Area Code 765 Map & Demographics
Area Code 765 Map
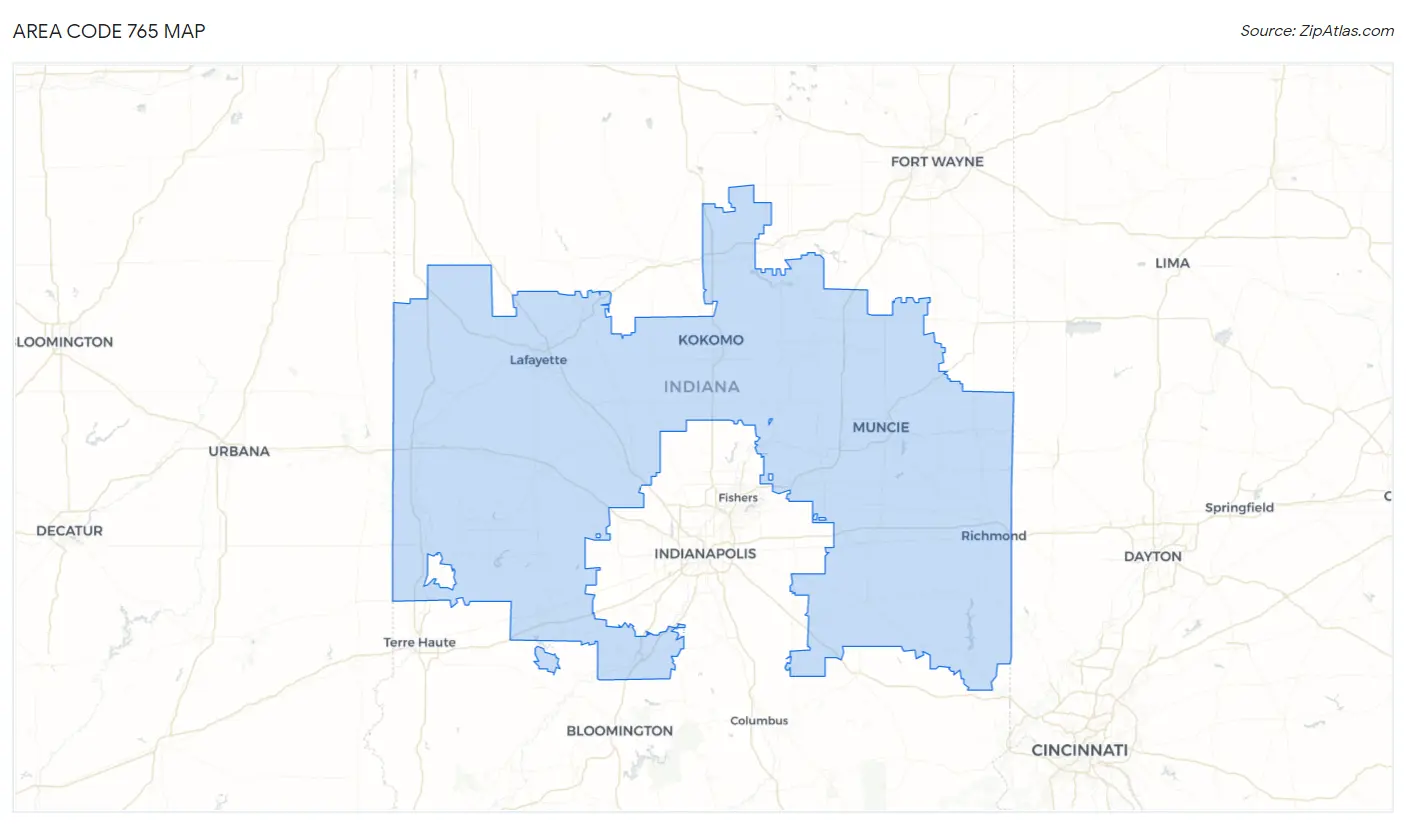
Area Code 765 Overview
$32,892
PER CAPITA INCOME
$78,550
AVG FAMILY INCOME
$66,555
AVG HOUSEHOLD INCOME
32.3%
WAGE / INCOME GAP [ % ]
67.7¢/ $1
WAGE / INCOME GAP [ $ ]
$11,695
FAMILY INCOME DEFICIT
76.32
INEQUALITY / GINI INDEX
1,221,814
TOTAL POPULATION
611,431
MALE POPULATION
610,383
FEMALE POPULATION
100.17
MALES / 100 FEMALES
99.83
FEMALES / 100 MALES
41.3
MEDIAN AGE
3.0
AVG FAMILY SIZE
2.5
AVG HOUSEHOLD SIZE
602,597
LABOR FORCE [ PEOPLE ]
60.5%
PERCENT IN LABOR FORCE
4.8%
UNEMPLOYMENT RATE
Income in Area Code 765
Income Overview in Area Code 765
Per Capita Income in Area Code 765 is $32,892, while median incomes of families and households are $78,550 and $66,555 respectively.
| Characteristic | Number | Measure |
| Per Capita Income | 1,221,814 | $32,892 |
| Median Family Income | 298,254 | $78,550 |
| Mean Family Income | 298,254 | $17,777,551 |
| Median Household Income | 490,807 | $66,555 |
| Mean Household Income | 490,807 | $15,485,782 |
| Income Deficit | 298,254 | $11,695 |
| Wage / Income Gap (%) | 1,221,814 | 32.30% |
| Wage / Income Gap ($) | 1,221,814 | 67.70¢ per $1 |
| Gini / Inequality Index | 1,221,814 | 76.32 |
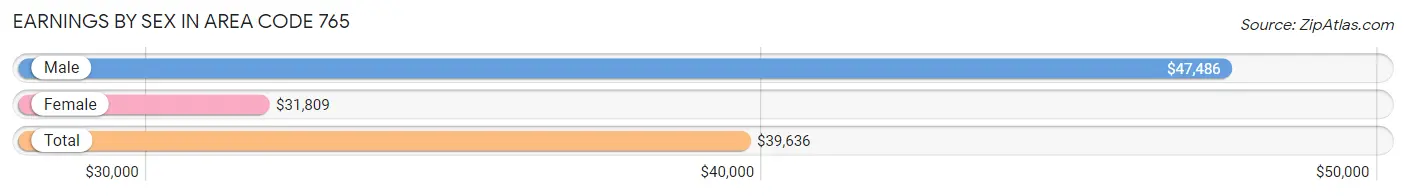
Earnings by Sex in Area Code 765
Average Earnings in Area Code 765 are $39,636, $47,486 for men and $31,809 for women, a difference of 33.0%.
| Sex | Number | Average Earnings |
| Male | 344,793 (52.8%) | $47,486 |
| Female | 307,908 (47.2%) | $31,809 |
| Total | 652,701 (100.0%) | $39,636 |
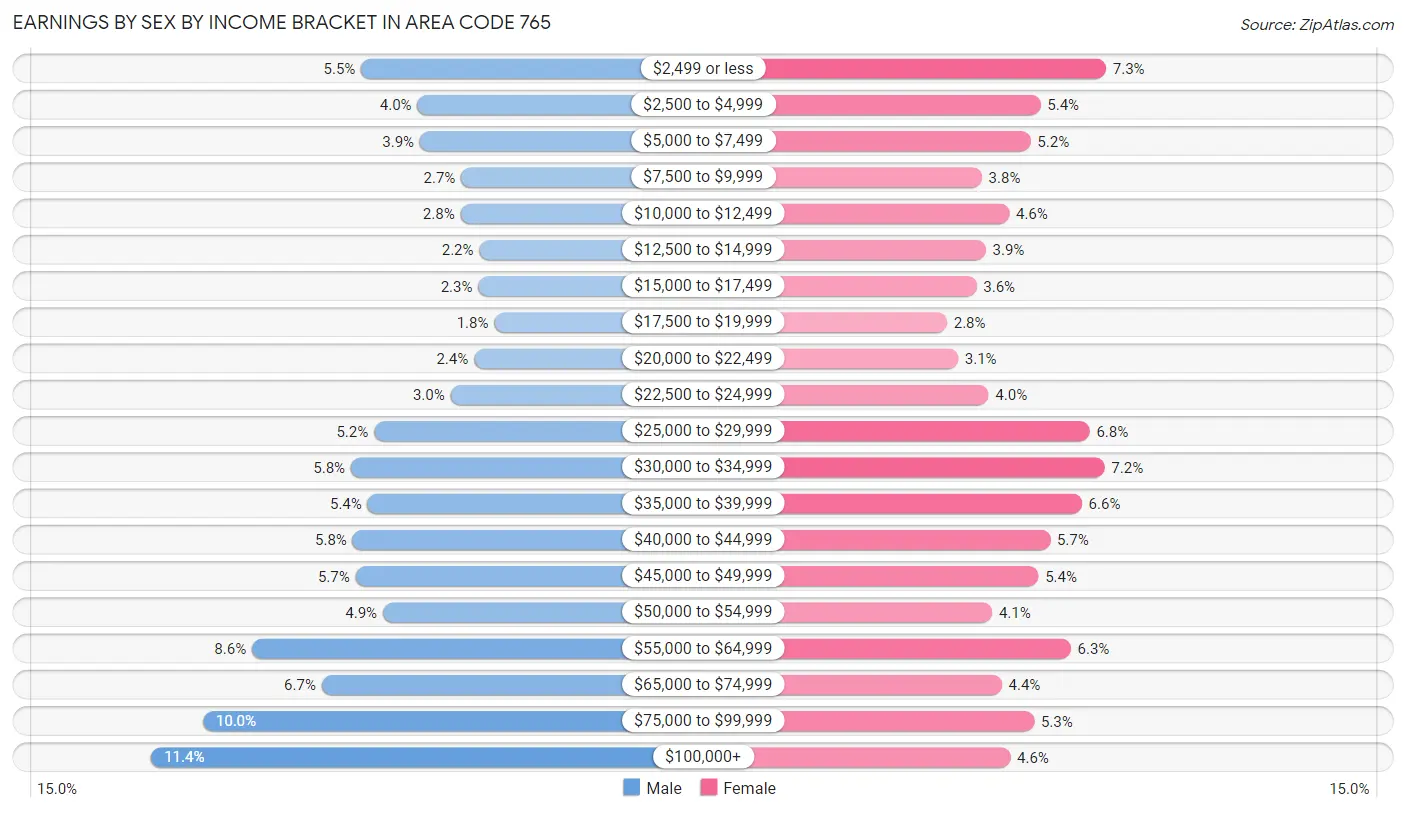
Earnings by Sex by Income Bracket in Area Code 765
The most common earnings brackets in Area Code 765 are $100,000+ for men (39,452 | 11.4%) and $2,499 or less for women (22,409 | 7.3%).
| Income | Male | Female |
| $2,499 or less | 19,090 (5.5%) | 22,409 (7.3%) |
| $2,500 to $4,999 | 13,666 (4.0%) | 16,758 (5.4%) |
| $5,000 to $7,499 | 13,418 (3.9%) | 15,886 (5.2%) |
| $7,500 to $9,999 | 9,398 (2.7%) | 11,658 (3.8%) |
| $10,000 to $12,499 | 9,483 (2.8%) | 14,034 (4.6%) |
| $12,500 to $14,999 | 7,651 (2.2%) | 12,007 (3.9%) |
| $15,000 to $17,499 | 7,751 (2.2%) | 11,211 (3.6%) |
| $17,500 to $19,999 | 6,197 (1.8%) | 8,655 (2.8%) |
| $20,000 to $22,499 | 8,171 (2.4%) | 9,597 (3.1%) |
| $22,500 to $24,999 | 10,460 (3.0%) | 12,247 (4.0%) |
| $25,000 to $29,999 | 17,874 (5.2%) | 20,985 (6.8%) |
| $30,000 to $34,999 | 20,100 (5.8%) | 22,306 (7.2%) |
| $35,000 to $39,999 | 18,464 (5.4%) | 20,337 (6.6%) |
| $40,000 to $44,999 | 19,922 (5.8%) | 17,574 (5.7%) |
| $45,000 to $49,999 | 19,649 (5.7%) | 16,578 (5.4%) |
| $50,000 to $54,999 | 16,995 (4.9%) | 12,558 (4.1%) |
| $55,000 to $64,999 | 29,670 (8.6%) | 19,365 (6.3%) |
| $65,000 to $74,999 | 22,933 (6.7%) | 13,404 (4.3%) |
| $75,000 to $99,999 | 34,449 (10.0%) | 16,194 (5.3%) |
| $100,000+ | 39,452 (11.4%) | 14,145 (4.6%) |
| Total | 344,793 (100.0%) | 307,908 (100.0%) |
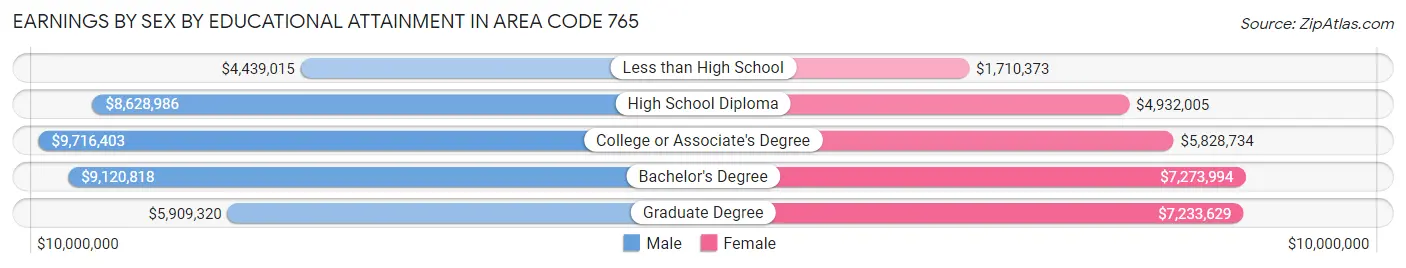
Earnings by Sex by Educational Attainment in Area Code 765
Average earnings in Area Code 765 are $10,030,179 for men and $6,751,117 for women, a difference of 32.7%. Men with an educational attainment of college or associate's degree enjoy the highest average annual earnings of $9,716,403, while those with less than high school education earn the least with $4,439,015. Women with an educational attainment of bachelor's degree earn the most with the average annual earnings of $7,273,994, while those with less than high school education have the smallest earnings of $1,710,373.
| Educational Attainment | Male Income | Female Income |
| Less than High School | $4,439,015 | $1,710,373 |
| High School Diploma | $8,628,986 | $4,932,005 |
| College or Associate's Degree | $9,716,403 | $5,828,734 |
| Bachelor's Degree | $9,120,818 | $7,273,994 |
| Graduate Degree | $5,909,320 | $7,233,629 |
| Total | $10,030,179 | $6,751,117 |
Family Income in Area Code 765
Family Income Brackets in Area Code 765
According to the Area Code 765 family income data, there are 12,522,791 families falling into the $100,000 to $149,999 income range, which is the most common income bracket and makes up 4,198.7% of all families. Conversely, the $10,000 to $14,999 income bracket is the least frequent group with only 1,090,118 families (365.5%) belonging to this category.
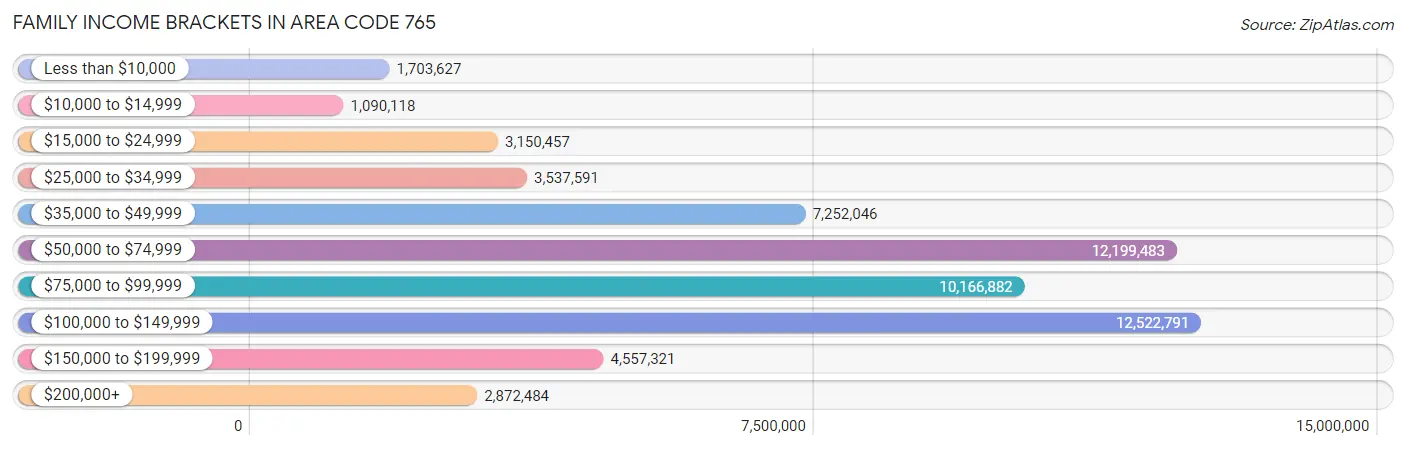
| Income Bracket | # Families | % Families |
| Less than $10,000 | 1,703,627 | 571.2% |
| $10,000 to $14,999 | 1,090,118 | 365.5% |
| $15,000 to $24,999 | 3,150,457 | 1,056.3% |
| $25,000 to $34,999 | 3,537,591 | 1,186.1% |
| $35,000 to $49,999 | 7,252,046 | 2,431.5% |
| $50,000 to $74,999 | 12,199,483 | 4,090.3% |
| $75,000 to $99,999 | 10,166,882 | 3,408.8% |
| $100,000 to $149,999 | 12,522,791 | 4,198.7% |
| $150,000 to $199,999 | 4,557,321 | 1,528.0% |
| $200,000+ | 2,872,484 | 963.1% |
Family Income by Famaliy Size in Area Code 765
7+ person families (3,997 | 1.3%) account for the highest median family income in Area Code 765 with $102,422 per family, while 2-person families (155,364 | 52.1%) have the highest median income of $36,066 per family member.
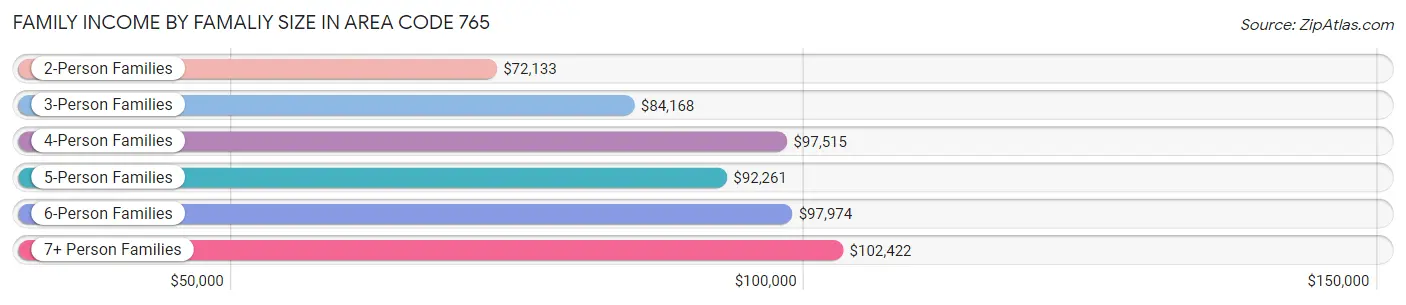
| Income Bracket | # Families | Median Income |
| 2-Person Families | 155,364 (52.1%) | $72,133 |
| 3-Person Families | 63,474 (21.3%) | $84,168 |
| 4-Person Families | 45,421 (15.2%) | $97,515 |
| 5-Person Families | 21,739 (7.3%) | $92,261 |
| 6-Person Families | 8,259 (2.8%) | $97,974 |
| 7+ Person Families | 3,997 (1.3%) | $102,422 |
| Total | 298,254 (100.0%) | $78,550 |
Family Income by Number of Earners in Area Code 765
The median family income in Area Code 765 is $78,550, with families comprising 3+ earners (28,427) having the highest median family income of $131,904, while families with no earners (49,615) have the lowest median family income of $48,614, accounting for 9.5% and 16.6% of families, respectively.
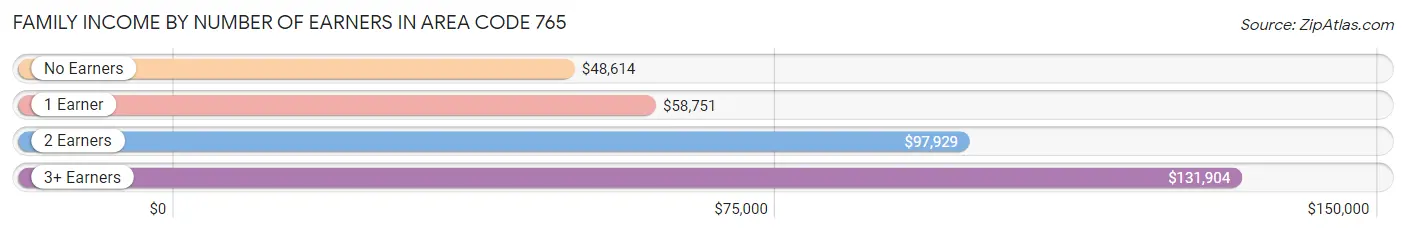
| Number of Earners | # Families | Median Income |
| No Earners | 49,615 (16.6%) | $48,614 |
| 1 Earner | 97,125 (32.6%) | $58,751 |
| 2 Earners | 123,087 (41.3%) | $97,929 |
| 3+ Earners | 28,427 (9.5%) | $131,904 |
| Total | 298,254 (100.0%) | $78,550 |
Household Income in Area Code 765
Household Income Brackets in Area Code 765
With 19,245,524 households falling in the category, the $50,000 to $74,999 income range is the most frequent in Area Code 765, accounting for 3,921.2% of all households. In contrast, only 3,600,560 households (733.6%) fall into the $10,000 to $14,999 income bracket, making it the least populous group.
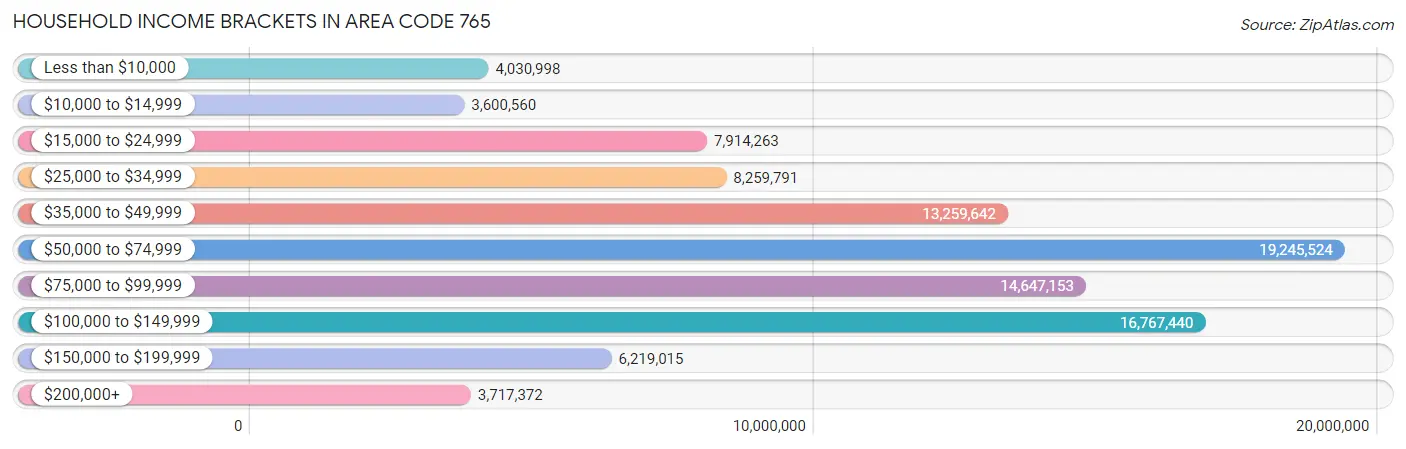
| Income Bracket | # Households | % Households |
| Less than $10,000 | 4,030,998 | 821.3% |
| $10,000 to $14,999 | 3,600,560 | 733.6% |
| $15,000 to $24,999 | 7,914,263 | 1,612.5% |
| $25,000 to $34,999 | 8,259,791 | 1,682.9% |
| $35,000 to $49,999 | 13,259,642 | 2,701.6% |
| $50,000 to $74,999 | 19,245,524 | 3,921.2% |
| $75,000 to $99,999 | 14,647,153 | 2,984.3% |
| $100,000 to $149,999 | 16,767,440 | 3,416.3% |
| $150,000 to $199,999 | 6,219,015 | 1,267.1% |
| $200,000+ | 3,717,372 | 757.4% |
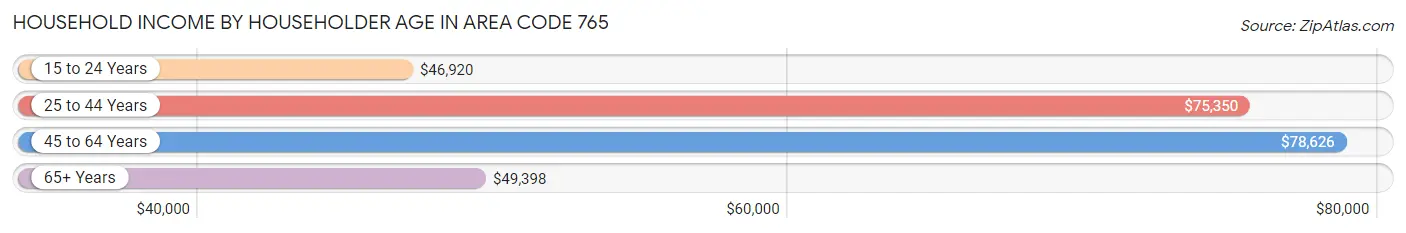
Household Income by Householder Age in Area Code 765
The median household income in Area Code 765 is $66,555, with the highest median household income of $78,626 found in the 45 to 64 years age bracket for the primary householder. A total of 173,165 households (35.3%) fall into this category. Meanwhile, the 15 to 24 years age bracket for the primary householder has the lowest median household income of $46,920, with 33,793 households (6.9%) in this group.
| Income Bracket | # Households | Median Income |
| 15 to 24 Years | 33,793 (6.9%) | $46,920 |
| 25 to 44 Years | 151,228 (30.8%) | $75,350 |
| 45 to 64 Years | 173,165 (35.3%) | $78,626 |
| 65+ Years | 132,621 (27.0%) | $49,398 |
| Total | 490,807 (100.0%) | $66,555 |
Poverty in Area Code 765
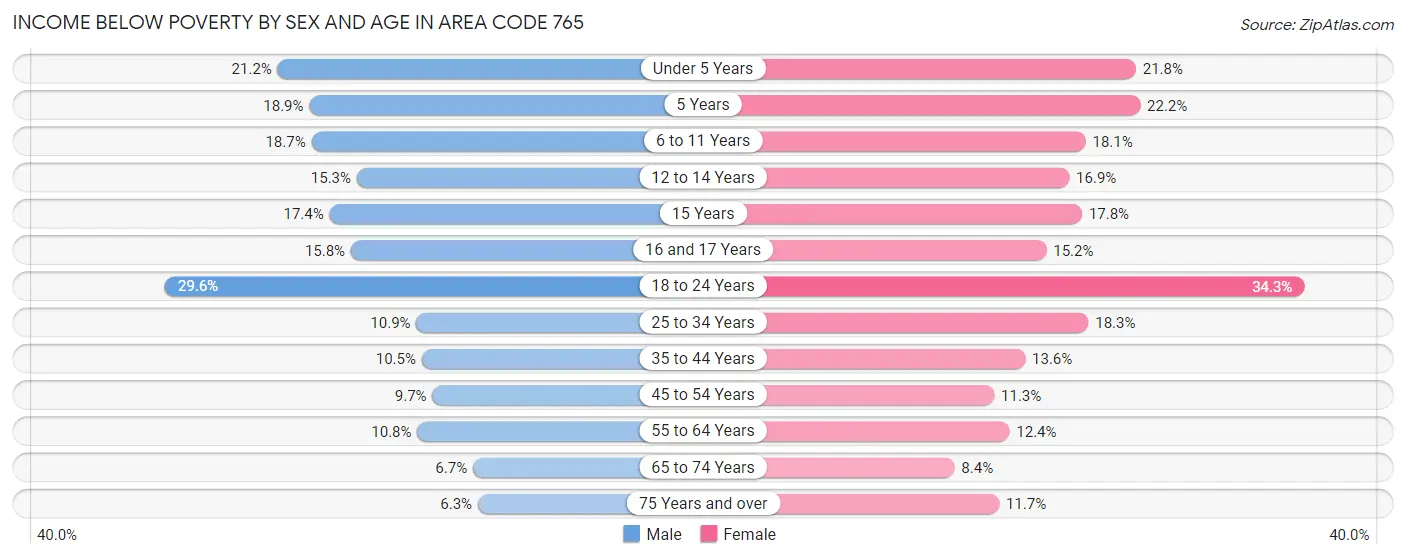
Income Below Poverty by Sex and Age in Area Code 765
With 13.8% poverty level for males and 16.2% for females among the residents of Area Code 765, 18 to 24 year old males and 18 to 24 year old females are the most vulnerable to poverty, with 19,307 males (29.6%) and 19,733 females (34.3%) in their respective age groups living below the poverty level.
| Age Bracket | Male | Female |
| Under 5 Years | 7,085 (21.2%) | 6,946 (21.8%) |
| 5 Years | 1,324 (18.9%) | 1,471 (22.2%) |
| 6 to 11 Years | 8,141 (18.7%) | 7,209 (18.1%) |
| 12 to 14 Years | 3,194 (15.3%) | 3,726 (16.9%) |
| 15 Years | 1,434 (17.4%) | 1,307 (17.8%) |
| 16 and 17 Years | 2,450 (15.8%) | 2,249 (15.2%) |
| 18 to 24 Years | 19,307 (29.6%) | 19,733 (34.3%) |
| 25 to 34 Years | 8,565 (10.9%) | 13,870 (18.3%) |
| 35 to 44 Years | 7,119 (10.5%) | 9,224 (13.6%) |
| 45 to 54 Years | 6,844 (9.7%) | 8,001 (11.3%) |
| 55 to 64 Years | 8,349 (10.8%) | 9,903 (12.4%) |
| 65 to 74 Years | 3,741 (6.7%) | 5,188 (8.4%) |
| 75 Years and over | 2,128 (6.3%) | 5,564 (11.7%) |
| Total | 79,681 (13.8%) | 94,391 (16.2%) |
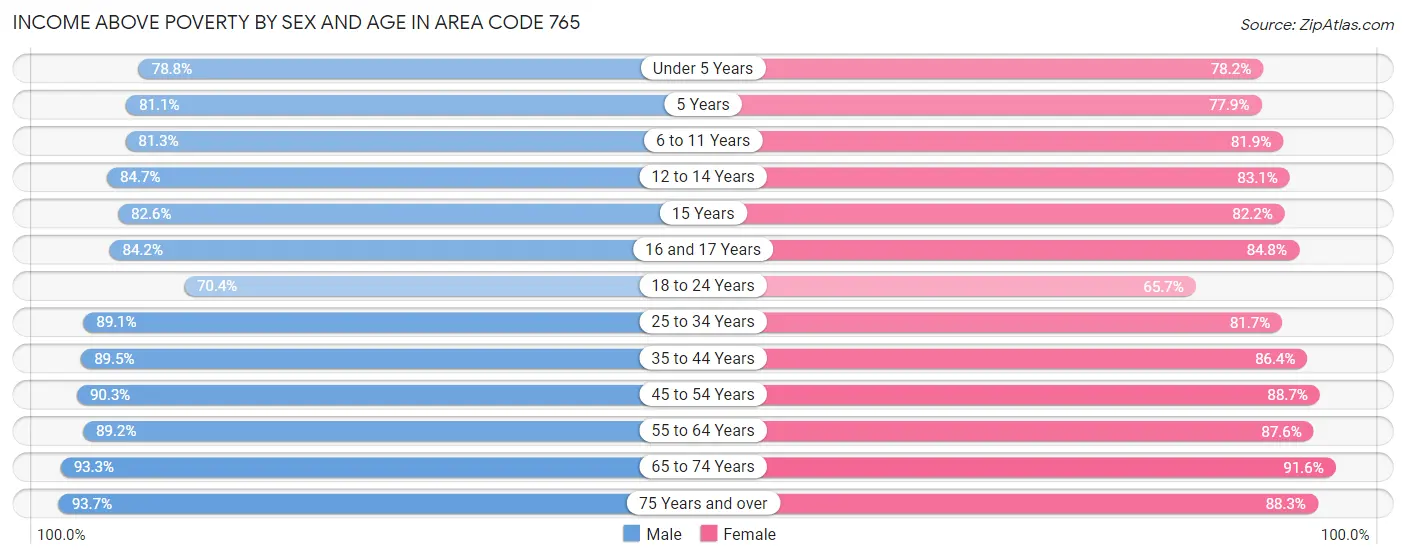
Income Above Poverty by Sex and Age in Area Code 765
According to the poverty statistics in Area Code 765, males aged 75 years and over and females aged 65 to 74 years are the age groups that are most secure financially, with 93.7% of males and 91.6% of females in these age groups living above the poverty line.
| Age Bracket | Male | Female |
| Under 5 Years | 26,326 (78.8%) | 24,875 (78.2%) |
| 5 Years | 5,695 (81.1%) | 5,170 (77.8%) |
| 6 to 11 Years | 35,399 (81.3%) | 32,628 (81.9%) |
| 12 to 14 Years | 17,642 (84.7%) | 18,345 (83.1%) |
| 15 Years | 6,824 (82.6%) | 6,022 (82.2%) |
| 16 and 17 Years | 13,087 (84.2%) | 12,568 (84.8%) |
| 18 to 24 Years | 45,953 (70.4%) | 37,748 (65.7%) |
| 25 to 34 Years | 69,915 (89.1%) | 61,929 (81.7%) |
| 35 to 44 Years | 60,646 (89.5%) | 58,549 (86.4%) |
| 45 to 54 Years | 63,569 (90.3%) | 62,734 (88.7%) |
| 55 to 64 Years | 68,663 (89.2%) | 69,674 (87.6%) |
| 65 to 74 Years | 51,991 (93.3%) | 56,841 (91.6%) |
| 75 Years and over | 31,416 (93.7%) | 42,094 (88.3%) |
| Total | 497,126 (86.2%) | 489,177 (83.8%) |
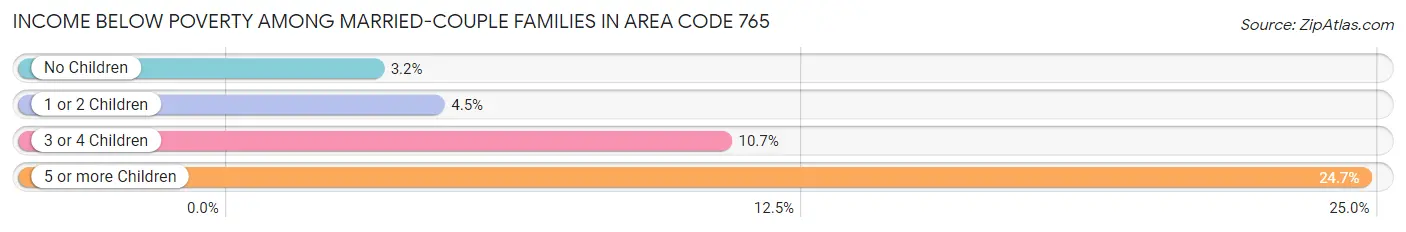
Income Below Poverty Among Married-Couple Families in Area Code 765
The poverty statistics for married-couple families in Area Code 765 show that 4.4% or 9,671 of the total 219,699 families live below the poverty line. Families with 5 or more children have the highest poverty rate of 24.7%, comprising of 477 families. On the other hand, families with no children have the lowest poverty rate of 3.2%, which includes 4,351 families.
| Children | Above Poverty | Below Poverty |
| No Children | 132,764 (96.8%) | 4,351 (3.2%) |
| 1 or 2 Children | 58,391 (95.5%) | 2,747 (4.5%) |
| 3 or 4 Children | 17,416 (89.3%) | 2,096 (10.7%) |
| 5 or more Children | 1,457 (75.3%) | 477 (24.7%) |
| Total | 210,028 (95.6%) | 9,671 (4.4%) |
Income Below Poverty Among Single-Parent Households in Area Code 765
According to the poverty data in Area Code 765, 15.0% or 3,654 single-father households and 28.6% or 15,490 single-mother households are living below the poverty line. Among single-father households, those with 5 or more children have the highest poverty rate, with 125 households (76.2%) experiencing poverty. Likewise, among single-mother households, those with 5 or more children have the highest poverty rate, with 225 households (76.5%) falling below the poverty line.
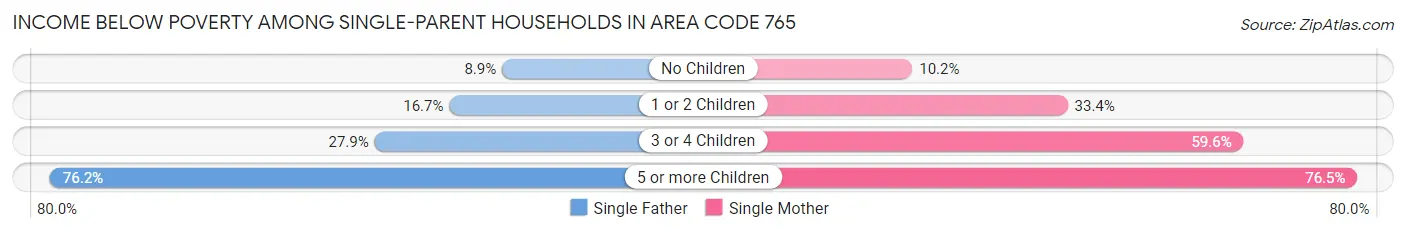
| Children | Single Father | Single Mother |
| No Children | 857 (8.9%) | 1,911 (10.2%) |
| 1 or 2 Children | 2,080 (16.7%) | 9,685 (33.4%) |
| 3 or 4 Children | 592 (27.9%) | 3,669 (59.6%) |
| 5 or more Children | 125 (76.2%) | 225 (76.5%) |
| Total | 3,654 (15.0%) | 15,490 (28.6%) |
Income Below Poverty Among Married-Couple vs Single-Parent Households in Area Code 765
The poverty data for Area Code 765 shows that 9,671 of the married-couple family households (4.4%) and 19,144 of the single-parent households (24.4%) are living below the poverty level. Within the married-couple family households, those with 5 or more children have the highest poverty rate, with 477 households (24.7%) falling below the poverty line. Among the single-parent households, those with 5 or more children have the highest poverty rate, with 350 household (76.4%) living below poverty.
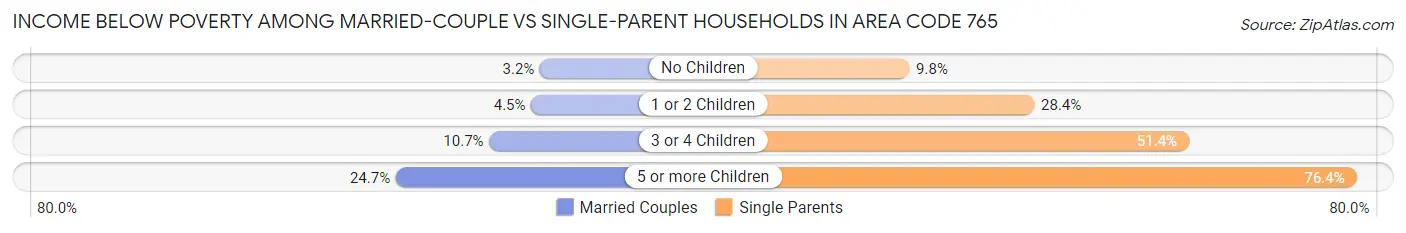
| Children | Married-Couple Families | Single-Parent Households |
| No Children | 4,351 (3.2%) | 2,768 (9.8%) |
| 1 or 2 Children | 2,747 (4.5%) | 11,765 (28.4%) |
| 3 or 4 Children | 2,096 (10.7%) | 4,261 (51.4%) |
| 5 or more Children | 477 (24.7%) | 350 (76.4%) |
| Total | 9,671 (4.4%) | 19,144 (24.4%) |
Race in Area Code 765
The most populous races in Area Code 765 are White / Caucasian (1,038,957 | 85.0%), Black / African American (82,838 | 6.8%), and Hispanic or Latino (60,625 | 5.0%).
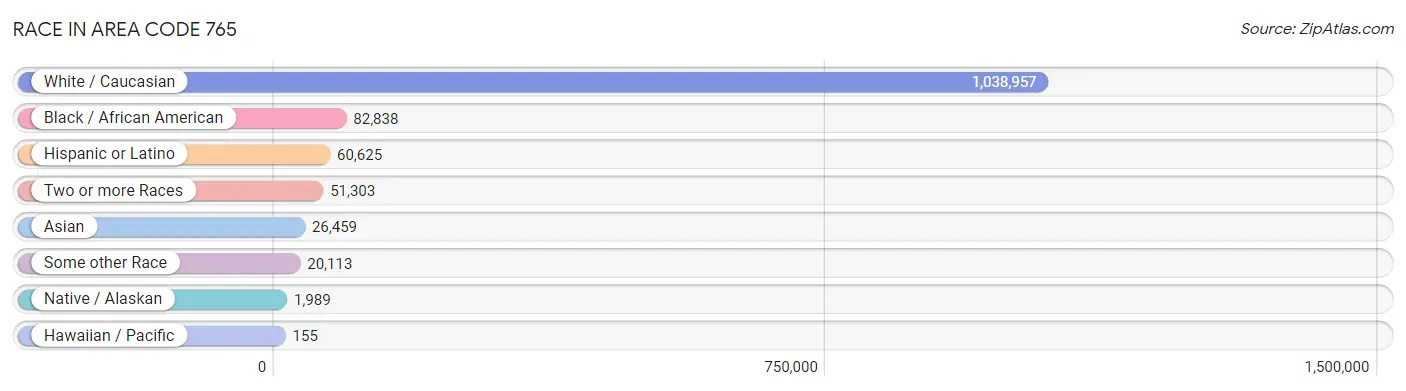
| Race | # Population | % Population |
| Asian | 26,459 | 2.2% |
| Black / African American | 82,838 | 6.8% |
| Hawaiian / Pacific | 155 | 0.0% |
| Hispanic or Latino | 60,625 | 5.0% |
| Native / Alaskan | 1,989 | 0.2% |
| White / Caucasian | 1,038,957 | 85.0% |
| Two or more Races | 51,303 | 4.2% |
| Some other Race | 20,113 | 1.7% |
| Total | 1,221,814 | 100.0% |
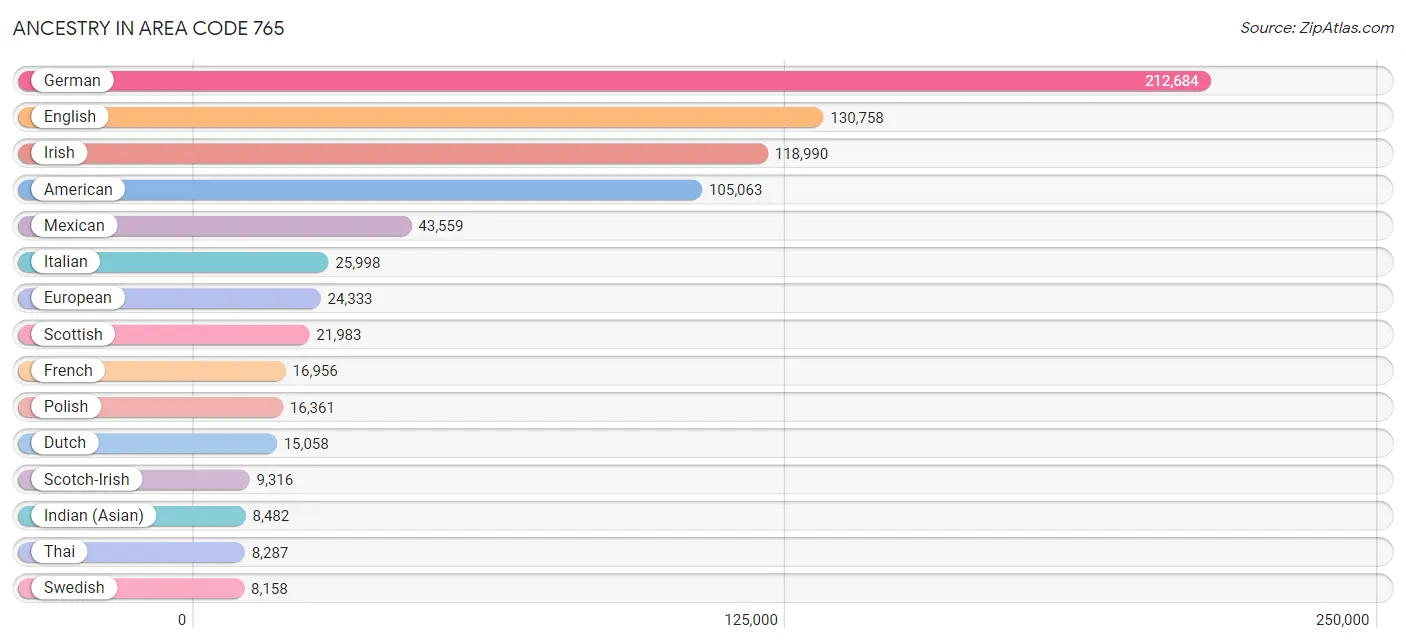
Ancestry in Area Code 765
The most populous ancestries reported in Area Code 765 are German (212,684 | 17.4%), English (130,758 | 10.7%), Irish (118,990 | 9.7%), American (105,063 | 8.6%), and Mexican (43,559 | 3.6%), together accounting for 50.0% of all Area Code 765 residents.
| Ancestry | # Population | % Population |
| Afghan | 51 | 0.0% |
| African | 3,988 | 0.3% |
| Alaska Native | 9 | 0.0% |
| Albanian | 263 | 0.0% |
| Aleut | 12 | 0.0% |
| Alsatian | 15 | 0.0% |
| American | 105,063 | 8.6% |
| Apache | 355 | 0.0% |
| Arab | 2,909 | 0.2% |
| Argentinean | 327 | 0.0% |
| Armenian | 248 | 0.0% |
| Assyrian / Chaldean / Syriac | 71 | 0.0% |
| Australian | 158 | 0.0% |
| Austrian | 1,012 | 0.1% |
| Bahamian | 115 | 0.0% |
| Bangladeshi | 26 | 0.0% |
| Barbadian | 84 | 0.0% |
| Belgian | 1,083 | 0.1% |
| Belizean | 43 | 0.0% |
| Bhutanese | 2,154 | 0.2% |
| Blackfeet | 808 | 0.1% |
| Bolivian | 51 | 0.0% |
| Brazilian | 417 | 0.0% |
| British | 7,580 | 0.6% |
| British West Indian | 35 | 0.0% |
| Bulgarian | 191 | 0.0% |
| Burmese | 3,040 | 0.3% |
| Cajun | 63 | 0.0% |
| Cambodian | 8 | 0.0% |
| Canadian | 724 | 0.1% |
| Cape Verdean | 16 | 0.0% |
| Celtic | 280 | 0.0% |
| Central American | 3,653 | 0.3% |
| Central American Indian | 134 | 0.0% |
| Cherokee | 3,868 | 0.3% |
| Cheyenne | 33 | 0.0% |
| Chickasaw | 4 | 0.0% |
| Chilean | 128 | 0.0% |
| Chinese | 13 | 0.0% |
| Chippewa | 182 | 0.0% |
| Choctaw | 230 | 0.0% |
| Colombian | 867 | 0.1% |
| Comanche | 35 | 0.0% |
| Costa Rican | 84 | 0.0% |
| Cree | 46 | 0.0% |
| Creek | 61 | 0.0% |
| Croatian | 815 | 0.1% |
| Crow | 24 | 0.0% |
| Cuban | 1,350 | 0.1% |
| Czech | 1,901 | 0.2% |
| Czechoslovakian | 386 | 0.0% |
| Danish | 1,562 | 0.1% |
| Delaware | 24 | 0.0% |
| Dominican | 238 | 0.0% |
| Dutch | 15,058 | 1.2% |
| Dutch West Indian | 6 | 0.0% |
| Eastern European | 1,761 | 0.1% |
| Ecuadorian | 507 | 0.0% |
| Egyptian | 377 | 0.0% |
| English | 130,758 | 10.7% |
| Estonian | 20 | 0.0% |
| Ethiopian | 235 | 0.0% |
| European | 24,333 | 2.0% |
| Fijian | 6 | 0.0% |
| Filipino | 462 | 0.0% |
| Finnish | 643 | 0.1% |
| French | 16,956 | 1.4% |
| French American Indian | 48 | 0.0% |
| French Canadian | 2,201 | 0.2% |
| German | 212,684 | 17.4% |
| German Russian | 52 | 0.0% |
| Ghanaian | 753 | 0.1% |
| Greek | 2,492 | 0.2% |
| Guamanian / Chamorro | 142 | 0.0% |
| Guatemalan | 1,489 | 0.1% |
| Guyanese | 79 | 0.0% |
| Haitian | 518 | 0.0% |
| Honduran | 451 | 0.0% |
| Hopi | 9 | 0.0% |
| Houma | 19 | 0.0% |
| Hungarian | 2,003 | 0.2% |
| Icelander | 54 | 0.0% |
| Indian (Asian) | 8,482 | 0.7% |
| Indonesian | 463 | 0.0% |
| Inupiat | 53 | 0.0% |
| Iranian | 744 | 0.1% |
| Iraqi | 1 | 0.0% |
| Irish | 118,990 | 9.7% |
| Iroquois | 249 | 0.0% |
| Israeli | 147 | 0.0% |
| Italian | 25,998 | 2.1% |
| Jamaican | 371 | 0.0% |
| Japanese | 333 | 0.0% |
| Jordanian | 49 | 0.0% |
| Kenyan | 216 | 0.0% |
| Korean | 3,793 | 0.3% |
| Laotian | 453 | 0.0% |
| Latvian | 197 | 0.0% |
| Lebanese | 867 | 0.1% |
| Liberian | 141 | 0.0% |
| Lithuanian | 1,237 | 0.1% |
| Luxembourger | 27 | 0.0% |
| Macedonian | 190 | 0.0% |
| Malaysian | 112 | 0.0% |
| Maltese | 30 | 0.0% |
| Menominee | 18 | 0.0% |
| Mexican | 43,559 | 3.6% |
| Mexican American Indian | 764 | 0.1% |
| Mongolian | 80 | 0.0% |
| Moroccan | 162 | 0.0% |
| Native Hawaiian | 343 | 0.0% |
| Navajo | 187 | 0.0% |
| New Zealander | 43 | 0.0% |
| Nicaraguan | 303 | 0.0% |
| Nigerian | 1,328 | 0.1% |
| Northern European | 1,231 | 0.1% |
| Norwegian | 5,600 | 0.5% |
| Okinawan | 16 | 0.0% |
| Osage | 3 | 0.0% |
| Ottawa | 3 | 0.0% |
| Pakistani | 910 | 0.1% |
| Palestinian | 70 | 0.0% |
| Panamanian | 527 | 0.0% |
| Pennsylvania German | 1,274 | 0.1% |
| Peruvian | 304 | 0.0% |
| Pima | 17 | 0.0% |
| Polish | 16,361 | 1.3% |
| Portuguese | 1,142 | 0.1% |
| Potawatomi | 119 | 0.0% |
| Pueblo | 29 | 0.0% |
| Puerto Rican | 4,576 | 0.4% |
| Puget Sound Salish | 51 | 0.0% |
| Romanian | 953 | 0.1% |
| Russian | 2,678 | 0.2% |
| Salvadoran | 799 | 0.1% |
| Samoan | 243 | 0.0% |
| Scandinavian | 2,705 | 0.2% |
| Scotch-Irish | 9,316 | 0.8% |
| Scottish | 21,983 | 1.8% |
| Seminole | 113 | 0.0% |
| Senegalese | 22 | 0.0% |
| Serbian | 464 | 0.0% |
| Shoshone | 7 | 0.0% |
| Sierra Leonean | 40 | 0.0% |
| Sioux | 242 | 0.0% |
| Slavic | 397 | 0.0% |
| Slovak | 1,128 | 0.1% |
| Slovene | 612 | 0.1% |
| Somali | 12 | 0.0% |
| South African | 323 | 0.0% |
| South American | 3,189 | 0.3% |
| South American Indian | 36 | 0.0% |
| Soviet Union | 10 | 0.0% |
| Spaniard | 881 | 0.1% |
| Spanish | 674 | 0.1% |
| Spanish American | 39 | 0.0% |
| Spanish American Indian | 2 | 0.0% |
| Sri Lankan | 2,243 | 0.2% |
| Subsaharan African | 7,643 | 0.6% |
| Sudanese | 16 | 0.0% |
| Swedish | 8,158 | 0.7% |
| Swiss | 4,020 | 0.3% |
| Syrian | 319 | 0.0% |
| Thai | 8,287 | 0.7% |
| Tlingit-Haida | 51 | 0.0% |
| Tohono O'Odham | 14 | 0.0% |
| Trinidadian and Tobagonian | 59 | 0.0% |
| Turkish | 414 | 0.0% |
| U.S. Virgin Islander | 22 | 0.0% |
| Ukrainian | 1,073 | 0.1% |
| Uruguayan | 20 | 0.0% |
| Venezuelan | 921 | 0.1% |
| Vietnamese | 150 | 0.0% |
| Welsh | 6,105 | 0.5% |
| West Indian | 109 | 0.0% |
| Yaqui | 6 | 0.0% |
| Yugoslavian | 559 | 0.1% |
| Zimbabwean | 164 | 0.0% | View All 178 Rows |
Immigrants in Area Code 765
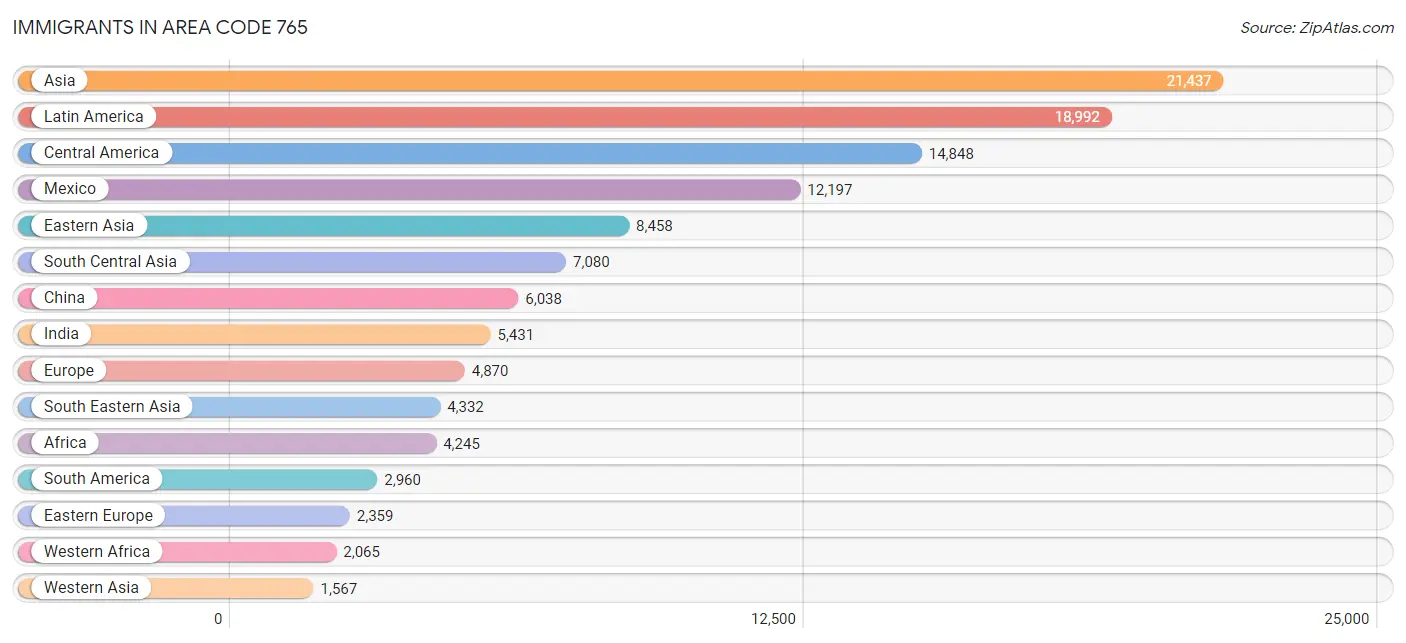
The most numerous immigrant groups reported in Area Code 765 came from Asia (21,437 | 1.8%), Latin America (18,992 | 1.5%), Central America (14,848 | 1.2%), Mexico (12,197 | 1.0%), and Eastern Asia (8,458 | 0.7%), together accounting for 6.2% of all Area Code 765 residents.
| Immigration Origin | # Population | % Population |
| Afghanistan | 153 | 0.0% |
| Africa | 4,245 | 0.4% |
| Albania | 40 | 0.0% |
| Argentina | 173 | 0.0% |
| Armenia | 22 | 0.0% |
| Asia | 21,437 | 1.8% |
| Australia | 141 | 0.0% |
| Austria | 15 | 0.0% |
| Bahamas | 12 | 0.0% |
| Bangladesh | 211 | 0.0% |
| Barbados | 75 | 0.0% |
| Belarus | 44 | 0.0% |
| Belgium | 14 | 0.0% |
| Belize | 65 | 0.0% |
| Bolivia | 41 | 0.0% |
| Bosnia and Herzegovina | 224 | 0.0% |
| Brazil | 542 | 0.0% |
| Bulgaria | 164 | 0.0% |
| Cambodia | 297 | 0.0% |
| Cameroon | 190 | 0.0% |
| Canada | 1,069 | 0.1% |
| Caribbean | 1,184 | 0.1% |
| Central America | 14,848 | 1.2% |
| Chile | 135 | 0.0% |
| China | 6,038 | 0.5% |
| Colombia | 723 | 0.1% |
| Congo | 148 | 0.0% |
| Costa Rica | 65 | 0.0% |
| Croatia | 48 | 0.0% |
| Cuba | 317 | 0.0% |
| Czechoslovakia | 59 | 0.0% |
| Denmark | 19 | 0.0% |
| Dominican Republic | 141 | 0.0% |
| Eastern Africa | 674 | 0.1% |
| Eastern Asia | 8,458 | 0.7% |
| Eastern Europe | 2,359 | 0.2% |
| Ecuador | 285 | 0.0% |
| Egypt | 311 | 0.0% |
| El Salvador | 385 | 0.0% |
| England | 173 | 0.0% |
| Eritrea | 136 | 0.0% |
| Ethiopia | 81 | 0.0% |
| Europe | 4,870 | 0.4% |
| Fiji | 70 | 0.0% |
| France | 100 | 0.0% |
| Germany | 773 | 0.1% |
| Ghana | 565 | 0.1% |
| Greece | 53 | 0.0% |
| Guatemala | 1,190 | 0.1% |
| Guyana | 19 | 0.0% |
| Haiti | 295 | 0.0% |
| Honduras | 311 | 0.0% |
| Hong Kong | 82 | 0.0% |
| Hungary | 24 | 0.0% |
| India | 5,431 | 0.4% |
| Indonesia | 330 | 0.0% |
| Iran | 490 | 0.0% |
| Iraq | 51 | 0.0% |
| Ireland | 39 | 0.0% |
| Israel | 120 | 0.0% |
| Italy | 223 | 0.0% |
| Jamaica | 219 | 0.0% |
| Japan | 887 | 0.1% |
| Jordan | 57 | 0.0% |
| Kazakhstan | 47 | 0.0% |
| Kenya | 209 | 0.0% |
| Korea | 1,527 | 0.1% |
| Kuwait | 52 | 0.0% |
| Laos | 86 | 0.0% |
| Latin America | 18,992 | 1.5% |
| Latvia | 91 | 0.0% |
| Lebanon | 118 | 0.0% |
| Liberia | 49 | 0.0% |
| Lithuania | 63 | 0.0% |
| Malaysia | 186 | 0.0% |
| Mexico | 12,197 | 1.0% |
| Middle Africa | 468 | 0.0% |
| Moldova | 10 | 0.0% |
| Morocco | 40 | 0.0% |
| Nepal | 115 | 0.0% |
| Netherlands | 119 | 0.0% |
| Nicaragua | 324 | 0.0% |
| Nigeria | 1,157 | 0.1% |
| North Macedonia | 129 | 0.0% |
| Northern Africa | 421 | 0.0% |
| Northern Europe | 902 | 0.1% |
| Norway | 16 | 0.0% |
| Oceania | 269 | 0.0% |
| Pakistan | 413 | 0.0% |
| Panama | 311 | 0.0% |
| Peru | 189 | 0.0% |
| Philippines | 1,297 | 0.1% |
| Poland | 153 | 0.0% |
| Portugal | 92 | 0.0% |
| Romania | 222 | 0.0% |
| Russia | 766 | 0.1% |
| Saudi Arabia | 489 | 0.0% |
| Scotland | 74 | 0.0% |
| Senegal | 14 | 0.0% |
| Serbia | 45 | 0.0% |
| Sierra Leone | 33 | 0.0% |
| Singapore | 129 | 0.0% |
| South Africa | 308 | 0.0% |
| South America | 2,960 | 0.2% |
| South Central Asia | 7,080 | 0.6% |
| South Eastern Asia | 4,332 | 0.4% |
| Southern Europe | 466 | 0.0% |
| Spain | 89 | 0.0% |
| Sri Lanka | 134 | 0.0% |
| St. Vincent and the Grenadines | 6 | 0.0% |
| Sudan | 10 | 0.0% |
| Sweden | 49 | 0.0% |
| Switzerland | 122 | 0.0% |
| Syria | 100 | 0.0% |
| Taiwan | 586 | 0.1% |
| Thailand | 635 | 0.1% |
| Trinidad and Tobago | 78 | 0.0% |
| Turkey | 292 | 0.0% |
| Ukraine | 212 | 0.0% |
| Uzbekistan | 14 | 0.0% |
| Venezuela | 836 | 0.1% |
| Vietnam | 1,054 | 0.1% |
| Western Africa | 2,065 | 0.2% |
| Western Asia | 1,567 | 0.1% |
| Western Europe | 1,143 | 0.1% |
| Yemen | 14 | 0.0% |
| Zaire | 83 | 0.0% |
| Zimbabwe | 145 | 0.0% | View All 128 Rows |
Sex and Age in Area Code 765
Sex and Age in Area Code 765
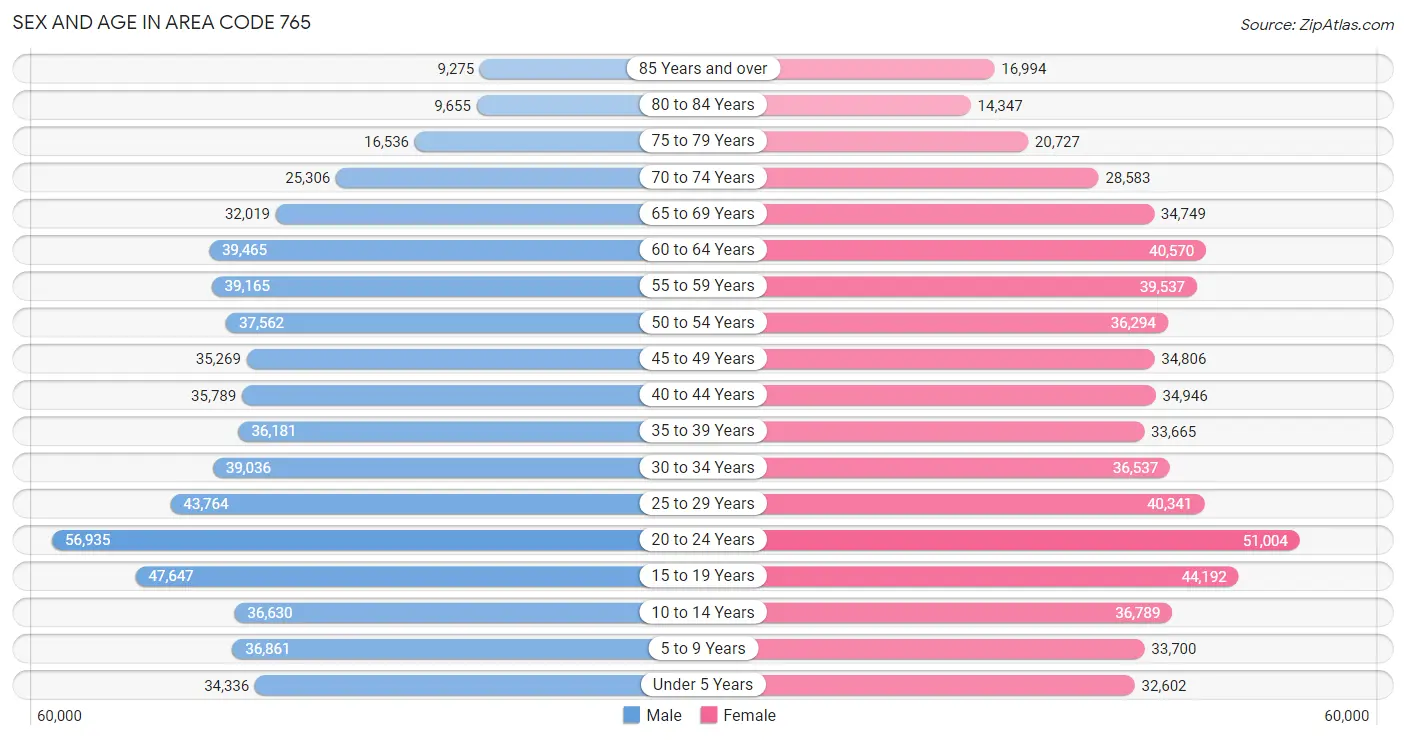
The most populous age groups in Area Code 765 are 20 to 24 Years (56,935 | 9.3%) for men and 20 to 24 Years (51,004 | 8.4%) for women.
| Age Bracket | Male | Female |
| Under 5 Years | 34,336 (5.6%) | 32,602 (5.3%) |
| 5 to 9 Years | 36,861 (6.0%) | 33,700 (5.5%) |
| 10 to 14 Years | 36,630 (6.0%) | 36,789 (6.0%) |
| 15 to 19 Years | 47,647 (7.8%) | 44,192 (7.2%) |
| 20 to 24 Years | 56,935 (9.3%) | 51,004 (8.4%) |
| 25 to 29 Years | 43,764 (7.2%) | 40,341 (6.6%) |
| 30 to 34 Years | 39,036 (6.4%) | 36,537 (6.0%) |
| 35 to 39 Years | 36,181 (5.9%) | 33,665 (5.5%) |
| 40 to 44 Years | 35,789 (5.9%) | 34,946 (5.7%) |
| 45 to 49 Years | 35,269 (5.8%) | 34,806 (5.7%) |
| 50 to 54 Years | 37,562 (6.1%) | 36,294 (5.9%) |
| 55 to 59 Years | 39,165 (6.4%) | 39,537 (6.5%) |
| 60 to 64 Years | 39,465 (6.5%) | 40,570 (6.7%) |
| 65 to 69 Years | 32,019 (5.2%) | 34,749 (5.7%) |
| 70 to 74 Years | 25,306 (4.1%) | 28,583 (4.7%) |
| 75 to 79 Years | 16,536 (2.7%) | 20,727 (3.4%) |
| 80 to 84 Years | 9,655 (1.6%) | 14,347 (2.4%) |
| 85 Years and over | 9,275 (1.5%) | 16,994 (2.8%) |
| Total | 611,431 (100.0%) | 610,383 (100.0%) |
Families and Households in Area Code 765
Median Family Size in Area Code 765
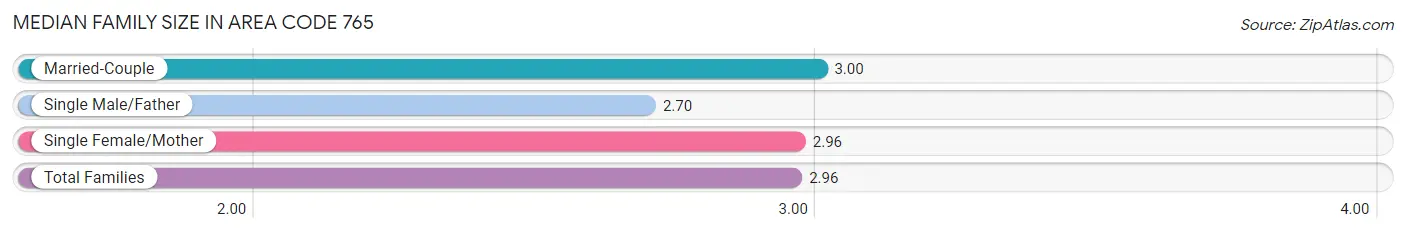
The median family size in Area Code 765 is 2.96 persons per family, with married-couple families (219,699 | 73.7%) accounting for the largest median family size of 3.00233 persons per family. On the other hand, single male/father families (24,403 | 8.2%) represent the smallest median family size with 2.70 persons per family.
| Family Type | # Families | Family Size |
| Married-Couple | 219,699 (73.7%) | 3.00 |
| Single Male/Father | 24,403 (8.2%) | 2.70 |
| Single Female/Mother | 54,152 (18.2%) | 2.96 |
| Total Families | 298,254 (100.0%) | 2.96 |
Median Household Size in Area Code 765
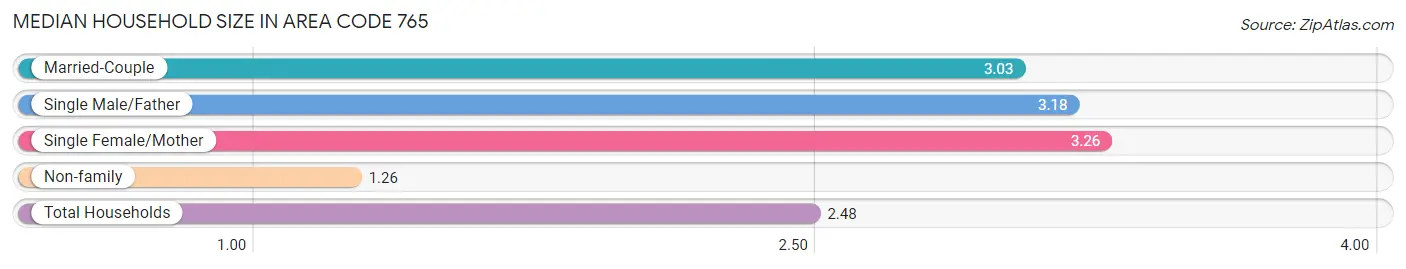
The median household size in Area Code 765 is 2.48 persons per household, with single female/mother households (54,152 | 11.0%) accounting for the largest median household size of 3.26497 persons per household. non-family households (192,553 | 39.2%) represent the smallest median household size with 1.26 persons per household.
| Household Type | # Households | Household Size |
| Married-Couple | 219,699 (44.8%) | 3.03 |
| Single Male/Father | 24,403 (5.0%) | 3.18 |
| Single Female/Mother | 54,152 (11.0%) | 3.26 |
| Non-family | 192,553 (39.2%) | 1.26 |
| Total Households | 490,807 (100.0%) | 2.48 |
Household Size by Marriage Status in Area Code 765
Out of a total of 490,807 households in Area Code 765, 298,254 (60.8%) are family households, while 192,553 (39.2%) are nonfamily households. The most numerous type of family households are 2-person households, comprising 144,806, and the most common type of nonfamily households are 1-person households, comprising 153,296.
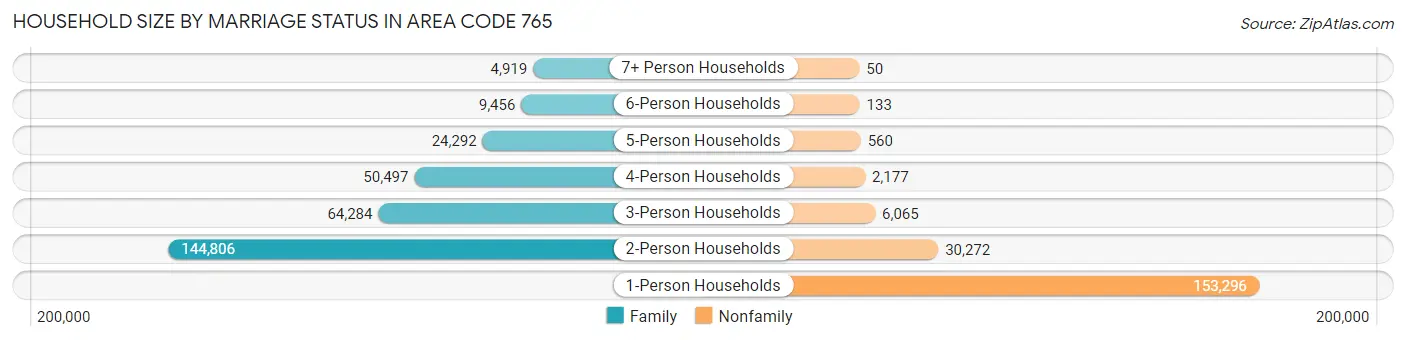
| Household Size | Family Households | Nonfamily Households |
| 1-Person Households | - | 153,296 (31.2%) |
| 2-Person Households | 144,806 (29.5%) | 30,272 (6.2%) |
| 3-Person Households | 64,284 (13.1%) | 6,065 (1.2%) |
| 4-Person Households | 50,497 (10.3%) | 2,177 (0.4%) |
| 5-Person Households | 24,292 (5.0%) | 560 (0.1%) |
| 6-Person Households | 9,456 (1.9%) | 133 (0.0%) |
| 7+ Person Households | 4,919 (1.0%) | 50 (0.0%) |
| Total | 298,254 (60.8%) | 192,553 (39.2%) |
Female Fertility in Area Code 765
Fertility by Age in Area Code 765
Average fertility rate in Area Code 765 is 61.6 births per 1,000 women. Women in the age bracket of 20 to 34 years have the highest fertility rate with 127.2 births per 1,000 women. Women in the age bracket of 20 to 34 years acount for 80.4% of all women with births.
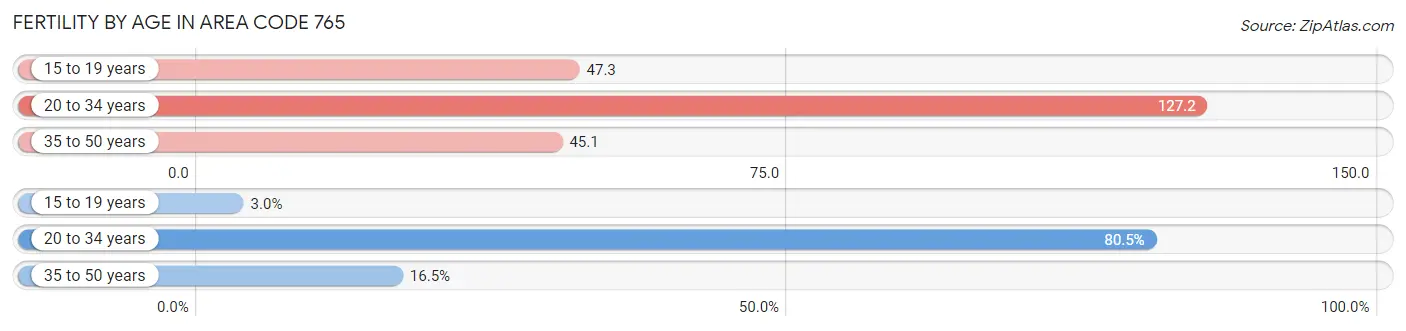
| Age Bracket | Women with Births | Births / 1,000 Women |
| 15 to 19 years | 448 (3.0%) | 47.3 |
| 20 to 34 years | 11,951 (80.4%) | 127.2 |
| 35 to 50 years | 2,456 (16.5%) | 45.1 |
| Total | 14,855 (100.0%) | 61.6 |
Fertility by Age by Marriage Status in Area Code 765
51.8% of women with births (14,855) in Area Code 765 are married. The highest percentage of unmarried women with births falls into 15 to 19 years age bracket with 100.0% of them unmarried at the time of birth, while the lowest percentage of unmarried women with births belong to 20 to 34 years age bracket with 51.8% of them unmarried.
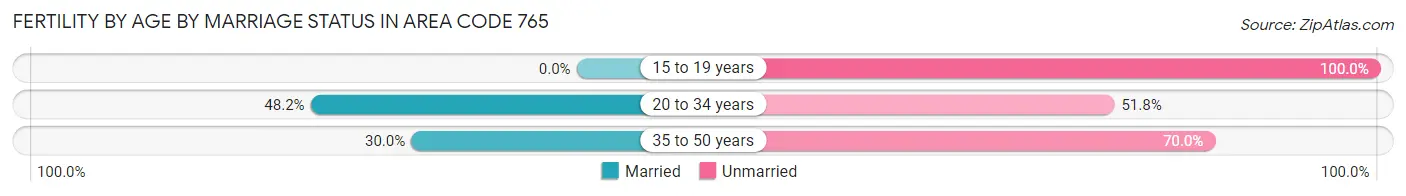
| Age Bracket | Married | Unmarried |
| 15 to 19 years | 0 (0.0%) | 448 (100.0%) |
| 20 to 34 years | 5,762 (48.2%) | 6,189 (51.8%) |
| 35 to 50 years | 736 (30.0%) | 1,720 (70.0%) |
| Total | 7,696 (51.8%) | 7,159 (48.2%) |
Fertility by Education in Area Code 765
Average fertility rate in Area Code 765 is 61.6 births per 1,000 women. Women with the education attainment of graduate degree have the highest fertility rate of 294.6 births per 1,000 women, while women with the education attainment of college or associate's degree have the lowest fertility at 81.3 births per 1,000 women. Women with the education attainment of college or associate's degree represent 35.1% of all women with births.
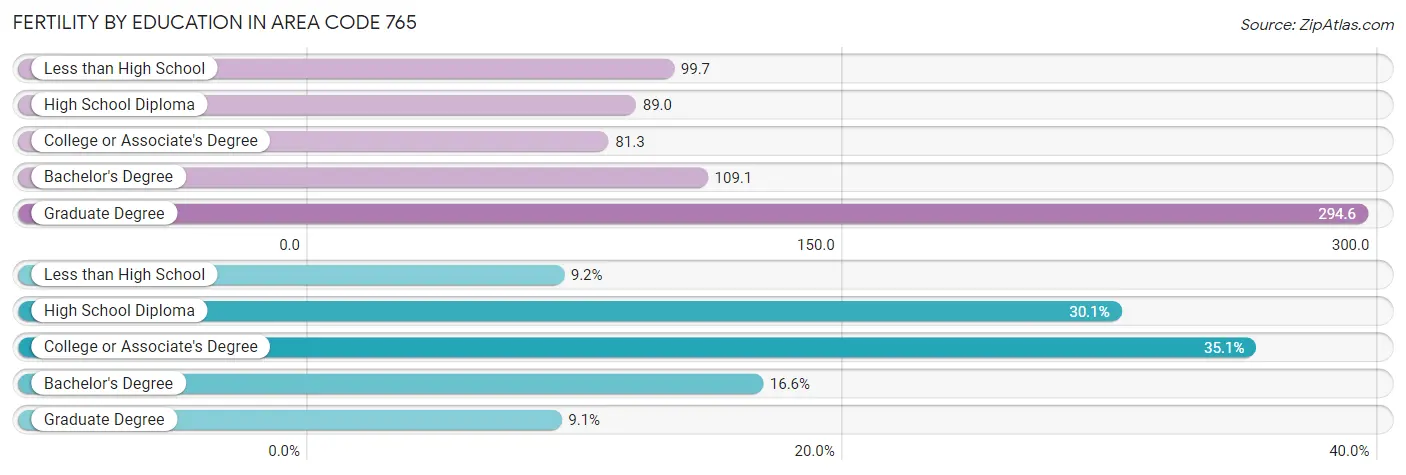
| Educational Attainment | Women with Births | Births / 1,000 Women |
| Less than High School | 1,361 (9.2%) | 99.7 |
| High School Diploma | 4,464 (30.0%) | 89.0 |
| College or Associate's Degree | 5,214 (35.1%) | 81.3 |
| Bachelor's Degree | 2,469 (16.6%) | 109.1 |
| Graduate Degree | 1,347 (9.1%) | 294.6 |
| Total | 14,855 (100.0%) | 61.6 |
Fertility by Education by Marriage Status in Area Code 765
48.2% of women with births in Area Code 765 are unmarried. Women with the educational attainment of bachelor's degree are most likely to be married with 53.6% of them married at childbirth, while women with the educational attainment of less than high school are least likely to be married with 83.8% of them unmarried at childbirth.
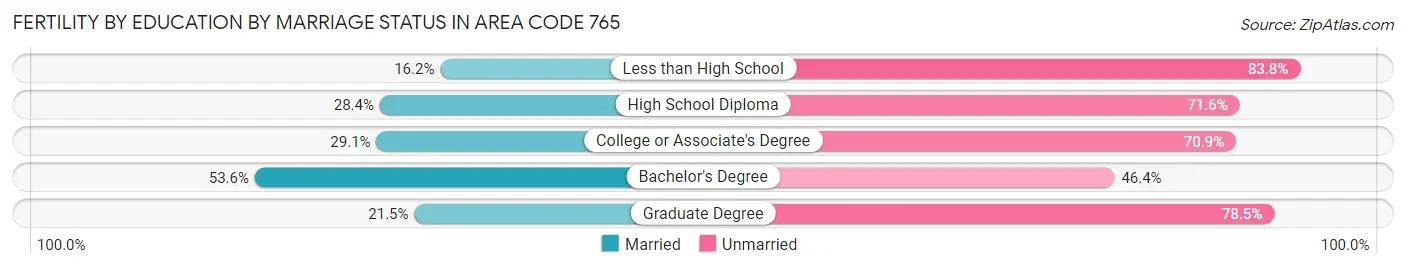
| Educational Attainment | Married | Unmarried |
| Less than High School | 221 (16.2%) | 1,140 (83.8%) |
| High School Diploma | 1,269 (28.4%) | 3,195 (71.6%) |
| College or Associate's Degree | 1,518 (29.1%) | 3,696 (70.9%) |
| Bachelor's Degree | 1,324 (53.6%) | 1,145 (46.4%) |
| Graduate Degree | 289 (21.5%) | 1,058 (78.5%) |
| Total | 7,696 (51.8%) | 7,159 (48.2%) |
Employment Characteristics in Area Code 765
Employment by Class of Employer in Area Code 765
Among the 561,802 employed individuals in Area Code 765, private company employees (389,210 | 69.3%), not-for-profit organizations (54,891 | 9.8%), and local government employees (35,178 | 6.3%) make up the most common classes of employment.
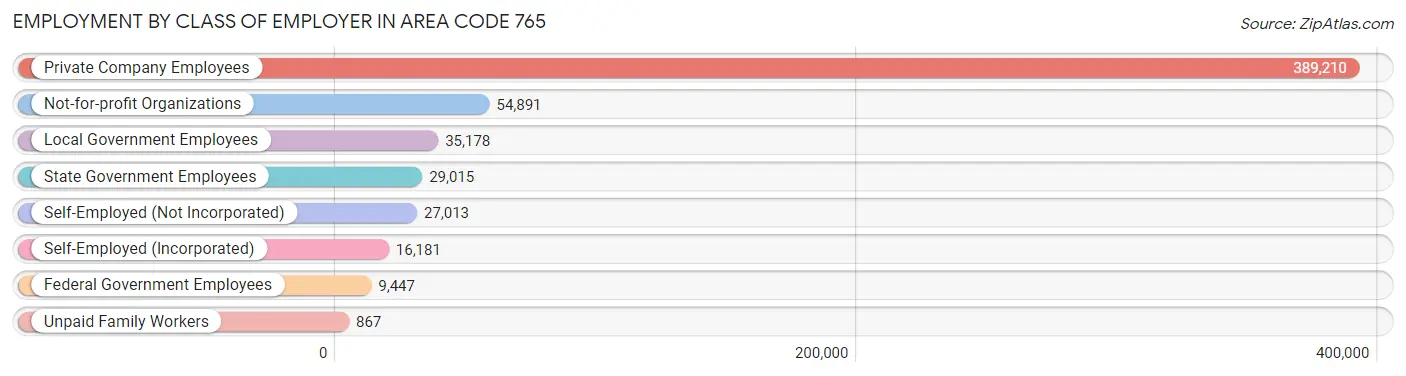
| Employer Class | # Employees | % Employees |
| Private Company Employees | 389,210 | 69.3% |
| Self-Employed (Incorporated) | 16,181 | 2.9% |
| Self-Employed (Not Incorporated) | 27,013 | 4.8% |
| Not-for-profit Organizations | 54,891 | 9.8% |
| Local Government Employees | 35,178 | 6.3% |
| State Government Employees | 29,015 | 5.2% |
| Federal Government Employees | 9,447 | 1.7% |
| Unpaid Family Workers | 867 | 0.2% |
| Total | 561,802 | 100.0% |
Employment Status by Age in Area Code 765
According to the labor force statistics for Area Code 765, out of the total population over 16 years of age (995,223), 60.6% or 602,608 individuals are in the labor force, with 4.8% or 29,166 of them unemployed. The age group with the highest labor force participation rate is 25 to 29 years, with 84.3% or 70,875 individuals in the labor force. Within the labor force, the 16 to 19 years age range has the highest percentage of unemployed individuals, with 2,350.8% or 861,239 of them being unemployed.
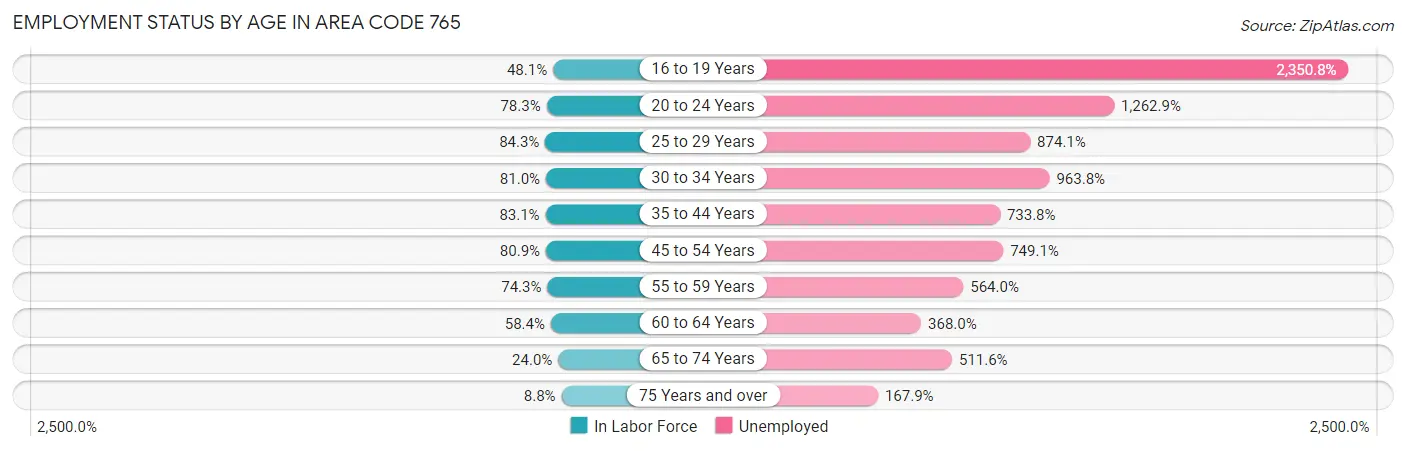
| Age Bracket | In Labor Force | Unemployed |
| 16 to 19 Years | 36,632 (48.1%) | 861,239 (2,350.8%) |
| 20 to 24 Years | 84,494 (78.3%) | 1,067,087 (1,262.9%) |
| 25 to 29 Years | 70,875 (84.3%) | 619,518 (874.1%) |
| 30 to 34 Years | 61,189 (81.0%) | 589,759 (963.8%) |
| 35 to 44 Years | 116,853 (83.1%) | 857,453 (733.8%) |
| 45 to 54 Years | 116,498 (80.9%) | 872,687 (749.1%) |
| 55 to 59 Years | 58,496 (74.3%) | 329,934 (564.0%) |
| 60 to 64 Years | 46,754 (58.4%) | 172,062 (368.0%) |
| 65 to 74 Years | 29,003 (24.0%) | 148,395 (511.6%) |
| 75 Years and over | 7,665 (8.8%) | 12,875 (167.9%) |
| Total | 602,597 (60.6%) | 29,185 (4.8%) |
Employment Status by Educational Attainment in Area Code 765
According to labor force statistics for Area Code 765, 76.9% of individuals (463,651) out of the total population between 25 and 64 years of age (602,927) are in the labor force, with 726.0% or 3,366,106 of them being unemployed. The group with the highest labor force participation rate are those with the educational attainment of bachelor's degree or higher, with 87.8% or 138,161 individuals in the labor force. Within the labor force, individuals with less than high school education have the highest percentage of unemployment, with 1,716.8% or 544,964 of them being unemployed.
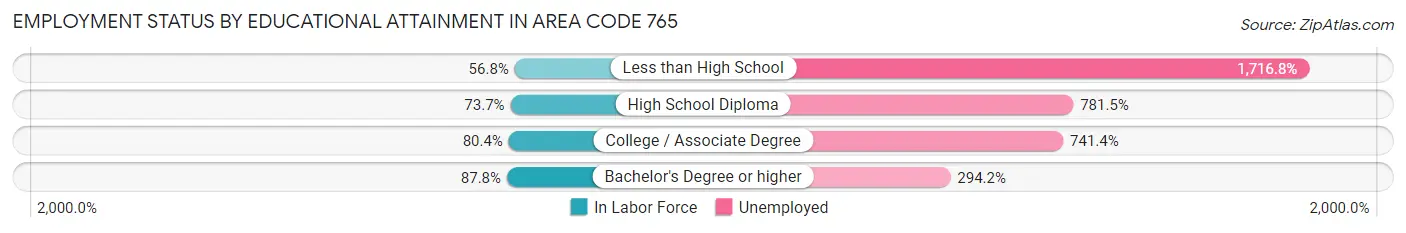
| Educational Attainment | In Labor Force | Unemployed |
| Less than High School | 31,742 (56.8%) | 959,605 (1,716.8%) |
| High School Diploma | 148,981 (73.7%) | 1,579,451 (781.5%) |
| College / Associate Degree | 150,817 (80.4%) | 1,390,229 (741.4%) |
| Bachelor's Degree or higher | 138,156 (87.8%) | 463,109 (294.2%) |
| Total | 463,678 (76.9%) | 4,377,250 (726.0%) |
Employment Occupations by Sex in Area Code 765
Management, Business, Science and Arts Occupations
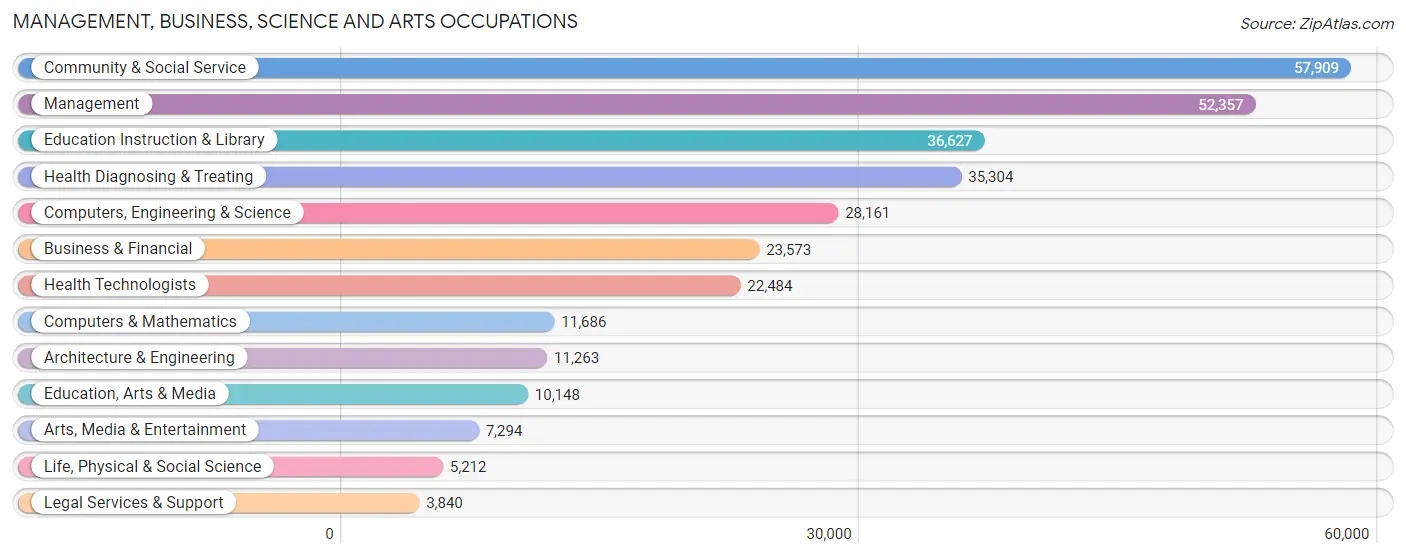
The most common Management, Business, Science and Arts occupations in Area Code 765 are Community & Social Service (57,909 | 10.1%), Management (52,357 | 9.1%), Education Instruction & Library (36,627 | 6.4%), Health Diagnosing & Treating (35,304 | 6.1%), and Computers, Engineering & Science (28,161 | 4.9%).
Management, Business, Science and Arts Occupations by Sex
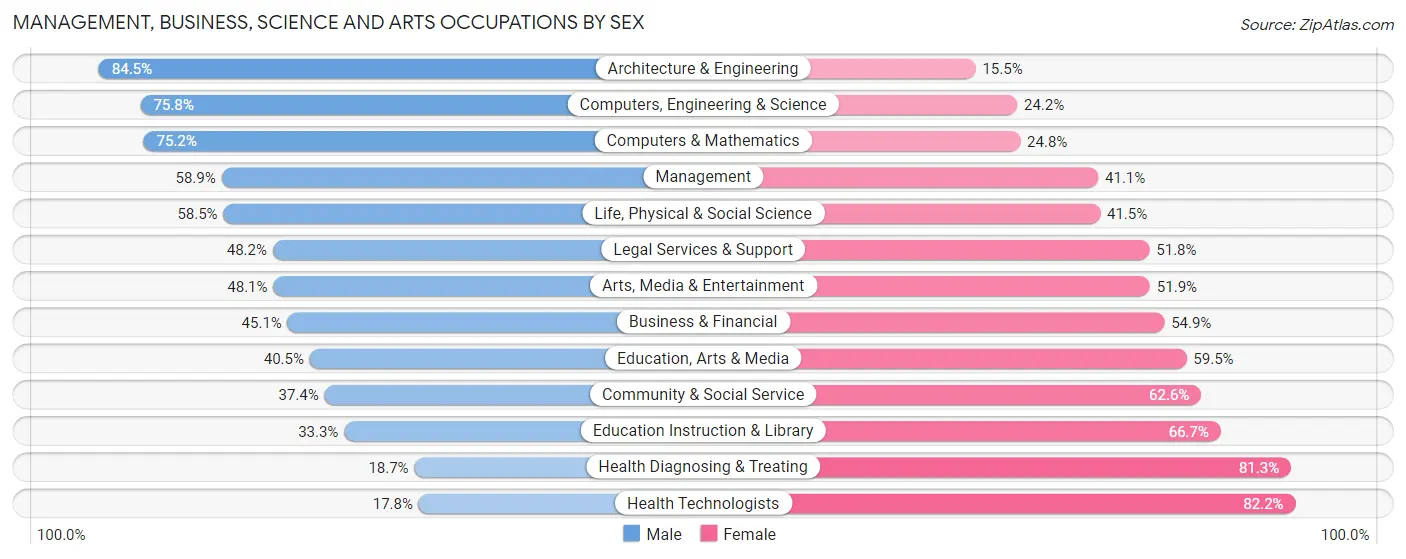
Within the Management, Business, Science and Arts occupations in Area Code 765, the most male-oriented occupations are Architecture & Engineering (84.5%), Computers, Engineering & Science (75.8%), and Computers & Mathematics (75.2%), while the most female-oriented occupations are Health Technologists (82.2%), Health Diagnosing & Treating (81.3%), and Education Instruction & Library (66.7%).
| Occupation | Male | Female |
| Management | 30,848 (58.9%) | 21,509 (41.1%) |
| Business & Financial | 10,638 (45.1%) | 12,935 (54.9%) |
| Computers, Engineering & Science | 21,353 (75.8%) | 6,808 (24.2%) |
| Computers & Mathematics | 8,786 (75.2%) | 2,900 (24.8%) |
| Architecture & Engineering | 9,517 (84.5%) | 1,746 (15.5%) |
| Life, Physical & Social Science | 3,050 (58.5%) | 2,162 (41.5%) |
| Community & Social Service | 21,678 (37.4%) | 36,231 (62.6%) |
| Education, Arts & Media | 4,110 (40.5%) | 6,038 (59.5%) |
| Legal Services & Support | 1,852 (48.2%) | 1,988 (51.8%) |
| Education Instruction & Library | 12,207 (33.3%) | 24,420 (66.7%) |
| Arts, Media & Entertainment | 3,509 (48.1%) | 3,785 (51.9%) |
| Health Diagnosing & Treating | 6,596 (18.7%) | 28,708 (81.3%) |
| Health Technologists | 3,994 (17.8%) | 18,490 (82.2%) |
| Total (Category) | 91,113 (46.2%) | 106,191 (53.8%) |
| Total (Overall) | 303,812 (52.7%) | 272,328 (47.3%) |
Services Occupations
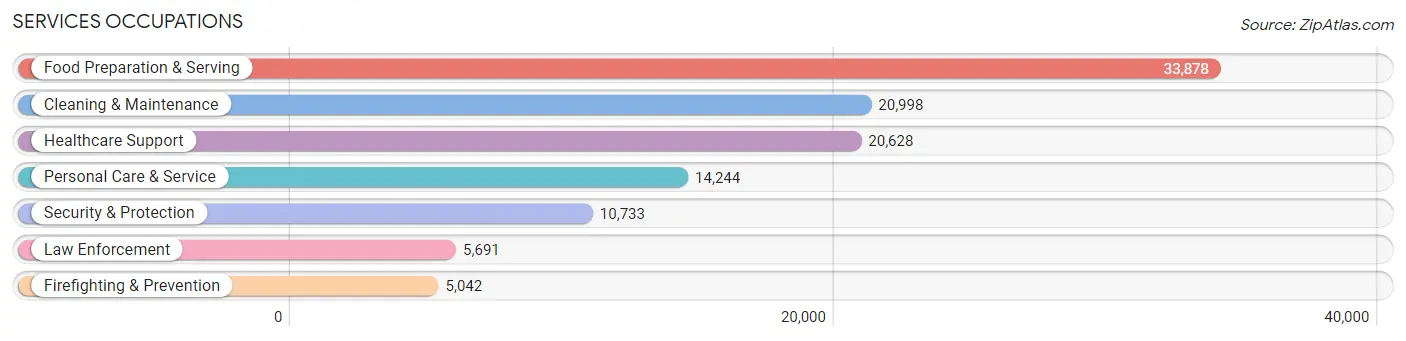
The most common Services occupations in Area Code 765 are Food Preparation & Serving (33,878 | 5.9%), Cleaning & Maintenance (20,998 | 3.6%), Healthcare Support (20,628 | 3.6%), Personal Care & Service (14,244 | 2.5%), and Security & Protection (10,733 | 1.9%).
Services Occupations by Sex
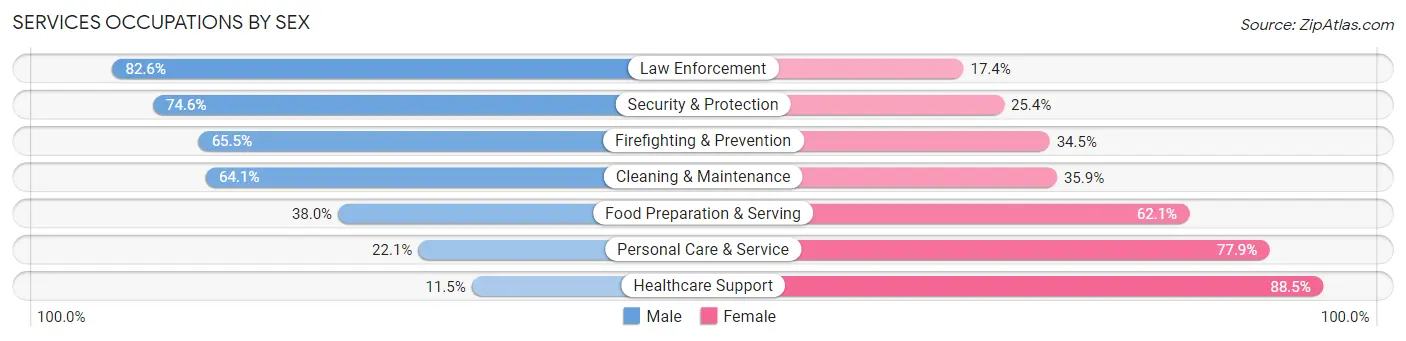
Within the Services occupations in Area Code 765, the most male-oriented occupations are Law Enforcement (82.6%), Security & Protection (74.6%), and Firefighting & Prevention (65.5%), while the most female-oriented occupations are Healthcare Support (88.5%), Personal Care & Service (77.9%), and Food Preparation & Serving (62.1%).
| Occupation | Male | Female |
| Healthcare Support | 2,370 (11.5%) | 18,258 (88.5%) |
| Security & Protection | 8,002 (74.6%) | 2,731 (25.4%) |
| Firefighting & Prevention | 3,303 (65.5%) | 1,739 (34.5%) |
| Law Enforcement | 4,699 (82.6%) | 992 (17.4%) |
| Food Preparation & Serving | 12,858 (38.0%) | 21,020 (62.1%) |
| Cleaning & Maintenance | 13,453 (64.1%) | 7,545 (35.9%) |
| Personal Care & Service | 3,143 (22.1%) | 11,101 (77.9%) |
| Total (Category) | 39,826 (39.6%) | 60,655 (60.4%) |
| Total (Overall) | 303,812 (52.7%) | 272,328 (47.3%) |
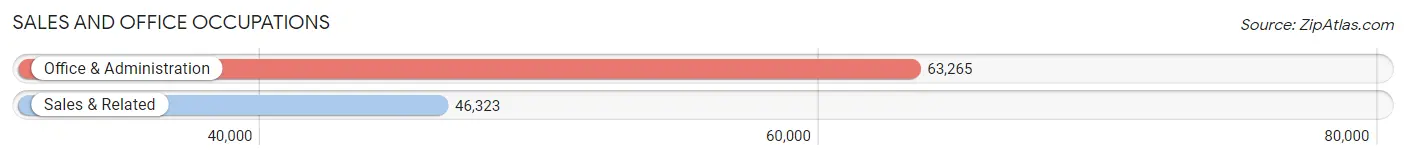
Sales and Office Occupations
The most common Sales and Office occupations in Area Code 765 are Office & Administration (63,265 | 11.0%), and Sales & Related (46,323 | 8.0%).
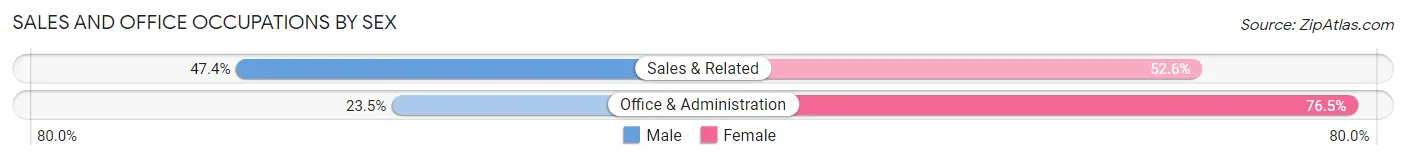
Sales and Office Occupations by Sex
| Occupation | Male | Female |
| Sales & Related | 21,974 (47.4%) | 24,349 (52.6%) |
| Office & Administration | 14,851 (23.5%) | 48,414 (76.5%) |
| Total (Category) | 36,825 (33.6%) | 72,763 (66.4%) |
| Total (Overall) | 303,812 (52.7%) | 272,328 (47.3%) |
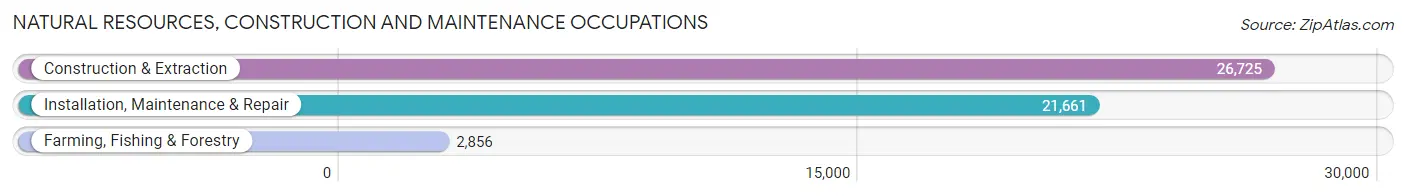
Natural Resources, Construction and Maintenance Occupations
The most common Natural Resources, Construction and Maintenance occupations in Area Code 765 are Construction & Extraction (26,725 | 4.6%), Installation, Maintenance & Repair (21,661 | 3.8%), and Farming, Fishing & Forestry (2,856 | 0.5%).
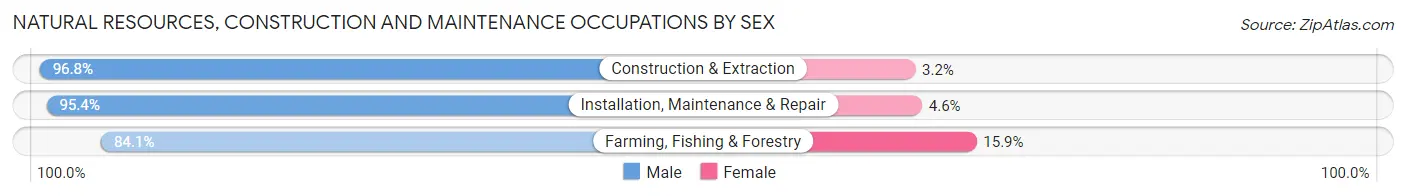
Natural Resources, Construction and Maintenance Occupations by Sex
| Occupation | Male | Female |
| Farming, Fishing & Forestry | 2,402 (84.1%) | 454 (15.9%) |
| Construction & Extraction | 25,880 (96.8%) | 845 (3.2%) |
| Installation, Maintenance & Repair | 20,673 (95.4%) | 988 (4.6%) |
| Total (Category) | 48,955 (95.5%) | 2,287 (4.5%) |
| Total (Overall) | 303,812 (52.7%) | 272,328 (47.3%) |
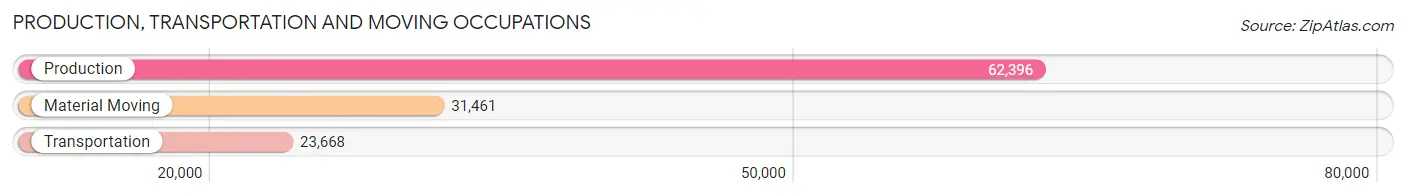
Production, Transportation and Moving Occupations
The most common Production, Transportation and Moving occupations in Area Code 765 are Production (62,396 | 10.8%), Material Moving (31,461 | 5.5%), and Transportation (23,668 | 4.1%).
Production, Transportation and Moving Occupations by Sex
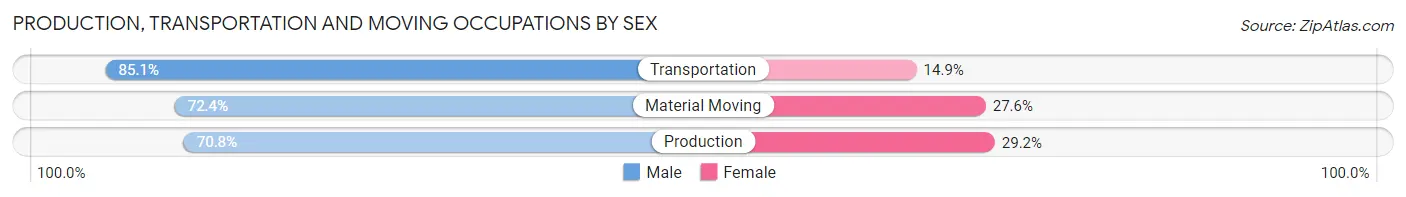
| Occupation | Male | Female |
| Production | 44,160 (70.8%) | 18,236 (29.2%) |
| Transportation | 20,146 (85.1%) | 3,522 (14.9%) |
| Material Moving | 22,787 (72.4%) | 8,674 (27.6%) |
| Total (Category) | 87,093 (74.1%) | 30,432 (25.9%) |
| Total (Overall) | 303,812 (52.7%) | 272,328 (47.3%) |
Employment Industries by Sex in Area Code 765
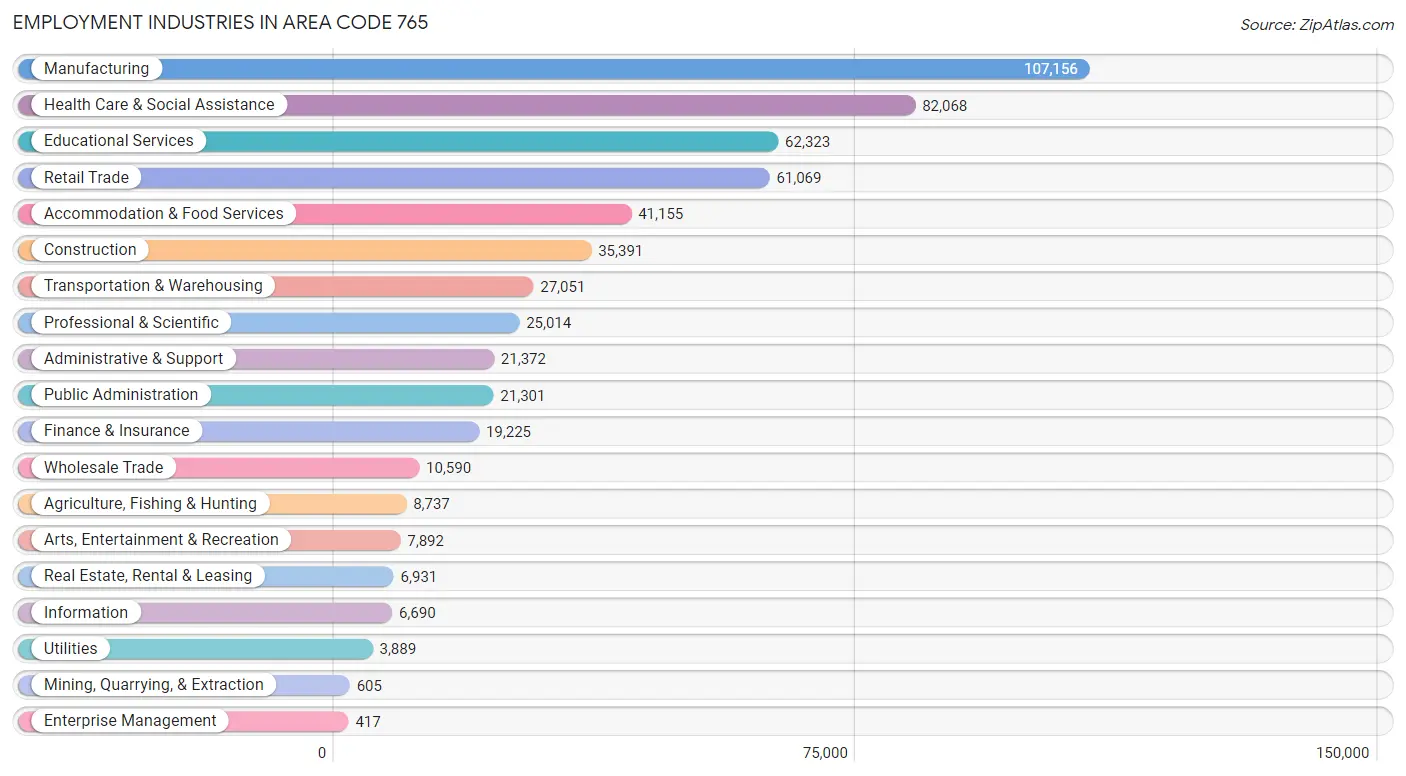
Employment Industries in Area Code 765
The major employment industries in Area Code 765 include Manufacturing (107,156 | 18.6%), Health Care & Social Assistance (82,068 | 14.2%), Educational Services (62,323 | 10.8%), Retail Trade (61,069 | 10.6%), and Accommodation & Food Services (41,155 | 7.1%).
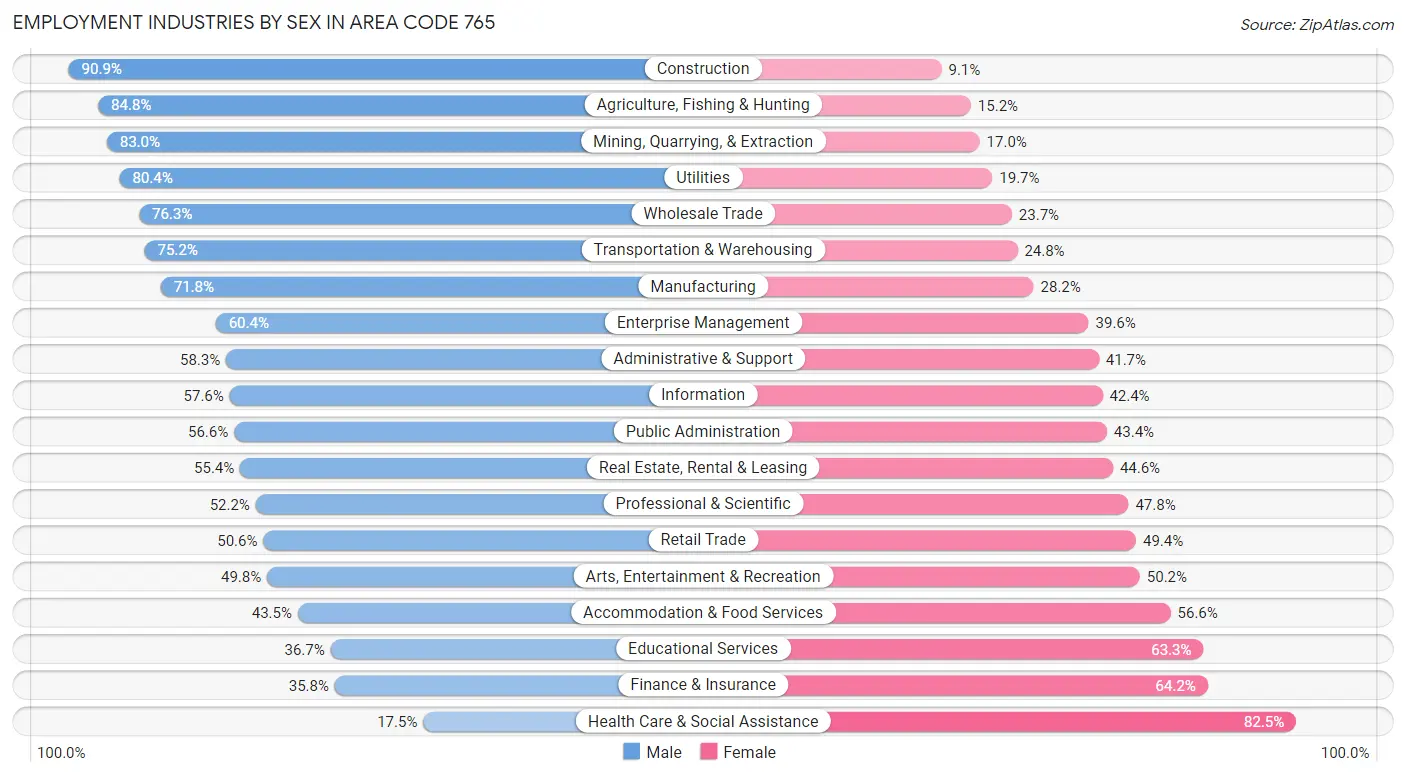
Employment Industries by Sex in Area Code 765
The Area Code 765 industries that see more men than women are Construction (90.9%), Agriculture, Fishing & Hunting (84.8%), and Mining, Quarrying, & Extraction (83.0%), whereas the industries that tend to have a higher number of women are Health Care & Social Assistance (82.5%), Finance & Insurance (64.2%), and Educational Services (63.3%).
| Industry | Male | Female |
| Agriculture, Fishing & Hunting | 7,408 (84.8%) | 1,329 (15.2%) |
| Mining, Quarrying, & Extraction | 502 (83.0%) | 103 (17.0%) |
| Construction | 32,161 (90.9%) | 3,230 (9.1%) |
| Manufacturing | 76,946 (71.8%) | 30,210 (28.2%) |
| Wholesale Trade | 8,080 (76.3%) | 2,510 (23.7%) |
| Retail Trade | 30,898 (50.6%) | 30,171 (49.4%) |
| Transportation & Warehousing | 20,332 (75.2%) | 6,719 (24.8%) |
| Utilities | 3,125 (80.3%) | 764 (19.7%) |
| Information | 3,851 (57.6%) | 2,839 (42.4%) |
| Finance & Insurance | 6,881 (35.8%) | 12,344 (64.2%) |
| Real Estate, Rental & Leasing | 3,839 (55.4%) | 3,092 (44.6%) |
| Professional & Scientific | 13,050 (52.2%) | 11,964 (47.8%) |
| Enterprise Management | 252 (60.4%) | 165 (39.6%) |
| Administrative & Support | 12,459 (58.3%) | 8,913 (41.7%) |
| Educational Services | 22,862 (36.7%) | 39,461 (63.3%) |
| Health Care & Social Assistance | 14,357 (17.5%) | 67,711 (82.5%) |
| Arts, Entertainment & Recreation | 3,932 (49.8%) | 3,960 (50.2%) |
| Accommodation & Food Services | 17,881 (43.4%) | 23,274 (56.6%) |
| Public Administration | 12,064 (56.6%) | 9,237 (43.4%) |
| Total | 303,812 (52.7%) | 272,328 (47.3%) |
Education in Area Code 765
School Enrollment in Area Code 765
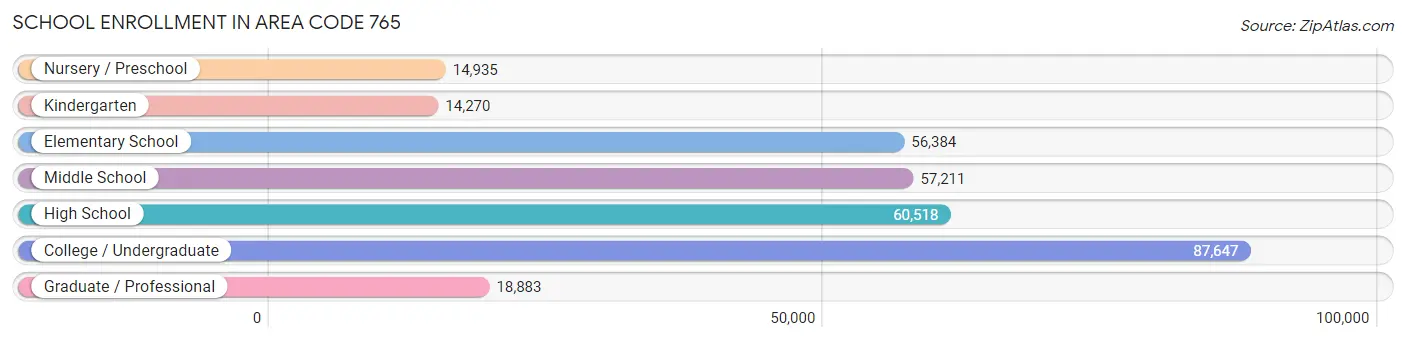
The most common levels of schooling among the 309,848 students in Area Code 765 are college / undergraduate (87,647 | 28.3%), high school (60,518 | 19.5%), and middle school (57,211 | 18.5%).
| School Level | # Students | % Students |
| Nursery / Preschool | 14,935 | 4.8% |
| Kindergarten | 14,270 | 4.6% |
| Elementary School | 56,384 | 18.2% |
| Middle School | 57,211 | 18.5% |
| High School | 60,518 | 19.5% |
| College / Undergraduate | 87,647 | 28.3% |
| Graduate / Professional | 18,883 | 6.1% |
| Total | 309,848 | 100.0% |
School Enrollment by Age by Funding Source in Area Code 765
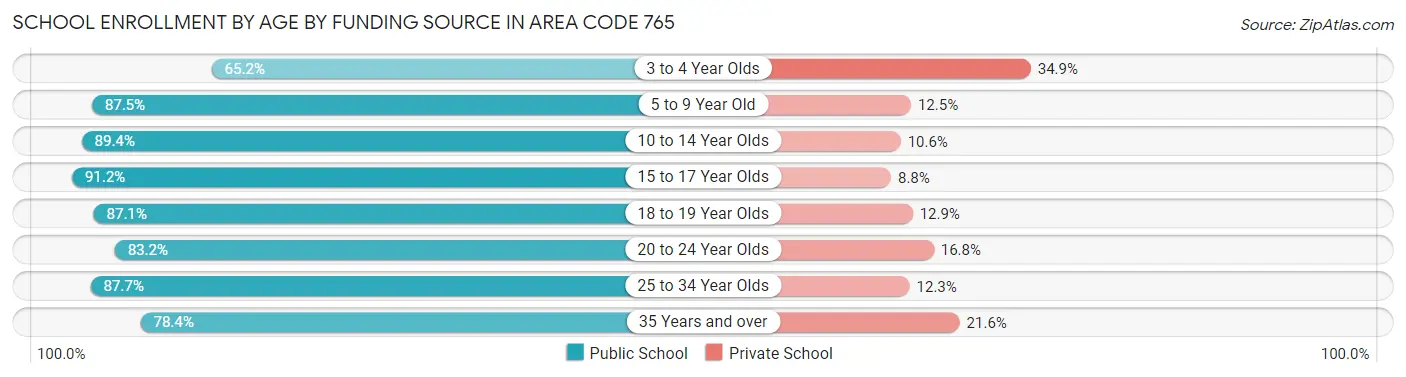
Out of a total of 309,848 students who are enrolled in schools in Area Code 765, 41,580 (13.4%) attend a private institution, while the remaining 268,268 (86.6%) are enrolled in public schools. The age group of 3 to 4 year olds has the highest likelihood of being enrolled in private schools, with 3,743 (34.8% in the age bracket) enrolled. Conversely, the age group of 15 to 17 year olds has the lowest likelihood of being enrolled in a private school, with 40,688 (91.2% in the age bracket) attending a public institution.
| Age Bracket | Public School | Private School |
| 3 to 4 Year Olds | 6,998 (65.1%) | 3,743 (34.8%) |
| 5 to 9 Year Old | 57,276 (87.5%) | 8,213 (12.5%) |
| 10 to 14 Year Olds | 64,073 (89.4%) | 7,611 (10.6%) |
| 15 to 17 Year Olds | 40,688 (91.2%) | 3,938 (8.8%) |
| 18 to 19 Year Olds | 30,384 (87.1%) | 4,485 (12.9%) |
| 20 to 24 Year Olds | 43,018 (83.2%) | 8,681 (16.8%) |
| 25 to 34 Year Olds | 16,046 (87.7%) | 2,247 (12.3%) |
| 35 Years and over | 9,758 (78.4%) | 2,689 (21.6%) |
| Total | 268,268 (86.6%) | 41,580 (13.4%) |
Educational Attainment by Field of Study in Area Code 765
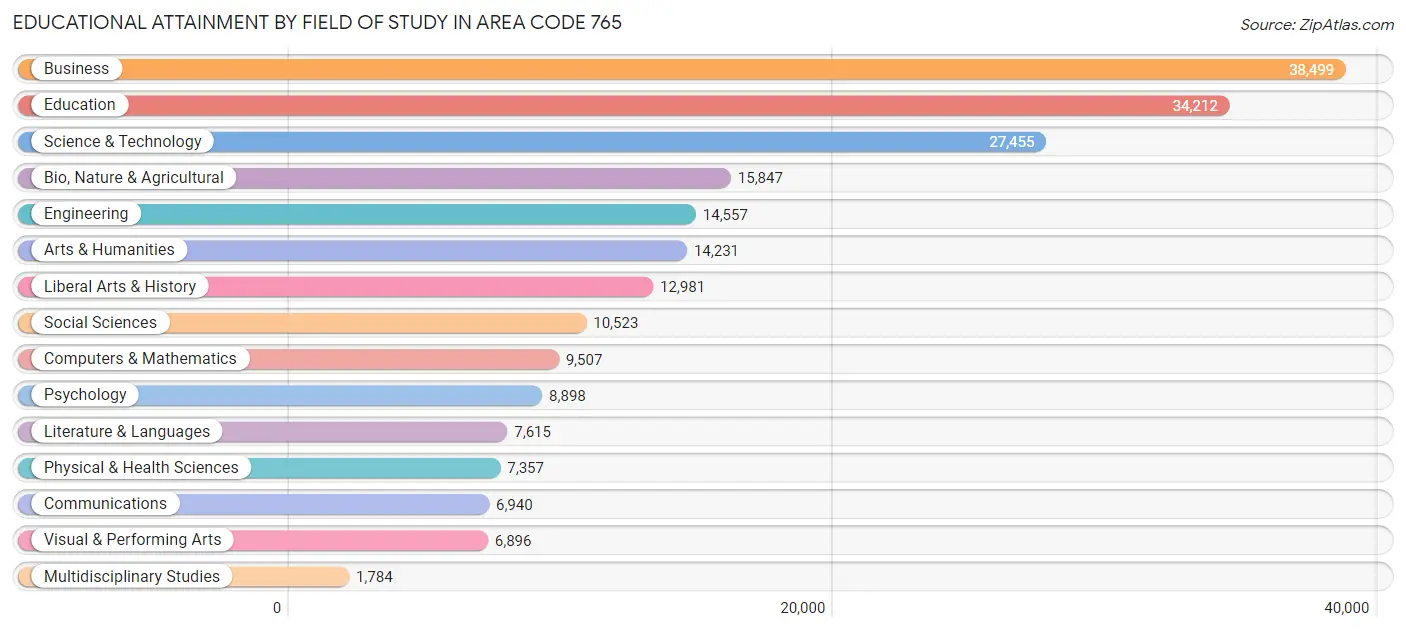
Business (38,499 | 17.7%), education (34,212 | 15.7%), science & technology (27,455 | 12.6%), bio, nature & agricultural (15,847 | 7.3%), and engineering (14,557 | 6.7%) are the most common fields of study among 217,302 individuals in Area Code 765 who have obtained a bachelor's degree or higher.
| Field of Study | # Graduates | % Graduates |
| Computers & Mathematics | 9,507 | 4.4% |
| Bio, Nature & Agricultural | 15,847 | 7.3% |
| Physical & Health Sciences | 7,357 | 3.4% |
| Psychology | 8,898 | 4.1% |
| Social Sciences | 10,523 | 4.8% |
| Engineering | 14,557 | 6.7% |
| Multidisciplinary Studies | 1,784 | 0.8% |
| Science & Technology | 27,455 | 12.6% |
| Business | 38,499 | 17.7% |
| Education | 34,212 | 15.7% |
| Literature & Languages | 7,615 | 3.5% |
| Liberal Arts & History | 12,981 | 6.0% |
| Visual & Performing Arts | 6,896 | 3.2% |
| Communications | 6,940 | 3.2% |
| Arts & Humanities | 14,231 | 6.6% |
| Total | 217,302 | 100.0% |
Transportation & Commute in Area Code 765
Vehicle Availability by Sex in Area Code 765
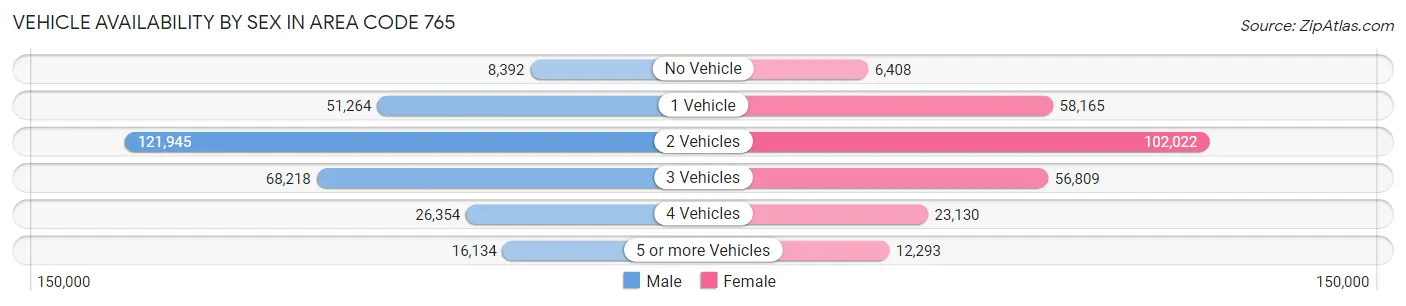
The most prevalent vehicle ownership categories in Area Code 765 are males with 2 vehicles (121,945, accounting for 41.7%) and females with 2 vehicles (102,022, making up 47.1%).
| Vehicles Available | Male | Female |
| No Vehicle | 8,392 (2.9%) | 6,408 (2.5%) |
| 1 Vehicle | 51,264 (17.5%) | 58,165 (22.5%) |
| 2 Vehicles | 121,945 (41.7%) | 102,022 (39.4%) |
| 3 Vehicles | 68,218 (23.3%) | 56,809 (22.0%) |
| 4 Vehicles | 26,354 (9.0%) | 23,130 (8.9%) |
| 5 or more Vehicles | 16,134 (5.5%) | 12,293 (4.8%) |
| Total | 292,307 (100.0%) | 258,827 (100.0%) |
Commute Time in Area Code 765
The most frequently occuring commute durations in Area Code 765 are 10 to 14 minutes (89,666 commuters, 17.2%), 15 to 19 minutes (86,180 commuters, 16.6%), and 5 to 9 minutes (71,509 commuters, 13.8%).
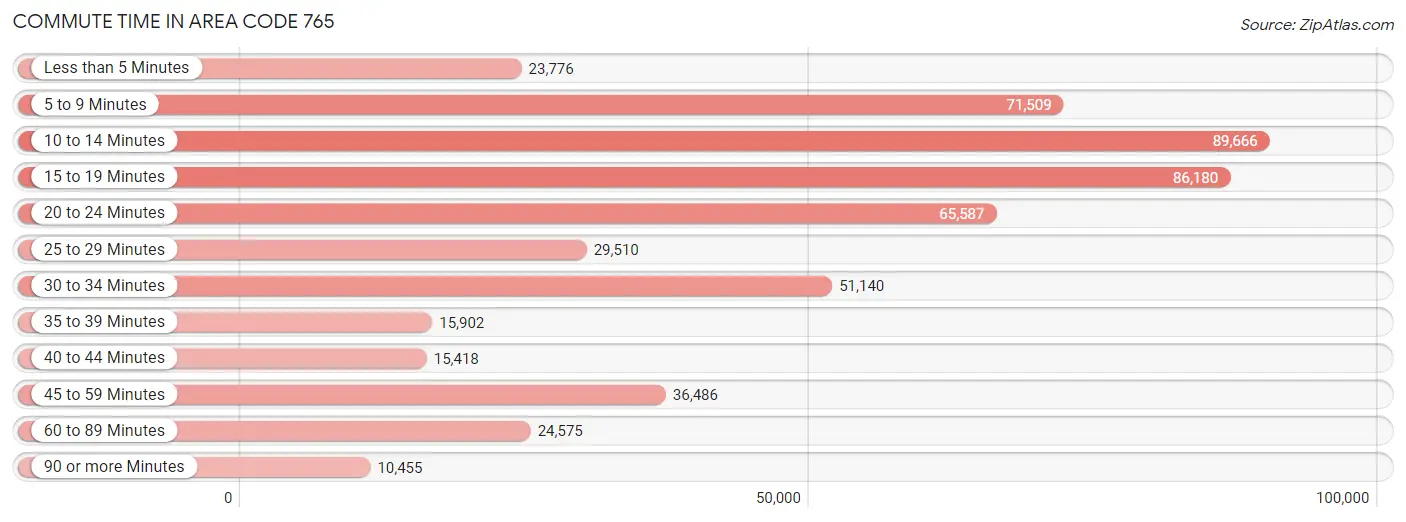
| Commute Time | # Commuters | % Commuters |
| Less than 5 Minutes | 23,776 | 4.6% |
| 5 to 9 Minutes | 71,509 | 13.8% |
| 10 to 14 Minutes | 89,666 | 17.2% |
| 15 to 19 Minutes | 86,180 | 16.6% |
| 20 to 24 Minutes | 65,587 | 12.6% |
| 25 to 29 Minutes | 29,510 | 5.7% |
| 30 to 34 Minutes | 51,140 | 9.8% |
| 35 to 39 Minutes | 15,902 | 3.1% |
| 40 to 44 Minutes | 15,418 | 3.0% |
| 45 to 59 Minutes | 36,486 | 7.0% |
| 60 to 89 Minutes | 24,575 | 4.7% |
| 90 or more Minutes | 10,455 | 2.0% |
Commute Time by Sex in Area Code 765
The most common commute times in Area Code 765 are 10 to 14 minutes (45,780 commuters, 16.5%) for males and 10 to 14 minutes (43,886 commuters, 18.1%) for females.
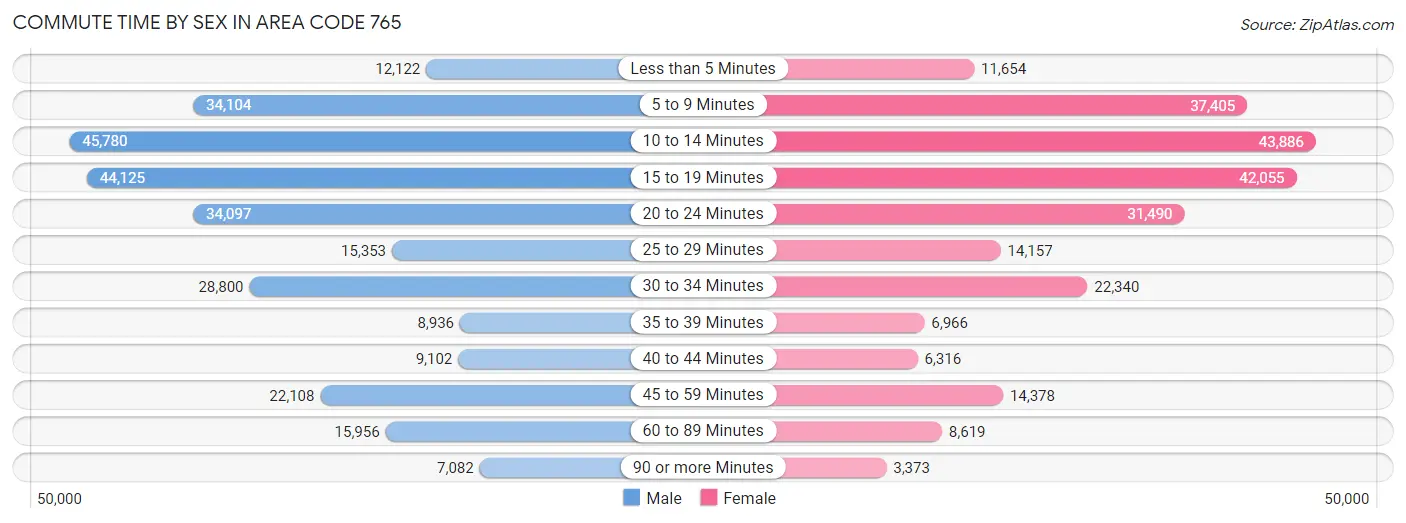
| Commute Time | Male | Female |
| Less than 5 Minutes | 12,122 (4.4%) | 11,654 (4.8%) |
| 5 to 9 Minutes | 34,104 (12.3%) | 37,405 (15.4%) |
| 10 to 14 Minutes | 45,780 (16.5%) | 43,886 (18.1%) |
| 15 to 19 Minutes | 44,125 (15.9%) | 42,055 (17.3%) |
| 20 to 24 Minutes | 34,097 (12.3%) | 31,490 (13.0%) |
| 25 to 29 Minutes | 15,353 (5.5%) | 14,157 (5.8%) |
| 30 to 34 Minutes | 28,800 (10.4%) | 22,340 (9.2%) |
| 35 to 39 Minutes | 8,936 (3.2%) | 6,966 (2.9%) |
| 40 to 44 Minutes | 9,102 (3.3%) | 6,316 (2.6%) |
| 45 to 59 Minutes | 22,108 (8.0%) | 14,378 (5.9%) |
| 60 to 89 Minutes | 15,956 (5.8%) | 8,619 (3.5%) |
| 90 or more Minutes | 7,082 (2.5%) | 3,373 (1.4%) |
Time of Departure to Work by Sex in Area Code 765
The most frequent times of departure to work in Area Code 765 are 7:00 AM to 7:29 AM (33,424, 12.0%) for males and 7:30 AM to 7:59 AM (38,659, 15.9%) for females.
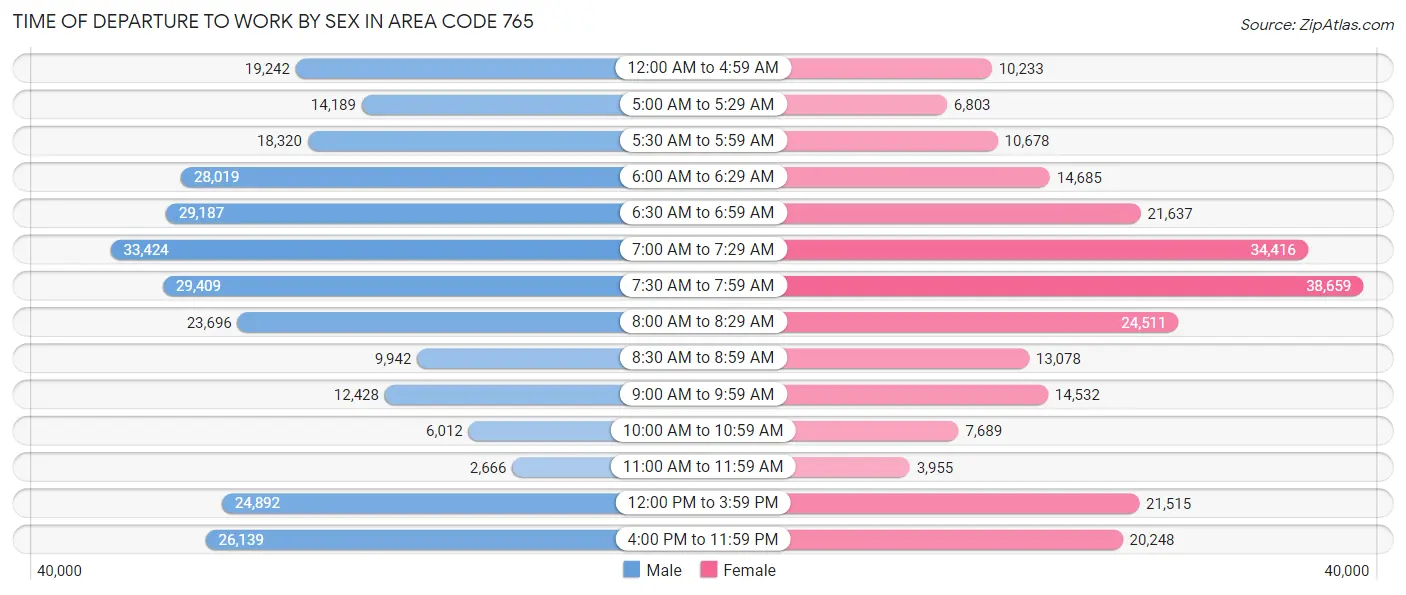
| Time of Departure | Male | Female |
| 12:00 AM to 4:59 AM | 19,242 (6.9%) | 10,233 (4.2%) |
| 5:00 AM to 5:29 AM | 14,189 (5.1%) | 6,803 (2.8%) |
| 5:30 AM to 5:59 AM | 18,320 (6.6%) | 10,678 (4.4%) |
| 6:00 AM to 6:29 AM | 28,019 (10.1%) | 14,685 (6.0%) |
| 6:30 AM to 6:59 AM | 29,187 (10.5%) | 21,637 (8.9%) |
| 7:00 AM to 7:29 AM | 33,424 (12.0%) | 34,416 (14.2%) |
| 7:30 AM to 7:59 AM | 29,409 (10.6%) | 38,659 (15.9%) |
| 8:00 AM to 8:29 AM | 23,696 (8.5%) | 24,511 (10.1%) |
| 8:30 AM to 8:59 AM | 9,942 (3.6%) | 13,078 (5.4%) |
| 9:00 AM to 9:59 AM | 12,428 (4.5%) | 14,532 (6.0%) |
| 10:00 AM to 10:59 AM | 6,012 (2.2%) | 7,689 (3.2%) |
| 11:00 AM to 11:59 AM | 2,666 (1.0%) | 3,955 (1.6%) |
| 12:00 PM to 3:59 PM | 24,892 (9.0%) | 21,515 (8.9%) |
| 4:00 PM to 11:59 PM | 26,139 (9.4%) | 20,248 (8.3%) |
| Total | 277,565 (100.0%) | 242,639 (100.0%) |
Housing Occupancy in Area Code 765
Occupancy by Ownership in Area Code 765
Of the total 490,807 dwellings in Area Code 765, owner-occupied units account for 329,412 (67.1%), while renter-occupied units make up 161,395 (32.9%).
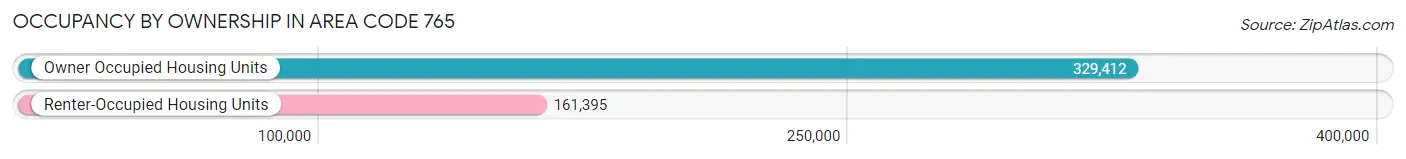
| Occupancy | # Housing Units | % Housing Units |
| Owner Occupied Housing Units | 329,412 | 67.1% |
| Renter-Occupied Housing Units | 161,395 | 32.9% |
| Total Occupied Housing Units | 490,807 | 100.0% |
Occupancy by Household Size in Area Code 765
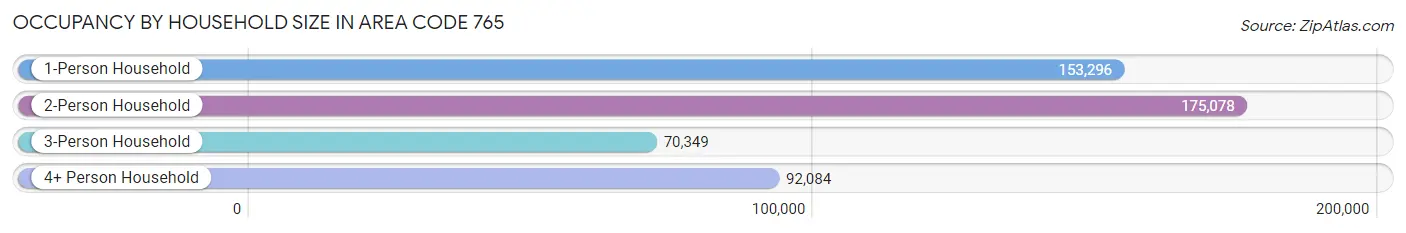
| Household Size | # Housing Units | % Housing Units |
| 1-Person Household | 153,296 | 31.2% |
| 2-Person Household | 175,078 | 35.7% |
| 3-Person Household | 70,349 | 14.3% |
| 4+ Person Household | 92,084 | 18.8% |
| Total Housing Units | 490,807 | 100.0% |
Occupancy by Ownership by Household Size in Area Code 765
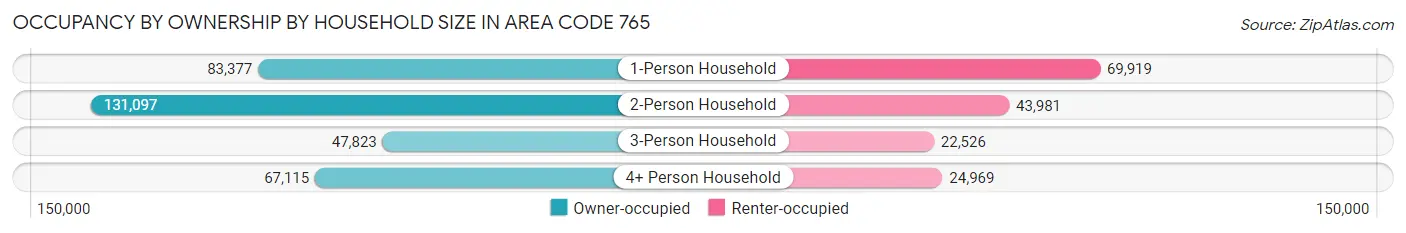
| Household Size | Owner-occupied | Renter-occupied |
| 1-Person Household | 83,377 (54.4%) | 69,919 (45.6%) |
| 2-Person Household | 131,097 (74.9%) | 43,981 (25.1%) |
| 3-Person Household | 47,823 (68.0%) | 22,526 (32.0%) |
| 4+ Person Household | 67,115 (72.9%) | 24,969 (27.1%) |
| Total Housing Units | 329,412 (67.1%) | 161,395 (32.9%) |
Occupancy by Educational Attainment in Area Code 765
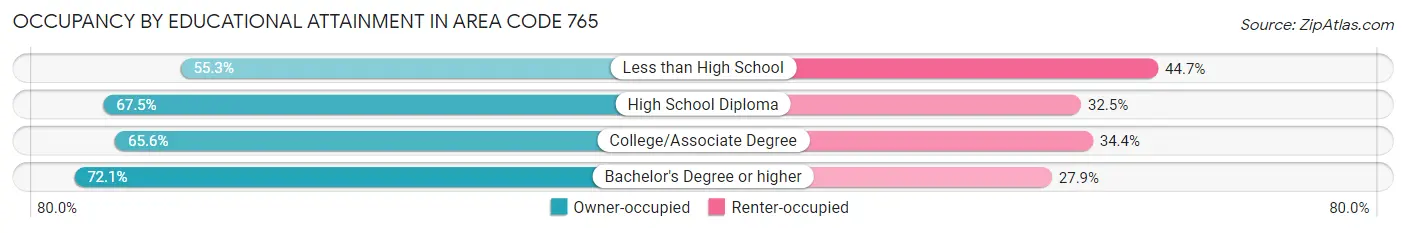
| Household Size | Owner-occupied | Renter-occupied |
| Less than High School | 22,308 (55.3%) | 18,051 (44.7%) |
| High School Diploma | 109,487 (67.5%) | 52,716 (32.5%) |
| College/Associate Degree | 104,132 (65.6%) | 54,503 (34.4%) |
| Bachelor's Degree or higher | 93,485 (72.1%) | 36,125 (27.9%) |
Occupancy by Age of Householder in Area Code 765
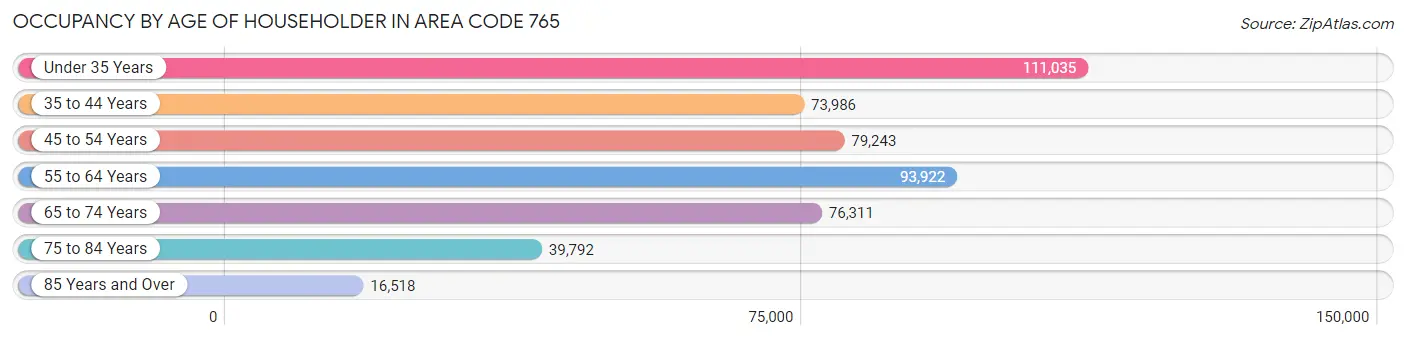
| Age Bracket | # Households | % Households |
| Under 35 Years | 111,035 | 22.6% |
| 35 to 44 Years | 73,986 | 15.1% |
| 45 to 54 Years | 79,243 | 16.2% |
| 55 to 64 Years | 93,922 | 19.1% |
| 65 to 74 Years | 76,311 | 15.5% |
| 75 to 84 Years | 39,792 | 8.1% |
| 85 Years and Over | 16,518 | 3.4% |
| Total | 490,807 | 100.0% |
Housing Finances in Area Code 765
Median Income by Occupancy in Area Code 765
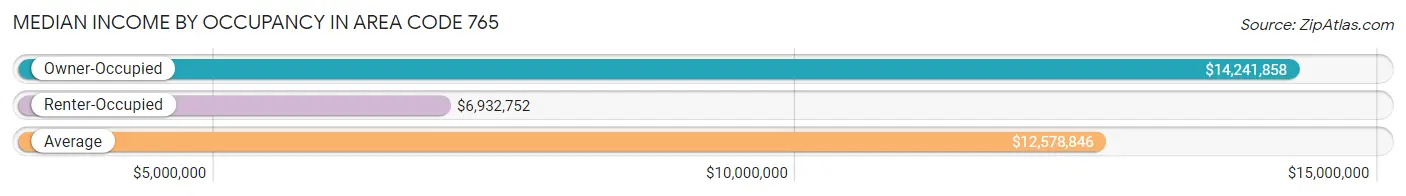
| Occupancy Type | # Households | Median Income |
| Owner-Occupied | 329,412 (67.1%) | $14,241,858 |
| Renter-Occupied | 161,395 (32.9%) | $6,932,752 |
| Average | 490,807 (100.0%) | $12,578,846 |
Occupancy by Householder Income Bracket in Area Code 765
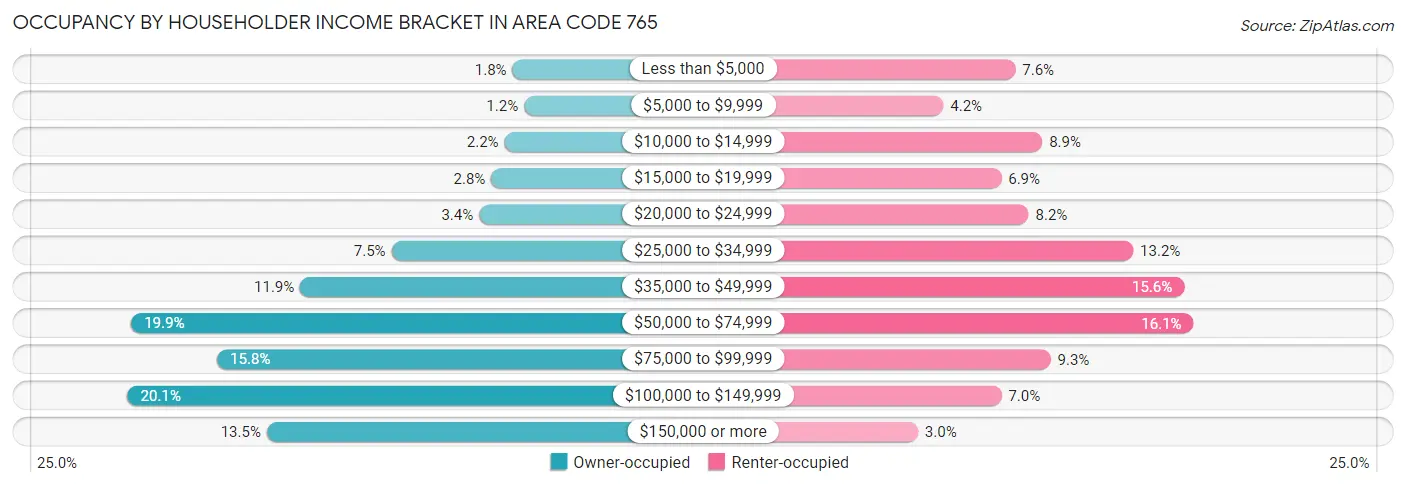
| Income Bracket | Owner-occupied | Renter-occupied |
| Less than $5,000 | 5,830 (1.8%) | 12,289 (7.6%) |
| $5,000 to $9,999 | 4,025 (1.2%) | 6,739 (4.2%) |
| $10,000 to $14,999 | 7,067 (2.1%) | 14,346 (8.9%) |
| $15,000 to $19,999 | 9,165 (2.8%) | 11,195 (6.9%) |
| $20,000 to $24,999 | 11,052 (3.4%) | 13,291 (8.2%) |
| $25,000 to $34,999 | 24,797 (7.5%) | 21,337 (13.2%) |
| $35,000 to $49,999 | 39,130 (11.9%) | 25,235 (15.6%) |
| $50,000 to $74,999 | 65,626 (19.9%) | 25,968 (16.1%) |
| $75,000 to $99,999 | 52,154 (15.8%) | 14,989 (9.3%) |
| $100,000 to $149,999 | 66,204 (20.1%) | 11,210 (7.0%) |
| $150,000 or more | 44,362 (13.5%) | 4,796 (3.0%) |
| Total | 329,412 (100.0%) | 161,395 (100.0%) |
Monthly Housing Cost Tiers in Area Code 765
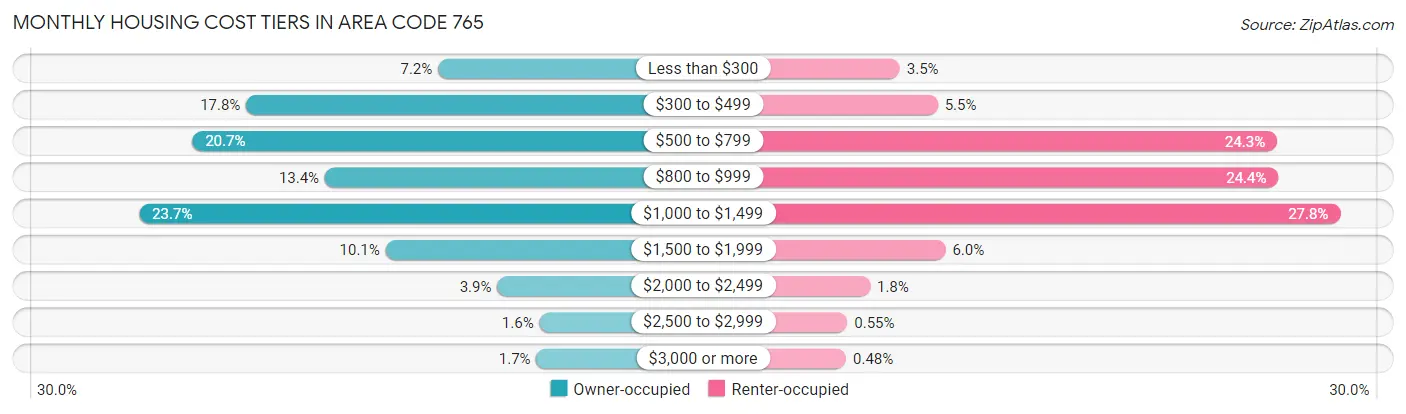
| Monthly Cost | Owner-occupied | Renter-occupied |
| Less than $300 | 23,590 (7.2%) | 5,564 (3.5%) |
| $300 to $499 | 58,517 (17.8%) | 8,936 (5.5%) |
| $500 to $799 | 68,312 (20.7%) | 39,192 (24.3%) |
| $800 to $999 | 44,183 (13.4%) | 39,298 (24.3%) |
| $1,000 to $1,499 | 78,014 (23.7%) | 44,823 (27.8%) |
| $1,500 to $1,999 | 33,144 (10.1%) | 9,640 (6.0%) |
| $2,000 to $2,499 | 12,824 (3.9%) | 2,905 (1.8%) |
| $2,500 to $2,999 | 5,143 (1.6%) | 895 (0.5%) |
| $3,000 or more | 5,685 (1.7%) | 772 (0.5%) |
| Total | 329,412 (100.0%) | 161,395 (100.0%) |
Physical Housing Characteristics in Area Code 765
Housing Structures in Area Code 765
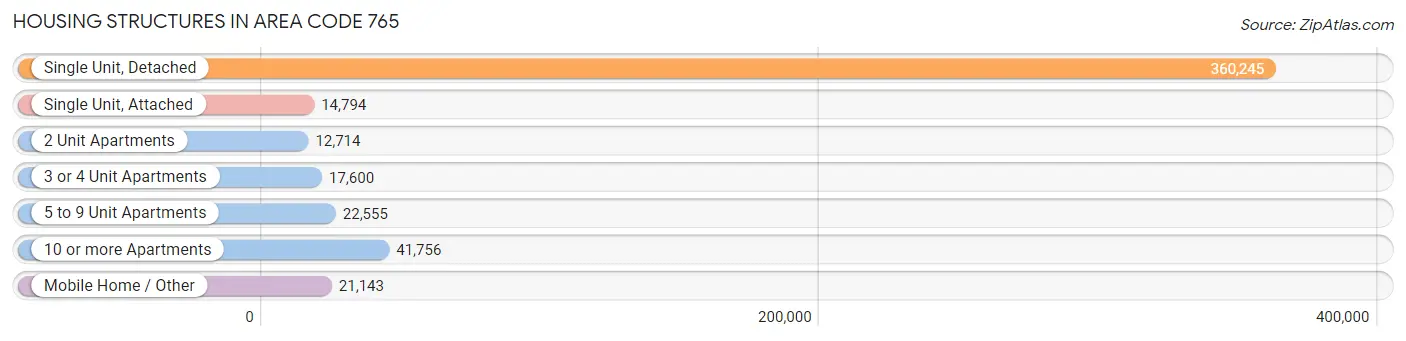
| Structure Type | # Housing Units | % Housing Units |
| Single Unit, Detached | 360,245 | 73.4% |
| Single Unit, Attached | 14,794 | 3.0% |
| 2 Unit Apartments | 12,714 | 2.6% |
| 3 or 4 Unit Apartments | 17,600 | 3.6% |
| 5 to 9 Unit Apartments | 22,555 | 4.6% |
| 10 or more Apartments | 41,756 | 8.5% |
| Mobile Home / Other | 21,143 | 4.3% |
| Total | 490,807 | 100.0% |
Housing Structures by Occupancy in Area Code 765
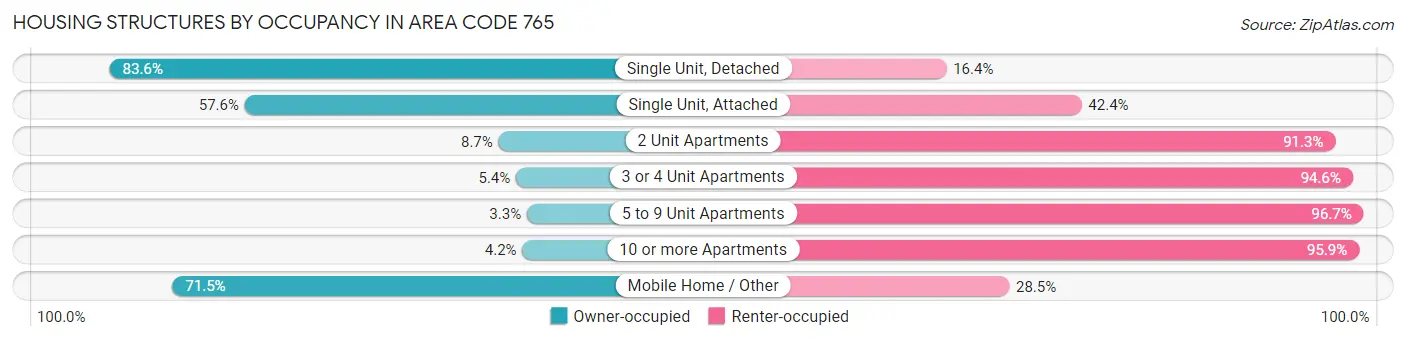
| Structure Type | Owner-occupied | Renter-occupied |
| Single Unit, Detached | 301,244 (83.6%) | 59,001 (16.4%) |
| Single Unit, Attached | 8,521 (57.6%) | 6,273 (42.4%) |
| 2 Unit Apartments | 1,110 (8.7%) | 11,604 (91.3%) |
| 3 or 4 Unit Apartments | 943 (5.4%) | 16,657 (94.6%) |
| 5 to 9 Unit Apartments | 738 (3.3%) | 21,817 (96.7%) |
| 10 or more Apartments | 1,732 (4.2%) | 40,024 (95.9%) |
| Mobile Home / Other | 15,124 (71.5%) | 6,019 (28.5%) |
| Total | 329,412 (67.1%) | 161,395 (32.9%) |
Housing Structures by Number of Rooms in Area Code 765
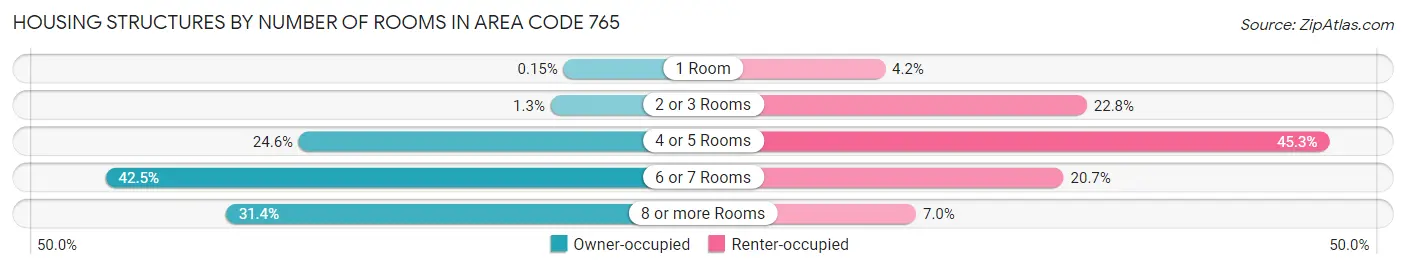
| Number of Rooms | Owner-occupied | Renter-occupied |
| 1 Room | 499 (0.2%) | 6,744 (4.2%) |
| 2 or 3 Rooms | 4,411 (1.3%) | 36,861 (22.8%) |
| 4 or 5 Rooms | 81,124 (24.6%) | 73,035 (45.3%) |
| 6 or 7 Rooms | 139,984 (42.5%) | 33,393 (20.7%) |
| 8 or more Rooms | 103,394 (31.4%) | 11,362 (7.0%) |
| Total | 329,412 (100.0%) | 161,395 (100.0%) |
Housing Structure by Heating Type in Area Code 765
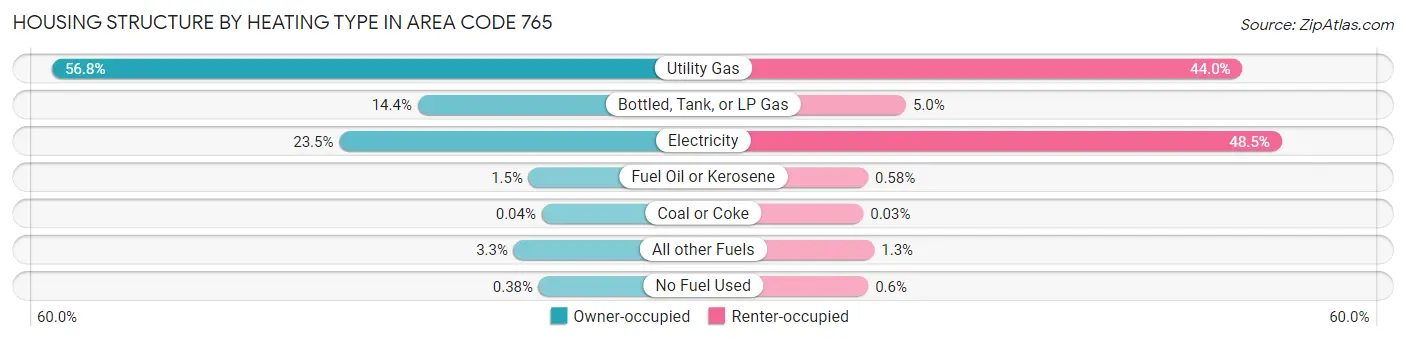
| Heating Type | Owner-occupied | Renter-occupied |
| Utility Gas | 187,183 (56.8%) | 70,974 (44.0%) |
| Bottled, Tank, or LP Gas | 47,516 (14.4%) | 8,030 (5.0%) |
| Electricity | 77,461 (23.5%) | 78,332 (48.5%) |
| Fuel Oil or Kerosene | 5,067 (1.5%) | 936 (0.6%) |
| Coal or Coke | 123 (0.0%) | 43 (0.0%) |
| All other Fuels | 10,801 (3.3%) | 2,117 (1.3%) |
| No Fuel Used | 1,261 (0.4%) | 963 (0.6%) |
| Total | 329,412 (100.0%) | 161,395 (100.0%) |
Household Vehicle Usage in Area Code 765
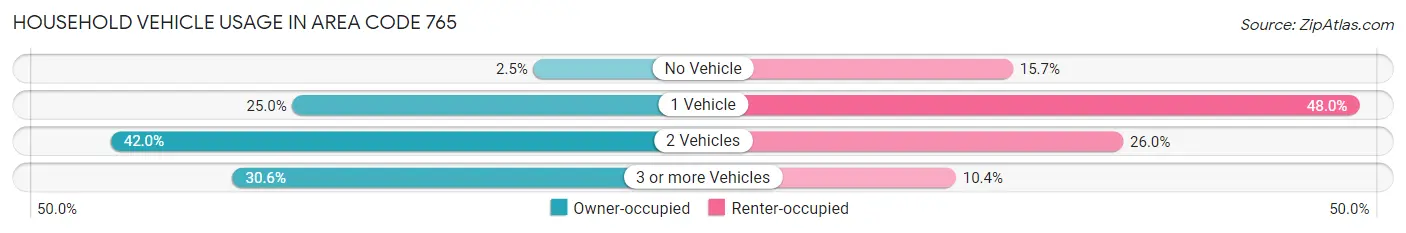
| Vehicles per Household | Owner-occupied | Renter-occupied |
| No Vehicle | 8,184 (2.5%) | 25,296 (15.7%) |
| 1 Vehicle | 82,334 (25.0%) | 77,477 (48.0%) |
| 2 Vehicles | 138,173 (41.9%) | 41,919 (26.0%) |
| 3 or more Vehicles | 100,721 (30.6%) | 16,703 (10.3%) |
| Total | 329,412 (100.0%) | 161,395 (100.0%) |
Real Estate & Mortgages in Area Code 765
Real Estate and Mortgage Overview in Area Code 765
| Characteristic | Without Mortgage | With Mortgage |
| Housing Units | 124,696 | 204,716 |
| Median Property Value | $22,827,500 | $28,075,100 |
| Median Household Income | $10,562,804 | $33,180 |
| Monthly Housing Costs | $84,126 | $5,524 |
| Real Estate Taxes | $158,416 | $6,605 |
Property Value by Mortgage Status in Area Code 765
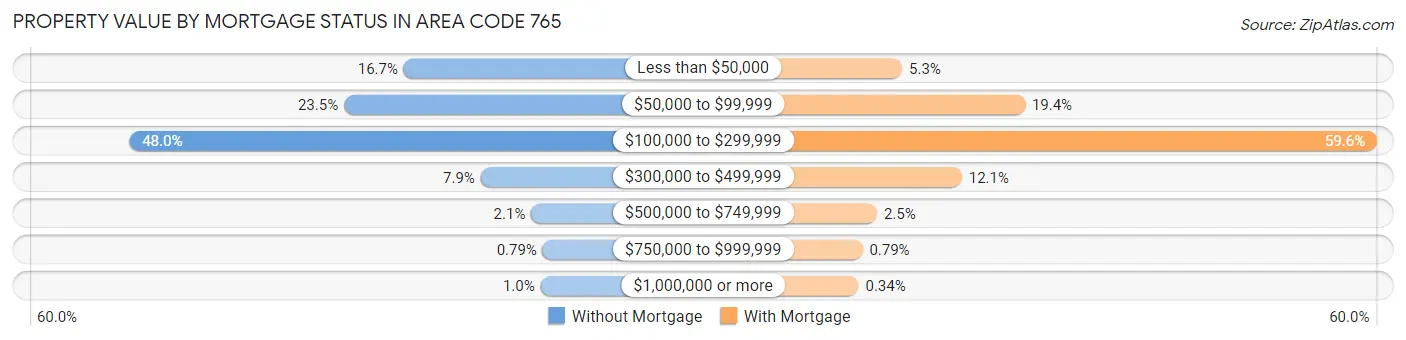
| Property Value | Without Mortgage | With Mortgage |
| Less than $50,000 | 20,776 (16.7%) | 10,897 (5.3%) |
| $50,000 to $99,999 | 29,305 (23.5%) | 39,624 (19.4%) |
| $100,000 to $299,999 | 59,898 (48.0%) | 122,006 (59.6%) |
| $300,000 to $499,999 | 9,825 (7.9%) | 24,856 (12.1%) |
| $500,000 to $749,999 | 2,621 (2.1%) | 5,016 (2.5%) |
| $750,000 to $999,999 | 984 (0.8%) | 1,616 (0.8%) |
| $1,000,000 or more | 1,287 (1.0%) | 701 (0.3%) |
| Total | 124,696 (100.0%) | 204,716 (100.0%) |
Household Income by Mortgage Status in Area Code 765
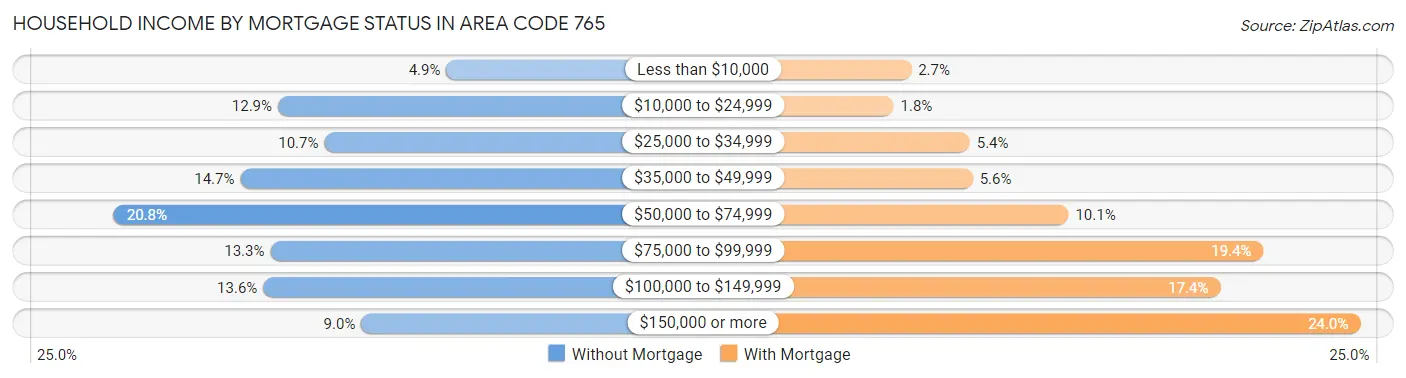
| Household Income | Without Mortgage | With Mortgage |
| Less than $10,000 | 6,140 (4.9%) | 5,424 (2.6%) |
| $10,000 to $24,999 | 16,141 (12.9%) | 3,715 (1.8%) |
| $25,000 to $34,999 | 13,382 (10.7%) | 11,143 (5.4%) |
| $35,000 to $49,999 | 18,372 (14.7%) | 11,415 (5.6%) |
| $50,000 to $74,999 | 25,879 (20.7%) | 20,758 (10.1%) |
| $75,000 to $99,999 | 16,590 (13.3%) | 39,747 (19.4%) |
| $100,000 to $149,999 | 17,010 (13.6%) | 35,564 (17.4%) |
| $150,000 or more | 11,182 (9.0%) | 49,194 (24.0%) |
| Total | 124,696 (100.0%) | 204,716 (100.0%) |
Property Value to Household Income Ratio in Area Code 765
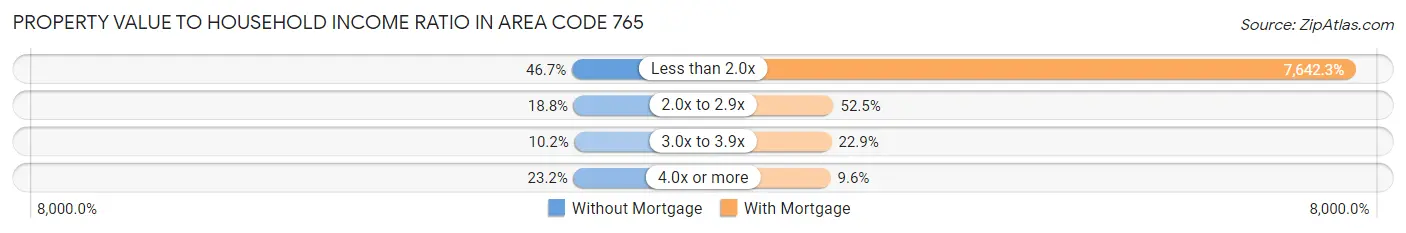
| Value-to-Income Ratio | Without Mortgage | With Mortgage |
| Less than 2.0x | 58,226 (46.7%) | 15,645,064 (7,642.3%) |
| 2.0x to 2.9x | 23,403 (18.8%) | 107,484 (52.5%) |
| 3.0x to 3.9x | 12,696 (10.2%) | 46,932 (22.9%) |
| 4.0x or more | 28,932 (23.2%) | 19,666 (9.6%) |
| Total | 124,696 (100.0%) | 204,716 (100.0%) |
Real Estate Taxes by Mortgage Status in Area Code 765
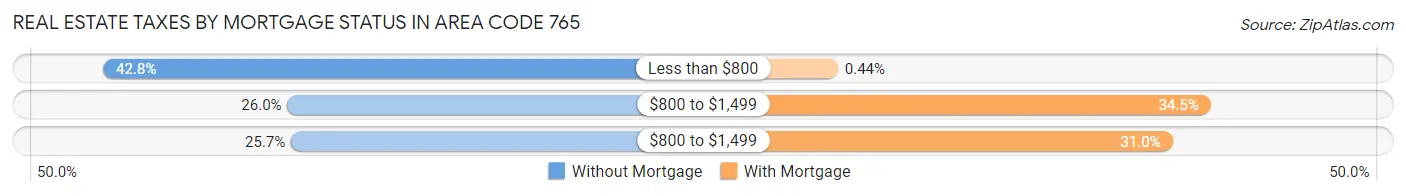
| Property Taxes | Without Mortgage | With Mortgage |
| Less than $800 | 53,404 (42.8%) | 892 (0.4%) |
| $800 to $1,499 | 32,424 (26.0%) | 70,607 (34.5%) |
| $800 to $1,499 | 32,002 (25.7%) | 63,487 (31.0%) |
| Total | 124,696 (100.0%) | 204,716 (100.0%) |
Health & Disability in Area Code 765
Health Insurance Coverage by Age in Area Code 765
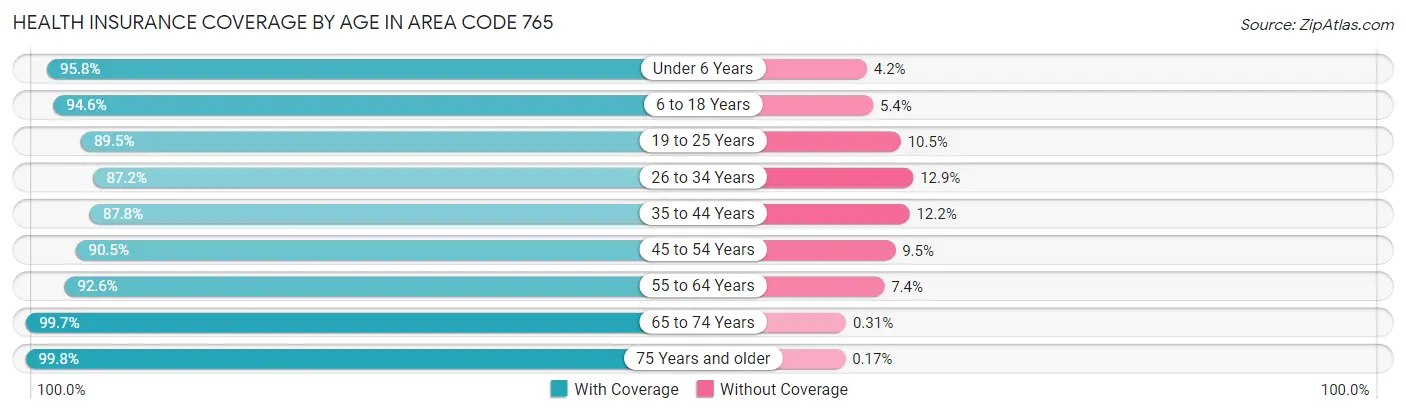
| Age Bracket | With Coverage | Without Coverage |
| Under 6 Years | 77,461 (95.8%) | 3,398 (4.2%) |
| 6 to 18 Years | 187,673 (94.6%) | 10,626 (5.4%) |
| 19 to 25 Years | 130,966 (89.5%) | 15,402 (10.5%) |
| 26 to 34 Years | 119,333 (87.2%) | 17,592 (12.9%) |
| 35 to 44 Years | 119,056 (87.8%) | 16,487 (12.2%) |
| 45 to 54 Years | 127,686 (90.5%) | 13,411 (9.5%) |
| 55 to 64 Years | 144,899 (92.6%) | 11,651 (7.4%) |
| 65 to 74 Years | 117,398 (99.7%) | 363 (0.3%) |
| 75 Years and older | 81,062 (99.8%) | 140 (0.2%) |
| Total | 1,105,534 (92.5%) | 89,070 (7.5%) |
Health Insurance Coverage by Citizenship Status in Area Code 765
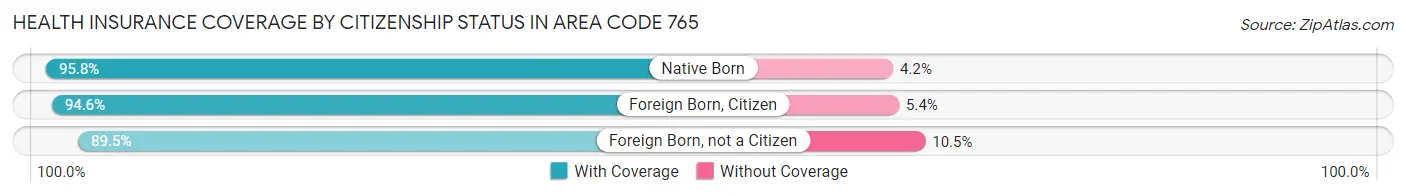
| Citizenship Status | With Coverage | Without Coverage |
| Native Born | 77,461 (95.8%) | 3,398 (4.2%) |
| Foreign Born, Citizen | 187,673 (94.6%) | 10,626 (5.4%) |
| Foreign Born, not a Citizen | 130,966 (89.5%) | 15,402 (10.5%) |
Health Insurance Coverage by Household Income in Area Code 765
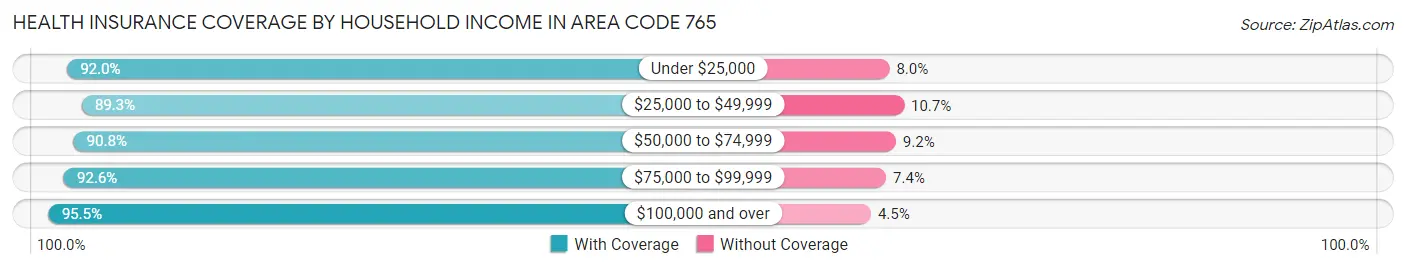
| Household Income | With Coverage | Without Coverage |
| Under $25,000 | 146,066 (92.0%) | 12,687 (8.0%) |
| $25,000 to $49,999 | 196,172 (89.3%) | 23,557 (10.7%) |
| $50,000 to $74,999 | 200,502 (90.8%) | 20,320 (9.2%) |
| $75,000 to $99,999 | 166,785 (92.6%) | 13,268 (7.4%) |
| $100,000 and over | 365,018 (95.5%) | 17,328 (4.5%) |
Public vs Private Health Insurance Coverage by Age in Area Code 765
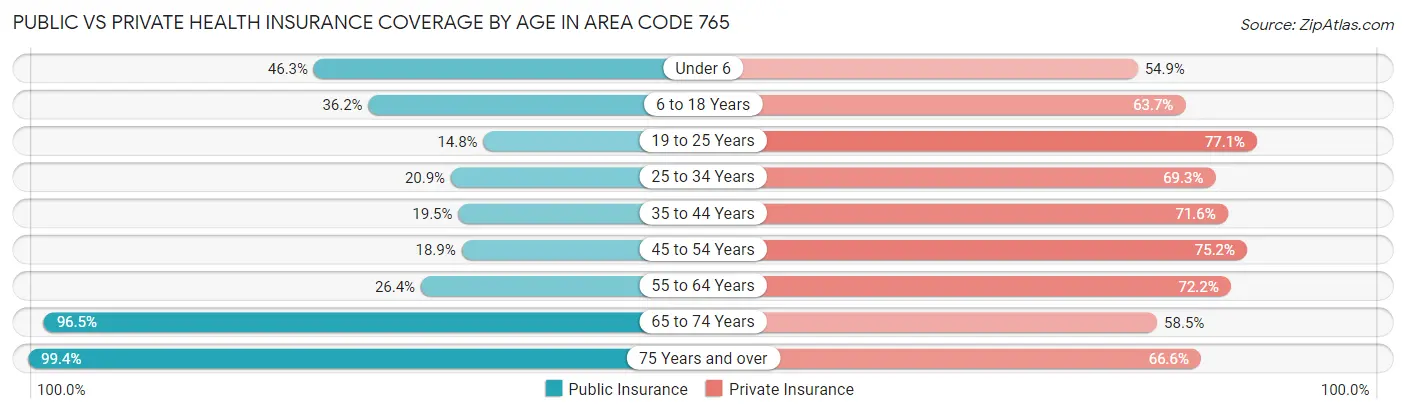
| Age Bracket | Public Insurance | Private Insurance |
| Under 6 | 37,442 (46.3%) | 44,407 (54.9%) |
| 6 to 18 Years | 71,748 (36.2%) | 126,373 (63.7%) |
| 19 to 25 Years | 21,711 (14.8%) | 112,777 (77.0%) |
| 25 to 34 Years | 28,560 (20.9%) | 94,908 (69.3%) |
| 35 to 44 Years | 26,421 (19.5%) | 97,029 (71.6%) |
| 45 to 54 Years | 26,664 (18.9%) | 106,072 (75.2%) |
| 55 to 64 Years | 41,374 (26.4%) | 112,952 (72.2%) |
| 65 to 74 Years | 113,583 (96.5%) | 68,932 (58.5%) |
| 75 Years and over | 80,678 (99.4%) | 54,102 (66.6%) |
| Total | 448,181 (37.5%) | 817,552 (68.4%) |
Disability Status by Sex by Age in Area Code 765
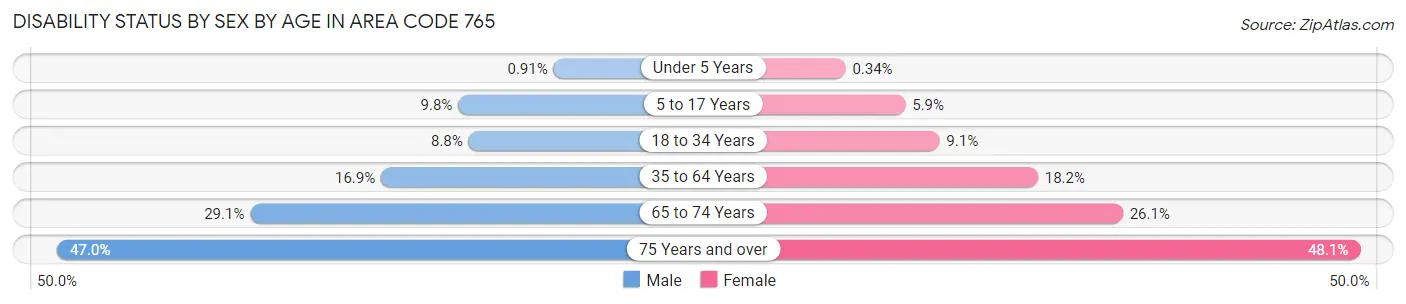
| Age Bracket | Male | Female |
| Under 5 Years | 311 (0.9%) | 110 (0.3%) |
| 5 to 17 Years | 9,496 (9.8%) | 5,460 (5.9%) |
| 18 to 34 Years | 13,810 (8.8%) | 13,447 (9.1%) |
| 35 to 64 Years | 36,381 (16.9%) | 39,685 (18.2%) |
| 65 to 74 Years | 16,193 (29.1%) | 16,169 (26.1%) |
| 75 Years and over | 15,762 (47.0%) | 22,928 (48.1%) |
Disability Class by Sex by Age in Area Code 765
Disability Class: Hearing Difficulty
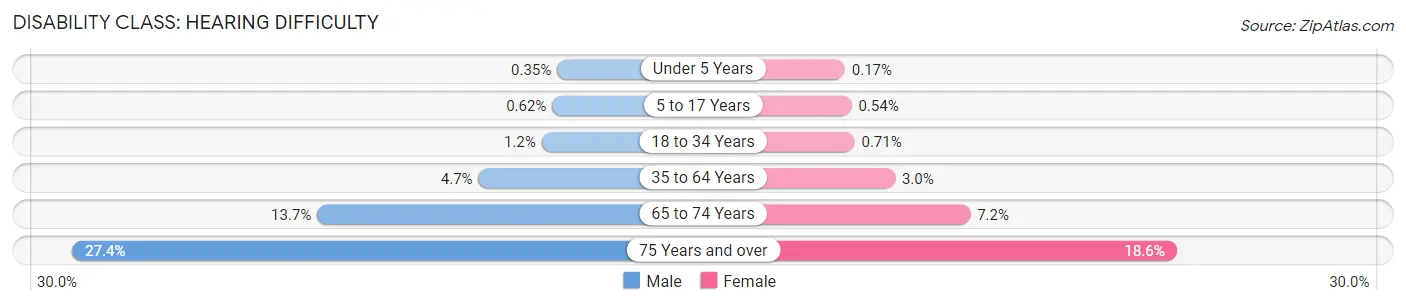
| Age Bracket | Male | Female |
| Under 5 Years | 119 (0.4%) | 54 (0.2%) |
| 5 to 17 Years | 606 (0.6%) | 501 (0.5%) |
| 18 to 34 Years | 1,902 (1.2%) | 1,052 (0.7%) |
| 35 to 64 Years | 10,176 (4.7%) | 6,447 (3.0%) |
| 65 to 74 Years | 7,641 (13.7%) | 4,432 (7.1%) |
| 75 Years and over | 9,173 (27.4%) | 8,883 (18.6%) |
Disability Class: Vision Difficulty
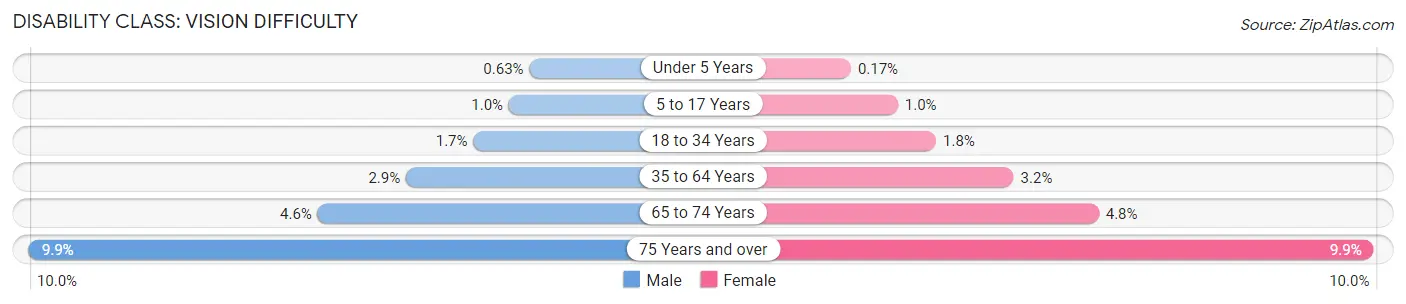
| Age Bracket | Male | Female |
| Under 5 Years | 216 (0.6%) | 56 (0.2%) |
| 5 to 17 Years | 984 (1.0%) | 961 (1.0%) |
| 18 to 34 Years | 2,623 (1.7%) | 2,595 (1.8%) |
| 35 to 64 Years | 6,283 (2.9%) | 6,968 (3.2%) |
| 65 to 74 Years | 2,539 (4.6%) | 2,959 (4.8%) |
| 75 Years and over | 3,328 (9.9%) | 4,703 (9.9%) |
Disability Class: Cognitive Difficulty
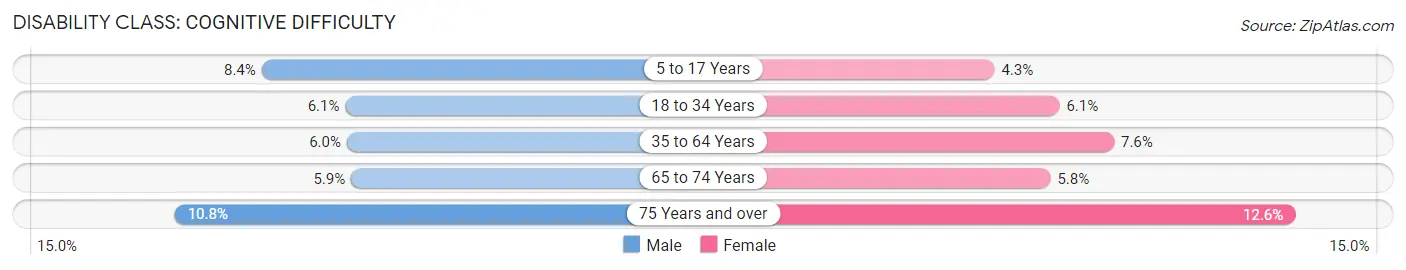
| Age Bracket | Male | Female |
| 5 to 17 Years | 8,174 (8.4%) | 3,940 (4.3%) |
| 18 to 34 Years | 9,538 (6.1%) | 8,997 (6.1%) |
| 35 to 64 Years | 12,970 (6.0%) | 16,534 (7.6%) |
| 65 to 74 Years | 3,294 (5.9%) | 3,606 (5.8%) |
| 75 Years and over | 3,629 (10.8%) | 6,015 (12.6%) |
Disability Class: Ambulatory Difficulty
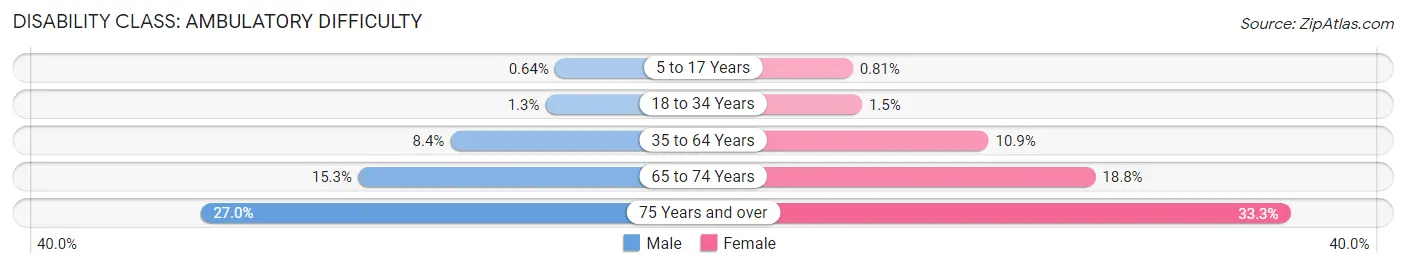
| Age Bracket | Male | Female |
| 5 to 17 Years | 623 (0.6%) | 746 (0.8%) |
| 18 to 34 Years | 2,100 (1.3%) | 2,225 (1.5%) |
| 35 to 64 Years | 18,069 (8.4%) | 23,781 (10.9%) |
| 65 to 74 Years | 8,502 (15.3%) | 11,683 (18.8%) |
| 75 Years and over | 9,044 (27.0%) | 15,868 (33.3%) |
Disability Class: Self-Care Difficulty
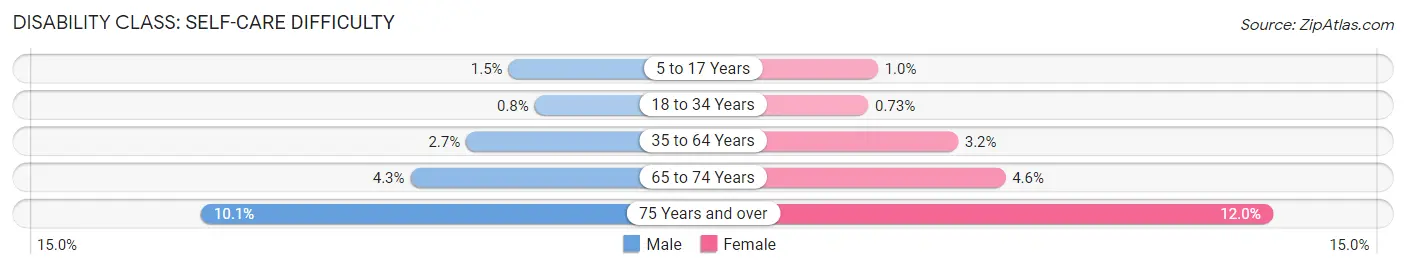
| Age Bracket | Male | Female |
| 5 to 17 Years | 1,490 (1.5%) | 925 (1.0%) |
| 18 to 34 Years | 1,254 (0.8%) | 1,080 (0.7%) |
| 35 to 64 Years | 5,822 (2.7%) | 7,056 (3.2%) |
| 65 to 74 Years | 2,376 (4.3%) | 2,825 (4.5%) |
| 75 Years and over | 3,385 (10.1%) | 5,716 (12.0%) |
Technology Access in Area Code 765
Computing Device Access in Area Code 765
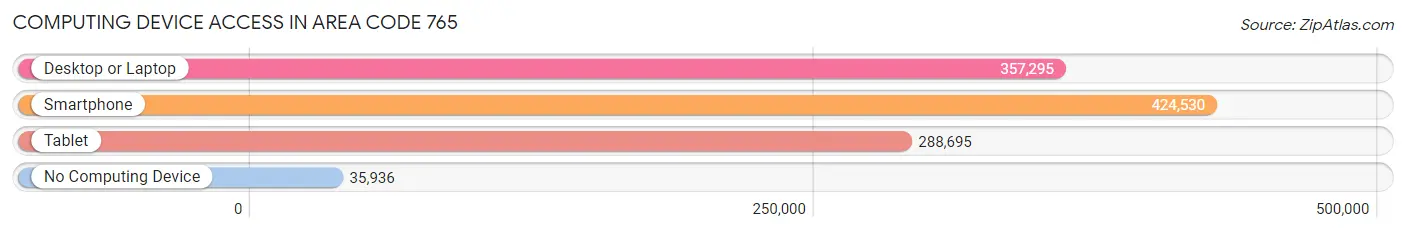
| Device Type | # Households | % Households |
| Desktop or Laptop | 357,295 | 72.8% |
| Smartphone | 424,530 | 86.5% |
| Tablet | 288,695 | 58.8% |
| No Computing Device | 35,936 | 7.3% |
| Total | 490,807 | 100.0% |
Internet Access in Area Code 765
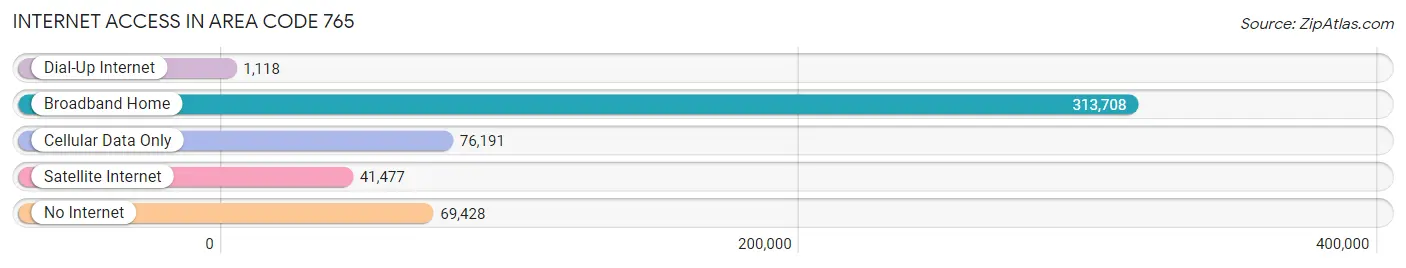
| Internet Type | # Households | % Households |
| Dial-Up Internet | 1,118 | 0.2% |
| Broadband Home | 313,708 | 63.9% |
| Cellular Data Only | 76,191 | 15.5% |
| Satellite Internet | 41,477 | 8.5% |
| No Internet | 69,428 | 14.1% |
| Total | 490,807 | 100.0% |
Area Code 765 Summary
Geography
Area code 765 is located in the state of Indiana. It covers the central and eastern parts of the state, including the cities of Lafayette, Muncie, Anderson, and Richmond.
Social
Area code 765 is home to a diverse population of people from all walks of life. The area is known for its friendly and welcoming atmosphere, and its residents are proud of their Hoosier heritage.
Economics
Area code 765 is home to a thriving economy. The area is home to a number of large employers, including Purdue University, Indiana University, and Ball State University. The area also has a strong manufacturing sector, with companies such as Delphi Automotive and Cummins Inc. located in the area.
Demographics
Area code 765 is home to a population of over 1.2 million people. The area is predominantly white, with a large Hispanic population. The median household income is around $50,000, and the unemployment rate is around 4%.
Common Questions
What is Per Capita Income in Area Code 765?
Per Capita income in Area Code 765 is $32,892.
What is the Median Family Income in Area Code 765?
Median Family Income in Area Code 765 is $78,550.
What is the Median Household income in Area Code 765?
Median Household Income in Area Code 765 is $66,555.
What is Income or Wage Gap in Area Code 765?
Income or Wage Gap in Area Code 765 is 32.3%.
Women in Area Code 765 earn 67.7 cents for every dollar earned by a man.
What is Family Income Deficit in Area Code 765?
Family Income Deficit in Area Code 765 is $11,695.
Families that are below poverty line in Area Code 765 earn $11,695 less on average than the poverty threshold level.
What is Inequality or Gini Index in Area Code 765?
Inequality or Gini Index in Area Code 765 is 76.32.
What is the Total Population of Area Code 765?
Total Population of Area Code 765 is 1,221,814.
What is the Total Male Population of Area Code 765?
Total Male Population of Area Code 765 is 611,431.
What is the Total Female Population of Area Code 765?
Total Female Population of Area Code 765 is 610,383.
What is the Ratio of Males per 100 Females in Area Code 765?
There are 100.17 Males per 100 Females in Area Code 765.
What is the Ratio of Females per 100 Males in Area Code 765?
There are 99.83 Females per 100 Males in Area Code 765.
What is the Median Population Age in Area Code 765?
Median Population Age in Area Code 765 is 41.3 Years.
What is the Average Family Size in Area Code 765
Average Family Size in Area Code 765 is 3.0 People.
What is the Average Household Size in Area Code 765
Average Household Size in Area Code 765 is 2.5 People.
How Large is the Labor Force in Area Code 765?
There are 602,597 People in the Labor Forcein in Area Code 765.
What is the Percentage of People in the Labor Force in Area Code 765?
60.5% of People are in the Labor Force in Area Code 765.
What is the Unemployment Rate in Area Code 765?
Unemployment Rate in Area Code 765 is 4.8%.