Valparaiso, IN Map & Demographics
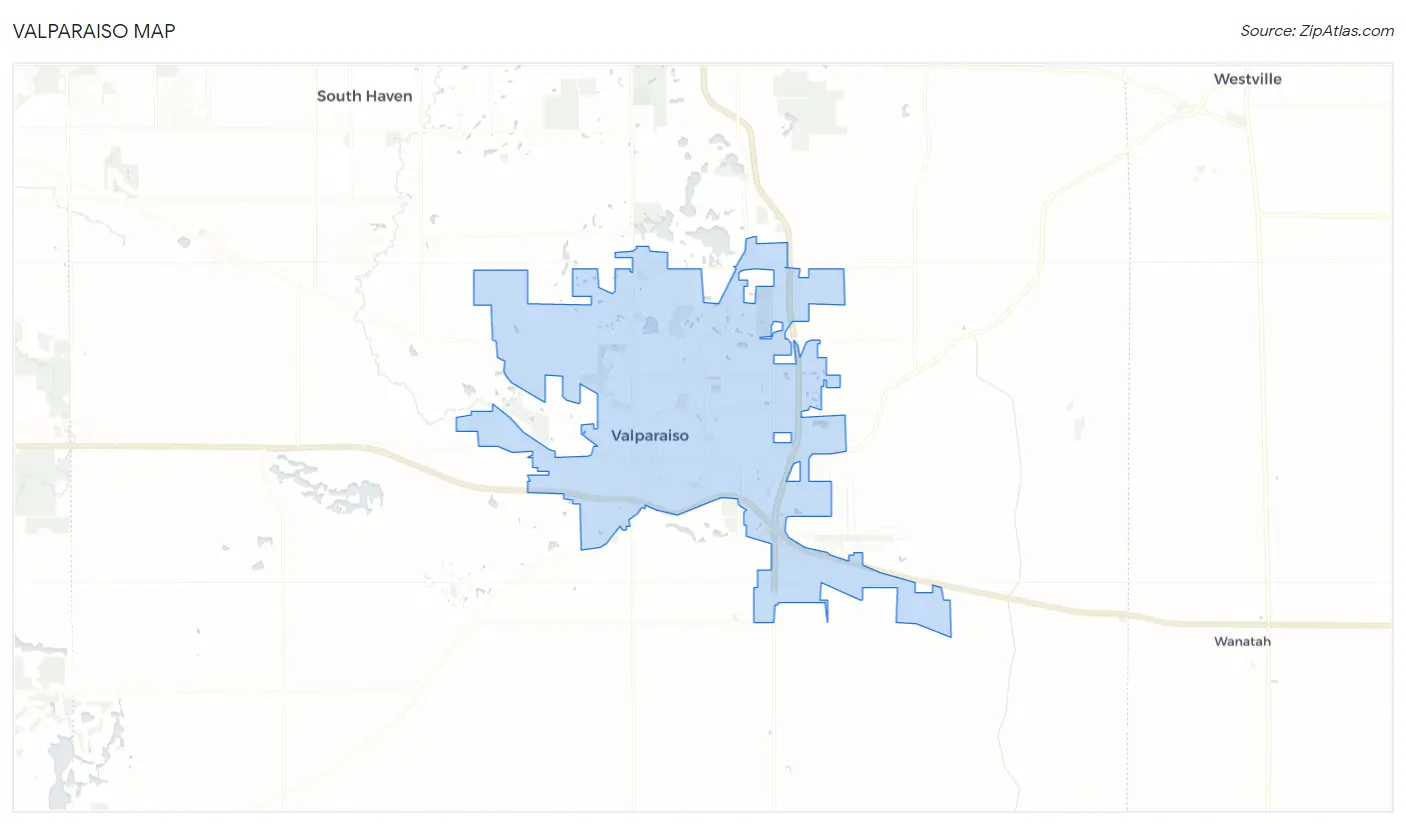
Valparaiso Map
Valparaiso Overview
$36,719
PER CAPITA INCOME
$90,210
AVG FAMILY INCOME
$59,943
AVG HOUSEHOLD INCOME
41.5%
WAGE / INCOME GAP [ % ]
58.5¢/ $1
WAGE / INCOME GAP [ $ ]
0.46
INEQUALITY / GINI INDEX
33,991
TOTAL POPULATION
16,047
MALE POPULATION
17,944
FEMALE POPULATION
89.43
MALES / 100 FEMALES
111.82
FEMALES / 100 MALES
36.8
MEDIAN AGE
2.9
AVG FAMILY SIZE
2.2
AVG HOUSEHOLD SIZE
17,212
LABOR FORCE [ PEOPLE ]
60.6%
PERCENT IN LABOR FORCE
3.0%
UNEMPLOYMENT RATE
Valparaiso Area Codes
Income in Valparaiso
Income Overview in Valparaiso
Per Capita Income in Valparaiso is $36,719, while median incomes of families and households are $90,210 and $59,943 respectively.
| Characteristic | Number | Measure |
| Per Capita Income | 33,991 | $36,719 |
| Median Family Income | 7,585 | $90,210 |
| Mean Family Income | 7,585 | $112,554 |
| Median Household Income | 14,339 | $59,943 |
| Mean Household Income | 14,339 | $85,212 |
| Income Deficit | 7,585 | $0 |
| Wage / Income Gap (%) | 33,991 | 41.50% |
| Wage / Income Gap ($) | 33,991 | 58.50¢ per $1 |
| Gini / Inequality Index | 33,991 | 0.46 |
Earnings by Sex in Valparaiso
Average Earnings in Valparaiso are $37,855, $48,055 for men and $28,110 for women, a difference of 41.5%.
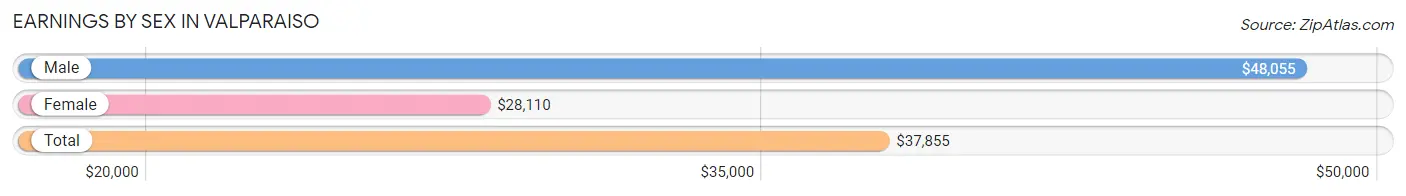
| Sex | Number | Average Earnings |
| Male | 9,463 (50.1%) | $48,055 |
| Female | 9,408 (49.8%) | $28,110 |
| Total | 18,871 (100.0%) | $37,855 |
Earnings by Sex by Income Bracket in Valparaiso
The most common earnings brackets in Valparaiso are $100,000+ for men (1,768 | 18.7%) and $2,499 or less for women (888 | 9.4%).
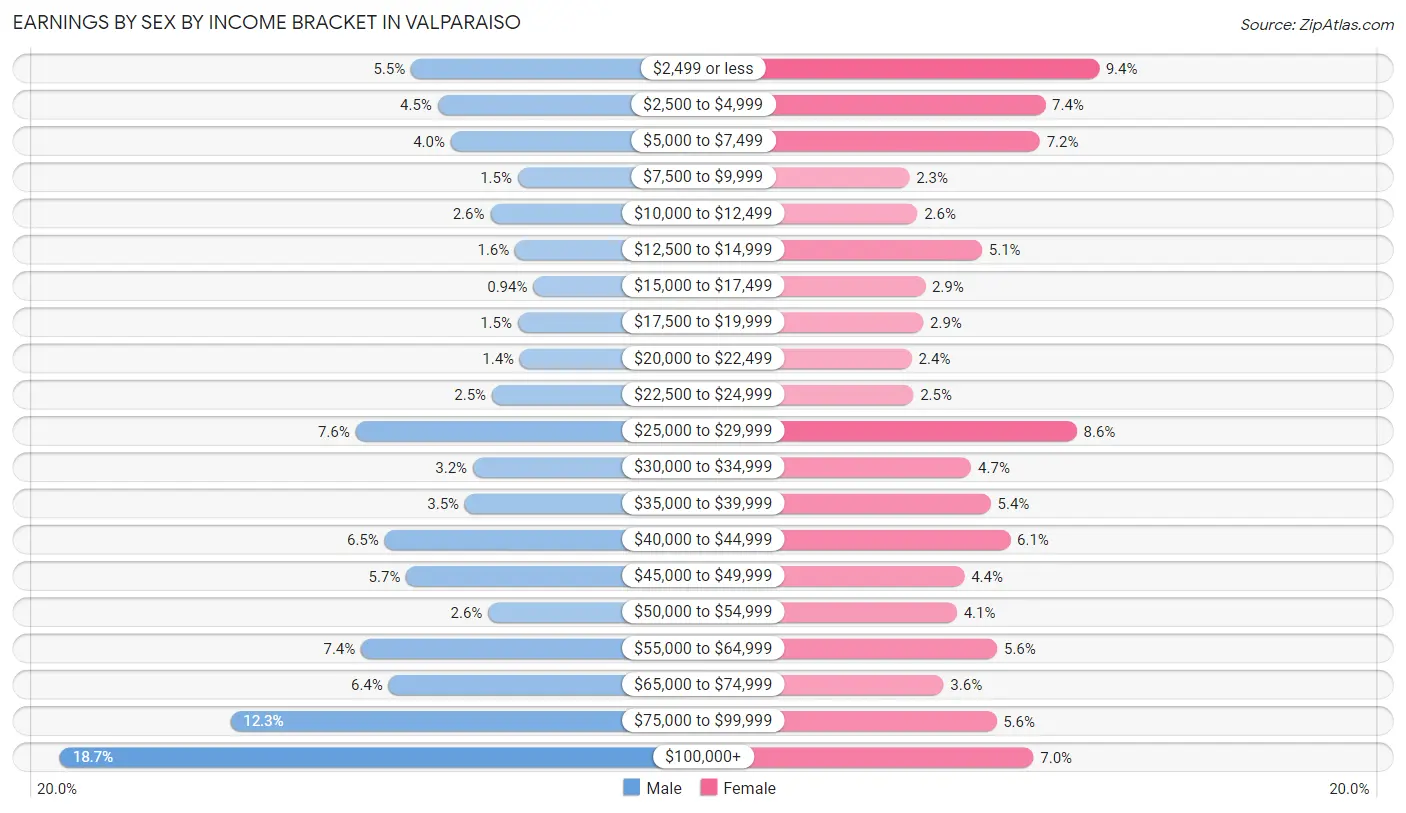
| Income | Male | Female |
| $2,499 or less | 522 (5.5%) | 888 (9.4%) |
| $2,500 to $4,999 | 428 (4.5%) | 699 (7.4%) |
| $5,000 to $7,499 | 381 (4.0%) | 680 (7.2%) |
| $7,500 to $9,999 | 144 (1.5%) | 220 (2.3%) |
| $10,000 to $12,499 | 241 (2.5%) | 248 (2.6%) |
| $12,500 to $14,999 | 153 (1.6%) | 476 (5.1%) |
| $15,000 to $17,499 | 89 (0.9%) | 276 (2.9%) |
| $17,500 to $19,999 | 144 (1.5%) | 269 (2.9%) |
| $20,000 to $22,499 | 136 (1.4%) | 229 (2.4%) |
| $22,500 to $24,999 | 236 (2.5%) | 234 (2.5%) |
| $25,000 to $29,999 | 719 (7.6%) | 810 (8.6%) |
| $30,000 to $34,999 | 303 (3.2%) | 438 (4.7%) |
| $35,000 to $39,999 | 331 (3.5%) | 507 (5.4%) |
| $40,000 to $44,999 | 616 (6.5%) | 576 (6.1%) |
| $45,000 to $49,999 | 539 (5.7%) | 414 (4.4%) |
| $50,000 to $54,999 | 249 (2.6%) | 388 (4.1%) |
| $55,000 to $64,999 | 699 (7.4%) | 530 (5.6%) |
| $65,000 to $74,999 | 602 (6.4%) | 341 (3.6%) |
| $75,000 to $99,999 | 1,163 (12.3%) | 527 (5.6%) |
| $100,000+ | 1,768 (18.7%) | 658 (7.0%) |
| Total | 9,463 (100.0%) | 9,408 (100.0%) |
Earnings by Sex by Educational Attainment in Valparaiso
Average earnings in Valparaiso are $58,016 for men and $39,388 for women, a difference of 32.1%. Men with an educational attainment of graduate degree enjoy the highest average annual earnings of $78,563, while those with less than high school education earn the least with $35,446. Women with an educational attainment of graduate degree earn the most with the average annual earnings of $53,490, while those with less than high school education have the smallest earnings of $20,962.
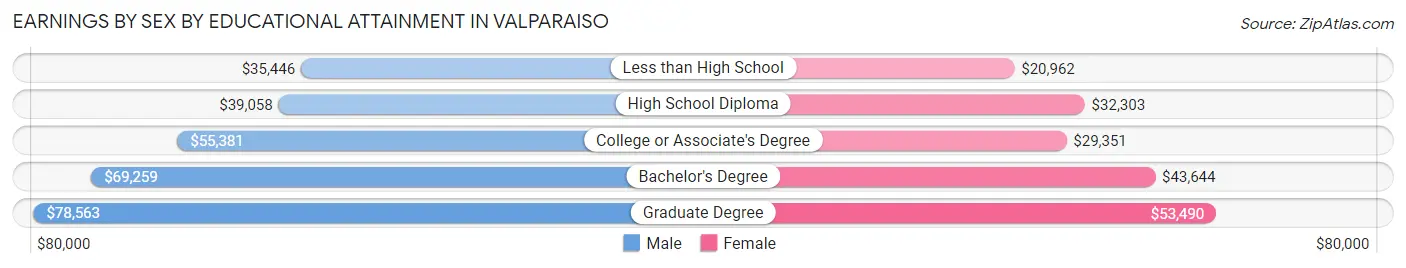
| Educational Attainment | Male Income | Female Income |
| Less than High School | $35,446 | $20,962 |
| High School Diploma | $39,058 | $32,303 |
| College or Associate's Degree | $55,381 | $29,351 |
| Bachelor's Degree | $69,259 | $43,644 |
| Graduate Degree | $78,563 | $53,490 |
| Total | $58,016 | $39,388 |
Family Income in Valparaiso
Family Income Brackets in Valparaiso
According to the Valparaiso family income data, there are 1,654 families falling into the $100,000 to $149,999 income range, which is the most common income bracket and makes up 21.8% of all families. Conversely, the $10,000 to $14,999 income bracket is the least frequent group with only 121 families (1.6%) belonging to this category.
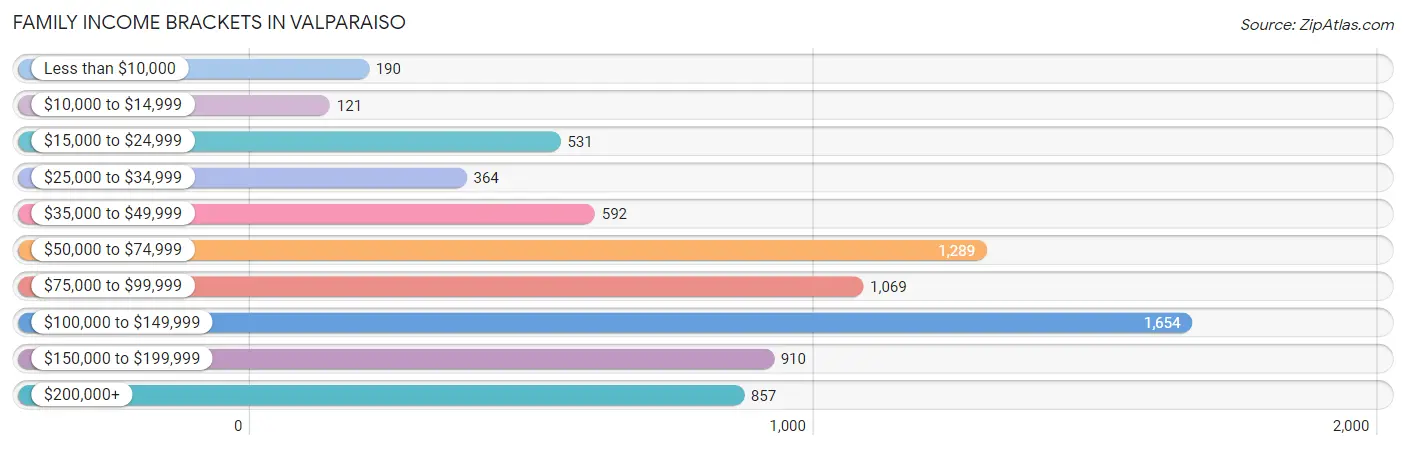
| Income Bracket | # Families | % Families |
| Less than $10,000 | 190 | 2.5% |
| $10,000 to $14,999 | 121 | 1.6% |
| $15,000 to $24,999 | 531 | 7.0% |
| $25,000 to $34,999 | 364 | 4.8% |
| $35,000 to $49,999 | 592 | 7.8% |
| $50,000 to $74,999 | 1,289 | 17.0% |
| $75,000 to $99,999 | 1,069 | 14.1% |
| $100,000 to $149,999 | 1,654 | 21.8% |
| $150,000 to $199,999 | 910 | 12.0% |
| $200,000+ | 857 | 11.3% |
Family Income by Famaliy Size in Valparaiso
4-person families (1,269 | 16.7%) account for the highest median family income in Valparaiso with $123,826 per family, while 2-person families (3,761 | 49.6%) have the highest median income of $41,115 per family member.
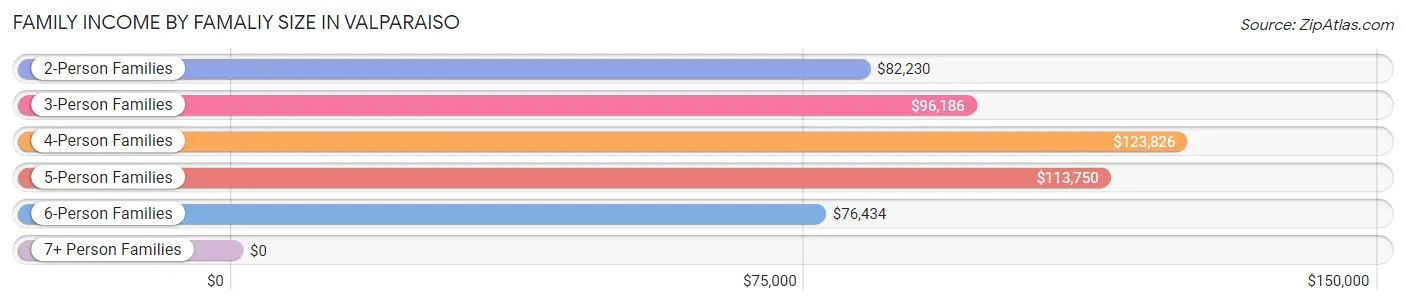
| Income Bracket | # Families | Median Income |
| 2-Person Families | 3,761 (49.6%) | $82,230 |
| 3-Person Families | 1,788 (23.6%) | $96,186 |
| 4-Person Families | 1,269 (16.7%) | $123,826 |
| 5-Person Families | 604 (8.0%) | $113,750 |
| 6-Person Families | 139 (1.8%) | $76,434 |
| 7+ Person Families | 24 (0.3%) | $0 |
| Total | 7,585 (100.0%) | $90,210 |
Family Income by Number of Earners in Valparaiso
The median family income in Valparaiso is $90,210, with families comprising 3+ earners (602) having the highest median family income of $172,500, while families with no earners (1,311) have the lowest median family income of $50,264, accounting for 7.9% and 17.3% of families, respectively.
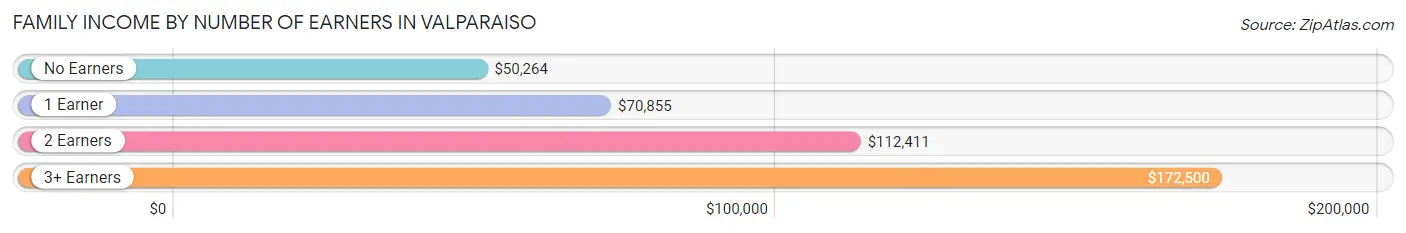
| Number of Earners | # Families | Median Income |
| No Earners | 1,311 (17.3%) | $50,264 |
| 1 Earner | 2,371 (31.3%) | $70,855 |
| 2 Earners | 3,301 (43.5%) | $112,411 |
| 3+ Earners | 602 (7.9%) | $172,500 |
| Total | 7,585 (100.0%) | $90,210 |
Household Income in Valparaiso
Household Income Brackets in Valparaiso
With 2,466 households falling in the category, the $50,000 to $74,999 income range is the most frequent in Valparaiso, accounting for 17.2% of all households. In contrast, only 373 households (2.6%) fall into the $10,000 to $14,999 income bracket, making it the least populous group.
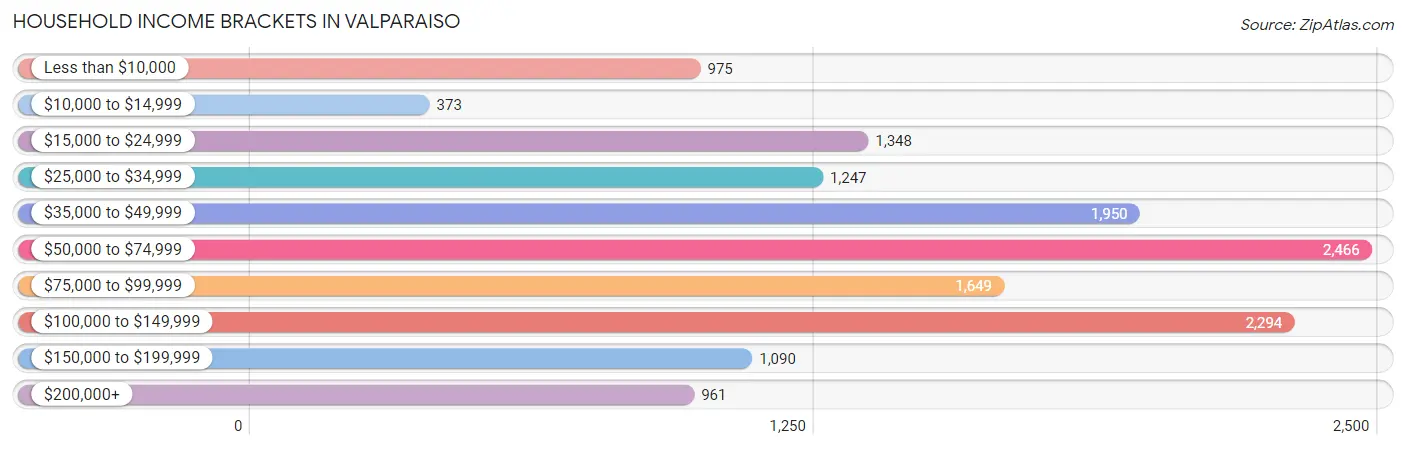
| Income Bracket | # Households | % Households |
| Less than $10,000 | 975 | 6.8% |
| $10,000 to $14,999 | 373 | 2.6% |
| $15,000 to $24,999 | 1,348 | 9.4% |
| $25,000 to $34,999 | 1,247 | 8.7% |
| $35,000 to $49,999 | 1,950 | 13.6% |
| $50,000 to $74,999 | 2,466 | 17.2% |
| $75,000 to $99,999 | 1,649 | 11.5% |
| $100,000 to $149,999 | 2,294 | 16.0% |
| $150,000 to $199,999 | 1,090 | 7.6% |
| $200,000+ | 961 | 6.7% |
Household Income by Householder Age in Valparaiso
The median household income in Valparaiso is $59,943, with the highest median household income of $81,015 found in the 45 to 64 years age bracket for the primary householder. A total of 4,533 households (31.6%) fall into this category. Meanwhile, the 15 to 24 years age bracket for the primary householder has the lowest median household income of $24,219, with 1,186 households (8.3%) in this group.
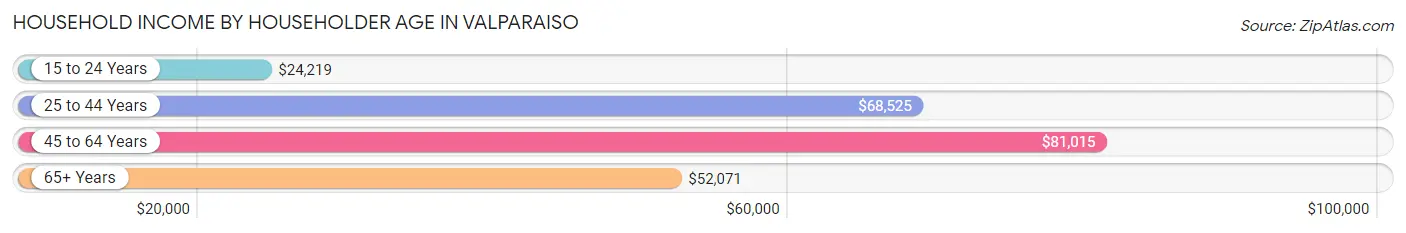
| Income Bracket | # Households | Median Income |
| 15 to 24 Years | 1,186 (8.3%) | $24,219 |
| 25 to 44 Years | 4,968 (34.6%) | $68,525 |
| 45 to 64 Years | 4,533 (31.6%) | $81,015 |
| 65+ Years | 3,652 (25.5%) | $52,071 |
| Total | 14,339 (100.0%) | $59,943 |
Poverty in Valparaiso
Income Below Poverty by Sex and Age in Valparaiso
With 13.3% poverty level for males and 16.4% for females among the residents of Valparaiso, 18 to 24 year old males and 18 to 24 year old females are the most vulnerable to poverty, with 481 males (28.5%) and 834 females (44.9%) in their respective age groups living below the poverty level.
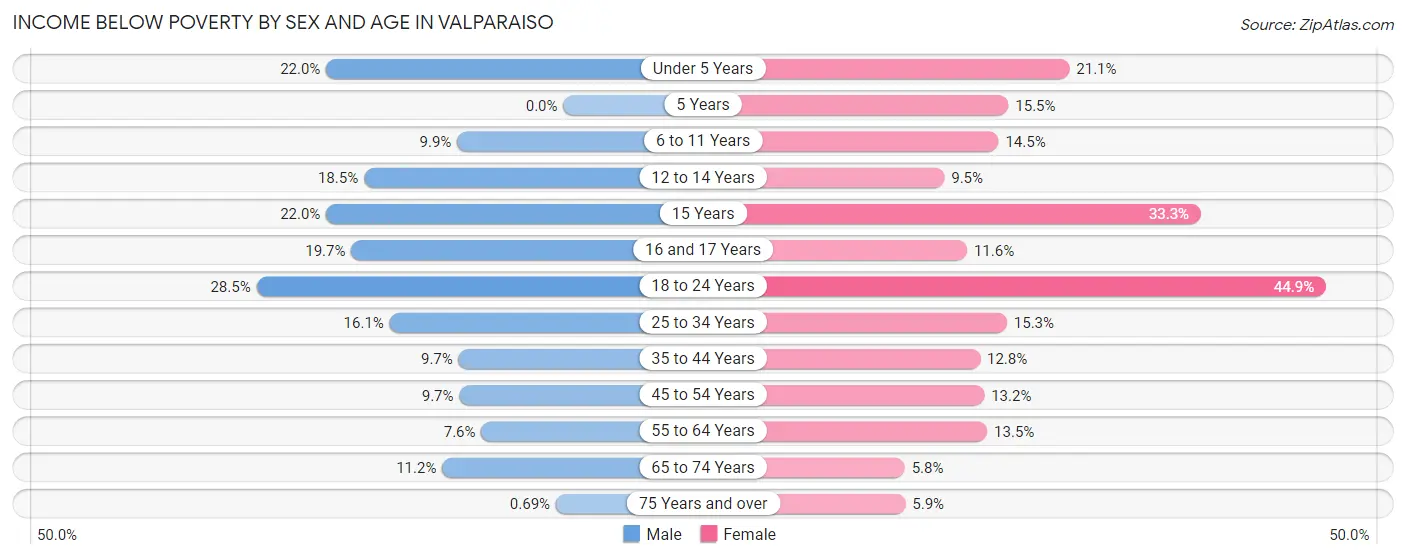
| Age Bracket | Male | Female |
| Under 5 Years | 175 (22.0%) | 169 (21.1%) |
| 5 Years | 0 (0.0%) | 30 (15.5%) |
| 6 to 11 Years | 99 (9.9%) | 146 (14.5%) |
| 12 to 14 Years | 89 (18.5%) | 43 (9.5%) |
| 15 Years | 35 (22.0%) | 110 (33.3%) |
| 16 and 17 Years | 62 (19.7%) | 56 (11.6%) |
| 18 to 24 Years | 481 (28.5%) | 834 (44.9%) |
| 25 to 34 Years | 336 (16.1%) | 303 (15.3%) |
| 35 to 44 Years | 220 (9.7%) | 294 (12.8%) |
| 45 to 54 Years | 150 (9.7%) | 262 (13.2%) |
| 55 to 64 Years | 145 (7.6%) | 263 (13.5%) |
| 65 to 74 Years | 152 (11.2%) | 102 (5.8%) |
| 75 Years and over | 6 (0.7%) | 81 (5.9%) |
| Total | 1,950 (13.3%) | 2,693 (16.4%) |
Income Above Poverty by Sex and Age in Valparaiso
According to the poverty statistics in Valparaiso, males aged 5 years and females aged 65 to 74 years are the age groups that are most secure financially, with 100.0% of males and 94.2% of females in these age groups living above the poverty line.
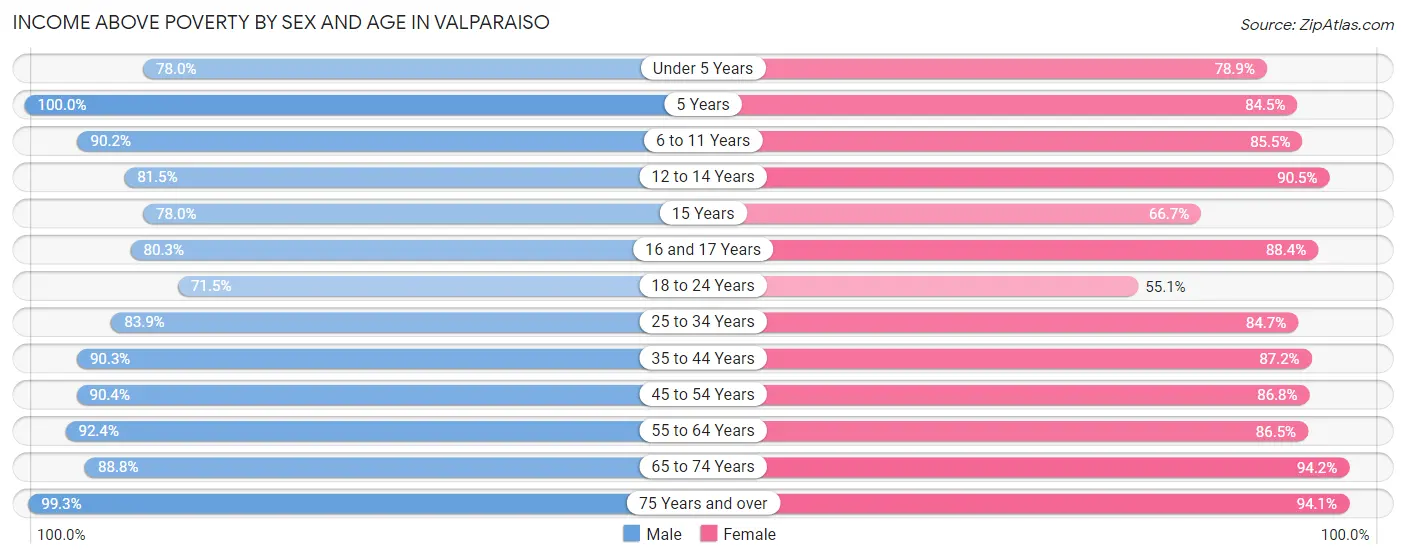
| Age Bracket | Male | Female |
| Under 5 Years | 620 (78.0%) | 631 (78.9%) |
| 5 Years | 218 (100.0%) | 164 (84.5%) |
| 6 to 11 Years | 906 (90.1%) | 858 (85.5%) |
| 12 to 14 Years | 392 (81.5%) | 409 (90.5%) |
| 15 Years | 124 (78.0%) | 220 (66.7%) |
| 16 and 17 Years | 253 (80.3%) | 426 (88.4%) |
| 18 to 24 Years | 1,208 (71.5%) | 1,022 (55.1%) |
| 25 to 34 Years | 1,748 (83.9%) | 1,675 (84.7%) |
| 35 to 44 Years | 2,044 (90.3%) | 1,998 (87.2%) |
| 45 to 54 Years | 1,405 (90.3%) | 1,720 (86.8%) |
| 55 to 64 Years | 1,760 (92.4%) | 1,686 (86.5%) |
| 65 to 74 Years | 1,200 (88.8%) | 1,646 (94.2%) |
| 75 Years and over | 861 (99.3%) | 1,293 (94.1%) |
| Total | 12,739 (86.7%) | 13,748 (83.6%) |
Income Below Poverty Among Married-Couple Families in Valparaiso
The poverty statistics for married-couple families in Valparaiso show that 4.8% or 283 of the total 5,879 families live below the poverty line. Families with 3 or 4 children have the highest poverty rate of 14.2%, comprising of 91 families. On the other hand, families with 5 or more children have the lowest poverty rate of 0.0%, which includes 0 families.
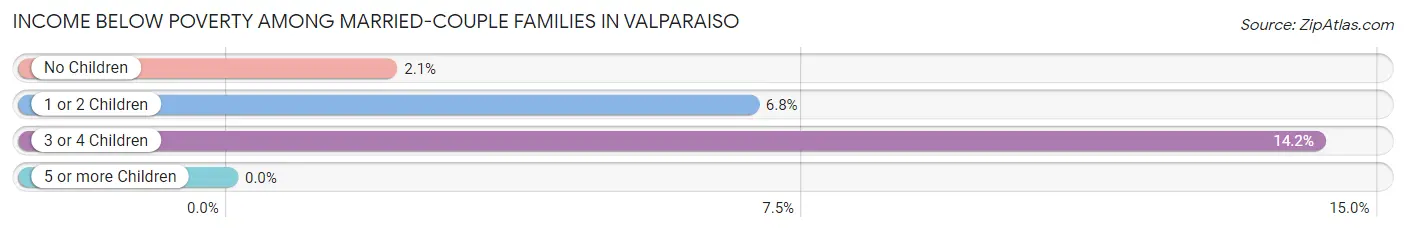
| Children | Above Poverty | Below Poverty |
| No Children | 3,394 (97.9%) | 72 (2.1%) |
| 1 or 2 Children | 1,644 (93.2%) | 120 (6.8%) |
| 3 or 4 Children | 550 (85.8%) | 91 (14.2%) |
| 5 or more Children | 8 (100.0%) | 0 (0.0%) |
| Total | 5,596 (95.2%) | 283 (4.8%) |
Income Below Poverty Among Single-Parent Households in Valparaiso
According to the poverty data in Valparaiso, 26.2% or 148 single-father households and 33.4% or 381 single-mother households are living below the poverty line. Among single-father households, those with 1 or 2 children have the highest poverty rate, with 121 households (31.5%) experiencing poverty. Likewise, among single-mother households, those with 3 or 4 children have the highest poverty rate, with 26 households (76.5%) falling below the poverty line.
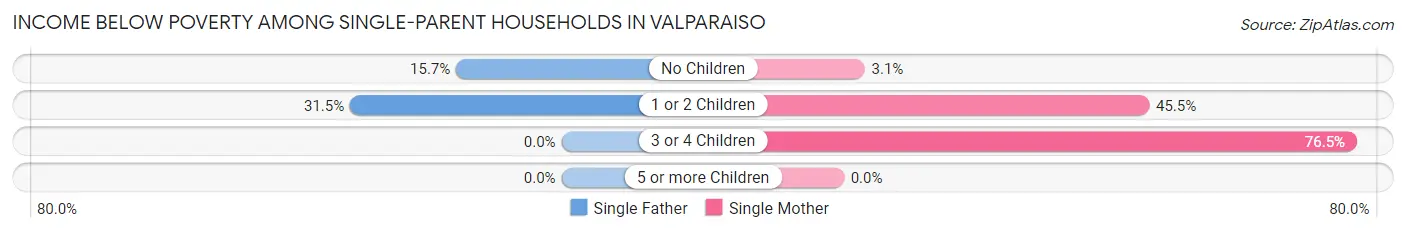
| Children | Single Father | Single Mother |
| No Children | 27 (15.7%) | 11 (3.1%) |
| 1 or 2 Children | 121 (31.5%) | 344 (45.5%) |
| 3 or 4 Children | 0 (0.0%) | 26 (76.5%) |
| 5 or more Children | 0 (0.0%) | 0 (0.0%) |
| Total | 148 (26.2%) | 381 (33.4%) |
Income Below Poverty Among Married-Couple vs Single-Parent Households in Valparaiso
The poverty data for Valparaiso shows that 283 of the married-couple family households (4.8%) and 529 of the single-parent households (31.0%) are living below the poverty level. Within the married-couple family households, those with 3 or 4 children have the highest poverty rate, with 91 households (14.2%) falling below the poverty line. Among the single-parent households, those with 3 or 4 children have the highest poverty rate, with 26 household (61.9%) living below poverty.
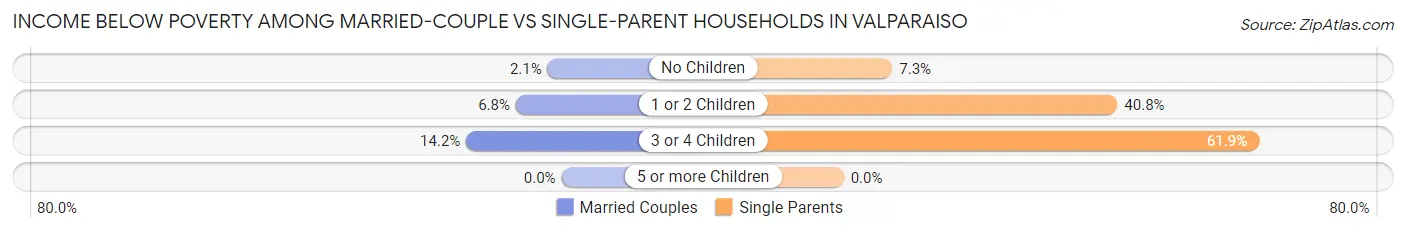
| Children | Married-Couple Families | Single-Parent Households |
| No Children | 72 (2.1%) | 38 (7.2%) |
| 1 or 2 Children | 120 (6.8%) | 465 (40.8%) |
| 3 or 4 Children | 91 (14.2%) | 26 (61.9%) |
| 5 or more Children | 0 (0.0%) | 0 (0.0%) |
| Total | 283 (4.8%) | 529 (31.0%) |
Race in Valparaiso
The most populous races in Valparaiso are White / Caucasian (28,689 | 84.4%), Hispanic or Latino (3,007 | 8.8%), and Two or more Races (2,094 | 6.2%).
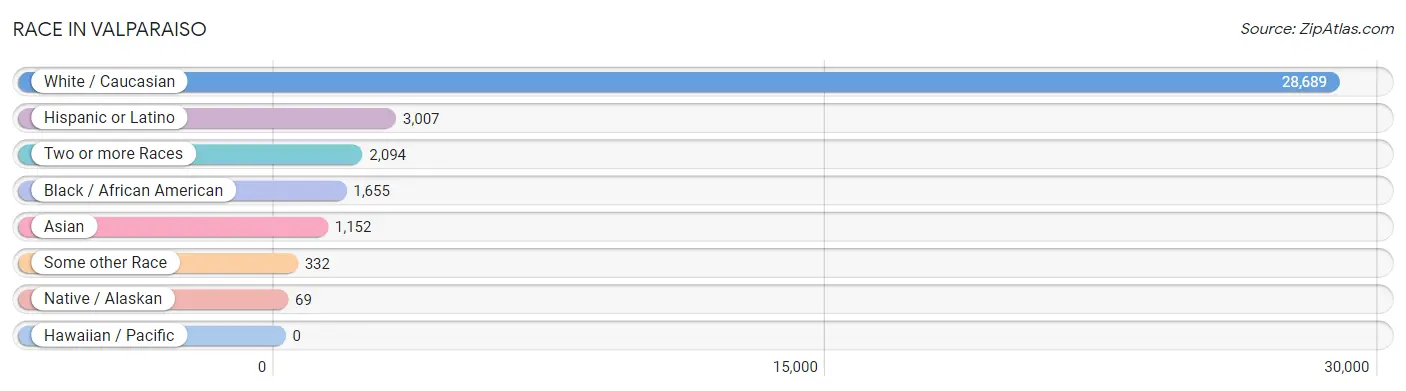
| Race | # Population | % Population |
| Asian | 1,152 | 3.4% |
| Black / African American | 1,655 | 4.9% |
| Hawaiian / Pacific | 0 | 0.0% |
| Hispanic or Latino | 3,007 | 8.8% |
| Native / Alaskan | 69 | 0.2% |
| White / Caucasian | 28,689 | 84.4% |
| Two or more Races | 2,094 | 6.2% |
| Some other Race | 332 | 1.0% |
| Total | 33,991 | 100.0% |
Ancestry in Valparaiso
The most populous ancestries reported in Valparaiso are German (7,401 | 21.8%), Irish (5,034 | 14.8%), English (3,823 | 11.3%), Polish (2,709 | 8.0%), and Mexican (2,313 | 6.8%), together accounting for 62.6% of all Valparaiso residents.
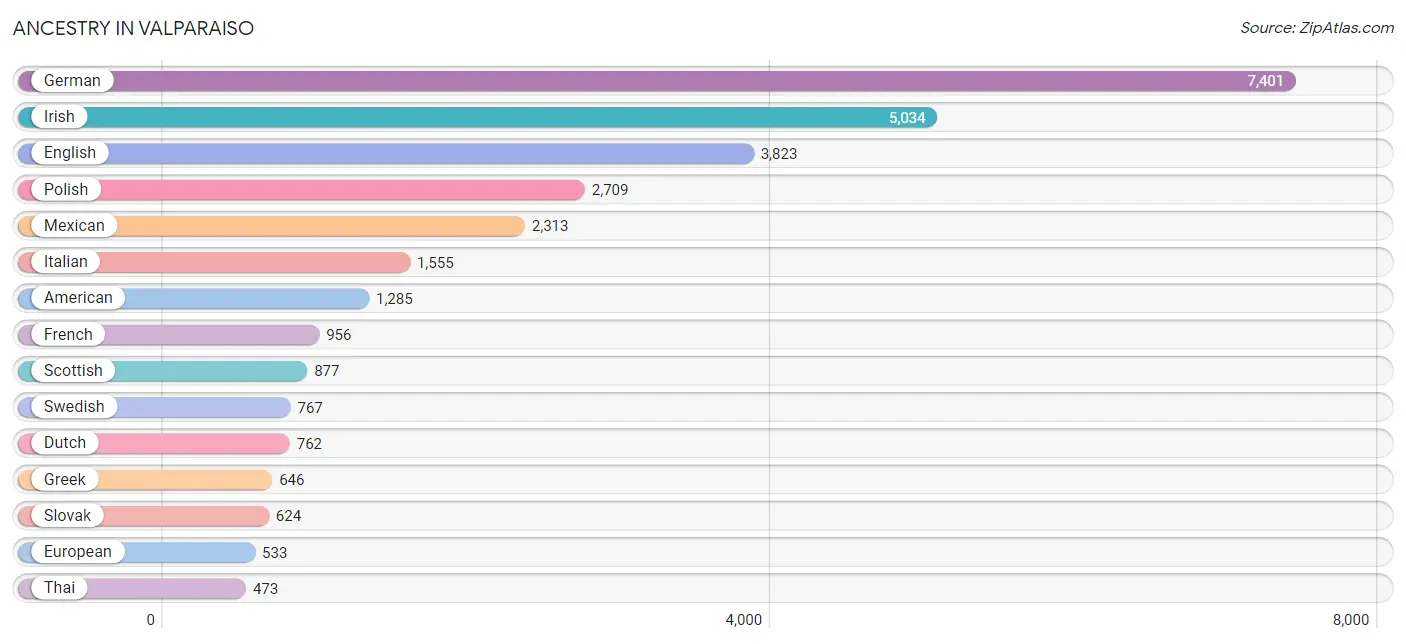
| Ancestry | # Population | % Population |
| African | 114 | 0.3% |
| American | 1,285 | 3.8% |
| Apache | 30 | 0.1% |
| Arab | 154 | 0.4% |
| Austrian | 105 | 0.3% |
| Bahamian | 7 | 0.0% |
| Belgian | 39 | 0.1% |
| Bhutanese | 41 | 0.1% |
| Brazilian | 49 | 0.1% |
| British | 260 | 0.8% |
| Bulgarian | 33 | 0.1% |
| Burmese | 53 | 0.2% |
| Canadian | 48 | 0.1% |
| Central American | 52 | 0.2% |
| Central American Indian | 4 | 0.0% |
| Cherokee | 20 | 0.1% |
| Chippewa | 7 | 0.0% |
| Choctaw | 9 | 0.0% |
| Colombian | 43 | 0.1% |
| Costa Rican | 15 | 0.0% |
| Creek | 9 | 0.0% |
| Croatian | 182 | 0.5% |
| Cuban | 114 | 0.3% |
| Czech | 119 | 0.4% |
| Czechoslovakian | 53 | 0.2% |
| Danish | 79 | 0.2% |
| Dominican | 55 | 0.2% |
| Dutch | 762 | 2.2% |
| Eastern European | 110 | 0.3% |
| English | 3,823 | 11.3% |
| European | 533 | 1.6% |
| Finnish | 59 | 0.2% |
| French | 956 | 2.8% |
| French Canadian | 77 | 0.2% |
| German | 7,401 | 21.8% |
| Greek | 646 | 1.9% |
| Guamanian / Chamorro | 81 | 0.2% |
| Guatemalan | 21 | 0.1% |
| Honduran | 16 | 0.1% |
| Hungarian | 286 | 0.8% |
| Indian (Asian) | 385 | 1.1% |
| Irish | 5,034 | 14.8% |
| Italian | 1,555 | 4.6% |
| Korean | 319 | 0.9% |
| Lebanese | 26 | 0.1% |
| Lithuanian | 173 | 0.5% |
| Luxembourger | 20 | 0.1% |
| Macedonian | 118 | 0.4% |
| Mexican | 2,313 | 6.8% |
| Mexican American Indian | 53 | 0.2% |
| Nigerian | 20 | 0.1% |
| Norwegian | 317 | 0.9% |
| Palestinian | 19 | 0.1% |
| Pennsylvania German | 22 | 0.1% |
| Peruvian | 4 | 0.0% |
| Polish | 2,709 | 8.0% |
| Portuguese | 11 | 0.0% |
| Puerto Rican | 321 | 0.9% |
| Romanian | 71 | 0.2% |
| Russian | 238 | 0.7% |
| Scandinavian | 151 | 0.4% |
| Scotch-Irish | 376 | 1.1% |
| Scottish | 877 | 2.6% |
| Serbian | 135 | 0.4% |
| Sioux | 9 | 0.0% |
| Slovak | 624 | 1.8% |
| South American | 47 | 0.1% |
| Spaniard | 24 | 0.1% |
| Spanish | 81 | 0.2% |
| Sri Lankan | 63 | 0.2% |
| Subsaharan African | 219 | 0.6% |
| Swedish | 767 | 2.3% |
| Swiss | 127 | 0.4% |
| Syrian | 109 | 0.3% |
| Thai | 473 | 1.4% |
| Turkish | 28 | 0.1% |
| Ugandan | 5 | 0.0% |
| Ukrainian | 133 | 0.4% |
| Welsh | 299 | 0.9% |
| Yugoslavian | 42 | 0.1% | View All 80 Rows |
Immigrants in Valparaiso
The most numerous immigrant groups reported in Valparaiso came from Asia (1,008 | 3.0%), Latin America (616 | 1.8%), Central America (595 | 1.8%), Mexico (595 | 1.8%), and Europe (490 | 1.4%), together accounting for 9.7% of all Valparaiso residents.
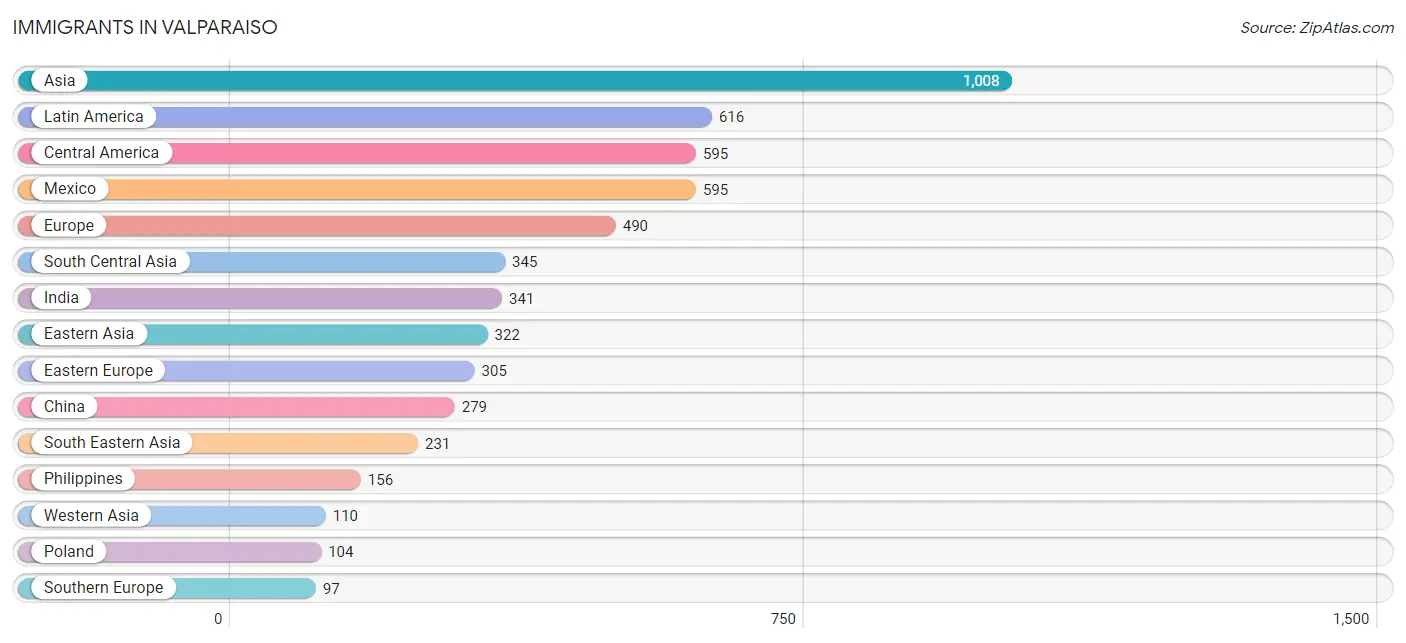
| Immigration Origin | # Population | % Population |
| Africa | 75 | 0.2% |
| Asia | 1,008 | 3.0% |
| Bosnia and Herzegovina | 18 | 0.1% |
| Bulgaria | 33 | 0.1% |
| Cambodia | 5 | 0.0% |
| Canada | 61 | 0.2% |
| Central America | 595 | 1.8% |
| China | 279 | 0.8% |
| Colombia | 13 | 0.0% |
| Croatia | 11 | 0.0% |
| Eastern Africa | 5 | 0.0% |
| Eastern Asia | 322 | 0.9% |
| Eastern Europe | 305 | 0.9% |
| England | 14 | 0.0% |
| Europe | 490 | 1.4% |
| Germany | 10 | 0.0% |
| Guyana | 4 | 0.0% |
| Hungary | 33 | 0.1% |
| India | 341 | 1.0% |
| Indonesia | 58 | 0.2% |
| Italy | 13 | 0.0% |
| Japan | 9 | 0.0% |
| Korea | 34 | 0.1% |
| Latin America | 616 | 1.8% |
| Mexico | 595 | 1.8% |
| Netherlands | 6 | 0.0% |
| Nigeria | 20 | 0.1% |
| Northern Europe | 72 | 0.2% |
| Pakistan | 4 | 0.0% |
| Peru | 4 | 0.0% |
| Philippines | 156 | 0.5% |
| Poland | 104 | 0.3% |
| Romania | 34 | 0.1% |
| Russia | 10 | 0.0% |
| Saudi Arabia | 19 | 0.1% |
| Serbia | 10 | 0.0% |
| South America | 21 | 0.1% |
| South Central Asia | 345 | 1.0% |
| South Eastern Asia | 231 | 0.7% |
| Southern Europe | 97 | 0.3% |
| Spain | 24 | 0.1% |
| Sweden | 4 | 0.0% |
| Syria | 63 | 0.2% |
| Turkey | 28 | 0.1% |
| Uganda | 5 | 0.0% |
| Vietnam | 12 | 0.0% |
| Western Africa | 70 | 0.2% |
| Western Asia | 110 | 0.3% |
| Western Europe | 16 | 0.1% | View All 49 Rows |
Sex and Age in Valparaiso
Sex and Age in Valparaiso
The most populous age groups in Valparaiso are 20 to 24 Years (1,627 | 10.1%) for men and 20 to 24 Years (2,293 | 12.8%) for women.
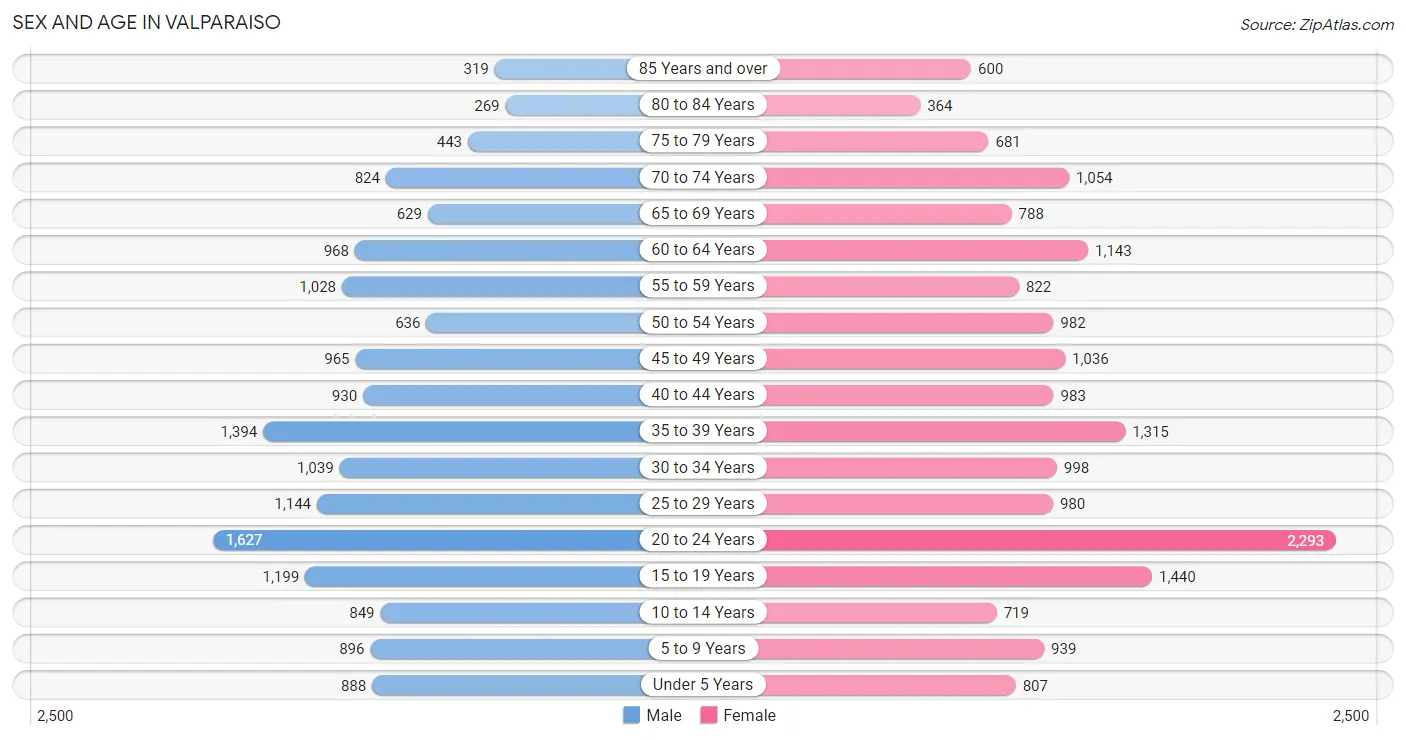
| Age Bracket | Male | Female |
| Under 5 Years | 888 (5.5%) | 807 (4.5%) |
| 5 to 9 Years | 896 (5.6%) | 939 (5.2%) |
| 10 to 14 Years | 849 (5.3%) | 719 (4.0%) |
| 15 to 19 Years | 1,199 (7.5%) | 1,440 (8.0%) |
| 20 to 24 Years | 1,627 (10.1%) | 2,293 (12.8%) |
| 25 to 29 Years | 1,144 (7.1%) | 980 (5.5%) |
| 30 to 34 Years | 1,039 (6.5%) | 998 (5.6%) |
| 35 to 39 Years | 1,394 (8.7%) | 1,315 (7.3%) |
| 40 to 44 Years | 930 (5.8%) | 983 (5.5%) |
| 45 to 49 Years | 965 (6.0%) | 1,036 (5.8%) |
| 50 to 54 Years | 636 (4.0%) | 982 (5.5%) |
| 55 to 59 Years | 1,028 (6.4%) | 822 (4.6%) |
| 60 to 64 Years | 968 (6.0%) | 1,143 (6.4%) |
| 65 to 69 Years | 629 (3.9%) | 788 (4.4%) |
| 70 to 74 Years | 824 (5.1%) | 1,054 (5.9%) |
| 75 to 79 Years | 443 (2.8%) | 681 (3.8%) |
| 80 to 84 Years | 269 (1.7%) | 364 (2.0%) |
| 85 Years and over | 319 (2.0%) | 600 (3.3%) |
| Total | 16,047 (100.0%) | 17,944 (100.0%) |
Families and Households in Valparaiso
Median Family Size in Valparaiso
The median family size in Valparaiso is 2.90 persons per family, with married-couple families (5,879 | 77.5%) accounting for the largest median family size of 2.94 persons per family. On the other hand, single male/father families (564 | 7.4%) represent the smallest median family size with 2.54 persons per family.
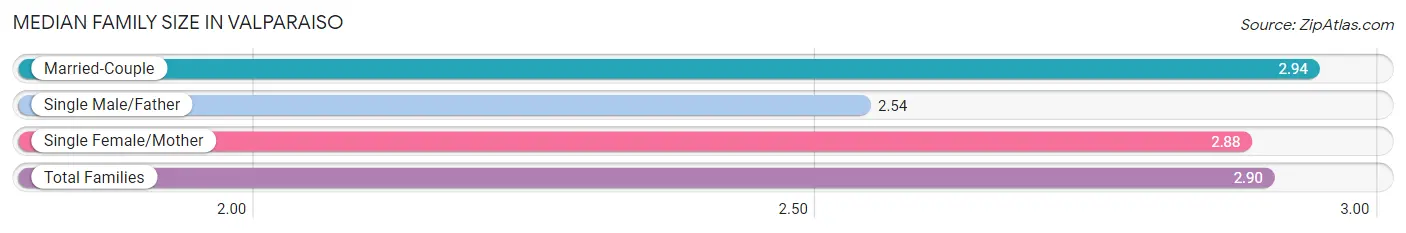
| Family Type | # Families | Family Size |
| Married-Couple | 5,879 (77.5%) | 2.94 |
| Single Male/Father | 564 (7.4%) | 2.54 |
| Single Female/Mother | 1,142 (15.1%) | 2.88 |
| Total Families | 7,585 (100.0%) | 2.90 |
Median Household Size in Valparaiso
The median household size in Valparaiso is 2.17 persons per household, with single female/mother households (1,142 | 8.0%) accounting for the largest median household size of 3.01 persons per household. non-family households (6,754 | 47.1%) represent the smallest median household size with 1.27 persons per household.
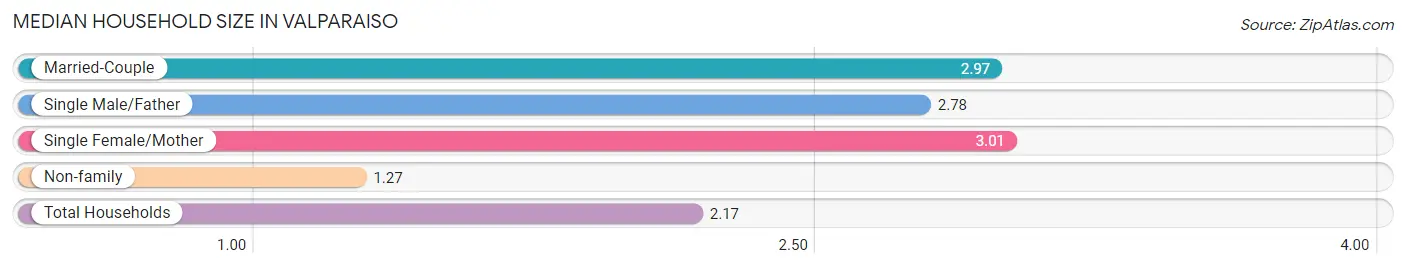
| Household Type | # Households | Household Size |
| Married-Couple | 5,879 (41.0%) | 2.97 |
| Single Male/Father | 564 (3.9%) | 2.78 |
| Single Female/Mother | 1,142 (8.0%) | 3.01 |
| Non-family | 6,754 (47.1%) | 1.27 |
| Total Households | 14,339 (100.0%) | 2.17 |
Household Size by Marriage Status in Valparaiso
Out of a total of 14,339 households in Valparaiso, 7,585 (52.9%) are family households, while 6,754 (47.1%) are nonfamily households. The most numerous type of family households are 2-person households, comprising 3,546, and the most common type of nonfamily households are 1-person households, comprising 5,475.
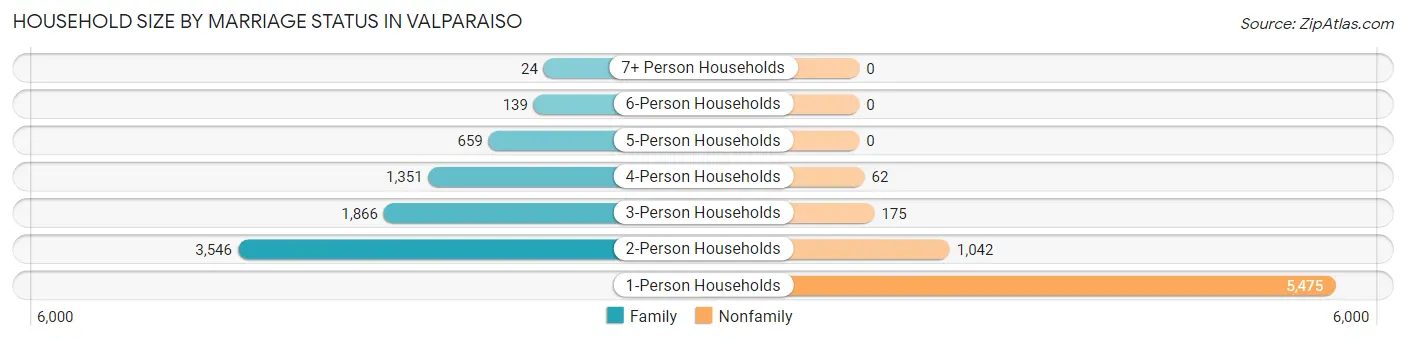
| Household Size | Family Households | Nonfamily Households |
| 1-Person Households | - | 5,475 (38.2%) |
| 2-Person Households | 3,546 (24.7%) | 1,042 (7.3%) |
| 3-Person Households | 1,866 (13.0%) | 175 (1.2%) |
| 4-Person Households | 1,351 (9.4%) | 62 (0.4%) |
| 5-Person Households | 659 (4.6%) | 0 (0.0%) |
| 6-Person Households | 139 (1.0%) | 0 (0.0%) |
| 7+ Person Households | 24 (0.2%) | 0 (0.0%) |
| Total | 7,585 (52.9%) | 6,754 (47.1%) |
Female Fertility in Valparaiso
Fertility by Age in Valparaiso
Average fertility rate in Valparaiso is 33.0 births per 1,000 women. Women in the age bracket of 20 to 34 years have the highest fertility rate with 48.0 births per 1,000 women. Women in the age bracket of 20 to 34 years acount for 68.3% of all women with births.
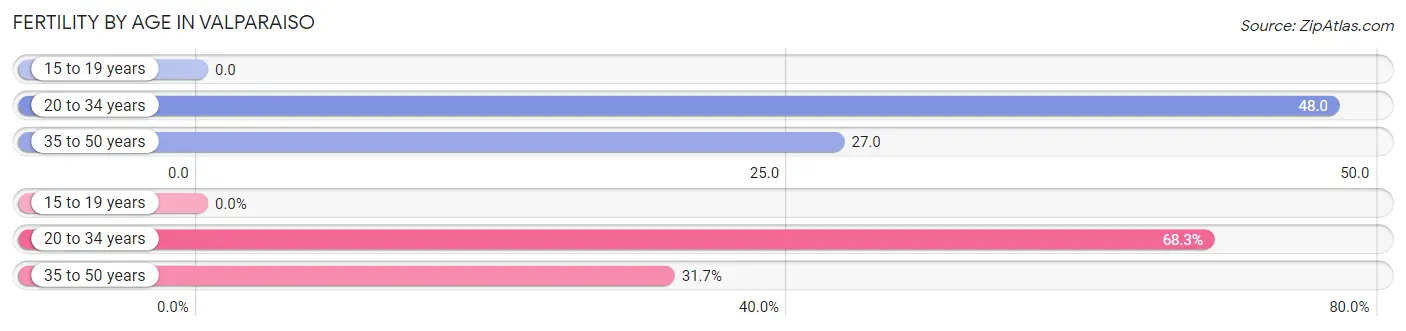
| Age Bracket | Women with Births | Births / 1,000 Women |
| 15 to 19 years | 0 (0.0%) | 0.0 |
| 20 to 34 years | 207 (68.3%) | 48.0 |
| 35 to 50 years | 96 (31.7%) | 27.0 |
| Total | 303 (100.0%) | 33.0 |
Fertility by Age by Marriage Status in Valparaiso
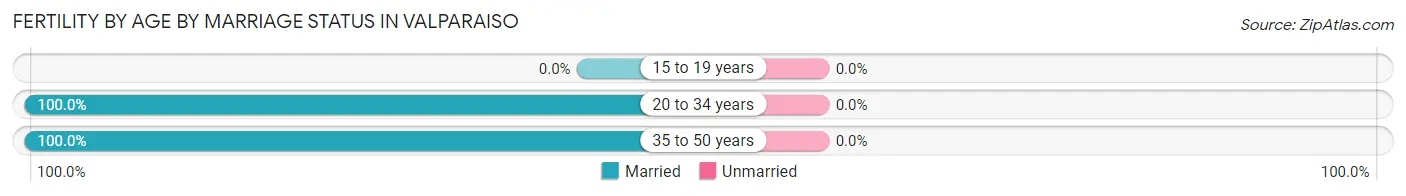
| Age Bracket | Married | Unmarried |
| 15 to 19 years | 0 (0.0%) | 0 (0.0%) |
| 20 to 34 years | 207 (100.0%) | 0 (0.0%) |
| 35 to 50 years | 96 (100.0%) | 0 (0.0%) |
| Total | 303 (100.0%) | 0 (0.0%) |
Fertility by Education in Valparaiso
Average fertility rate in Valparaiso is 33.0 births per 1,000 women. Women with the education attainment of less than high school have the highest fertility rate of 74.0 births per 1,000 women, while women with the education attainment of college or associate's degree have the lowest fertility at 6.0 births per 1,000 women. Women with the education attainment of bachelor's degree represent 40.3% of all women with births.
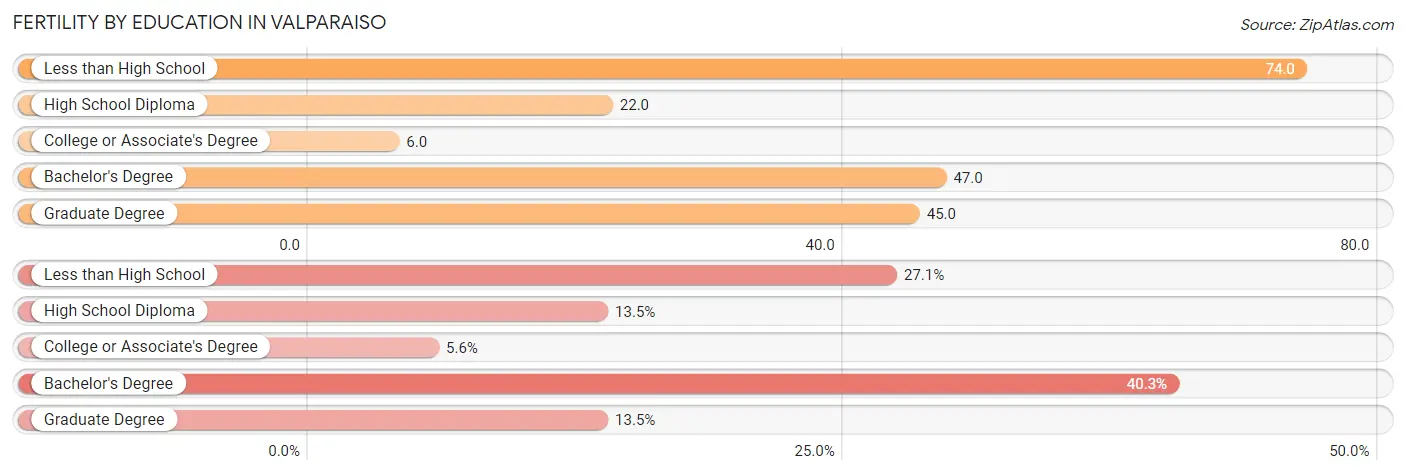
| Educational Attainment | Women with Births | Births / 1,000 Women |
| Less than High School | 82 (27.1%) | 74.0 |
| High School Diploma | 41 (13.5%) | 22.0 |
| College or Associate's Degree | 17 (5.6%) | 6.0 |
| Bachelor's Degree | 122 (40.3%) | 47.0 |
| Graduate Degree | 41 (13.5%) | 45.0 |
| Total | 303 (100.0%) | 33.0 |
Fertility by Education by Marriage Status in Valparaiso
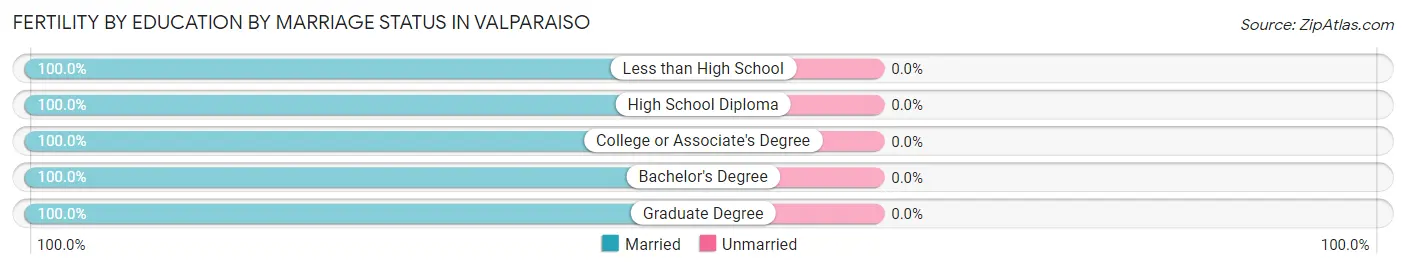
| Educational Attainment | Married | Unmarried |
| Less than High School | 82 (100.0%) | 0 (0.0%) |
| High School Diploma | 41 (100.0%) | 0 (0.0%) |
| College or Associate's Degree | 17 (100.0%) | 0 (0.0%) |
| Bachelor's Degree | 122 (100.0%) | 0 (0.0%) |
| Graduate Degree | 41 (100.0%) | 0 (0.0%) |
| Total | 303 (100.0%) | 0 (0.0%) |
Employment Characteristics in Valparaiso
Employment by Class of Employer in Valparaiso
Among the 16,340 employed individuals in Valparaiso, private company employees (11,280 | 69.0%), local government employees (1,526 | 9.3%), and not-for-profit organizations (1,424 | 8.7%) make up the most common classes of employment.
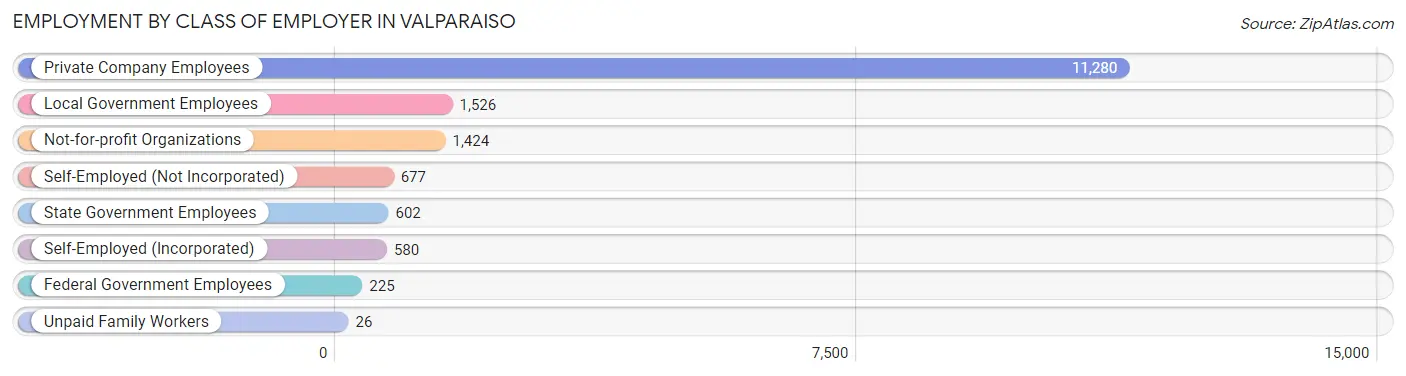
| Employer Class | # Employees | % Employees |
| Private Company Employees | 11,280 | 69.0% |
| Self-Employed (Incorporated) | 580 | 3.5% |
| Self-Employed (Not Incorporated) | 677 | 4.1% |
| Not-for-profit Organizations | 1,424 | 8.7% |
| Local Government Employees | 1,526 | 9.3% |
| State Government Employees | 602 | 3.7% |
| Federal Government Employees | 225 | 1.4% |
| Unpaid Family Workers | 26 | 0.2% |
| Total | 16,340 | 100.0% |
Employment Status by Age in Valparaiso
According to the labor force statistics for Valparaiso, out of the total population over 16 years of age (28,402), 60.6% or 17,212 individuals are in the labor force, with 3.0% or 516 of them unemployed. The age group with the highest labor force participation rate is 35 to 44 years, with 86.3% or 3,989 individuals in the labor force. Within the labor force, the 30 to 34 years age range has the highest percentage of unemployed individuals, with 6.8% or 108 of them being unemployed.
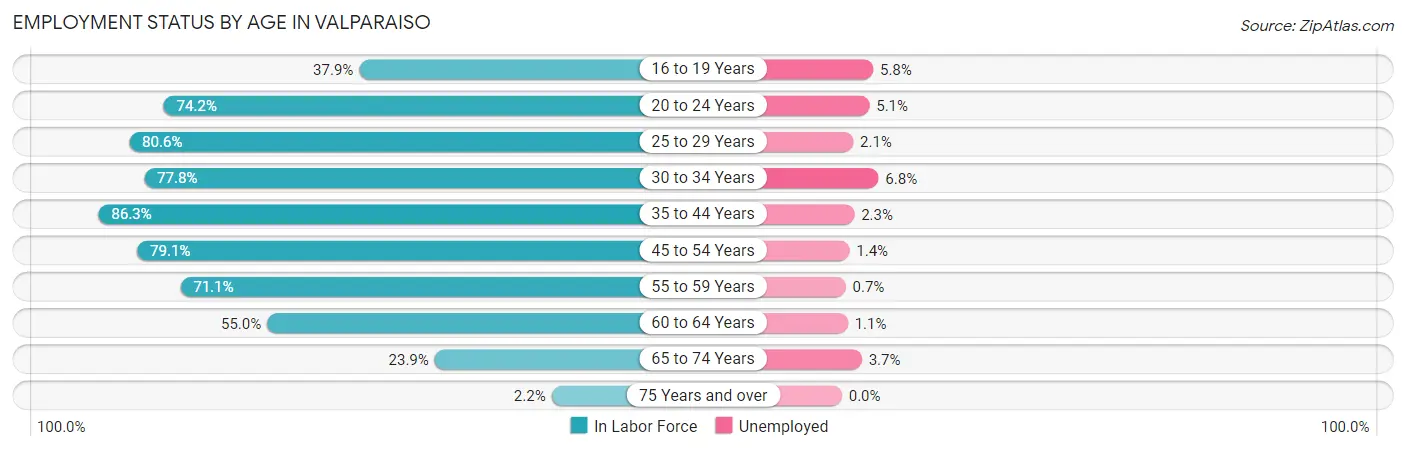
| Age Bracket | In Labor Force | Unemployed |
| 16 to 19 Years | 814 (37.9%) | 47 (5.8%) |
| 20 to 24 Years | 2,909 (74.2%) | 148 (5.1%) |
| 25 to 29 Years | 1,712 (80.6%) | 36 (2.1%) |
| 30 to 34 Years | 1,585 (77.8%) | 108 (6.8%) |
| 35 to 44 Years | 3,989 (86.3%) | 92 (2.3%) |
| 45 to 54 Years | 2,863 (79.1%) | 40 (1.4%) |
| 55 to 59 Years | 1,315 (71.1%) | 9 (0.7%) |
| 60 to 64 Years | 1,161 (55.0%) | 13 (1.1%) |
| 65 to 74 Years | 788 (23.9%) | 29 (3.7%) |
| 75 Years and over | 59 (2.2%) | 0 (0.0%) |
| Total | 17,212 (60.6%) | 516 (3.0%) |
Employment Status by Educational Attainment in Valparaiso
According to labor force statistics for Valparaiso, 77.2% of individuals (12,632) out of the total population between 25 and 64 years of age (16,363) are in the labor force, with 2.4% or 303 of them being unemployed. The group with the highest labor force participation rate are those with the educational attainment of bachelor's degree or higher, with 85.4% or 6,445 individuals in the labor force. Within the labor force, individuals with high school diploma education have the highest percentage of unemployment, with 5.5% or 126 of them being unemployed.
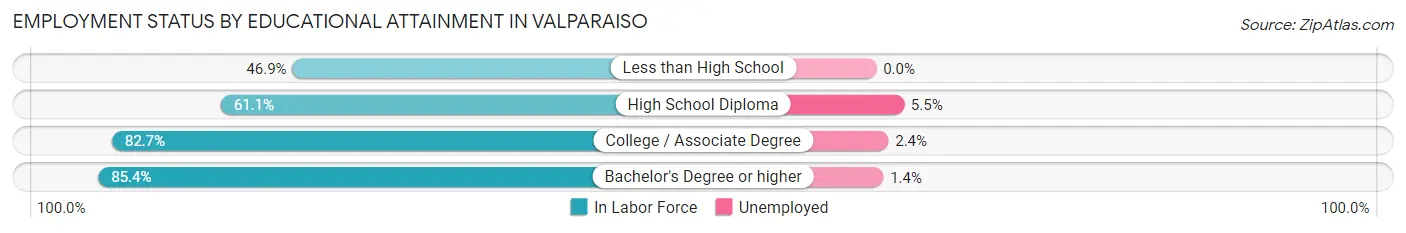
| Educational Attainment | In Labor Force | Unemployed |
| Less than High School | 390 (46.9%) | 0 (0.0%) |
| High School Diploma | 2,293 (61.1%) | 206 (5.5%) |
| College / Associate Degree | 3,500 (82.7%) | 102 (2.4%) |
| Bachelor's Degree or higher | 6,445 (85.4%) | 106 (1.4%) |
| Total | 12,632 (77.2%) | 393 (2.4%) |
Employment Occupations by Sex in Valparaiso
Management, Business, Science and Arts Occupations
The most common Management, Business, Science and Arts occupations in Valparaiso are Community & Social Service (2,564 | 15.4%), Management (1,907 | 11.5%), Education Instruction & Library (1,614 | 9.7%), Health Diagnosing & Treating (1,229 | 7.4%), and Computers, Engineering & Science (966 | 5.8%).
Management, Business, Science and Arts Occupations by Sex
Within the Management, Business, Science and Arts occupations in Valparaiso, the most male-oriented occupations are Architecture & Engineering (100.0%), Computers, Engineering & Science (59.1%), and Education, Arts & Media (58.2%), while the most female-oriented occupations are Health Diagnosing & Treating (80.4%), Health Technologists (72.7%), and Education Instruction & Library (69.0%).
| Occupation | Male | Female |
| Management | 1,041 (54.6%) | 866 (45.4%) |
| Business & Financial | 388 (53.2%) | 341 (46.8%) |
| Computers, Engineering & Science | 571 (59.1%) | 395 (40.9%) |
| Computers & Mathematics | 288 (46.2%) | 335 (53.8%) |
| Architecture & Engineering | 231 (100.0%) | 0 (0.0%) |
| Life, Physical & Social Science | 52 (46.4%) | 60 (53.6%) |
| Community & Social Service | 997 (38.9%) | 1,567 (61.1%) |
| Education, Arts & Media | 329 (58.2%) | 236 (41.8%) |
| Legal Services & Support | 86 (40.9%) | 124 (59.1%) |
| Education Instruction & Library | 500 (31.0%) | 1,114 (69.0%) |
| Arts, Media & Entertainment | 82 (46.9%) | 93 (53.1%) |
| Health Diagnosing & Treating | 241 (19.6%) | 988 (80.4%) |
| Health Technologists | 241 (27.3%) | 642 (72.7%) |
| Total (Category) | 3,238 (43.8%) | 4,157 (56.2%) |
| Total (Overall) | 8,341 (50.1%) | 8,316 (49.9%) |
Services Occupations
The most common Services occupations in Valparaiso are Food Preparation & Serving (1,151 | 6.9%), Healthcare Support (556 | 3.3%), Personal Care & Service (362 | 2.2%), Cleaning & Maintenance (347 | 2.1%), and Security & Protection (312 | 1.9%).
Services Occupations by Sex
Within the Services occupations in Valparaiso, the most male-oriented occupations are Firefighting & Prevention (100.0%), Security & Protection (96.5%), and Law Enforcement (91.5%), while the most female-oriented occupations are Healthcare Support (97.1%), Personal Care & Service (85.9%), and Food Preparation & Serving (53.7%).
| Occupation | Male | Female |
| Healthcare Support | 16 (2.9%) | 540 (97.1%) |
| Security & Protection | 301 (96.5%) | 11 (3.5%) |
| Firefighting & Prevention | 182 (100.0%) | 0 (0.0%) |
| Law Enforcement | 119 (91.5%) | 11 (8.5%) |
| Food Preparation & Serving | 533 (46.3%) | 618 (53.7%) |
| Cleaning & Maintenance | 208 (59.9%) | 139 (40.1%) |
| Personal Care & Service | 51 (14.1%) | 311 (85.9%) |
| Total (Category) | 1,109 (40.6%) | 1,619 (59.4%) |
| Total (Overall) | 8,341 (50.1%) | 8,316 (49.9%) |
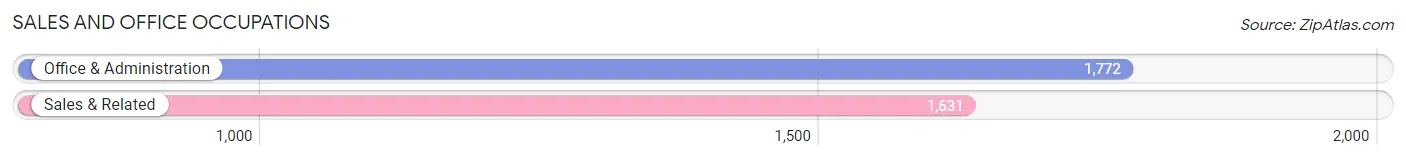
Sales and Office Occupations
The most common Sales and Office occupations in Valparaiso are Office & Administration (1,772 | 10.6%), and Sales & Related (1,631 | 9.8%).
Sales and Office Occupations by Sex
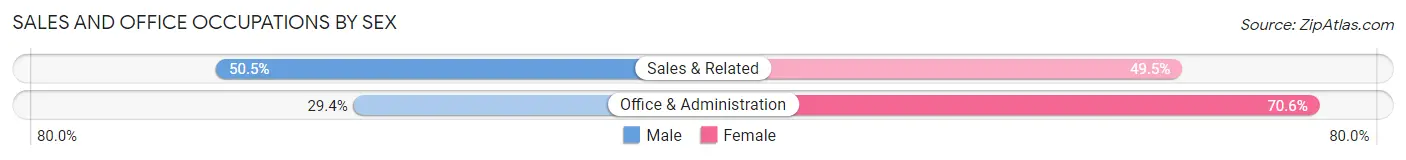
| Occupation | Male | Female |
| Sales & Related | 824 (50.5%) | 807 (49.5%) |
| Office & Administration | 521 (29.4%) | 1,251 (70.6%) |
| Total (Category) | 1,345 (39.5%) | 2,058 (60.5%) |
| Total (Overall) | 8,341 (50.1%) | 8,316 (49.9%) |
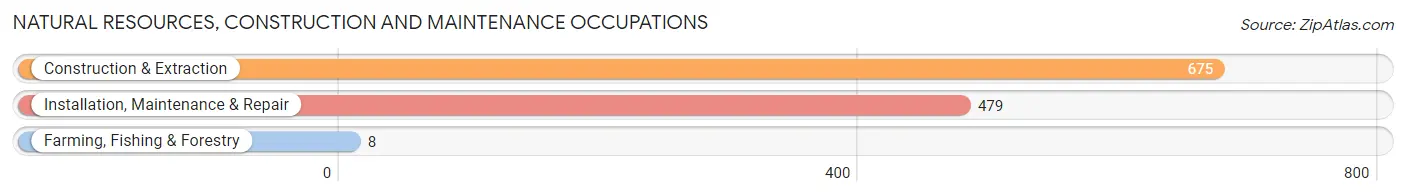
Natural Resources, Construction and Maintenance Occupations
The most common Natural Resources, Construction and Maintenance occupations in Valparaiso are Construction & Extraction (675 | 4.1%), Installation, Maintenance & Repair (479 | 2.9%), and Farming, Fishing & Forestry (8 | 0.1%).
Natural Resources, Construction and Maintenance Occupations by Sex
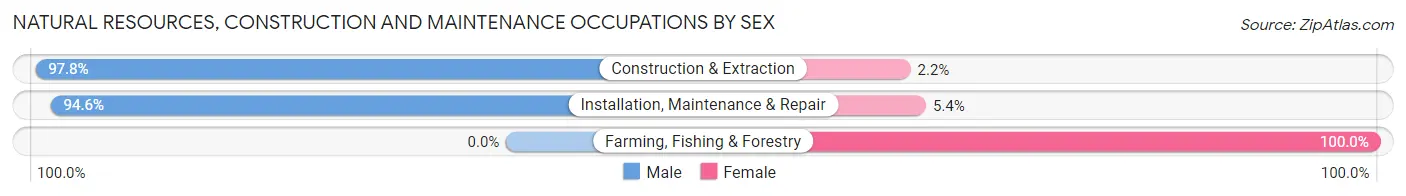
| Occupation | Male | Female |
| Farming, Fishing & Forestry | 0 (0.0%) | 8 (100.0%) |
| Construction & Extraction | 660 (97.8%) | 15 (2.2%) |
| Installation, Maintenance & Repair | 453 (94.6%) | 26 (5.4%) |
| Total (Category) | 1,113 (95.8%) | 49 (4.2%) |
| Total (Overall) | 8,341 (50.1%) | 8,316 (49.9%) |
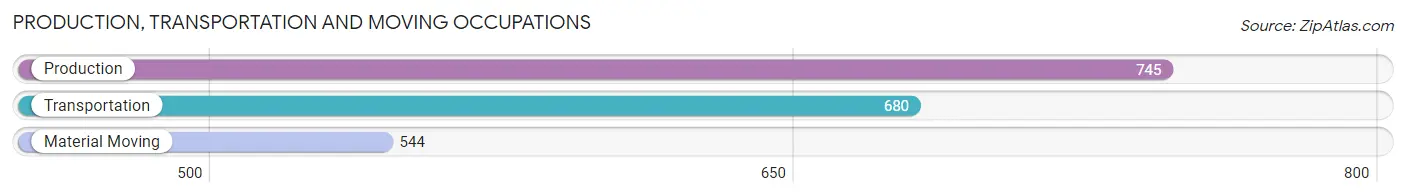
Production, Transportation and Moving Occupations
The most common Production, Transportation and Moving occupations in Valparaiso are Production (745 | 4.5%), Transportation (680 | 4.1%), and Material Moving (544 | 3.3%).
Production, Transportation and Moving Occupations by Sex
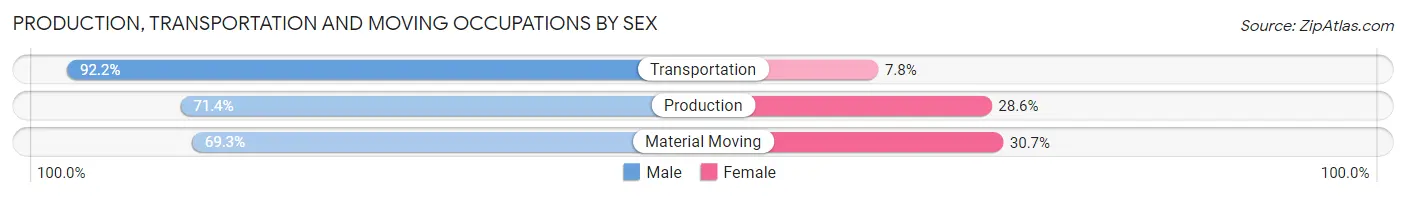
| Occupation | Male | Female |
| Production | 532 (71.4%) | 213 (28.6%) |
| Transportation | 627 (92.2%) | 53 (7.8%) |
| Material Moving | 377 (69.3%) | 167 (30.7%) |
| Total (Category) | 1,536 (78.0%) | 433 (22.0%) |
| Total (Overall) | 8,341 (50.1%) | 8,316 (49.9%) |
Employment Industries by Sex in Valparaiso
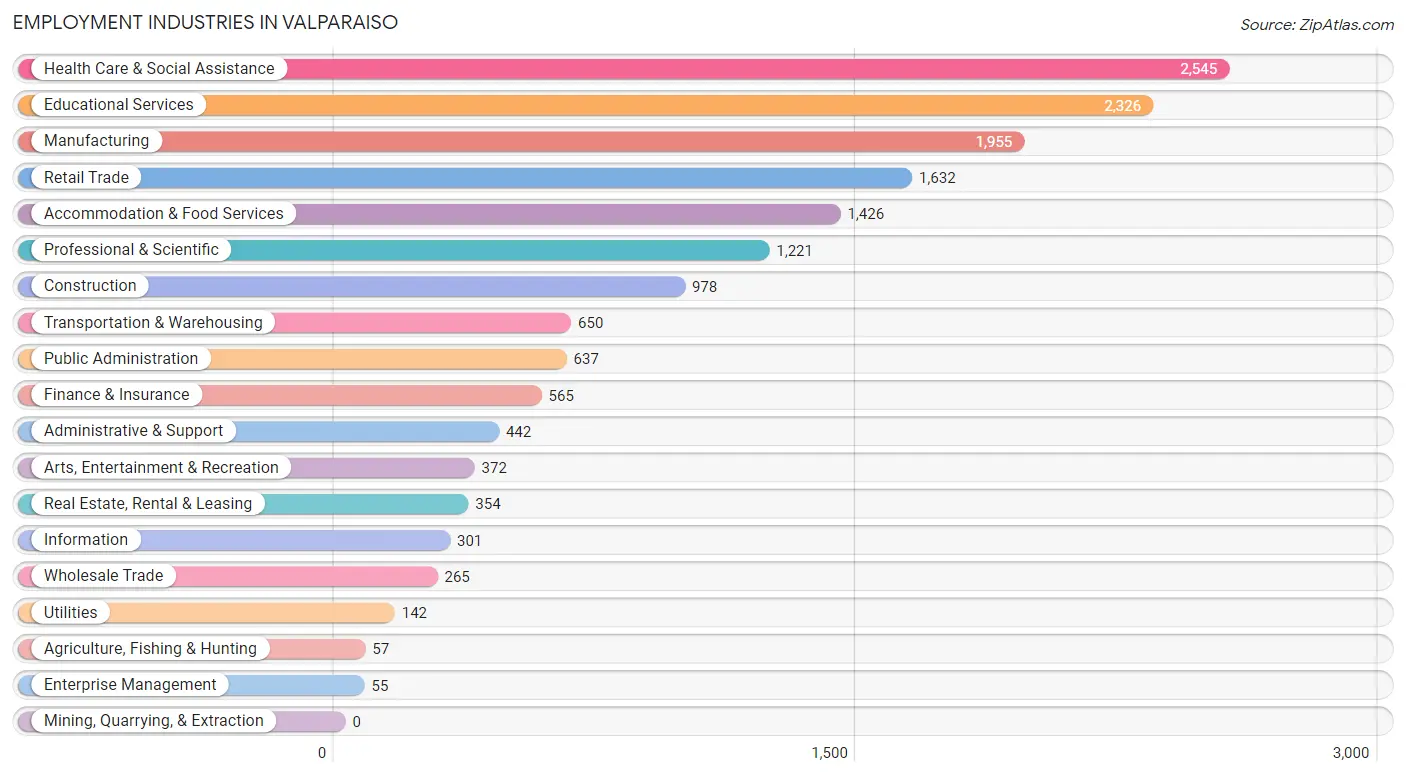
Employment Industries in Valparaiso
The major employment industries in Valparaiso include Health Care & Social Assistance (2,545 | 15.3%), Educational Services (2,326 | 14.0%), Manufacturing (1,955 | 11.7%), Retail Trade (1,632 | 9.8%), and Accommodation & Food Services (1,426 | 8.6%).
Employment Industries by Sex in Valparaiso
The Valparaiso industries that see more men than women are Enterprise Management (100.0%), Construction (88.6%), and Agriculture, Fishing & Hunting (86.0%), whereas the industries that tend to have a higher number of women are Health Care & Social Assistance (78.1%), Educational Services (73.5%), and Arts, Entertainment & Recreation (68.0%).
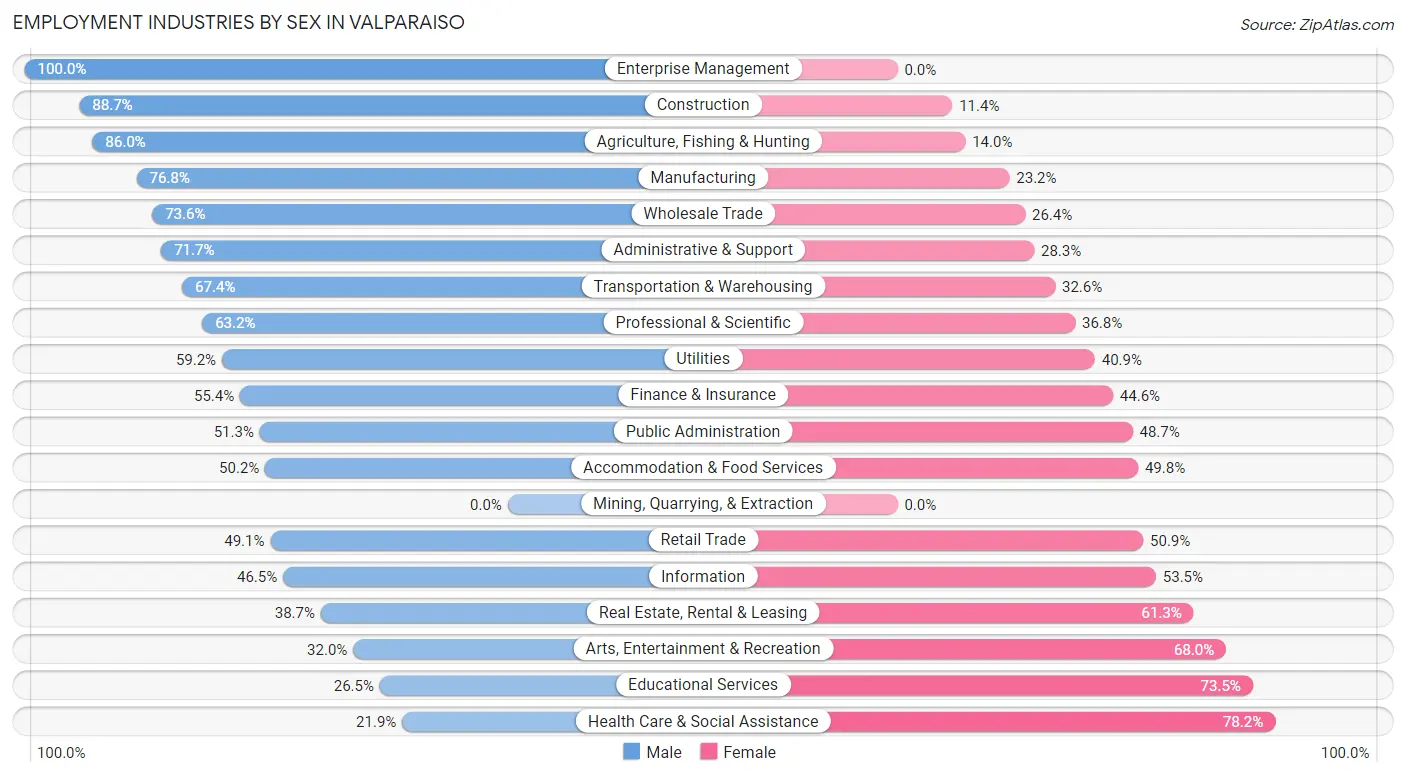
| Industry | Male | Female |
| Agriculture, Fishing & Hunting | 49 (86.0%) | 8 (14.0%) |
| Mining, Quarrying, & Extraction | 0 (0.0%) | 0 (0.0%) |
| Construction | 867 (88.6%) | 111 (11.4%) |
| Manufacturing | 1,502 (76.8%) | 453 (23.2%) |
| Wholesale Trade | 195 (73.6%) | 70 (26.4%) |
| Retail Trade | 802 (49.1%) | 830 (50.9%) |
| Transportation & Warehousing | 438 (67.4%) | 212 (32.6%) |
| Utilities | 84 (59.2%) | 58 (40.8%) |
| Information | 140 (46.5%) | 161 (53.5%) |
| Finance & Insurance | 313 (55.4%) | 252 (44.6%) |
| Real Estate, Rental & Leasing | 137 (38.7%) | 217 (61.3%) |
| Professional & Scientific | 772 (63.2%) | 449 (36.8%) |
| Enterprise Management | 55 (100.0%) | 0 (0.0%) |
| Administrative & Support | 317 (71.7%) | 125 (28.3%) |
| Educational Services | 616 (26.5%) | 1,710 (73.5%) |
| Health Care & Social Assistance | 556 (21.8%) | 1,989 (78.1%) |
| Arts, Entertainment & Recreation | 119 (32.0%) | 253 (68.0%) |
| Accommodation & Food Services | 716 (50.2%) | 710 (49.8%) |
| Public Administration | 327 (51.3%) | 310 (48.7%) |
| Total | 8,341 (50.1%) | 8,316 (49.9%) |
Education in Valparaiso
School Enrollment in Valparaiso
The most common levels of schooling among the 8,967 students in Valparaiso are college / undergraduate (3,066 | 34.2%), high school (1,824 | 20.3%), and middle school (1,209 | 13.5%).
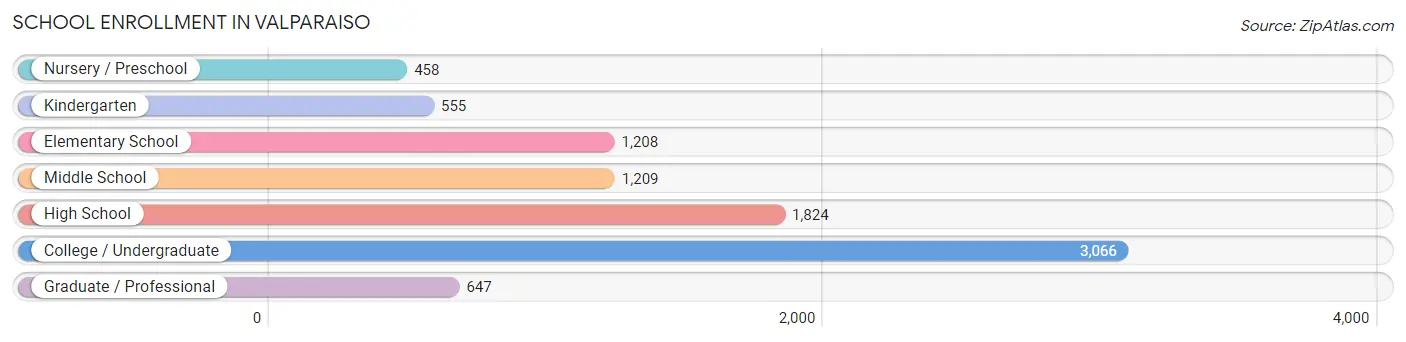
| School Level | # Students | % Students |
| Nursery / Preschool | 458 | 5.1% |
| Kindergarten | 555 | 6.2% |
| Elementary School | 1,208 | 13.5% |
| Middle School | 1,209 | 13.5% |
| High School | 1,824 | 20.3% |
| College / Undergraduate | 3,066 | 34.2% |
| Graduate / Professional | 647 | 7.2% |
| Total | 8,967 | 100.0% |
School Enrollment by Age by Funding Source in Valparaiso
Out of a total of 8,967 students who are enrolled in schools in Valparaiso, 3,129 (34.9%) attend a private institution, while the remaining 5,838 (65.1%) are enrolled in public schools. The age group of 20 to 24 year olds has the highest likelihood of being enrolled in private schools, with 1,907 (88.9% in the age bracket) enrolled. Conversely, the age group of 5 to 9 year old has the lowest likelihood of being enrolled in a private school, with 1,548 (92.6% in the age bracket) attending a public institution.
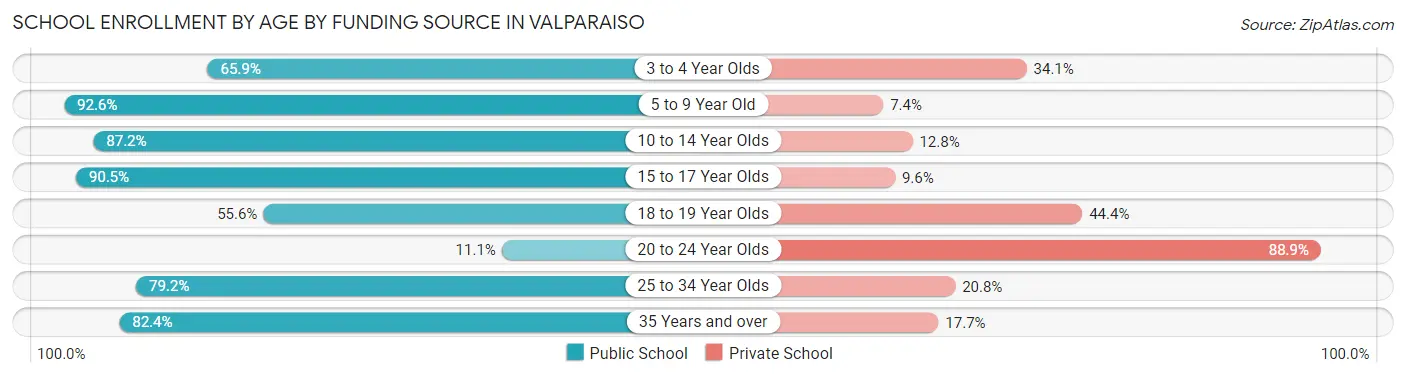
| Age Bracket | Public School | Private School |
| 3 to 4 Year Olds | 234 (65.9%) | 121 (34.1%) |
| 5 to 9 Year Old | 1,548 (92.6%) | 123 (7.4%) |
| 10 to 14 Year Olds | 1,367 (87.2%) | 201 (12.8%) |
| 15 to 17 Year Olds | 1,146 (90.4%) | 121 (9.6%) |
| 18 to 19 Year Olds | 615 (55.6%) | 492 (44.4%) |
| 20 to 24 Year Olds | 239 (11.1%) | 1,907 (88.9%) |
| 25 to 34 Year Olds | 393 (79.2%) | 103 (20.8%) |
| 35 Years and over | 294 (82.4%) | 63 (17.6%) |
| Total | 5,838 (65.1%) | 3,129 (34.9%) |
Educational Attainment by Field of Study in Valparaiso
Business (1,704 | 17.4%), education (1,541 | 15.8%), engineering (848 | 8.7%), science & technology (760 | 7.8%), and arts & humanities (698 | 7.1%) are the most common fields of study among 9,764 individuals in Valparaiso who have obtained a bachelor's degree or higher.
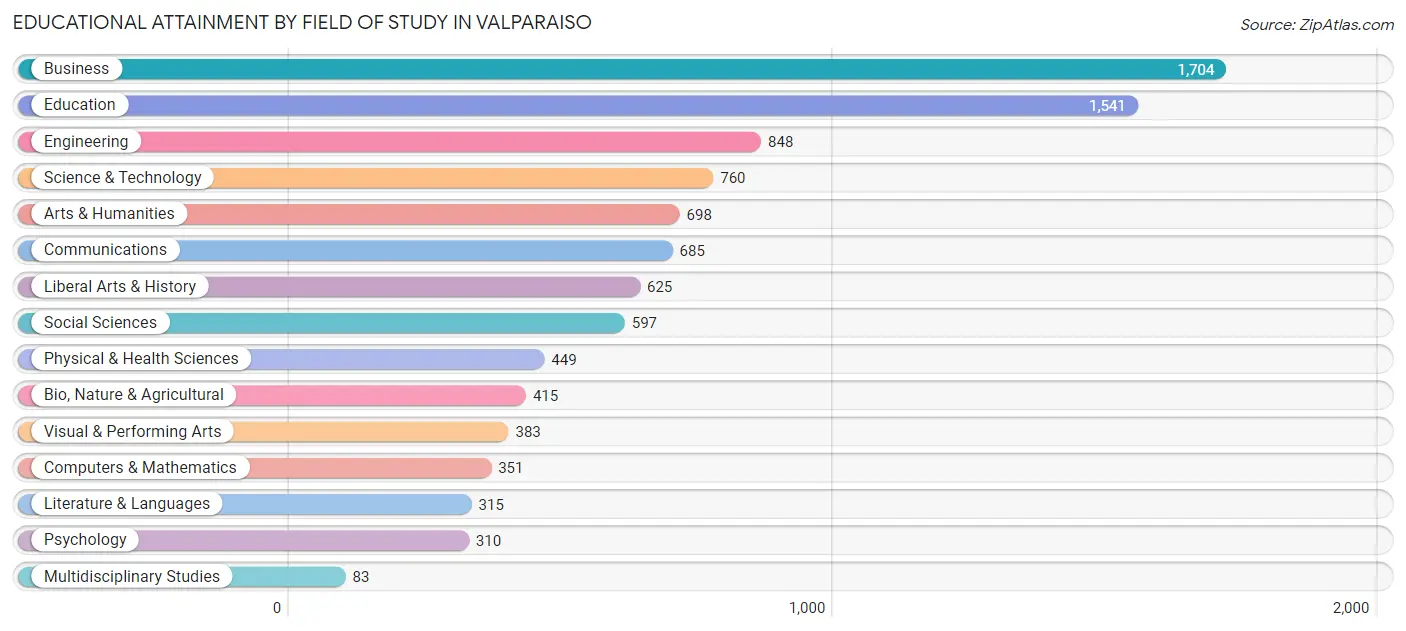
| Field of Study | # Graduates | % Graduates |
| Computers & Mathematics | 351 | 3.6% |
| Bio, Nature & Agricultural | 415 | 4.3% |
| Physical & Health Sciences | 449 | 4.6% |
| Psychology | 310 | 3.2% |
| Social Sciences | 597 | 6.1% |
| Engineering | 848 | 8.7% |
| Multidisciplinary Studies | 83 | 0.9% |
| Science & Technology | 760 | 7.8% |
| Business | 1,704 | 17.4% |
| Education | 1,541 | 15.8% |
| Literature & Languages | 315 | 3.2% |
| Liberal Arts & History | 625 | 6.4% |
| Visual & Performing Arts | 383 | 3.9% |
| Communications | 685 | 7.0% |
| Arts & Humanities | 698 | 7.1% |
| Total | 9,764 | 100.0% |
Transportation & Commute in Valparaiso
Vehicle Availability by Sex in Valparaiso
The most prevalent vehicle ownership categories in Valparaiso are males with 2 vehicles (3,678, accounting for 46.0%) and females with 2 vehicles (3,128, making up 49.6%).
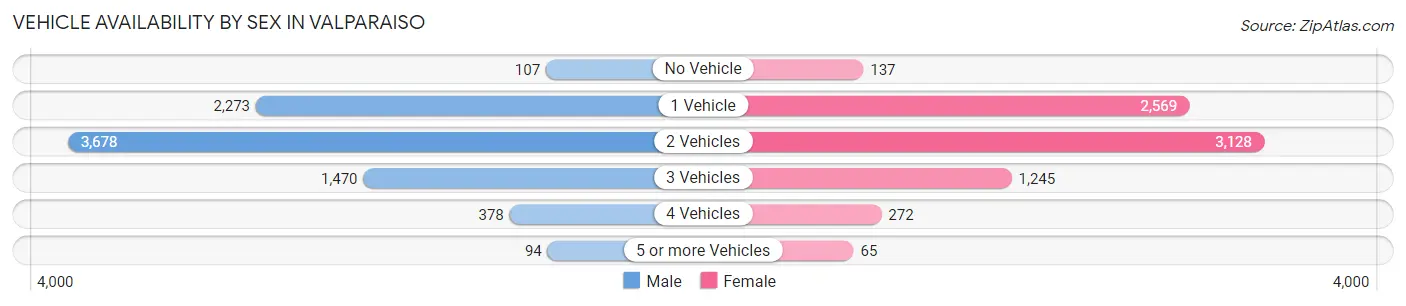
| Vehicles Available | Male | Female |
| No Vehicle | 107 (1.3%) | 137 (1.8%) |
| 1 Vehicle | 2,273 (28.4%) | 2,569 (34.6%) |
| 2 Vehicles | 3,678 (46.0%) | 3,128 (42.2%) |
| 3 Vehicles | 1,470 (18.4%) | 1,245 (16.8%) |
| 4 Vehicles | 378 (4.7%) | 272 (3.7%) |
| 5 or more Vehicles | 94 (1.2%) | 65 (0.9%) |
| Total | 8,000 (100.0%) | 7,416 (100.0%) |
Commute Time in Valparaiso
The most frequently occuring commute durations in Valparaiso are 10 to 14 minutes (2,742 commuters, 18.4%), 5 to 9 minutes (2,569 commuters, 17.2%), and 30 to 34 minutes (1,869 commuters, 12.6%).
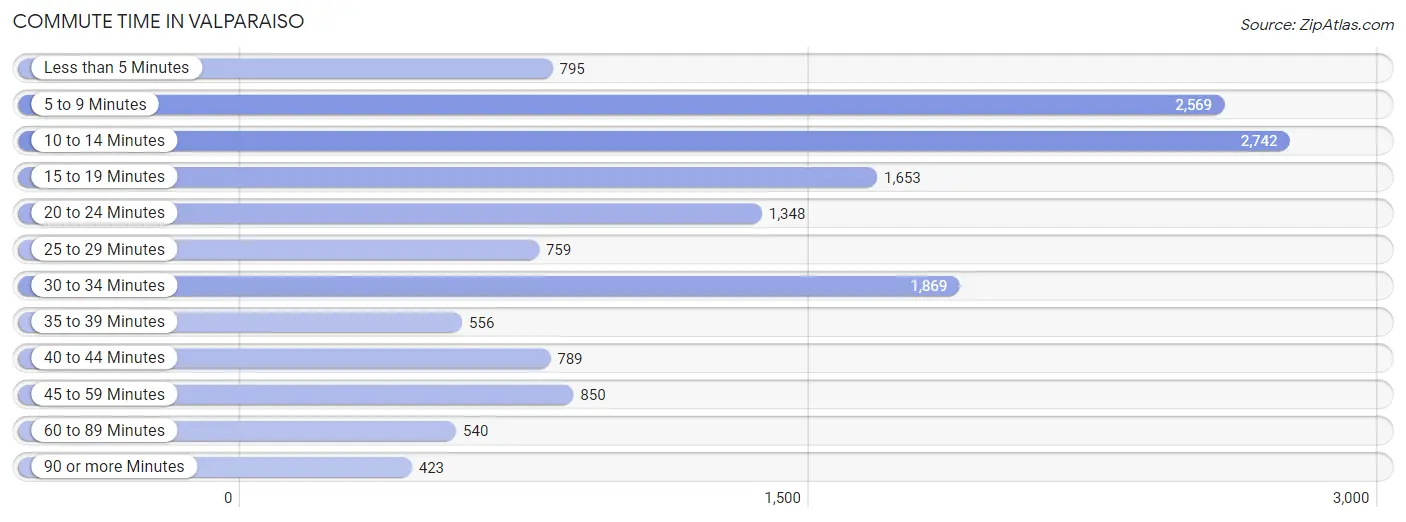
| Commute Time | # Commuters | % Commuters |
| Less than 5 Minutes | 795 | 5.3% |
| 5 to 9 Minutes | 2,569 | 17.2% |
| 10 to 14 Minutes | 2,742 | 18.4% |
| 15 to 19 Minutes | 1,653 | 11.1% |
| 20 to 24 Minutes | 1,348 | 9.0% |
| 25 to 29 Minutes | 759 | 5.1% |
| 30 to 34 Minutes | 1,869 | 12.6% |
| 35 to 39 Minutes | 556 | 3.7% |
| 40 to 44 Minutes | 789 | 5.3% |
| 45 to 59 Minutes | 850 | 5.7% |
| 60 to 89 Minutes | 540 | 3.6% |
| 90 or more Minutes | 423 | 2.8% |
Commute Time by Sex in Valparaiso
The most common commute times in Valparaiso are 10 to 14 minutes (1,158 commuters, 15.6%) for males and 5 to 9 minutes (1,692 commuters, 22.6%) for females.
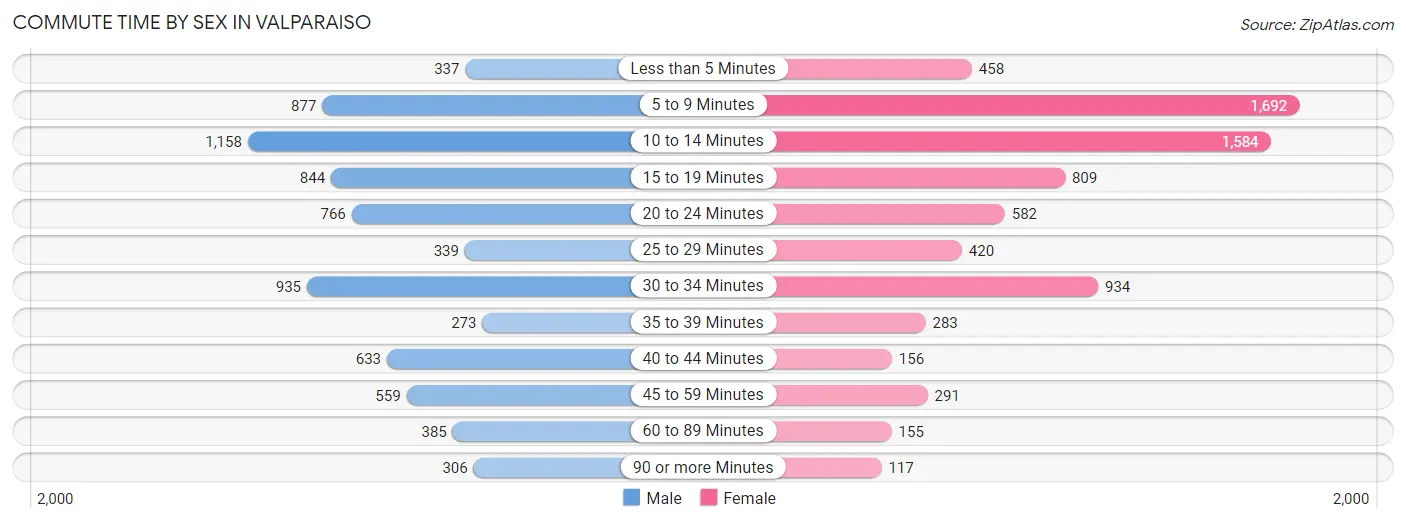
| Commute Time | Male | Female |
| Less than 5 Minutes | 337 (4.5%) | 458 (6.1%) |
| 5 to 9 Minutes | 877 (11.8%) | 1,692 (22.6%) |
| 10 to 14 Minutes | 1,158 (15.6%) | 1,584 (21.2%) |
| 15 to 19 Minutes | 844 (11.4%) | 809 (10.8%) |
| 20 to 24 Minutes | 766 (10.3%) | 582 (7.8%) |
| 25 to 29 Minutes | 339 (4.6%) | 420 (5.6%) |
| 30 to 34 Minutes | 935 (12.6%) | 934 (12.5%) |
| 35 to 39 Minutes | 273 (3.7%) | 283 (3.8%) |
| 40 to 44 Minutes | 633 (8.5%) | 156 (2.1%) |
| 45 to 59 Minutes | 559 (7.5%) | 291 (3.9%) |
| 60 to 89 Minutes | 385 (5.2%) | 155 (2.1%) |
| 90 or more Minutes | 306 (4.1%) | 117 (1.6%) |
Time of Departure to Work by Sex in Valparaiso
The most frequent times of departure to work in Valparaiso are 7:30 AM to 7:59 AM (919, 12.4%) for males and 7:00 AM to 7:29 AM (1,063, 14.2%) for females.
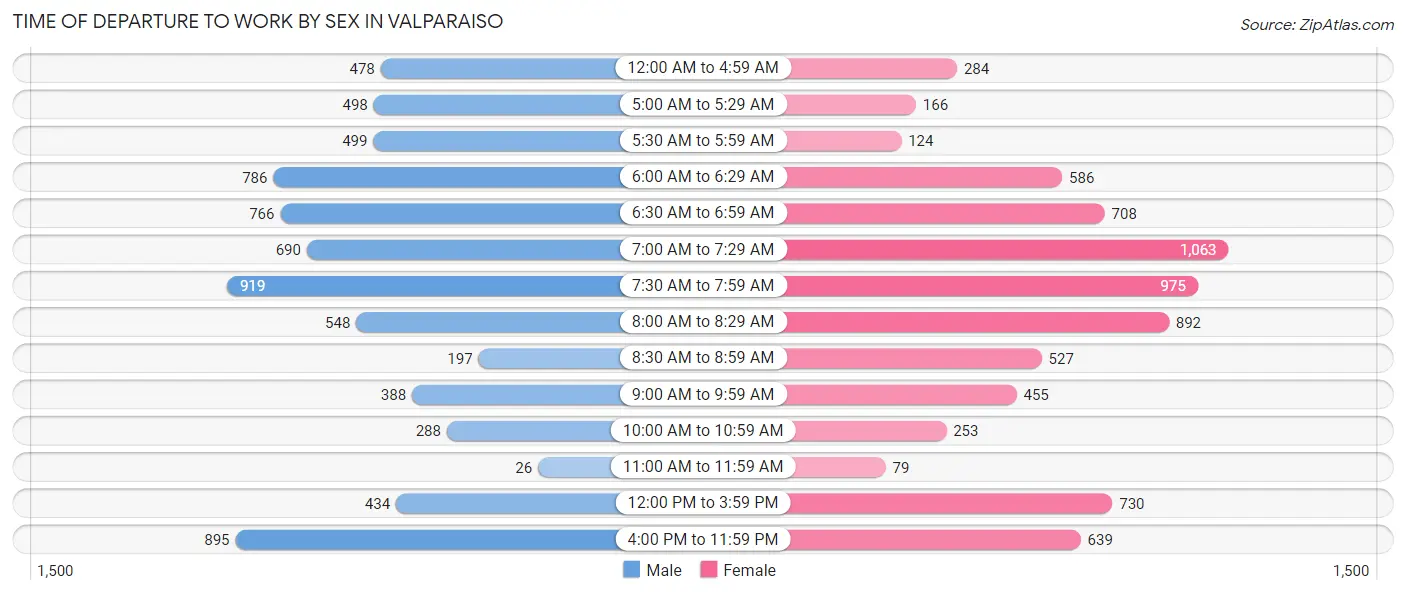
| Time of Departure | Male | Female |
| 12:00 AM to 4:59 AM | 478 (6.5%) | 284 (3.8%) |
| 5:00 AM to 5:29 AM | 498 (6.7%) | 166 (2.2%) |
| 5:30 AM to 5:59 AM | 499 (6.7%) | 124 (1.7%) |
| 6:00 AM to 6:29 AM | 786 (10.6%) | 586 (7.8%) |
| 6:30 AM to 6:59 AM | 766 (10.3%) | 708 (9.5%) |
| 7:00 AM to 7:29 AM | 690 (9.3%) | 1,063 (14.2%) |
| 7:30 AM to 7:59 AM | 919 (12.4%) | 975 (13.0%) |
| 8:00 AM to 8:29 AM | 548 (7.4%) | 892 (11.9%) |
| 8:30 AM to 8:59 AM | 197 (2.7%) | 527 (7.0%) |
| 9:00 AM to 9:59 AM | 388 (5.2%) | 455 (6.1%) |
| 10:00 AM to 10:59 AM | 288 (3.9%) | 253 (3.4%) |
| 11:00 AM to 11:59 AM | 26 (0.4%) | 79 (1.1%) |
| 12:00 PM to 3:59 PM | 434 (5.9%) | 730 (9.8%) |
| 4:00 PM to 11:59 PM | 895 (12.1%) | 639 (8.5%) |
| Total | 7,412 (100.0%) | 7,481 (100.0%) |
Housing Occupancy in Valparaiso
Occupancy by Ownership in Valparaiso
Of the total 14,339 dwellings in Valparaiso, owner-occupied units account for 7,983 (55.7%), while renter-occupied units make up 6,356 (44.3%).
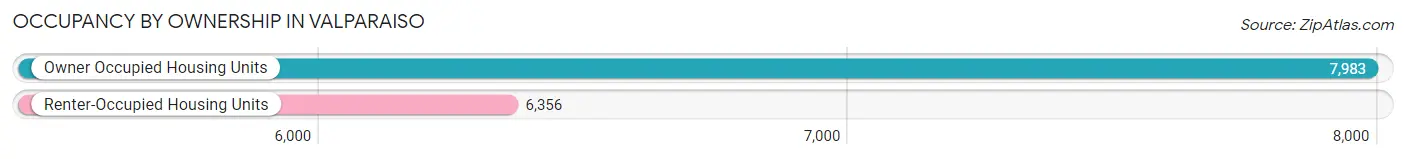
| Occupancy | # Housing Units | % Housing Units |
| Owner Occupied Housing Units | 7,983 | 55.7% |
| Renter-Occupied Housing Units | 6,356 | 44.3% |
| Total Occupied Housing Units | 14,339 | 100.0% |
Occupancy by Household Size in Valparaiso
| Household Size | # Housing Units | % Housing Units |
| 1-Person Household | 5,475 | 38.2% |
| 2-Person Household | 4,588 | 32.0% |
| 3-Person Household | 2,041 | 14.2% |
| 4+ Person Household | 2,235 | 15.6% |
| Total Housing Units | 14,339 | 100.0% |
Occupancy by Ownership by Household Size in Valparaiso
| Household Size | Owner-occupied | Renter-occupied |
| 1-Person Household | 2,477 (45.2%) | 2,998 (54.8%) |
| 2-Person Household | 2,938 (64.0%) | 1,650 (36.0%) |
| 3-Person Household | 1,072 (52.5%) | 969 (47.5%) |
| 4+ Person Household | 1,496 (66.9%) | 739 (33.1%) |
| Total Housing Units | 7,983 (55.7%) | 6,356 (44.3%) |
Occupancy by Educational Attainment in Valparaiso
| Household Size | Owner-occupied | Renter-occupied |
| Less than High School | 227 (37.5%) | 378 (62.5%) |
| High School Diploma | 1,273 (38.6%) | 2,027 (61.4%) |
| College/Associate Degree | 2,382 (57.7%) | 1,744 (42.3%) |
| Bachelor's Degree or higher | 4,101 (65.0%) | 2,207 (35.0%) |
Occupancy by Age of Householder in Valparaiso
| Age Bracket | # Households | % Households |
| Under 35 Years | 3,536 | 24.7% |
| 35 to 44 Years | 2,618 | 18.3% |
| 45 to 54 Years | 2,192 | 15.3% |
| 55 to 64 Years | 2,341 | 16.3% |
| 65 to 74 Years | 2,123 | 14.8% |
| 75 to 84 Years | 980 | 6.8% |
| 85 Years and Over | 549 | 3.8% |
| Total | 14,339 | 100.0% |
Housing Finances in Valparaiso
Median Income by Occupancy in Valparaiso
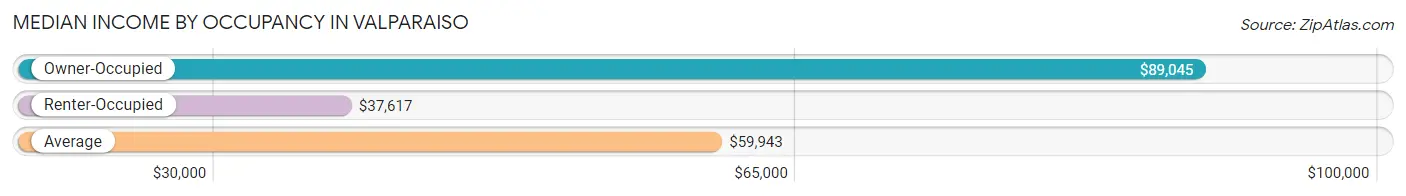
| Occupancy Type | # Households | Median Income |
| Owner-Occupied | 7,983 (55.7%) | $89,045 |
| Renter-Occupied | 6,356 (44.3%) | $37,617 |
| Average | 14,339 (100.0%) | $59,943 |
Occupancy by Householder Income Bracket in Valparaiso
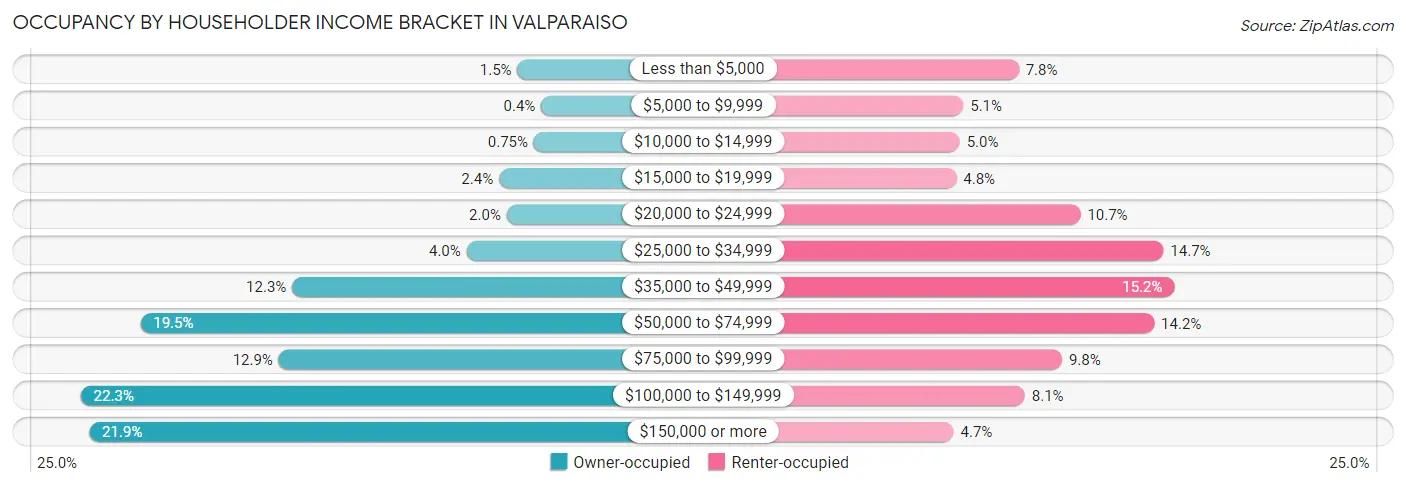
| Income Bracket | Owner-occupied | Renter-occupied |
| Less than $5,000 | 122 (1.5%) | 494 (7.8%) |
| $5,000 to $9,999 | 32 (0.4%) | 326 (5.1%) |
| $10,000 to $14,999 | 60 (0.7%) | 315 (5.0%) |
| $15,000 to $19,999 | 192 (2.4%) | 305 (4.8%) |
| $20,000 to $24,999 | 163 (2.0%) | 681 (10.7%) |
| $25,000 to $34,999 | 315 (4.0%) | 932 (14.7%) |
| $35,000 to $49,999 | 979 (12.3%) | 965 (15.2%) |
| $50,000 to $74,999 | 1,556 (19.5%) | 904 (14.2%) |
| $75,000 to $99,999 | 1,030 (12.9%) | 625 (9.8%) |
| $100,000 to $149,999 | 1,783 (22.3%) | 512 (8.1%) |
| $150,000 or more | 1,751 (21.9%) | 297 (4.7%) |
| Total | 7,983 (100.0%) | 6,356 (100.0%) |
Monthly Housing Cost Tiers in Valparaiso
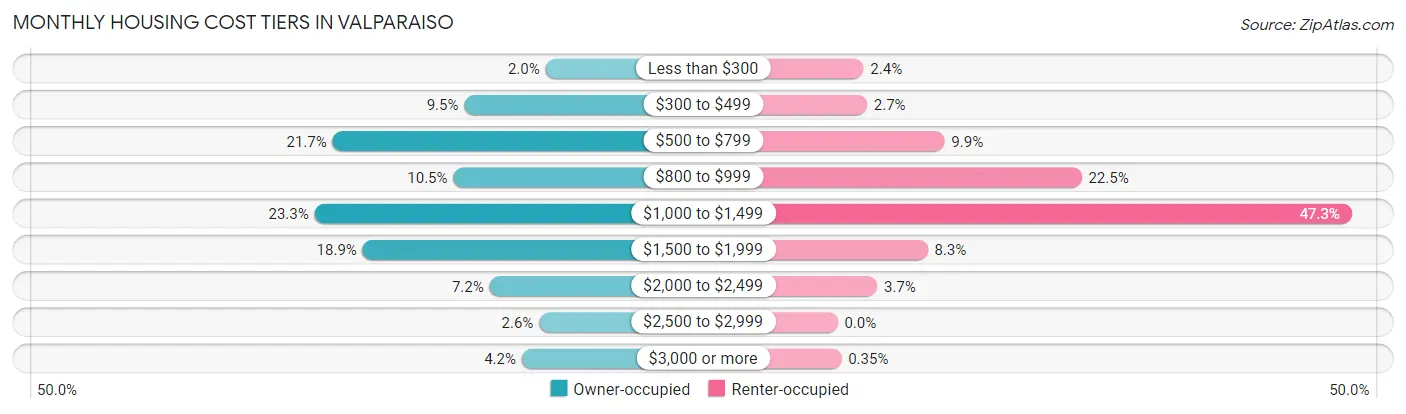
| Monthly Cost | Owner-occupied | Renter-occupied |
| Less than $300 | 163 (2.0%) | 152 (2.4%) |
| $300 to $499 | 760 (9.5%) | 172 (2.7%) |
| $500 to $799 | 1,728 (21.6%) | 626 (9.9%) |
| $800 to $999 | 841 (10.5%) | 1,428 (22.5%) |
| $1,000 to $1,499 | 1,861 (23.3%) | 3,009 (47.3%) |
| $1,500 to $1,999 | 1,507 (18.9%) | 527 (8.3%) |
| $2,000 to $2,499 | 575 (7.2%) | 232 (3.6%) |
| $2,500 to $2,999 | 210 (2.6%) | 0 (0.0%) |
| $3,000 or more | 338 (4.2%) | 22 (0.4%) |
| Total | 7,983 (100.0%) | 6,356 (100.0%) |
Physical Housing Characteristics in Valparaiso
Housing Structures in Valparaiso
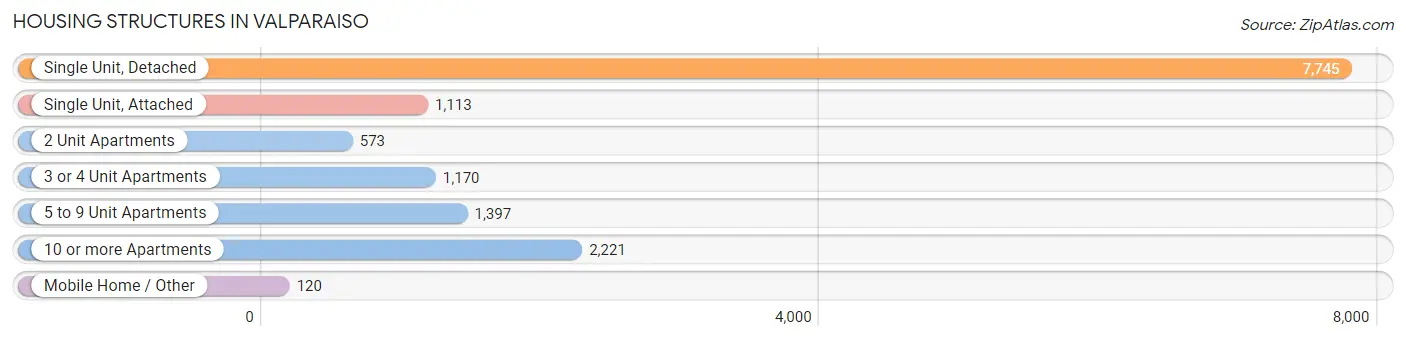
| Structure Type | # Housing Units | % Housing Units |
| Single Unit, Detached | 7,745 | 54.0% |
| Single Unit, Attached | 1,113 | 7.8% |
| 2 Unit Apartments | 573 | 4.0% |
| 3 or 4 Unit Apartments | 1,170 | 8.2% |
| 5 to 9 Unit Apartments | 1,397 | 9.7% |
| 10 or more Apartments | 2,221 | 15.5% |
| Mobile Home / Other | 120 | 0.8% |
| Total | 14,339 | 100.0% |
Housing Structures by Occupancy in Valparaiso
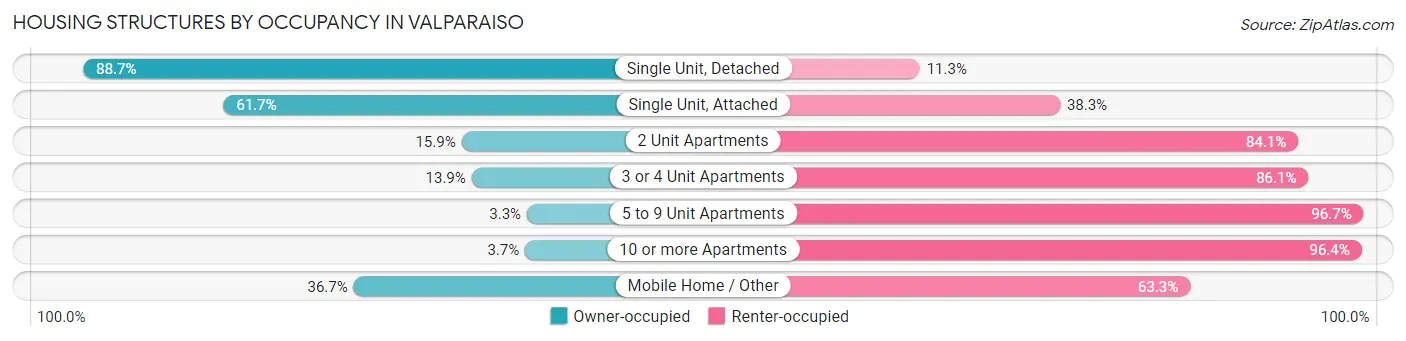
| Structure Type | Owner-occupied | Renter-occupied |
| Single Unit, Detached | 6,871 (88.7%) | 874 (11.3%) |
| Single Unit, Attached | 687 (61.7%) | 426 (38.3%) |
| 2 Unit Apartments | 91 (15.9%) | 482 (84.1%) |
| 3 or 4 Unit Apartments | 163 (13.9%) | 1,007 (86.1%) |
| 5 to 9 Unit Apartments | 46 (3.3%) | 1,351 (96.7%) |
| 10 or more Apartments | 81 (3.6%) | 2,140 (96.4%) |
| Mobile Home / Other | 44 (36.7%) | 76 (63.3%) |
| Total | 7,983 (55.7%) | 6,356 (44.3%) |
Housing Structures by Number of Rooms in Valparaiso
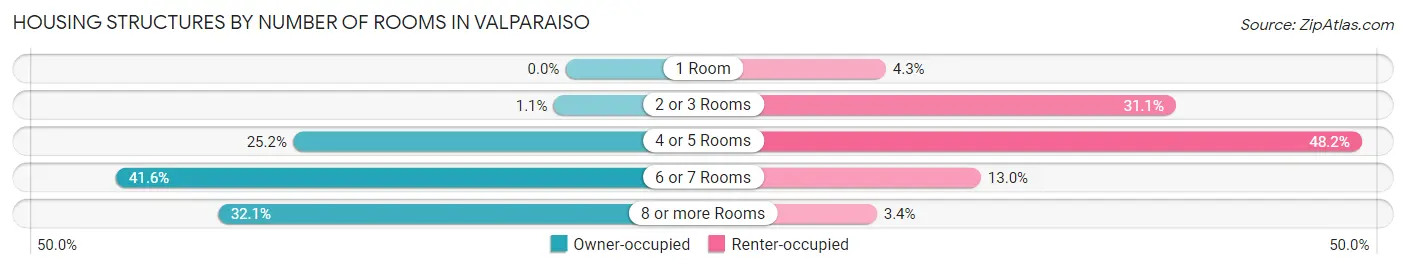
| Number of Rooms | Owner-occupied | Renter-occupied |
| 1 Room | 0 (0.0%) | 270 (4.3%) |
| 2 or 3 Rooms | 88 (1.1%) | 1,974 (31.1%) |
| 4 or 5 Rooms | 2,012 (25.2%) | 3,066 (48.2%) |
| 6 or 7 Rooms | 3,317 (41.5%) | 829 (13.0%) |
| 8 or more Rooms | 2,566 (32.1%) | 217 (3.4%) |
| Total | 7,983 (100.0%) | 6,356 (100.0%) |
Housing Structure by Heating Type in Valparaiso
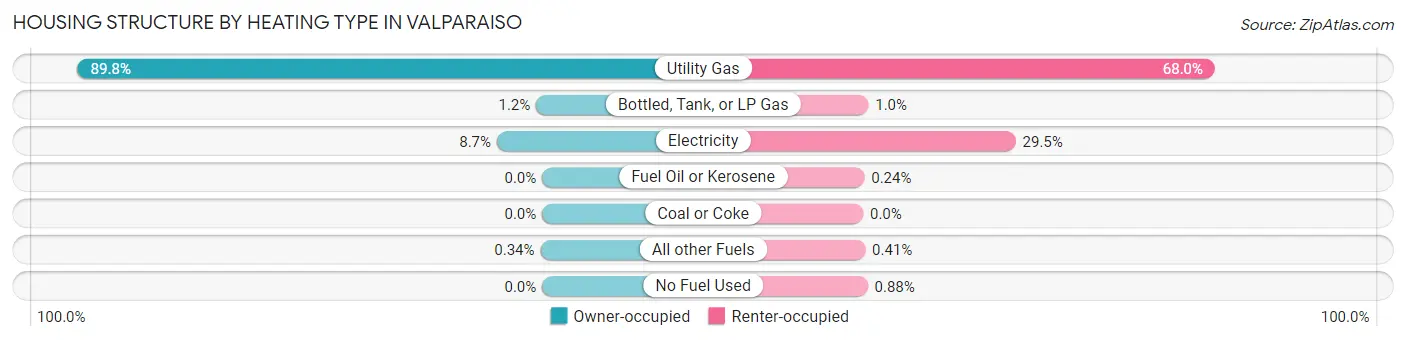
| Heating Type | Owner-occupied | Renter-occupied |
| Utility Gas | 7,165 (89.7%) | 4,321 (68.0%) |
| Bottled, Tank, or LP Gas | 93 (1.2%) | 64 (1.0%) |
| Electricity | 698 (8.7%) | 1,874 (29.5%) |
| Fuel Oil or Kerosene | 0 (0.0%) | 15 (0.2%) |
| Coal or Coke | 0 (0.0%) | 0 (0.0%) |
| All other Fuels | 27 (0.3%) | 26 (0.4%) |
| No Fuel Used | 0 (0.0%) | 56 (0.9%) |
| Total | 7,983 (100.0%) | 6,356 (100.0%) |
Household Vehicle Usage in Valparaiso
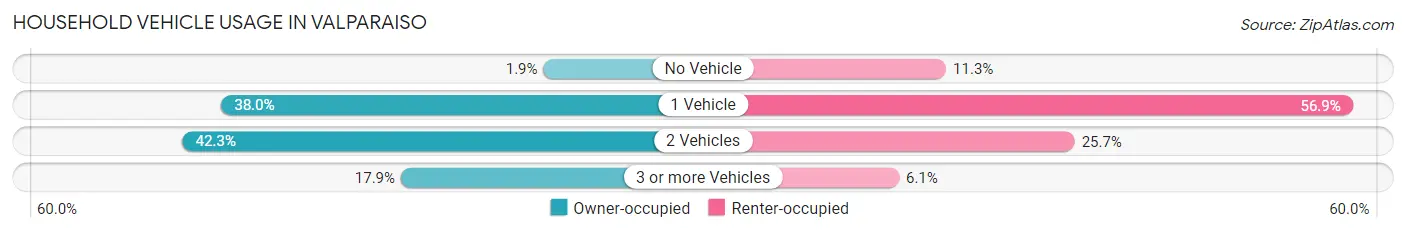
| Vehicles per Household | Owner-occupied | Renter-occupied |
| No Vehicle | 151 (1.9%) | 721 (11.3%) |
| 1 Vehicle | 3,030 (38.0%) | 3,614 (56.9%) |
| 2 Vehicles | 3,377 (42.3%) | 1,636 (25.7%) |
| 3 or more Vehicles | 1,425 (17.8%) | 385 (6.1%) |
| Total | 7,983 (100.0%) | 6,356 (100.0%) |
Real Estate & Mortgages in Valparaiso
Real Estate and Mortgage Overview in Valparaiso
| Characteristic | Without Mortgage | With Mortgage |
| Housing Units | 2,820 | 5,163 |
| Median Property Value | $219,800 | $236,000 |
| Median Household Income | $62,148 | $1,403 |
| Monthly Housing Costs | $568 | $327 |
| Real Estate Taxes | $2,353 | $58 |
Property Value by Mortgage Status in Valparaiso
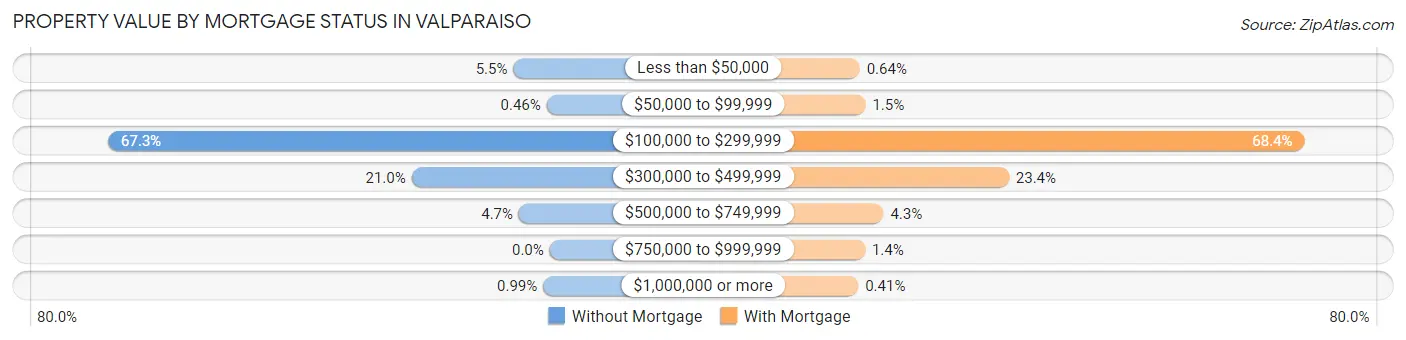
| Property Value | Without Mortgage | With Mortgage |
| Less than $50,000 | 156 (5.5%) | 33 (0.6%) |
| $50,000 to $99,999 | 13 (0.5%) | 78 (1.5%) |
| $100,000 to $299,999 | 1,898 (67.3%) | 3,531 (68.4%) |
| $300,000 to $499,999 | 593 (21.0%) | 1,206 (23.4%) |
| $500,000 to $749,999 | 132 (4.7%) | 220 (4.3%) |
| $750,000 to $999,999 | 0 (0.0%) | 74 (1.4%) |
| $1,000,000 or more | 28 (1.0%) | 21 (0.4%) |
| Total | 2,820 (100.0%) | 5,163 (100.0%) |
Household Income by Mortgage Status in Valparaiso
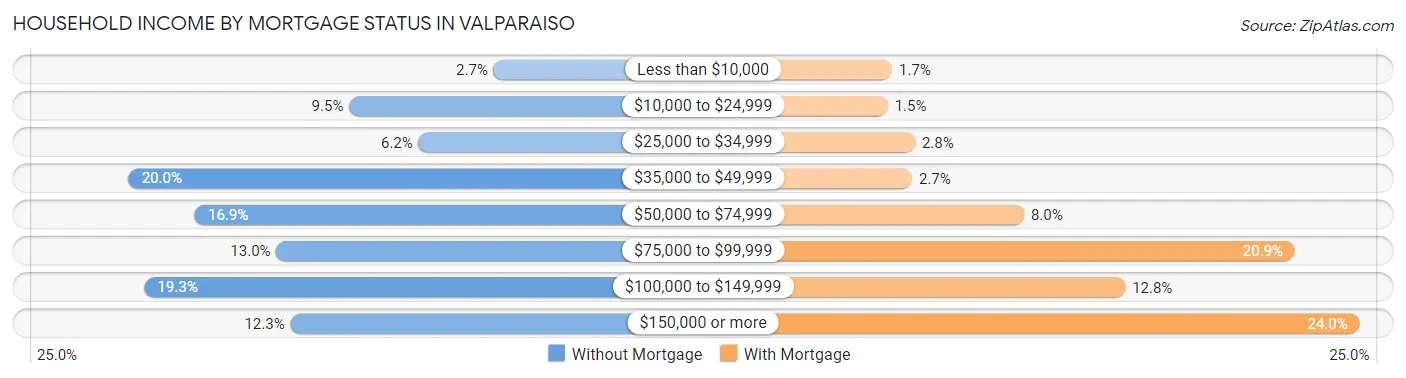
| Household Income | Without Mortgage | With Mortgage |
| Less than $10,000 | 75 (2.7%) | 90 (1.7%) |
| $10,000 to $24,999 | 269 (9.5%) | 79 (1.5%) |
| $25,000 to $34,999 | 176 (6.2%) | 146 (2.8%) |
| $35,000 to $49,999 | 565 (20.0%) | 139 (2.7%) |
| $50,000 to $74,999 | 476 (16.9%) | 414 (8.0%) |
| $75,000 to $99,999 | 367 (13.0%) | 1,080 (20.9%) |
| $100,000 to $149,999 | 544 (19.3%) | 663 (12.8%) |
| $150,000 or more | 348 (12.3%) | 1,239 (24.0%) |
| Total | 2,820 (100.0%) | 5,163 (100.0%) |
Property Value to Household Income Ratio in Valparaiso
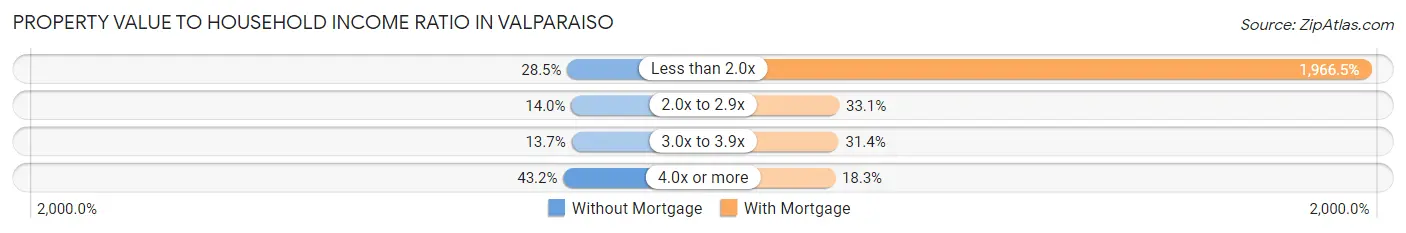
| Value-to-Income Ratio | Without Mortgage | With Mortgage |
| Less than 2.0x | 804 (28.5%) | 101,528 (1,966.5%) |
| 2.0x to 2.9x | 395 (14.0%) | 1,711 (33.1%) |
| 3.0x to 3.9x | 385 (13.7%) | 1,619 (31.4%) |
| 4.0x or more | 1,219 (43.2%) | 943 (18.3%) |
| Total | 2,820 (100.0%) | 5,163 (100.0%) |
Real Estate Taxes by Mortgage Status in Valparaiso
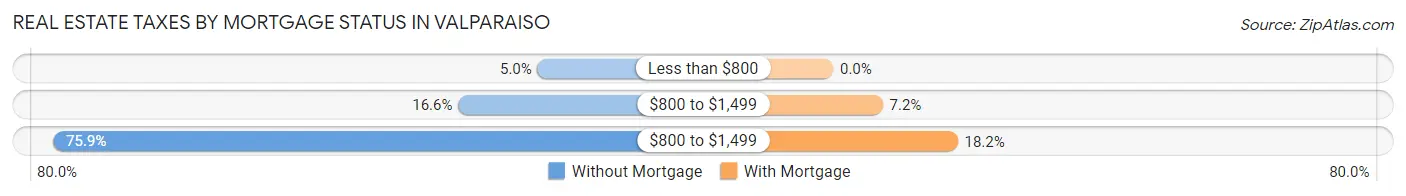
| Property Taxes | Without Mortgage | With Mortgage |
| Less than $800 | 142 (5.0%) | 0 (0.0%) |
| $800 to $1,499 | 469 (16.6%) | 374 (7.2%) |
| $800 to $1,499 | 2,139 (75.8%) | 939 (18.2%) |
| Total | 2,820 (100.0%) | 5,163 (100.0%) |
Health & Disability in Valparaiso
Health Insurance Coverage by Age in Valparaiso
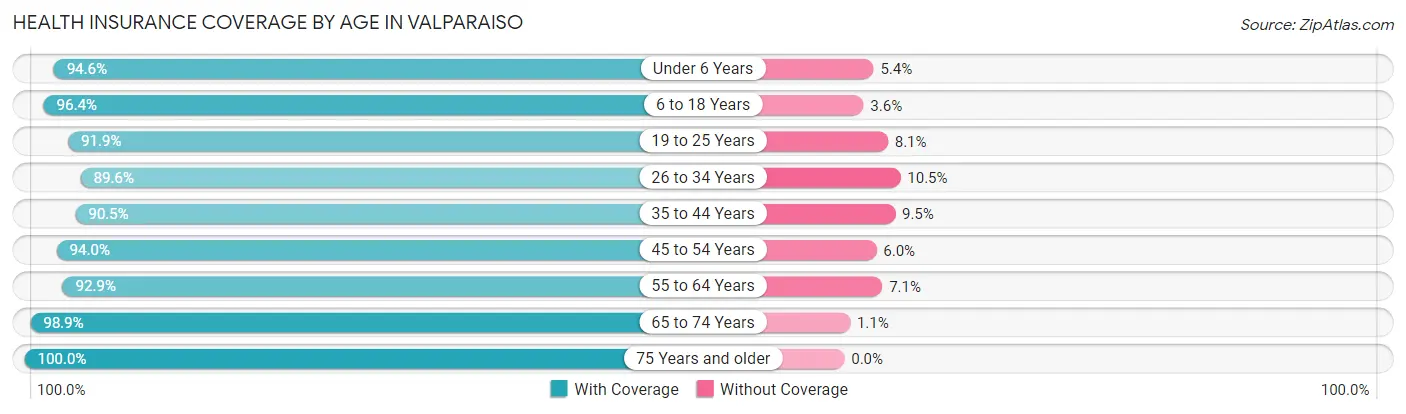
| Age Bracket | With Coverage | Without Coverage |
| Under 6 Years | 2,000 (94.6%) | 115 (5.4%) |
| 6 to 18 Years | 4,824 (96.4%) | 178 (3.6%) |
| 19 to 25 Years | 4,522 (91.9%) | 399 (8.1%) |
| 26 to 34 Years | 3,264 (89.5%) | 381 (10.4%) |
| 35 to 44 Years | 4,125 (90.5%) | 431 (9.5%) |
| 45 to 54 Years | 3,326 (94.0%) | 211 (6.0%) |
| 55 to 64 Years | 3,581 (92.9%) | 273 (7.1%) |
| 65 to 74 Years | 3,067 (98.9%) | 33 (1.1%) |
| 75 Years and older | 2,241 (100.0%) | 0 (0.0%) |
| Total | 30,950 (93.9%) | 2,021 (6.1%) |
Health Insurance Coverage by Citizenship Status in Valparaiso
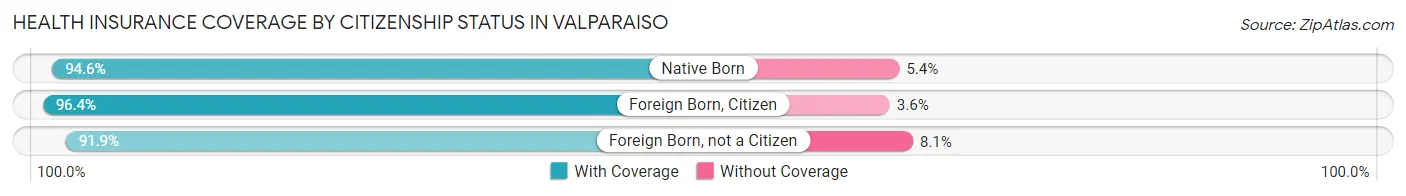
| Citizenship Status | With Coverage | Without Coverage |
| Native Born | 2,000 (94.6%) | 115 (5.4%) |
| Foreign Born, Citizen | 4,824 (96.4%) | 178 (3.6%) |
| Foreign Born, not a Citizen | 4,522 (91.9%) | 399 (8.1%) |
Health Insurance Coverage by Household Income in Valparaiso
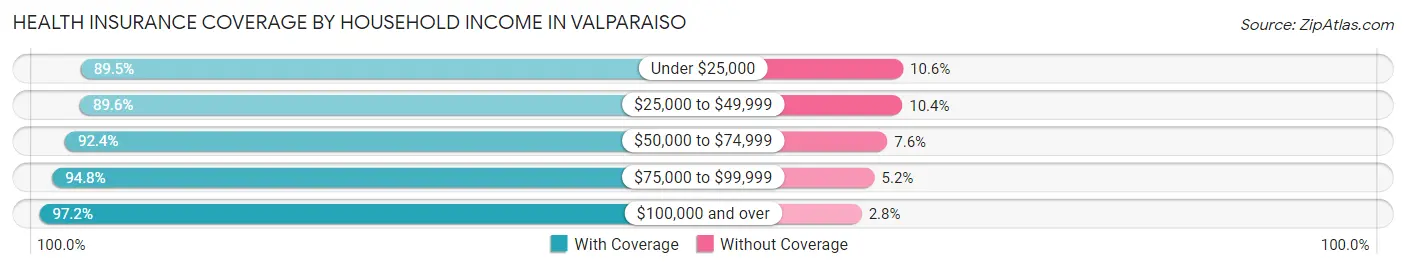
| Household Income | With Coverage | Without Coverage |
| Under $25,000 | 4,012 (89.4%) | 473 (10.5%) |
| $25,000 to $49,999 | 4,766 (89.6%) | 553 (10.4%) |
| $50,000 to $74,999 | 4,529 (92.4%) | 372 (7.6%) |
| $75,000 to $99,999 | 3,330 (94.8%) | 183 (5.2%) |
| $100,000 and over | 12,448 (97.2%) | 359 (2.8%) |
Public vs Private Health Insurance Coverage by Age in Valparaiso
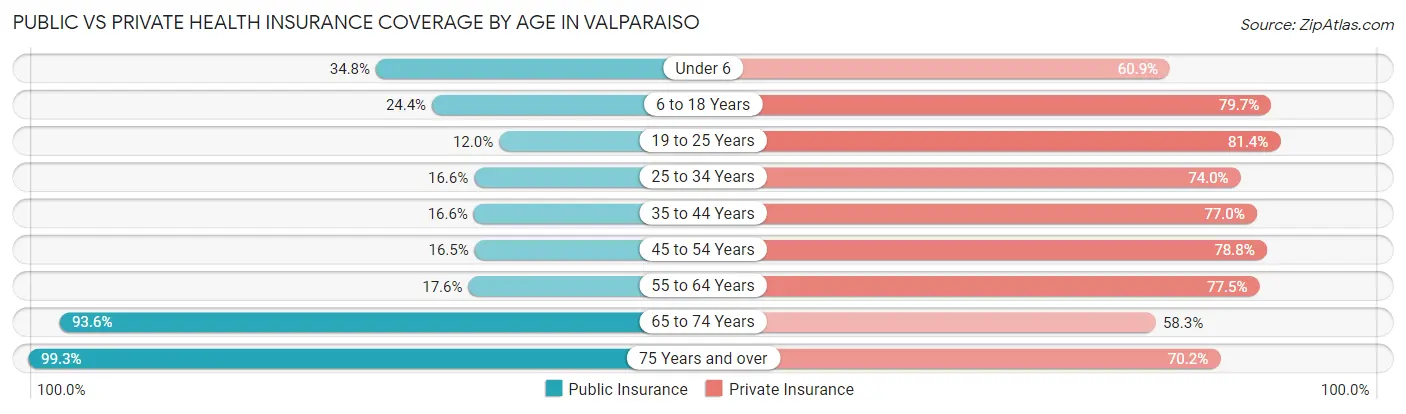
| Age Bracket | Public Insurance | Private Insurance |
| Under 6 | 736 (34.8%) | 1,288 (60.9%) |
| 6 to 18 Years | 1,220 (24.4%) | 3,985 (79.7%) |
| 19 to 25 Years | 588 (11.9%) | 4,003 (81.4%) |
| 25 to 34 Years | 604 (16.6%) | 2,697 (74.0%) |
| 35 to 44 Years | 758 (16.6%) | 3,507 (77.0%) |
| 45 to 54 Years | 583 (16.5%) | 2,788 (78.8%) |
| 55 to 64 Years | 680 (17.6%) | 2,986 (77.5%) |
| 65 to 74 Years | 2,902 (93.6%) | 1,808 (58.3%) |
| 75 Years and over | 2,226 (99.3%) | 1,573 (70.2%) |
| Total | 10,297 (31.2%) | 24,635 (74.7%) |
Disability Status by Sex by Age in Valparaiso
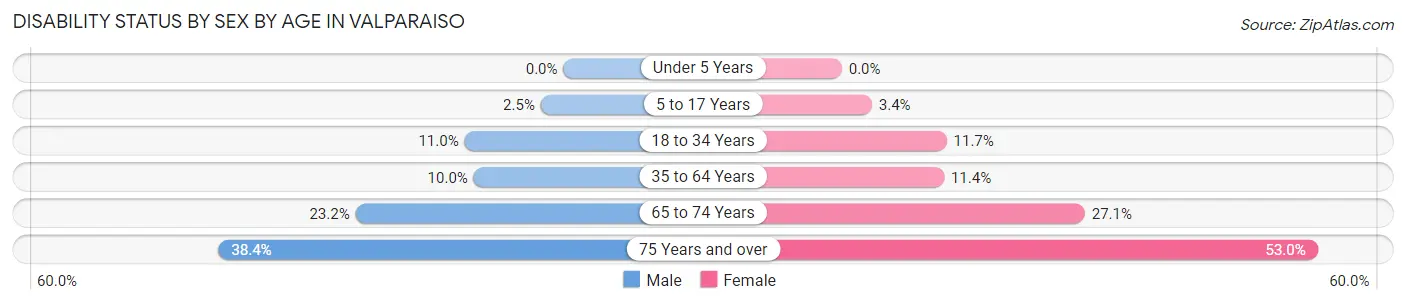
| Age Bracket | Male | Female |
| Under 5 Years | 0 (0.0%) | 0 (0.0%) |
| 5 to 17 Years | 56 (2.5%) | 83 (3.4%) |
| 18 to 34 Years | 486 (11.0%) | 569 (11.7%) |
| 35 to 64 Years | 572 (10.0%) | 708 (11.4%) |
| 65 to 74 Years | 313 (23.2%) | 473 (27.1%) |
| 75 Years and over | 333 (38.4%) | 728 (53.0%) |
Disability Class by Sex by Age in Valparaiso
Disability Class: Hearing Difficulty
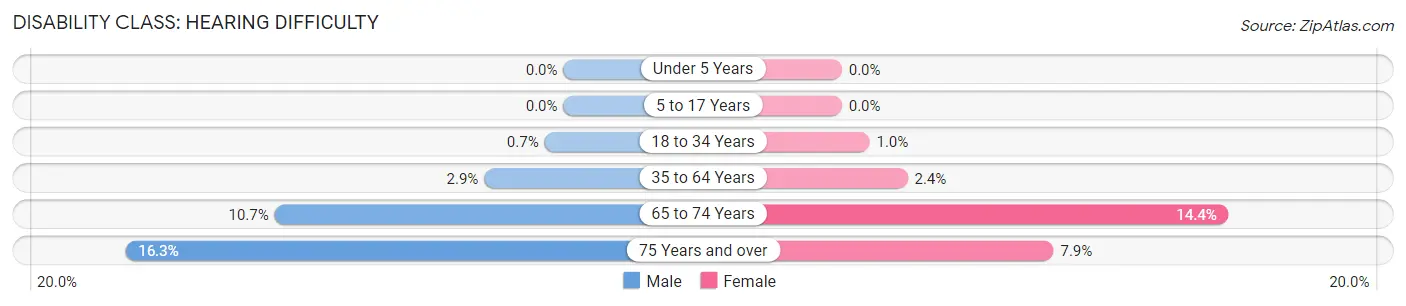
| Age Bracket | Male | Female |
| Under 5 Years | 0 (0.0%) | 0 (0.0%) |
| 5 to 17 Years | 0 (0.0%) | 0 (0.0%) |
| 18 to 34 Years | 31 (0.7%) | 50 (1.0%) |
| 35 to 64 Years | 168 (2.9%) | 152 (2.4%) |
| 65 to 74 Years | 145 (10.7%) | 251 (14.4%) |
| 75 Years and over | 141 (16.3%) | 108 (7.9%) |
Disability Class: Vision Difficulty
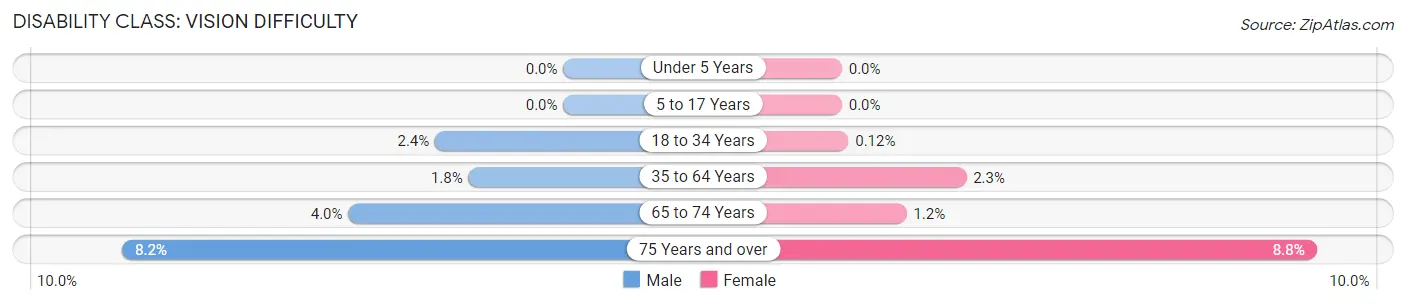
| Age Bracket | Male | Female |
| Under 5 Years | 0 (0.0%) | 0 (0.0%) |
| 5 to 17 Years | 0 (0.0%) | 0 (0.0%) |
| 18 to 34 Years | 105 (2.4%) | 6 (0.1%) |
| 35 to 64 Years | 101 (1.8%) | 144 (2.3%) |
| 65 to 74 Years | 54 (4.0%) | 21 (1.2%) |
| 75 Years and over | 71 (8.2%) | 121 (8.8%) |
Disability Class: Cognitive Difficulty
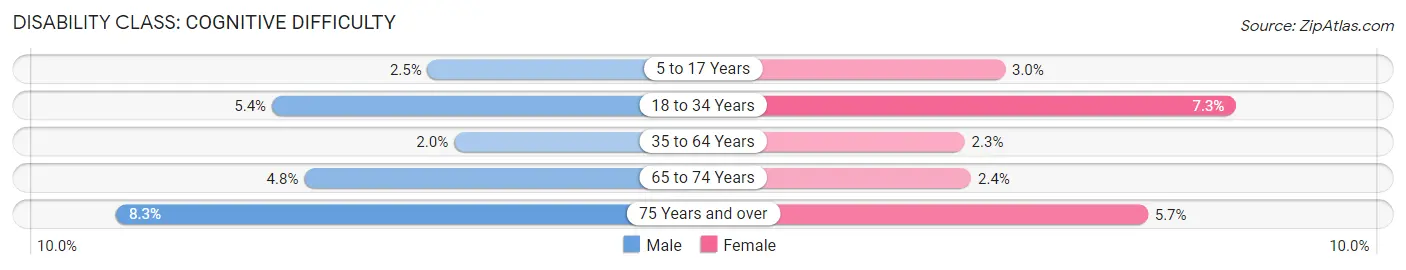
| Age Bracket | Male | Female |
| 5 to 17 Years | 56 (2.5%) | 75 (3.0%) |
| 18 to 34 Years | 239 (5.4%) | 357 (7.3%) |
| 35 to 64 Years | 116 (2.0%) | 142 (2.3%) |
| 65 to 74 Years | 65 (4.8%) | 42 (2.4%) |
| 75 Years and over | 72 (8.3%) | 78 (5.7%) |
Disability Class: Ambulatory Difficulty
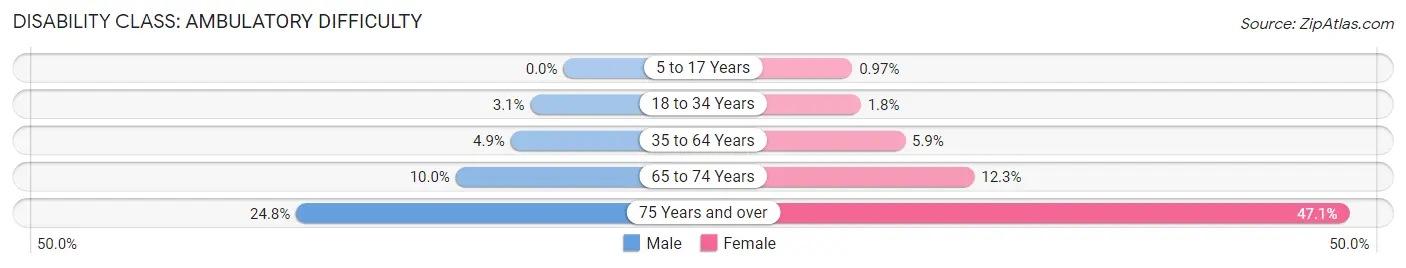
| Age Bracket | Male | Female |
| 5 to 17 Years | 0 (0.0%) | 24 (1.0%) |
| 18 to 34 Years | 135 (3.1%) | 86 (1.8%) |
| 35 to 64 Years | 280 (4.9%) | 365 (5.9%) |
| 65 to 74 Years | 135 (10.0%) | 215 (12.3%) |
| 75 Years and over | 215 (24.8%) | 647 (47.1%) |
Disability Class: Self-Care Difficulty
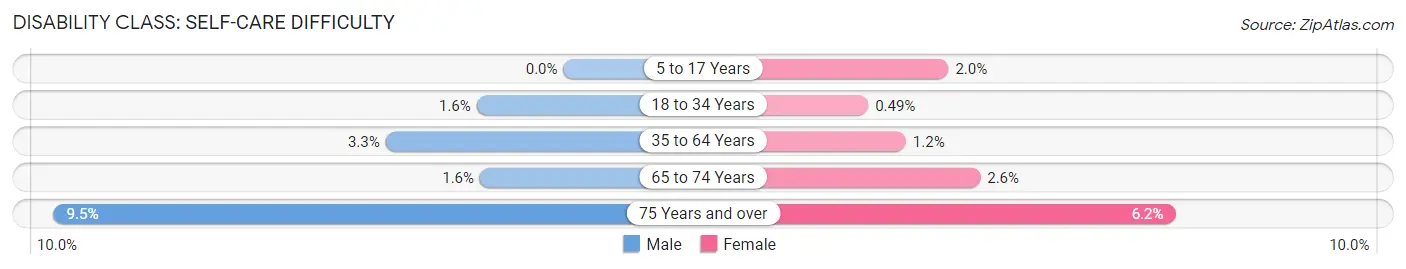
| Age Bracket | Male | Female |
| 5 to 17 Years | 0 (0.0%) | 49 (2.0%) |
| 18 to 34 Years | 71 (1.6%) | 24 (0.5%) |
| 35 to 64 Years | 189 (3.3%) | 74 (1.2%) |
| 65 to 74 Years | 21 (1.5%) | 45 (2.6%) |
| 75 Years and over | 82 (9.5%) | 85 (6.2%) |
Technology Access in Valparaiso
Computing Device Access in Valparaiso
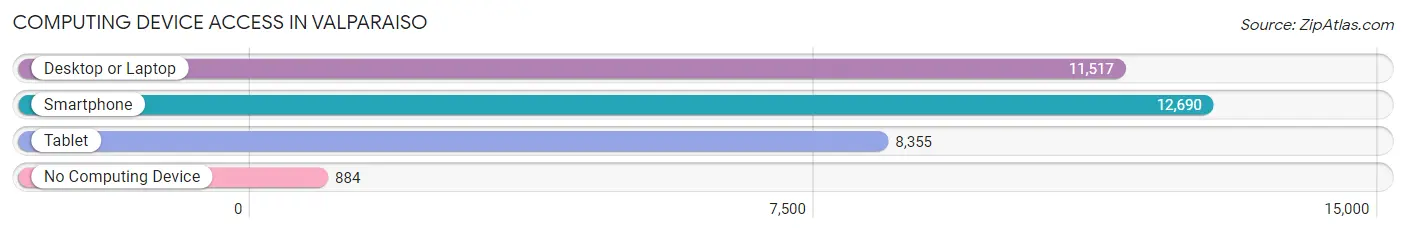
| Device Type | # Households | % Households |
| Desktop or Laptop | 11,517 | 80.3% |
| Smartphone | 12,690 | 88.5% |
| Tablet | 8,355 | 58.3% |
| No Computing Device | 884 | 6.2% |
| Total | 14,339 | 100.0% |
Internet Access in Valparaiso
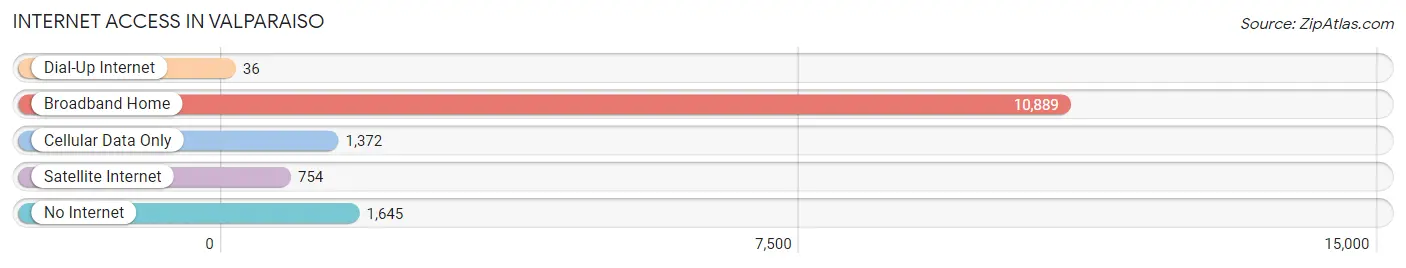
| Internet Type | # Households | % Households |
| Dial-Up Internet | 36 | 0.3% |
| Broadband Home | 10,889 | 75.9% |
| Cellular Data Only | 1,372 | 9.6% |
| Satellite Internet | 754 | 5.3% |
| No Internet | 1,645 | 11.5% |
| Total | 14,339 | 100.0% |
Valparaiso Summary
Valparaiso, Indiana is a city located in Porter County, Indiana, United States. It is the county seat of Porter County and is located in the northwest corner of the state. The city is part of the Chicago metropolitan area and is located approximately 50 miles southeast of Chicago. As of the 2010 census, the city had a population of 31,730.
History
Valparaiso was founded in 1836 by a group of settlers from New England. The city was named after Valparaiso, Chile, which was the hometown of one of the settlers. The city was incorporated in 1851 and was the county seat of Porter County.
Valparaiso was an important stop on the Underground Railroad, and the city was a major center for abolitionist activity. During the Civil War, the city was a major center for Union recruitment and training.
In the late 19th century, Valparaiso was a major center for the production of bricks and tile. The city was also home to several large manufacturing companies, including the Valparaiso Manufacturing Company, which produced agricultural implements.
Geography
Valparaiso is located in the northwest corner of Indiana, approximately 50 miles southeast of Chicago. The city is situated on the Valparaiso Moraine, a ridge of glacial deposits that runs through the area. The city is located on the Kankakee River, which flows through the city and into Lake Michigan.
The city has a total area of 16.2 square miles, of which 15.9 square miles is land and 0.3 square miles is water.
Economy
Valparaiso is a major center for manufacturing and industry. The city is home to several large companies, including the Valparaiso Manufacturing Company, which produces agricultural implements, and the Valparaiso Foundry, which produces castings for the automotive industry.
The city is also home to several educational institutions, including Valparaiso University, which is a private university, and Ivy Tech Community College, which is a public two-year college.
Demographics
As of the 2010 census, the city had a population of 31,730. The racial makeup of the city was 87.3% White, 5.7% African American, 0.4% Native American, 1.7% Asian, 0.1% Pacific Islander, 2.2% from other races, and 2.6% from two or more races. Hispanic or Latino of any race were 6.3% of the population.
The median income for a household in the city was $50,945, and the median income for a family was $63,945. The per capita income for the city was $25,945. About 8.3% of families and 11.2% of the population were below the poverty line, including 15.2% of those under age 18 and 6.2% of those age 65 or over.
Common Questions
What is Per Capita Income in Valparaiso?
Per Capita income in Valparaiso is $36,719.
What is the Median Family Income in Valparaiso?
Median Family Income in Valparaiso is $90,210.
What is the Median Household income in Valparaiso?
Median Household Income in Valparaiso is $59,943.
What is Income or Wage Gap in Valparaiso?
Income or Wage Gap in Valparaiso is 41.5%.
Women in Valparaiso earn 58.5 cents for every dollar earned by a man.
What is Inequality or Gini Index in Valparaiso?
Inequality or Gini Index in Valparaiso is 0.46.
What is the Total Population of Valparaiso?
Total Population of Valparaiso is 33,991.
What is the Total Male Population of Valparaiso?
Total Male Population of Valparaiso is 16,047.
What is the Total Female Population of Valparaiso?
Total Female Population of Valparaiso is 17,944.
What is the Ratio of Males per 100 Females in Valparaiso?
There are 89.43 Males per 100 Females in Valparaiso.
What is the Ratio of Females per 100 Males in Valparaiso?
There are 111.82 Females per 100 Males in Valparaiso.
What is the Median Population Age in Valparaiso?
Median Population Age in Valparaiso is 36.8 Years.
What is the Average Family Size in Valparaiso
Average Family Size in Valparaiso is 2.9 People.
What is the Average Household Size in Valparaiso
Average Household Size in Valparaiso is 2.2 People.
How Large is the Labor Force in Valparaiso?
There are 17,212 People in the Labor Forcein in Valparaiso.
What is the Percentage of People in the Labor Force in Valparaiso?
60.6% of People are in the Labor Force in Valparaiso.
What is the Unemployment Rate in Valparaiso?
Unemployment Rate in Valparaiso is 3.0%.