Jeffersonville, IN Map & Demographics
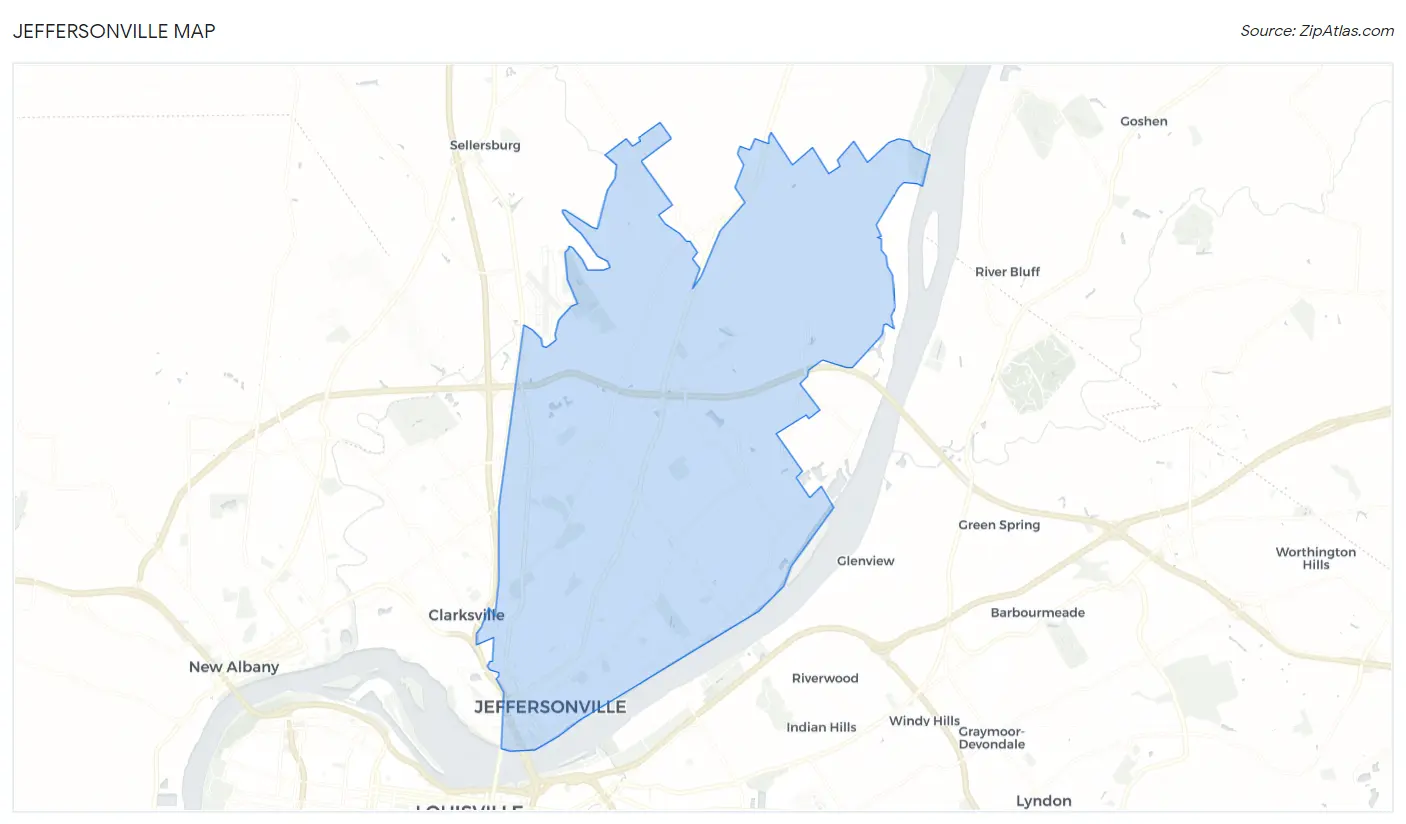
Jeffersonville Map
Jeffersonville Overview
$34,587
PER CAPITA INCOME
$75,826
AVG FAMILY INCOME
$67,566
AVG HOUSEHOLD INCOME
17.9%
WAGE / INCOME GAP [ % ]
82.1¢/ $1
WAGE / INCOME GAP [ $ ]
$8,235
FAMILY INCOME DEFICIT
0.40
INEQUALITY / GINI INDEX
49,771
TOTAL POPULATION
24,601
MALE POPULATION
25,170
FEMALE POPULATION
97.74
MALES / 100 FEMALES
102.31
FEMALES / 100 MALES
38.6
MEDIAN AGE
3.0
AVG FAMILY SIZE
2.4
AVG HOUSEHOLD SIZE
26,516
LABOR FORCE [ PEOPLE ]
66.2%
PERCENT IN LABOR FORCE
3.6%
UNEMPLOYMENT RATE
Jeffersonville Zip Codes
Jeffersonville Area Codes
Income in Jeffersonville
Income Overview in Jeffersonville
Per Capita Income in Jeffersonville is $34,587, while median incomes of families and households are $75,826 and $67,566 respectively.
| Characteristic | Number | Measure |
| Per Capita Income | 49,771 | $34,587 |
| Median Family Income | 12,921 | $75,826 |
| Mean Family Income | 12,921 | $92,980 |
| Median Household Income | 20,411 | $67,566 |
| Mean Household Income | 20,411 | $81,411 |
| Income Deficit | 12,921 | $8,235 |
| Wage / Income Gap (%) | 49,771 | 17.90% |
| Wage / Income Gap ($) | 49,771 | 82.10¢ per $1 |
| Gini / Inequality Index | 49,771 | 0.40 |
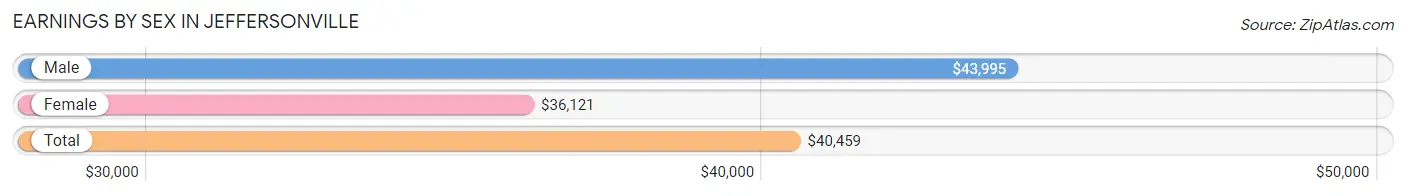
Earnings by Sex in Jeffersonville
Average Earnings in Jeffersonville are $40,459, $43,995 for men and $36,121 for women, a difference of 17.9%.
| Sex | Number | Average Earnings |
| Male | 14,377 (51.6%) | $43,995 |
| Female | 13,509 (48.4%) | $36,121 |
| Total | 27,886 (100.0%) | $40,459 |
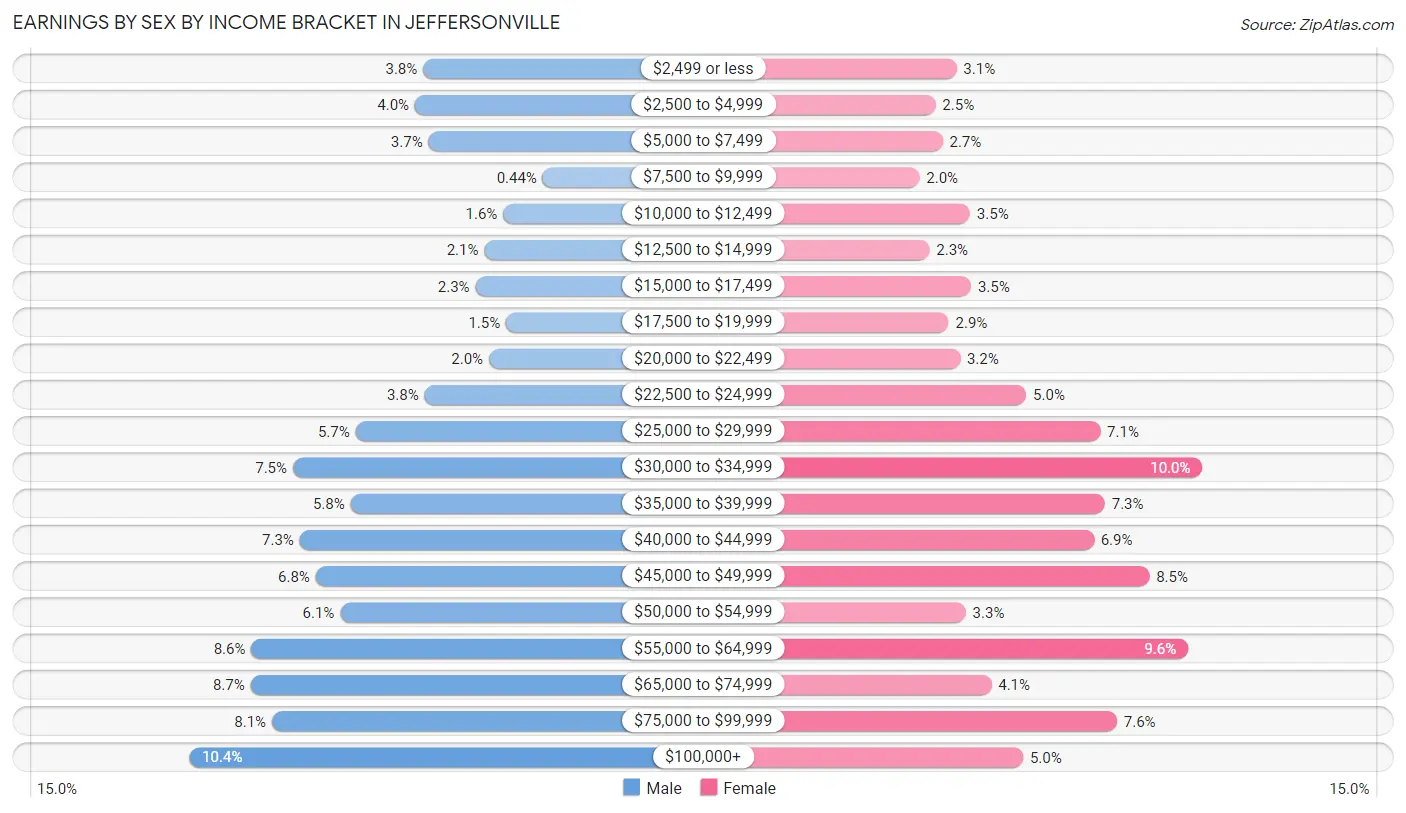
Earnings by Sex by Income Bracket in Jeffersonville
The most common earnings brackets in Jeffersonville are $100,000+ for men (1,492 | 10.4%) and $30,000 to $34,999 for women (1,349 | 10.0%).
| Income | Male | Female |
| $2,499 or less | 546 (3.8%) | 416 (3.1%) |
| $2,500 to $4,999 | 580 (4.0%) | 337 (2.5%) |
| $5,000 to $7,499 | 525 (3.6%) | 364 (2.7%) |
| $7,500 to $9,999 | 63 (0.4%) | 276 (2.0%) |
| $10,000 to $12,499 | 223 (1.5%) | 468 (3.5%) |
| $12,500 to $14,999 | 299 (2.1%) | 314 (2.3%) |
| $15,000 to $17,499 | 335 (2.3%) | 471 (3.5%) |
| $17,500 to $19,999 | 211 (1.5%) | 386 (2.9%) |
| $20,000 to $22,499 | 281 (1.9%) | 430 (3.2%) |
| $22,500 to $24,999 | 540 (3.8%) | 681 (5.0%) |
| $25,000 to $29,999 | 820 (5.7%) | 962 (7.1%) |
| $30,000 to $34,999 | 1,073 (7.5%) | 1,349 (10.0%) |
| $35,000 to $39,999 | 840 (5.8%) | 979 (7.2%) |
| $40,000 to $44,999 | 1,045 (7.3%) | 937 (6.9%) |
| $45,000 to $49,999 | 981 (6.8%) | 1,148 (8.5%) |
| $50,000 to $54,999 | 881 (6.1%) | 451 (3.3%) |
| $55,000 to $64,999 | 1,241 (8.6%) | 1,296 (9.6%) |
| $65,000 to $74,999 | 1,244 (8.6%) | 549 (4.1%) |
| $75,000 to $99,999 | 1,157 (8.1%) | 1,026 (7.6%) |
| $100,000+ | 1,492 (10.4%) | 669 (5.0%) |
| Total | 14,377 (100.0%) | 13,509 (100.0%) |
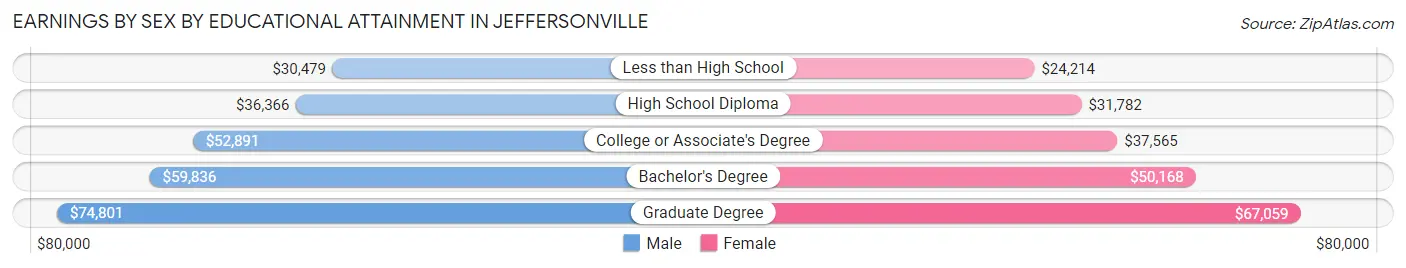
Earnings by Sex by Educational Attainment in Jeffersonville
Average earnings in Jeffersonville are $47,823 for men and $40,053 for women, a difference of 16.3%. Men with an educational attainment of graduate degree enjoy the highest average annual earnings of $74,801, while those with less than high school education earn the least with $30,479. Women with an educational attainment of graduate degree earn the most with the average annual earnings of $67,059, while those with less than high school education have the smallest earnings of $24,214.
| Educational Attainment | Male Income | Female Income |
| Less than High School | $30,479 | $24,214 |
| High School Diploma | $36,366 | $31,782 |
| College or Associate's Degree | $52,891 | $37,565 |
| Bachelor's Degree | $59,836 | $50,168 |
| Graduate Degree | $74,801 | $67,059 |
| Total | $47,823 | $40,053 |
Family Income in Jeffersonville
Family Income Brackets in Jeffersonville
According to the Jeffersonville family income data, there are 3,049 families falling into the $50,000 to $74,999 income range, which is the most common income bracket and makes up 23.6% of all families. Conversely, the less than $10,000 income bracket is the least frequent group with only 220 families (1.7%) belonging to this category.
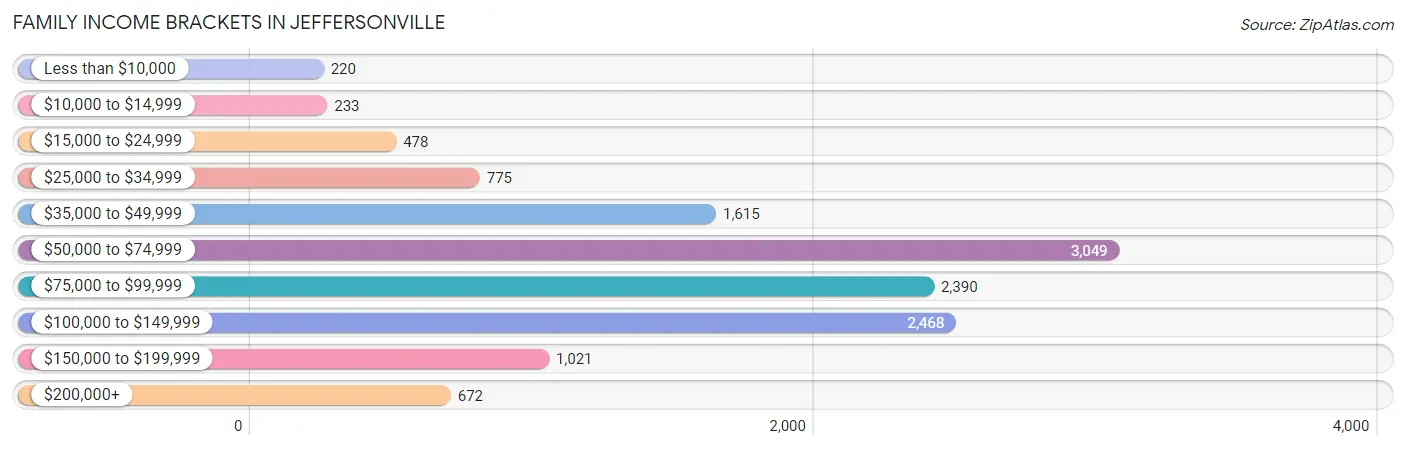
| Income Bracket | # Families | % Families |
| Less than $10,000 | 220 | 1.7% |
| $10,000 to $14,999 | 233 | 1.8% |
| $15,000 to $24,999 | 478 | 3.7% |
| $25,000 to $34,999 | 775 | 6.0% |
| $35,000 to $49,999 | 1,615 | 12.5% |
| $50,000 to $74,999 | 3,049 | 23.6% |
| $75,000 to $99,999 | 2,390 | 18.5% |
| $100,000 to $149,999 | 2,468 | 19.1% |
| $150,000 to $199,999 | 1,021 | 7.9% |
| $200,000+ | 672 | 5.2% |
Family Income by Famaliy Size in Jeffersonville
7+ person families (184 | 1.4%) account for the highest median family income in Jeffersonville with $118,929 per family, while 2-person families (6,776 | 52.4%) have the highest median income of $36,034 per family member.
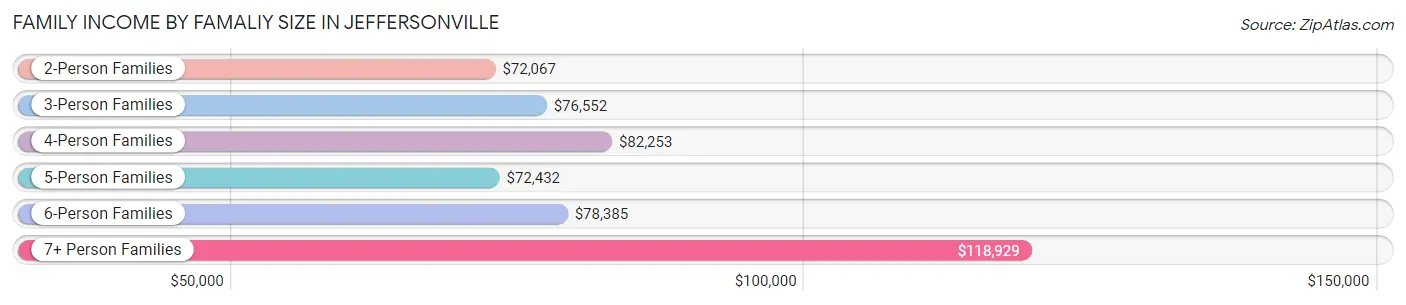
| Income Bracket | # Families | Median Income |
| 2-Person Families | 6,776 (52.4%) | $72,067 |
| 3-Person Families | 3,132 (24.2%) | $76,552 |
| 4-Person Families | 1,951 (15.1%) | $82,253 |
| 5-Person Families | 556 (4.3%) | $72,432 |
| 6-Person Families | 322 (2.5%) | $78,385 |
| 7+ Person Families | 184 (1.4%) | $118,929 |
| Total | 12,921 (100.0%) | $75,826 |
Family Income by Number of Earners in Jeffersonville
The median family income in Jeffersonville is $75,826, with families comprising 3+ earners (944) having the highest median family income of $115,909, while families with no earners (1,674) have the lowest median family income of $48,144, accounting for 7.3% and 13.0% of families, respectively.
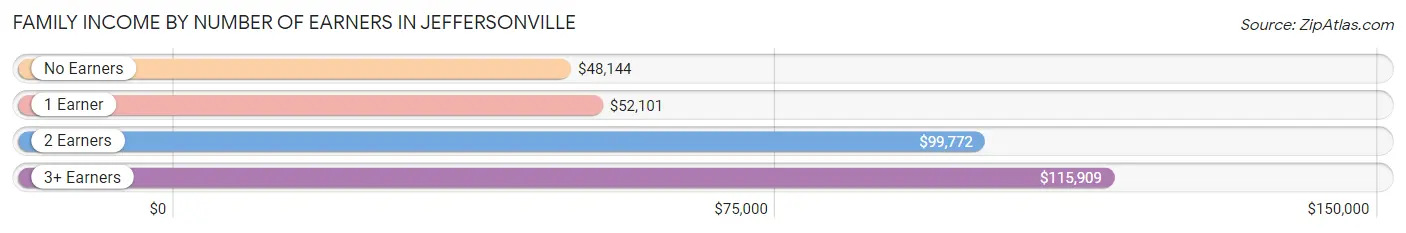
| Number of Earners | # Families | Median Income |
| No Earners | 1,674 (13.0%) | $48,144 |
| 1 Earner | 4,227 (32.7%) | $52,101 |
| 2 Earners | 6,076 (47.0%) | $99,772 |
| 3+ Earners | 944 (7.3%) | $115,909 |
| Total | 12,921 (100.0%) | $75,826 |
Household Income in Jeffersonville
Household Income Brackets in Jeffersonville
With 4,103 households falling in the category, the $50,000 to $74,999 income range is the most frequent in Jeffersonville, accounting for 20.1% of all households. In contrast, only 735 households (3.6%) fall into the less than $10,000 income bracket, making it the least populous group.
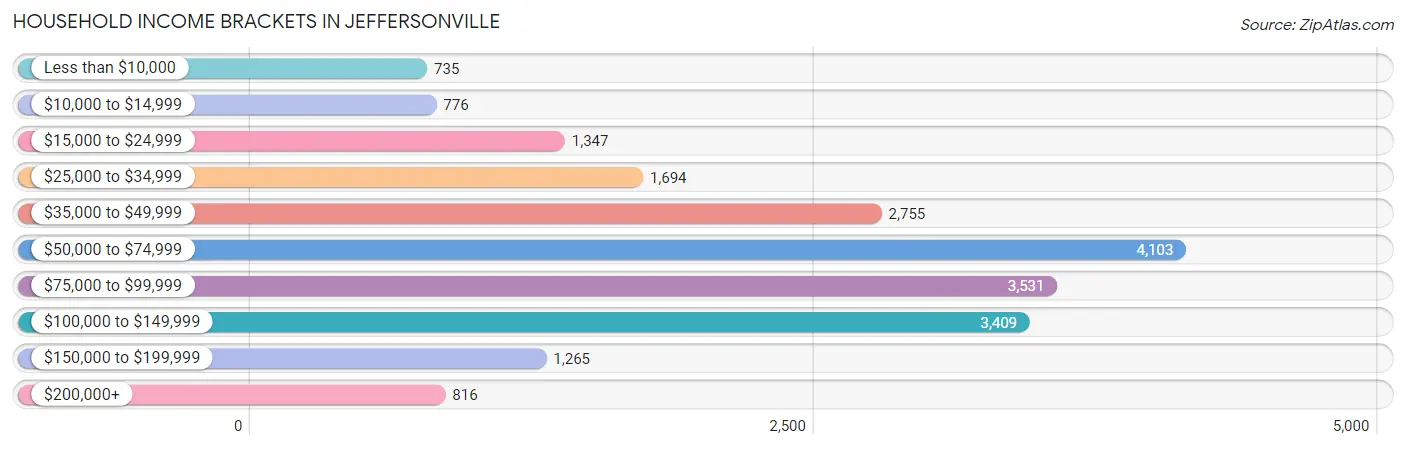
| Income Bracket | # Households | % Households |
| Less than $10,000 | 735 | 3.6% |
| $10,000 to $14,999 | 776 | 3.8% |
| $15,000 to $24,999 | 1,347 | 6.6% |
| $25,000 to $34,999 | 1,694 | 8.3% |
| $35,000 to $49,999 | 2,755 | 13.5% |
| $50,000 to $74,999 | 4,103 | 20.1% |
| $75,000 to $99,999 | 3,531 | 17.3% |
| $100,000 to $149,999 | 3,409 | 16.7% |
| $150,000 to $199,999 | 1,265 | 6.2% |
| $200,000+ | 816 | 4.0% |
Household Income by Householder Age in Jeffersonville
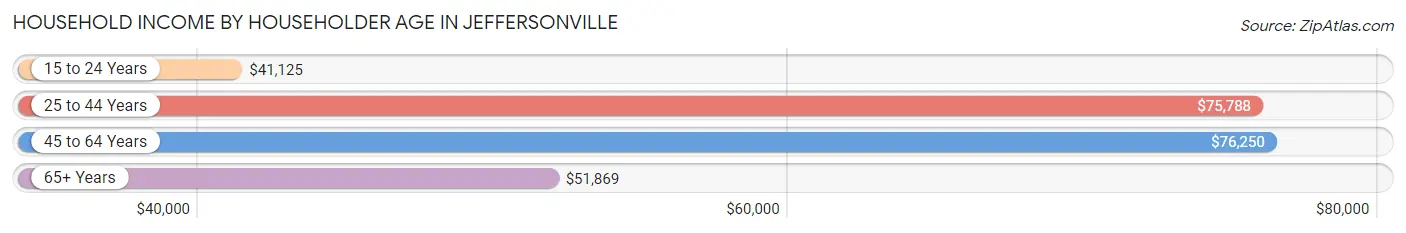
The median household income in Jeffersonville is $67,566, with the highest median household income of $76,250 found in the 45 to 64 years age bracket for the primary householder. A total of 7,275 households (35.6%) fall into this category. Meanwhile, the 15 to 24 years age bracket for the primary householder has the lowest median household income of $41,125, with 745 households (3.6%) in this group.
| Income Bracket | # Households | Median Income |
| 15 to 24 Years | 745 (3.6%) | $41,125 |
| 25 to 44 Years | 7,171 (35.1%) | $75,788 |
| 45 to 64 Years | 7,275 (35.6%) | $76,250 |
| 65+ Years | 5,220 (25.6%) | $51,869 |
| Total | 20,411 (100.0%) | $67,566 |
Poverty in Jeffersonville
Income Below Poverty by Sex and Age in Jeffersonville
With 11.9% poverty level for males and 9.1% for females among the residents of Jeffersonville, 16 and 17 year old males and 5 year old females are the most vulnerable to poverty, with 111 males (20.3%) and 110 females (42.3%) in their respective age groups living below the poverty level.
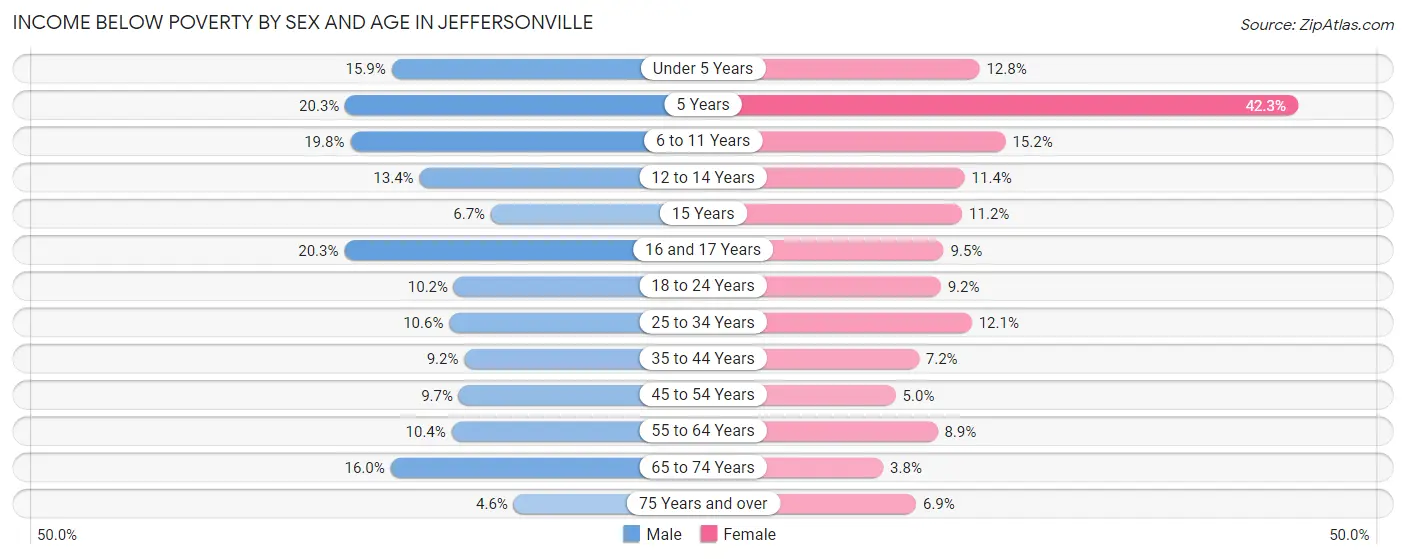
| Age Bracket | Male | Female |
| Under 5 Years | 243 (15.9%) | 193 (12.8%) |
| 5 Years | 99 (20.3%) | 110 (42.3%) |
| 6 to 11 Years | 300 (19.8%) | 270 (15.2%) |
| 12 to 14 Years | 119 (13.4%) | 87 (11.4%) |
| 15 Years | 24 (6.7%) | 23 (11.2%) |
| 16 and 17 Years | 111 (20.3%) | 50 (9.5%) |
| 18 to 24 Years | 193 (10.2%) | 176 (9.2%) |
| 25 to 34 Years | 384 (10.6%) | 449 (12.1%) |
| 35 to 44 Years | 306 (9.2%) | 228 (7.1%) |
| 45 to 54 Years | 283 (9.7%) | 163 (5.0%) |
| 55 to 64 Years | 343 (10.4%) | 278 (8.9%) |
| 65 to 74 Years | 378 (16.0%) | 106 (3.8%) |
| 75 Years and over | 50 (4.6%) | 129 (6.9%) |
| Total | 2,833 (11.9%) | 2,262 (9.1%) |
Income Above Poverty by Sex and Age in Jeffersonville
According to the poverty statistics in Jeffersonville, males aged 75 years and over and females aged 65 to 74 years are the age groups that are most secure financially, with 95.4% of males and 96.2% of females in these age groups living above the poverty line.
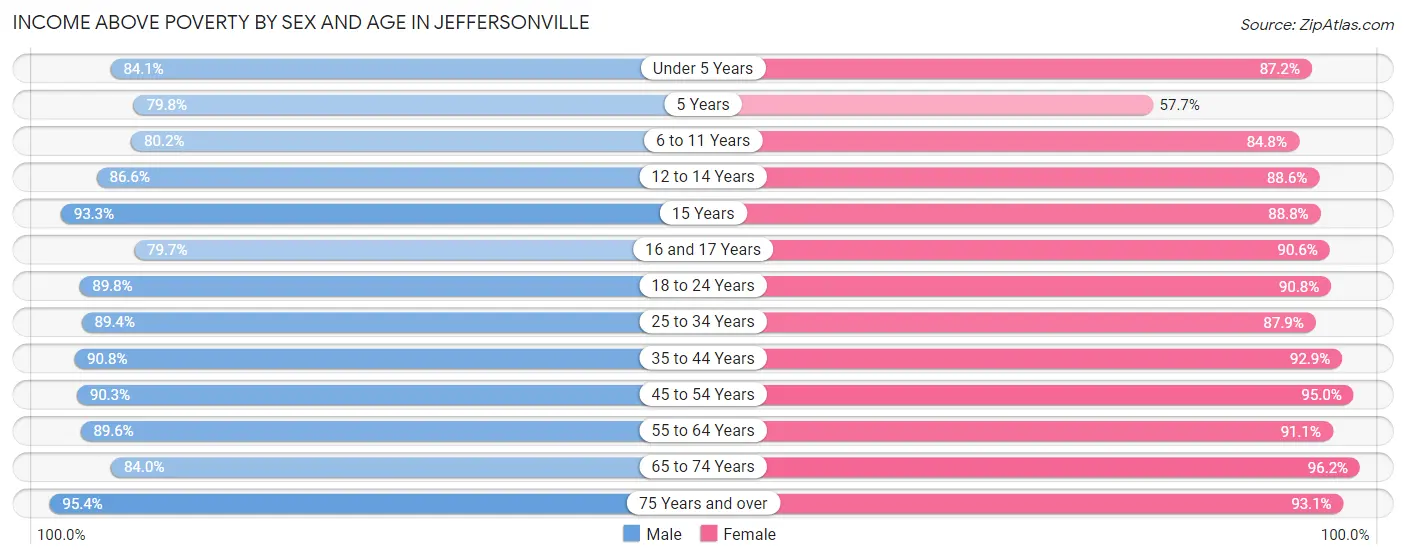
| Age Bracket | Male | Female |
| Under 5 Years | 1,281 (84.1%) | 1,317 (87.2%) |
| 5 Years | 390 (79.7%) | 150 (57.7%) |
| 6 to 11 Years | 1,217 (80.2%) | 1,507 (84.8%) |
| 12 to 14 Years | 772 (86.6%) | 676 (88.6%) |
| 15 Years | 333 (93.3%) | 183 (88.8%) |
| 16 and 17 Years | 435 (79.7%) | 479 (90.5%) |
| 18 to 24 Years | 1,707 (89.8%) | 1,742 (90.8%) |
| 25 to 34 Years | 3,242 (89.4%) | 3,275 (87.9%) |
| 35 to 44 Years | 3,023 (90.8%) | 2,960 (92.8%) |
| 45 to 54 Years | 2,635 (90.3%) | 3,099 (95.0%) |
| 55 to 64 Years | 2,964 (89.6%) | 2,851 (91.1%) |
| 65 to 74 Years | 1,979 (84.0%) | 2,657 (96.2%) |
| 75 Years and over | 1,035 (95.4%) | 1,742 (93.1%) |
| Total | 21,013 (88.1%) | 22,638 (90.9%) |
Income Below Poverty Among Married-Couple Families in Jeffersonville
The poverty statistics for married-couple families in Jeffersonville show that 3.8% or 349 of the total 9,110 families live below the poverty line. Families with 5 or more children have the highest poverty rate of 100.0%, comprising of 48 families. On the other hand, families with no children have the lowest poverty rate of 1.6%, which includes 87 families.
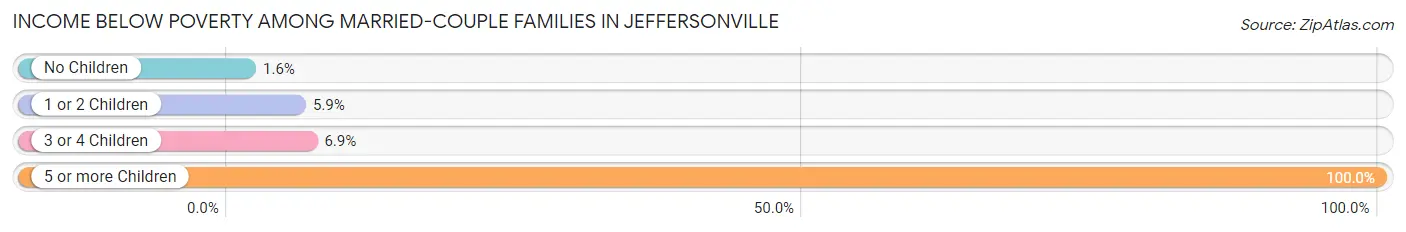
| Children | Above Poverty | Below Poverty |
| No Children | 5,469 (98.4%) | 87 (1.6%) |
| 1 or 2 Children | 2,645 (94.1%) | 166 (5.9%) |
| 3 or 4 Children | 647 (93.1%) | 48 (6.9%) |
| 5 or more Children | 0 (0.0%) | 48 (100.0%) |
| Total | 8,761 (96.2%) | 349 (3.8%) |
Income Below Poverty Among Single-Parent Households in Jeffersonville
According to the poverty data in Jeffersonville, 14.5% or 138 single-father households and 13.7% or 391 single-mother households are living below the poverty line. Among single-father households, those with 1 or 2 children have the highest poverty rate, with 127 households (23.2%) experiencing poverty. Likewise, among single-mother households, those with 3 or 4 children have the highest poverty rate, with 91 households (26.9%) falling below the poverty line.
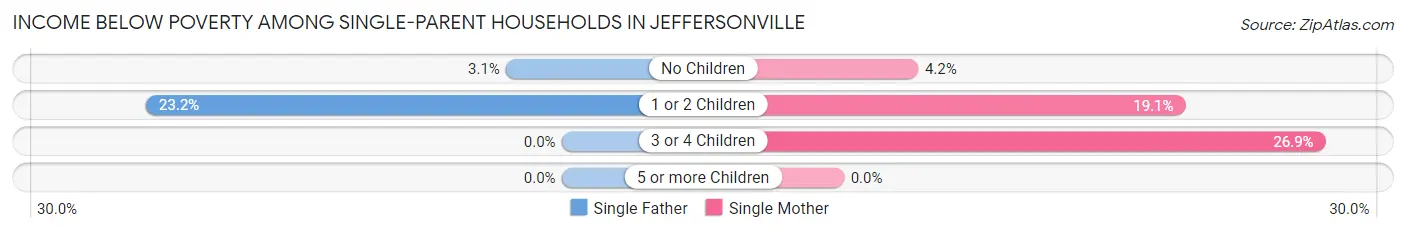
| Children | Single Father | Single Mother |
| No Children | 11 (3.1%) | 49 (4.2%) |
| 1 or 2 Children | 127 (23.2%) | 251 (19.1%) |
| 3 or 4 Children | 0 (0.0%) | 91 (26.9%) |
| 5 or more Children | 0 (0.0%) | 0 (0.0%) |
| Total | 138 (14.5%) | 391 (13.7%) |
Income Below Poverty Among Married-Couple vs Single-Parent Households in Jeffersonville
The poverty data for Jeffersonville shows that 349 of the married-couple family households (3.8%) and 529 of the single-parent households (13.9%) are living below the poverty level. Within the married-couple family households, those with 5 or more children have the highest poverty rate, with 48 households (100.0%) falling below the poverty line. Among the single-parent households, those with 3 or 4 children have the highest poverty rate, with 91 household (23.5%) living below poverty.
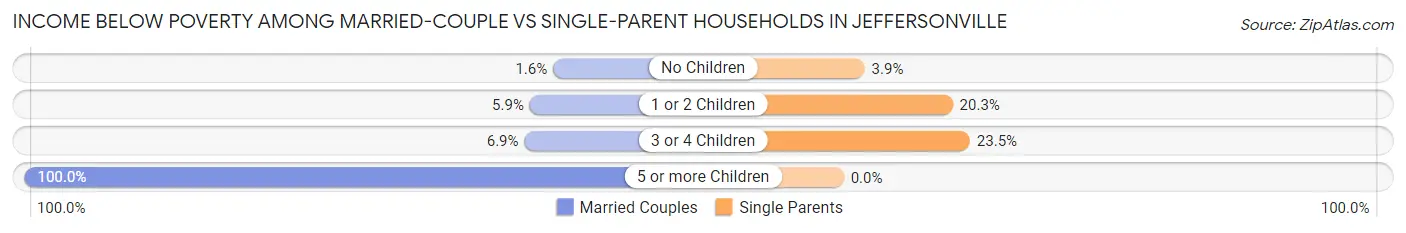
| Children | Married-Couple Families | Single-Parent Households |
| No Children | 87 (1.6%) | 60 (3.9%) |
| 1 or 2 Children | 166 (5.9%) | 378 (20.3%) |
| 3 or 4 Children | 48 (6.9%) | 91 (23.5%) |
| 5 or more Children | 48 (100.0%) | 0 (0.0%) |
| Total | 349 (3.8%) | 529 (13.9%) |
Race in Jeffersonville
The most populous races in Jeffersonville are White / Caucasian (38,316 | 77.0%), Black / African American (6,183 | 12.4%), and Two or more Races (3,806 | 7.6%).
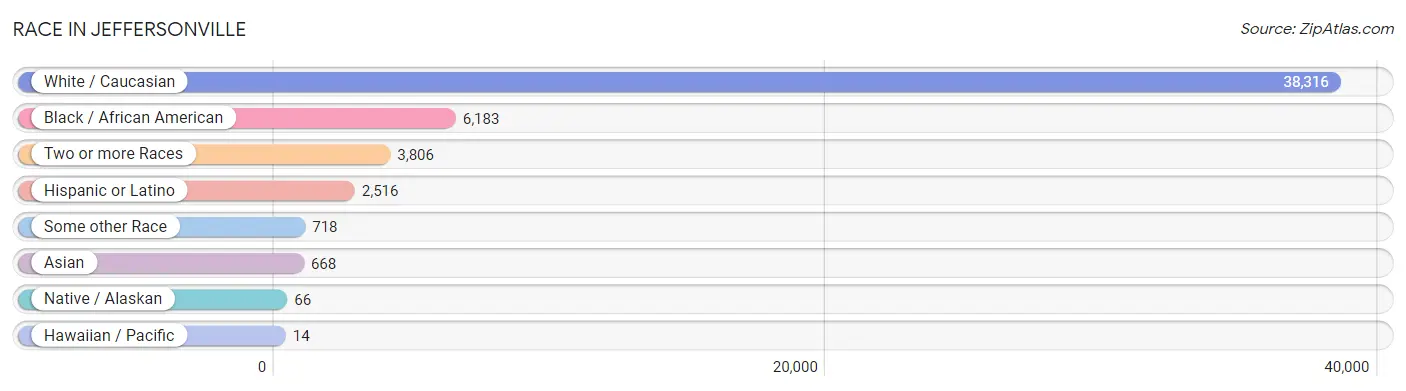
| Race | # Population | % Population |
| Asian | 668 | 1.3% |
| Black / African American | 6,183 | 12.4% |
| Hawaiian / Pacific | 14 | 0.0% |
| Hispanic or Latino | 2,516 | 5.1% |
| Native / Alaskan | 66 | 0.1% |
| White / Caucasian | 38,316 | 77.0% |
| Two or more Races | 3,806 | 7.6% |
| Some other Race | 718 | 1.4% |
| Total | 49,771 | 100.0% |
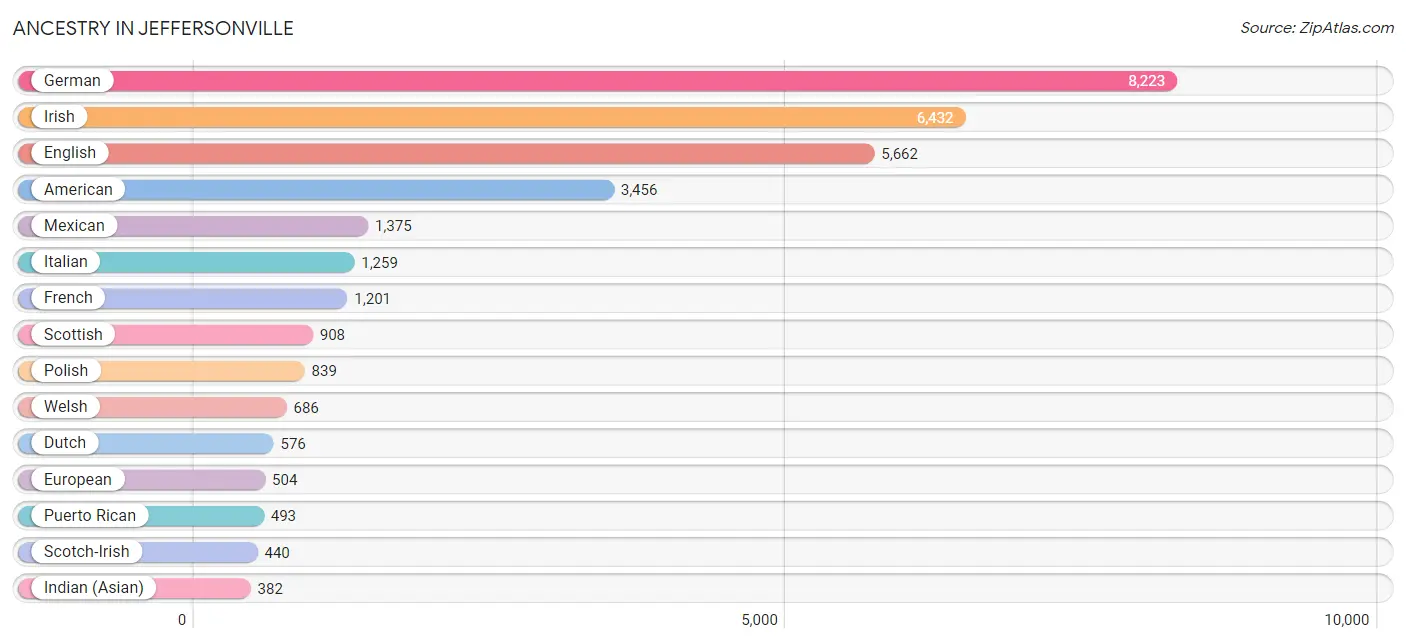
Ancestry in Jeffersonville
The most populous ancestries reported in Jeffersonville are German (8,223 | 16.5%), Irish (6,432 | 12.9%), English (5,662 | 11.4%), American (3,456 | 6.9%), and Mexican (1,375 | 2.8%), together accounting for 50.5% of all Jeffersonville residents.
| Ancestry | # Population | % Population |
| African | 190 | 0.4% |
| American | 3,456 | 6.9% |
| Arab | 28 | 0.1% |
| Austrian | 83 | 0.2% |
| Belgian | 31 | 0.1% |
| Belizean | 114 | 0.2% |
| Bhutanese | 54 | 0.1% |
| Blackfeet | 121 | 0.2% |
| British | 317 | 0.6% |
| Bulgarian | 8 | 0.0% |
| Burmese | 59 | 0.1% |
| Cambodian | 37 | 0.1% |
| Canadian | 79 | 0.2% |
| Central American | 295 | 0.6% |
| Cherokee | 80 | 0.2% |
| Chickasaw | 6 | 0.0% |
| Chippewa | 19 | 0.0% |
| Colombian | 150 | 0.3% |
| Croatian | 28 | 0.1% |
| Crow | 116 | 0.2% |
| Cuban | 90 | 0.2% |
| Czech | 84 | 0.2% |
| Dutch | 576 | 1.2% |
| Eastern European | 52 | 0.1% |
| Ecuadorian | 9 | 0.0% |
| Egyptian | 1 | 0.0% |
| English | 5,662 | 11.4% |
| Ethiopian | 16 | 0.0% |
| European | 504 | 1.0% |
| Filipino | 33 | 0.1% |
| Finnish | 55 | 0.1% |
| French | 1,201 | 2.4% |
| French Canadian | 35 | 0.1% |
| German | 8,223 | 16.5% |
| Greek | 60 | 0.1% |
| Guatemalan | 72 | 0.1% |
| Haitian | 24 | 0.1% |
| Honduran | 154 | 0.3% |
| Hungarian | 24 | 0.1% |
| Icelander | 103 | 0.2% |
| Indian (Asian) | 382 | 0.8% |
| Iranian | 114 | 0.2% |
| Irish | 6,432 | 12.9% |
| Israeli | 12 | 0.0% |
| Italian | 1,259 | 2.5% |
| Jamaican | 10 | 0.0% |
| Jordanian | 5 | 0.0% |
| Korean | 68 | 0.1% |
| Latvian | 8 | 0.0% |
| Lebanese | 12 | 0.0% |
| Lithuanian | 9 | 0.0% |
| Malaysian | 21 | 0.0% |
| Mexican | 1,375 | 2.8% |
| Mexican American Indian | 81 | 0.2% |
| Native Hawaiian | 60 | 0.1% |
| Navajo | 6 | 0.0% |
| New Zealander | 48 | 0.1% |
| Nicaraguan | 57 | 0.1% |
| Northern European | 13 | 0.0% |
| Norwegian | 325 | 0.6% |
| Pakistani | 16 | 0.0% |
| Pennsylvania German | 23 | 0.1% |
| Polish | 839 | 1.7% |
| Portuguese | 17 | 0.0% |
| Puerto Rican | 493 | 1.0% |
| Romanian | 50 | 0.1% |
| Russian | 31 | 0.1% |
| Salvadoran | 12 | 0.0% |
| Scandinavian | 36 | 0.1% |
| Scotch-Irish | 440 | 0.9% |
| Scottish | 908 | 1.8% |
| Slavic | 15 | 0.0% |
| Slovak | 7 | 0.0% |
| Somali | 17 | 0.0% |
| South American | 173 | 0.4% |
| Spaniard | 36 | 0.1% |
| Sri Lankan | 128 | 0.3% |
| Subsaharan African | 223 | 0.4% |
| Swedish | 127 | 0.3% |
| Swiss | 174 | 0.4% |
| Thai | 167 | 0.3% |
| Turkish | 7 | 0.0% |
| Ukrainian | 8 | 0.0% |
| Venezuelan | 14 | 0.0% |
| Welsh | 686 | 1.4% |
| West Indian | 47 | 0.1% | View All 86 Rows |
Immigrants in Jeffersonville
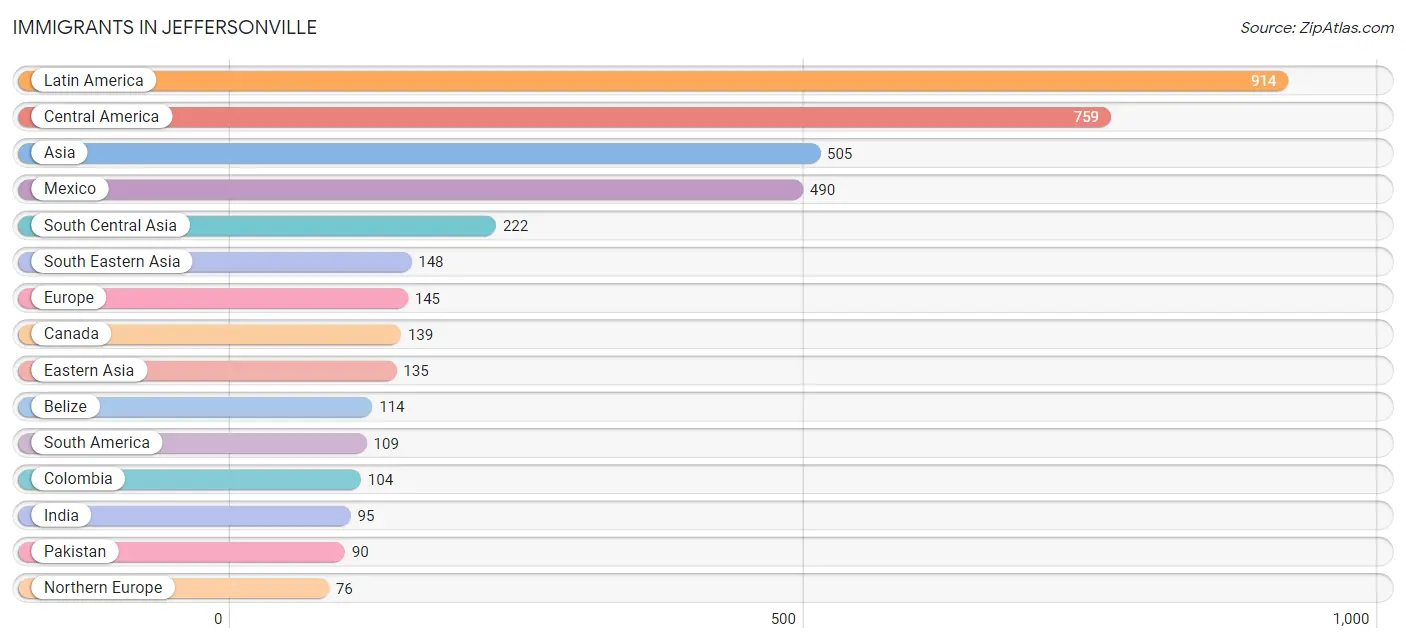
The most numerous immigrant groups reported in Jeffersonville came from Latin America (914 | 1.8%), Central America (759 | 1.5%), Asia (505 | 1.0%), Mexico (490 | 1.0%), and South Central Asia (222 | 0.4%), together accounting for 5.8% of all Jeffersonville residents.
| Immigration Origin | # Population | % Population |
| Asia | 505 | 1.0% |
| Belize | 114 | 0.2% |
| Bulgaria | 8 | 0.0% |
| Canada | 139 | 0.3% |
| Caribbean | 46 | 0.1% |
| Central America | 759 | 1.5% |
| China | 62 | 0.1% |
| Colombia | 104 | 0.2% |
| Cuba | 46 | 0.1% |
| Eastern Asia | 135 | 0.3% |
| Eastern Europe | 17 | 0.0% |
| England | 19 | 0.0% |
| Europe | 145 | 0.3% |
| Germany | 44 | 0.1% |
| Greece | 8 | 0.0% |
| Guatemala | 40 | 0.1% |
| Guyana | 5 | 0.0% |
| Honduras | 49 | 0.1% |
| India | 95 | 0.2% |
| Indonesia | 55 | 0.1% |
| Iran | 34 | 0.1% |
| Ireland | 39 | 0.1% |
| Korea | 36 | 0.1% |
| Latin America | 914 | 1.8% |
| Mexico | 490 | 1.0% |
| Nepal | 3 | 0.0% |
| Nicaragua | 66 | 0.1% |
| Northern Europe | 76 | 0.2% |
| Oceania | 17 | 0.0% |
| Pakistan | 90 | 0.2% |
| Philippines | 36 | 0.1% |
| Romania | 9 | 0.0% |
| South America | 109 | 0.2% |
| South Central Asia | 222 | 0.4% |
| South Eastern Asia | 148 | 0.3% |
| Southern Europe | 8 | 0.0% |
| Vietnam | 57 | 0.1% |
| Western Europe | 44 | 0.1% | View All 38 Rows |
Sex and Age in Jeffersonville
Sex and Age in Jeffersonville
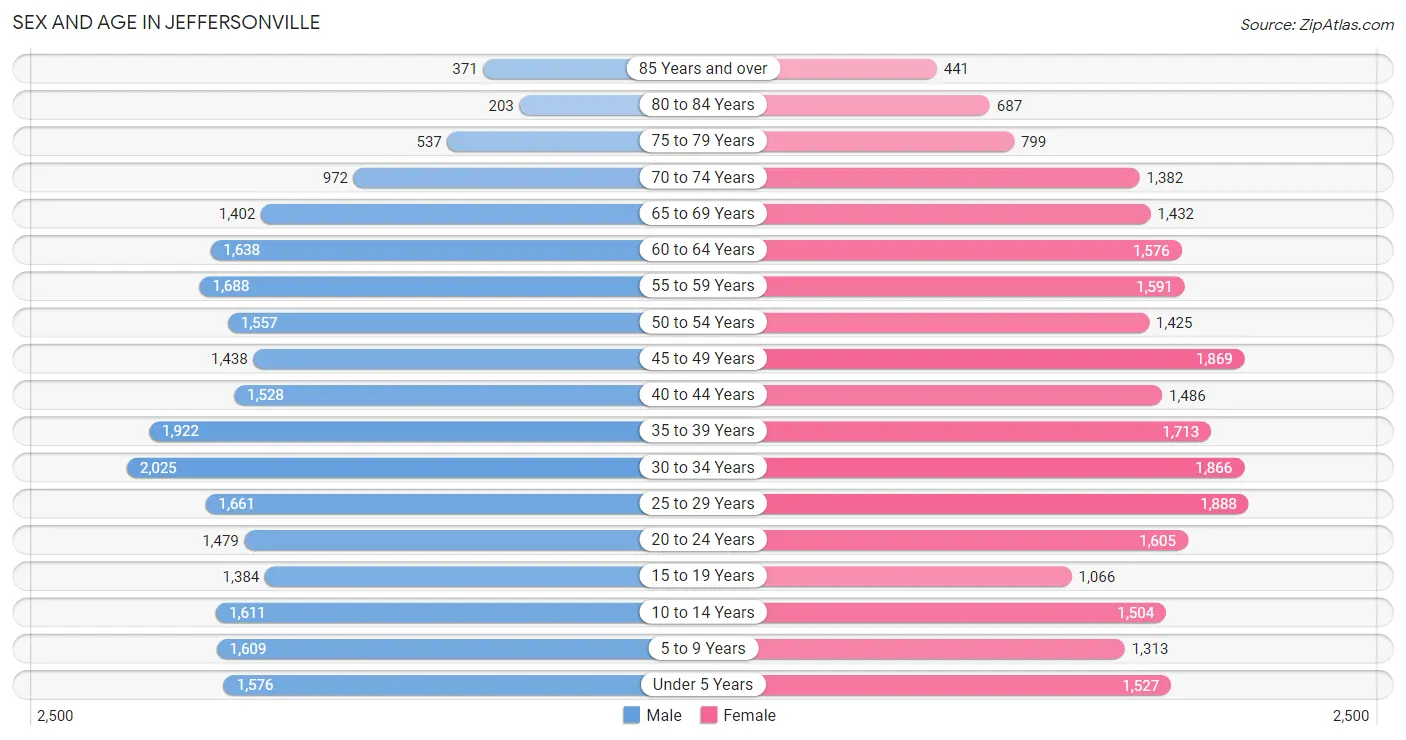
The most populous age groups in Jeffersonville are 30 to 34 Years (2,025 | 8.2%) for men and 25 to 29 Years (1,888 | 7.5%) for women.
| Age Bracket | Male | Female |
| Under 5 Years | 1,576 (6.4%) | 1,527 (6.1%) |
| 5 to 9 Years | 1,609 (6.5%) | 1,313 (5.2%) |
| 10 to 14 Years | 1,611 (6.6%) | 1,504 (6.0%) |
| 15 to 19 Years | 1,384 (5.6%) | 1,066 (4.2%) |
| 20 to 24 Years | 1,479 (6.0%) | 1,605 (6.4%) |
| 25 to 29 Years | 1,661 (6.8%) | 1,888 (7.5%) |
| 30 to 34 Years | 2,025 (8.2%) | 1,866 (7.4%) |
| 35 to 39 Years | 1,922 (7.8%) | 1,713 (6.8%) |
| 40 to 44 Years | 1,528 (6.2%) | 1,486 (5.9%) |
| 45 to 49 Years | 1,438 (5.9%) | 1,869 (7.4%) |
| 50 to 54 Years | 1,557 (6.3%) | 1,425 (5.7%) |
| 55 to 59 Years | 1,688 (6.9%) | 1,591 (6.3%) |
| 60 to 64 Years | 1,638 (6.7%) | 1,576 (6.3%) |
| 65 to 69 Years | 1,402 (5.7%) | 1,432 (5.7%) |
| 70 to 74 Years | 972 (4.0%) | 1,382 (5.5%) |
| 75 to 79 Years | 537 (2.2%) | 799 (3.2%) |
| 80 to 84 Years | 203 (0.8%) | 687 (2.7%) |
| 85 Years and over | 371 (1.5%) | 441 (1.8%) |
| Total | 24,601 (100.0%) | 25,170 (100.0%) |
Families and Households in Jeffersonville
Median Family Size in Jeffersonville
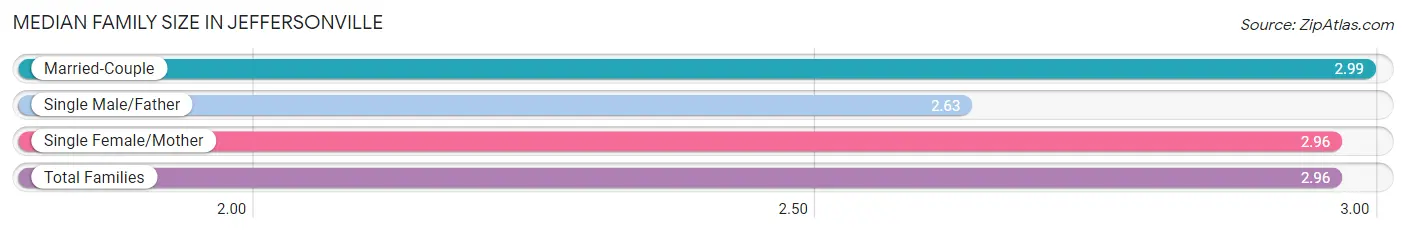
The median family size in Jeffersonville is 2.96 persons per family, with married-couple families (9,110 | 70.5%) accounting for the largest median family size of 2.99 persons per family. On the other hand, single male/father families (949 | 7.3%) represent the smallest median family size with 2.63 persons per family.
| Family Type | # Families | Family Size |
| Married-Couple | 9,110 (70.5%) | 2.99 |
| Single Male/Father | 949 (7.3%) | 2.63 |
| Single Female/Mother | 2,862 (22.2%) | 2.96 |
| Total Families | 12,921 (100.0%) | 2.96 |
Median Household Size in Jeffersonville
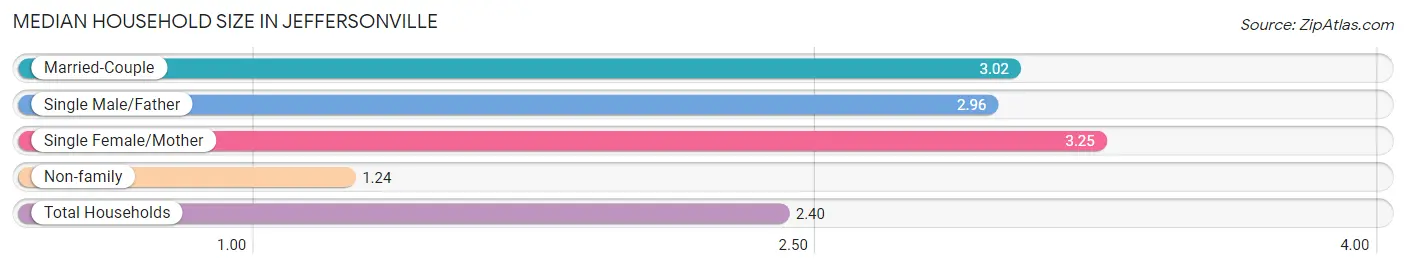
The median household size in Jeffersonville is 2.40 persons per household, with single female/mother households (2,862 | 14.0%) accounting for the largest median household size of 3.25 persons per household. non-family households (7,490 | 36.7%) represent the smallest median household size with 1.24 persons per household.
| Household Type | # Households | Household Size |
| Married-Couple | 9,110 (44.6%) | 3.02 |
| Single Male/Father | 949 (4.6%) | 2.96 |
| Single Female/Mother | 2,862 (14.0%) | 3.25 |
| Non-family | 7,490 (36.7%) | 1.24 |
| Total Households | 20,411 (100.0%) | 2.40 |
Household Size by Marriage Status in Jeffersonville
Out of a total of 20,411 households in Jeffersonville, 12,921 (63.3%) are family households, while 7,490 (36.7%) are nonfamily households. The most numerous type of family households are 2-person households, comprising 6,237, and the most common type of nonfamily households are 1-person households, comprising 6,329.
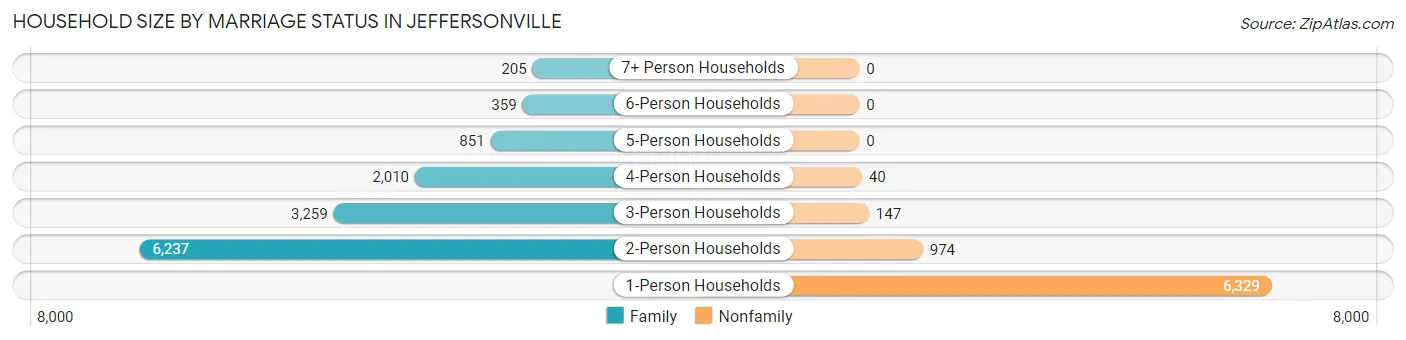
| Household Size | Family Households | Nonfamily Households |
| 1-Person Households | - | 6,329 (31.0%) |
| 2-Person Households | 6,237 (30.6%) | 974 (4.8%) |
| 3-Person Households | 3,259 (16.0%) | 147 (0.7%) |
| 4-Person Households | 2,010 (9.9%) | 40 (0.2%) |
| 5-Person Households | 851 (4.2%) | 0 (0.0%) |
| 6-Person Households | 359 (1.8%) | 0 (0.0%) |
| 7+ Person Households | 205 (1.0%) | 0 (0.0%) |
| Total | 12,921 (63.3%) | 7,490 (36.7%) |
Female Fertility in Jeffersonville
Fertility by Age in Jeffersonville
Average fertility rate in Jeffersonville is 63.0 births per 1,000 women. Women in the age bracket of 20 to 34 years have the highest fertility rate with 115.0 births per 1,000 women. Women in the age bracket of 20 to 34 years acount for 83.9% of all women with births.
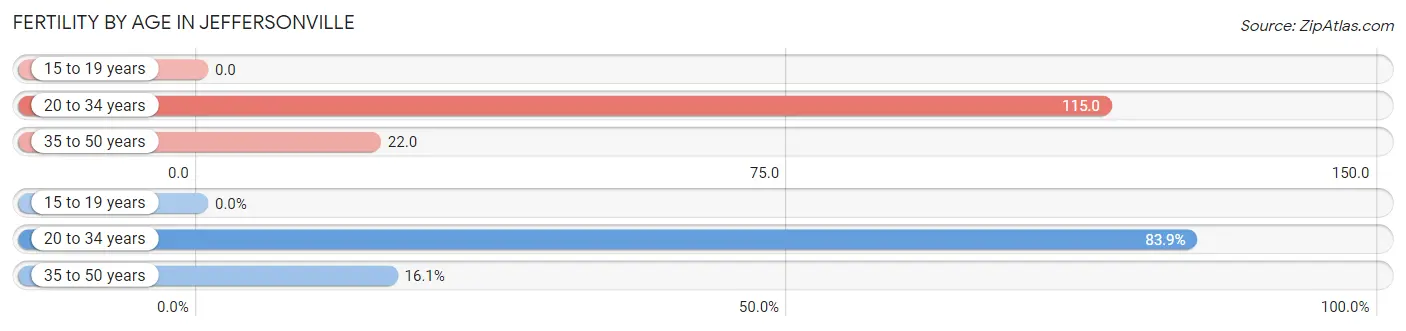
| Age Bracket | Women with Births | Births / 1,000 Women |
| 15 to 19 years | 0 (0.0%) | 0.0 |
| 20 to 34 years | 616 (83.9%) | 115.0 |
| 35 to 50 years | 118 (16.1%) | 22.0 |
| Total | 734 (100.0%) | 63.0 |
Fertility by Age by Marriage Status in Jeffersonville
71.9% of women with births (734) in Jeffersonville are married. The highest percentage of unmarried women with births falls into 35 to 50 years age bracket with 37.3% of them unmarried at the time of birth, while the lowest percentage of unmarried women with births belong to 20 to 34 years age bracket with 26.3% of them unmarried.
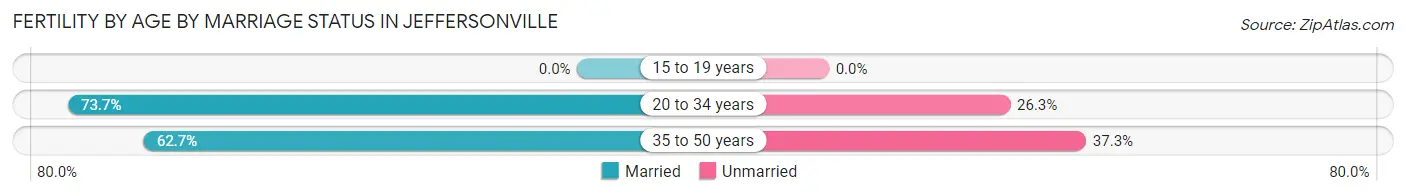
| Age Bracket | Married | Unmarried |
| 15 to 19 years | 0 (0.0%) | 0 (0.0%) |
| 20 to 34 years | 454 (73.7%) | 162 (26.3%) |
| 35 to 50 years | 74 (62.7%) | 44 (37.3%) |
| Total | 528 (71.9%) | 206 (28.1%) |
Fertility by Education in Jeffersonville
Average fertility rate in Jeffersonville is 63.0 births per 1,000 women. Women with the education attainment of college or associate's degree have the highest fertility rate of 92.0 births per 1,000 women, while women with the education attainment of less than high school have the lowest fertility at 15.0 births per 1,000 women. Women with the education attainment of college or associate's degree represent 55.2% of all women with births.
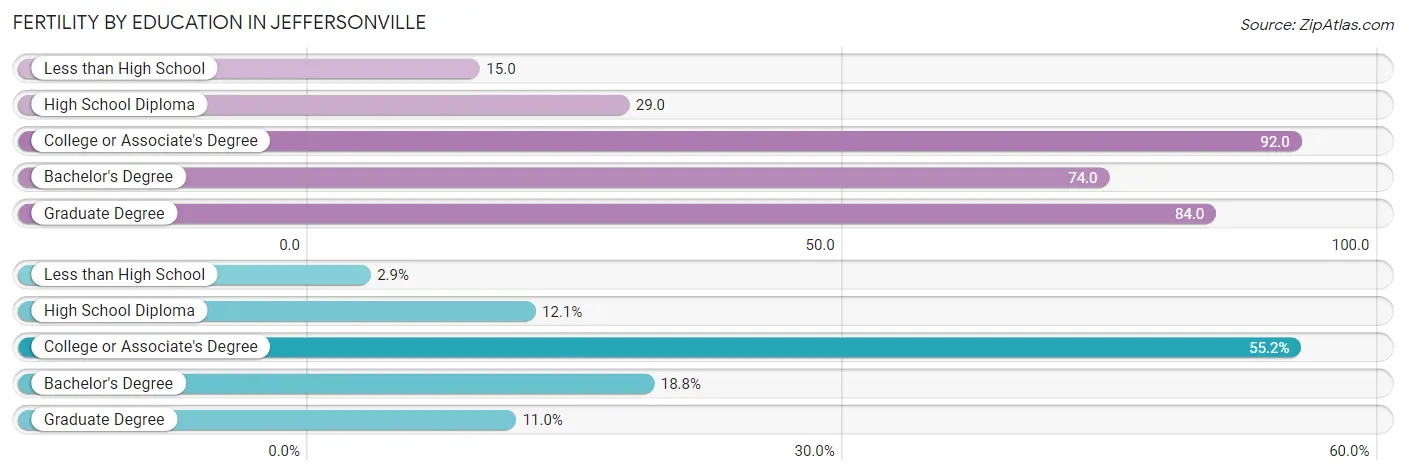
| Educational Attainment | Women with Births | Births / 1,000 Women |
| Less than High School | 21 (2.9%) | 15.0 |
| High School Diploma | 89 (12.1%) | 29.0 |
| College or Associate's Degree | 405 (55.2%) | 92.0 |
| Bachelor's Degree | 138 (18.8%) | 74.0 |
| Graduate Degree | 81 (11.0%) | 84.0 |
| Total | 734 (100.0%) | 63.0 |
Fertility by Education by Marriage Status in Jeffersonville
28.1% of women with births in Jeffersonville are unmarried. Women with the educational attainment of less than high school are most likely to be married with 100.0% of them married at childbirth, while women with the educational attainment of high school diploma are least likely to be married with 49.4% of them unmarried at childbirth.
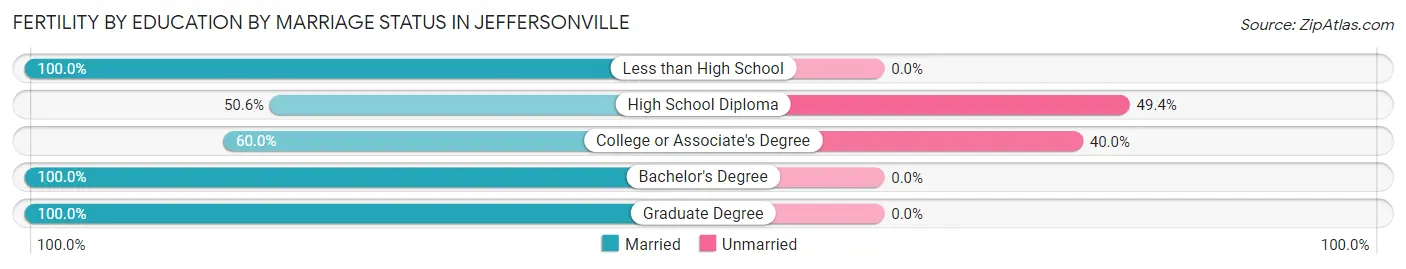
| Educational Attainment | Married | Unmarried |
| Less than High School | 21 (100.0%) | 0 (0.0%) |
| High School Diploma | 45 (50.6%) | 44 (49.4%) |
| College or Associate's Degree | 243 (60.0%) | 162 (40.0%) |
| Bachelor's Degree | 138 (100.0%) | 0 (0.0%) |
| Graduate Degree | 81 (100.0%) | 0 (0.0%) |
| Total | 528 (71.9%) | 206 (28.1%) |
Employment Characteristics in Jeffersonville
Employment by Class of Employer in Jeffersonville
Among the 25,059 employed individuals in Jeffersonville, private company employees (18,843 | 75.2%), not-for-profit organizations (1,748 | 7.0%), and local government employees (1,315 | 5.2%) make up the most common classes of employment.
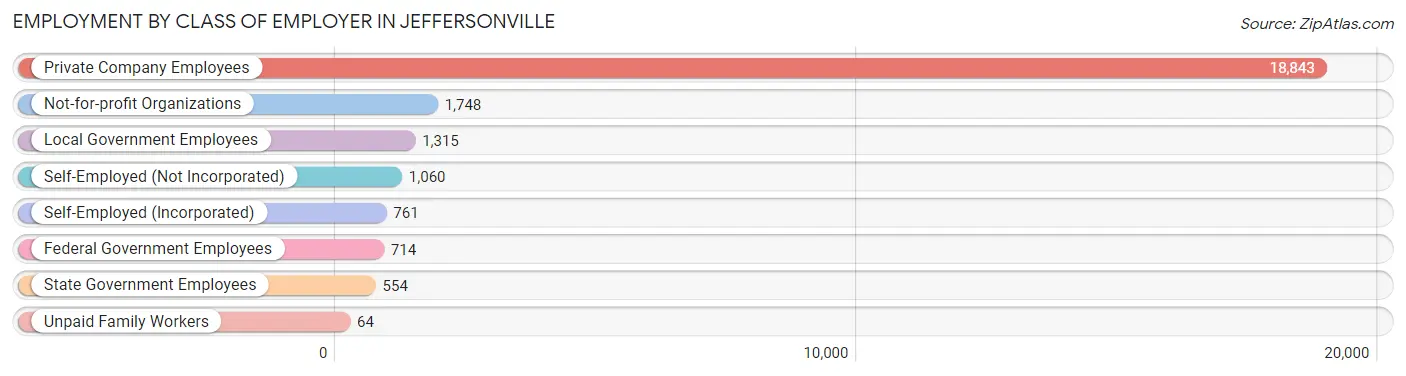
| Employer Class | # Employees | % Employees |
| Private Company Employees | 18,843 | 75.2% |
| Self-Employed (Incorporated) | 761 | 3.0% |
| Self-Employed (Not Incorporated) | 1,060 | 4.2% |
| Not-for-profit Organizations | 1,748 | 7.0% |
| Local Government Employees | 1,315 | 5.2% |
| State Government Employees | 554 | 2.2% |
| Federal Government Employees | 714 | 2.9% |
| Unpaid Family Workers | 64 | 0.3% |
| Total | 25,059 | 100.0% |
Employment Status by Age in Jeffersonville
According to the labor force statistics for Jeffersonville, out of the total population over 16 years of age (40,055), 66.2% or 26,516 individuals are in the labor force, with 3.6% or 955 of them unemployed. The age group with the highest labor force participation rate is 35 to 44 years, with 88.0% or 5,851 individuals in the labor force. Within the labor force, the 16 to 19 years age range has the highest percentage of unemployed individuals, with 10.1% or 87 of them being unemployed.
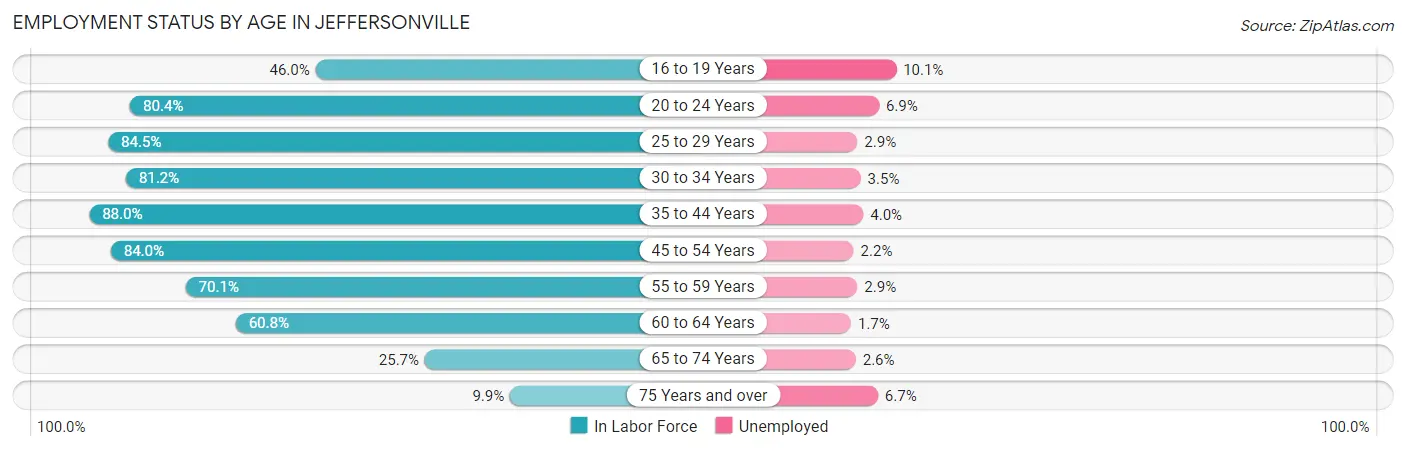
| Age Bracket | In Labor Force | Unemployed |
| 16 to 19 Years | 862 (46.0%) | 87 (10.1%) |
| 20 to 24 Years | 2,480 (80.4%) | 171 (6.9%) |
| 25 to 29 Years | 2,999 (84.5%) | 87 (2.9%) |
| 30 to 34 Years | 3,159 (81.2%) | 111 (3.5%) |
| 35 to 44 Years | 5,851 (88.0%) | 234 (4.0%) |
| 45 to 54 Years | 5,283 (84.0%) | 116 (2.2%) |
| 55 to 59 Years | 2,299 (70.1%) | 67 (2.9%) |
| 60 to 64 Years | 1,954 (60.8%) | 33 (1.7%) |
| 65 to 74 Years | 1,333 (25.7%) | 35 (2.6%) |
| 75 Years and over | 301 (9.9%) | 20 (6.7%) |
| Total | 26,516 (66.2%) | 955 (3.6%) |
Employment Status by Educational Attainment in Jeffersonville
According to labor force statistics for Jeffersonville, 80.2% of individuals (21,551) out of the total population between 25 and 64 years of age (26,871) are in the labor force, with 3.0% or 647 of them being unemployed. The group with the highest labor force participation rate are those with the educational attainment of bachelor's degree or higher, with 90.2% or 6,123 individuals in the labor force. Within the labor force, individuals with less than high school education have the highest percentage of unemployment, with 7.2% or 70 of them being unemployed.
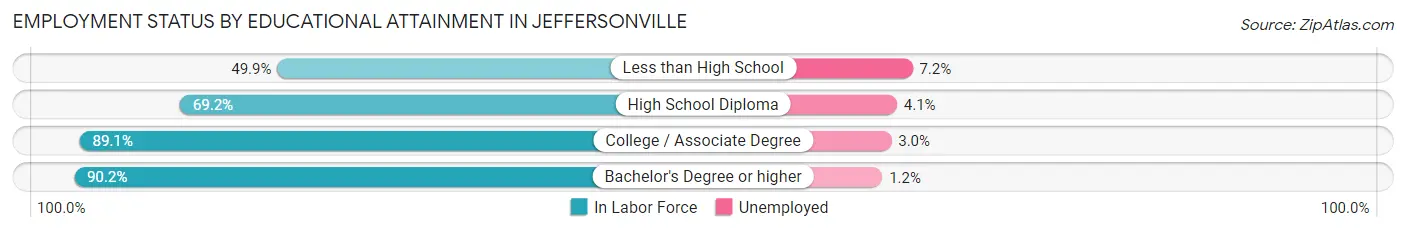
| Educational Attainment | In Labor Force | Unemployed |
| Less than High School | 971 (49.9%) | 140 (7.2%) |
| High School Diploma | 5,951 (69.2%) | 353 (4.1%) |
| College / Associate Degree | 8,497 (89.1%) | 286 (3.0%) |
| Bachelor's Degree or higher | 6,123 (90.2%) | 81 (1.2%) |
| Total | 21,551 (80.2%) | 806 (3.0%) |
Employment Occupations by Sex in Jeffersonville
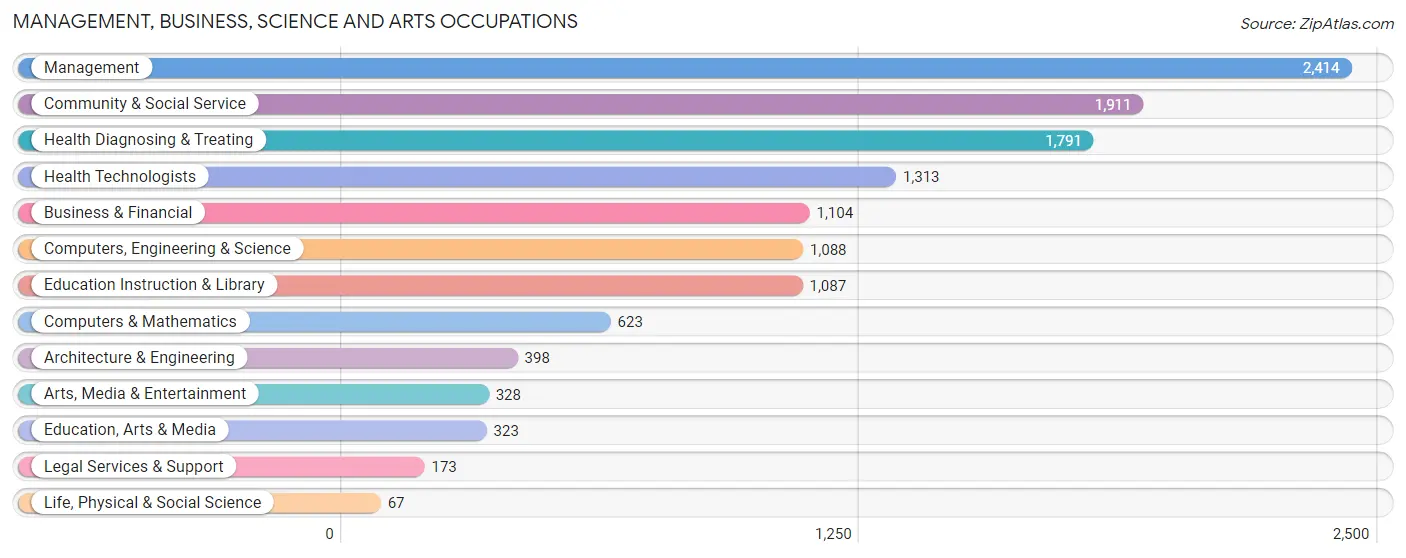
Management, Business, Science and Arts Occupations
The most common Management, Business, Science and Arts occupations in Jeffersonville are Management (2,414 | 9.5%), Community & Social Service (1,911 | 7.5%), Health Diagnosing & Treating (1,791 | 7.0%), Health Technologists (1,313 | 5.1%), and Business & Financial (1,104 | 4.3%).
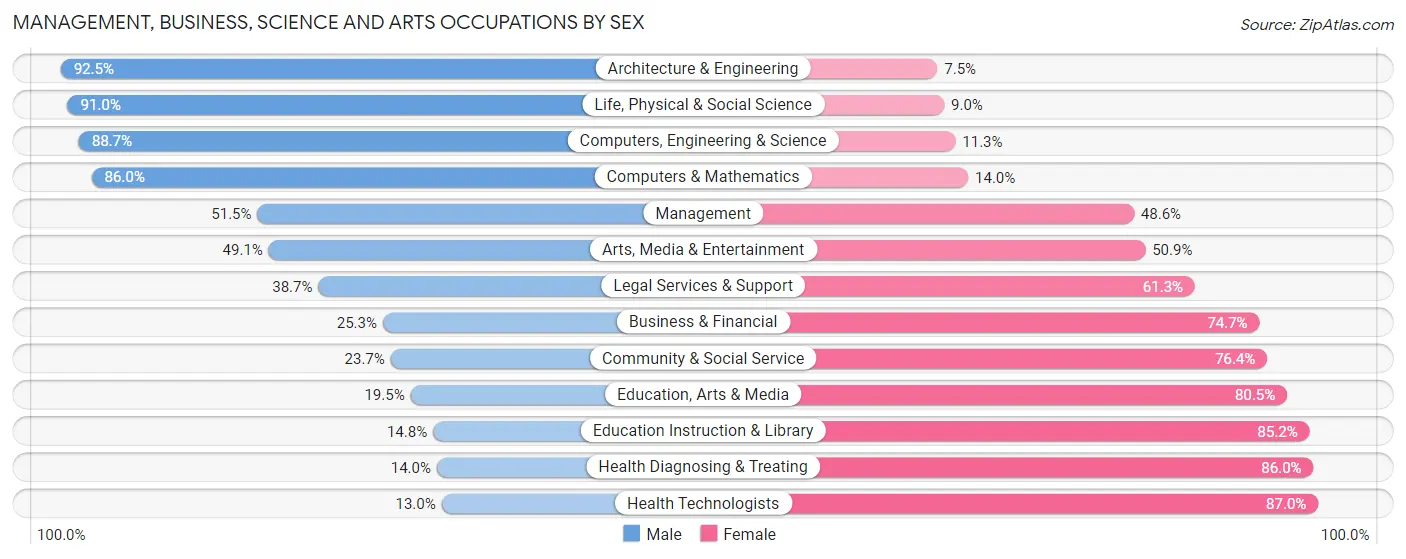
Management, Business, Science and Arts Occupations by Sex
Within the Management, Business, Science and Arts occupations in Jeffersonville, the most male-oriented occupations are Architecture & Engineering (92.5%), Life, Physical & Social Science (91.0%), and Computers, Engineering & Science (88.7%), while the most female-oriented occupations are Health Technologists (87.0%), Health Diagnosing & Treating (86.0%), and Education Instruction & Library (85.2%).
| Occupation | Male | Female |
| Management | 1,242 (51.4%) | 1,172 (48.5%) |
| Business & Financial | 279 (25.3%) | 825 (74.7%) |
| Computers, Engineering & Science | 965 (88.7%) | 123 (11.3%) |
| Computers & Mathematics | 536 (86.0%) | 87 (14.0%) |
| Architecture & Engineering | 368 (92.5%) | 30 (7.5%) |
| Life, Physical & Social Science | 61 (91.0%) | 6 (9.0%) |
| Community & Social Service | 452 (23.6%) | 1,459 (76.3%) |
| Education, Arts & Media | 63 (19.5%) | 260 (80.5%) |
| Legal Services & Support | 67 (38.7%) | 106 (61.3%) |
| Education Instruction & Library | 161 (14.8%) | 926 (85.2%) |
| Arts, Media & Entertainment | 161 (49.1%) | 167 (50.9%) |
| Health Diagnosing & Treating | 251 (14.0%) | 1,540 (86.0%) |
| Health Technologists | 171 (13.0%) | 1,142 (87.0%) |
| Total (Category) | 3,189 (38.4%) | 5,119 (61.6%) |
| Total (Overall) | 13,006 (50.9%) | 12,531 (49.1%) |
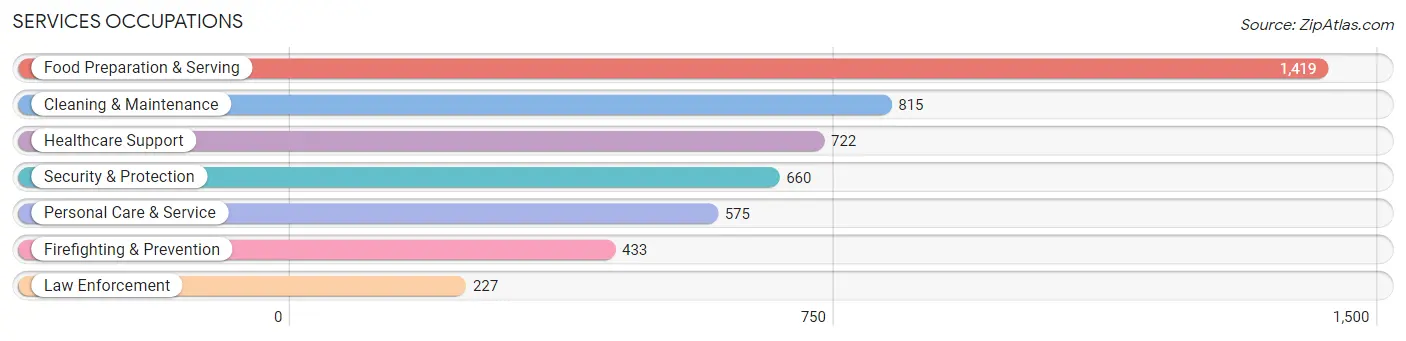
Services Occupations
The most common Services occupations in Jeffersonville are Food Preparation & Serving (1,419 | 5.6%), Cleaning & Maintenance (815 | 3.2%), Healthcare Support (722 | 2.8%), Security & Protection (660 | 2.6%), and Personal Care & Service (575 | 2.2%).
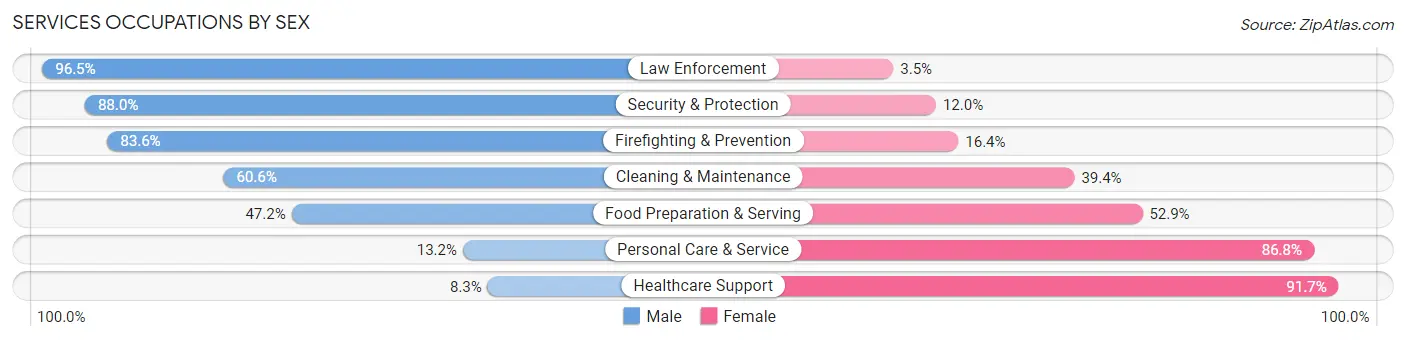
Services Occupations by Sex
Within the Services occupations in Jeffersonville, the most male-oriented occupations are Law Enforcement (96.5%), Security & Protection (88.0%), and Firefighting & Prevention (83.6%), while the most female-oriented occupations are Healthcare Support (91.7%), Personal Care & Service (86.8%), and Food Preparation & Serving (52.8%).
| Occupation | Male | Female |
| Healthcare Support | 60 (8.3%) | 662 (91.7%) |
| Security & Protection | 581 (88.0%) | 79 (12.0%) |
| Firefighting & Prevention | 362 (83.6%) | 71 (16.4%) |
| Law Enforcement | 219 (96.5%) | 8 (3.5%) |
| Food Preparation & Serving | 669 (47.1%) | 750 (52.8%) |
| Cleaning & Maintenance | 494 (60.6%) | 321 (39.4%) |
| Personal Care & Service | 76 (13.2%) | 499 (86.8%) |
| Total (Category) | 1,880 (44.9%) | 2,311 (55.1%) |
| Total (Overall) | 13,006 (50.9%) | 12,531 (49.1%) |
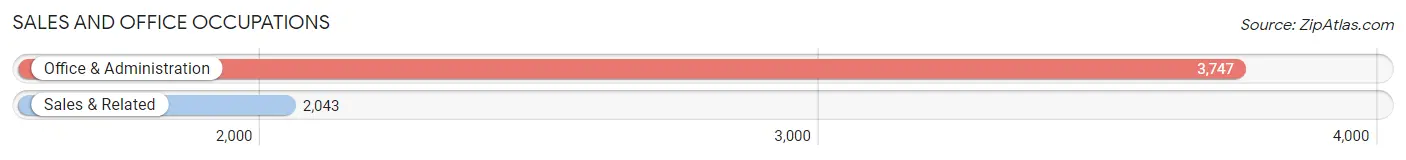
Sales and Office Occupations
The most common Sales and Office occupations in Jeffersonville are Office & Administration (3,747 | 14.7%), and Sales & Related (2,043 | 8.0%).
Sales and Office Occupations by Sex
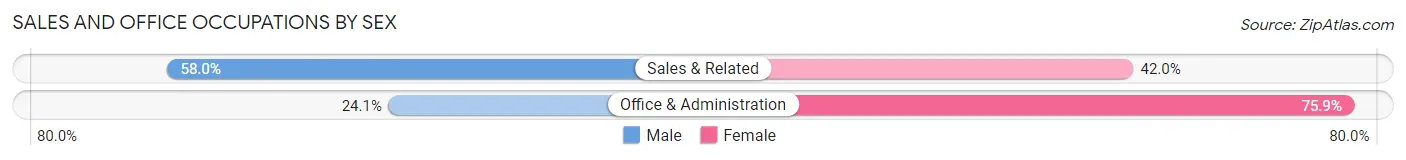
| Occupation | Male | Female |
| Sales & Related | 1,185 (58.0%) | 858 (42.0%) |
| Office & Administration | 904 (24.1%) | 2,843 (75.9%) |
| Total (Category) | 2,089 (36.1%) | 3,701 (63.9%) |
| Total (Overall) | 13,006 (50.9%) | 12,531 (49.1%) |
Natural Resources, Construction and Maintenance Occupations
The most common Natural Resources, Construction and Maintenance occupations in Jeffersonville are Construction & Extraction (1,174 | 4.6%), and Installation, Maintenance & Repair (840 | 3.3%).

Natural Resources, Construction and Maintenance Occupations by Sex
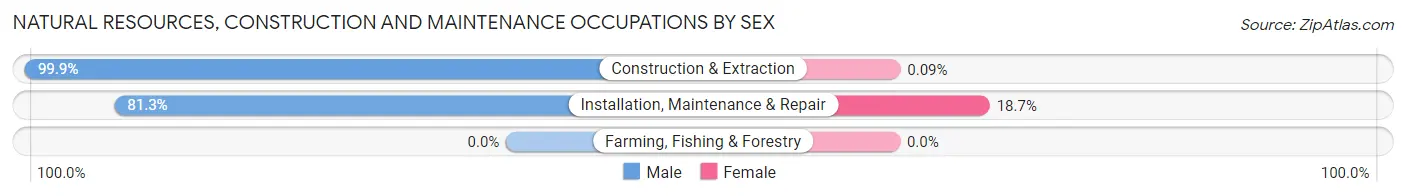
| Occupation | Male | Female |
| Farming, Fishing & Forestry | 0 (0.0%) | 0 (0.0%) |
| Construction & Extraction | 1,173 (99.9%) | 1 (0.1%) |
| Installation, Maintenance & Repair | 683 (81.3%) | 157 (18.7%) |
| Total (Category) | 1,856 (92.1%) | 158 (7.9%) |
| Total (Overall) | 13,006 (50.9%) | 12,531 (49.1%) |
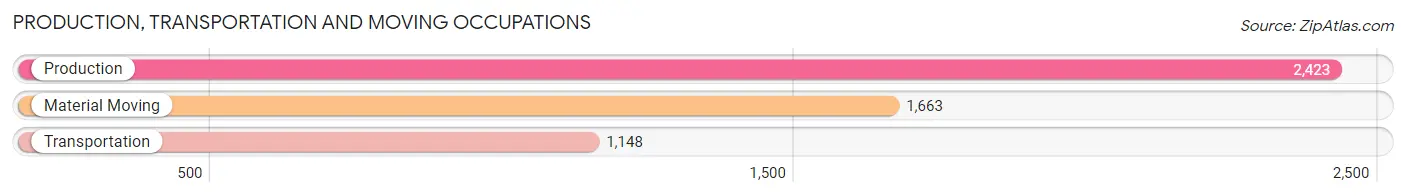
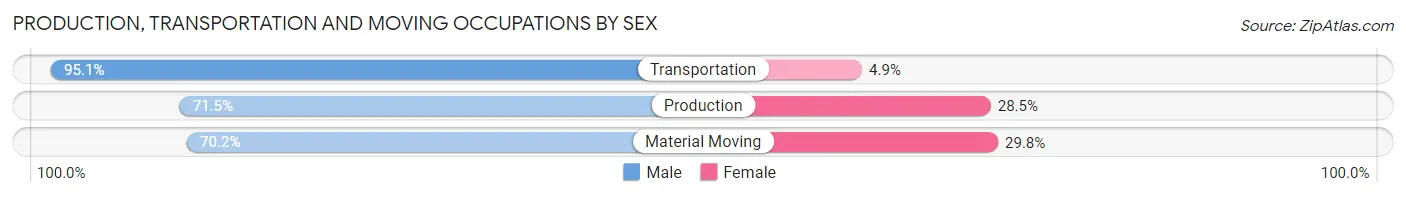
Production, Transportation and Moving Occupations
The most common Production, Transportation and Moving occupations in Jeffersonville are Production (2,423 | 9.5%), Material Moving (1,663 | 6.5%), and Transportation (1,148 | 4.5%).
Production, Transportation and Moving Occupations by Sex
| Occupation | Male | Female |
| Production | 1,733 (71.5%) | 690 (28.5%) |
| Transportation | 1,092 (95.1%) | 56 (4.9%) |
| Material Moving | 1,167 (70.2%) | 496 (29.8%) |
| Total (Category) | 3,992 (76.3%) | 1,242 (23.7%) |
| Total (Overall) | 13,006 (50.9%) | 12,531 (49.1%) |
Employment Industries by Sex in Jeffersonville
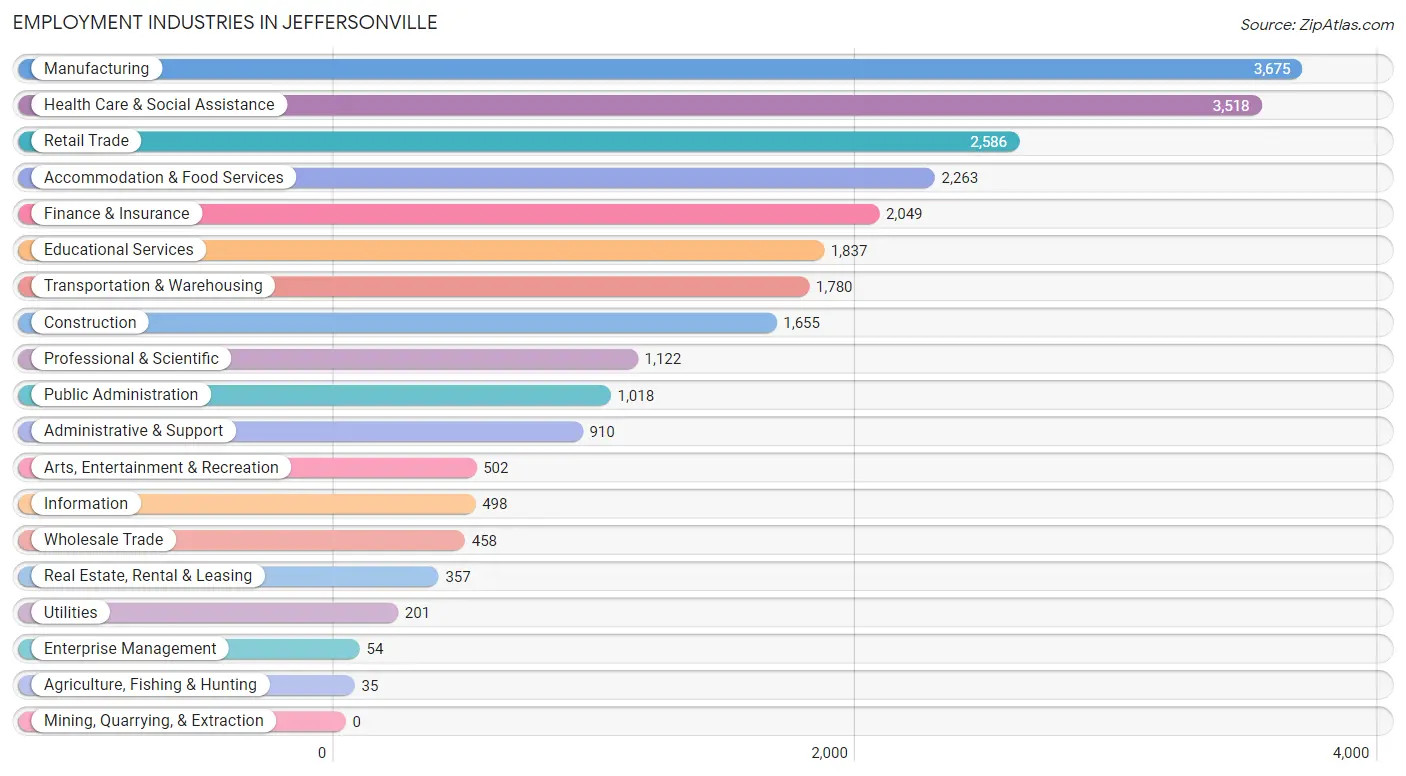
Employment Industries in Jeffersonville
The major employment industries in Jeffersonville include Manufacturing (3,675 | 14.4%), Health Care & Social Assistance (3,518 | 13.8%), Retail Trade (2,586 | 10.1%), Accommodation & Food Services (2,263 | 8.9%), and Finance & Insurance (2,049 | 8.0%).
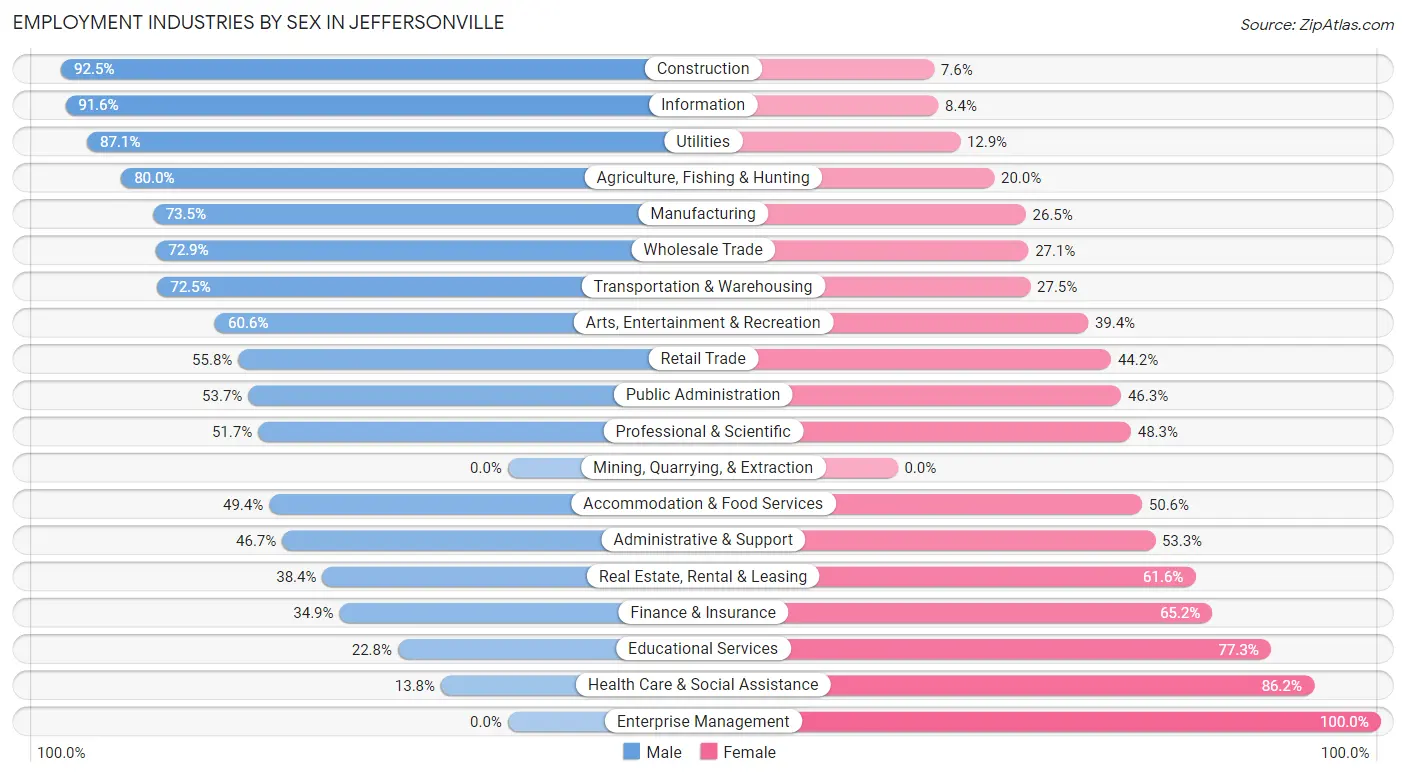
Employment Industries by Sex in Jeffersonville
The Jeffersonville industries that see more men than women are Construction (92.4%), Information (91.6%), and Utilities (87.1%), whereas the industries that tend to have a higher number of women are Enterprise Management (100.0%), Health Care & Social Assistance (86.2%), and Educational Services (77.2%).
| Industry | Male | Female |
| Agriculture, Fishing & Hunting | 28 (80.0%) | 7 (20.0%) |
| Mining, Quarrying, & Extraction | 0 (0.0%) | 0 (0.0%) |
| Construction | 1,530 (92.4%) | 125 (7.5%) |
| Manufacturing | 2,700 (73.5%) | 975 (26.5%) |
| Wholesale Trade | 334 (72.9%) | 124 (27.1%) |
| Retail Trade | 1,443 (55.8%) | 1,143 (44.2%) |
| Transportation & Warehousing | 1,291 (72.5%) | 489 (27.5%) |
| Utilities | 175 (87.1%) | 26 (12.9%) |
| Information | 456 (91.6%) | 42 (8.4%) |
| Finance & Insurance | 714 (34.8%) | 1,335 (65.1%) |
| Real Estate, Rental & Leasing | 137 (38.4%) | 220 (61.6%) |
| Professional & Scientific | 580 (51.7%) | 542 (48.3%) |
| Enterprise Management | 0 (0.0%) | 54 (100.0%) |
| Administrative & Support | 425 (46.7%) | 485 (53.3%) |
| Educational Services | 418 (22.8%) | 1,419 (77.2%) |
| Health Care & Social Assistance | 487 (13.8%) | 3,031 (86.2%) |
| Arts, Entertainment & Recreation | 304 (60.6%) | 198 (39.4%) |
| Accommodation & Food Services | 1,118 (49.4%) | 1,145 (50.6%) |
| Public Administration | 547 (53.7%) | 471 (46.3%) |
| Total | 13,006 (50.9%) | 12,531 (49.1%) |
Education in Jeffersonville
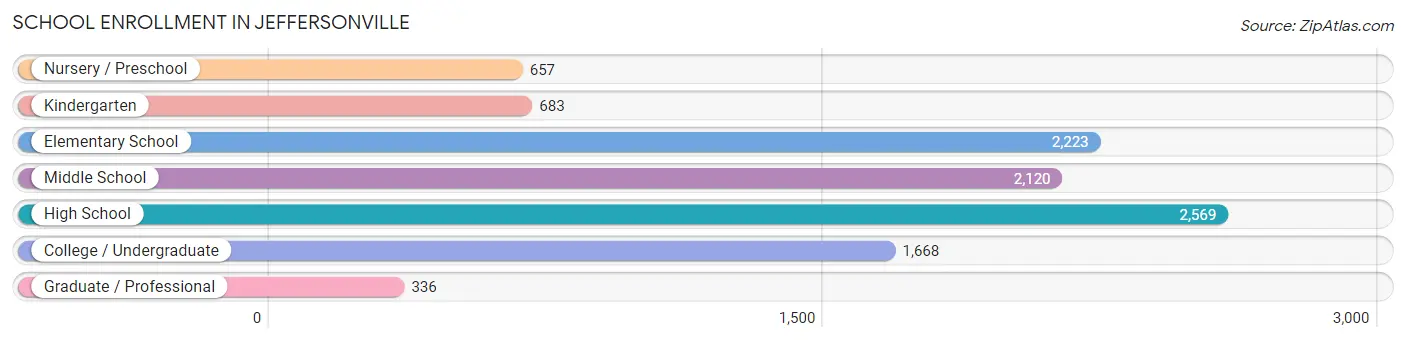
School Enrollment in Jeffersonville
The most common levels of schooling among the 10,256 students in Jeffersonville are high school (2,569 | 25.1%), elementary school (2,223 | 21.7%), and middle school (2,120 | 20.7%).
| School Level | # Students | % Students |
| Nursery / Preschool | 657 | 6.4% |
| Kindergarten | 683 | 6.7% |
| Elementary School | 2,223 | 21.7% |
| Middle School | 2,120 | 20.7% |
| High School | 2,569 | 25.1% |
| College / Undergraduate | 1,668 | 16.3% |
| Graduate / Professional | 336 | 3.3% |
| Total | 10,256 | 100.0% |
School Enrollment by Age by Funding Source in Jeffersonville
Out of a total of 10,256 students who are enrolled in schools in Jeffersonville, 1,928 (18.8%) attend a private institution, while the remaining 8,328 (81.2%) are enrolled in public schools. The age group of 3 to 4 year olds has the highest likelihood of being enrolled in private schools, with 170 (43.8% in the age bracket) enrolled. Conversely, the age group of 15 to 17 year olds has the lowest likelihood of being enrolled in a private school, with 1,391 (89.7% in the age bracket) attending a public institution.
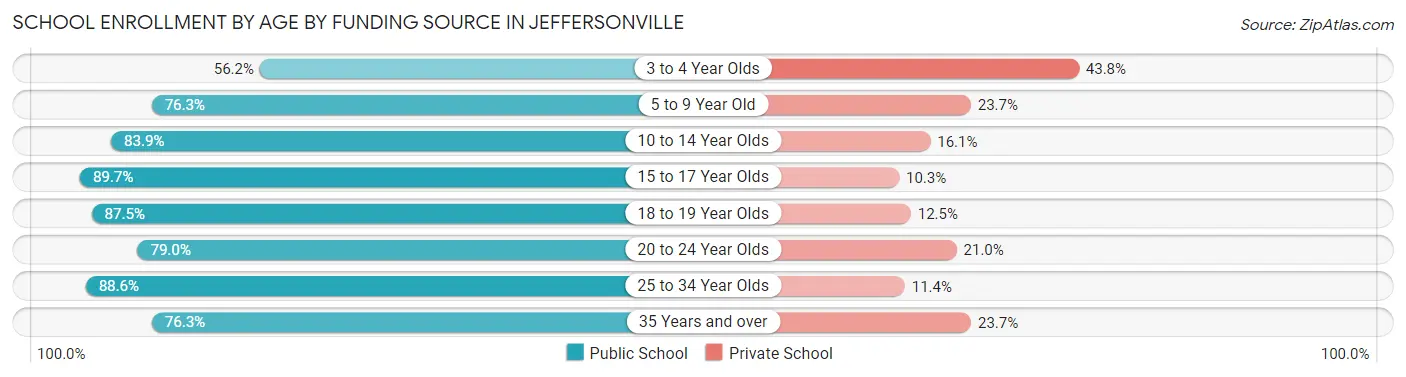
| Age Bracket | Public School | Private School |
| 3 to 4 Year Olds | 218 (56.2%) | 170 (43.8%) |
| 5 to 9 Year Old | 2,124 (76.3%) | 659 (23.7%) |
| 10 to 14 Year Olds | 2,553 (83.9%) | 491 (16.1%) |
| 15 to 17 Year Olds | 1,391 (89.7%) | 160 (10.3%) |
| 18 to 19 Year Olds | 490 (87.5%) | 70 (12.5%) |
| 20 to 24 Year Olds | 608 (79.0%) | 162 (21.0%) |
| 25 to 34 Year Olds | 389 (88.6%) | 50 (11.4%) |
| 35 Years and over | 550 (76.3%) | 171 (23.7%) |
| Total | 8,328 (81.2%) | 1,928 (18.8%) |
Educational Attainment by Field of Study in Jeffersonville
Business (1,978 | 21.3%), education (1,430 | 15.4%), science & technology (1,072 | 11.6%), communications (596 | 6.4%), and liberal arts & history (564 | 6.1%) are the most common fields of study among 9,265 individuals in Jeffersonville who have obtained a bachelor's degree or higher.
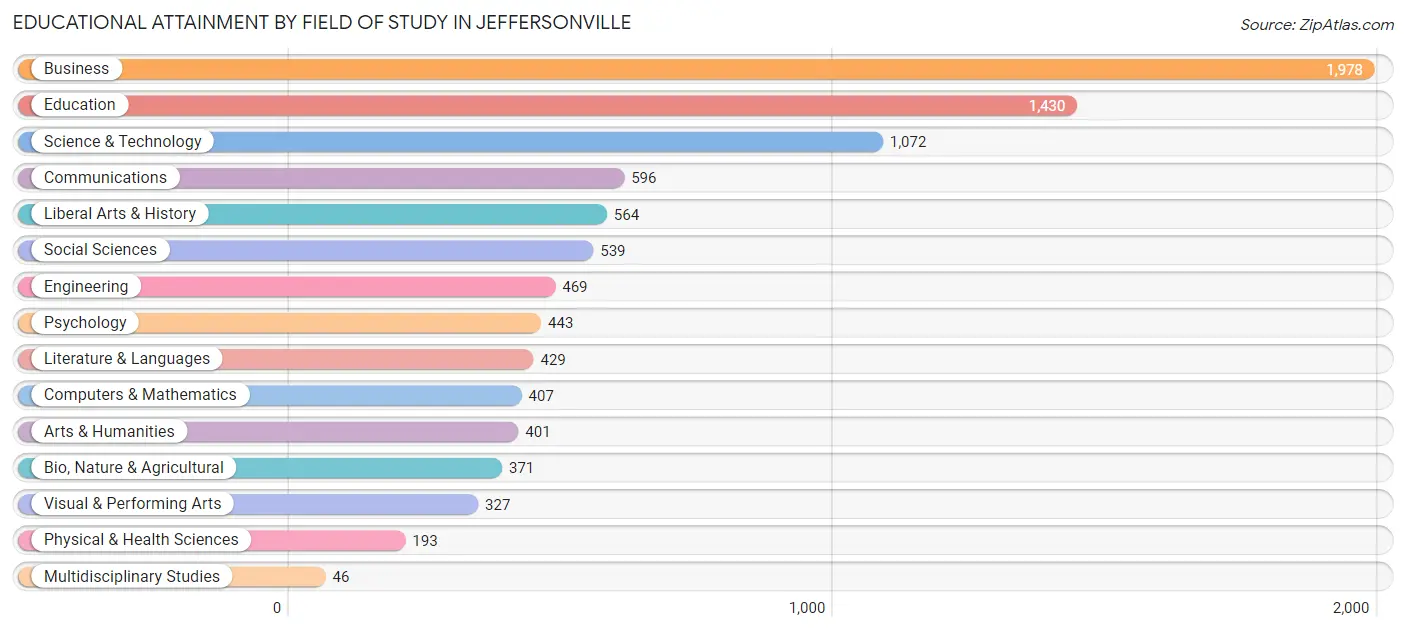
| Field of Study | # Graduates | % Graduates |
| Computers & Mathematics | 407 | 4.4% |
| Bio, Nature & Agricultural | 371 | 4.0% |
| Physical & Health Sciences | 193 | 2.1% |
| Psychology | 443 | 4.8% |
| Social Sciences | 539 | 5.8% |
| Engineering | 469 | 5.1% |
| Multidisciplinary Studies | 46 | 0.5% |
| Science & Technology | 1,072 | 11.6% |
| Business | 1,978 | 21.3% |
| Education | 1,430 | 15.4% |
| Literature & Languages | 429 | 4.6% |
| Liberal Arts & History | 564 | 6.1% |
| Visual & Performing Arts | 327 | 3.5% |
| Communications | 596 | 6.4% |
| Arts & Humanities | 401 | 4.3% |
| Total | 9,265 | 100.0% |
Transportation & Commute in Jeffersonville
Vehicle Availability by Sex in Jeffersonville
The most prevalent vehicle ownership categories in Jeffersonville are males with 2 vehicles (6,207, accounting for 48.8%) and females with 2 vehicles (5,469, making up 50.5%).
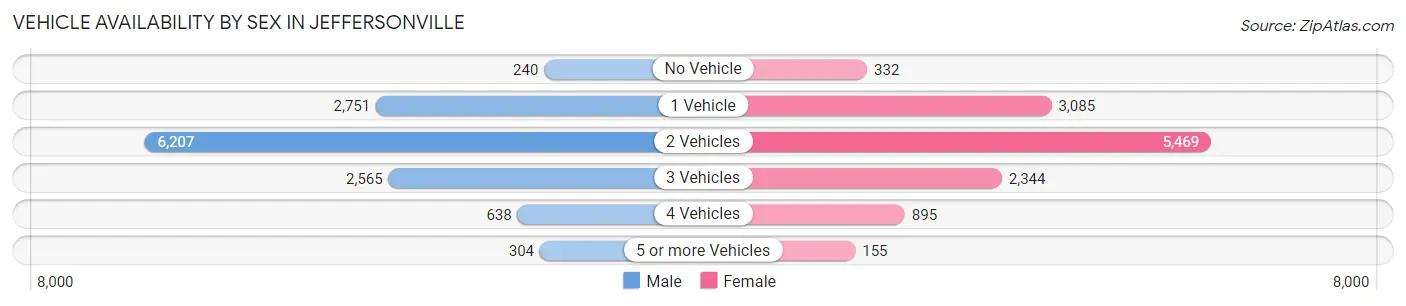
| Vehicles Available | Male | Female |
| No Vehicle | 240 (1.9%) | 332 (2.7%) |
| 1 Vehicle | 2,751 (21.6%) | 3,085 (25.1%) |
| 2 Vehicles | 6,207 (48.8%) | 5,469 (44.5%) |
| 3 Vehicles | 2,565 (20.2%) | 2,344 (19.1%) |
| 4 Vehicles | 638 (5.0%) | 895 (7.3%) |
| 5 or more Vehicles | 304 (2.4%) | 155 (1.3%) |
| Total | 12,705 (100.0%) | 12,280 (100.0%) |
Commute Time in Jeffersonville
The most frequently occuring commute durations in Jeffersonville are 15 to 19 minutes (4,808 commuters, 21.8%), 20 to 24 minutes (4,303 commuters, 19.6%), and 10 to 14 minutes (3,862 commuters, 17.5%).
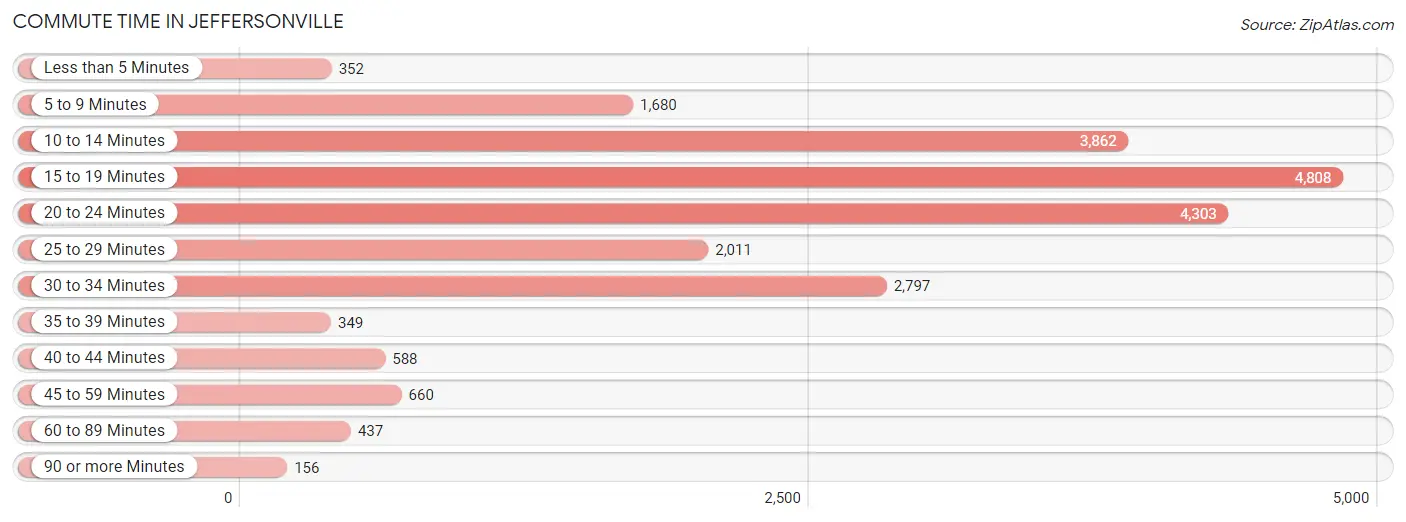
| Commute Time | # Commuters | % Commuters |
| Less than 5 Minutes | 352 | 1.6% |
| 5 to 9 Minutes | 1,680 | 7.6% |
| 10 to 14 Minutes | 3,862 | 17.5% |
| 15 to 19 Minutes | 4,808 | 21.8% |
| 20 to 24 Minutes | 4,303 | 19.6% |
| 25 to 29 Minutes | 2,011 | 9.1% |
| 30 to 34 Minutes | 2,797 | 12.7% |
| 35 to 39 Minutes | 349 | 1.6% |
| 40 to 44 Minutes | 588 | 2.7% |
| 45 to 59 Minutes | 660 | 3.0% |
| 60 to 89 Minutes | 437 | 2.0% |
| 90 or more Minutes | 156 | 0.7% |
Commute Time by Sex in Jeffersonville
The most common commute times in Jeffersonville are 10 to 14 minutes (2,270 commuters, 20.1%) for males and 15 to 19 minutes (2,543 commuters, 23.7%) for females.
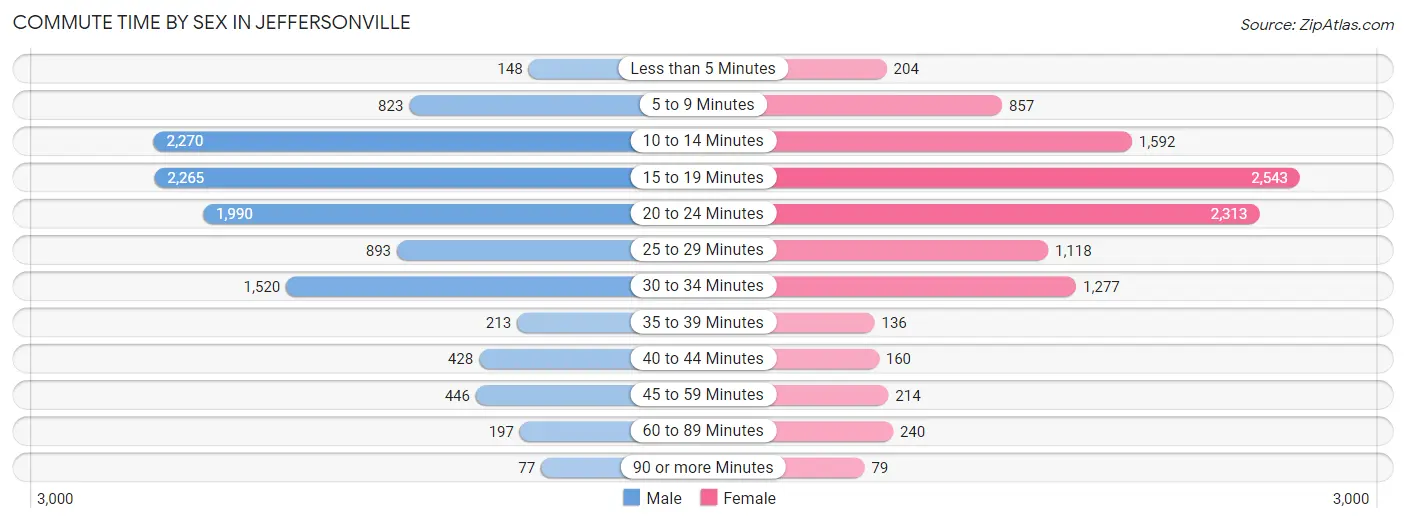
| Commute Time | Male | Female |
| Less than 5 Minutes | 148 (1.3%) | 204 (1.9%) |
| 5 to 9 Minutes | 823 (7.3%) | 857 (8.0%) |
| 10 to 14 Minutes | 2,270 (20.1%) | 1,592 (14.8%) |
| 15 to 19 Minutes | 2,265 (20.1%) | 2,543 (23.7%) |
| 20 to 24 Minutes | 1,990 (17.7%) | 2,313 (21.5%) |
| 25 to 29 Minutes | 893 (7.9%) | 1,118 (10.4%) |
| 30 to 34 Minutes | 1,520 (13.5%) | 1,277 (11.9%) |
| 35 to 39 Minutes | 213 (1.9%) | 136 (1.3%) |
| 40 to 44 Minutes | 428 (3.8%) | 160 (1.5%) |
| 45 to 59 Minutes | 446 (4.0%) | 214 (2.0%) |
| 60 to 89 Minutes | 197 (1.8%) | 240 (2.2%) |
| 90 or more Minutes | 77 (0.7%) | 79 (0.7%) |
Time of Departure to Work by Sex in Jeffersonville
The most frequent times of departure to work in Jeffersonville are 7:00 AM to 7:29 AM (1,497, 13.3%) for males and 7:30 AM to 7:59 AM (2,012, 18.8%) for females.
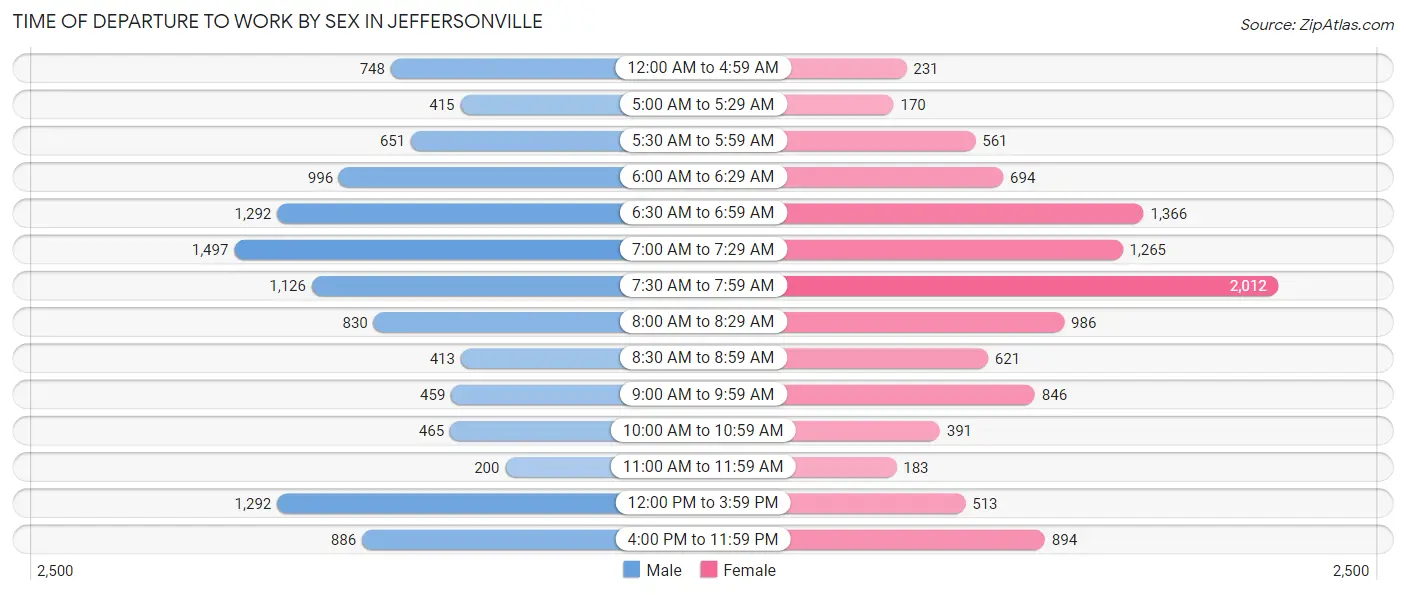
| Time of Departure | Male | Female |
| 12:00 AM to 4:59 AM | 748 (6.6%) | 231 (2.1%) |
| 5:00 AM to 5:29 AM | 415 (3.7%) | 170 (1.6%) |
| 5:30 AM to 5:59 AM | 651 (5.8%) | 561 (5.2%) |
| 6:00 AM to 6:29 AM | 996 (8.8%) | 694 (6.5%) |
| 6:30 AM to 6:59 AM | 1,292 (11.5%) | 1,366 (12.7%) |
| 7:00 AM to 7:29 AM | 1,497 (13.3%) | 1,265 (11.8%) |
| 7:30 AM to 7:59 AM | 1,126 (10.0%) | 2,012 (18.8%) |
| 8:00 AM to 8:29 AM | 830 (7.4%) | 986 (9.2%) |
| 8:30 AM to 8:59 AM | 413 (3.7%) | 621 (5.8%) |
| 9:00 AM to 9:59 AM | 459 (4.1%) | 846 (7.9%) |
| 10:00 AM to 10:59 AM | 465 (4.1%) | 391 (3.6%) |
| 11:00 AM to 11:59 AM | 200 (1.8%) | 183 (1.7%) |
| 12:00 PM to 3:59 PM | 1,292 (11.5%) | 513 (4.8%) |
| 4:00 PM to 11:59 PM | 886 (7.9%) | 894 (8.3%) |
| Total | 11,270 (100.0%) | 10,733 (100.0%) |
Housing Occupancy in Jeffersonville
Occupancy by Ownership in Jeffersonville
Of the total 20,411 dwellings in Jeffersonville, owner-occupied units account for 14,589 (71.5%), while renter-occupied units make up 5,822 (28.5%).
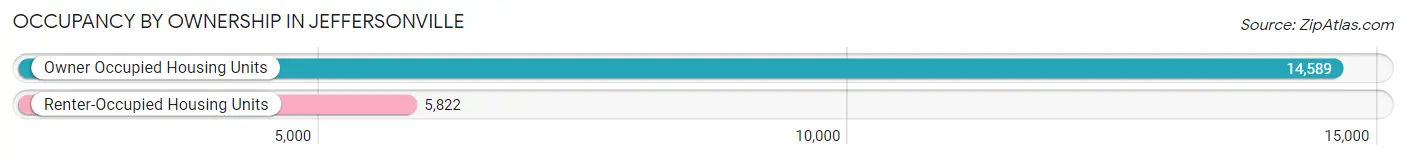
| Occupancy | # Housing Units | % Housing Units |
| Owner Occupied Housing Units | 14,589 | 71.5% |
| Renter-Occupied Housing Units | 5,822 | 28.5% |
| Total Occupied Housing Units | 20,411 | 100.0% |
Occupancy by Household Size in Jeffersonville
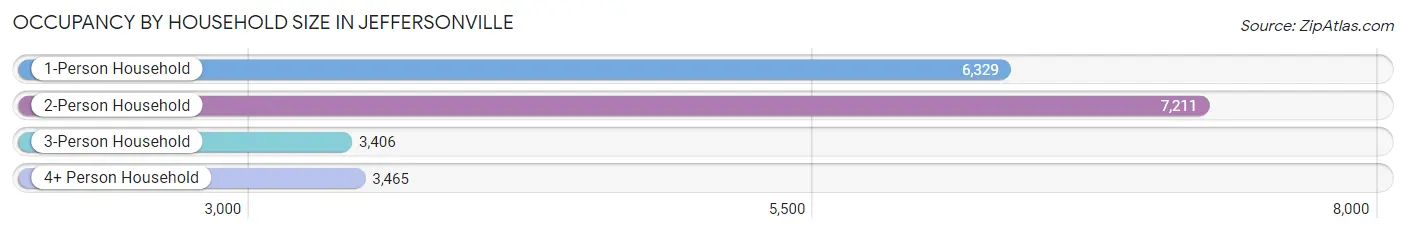
| Household Size | # Housing Units | % Housing Units |
| 1-Person Household | 6,329 | 31.0% |
| 2-Person Household | 7,211 | 35.3% |
| 3-Person Household | 3,406 | 16.7% |
| 4+ Person Household | 3,465 | 17.0% |
| Total Housing Units | 20,411 | 100.0% |
Occupancy by Ownership by Household Size in Jeffersonville
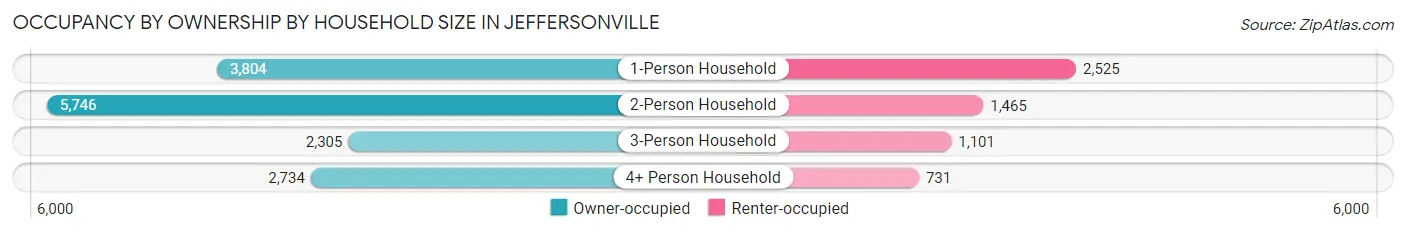
| Household Size | Owner-occupied | Renter-occupied |
| 1-Person Household | 3,804 (60.1%) | 2,525 (39.9%) |
| 2-Person Household | 5,746 (79.7%) | 1,465 (20.3%) |
| 3-Person Household | 2,305 (67.7%) | 1,101 (32.3%) |
| 4+ Person Household | 2,734 (78.9%) | 731 (21.1%) |
| Total Housing Units | 14,589 (71.5%) | 5,822 (28.5%) |
Occupancy by Educational Attainment in Jeffersonville
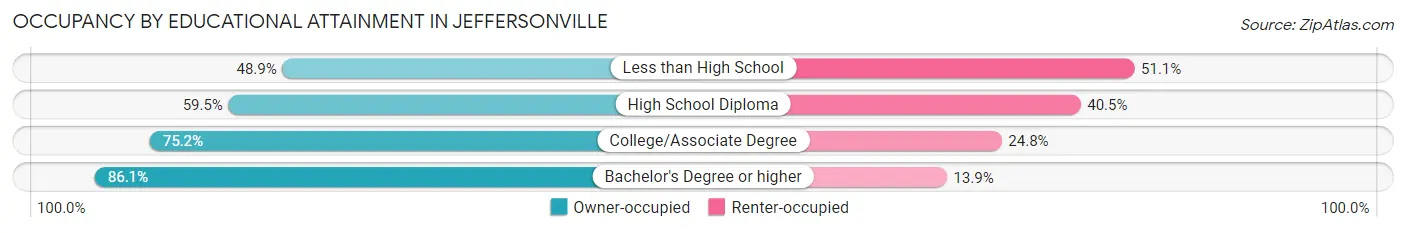
| Household Size | Owner-occupied | Renter-occupied |
| Less than High School | 727 (48.9%) | 761 (51.1%) |
| High School Diploma | 3,623 (59.5%) | 2,463 (40.5%) |
| College/Associate Degree | 5,583 (75.2%) | 1,844 (24.8%) |
| Bachelor's Degree or higher | 4,656 (86.1%) | 754 (13.9%) |
Occupancy by Age of Householder in Jeffersonville
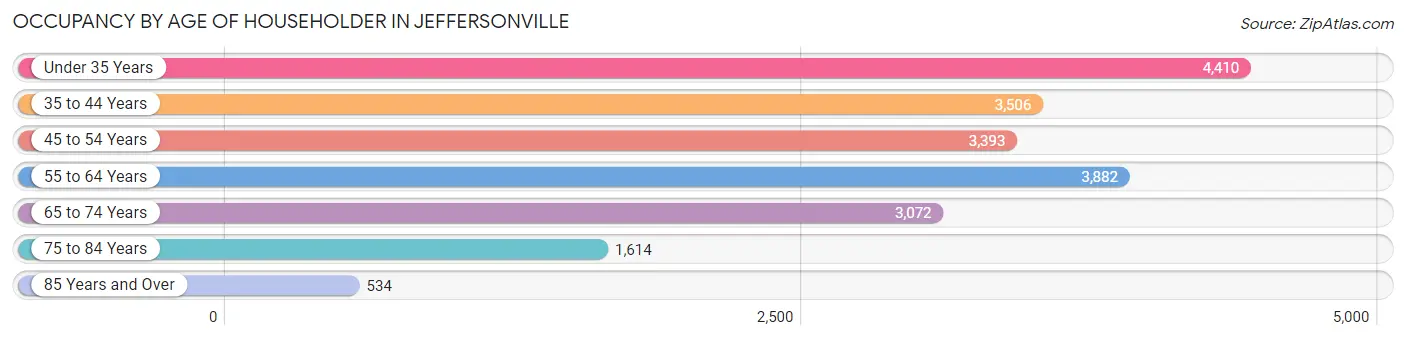
| Age Bracket | # Households | % Households |
| Under 35 Years | 4,410 | 21.6% |
| 35 to 44 Years | 3,506 | 17.2% |
| 45 to 54 Years | 3,393 | 16.6% |
| 55 to 64 Years | 3,882 | 19.0% |
| 65 to 74 Years | 3,072 | 15.0% |
| 75 to 84 Years | 1,614 | 7.9% |
| 85 Years and Over | 534 | 2.6% |
| Total | 20,411 | 100.0% |
Housing Finances in Jeffersonville
Median Income by Occupancy in Jeffersonville
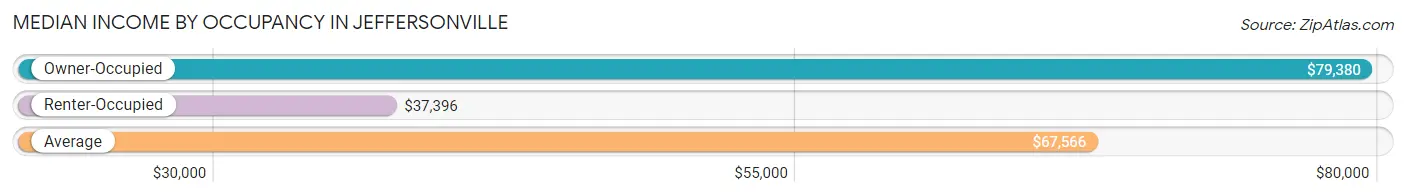
| Occupancy Type | # Households | Median Income |
| Owner-Occupied | 14,589 (71.5%) | $79,380 |
| Renter-Occupied | 5,822 (28.5%) | $37,396 |
| Average | 20,411 (100.0%) | $67,566 |
Occupancy by Householder Income Bracket in Jeffersonville
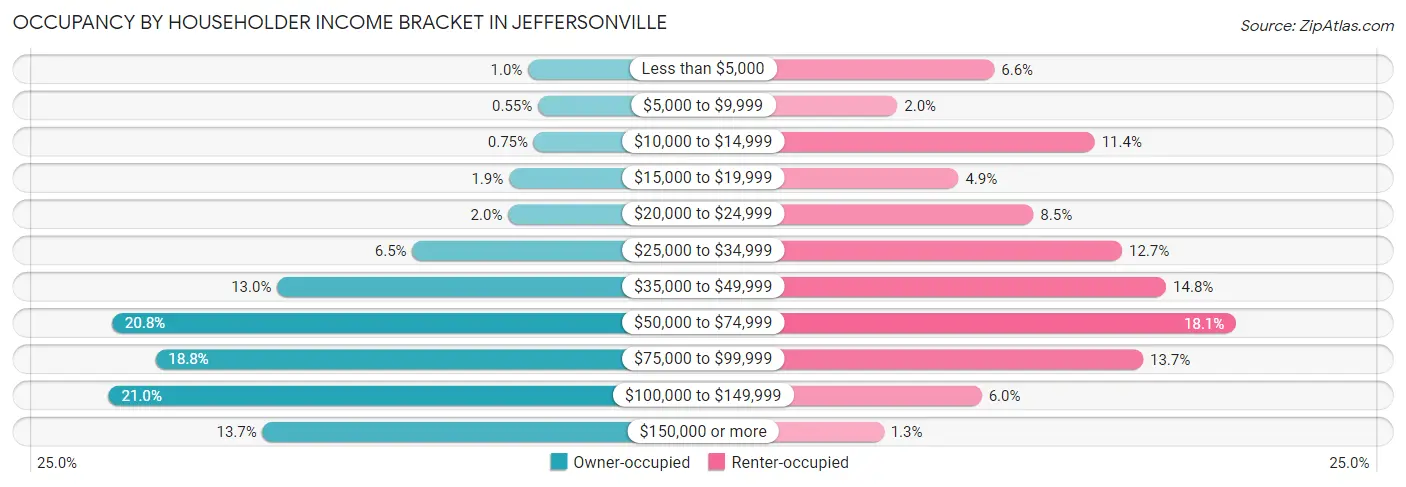
| Income Bracket | Owner-occupied | Renter-occupied |
| Less than $5,000 | 149 (1.0%) | 385 (6.6%) |
| $5,000 to $9,999 | 80 (0.5%) | 116 (2.0%) |
| $10,000 to $14,999 | 109 (0.7%) | 663 (11.4%) |
| $15,000 to $19,999 | 282 (1.9%) | 285 (4.9%) |
| $20,000 to $24,999 | 287 (2.0%) | 493 (8.5%) |
| $25,000 to $34,999 | 953 (6.5%) | 739 (12.7%) |
| $35,000 to $49,999 | 1,892 (13.0%) | 861 (14.8%) |
| $50,000 to $74,999 | 3,040 (20.8%) | 1,055 (18.1%) |
| $75,000 to $99,999 | 2,739 (18.8%) | 797 (13.7%) |
| $100,000 to $149,999 | 3,063 (21.0%) | 350 (6.0%) |
| $150,000 or more | 1,995 (13.7%) | 78 (1.3%) |
| Total | 14,589 (100.0%) | 5,822 (100.0%) |
Monthly Housing Cost Tiers in Jeffersonville
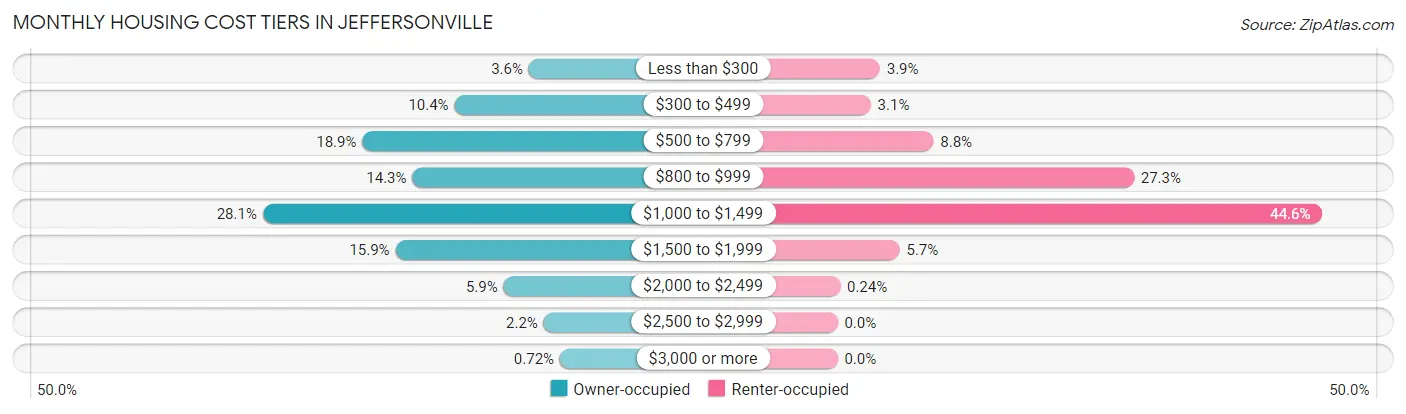
| Monthly Cost | Owner-occupied | Renter-occupied |
| Less than $300 | 522 (3.6%) | 227 (3.9%) |
| $300 to $499 | 1,522 (10.4%) | 178 (3.1%) |
| $500 to $799 | 2,759 (18.9%) | 514 (8.8%) |
| $800 to $999 | 2,086 (14.3%) | 1,588 (27.3%) |
| $1,000 to $1,499 | 4,097 (28.1%) | 2,599 (44.6%) |
| $1,500 to $1,999 | 2,314 (15.9%) | 333 (5.7%) |
| $2,000 to $2,499 | 862 (5.9%) | 14 (0.2%) |
| $2,500 to $2,999 | 322 (2.2%) | 0 (0.0%) |
| $3,000 or more | 105 (0.7%) | 0 (0.0%) |
| Total | 14,589 (100.0%) | 5,822 (100.0%) |
Physical Housing Characteristics in Jeffersonville
Housing Structures in Jeffersonville
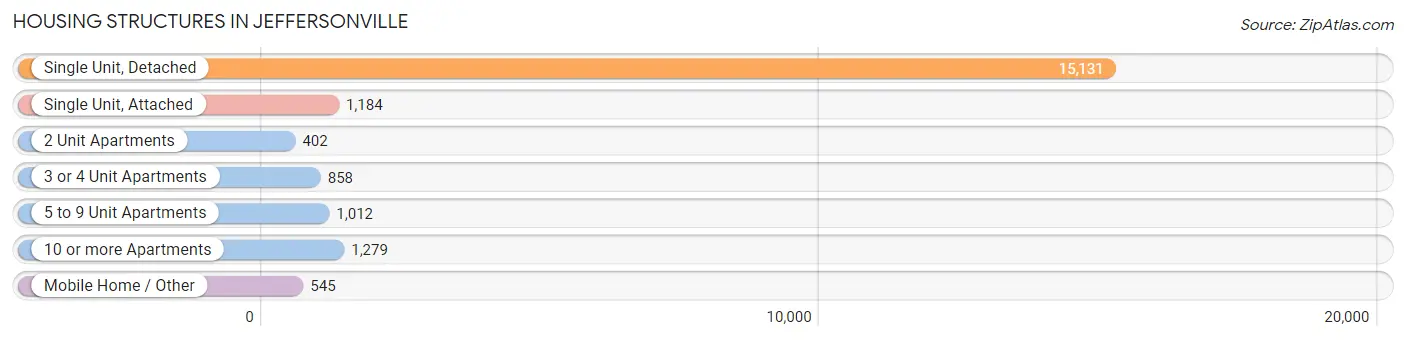
| Structure Type | # Housing Units | % Housing Units |
| Single Unit, Detached | 15,131 | 74.1% |
| Single Unit, Attached | 1,184 | 5.8% |
| 2 Unit Apartments | 402 | 2.0% |
| 3 or 4 Unit Apartments | 858 | 4.2% |
| 5 to 9 Unit Apartments | 1,012 | 5.0% |
| 10 or more Apartments | 1,279 | 6.3% |
| Mobile Home / Other | 545 | 2.7% |
| Total | 20,411 | 100.0% |
Housing Structures by Occupancy in Jeffersonville
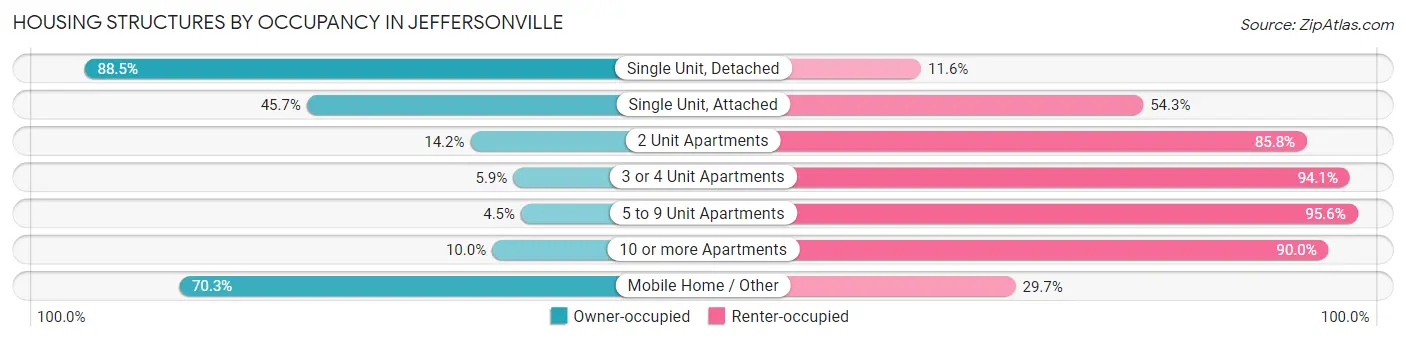
| Structure Type | Owner-occupied | Renter-occupied |
| Single Unit, Detached | 13,384 (88.4%) | 1,747 (11.6%) |
| Single Unit, Attached | 541 (45.7%) | 643 (54.3%) |
| 2 Unit Apartments | 57 (14.2%) | 345 (85.8%) |
| 3 or 4 Unit Apartments | 51 (5.9%) | 807 (94.1%) |
| 5 to 9 Unit Apartments | 45 (4.4%) | 967 (95.6%) |
| 10 or more Apartments | 128 (10.0%) | 1,151 (90.0%) |
| Mobile Home / Other | 383 (70.3%) | 162 (29.7%) |
| Total | 14,589 (71.5%) | 5,822 (28.5%) |
Housing Structures by Number of Rooms in Jeffersonville

| Number of Rooms | Owner-occupied | Renter-occupied |
| 1 Room | 0 (0.0%) | 104 (1.8%) |
| 2 or 3 Rooms | 176 (1.2%) | 1,222 (21.0%) |
| 4 or 5 Rooms | 5,226 (35.8%) | 3,519 (60.4%) |
| 6 or 7 Rooms | 5,801 (39.8%) | 789 (13.6%) |
| 8 or more Rooms | 3,386 (23.2%) | 188 (3.2%) |
| Total | 14,589 (100.0%) | 5,822 (100.0%) |
Housing Structure by Heating Type in Jeffersonville
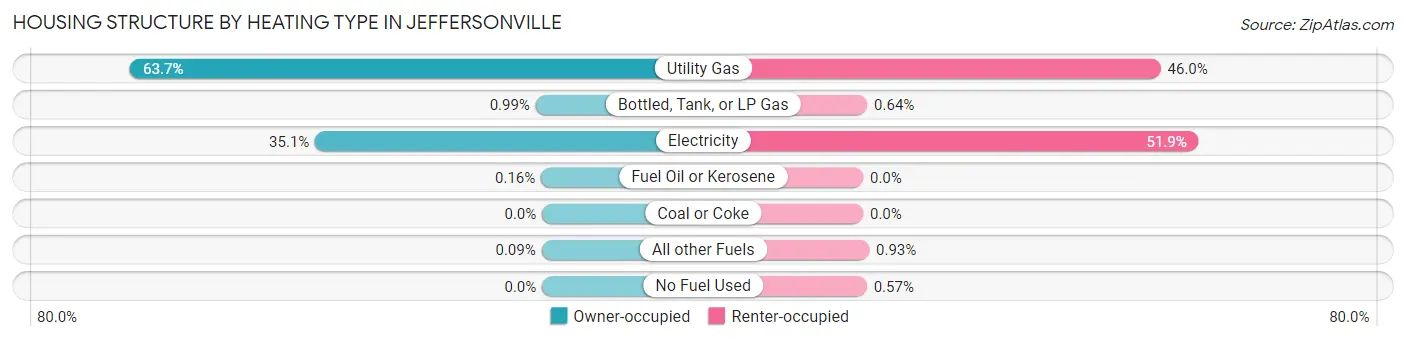
| Heating Type | Owner-occupied | Renter-occupied |
| Utility Gas | 9,290 (63.7%) | 2,678 (46.0%) |
| Bottled, Tank, or LP Gas | 144 (1.0%) | 37 (0.6%) |
| Electricity | 5,118 (35.1%) | 3,020 (51.9%) |
| Fuel Oil or Kerosene | 24 (0.2%) | 0 (0.0%) |
| Coal or Coke | 0 (0.0%) | 0 (0.0%) |
| All other Fuels | 13 (0.1%) | 54 (0.9%) |
| No Fuel Used | 0 (0.0%) | 33 (0.6%) |
| Total | 14,589 (100.0%) | 5,822 (100.0%) |
Household Vehicle Usage in Jeffersonville
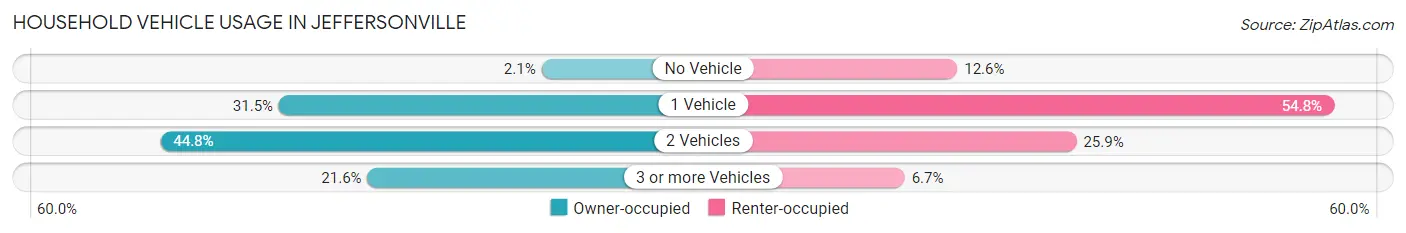
| Vehicles per Household | Owner-occupied | Renter-occupied |
| No Vehicle | 306 (2.1%) | 733 (12.6%) |
| 1 Vehicle | 4,597 (31.5%) | 3,189 (54.8%) |
| 2 Vehicles | 6,535 (44.8%) | 1,510 (25.9%) |
| 3 or more Vehicles | 3,151 (21.6%) | 390 (6.7%) |
| Total | 14,589 (100.0%) | 5,822 (100.0%) |
Real Estate & Mortgages in Jeffersonville
Real Estate and Mortgage Overview in Jeffersonville
| Characteristic | Without Mortgage | With Mortgage |
| Housing Units | 4,605 | 9,984 |
| Median Property Value | $177,400 | $190,800 |
| Median Household Income | $66,993 | $1,545 |
| Monthly Housing Costs | $531 | $74 |
| Real Estate Taxes | $1,692 | $251 |
Property Value by Mortgage Status in Jeffersonville
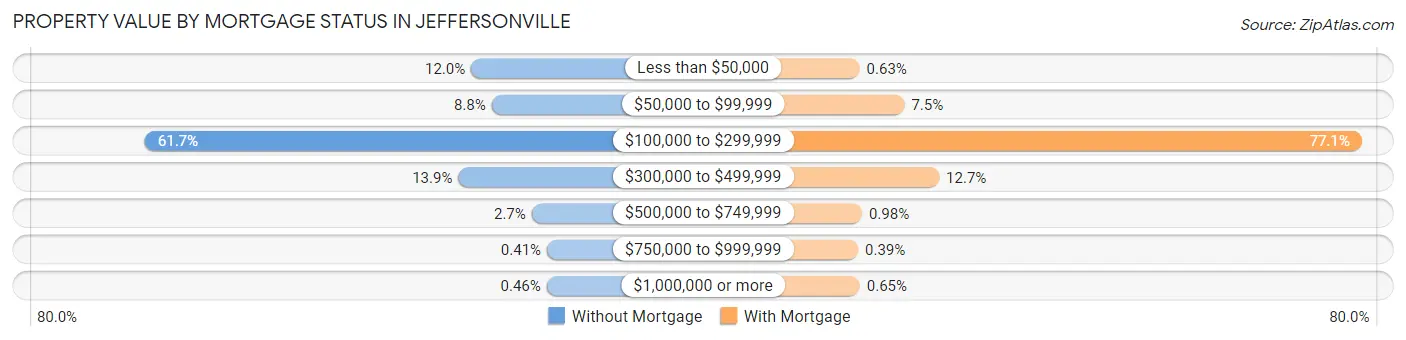
| Property Value | Without Mortgage | With Mortgage |
| Less than $50,000 | 551 (12.0%) | 63 (0.6%) |
| $50,000 to $99,999 | 407 (8.8%) | 745 (7.5%) |
| $100,000 to $299,999 | 2,840 (61.7%) | 7,702 (77.1%) |
| $300,000 to $499,999 | 641 (13.9%) | 1,272 (12.7%) |
| $500,000 to $749,999 | 126 (2.7%) | 98 (1.0%) |
| $750,000 to $999,999 | 19 (0.4%) | 39 (0.4%) |
| $1,000,000 or more | 21 (0.5%) | 65 (0.6%) |
| Total | 4,605 (100.0%) | 9,984 (100.0%) |
Household Income by Mortgage Status in Jeffersonville
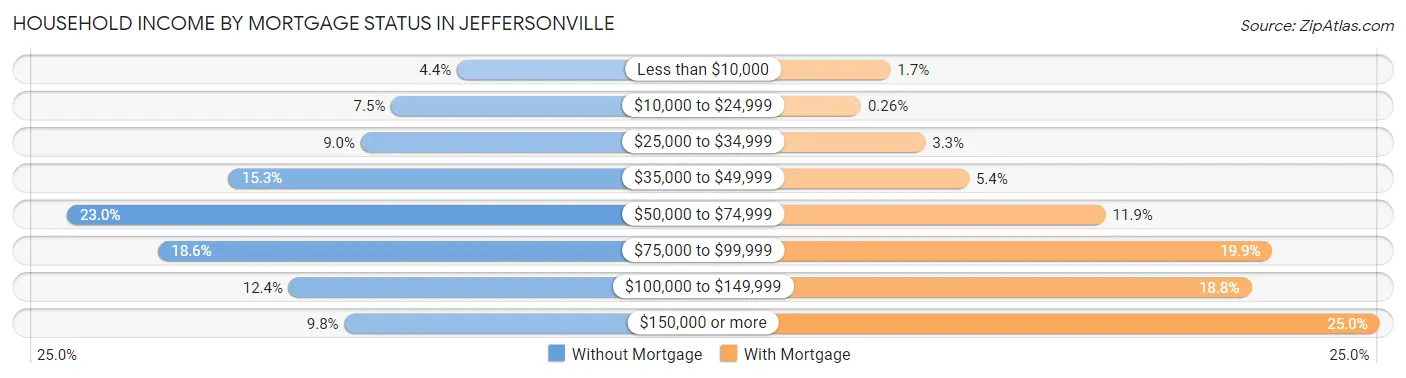
| Household Income | Without Mortgage | With Mortgage |
| Less than $10,000 | 203 (4.4%) | 166 (1.7%) |
| $10,000 to $24,999 | 347 (7.5%) | 26 (0.3%) |
| $25,000 to $34,999 | 414 (9.0%) | 331 (3.3%) |
| $35,000 to $49,999 | 703 (15.3%) | 539 (5.4%) |
| $50,000 to $74,999 | 1,058 (23.0%) | 1,189 (11.9%) |
| $75,000 to $99,999 | 858 (18.6%) | 1,982 (19.9%) |
| $100,000 to $149,999 | 572 (12.4%) | 1,881 (18.8%) |
| $150,000 or more | 450 (9.8%) | 2,491 (24.9%) |
| Total | 4,605 (100.0%) | 9,984 (100.0%) |
Property Value to Household Income Ratio in Jeffersonville
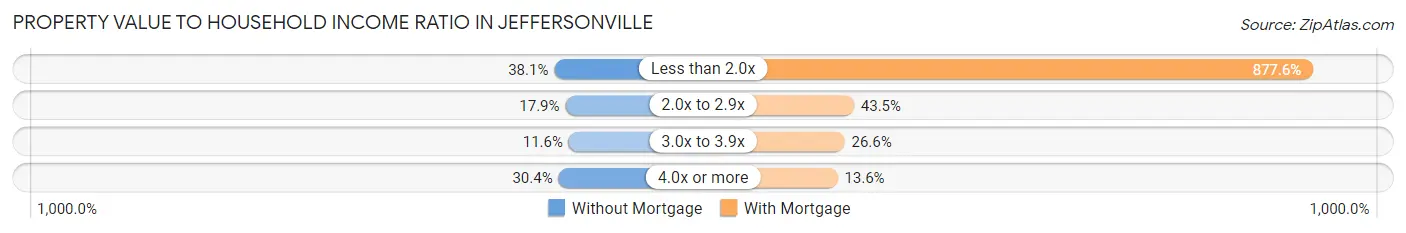
| Value-to-Income Ratio | Without Mortgage | With Mortgage |
| Less than 2.0x | 1,756 (38.1%) | 87,619 (877.6%) |
| 2.0x to 2.9x | 826 (17.9%) | 4,339 (43.5%) |
| 3.0x to 3.9x | 534 (11.6%) | 2,657 (26.6%) |
| 4.0x or more | 1,401 (30.4%) | 1,361 (13.6%) |
| Total | 4,605 (100.0%) | 9,984 (100.0%) |
Real Estate Taxes by Mortgage Status in Jeffersonville
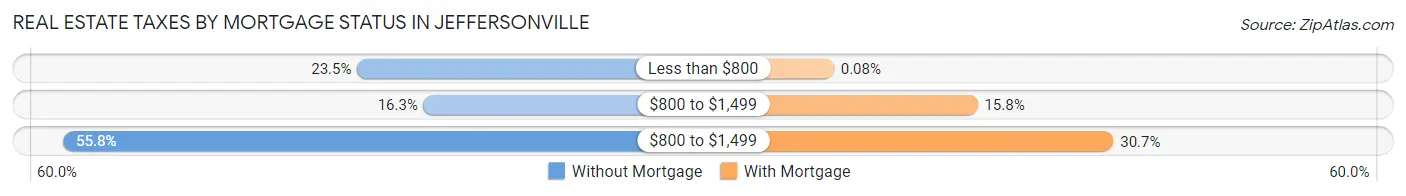
| Property Taxes | Without Mortgage | With Mortgage |
| Less than $800 | 1,084 (23.5%) | 8 (0.1%) |
| $800 to $1,499 | 749 (16.3%) | 1,580 (15.8%) |
| $800 to $1,499 | 2,568 (55.8%) | 3,066 (30.7%) |
| Total | 4,605 (100.0%) | 9,984 (100.0%) |
Health & Disability in Jeffersonville
Health Insurance Coverage by Age in Jeffersonville
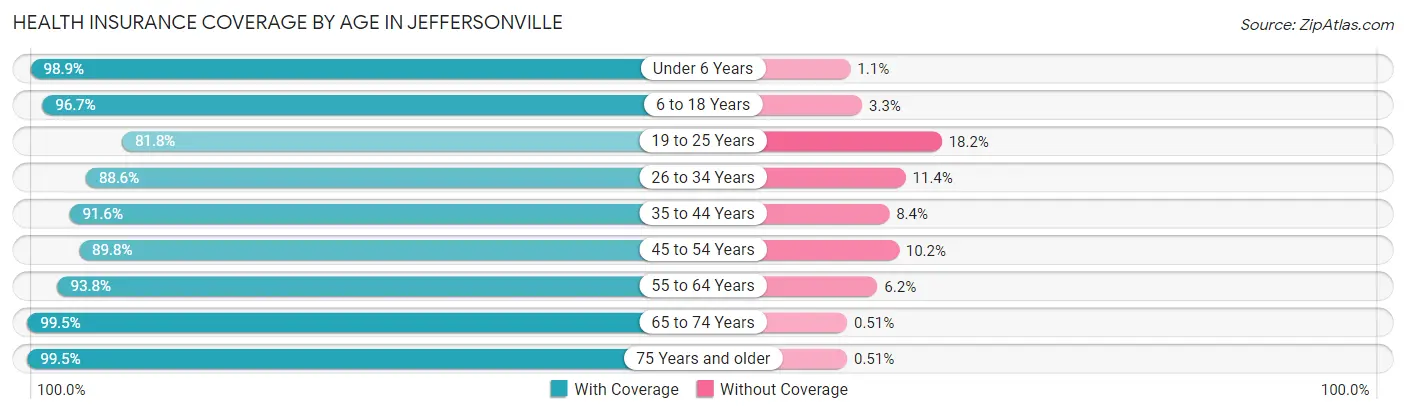
| Age Bracket | With Coverage | Without Coverage |
| Under 6 Years | 3,886 (98.9%) | 45 (1.1%) |
| 6 to 18 Years | 7,133 (96.7%) | 245 (3.3%) |
| 19 to 25 Years | 3,204 (81.8%) | 711 (18.2%) |
| 26 to 34 Years | 5,930 (88.6%) | 765 (11.4%) |
| 35 to 44 Years | 5,971 (91.6%) | 546 (8.4%) |
| 45 to 54 Years | 5,552 (89.8%) | 628 (10.2%) |
| 55 to 64 Years | 6,039 (93.8%) | 397 (6.2%) |
| 65 to 74 Years | 5,094 (99.5%) | 26 (0.5%) |
| 75 Years and older | 2,941 (99.5%) | 15 (0.5%) |
| Total | 45,750 (93.1%) | 3,378 (6.9%) |
Health Insurance Coverage by Citizenship Status in Jeffersonville
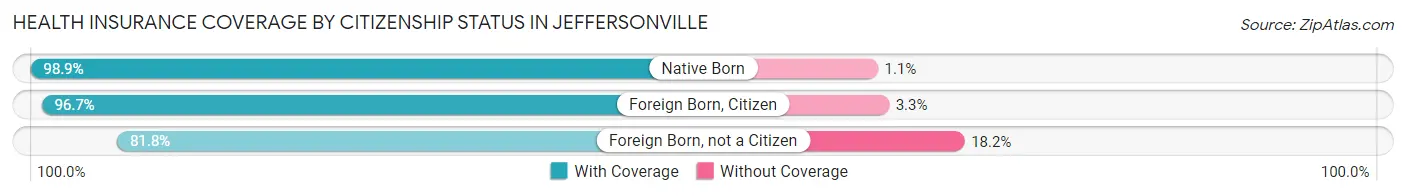
| Citizenship Status | With Coverage | Without Coverage |
| Native Born | 3,886 (98.9%) | 45 (1.1%) |
| Foreign Born, Citizen | 7,133 (96.7%) | 245 (3.3%) |
| Foreign Born, not a Citizen | 3,204 (81.8%) | 711 (18.2%) |
Health Insurance Coverage by Household Income in Jeffersonville
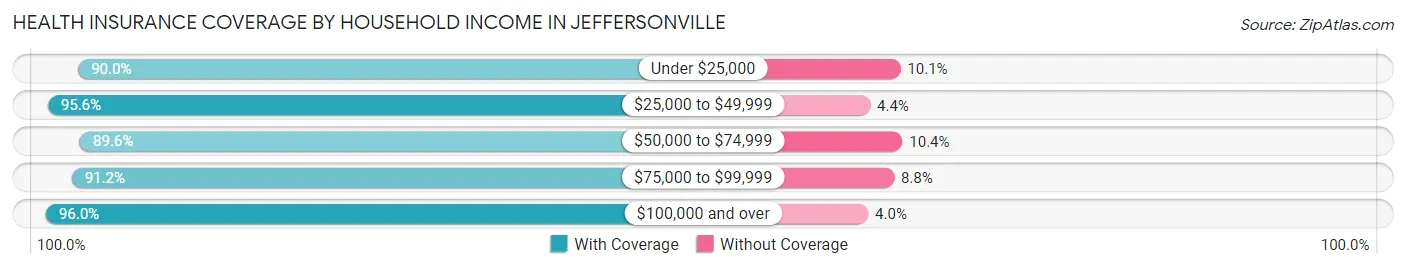
| Household Income | With Coverage | Without Coverage |
| Under $25,000 | 3,811 (89.9%) | 426 (10.1%) |
| $25,000 to $49,999 | 8,510 (95.6%) | 388 (4.4%) |
| $50,000 to $74,999 | 8,699 (89.6%) | 1,011 (10.4%) |
| $75,000 to $99,999 | 8,784 (91.2%) | 851 (8.8%) |
| $100,000 and over | 15,735 (96.0%) | 655 (4.0%) |
Public vs Private Health Insurance Coverage by Age in Jeffersonville
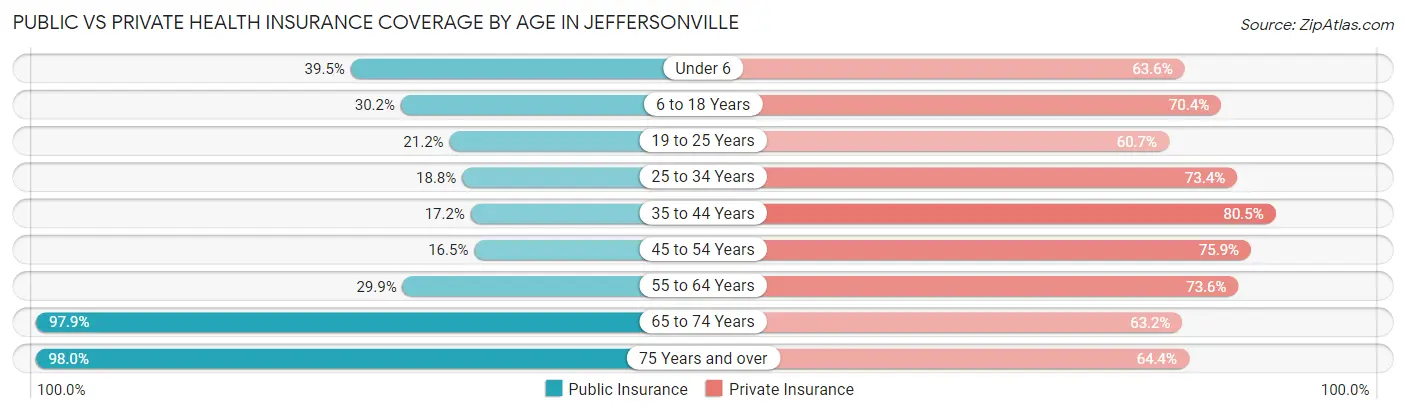
| Age Bracket | Public Insurance | Private Insurance |
| Under 6 | 1,552 (39.5%) | 2,500 (63.6%) |
| 6 to 18 Years | 2,227 (30.2%) | 5,195 (70.4%) |
| 19 to 25 Years | 828 (21.1%) | 2,376 (60.7%) |
| 25 to 34 Years | 1,258 (18.8%) | 4,913 (73.4%) |
| 35 to 44 Years | 1,121 (17.2%) | 5,246 (80.5%) |
| 45 to 54 Years | 1,022 (16.5%) | 4,693 (75.9%) |
| 55 to 64 Years | 1,922 (29.9%) | 4,736 (73.6%) |
| 65 to 74 Years | 5,011 (97.9%) | 3,236 (63.2%) |
| 75 Years and over | 2,896 (98.0%) | 1,904 (64.4%) |
| Total | 17,837 (36.3%) | 34,799 (70.8%) |
Disability Status by Sex by Age in Jeffersonville
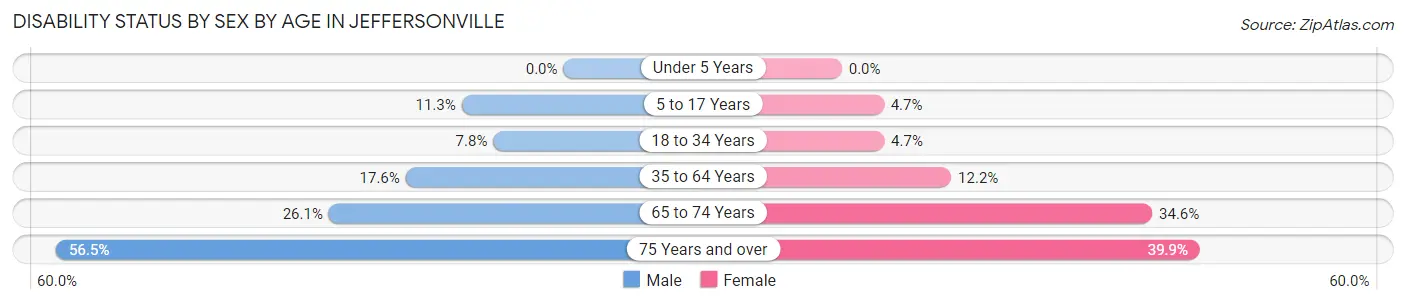
| Age Bracket | Male | Female |
| Under 5 Years | 0 (0.0%) | 0 (0.0%) |
| 5 to 17 Years | 467 (11.3%) | 166 (4.7%) |
| 18 to 34 Years | 430 (7.8%) | 266 (4.7%) |
| 35 to 64 Years | 1,679 (17.6%) | 1,167 (12.2%) |
| 65 to 74 Years | 616 (26.1%) | 955 (34.6%) |
| 75 Years and over | 613 (56.5%) | 746 (39.9%) |
Disability Class by Sex by Age in Jeffersonville
Disability Class: Hearing Difficulty
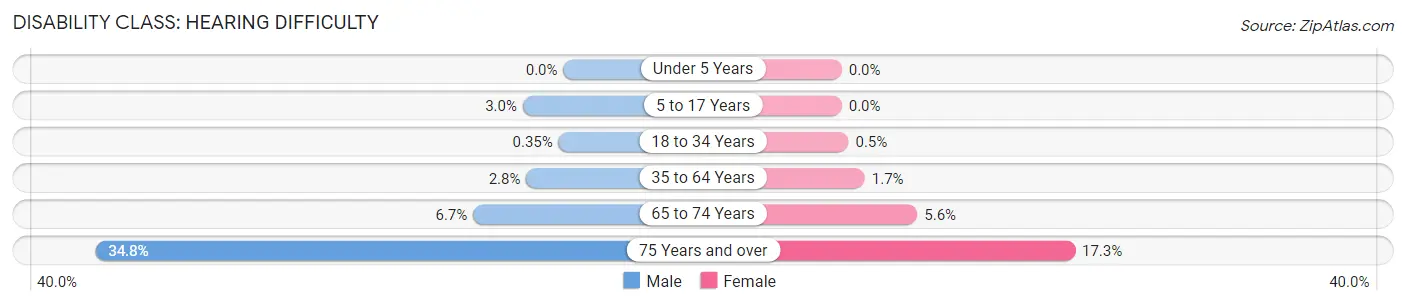
| Age Bracket | Male | Female |
| Under 5 Years | 0 (0.0%) | 0 (0.0%) |
| 5 to 17 Years | 124 (3.0%) | 0 (0.0%) |
| 18 to 34 Years | 19 (0.4%) | 28 (0.5%) |
| 35 to 64 Years | 263 (2.8%) | 164 (1.7%) |
| 65 to 74 Years | 158 (6.7%) | 155 (5.6%) |
| 75 Years and over | 377 (34.7%) | 324 (17.3%) |
Disability Class: Vision Difficulty
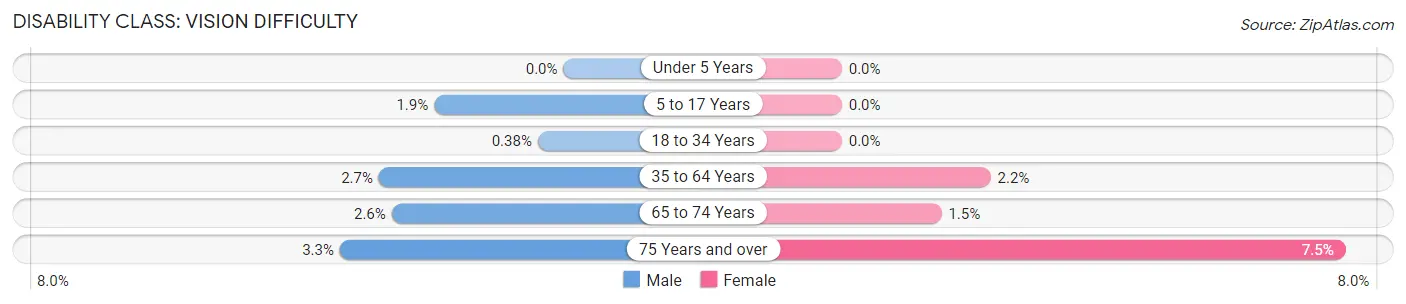
| Age Bracket | Male | Female |
| Under 5 Years | 0 (0.0%) | 0 (0.0%) |
| 5 to 17 Years | 79 (1.9%) | 0 (0.0%) |
| 18 to 34 Years | 21 (0.4%) | 0 (0.0%) |
| 35 to 64 Years | 262 (2.7%) | 212 (2.2%) |
| 65 to 74 Years | 60 (2.5%) | 41 (1.5%) |
| 75 Years and over | 36 (3.3%) | 140 (7.5%) |
Disability Class: Cognitive Difficulty
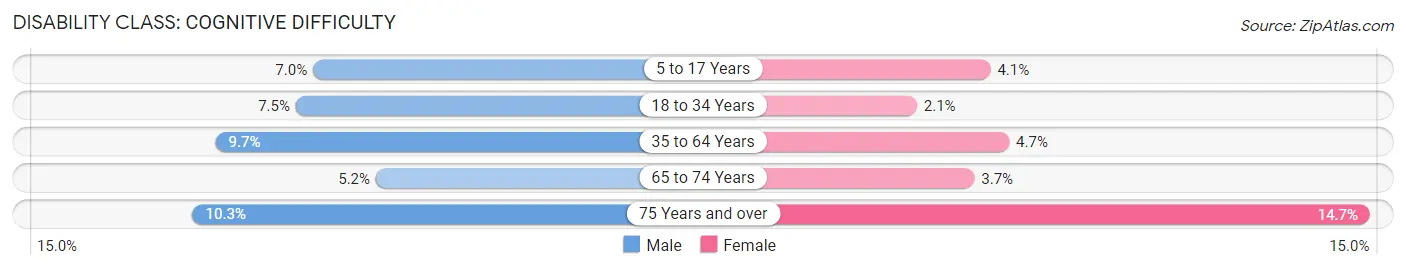
| Age Bracket | Male | Female |
| 5 to 17 Years | 287 (7.0%) | 147 (4.1%) |
| 18 to 34 Years | 410 (7.4%) | 118 (2.1%) |
| 35 to 64 Years | 925 (9.7%) | 446 (4.7%) |
| 65 to 74 Years | 123 (5.2%) | 102 (3.7%) |
| 75 Years and over | 112 (10.3%) | 275 (14.7%) |
Disability Class: Ambulatory Difficulty
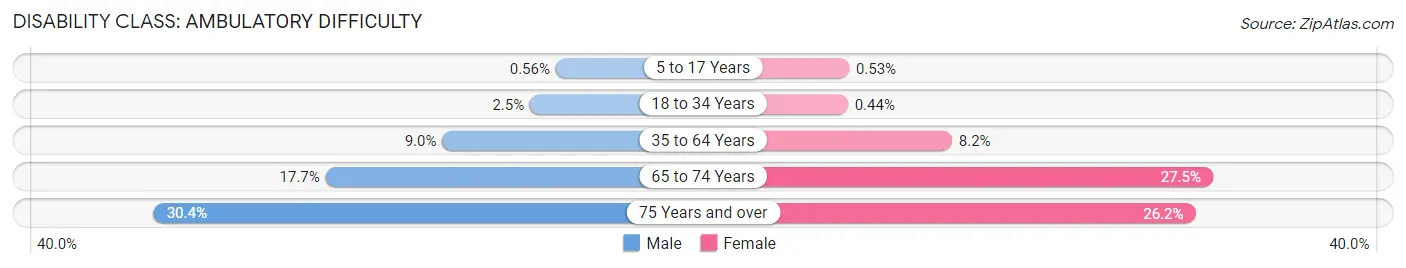
| Age Bracket | Male | Female |
| 5 to 17 Years | 23 (0.6%) | 19 (0.5%) |
| 18 to 34 Years | 136 (2.5%) | 25 (0.4%) |
| 35 to 64 Years | 859 (9.0%) | 783 (8.2%) |
| 65 to 74 Years | 416 (17.6%) | 761 (27.5%) |
| 75 Years and over | 330 (30.4%) | 491 (26.2%) |
Disability Class: Self-Care Difficulty
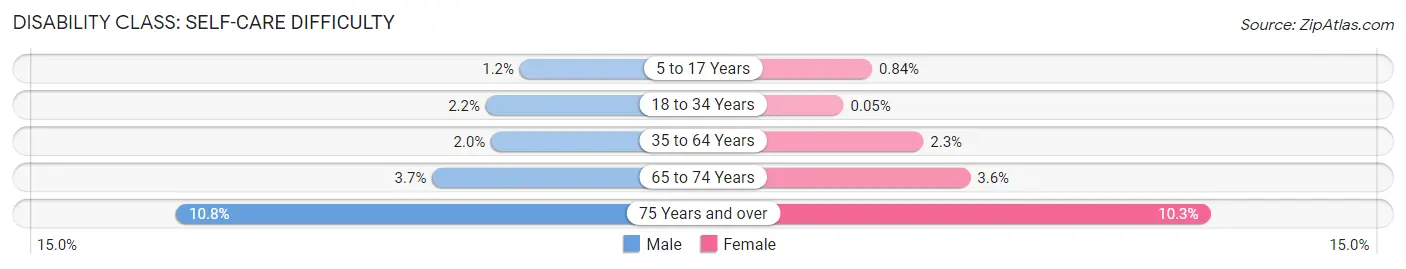
| Age Bracket | Male | Female |
| 5 to 17 Years | 50 (1.2%) | 30 (0.8%) |
| 18 to 34 Years | 119 (2.2%) | 3 (0.1%) |
| 35 to 64 Years | 192 (2.0%) | 217 (2.3%) |
| 65 to 74 Years | 86 (3.6%) | 99 (3.6%) |
| 75 Years and over | 117 (10.8%) | 192 (10.3%) |
Technology Access in Jeffersonville
Computing Device Access in Jeffersonville
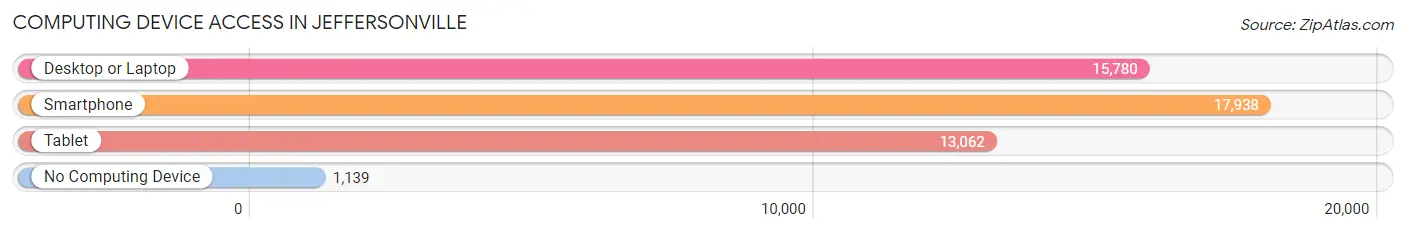
| Device Type | # Households | % Households |
| Desktop or Laptop | 15,780 | 77.3% |
| Smartphone | 17,938 | 87.9% |
| Tablet | 13,062 | 64.0% |
| No Computing Device | 1,139 | 5.6% |
| Total | 20,411 | 100.0% |
Internet Access in Jeffersonville
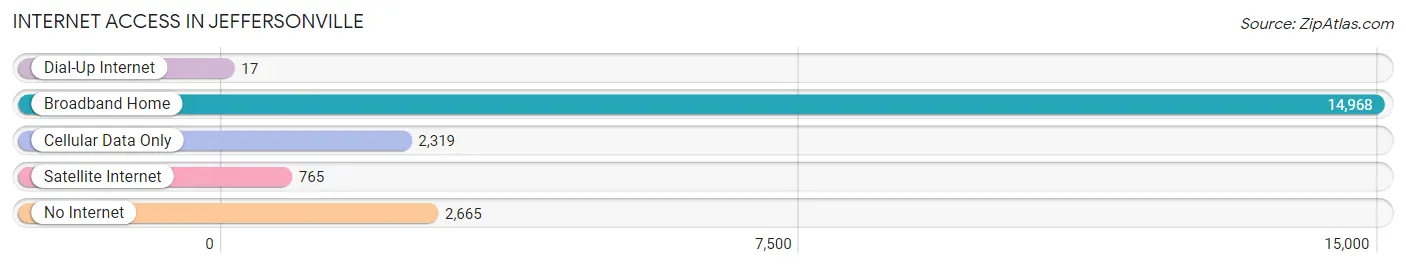
| Internet Type | # Households | % Households |
| Dial-Up Internet | 17 | 0.1% |
| Broadband Home | 14,968 | 73.3% |
| Cellular Data Only | 2,319 | 11.4% |
| Satellite Internet | 765 | 3.7% |
| No Internet | 2,665 | 13.1% |
| Total | 20,411 | 100.0% |
Jeffersonville Summary
Jeffersonville, Indiana is a city located in Clark County, Indiana, United States. It is situated along the Ohio River, directly across from Louisville, Kentucky. The city is the county seat of Clark County and is the 11th largest city in Indiana. As of the 2010 census, the city had a population of 44,953.
History
The area that is now Jeffersonville was first settled in 1786 by Col. George Rogers Clark and his men. The settlement was named Clarksville in honor of Clark. In 1802, the town was renamed Jeffersonville in honor of Thomas Jefferson. The city was incorporated in 1813 and became the county seat of Clark County in 1814.
In the 19th century, Jeffersonville was a major port on the Ohio River. It was a major center for the production of iron and steel products. The city was also home to several large manufacturing companies, including the Jeffersonville Boat and Machine Company, which produced steamboats and other vessels.
In the 20th century, Jeffersonville experienced a period of growth and development. The city was home to several large industrial plants, including the Jeffersonville Shipyard, which produced ships for the U.S. Navy during World War II. The city also became a major center for the automotive industry, with several large auto plants located in the city.
Geography
Jeffersonville is located in Clark County, Indiana, along the Ohio River. It is situated directly across from Louisville, Kentucky. The city has a total area of 16.2 square miles, of which 15.9 square miles is land and 0.3 square miles is water.
The city is located in the Central Lowlands region of the United States. The terrain is mostly flat, with some rolling hills in the northern and western parts of the city. The climate is humid continental, with hot, humid summers and cold, snowy winters.
Economy
Jeffersonville is a major center for the automotive industry. The city is home to several large auto plants, including the Toyota Motor Manufacturing Indiana plant, which produces the Toyota Highlander and the Toyota Sequoia. The city is also home to several other automotive-related businesses, including the Cummins Engine Company, which produces diesel engines.
The city is also home to several large manufacturing companies, including the Jeffersonville Boat and Machine Company, which produces steamboats and other vessels. The city is also home to several large industrial plants, including the Jeffersonville Shipyard, which produces ships for the U.S. Navy.
Demographics
As of the 2010 census, the city had a population of 44,953. The racial makeup of the city was 79.2% White, 15.3% African American, 0.4% Native American, 1.2% Asian, 0.1% Pacific Islander, 1.7% from other races, and 2.1% from two or more races. Hispanic or Latino of any race were 4.2% of the population.
The median income for a household in the city was $37,945, and the median income for a family was $45,945. The per capita income for the city was $20,945. About 14.2% of families and 17.3% of the population were below the poverty line, including 25.2% of those under age 18 and 8.7% of those age 65 or over.
Common Questions
What is Per Capita Income in Jeffersonville?
Per Capita income in Jeffersonville is $34,587.
What is the Median Family Income in Jeffersonville?
Median Family Income in Jeffersonville is $75,826.
What is the Median Household income in Jeffersonville?
Median Household Income in Jeffersonville is $67,566.
What is Income or Wage Gap in Jeffersonville?
Income or Wage Gap in Jeffersonville is 17.9%.
Women in Jeffersonville earn 82.1 cents for every dollar earned by a man.
What is Family Income Deficit in Jeffersonville?
Family Income Deficit in Jeffersonville is $8,235.
Families that are below poverty line in Jeffersonville earn $8,235 less on average than the poverty threshold level.
What is Inequality or Gini Index in Jeffersonville?
Inequality or Gini Index in Jeffersonville is 0.40.
What is the Total Population of Jeffersonville?
Total Population of Jeffersonville is 49,771.
What is the Total Male Population of Jeffersonville?
Total Male Population of Jeffersonville is 24,601.
What is the Total Female Population of Jeffersonville?
Total Female Population of Jeffersonville is 25,170.
What is the Ratio of Males per 100 Females in Jeffersonville?
There are 97.74 Males per 100 Females in Jeffersonville.
What is the Ratio of Females per 100 Males in Jeffersonville?
There are 102.31 Females per 100 Males in Jeffersonville.
What is the Median Population Age in Jeffersonville?
Median Population Age in Jeffersonville is 38.6 Years.
What is the Average Family Size in Jeffersonville
Average Family Size in Jeffersonville is 3.0 People.
What is the Average Household Size in Jeffersonville
Average Household Size in Jeffersonville is 2.4 People.
How Large is the Labor Force in Jeffersonville?
There are 26,516 People in the Labor Forcein in Jeffersonville.
What is the Percentage of People in the Labor Force in Jeffersonville?
66.2% of People are in the Labor Force in Jeffersonville.
What is the Unemployment Rate in Jeffersonville?
Unemployment Rate in Jeffersonville is 3.6%.