Kokomo, IN Map & Demographics
Kokomo Map
Kokomo Overview
$30,738
PER CAPITA INCOME
$68,839
AVG FAMILY INCOME
$53,967
AVG HOUSEHOLD INCOME
28.1%
WAGE / INCOME GAP [ % ]
71.9¢/ $1
WAGE / INCOME GAP [ $ ]
$10,681
FAMILY INCOME DEFICIT
0.43
INEQUALITY / GINI INDEX
59,534
TOTAL POPULATION
28,076
MALE POPULATION
31,458
FEMALE POPULATION
89.25
MALES / 100 FEMALES
112.05
FEMALES / 100 MALES
39.8
MEDIAN AGE
2.9
AVG FAMILY SIZE
2.2
AVG HOUSEHOLD SIZE
27,727
LABOR FORCE [ PEOPLE ]
58.2%
PERCENT IN LABOR FORCE
6.1%
UNEMPLOYMENT RATE
Kokomo Area Codes
Income in Kokomo
Income Overview in Kokomo
Per Capita Income in Kokomo is $30,738, while median incomes of families and households are $68,839 and $53,967 respectively.
| Characteristic | Number | Measure |
| Per Capita Income | 59,534 | $30,738 |
| Median Family Income | 14,793 | $68,839 |
| Mean Family Income | 14,793 | $83,869 |
| Median Household Income | 26,066 | $53,967 |
| Mean Household Income | 26,066 | $69,069 |
| Income Deficit | 14,793 | $10,681 |
| Wage / Income Gap (%) | 59,534 | 28.10% |
| Wage / Income Gap ($) | 59,534 | 71.90¢ per $1 |
| Gini / Inequality Index | 59,534 | 0.43 |
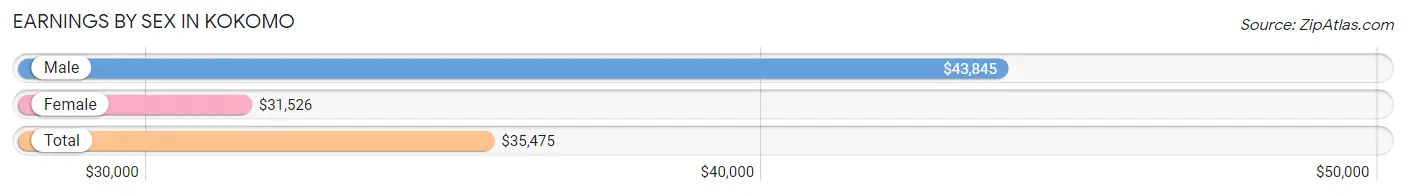
Earnings by Sex in Kokomo
Average Earnings in Kokomo are $35,475, $43,845 for men and $31,526 for women, a difference of 28.1%.
| Sex | Number | Average Earnings |
| Male | 14,264 (48.7%) | $43,845 |
| Female | 15,000 (51.3%) | $31,526 |
| Total | 29,264 (100.0%) | $35,475 |
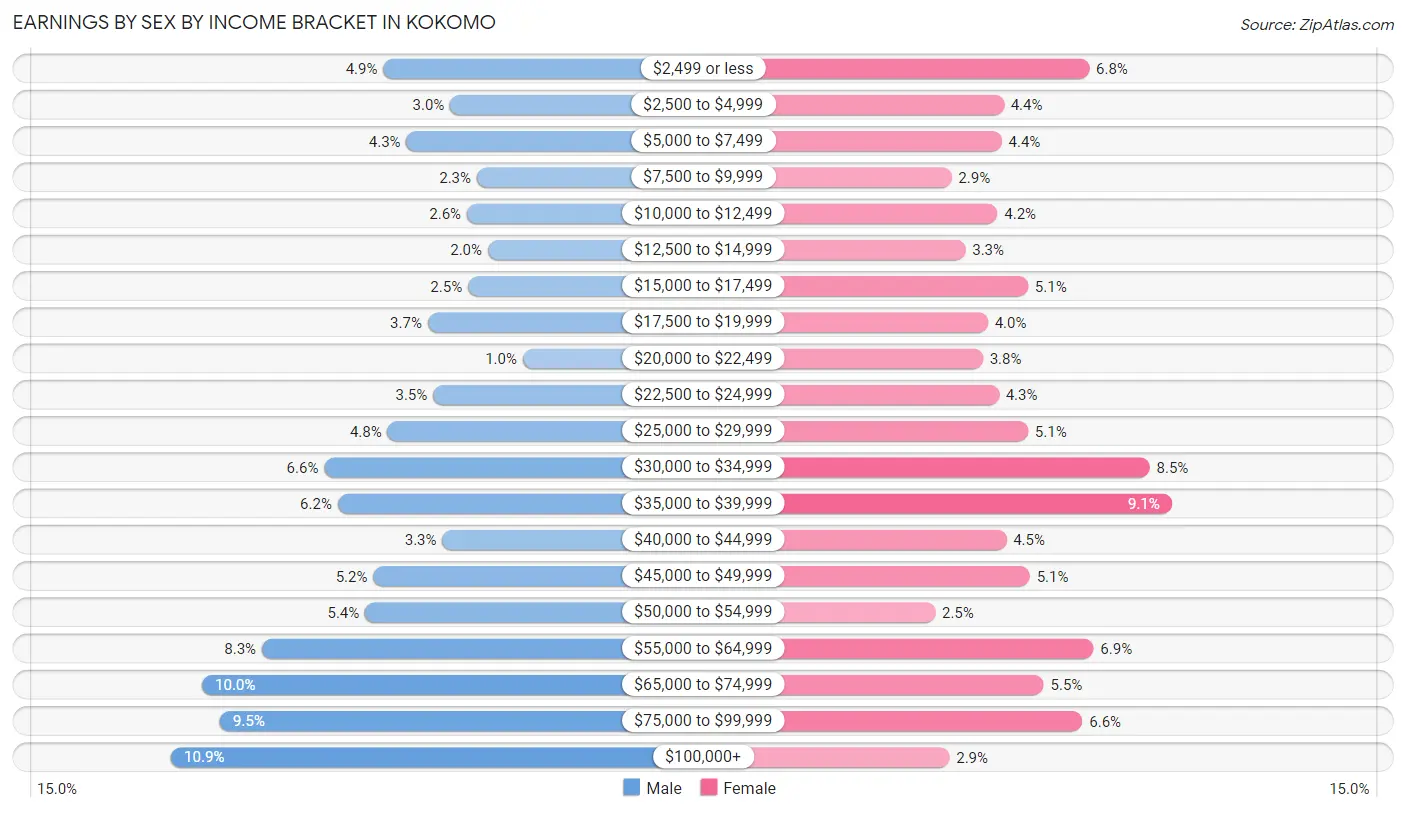
Earnings by Sex by Income Bracket in Kokomo
The most common earnings brackets in Kokomo are $100,000+ for men (1,552 | 10.9%) and $35,000 to $39,999 for women (1,370 | 9.1%).
| Income | Male | Female |
| $2,499 or less | 702 (4.9%) | 1,022 (6.8%) |
| $2,500 to $4,999 | 433 (3.0%) | 662 (4.4%) |
| $5,000 to $7,499 | 609 (4.3%) | 653 (4.3%) |
| $7,500 to $9,999 | 326 (2.3%) | 441 (2.9%) |
| $10,000 to $12,499 | 366 (2.6%) | 634 (4.2%) |
| $12,500 to $14,999 | 283 (2.0%) | 500 (3.3%) |
| $15,000 to $17,499 | 363 (2.5%) | 763 (5.1%) |
| $17,500 to $19,999 | 524 (3.7%) | 594 (4.0%) |
| $20,000 to $22,499 | 142 (1.0%) | 573 (3.8%) |
| $22,500 to $24,999 | 502 (3.5%) | 641 (4.3%) |
| $25,000 to $29,999 | 684 (4.8%) | 763 (5.1%) |
| $30,000 to $34,999 | 939 (6.6%) | 1,276 (8.5%) |
| $35,000 to $39,999 | 885 (6.2%) | 1,370 (9.1%) |
| $40,000 to $44,999 | 465 (3.3%) | 672 (4.5%) |
| $45,000 to $49,999 | 742 (5.2%) | 771 (5.1%) |
| $50,000 to $54,999 | 775 (5.4%) | 372 (2.5%) |
| $55,000 to $64,999 | 1,188 (8.3%) | 1,039 (6.9%) |
| $65,000 to $74,999 | 1,428 (10.0%) | 829 (5.5%) |
| $75,000 to $99,999 | 1,356 (9.5%) | 993 (6.6%) |
| $100,000+ | 1,552 (10.9%) | 432 (2.9%) |
| Total | 14,264 (100.0%) | 15,000 (100.0%) |
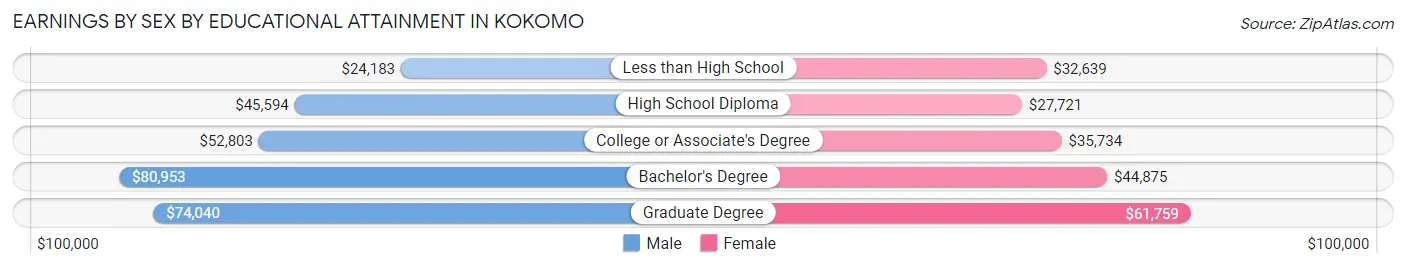
Earnings by Sex by Educational Attainment in Kokomo
Average earnings in Kokomo are $50,685 for men and $34,438 for women, a difference of 32.1%. Men with an educational attainment of bachelor's degree enjoy the highest average annual earnings of $80,953, while those with less than high school education earn the least with $24,183. Women with an educational attainment of graduate degree earn the most with the average annual earnings of $61,759, while those with high school diploma education have the smallest earnings of $27,721.
| Educational Attainment | Male Income | Female Income |
| Less than High School | $24,183 | $32,639 |
| High School Diploma | $45,594 | $27,721 |
| College or Associate's Degree | $52,803 | $35,734 |
| Bachelor's Degree | $80,953 | $44,875 |
| Graduate Degree | $74,040 | $61,759 |
| Total | $50,685 | $34,438 |
Family Income in Kokomo
Family Income Brackets in Kokomo
According to the Kokomo family income data, there are 3,033 families falling into the $50,000 to $74,999 income range, which is the most common income bracket and makes up 20.5% of all families. Conversely, the $10,000 to $14,999 income bracket is the least frequent group with only 296 families (2.0%) belonging to this category.
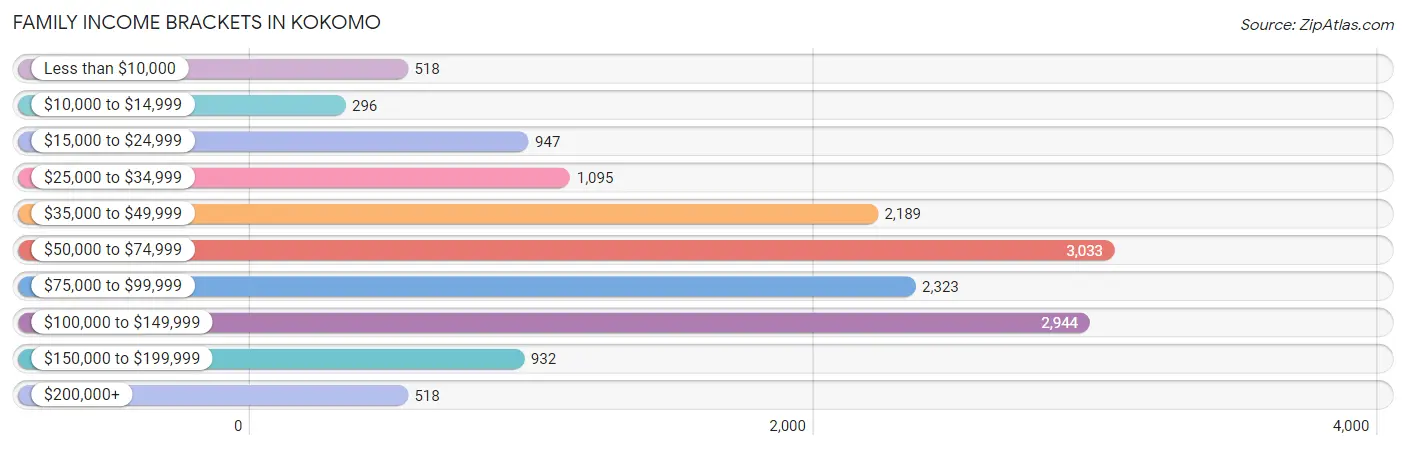
| Income Bracket | # Families | % Families |
| Less than $10,000 | 518 | 3.5% |
| $10,000 to $14,999 | 296 | 2.0% |
| $15,000 to $24,999 | 947 | 6.4% |
| $25,000 to $34,999 | 1,095 | 7.4% |
| $35,000 to $49,999 | 2,189 | 14.8% |
| $50,000 to $74,999 | 3,033 | 20.5% |
| $75,000 to $99,999 | 2,323 | 15.7% |
| $100,000 to $149,999 | 2,944 | 19.9% |
| $150,000 to $199,999 | 932 | 6.3% |
| $200,000+ | 518 | 3.5% |
Family Income by Famaliy Size in Kokomo
7+ person families (118 | 0.8%) account for the highest median family income in Kokomo with $101,014 per family, while 2-person families (7,824 | 52.9%) have the highest median income of $33,147 per family member.
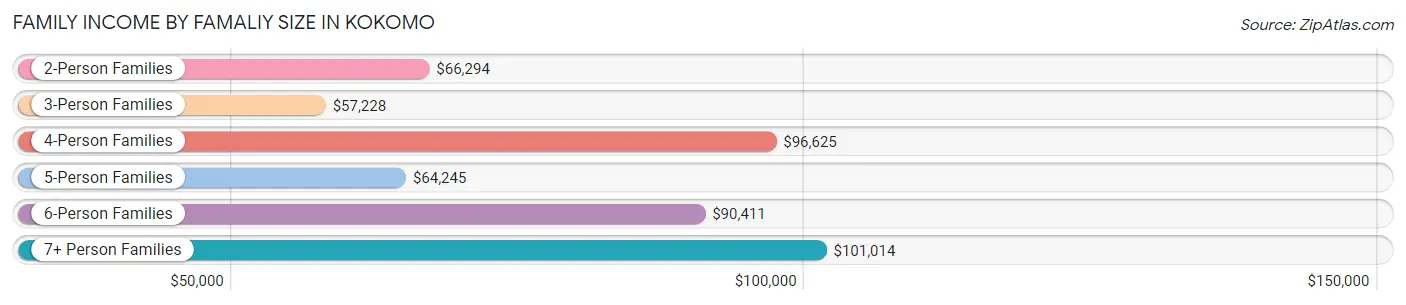
| Income Bracket | # Families | Median Income |
| 2-Person Families | 7,824 (52.9%) | $66,294 |
| 3-Person Families | 2,978 (20.1%) | $57,228 |
| 4-Person Families | 2,191 (14.8%) | $96,625 |
| 5-Person Families | 1,303 (8.8%) | $64,245 |
| 6-Person Families | 379 (2.6%) | $90,411 |
| 7+ Person Families | 118 (0.8%) | $101,014 |
| Total | 14,793 (100.0%) | $68,839 |
Family Income by Number of Earners in Kokomo
The median family income in Kokomo is $68,839, with families comprising 3+ earners (1,472) having the highest median family income of $128,289, while families with 1 earner (5,268) have the lowest median family income of $51,241, accounting for 10.0% and 35.6% of families, respectively.
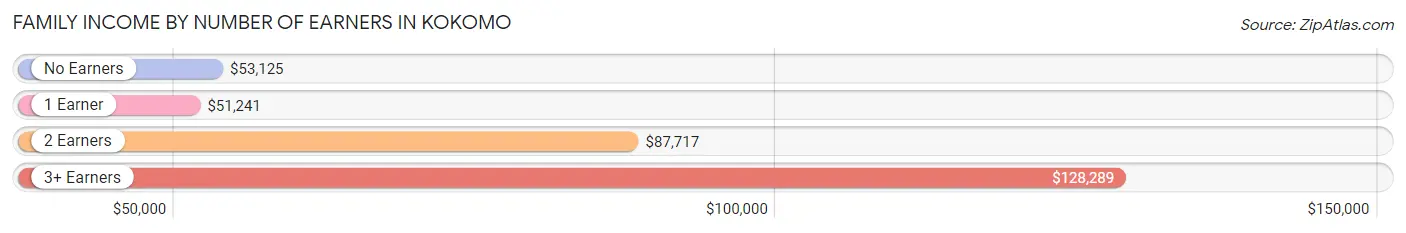
| Number of Earners | # Families | Median Income |
| No Earners | 2,931 (19.8%) | $53,125 |
| 1 Earner | 5,268 (35.6%) | $51,241 |
| 2 Earners | 5,122 (34.6%) | $87,717 |
| 3+ Earners | 1,472 (10.0%) | $128,289 |
| Total | 14,793 (100.0%) | $68,839 |
Household Income in Kokomo
Household Income Brackets in Kokomo
With 5,005 households falling in the category, the $50,000 to $74,999 income range is the most frequent in Kokomo, accounting for 19.2% of all households. In contrast, only 652 households (2.5%) fall into the $200,000+ income bracket, making it the least populous group.
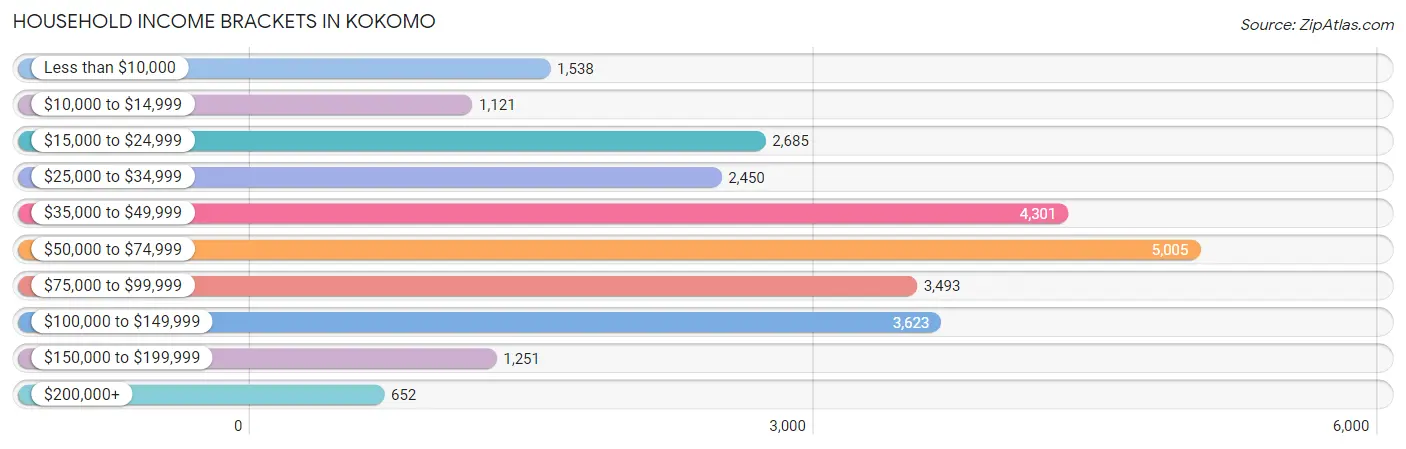
| Income Bracket | # Households | % Households |
| Less than $10,000 | 1,538 | 5.9% |
| $10,000 to $14,999 | 1,121 | 4.3% |
| $15,000 to $24,999 | 2,685 | 10.3% |
| $25,000 to $34,999 | 2,450 | 9.4% |
| $35,000 to $49,999 | 4,301 | 16.5% |
| $50,000 to $74,999 | 5,005 | 19.2% |
| $75,000 to $99,999 | 3,493 | 13.4% |
| $100,000 to $149,999 | 3,623 | 13.9% |
| $150,000 to $199,999 | 1,251 | 4.8% |
| $200,000+ | 652 | 2.5% |
Household Income by Householder Age in Kokomo
The median household income in Kokomo is $53,967, with the highest median household income of $65,822 found in the 45 to 64 years age bracket for the primary householder. A total of 9,381 households (36.0%) fall into this category. Meanwhile, the 15 to 24 years age bracket for the primary householder has the lowest median household income of $30,615, with 1,006 households (3.9%) in this group.
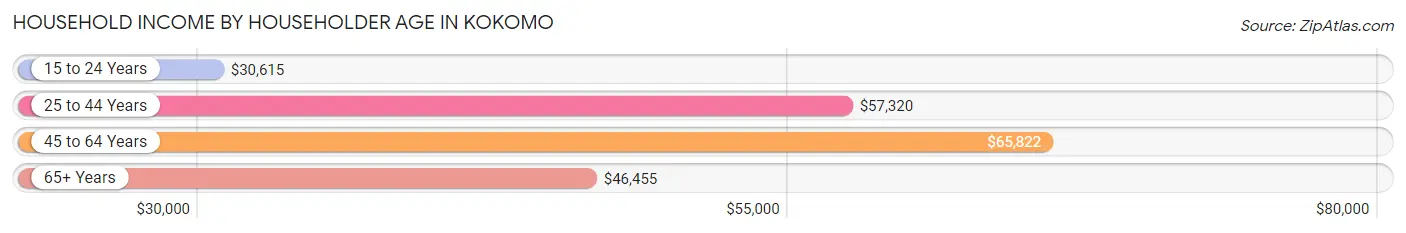
| Income Bracket | # Households | Median Income |
| 15 to 24 Years | 1,006 (3.9%) | $30,615 |
| 25 to 44 Years | 7,703 (29.5%) | $57,320 |
| 45 to 64 Years | 9,381 (36.0%) | $65,822 |
| 65+ Years | 7,976 (30.6%) | $46,455 |
| Total | 26,066 (100.0%) | $53,967 |
Poverty in Kokomo
Income Below Poverty by Sex and Age in Kokomo
With 13.6% poverty level for males and 15.7% for females among the residents of Kokomo, 16 and 17 year old males and 6 to 11 year old females are the most vulnerable to poverty, with 200 males (23.5%) and 591 females (25.0%) in their respective age groups living below the poverty level.
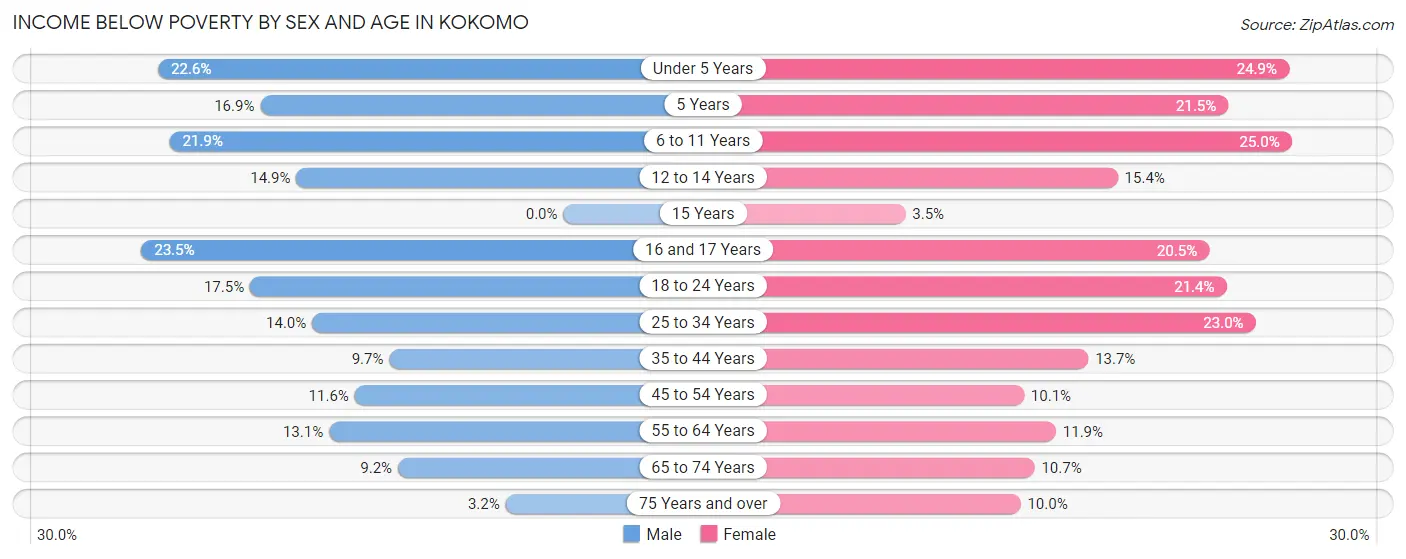
| Age Bracket | Male | Female |
| Under 5 Years | 364 (22.6%) | 408 (24.9%) |
| 5 Years | 40 (16.9%) | 74 (21.5%) |
| 6 to 11 Years | 542 (21.9%) | 591 (25.0%) |
| 12 to 14 Years | 172 (14.9%) | 157 (15.4%) |
| 15 Years | 0 (0.0%) | 13 (3.5%) |
| 16 and 17 Years | 200 (23.5%) | 155 (20.4%) |
| 18 to 24 Years | 452 (17.4%) | 524 (21.4%) |
| 25 to 34 Years | 549 (14.0%) | 887 (23.0%) |
| 35 to 44 Years | 300 (9.7%) | 481 (13.7%) |
| 45 to 54 Years | 409 (11.6%) | 377 (10.1%) |
| 55 to 64 Years | 426 (13.1%) | 533 (11.9%) |
| 65 to 74 Years | 220 (9.2%) | 364 (10.7%) |
| 75 Years and over | 62 (3.2%) | 302 (10.0%) |
| Total | 3,736 (13.6%) | 4,866 (15.7%) |
Income Above Poverty by Sex and Age in Kokomo
According to the poverty statistics in Kokomo, males aged 15 years and females aged 15 years are the age groups that are most secure financially, with 100.0% of males and 96.5% of females in these age groups living above the poverty line.
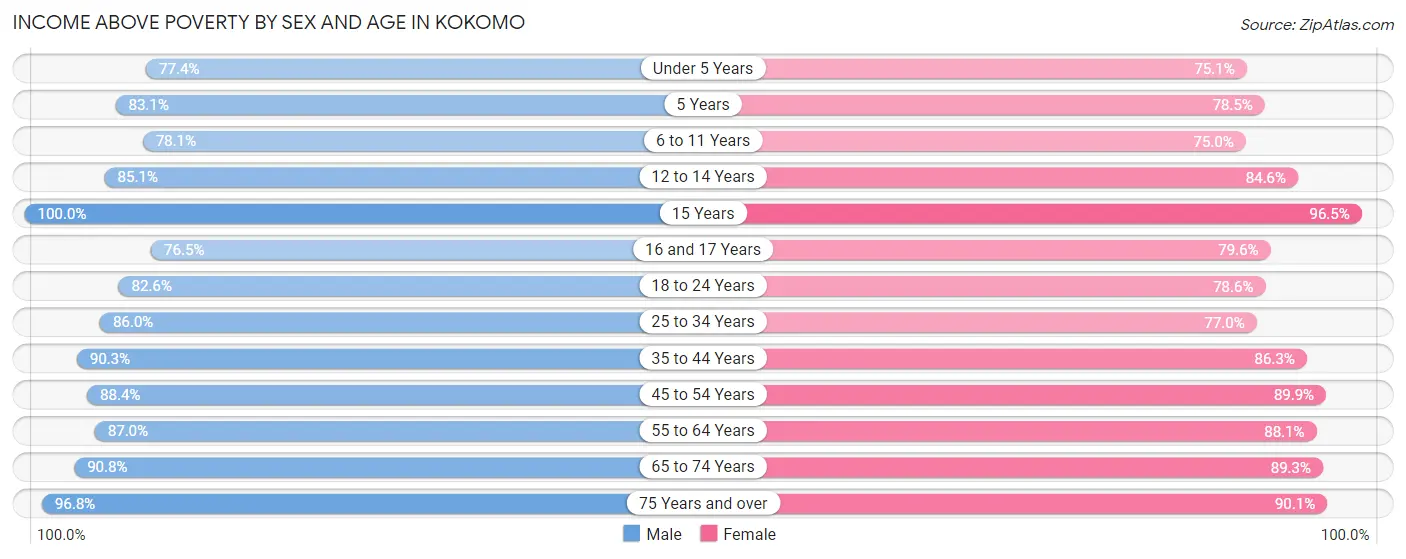
| Age Bracket | Male | Female |
| Under 5 Years | 1,249 (77.4%) | 1,231 (75.1%) |
| 5 Years | 197 (83.1%) | 270 (78.5%) |
| 6 to 11 Years | 1,929 (78.1%) | 1,769 (75.0%) |
| 12 to 14 Years | 985 (85.1%) | 865 (84.6%) |
| 15 Years | 354 (100.0%) | 354 (96.5%) |
| 16 and 17 Years | 651 (76.5%) | 603 (79.5%) |
| 18 to 24 Years | 2,139 (82.6%) | 1,924 (78.6%) |
| 25 to 34 Years | 3,374 (86.0%) | 2,965 (77.0%) |
| 35 to 44 Years | 2,797 (90.3%) | 3,026 (86.3%) |
| 45 to 54 Years | 3,111 (88.4%) | 3,341 (89.9%) |
| 55 to 64 Years | 2,839 (87.0%) | 3,938 (88.1%) |
| 65 to 74 Years | 2,170 (90.8%) | 3,029 (89.3%) |
| 75 Years and over | 1,864 (96.8%) | 2,732 (90.0%) |
| Total | 23,659 (86.4%) | 26,047 (84.3%) |
Income Below Poverty Among Married-Couple Families in Kokomo
The poverty statistics for married-couple families in Kokomo show that 3.9% or 350 of the total 9,009 families live below the poverty line. Families with 3 or 4 children have the highest poverty rate of 19.0%, comprising of 155 families. On the other hand, families with 5 or more children have the lowest poverty rate of 0.0%, which includes 0 families.
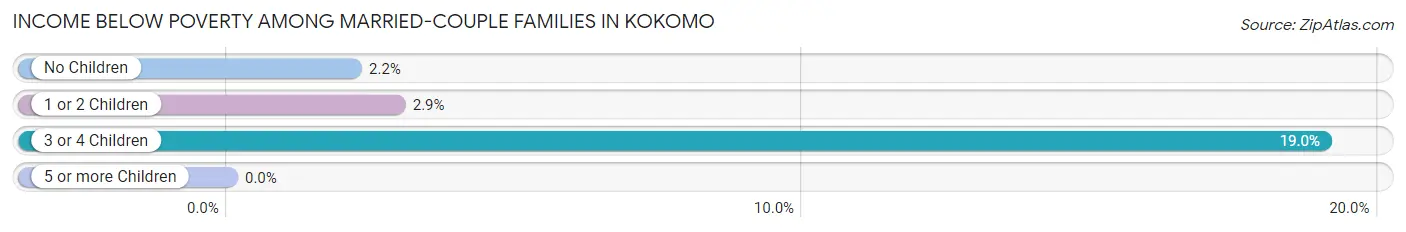
| Children | Above Poverty | Below Poverty |
| No Children | 5,532 (97.8%) | 122 (2.2%) |
| 1 or 2 Children | 2,430 (97.1%) | 73 (2.9%) |
| 3 or 4 Children | 659 (81.0%) | 155 (19.0%) |
| 5 or more Children | 38 (100.0%) | 0 (0.0%) |
| Total | 8,659 (96.1%) | 350 (3.9%) |
Income Below Poverty Among Single-Parent Households in Kokomo
According to the poverty data in Kokomo, 15.1% or 220 single-father households and 24.9% or 1,078 single-mother households are living below the poverty line. Among single-father households, those with 3 or 4 children have the highest poverty rate, with 50 households (30.9%) experiencing poverty. Likewise, among single-mother households, those with 3 or 4 children have the highest poverty rate, with 194 households (53.4%) falling below the poverty line.
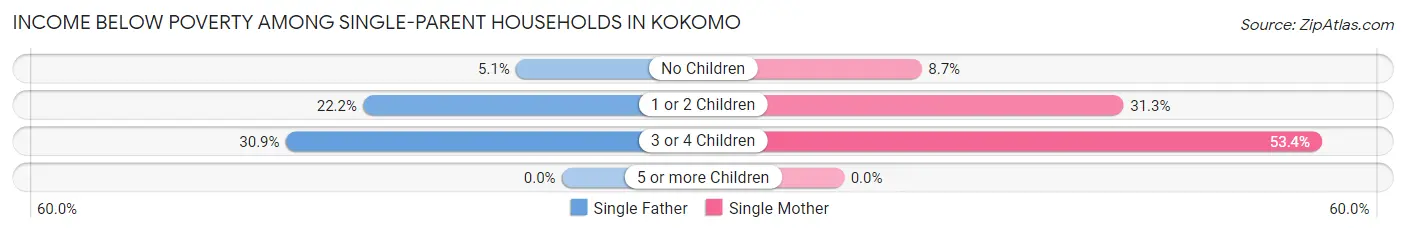
| Children | Single Father | Single Mother |
| No Children | 35 (5.1%) | 134 (8.7%) |
| 1 or 2 Children | 135 (22.2%) | 750 (31.2%) |
| 3 or 4 Children | 50 (30.9%) | 194 (53.4%) |
| 5 or more Children | 0 (0.0%) | 0 (0.0%) |
| Total | 220 (15.1%) | 1,078 (24.9%) |
Income Below Poverty Among Married-Couple vs Single-Parent Households in Kokomo
The poverty data for Kokomo shows that 350 of the married-couple family households (3.9%) and 1,298 of the single-parent households (22.4%) are living below the poverty level. Within the married-couple family households, those with 3 or 4 children have the highest poverty rate, with 155 households (19.0%) falling below the poverty line. Among the single-parent households, those with 3 or 4 children have the highest poverty rate, with 244 household (46.5%) living below poverty.
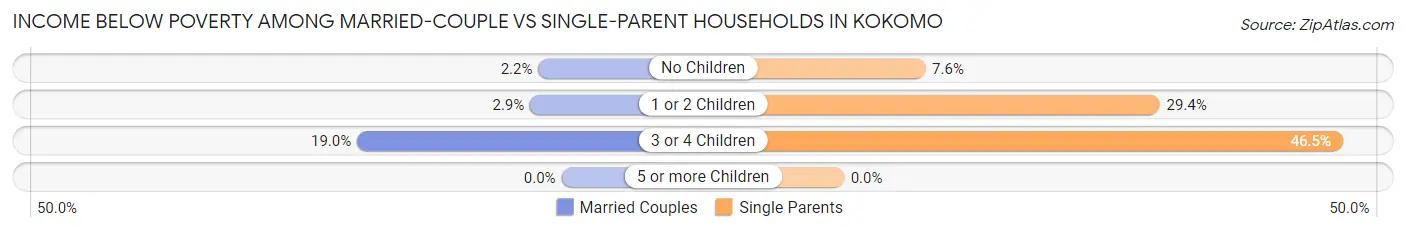
| Children | Married-Couple Families | Single-Parent Households |
| No Children | 122 (2.2%) | 169 (7.6%) |
| 1 or 2 Children | 73 (2.9%) | 885 (29.4%) |
| 3 or 4 Children | 155 (19.0%) | 244 (46.5%) |
| 5 or more Children | 0 (0.0%) | 0 (0.0%) |
| Total | 350 (3.9%) | 1,298 (22.4%) |
Race in Kokomo
The most populous races in Kokomo are White / Caucasian (48,823 | 82.0%), Black / African American (6,239 | 10.5%), and Two or more Races (2,806 | 4.7%).
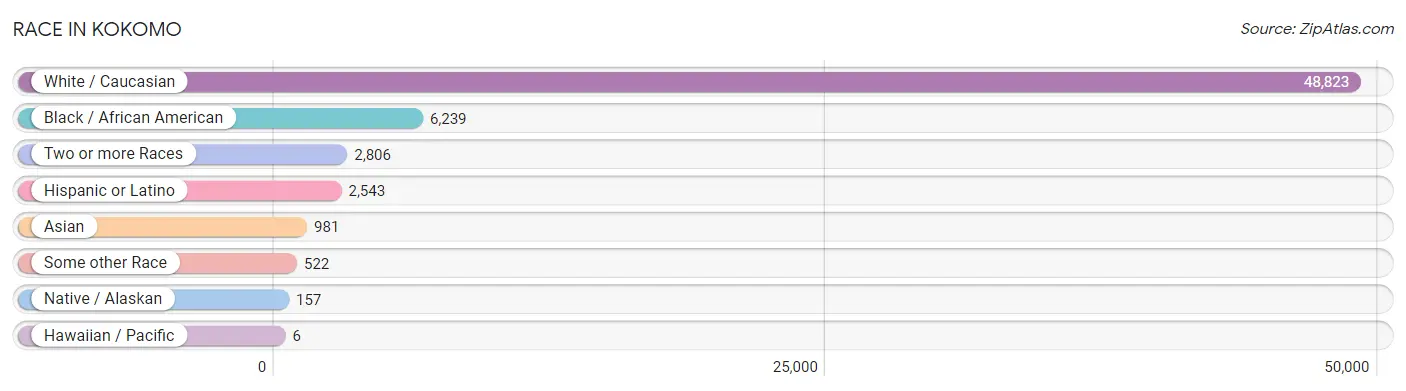
| Race | # Population | % Population |
| Asian | 981 | 1.7% |
| Black / African American | 6,239 | 10.5% |
| Hawaiian / Pacific | 6 | 0.0% |
| Hispanic or Latino | 2,543 | 4.3% |
| Native / Alaskan | 157 | 0.3% |
| White / Caucasian | 48,823 | 82.0% |
| Two or more Races | 2,806 | 4.7% |
| Some other Race | 522 | 0.9% |
| Total | 59,534 | 100.0% |
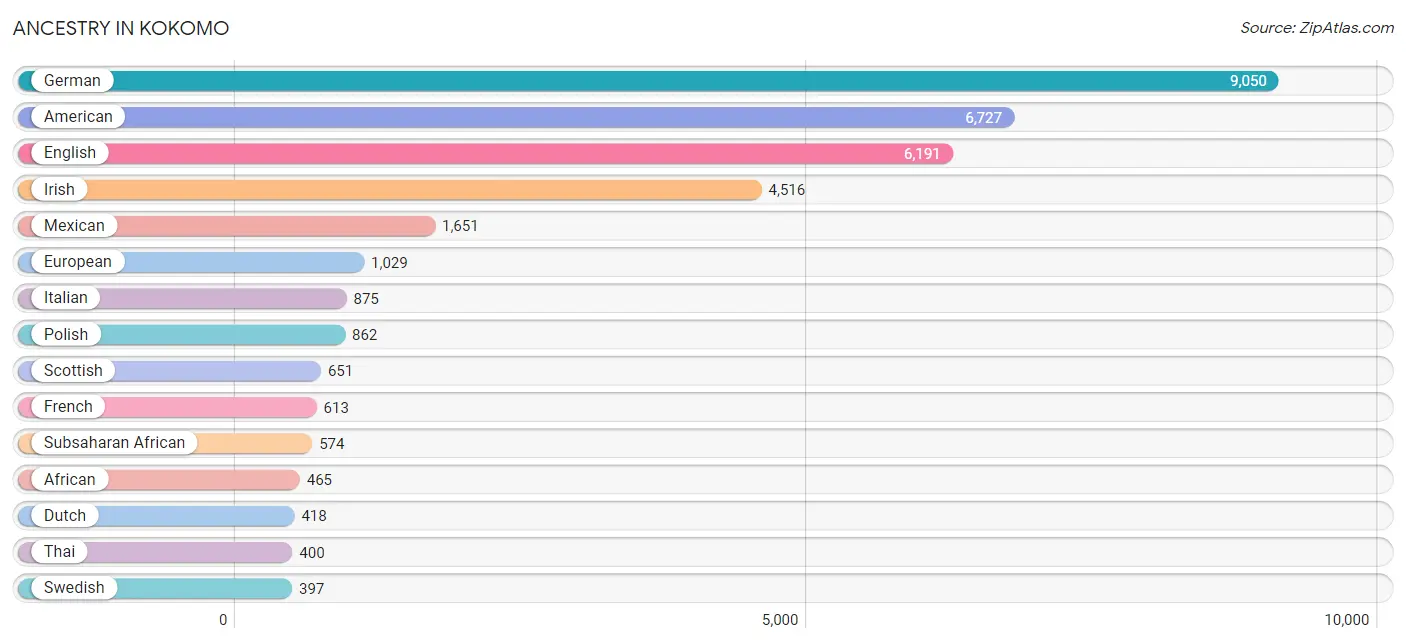
Ancestry in Kokomo
The most populous ancestries reported in Kokomo are German (9,050 | 15.2%), American (6,727 | 11.3%), English (6,191 | 10.4%), Irish (4,516 | 7.6%), and Mexican (1,651 | 2.8%), together accounting for 47.3% of all Kokomo residents.
| Ancestry | # Population | % Population |
| African | 465 | 0.8% |
| American | 6,727 | 11.3% |
| Arab | 66 | 0.1% |
| Argentinean | 68 | 0.1% |
| Australian | 15 | 0.0% |
| Austrian | 41 | 0.1% |
| Bahamian | 54 | 0.1% |
| Belgian | 61 | 0.1% |
| Bhutanese | 80 | 0.1% |
| Blackfeet | 151 | 0.3% |
| British | 345 | 0.6% |
| Bulgarian | 25 | 0.0% |
| Burmese | 94 | 0.2% |
| Cajun | 23 | 0.0% |
| Central American | 61 | 0.1% |
| Cherokee | 137 | 0.2% |
| Choctaw | 44 | 0.1% |
| Creek | 10 | 0.0% |
| Cuban | 186 | 0.3% |
| Czech | 9 | 0.0% |
| Czechoslovakian | 10 | 0.0% |
| Danish | 83 | 0.1% |
| Dominican | 38 | 0.1% |
| Dutch | 418 | 0.7% |
| Eastern European | 109 | 0.2% |
| English | 6,191 | 10.4% |
| Ethiopian | 9 | 0.0% |
| European | 1,029 | 1.7% |
| French | 613 | 1.0% |
| French Canadian | 68 | 0.1% |
| German | 9,050 | 15.2% |
| Greek | 201 | 0.3% |
| Guamanian / Chamorro | 5 | 0.0% |
| Guatemalan | 36 | 0.1% |
| Haitian | 76 | 0.1% |
| Hungarian | 63 | 0.1% |
| Indian (Asian) | 34 | 0.1% |
| Iranian | 44 | 0.1% |
| Irish | 4,516 | 7.6% |
| Iroquois | 51 | 0.1% |
| Italian | 875 | 1.5% |
| Japanese | 252 | 0.4% |
| Korean | 353 | 0.6% |
| Lebanese | 19 | 0.0% |
| Liberian | 50 | 0.1% |
| Lithuanian | 4 | 0.0% |
| Mexican | 1,651 | 2.8% |
| Mexican American Indian | 44 | 0.1% |
| Moroccan | 14 | 0.0% |
| Native Hawaiian | 29 | 0.1% |
| Nigerian | 50 | 0.1% |
| Norwegian | 321 | 0.5% |
| Pennsylvania German | 11 | 0.0% |
| Polish | 862 | 1.5% |
| Portuguese | 21 | 0.0% |
| Puerto Rican | 219 | 0.4% |
| Romanian | 128 | 0.2% |
| Russian | 121 | 0.2% |
| Salvadoran | 25 | 0.0% |
| Samoan | 24 | 0.0% |
| Scandinavian | 98 | 0.2% |
| Scotch-Irish | 337 | 0.6% |
| Scottish | 651 | 1.1% |
| Serbian | 22 | 0.0% |
| Sioux | 7 | 0.0% |
| Slovak | 3 | 0.0% |
| Slovene | 13 | 0.0% |
| South American | 68 | 0.1% |
| Spaniard | 112 | 0.2% |
| Sri Lankan | 156 | 0.3% |
| Subsaharan African | 574 | 1.0% |
| Swedish | 397 | 0.7% |
| Swiss | 231 | 0.4% |
| Syrian | 33 | 0.1% |
| Thai | 400 | 0.7% |
| Ukrainian | 8 | 0.0% |
| Welsh | 69 | 0.1% | View All 77 Rows |
Immigrants in Kokomo
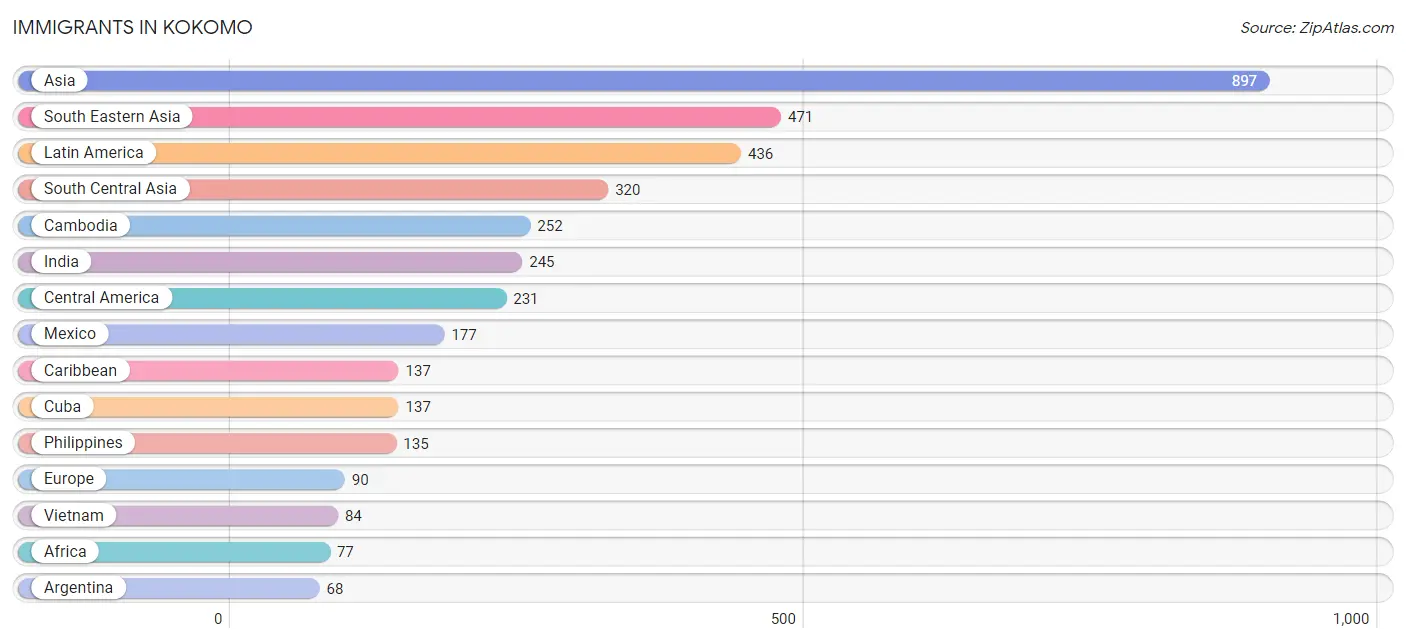
The most numerous immigrant groups reported in Kokomo came from Asia (897 | 1.5%), South Eastern Asia (471 | 0.8%), Latin America (436 | 0.7%), South Central Asia (320 | 0.5%), and Cambodia (252 | 0.4%), together accounting for 4.0% of all Kokomo residents.
| Immigration Origin | # Population | % Population |
| Africa | 77 | 0.1% |
| Argentina | 68 | 0.1% |
| Asia | 897 | 1.5% |
| Belize | 13 | 0.0% |
| Bulgaria | 25 | 0.0% |
| Cambodia | 252 | 0.4% |
| Canada | 50 | 0.1% |
| Caribbean | 137 | 0.2% |
| Central America | 231 | 0.4% |
| China | 16 | 0.0% |
| Cuba | 137 | 0.2% |
| Eastern Africa | 32 | 0.1% |
| Eastern Asia | 50 | 0.1% |
| Eastern Europe | 39 | 0.1% |
| El Salvador | 41 | 0.1% |
| England | 12 | 0.0% |
| Eritrea | 24 | 0.0% |
| Ethiopia | 8 | 0.0% |
| Europe | 90 | 0.2% |
| India | 245 | 0.4% |
| Iran | 44 | 0.1% |
| Israel | 56 | 0.1% |
| Kazakhstan | 31 | 0.1% |
| Korea | 34 | 0.1% |
| Latin America | 436 | 0.7% |
| Mexico | 177 | 0.3% |
| Morocco | 14 | 0.0% |
| Nigeria | 31 | 0.1% |
| Northern Africa | 14 | 0.0% |
| Northern Europe | 14 | 0.0% |
| Philippines | 135 | 0.2% |
| Russia | 14 | 0.0% |
| South America | 68 | 0.1% |
| South Central Asia | 320 | 0.5% |
| South Eastern Asia | 471 | 0.8% |
| Switzerland | 37 | 0.1% |
| Vietnam | 84 | 0.1% |
| Western Africa | 31 | 0.1% |
| Western Asia | 56 | 0.1% |
| Western Europe | 37 | 0.1% | View All 40 Rows |
Sex and Age in Kokomo
Sex and Age in Kokomo
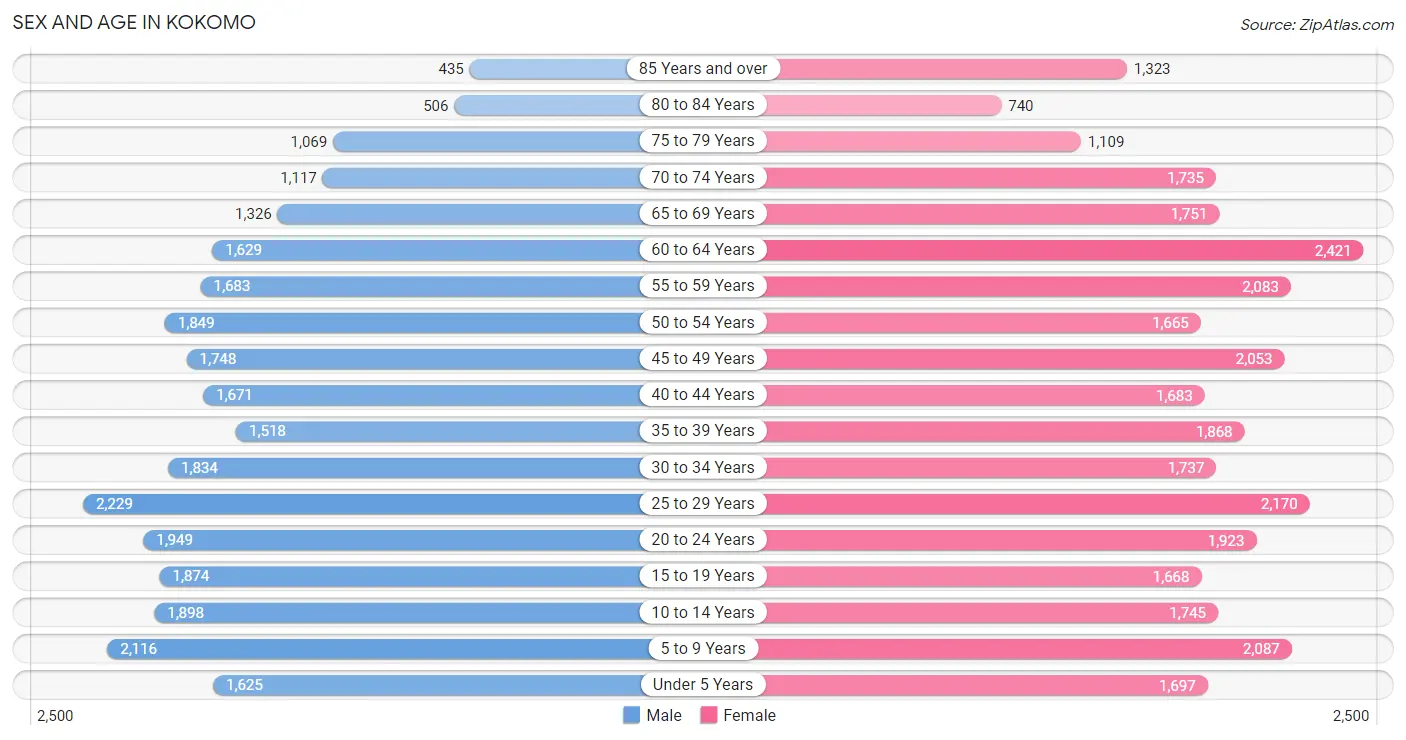
The most populous age groups in Kokomo are 25 to 29 Years (2,229 | 7.9%) for men and 60 to 64 Years (2,421 | 7.7%) for women.
| Age Bracket | Male | Female |
| Under 5 Years | 1,625 (5.8%) | 1,697 (5.4%) |
| 5 to 9 Years | 2,116 (7.5%) | 2,087 (6.6%) |
| 10 to 14 Years | 1,898 (6.8%) | 1,745 (5.6%) |
| 15 to 19 Years | 1,874 (6.7%) | 1,668 (5.3%) |
| 20 to 24 Years | 1,949 (6.9%) | 1,923 (6.1%) |
| 25 to 29 Years | 2,229 (7.9%) | 2,170 (6.9%) |
| 30 to 34 Years | 1,834 (6.5%) | 1,737 (5.5%) |
| 35 to 39 Years | 1,518 (5.4%) | 1,868 (5.9%) |
| 40 to 44 Years | 1,671 (5.9%) | 1,683 (5.3%) |
| 45 to 49 Years | 1,748 (6.2%) | 2,053 (6.5%) |
| 50 to 54 Years | 1,849 (6.6%) | 1,665 (5.3%) |
| 55 to 59 Years | 1,683 (6.0%) | 2,083 (6.6%) |
| 60 to 64 Years | 1,629 (5.8%) | 2,421 (7.7%) |
| 65 to 69 Years | 1,326 (4.7%) | 1,751 (5.6%) |
| 70 to 74 Years | 1,117 (4.0%) | 1,735 (5.5%) |
| 75 to 79 Years | 1,069 (3.8%) | 1,109 (3.5%) |
| 80 to 84 Years | 506 (1.8%) | 740 (2.4%) |
| 85 Years and over | 435 (1.5%) | 1,323 (4.2%) |
| Total | 28,076 (100.0%) | 31,458 (100.0%) |
Families and Households in Kokomo
Median Family Size in Kokomo
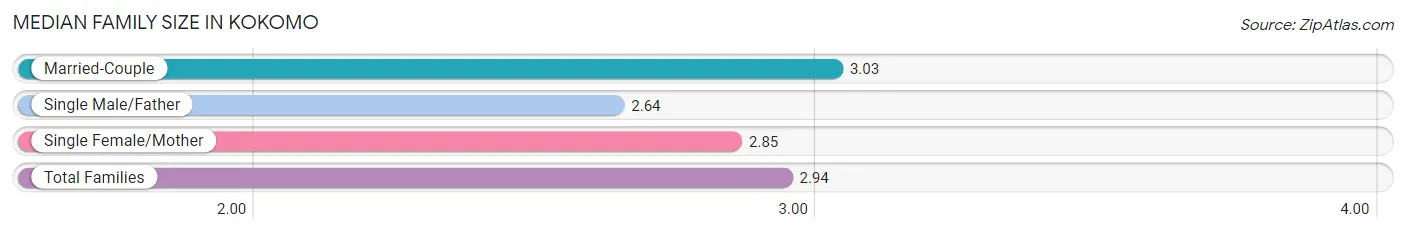
The median family size in Kokomo is 2.94 persons per family, with married-couple families (9,009 | 60.9%) accounting for the largest median family size of 3.03 persons per family. On the other hand, single male/father families (1,453 | 9.8%) represent the smallest median family size with 2.64 persons per family.
| Family Type | # Families | Family Size |
| Married-Couple | 9,009 (60.9%) | 3.03 |
| Single Male/Father | 1,453 (9.8%) | 2.64 |
| Single Female/Mother | 4,331 (29.3%) | 2.85 |
| Total Families | 14,793 (100.0%) | 2.94 |
Median Household Size in Kokomo
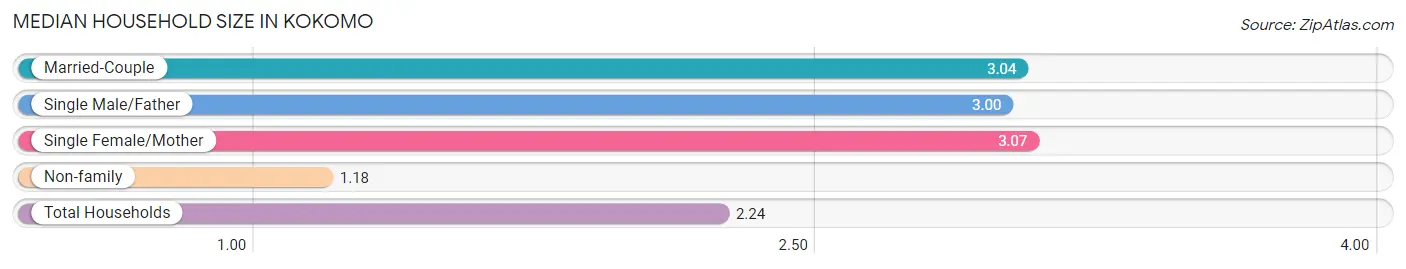
The median household size in Kokomo is 2.24 persons per household, with single female/mother households (4,331 | 16.6%) accounting for the largest median household size of 3.07 persons per household. non-family households (11,273 | 43.2%) represent the smallest median household size with 1.18 persons per household.
| Household Type | # Households | Household Size |
| Married-Couple | 9,009 (34.6%) | 3.04 |
| Single Male/Father | 1,453 (5.6%) | 3.00 |
| Single Female/Mother | 4,331 (16.6%) | 3.07 |
| Non-family | 11,273 (43.2%) | 1.18 |
| Total Households | 26,066 (100.0%) | 2.24 |
Household Size by Marriage Status in Kokomo
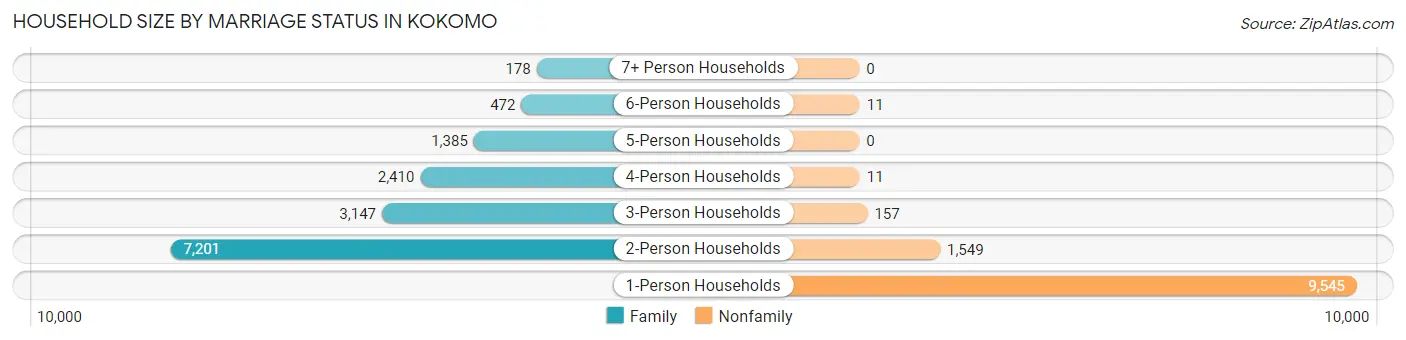
Out of a total of 26,066 households in Kokomo, 14,793 (56.8%) are family households, while 11,273 (43.2%) are nonfamily households. The most numerous type of family households are 2-person households, comprising 7,201, and the most common type of nonfamily households are 1-person households, comprising 9,545.
| Household Size | Family Households | Nonfamily Households |
| 1-Person Households | - | 9,545 (36.6%) |
| 2-Person Households | 7,201 (27.6%) | 1,549 (5.9%) |
| 3-Person Households | 3,147 (12.1%) | 157 (0.6%) |
| 4-Person Households | 2,410 (9.2%) | 11 (0.0%) |
| 5-Person Households | 1,385 (5.3%) | 0 (0.0%) |
| 6-Person Households | 472 (1.8%) | 11 (0.0%) |
| 7+ Person Households | 178 (0.7%) | 0 (0.0%) |
| Total | 14,793 (56.8%) | 11,273 (43.2%) |
Female Fertility in Kokomo
Fertility by Age in Kokomo
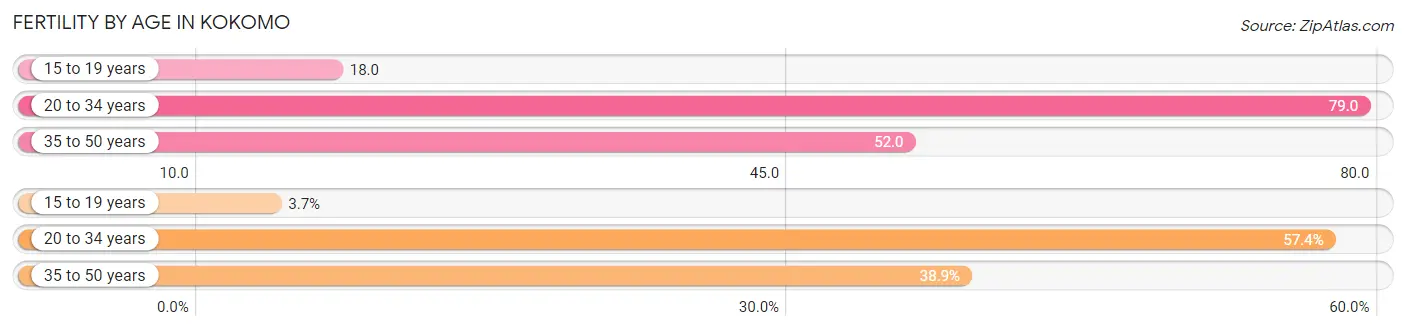
Average fertility rate in Kokomo is 60.0 births per 1,000 women. Women in the age bracket of 20 to 34 years have the highest fertility rate with 79.0 births per 1,000 women. Women in the age bracket of 20 to 34 years acount for 57.4% of all women with births.
| Age Bracket | Women with Births | Births / 1,000 Women |
| 15 to 19 years | 30 (3.7%) | 18.0 |
| 20 to 34 years | 462 (57.4%) | 79.0 |
| 35 to 50 years | 313 (38.9%) | 52.0 |
| Total | 805 (100.0%) | 60.0 |
Fertility by Age by Marriage Status in Kokomo
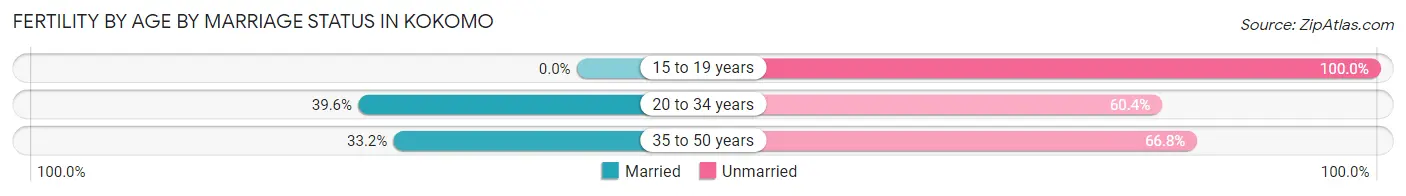
35.7% of women with births (805) in Kokomo are married. The highest percentage of unmarried women with births falls into 15 to 19 years age bracket with 100.0% of them unmarried at the time of birth, while the lowest percentage of unmarried women with births belong to 20 to 34 years age bracket with 60.4% of them unmarried.
| Age Bracket | Married | Unmarried |
| 15 to 19 years | 0 (0.0%) | 30 (100.0%) |
| 20 to 34 years | 183 (39.6%) | 279 (60.4%) |
| 35 to 50 years | 104 (33.2%) | 209 (66.8%) |
| Total | 287 (35.6%) | 518 (64.3%) |
Fertility by Education in Kokomo
Average fertility rate in Kokomo is 60.0 births per 1,000 women. Women with the education attainment of high school diploma have the highest fertility rate of 108.0 births per 1,000 women, while women with the education attainment of less than high school have the lowest fertility at 18.0 births per 1,000 women. Women with the education attainment of high school diploma represent 53.5% of all women with births.

| Educational Attainment | Women with Births | Births / 1,000 Women |
| Less than High School | 40 (5.0%) | 18.0 |
| High School Diploma | 431 (53.5%) | 108.0 |
| College or Associate's Degree | 268 (33.3%) | 52.0 |
| Bachelor's Degree | 57 (7.1%) | 32.0 |
| Graduate Degree | 9 (1.1%) | 24.0 |
| Total | 805 (100.0%) | 60.0 |
Fertility by Education by Marriage Status in Kokomo
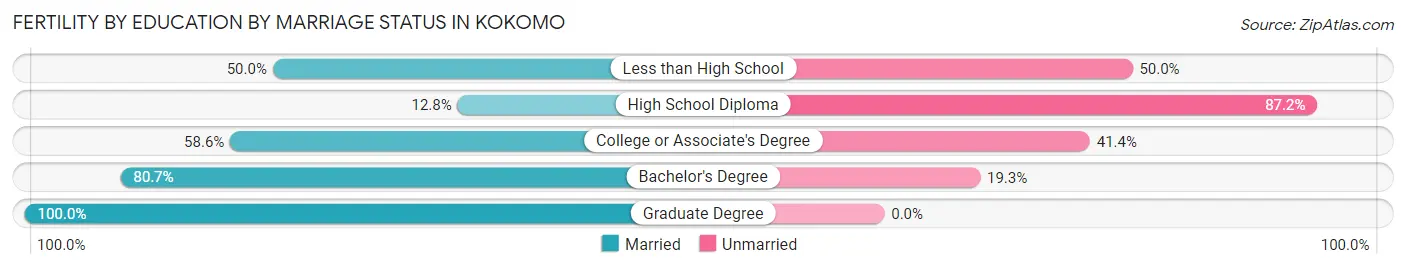
64.3% of women with births in Kokomo are unmarried. Women with the educational attainment of graduate degree are most likely to be married with 100.0% of them married at childbirth, while women with the educational attainment of high school diploma are least likely to be married with 87.2% of them unmarried at childbirth.
| Educational Attainment | Married | Unmarried |
| Less than High School | 20 (50.0%) | 20 (50.0%) |
| High School Diploma | 55 (12.8%) | 376 (87.2%) |
| College or Associate's Degree | 157 (58.6%) | 111 (41.4%) |
| Bachelor's Degree | 46 (80.7%) | 11 (19.3%) |
| Graduate Degree | 9 (100.0%) | 0 (0.0%) |
| Total | 287 (35.6%) | 518 (64.3%) |
Employment Characteristics in Kokomo
Employment by Class of Employer in Kokomo
Among the 25,164 employed individuals in Kokomo, private company employees (19,142 | 76.1%), not-for-profit organizations (2,052 | 8.2%), and local government employees (1,606 | 6.4%) make up the most common classes of employment.
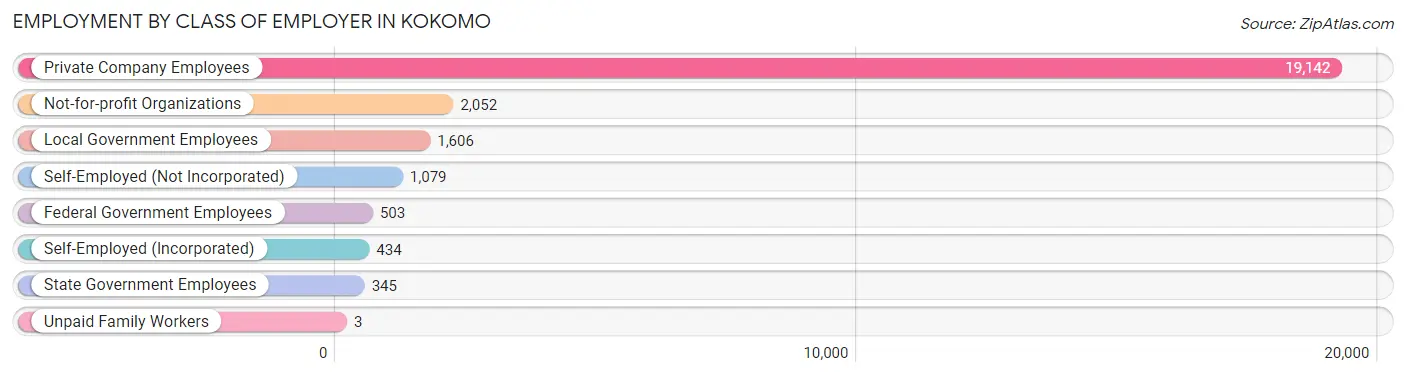
| Employer Class | # Employees | % Employees |
| Private Company Employees | 19,142 | 76.1% |
| Self-Employed (Incorporated) | 434 | 1.7% |
| Self-Employed (Not Incorporated) | 1,079 | 4.3% |
| Not-for-profit Organizations | 2,052 | 8.2% |
| Local Government Employees | 1,606 | 6.4% |
| State Government Employees | 345 | 1.4% |
| Federal Government Employees | 503 | 2.0% |
| Unpaid Family Workers | 3 | 0.0% |
| Total | 25,164 | 100.0% |
Employment Status by Age in Kokomo
According to the labor force statistics for Kokomo, out of the total population over 16 years of age (47,641), 58.2% or 27,727 individuals are in the labor force, with 6.1% or 1,691 of them unemployed. The age group with the highest labor force participation rate is 25 to 29 years, with 85.4% or 3,757 individuals in the labor force. Within the labor force, the 20 to 24 years age range has the highest percentage of unemployed individuals, with 22.1% or 697 of them being unemployed.
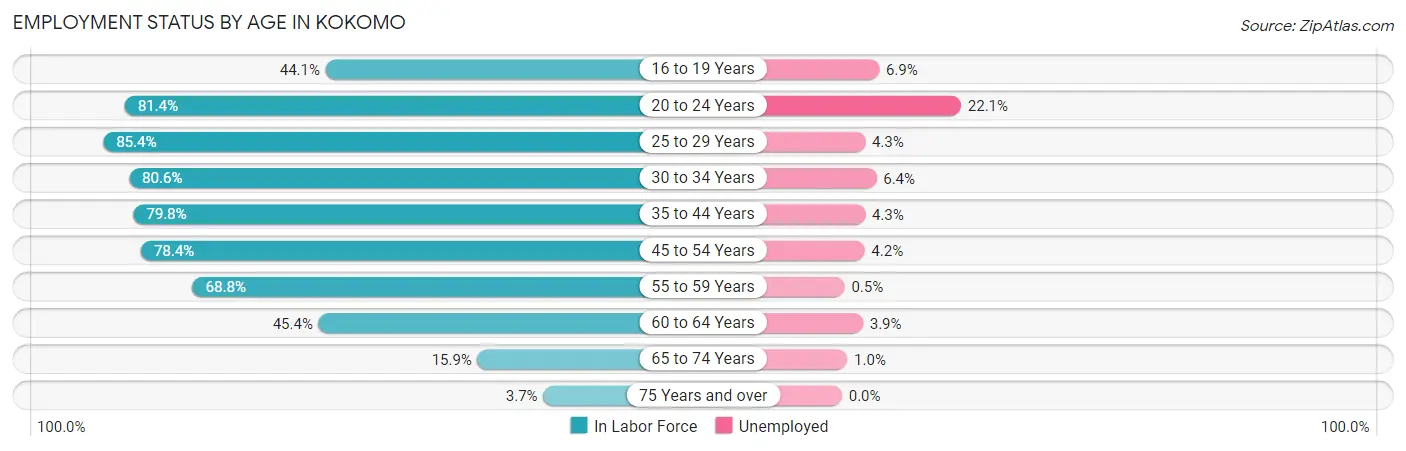
| Age Bracket | In Labor Force | Unemployed |
| 16 to 19 Years | 1,242 (44.1%) | 86 (6.9%) |
| 20 to 24 Years | 3,152 (81.4%) | 697 (22.1%) |
| 25 to 29 Years | 3,757 (85.4%) | 162 (4.3%) |
| 30 to 34 Years | 2,878 (80.6%) | 184 (6.4%) |
| 35 to 44 Years | 5,379 (79.8%) | 231 (4.3%) |
| 45 to 54 Years | 5,735 (78.4%) | 241 (4.2%) |
| 55 to 59 Years | 2,591 (68.8%) | 13 (0.5%) |
| 60 to 64 Years | 1,839 (45.4%) | 72 (3.9%) |
| 65 to 74 Years | 943 (15.9%) | 9 (1.0%) |
| 75 Years and over | 192 (3.7%) | 0 (0.0%) |
| Total | 27,727 (58.2%) | 1,691 (6.1%) |
Employment Status by Educational Attainment in Kokomo
According to labor force statistics for Kokomo, 74.3% of individuals (22,172) out of the total population between 25 and 64 years of age (29,841) are in the labor force, with 4.1% or 909 of them being unemployed. The group with the highest labor force participation rate are those with the educational attainment of bachelor's degree or higher, with 90.4% or 4,472 individuals in the labor force. Within the labor force, individuals with less than high school education have the highest percentage of unemployment, with 16.2% or 226 of them being unemployed.
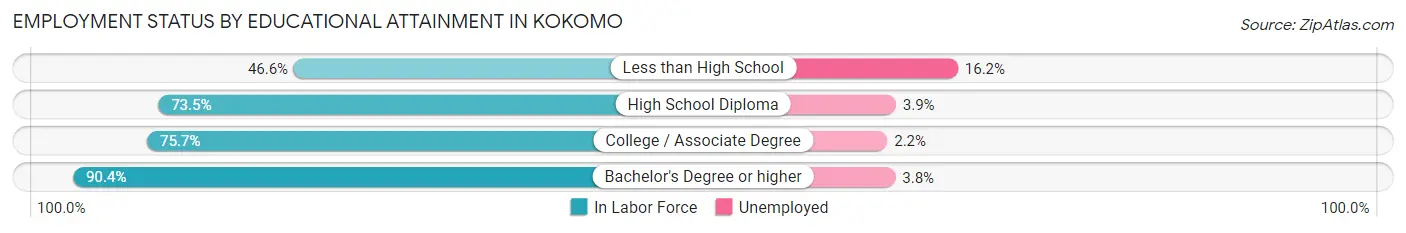
| Educational Attainment | In Labor Force | Unemployed |
| Less than High School | 1,392 (46.6%) | 484 (16.2%) |
| High School Diploma | 8,600 (73.5%) | 456 (3.9%) |
| College / Associate Degree | 7,727 (75.7%) | 225 (2.2%) |
| Bachelor's Degree or higher | 4,472 (90.4%) | 188 (3.8%) |
| Total | 22,172 (74.3%) | 1,223 (4.1%) |
Employment Occupations by Sex in Kokomo
Management, Business, Science and Arts Occupations
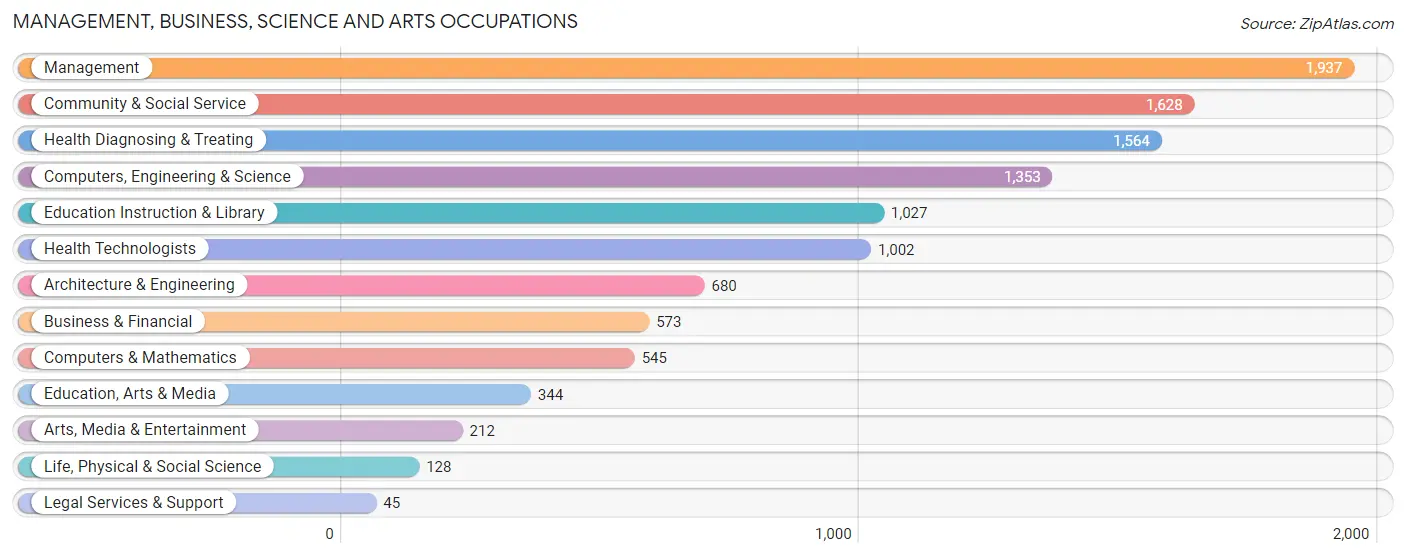
The most common Management, Business, Science and Arts occupations in Kokomo are Management (1,937 | 7.5%), Community & Social Service (1,628 | 6.3%), Health Diagnosing & Treating (1,564 | 6.0%), Computers, Engineering & Science (1,353 | 5.2%), and Education Instruction & Library (1,027 | 4.0%).
Management, Business, Science and Arts Occupations by Sex
Within the Management, Business, Science and Arts occupations in Kokomo, the most male-oriented occupations are Arts, Media & Entertainment (87.3%), Architecture & Engineering (85.4%), and Computers, Engineering & Science (78.7%), while the most female-oriented occupations are Health Diagnosing & Treating (89.1%), Health Technologists (86.9%), and Legal Services & Support (77.8%).
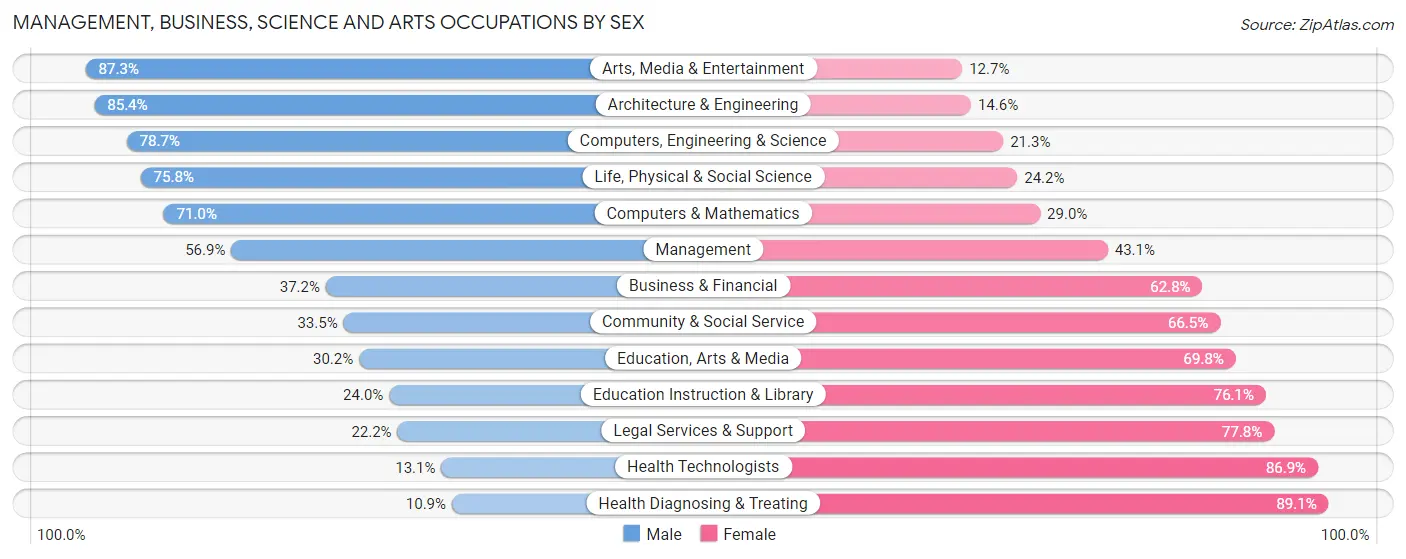
| Occupation | Male | Female |
| Management | 1,102 (56.9%) | 835 (43.1%) |
| Business & Financial | 213 (37.2%) | 360 (62.8%) |
| Computers, Engineering & Science | 1,065 (78.7%) | 288 (21.3%) |
| Computers & Mathematics | 387 (71.0%) | 158 (29.0%) |
| Architecture & Engineering | 581 (85.4%) | 99 (14.6%) |
| Life, Physical & Social Science | 97 (75.8%) | 31 (24.2%) |
| Community & Social Service | 545 (33.5%) | 1,083 (66.5%) |
| Education, Arts & Media | 104 (30.2%) | 240 (69.8%) |
| Legal Services & Support | 10 (22.2%) | 35 (77.8%) |
| Education Instruction & Library | 246 (23.9%) | 781 (76.0%) |
| Arts, Media & Entertainment | 185 (87.3%) | 27 (12.7%) |
| Health Diagnosing & Treating | 170 (10.9%) | 1,394 (89.1%) |
| Health Technologists | 131 (13.1%) | 871 (86.9%) |
| Total (Category) | 3,095 (43.9%) | 3,960 (56.1%) |
| Total (Overall) | 12,602 (48.8%) | 13,228 (51.2%) |
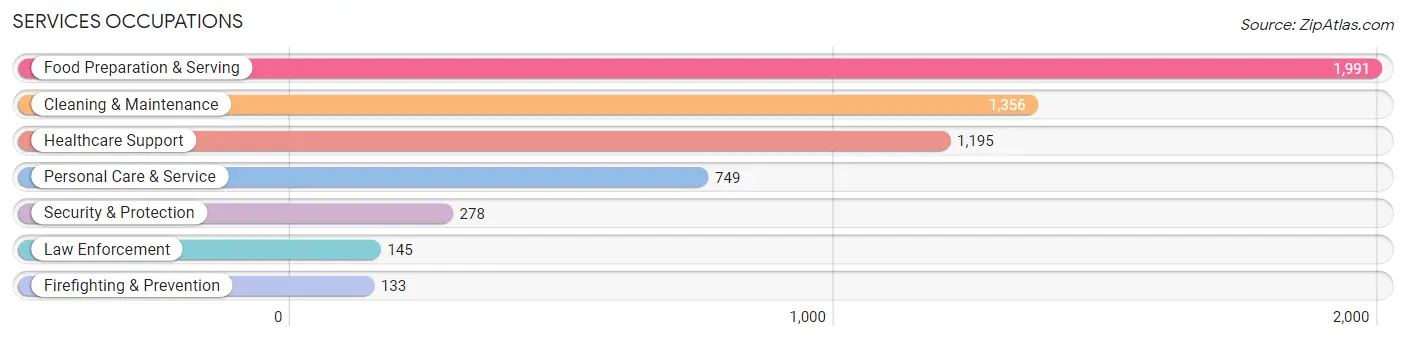
Services Occupations
The most common Services occupations in Kokomo are Food Preparation & Serving (1,991 | 7.7%), Cleaning & Maintenance (1,356 | 5.2%), Healthcare Support (1,195 | 4.6%), Personal Care & Service (749 | 2.9%), and Security & Protection (278 | 1.1%).
Services Occupations by Sex
Within the Services occupations in Kokomo, the most male-oriented occupations are Firefighting & Prevention (78.2%), Security & Protection (71.6%), and Law Enforcement (65.5%), while the most female-oriented occupations are Healthcare Support (84.4%), Personal Care & Service (83.7%), and Food Preparation & Serving (70.6%).
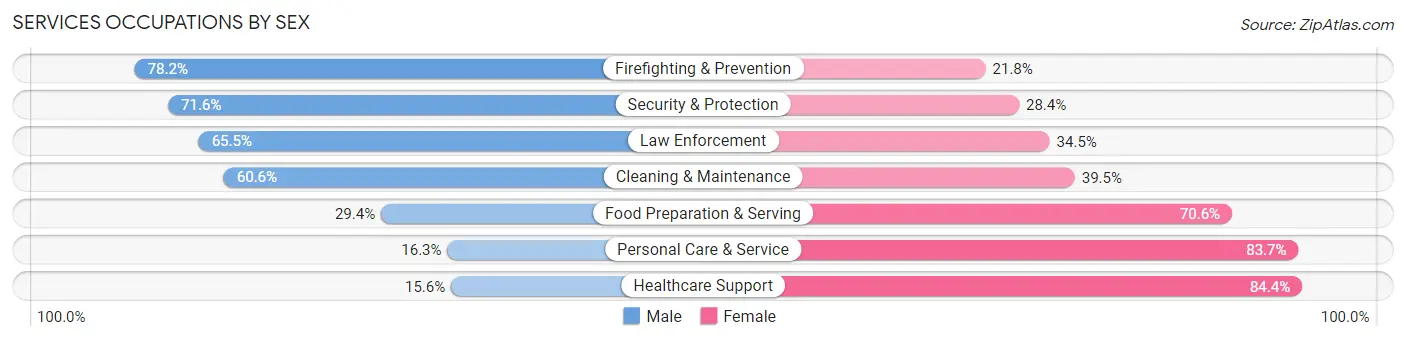
| Occupation | Male | Female |
| Healthcare Support | 186 (15.6%) | 1,009 (84.4%) |
| Security & Protection | 199 (71.6%) | 79 (28.4%) |
| Firefighting & Prevention | 104 (78.2%) | 29 (21.8%) |
| Law Enforcement | 95 (65.5%) | 50 (34.5%) |
| Food Preparation & Serving | 586 (29.4%) | 1,405 (70.6%) |
| Cleaning & Maintenance | 821 (60.6%) | 535 (39.5%) |
| Personal Care & Service | 122 (16.3%) | 627 (83.7%) |
| Total (Category) | 1,914 (34.4%) | 3,655 (65.6%) |
| Total (Overall) | 12,602 (48.8%) | 13,228 (51.2%) |
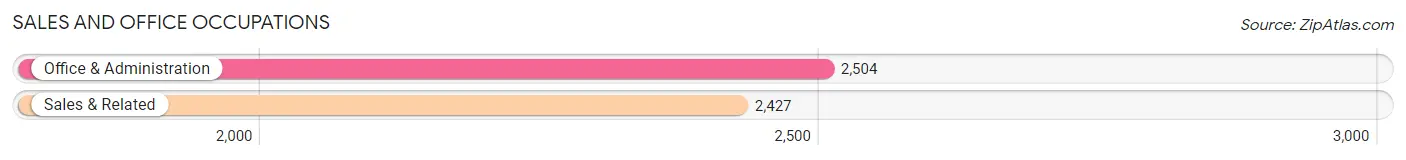
Sales and Office Occupations
The most common Sales and Office occupations in Kokomo are Office & Administration (2,504 | 9.7%), and Sales & Related (2,427 | 9.4%).
Sales and Office Occupations by Sex
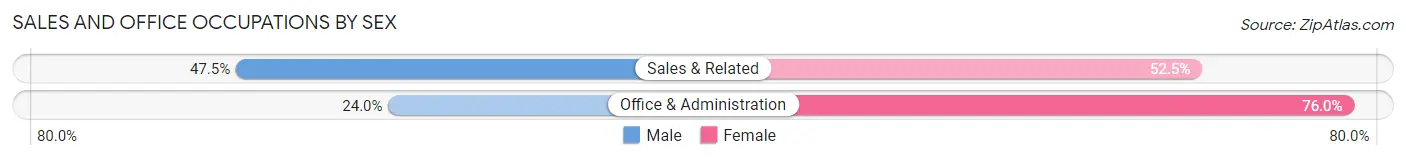
| Occupation | Male | Female |
| Sales & Related | 1,152 (47.5%) | 1,275 (52.5%) |
| Office & Administration | 602 (24.0%) | 1,902 (76.0%) |
| Total (Category) | 1,754 (35.6%) | 3,177 (64.4%) |
| Total (Overall) | 12,602 (48.8%) | 13,228 (51.2%) |
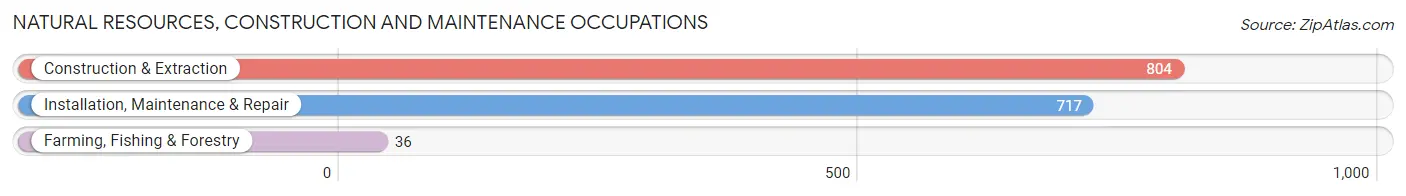
Natural Resources, Construction and Maintenance Occupations
The most common Natural Resources, Construction and Maintenance occupations in Kokomo are Construction & Extraction (804 | 3.1%), Installation, Maintenance & Repair (717 | 2.8%), and Farming, Fishing & Forestry (36 | 0.1%).
Natural Resources, Construction and Maintenance Occupations by Sex
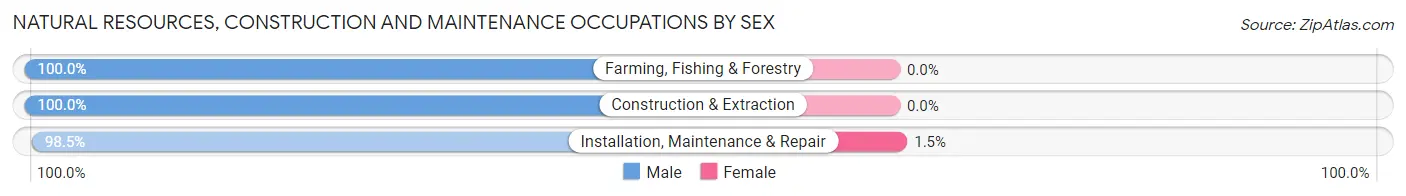
| Occupation | Male | Female |
| Farming, Fishing & Forestry | 36 (100.0%) | 0 (0.0%) |
| Construction & Extraction | 804 (100.0%) | 0 (0.0%) |
| Installation, Maintenance & Repair | 706 (98.5%) | 11 (1.5%) |
| Total (Category) | 1,546 (99.3%) | 11 (0.7%) |
| Total (Overall) | 12,602 (48.8%) | 13,228 (51.2%) |
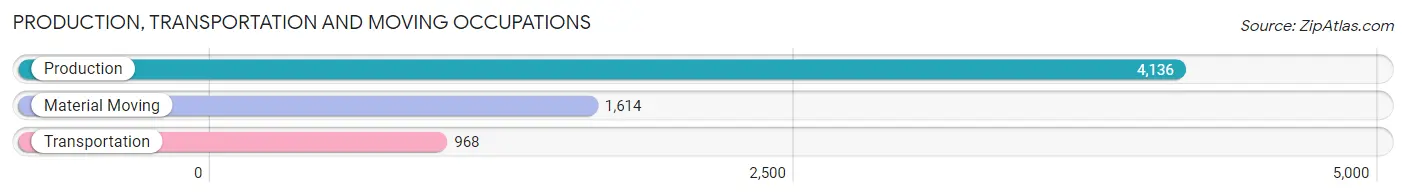
Production, Transportation and Moving Occupations
The most common Production, Transportation and Moving occupations in Kokomo are Production (4,136 | 16.0%), Material Moving (1,614 | 6.2%), and Transportation (968 | 3.7%).
Production, Transportation and Moving Occupations by Sex
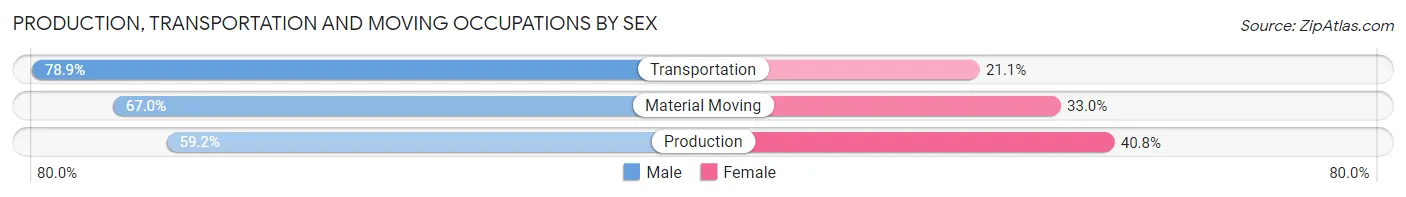
| Occupation | Male | Female |
| Production | 2,447 (59.2%) | 1,689 (40.8%) |
| Transportation | 764 (78.9%) | 204 (21.1%) |
| Material Moving | 1,082 (67.0%) | 532 (33.0%) |
| Total (Category) | 4,293 (63.9%) | 2,425 (36.1%) |
| Total (Overall) | 12,602 (48.8%) | 13,228 (51.2%) |
Employment Industries by Sex in Kokomo
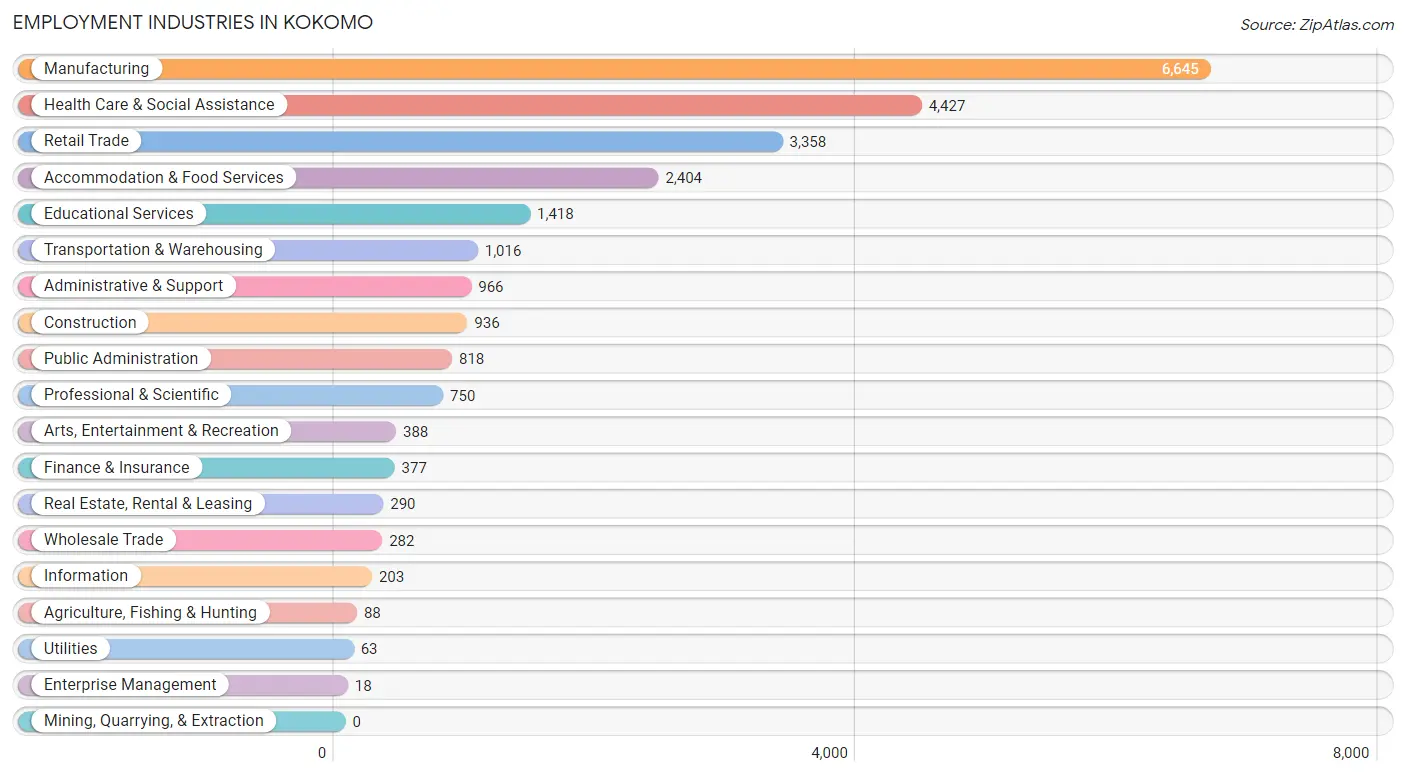
Employment Industries in Kokomo
The major employment industries in Kokomo include Manufacturing (6,645 | 25.7%), Health Care & Social Assistance (4,427 | 17.1%), Retail Trade (3,358 | 13.0%), Accommodation & Food Services (2,404 | 9.3%), and Educational Services (1,418 | 5.5%).
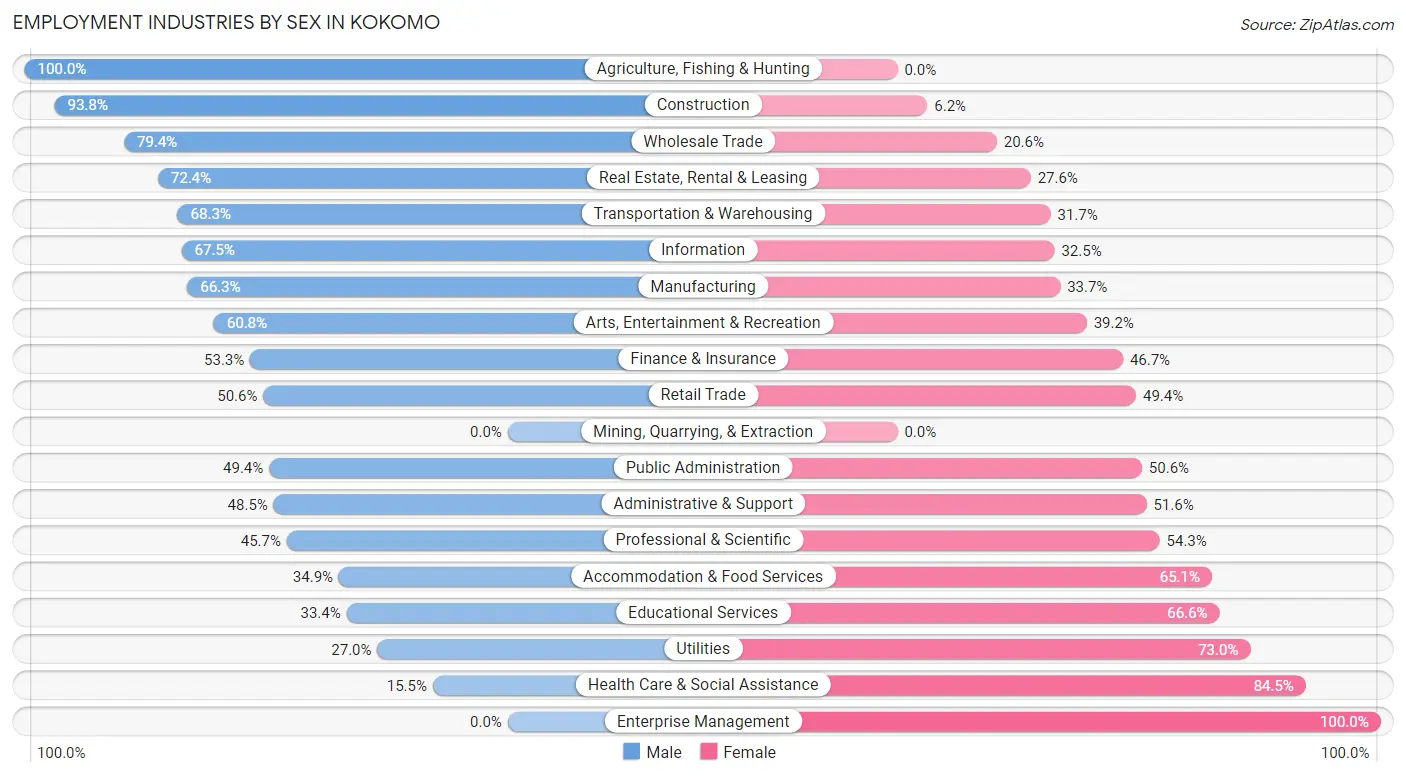
Employment Industries by Sex in Kokomo
The Kokomo industries that see more men than women are Agriculture, Fishing & Hunting (100.0%), Construction (93.8%), and Wholesale Trade (79.4%), whereas the industries that tend to have a higher number of women are Enterprise Management (100.0%), Health Care & Social Assistance (84.5%), and Utilities (73.0%).
| Industry | Male | Female |
| Agriculture, Fishing & Hunting | 88 (100.0%) | 0 (0.0%) |
| Mining, Quarrying, & Extraction | 0 (0.0%) | 0 (0.0%) |
| Construction | 878 (93.8%) | 58 (6.2%) |
| Manufacturing | 4,406 (66.3%) | 2,239 (33.7%) |
| Wholesale Trade | 224 (79.4%) | 58 (20.6%) |
| Retail Trade | 1,699 (50.6%) | 1,659 (49.4%) |
| Transportation & Warehousing | 694 (68.3%) | 322 (31.7%) |
| Utilities | 17 (27.0%) | 46 (73.0%) |
| Information | 137 (67.5%) | 66 (32.5%) |
| Finance & Insurance | 201 (53.3%) | 176 (46.7%) |
| Real Estate, Rental & Leasing | 210 (72.4%) | 80 (27.6%) |
| Professional & Scientific | 343 (45.7%) | 407 (54.3%) |
| Enterprise Management | 0 (0.0%) | 18 (100.0%) |
| Administrative & Support | 468 (48.4%) | 498 (51.5%) |
| Educational Services | 473 (33.4%) | 945 (66.6%) |
| Health Care & Social Assistance | 686 (15.5%) | 3,741 (84.5%) |
| Arts, Entertainment & Recreation | 236 (60.8%) | 152 (39.2%) |
| Accommodation & Food Services | 840 (34.9%) | 1,564 (65.1%) |
| Public Administration | 404 (49.4%) | 414 (50.6%) |
| Total | 12,602 (48.8%) | 13,228 (51.2%) |
Education in Kokomo
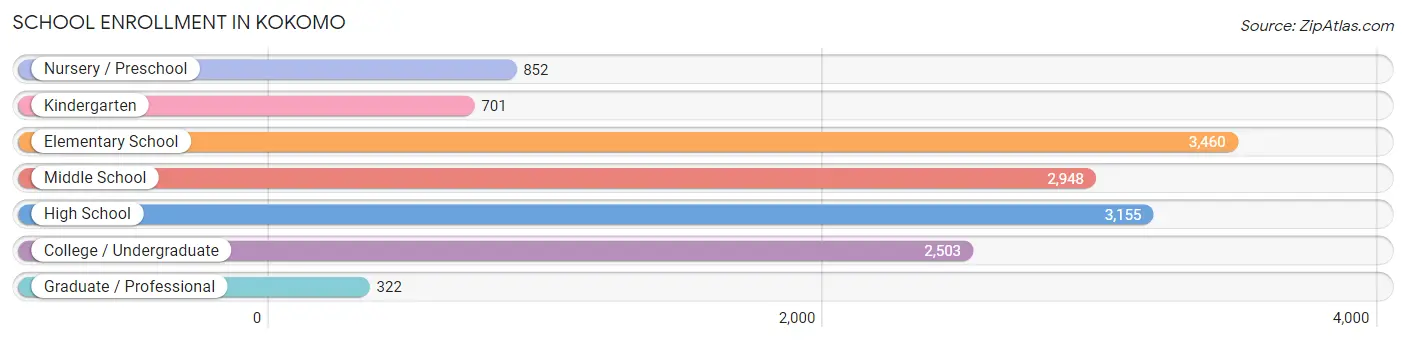
School Enrollment in Kokomo
The most common levels of schooling among the 13,941 students in Kokomo are elementary school (3,460 | 24.8%), high school (3,155 | 22.6%), and middle school (2,948 | 21.1%).
| School Level | # Students | % Students |
| Nursery / Preschool | 852 | 6.1% |
| Kindergarten | 701 | 5.0% |
| Elementary School | 3,460 | 24.8% |
| Middle School | 2,948 | 21.1% |
| High School | 3,155 | 22.6% |
| College / Undergraduate | 2,503 | 17.9% |
| Graduate / Professional | 322 | 2.3% |
| Total | 13,941 | 100.0% |
School Enrollment by Age by Funding Source in Kokomo
Out of a total of 13,941 students who are enrolled in schools in Kokomo, 1,073 (7.7%) attend a private institution, while the remaining 12,868 (92.3%) are enrolled in public schools. The age group of 3 to 4 year olds has the highest likelihood of being enrolled in private schools, with 133 (18.8% in the age bracket) enrolled. Conversely, the age group of 15 to 17 year olds has the lowest likelihood of being enrolled in a private school, with 2,222 (97.5% in the age bracket) attending a public institution.
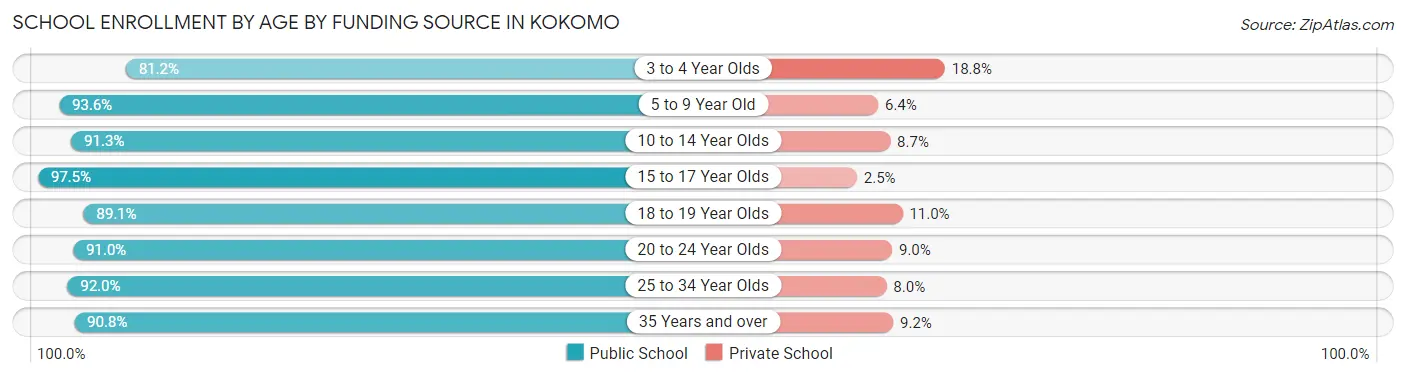
| Age Bracket | Public School | Private School |
| 3 to 4 Year Olds | 573 (81.2%) | 133 (18.8%) |
| 5 to 9 Year Old | 3,655 (93.6%) | 250 (6.4%) |
| 10 to 14 Year Olds | 3,248 (91.3%) | 308 (8.7%) |
| 15 to 17 Year Olds | 2,222 (97.5%) | 56 (2.5%) |
| 18 to 19 Year Olds | 821 (89.0%) | 101 (11.0%) |
| 20 to 24 Year Olds | 899 (91.0%) | 89 (9.0%) |
| 25 to 34 Year Olds | 740 (92.0%) | 64 (8.0%) |
| 35 Years and over | 710 (90.8%) | 72 (9.2%) |
| Total | 12,868 (92.3%) | 1,073 (7.7%) |
Educational Attainment by Field of Study in Kokomo
Business (1,477 | 20.3%), education (1,290 | 17.7%), science & technology (982 | 13.5%), engineering (826 | 11.4%), and liberal arts & history (558 | 7.7%) are the most common fields of study among 7,273 individuals in Kokomo who have obtained a bachelor's degree or higher.
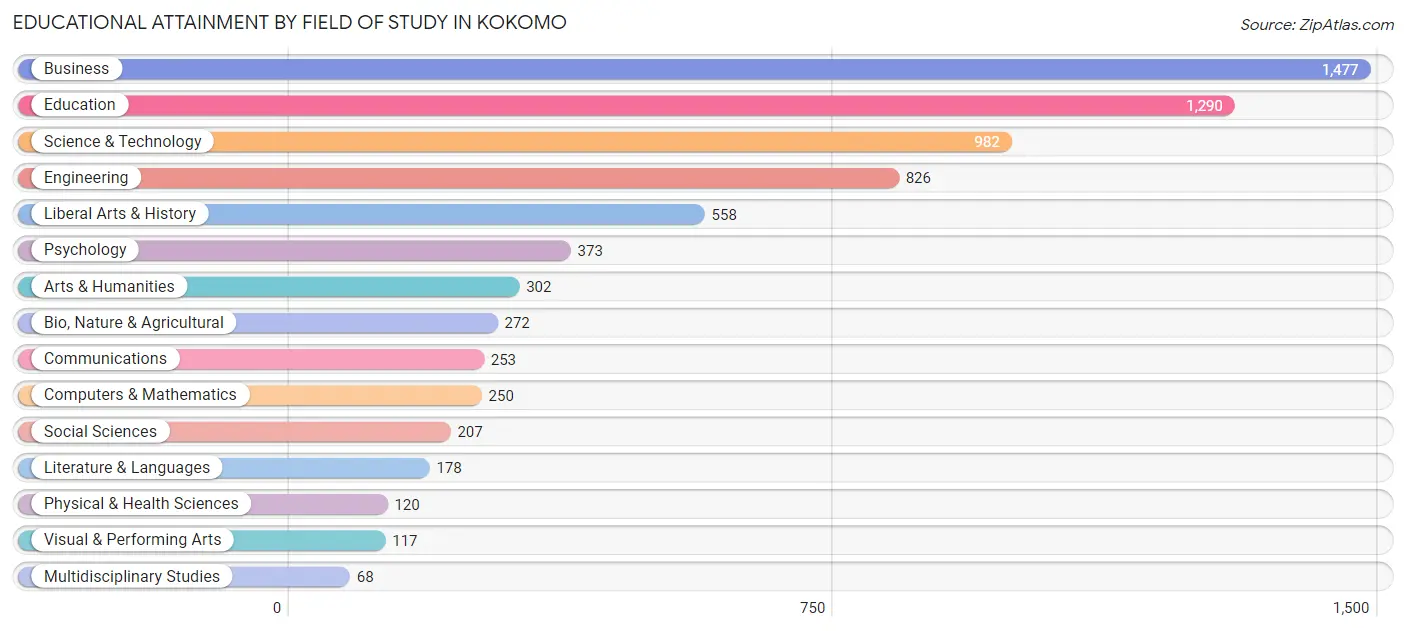
| Field of Study | # Graduates | % Graduates |
| Computers & Mathematics | 250 | 3.4% |
| Bio, Nature & Agricultural | 272 | 3.7% |
| Physical & Health Sciences | 120 | 1.7% |
| Psychology | 373 | 5.1% |
| Social Sciences | 207 | 2.9% |
| Engineering | 826 | 11.4% |
| Multidisciplinary Studies | 68 | 0.9% |
| Science & Technology | 982 | 13.5% |
| Business | 1,477 | 20.3% |
| Education | 1,290 | 17.7% |
| Literature & Languages | 178 | 2.5% |
| Liberal Arts & History | 558 | 7.7% |
| Visual & Performing Arts | 117 | 1.6% |
| Communications | 253 | 3.5% |
| Arts & Humanities | 302 | 4.2% |
| Total | 7,273 | 100.0% |
Transportation & Commute in Kokomo
Vehicle Availability by Sex in Kokomo
The most prevalent vehicle ownership categories in Kokomo are males with 2 vehicles (5,275, accounting for 42.3%) and females with 2 vehicles (5,378, making up 41.7%).
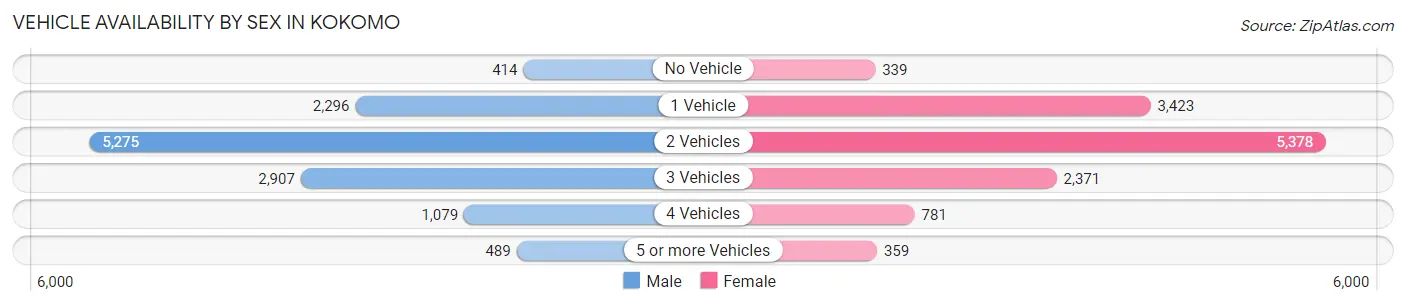
| Vehicles Available | Male | Female |
| No Vehicle | 414 (3.3%) | 339 (2.7%) |
| 1 Vehicle | 2,296 (18.4%) | 3,423 (27.1%) |
| 2 Vehicles | 5,275 (42.3%) | 5,378 (42.5%) |
| 3 Vehicles | 2,907 (23.3%) | 2,371 (18.7%) |
| 4 Vehicles | 1,079 (8.7%) | 781 (6.2%) |
| 5 or more Vehicles | 489 (3.9%) | 359 (2.8%) |
| Total | 12,460 (100.0%) | 12,651 (100.0%) |
Commute Time in Kokomo
The most frequently occuring commute durations in Kokomo are 10 to 14 minutes (5,959 commuters, 24.7%), 5 to 9 minutes (4,878 commuters, 20.2%), and 15 to 19 minutes (4,530 commuters, 18.8%).
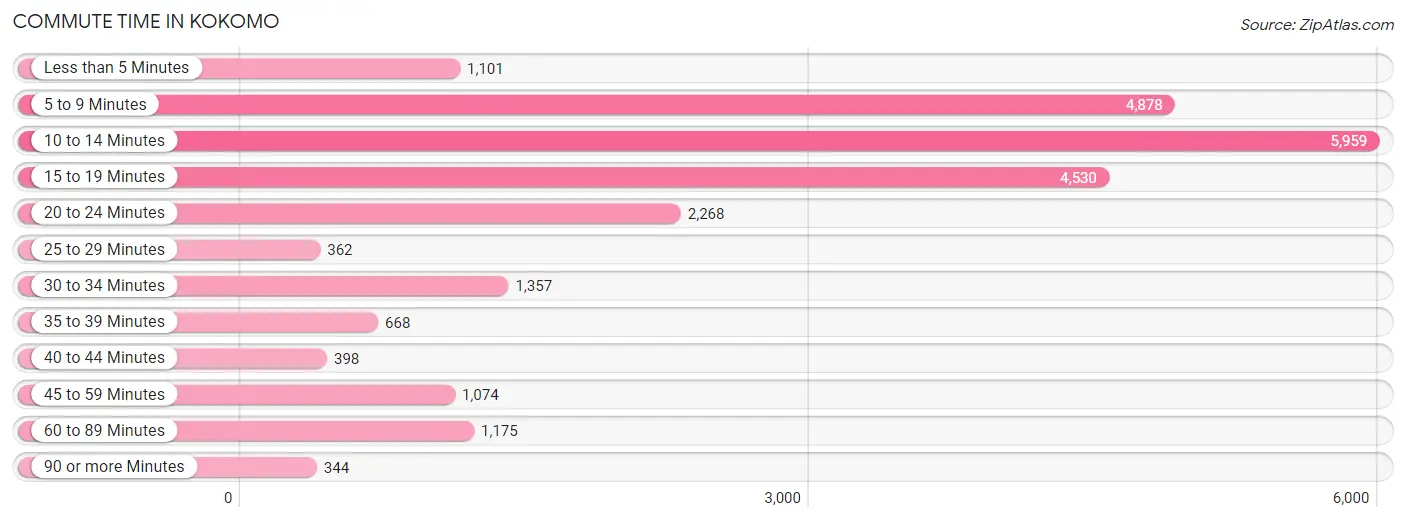
| Commute Time | # Commuters | % Commuters |
| Less than 5 Minutes | 1,101 | 4.6% |
| 5 to 9 Minutes | 4,878 | 20.2% |
| 10 to 14 Minutes | 5,959 | 24.7% |
| 15 to 19 Minutes | 4,530 | 18.8% |
| 20 to 24 Minutes | 2,268 | 9.4% |
| 25 to 29 Minutes | 362 | 1.5% |
| 30 to 34 Minutes | 1,357 | 5.6% |
| 35 to 39 Minutes | 668 | 2.8% |
| 40 to 44 Minutes | 398 | 1.7% |
| 45 to 59 Minutes | 1,074 | 4.4% |
| 60 to 89 Minutes | 1,175 | 4.9% |
| 90 or more Minutes | 344 | 1.4% |
Commute Time by Sex in Kokomo
The most common commute times in Kokomo are 10 to 14 minutes (2,824 commuters, 23.7%) for males and 10 to 14 minutes (3,135 commuters, 25.7%) for females.
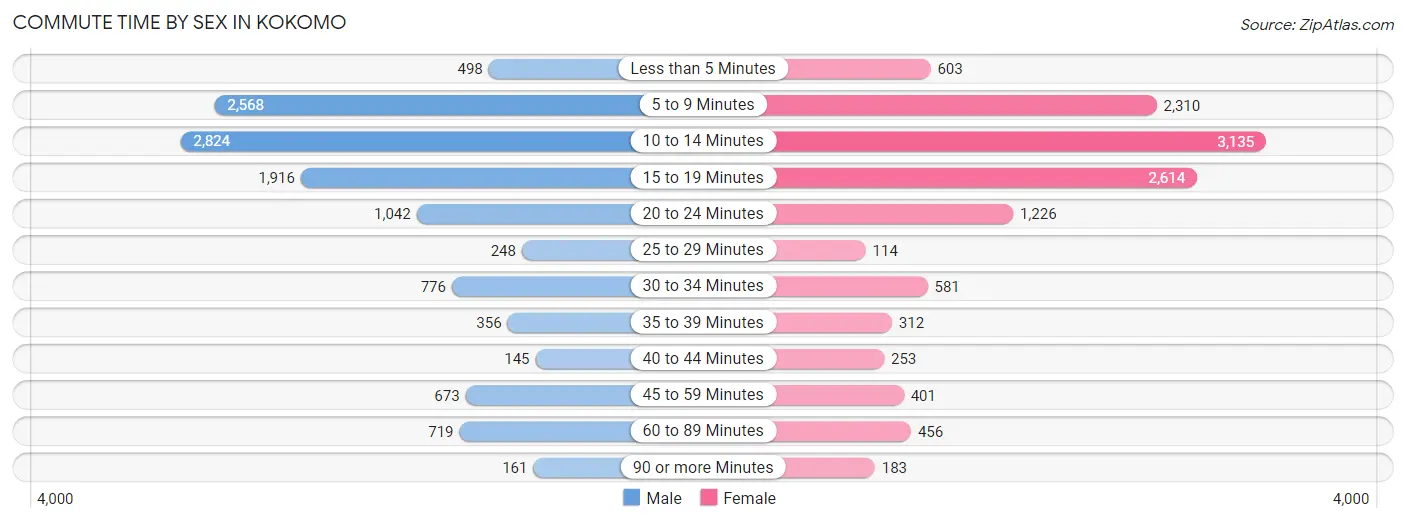
| Commute Time | Male | Female |
| Less than 5 Minutes | 498 (4.2%) | 603 (5.0%) |
| 5 to 9 Minutes | 2,568 (21.5%) | 2,310 (19.0%) |
| 10 to 14 Minutes | 2,824 (23.7%) | 3,135 (25.7%) |
| 15 to 19 Minutes | 1,916 (16.1%) | 2,614 (21.4%) |
| 20 to 24 Minutes | 1,042 (8.7%) | 1,226 (10.1%) |
| 25 to 29 Minutes | 248 (2.1%) | 114 (0.9%) |
| 30 to 34 Minutes | 776 (6.5%) | 581 (4.8%) |
| 35 to 39 Minutes | 356 (3.0%) | 312 (2.6%) |
| 40 to 44 Minutes | 145 (1.2%) | 253 (2.1%) |
| 45 to 59 Minutes | 673 (5.6%) | 401 (3.3%) |
| 60 to 89 Minutes | 719 (6.0%) | 456 (3.7%) |
| 90 or more Minutes | 161 (1.3%) | 183 (1.5%) |
Time of Departure to Work by Sex in Kokomo
The most frequent times of departure to work in Kokomo are 4:00 PM to 11:59 PM (1,814, 15.2%) for males and 7:30 AM to 7:59 AM (1,933, 15.9%) for females.
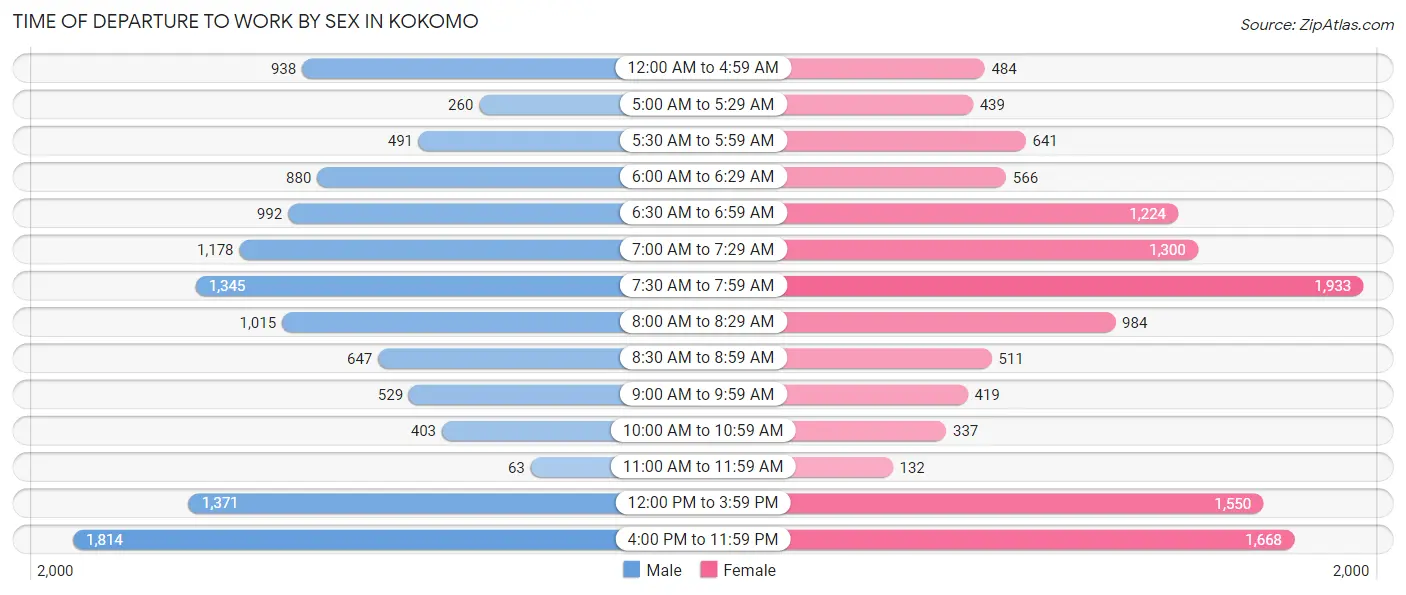
| Time of Departure | Male | Female |
| 12:00 AM to 4:59 AM | 938 (7.9%) | 484 (4.0%) |
| 5:00 AM to 5:29 AM | 260 (2.2%) | 439 (3.6%) |
| 5:30 AM to 5:59 AM | 491 (4.1%) | 641 (5.3%) |
| 6:00 AM to 6:29 AM | 880 (7.4%) | 566 (4.6%) |
| 6:30 AM to 6:59 AM | 992 (8.3%) | 1,224 (10.0%) |
| 7:00 AM to 7:29 AM | 1,178 (9.9%) | 1,300 (10.7%) |
| 7:30 AM to 7:59 AM | 1,345 (11.3%) | 1,933 (15.9%) |
| 8:00 AM to 8:29 AM | 1,015 (8.5%) | 984 (8.1%) |
| 8:30 AM to 8:59 AM | 647 (5.4%) | 511 (4.2%) |
| 9:00 AM to 9:59 AM | 529 (4.4%) | 419 (3.4%) |
| 10:00 AM to 10:59 AM | 403 (3.4%) | 337 (2.8%) |
| 11:00 AM to 11:59 AM | 63 (0.5%) | 132 (1.1%) |
| 12:00 PM to 3:59 PM | 1,371 (11.5%) | 1,550 (12.7%) |
| 4:00 PM to 11:59 PM | 1,814 (15.2%) | 1,668 (13.7%) |
| Total | 11,926 (100.0%) | 12,188 (100.0%) |
Housing Occupancy in Kokomo
Occupancy by Ownership in Kokomo
Of the total 26,066 dwellings in Kokomo, owner-occupied units account for 16,917 (64.9%), while renter-occupied units make up 9,149 (35.1%).
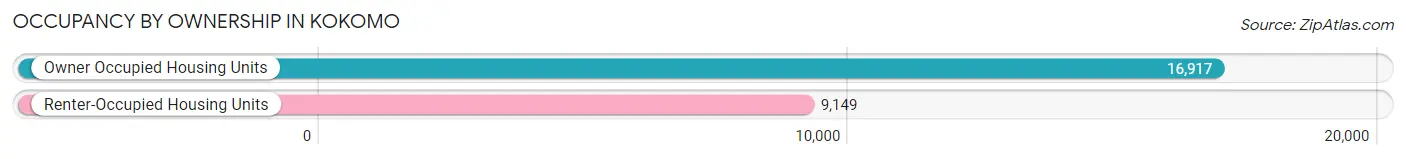
| Occupancy | # Housing Units | % Housing Units |
| Owner Occupied Housing Units | 16,917 | 64.9% |
| Renter-Occupied Housing Units | 9,149 | 35.1% |
| Total Occupied Housing Units | 26,066 | 100.0% |
Occupancy by Household Size in Kokomo
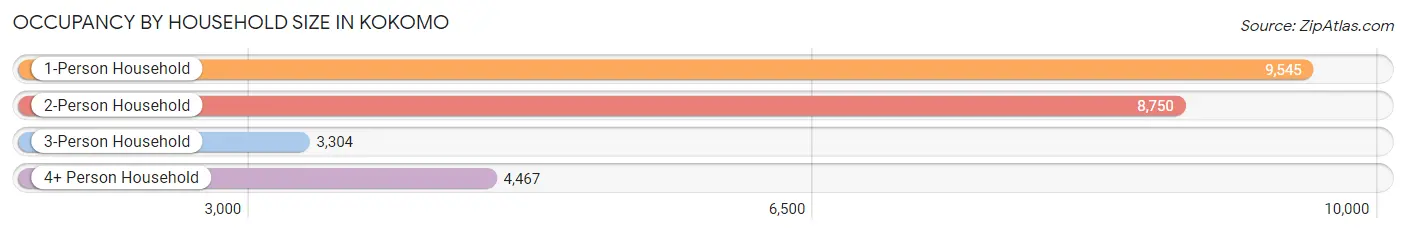
| Household Size | # Housing Units | % Housing Units |
| 1-Person Household | 9,545 | 36.6% |
| 2-Person Household | 8,750 | 33.6% |
| 3-Person Household | 3,304 | 12.7% |
| 4+ Person Household | 4,467 | 17.1% |
| Total Housing Units | 26,066 | 100.0% |
Occupancy by Ownership by Household Size in Kokomo
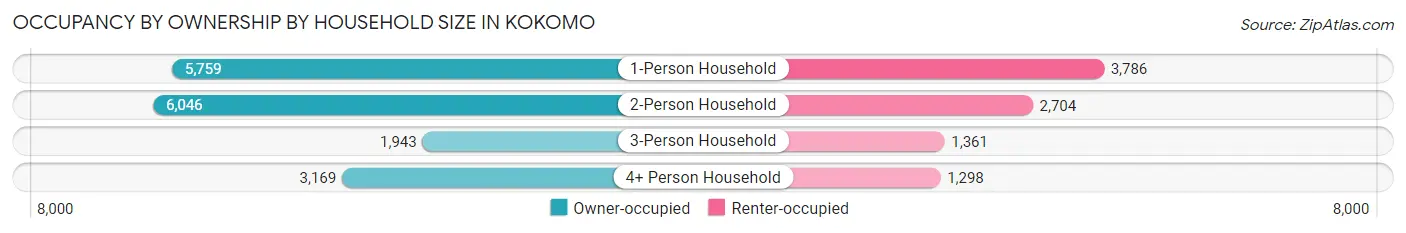
| Household Size | Owner-occupied | Renter-occupied |
| 1-Person Household | 5,759 (60.3%) | 3,786 (39.7%) |
| 2-Person Household | 6,046 (69.1%) | 2,704 (30.9%) |
| 3-Person Household | 1,943 (58.8%) | 1,361 (41.2%) |
| 4+ Person Household | 3,169 (70.9%) | 1,298 (29.1%) |
| Total Housing Units | 16,917 (64.9%) | 9,149 (35.1%) |
Occupancy by Educational Attainment in Kokomo
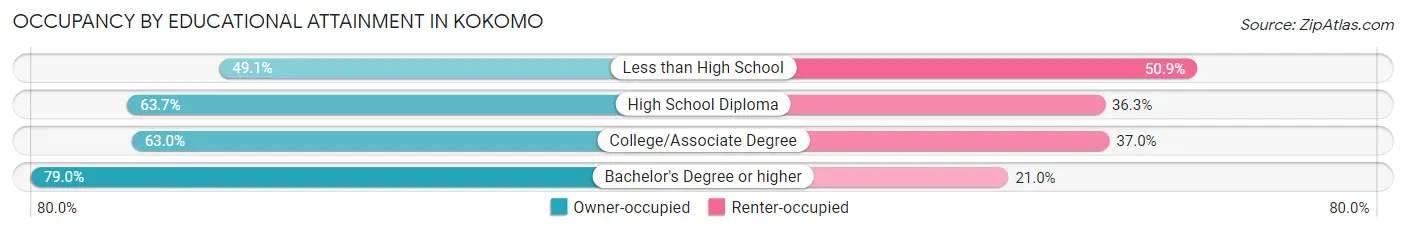
| Household Size | Owner-occupied | Renter-occupied |
| Less than High School | 1,285 (49.1%) | 1,332 (50.9%) |
| High School Diploma | 6,025 (63.7%) | 3,432 (36.3%) |
| College/Associate Degree | 5,698 (63.0%) | 3,347 (37.0%) |
| Bachelor's Degree or higher | 3,909 (79.0%) | 1,038 (21.0%) |
Occupancy by Age of Householder in Kokomo
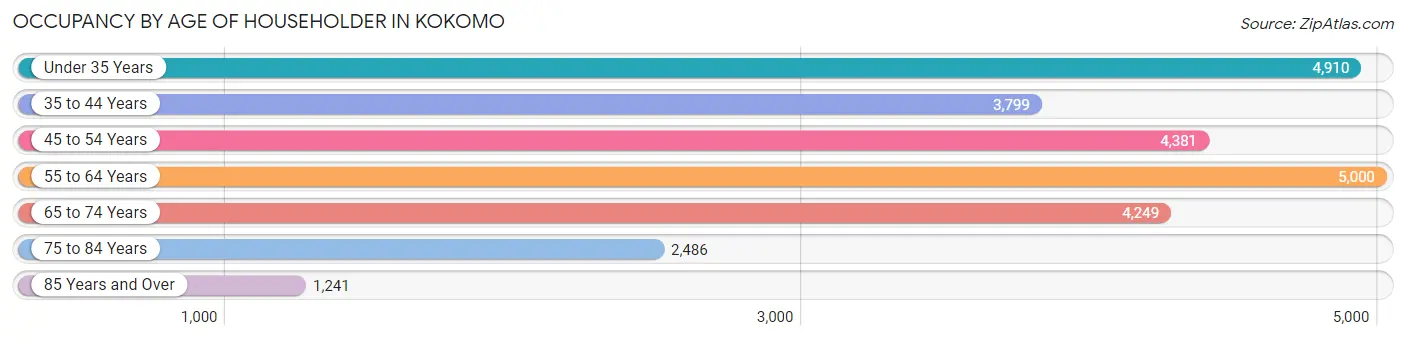
| Age Bracket | # Households | % Households |
| Under 35 Years | 4,910 | 18.8% |
| 35 to 44 Years | 3,799 | 14.6% |
| 45 to 54 Years | 4,381 | 16.8% |
| 55 to 64 Years | 5,000 | 19.2% |
| 65 to 74 Years | 4,249 | 16.3% |
| 75 to 84 Years | 2,486 | 9.5% |
| 85 Years and Over | 1,241 | 4.8% |
| Total | 26,066 | 100.0% |
Housing Finances in Kokomo
Median Income by Occupancy in Kokomo
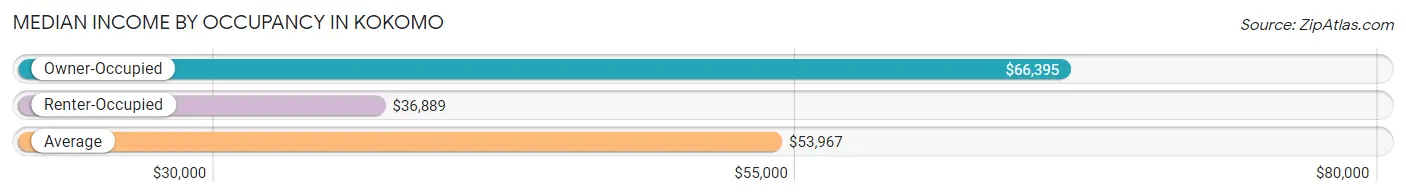
| Occupancy Type | # Households | Median Income |
| Owner-Occupied | 16,917 (64.9%) | $66,395 |
| Renter-Occupied | 9,149 (35.1%) | $36,889 |
| Average | 26,066 (100.0%) | $53,967 |
Occupancy by Householder Income Bracket in Kokomo
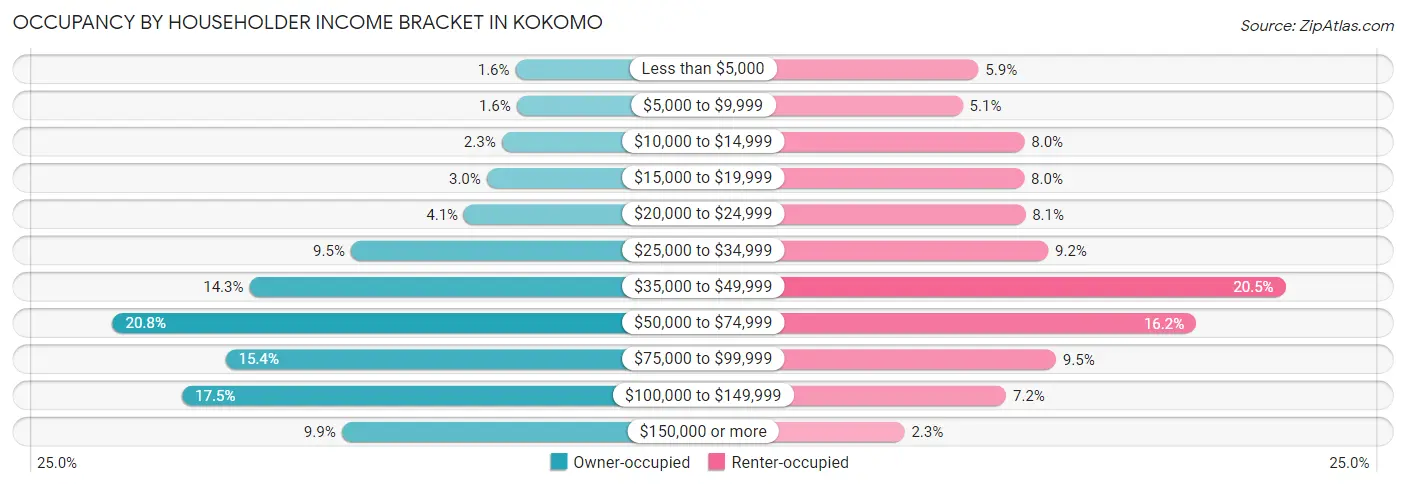
| Income Bracket | Owner-occupied | Renter-occupied |
| Less than $5,000 | 276 (1.6%) | 535 (5.9%) |
| $5,000 to $9,999 | 266 (1.6%) | 467 (5.1%) |
| $10,000 to $14,999 | 388 (2.3%) | 736 (8.0%) |
| $15,000 to $19,999 | 508 (3.0%) | 735 (8.0%) |
| $20,000 to $24,999 | 690 (4.1%) | 739 (8.1%) |
| $25,000 to $34,999 | 1,602 (9.5%) | 839 (9.2%) |
| $35,000 to $49,999 | 2,419 (14.3%) | 1,873 (20.5%) |
| $50,000 to $74,999 | 3,521 (20.8%) | 1,483 (16.2%) |
| $75,000 to $99,999 | 2,610 (15.4%) | 873 (9.5%) |
| $100,000 to $149,999 | 2,961 (17.5%) | 656 (7.2%) |
| $150,000 or more | 1,676 (9.9%) | 213 (2.3%) |
| Total | 16,917 (100.0%) | 9,149 (100.0%) |
Monthly Housing Cost Tiers in Kokomo
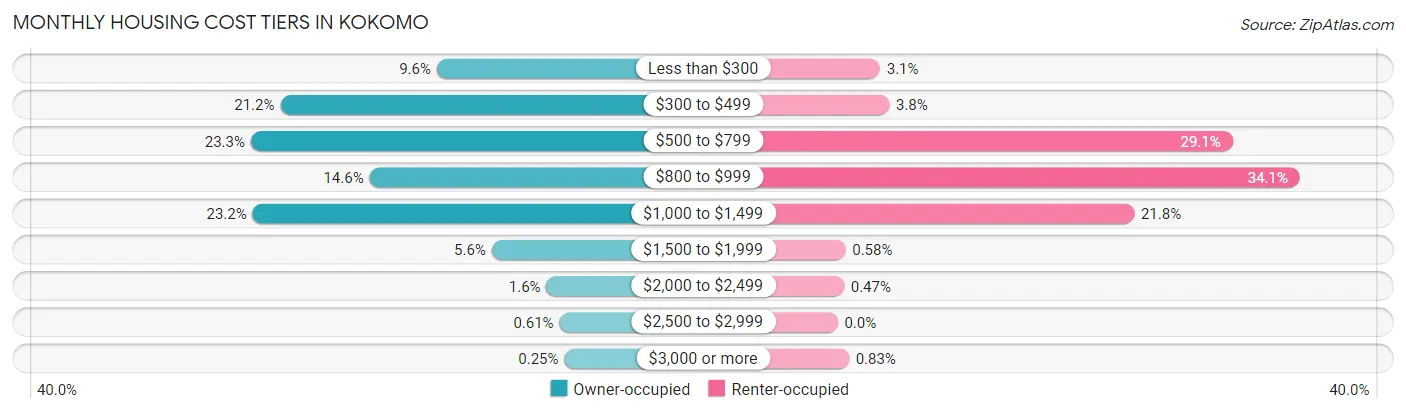
| Monthly Cost | Owner-occupied | Renter-occupied |
| Less than $300 | 1,631 (9.6%) | 285 (3.1%) |
| $300 to $499 | 3,582 (21.2%) | 348 (3.8%) |
| $500 to $799 | 3,948 (23.3%) | 2,662 (29.1%) |
| $800 to $999 | 2,470 (14.6%) | 3,115 (34.1%) |
| $1,000 to $1,499 | 3,927 (23.2%) | 1,998 (21.8%) |
| $1,500 to $1,999 | 948 (5.6%) | 53 (0.6%) |
| $2,000 to $2,499 | 265 (1.6%) | 43 (0.5%) |
| $2,500 to $2,999 | 104 (0.6%) | 0 (0.0%) |
| $3,000 or more | 42 (0.3%) | 76 (0.8%) |
| Total | 16,917 (100.0%) | 9,149 (100.0%) |
Physical Housing Characteristics in Kokomo
Housing Structures in Kokomo
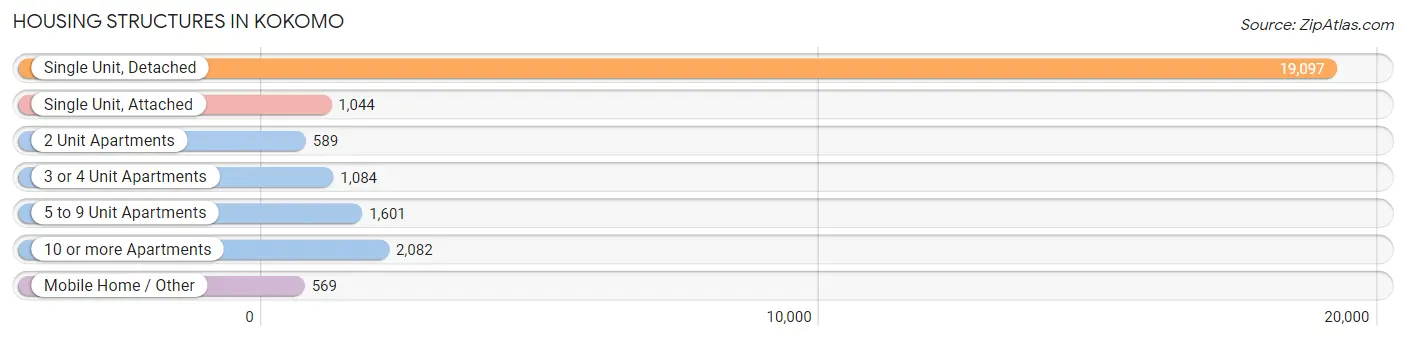
| Structure Type | # Housing Units | % Housing Units |
| Single Unit, Detached | 19,097 | 73.3% |
| Single Unit, Attached | 1,044 | 4.0% |
| 2 Unit Apartments | 589 | 2.3% |
| 3 or 4 Unit Apartments | 1,084 | 4.2% |
| 5 to 9 Unit Apartments | 1,601 | 6.1% |
| 10 or more Apartments | 2,082 | 8.0% |
| Mobile Home / Other | 569 | 2.2% |
| Total | 26,066 | 100.0% |
Housing Structures by Occupancy in Kokomo
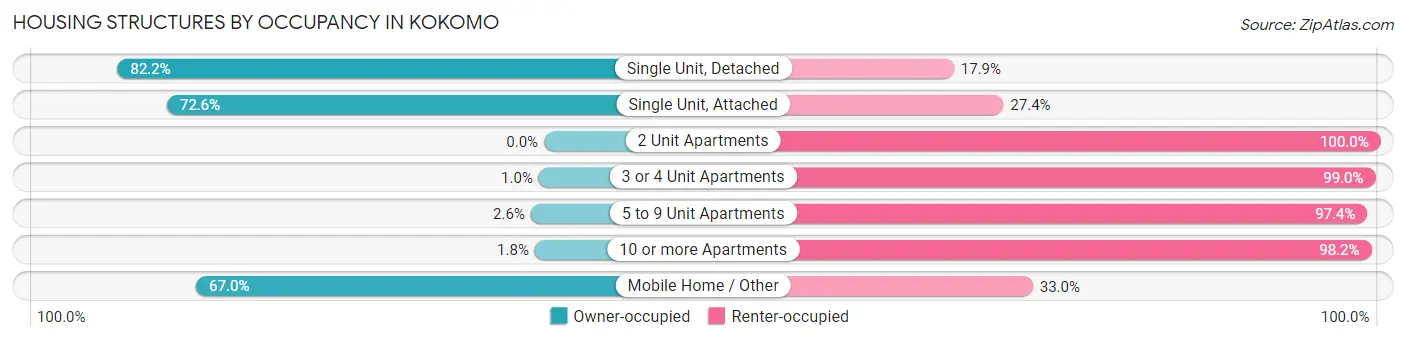
| Structure Type | Owner-occupied | Renter-occupied |
| Single Unit, Detached | 15,689 (82.2%) | 3,408 (17.8%) |
| Single Unit, Attached | 758 (72.6%) | 286 (27.4%) |
| 2 Unit Apartments | 0 (0.0%) | 589 (100.0%) |
| 3 or 4 Unit Apartments | 11 (1.0%) | 1,073 (99.0%) |
| 5 to 9 Unit Apartments | 41 (2.6%) | 1,560 (97.4%) |
| 10 or more Apartments | 37 (1.8%) | 2,045 (98.2%) |
| Mobile Home / Other | 381 (67.0%) | 188 (33.0%) |
| Total | 16,917 (64.9%) | 9,149 (35.1%) |
Housing Structures by Number of Rooms in Kokomo
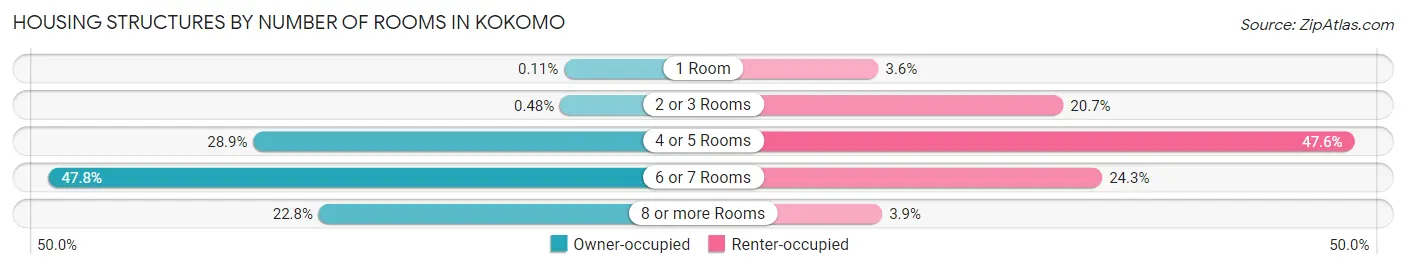
| Number of Rooms | Owner-occupied | Renter-occupied |
| 1 Room | 18 (0.1%) | 327 (3.6%) |
| 2 or 3 Rooms | 81 (0.5%) | 1,891 (20.7%) |
| 4 or 5 Rooms | 4,881 (28.8%) | 4,353 (47.6%) |
| 6 or 7 Rooms | 8,082 (47.8%) | 2,220 (24.3%) |
| 8 or more Rooms | 3,855 (22.8%) | 358 (3.9%) |
| Total | 16,917 (100.0%) | 9,149 (100.0%) |
Housing Structure by Heating Type in Kokomo
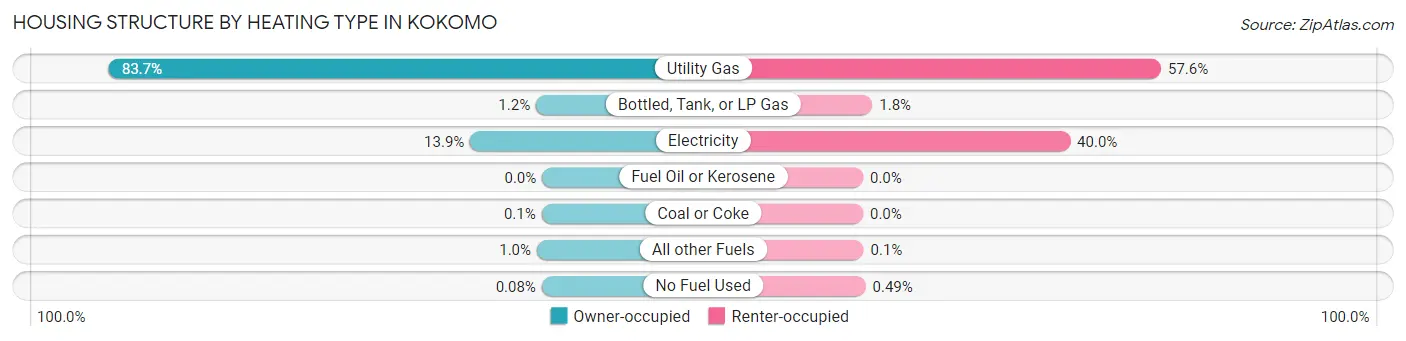
| Heating Type | Owner-occupied | Renter-occupied |
| Utility Gas | 14,163 (83.7%) | 5,269 (57.6%) |
| Bottled, Tank, or LP Gas | 200 (1.2%) | 165 (1.8%) |
| Electricity | 2,352 (13.9%) | 3,661 (40.0%) |
| Fuel Oil or Kerosene | 0 (0.0%) | 0 (0.0%) |
| Coal or Coke | 17 (0.1%) | 0 (0.0%) |
| All other Fuels | 171 (1.0%) | 9 (0.1%) |
| No Fuel Used | 14 (0.1%) | 45 (0.5%) |
| Total | 16,917 (100.0%) | 9,149 (100.0%) |
Household Vehicle Usage in Kokomo
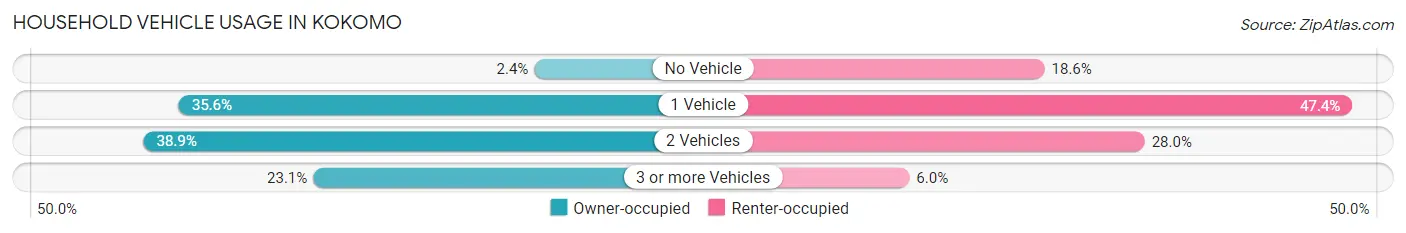
| Vehicles per Household | Owner-occupied | Renter-occupied |
| No Vehicle | 411 (2.4%) | 1,705 (18.6%) |
| 1 Vehicle | 6,023 (35.6%) | 4,332 (47.3%) |
| 2 Vehicles | 6,580 (38.9%) | 2,561 (28.0%) |
| 3 or more Vehicles | 3,903 (23.1%) | 551 (6.0%) |
| Total | 16,917 (100.0%) | 9,149 (100.0%) |
Real Estate & Mortgages in Kokomo
Real Estate and Mortgage Overview in Kokomo
| Characteristic | Without Mortgage | With Mortgage |
| Housing Units | 6,344 | 10,573 |
| Median Property Value | $97,700 | $129,000 |
| Median Household Income | $54,011 | $1,144 |
| Monthly Housing Costs | $394 | $11 |
| Real Estate Taxes | $768 | $538 |
Property Value by Mortgage Status in Kokomo
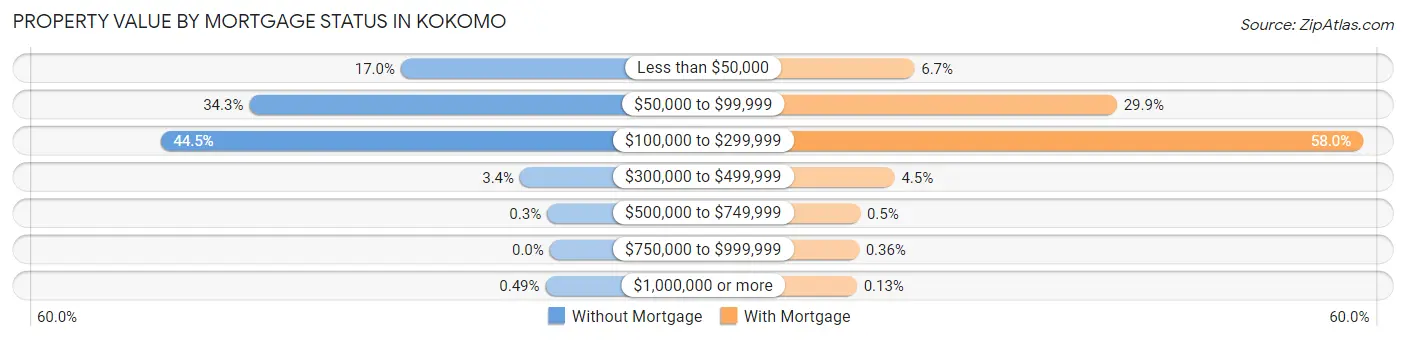
| Property Value | Without Mortgage | With Mortgage |
| Less than $50,000 | 1,079 (17.0%) | 709 (6.7%) |
| $50,000 to $99,999 | 2,178 (34.3%) | 3,156 (29.8%) |
| $100,000 to $299,999 | 2,821 (44.5%) | 6,132 (58.0%) |
| $300,000 to $499,999 | 216 (3.4%) | 471 (4.4%) |
| $500,000 to $749,999 | 19 (0.3%) | 53 (0.5%) |
| $750,000 to $999,999 | 0 (0.0%) | 38 (0.4%) |
| $1,000,000 or more | 31 (0.5%) | 14 (0.1%) |
| Total | 6,344 (100.0%) | 10,573 (100.0%) |
Household Income by Mortgage Status in Kokomo
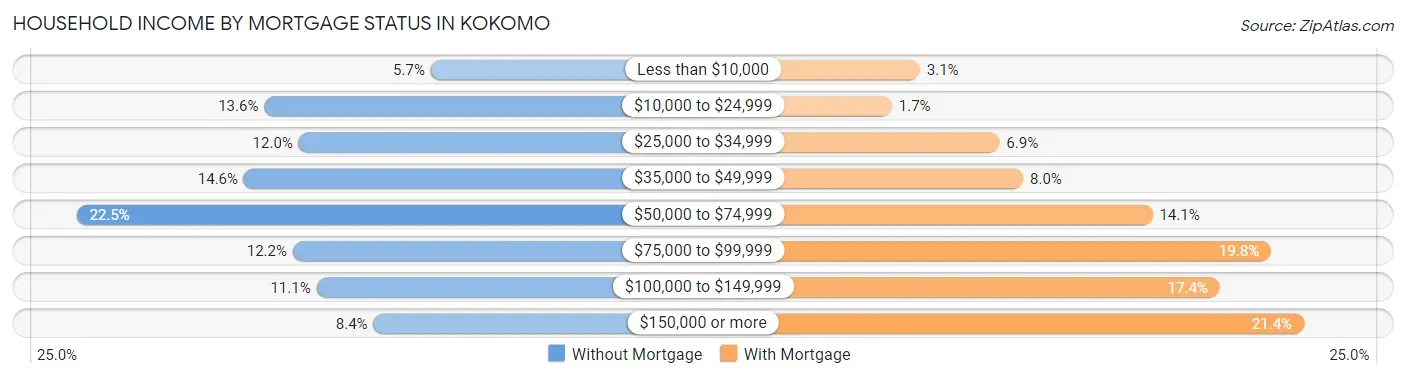
| Household Income | Without Mortgage | With Mortgage |
| Less than $10,000 | 359 (5.7%) | 324 (3.1%) |
| $10,000 to $24,999 | 862 (13.6%) | 183 (1.7%) |
| $25,000 to $34,999 | 758 (11.9%) | 724 (6.9%) |
| $35,000 to $49,999 | 924 (14.6%) | 844 (8.0%) |
| $50,000 to $74,999 | 1,429 (22.5%) | 1,495 (14.1%) |
| $75,000 to $99,999 | 776 (12.2%) | 2,092 (19.8%) |
| $100,000 to $149,999 | 704 (11.1%) | 1,834 (17.3%) |
| $150,000 or more | 532 (8.4%) | 2,257 (21.3%) |
| Total | 6,344 (100.0%) | 10,573 (100.0%) |
Property Value to Household Income Ratio in Kokomo
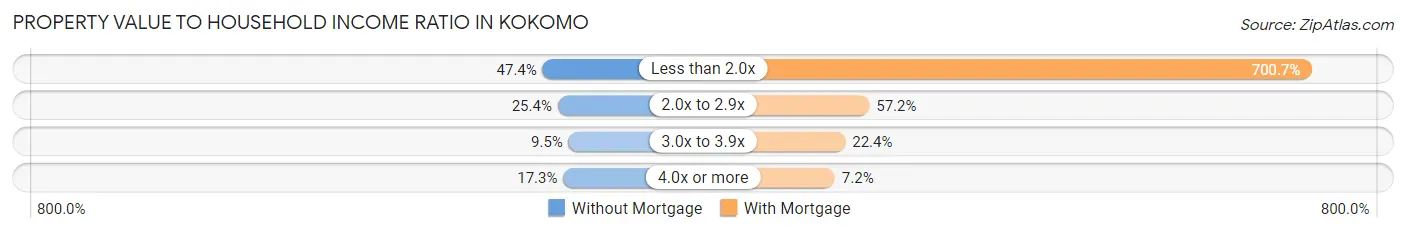
| Value-to-Income Ratio | Without Mortgage | With Mortgage |
| Less than 2.0x | 3,008 (47.4%) | 74,087 (700.7%) |
| 2.0x to 2.9x | 1,610 (25.4%) | 6,052 (57.2%) |
| 3.0x to 3.9x | 603 (9.5%) | 2,364 (22.4%) |
| 4.0x or more | 1,097 (17.3%) | 762 (7.2%) |
| Total | 6,344 (100.0%) | 10,573 (100.0%) |
Real Estate Taxes by Mortgage Status in Kokomo
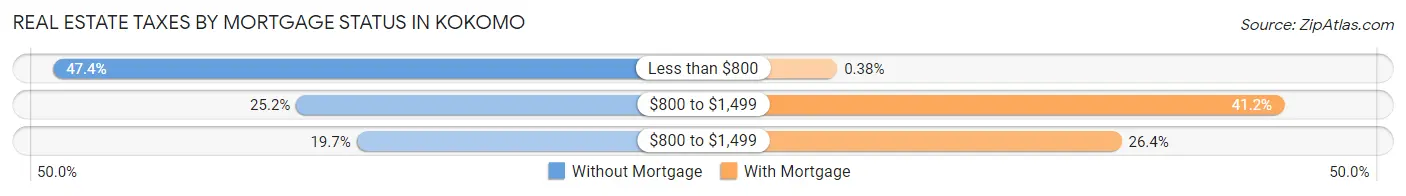
| Property Taxes | Without Mortgage | With Mortgage |
| Less than $800 | 3,006 (47.4%) | 40 (0.4%) |
| $800 to $1,499 | 1,599 (25.2%) | 4,353 (41.2%) |
| $800 to $1,499 | 1,249 (19.7%) | 2,786 (26.4%) |
| Total | 6,344 (100.0%) | 10,573 (100.0%) |
Health & Disability in Kokomo
Health Insurance Coverage by Age in Kokomo
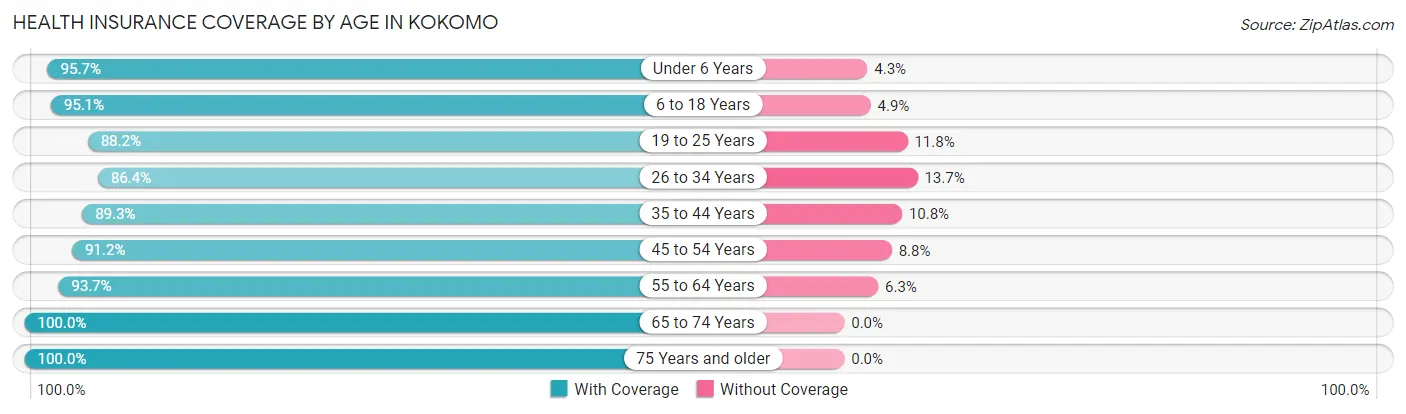
| Age Bracket | With Coverage | Without Coverage |
| Under 6 Years | 3,743 (95.7%) | 168 (4.3%) |
| 6 to 18 Years | 9,830 (95.1%) | 506 (4.9%) |
| 19 to 25 Years | 4,472 (88.2%) | 597 (11.8%) |
| 26 to 34 Years | 5,879 (86.4%) | 929 (13.7%) |
| 35 to 44 Years | 5,894 (89.2%) | 710 (10.7%) |
| 45 to 54 Years | 6,581 (91.2%) | 638 (8.8%) |
| 55 to 64 Years | 7,249 (93.7%) | 487 (6.3%) |
| 65 to 74 Years | 5,783 (100.0%) | 0 (0.0%) |
| 75 Years and older | 4,960 (100.0%) | 0 (0.0%) |
| Total | 54,391 (93.1%) | 4,035 (6.9%) |
Health Insurance Coverage by Citizenship Status in Kokomo
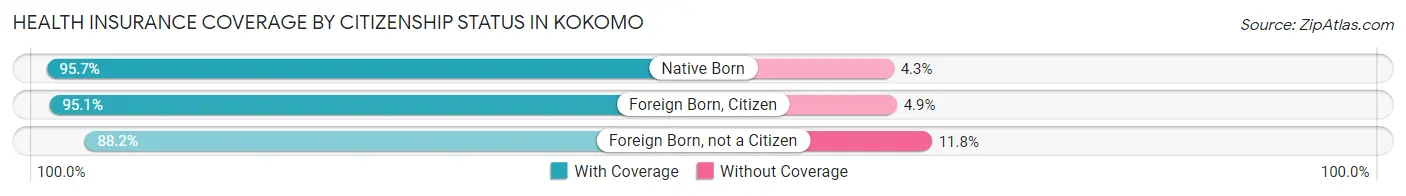
| Citizenship Status | With Coverage | Without Coverage |
| Native Born | 3,743 (95.7%) | 168 (4.3%) |
| Foreign Born, Citizen | 9,830 (95.1%) | 506 (4.9%) |
| Foreign Born, not a Citizen | 4,472 (88.2%) | 597 (11.8%) |
Health Insurance Coverage by Household Income in Kokomo
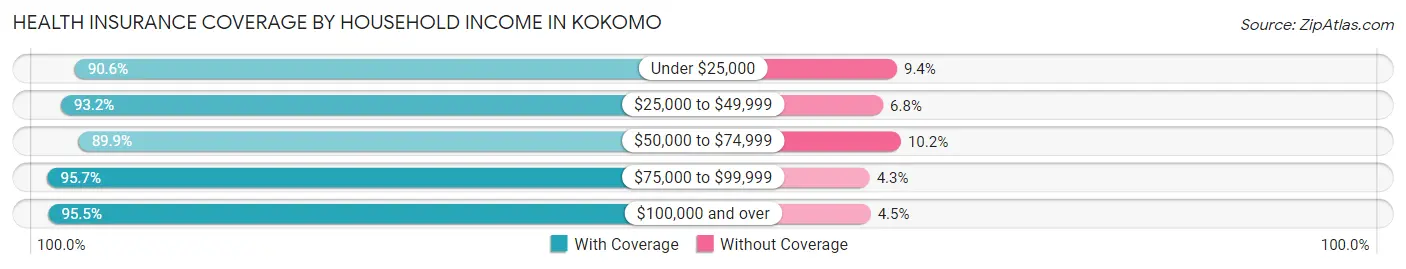
| Household Income | With Coverage | Without Coverage |
| Under $25,000 | 7,667 (90.6%) | 796 (9.4%) |
| $25,000 to $49,999 | 11,391 (93.2%) | 833 (6.8%) |
| $50,000 to $74,999 | 11,323 (89.8%) | 1,279 (10.2%) |
| $75,000 to $99,999 | 8,144 (95.7%) | 366 (4.3%) |
| $100,000 and over | 15,702 (95.5%) | 737 (4.5%) |
Public vs Private Health Insurance Coverage by Age in Kokomo
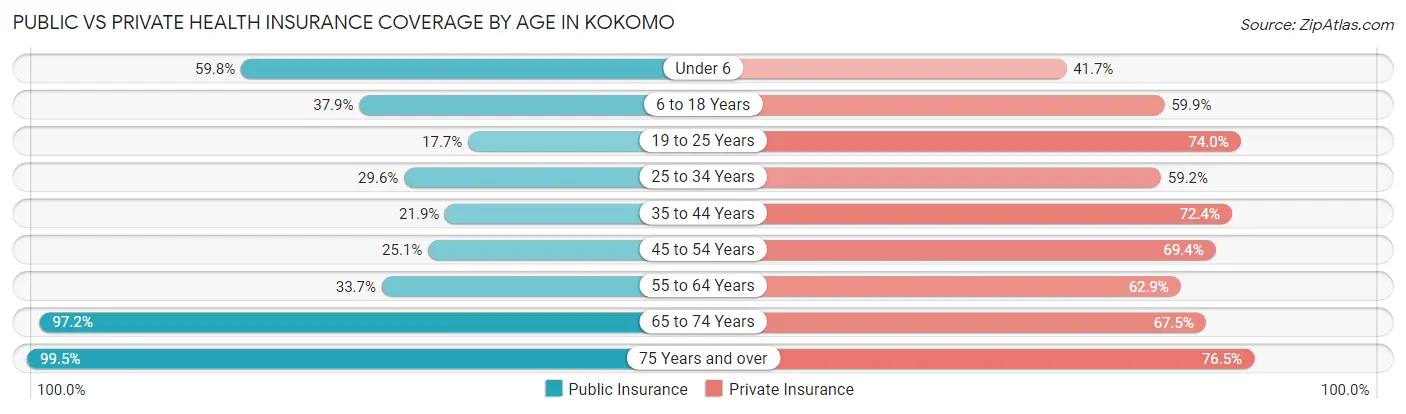
| Age Bracket | Public Insurance | Private Insurance |
| Under 6 | 2,340 (59.8%) | 1,629 (41.6%) |
| 6 to 18 Years | 3,915 (37.9%) | 6,186 (59.9%) |
| 19 to 25 Years | 896 (17.7%) | 3,751 (74.0%) |
| 25 to 34 Years | 2,012 (29.5%) | 4,032 (59.2%) |
| 35 to 44 Years | 1,449 (21.9%) | 4,779 (72.4%) |
| 45 to 54 Years | 1,812 (25.1%) | 5,008 (69.4%) |
| 55 to 64 Years | 2,607 (33.7%) | 4,866 (62.9%) |
| 65 to 74 Years | 5,623 (97.2%) | 3,906 (67.5%) |
| 75 Years and over | 4,936 (99.5%) | 3,794 (76.5%) |
| Total | 25,590 (43.8%) | 37,951 (65.0%) |
Disability Status by Sex by Age in Kokomo
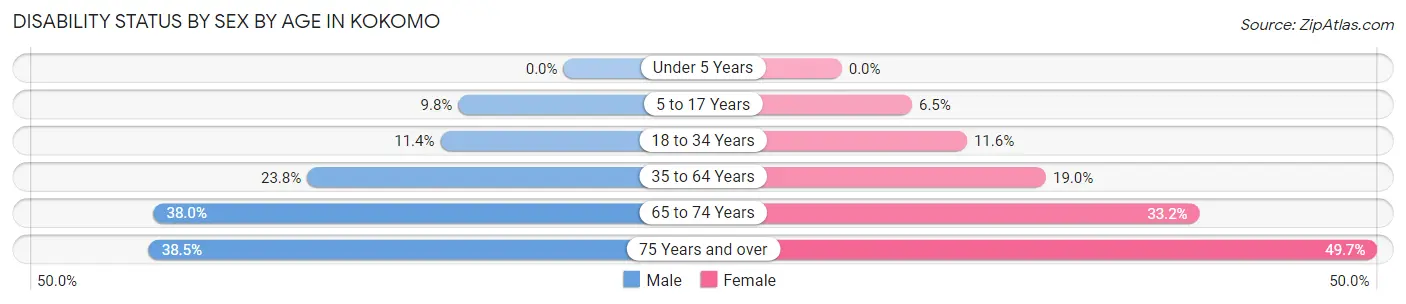
| Age Bracket | Male | Female |
| Under 5 Years | 0 (0.0%) | 0 (0.0%) |
| 5 to 17 Years | 509 (9.8%) | 323 (6.5%) |
| 18 to 34 Years | 728 (11.4%) | 727 (11.6%) |
| 35 to 64 Years | 2,346 (23.8%) | 2,218 (19.0%) |
| 65 to 74 Years | 909 (38.0%) | 1,126 (33.2%) |
| 75 Years and over | 741 (38.5%) | 1,508 (49.7%) |
Disability Class by Sex by Age in Kokomo
Disability Class: Hearing Difficulty
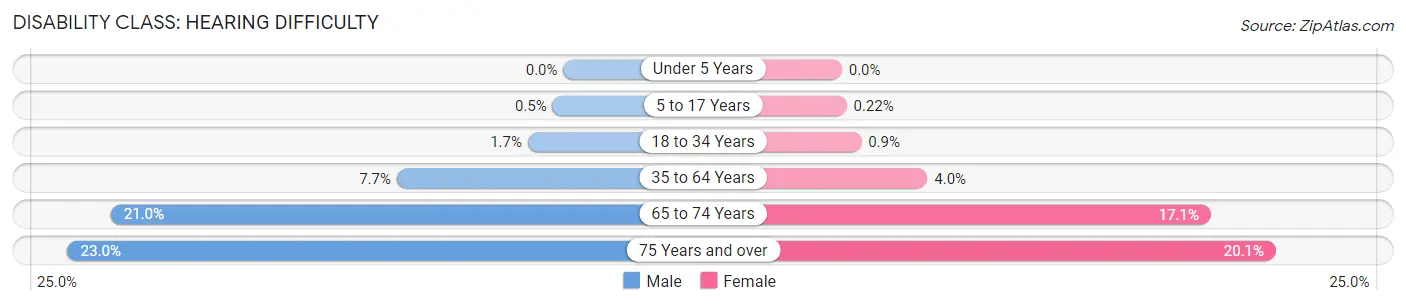
| Age Bracket | Male | Female |
| Under 5 Years | 0 (0.0%) | 0 (0.0%) |
| 5 to 17 Years | 26 (0.5%) | 11 (0.2%) |
| 18 to 34 Years | 105 (1.7%) | 56 (0.9%) |
| 35 to 64 Years | 762 (7.7%) | 464 (4.0%) |
| 65 to 74 Years | 502 (21.0%) | 581 (17.1%) |
| 75 Years and over | 443 (23.0%) | 611 (20.1%) |
Disability Class: Vision Difficulty
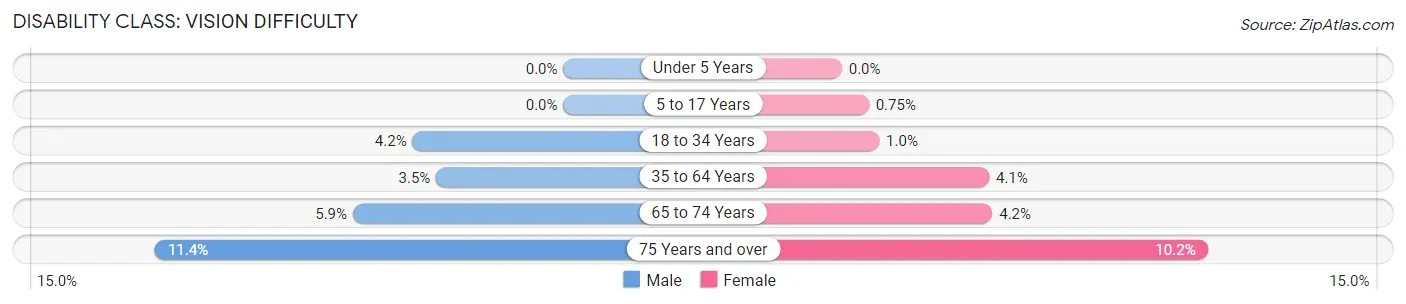
| Age Bracket | Male | Female |
| Under 5 Years | 0 (0.0%) | 0 (0.0%) |
| 5 to 17 Years | 0 (0.0%) | 37 (0.7%) |
| 18 to 34 Years | 268 (4.2%) | 65 (1.0%) |
| 35 to 64 Years | 349 (3.5%) | 479 (4.1%) |
| 65 to 74 Years | 140 (5.9%) | 142 (4.2%) |
| 75 Years and over | 219 (11.4%) | 309 (10.2%) |
Disability Class: Cognitive Difficulty
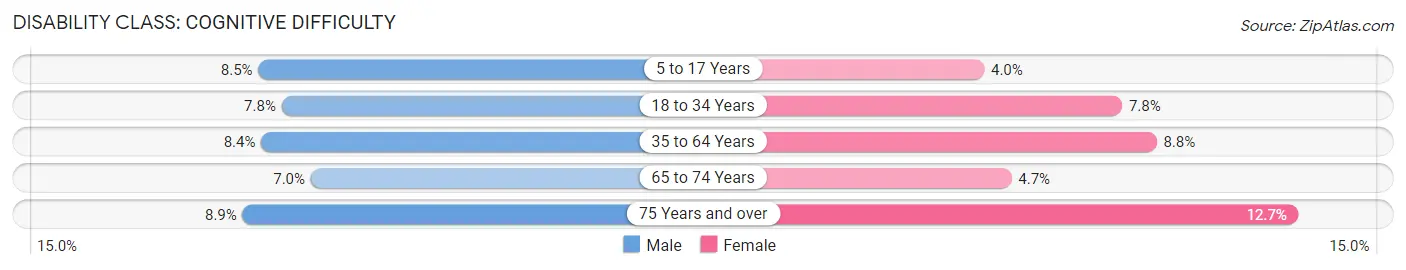
| Age Bracket | Male | Female |
| 5 to 17 Years | 443 (8.5%) | 196 (4.0%) |
| 18 to 34 Years | 500 (7.8%) | 488 (7.8%) |
| 35 to 64 Years | 829 (8.4%) | 1,025 (8.8%) |
| 65 to 74 Years | 168 (7.0%) | 160 (4.7%) |
| 75 Years and over | 172 (8.9%) | 386 (12.7%) |
Disability Class: Ambulatory Difficulty
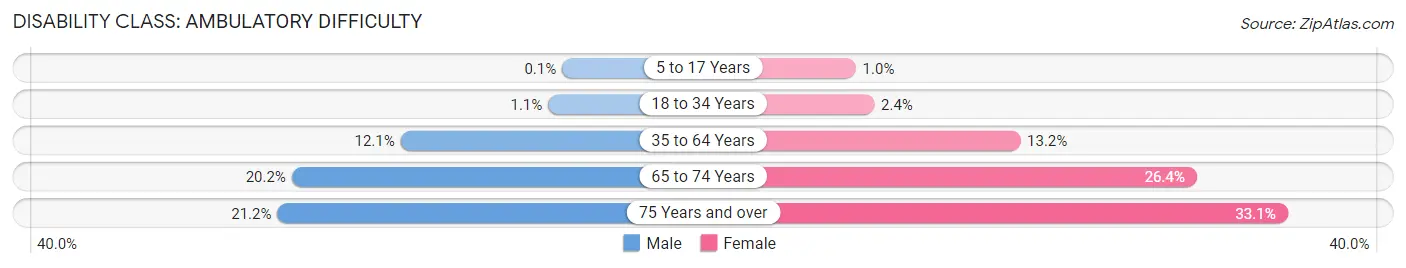
| Age Bracket | Male | Female |
| 5 to 17 Years | 5 (0.1%) | 51 (1.0%) |
| 18 to 34 Years | 72 (1.1%) | 150 (2.4%) |
| 35 to 64 Years | 1,192 (12.1%) | 1,549 (13.2%) |
| 65 to 74 Years | 482 (20.2%) | 894 (26.4%) |
| 75 Years and over | 409 (21.2%) | 1,004 (33.1%) |
Disability Class: Self-Care Difficulty
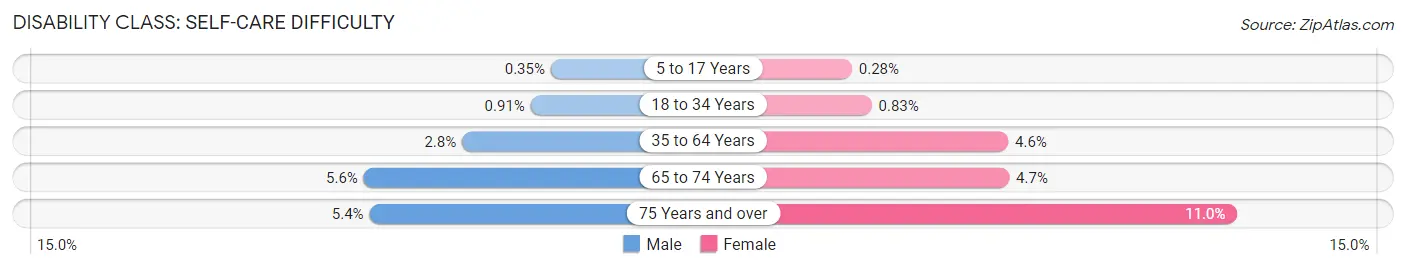
| Age Bracket | Male | Female |
| 5 to 17 Years | 18 (0.4%) | 14 (0.3%) |
| 18 to 34 Years | 58 (0.9%) | 52 (0.8%) |
| 35 to 64 Years | 278 (2.8%) | 542 (4.6%) |
| 65 to 74 Years | 133 (5.6%) | 158 (4.7%) |
| 75 Years and over | 104 (5.4%) | 334 (11.0%) |
Technology Access in Kokomo
Computing Device Access in Kokomo
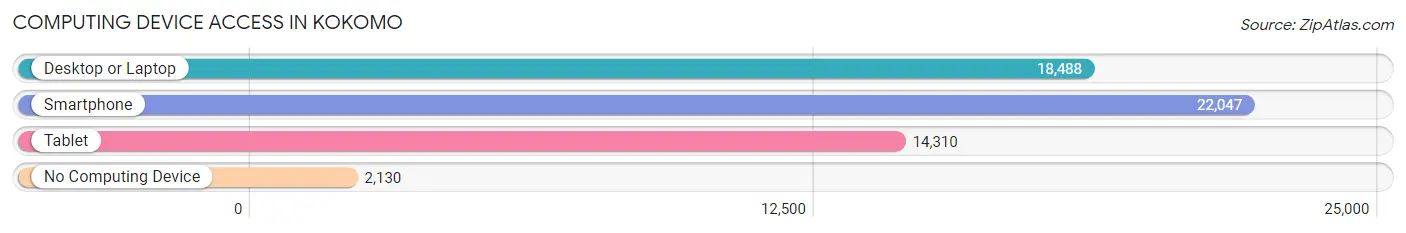
| Device Type | # Households | % Households |
| Desktop or Laptop | 18,488 | 70.9% |
| Smartphone | 22,047 | 84.6% |
| Tablet | 14,310 | 54.9% |
| No Computing Device | 2,130 | 8.2% |
| Total | 26,066 | 100.0% |
Internet Access in Kokomo
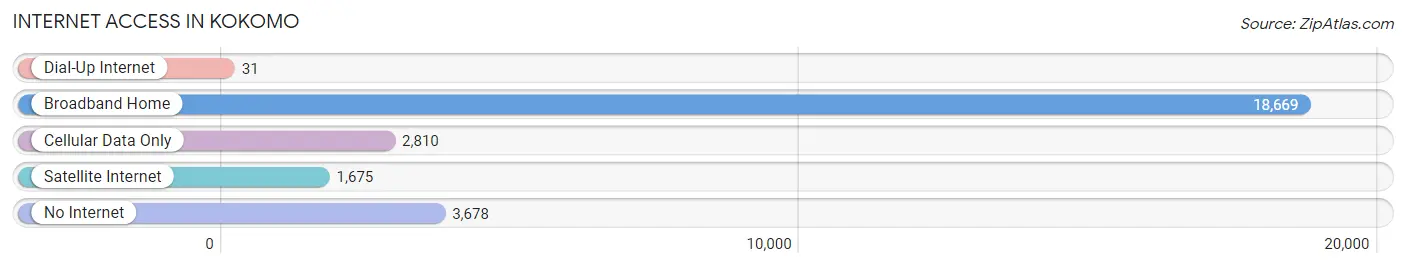
| Internet Type | # Households | % Households |
| Dial-Up Internet | 31 | 0.1% |
| Broadband Home | 18,669 | 71.6% |
| Cellular Data Only | 2,810 | 10.8% |
| Satellite Internet | 1,675 | 6.4% |
| No Internet | 3,678 | 14.1% |
| Total | 26,066 | 100.0% |
Kokomo Summary
Kokomo, Indiana is a city located in Howard County, Indiana, United States. It is the county seat of Howard County and is located in the north-central part of the state. The city is situated in the heart of the Kokomo metropolitan area, which includes Howard, Tipton, and Miami counties. The population of Kokomo was estimated to be 57,818 in 2019, making it the 14th largest city in Indiana.
History
Kokomo was founded in 1844 by David Foster, a Quaker from North Carolina. He named the city after the Miami Indian word for "black walnut tree," which was the name of a nearby creek. The city was incorporated in 1865 and was the first city in Howard County.
Kokomo experienced rapid growth in the late 19th and early 20th centuries, due to its location on the Wabash and Erie Canal and the Nickel Plate Railroad. The city was a major industrial center, producing automobiles, steel, and glass. The city was also home to the first all-electric streetcar system in the United States.
Geography
Kokomo is located in north-central Indiana, approximately 50 miles north of Indianapolis. The city is situated in the Kokomo metropolitan area, which includes Howard, Tipton, and Miami counties. The city is located on the banks of the Wildcat Creek, a tributary of the Wabash River.
Kokomo has a total area of 24.2 square miles, of which 24.1 square miles is land and 0.1 square miles is water. The city is located in the Central Till Plains region of Indiana, which is characterized by flat terrain and fertile soils.
Economy
Kokomo is a major industrial center in Indiana. The city is home to several major employers, including Chrysler, Delphi, and Haynes International. The city is also home to several smaller businesses, including manufacturing, healthcare, and retail.
Kokomo is also home to several educational institutions, including Indiana University Kokomo, Ivy Tech Community College, and the Kokomo-Howard County Public Library.
Demographics
As of the 2019 census, the population of Kokomo was estimated to be 57,818. The racial makeup of the city was 79.2% White, 14.3% African American, 0.4% Native American, 1.7% Asian, 0.1% Pacific Islander, 1.7% from other races, and 2.6% from two or more races. Hispanic or Latino of any race were 4.3% of the population.
The median household income in Kokomo was $41,945 in 2019. The per capita income for the city was $21,845. The median age in the city was 36.7 years. About 17.3% of the population was under the age of 18, and 8.3% was 65 years or older.
Common Questions
What is Per Capita Income in Kokomo?
Per Capita income in Kokomo is $30,738.
What is the Median Family Income in Kokomo?
Median Family Income in Kokomo is $68,839.
What is the Median Household income in Kokomo?
Median Household Income in Kokomo is $53,967.
What is Income or Wage Gap in Kokomo?
Income or Wage Gap in Kokomo is 28.1%.
Women in Kokomo earn 71.9 cents for every dollar earned by a man.
What is Family Income Deficit in Kokomo?
Family Income Deficit in Kokomo is $10,681.
Families that are below poverty line in Kokomo earn $10,681 less on average than the poverty threshold level.
What is Inequality or Gini Index in Kokomo?
Inequality or Gini Index in Kokomo is 0.43.
What is the Total Population of Kokomo?
Total Population of Kokomo is 59,534.
What is the Total Male Population of Kokomo?
Total Male Population of Kokomo is 28,076.
What is the Total Female Population of Kokomo?
Total Female Population of Kokomo is 31,458.
What is the Ratio of Males per 100 Females in Kokomo?
There are 89.25 Males per 100 Females in Kokomo.
What is the Ratio of Females per 100 Males in Kokomo?
There are 112.05 Females per 100 Males in Kokomo.
What is the Median Population Age in Kokomo?
Median Population Age in Kokomo is 39.8 Years.
What is the Average Family Size in Kokomo
Average Family Size in Kokomo is 2.9 People.
What is the Average Household Size in Kokomo
Average Household Size in Kokomo is 2.2 People.
How Large is the Labor Force in Kokomo?
There are 27,727 People in the Labor Forcein in Kokomo.
What is the Percentage of People in the Labor Force in Kokomo?
58.2% of People are in the Labor Force in Kokomo.
What is the Unemployment Rate in Kokomo?
Unemployment Rate in Kokomo is 6.1%.