Westfield, IN Map & Demographics
Westfield Map
Westfield Overview
$58,223
PER CAPITA INCOME
$128,462
AVG FAMILY INCOME
$117,519
AVG HOUSEHOLD INCOME
42.9%
WAGE / INCOME GAP [ % ]
57.1¢/ $1
WAGE / INCOME GAP [ $ ]
0.44
INEQUALITY / GINI INDEX
48,262
TOTAL POPULATION
23,647
MALE POPULATION
24,615
FEMALE POPULATION
96.07
MALES / 100 FEMALES
104.09
FEMALES / 100 MALES
36.9
MEDIAN AGE
3.1
AVG FAMILY SIZE
2.7
AVG HOUSEHOLD SIZE
26,215
LABOR FORCE [ PEOPLE ]
72.8%
PERCENT IN LABOR FORCE
2.0%
UNEMPLOYMENT RATE
Westfield Zip Codes
Westfield Area Codes
Income in Westfield
Income Overview in Westfield
Per Capita Income in Westfield is $58,223, while median incomes of families and households are $128,462 and $117,519 respectively.
| Characteristic | Number | Measure |
| Per Capita Income | 48,262 | $58,223 |
| Median Family Income | 14,035 | $128,462 |
| Mean Family Income | 14,035 | $175,715 |
| Median Household Income | 17,888 | $117,519 |
| Mean Household Income | 17,888 | $157,236 |
| Income Deficit | 14,035 | $0 |
| Wage / Income Gap (%) | 48,262 | 42.86% |
| Wage / Income Gap ($) | 48,262 | 57.14¢ per $1 |
| Gini / Inequality Index | 48,262 | 0.44 |
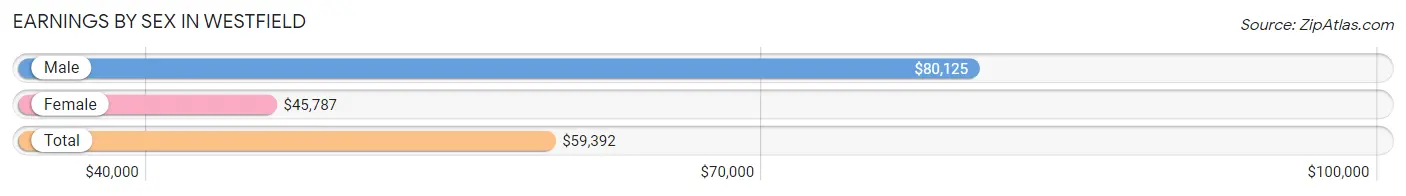
Earnings by Sex in Westfield
Average Earnings in Westfield are $59,392, $80,125 for men and $45,787 for women, a difference of 42.9%.
| Sex | Number | Average Earnings |
| Male | 14,265 (53.3%) | $80,125 |
| Female | 12,473 (46.7%) | $45,787 |
| Total | 26,738 (100.0%) | $59,392 |
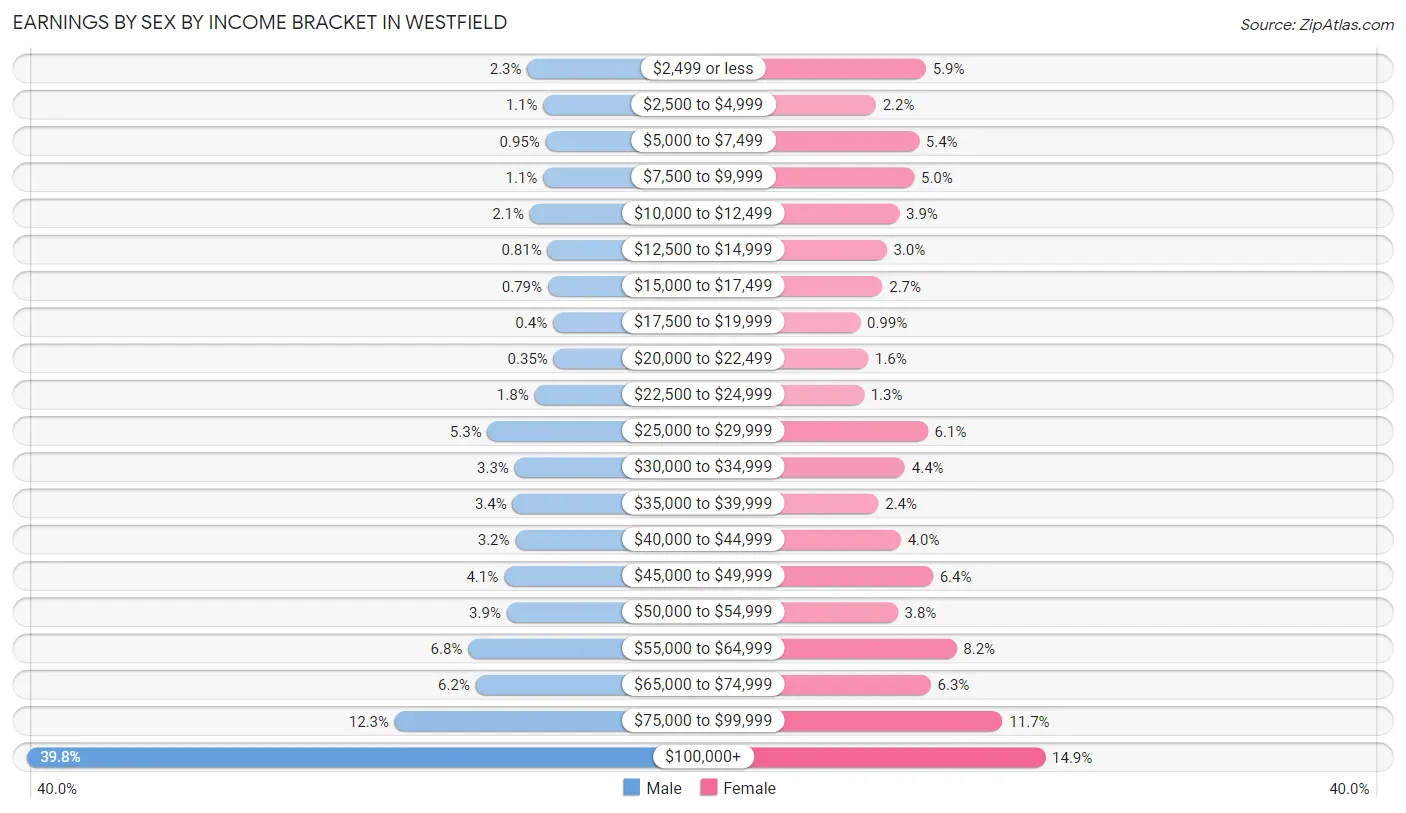
Earnings by Sex by Income Bracket in Westfield
The most common earnings brackets in Westfield are $100,000+ for men (5,677 | 39.8%) and $100,000+ for women (1,854 | 14.9%).
| Income | Male | Female |
| $2,499 or less | 331 (2.3%) | 739 (5.9%) |
| $2,500 to $4,999 | 161 (1.1%) | 271 (2.2%) |
| $5,000 to $7,499 | 135 (0.9%) | 673 (5.4%) |
| $7,500 to $9,999 | 163 (1.1%) | 629 (5.0%) |
| $10,000 to $12,499 | 305 (2.1%) | 489 (3.9%) |
| $12,500 to $14,999 | 116 (0.8%) | 371 (3.0%) |
| $15,000 to $17,499 | 113 (0.8%) | 332 (2.7%) |
| $17,500 to $19,999 | 57 (0.4%) | 124 (1.0%) |
| $20,000 to $22,499 | 50 (0.4%) | 198 (1.6%) |
| $22,500 to $24,999 | 256 (1.8%) | 158 (1.3%) |
| $25,000 to $29,999 | 758 (5.3%) | 756 (6.1%) |
| $30,000 to $34,999 | 466 (3.3%) | 542 (4.3%) |
| $35,000 to $39,999 | 489 (3.4%) | 294 (2.4%) |
| $40,000 to $44,999 | 459 (3.2%) | 504 (4.0%) |
| $45,000 to $49,999 | 581 (4.1%) | 803 (6.4%) |
| $50,000 to $54,999 | 552 (3.9%) | 475 (3.8%) |
| $55,000 to $64,999 | 965 (6.8%) | 1,024 (8.2%) |
| $65,000 to $74,999 | 883 (6.2%) | 783 (6.3%) |
| $75,000 to $99,999 | 1,748 (12.2%) | 1,454 (11.7%) |
| $100,000+ | 5,677 (39.8%) | 1,854 (14.9%) |
| Total | 14,265 (100.0%) | 12,473 (100.0%) |
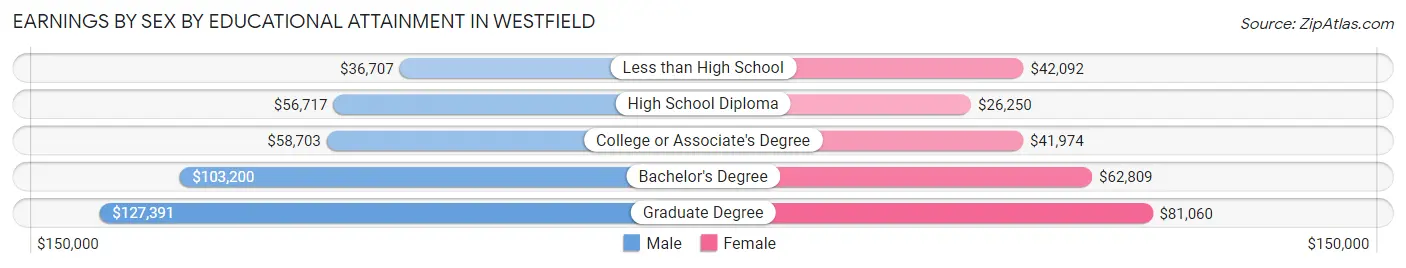
Earnings by Sex by Educational Attainment in Westfield
Average earnings in Westfield are $87,494 for men and $52,339 for women, a difference of 40.2%. Men with an educational attainment of graduate degree enjoy the highest average annual earnings of $127,391, while those with less than high school education earn the least with $36,707. Women with an educational attainment of graduate degree earn the most with the average annual earnings of $81,060, while those with high school diploma education have the smallest earnings of $26,250.
| Educational Attainment | Male Income | Female Income |
| Less than High School | $36,707 | $42,092 |
| High School Diploma | $56,717 | $26,250 |
| College or Associate's Degree | $58,703 | $41,974 |
| Bachelor's Degree | $103,200 | $62,809 |
| Graduate Degree | $127,391 | $81,060 |
| Total | $87,494 | $52,339 |
Family Income in Westfield
Family Income Brackets in Westfield
According to the Westfield family income data, there are 3,944 families falling into the $200,000+ income range, which is the most common income bracket and makes up 28.1% of all families. Conversely, the less than $10,000 income bracket is the least frequent group with only 84 families (0.6%) belonging to this category.
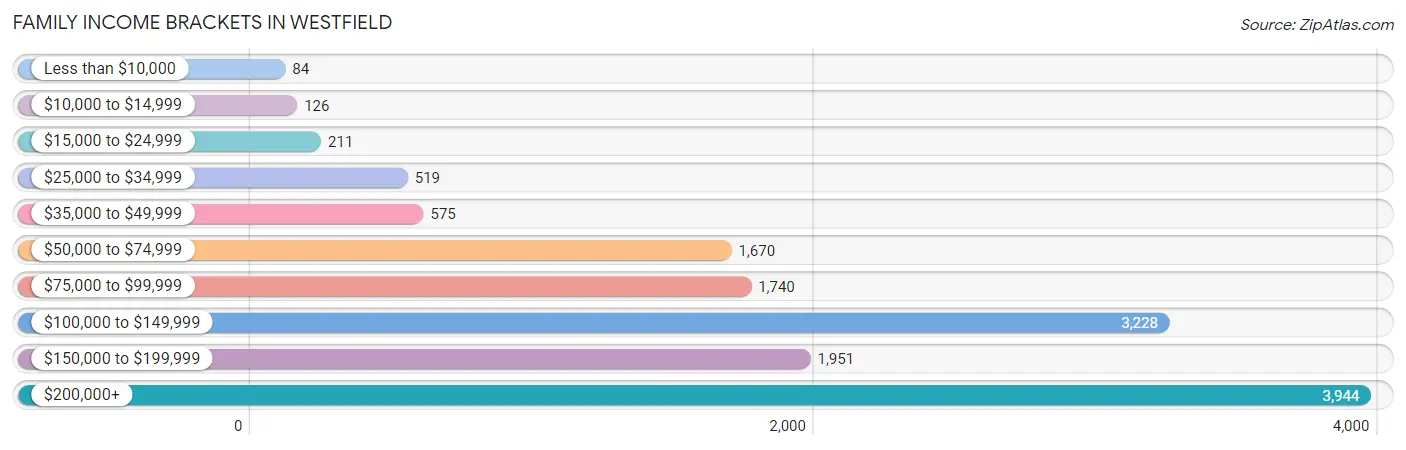
| Income Bracket | # Families | % Families |
| Less than $10,000 | 84 | 0.6% |
| $10,000 to $14,999 | 126 | 0.9% |
| $15,000 to $24,999 | 211 | 1.5% |
| $25,000 to $34,999 | 519 | 3.7% |
| $35,000 to $49,999 | 575 | 4.1% |
| $50,000 to $74,999 | 1,670 | 11.9% |
| $75,000 to $99,999 | 1,740 | 12.4% |
| $100,000 to $149,999 | 3,228 | 23.0% |
| $150,000 to $199,999 | 1,951 | 13.9% |
| $200,000+ | 3,944 | 28.1% |
Family Income by Famaliy Size in Westfield
7+ person families (155 | 1.1%) account for the highest median family income in Westfield with $180,717 per family, while 2-person families (6,165 | 43.9%) have the highest median income of $56,736 per family member.
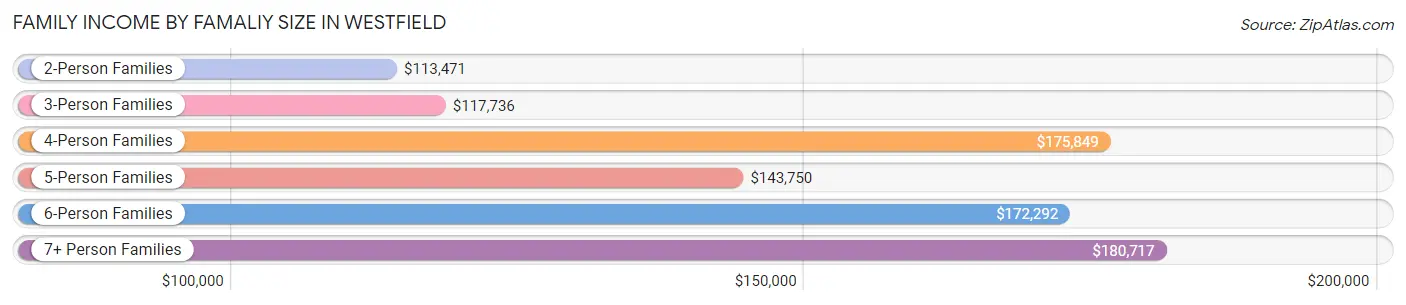
| Income Bracket | # Families | Median Income |
| 2-Person Families | 6,165 (43.9%) | $113,471 |
| 3-Person Families | 3,100 (22.1%) | $117,736 |
| 4-Person Families | 3,064 (21.8%) | $175,849 |
| 5-Person Families | 1,256 (8.9%) | $143,750 |
| 6-Person Families | 295 (2.1%) | $172,292 |
| 7+ Person Families | 155 (1.1%) | $180,717 |
| Total | 14,035 (100.0%) | $128,462 |
Family Income by Number of Earners in Westfield
The median family income in Westfield is $128,462, with families comprising 3+ earners (1,042) having the highest median family income of $179,375, while families with no earners (1,473) have the lowest median family income of $72,449, accounting for 7.4% and 10.5% of families, respectively.
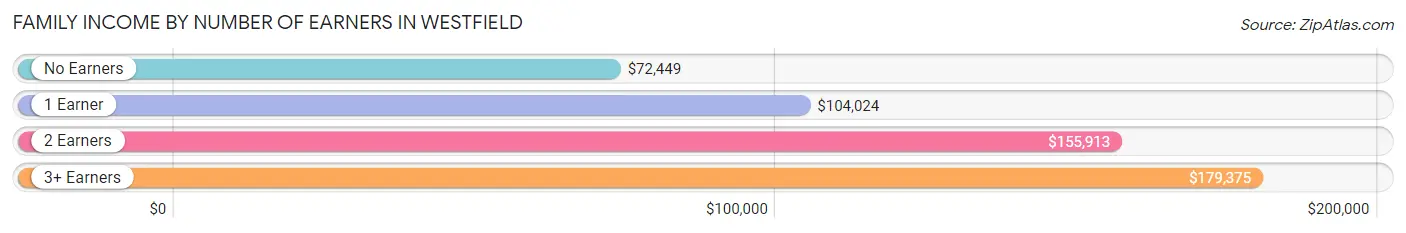
| Number of Earners | # Families | Median Income |
| No Earners | 1,473 (10.5%) | $72,449 |
| 1 Earner | 4,286 (30.5%) | $104,024 |
| 2 Earners | 7,234 (51.5%) | $155,913 |
| 3+ Earners | 1,042 (7.4%) | $179,375 |
| Total | 14,035 (100.0%) | $128,462 |
Household Income in Westfield
Household Income Brackets in Westfield
With 4,150 households falling in the category, the $200,000+ income range is the most frequent in Westfield, accounting for 23.2% of all households. In contrast, only 161 households (0.9%) fall into the less than $10,000 income bracket, making it the least populous group.
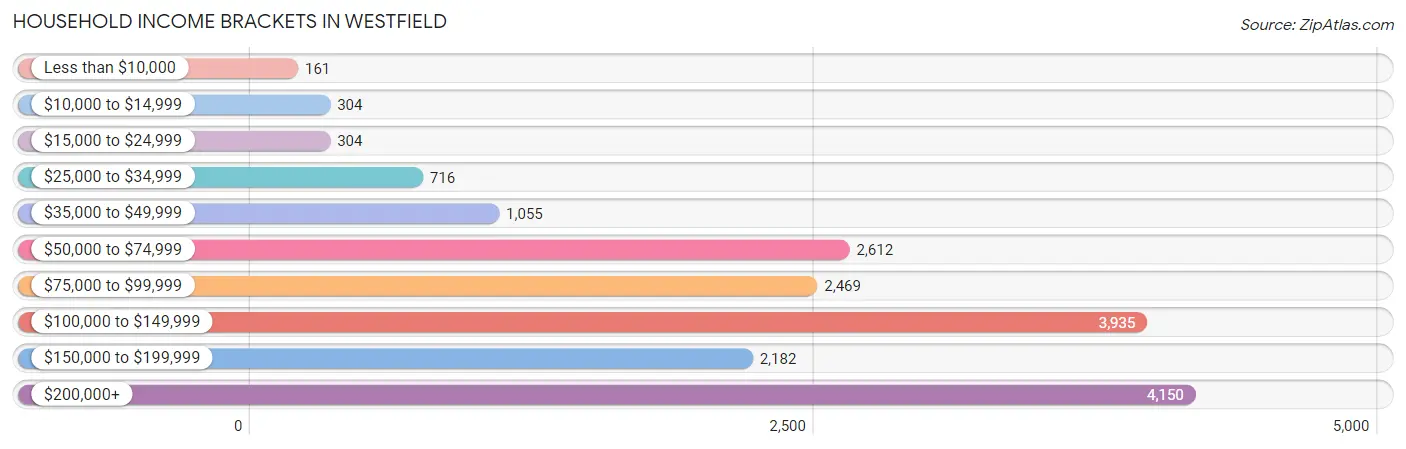
| Income Bracket | # Households | % Households |
| Less than $10,000 | 161 | 0.9% |
| $10,000 to $14,999 | 304 | 1.7% |
| $15,000 to $24,999 | 304 | 1.7% |
| $25,000 to $34,999 | 716 | 4.0% |
| $35,000 to $49,999 | 1,055 | 5.9% |
| $50,000 to $74,999 | 2,612 | 14.6% |
| $75,000 to $99,999 | 2,469 | 13.8% |
| $100,000 to $149,999 | 3,935 | 22.0% |
| $150,000 to $199,999 | 2,182 | 12.2% |
| $200,000+ | 4,150 | 23.2% |
Household Income by Householder Age in Westfield
The median household income in Westfield is $117,519, with the highest median household income of $142,647 found in the 45 to 64 years age bracket for the primary householder. A total of 6,474 households (36.2%) fall into this category. Meanwhile, the 15 to 24 years age bracket for the primary householder has the lowest median household income of $0, with 450 households (2.5%) in this group.
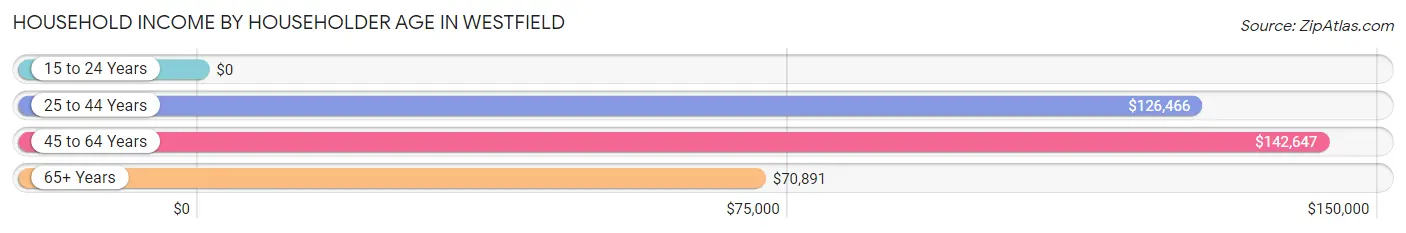
| Income Bracket | # Households | Median Income |
| 15 to 24 Years | 450 (2.5%) | $0 |
| 25 to 44 Years | 7,246 (40.5%) | $126,466 |
| 45 to 64 Years | 6,474 (36.2%) | $142,647 |
| 65+ Years | 3,718 (20.8%) | $70,891 |
| Total | 17,888 (100.0%) | $117,519 |
Poverty in Westfield
Income Below Poverty by Sex and Age in Westfield
With 4.0% poverty level for males and 4.2% for females among the residents of Westfield, 6 to 11 year old males and 18 to 24 year old females are the most vulnerable to poverty, with 363 males (12.4%) and 174 females (9.8%) in their respective age groups living below the poverty level.
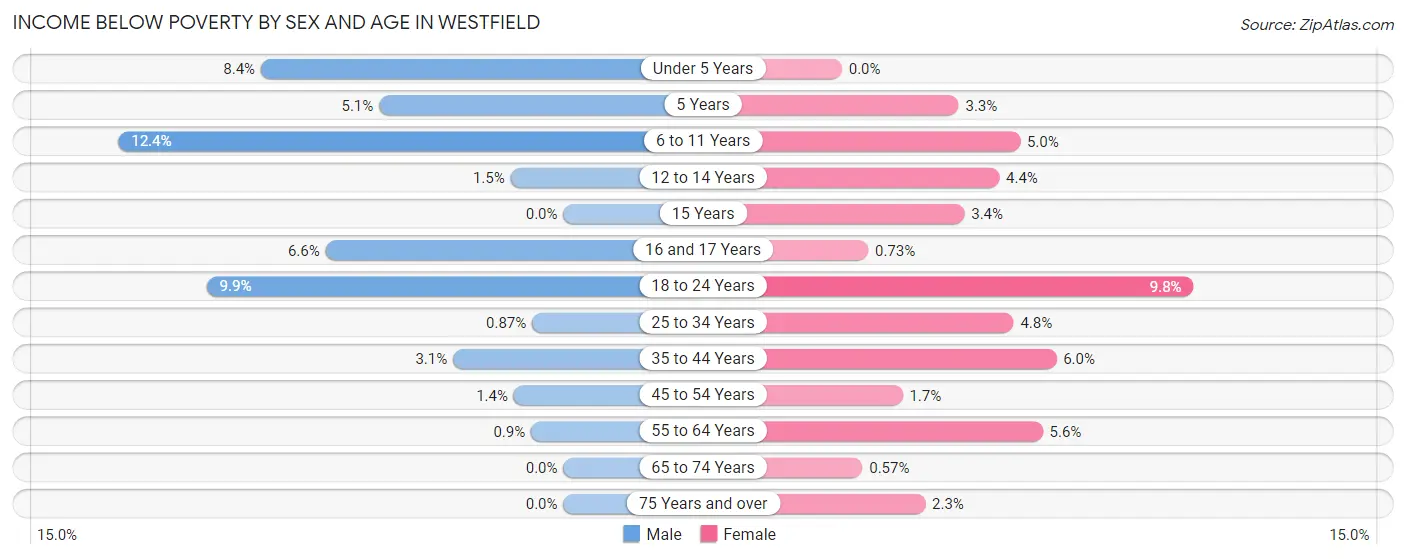
| Age Bracket | Male | Female |
| Under 5 Years | 148 (8.4%) | 0 (0.0%) |
| 5 Years | 22 (5.1%) | 16 (3.3%) |
| 6 to 11 Years | 363 (12.4%) | 123 (5.0%) |
| 12 to 14 Years | 16 (1.5%) | 55 (4.4%) |
| 15 Years | 0 (0.0%) | 9 (3.4%) |
| 16 and 17 Years | 37 (6.6%) | 4 (0.7%) |
| 18 to 24 Years | 137 (9.9%) | 174 (9.8%) |
| 25 to 34 Years | 27 (0.9%) | 139 (4.8%) |
| 35 to 44 Years | 116 (3.1%) | 244 (6.0%) |
| 45 to 54 Years | 44 (1.4%) | 51 (1.7%) |
| 55 to 64 Years | 23 (0.9%) | 150 (5.6%) |
| 65 to 74 Years | 0 (0.0%) | 12 (0.6%) |
| 75 Years and over | 0 (0.0%) | 36 (2.3%) |
| Total | 933 (4.0%) | 1,013 (4.2%) |
Income Above Poverty by Sex and Age in Westfield
According to the poverty statistics in Westfield, males aged 15 years and females aged under 5 years are the age groups that are most secure financially, with 100.0% of males and 100.0% of females in these age groups living above the poverty line.
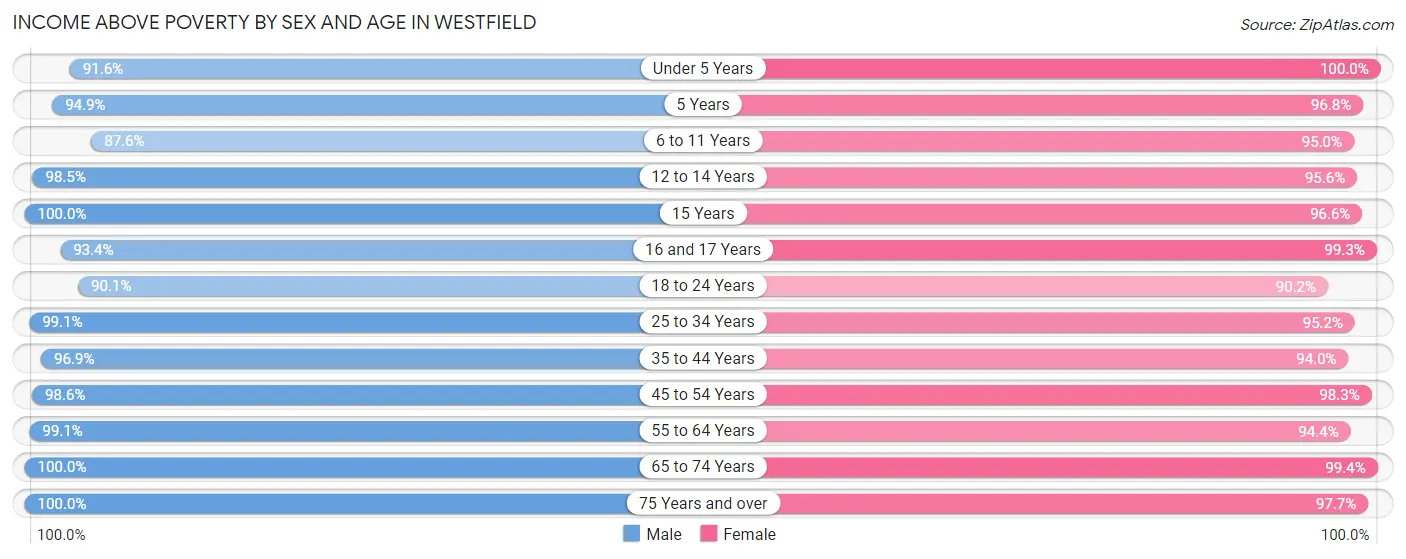
| Age Bracket | Male | Female |
| Under 5 Years | 1,609 (91.6%) | 1,265 (100.0%) |
| 5 Years | 407 (94.9%) | 476 (96.8%) |
| 6 to 11 Years | 2,567 (87.6%) | 2,359 (95.0%) |
| 12 to 14 Years | 1,073 (98.5%) | 1,202 (95.6%) |
| 15 Years | 229 (100.0%) | 255 (96.6%) |
| 16 and 17 Years | 522 (93.4%) | 546 (99.3%) |
| 18 to 24 Years | 1,243 (90.1%) | 1,604 (90.2%) |
| 25 to 34 Years | 3,077 (99.1%) | 2,768 (95.2%) |
| 35 to 44 Years | 3,668 (96.9%) | 3,842 (94.0%) |
| 45 to 54 Years | 3,151 (98.6%) | 2,967 (98.3%) |
| 55 to 64 Years | 2,532 (99.1%) | 2,533 (94.4%) |
| 65 to 74 Years | 1,732 (100.0%) | 2,091 (99.4%) |
| 75 Years and over | 811 (100.0%) | 1,517 (97.7%) |
| Total | 22,621 (96.0%) | 23,425 (95.9%) |
Income Below Poverty Among Married-Couple Families in Westfield
The poverty statistics for married-couple families in Westfield show that 1.0% or 116 of the total 11,539 families live below the poverty line. Families with 1 or 2 children have the highest poverty rate of 2.4%, comprising of 106 families. On the other hand, families with 3 or 4 children have the lowest poverty rate of 0.0%, which includes 0 families.
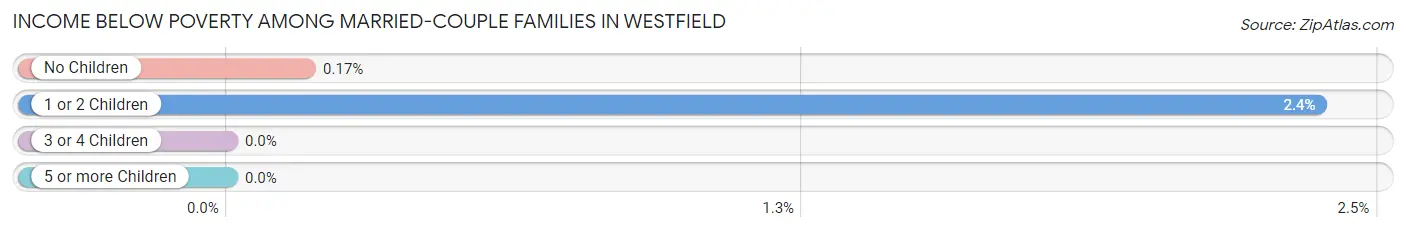
| Children | Above Poverty | Below Poverty |
| No Children | 5,799 (99.8%) | 10 (0.2%) |
| 1 or 2 Children | 4,374 (97.6%) | 106 (2.4%) |
| 3 or 4 Children | 1,163 (100.0%) | 0 (0.0%) |
| 5 or more Children | 87 (100.0%) | 0 (0.0%) |
| Total | 11,423 (99.0%) | 116 (1.0%) |
Income Below Poverty Among Single-Parent Households in Westfield
According to the poverty data in Westfield, 1.3% or 9 single-father households and 21.3% or 380 single-mother households are living below the poverty line. Among single-father households, those with 1 or 2 children have the highest poverty rate, with 9 households (2.4%) experiencing poverty. Likewise, among single-mother households, those with 3 or 4 children have the highest poverty rate, with 117 households (57.6%) falling below the poverty line.
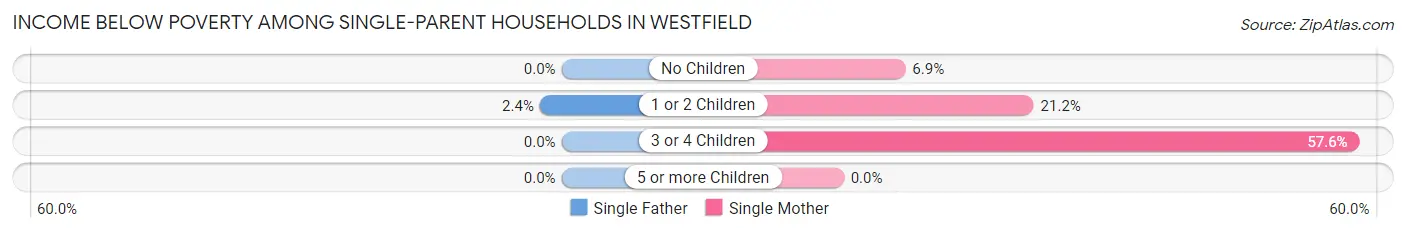
| Children | Single Father | Single Mother |
| No Children | 0 (0.0%) | 35 (6.9%) |
| 1 or 2 Children | 9 (2.4%) | 228 (21.2%) |
| 3 or 4 Children | 0 (0.0%) | 117 (57.6%) |
| 5 or more Children | 0 (0.0%) | 0 (0.0%) |
| Total | 9 (1.3%) | 380 (21.3%) |
Income Below Poverty Among Married-Couple vs Single-Parent Households in Westfield
The poverty data for Westfield shows that 116 of the married-couple family households (1.0%) and 389 of the single-parent households (15.6%) are living below the poverty level. Within the married-couple family households, those with 1 or 2 children have the highest poverty rate, with 106 households (2.4%) falling below the poverty line. Among the single-parent households, those with 3 or 4 children have the highest poverty rate, with 117 household (57.6%) living below poverty.
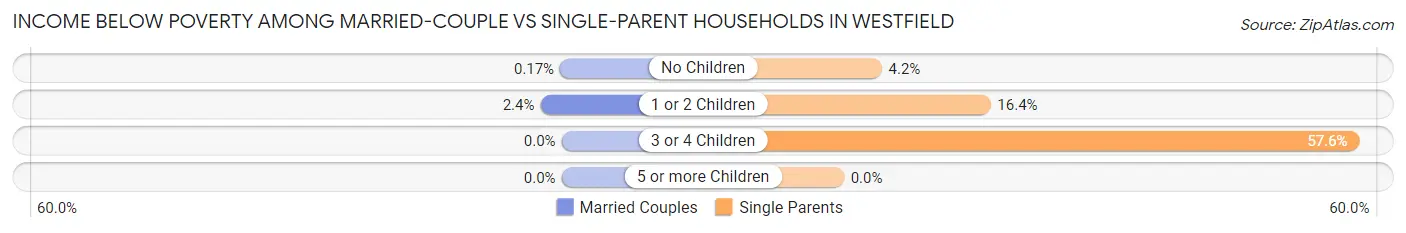
| Children | Married-Couple Families | Single-Parent Households |
| No Children | 10 (0.2%) | 35 (4.2%) |
| 1 or 2 Children | 106 (2.4%) | 237 (16.4%) |
| 3 or 4 Children | 0 (0.0%) | 117 (57.6%) |
| 5 or more Children | 0 (0.0%) | 0 (0.0%) |
| Total | 116 (1.0%) | 389 (15.6%) |
Race in Westfield
The most populous races in Westfield are White / Caucasian (40,472 | 83.9%), Hispanic or Latino (4,564 | 9.5%), and Two or more Races (3,879 | 8.0%).
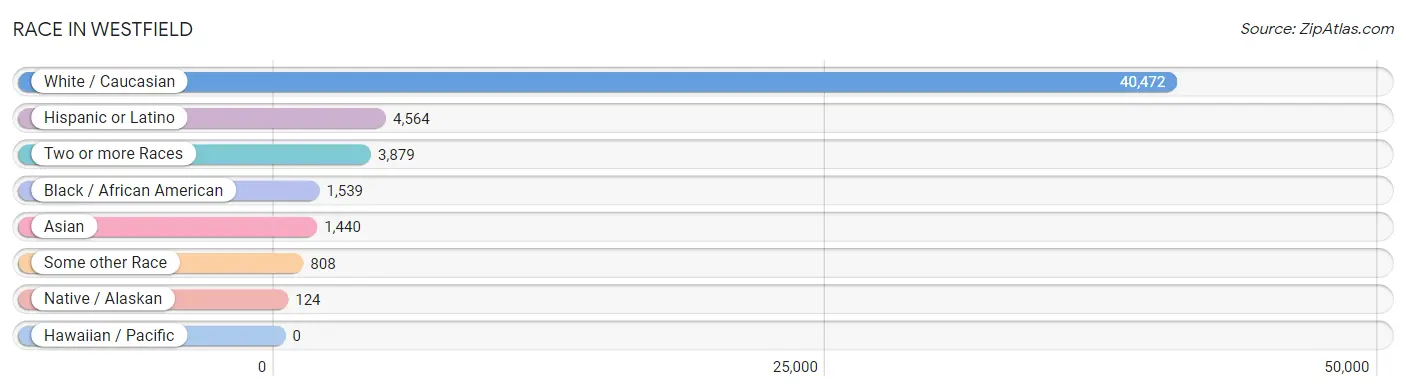
| Race | # Population | % Population |
| Asian | 1,440 | 3.0% |
| Black / African American | 1,539 | 3.2% |
| Hawaiian / Pacific | 0 | 0.0% |
| Hispanic or Latino | 4,564 | 9.5% |
| Native / Alaskan | 124 | 0.3% |
| White / Caucasian | 40,472 | 83.9% |
| Two or more Races | 3,879 | 8.0% |
| Some other Race | 808 | 1.7% |
| Total | 48,262 | 100.0% |
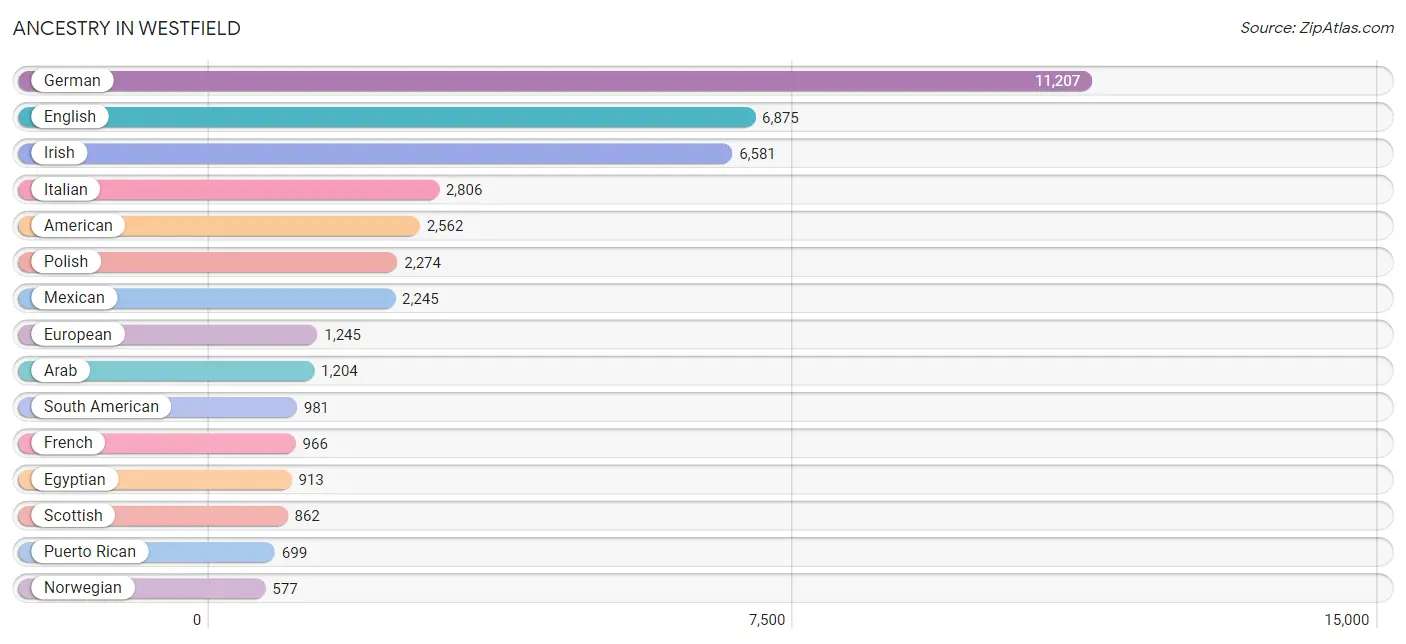
Ancestry in Westfield
The most populous ancestries reported in Westfield are German (11,207 | 23.2%), English (6,875 | 14.2%), Irish (6,581 | 13.6%), Italian (2,806 | 5.8%), and American (2,562 | 5.3%), together accounting for 62.2% of all Westfield residents.
| Ancestry | # Population | % Population |
| African | 77 | 0.2% |
| American | 2,562 | 5.3% |
| Arab | 1,204 | 2.5% |
| Argentinean | 368 | 0.8% |
| Austrian | 79 | 0.2% |
| Bangladeshi | 91 | 0.2% |
| Belgian | 140 | 0.3% |
| Bhutanese | 218 | 0.4% |
| Brazilian | 56 | 0.1% |
| British | 114 | 0.2% |
| Burmese | 335 | 0.7% |
| Canadian | 51 | 0.1% |
| Central American | 575 | 1.2% |
| Cherokee | 32 | 0.1% |
| Colombian | 36 | 0.1% |
| Croatian | 116 | 0.2% |
| Czech | 181 | 0.4% |
| Czechoslovakian | 27 | 0.1% |
| Danish | 15 | 0.0% |
| Dominican | 52 | 0.1% |
| Dutch | 487 | 1.0% |
| Eastern European | 15 | 0.0% |
| Egyptian | 913 | 1.9% |
| English | 6,875 | 14.2% |
| Ethiopian | 19 | 0.0% |
| European | 1,245 | 2.6% |
| Finnish | 9 | 0.0% |
| French | 966 | 2.0% |
| French Canadian | 74 | 0.2% |
| German | 11,207 | 23.2% |
| Greek | 136 | 0.3% |
| Guamanian / Chamorro | 19 | 0.0% |
| Guatemalan | 117 | 0.2% |
| Honduran | 82 | 0.2% |
| Hungarian | 263 | 0.5% |
| Icelander | 8 | 0.0% |
| Indian (Asian) | 51 | 0.1% |
| Irish | 6,581 | 13.6% |
| Israeli | 23 | 0.1% |
| Italian | 2,806 | 5.8% |
| Jamaican | 52 | 0.1% |
| Japanese | 186 | 0.4% |
| Jordanian | 46 | 0.1% |
| Kenyan | 12 | 0.0% |
| Korean | 368 | 0.8% |
| Latvian | 114 | 0.2% |
| Lebanese | 23 | 0.1% |
| Lithuanian | 47 | 0.1% |
| Mexican | 2,245 | 4.6% |
| Mexican American Indian | 155 | 0.3% |
| Navajo | 8 | 0.0% |
| Northern European | 211 | 0.4% |
| Norwegian | 577 | 1.2% |
| Okinawan | 15 | 0.0% |
| Panamanian | 8 | 0.0% |
| Peruvian | 169 | 0.4% |
| Polish | 2,274 | 4.7% |
| Portuguese | 33 | 0.1% |
| Puerto Rican | 699 | 1.5% |
| Russian | 358 | 0.7% |
| Salvadoran | 368 | 0.8% |
| Samoan | 6 | 0.0% |
| Scandinavian | 62 | 0.1% |
| Scotch-Irish | 371 | 0.8% |
| Scottish | 862 | 1.8% |
| Serbian | 8 | 0.0% |
| Sioux | 17 | 0.0% |
| Slovak | 7 | 0.0% |
| Slovene | 96 | 0.2% |
| South American | 981 | 2.0% |
| Spanish | 12 | 0.0% |
| Sri Lankan | 253 | 0.5% |
| Subsaharan African | 129 | 0.3% |
| Swedish | 360 | 0.7% |
| Swiss | 246 | 0.5% |
| Syrian | 33 | 0.1% |
| Thai | 552 | 1.1% |
| Ukrainian | 577 | 1.2% |
| Venezuelan | 408 | 0.9% |
| Welsh | 173 | 0.4% |
| Yugoslavian | 88 | 0.2% | View All 81 Rows |
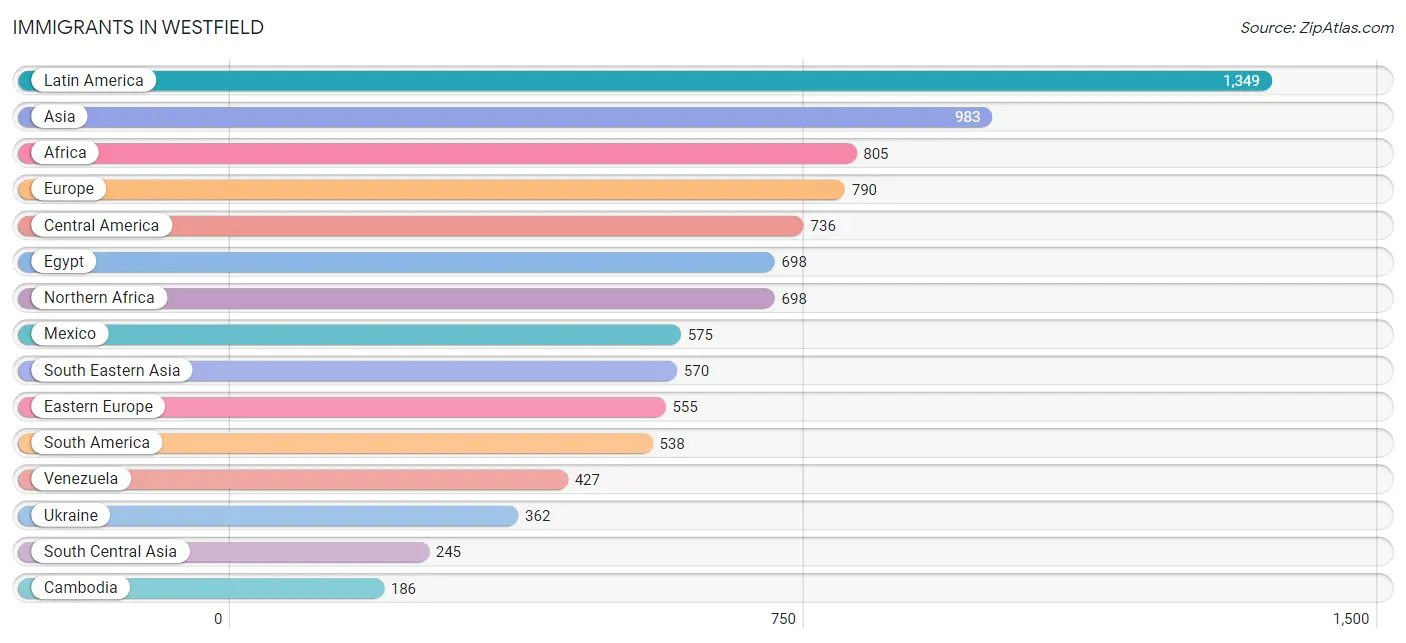
Immigrants in Westfield
The most numerous immigrant groups reported in Westfield came from Latin America (1,349 | 2.8%), Asia (983 | 2.0%), Africa (805 | 1.7%), Europe (790 | 1.6%), and Central America (736 | 1.5%), together accounting for 9.7% of all Westfield residents.
| Immigration Origin | # Population | % Population |
| Africa | 805 | 1.7% |
| Asia | 983 | 2.0% |
| Belize | 6 | 0.0% |
| Bosnia and Herzegovina | 45 | 0.1% |
| Brazil | 49 | 0.1% |
| Cambodia | 186 | 0.4% |
| Canada | 72 | 0.2% |
| Caribbean | 75 | 0.2% |
| Central America | 736 | 1.5% |
| Croatia | 50 | 0.1% |
| Dominican Republic | 23 | 0.1% |
| Eastern Africa | 31 | 0.1% |
| Eastern Asia | 106 | 0.2% |
| Eastern Europe | 555 | 1.1% |
| Egypt | 698 | 1.5% |
| England | 52 | 0.1% |
| Ethiopia | 19 | 0.0% |
| Europe | 790 | 1.6% |
| Germany | 62 | 0.1% |
| Greece | 9 | 0.0% |
| Guatemala | 117 | 0.2% |
| Honduras | 38 | 0.1% |
| India | 182 | 0.4% |
| Italy | 11 | 0.0% |
| Jamaica | 52 | 0.1% |
| Japan | 7 | 0.0% |
| Jordan | 62 | 0.1% |
| Kenya | 12 | 0.0% |
| Korea | 99 | 0.2% |
| Laos | 45 | 0.1% |
| Latin America | 1,349 | 2.8% |
| Latvia | 15 | 0.0% |
| Mexico | 575 | 1.2% |
| Middle Africa | 21 | 0.0% |
| Northern Africa | 698 | 1.5% |
| Northern Europe | 74 | 0.2% |
| Pakistan | 63 | 0.1% |
| Peru | 62 | 0.1% |
| Philippines | 140 | 0.3% |
| Poland | 5 | 0.0% |
| Russia | 78 | 0.2% |
| Senegal | 55 | 0.1% |
| Singapore | 15 | 0.0% |
| South America | 538 | 1.1% |
| South Central Asia | 245 | 0.5% |
| South Eastern Asia | 570 | 1.2% |
| Southern Europe | 99 | 0.2% |
| Spain | 79 | 0.2% |
| Ukraine | 362 | 0.7% |
| Venezuela | 427 | 0.9% |
| Vietnam | 184 | 0.4% |
| Western Africa | 55 | 0.1% |
| Western Asia | 62 | 0.1% |
| Western Europe | 62 | 0.1% |
| Zaire | 21 | 0.0% | View All 55 Rows |
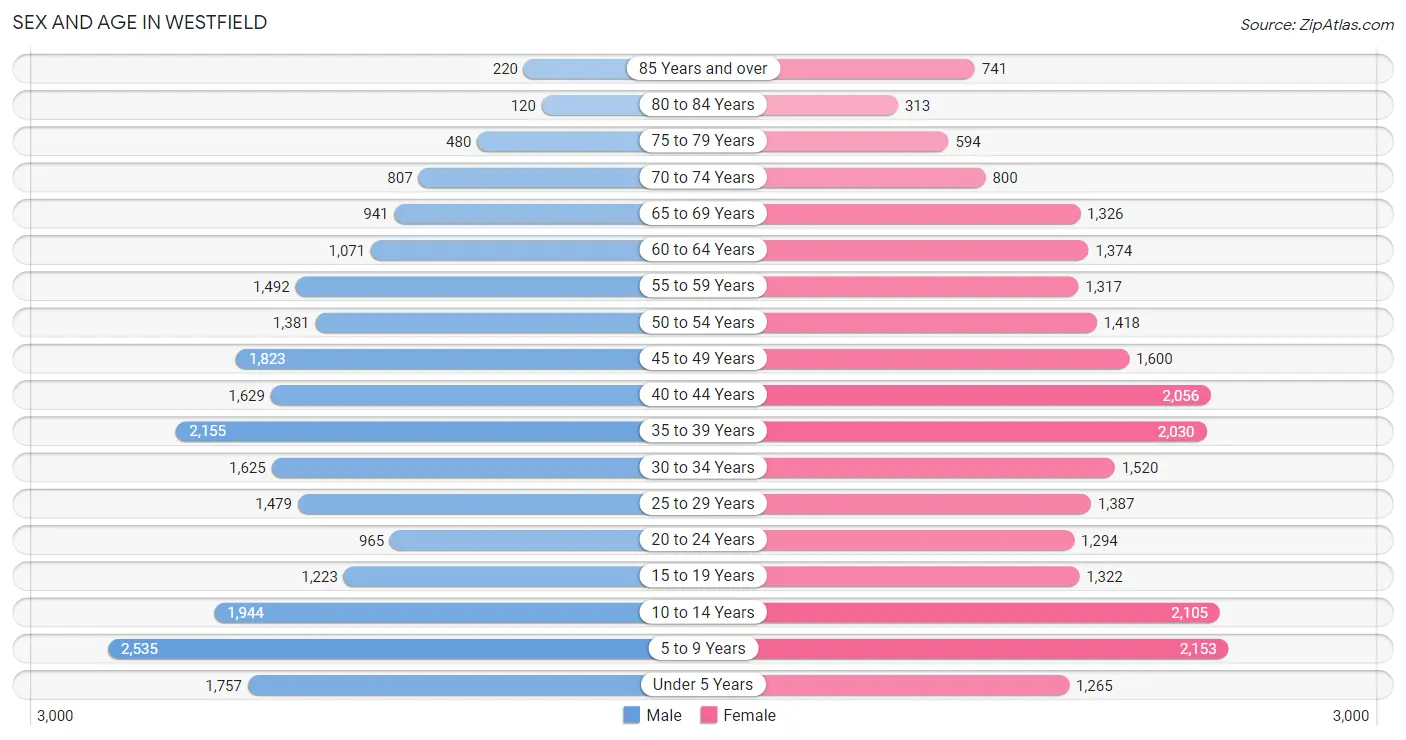
Sex and Age in Westfield
Sex and Age in Westfield
The most populous age groups in Westfield are 5 to 9 Years (2,535 | 10.7%) for men and 5 to 9 Years (2,153 | 8.7%) for women.
| Age Bracket | Male | Female |
| Under 5 Years | 1,757 (7.4%) | 1,265 (5.1%) |
| 5 to 9 Years | 2,535 (10.7%) | 2,153 (8.7%) |
| 10 to 14 Years | 1,944 (8.2%) | 2,105 (8.6%) |
| 15 to 19 Years | 1,223 (5.2%) | 1,322 (5.4%) |
| 20 to 24 Years | 965 (4.1%) | 1,294 (5.3%) |
| 25 to 29 Years | 1,479 (6.2%) | 1,387 (5.6%) |
| 30 to 34 Years | 1,625 (6.9%) | 1,520 (6.2%) |
| 35 to 39 Years | 2,155 (9.1%) | 2,030 (8.3%) |
| 40 to 44 Years | 1,629 (6.9%) | 2,056 (8.4%) |
| 45 to 49 Years | 1,823 (7.7%) | 1,600 (6.5%) |
| 50 to 54 Years | 1,381 (5.8%) | 1,418 (5.8%) |
| 55 to 59 Years | 1,492 (6.3%) | 1,317 (5.3%) |
| 60 to 64 Years | 1,071 (4.5%) | 1,374 (5.6%) |
| 65 to 69 Years | 941 (4.0%) | 1,326 (5.4%) |
| 70 to 74 Years | 807 (3.4%) | 800 (3.3%) |
| 75 to 79 Years | 480 (2.0%) | 594 (2.4%) |
| 80 to 84 Years | 120 (0.5%) | 313 (1.3%) |
| 85 Years and over | 220 (0.9%) | 741 (3.0%) |
| Total | 23,647 (100.0%) | 24,615 (100.0%) |
Families and Households in Westfield
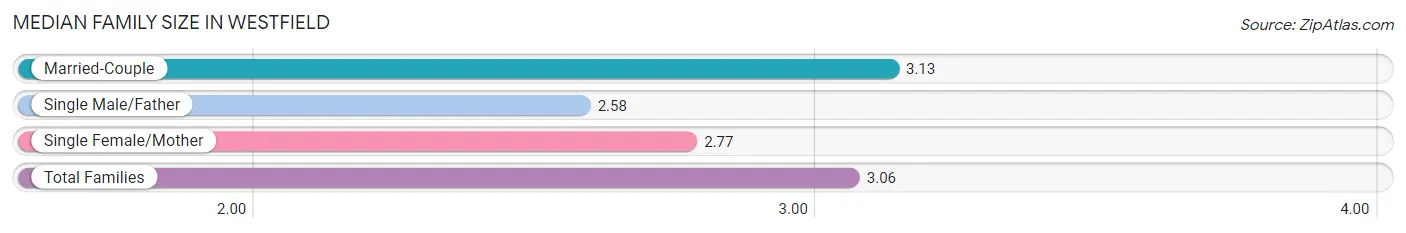
Median Family Size in Westfield
The median family size in Westfield is 3.06 persons per family, with married-couple families (11,539 | 82.2%) accounting for the largest median family size of 3.13 persons per family. On the other hand, single male/father families (712 | 5.1%) represent the smallest median family size with 2.58 persons per family.
| Family Type | # Families | Family Size |
| Married-Couple | 11,539 (82.2%) | 3.13 |
| Single Male/Father | 712 (5.1%) | 2.58 |
| Single Female/Mother | 1,784 (12.7%) | 2.77 |
| Total Families | 14,035 (100.0%) | 3.06 |
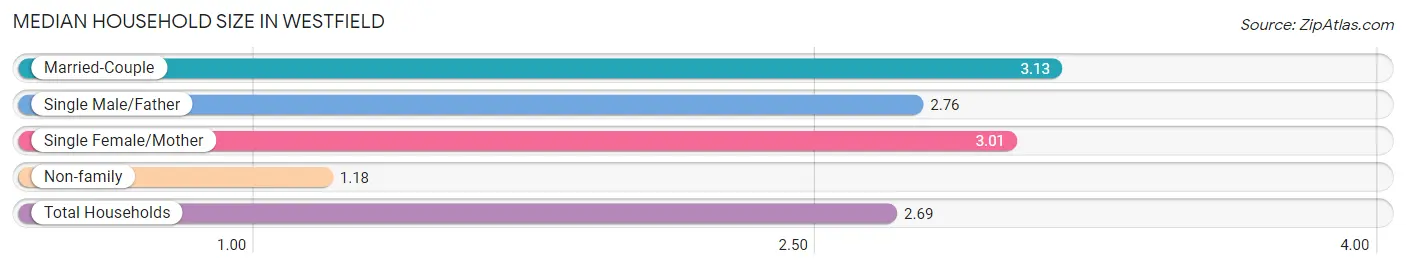
Median Household Size in Westfield
The median household size in Westfield is 2.69 persons per household, with married-couple households (11,539 | 64.5%) accounting for the largest median household size of 3.13 persons per household. non-family households (3,853 | 21.5%) represent the smallest median household size with 1.18 persons per household.
| Household Type | # Households | Household Size |
| Married-Couple | 11,539 (64.5%) | 3.13 |
| Single Male/Father | 712 (4.0%) | 2.76 |
| Single Female/Mother | 1,784 (10.0%) | 3.01 |
| Non-family | 3,853 (21.5%) | 1.18 |
| Total Households | 17,888 (100.0%) | 2.69 |
Household Size by Marriage Status in Westfield
Out of a total of 17,888 households in Westfield, 14,035 (78.5%) are family households, while 3,853 (21.5%) are nonfamily households. The most numerous type of family households are 2-person households, comprising 6,043, and the most common type of nonfamily households are 1-person households, comprising 3,315.
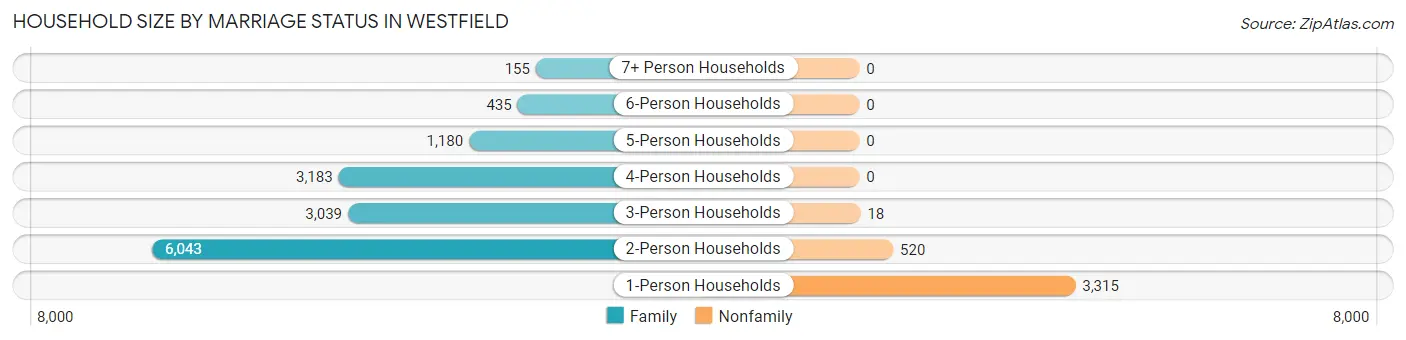
| Household Size | Family Households | Nonfamily Households |
| 1-Person Households | - | 3,315 (18.5%) |
| 2-Person Households | 6,043 (33.8%) | 520 (2.9%) |
| 3-Person Households | 3,039 (17.0%) | 18 (0.1%) |
| 4-Person Households | 3,183 (17.8%) | 0 (0.0%) |
| 5-Person Households | 1,180 (6.6%) | 0 (0.0%) |
| 6-Person Households | 435 (2.4%) | 0 (0.0%) |
| 7+ Person Households | 155 (0.9%) | 0 (0.0%) |
| Total | 14,035 (78.5%) | 3,853 (21.5%) |
Female Fertility in Westfield
Fertility by Age in Westfield
Average fertility rate in Westfield is 71.0 births per 1,000 women. Women in the age bracket of 20 to 34 years have the highest fertility rate with 159.0 births per 1,000 women. Women in the age bracket of 20 to 34 years acount for 80.7% of all women with births.
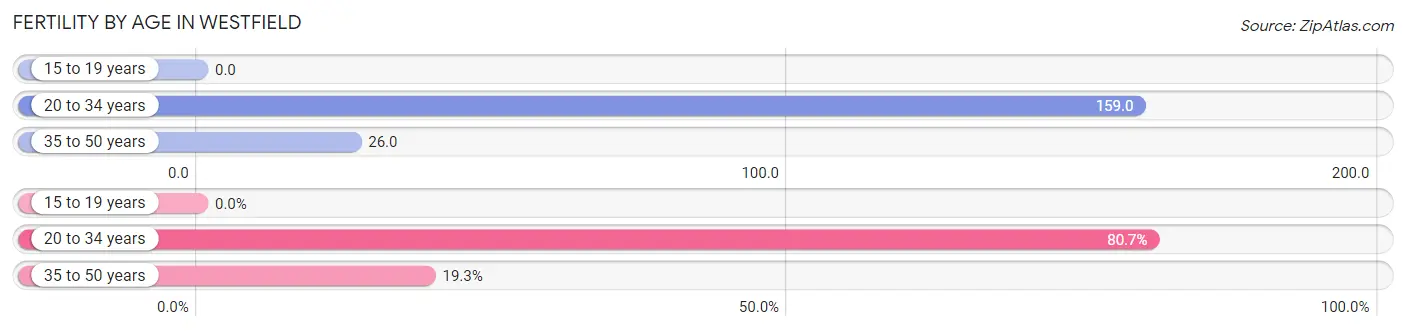
| Age Bracket | Women with Births | Births / 1,000 Women |
| 15 to 19 years | 0 (0.0%) | 0.0 |
| 20 to 34 years | 669 (80.7%) | 159.0 |
| 35 to 50 years | 160 (19.3%) | 26.0 |
| Total | 829 (100.0%) | 71.0 |
Fertility by Age by Marriage Status in Westfield
88.9% of women with births (829) in Westfield are married. The highest percentage of unmarried women with births falls into 20 to 34 years age bracket with 13.8% of them unmarried at the time of birth, while the lowest percentage of unmarried women with births belong to 35 to 50 years age bracket with 0.0% of them unmarried.
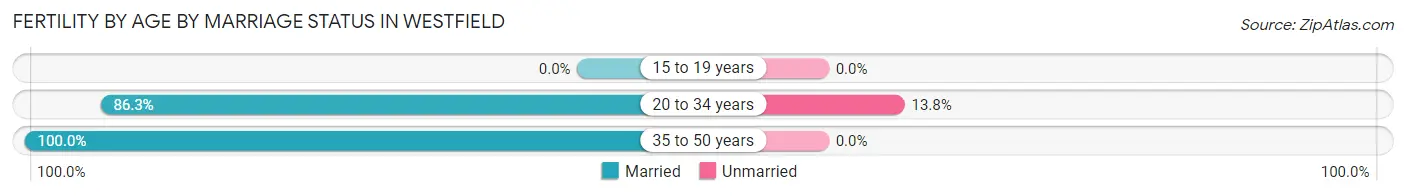
| Age Bracket | Married | Unmarried |
| 15 to 19 years | 0 (0.0%) | 0 (0.0%) |
| 20 to 34 years | 577 (86.3%) | 92 (13.8%) |
| 35 to 50 years | 160 (100.0%) | 0 (0.0%) |
| Total | 737 (88.9%) | 92 (11.1%) |
Fertility by Education in Westfield
Average fertility rate in Westfield is 71.0 births per 1,000 women. Women with the education attainment of less than high school have the highest fertility rate of 132.0 births per 1,000 women, while women with the education attainment of college or associate's degree have the lowest fertility at 33.0 births per 1,000 women. Women with the education attainment of bachelor's degree represent 49.6% of all women with births.
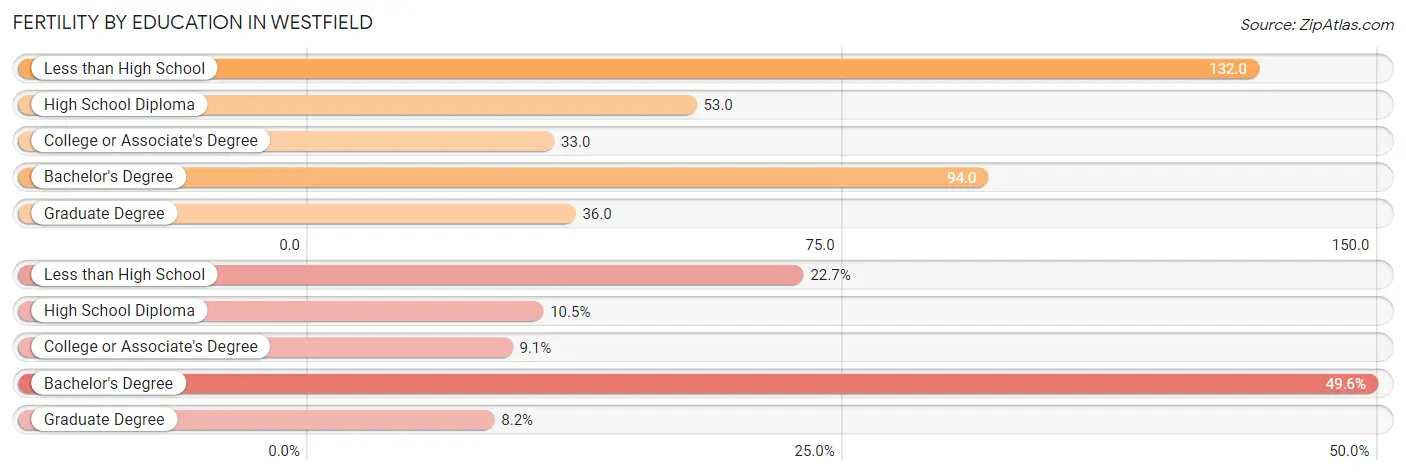
| Educational Attainment | Women with Births | Births / 1,000 Women |
| Less than High School | 188 (22.7%) | 132.0 |
| High School Diploma | 87 (10.5%) | 53.0 |
| College or Associate's Degree | 75 (9.0%) | 33.0 |
| Bachelor's Degree | 411 (49.6%) | 94.0 |
| Graduate Degree | 68 (8.2%) | 36.0 |
| Total | 829 (100.0%) | 71.0 |
Fertility by Education by Marriage Status in Westfield
11.1% of women with births in Westfield are unmarried. Women with the educational attainment of less than high school are most likely to be married with 100.0% of them married at childbirth, while women with the educational attainment of college or associate's degree are least likely to be married with 93.3% of them unmarried at childbirth.
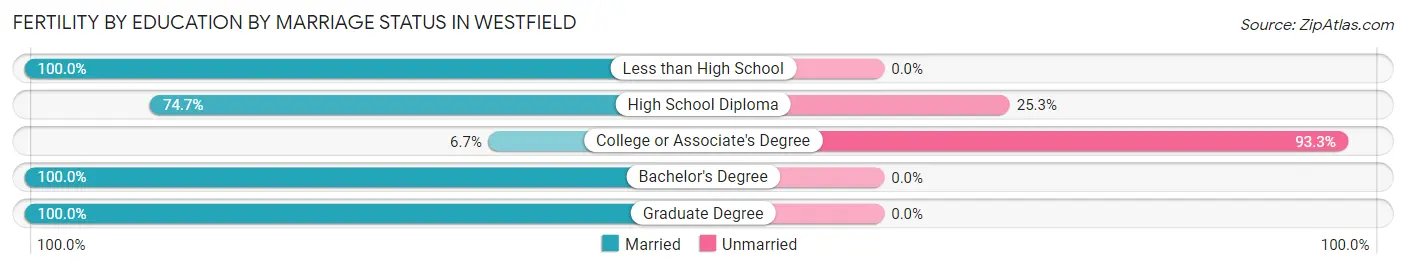
| Educational Attainment | Married | Unmarried |
| Less than High School | 188 (100.0%) | 0 (0.0%) |
| High School Diploma | 65 (74.7%) | 22 (25.3%) |
| College or Associate's Degree | 5 (6.7%) | 70 (93.3%) |
| Bachelor's Degree | 411 (100.0%) | 0 (0.0%) |
| Graduate Degree | 68 (100.0%) | 0 (0.0%) |
| Total | 737 (88.9%) | 92 (11.1%) |
Employment Characteristics in Westfield
Employment by Class of Employer in Westfield
Among the 25,279 employed individuals in Westfield, private company employees (18,536 | 73.3%), not-for-profit organizations (2,106 | 8.3%), and self-employed (not incorporated) (1,277 | 5.1%) make up the most common classes of employment.
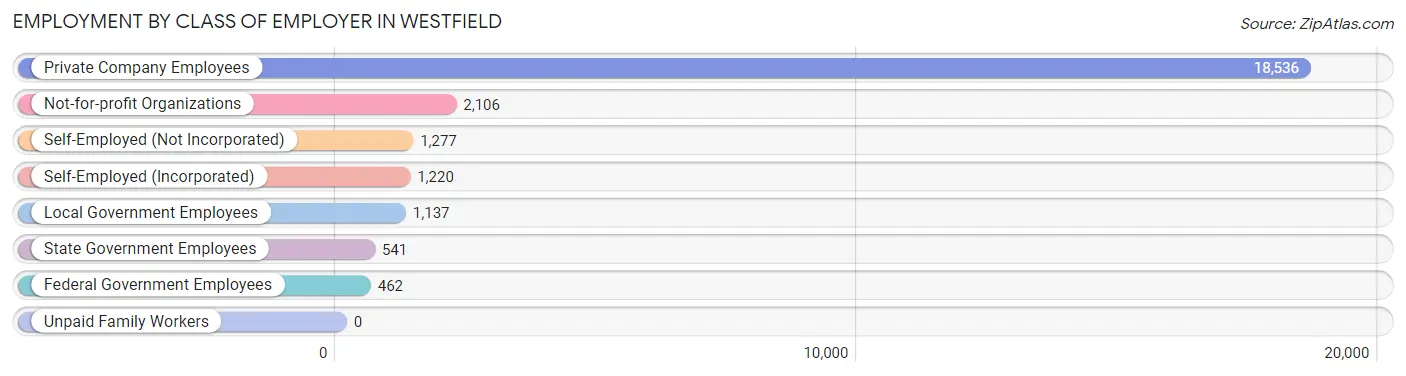
| Employer Class | # Employees | % Employees |
| Private Company Employees | 18,536 | 73.3% |
| Self-Employed (Incorporated) | 1,220 | 4.8% |
| Self-Employed (Not Incorporated) | 1,277 | 5.1% |
| Not-for-profit Organizations | 2,106 | 8.3% |
| Local Government Employees | 1,137 | 4.5% |
| State Government Employees | 541 | 2.1% |
| Federal Government Employees | 462 | 1.8% |
| Unpaid Family Workers | 0 | 0.0% |
| Total | 25,279 | 100.0% |
Employment Status by Age in Westfield
According to the labor force statistics for Westfield, out of the total population over 16 years of age (36,010), 72.8% or 26,215 individuals are in the labor force, with 2.0% or 524 of them unemployed. The age group with the highest labor force participation rate is 25 to 29 years, with 96.4% or 2,763 individuals in the labor force. Within the labor force, the 16 to 19 years age range has the highest percentage of unemployed individuals, with 7.7% or 82 of them being unemployed.
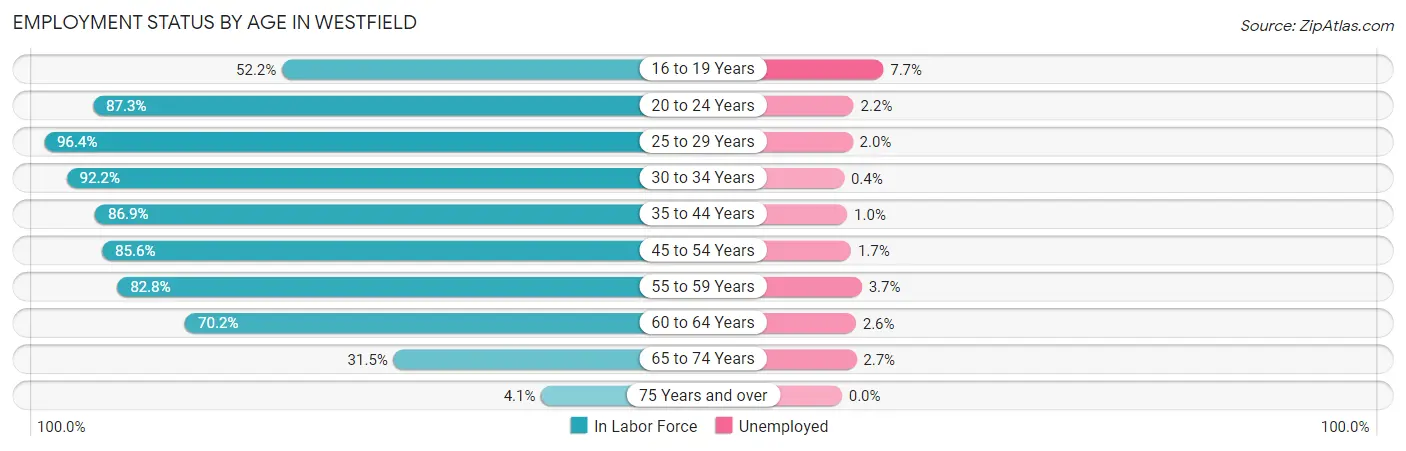
| Age Bracket | In Labor Force | Unemployed |
| 16 to 19 Years | 1,071 (52.2%) | 82 (7.7%) |
| 20 to 24 Years | 1,972 (87.3%) | 43 (2.2%) |
| 25 to 29 Years | 2,763 (96.4%) | 55 (2.0%) |
| 30 to 34 Years | 2,900 (92.2%) | 12 (0.4%) |
| 35 to 44 Years | 6,839 (86.9%) | 68 (1.0%) |
| 45 to 54 Years | 5,326 (85.6%) | 91 (1.7%) |
| 55 to 59 Years | 2,326 (82.8%) | 86 (3.7%) |
| 60 to 64 Years | 1,716 (70.2%) | 45 (2.6%) |
| 65 to 74 Years | 1,220 (31.5%) | 33 (2.7%) |
| 75 Years and over | 101 (4.1%) | 0 (0.0%) |
| Total | 26,215 (72.8%) | 524 (2.0%) |
Employment Status by Educational Attainment in Westfield
According to labor force statistics for Westfield, 86.2% of individuals (21,858) out of the total population between 25 and 64 years of age (25,357) are in the labor force, with 1.6% or 350 of them being unemployed. The group with the highest labor force participation rate are those with the educational attainment of less than high school, with 93.6% or 799 individuals in the labor force. Within the labor force, individuals with less than high school education have the highest percentage of unemployment, with 10.4% or 83 of them being unemployed.
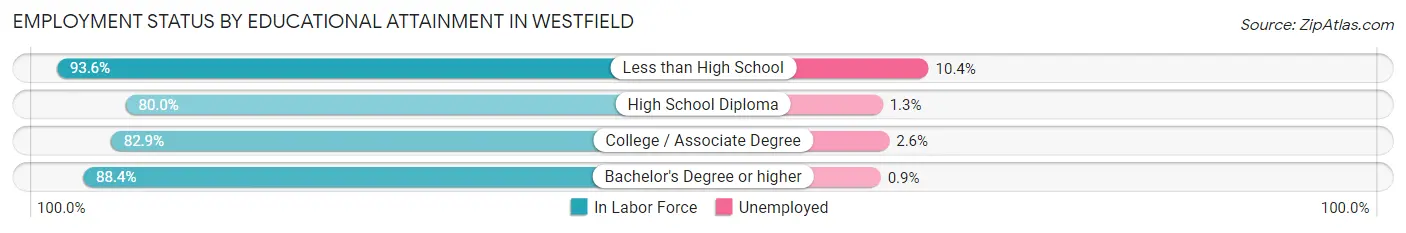
| Educational Attainment | In Labor Force | Unemployed |
| Less than High School | 799 (93.6%) | 89 (10.4%) |
| High School Diploma | 2,971 (80.0%) | 48 (1.3%) |
| College / Associate Degree | 4,189 (82.9%) | 131 (2.6%) |
| Bachelor's Degree or higher | 13,911 (88.4%) | 142 (0.9%) |
| Total | 21,858 (86.2%) | 406 (1.6%) |
Employment Occupations by Sex in Westfield
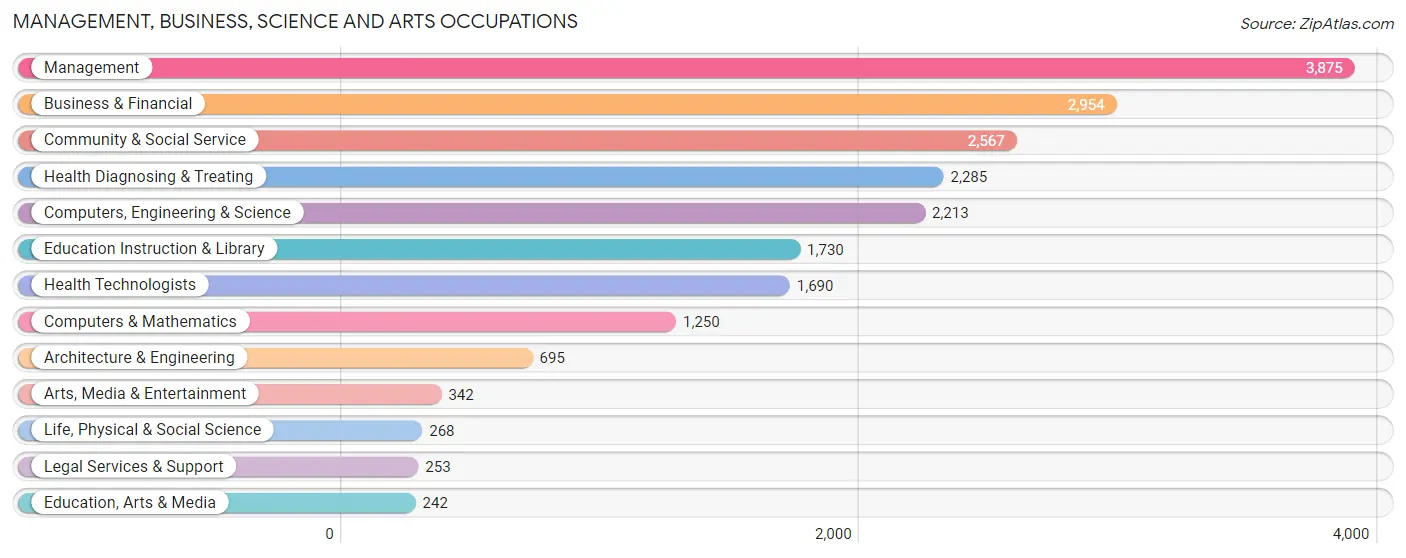
Management, Business, Science and Arts Occupations
The most common Management, Business, Science and Arts occupations in Westfield are Management (3,875 | 15.1%), Business & Financial (2,954 | 11.5%), Community & Social Service (2,567 | 10.0%), Health Diagnosing & Treating (2,285 | 8.9%), and Computers, Engineering & Science (2,213 | 8.6%).
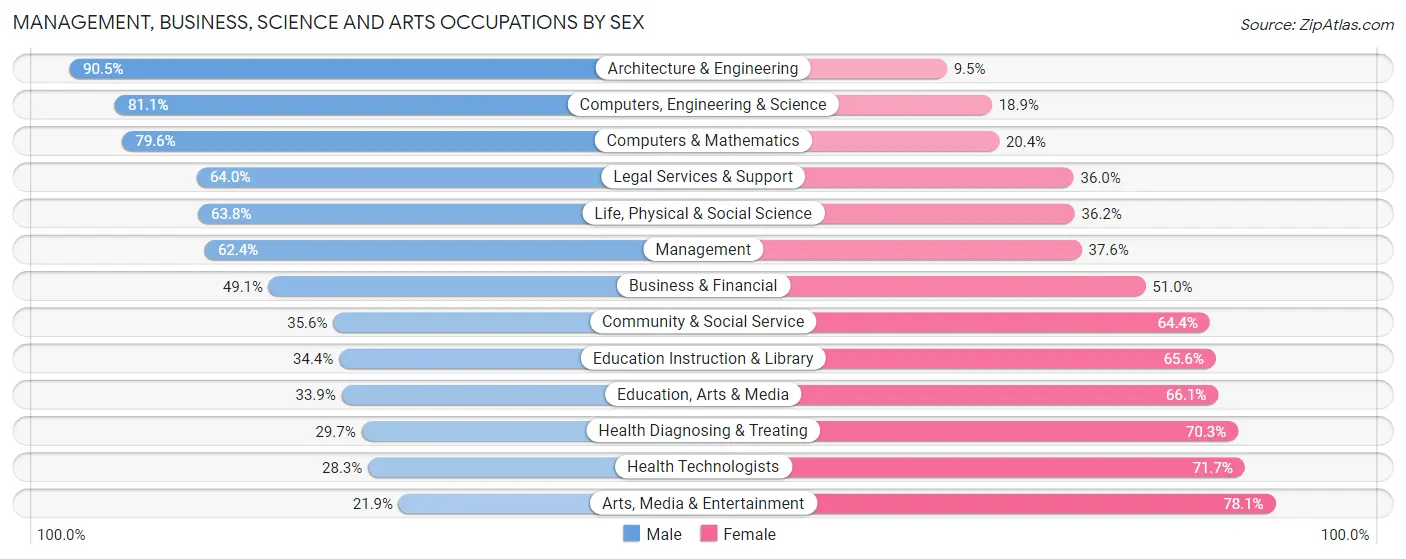
Management, Business, Science and Arts Occupations by Sex
Within the Management, Business, Science and Arts occupations in Westfield, the most male-oriented occupations are Architecture & Engineering (90.5%), Computers, Engineering & Science (81.1%), and Computers & Mathematics (79.6%), while the most female-oriented occupations are Arts, Media & Entertainment (78.1%), Health Technologists (71.7%), and Health Diagnosing & Treating (70.3%).
| Occupation | Male | Female |
| Management | 2,417 (62.4%) | 1,458 (37.6%) |
| Business & Financial | 1,449 (49.0%) | 1,505 (50.9%) |
| Computers, Engineering & Science | 1,795 (81.1%) | 418 (18.9%) |
| Computers & Mathematics | 995 (79.6%) | 255 (20.4%) |
| Architecture & Engineering | 629 (90.5%) | 66 (9.5%) |
| Life, Physical & Social Science | 171 (63.8%) | 97 (36.2%) |
| Community & Social Service | 914 (35.6%) | 1,653 (64.4%) |
| Education, Arts & Media | 82 (33.9%) | 160 (66.1%) |
| Legal Services & Support | 162 (64.0%) | 91 (36.0%) |
| Education Instruction & Library | 595 (34.4%) | 1,135 (65.6%) |
| Arts, Media & Entertainment | 75 (21.9%) | 267 (78.1%) |
| Health Diagnosing & Treating | 679 (29.7%) | 1,606 (70.3%) |
| Health Technologists | 479 (28.3%) | 1,211 (71.7%) |
| Total (Category) | 7,254 (52.2%) | 6,640 (47.8%) |
| Total (Overall) | 13,841 (54.0%) | 11,793 (46.0%) |
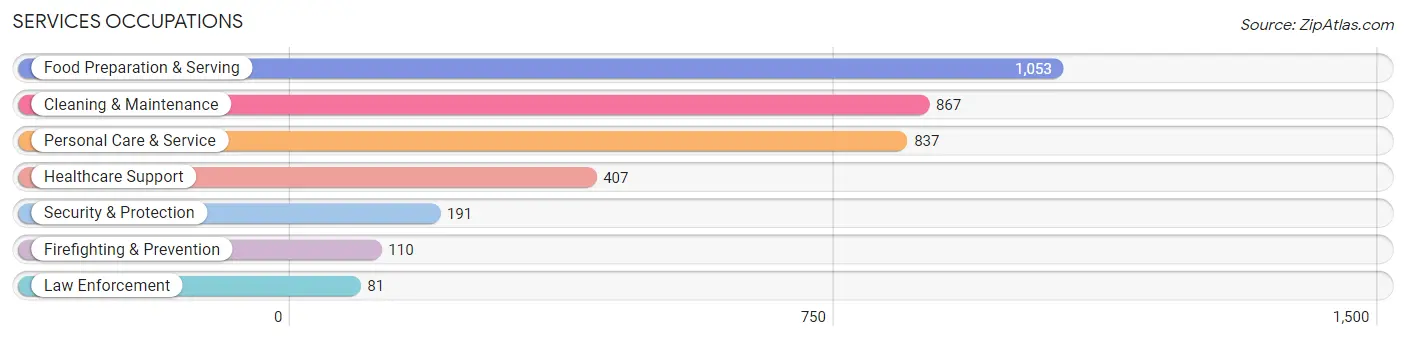
Services Occupations
The most common Services occupations in Westfield are Food Preparation & Serving (1,053 | 4.1%), Cleaning & Maintenance (867 | 3.4%), Personal Care & Service (837 | 3.3%), Healthcare Support (407 | 1.6%), and Security & Protection (191 | 0.7%).
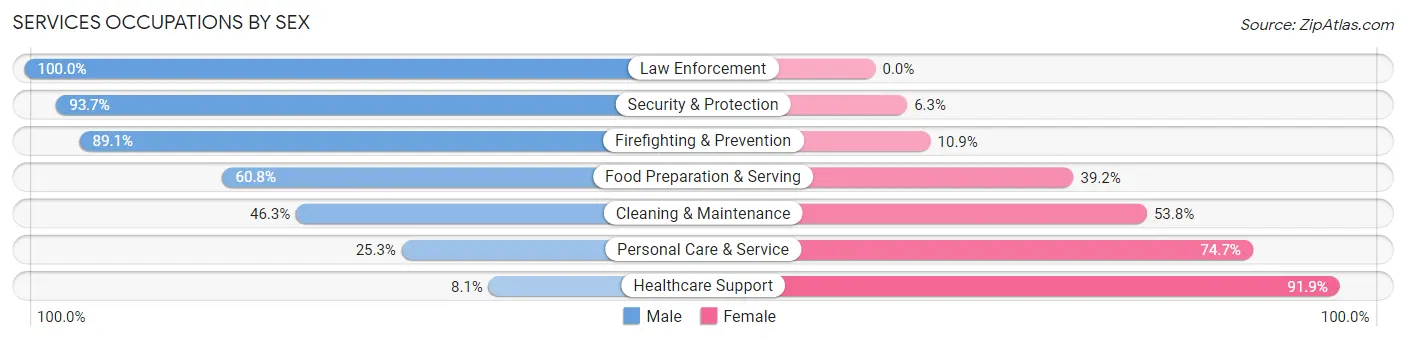
Services Occupations by Sex
Within the Services occupations in Westfield, the most male-oriented occupations are Law Enforcement (100.0%), Security & Protection (93.7%), and Firefighting & Prevention (89.1%), while the most female-oriented occupations are Healthcare Support (91.9%), Personal Care & Service (74.7%), and Cleaning & Maintenance (53.7%).
| Occupation | Male | Female |
| Healthcare Support | 33 (8.1%) | 374 (91.9%) |
| Security & Protection | 179 (93.7%) | 12 (6.3%) |
| Firefighting & Prevention | 98 (89.1%) | 12 (10.9%) |
| Law Enforcement | 81 (100.0%) | 0 (0.0%) |
| Food Preparation & Serving | 640 (60.8%) | 413 (39.2%) |
| Cleaning & Maintenance | 401 (46.3%) | 466 (53.7%) |
| Personal Care & Service | 212 (25.3%) | 625 (74.7%) |
| Total (Category) | 1,465 (43.7%) | 1,890 (56.3%) |
| Total (Overall) | 13,841 (54.0%) | 11,793 (46.0%) |
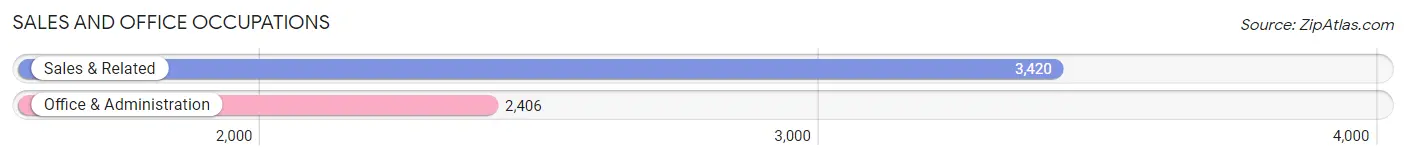
Sales and Office Occupations
The most common Sales and Office occupations in Westfield are Sales & Related (3,420 | 13.3%), and Office & Administration (2,406 | 9.4%).
Sales and Office Occupations by Sex
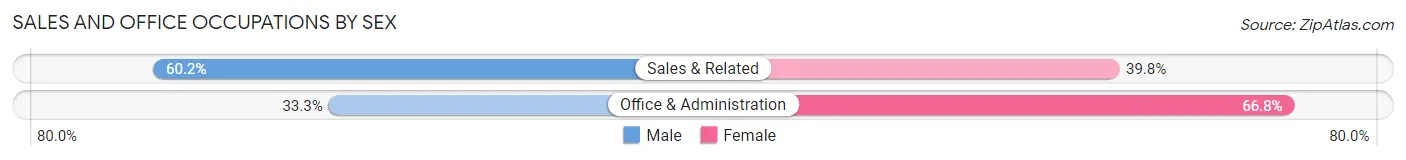
| Occupation | Male | Female |
| Sales & Related | 2,060 (60.2%) | 1,360 (39.8%) |
| Office & Administration | 800 (33.3%) | 1,606 (66.7%) |
| Total (Category) | 2,860 (49.1%) | 2,966 (50.9%) |
| Total (Overall) | 13,841 (54.0%) | 11,793 (46.0%) |
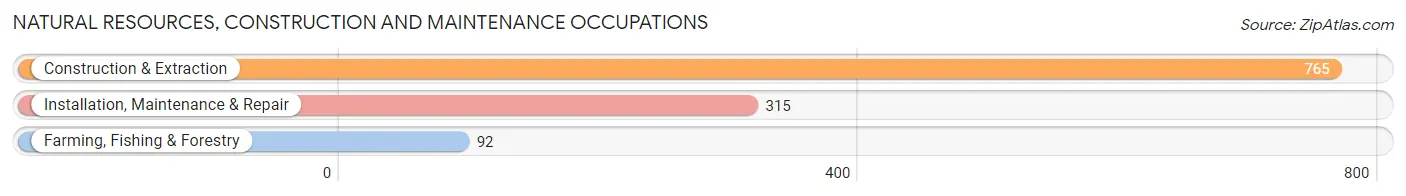
Natural Resources, Construction and Maintenance Occupations
The most common Natural Resources, Construction and Maintenance occupations in Westfield are Construction & Extraction (765 | 3.0%), Installation, Maintenance & Repair (315 | 1.2%), and Farming, Fishing & Forestry (92 | 0.4%).
Natural Resources, Construction and Maintenance Occupations by Sex
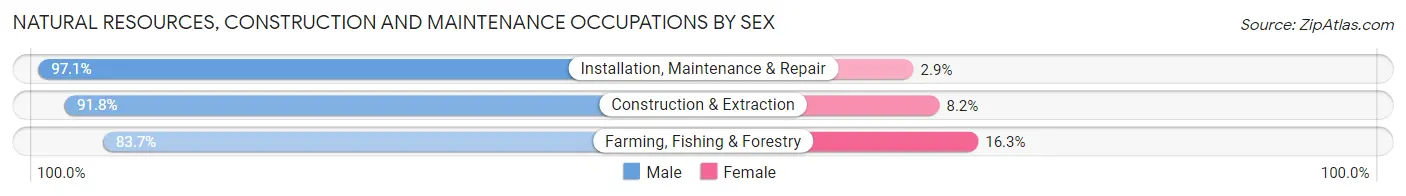
| Occupation | Male | Female |
| Farming, Fishing & Forestry | 77 (83.7%) | 15 (16.3%) |
| Construction & Extraction | 702 (91.8%) | 63 (8.2%) |
| Installation, Maintenance & Repair | 306 (97.1%) | 9 (2.9%) |
| Total (Category) | 1,085 (92.6%) | 87 (7.4%) |
| Total (Overall) | 13,841 (54.0%) | 11,793 (46.0%) |
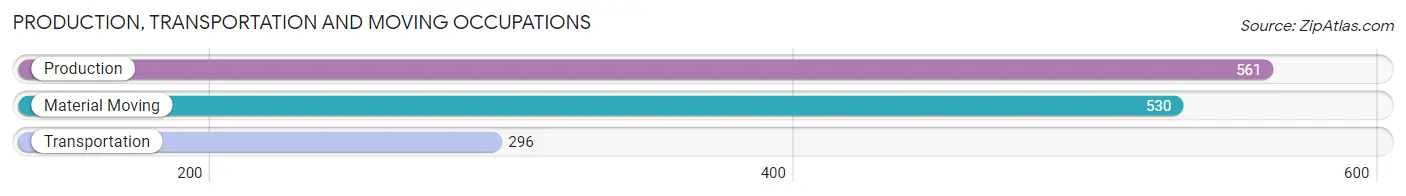
Production, Transportation and Moving Occupations
The most common Production, Transportation and Moving occupations in Westfield are Production (561 | 2.2%), Material Moving (530 | 2.1%), and Transportation (296 | 1.1%).
Production, Transportation and Moving Occupations by Sex
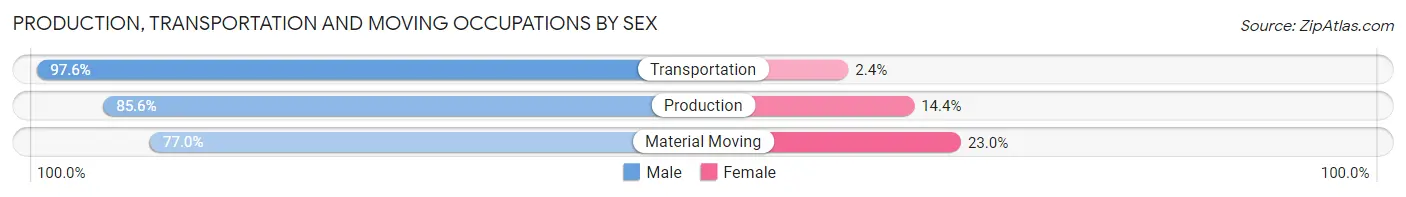
| Occupation | Male | Female |
| Production | 480 (85.6%) | 81 (14.4%) |
| Transportation | 289 (97.6%) | 7 (2.4%) |
| Material Moving | 408 (77.0%) | 122 (23.0%) |
| Total (Category) | 1,177 (84.9%) | 210 (15.1%) |
| Total (Overall) | 13,841 (54.0%) | 11,793 (46.0%) |
Employment Industries by Sex in Westfield
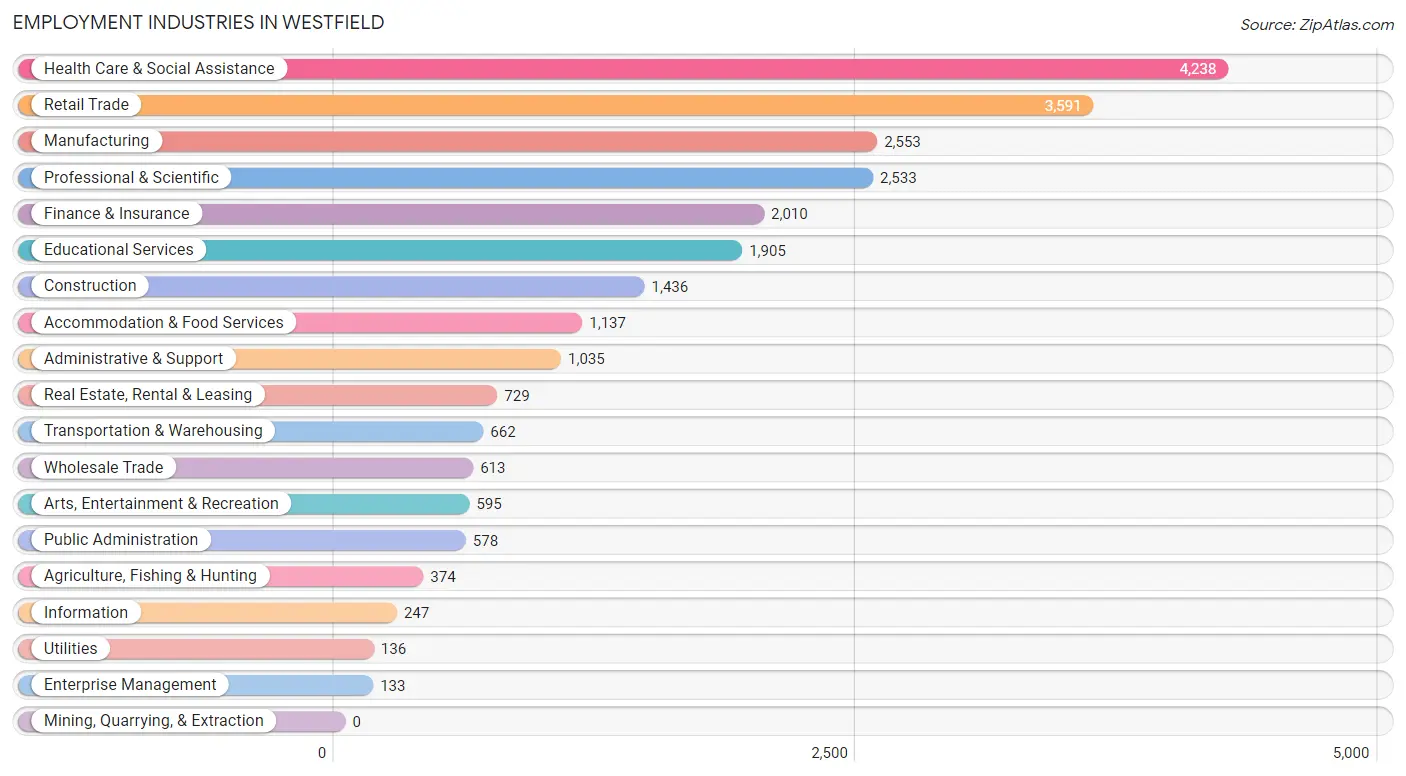
Employment Industries in Westfield
The major employment industries in Westfield include Health Care & Social Assistance (4,238 | 16.5%), Retail Trade (3,591 | 14.0%), Manufacturing (2,553 | 10.0%), Professional & Scientific (2,533 | 9.9%), and Finance & Insurance (2,010 | 7.8%).
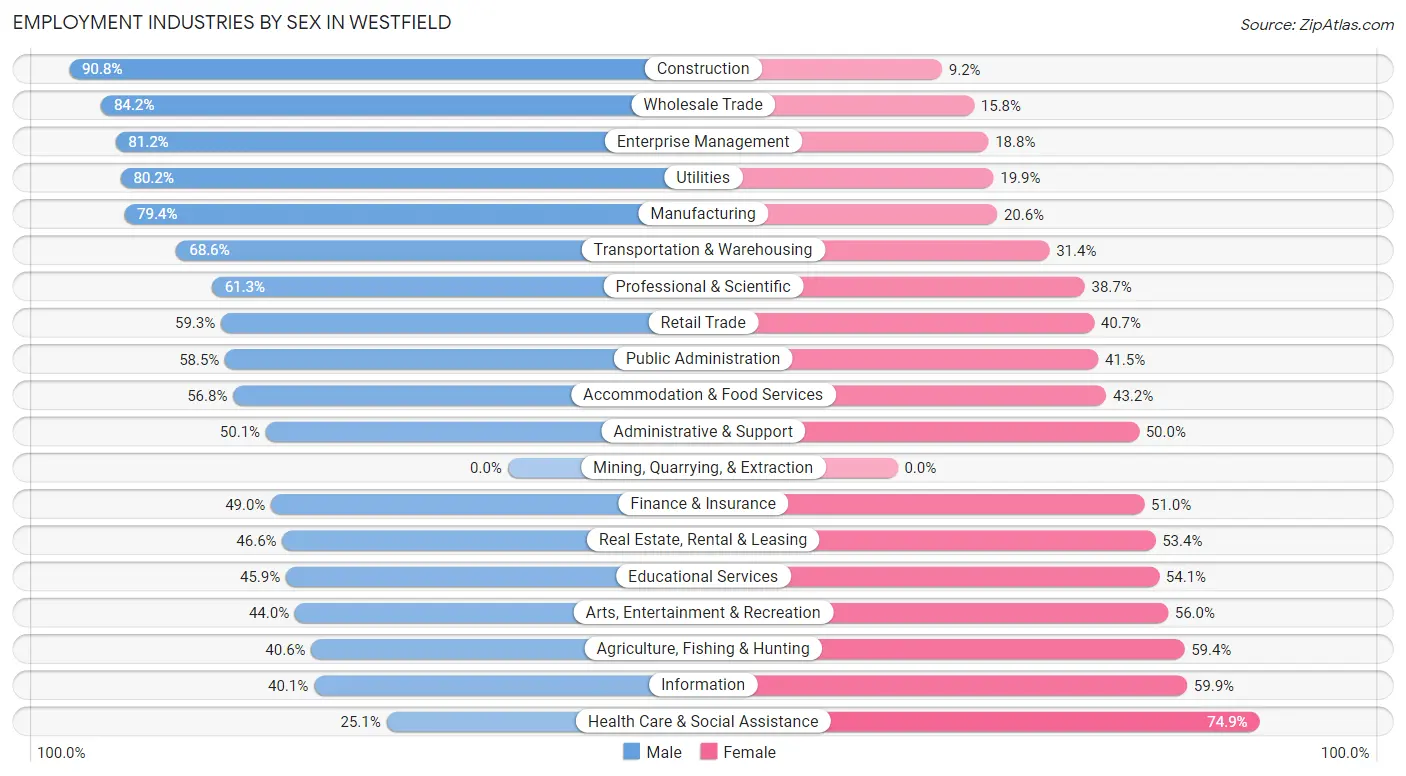
Employment Industries by Sex in Westfield
The Westfield industries that see more men than women are Construction (90.8%), Wholesale Trade (84.2%), and Enterprise Management (81.2%), whereas the industries that tend to have a higher number of women are Health Care & Social Assistance (74.9%), Information (59.9%), and Agriculture, Fishing & Hunting (59.4%).
| Industry | Male | Female |
| Agriculture, Fishing & Hunting | 152 (40.6%) | 222 (59.4%) |
| Mining, Quarrying, & Extraction | 0 (0.0%) | 0 (0.0%) |
| Construction | 1,304 (90.8%) | 132 (9.2%) |
| Manufacturing | 2,027 (79.4%) | 526 (20.6%) |
| Wholesale Trade | 516 (84.2%) | 97 (15.8%) |
| Retail Trade | 2,131 (59.3%) | 1,460 (40.7%) |
| Transportation & Warehousing | 454 (68.6%) | 208 (31.4%) |
| Utilities | 109 (80.1%) | 27 (19.9%) |
| Information | 99 (40.1%) | 148 (59.9%) |
| Finance & Insurance | 984 (49.0%) | 1,026 (51.0%) |
| Real Estate, Rental & Leasing | 340 (46.6%) | 389 (53.4%) |
| Professional & Scientific | 1,552 (61.3%) | 981 (38.7%) |
| Enterprise Management | 108 (81.2%) | 25 (18.8%) |
| Administrative & Support | 518 (50.0%) | 517 (49.9%) |
| Educational Services | 874 (45.9%) | 1,031 (54.1%) |
| Health Care & Social Assistance | 1,063 (25.1%) | 3,175 (74.9%) |
| Arts, Entertainment & Recreation | 262 (44.0%) | 333 (56.0%) |
| Accommodation & Food Services | 646 (56.8%) | 491 (43.2%) |
| Public Administration | 338 (58.5%) | 240 (41.5%) |
| Total | 13,841 (54.0%) | 11,793 (46.0%) |
Education in Westfield
School Enrollment in Westfield
The most common levels of schooling among the 13,365 students in Westfield are elementary school (3,456 | 25.9%), middle school (3,331 | 24.9%), and high school (2,284 | 17.1%).
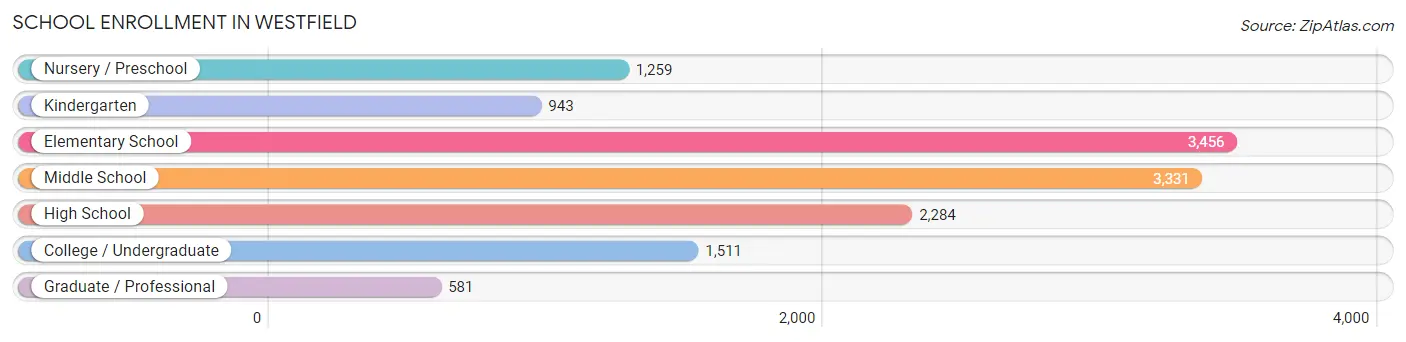
| School Level | # Students | % Students |
| Nursery / Preschool | 1,259 | 9.4% |
| Kindergarten | 943 | 7.1% |
| Elementary School | 3,456 | 25.9% |
| Middle School | 3,331 | 24.9% |
| High School | 2,284 | 17.1% |
| College / Undergraduate | 1,511 | 11.3% |
| Graduate / Professional | 581 | 4.3% |
| Total | 13,365 | 100.0% |
School Enrollment by Age by Funding Source in Westfield
Out of a total of 13,365 students who are enrolled in schools in Westfield, 2,606 (19.5%) attend a private institution, while the remaining 10,759 (80.5%) are enrolled in public schools. The age group of 3 to 4 year olds has the highest likelihood of being enrolled in private schools, with 449 (57.6% in the age bracket) enrolled. Conversely, the age group of 25 to 34 year olds has the lowest likelihood of being enrolled in a private school, with 479 (92.3% in the age bracket) attending a public institution.
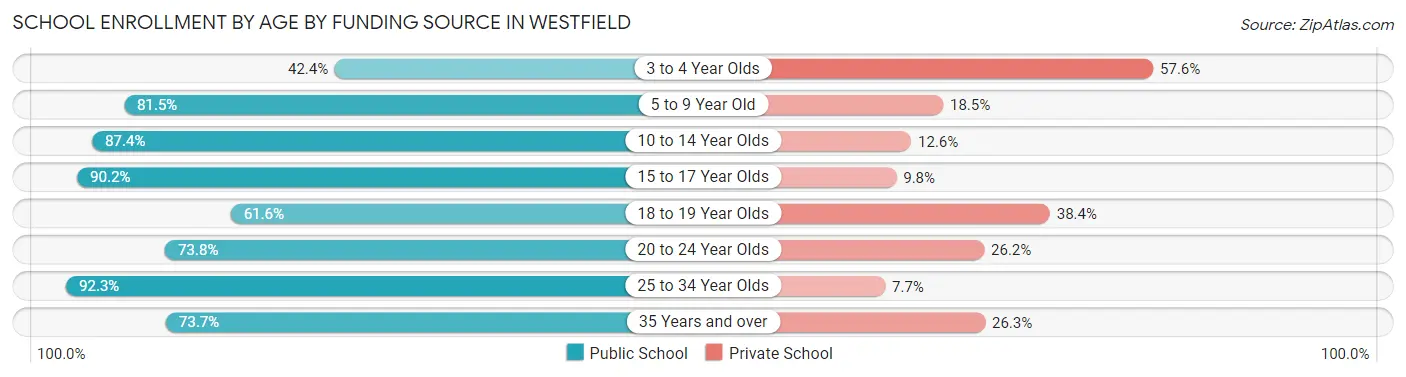
| Age Bracket | Public School | Private School |
| 3 to 4 Year Olds | 330 (42.4%) | 449 (57.6%) |
| 5 to 9 Year Old | 3,592 (81.5%) | 816 (18.5%) |
| 10 to 14 Year Olds | 3,481 (87.4%) | 500 (12.6%) |
| 15 to 17 Year Olds | 1,445 (90.2%) | 157 (9.8%) |
| 18 to 19 Year Olds | 499 (61.6%) | 311 (38.4%) |
| 20 to 24 Year Olds | 587 (73.8%) | 208 (26.2%) |
| 25 to 34 Year Olds | 479 (92.3%) | 40 (7.7%) |
| 35 Years and over | 347 (73.7%) | 124 (26.3%) |
| Total | 10,759 (80.5%) | 2,606 (19.5%) |
Educational Attainment by Field of Study in Westfield
Business (5,712 | 29.6%), science & technology (2,333 | 12.1%), education (1,765 | 9.2%), engineering (1,391 | 7.2%), and bio, nature & agricultural (1,255 | 6.5%) are the most common fields of study among 19,267 individuals in Westfield who have obtained a bachelor's degree or higher.
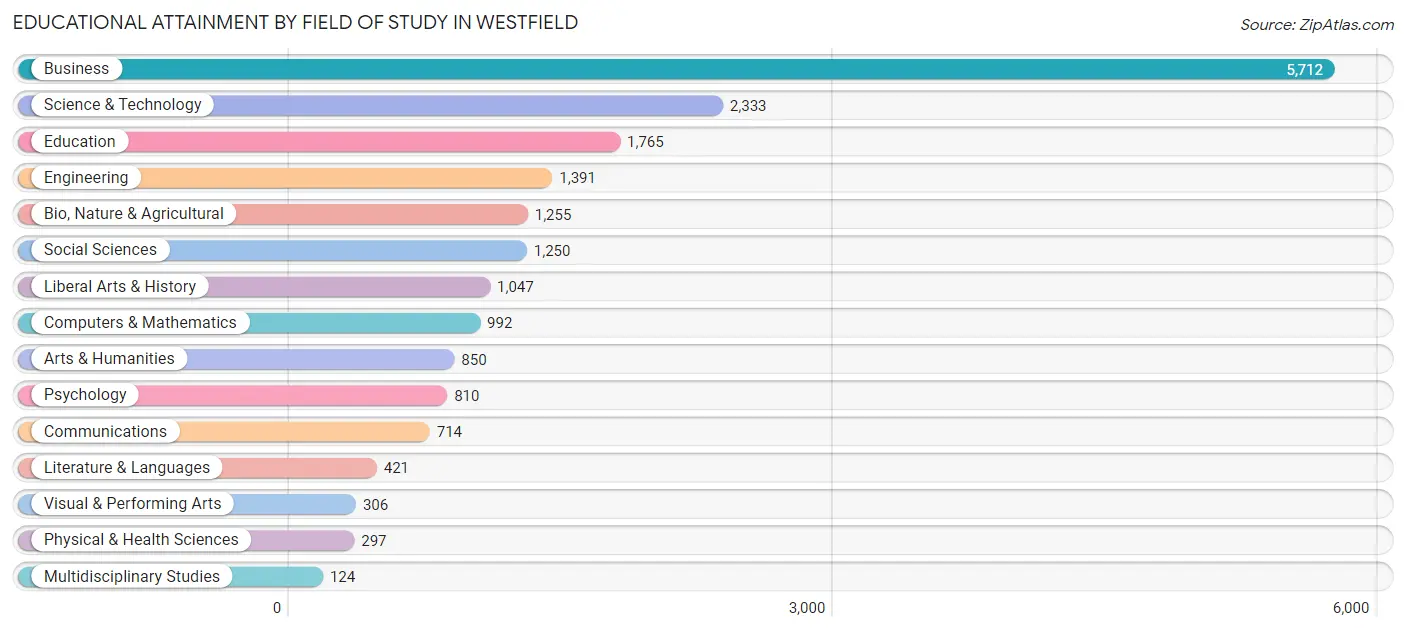
| Field of Study | # Graduates | % Graduates |
| Computers & Mathematics | 992 | 5.1% |
| Bio, Nature & Agricultural | 1,255 | 6.5% |
| Physical & Health Sciences | 297 | 1.5% |
| Psychology | 810 | 4.2% |
| Social Sciences | 1,250 | 6.5% |
| Engineering | 1,391 | 7.2% |
| Multidisciplinary Studies | 124 | 0.6% |
| Science & Technology | 2,333 | 12.1% |
| Business | 5,712 | 29.6% |
| Education | 1,765 | 9.2% |
| Literature & Languages | 421 | 2.2% |
| Liberal Arts & History | 1,047 | 5.4% |
| Visual & Performing Arts | 306 | 1.6% |
| Communications | 714 | 3.7% |
| Arts & Humanities | 850 | 4.4% |
| Total | 19,267 | 100.0% |
Transportation & Commute in Westfield
Vehicle Availability by Sex in Westfield
The most prevalent vehicle ownership categories in Westfield are males with 2 vehicles (8,113, accounting for 58.8%) and females with 2 vehicles (6,315, making up 70.7%).
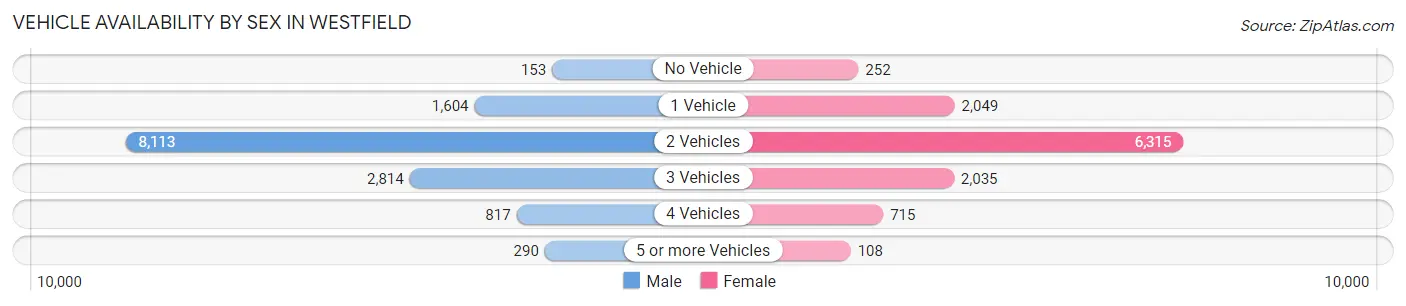
| Vehicles Available | Male | Female |
| No Vehicle | 153 (1.1%) | 252 (2.2%) |
| 1 Vehicle | 1,604 (11.6%) | 2,049 (17.9%) |
| 2 Vehicles | 8,113 (58.8%) | 6,315 (55.0%) |
| 3 Vehicles | 2,814 (20.4%) | 2,035 (17.7%) |
| 4 Vehicles | 817 (5.9%) | 715 (6.2%) |
| 5 or more Vehicles | 290 (2.1%) | 108 (0.9%) |
| Total | 13,791 (100.0%) | 11,474 (100.0%) |
Commute Time in Westfield
The most frequently occuring commute durations in Westfield are 15 to 19 minutes (4,215 commuters, 19.9%), 20 to 24 minutes (3,201 commuters, 15.1%), and 10 to 14 minutes (3,128 commuters, 14.8%).
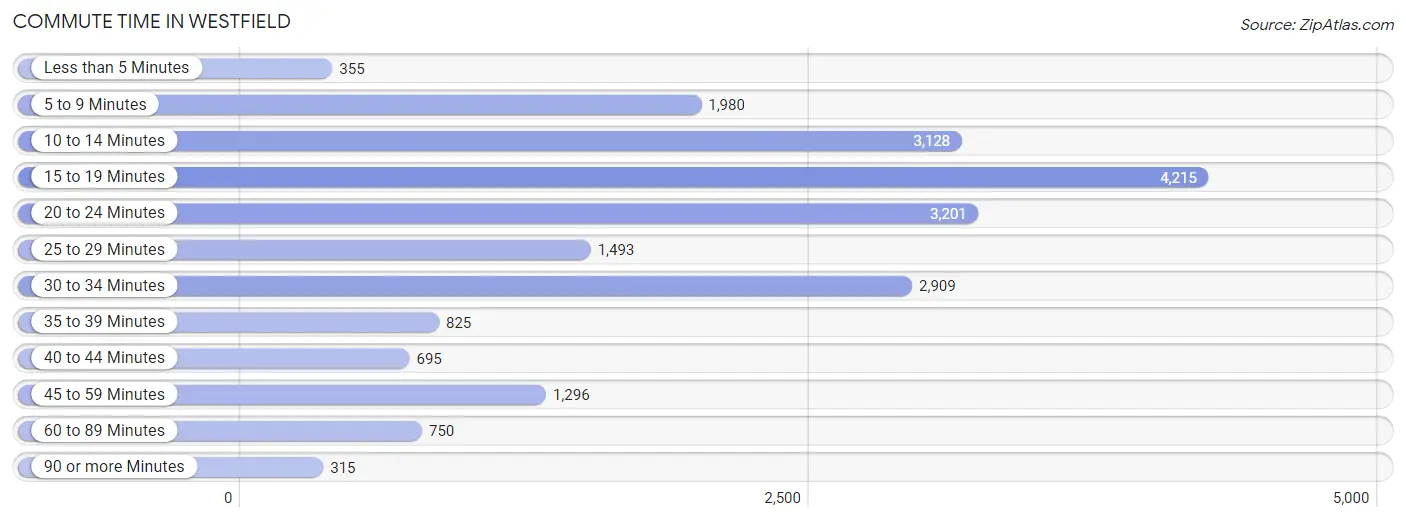
| Commute Time | # Commuters | % Commuters |
| Less than 5 Minutes | 355 | 1.7% |
| 5 to 9 Minutes | 1,980 | 9.4% |
| 10 to 14 Minutes | 3,128 | 14.8% |
| 15 to 19 Minutes | 4,215 | 19.9% |
| 20 to 24 Minutes | 3,201 | 15.1% |
| 25 to 29 Minutes | 1,493 | 7.1% |
| 30 to 34 Minutes | 2,909 | 13.8% |
| 35 to 39 Minutes | 825 | 3.9% |
| 40 to 44 Minutes | 695 | 3.3% |
| 45 to 59 Minutes | 1,296 | 6.1% |
| 60 to 89 Minutes | 750 | 3.5% |
| 90 or more Minutes | 315 | 1.5% |
Commute Time by Sex in Westfield
The most common commute times in Westfield are 15 to 19 minutes (2,368 commuters, 19.8%) for males and 20 to 24 minutes (1,860 commuters, 20.3%) for females.
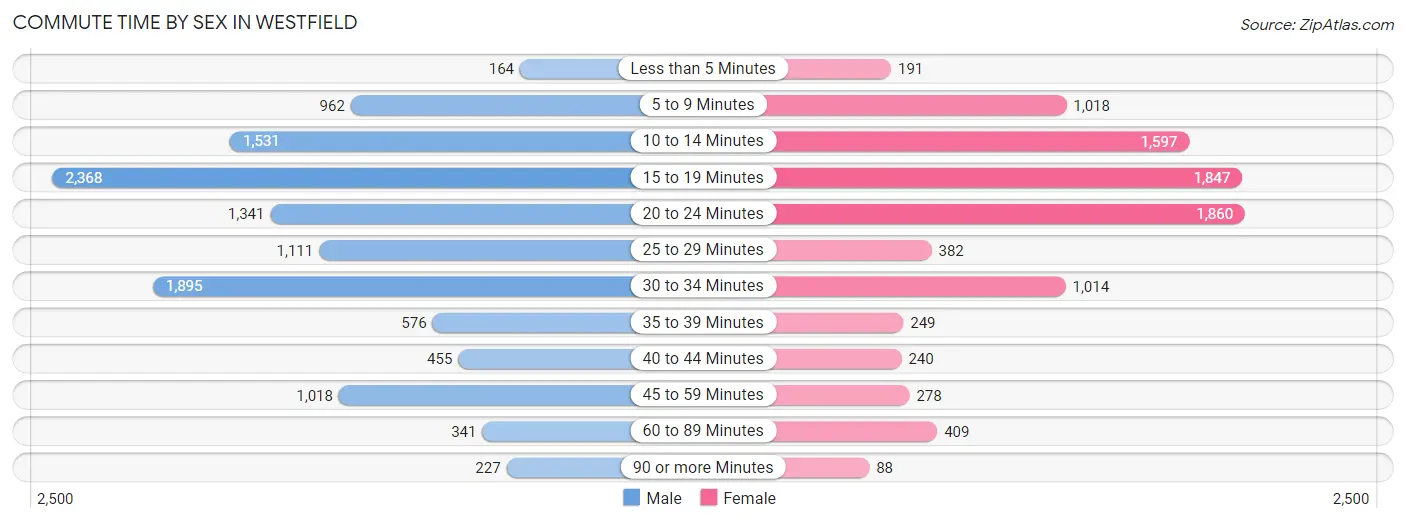
| Commute Time | Male | Female |
| Less than 5 Minutes | 164 (1.4%) | 191 (2.1%) |
| 5 to 9 Minutes | 962 (8.0%) | 1,018 (11.1%) |
| 10 to 14 Minutes | 1,531 (12.8%) | 1,597 (17.4%) |
| 15 to 19 Minutes | 2,368 (19.8%) | 1,847 (20.1%) |
| 20 to 24 Minutes | 1,341 (11.2%) | 1,860 (20.3%) |
| 25 to 29 Minutes | 1,111 (9.3%) | 382 (4.2%) |
| 30 to 34 Minutes | 1,895 (15.8%) | 1,014 (11.1%) |
| 35 to 39 Minutes | 576 (4.8%) | 249 (2.7%) |
| 40 to 44 Minutes | 455 (3.8%) | 240 (2.6%) |
| 45 to 59 Minutes | 1,018 (8.5%) | 278 (3.0%) |
| 60 to 89 Minutes | 341 (2.8%) | 409 (4.5%) |
| 90 or more Minutes | 227 (1.9%) | 88 (1.0%) |
Time of Departure to Work by Sex in Westfield
The most frequent times of departure to work in Westfield are 7:00 AM to 7:29 AM (2,613, 21.8%) for males and 7:00 AM to 7:29 AM (1,785, 19.5%) for females.
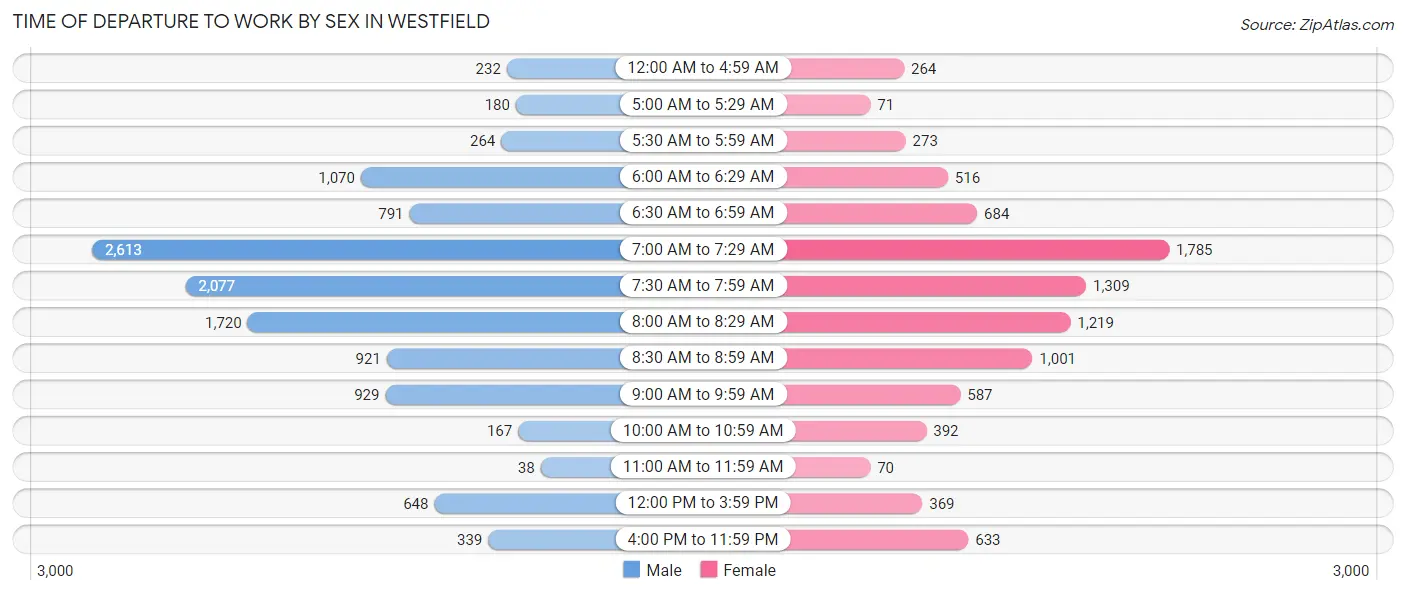
| Time of Departure | Male | Female |
| 12:00 AM to 4:59 AM | 232 (1.9%) | 264 (2.9%) |
| 5:00 AM to 5:29 AM | 180 (1.5%) | 71 (0.8%) |
| 5:30 AM to 5:59 AM | 264 (2.2%) | 273 (3.0%) |
| 6:00 AM to 6:29 AM | 1,070 (8.9%) | 516 (5.6%) |
| 6:30 AM to 6:59 AM | 791 (6.6%) | 684 (7.5%) |
| 7:00 AM to 7:29 AM | 2,613 (21.8%) | 1,785 (19.5%) |
| 7:30 AM to 7:59 AM | 2,077 (17.3%) | 1,309 (14.3%) |
| 8:00 AM to 8:29 AM | 1,720 (14.3%) | 1,219 (13.3%) |
| 8:30 AM to 8:59 AM | 921 (7.7%) | 1,001 (10.9%) |
| 9:00 AM to 9:59 AM | 929 (7.7%) | 587 (6.4%) |
| 10:00 AM to 10:59 AM | 167 (1.4%) | 392 (4.3%) |
| 11:00 AM to 11:59 AM | 38 (0.3%) | 70 (0.8%) |
| 12:00 PM to 3:59 PM | 648 (5.4%) | 369 (4.0%) |
| 4:00 PM to 11:59 PM | 339 (2.8%) | 633 (6.9%) |
| Total | 11,989 (100.0%) | 9,173 (100.0%) |
Housing Occupancy in Westfield
Occupancy by Ownership in Westfield
Of the total 17,888 dwellings in Westfield, owner-occupied units account for 14,276 (79.8%), while renter-occupied units make up 3,612 (20.2%).
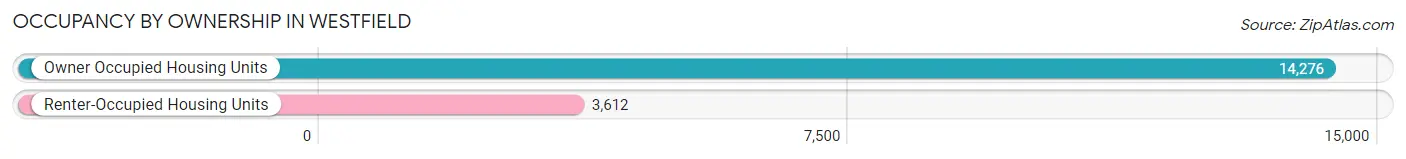
| Occupancy | # Housing Units | % Housing Units |
| Owner Occupied Housing Units | 14,276 | 79.8% |
| Renter-Occupied Housing Units | 3,612 | 20.2% |
| Total Occupied Housing Units | 17,888 | 100.0% |
Occupancy by Household Size in Westfield
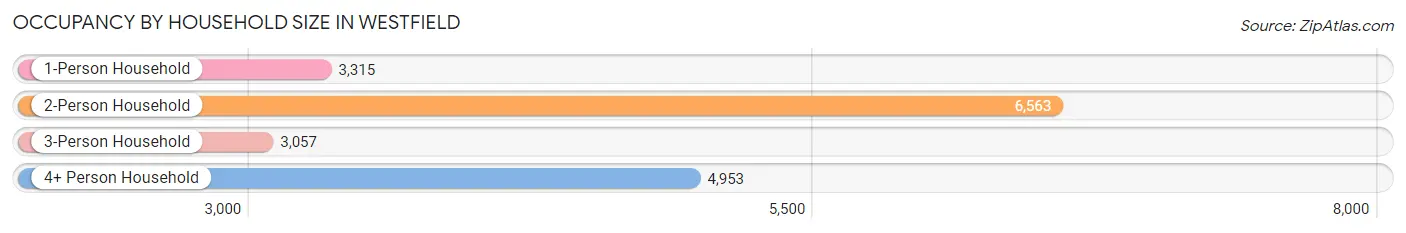
| Household Size | # Housing Units | % Housing Units |
| 1-Person Household | 3,315 | 18.5% |
| 2-Person Household | 6,563 | 36.7% |
| 3-Person Household | 3,057 | 17.1% |
| 4+ Person Household | 4,953 | 27.7% |
| Total Housing Units | 17,888 | 100.0% |
Occupancy by Ownership by Household Size in Westfield
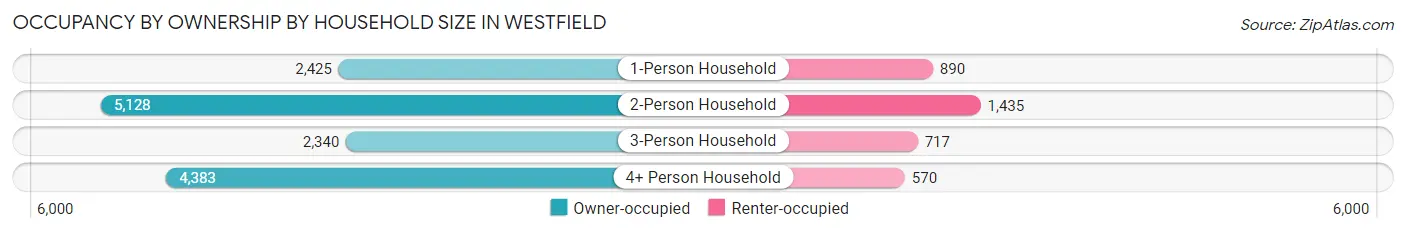
| Household Size | Owner-occupied | Renter-occupied |
| 1-Person Household | 2,425 (73.2%) | 890 (26.9%) |
| 2-Person Household | 5,128 (78.1%) | 1,435 (21.9%) |
| 3-Person Household | 2,340 (76.5%) | 717 (23.4%) |
| 4+ Person Household | 4,383 (88.5%) | 570 (11.5%) |
| Total Housing Units | 14,276 (79.8%) | 3,612 (20.2%) |
Occupancy by Educational Attainment in Westfield
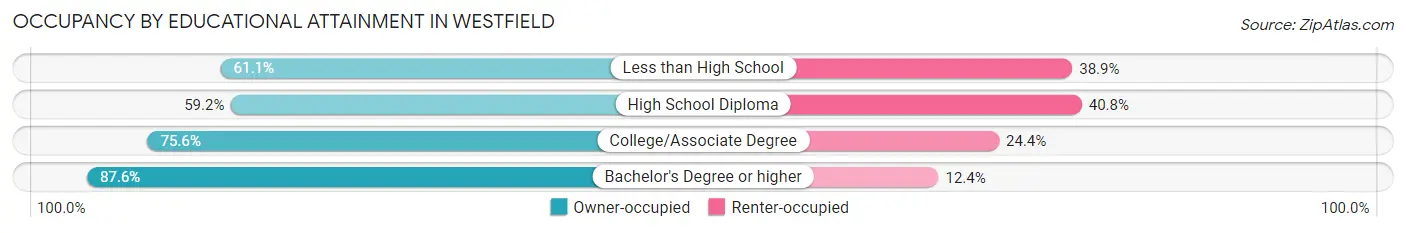
| Household Size | Owner-occupied | Renter-occupied |
| Less than High School | 261 (61.1%) | 166 (38.9%) |
| High School Diploma | 1,720 (59.2%) | 1,184 (40.8%) |
| College/Associate Degree | 2,905 (75.6%) | 936 (24.4%) |
| Bachelor's Degree or higher | 9,390 (87.6%) | 1,326 (12.4%) |
Occupancy by Age of Householder in Westfield
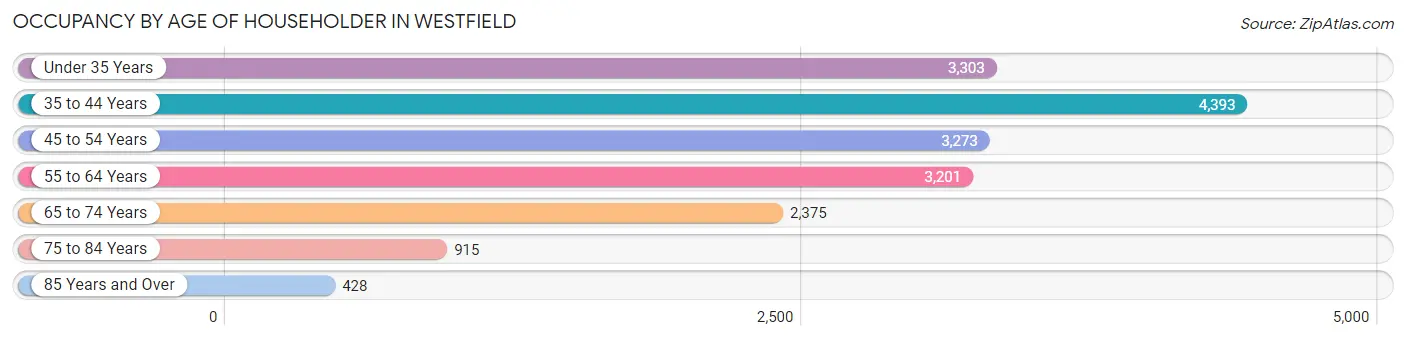
| Age Bracket | # Households | % Households |
| Under 35 Years | 3,303 | 18.5% |
| 35 to 44 Years | 4,393 | 24.6% |
| 45 to 54 Years | 3,273 | 18.3% |
| 55 to 64 Years | 3,201 | 17.9% |
| 65 to 74 Years | 2,375 | 13.3% |
| 75 to 84 Years | 915 | 5.1% |
| 85 Years and Over | 428 | 2.4% |
| Total | 17,888 | 100.0% |
Housing Finances in Westfield
Median Income by Occupancy in Westfield
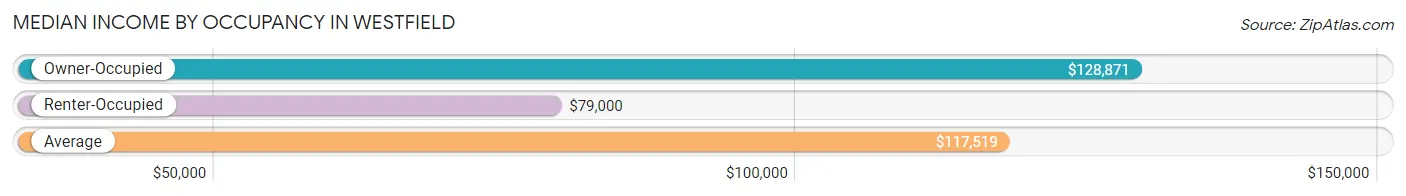
| Occupancy Type | # Households | Median Income |
| Owner-Occupied | 14,276 (79.8%) | $128,871 |
| Renter-Occupied | 3,612 (20.2%) | $79,000 |
| Average | 17,888 (100.0%) | $117,519 |
Occupancy by Householder Income Bracket in Westfield
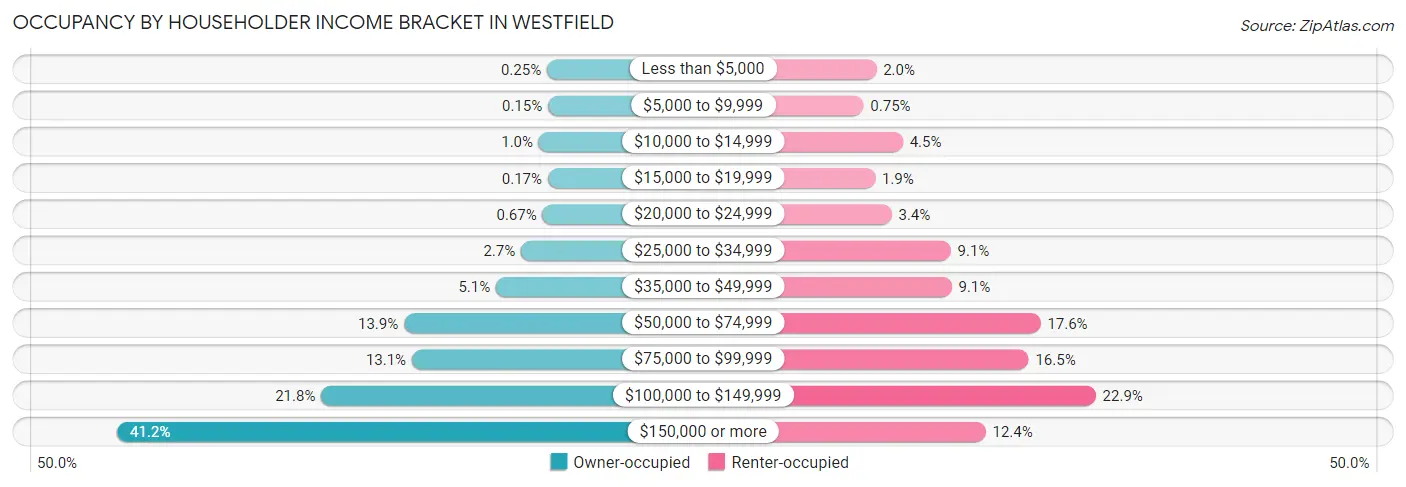
| Income Bracket | Owner-occupied | Renter-occupied |
| Less than $5,000 | 35 (0.3%) | 71 (2.0%) |
| $5,000 to $9,999 | 22 (0.2%) | 27 (0.7%) |
| $10,000 to $14,999 | 146 (1.0%) | 162 (4.5%) |
| $15,000 to $19,999 | 24 (0.2%) | 67 (1.8%) |
| $20,000 to $24,999 | 96 (0.7%) | 124 (3.4%) |
| $25,000 to $34,999 | 389 (2.7%) | 327 (9.0%) |
| $35,000 to $49,999 | 728 (5.1%) | 330 (9.1%) |
| $50,000 to $74,999 | 1,979 (13.9%) | 636 (17.6%) |
| $75,000 to $99,999 | 1,872 (13.1%) | 595 (16.5%) |
| $100,000 to $149,999 | 3,105 (21.7%) | 826 (22.9%) |
| $150,000 or more | 5,880 (41.2%) | 447 (12.4%) |
| Total | 14,276 (100.0%) | 3,612 (100.0%) |
Monthly Housing Cost Tiers in Westfield
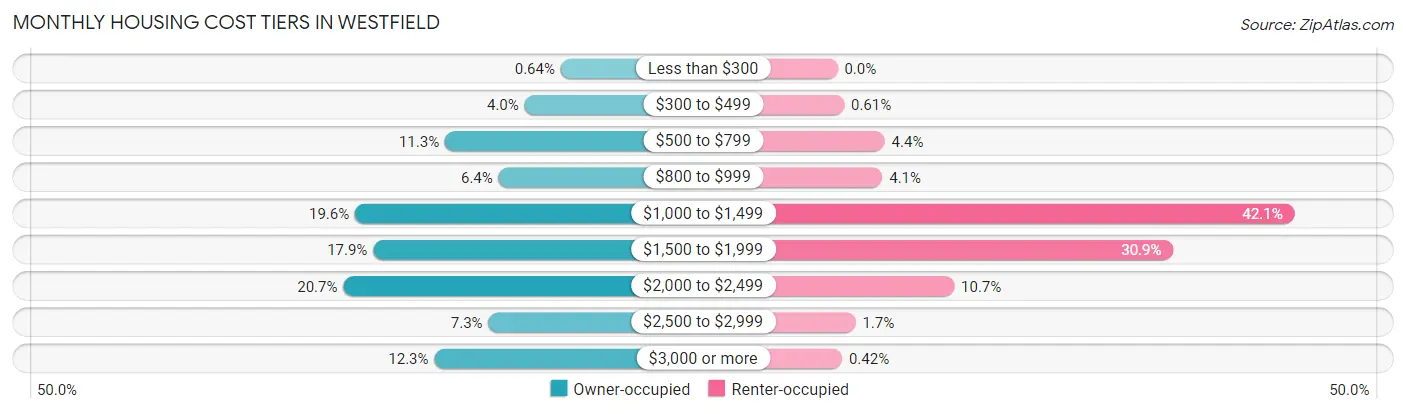
| Monthly Cost | Owner-occupied | Renter-occupied |
| Less than $300 | 92 (0.6%) | 0 (0.0%) |
| $300 to $499 | 567 (4.0%) | 22 (0.6%) |
| $500 to $799 | 1,613 (11.3%) | 157 (4.3%) |
| $800 to $999 | 908 (6.4%) | 149 (4.1%) |
| $1,000 to $1,499 | 2,795 (19.6%) | 1,520 (42.1%) |
| $1,500 to $1,999 | 2,557 (17.9%) | 1,117 (30.9%) |
| $2,000 to $2,499 | 2,949 (20.7%) | 388 (10.7%) |
| $2,500 to $2,999 | 1,042 (7.3%) | 60 (1.7%) |
| $3,000 or more | 1,753 (12.3%) | 15 (0.4%) |
| Total | 14,276 (100.0%) | 3,612 (100.0%) |
Physical Housing Characteristics in Westfield
Housing Structures in Westfield
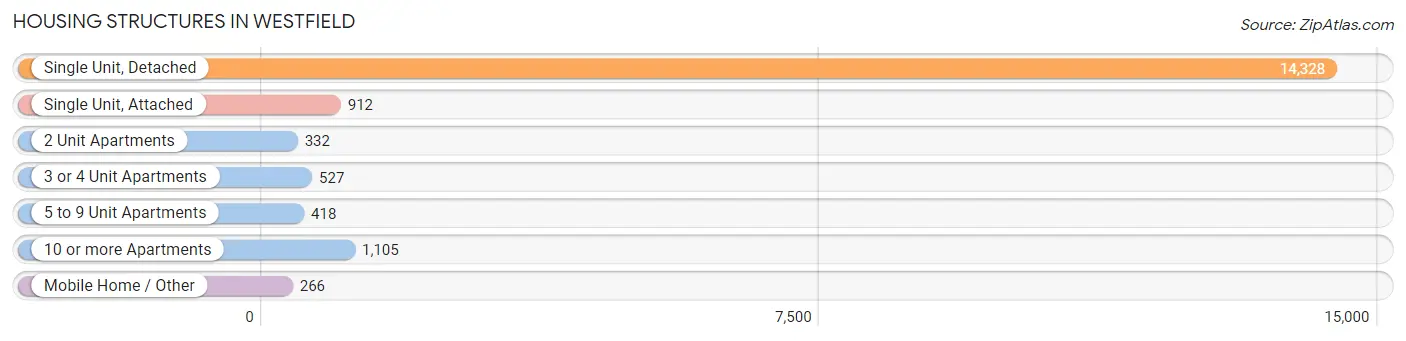
| Structure Type | # Housing Units | % Housing Units |
| Single Unit, Detached | 14,328 | 80.1% |
| Single Unit, Attached | 912 | 5.1% |
| 2 Unit Apartments | 332 | 1.9% |
| 3 or 4 Unit Apartments | 527 | 2.9% |
| 5 to 9 Unit Apartments | 418 | 2.3% |
| 10 or more Apartments | 1,105 | 6.2% |
| Mobile Home / Other | 266 | 1.5% |
| Total | 17,888 | 100.0% |
Housing Structures by Occupancy in Westfield
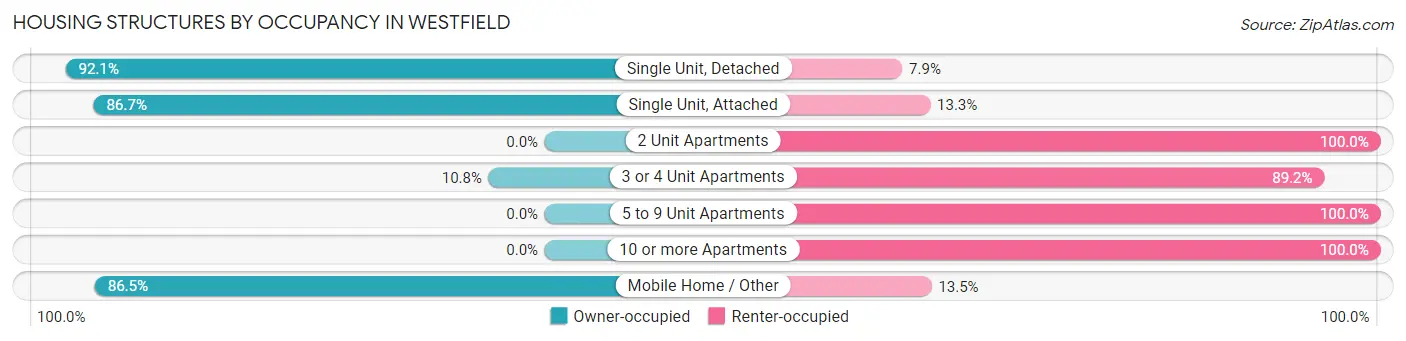
| Structure Type | Owner-occupied | Renter-occupied |
| Single Unit, Detached | 13,198 (92.1%) | 1,130 (7.9%) |
| Single Unit, Attached | 791 (86.7%) | 121 (13.3%) |
| 2 Unit Apartments | 0 (0.0%) | 332 (100.0%) |
| 3 or 4 Unit Apartments | 57 (10.8%) | 470 (89.2%) |
| 5 to 9 Unit Apartments | 0 (0.0%) | 418 (100.0%) |
| 10 or more Apartments | 0 (0.0%) | 1,105 (100.0%) |
| Mobile Home / Other | 230 (86.5%) | 36 (13.5%) |
| Total | 14,276 (79.8%) | 3,612 (20.2%) |
Housing Structures by Number of Rooms in Westfield
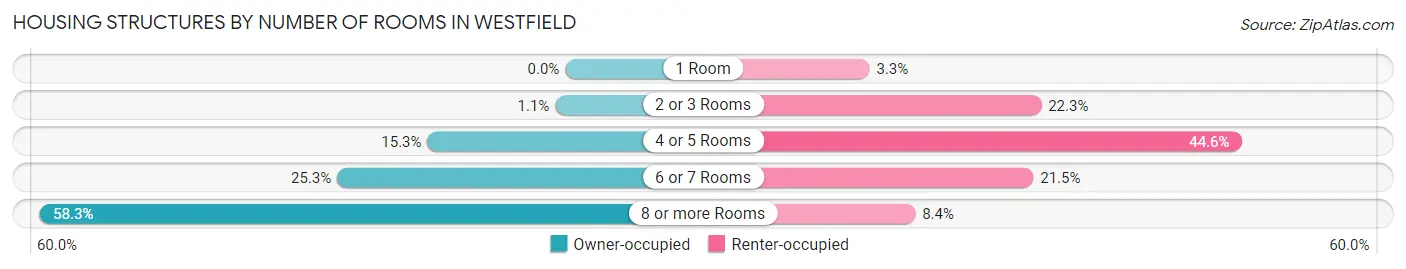
| Number of Rooms | Owner-occupied | Renter-occupied |
| 1 Room | 0 (0.0%) | 119 (3.3%) |
| 2 or 3 Rooms | 159 (1.1%) | 807 (22.3%) |
| 4 or 5 Rooms | 2,184 (15.3%) | 1,609 (44.6%) |
| 6 or 7 Rooms | 3,615 (25.3%) | 775 (21.5%) |
| 8 or more Rooms | 8,318 (58.3%) | 302 (8.4%) |
| Total | 14,276 (100.0%) | 3,612 (100.0%) |
Housing Structure by Heating Type in Westfield
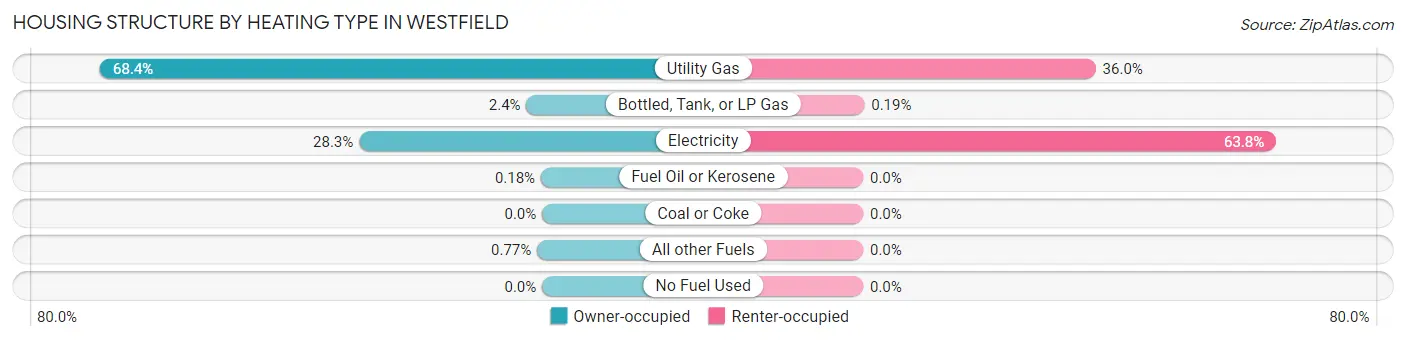
| Heating Type | Owner-occupied | Renter-occupied |
| Utility Gas | 9,757 (68.3%) | 1,299 (36.0%) |
| Bottled, Tank, or LP Gas | 346 (2.4%) | 7 (0.2%) |
| Electricity | 4,038 (28.3%) | 2,306 (63.8%) |
| Fuel Oil or Kerosene | 25 (0.2%) | 0 (0.0%) |
| Coal or Coke | 0 (0.0%) | 0 (0.0%) |
| All other Fuels | 110 (0.8%) | 0 (0.0%) |
| No Fuel Used | 0 (0.0%) | 0 (0.0%) |
| Total | 14,276 (100.0%) | 3,612 (100.0%) |
Household Vehicle Usage in Westfield
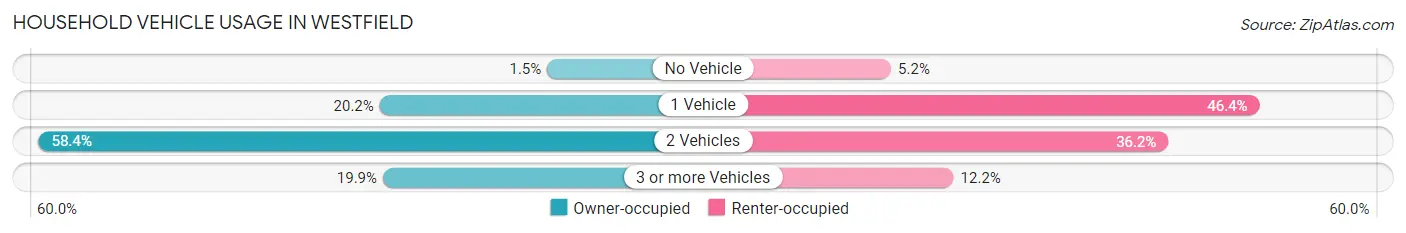
| Vehicles per Household | Owner-occupied | Renter-occupied |
| No Vehicle | 210 (1.5%) | 187 (5.2%) |
| 1 Vehicle | 2,888 (20.2%) | 1,677 (46.4%) |
| 2 Vehicles | 8,342 (58.4%) | 1,308 (36.2%) |
| 3 or more Vehicles | 2,836 (19.9%) | 440 (12.2%) |
| Total | 14,276 (100.0%) | 3,612 (100.0%) |
Real Estate & Mortgages in Westfield
Real Estate and Mortgage Overview in Westfield
| Characteristic | Without Mortgage | With Mortgage |
| Housing Units | 3,259 | 11,017 |
| Median Property Value | $349,300 | $368,800 |
| Median Household Income | $82,192 | $5,073 |
| Monthly Housing Costs | $688 | $1,747 |
| Real Estate Taxes | $3,263 | $112 |
Property Value by Mortgage Status in Westfield
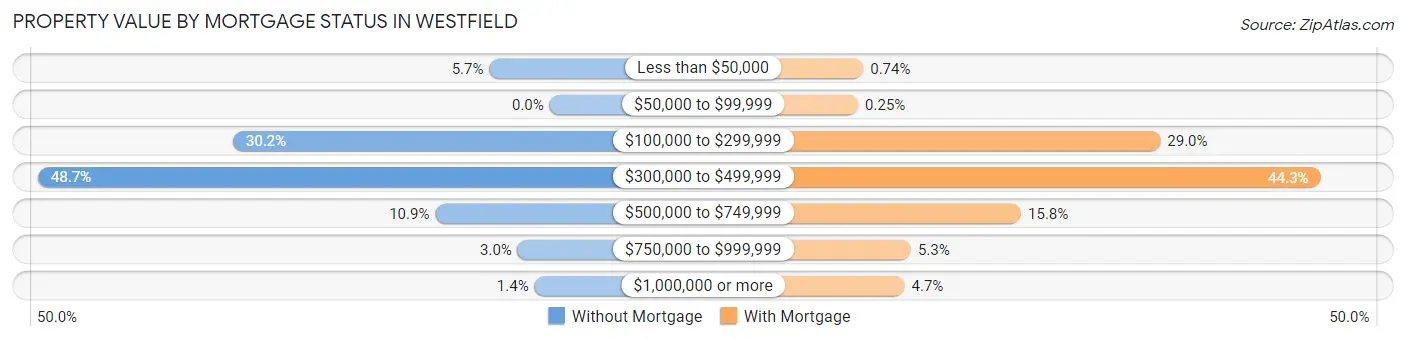
| Property Value | Without Mortgage | With Mortgage |
| Less than $50,000 | 187 (5.7%) | 82 (0.7%) |
| $50,000 to $99,999 | 0 (0.0%) | 27 (0.3%) |
| $100,000 to $299,999 | 983 (30.2%) | 3,198 (29.0%) |
| $300,000 to $499,999 | 1,588 (48.7%) | 4,877 (44.3%) |
| $500,000 to $749,999 | 355 (10.9%) | 1,737 (15.8%) |
| $750,000 to $999,999 | 99 (3.0%) | 582 (5.3%) |
| $1,000,000 or more | 47 (1.4%) | 514 (4.7%) |
| Total | 3,259 (100.0%) | 11,017 (100.0%) |
Household Income by Mortgage Status in Westfield
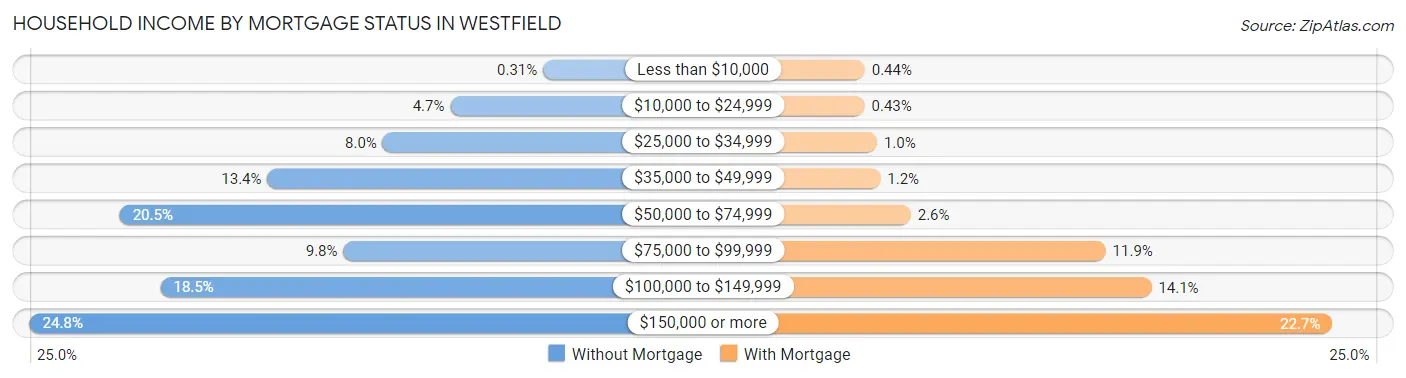
| Household Income | Without Mortgage | With Mortgage |
| Less than $10,000 | 10 (0.3%) | 49 (0.4%) |
| $10,000 to $24,999 | 154 (4.7%) | 47 (0.4%) |
| $25,000 to $34,999 | 259 (8.0%) | 112 (1.0%) |
| $35,000 to $49,999 | 438 (13.4%) | 130 (1.2%) |
| $50,000 to $74,999 | 667 (20.5%) | 290 (2.6%) |
| $75,000 to $99,999 | 320 (9.8%) | 1,312 (11.9%) |
| $100,000 to $149,999 | 604 (18.5%) | 1,552 (14.1%) |
| $150,000 or more | 807 (24.8%) | 2,501 (22.7%) |
| Total | 3,259 (100.0%) | 11,017 (100.0%) |
Property Value to Household Income Ratio in Westfield
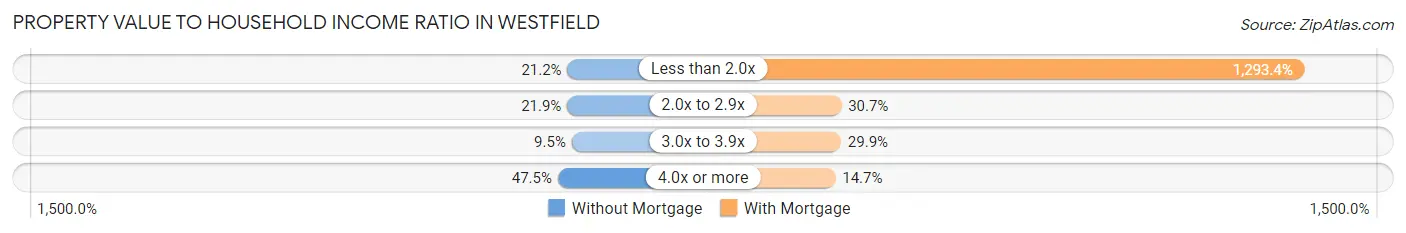
| Value-to-Income Ratio | Without Mortgage | With Mortgage |
| Less than 2.0x | 691 (21.2%) | 142,494 (1,293.4%) |
| 2.0x to 2.9x | 712 (21.8%) | 3,387 (30.7%) |
| 3.0x to 3.9x | 308 (9.5%) | 3,289 (29.8%) |
| 4.0x or more | 1,548 (47.5%) | 1,618 (14.7%) |
| Total | 3,259 (100.0%) | 11,017 (100.0%) |
Real Estate Taxes by Mortgage Status in Westfield
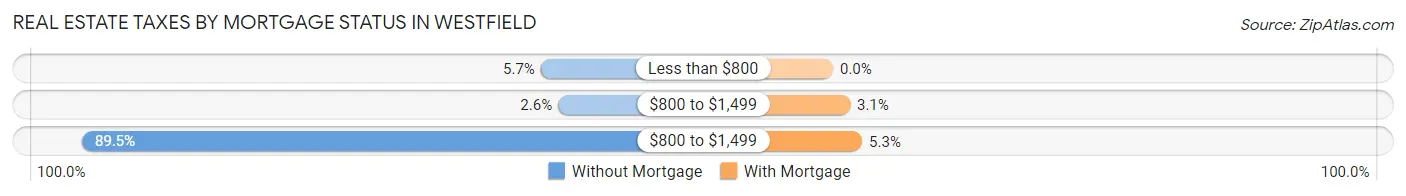
| Property Taxes | Without Mortgage | With Mortgage |
| Less than $800 | 187 (5.7%) | 0 (0.0%) |
| $800 to $1,499 | 84 (2.6%) | 342 (3.1%) |
| $800 to $1,499 | 2,918 (89.5%) | 586 (5.3%) |
| Total | 3,259 (100.0%) | 11,017 (100.0%) |
Health & Disability in Westfield
Health Insurance Coverage by Age in Westfield
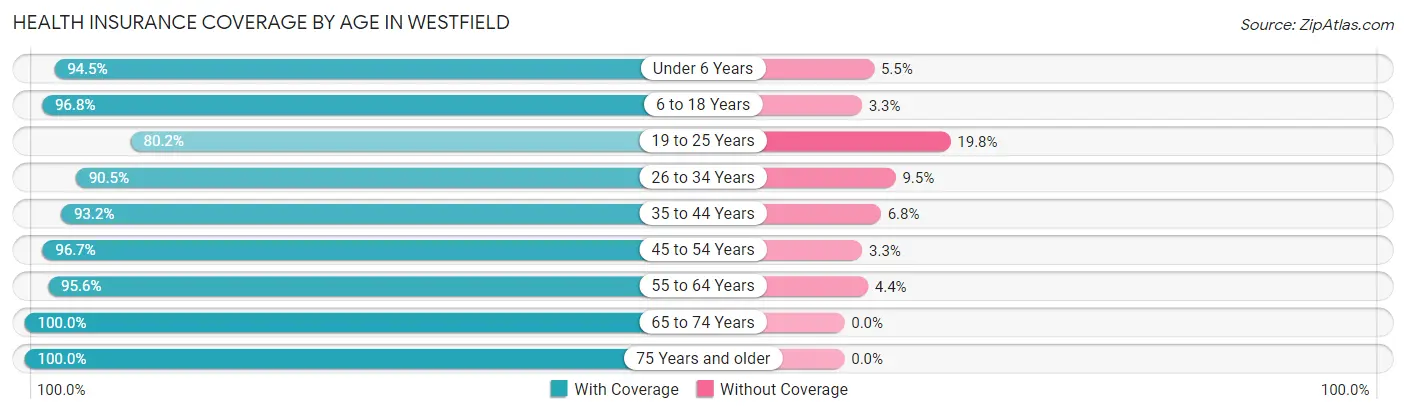
| Age Bracket | With Coverage | Without Coverage |
| Under 6 Years | 3,725 (94.5%) | 218 (5.5%) |
| 6 to 18 Years | 9,663 (96.8%) | 325 (3.3%) |
| 19 to 25 Years | 2,450 (80.2%) | 604 (19.8%) |
| 26 to 34 Years | 5,056 (90.5%) | 533 (9.5%) |
| 35 to 44 Years | 7,294 (93.2%) | 531 (6.8%) |
| 45 to 54 Years | 5,970 (96.7%) | 205 (3.3%) |
| 55 to 64 Years | 5,008 (95.6%) | 230 (4.4%) |
| 65 to 74 Years | 3,835 (100.0%) | 0 (0.0%) |
| 75 Years and older | 2,364 (100.0%) | 0 (0.0%) |
| Total | 45,365 (94.5%) | 2,646 (5.5%) |
Health Insurance Coverage by Citizenship Status in Westfield
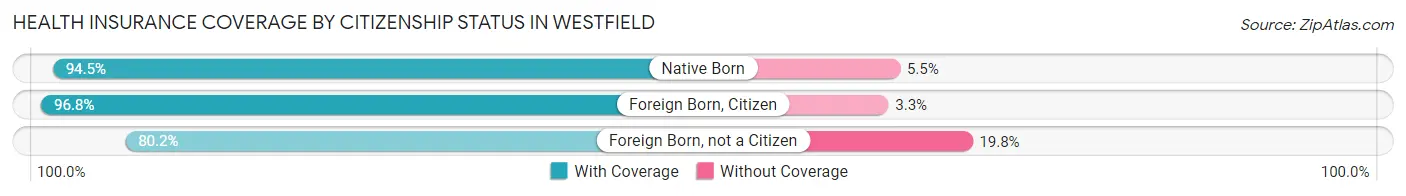
| Citizenship Status | With Coverage | Without Coverage |
| Native Born | 3,725 (94.5%) | 218 (5.5%) |
| Foreign Born, Citizen | 9,663 (96.8%) | 325 (3.3%) |
| Foreign Born, not a Citizen | 2,450 (80.2%) | 604 (19.8%) |
Health Insurance Coverage by Household Income in Westfield
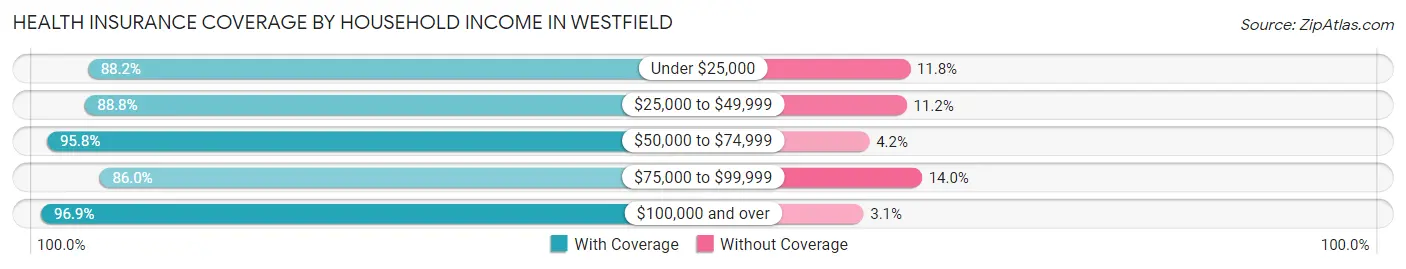
| Household Income | With Coverage | Without Coverage |
| Under $25,000 | 1,372 (88.2%) | 184 (11.8%) |
| $25,000 to $49,999 | 2,562 (88.8%) | 323 (11.2%) |
| $50,000 to $74,999 | 5,244 (95.8%) | 230 (4.2%) |
| $75,000 to $99,999 | 5,765 (86.0%) | 941 (14.0%) |
| $100,000 and over | 30,375 (96.9%) | 968 (3.1%) |
Public vs Private Health Insurance Coverage by Age in Westfield
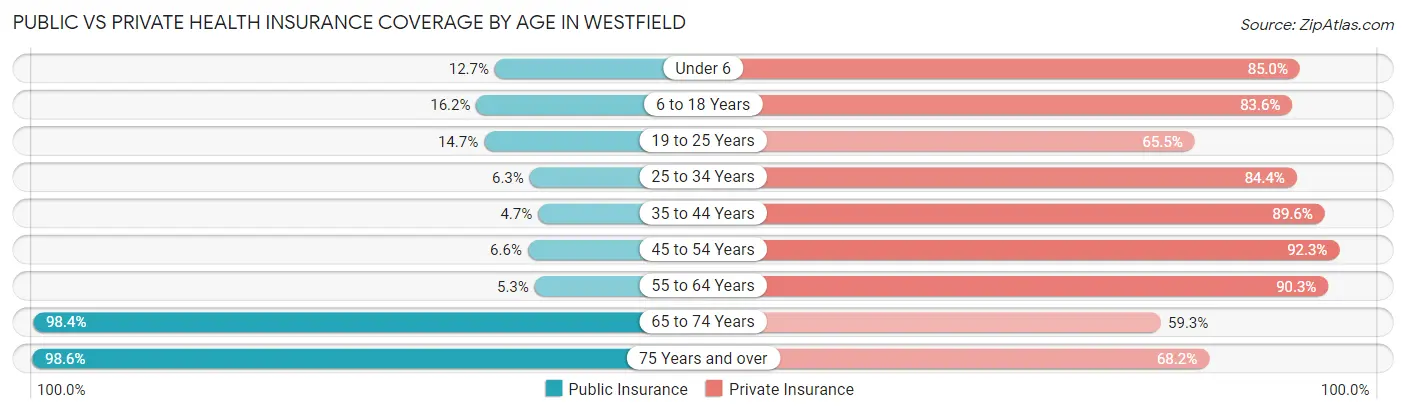
| Age Bracket | Public Insurance | Private Insurance |
| Under 6 | 502 (12.7%) | 3,352 (85.0%) |
| 6 to 18 Years | 1,614 (16.2%) | 8,350 (83.6%) |
| 19 to 25 Years | 450 (14.7%) | 2,000 (65.5%) |
| 25 to 34 Years | 350 (6.3%) | 4,719 (84.4%) |
| 35 to 44 Years | 368 (4.7%) | 7,013 (89.6%) |
| 45 to 54 Years | 408 (6.6%) | 5,701 (92.3%) |
| 55 to 64 Years | 279 (5.3%) | 4,729 (90.3%) |
| 65 to 74 Years | 3,775 (98.4%) | 2,273 (59.3%) |
| 75 Years and over | 2,331 (98.6%) | 1,611 (68.1%) |
| Total | 10,077 (21.0%) | 39,748 (82.8%) |
Disability Status by Sex by Age in Westfield
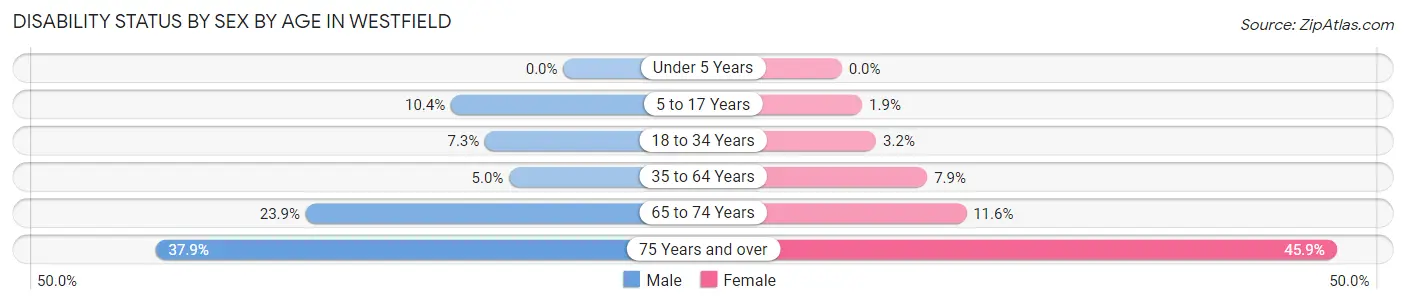
| Age Bracket | Male | Female |
| Under 5 Years | 0 (0.0%) | 0 (0.0%) |
| 5 to 17 Years | 549 (10.4%) | 96 (1.9%) |
| 18 to 34 Years | 327 (7.3%) | 150 (3.2%) |
| 35 to 64 Years | 475 (5.0%) | 776 (7.9%) |
| 65 to 74 Years | 414 (23.9%) | 243 (11.6%) |
| 75 Years and over | 307 (37.9%) | 713 (45.9%) |
Disability Class by Sex by Age in Westfield
Disability Class: Hearing Difficulty
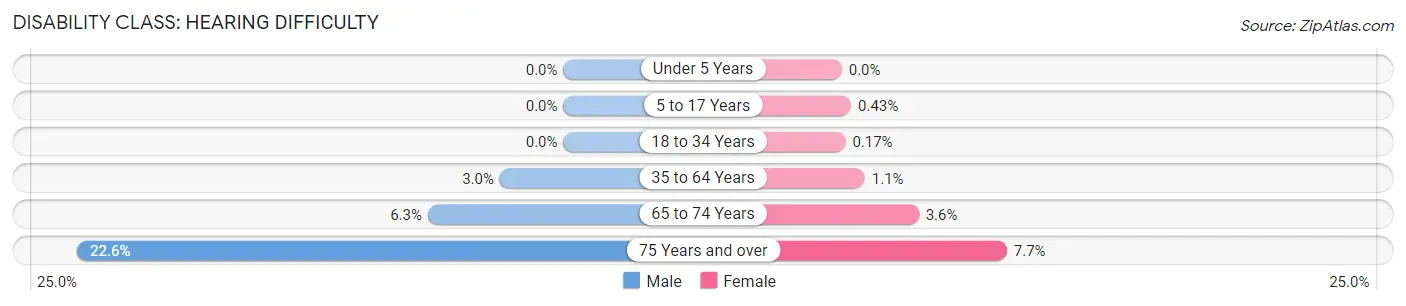
| Age Bracket | Male | Female |
| Under 5 Years | 0 (0.0%) | 0 (0.0%) |
| 5 to 17 Years | 0 (0.0%) | 22 (0.4%) |
| 18 to 34 Years | 0 (0.0%) | 8 (0.2%) |
| 35 to 64 Years | 279 (2.9%) | 105 (1.1%) |
| 65 to 74 Years | 109 (6.3%) | 75 (3.6%) |
| 75 Years and over | 183 (22.6%) | 119 (7.7%) |
Disability Class: Vision Difficulty
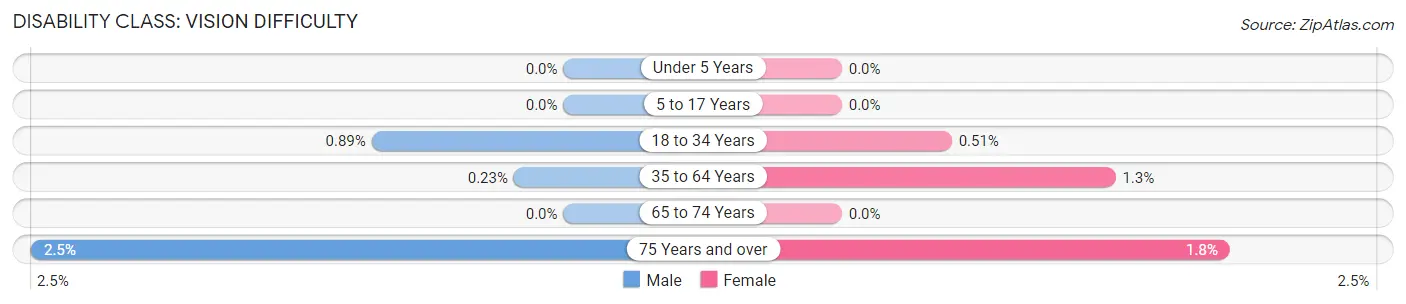
| Age Bracket | Male | Female |
| Under 5 Years | 0 (0.0%) | 0 (0.0%) |
| 5 to 17 Years | 0 (0.0%) | 0 (0.0%) |
| 18 to 34 Years | 40 (0.9%) | 24 (0.5%) |
| 35 to 64 Years | 22 (0.2%) | 124 (1.3%) |
| 65 to 74 Years | 0 (0.0%) | 0 (0.0%) |
| 75 Years and over | 20 (2.5%) | 28 (1.8%) |
Disability Class: Cognitive Difficulty
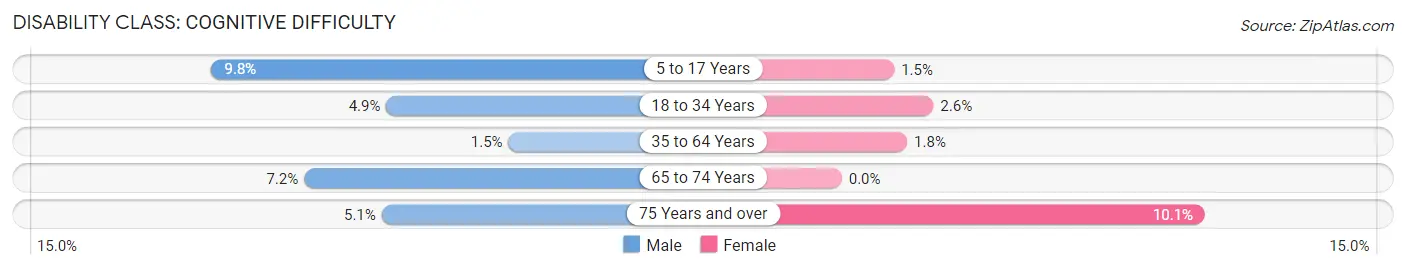
| Age Bracket | Male | Female |
| 5 to 17 Years | 516 (9.8%) | 74 (1.5%) |
| 18 to 34 Years | 222 (4.9%) | 120 (2.5%) |
| 35 to 64 Years | 145 (1.5%) | 178 (1.8%) |
| 65 to 74 Years | 125 (7.2%) | 0 (0.0%) |
| 75 Years and over | 41 (5.1%) | 157 (10.1%) |
Disability Class: Ambulatory Difficulty
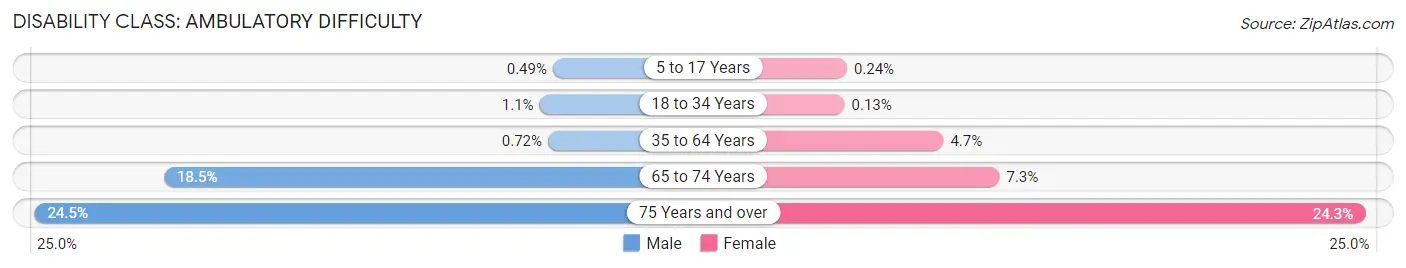
| Age Bracket | Male | Female |
| 5 to 17 Years | 26 (0.5%) | 12 (0.2%) |
| 18 to 34 Years | 50 (1.1%) | 6 (0.1%) |
| 35 to 64 Years | 68 (0.7%) | 462 (4.7%) |
| 65 to 74 Years | 321 (18.5%) | 154 (7.3%) |
| 75 Years and over | 199 (24.5%) | 377 (24.3%) |
Disability Class: Self-Care Difficulty
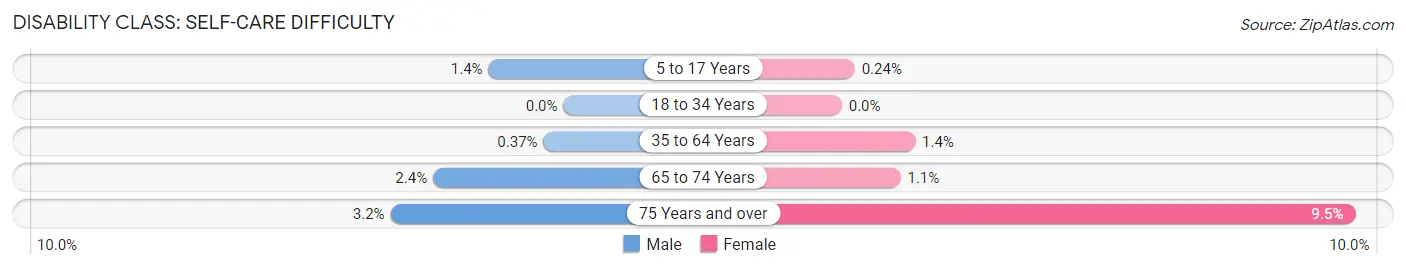
| Age Bracket | Male | Female |
| 5 to 17 Years | 73 (1.4%) | 12 (0.2%) |
| 18 to 34 Years | 0 (0.0%) | 0 (0.0%) |
| 35 to 64 Years | 35 (0.4%) | 133 (1.4%) |
| 65 to 74 Years | 42 (2.4%) | 23 (1.1%) |
| 75 Years and over | 26 (3.2%) | 148 (9.5%) |
Technology Access in Westfield
Computing Device Access in Westfield
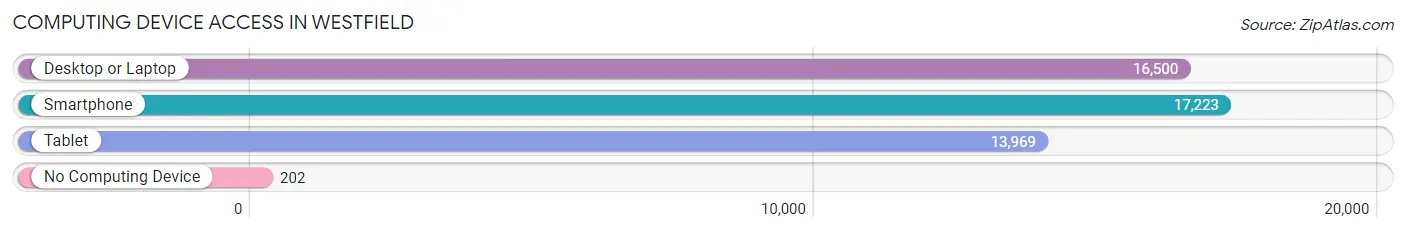
| Device Type | # Households | % Households |
| Desktop or Laptop | 16,500 | 92.2% |
| Smartphone | 17,223 | 96.3% |
| Tablet | 13,969 | 78.1% |
| No Computing Device | 202 | 1.1% |
| Total | 17,888 | 100.0% |
Internet Access in Westfield
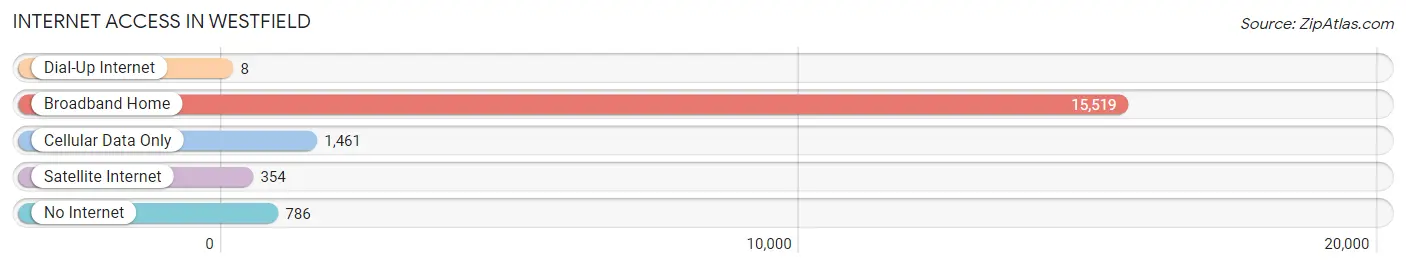
| Internet Type | # Households | % Households |
| Dial-Up Internet | 8 | 0.0% |
| Broadband Home | 15,519 | 86.8% |
| Cellular Data Only | 1,461 | 8.2% |
| Satellite Internet | 354 | 2.0% |
| No Internet | 786 | 4.4% |
| Total | 17,888 | 100.0% |
Westfield Summary
History
Westfield, Indiana is a city located in Hamilton County, Indiana, United States. It is located approximately 20 miles north of Indianapolis, the state capital. Westfield was founded in 1834 by Quaker settlers from North Carolina. The city was originally known as Middletown, but was renamed Westfield in 1837.
Westfield experienced rapid growth in the late 19th and early 20th centuries, due to its proximity to Indianapolis and the development of the railroad. The city was incorporated in 1868, and by 1900, the population had grown to 1,845. The city continued to grow throughout the 20th century, and by the 2000 census, the population had grown to 21,719.
Geography
Westfield is located in central Hamilton County, Indiana, approximately 20 miles north of Indianapolis. The city is situated on the White River, and is bordered by the towns of Carmel, Fishers, and Noblesville. The city covers an area of approximately 20 square miles, and has an elevation of 830 feet.
The climate in Westfield is classified as humid continental, with hot, humid summers and cold, snowy winters. The average annual temperature is 54 degrees Fahrenheit, and the average annual precipitation is 40 inches.
Economy
Westfield’s economy is largely based on the service industry, with many residents employed in retail, healthcare, and education. The city is also home to several large employers, including the Westfield Washington Schools, the Westfield-Washington Public Library, and the Westfield YMCA.
The city is also home to several large corporations, including the Westfield Group, a global shopping center developer and operator; the Westfield Corporation, a real estate investment trust; and the Westfield Insurance Company.
Demographics
As of the 2010 census, Westfield had a population of 30,068. The racial makeup of the city was 87.3% White, 5.3% African American, 0.3% Native American, 3.2% Asian, and 3.9% from other races. Hispanic or Latino of any race were 6.2% of the population.
The median household income in Westfield was $76,845, and the median family income was $90,945. The per capita income was $35,945. About 4.2% of families and 5.3% of the population were below the poverty line.
Westfield is served by the Westfield-Washington Public Library, which has a collection of over 200,000 items. The city is also home to several parks, including Grand Park, which features a variety of sports fields, trails, and playgrounds.
Common Questions
What is Per Capita Income in Westfield?
Per Capita income in Westfield is $58,223.
What is the Median Family Income in Westfield?
Median Family Income in Westfield is $128,462.
What is the Median Household income in Westfield?
Median Household Income in Westfield is $117,519.
What is Income or Wage Gap in Westfield?
Income or Wage Gap in Westfield is 42.9%.
Women in Westfield earn 57.1 cents for every dollar earned by a man.
What is Inequality or Gini Index in Westfield?
Inequality or Gini Index in Westfield is 0.44.
What is the Total Population of Westfield?
Total Population of Westfield is 48,262.
What is the Total Male Population of Westfield?
Total Male Population of Westfield is 23,647.
What is the Total Female Population of Westfield?
Total Female Population of Westfield is 24,615.
What is the Ratio of Males per 100 Females in Westfield?
There are 96.07 Males per 100 Females in Westfield.
What is the Ratio of Females per 100 Males in Westfield?
There are 104.09 Females per 100 Males in Westfield.
What is the Median Population Age in Westfield?
Median Population Age in Westfield is 36.9 Years.
What is the Average Family Size in Westfield
Average Family Size in Westfield is 3.1 People.
What is the Average Household Size in Westfield
Average Household Size in Westfield is 2.7 People.
How Large is the Labor Force in Westfield?
There are 26,215 People in the Labor Forcein in Westfield.
What is the Percentage of People in the Labor Force in Westfield?
72.8% of People are in the Labor Force in Westfield.
What is the Unemployment Rate in Westfield?
Unemployment Rate in Westfield is 2.0%.