Area Code 219 Map & Demographics
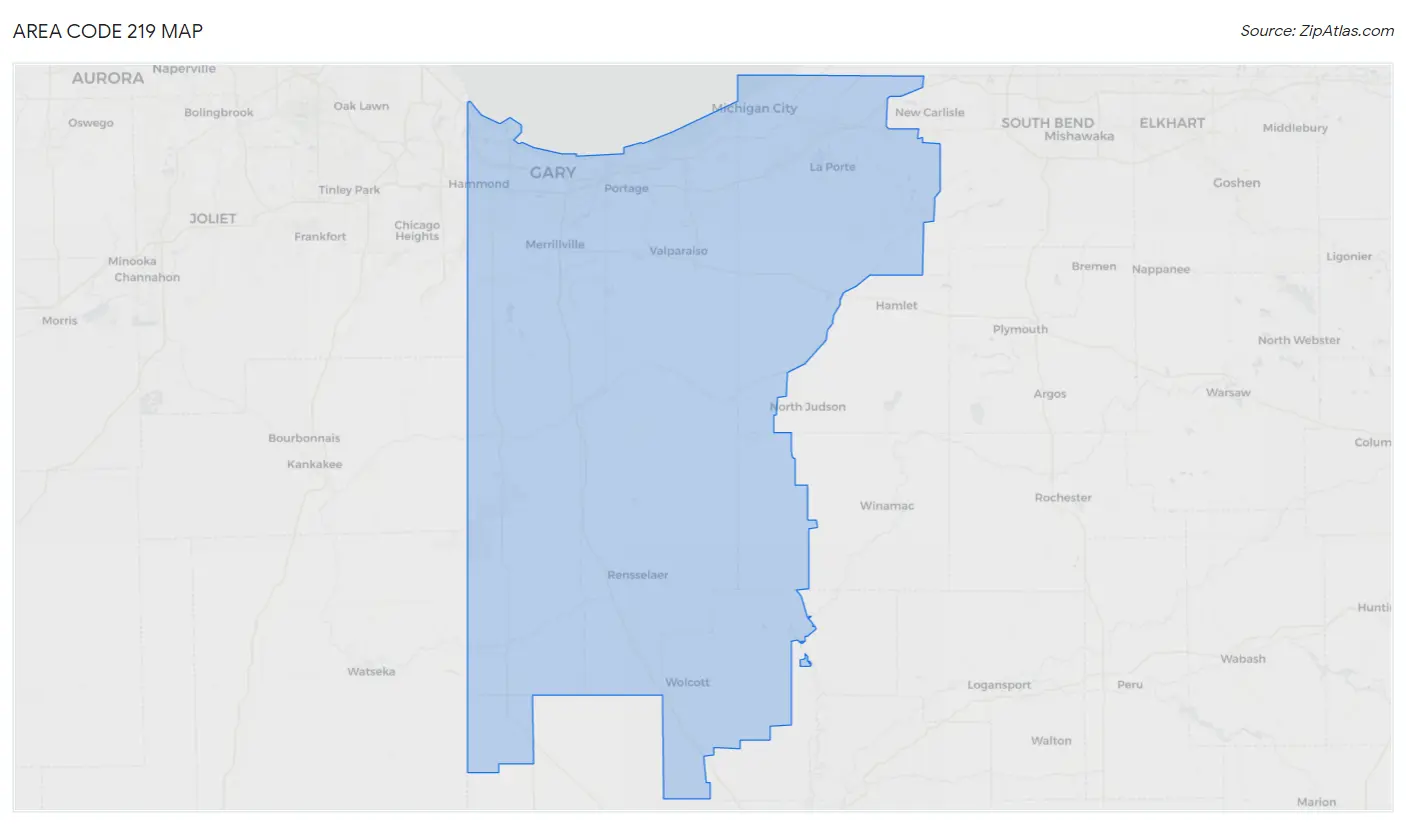
Area Code 219 Map
Area Code 219 Overview
$33,146
PER CAPITA INCOME
$81,779
AVG FAMILY INCOME
$68,442
AVG HOUSEHOLD INCOME
38.3%
WAGE / INCOME GAP [ % ]
61.7¢/ $1
WAGE / INCOME GAP [ $ ]
$10,932
FAMILY INCOME DEFICIT
26.69
INEQUALITY / GINI INDEX
843,690
TOTAL POPULATION
417,521
MALE POPULATION
426,169
FEMALE POPULATION
97.97
MALES / 100 FEMALES
102.07
FEMALES / 100 MALES
42.5
MEDIAN AGE
3.1
AVG FAMILY SIZE
2.5
AVG HOUSEHOLD SIZE
399,542
LABOR FORCE [ PEOPLE ]
59.2%
PERCENT IN LABOR FORCE
7.0%
UNEMPLOYMENT RATE
Income in Area Code 219
Income Overview in Area Code 219
Per Capita Income in Area Code 219 is $33,146, while median incomes of families and households are $81,779 and $68,442 respectively.
| Characteristic | Number | Measure |
| Per Capita Income | 843,690 | $33,146 |
| Median Family Income | 213,958 | $81,779 |
| Mean Family Income | 213,958 | $6,305,668 |
| Median Household Income | 325,857 | $68,442 |
| Mean Household Income | 325,857 | $5,476,508 |
| Income Deficit | 213,958 | $10,932 |
| Wage / Income Gap (%) | 843,690 | 38.34% |
| Wage / Income Gap ($) | 843,690 | 61.66¢ per $1 |
| Gini / Inequality Index | 843,690 | 26.69 |
Earnings by Sex in Area Code 219
Average Earnings in Area Code 219 are $40,087, $50,609 for men and $30,308 for women, a difference of 40.1%.
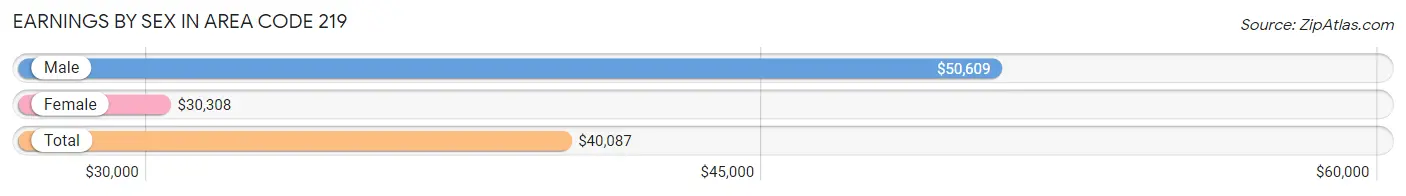
| Sex | Number | Average Earnings |
| Male | 224,632 (52.6%) | $50,609 |
| Female | 202,562 (47.4%) | $30,308 |
| Total | 427,194 (100.0%) | $40,087 |
Earnings by Sex by Income Bracket in Area Code 219
The most common earnings brackets in Area Code 219 are $100,000+ for men (42,346 | 18.9%) and $25,000 to $29,999 for women (14,956 | 7.4%).
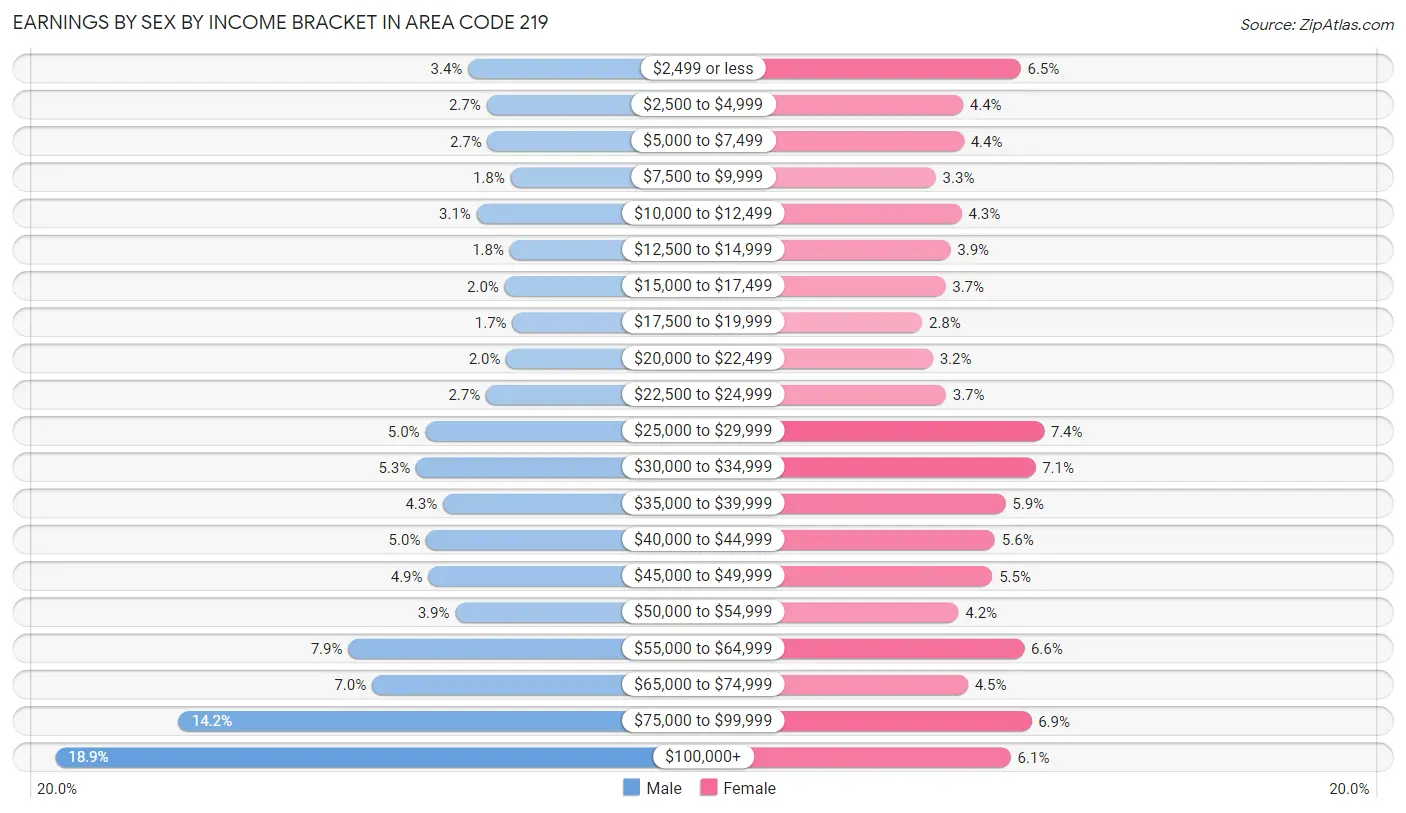
| Income | Male | Female |
| $2,499 or less | 7,593 (3.4%) | 13,193 (6.5%) |
| $2,500 to $4,999 | 6,045 (2.7%) | 8,810 (4.3%) |
| $5,000 to $7,499 | 5,943 (2.6%) | 8,879 (4.4%) |
| $7,500 to $9,999 | 4,028 (1.8%) | 6,747 (3.3%) |
| $10,000 to $12,499 | 6,864 (3.1%) | 8,708 (4.3%) |
| $12,500 to $14,999 | 4,085 (1.8%) | 7,868 (3.9%) |
| $15,000 to $17,499 | 4,525 (2.0%) | 7,472 (3.7%) |
| $17,500 to $19,999 | 3,863 (1.7%) | 5,711 (2.8%) |
| $20,000 to $22,499 | 4,376 (1.9%) | 6,516 (3.2%) |
| $22,500 to $24,999 | 6,092 (2.7%) | 7,519 (3.7%) |
| $25,000 to $29,999 | 11,193 (5.0%) | 14,956 (7.4%) |
| $30,000 to $34,999 | 11,971 (5.3%) | 14,307 (7.1%) |
| $35,000 to $39,999 | 9,701 (4.3%) | 12,033 (5.9%) |
| $40,000 to $44,999 | 11,114 (5.0%) | 11,251 (5.6%) |
| $45,000 to $49,999 | 10,933 (4.9%) | 11,048 (5.4%) |
| $50,000 to $54,999 | 8,671 (3.9%) | 8,464 (4.2%) |
| $55,000 to $64,999 | 17,673 (7.9%) | 13,457 (6.6%) |
| $65,000 to $74,999 | 15,680 (7.0%) | 9,184 (4.5%) |
| $75,000 to $99,999 | 31,936 (14.2%) | 13,999 (6.9%) |
| $100,000+ | 42,346 (18.9%) | 12,440 (6.1%) |
| Total | 224,632 (100.0%) | 202,562 (100.0%) |
Earnings by Sex by Educational Attainment in Area Code 219
Average earnings in Area Code 219 are $3,516,838 for men and $2,180,593 for women, a difference of 38.0%. Men with an educational attainment of college or associate's degree enjoy the highest average annual earnings of $3,499,472, while those with less than high school education earn the least with $1,777,194. Women with an educational attainment of graduate degree earn the most with the average annual earnings of $2,818,459, while those with less than high school education have the smallest earnings of $744,538.
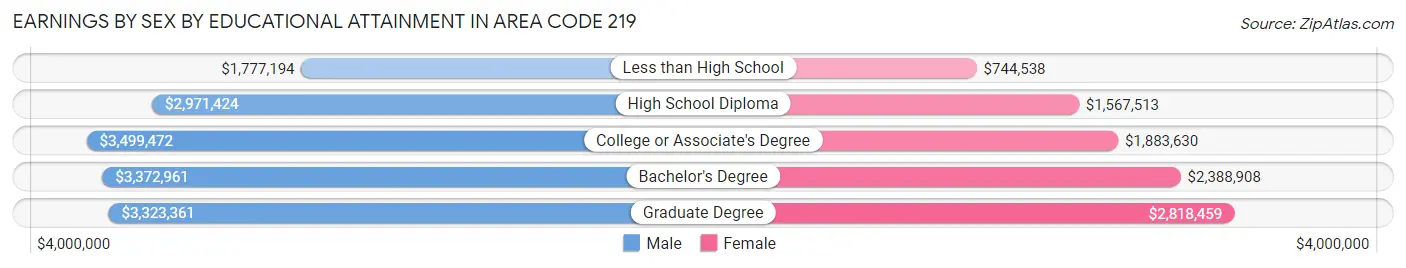
| Educational Attainment | Male Income | Female Income |
| Less than High School | $1,777,194 | $744,538 |
| High School Diploma | $2,971,424 | $1,567,513 |
| College or Associate's Degree | $3,499,472 | $1,883,630 |
| Bachelor's Degree | $3,372,961 | $2,388,908 |
| Graduate Degree | $3,323,361 | $2,818,459 |
| Total | $3,516,838 | $2,180,593 |
Family Income in Area Code 219
Family Income Brackets in Area Code 219
According to the Area Code 219 family income data, there are 2,899,773 families falling into the $100,000 to $149,999 income range, which is the most common income bracket and makes up 1,355.3% of all families. Conversely, the $10,000 to $14,999 income bracket is the least frequent group with only 319,653 families (149.4%) belonging to this category.
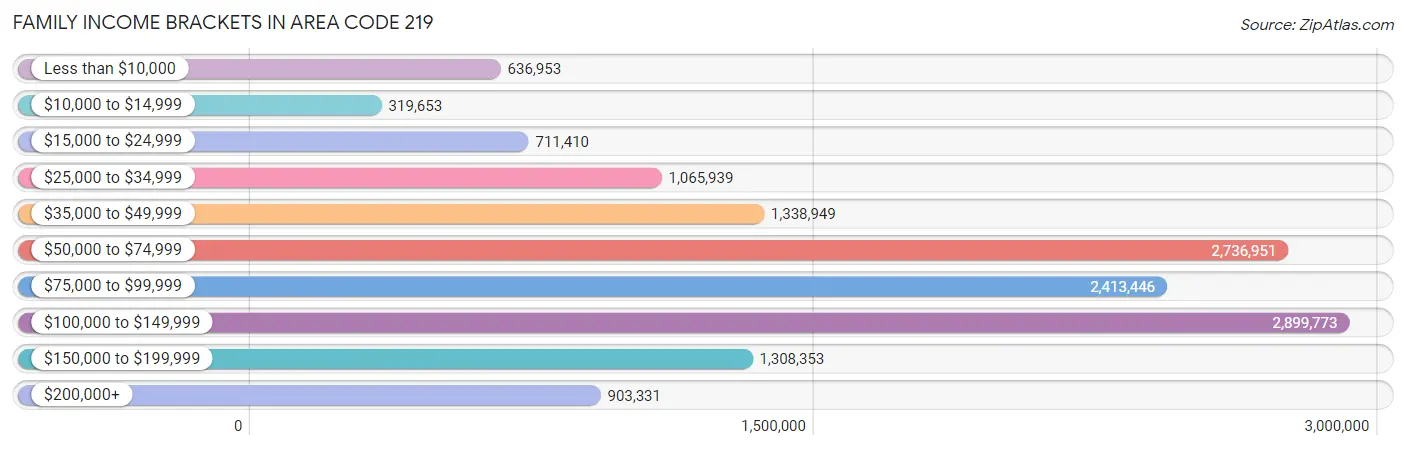
| Income Bracket | # Families | % Families |
| Less than $10,000 | 636,953 | 297.7% |
| $10,000 to $14,999 | 319,653 | 149.4% |
| $15,000 to $24,999 | 711,410 | 332.5% |
| $25,000 to $34,999 | 1,065,939 | 498.2% |
| $35,000 to $49,999 | 1,338,949 | 625.8% |
| $50,000 to $74,999 | 2,736,951 | 1,279.2% |
| $75,000 to $99,999 | 2,413,446 | 1,128.0% |
| $100,000 to $149,999 | 2,899,773 | 1,355.3% |
| $150,000 to $199,999 | 1,308,353 | 611.5% |
| $200,000+ | 903,331 | 422.2% |
Family Income by Famaliy Size in Area Code 219
7+ person families (3,098 | 1.5%) account for the highest median family income in Area Code 219 with $129,371 per family, while 2-person families (100,041 | 46.8%) have the highest median income of $36,799 per family member.
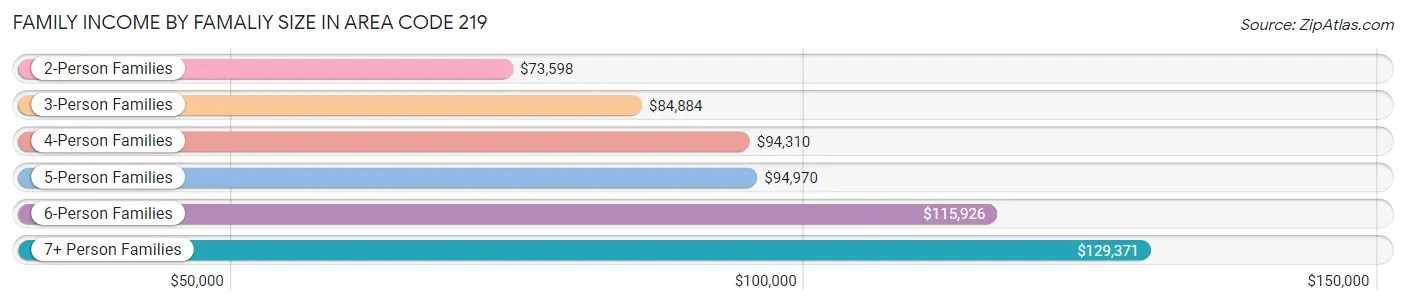
| Income Bracket | # Families | Median Income |
| 2-Person Families | 100,041 (46.8%) | $73,598 |
| 3-Person Families | 47,537 (22.2%) | $84,884 |
| 4-Person Families | 38,930 (18.2%) | $94,310 |
| 5-Person Families | 17,863 (8.4%) | $94,970 |
| 6-Person Families | 6,489 (3.0%) | $115,926 |
| 7+ Person Families | 3,098 (1.5%) | $129,371 |
| Total | 213,958 (100.0%) | $81,779 |
Family Income by Number of Earners in Area Code 219
The median family income in Area Code 219 is $81,779, with families comprising 3+ earners (24,857) having the highest median family income of $140,000, while families with no earners (35,126) have the lowest median family income of $46,796, accounting for 11.6% and 16.4% of families, respectively.
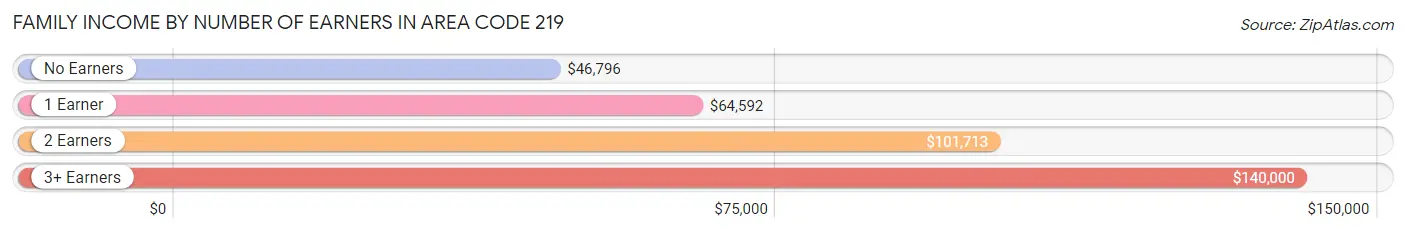
| Number of Earners | # Families | Median Income |
| No Earners | 35,126 (16.4%) | $46,796 |
| 1 Earner | 71,634 (33.5%) | $64,592 |
| 2 Earners | 82,341 (38.5%) | $101,713 |
| 3+ Earners | 24,857 (11.6%) | $140,000 |
| Total | 213,958 (100.0%) | $81,779 |
Household Income in Area Code 219
Household Income Brackets in Area Code 219
With 4,147,182 households falling in the category, the $50,000 to $74,999 income range is the most frequent in Area Code 219, accounting for 1,272.7% of all households. In contrast, only 744,909 households (228.6%) fall into the $10,000 to $14,999 income bracket, making it the least populous group.
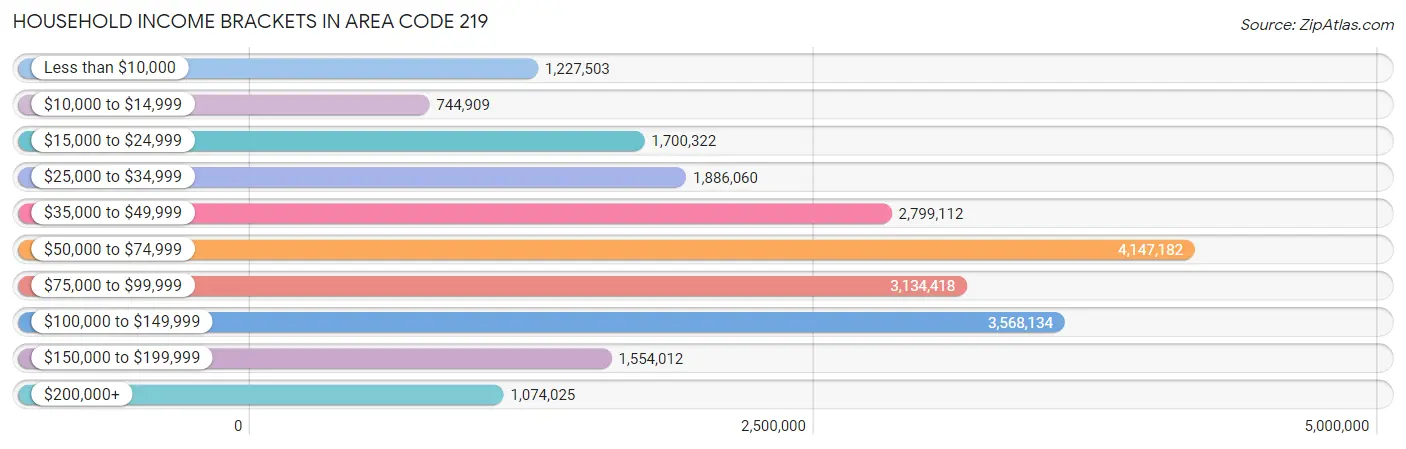
| Income Bracket | # Households | % Households |
| Less than $10,000 | 1,227,503 | 376.7% |
| $10,000 to $14,999 | 744,909 | 228.6% |
| $15,000 to $24,999 | 1,700,322 | 521.8% |
| $25,000 to $34,999 | 1,886,060 | 578.8% |
| $35,000 to $49,999 | 2,799,112 | 859.0% |
| $50,000 to $74,999 | 4,147,182 | 1,272.7% |
| $75,000 to $99,999 | 3,134,418 | 961.9% |
| $100,000 to $149,999 | 3,568,134 | 1,095.0% |
| $150,000 to $199,999 | 1,554,012 | 476.9% |
| $200,000+ | 1,074,025 | 329.6% |
Household Income by Householder Age in Area Code 219
The median household income in Area Code 219 is $68,442, with the highest median household income of $81,942 found in the 45 to 64 years age bracket for the primary householder. A total of 124,859 households (38.3%) fall into this category. Meanwhile, the 65+ years age bracket for the primary householder has the lowest median household income of $51,081, with 92,650 households (28.4%) in this group.
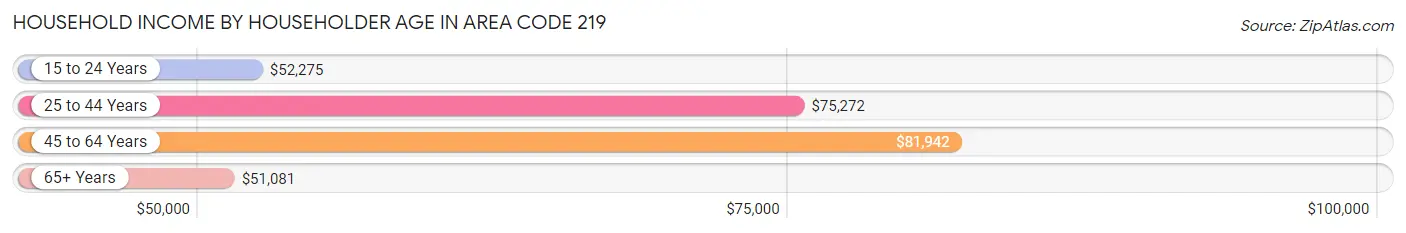
| Income Bracket | # Households | Median Income |
| 15 to 24 Years | 9,386 (2.9%) | $52,275 |
| 25 to 44 Years | 98,962 (30.4%) | $75,272 |
| 45 to 64 Years | 124,859 (38.3%) | $81,942 |
| 65+ Years | 92,650 (28.4%) | $51,081 |
| Total | 325,857 (100.0%) | $68,442 |
Poverty in Area Code 219
Income Below Poverty by Sex and Age in Area Code 219
With 11.7% poverty level for males and 14.7% for females among the residents of Area Code 219, 15 year old males and 5 year old females are the most vulnerable to poverty, with 1,454 males (22.8%) and 1,249 females (24.1%) in their respective age groups living below the poverty level.

| Age Bracket | Male | Female |
| Under 5 Years | 4,977 (20.8%) | 4,725 (20.5%) |
| 5 Years | 955 (19.3%) | 1,249 (24.1%) |
| 6 to 11 Years | 7,032 (21.5%) | 5,874 (19.2%) |
| 12 to 14 Years | 2,690 (15.8%) | 3,318 (20.1%) |
| 15 Years | 1,454 (22.8%) | 1,194 (20.5%) |
| 16 and 17 Years | 2,226 (19.2%) | 2,016 (17.7%) |
| 18 to 24 Years | 5,264 (14.5%) | 6,453 (19.3%) |
| 25 to 34 Years | 4,634 (9.3%) | 8,775 (17.4%) |
| 35 to 44 Years | 5,036 (9.6%) | 8,661 (16.0%) |
| 45 to 54 Years | 4,086 (8.0%) | 5,373 (10.2%) |
| 55 to 64 Years | 4,895 (8.8%) | 6,474 (11.1%) |
| 65 to 74 Years | 2,795 (6.9%) | 4,079 (9.0%) |
| 75 Years and over | 1,280 (5.7%) | 3,569 (10.7%) |
| Total | 47,324 (11.7%) | 61,760 (14.7%) |
Income Above Poverty by Sex and Age in Area Code 219
According to the poverty statistics in Area Code 219, males aged 75 years and over and females aged 65 to 74 years are the age groups that are most secure financially, with 94.3% of males and 91.0% of females in these age groups living above the poverty line.
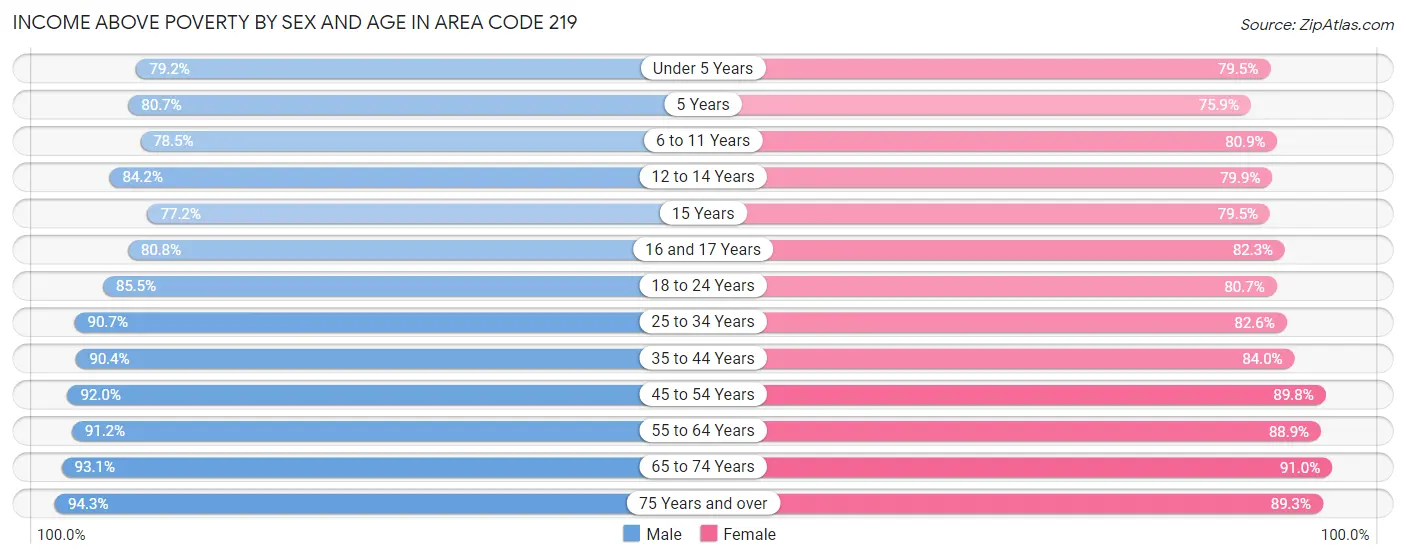
| Age Bracket | Male | Female |
| Under 5 Years | 18,998 (79.2%) | 18,306 (79.5%) |
| 5 Years | 4,000 (80.7%) | 3,935 (75.9%) |
| 6 to 11 Years | 25,740 (78.5%) | 24,799 (80.8%) |
| 12 to 14 Years | 14,361 (84.2%) | 13,181 (79.9%) |
| 15 Years | 4,913 (77.2%) | 4,619 (79.5%) |
| 16 and 17 Years | 9,391 (80.8%) | 9,342 (82.3%) |
| 18 to 24 Years | 30,999 (85.5%) | 26,947 (80.7%) |
| 25 to 34 Years | 45,321 (90.7%) | 41,507 (82.6%) |
| 35 to 44 Years | 47,407 (90.4%) | 45,498 (84.0%) |
| 45 to 54 Years | 47,205 (92.0%) | 47,269 (89.8%) |
| 55 to 64 Years | 50,855 (91.2%) | 52,023 (88.9%) |
| 65 to 74 Years | 37,856 (93.1%) | 41,187 (91.0%) |
| 75 Years and over | 21,281 (94.3%) | 29,685 (89.3%) |
| Total | 358,327 (88.3%) | 358,298 (85.3%) |
Income Below Poverty Among Married-Couple Families in Area Code 219
The poverty statistics for married-couple families in Area Code 219 show that 3.8% or 5,762 of the total 150,646 families live below the poverty line. Families with 5 or more children have the highest poverty rate of 21.1%, comprising of 211 families. On the other hand, families with no children have the lowest poverty rate of 2.6%, which includes 2,378 families.
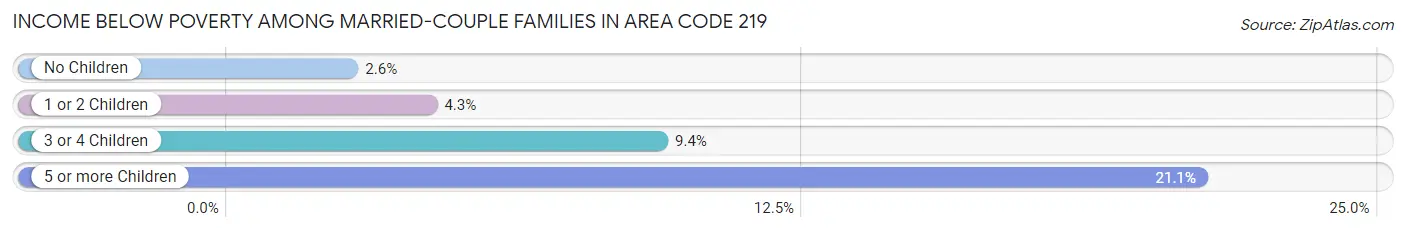
| Children | Above Poverty | Below Poverty |
| No Children | 88,502 (97.4%) | 2,378 (2.6%) |
| 1 or 2 Children | 44,310 (95.7%) | 2,008 (4.3%) |
| 3 or 4 Children | 11,283 (90.6%) | 1,165 (9.4%) |
| 5 or more Children | 789 (78.9%) | 211 (21.1%) |
| Total | 144,884 (96.2%) | 5,762 (3.8%) |
Income Below Poverty Among Single-Parent Households in Area Code 219
According to the poverty data in Area Code 219, 16.3% or 3,173 single-father households and 28.6% or 12,542 single-mother households are living below the poverty line. Among single-father households, those with 3 or 4 children have the highest poverty rate, with 523 households (29.4%) experiencing poverty. Likewise, among single-mother households, those with 5 or more children have the highest poverty rate, with 678 households (88.4%) falling below the poverty line.
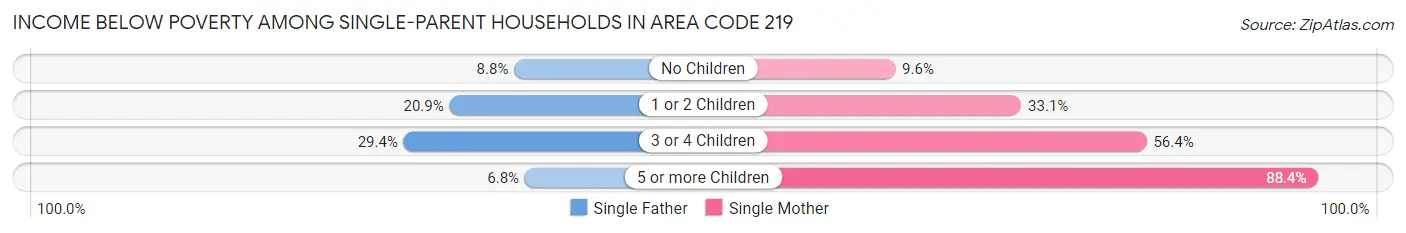
| Children | Single Father | Single Mother |
| No Children | 739 (8.8%) | 1,453 (9.6%) |
| 1 or 2 Children | 1,898 (20.8%) | 7,555 (33.1%) |
| 3 or 4 Children | 523 (29.4%) | 2,856 (56.4%) |
| 5 or more Children | 13 (6.8%) | 678 (88.4%) |
| Total | 3,173 (16.3%) | 12,542 (28.6%) |
Income Below Poverty Among Married-Couple vs Single-Parent Households in Area Code 219
The poverty data for Area Code 219 shows that 5,762 of the married-couple family households (3.8%) and 15,715 of the single-parent households (24.8%) are living below the poverty level. Within the married-couple family households, those with 5 or more children have the highest poverty rate, with 211 households (21.1%) falling below the poverty line. Among the single-parent households, those with 5 or more children have the highest poverty rate, with 691 household (72.1%) living below poverty.
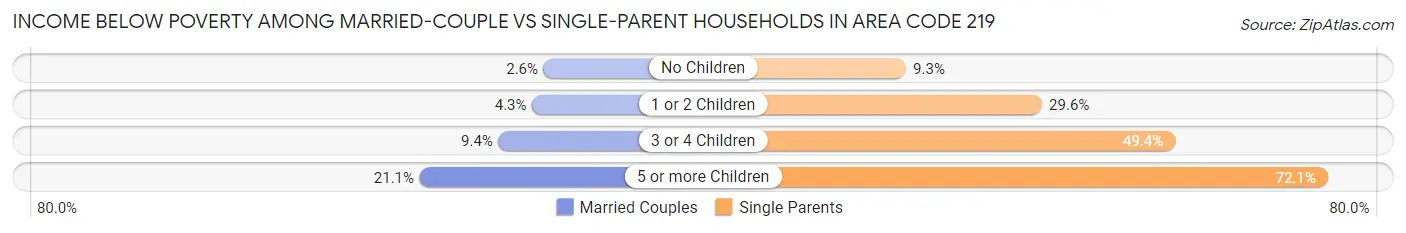
| Children | Married-Couple Families | Single-Parent Households |
| No Children | 2,378 (2.6%) | 2,192 (9.3%) |
| 1 or 2 Children | 2,008 (4.3%) | 9,453 (29.6%) |
| 3 or 4 Children | 1,165 (9.4%) | 3,379 (49.4%) |
| 5 or more Children | 211 (21.1%) | 691 (72.1%) |
| Total | 5,762 (3.8%) | 15,715 (24.8%) |
Race in Area Code 219
The most populous races in Area Code 219 are White / Caucasian (586,025 | 69.5%), Black / African American (135,607 | 16.1%), and Hispanic or Latino (131,415 | 15.6%).
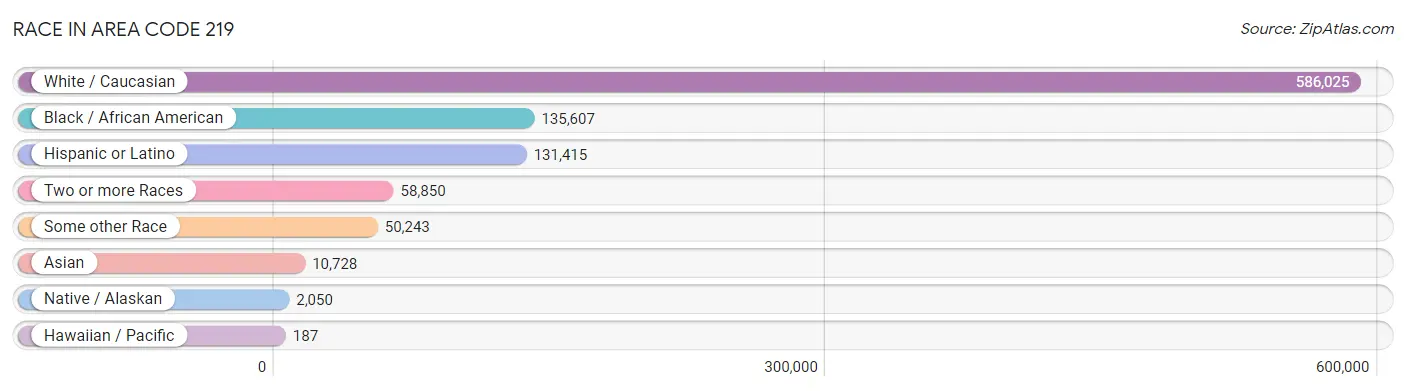
| Race | # Population | % Population |
| Asian | 10,728 | 1.3% |
| Black / African American | 135,607 | 16.1% |
| Hawaiian / Pacific | 187 | 0.0% |
| Hispanic or Latino | 131,415 | 15.6% |
| Native / Alaskan | 2,050 | 0.2% |
| White / Caucasian | 586,025 | 69.5% |
| Two or more Races | 58,850 | 7.0% |
| Some other Race | 50,243 | 6.0% |
| Total | 843,690 | 100.0% |
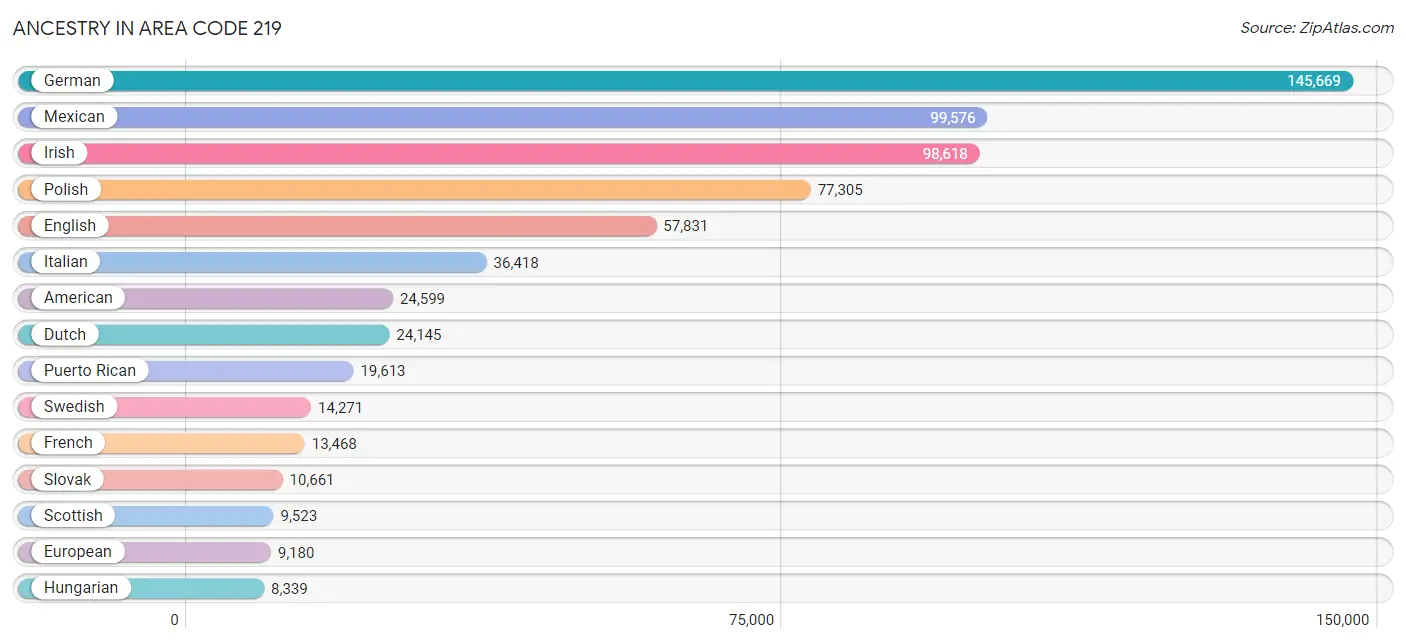
Ancestry in Area Code 219
The most populous ancestries reported in Area Code 219 are German (145,669 | 17.3%), Mexican (99,576 | 11.8%), Irish (98,618 | 11.7%), Polish (77,305 | 9.2%), and English (57,831 | 6.9%), together accounting for 56.8% of all Area Code 219 residents.
| Ancestry | # Population | % Population |
| African | 1,943 | 0.2% |
| Alaska Native | 6 | 0.0% |
| Alaskan Athabascan | 31 | 0.0% |
| Albanian | 88 | 0.0% |
| Aleut | 26 | 0.0% |
| American | 24,599 | 2.9% |
| Apache | 198 | 0.0% |
| Arab | 4,432 | 0.5% |
| Argentinean | 180 | 0.0% |
| Armenian | 304 | 0.0% |
| Assyrian / Chaldean / Syriac | 76 | 0.0% |
| Australian | 185 | 0.0% |
| Austrian | 1,369 | 0.2% |
| Bahamian | 43 | 0.0% |
| Barbadian | 2 | 0.0% |
| Basque | 34 | 0.0% |
| Belgian | 937 | 0.1% |
| Belizean | 43 | 0.0% |
| Bhutanese | 929 | 0.1% |
| Blackfeet | 469 | 0.1% |
| Bolivian | 51 | 0.0% |
| Brazilian | 240 | 0.0% |
| British | 2,748 | 0.3% |
| Bulgarian | 733 | 0.1% |
| Burmese | 1,425 | 0.2% |
| Cajun | 6 | 0.0% |
| Cambodian | 24 | 0.0% |
| Canadian | 1,430 | 0.2% |
| Cape Verdean | 72 | 0.0% |
| Carpatho Rusyn | 33 | 0.0% |
| Celtic | 40 | 0.0% |
| Central American | 3,440 | 0.4% |
| Central American Indian | 647 | 0.1% |
| Cherokee | 2,375 | 0.3% |
| Cheyenne | 5 | 0.0% |
| Chickasaw | 17 | 0.0% |
| Chilean | 107 | 0.0% |
| Chippewa | 179 | 0.0% |
| Choctaw | 272 | 0.0% |
| Colombian | 704 | 0.1% |
| Comanche | 17 | 0.0% |
| Costa Rican | 101 | 0.0% |
| Cree | 9 | 0.0% |
| Creek | 37 | 0.0% |
| Croatian | 6,439 | 0.8% |
| Cuban | 754 | 0.1% |
| Czech | 4,924 | 0.6% |
| Czechoslovakian | 983 | 0.1% |
| Danish | 1,704 | 0.2% |
| Delaware | 22 | 0.0% |
| Dominican | 685 | 0.1% |
| Dutch | 24,145 | 2.9% |
| Eastern European | 1,693 | 0.2% |
| Ecuadorian | 149 | 0.0% |
| Egyptian | 76 | 0.0% |
| English | 57,831 | 6.9% |
| Estonian | 39 | 0.0% |
| Ethiopian | 210 | 0.0% |
| European | 9,180 | 1.1% |
| Filipino | 72 | 0.0% |
| Finnish | 742 | 0.1% |
| French | 13,468 | 1.6% |
| French American Indian | 32 | 0.0% |
| French Canadian | 1,994 | 0.2% |
| German | 145,669 | 17.3% |
| Ghanaian | 127 | 0.0% |
| Greek | 7,839 | 0.9% |
| Guamanian / Chamorro | 167 | 0.0% |
| Guatemalan | 859 | 0.1% |
| Guyanese | 102 | 0.0% |
| Haitian | 266 | 0.0% |
| Honduran | 645 | 0.1% |
| Hungarian | 8,339 | 1.0% |
| Icelander | 20 | 0.0% |
| Indian (Asian) | 2,423 | 0.3% |
| Indonesian | 246 | 0.0% |
| Iranian | 35 | 0.0% |
| Irish | 98,618 | 11.7% |
| Iroquois | 122 | 0.0% |
| Israeli | 88 | 0.0% |
| Italian | 36,418 | 4.3% |
| Jamaican | 436 | 0.1% |
| Japanese | 45 | 0.0% |
| Jordanian | 532 | 0.1% |
| Korean | 4,017 | 0.5% |
| Laotian | 64 | 0.0% |
| Latvian | 69 | 0.0% |
| Lebanese | 991 | 0.1% |
| Liberian | 6 | 0.0% |
| Lithuanian | 3,457 | 0.4% |
| Lumbee | 75 | 0.0% |
| Luxembourger | 200 | 0.0% |
| Macedonian | 2,242 | 0.3% |
| Maltese | 11 | 0.0% |
| Menominee | 25 | 0.0% |
| Mexican | 99,576 | 11.8% |
| Mexican American Indian | 1,025 | 0.1% |
| Mongolian | 12 | 0.0% |
| Moroccan | 86 | 0.0% |
| Native Hawaiian | 197 | 0.0% |
| Navajo | 159 | 0.0% |
| New Zealander | 31 | 0.0% |
| Nicaraguan | 119 | 0.0% |
| Nigerian | 904 | 0.1% |
| Northern European | 513 | 0.1% |
| Norwegian | 5,074 | 0.6% |
| Osage | 38 | 0.0% |
| Ottawa | 24 | 0.0% |
| Paiute | 8 | 0.0% |
| Pakistani | 293 | 0.0% |
| Palestinian | 465 | 0.1% |
| Panamanian | 219 | 0.0% |
| Pennsylvania German | 347 | 0.0% |
| Peruvian | 341 | 0.0% |
| Polish | 77,305 | 9.2% |
| Portuguese | 315 | 0.0% |
| Potawatomi | 156 | 0.0% |
| Pueblo | 97 | 0.0% |
| Puerto Rican | 19,613 | 2.3% |
| Romanian | 2,404 | 0.3% |
| Russian | 3,934 | 0.5% |
| Salvadoran | 1,497 | 0.2% |
| Samoan | 76 | 0.0% |
| Scandinavian | 1,737 | 0.2% |
| Scotch-Irish | 4,636 | 0.5% |
| Scottish | 9,523 | 1.1% |
| Seminole | 2 | 0.0% |
| Serbian | 6,638 | 0.8% |
| Sioux | 176 | 0.0% |
| Slavic | 403 | 0.1% |
| Slovak | 10,661 | 1.3% |
| Slovene | 471 | 0.1% |
| Somali | 10 | 0.0% |
| South African | 50 | 0.0% |
| South American | 1,873 | 0.2% |
| South American Indian | 49 | 0.0% |
| Spaniard | 1,962 | 0.2% |
| Spanish | 1,528 | 0.2% |
| Spanish American Indian | 50 | 0.0% |
| Sri Lankan | 927 | 0.1% |
| Subsaharan African | 3,536 | 0.4% |
| Sudanese | 34 | 0.0% |
| Swedish | 14,271 | 1.7% |
| Swiss | 1,847 | 0.2% |
| Syrian | 333 | 0.0% |
| Thai | 3,431 | 0.4% |
| Tongan | 39 | 0.0% |
| Trinidadian and Tobagonian | 38 | 0.0% |
| Turkish | 401 | 0.1% |
| Ugandan | 5 | 0.0% |
| Ukrainian | 2,433 | 0.3% |
| Uruguayan | 78 | 0.0% |
| Ute | 38 | 0.0% |
| Venezuelan | 229 | 0.0% |
| Vietnamese | 78 | 0.0% |
| Welsh | 2,772 | 0.3% |
| West Indian | 151 | 0.0% |
| Yugoslavian | 575 | 0.1% |
| Zimbabwean | 15 | 0.0% | View All 159 Rows |
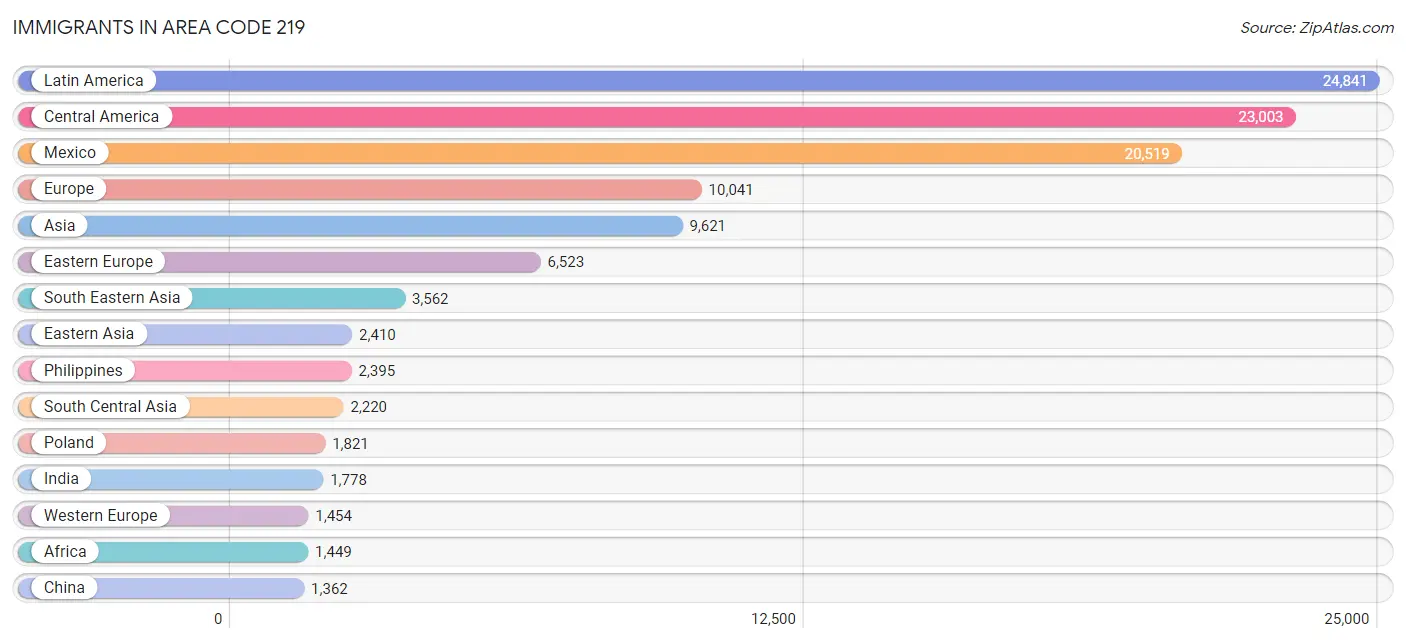
Immigrants in Area Code 219
The most numerous immigrant groups reported in Area Code 219 came from Latin America (24,841 | 2.9%), Central America (23,003 | 2.7%), Mexico (20,519 | 2.4%), Europe (10,041 | 1.2%), and Asia (9,621 | 1.1%), together accounting for 10.4% of all Area Code 219 residents.
| Immigration Origin | # Population | % Population |
| Africa | 1,449 | 0.2% |
| Albania | 14 | 0.0% |
| Argentina | 109 | 0.0% |
| Asia | 9,621 | 1.1% |
| Australia | 117 | 0.0% |
| Austria | 23 | 0.0% |
| Bahamas | 18 | 0.0% |
| Bangladesh | 76 | 0.0% |
| Belgium | 45 | 0.0% |
| Bolivia | 27 | 0.0% |
| Bosnia and Herzegovina | 322 | 0.0% |
| Brazil | 109 | 0.0% |
| Bulgaria | 389 | 0.1% |
| Cambodia | 17 | 0.0% |
| Canada | 896 | 0.1% |
| Caribbean | 910 | 0.1% |
| Central America | 23,003 | 2.7% |
| China | 1,362 | 0.2% |
| Colombia | 112 | 0.0% |
| Congo | 9 | 0.0% |
| Costa Rica | 50 | 0.0% |
| Croatia | 745 | 0.1% |
| Cuba | 156 | 0.0% |
| Czechoslovakia | 149 | 0.0% |
| Dominican Republic | 234 | 0.0% |
| Eastern Africa | 373 | 0.0% |
| Eastern Asia | 2,410 | 0.3% |
| Eastern Europe | 6,523 | 0.8% |
| Ecuador | 67 | 0.0% |
| Egypt | 75 | 0.0% |
| El Salvador | 1,191 | 0.1% |
| England | 399 | 0.1% |
| Eritrea | 9 | 0.0% |
| Ethiopia | 225 | 0.0% |
| Europe | 10,041 | 1.2% |
| France | 66 | 0.0% |
| Germany | 1,260 | 0.2% |
| Ghana | 137 | 0.0% |
| Greece | 540 | 0.1% |
| Guatemala | 728 | 0.1% |
| Guyana | 50 | 0.0% |
| Haiti | 97 | 0.0% |
| Honduras | 331 | 0.0% |
| Hong Kong | 65 | 0.0% |
| Hungary | 216 | 0.0% |
| India | 1,778 | 0.2% |
| Indonesia | 124 | 0.0% |
| Iran | 16 | 0.0% |
| Iraq | 14 | 0.0% |
| Ireland | 200 | 0.0% |
| Israel | 92 | 0.0% |
| Italy | 251 | 0.0% |
| Jamaica | 334 | 0.0% |
| Japan | 171 | 0.0% |
| Jordan | 412 | 0.1% |
| Kazakhstan | 18 | 0.0% |
| Korea | 877 | 0.1% |
| Kuwait | 229 | 0.0% |
| Latin America | 24,841 | 2.9% |
| Latvia | 15 | 0.0% |
| Lebanon | 141 | 0.0% |
| Lithuania | 113 | 0.0% |
| Malaysia | 59 | 0.0% |
| Mexico | 20,519 | 2.4% |
| Middle Africa | 34 | 0.0% |
| Moldova | 12 | 0.0% |
| Morocco | 58 | 0.0% |
| Nepal | 7 | 0.0% |
| Netherlands | 58 | 0.0% |
| Nicaragua | 55 | 0.0% |
| Nigeria | 469 | 0.1% |
| North Macedonia | 855 | 0.1% |
| Northern Africa | 292 | 0.0% |
| Northern Europe | 877 | 0.1% |
| Oceania | 158 | 0.0% |
| Pakistan | 325 | 0.0% |
| Panama | 111 | 0.0% |
| Peru | 220 | 0.0% |
| Philippines | 2,395 | 0.3% |
| Poland | 1,821 | 0.2% |
| Romania | 310 | 0.0% |
| Russia | 266 | 0.0% |
| Saudi Arabia | 19 | 0.0% |
| Scotland | 35 | 0.0% |
| Serbia | 572 | 0.1% |
| Singapore | 27 | 0.0% |
| South Africa | 51 | 0.0% |
| South America | 928 | 0.1% |
| South Central Asia | 2,220 | 0.3% |
| South Eastern Asia | 3,562 | 0.4% |
| Southern Europe | 1,122 | 0.1% |
| Spain | 271 | 0.0% |
| Sudan | 13 | 0.0% |
| Sweden | 4 | 0.0% |
| Syria | 248 | 0.0% |
| Taiwan | 140 | 0.0% |
| Thailand | 166 | 0.0% |
| Trinidad and Tobago | 71 | 0.0% |
| Turkey | 100 | 0.0% |
| Uganda | 14 | 0.0% |
| Ukraine | 61 | 0.0% |
| Uruguay | 5 | 0.0% |
| Venezuela | 191 | 0.0% |
| Vietnam | 573 | 0.1% |
| Western Africa | 674 | 0.1% |
| Western Asia | 1,312 | 0.2% |
| Western Europe | 1,454 | 0.2% |
| Yemen | 8 | 0.0% | View All 108 Rows |
Sex and Age in Area Code 219
Sex and Age in Area Code 219
The most populous age groups in Area Code 219 are 15 to 19 Years (29,127 | 7.0%) for men and 60 to 64 Years (30,465 | 7.1%) for women.
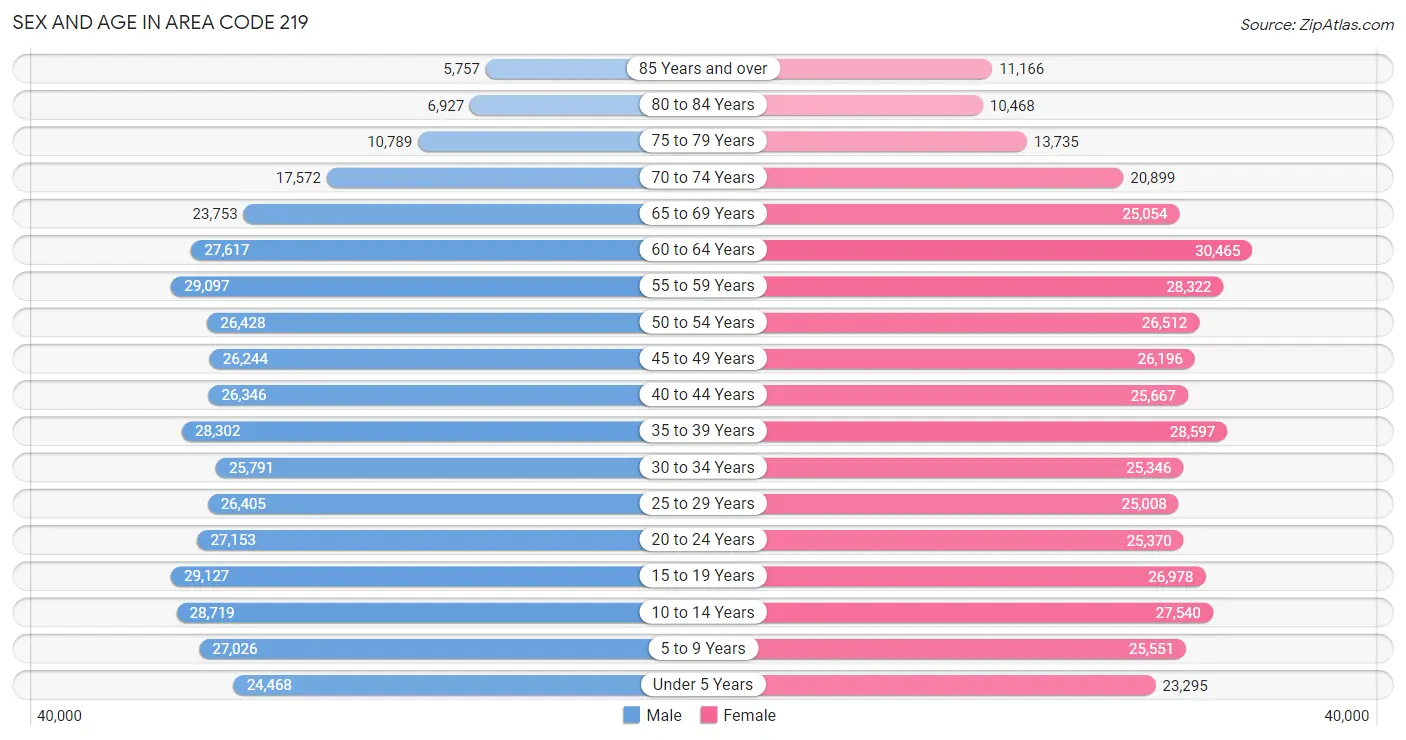
| Age Bracket | Male | Female |
| Under 5 Years | 24,468 (5.9%) | 23,295 (5.5%) |
| 5 to 9 Years | 27,026 (6.5%) | 25,551 (6.0%) |
| 10 to 14 Years | 28,719 (6.9%) | 27,540 (6.5%) |
| 15 to 19 Years | 29,127 (7.0%) | 26,978 (6.3%) |
| 20 to 24 Years | 27,153 (6.5%) | 25,370 (5.9%) |
| 25 to 29 Years | 26,405 (6.3%) | 25,008 (5.9%) |
| 30 to 34 Years | 25,791 (6.2%) | 25,346 (5.9%) |
| 35 to 39 Years | 28,302 (6.8%) | 28,597 (6.7%) |
| 40 to 44 Years | 26,346 (6.3%) | 25,667 (6.0%) |
| 45 to 49 Years | 26,244 (6.3%) | 26,196 (6.1%) |
| 50 to 54 Years | 26,428 (6.3%) | 26,512 (6.2%) |
| 55 to 59 Years | 29,097 (7.0%) | 28,322 (6.7%) |
| 60 to 64 Years | 27,617 (6.6%) | 30,465 (7.1%) |
| 65 to 69 Years | 23,753 (5.7%) | 25,054 (5.9%) |
| 70 to 74 Years | 17,572 (4.2%) | 20,899 (4.9%) |
| 75 to 79 Years | 10,789 (2.6%) | 13,735 (3.2%) |
| 80 to 84 Years | 6,927 (1.7%) | 10,468 (2.5%) |
| 85 Years and over | 5,757 (1.4%) | 11,166 (2.6%) |
| Total | 417,521 (100.0%) | 426,169 (100.0%) |
Families and Households in Area Code 219
Median Family Size in Area Code 219
The median family size in Area Code 219 is 3.10 persons per family, with married-couple families (150,646 | 70.4%) accounting for the largest median family size of 3.13492 persons per family. On the other hand, single male/father families (19,473 | 9.1%) represent the smallest median family size with 2.99 persons per family.
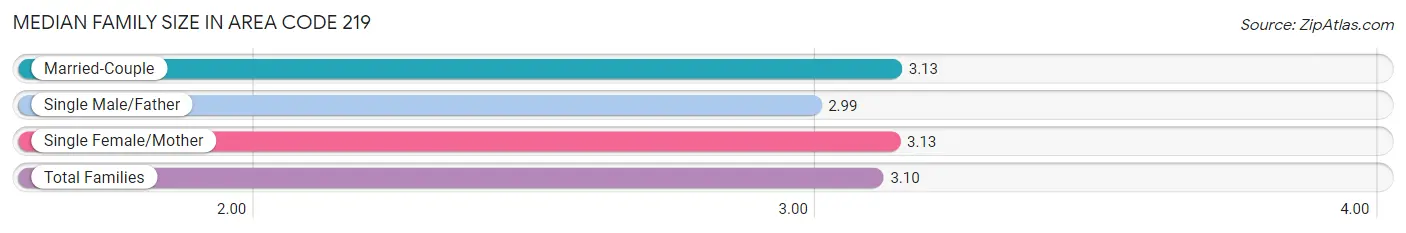
| Family Type | # Families | Family Size |
| Married-Couple | 150,646 (70.4%) | 3.13 |
| Single Male/Father | 19,473 (9.1%) | 2.99 |
| Single Female/Mother | 43,839 (20.5%) | 3.13 |
| Total Families | 213,958 (100.0%) | 3.10 |
Median Household Size in Area Code 219
The median household size in Area Code 219 is 2.53 persons per household, with single male/father households (19,473 | 6.0%) accounting for the largest median household size of 3.40135 persons per household. non-family households (111,899 | 34.3%) represent the smallest median household size with 1.24 persons per household.
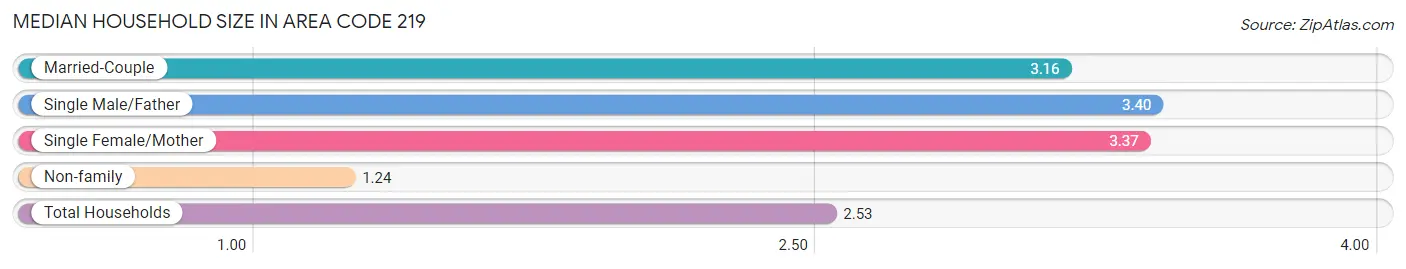
| Household Type | # Households | Household Size |
| Married-Couple | 150,646 (46.2%) | 3.16 |
| Single Male/Father | 19,473 (6.0%) | 3.40 |
| Single Female/Mother | 43,839 (13.5%) | 3.37 |
| Non-family | 111,899 (34.3%) | 1.24 |
| Total Households | 325,857 (100.0%) | 2.53 |
Household Size by Marriage Status in Area Code 219
Out of a total of 325,857 households in Area Code 219, 213,958 (65.7%) are family households, while 111,899 (34.3%) are nonfamily households. The most numerous type of family households are 2-person households, comprising 93,724, and the most common type of nonfamily households are 1-person households, comprising 93,401.
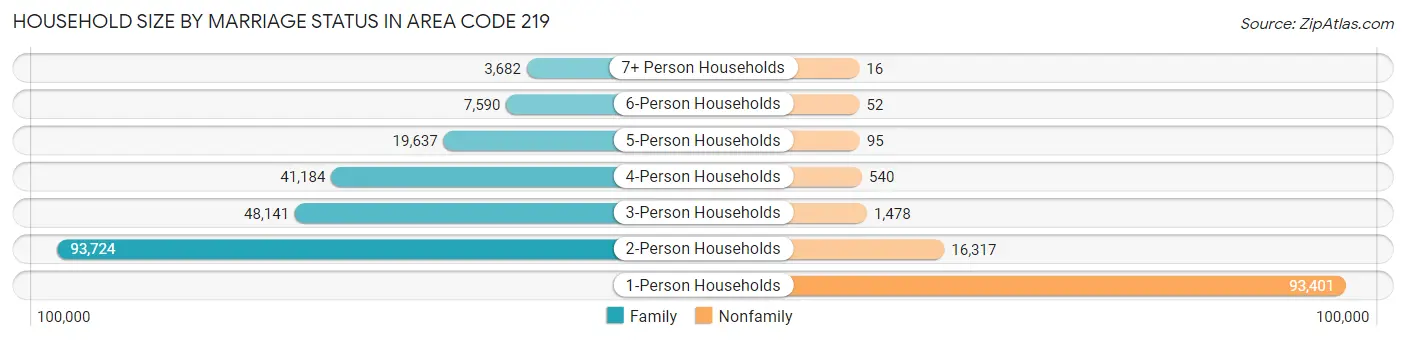
| Household Size | Family Households | Nonfamily Households |
| 1-Person Households | - | 93,401 (28.7%) |
| 2-Person Households | 93,724 (28.8%) | 16,317 (5.0%) |
| 3-Person Households | 48,141 (14.8%) | 1,478 (0.4%) |
| 4-Person Households | 41,184 (12.6%) | 540 (0.2%) |
| 5-Person Households | 19,637 (6.0%) | 95 (0.0%) |
| 6-Person Households | 7,590 (2.3%) | 52 (0.0%) |
| 7+ Person Households | 3,682 (1.1%) | 16 (0.0%) |
| Total | 213,958 (65.7%) | 111,899 (34.3%) |
Female Fertility in Area Code 219
Fertility by Age in Area Code 219
Average fertility rate in Area Code 219 is 73.3 births per 1,000 women. Women in the age bracket of 20 to 34 years have the highest fertility rate with 147.3 births per 1,000 women. Women in the age bracket of 20 to 34 years acount for 74.8% of all women with births.
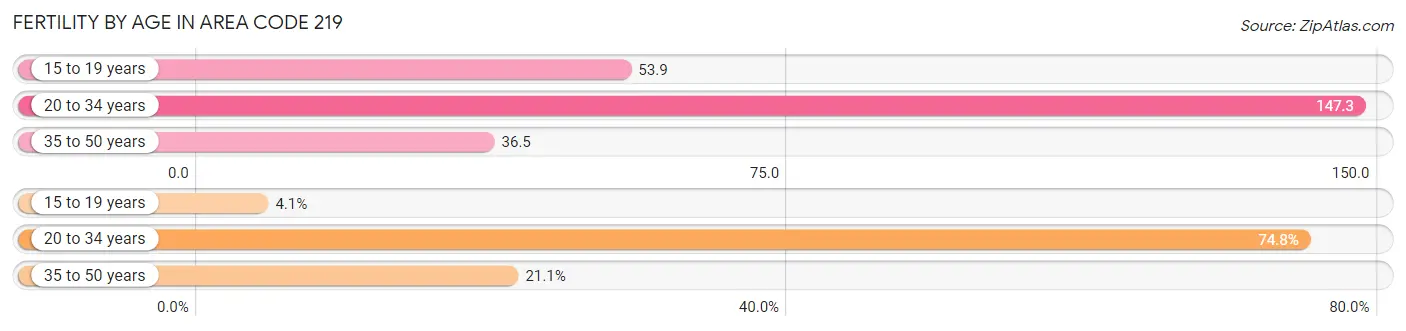
| Age Bracket | Women with Births | Births / 1,000 Women |
| 15 to 19 years | 458 (4.1%) | 53.9 |
| 20 to 34 years | 8,365 (74.8%) | 147.3 |
| 35 to 50 years | 2,355 (21.1%) | 36.5 |
| Total | 11,178 (100.0%) | 73.3 |
Fertility by Age by Marriage Status in Area Code 219
51.6% of women with births (11,178) in Area Code 219 are married. The highest percentage of unmarried women with births falls into 15 to 19 years age bracket with 98.0% of them unmarried at the time of birth, while the lowest percentage of unmarried women with births belong to 20 to 34 years age bracket with 54.2% of them unmarried.
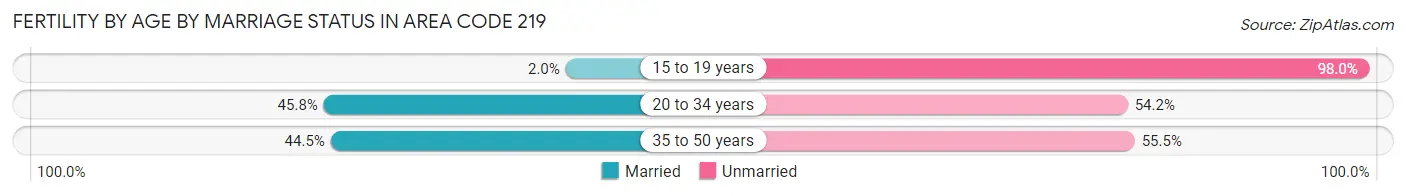
| Age Bracket | Married | Unmarried |
| 15 to 19 years | 9 (2.0%) | 449 (98.0%) |
| 20 to 34 years | 3,832 (45.8%) | 4,533 (54.2%) |
| 35 to 50 years | 1,049 (44.5%) | 1,306 (55.5%) |
| Total | 5,773 (51.6%) | 5,405 (48.3%) |
Fertility by Education in Area Code 219
Average fertility rate in Area Code 219 is 73.3 births per 1,000 women. Women with the education attainment of graduate degree have the highest fertility rate of 127.5 births per 1,000 women, while women with the education attainment of less than high school have the lowest fertility at 67.3 births per 1,000 women. Women with the education attainment of college or associate's degree represent 31.5% of all women with births.
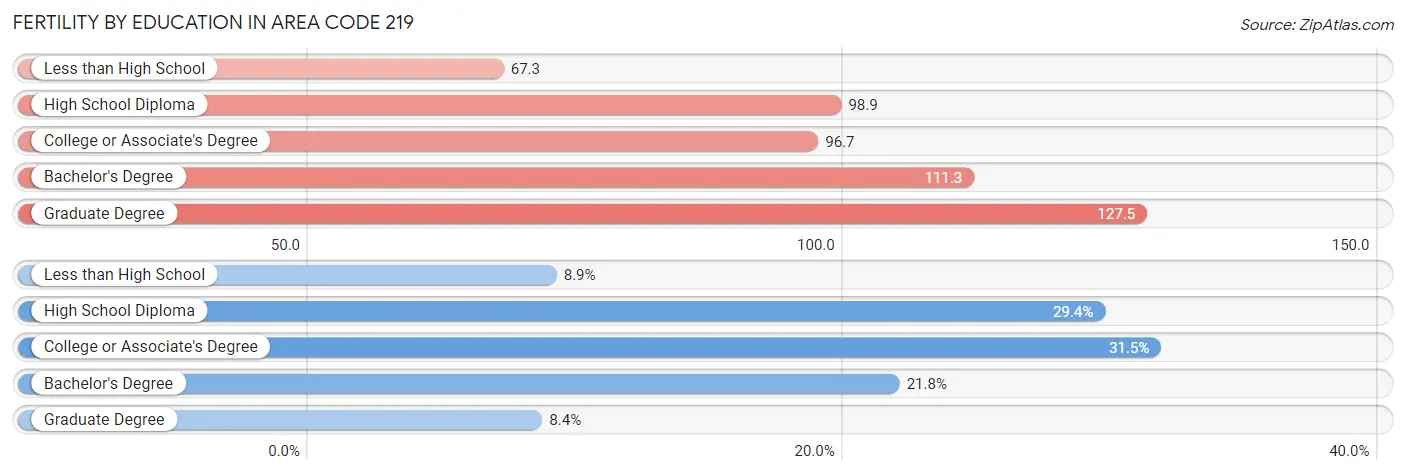
| Educational Attainment | Women with Births | Births / 1,000 Women |
| Less than High School | 995 (8.9%) | 67.3 |
| High School Diploma | 3,291 (29.4%) | 98.9 |
| College or Associate's Degree | 3,526 (31.5%) | 96.7 |
| Bachelor's Degree | 2,431 (21.7%) | 111.3 |
| Graduate Degree | 935 (8.4%) | 127.5 |
| Total | 11,178 (100.0%) | 73.3 |
Fertility by Education by Marriage Status in Area Code 219
48.3% of women with births in Area Code 219 are unmarried. Women with the educational attainment of graduate degree are most likely to be married with 100.0% of them married at childbirth, while women with the educational attainment of less than high school are least likely to be married with 85.9% of them unmarried at childbirth.
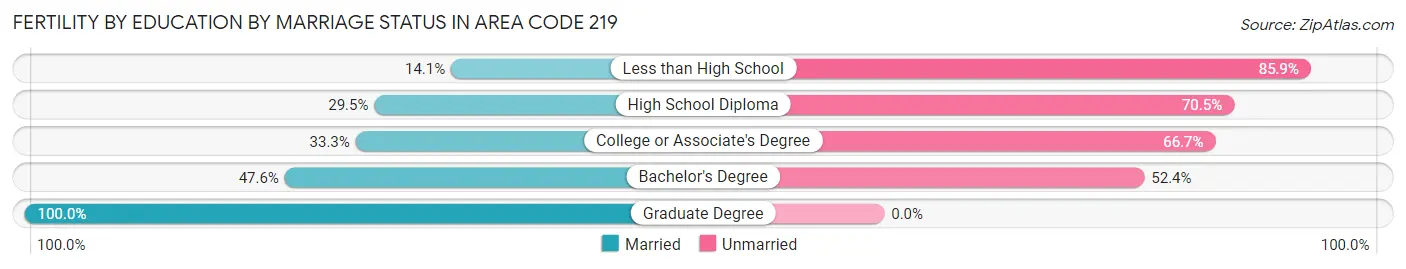
| Educational Attainment | Married | Unmarried |
| Less than High School | 140 (14.1%) | 855 (85.9%) |
| High School Diploma | 972 (29.5%) | 2,319 (70.5%) |
| College or Associate's Degree | 1,174 (33.3%) | 2,352 (66.7%) |
| Bachelor's Degree | 1,157 (47.6%) | 1,274 (52.4%) |
| Graduate Degree | 935 (100.0%) | 0 (0.0%) |
| Total | 5,773 (51.6%) | 5,405 (48.3%) |
Employment Characteristics in Area Code 219
Employment by Class of Employer in Area Code 219
Among the 379,232 employed individuals in Area Code 219, private company employees (279,220 | 73.6%), not-for-profit organizations (30,783 | 8.1%), and local government employees (25,578 | 6.7%) make up the most common classes of employment.
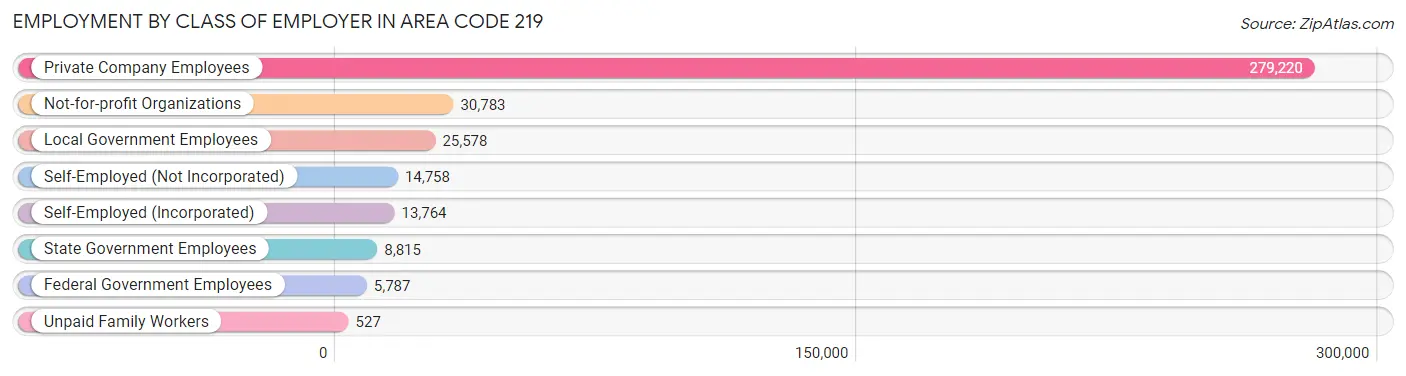
| Employer Class | # Employees | % Employees |
| Private Company Employees | 279,220 | 73.6% |
| Self-Employed (Incorporated) | 13,764 | 3.6% |
| Self-Employed (Not Incorporated) | 14,758 | 3.9% |
| Not-for-profit Organizations | 30,783 | 8.1% |
| Local Government Employees | 25,578 | 6.7% |
| State Government Employees | 8,815 | 2.3% |
| Federal Government Employees | 5,787 | 1.5% |
| Unpaid Family Workers | 527 | 0.1% |
| Total | 379,232 | 100.0% |
Employment Status by Age in Area Code 219
According to the labor force statistics for Area Code 219, out of the total population over 16 years of age (674,851), 59.2% or 399,512 individuals are in the labor force, with 7.0% or 27,846 of them unemployed. The age group with the highest labor force participation rate is 25 to 29 years, with 81.0% or 41,670 individuals in the labor force. Within the labor force, the 20 to 24 years age range has the highest percentage of unemployed individuals, with 799.9% or 336,358 of them being unemployed.
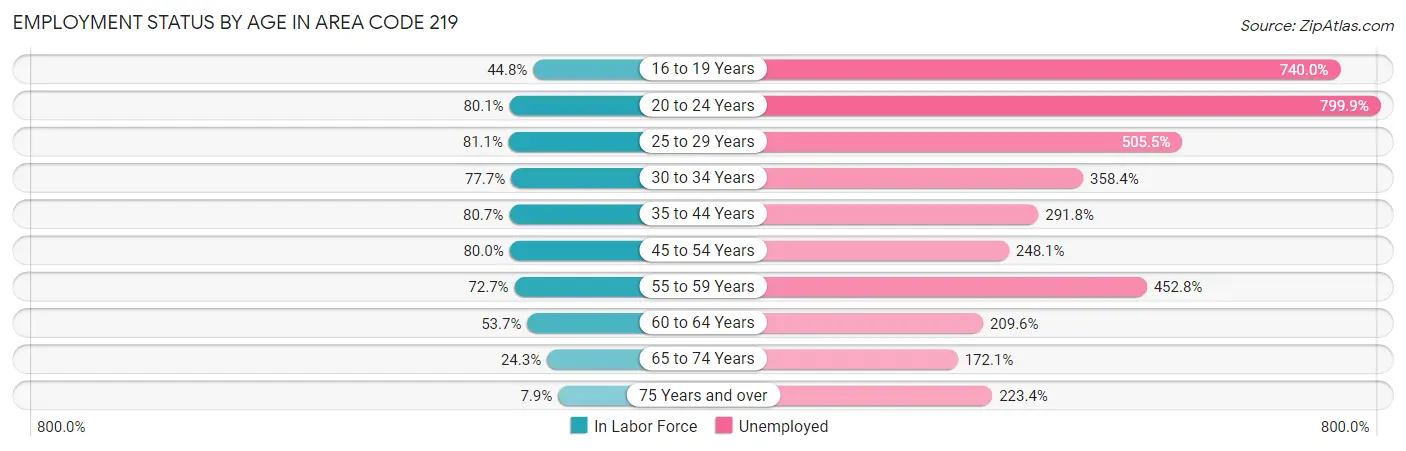
| Age Bracket | In Labor Force | Unemployed |
| 16 to 19 Years | 19,634 (44.8%) | 145,292 (740.0%) |
| 20 to 24 Years | 42,052 (80.1%) | 336,358 (799.9%) |
| 25 to 29 Years | 41,669 (81.0%) | 210,642 (505.5%) |
| 30 to 34 Years | 39,729 (77.7%) | 142,385 (358.4%) |
| 35 to 44 Years | 87,848 (80.7%) | 256,340 (291.8%) |
| 45 to 54 Years | 84,296 (80.0%) | 209,131 (248.1%) |
| 55 to 59 Years | 41,737 (72.7%) | 188,990 (452.8%) |
| 60 to 64 Years | 31,163 (53.6%) | 65,313 (209.6%) |
| 65 to 74 Years | 21,193 (24.3%) | 36,470 (172.1%) |
| 75 Years and over | 4,635 (7.9%) | 10,359 (223.4%) |
| Total | 399,542 (59.2%) | 27,828 (7.0%) |
Employment Status by Educational Attainment in Area Code 219
According to labor force statistics for Area Code 219, 74.1% of individuals (320,453) out of the total population between 25 and 64 years of age (432,343) are in the labor force, with 327.6% or 1,049,804 of them being unemployed. The group with the highest labor force participation rate are those with the educational attainment of bachelor's degree or higher, with 86.6% or 96,934 individuals in the labor force. Within the labor force, individuals with less than high school education have the highest percentage of unemployment, with 586.8% or 119,044 of them being unemployed.
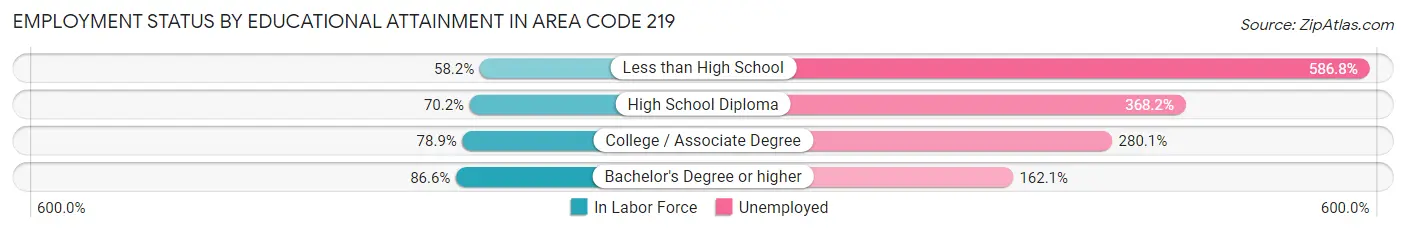
| Educational Attainment | In Labor Force | Unemployed |
| Less than High School | 20,286 (58.2%) | 204,506 (586.8%) |
| High School Diploma | 103,950 (70.2%) | 544,991 (368.2%) |
| College / Associate Degree | 108,476 (78.9%) | 385,188 (280.1%) |
| Bachelor's Degree or higher | 96,939 (86.6%) | 181,486 (162.1%) |
| Total | 320,432 (74.1%) | 1,416,356 (327.6%) |
Employment Occupations by Sex in Area Code 219
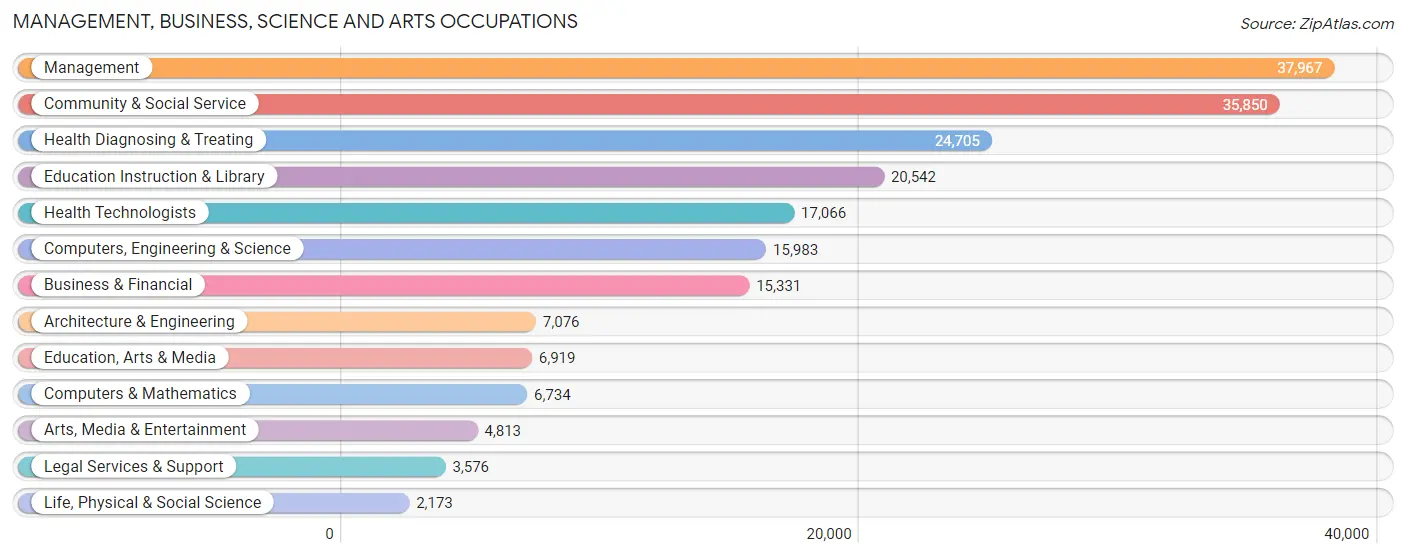
Management, Business, Science and Arts Occupations
The most common Management, Business, Science and Arts occupations in Area Code 219 are Management (37,967 | 9.8%), Community & Social Service (35,850 | 9.2%), Health Diagnosing & Treating (24,705 | 6.4%), Education Instruction & Library (20,542 | 5.3%), and Health Technologists (17,066 | 4.4%).
Management, Business, Science and Arts Occupations by Sex
Within the Management, Business, Science and Arts occupations in Area Code 219, the most male-oriented occupations are Architecture & Engineering (86.0%), Computers, Engineering & Science (72.4%), and Computers & Mathematics (62.8%), while the most female-oriented occupations are Health Technologists (82.5%), Health Diagnosing & Treating (82.3%), and Education Instruction & Library (79.6%).
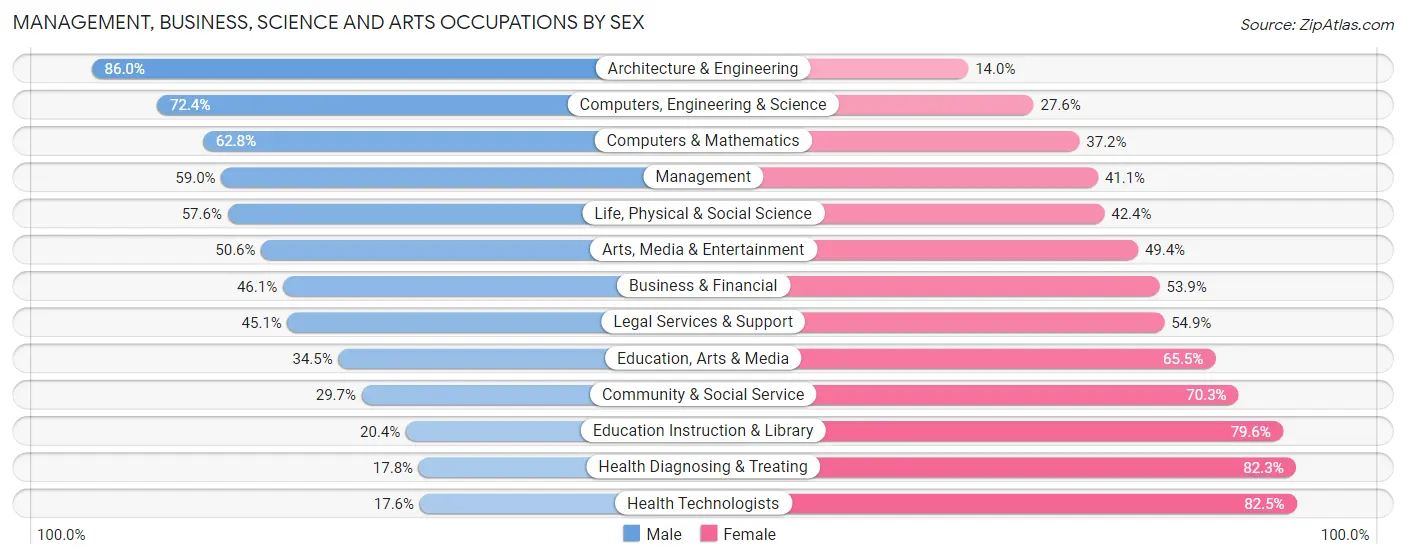
| Occupation | Male | Female |
| Management | 22,381 (59.0%) | 15,586 (41.0%) |
| Business & Financial | 7,068 (46.1%) | 8,263 (53.9%) |
| Computers, Engineering & Science | 11,569 (72.4%) | 4,414 (27.6%) |
| Computers & Mathematics | 4,231 (62.8%) | 2,503 (37.2%) |
| Architecture & Engineering | 6,086 (86.0%) | 990 (14.0%) |
| Life, Physical & Social Science | 1,252 (57.6%) | 921 (42.4%) |
| Community & Social Service | 10,633 (29.7%) | 25,217 (70.3%) |
| Education, Arts & Media | 2,388 (34.5%) | 4,531 (65.5%) |
| Legal Services & Support | 1,614 (45.1%) | 1,962 (54.9%) |
| Education Instruction & Library | 4,195 (20.4%) | 16,347 (79.6%) |
| Arts, Media & Entertainment | 2,436 (50.6%) | 2,377 (49.4%) |
| Health Diagnosing & Treating | 4,385 (17.7%) | 20,320 (82.3%) |
| Health Technologists | 2,995 (17.5%) | 14,071 (82.5%) |
| Total (Category) | 56,036 (43.2%) | 73,800 (56.8%) |
| Total (Overall) | 204,538 (52.7%) | 183,565 (47.3%) |
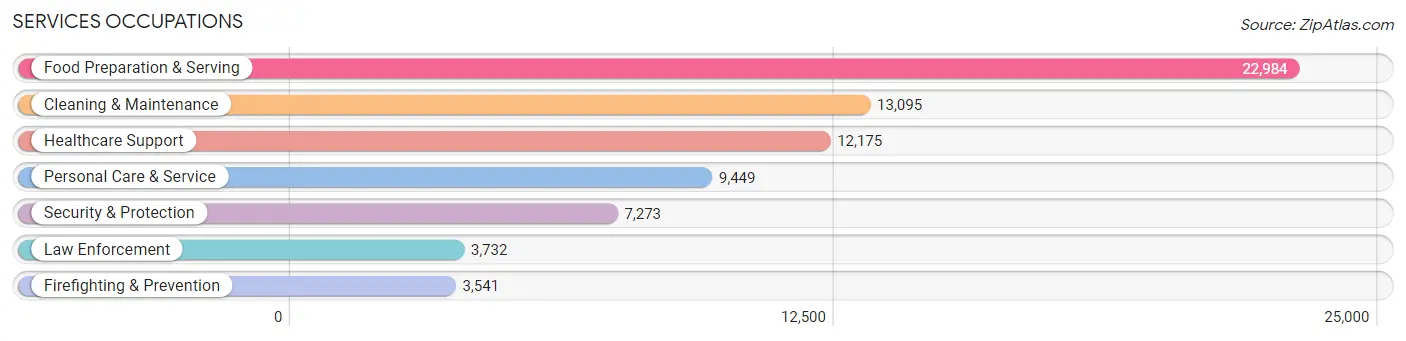
Services Occupations
The most common Services occupations in Area Code 219 are Food Preparation & Serving (22,984 | 5.9%), Cleaning & Maintenance (13,095 | 3.4%), Healthcare Support (12,175 | 3.1%), Personal Care & Service (9,449 | 2.4%), and Security & Protection (7,273 | 1.9%).
Services Occupations by Sex
Within the Services occupations in Area Code 219, the most male-oriented occupations are Law Enforcement (81.1%), Security & Protection (78.2%), and Firefighting & Prevention (75.1%), while the most female-oriented occupations are Healthcare Support (91.9%), Personal Care & Service (78.6%), and Food Preparation & Serving (58.6%).
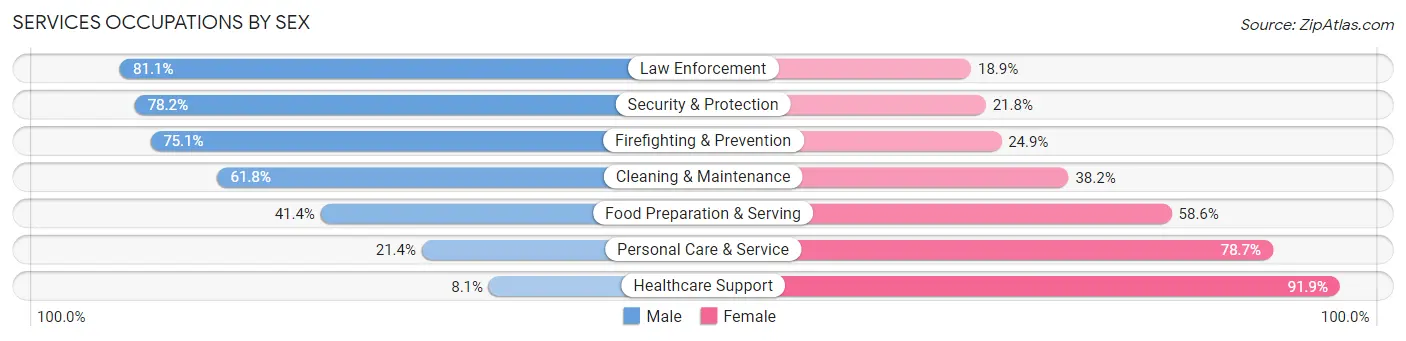
| Occupation | Male | Female |
| Healthcare Support | 983 (8.1%) | 11,192 (91.9%) |
| Security & Protection | 5,686 (78.2%) | 1,587 (21.8%) |
| Firefighting & Prevention | 2,660 (75.1%) | 881 (24.9%) |
| Law Enforcement | 3,026 (81.1%) | 706 (18.9%) |
| Food Preparation & Serving | 9,509 (41.4%) | 13,475 (58.6%) |
| Cleaning & Maintenance | 8,092 (61.8%) | 5,003 (38.2%) |
| Personal Care & Service | 2,017 (21.3%) | 7,432 (78.6%) |
| Total (Category) | 26,287 (40.5%) | 38,689 (59.5%) |
| Total (Overall) | 204,538 (52.7%) | 183,565 (47.3%) |
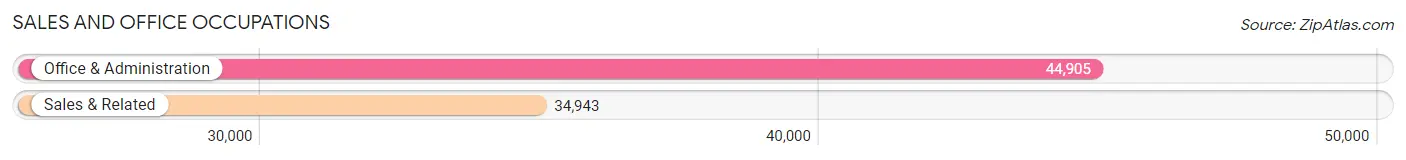
Sales and Office Occupations
The most common Sales and Office occupations in Area Code 219 are Office & Administration (44,905 | 11.6%), and Sales & Related (34,943 | 9.0%).
Sales and Office Occupations by Sex
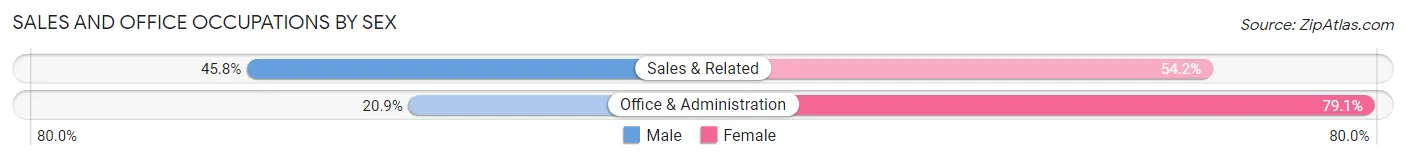
| Occupation | Male | Female |
| Sales & Related | 15,997 (45.8%) | 18,946 (54.2%) |
| Office & Administration | 9,392 (20.9%) | 35,513 (79.1%) |
| Total (Category) | 25,389 (31.8%) | 54,459 (68.2%) |
| Total (Overall) | 204,538 (52.7%) | 183,565 (47.3%) |
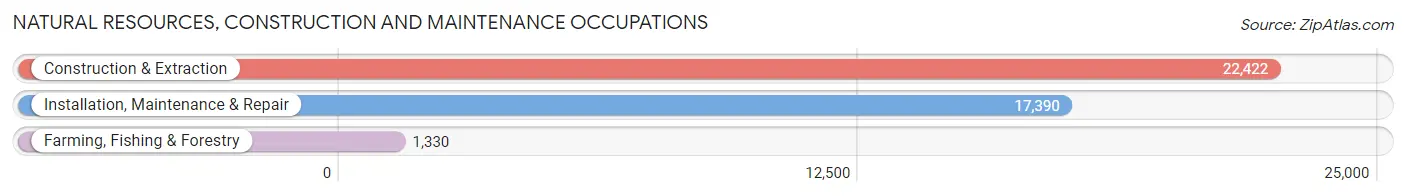
Natural Resources, Construction and Maintenance Occupations
The most common Natural Resources, Construction and Maintenance occupations in Area Code 219 are Construction & Extraction (22,422 | 5.8%), Installation, Maintenance & Repair (17,390 | 4.5%), and Farming, Fishing & Forestry (1,330 | 0.3%).
Natural Resources, Construction and Maintenance Occupations by Sex
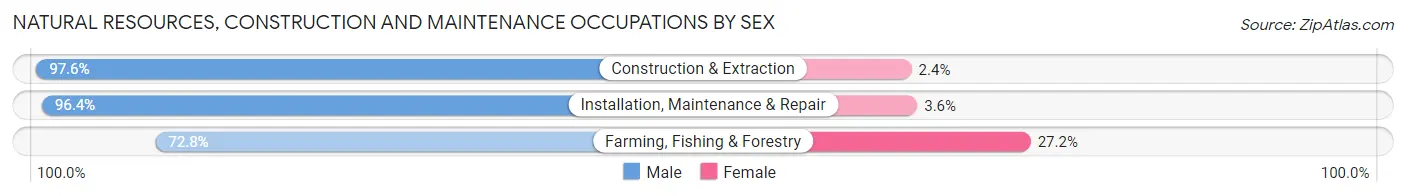
| Occupation | Male | Female |
| Farming, Fishing & Forestry | 968 (72.8%) | 362 (27.2%) |
| Construction & Extraction | 21,875 (97.6%) | 547 (2.4%) |
| Installation, Maintenance & Repair | 16,762 (96.4%) | 628 (3.6%) |
| Total (Category) | 39,605 (96.3%) | 1,537 (3.7%) |
| Total (Overall) | 204,538 (52.7%) | 183,565 (47.3%) |
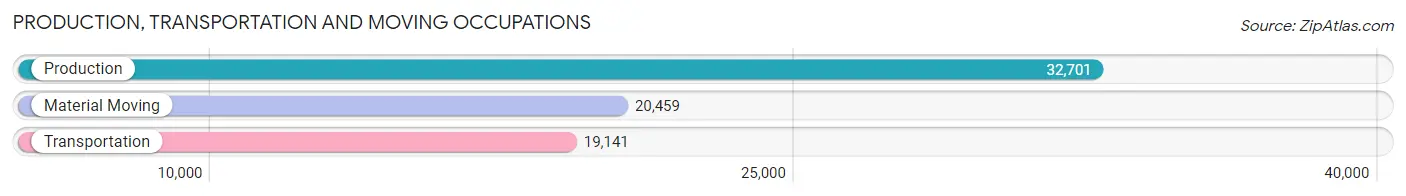
Production, Transportation and Moving Occupations
The most common Production, Transportation and Moving occupations in Area Code 219 are Production (32,701 | 8.4%), Material Moving (20,459 | 5.3%), and Transportation (19,141 | 4.9%).
Production, Transportation and Moving Occupations by Sex
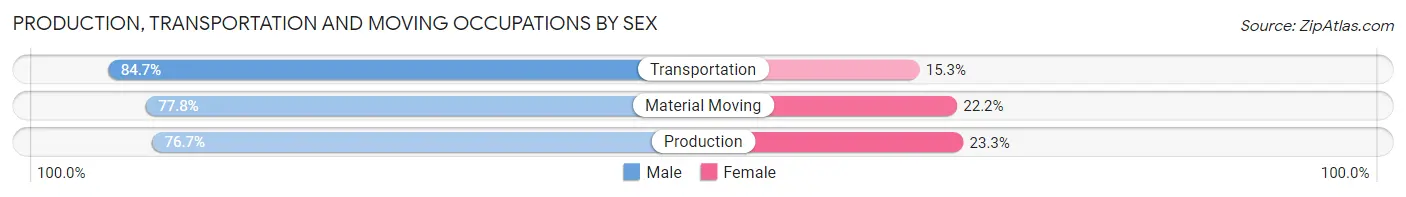
| Occupation | Male | Female |
| Production | 25,080 (76.7%) | 7,621 (23.3%) |
| Transportation | 16,217 (84.7%) | 2,924 (15.3%) |
| Material Moving | 15,924 (77.8%) | 4,535 (22.2%) |
| Total (Category) | 57,221 (79.1%) | 15,080 (20.9%) |
| Total (Overall) | 204,538 (52.7%) | 183,565 (47.3%) |
Employment Industries by Sex in Area Code 219
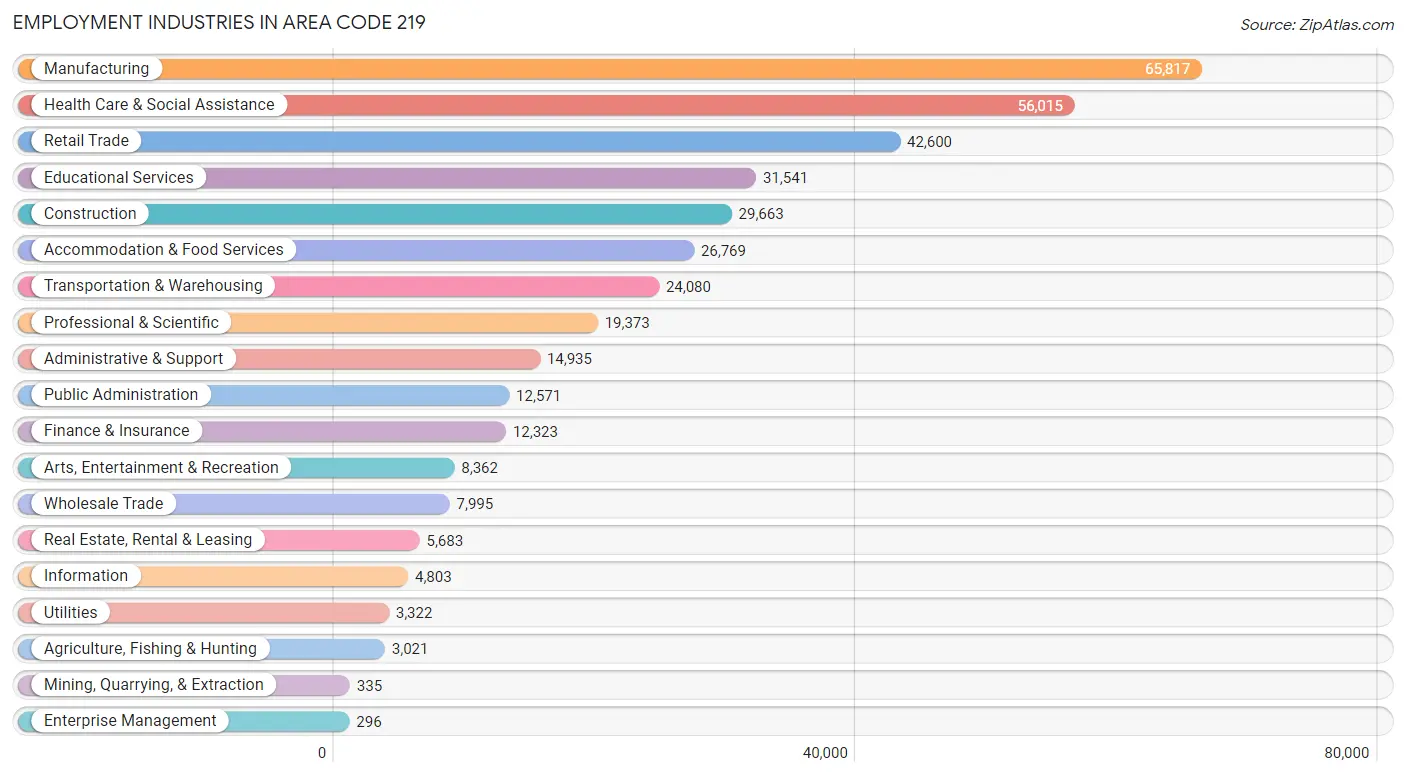
Employment Industries in Area Code 219
The major employment industries in Area Code 219 include Manufacturing (65,817 | 17.0%), Health Care & Social Assistance (56,015 | 14.4%), Retail Trade (42,600 | 11.0%), Educational Services (31,541 | 8.1%), and Construction (29,663 | 7.6%).
Employment Industries by Sex in Area Code 219
The Area Code 219 industries that see more men than women are Construction (91.0%), Agriculture, Fishing & Hunting (80.5%), and Manufacturing (77.2%), whereas the industries that tend to have a higher number of women are Health Care & Social Assistance (83.6%), Educational Services (74.3%), and Finance & Insurance (64.3%).
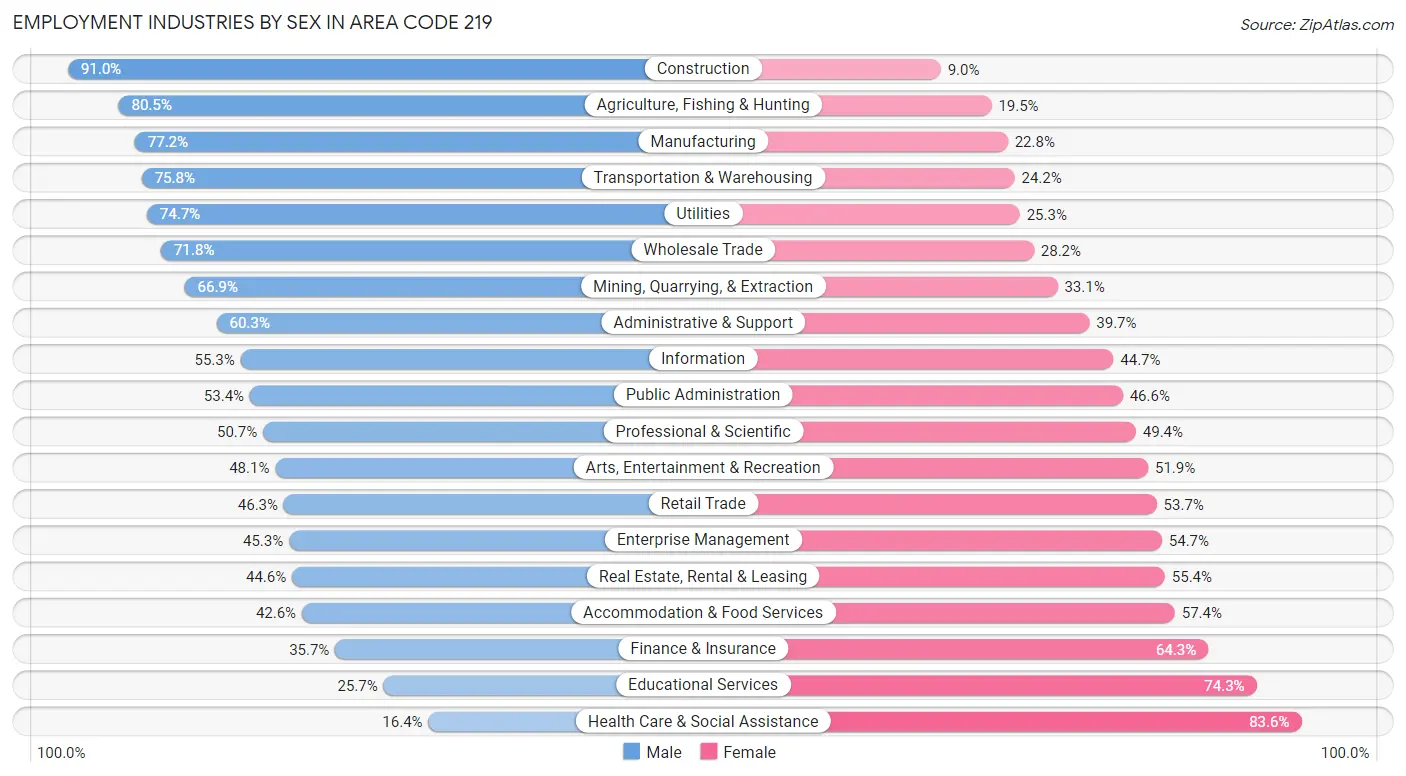
| Industry | Male | Female |
| Agriculture, Fishing & Hunting | 2,433 (80.5%) | 588 (19.5%) |
| Mining, Quarrying, & Extraction | 224 (66.9%) | 111 (33.1%) |
| Construction | 27,001 (91.0%) | 2,662 (9.0%) |
| Manufacturing | 50,791 (77.2%) | 15,026 (22.8%) |
| Wholesale Trade | 5,737 (71.8%) | 2,258 (28.2%) |
| Retail Trade | 19,740 (46.3%) | 22,860 (53.7%) |
| Transportation & Warehousing | 18,242 (75.8%) | 5,838 (24.2%) |
| Utilities | 2,481 (74.7%) | 841 (25.3%) |
| Information | 2,656 (55.3%) | 2,147 (44.7%) |
| Finance & Insurance | 4,400 (35.7%) | 7,923 (64.3%) |
| Real Estate, Rental & Leasing | 2,537 (44.6%) | 3,146 (55.4%) |
| Professional & Scientific | 9,813 (50.6%) | 9,560 (49.3%) |
| Enterprise Management | 134 (45.3%) | 162 (54.7%) |
| Administrative & Support | 9,002 (60.3%) | 5,933 (39.7%) |
| Educational Services | 8,106 (25.7%) | 23,435 (74.3%) |
| Health Care & Social Assistance | 9,200 (16.4%) | 46,815 (83.6%) |
| Arts, Entertainment & Recreation | 4,024 (48.1%) | 4,338 (51.9%) |
| Accommodation & Food Services | 11,400 (42.6%) | 15,369 (57.4%) |
| Public Administration | 6,708 (53.4%) | 5,863 (46.6%) |
| Total | 204,538 (52.7%) | 183,565 (47.3%) |
Education in Area Code 219
School Enrollment in Area Code 219
The most common levels of schooling among the 193,407 students in Area Code 219 are high school (46,427 | 24.0%), middle school (44,738 | 23.1%), and elementary school (40,589 | 21.0%).
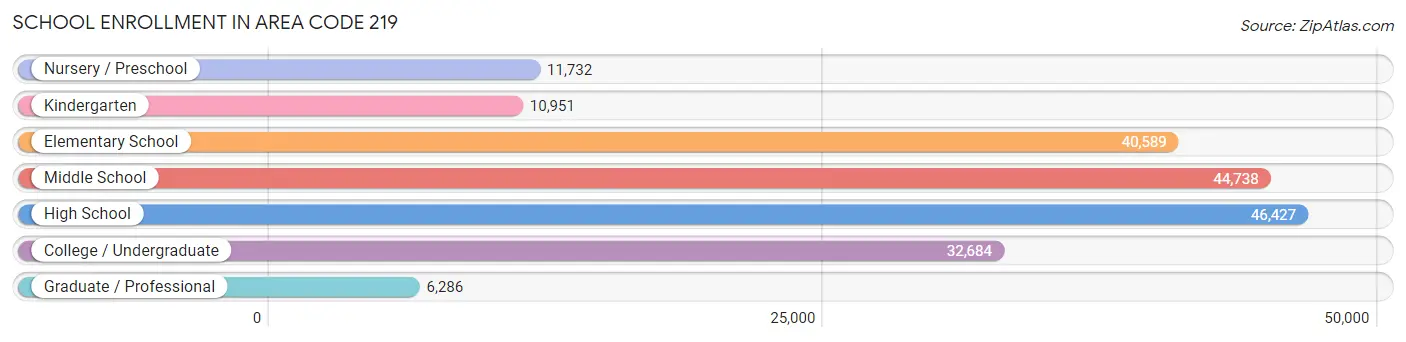
| School Level | # Students | % Students |
| Nursery / Preschool | 11,732 | 6.1% |
| Kindergarten | 10,951 | 5.7% |
| Elementary School | 40,589 | 21.0% |
| Middle School | 44,738 | 23.1% |
| High School | 46,427 | 24.0% |
| College / Undergraduate | 32,684 | 16.9% |
| Graduate / Professional | 6,286 | 3.3% |
| Total | 193,407 | 100.0% |
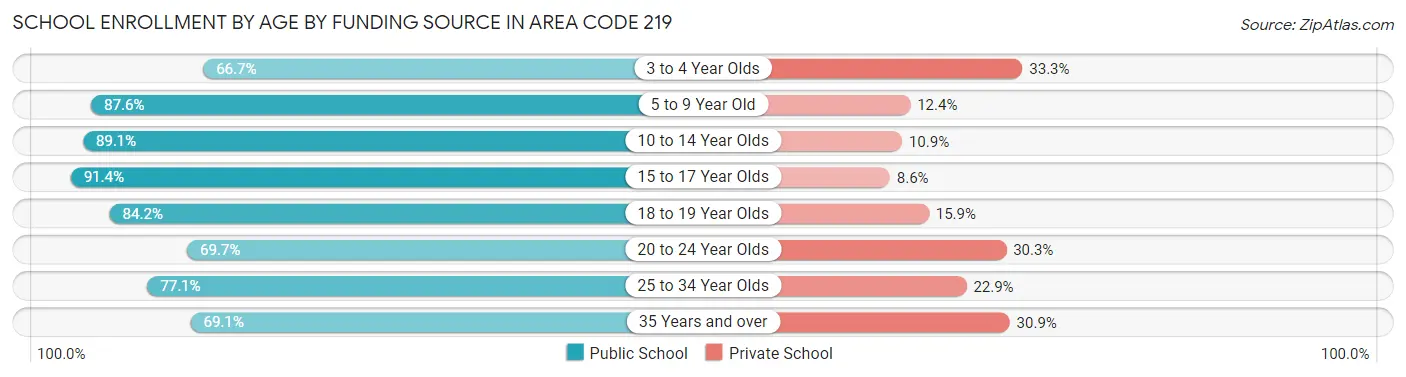
School Enrollment by Age by Funding Source in Area Code 219
Out of a total of 193,407 students who are enrolled in schools in Area Code 219, 29,373 (15.2%) attend a private institution, while the remaining 164,034 (84.8%) are enrolled in public schools. The age group of 3 to 4 year olds has the highest likelihood of being enrolled in private schools, with 2,651 (33.3% in the age bracket) enrolled. Conversely, the age group of 15 to 17 year olds has the lowest likelihood of being enrolled in a private school, with 31,255 (91.4% in the age bracket) attending a public institution.
| Age Bracket | Public School | Private School |
| 3 to 4 Year Olds | 5,315 (66.7%) | 2,651 (33.3%) |
| 5 to 9 Year Old | 42,788 (87.6%) | 6,057 (12.4%) |
| 10 to 14 Year Olds | 49,133 (89.1%) | 5,986 (10.9%) |
| 15 to 17 Year Olds | 31,255 (91.4%) | 2,941 (8.6%) |
| 18 to 19 Year Olds | 11,704 (84.2%) | 2,204 (15.9%) |
| 20 to 24 Year Olds | 11,741 (69.7%) | 5,096 (30.3%) |
| 25 to 34 Year Olds | 6,394 (77.1%) | 1,896 (22.9%) |
| 35 Years and over | 5,696 (69.1%) | 2,550 (30.9%) |
| Total | 164,034 (84.8%) | 29,373 (15.2%) |
Educational Attainment by Field of Study in Area Code 219
Business (32,232 | 21.1%), education (23,668 | 15.5%), science & technology (20,437 | 13.4%), arts & humanities (10,246 | 6.7%), and engineering (9,011 | 5.9%) are the most common fields of study among 152,848 individuals in Area Code 219 who have obtained a bachelor's degree or higher.
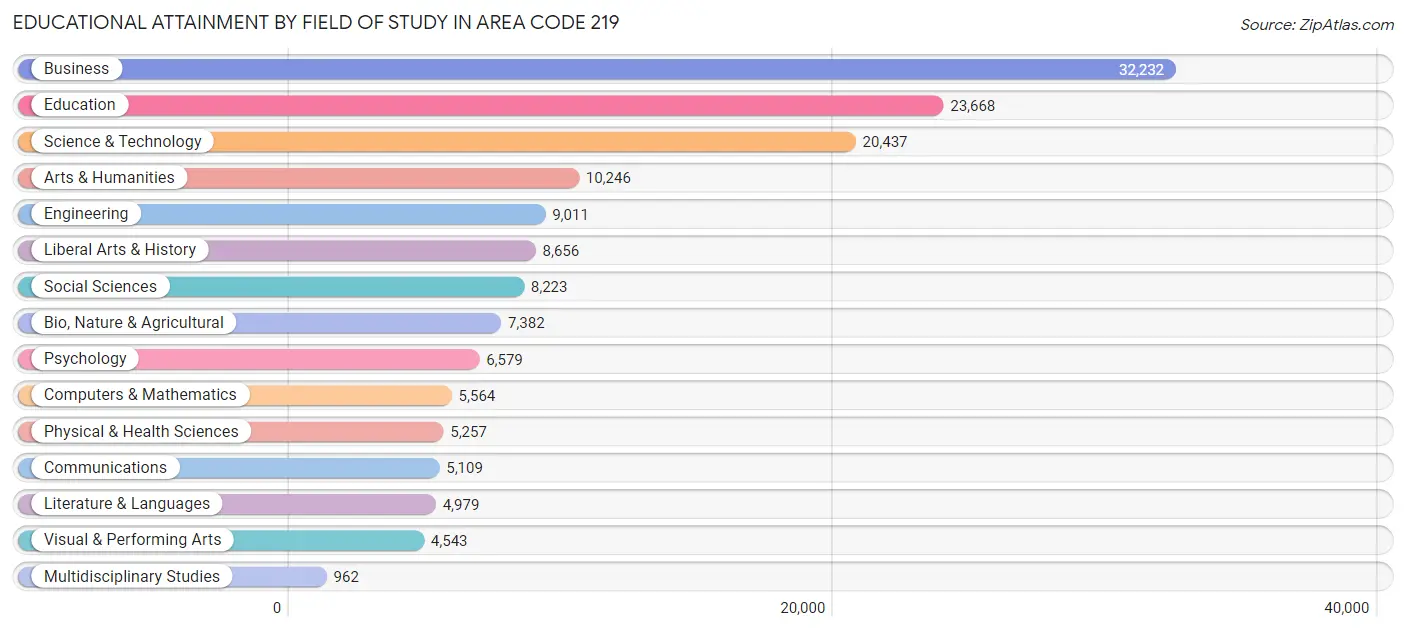
| Field of Study | # Graduates | % Graduates |
| Computers & Mathematics | 5,564 | 3.6% |
| Bio, Nature & Agricultural | 7,382 | 4.8% |
| Physical & Health Sciences | 5,257 | 3.4% |
| Psychology | 6,579 | 4.3% |
| Social Sciences | 8,223 | 5.4% |
| Engineering | 9,011 | 5.9% |
| Multidisciplinary Studies | 962 | 0.6% |
| Science & Technology | 20,437 | 13.4% |
| Business | 32,232 | 21.1% |
| Education | 23,668 | 15.5% |
| Literature & Languages | 4,979 | 3.3% |
| Liberal Arts & History | 8,656 | 5.7% |
| Visual & Performing Arts | 4,543 | 3.0% |
| Communications | 5,109 | 3.3% |
| Arts & Humanities | 10,246 | 6.7% |
| Total | 152,848 | 100.0% |
Transportation & Commute in Area Code 219
Vehicle Availability by Sex in Area Code 219
The most prevalent vehicle ownership categories in Area Code 219 are males with 2 vehicles (85,016, accounting for 42.4%) and females with 2 vehicles (71,022, making up 48.0%).
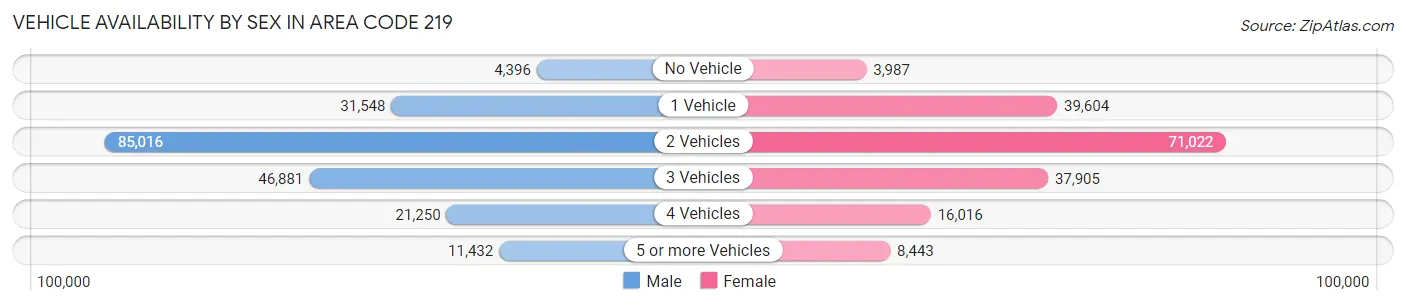
| Vehicles Available | Male | Female |
| No Vehicle | 4,396 (2.2%) | 3,987 (2.2%) |
| 1 Vehicle | 31,548 (15.7%) | 39,604 (22.4%) |
| 2 Vehicles | 85,016 (42.4%) | 71,022 (40.1%) |
| 3 Vehicles | 46,881 (23.4%) | 37,905 (21.4%) |
| 4 Vehicles | 21,250 (10.6%) | 16,016 (9.0%) |
| 5 or more Vehicles | 11,432 (5.7%) | 8,443 (4.8%) |
| Total | 200,523 (100.0%) | 176,977 (100.0%) |
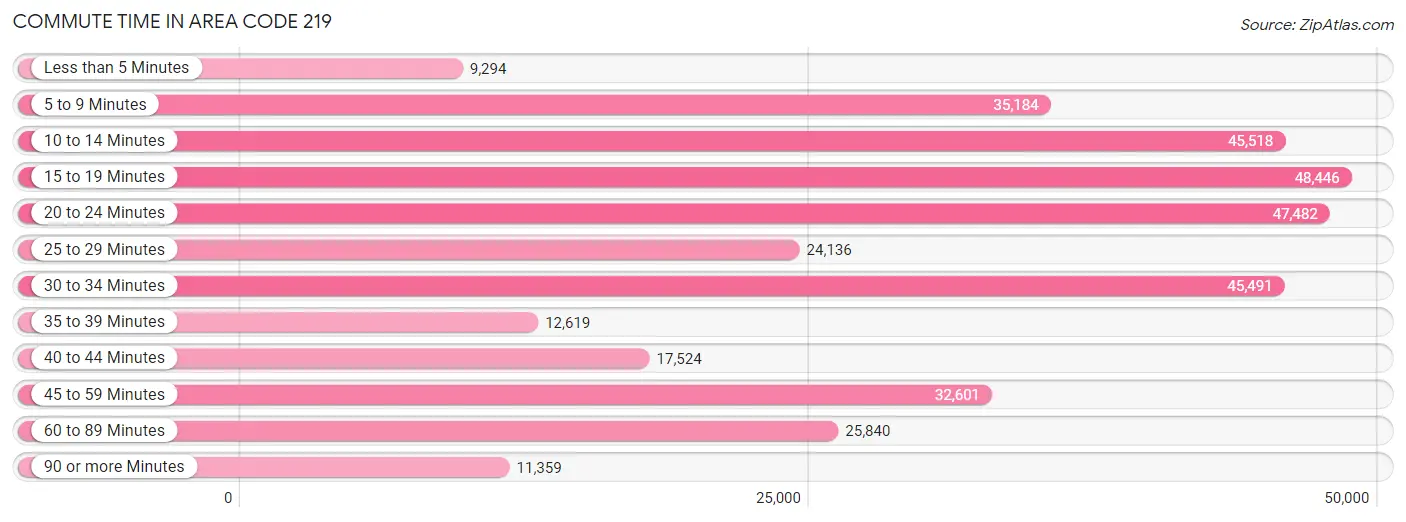
Commute Time in Area Code 219
The most frequently occuring commute durations in Area Code 219 are 15 to 19 minutes (48,446 commuters, 13.6%), 20 to 24 minutes (47,482 commuters, 13.4%), and 10 to 14 minutes (45,518 commuters, 12.8%).
| Commute Time | # Commuters | % Commuters |
| Less than 5 Minutes | 9,294 | 2.6% |
| 5 to 9 Minutes | 35,184 | 9.9% |
| 10 to 14 Minutes | 45,518 | 12.8% |
| 15 to 19 Minutes | 48,446 | 13.6% |
| 20 to 24 Minutes | 47,482 | 13.4% |
| 25 to 29 Minutes | 24,136 | 6.8% |
| 30 to 34 Minutes | 45,491 | 12.8% |
| 35 to 39 Minutes | 12,619 | 3.5% |
| 40 to 44 Minutes | 17,524 | 4.9% |
| 45 to 59 Minutes | 32,601 | 9.2% |
| 60 to 89 Minutes | 25,840 | 7.3% |
| 90 or more Minutes | 11,359 | 3.2% |
Commute Time by Sex in Area Code 219
The most common commute times in Area Code 219 are 30 to 34 minutes (25,579 commuters, 13.4%) for males and 15 to 19 minutes (25,424 commuters, 15.4%) for females.
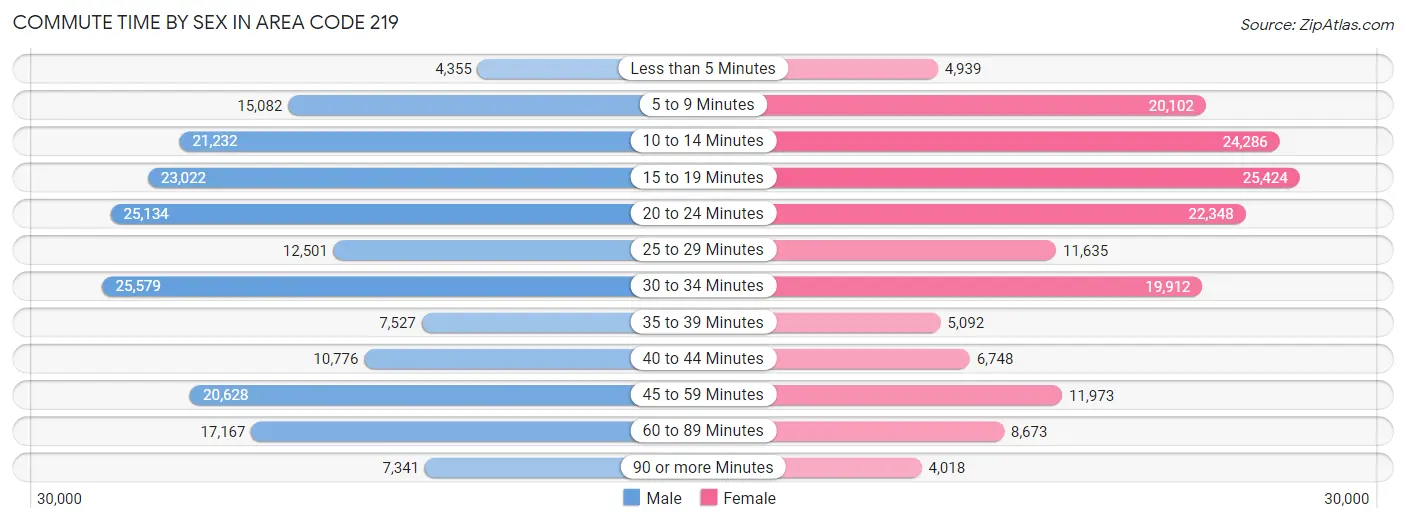
| Commute Time | Male | Female |
| Less than 5 Minutes | 4,355 (2.3%) | 4,939 (3.0%) |
| 5 to 9 Minutes | 15,082 (7.9%) | 20,102 (12.2%) |
| 10 to 14 Minutes | 21,232 (11.2%) | 24,286 (14.7%) |
| 15 to 19 Minutes | 23,022 (12.1%) | 25,424 (15.4%) |
| 20 to 24 Minutes | 25,134 (13.2%) | 22,348 (13.5%) |
| 25 to 29 Minutes | 12,501 (6.6%) | 11,635 (7.0%) |
| 30 to 34 Minutes | 25,579 (13.4%) | 19,912 (12.1%) |
| 35 to 39 Minutes | 7,527 (4.0%) | 5,092 (3.1%) |
| 40 to 44 Minutes | 10,776 (5.7%) | 6,748 (4.1%) |
| 45 to 59 Minutes | 20,628 (10.8%) | 11,973 (7.2%) |
| 60 to 89 Minutes | 17,167 (9.0%) | 8,673 (5.2%) |
| 90 or more Minutes | 7,341 (3.9%) | 4,018 (2.4%) |
Time of Departure to Work by Sex in Area Code 219
The most frequent times of departure to work in Area Code 219 are 6:00 AM to 6:29 AM (23,296, 12.2%) for males and 7:00 AM to 7:29 AM (24,230, 14.7%) for females.
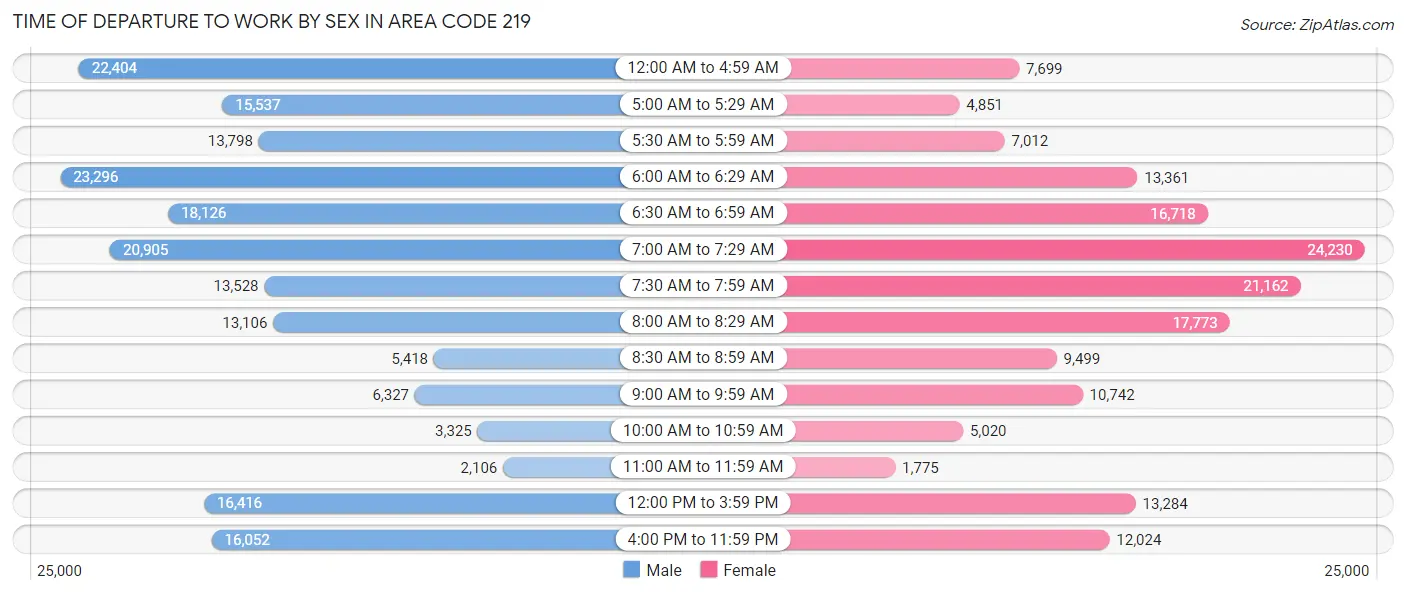
| Time of Departure | Male | Female |
| 12:00 AM to 4:59 AM | 22,404 (11.8%) | 7,699 (4.7%) |
| 5:00 AM to 5:29 AM | 15,537 (8.2%) | 4,851 (2.9%) |
| 5:30 AM to 5:59 AM | 13,798 (7.2%) | 7,012 (4.3%) |
| 6:00 AM to 6:29 AM | 23,296 (12.2%) | 13,361 (8.1%) |
| 6:30 AM to 6:59 AM | 18,126 (9.5%) | 16,718 (10.1%) |
| 7:00 AM to 7:29 AM | 20,905 (11.0%) | 24,230 (14.7%) |
| 7:30 AM to 7:59 AM | 13,528 (7.1%) | 21,162 (12.8%) |
| 8:00 AM to 8:29 AM | 13,106 (6.9%) | 17,773 (10.8%) |
| 8:30 AM to 8:59 AM | 5,418 (2.9%) | 9,499 (5.8%) |
| 9:00 AM to 9:59 AM | 6,327 (3.3%) | 10,742 (6.5%) |
| 10:00 AM to 10:59 AM | 3,325 (1.8%) | 5,020 (3.0%) |
| 11:00 AM to 11:59 AM | 2,106 (1.1%) | 1,775 (1.1%) |
| 12:00 PM to 3:59 PM | 16,416 (8.6%) | 13,284 (8.0%) |
| 4:00 PM to 11:59 PM | 16,052 (8.4%) | 12,024 (7.3%) |
| Total | 190,344 (100.0%) | 165,150 (100.0%) |
Housing Occupancy in Area Code 219
Occupancy by Ownership in Area Code 219
Of the total 325,857 dwellings in Area Code 219, owner-occupied units account for 238,694 (73.3%), while renter-occupied units make up 87,163 (26.8%).
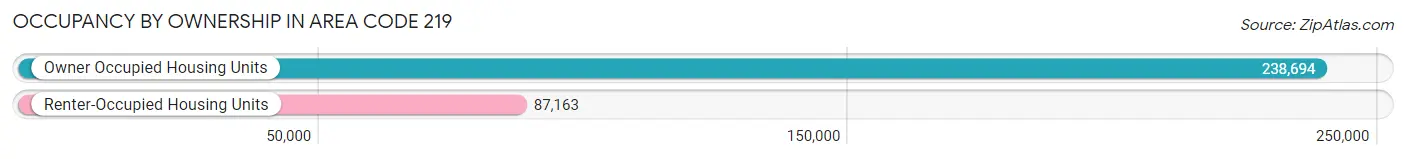
| Occupancy | # Housing Units | % Housing Units |
| Owner Occupied Housing Units | 238,694 | 73.3% |
| Renter-Occupied Housing Units | 87,163 | 26.8% |
| Total Occupied Housing Units | 325,857 | 100.0% |
Occupancy by Household Size in Area Code 219
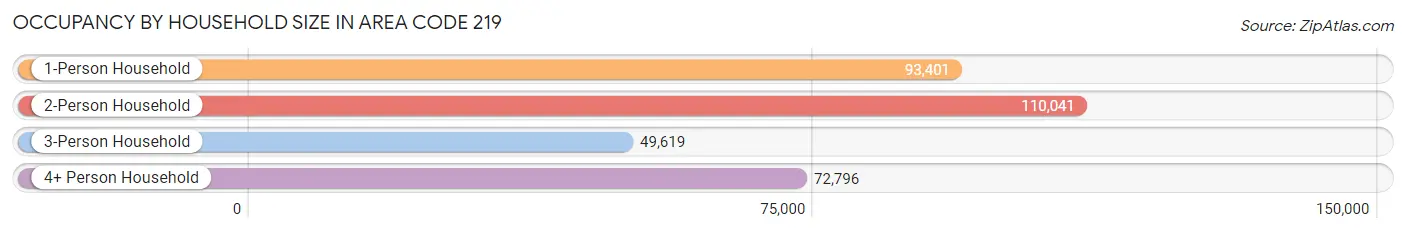
| Household Size | # Housing Units | % Housing Units |
| 1-Person Household | 93,401 | 28.7% |
| 2-Person Household | 110,041 | 33.8% |
| 3-Person Household | 49,619 | 15.2% |
| 4+ Person Household | 72,796 | 22.3% |
| Total Housing Units | 325,857 | 100.0% |
Occupancy by Ownership by Household Size in Area Code 219
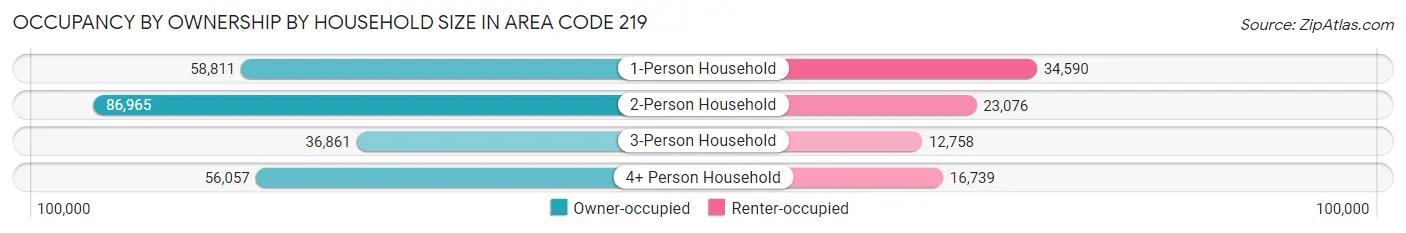
| Household Size | Owner-occupied | Renter-occupied |
| 1-Person Household | 58,811 (63.0%) | 34,590 (37.0%) |
| 2-Person Household | 86,965 (79.0%) | 23,076 (21.0%) |
| 3-Person Household | 36,861 (74.3%) | 12,758 (25.7%) |
| 4+ Person Household | 56,057 (77.0%) | 16,739 (23.0%) |
| Total Housing Units | 238,694 (73.3%) | 87,163 (26.8%) |
Occupancy by Educational Attainment in Area Code 219
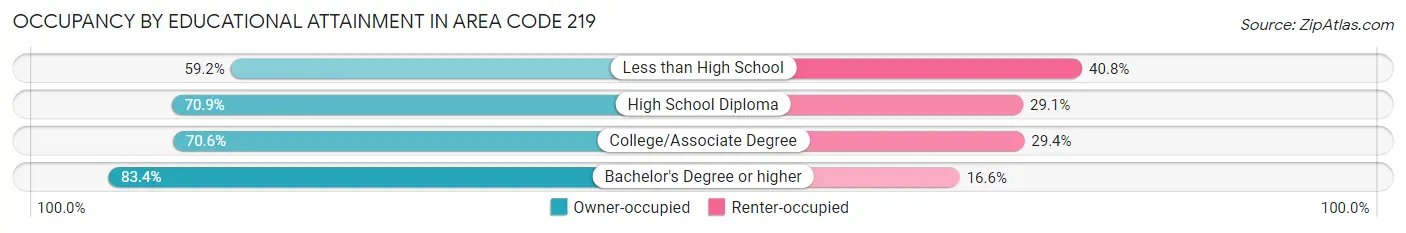
| Household Size | Owner-occupied | Renter-occupied |
| Less than High School | 14,920 (59.2%) | 10,301 (40.8%) |
| High School Diploma | 77,048 (70.9%) | 31,658 (29.1%) |
| College/Associate Degree | 73,874 (70.6%) | 30,730 (29.4%) |
| Bachelor's Degree or higher | 72,852 (83.4%) | 14,474 (16.6%) |
Occupancy by Age of Householder in Area Code 219
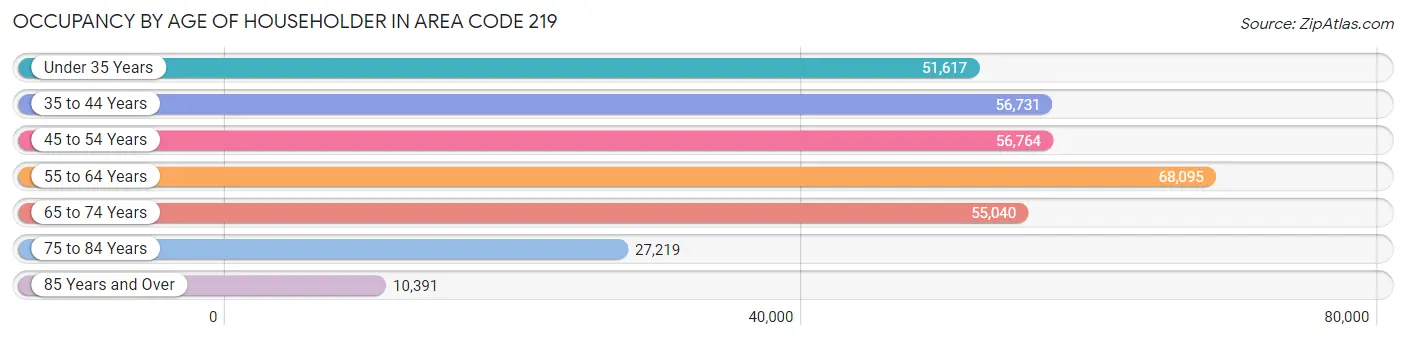
| Age Bracket | # Households | % Households |
| Under 35 Years | 51,617 | 15.8% |
| 35 to 44 Years | 56,731 | 17.4% |
| 45 to 54 Years | 56,764 | 17.4% |
| 55 to 64 Years | 68,095 | 20.9% |
| 65 to 74 Years | 55,040 | 16.9% |
| 75 to 84 Years | 27,219 | 8.4% |
| 85 Years and Over | 10,391 | 3.2% |
| Total | 325,857 | 100.0% |
Housing Finances in Area Code 219
Median Income by Occupancy in Area Code 219
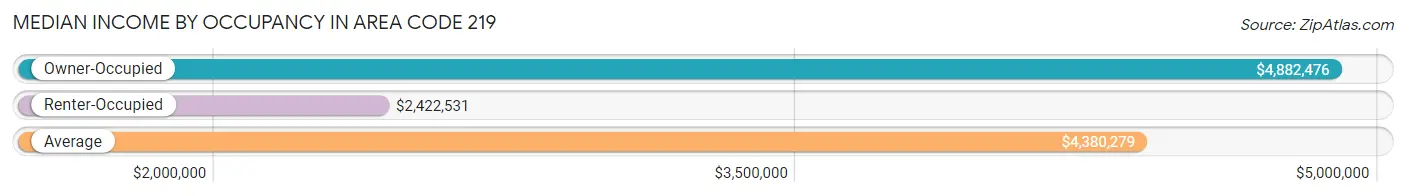
| Occupancy Type | # Households | Median Income |
| Owner-Occupied | 238,694 (73.3%) | $4,882,476 |
| Renter-Occupied | 87,163 (26.8%) | $2,422,531 |
| Average | 325,857 (100.0%) | $4,380,279 |
Occupancy by Householder Income Bracket in Area Code 219
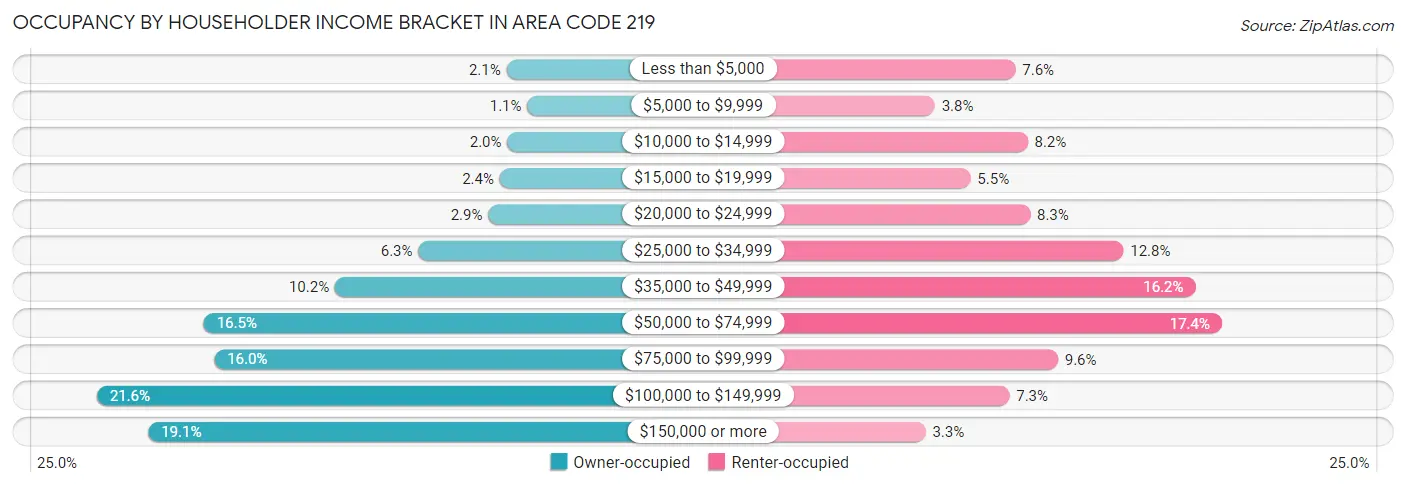
| Income Bracket | Owner-occupied | Renter-occupied |
| Less than $5,000 | 4,891 (2.1%) | 6,635 (7.6%) |
| $5,000 to $9,999 | 2,540 (1.1%) | 3,286 (3.8%) |
| $10,000 to $14,999 | 4,808 (2.0%) | 7,139 (8.2%) |
| $15,000 to $19,999 | 5,657 (2.4%) | 4,765 (5.5%) |
| $20,000 to $24,999 | 6,965 (2.9%) | 7,244 (8.3%) |
| $25,000 to $34,999 | 14,918 (6.2%) | 11,115 (12.8%) |
| $35,000 to $49,999 | 24,398 (10.2%) | 14,101 (16.2%) |
| $50,000 to $74,999 | 39,323 (16.5%) | 15,201 (17.4%) |
| $75,000 to $99,999 | 38,116 (16.0%) | 8,393 (9.6%) |
| $100,000 to $149,999 | 51,456 (21.6%) | 6,378 (7.3%) |
| $150,000 or more | 45,622 (19.1%) | 2,906 (3.3%) |
| Total | 238,694 (100.0%) | 87,163 (100.0%) |
Monthly Housing Cost Tiers in Area Code 219
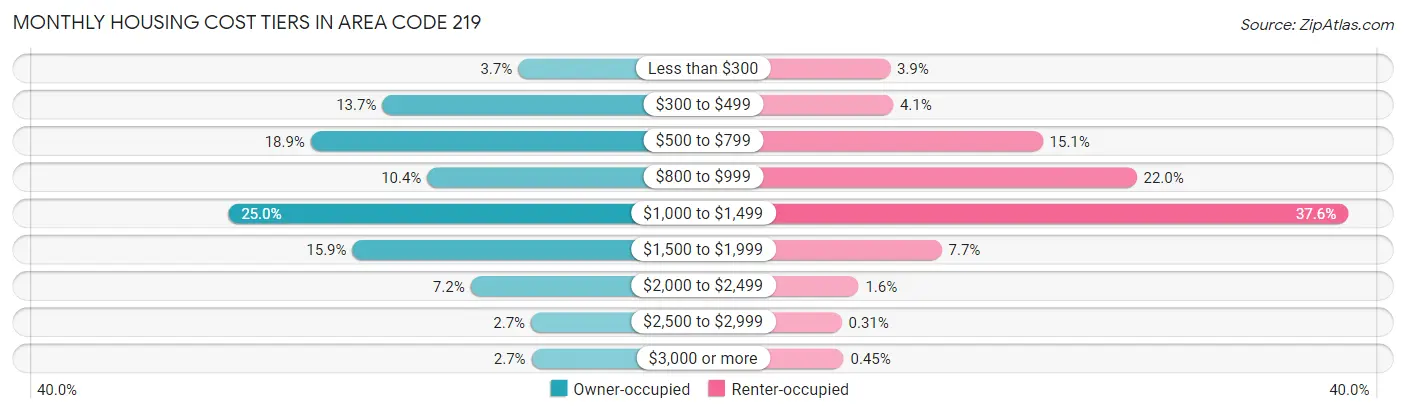
| Monthly Cost | Owner-occupied | Renter-occupied |
| Less than $300 | 8,743 (3.7%) | 3,376 (3.9%) |
| $300 to $499 | 32,599 (13.7%) | 3,566 (4.1%) |
| $500 to $799 | 45,175 (18.9%) | 13,172 (15.1%) |
| $800 to $999 | 24,703 (10.3%) | 19,201 (22.0%) |
| $1,000 to $1,499 | 59,685 (25.0%) | 32,769 (37.6%) |
| $1,500 to $1,999 | 37,862 (15.9%) | 6,682 (7.7%) |
| $2,000 to $2,499 | 17,102 (7.2%) | 1,347 (1.5%) |
| $2,500 to $2,999 | 6,462 (2.7%) | 273 (0.3%) |
| $3,000 or more | 6,363 (2.7%) | 389 (0.4%) |
| Total | 238,694 (100.0%) | 87,163 (100.0%) |
Physical Housing Characteristics in Area Code 219
Housing Structures in Area Code 219
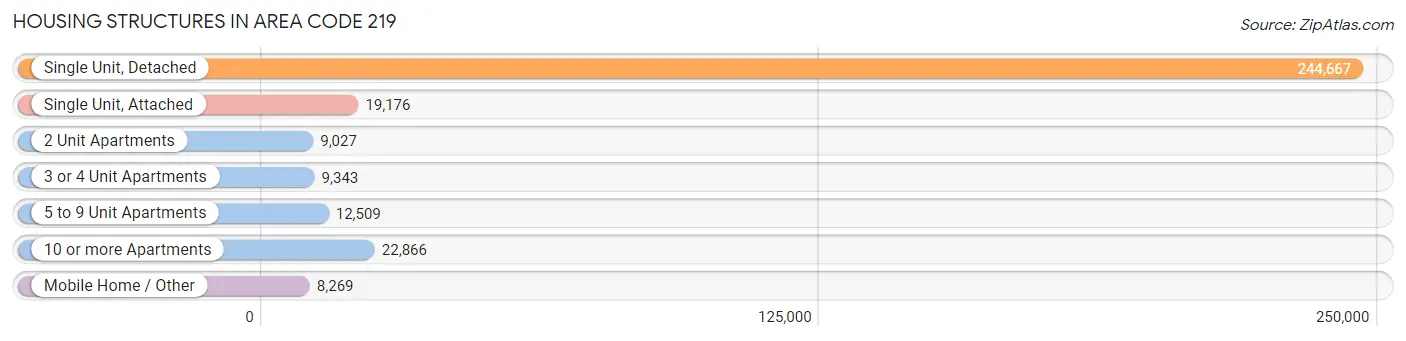
| Structure Type | # Housing Units | % Housing Units |
| Single Unit, Detached | 244,667 | 75.1% |
| Single Unit, Attached | 19,176 | 5.9% |
| 2 Unit Apartments | 9,027 | 2.8% |
| 3 or 4 Unit Apartments | 9,343 | 2.9% |
| 5 to 9 Unit Apartments | 12,509 | 3.8% |
| 10 or more Apartments | 22,866 | 7.0% |
| Mobile Home / Other | 8,269 | 2.5% |
| Total | 325,857 | 100.0% |
Housing Structures by Occupancy in Area Code 219
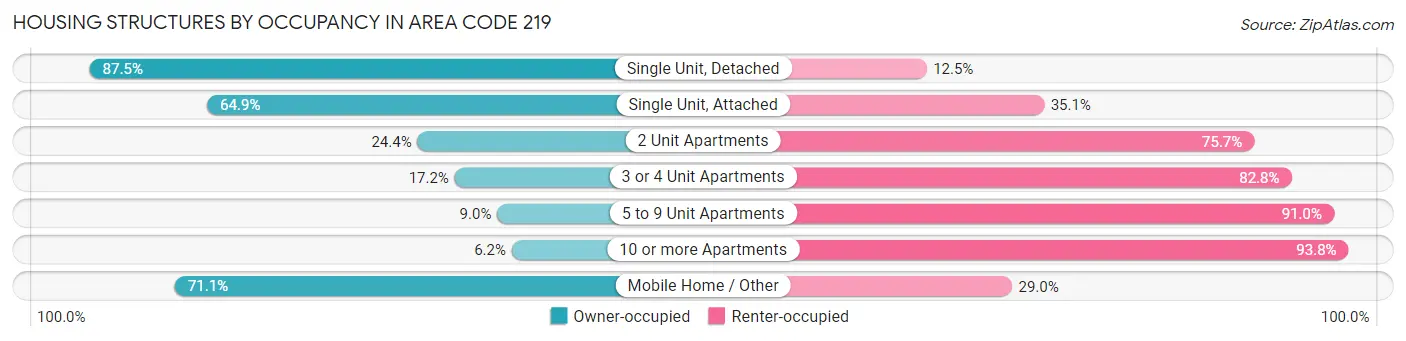
| Structure Type | Owner-occupied | Renter-occupied |
| Single Unit, Detached | 214,037 (87.5%) | 30,630 (12.5%) |
| Single Unit, Attached | 12,437 (64.9%) | 6,739 (35.1%) |
| 2 Unit Apartments | 2,198 (24.3%) | 6,829 (75.6%) |
| 3 or 4 Unit Apartments | 1,606 (17.2%) | 7,737 (82.8%) |
| 5 to 9 Unit Apartments | 1,126 (9.0%) | 11,383 (91.0%) |
| 10 or more Apartments | 1,415 (6.2%) | 21,451 (93.8%) |
| Mobile Home / Other | 5,875 (71.1%) | 2,394 (28.9%) |
| Total | 238,694 (73.3%) | 87,163 (26.8%) |
Housing Structures by Number of Rooms in Area Code 219
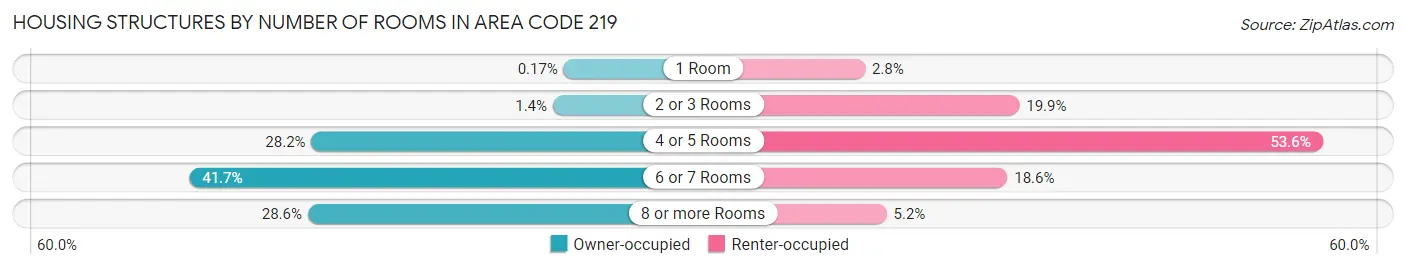
| Number of Rooms | Owner-occupied | Renter-occupied |
| 1 Room | 408 (0.2%) | 2,423 (2.8%) |
| 2 or 3 Rooms | 3,266 (1.4%) | 17,350 (19.9%) |
| 4 or 5 Rooms | 67,242 (28.2%) | 46,677 (53.5%) |
| 6 or 7 Rooms | 99,573 (41.7%) | 16,195 (18.6%) |
| 8 or more Rooms | 68,205 (28.6%) | 4,518 (5.2%) |
| Total | 238,694 (100.0%) | 87,163 (100.0%) |
Housing Structure by Heating Type in Area Code 219
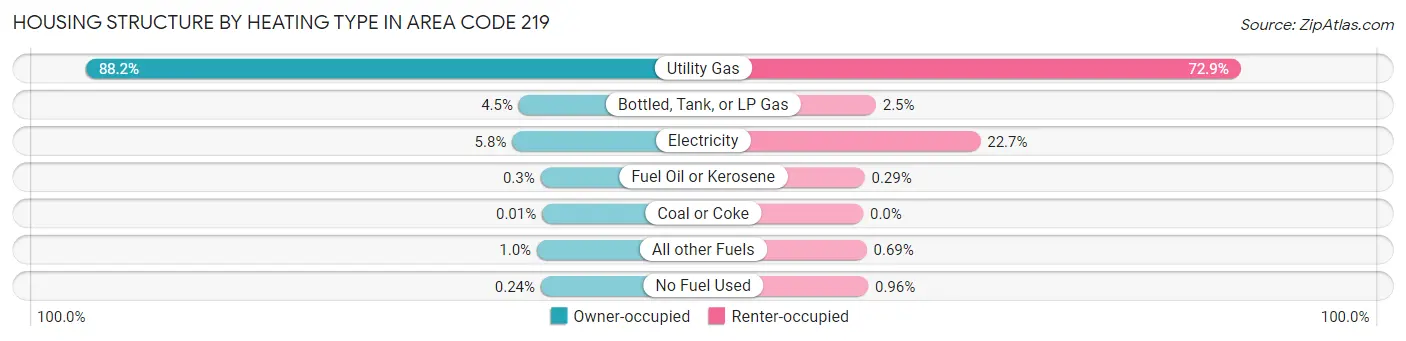
| Heating Type | Owner-occupied | Renter-occupied |
| Utility Gas | 210,500 (88.2%) | 63,574 (72.9%) |
| Bottled, Tank, or LP Gas | 10,740 (4.5%) | 2,147 (2.5%) |
| Electricity | 13,781 (5.8%) | 19,749 (22.7%) |
| Fuel Oil or Kerosene | 713 (0.3%) | 254 (0.3%) |
| Coal or Coke | 14 (0.0%) | 0 (0.0%) |
| All other Fuels | 2,385 (1.0%) | 604 (0.7%) |
| No Fuel Used | 561 (0.2%) | 835 (1.0%) |
| Total | 238,694 (100.0%) | 87,163 (100.0%) |
Household Vehicle Usage in Area Code 219
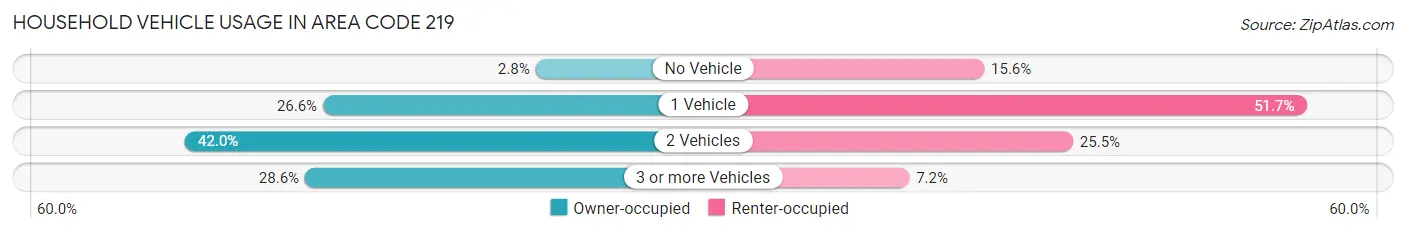
| Vehicles per Household | Owner-occupied | Renter-occupied |
| No Vehicle | 6,622 (2.8%) | 13,588 (15.6%) |
| 1 Vehicle | 63,451 (26.6%) | 45,034 (51.7%) |
| 2 Vehicles | 100,353 (42.0%) | 22,263 (25.5%) |
| 3 or more Vehicles | 68,268 (28.6%) | 6,278 (7.2%) |
| Total | 238,694 (100.0%) | 87,163 (100.0%) |
Real Estate & Mortgages in Area Code 219
Real Estate and Mortgage Overview in Area Code 219
| Characteristic | Without Mortgage | With Mortgage |
| Housing Units | 86,143 | 152,551 |
| Median Property Value | $10,724,400 | $11,408,200 |
| Median Household Income | $3,879,487 | $35,850 |
| Monthly Housing Costs | $32,756 | $6,190 |
| Real Estate Taxes | $94,117 | $1,745 |
Property Value by Mortgage Status in Area Code 219
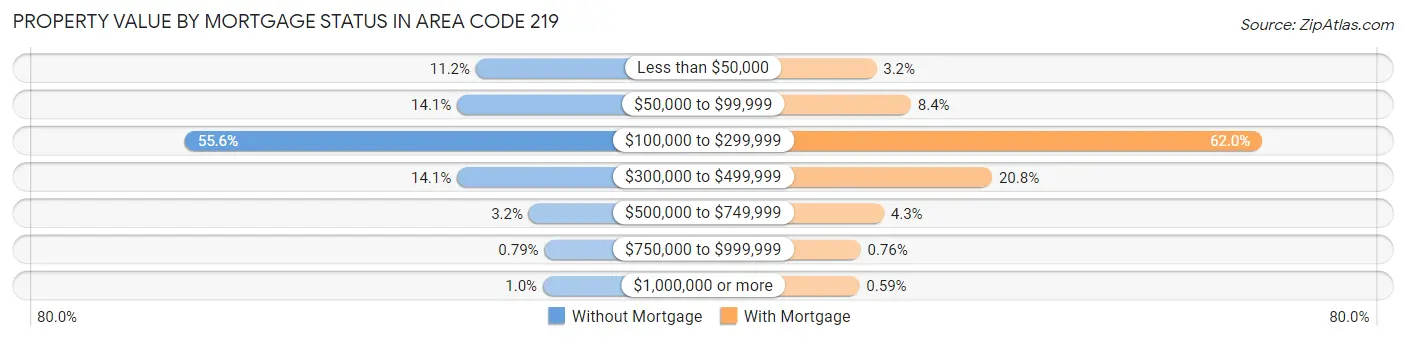
| Property Value | Without Mortgage | With Mortgage |
| Less than $50,000 | 9,681 (11.2%) | 4,816 (3.2%) |
| $50,000 to $99,999 | 12,140 (14.1%) | 12,864 (8.4%) |
| $100,000 to $299,999 | 47,874 (55.6%) | 94,521 (62.0%) |
| $300,000 to $499,999 | 12,154 (14.1%) | 31,710 (20.8%) |
| $500,000 to $749,999 | 2,730 (3.2%) | 6,581 (4.3%) |
| $750,000 to $999,999 | 683 (0.8%) | 1,161 (0.8%) |
| $1,000,000 or more | 881 (1.0%) | 898 (0.6%) |
| Total | 86,143 (100.0%) | 152,551 (100.0%) |
Household Income by Mortgage Status in Area Code 219
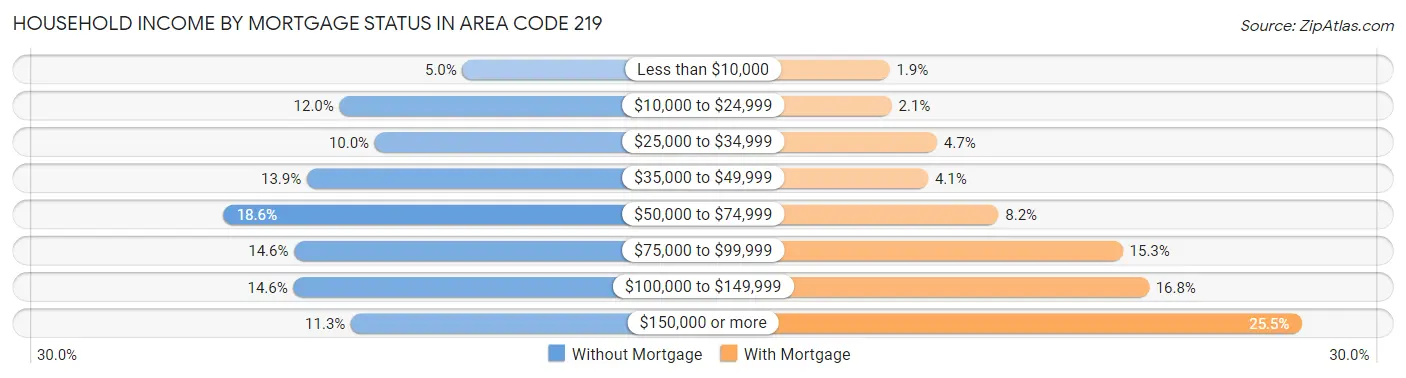
| Household Income | Without Mortgage | With Mortgage |
| Less than $10,000 | 4,283 (5.0%) | 2,967 (1.9%) |
| $10,000 to $24,999 | 10,341 (12.0%) | 3,148 (2.1%) |
| $25,000 to $34,999 | 8,597 (10.0%) | 7,089 (4.6%) |
| $35,000 to $49,999 | 11,943 (13.9%) | 6,321 (4.1%) |
| $50,000 to $74,999 | 16,039 (18.6%) | 12,455 (8.2%) |
| $75,000 to $99,999 | 12,567 (14.6%) | 23,284 (15.3%) |
| $100,000 to $149,999 | 12,601 (14.6%) | 25,549 (16.8%) |
| $150,000 or more | 9,772 (11.3%) | 38,855 (25.5%) |
| Total | 86,143 (100.0%) | 152,551 (100.0%) |
Property Value to Household Income Ratio in Area Code 219
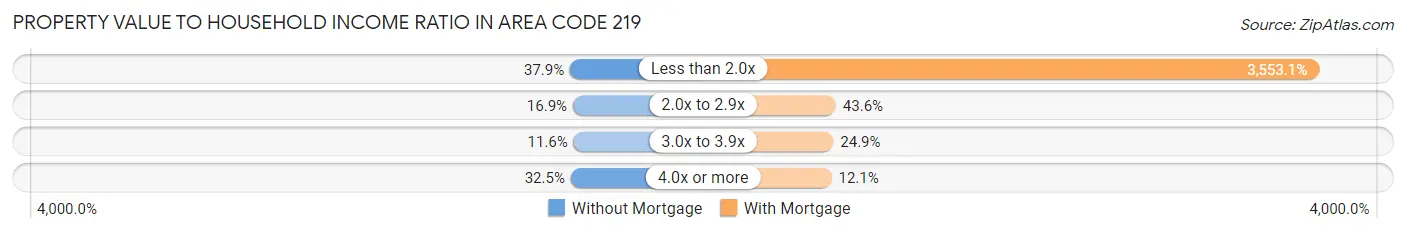
| Value-to-Income Ratio | Without Mortgage | With Mortgage |
| Less than 2.0x | 32,608 (37.9%) | 5,420,247 (3,553.1%) |
| 2.0x to 2.9x | 14,588 (16.9%) | 66,512 (43.6%) |
| 3.0x to 3.9x | 9,984 (11.6%) | 37,970 (24.9%) |
| 4.0x or more | 28,030 (32.5%) | 18,399 (12.1%) |
| Total | 86,143 (100.0%) | 152,551 (100.0%) |
Real Estate Taxes by Mortgage Status in Area Code 219
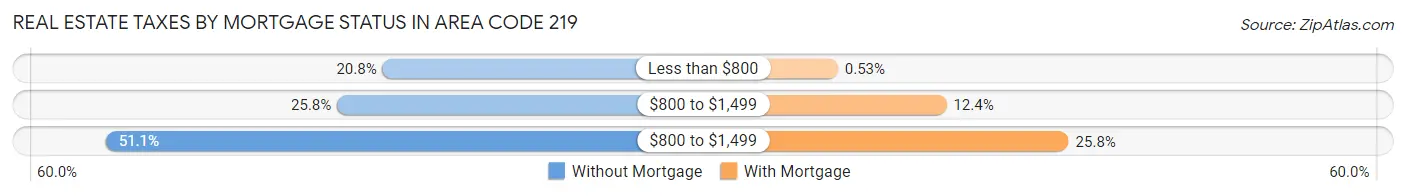
| Property Taxes | Without Mortgage | With Mortgage |
| Less than $800 | 17,904 (20.8%) | 806 (0.5%) |
| $800 to $1,499 | 22,178 (25.8%) | 18,962 (12.4%) |
| $800 to $1,499 | 44,019 (51.1%) | 39,385 (25.8%) |
| Total | 86,143 (100.0%) | 152,551 (100.0%) |
Health & Disability in Area Code 219
Health Insurance Coverage by Age in Area Code 219
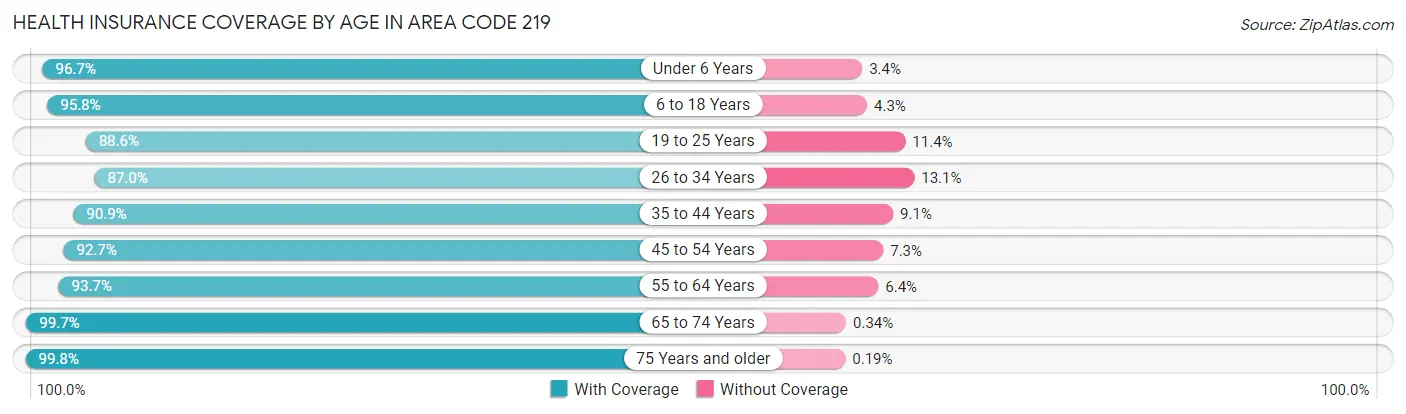
| Age Bracket | With Coverage | Without Coverage |
| Under 6 Years | 56,093 (96.7%) | 1,942 (3.4%) |
| 6 to 18 Years | 138,799 (95.8%) | 6,164 (4.3%) |
| 19 to 25 Years | 63,537 (88.6%) | 8,172 (11.4%) |
| 26 to 34 Years | 77,885 (87.0%) | 11,692 (13.1%) |
| 35 to 44 Years | 96,893 (90.9%) | 9,706 (9.1%) |
| 45 to 54 Years | 96,366 (92.7%) | 7,556 (7.3%) |
| 55 to 64 Years | 106,990 (93.6%) | 7,257 (6.4%) |
| 65 to 74 Years | 85,625 (99.7%) | 292 (0.3%) |
| 75 Years and older | 55,711 (99.8%) | 104 (0.2%) |
| Total | 777,899 (93.6%) | 52,885 (6.4%) |
Health Insurance Coverage by Citizenship Status in Area Code 219
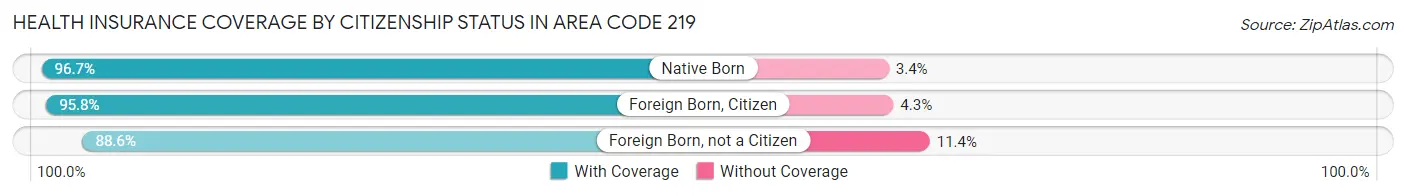
| Citizenship Status | With Coverage | Without Coverage |
| Native Born | 56,093 (96.7%) | 1,942 (3.4%) |
| Foreign Born, Citizen | 138,799 (95.8%) | 6,164 (4.3%) |
| Foreign Born, not a Citizen | 63,537 (88.6%) | 8,172 (11.4%) |
Health Insurance Coverage by Household Income in Area Code 219
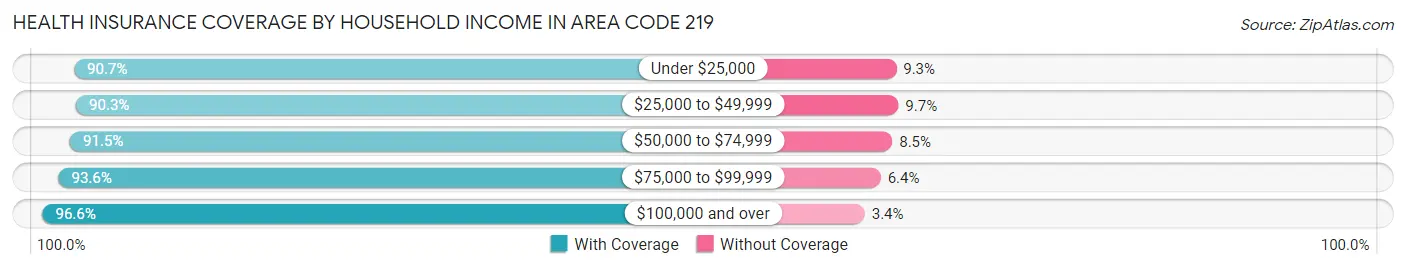
| Household Income | With Coverage | Without Coverage |
| Under $25,000 | 88,894 (90.7%) | 9,085 (9.3%) |
| $25,000 to $49,999 | 120,588 (90.3%) | 12,911 (9.7%) |
| $50,000 to $74,999 | 119,569 (91.5%) | 11,134 (8.5%) |
| $75,000 to $99,999 | 118,772 (93.6%) | 8,063 (6.4%) |
| $100,000 and over | 325,876 (96.6%) | 11,370 (3.4%) |
Public vs Private Health Insurance Coverage by Age in Area Code 219
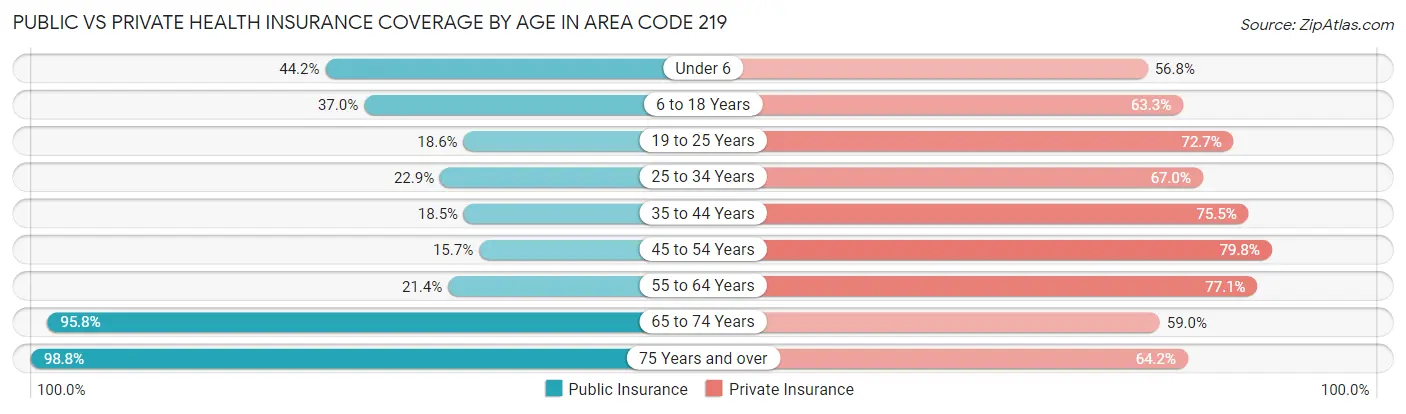
| Age Bracket | Public Insurance | Private Insurance |
| Under 6 | 25,643 (44.2%) | 32,960 (56.8%) |
| 6 to 18 Years | 53,643 (37.0%) | 91,821 (63.3%) |
| 19 to 25 Years | 13,302 (18.5%) | 52,138 (72.7%) |
| 25 to 34 Years | 20,511 (22.9%) | 60,011 (67.0%) |
| 35 to 44 Years | 19,679 (18.5%) | 80,489 (75.5%) |
| 45 to 54 Years | 16,276 (15.7%) | 82,921 (79.8%) |
| 55 to 64 Years | 24,463 (21.4%) | 88,129 (77.1%) |
| 65 to 74 Years | 82,291 (95.8%) | 50,706 (59.0%) |
| 75 Years and over | 55,170 (98.8%) | 35,846 (64.2%) |
| Total | 310,978 (37.4%) | 575,021 (69.2%) |
Disability Status by Sex by Age in Area Code 219
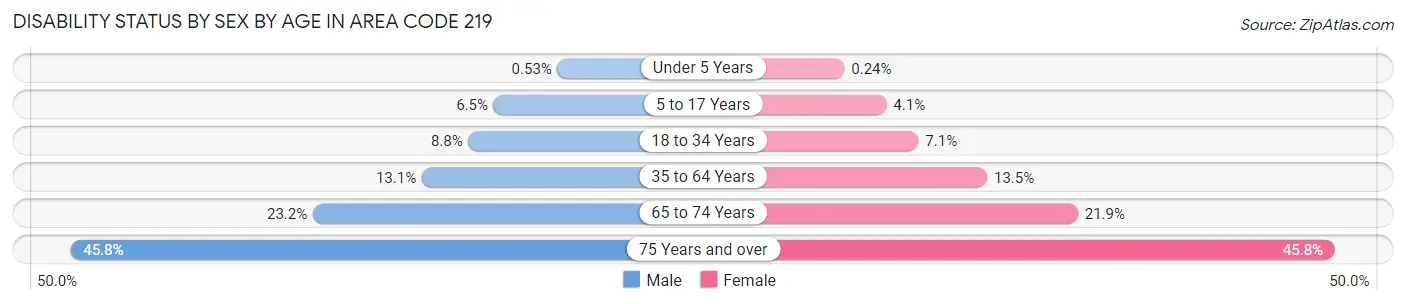
| Age Bracket | Male | Female |
| Under 5 Years | 129 (0.5%) | 57 (0.2%) |
| 5 to 17 Years | 4,756 (6.5%) | 2,906 (4.1%) |
| 18 to 34 Years | 7,681 (8.8%) | 6,063 (7.1%) |
| 35 to 64 Years | 20,924 (13.1%) | 22,281 (13.5%) |
| 65 to 74 Years | 9,442 (23.2%) | 9,913 (21.9%) |
| 75 Years and over | 10,324 (45.8%) | 15,218 (45.8%) |
Disability Class by Sex by Age in Area Code 219
Disability Class: Hearing Difficulty
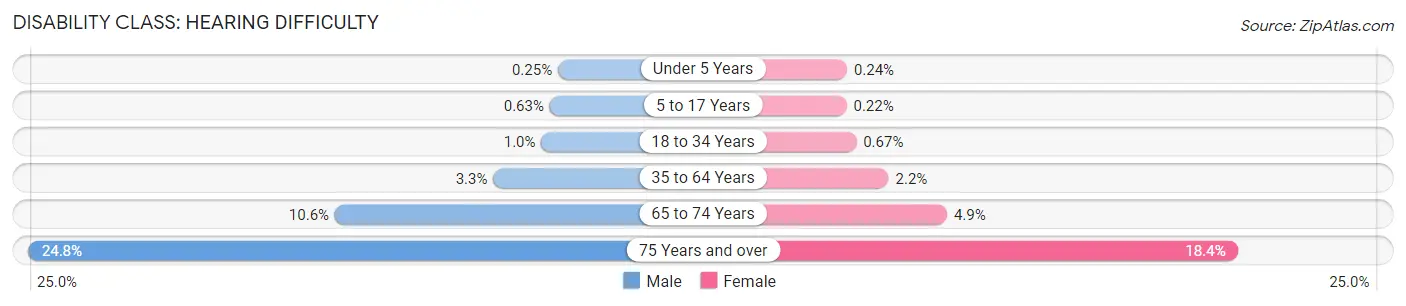
| Age Bracket | Male | Female |
| Under 5 Years | 61 (0.3%) | 57 (0.2%) |
| 5 to 17 Years | 466 (0.6%) | 158 (0.2%) |
| 18 to 34 Years | 894 (1.0%) | 574 (0.7%) |
| 35 to 64 Years | 5,178 (3.3%) | 3,595 (2.2%) |
| 65 to 74 Years | 4,311 (10.6%) | 2,208 (4.9%) |
| 75 Years and over | 5,595 (24.8%) | 6,107 (18.4%) |
Disability Class: Vision Difficulty
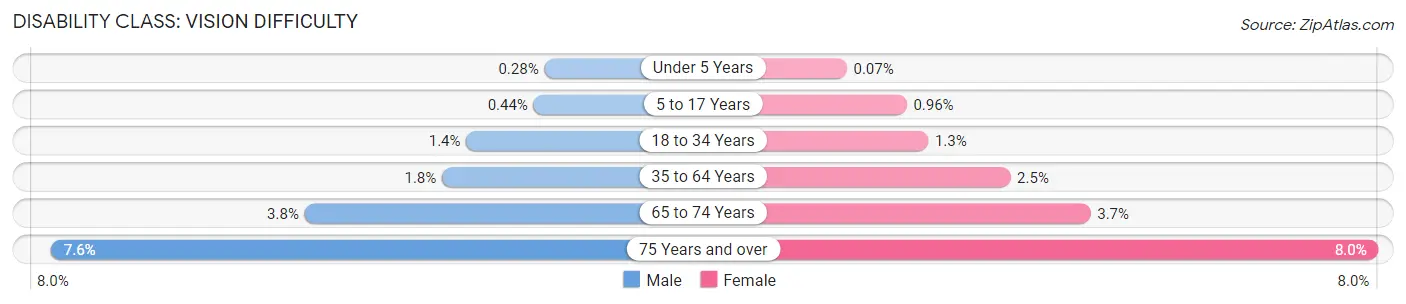
| Age Bracket | Male | Female |
| Under 5 Years | 68 (0.3%) | 16 (0.1%) |
| 5 to 17 Years | 323 (0.4%) | 675 (1.0%) |
| 18 to 34 Years | 1,261 (1.4%) | 1,094 (1.3%) |
| 35 to 64 Years | 2,867 (1.8%) | 4,135 (2.5%) |
| 65 to 74 Years | 1,561 (3.8%) | 1,671 (3.7%) |
| 75 Years and over | 1,716 (7.6%) | 2,650 (8.0%) |
Disability Class: Cognitive Difficulty
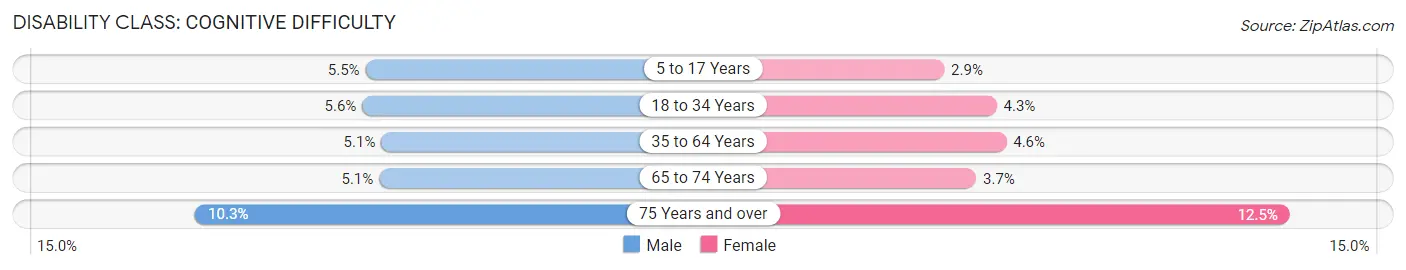
| Age Bracket | Male | Female |
| 5 to 17 Years | 4,061 (5.5%) | 2,002 (2.9%) |
| 18 to 34 Years | 4,889 (5.6%) | 3,674 (4.3%) |
| 35 to 64 Years | 8,081 (5.1%) | 7,576 (4.6%) |
| 65 to 74 Years | 2,087 (5.1%) | 1,694 (3.7%) |
| 75 Years and over | 2,312 (10.2%) | 4,146 (12.5%) |
Disability Class: Ambulatory Difficulty
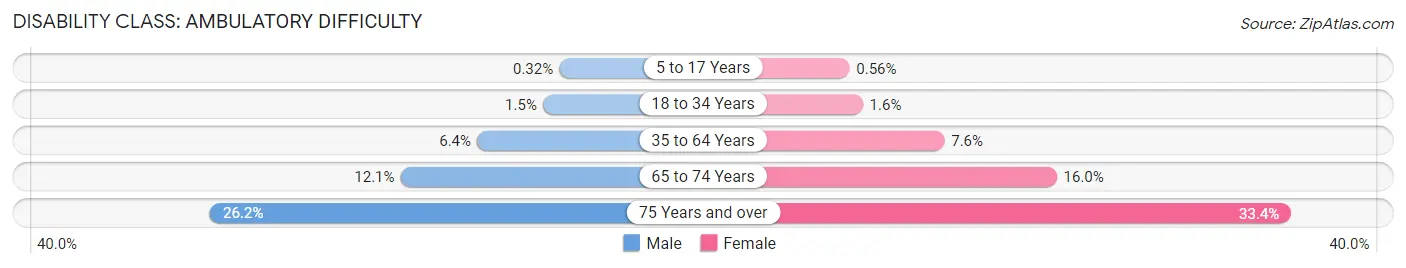
| Age Bracket | Male | Female |
| 5 to 17 Years | 235 (0.3%) | 392 (0.6%) |
| 18 to 34 Years | 1,332 (1.5%) | 1,318 (1.5%) |
| 35 to 64 Years | 10,240 (6.4%) | 12,580 (7.6%) |
| 65 to 74 Years | 4,918 (12.1%) | 7,222 (16.0%) |
| 75 Years and over | 5,917 (26.2%) | 11,093 (33.4%) |
Disability Class: Self-Care Difficulty
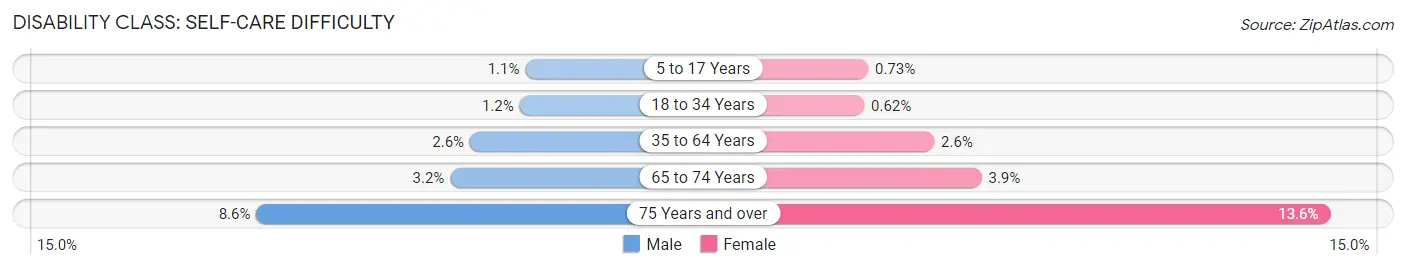
| Age Bracket | Male | Female |
| 5 to 17 Years | 784 (1.1%) | 515 (0.7%) |
| 18 to 34 Years | 1,061 (1.2%) | 527 (0.6%) |
| 35 to 64 Years | 4,144 (2.6%) | 4,250 (2.6%) |
| 65 to 74 Years | 1,280 (3.2%) | 1,762 (3.9%) |
| 75 Years and over | 1,930 (8.6%) | 4,521 (13.6%) |
Technology Access in Area Code 219
Computing Device Access in Area Code 219
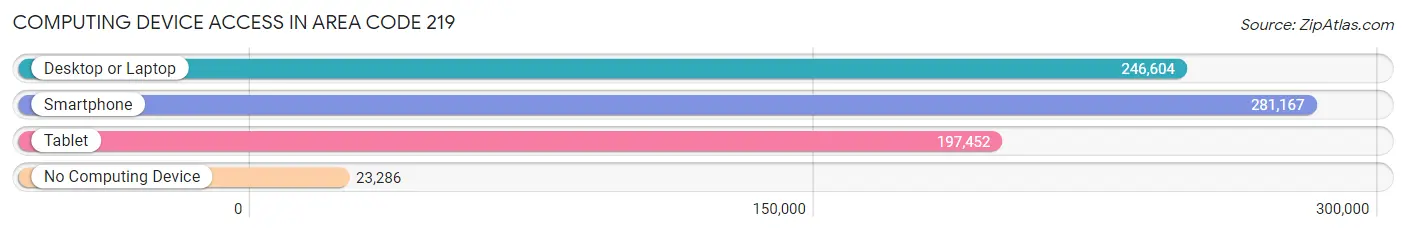
| Device Type | # Households | % Households |
| Desktop or Laptop | 246,604 | 75.7% |
| Smartphone | 281,167 | 86.3% |
| Tablet | 197,452 | 60.6% |
| No Computing Device | 23,286 | 7.1% |
| Total | 325,857 | 100.0% |
Internet Access in Area Code 219
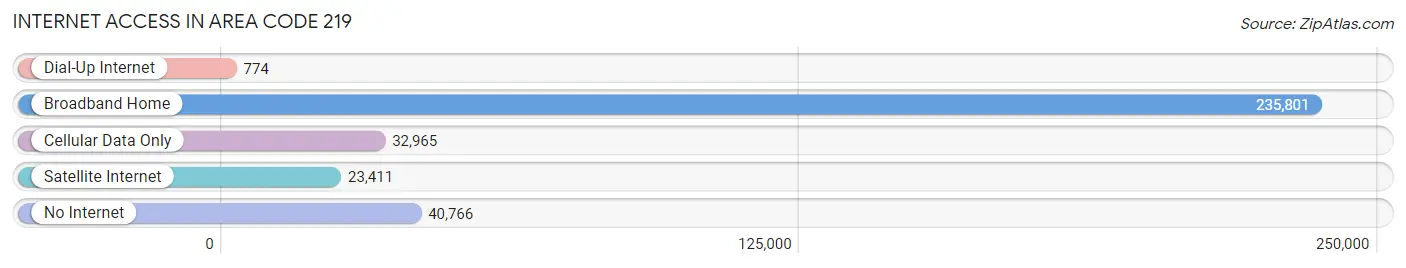
| Internet Type | # Households | % Households |
| Dial-Up Internet | 774 | 0.2% |
| Broadband Home | 235,801 | 72.4% |
| Cellular Data Only | 32,965 | 10.1% |
| Satellite Internet | 23,411 | 7.2% |
| No Internet | 40,766 | 12.5% |
| Total | 325,857 | 100.0% |
Area Code 219 Summary
Geography
Area code 219 is located in the northwestern corner of Indiana, covering Lake, Porter, LaPorte, and Starke counties. It is bordered by Michigan to the north, Illinois to the east, and Ohio to the east and south.
Social
The area code 219 region is home to a diverse population of people from all walks of life. The region is known for its strong sense of community and its friendly, welcoming atmosphere. Residents of the area code 219 region enjoy a variety of outdoor activities, including fishing, boating, and camping.
Economics
The area code 219 region is home to a variety of industries, including manufacturing, healthcare, and education. The region is also home to a number of small businesses, including restaurants, retail stores, and service providers. The region is known for its low unemployment rate and strong economic growth.
Demographics
The area code 219 region is home to a diverse population of people from all walks of life. The population is primarily white, with a significant Hispanic population. The median household income in the region is slightly higher than the national average. The region is also home to a large number of college-educated individuals.
Common Questions
What is Per Capita Income in Area Code 219?
Per Capita income in Area Code 219 is $33,146.
What is the Median Family Income in Area Code 219?
Median Family Income in Area Code 219 is $81,779.
What is the Median Household income in Area Code 219?
Median Household Income in Area Code 219 is $68,442.
What is Income or Wage Gap in Area Code 219?
Income or Wage Gap in Area Code 219 is 38.3%.
Women in Area Code 219 earn 61.7 cents for every dollar earned by a man.
What is Family Income Deficit in Area Code 219?
Family Income Deficit in Area Code 219 is $10,932.
Families that are below poverty line in Area Code 219 earn $10,932 less on average than the poverty threshold level.
What is Inequality or Gini Index in Area Code 219?
Inequality or Gini Index in Area Code 219 is 26.69.
What is the Total Population of Area Code 219?
Total Population of Area Code 219 is 843,690.
What is the Total Male Population of Area Code 219?
Total Male Population of Area Code 219 is 417,521.
What is the Total Female Population of Area Code 219?
Total Female Population of Area Code 219 is 426,169.
What is the Ratio of Males per 100 Females in Area Code 219?
There are 97.97 Males per 100 Females in Area Code 219.
What is the Ratio of Females per 100 Males in Area Code 219?
There are 102.07 Females per 100 Males in Area Code 219.
What is the Median Population Age in Area Code 219?
Median Population Age in Area Code 219 is 42.5 Years.
What is the Average Family Size in Area Code 219
Average Family Size in Area Code 219 is 3.1 People.
What is the Average Household Size in Area Code 219
Average Household Size in Area Code 219 is 2.5 People.
How Large is the Labor Force in Area Code 219?
There are 399,542 People in the Labor Forcein in Area Code 219.
What is the Percentage of People in the Labor Force in Area Code 219?
59.2% of People are in the Labor Force in Area Code 219.
What is the Unemployment Rate in Area Code 219?
Unemployment Rate in Area Code 219 is 7.0%.