Bloomington, IN Map & Demographics
Bloomington Map
Bloomington Overview
$31,069
PER CAPITA INCOME
$85,448
AVG FAMILY INCOME
$46,543
AVG HOUSEHOLD INCOME
27.3%
WAGE / INCOME GAP [ % ]
72.7¢/ $1
WAGE / INCOME GAP [ $ ]
$11,983
FAMILY INCOME DEFICIT
0.54
INEQUALITY / GINI INDEX
79,006
TOTAL POPULATION
39,839
MALE POPULATION
39,167
FEMALE POPULATION
101.72
MALES / 100 FEMALES
98.31
FEMALES / 100 MALES
24.4
MEDIAN AGE
2.7
AVG FAMILY SIZE
2.0
AVG HOUSEHOLD SIZE
41,632
LABOR FORCE [ PEOPLE ]
58.5%
PERCENT IN LABOR FORCE
6.5%
UNEMPLOYMENT RATE
Bloomington Area Codes
Income in Bloomington
Income Overview in Bloomington
Per Capita Income in Bloomington is $31,069, while median incomes of families and households are $85,448 and $46,543 respectively.
| Characteristic | Number | Measure |
| Per Capita Income | 79,006 | $31,069 |
| Median Family Income | 11,751 | $85,448 |
| Mean Family Income | 11,751 | $116,840 |
| Median Household Income | 32,592 | $46,543 |
| Mean Household Income | 32,592 | $71,517 |
| Income Deficit | 11,751 | $11,983 |
| Wage / Income Gap (%) | 79,006 | 27.27% |
| Wage / Income Gap ($) | 79,006 | 72.73¢ per $1 |
| Gini / Inequality Index | 79,006 | 0.54 |
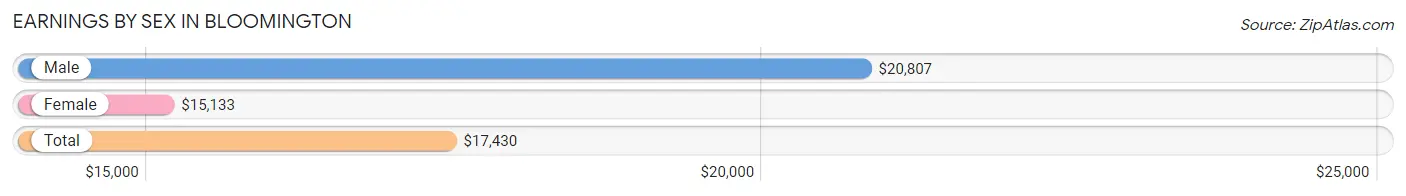
Earnings by Sex in Bloomington
Average Earnings in Bloomington are $17,430, $20,807 for men and $15,133 for women, a difference of 27.3%.
| Sex | Number | Average Earnings |
| Male | 27,530 (53.1%) | $20,807 |
| Female | 24,345 (46.9%) | $15,133 |
| Total | 51,875 (100.0%) | $17,430 |
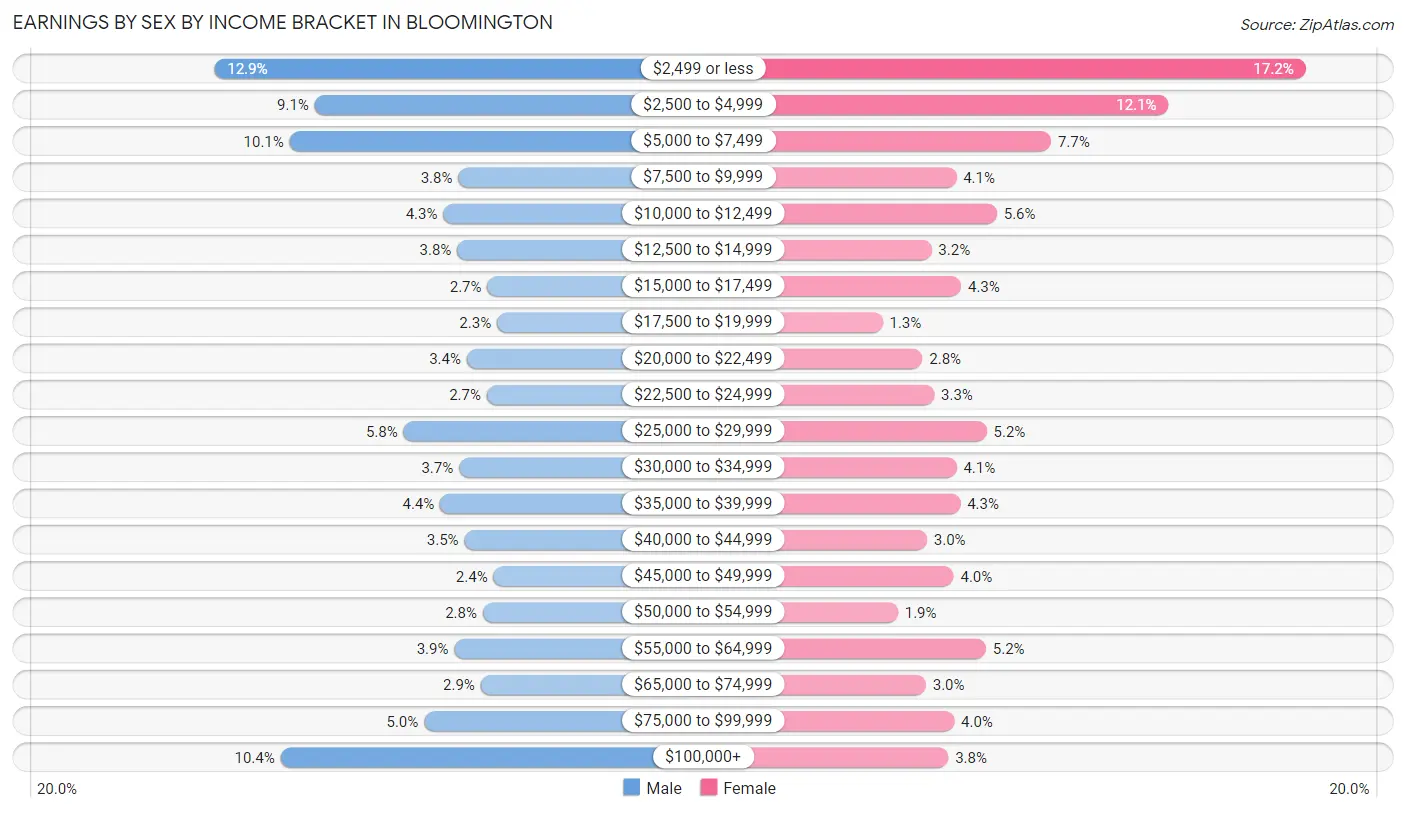
Earnings by Sex by Income Bracket in Bloomington
The most common earnings brackets in Bloomington are $2,499 or less for men (3,548 | 12.9%) and $2,499 or less for women (4,186 | 17.2%).
| Income | Male | Female |
| $2,499 or less | 3,548 (12.9%) | 4,186 (17.2%) |
| $2,500 to $4,999 | 2,513 (9.1%) | 2,933 (12.0%) |
| $5,000 to $7,499 | 2,773 (10.1%) | 1,862 (7.6%) |
| $7,500 to $9,999 | 1,032 (3.7%) | 997 (4.1%) |
| $10,000 to $12,499 | 1,186 (4.3%) | 1,367 (5.6%) |
| $12,500 to $14,999 | 1,044 (3.8%) | 772 (3.2%) |
| $15,000 to $17,499 | 731 (2.7%) | 1,043 (4.3%) |
| $17,500 to $19,999 | 633 (2.3%) | 326 (1.3%) |
| $20,000 to $22,499 | 945 (3.4%) | 690 (2.8%) |
| $22,500 to $24,999 | 739 (2.7%) | 795 (3.3%) |
| $25,000 to $29,999 | 1,598 (5.8%) | 1,276 (5.2%) |
| $30,000 to $34,999 | 1,023 (3.7%) | 1,001 (4.1%) |
| $35,000 to $39,999 | 1,219 (4.4%) | 1,035 (4.3%) |
| $40,000 to $44,999 | 969 (3.5%) | 730 (3.0%) |
| $45,000 to $49,999 | 669 (2.4%) | 973 (4.0%) |
| $50,000 to $54,999 | 779 (2.8%) | 466 (1.9%) |
| $55,000 to $64,999 | 1,075 (3.9%) | 1,269 (5.2%) |
| $65,000 to $74,999 | 802 (2.9%) | 720 (3.0%) |
| $75,000 to $99,999 | 1,385 (5.0%) | 979 (4.0%) |
| $100,000+ | 2,867 (10.4%) | 925 (3.8%) |
| Total | 27,530 (100.0%) | 24,345 (100.0%) |
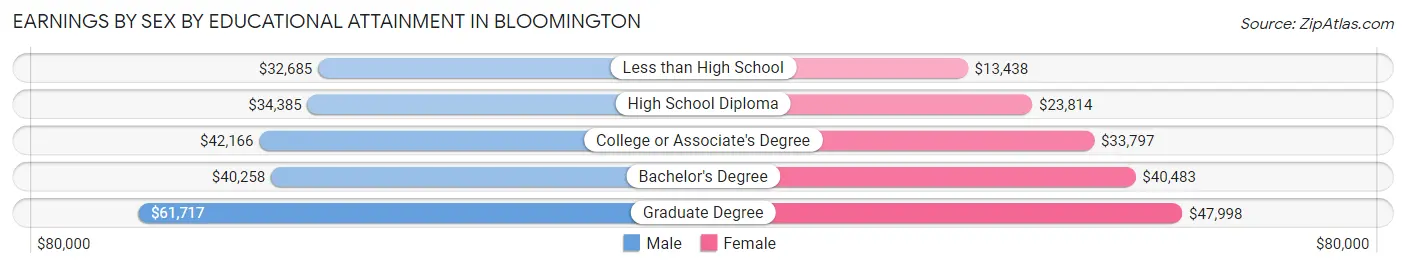
Earnings by Sex by Educational Attainment in Bloomington
Average earnings in Bloomington are $41,647 for men and $37,824 for women, a difference of 9.2%. Men with an educational attainment of graduate degree enjoy the highest average annual earnings of $61,717, while those with less than high school education earn the least with $32,685. Women with an educational attainment of graduate degree earn the most with the average annual earnings of $47,998, while those with less than high school education have the smallest earnings of $13,438.
| Educational Attainment | Male Income | Female Income |
| Less than High School | $32,685 | $13,438 |
| High School Diploma | $34,385 | $23,814 |
| College or Associate's Degree | $42,166 | $33,797 |
| Bachelor's Degree | $40,258 | $40,483 |
| Graduate Degree | $61,717 | $47,998 |
| Total | $41,647 | $37,824 |
Family Income in Bloomington
Family Income Brackets in Bloomington
According to the Bloomington family income data, there are 2,327 families falling into the $100,000 to $149,999 income range, which is the most common income bracket and makes up 19.8% of all families. Conversely, the $10,000 to $14,999 income bracket is the least frequent group with only 505 families (4.3%) belonging to this category.
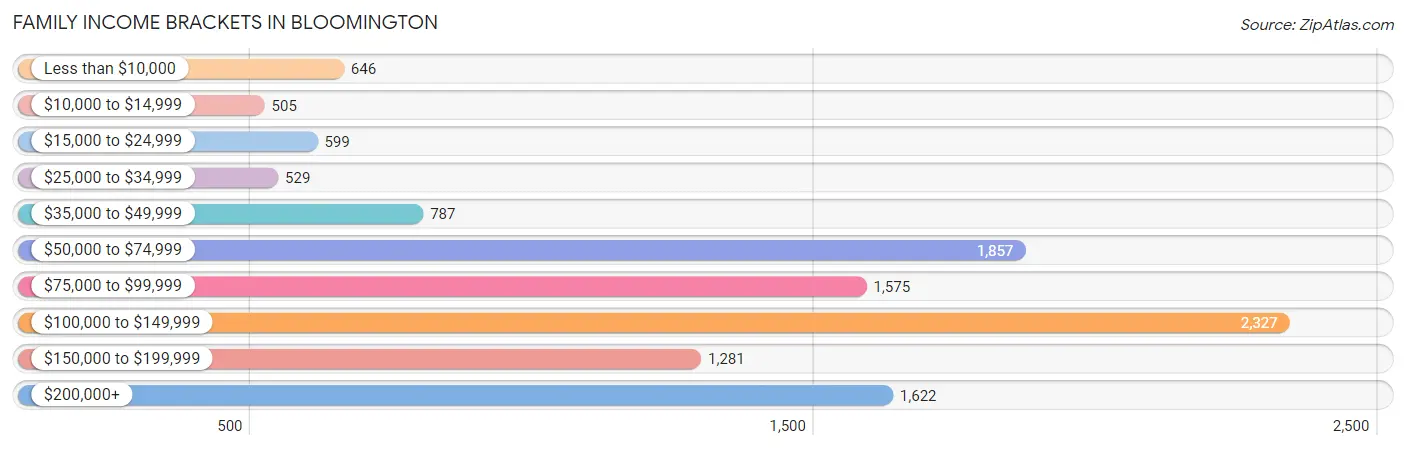
| Income Bracket | # Families | % Families |
| Less than $10,000 | 646 | 5.5% |
| $10,000 to $14,999 | 505 | 4.3% |
| $15,000 to $24,999 | 599 | 5.1% |
| $25,000 to $34,999 | 529 | 4.5% |
| $35,000 to $49,999 | 787 | 6.7% |
| $50,000 to $74,999 | 1,857 | 15.8% |
| $75,000 to $99,999 | 1,575 | 13.4% |
| $100,000 to $149,999 | 2,327 | 19.8% |
| $150,000 to $199,999 | 1,281 | 10.9% |
| $200,000+ | 1,622 | 13.8% |
Family Income by Famaliy Size in Bloomington
5-person families (458 | 3.9%) account for the highest median family income in Bloomington with $125,313 per family, while 2-person families (6,258 | 53.3%) have the highest median income of $42,079 per family member.
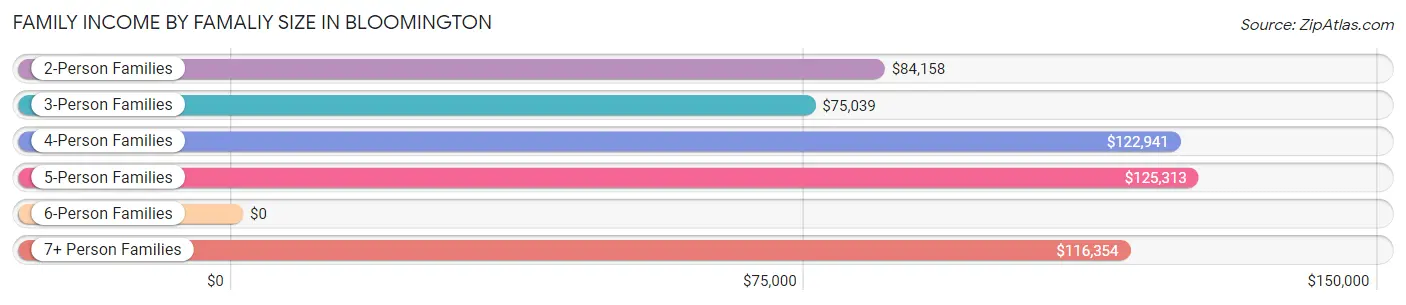
| Income Bracket | # Families | Median Income |
| 2-Person Families | 6,258 (53.3%) | $84,158 |
| 3-Person Families | 2,893 (24.6%) | $75,039 |
| 4-Person Families | 1,750 (14.9%) | $122,941 |
| 5-Person Families | 458 (3.9%) | $125,313 |
| 6-Person Families | 291 (2.5%) | $0 |
| 7+ Person Families | 101 (0.9%) | $116,354 |
| Total | 11,751 (100.0%) | $85,448 |
Family Income by Number of Earners in Bloomington
The median family income in Bloomington is $85,448, with families comprising 3+ earners (807) having the highest median family income of $165,313, while families with 1 earner (3,523) have the lowest median family income of $60,683, accounting for 6.9% and 30.0% of families, respectively.
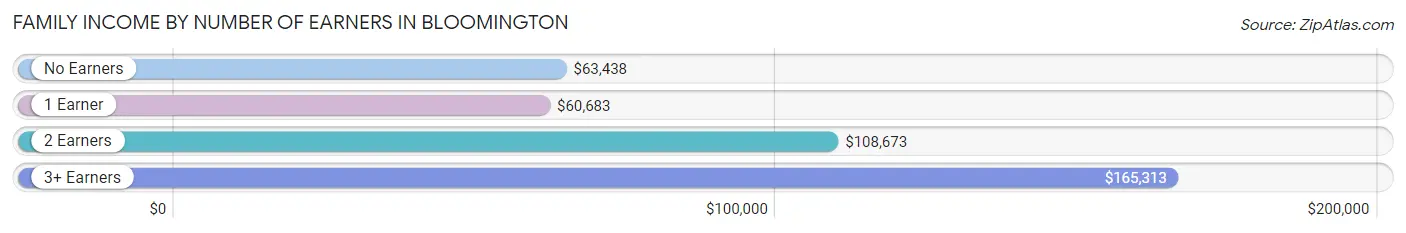
| Number of Earners | # Families | Median Income |
| No Earners | 1,614 (13.7%) | $63,438 |
| 1 Earner | 3,523 (30.0%) | $60,683 |
| 2 Earners | 5,807 (49.4%) | $108,673 |
| 3+ Earners | 807 (6.9%) | $165,313 |
| Total | 11,751 (100.0%) | $85,448 |
Household Income in Bloomington
Household Income Brackets in Bloomington
With 5,084 households falling in the category, the $50,000 to $74,999 income range is the most frequent in Bloomington, accounting for 15.6% of all households. In contrast, only 1,760 households (5.4%) fall into the $150,000 to $199,999 income bracket, making it the least populous group.
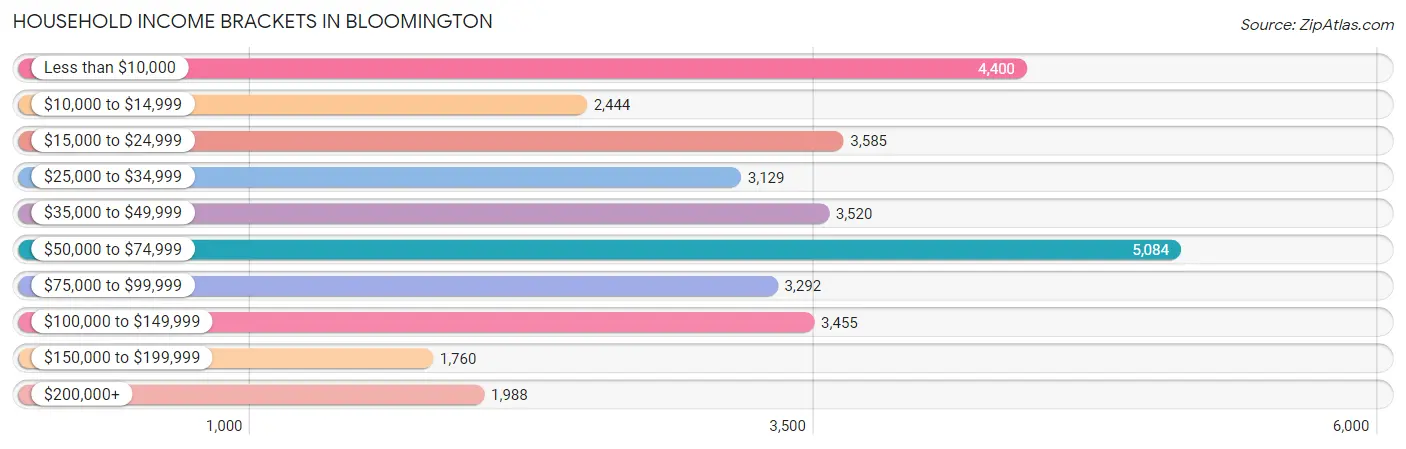
| Income Bracket | # Households | % Households |
| Less than $10,000 | 4,400 | 13.5% |
| $10,000 to $14,999 | 2,444 | 7.5% |
| $15,000 to $24,999 | 3,585 | 11.0% |
| $25,000 to $34,999 | 3,129 | 9.6% |
| $35,000 to $49,999 | 3,520 | 10.8% |
| $50,000 to $74,999 | 5,084 | 15.6% |
| $75,000 to $99,999 | 3,292 | 10.1% |
| $100,000 to $149,999 | 3,455 | 10.6% |
| $150,000 to $199,999 | 1,760 | 5.4% |
| $200,000+ | 1,988 | 6.1% |
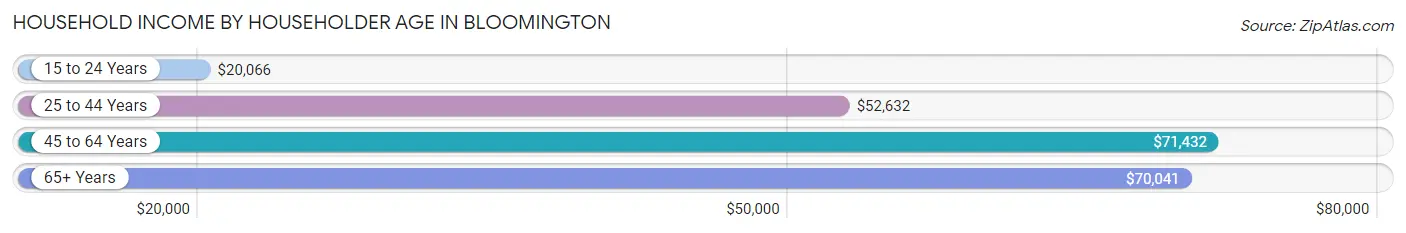
Household Income by Householder Age in Bloomington
The median household income in Bloomington is $46,543, with the highest median household income of $71,432 found in the 45 to 64 years age bracket for the primary householder. A total of 7,143 households (21.9%) fall into this category. Meanwhile, the 15 to 24 years age bracket for the primary householder has the lowest median household income of $20,066, with 8,406 households (25.8%) in this group.
| Income Bracket | # Households | Median Income |
| 15 to 24 Years | 8,406 (25.8%) | $20,066 |
| 25 to 44 Years | 11,340 (34.8%) | $52,632 |
| 45 to 64 Years | 7,143 (21.9%) | $71,432 |
| 65+ Years | 5,703 (17.5%) | $70,041 |
| Total | 32,592 (100.0%) | $46,543 |
Poverty in Bloomington
Income Below Poverty by Sex and Age in Bloomington
With 31.0% poverty level for males and 31.1% for females among the residents of Bloomington, 18 to 24 year old males and 18 to 24 year old females are the most vulnerable to poverty, with 6,704 males (68.0%) and 5,995 females (66.5%) in their respective age groups living below the poverty level.
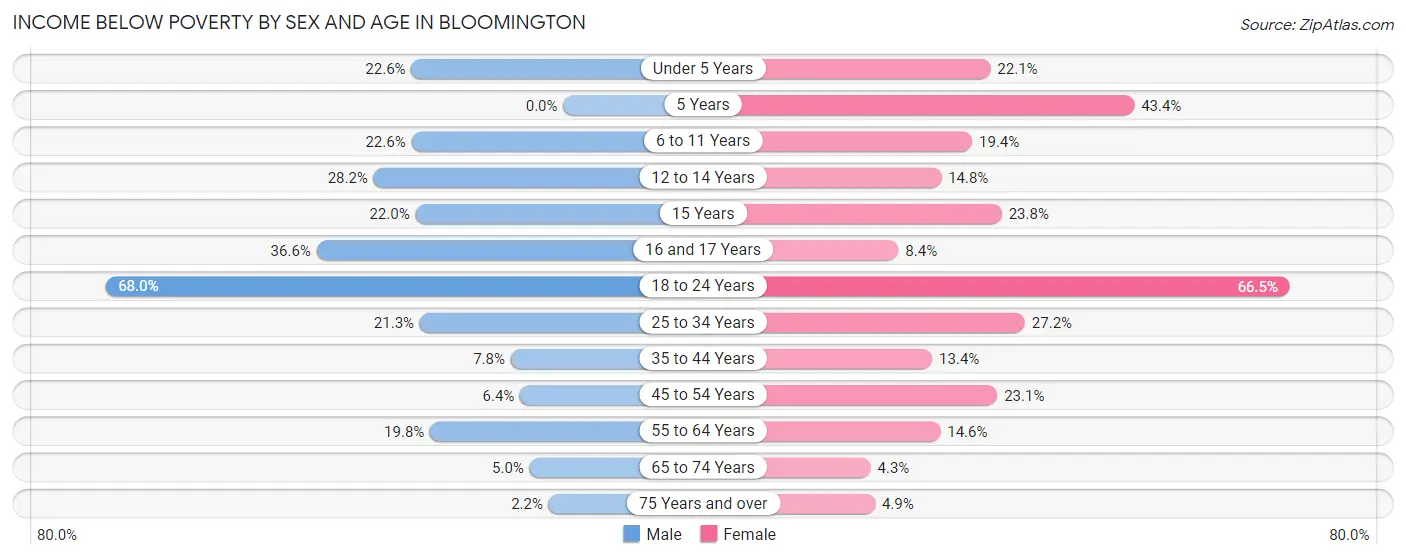
| Age Bracket | Male | Female |
| Under 5 Years | 270 (22.6%) | 311 (22.1%) |
| 5 Years | 0 (0.0%) | 99 (43.4%) |
| 6 to 11 Years | 331 (22.6%) | 225 (19.4%) |
| 12 to 14 Years | 165 (28.2%) | 98 (14.8%) |
| 15 Years | 65 (22.0%) | 90 (23.7%) |
| 16 and 17 Years | 200 (36.6%) | 37 (8.4%) |
| 18 to 24 Years | 6,704 (68.0%) | 5,995 (66.5%) |
| 25 to 34 Years | 1,291 (21.3%) | 1,395 (27.2%) |
| 35 to 44 Years | 265 (7.8%) | 467 (13.4%) |
| 45 to 54 Years | 190 (6.4%) | 608 (23.1%) |
| 55 to 64 Years | 562 (19.8%) | 384 (14.6%) |
| 65 to 74 Years | 105 (5.0%) | 111 (4.3%) |
| 75 Years and over | 28 (2.2%) | 105 (4.9%) |
| Total | 10,176 (31.0%) | 9,925 (31.1%) |
Income Above Poverty by Sex and Age in Bloomington
According to the poverty statistics in Bloomington, males aged 5 years and females aged 65 to 74 years are the age groups that are most secure financially, with 100.0% of males and 95.7% of females in these age groups living above the poverty line.
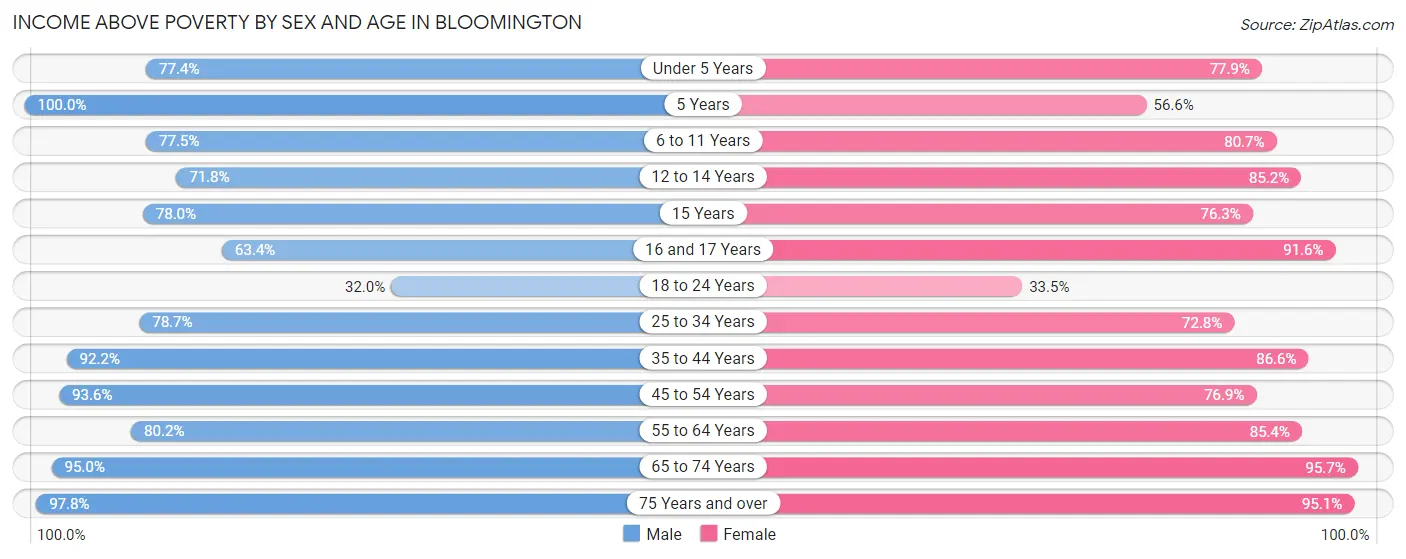
| Age Bracket | Male | Female |
| Under 5 Years | 927 (77.4%) | 1,098 (77.9%) |
| 5 Years | 175 (100.0%) | 129 (56.6%) |
| 6 to 11 Years | 1,137 (77.4%) | 938 (80.6%) |
| 12 to 14 Years | 421 (71.8%) | 566 (85.2%) |
| 15 Years | 231 (78.0%) | 289 (76.2%) |
| 16 and 17 Years | 346 (63.4%) | 403 (91.6%) |
| 18 to 24 Years | 3,152 (32.0%) | 3,019 (33.5%) |
| 25 to 34 Years | 4,769 (78.7%) | 3,735 (72.8%) |
| 35 to 44 Years | 3,132 (92.2%) | 3,013 (86.6%) |
| 45 to 54 Years | 2,776 (93.6%) | 2,026 (76.9%) |
| 55 to 64 Years | 2,279 (80.2%) | 2,241 (85.4%) |
| 65 to 74 Years | 1,994 (95.0%) | 2,484 (95.7%) |
| 75 Years and over | 1,270 (97.8%) | 2,028 (95.1%) |
| Total | 22,609 (69.0%) | 21,969 (68.9%) |
Income Below Poverty Among Married-Couple Families in Bloomington
The poverty statistics for married-couple families in Bloomington show that 4.6% or 393 of the total 8,456 families live below the poverty line. Families with 3 or 4 children have the highest poverty rate of 13.6%, comprising of 54 families. On the other hand, families with 1 or 2 children have the lowest poverty rate of 2.1%, which includes 53 families.
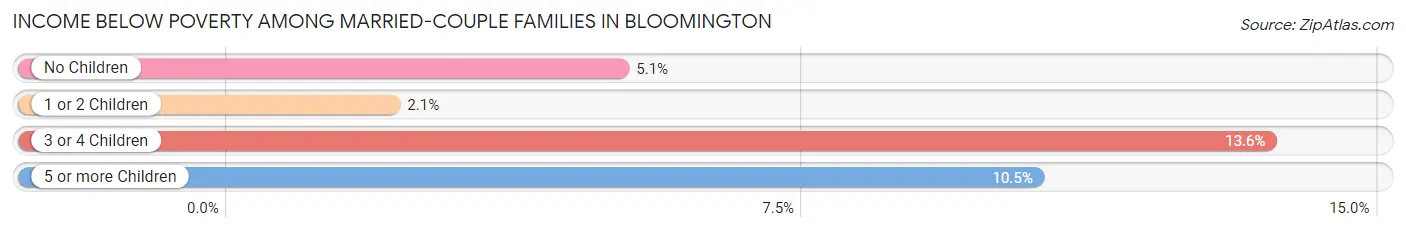
| Children | Above Poverty | Below Poverty |
| No Children | 5,235 (94.9%) | 282 (5.1%) |
| 1 or 2 Children | 2,450 (97.9%) | 53 (2.1%) |
| 3 or 4 Children | 344 (86.4%) | 54 (13.6%) |
| 5 or more Children | 34 (89.5%) | 4 (10.5%) |
| Total | 8,063 (95.4%) | 393 (4.6%) |
Income Below Poverty Among Single-Parent Households in Bloomington
According to the poverty data in Bloomington, 34.4% or 304 single-father households and 40.3% or 973 single-mother households are living below the poverty line. Among single-father households, those with 1 or 2 children have the highest poverty rate, with 143 households (37.2%) experiencing poverty. Likewise, among single-mother households, those with 5 or more children have the highest poverty rate, with 114 households (100.0%) falling below the poverty line.
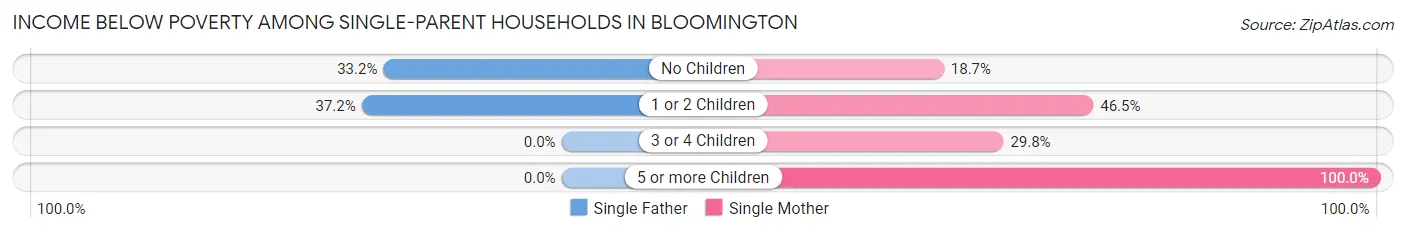
| Children | Single Father | Single Mother |
| No Children | 161 (33.2%) | 131 (18.7%) |
| 1 or 2 Children | 143 (37.2%) | 703 (46.5%) |
| 3 or 4 Children | 0 (0.0%) | 25 (29.8%) |
| 5 or more Children | 0 (0.0%) | 114 (100.0%) |
| Total | 304 (34.4%) | 973 (40.3%) |
Income Below Poverty Among Married-Couple vs Single-Parent Households in Bloomington
The poverty data for Bloomington shows that 393 of the married-couple family households (4.6%) and 1,277 of the single-parent households (38.8%) are living below the poverty level. Within the married-couple family households, those with 3 or 4 children have the highest poverty rate, with 54 households (13.6%) falling below the poverty line. Among the single-parent households, those with 5 or more children have the highest poverty rate, with 114 household (100.0%) living below poverty.
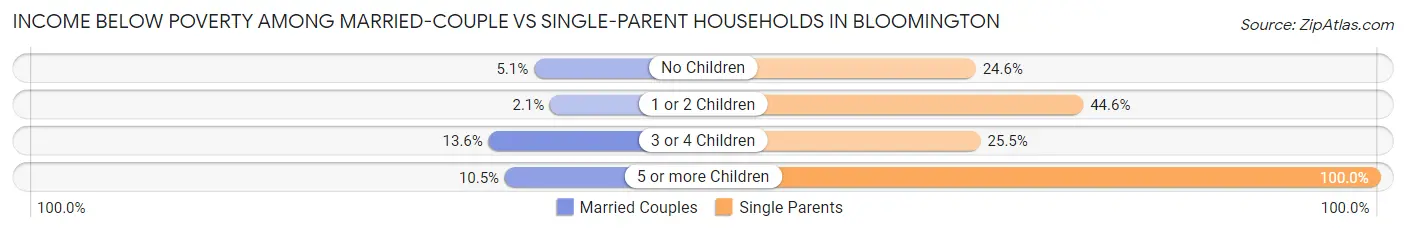
| Children | Married-Couple Families | Single-Parent Households |
| No Children | 282 (5.1%) | 292 (24.6%) |
| 1 or 2 Children | 53 (2.1%) | 846 (44.6%) |
| 3 or 4 Children | 54 (13.6%) | 25 (25.5%) |
| 5 or more Children | 4 (10.5%) | 114 (100.0%) |
| Total | 393 (4.6%) | 1,277 (38.8%) |
Race in Bloomington
The most populous races in Bloomington are White / Caucasian (62,541 | 79.2%), Asian (8,321 | 10.5%), and Black / African American (3,755 | 4.8%).
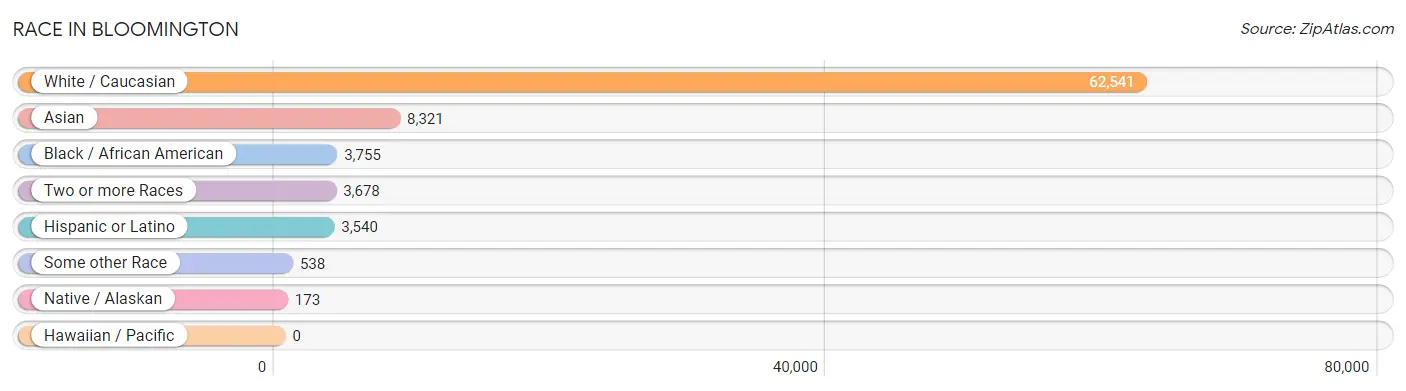
| Race | # Population | % Population |
| Asian | 8,321 | 10.5% |
| Black / African American | 3,755 | 4.8% |
| Hawaiian / Pacific | 0 | 0.0% |
| Hispanic or Latino | 3,540 | 4.5% |
| Native / Alaskan | 173 | 0.2% |
| White / Caucasian | 62,541 | 79.2% |
| Two or more Races | 3,678 | 4.7% |
| Some other Race | 538 | 0.7% |
| Total | 79,006 | 100.0% |
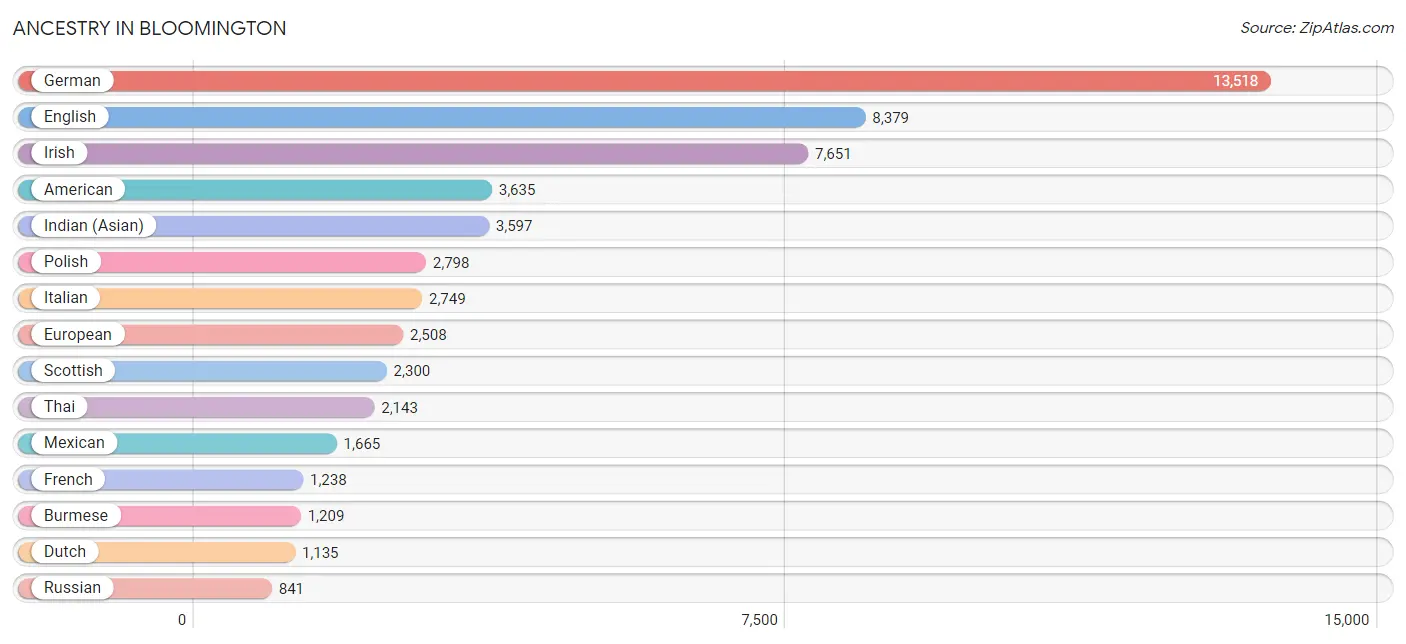
Ancestry in Bloomington
The most populous ancestries reported in Bloomington are German (13,518 | 17.1%), English (8,379 | 10.6%), Irish (7,651 | 9.7%), American (3,635 | 4.6%), and Indian (Asian) (3,597 | 4.5%), together accounting for 46.5% of all Bloomington residents.
| Ancestry | # Population | % Population |
| Afghan | 109 | 0.1% |
| African | 171 | 0.2% |
| Albanian | 12 | 0.0% |
| American | 3,635 | 4.6% |
| Arab | 680 | 0.9% |
| Argentinean | 58 | 0.1% |
| Armenian | 12 | 0.0% |
| Assyrian / Chaldean / Syriac | 7 | 0.0% |
| Austrian | 98 | 0.1% |
| Basque | 7 | 0.0% |
| Belgian | 69 | 0.1% |
| Bhutanese | 520 | 0.7% |
| Blackfeet | 6 | 0.0% |
| Brazilian | 33 | 0.0% |
| British | 626 | 0.8% |
| Bulgarian | 19 | 0.0% |
| Burmese | 1,209 | 1.5% |
| Cambodian | 53 | 0.1% |
| Canadian | 69 | 0.1% |
| Central American | 206 | 0.3% |
| Central American Indian | 39 | 0.1% |
| Cherokee | 181 | 0.2% |
| Chilean | 67 | 0.1% |
| Chippewa | 9 | 0.0% |
| Colombian | 141 | 0.2% |
| Costa Rican | 25 | 0.0% |
| Croatian | 204 | 0.3% |
| Cuban | 209 | 0.3% |
| Czech | 300 | 0.4% |
| Czechoslovakian | 69 | 0.1% |
| Danish | 276 | 0.4% |
| Dominican | 31 | 0.0% |
| Dutch | 1,135 | 1.4% |
| Eastern European | 249 | 0.3% |
| Egyptian | 161 | 0.2% |
| English | 8,379 | 10.6% |
| Estonian | 26 | 0.0% |
| Ethiopian | 52 | 0.1% |
| European | 2,508 | 3.2% |
| Filipino | 230 | 0.3% |
| Finnish | 295 | 0.4% |
| French | 1,238 | 1.6% |
| French Canadian | 80 | 0.1% |
| German | 13,518 | 17.1% |
| Ghanaian | 71 | 0.1% |
| Greek | 329 | 0.4% |
| Guatemalan | 64 | 0.1% |
| Guyanese | 12 | 0.0% |
| Haitian | 142 | 0.2% |
| Honduran | 9 | 0.0% |
| Hungarian | 327 | 0.4% |
| Icelander | 30 | 0.0% |
| Indian (Asian) | 3,597 | 4.5% |
| Indonesian | 34 | 0.0% |
| Iranian | 276 | 0.4% |
| Irish | 7,651 | 9.7% |
| Israeli | 77 | 0.1% |
| Italian | 2,749 | 3.5% |
| Jamaican | 61 | 0.1% |
| Jordanian | 28 | 0.0% |
| Kenyan | 40 | 0.1% |
| Korean | 673 | 0.9% |
| Latvian | 21 | 0.0% |
| Lebanese | 45 | 0.1% |
| Lithuanian | 235 | 0.3% |
| Macedonian | 54 | 0.1% |
| Malaysian | 14 | 0.0% |
| Mexican | 1,665 | 2.1% |
| Mexican American Indian | 40 | 0.1% |
| Mongolian | 172 | 0.2% |
| Moroccan | 9 | 0.0% |
| Native Hawaiian | 46 | 0.1% |
| Navajo | 40 | 0.1% |
| New Zealander | 13 | 0.0% |
| Nicaraguan | 31 | 0.0% |
| Nigerian | 134 | 0.2% |
| Northern European | 201 | 0.3% |
| Norwegian | 763 | 1.0% |
| Okinawan | 75 | 0.1% |
| Osage | 5 | 0.0% |
| Ottawa | 9 | 0.0% |
| Pakistani | 40 | 0.1% |
| Palestinian | 10 | 0.0% |
| Paraguayan | 21 | 0.0% |
| Peruvian | 43 | 0.1% |
| Polish | 2,798 | 3.5% |
| Portuguese | 107 | 0.1% |
| Puerto Rican | 497 | 0.6% |
| Puget Sound Salish | 21 | 0.0% |
| Romanian | 80 | 0.1% |
| Russian | 841 | 1.1% |
| Salvadoran | 72 | 0.1% |
| Scandinavian | 318 | 0.4% |
| Scotch-Irish | 808 | 1.0% |
| Scottish | 2,300 | 2.9% |
| Serbian | 178 | 0.2% |
| Shoshone | 6 | 0.0% |
| Slavic | 51 | 0.1% |
| Slovak | 247 | 0.3% |
| Slovene | 67 | 0.1% |
| South American | 555 | 0.7% |
| South American Indian | 60 | 0.1% |
| Spaniard | 141 | 0.2% |
| Spanish | 88 | 0.1% |
| Sri Lankan | 278 | 0.4% |
| Subsaharan African | 556 | 0.7% |
| Swedish | 800 | 1.0% |
| Swiss | 224 | 0.3% |
| Thai | 2,143 | 2.7% |
| Trinidadian and Tobagonian | 10 | 0.0% |
| Turkish | 77 | 0.1% |
| Ukrainian | 352 | 0.4% |
| Uruguayan | 13 | 0.0% |
| Venezuelan | 212 | 0.3% |
| Welsh | 832 | 1.1% |
| West Indian | 8 | 0.0% |
| Yugoslavian | 46 | 0.1% | View All 117 Rows |
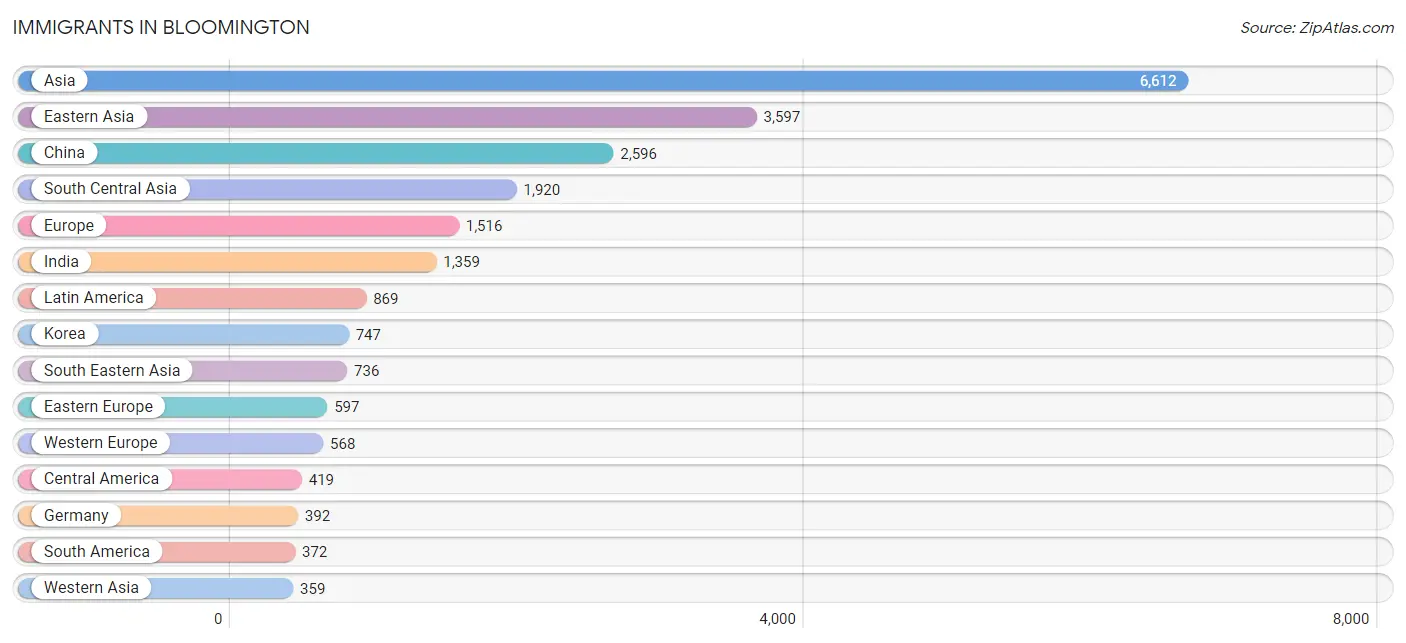
Immigrants in Bloomington
The most numerous immigrant groups reported in Bloomington came from Asia (6,612 | 8.4%), Eastern Asia (3,597 | 4.5%), China (2,596 | 3.3%), South Central Asia (1,920 | 2.4%), and Europe (1,516 | 1.9%), together accounting for 20.6% of all Bloomington residents.
| Immigration Origin | # Population | % Population |
| Afghanistan | 61 | 0.1% |
| Africa | 329 | 0.4% |
| Argentina | 20 | 0.0% |
| Asia | 6,612 | 8.4% |
| Austria | 26 | 0.0% |
| Belgium | 17 | 0.0% |
| Bosnia and Herzegovina | 27 | 0.0% |
| Brazil | 69 | 0.1% |
| Bulgaria | 19 | 0.0% |
| Canada | 148 | 0.2% |
| Caribbean | 78 | 0.1% |
| Central America | 419 | 0.5% |
| Chile | 36 | 0.1% |
| China | 2,596 | 3.3% |
| Colombia | 50 | 0.1% |
| Costa Rica | 9 | 0.0% |
| Denmark | 52 | 0.1% |
| Eastern Africa | 56 | 0.1% |
| Eastern Asia | 3,597 | 4.5% |
| Eastern Europe | 597 | 0.8% |
| Egypt | 46 | 0.1% |
| El Salvador | 9 | 0.0% |
| England | 10 | 0.0% |
| Eritrea | 12 | 0.0% |
| Ethiopia | 16 | 0.0% |
| Europe | 1,516 | 1.9% |
| France | 45 | 0.1% |
| Germany | 392 | 0.5% |
| Ghana | 25 | 0.0% |
| Guatemala | 46 | 0.1% |
| Haiti | 78 | 0.1% |
| Honduras | 9 | 0.0% |
| Hong Kong | 141 | 0.2% |
| Hungary | 33 | 0.0% |
| India | 1,359 | 1.7% |
| Iran | 107 | 0.1% |
| Iraq | 49 | 0.1% |
| Ireland | 48 | 0.1% |
| Israel | 52 | 0.1% |
| Italy | 23 | 0.0% |
| Japan | 201 | 0.3% |
| Kenya | 19 | 0.0% |
| Korea | 747 | 0.9% |
| Kuwait | 48 | 0.1% |
| Latin America | 869 | 1.1% |
| Malaysia | 163 | 0.2% |
| Mexico | 346 | 0.4% |
| Middle Africa | 34 | 0.0% |
| Moldova | 14 | 0.0% |
| Nepal | 232 | 0.3% |
| Netherlands | 88 | 0.1% |
| Nigeria | 39 | 0.1% |
| Northern Africa | 46 | 0.1% |
| Northern Europe | 228 | 0.3% |
| Norway | 1 | 0.0% |
| Pakistan | 51 | 0.1% |
| Peru | 24 | 0.0% |
| Philippines | 295 | 0.4% |
| Poland | 77 | 0.1% |
| Portugal | 25 | 0.0% |
| Romania | 46 | 0.1% |
| Russia | 188 | 0.2% |
| Saudi Arabia | 161 | 0.2% |
| Senegal | 79 | 0.1% |
| Serbia | 54 | 0.1% |
| Sierra Leone | 16 | 0.0% |
| Singapore | 94 | 0.1% |
| South Africa | 34 | 0.0% |
| South America | 372 | 0.5% |
| South Central Asia | 1,920 | 2.4% |
| South Eastern Asia | 736 | 0.9% |
| Southern Europe | 123 | 0.2% |
| Spain | 75 | 0.1% |
| Sri Lanka | 46 | 0.1% |
| Taiwan | 309 | 0.4% |
| Thailand | 36 | 0.1% |
| Turkey | 10 | 0.0% |
| Uganda | 9 | 0.0% |
| Ukraine | 139 | 0.2% |
| Uruguay | 7 | 0.0% |
| Uzbekistan | 23 | 0.0% |
| Venezuela | 145 | 0.2% |
| Vietnam | 131 | 0.2% |
| Western Africa | 159 | 0.2% |
| Western Asia | 359 | 0.4% |
| Western Europe | 568 | 0.7% | View All 86 Rows |
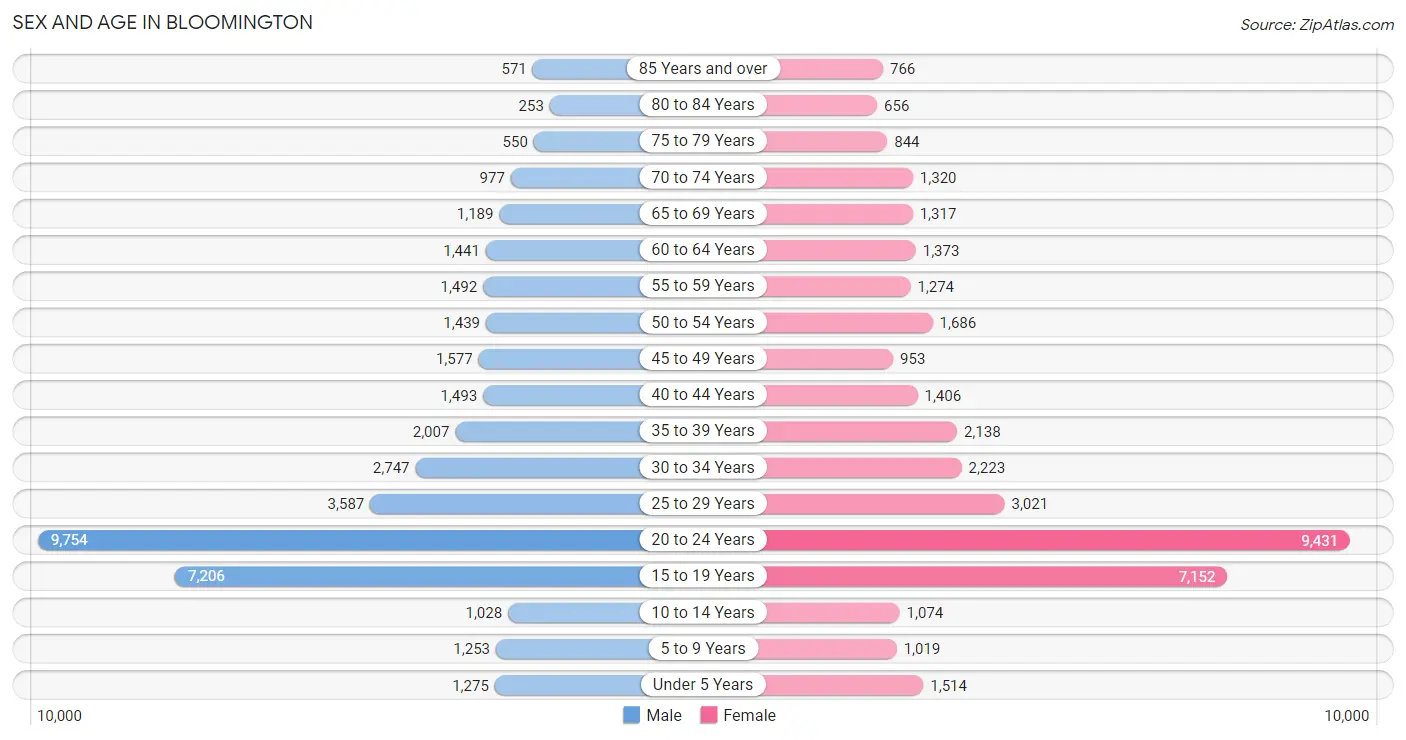
Sex and Age in Bloomington
Sex and Age in Bloomington
The most populous age groups in Bloomington are 20 to 24 Years (9,754 | 24.5%) for men and 20 to 24 Years (9,431 | 24.1%) for women.
| Age Bracket | Male | Female |
| Under 5 Years | 1,275 (3.2%) | 1,514 (3.9%) |
| 5 to 9 Years | 1,253 (3.2%) | 1,019 (2.6%) |
| 10 to 14 Years | 1,028 (2.6%) | 1,074 (2.7%) |
| 15 to 19 Years | 7,206 (18.1%) | 7,152 (18.3%) |
| 20 to 24 Years | 9,754 (24.5%) | 9,431 (24.1%) |
| 25 to 29 Years | 3,587 (9.0%) | 3,021 (7.7%) |
| 30 to 34 Years | 2,747 (6.9%) | 2,223 (5.7%) |
| 35 to 39 Years | 2,007 (5.0%) | 2,138 (5.5%) |
| 40 to 44 Years | 1,493 (3.7%) | 1,406 (3.6%) |
| 45 to 49 Years | 1,577 (4.0%) | 953 (2.4%) |
| 50 to 54 Years | 1,439 (3.6%) | 1,686 (4.3%) |
| 55 to 59 Years | 1,492 (3.7%) | 1,274 (3.3%) |
| 60 to 64 Years | 1,441 (3.6%) | 1,373 (3.5%) |
| 65 to 69 Years | 1,189 (3.0%) | 1,317 (3.4%) |
| 70 to 74 Years | 977 (2.5%) | 1,320 (3.4%) |
| 75 to 79 Years | 550 (1.4%) | 844 (2.1%) |
| 80 to 84 Years | 253 (0.6%) | 656 (1.7%) |
| 85 Years and over | 571 (1.4%) | 766 (2.0%) |
| Total | 39,839 (100.0%) | 39,167 (100.0%) |
Families and Households in Bloomington
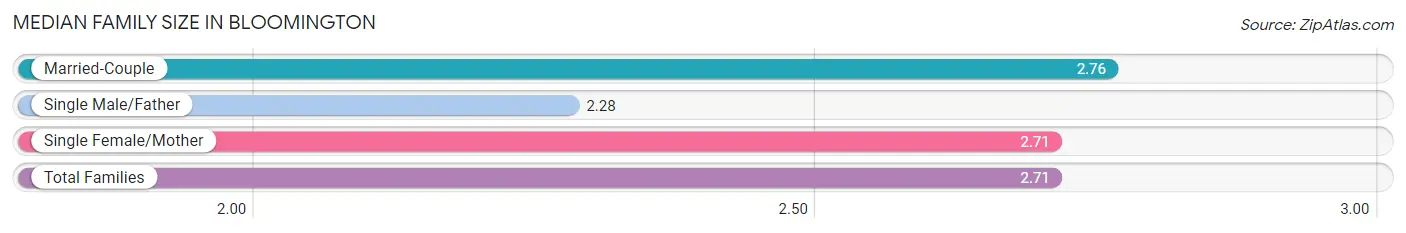
Median Family Size in Bloomington
The median family size in Bloomington is 2.71 persons per family, with married-couple families (8,456 | 72.0%) accounting for the largest median family size of 2.76 persons per family. On the other hand, single male/father families (883 | 7.5%) represent the smallest median family size with 2.28 persons per family.
| Family Type | # Families | Family Size |
| Married-Couple | 8,456 (72.0%) | 2.76 |
| Single Male/Father | 883 (7.5%) | 2.28 |
| Single Female/Mother | 2,412 (20.5%) | 2.71 |
| Total Families | 11,751 (100.0%) | 2.71 |
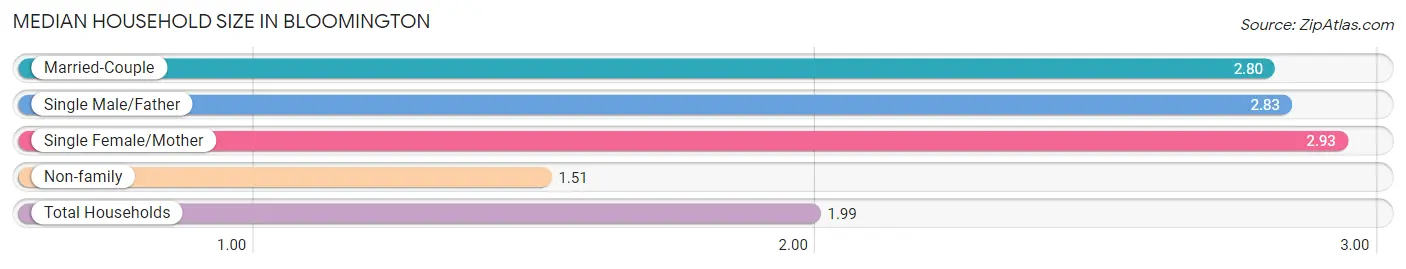
Median Household Size in Bloomington
The median household size in Bloomington is 1.99 persons per household, with single female/mother households (2,412 | 7.4%) accounting for the largest median household size of 2.93 persons per household. non-family households (20,841 | 63.9%) represent the smallest median household size with 1.51 persons per household.
| Household Type | # Households | Household Size |
| Married-Couple | 8,456 (26.0%) | 2.80 |
| Single Male/Father | 883 (2.7%) | 2.83 |
| Single Female/Mother | 2,412 (7.4%) | 2.93 |
| Non-family | 20,841 (63.9%) | 1.51 |
| Total Households | 32,592 (100.0%) | 1.99 |
Household Size by Marriage Status in Bloomington
Out of a total of 32,592 households in Bloomington, 11,751 (36.0%) are family households, while 20,841 (63.9%) are nonfamily households. The most numerous type of family households are 2-person households, comprising 5,778, and the most common type of nonfamily households are 1-person households, comprising 14,101.
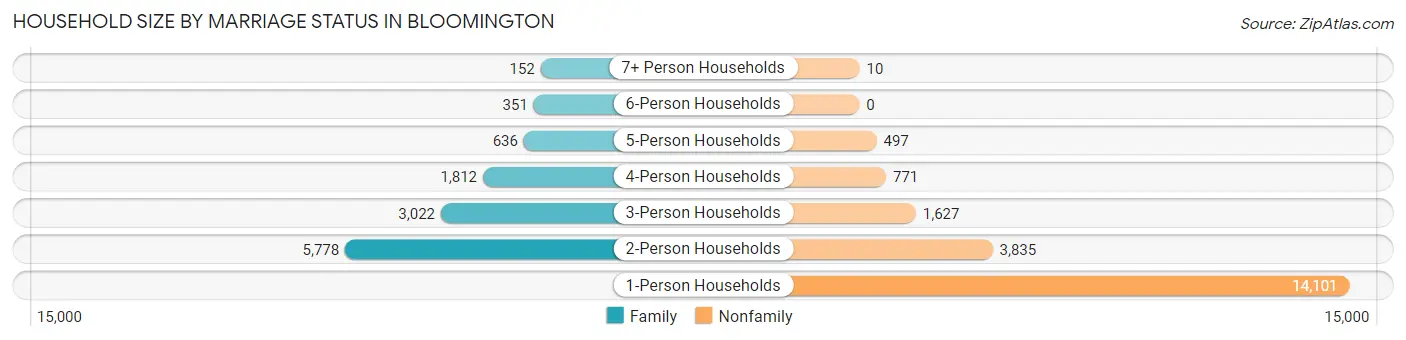
| Household Size | Family Households | Nonfamily Households |
| 1-Person Households | - | 14,101 (43.3%) |
| 2-Person Households | 5,778 (17.7%) | 3,835 (11.8%) |
| 3-Person Households | 3,022 (9.3%) | 1,627 (5.0%) |
| 4-Person Households | 1,812 (5.6%) | 771 (2.4%) |
| 5-Person Households | 636 (1.9%) | 497 (1.5%) |
| 6-Person Households | 351 (1.1%) | 0 (0.0%) |
| 7+ Person Households | 152 (0.5%) | 10 (0.0%) |
| Total | 11,751 (36.0%) | 20,841 (63.9%) |
Female Fertility in Bloomington
Fertility by Age in Bloomington
Average fertility rate in Bloomington is 19.0 births per 1,000 women. Women in the age bracket of 20 to 34 years have the highest fertility rate with 26.0 births per 1,000 women. Women in the age bracket of 20 to 34 years acount for 75.0% of all women with births.
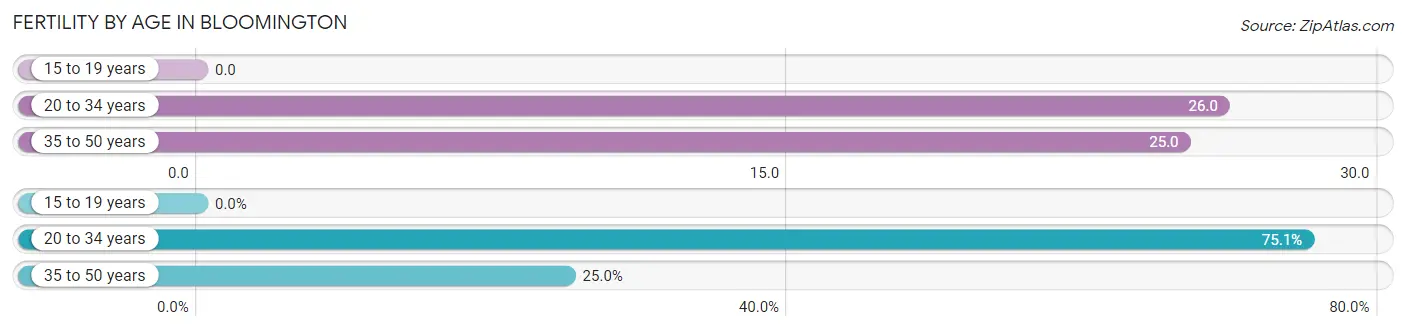
| Age Bracket | Women with Births | Births / 1,000 Women |
| 15 to 19 years | 0 (0.0%) | 0.0 |
| 20 to 34 years | 382 (75.0%) | 26.0 |
| 35 to 50 years | 127 (24.9%) | 25.0 |
| Total | 509 (100.0%) | 19.0 |
Fertility by Age by Marriage Status in Bloomington
69.5% of women with births (509) in Bloomington are married. The highest percentage of unmarried women with births falls into 20 to 34 years age bracket with 37.7% of them unmarried at the time of birth, while the lowest percentage of unmarried women with births belong to 35 to 50 years age bracket with 8.7% of them unmarried.
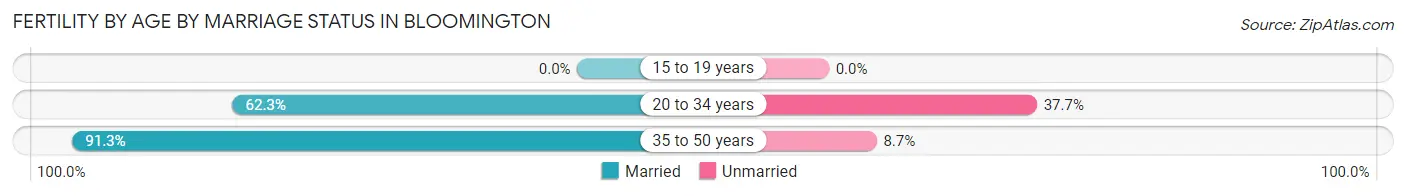
| Age Bracket | Married | Unmarried |
| 15 to 19 years | 0 (0.0%) | 0 (0.0%) |
| 20 to 34 years | 238 (62.3%) | 144 (37.7%) |
| 35 to 50 years | 116 (91.3%) | 11 (8.7%) |
| Total | 354 (69.6%) | 155 (30.4%) |
Fertility by Education in Bloomington
Average fertility rate in Bloomington is 19.0 births per 1,000 women. Women with the education attainment of graduate degree have the highest fertility rate of 48.0 births per 1,000 women, while women with the education attainment of less than high school have the lowest fertility at 8.0 births per 1,000 women. Women with the education attainment of college or associate's degree represent 48.1% of all women with births.
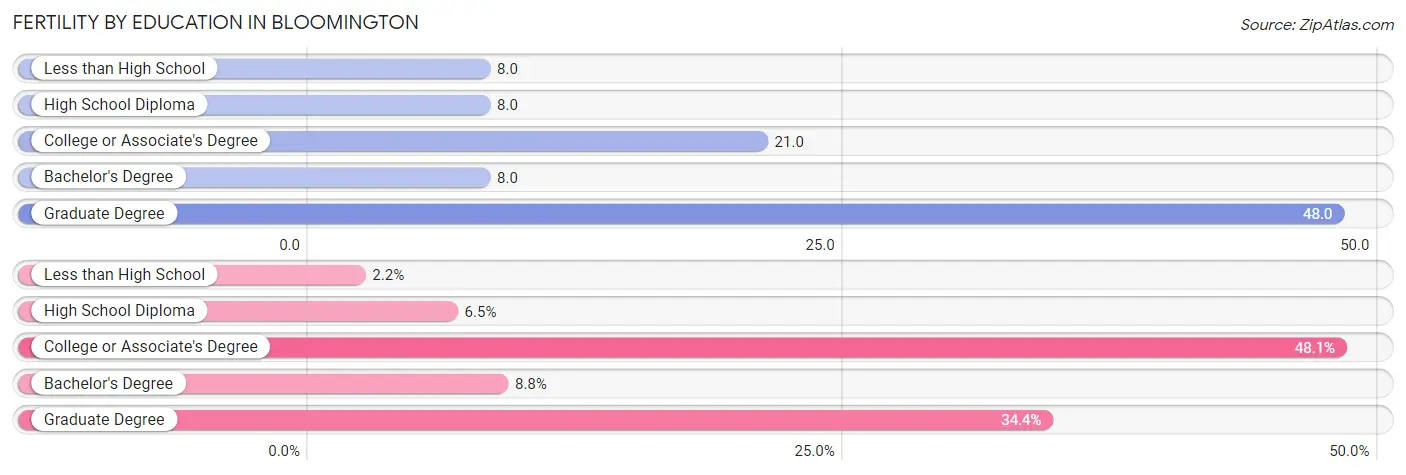
| Educational Attainment | Women with Births | Births / 1,000 Women |
| Less than High School | 11 (2.2%) | 8.0 |
| High School Diploma | 33 (6.5%) | 8.0 |
| College or Associate's Degree | 245 (48.1%) | 21.0 |
| Bachelor's Degree | 45 (8.8%) | 8.0 |
| Graduate Degree | 175 (34.4%) | 48.0 |
| Total | 509 (100.0%) | 19.0 |
Fertility by Education by Marriage Status in Bloomington
30.4% of women with births in Bloomington are unmarried. Women with the educational attainment of graduate degree are most likely to be married with 100.0% of them married at childbirth, while women with the educational attainment of less than high school are least likely to be married with 100.0% of them unmarried at childbirth.
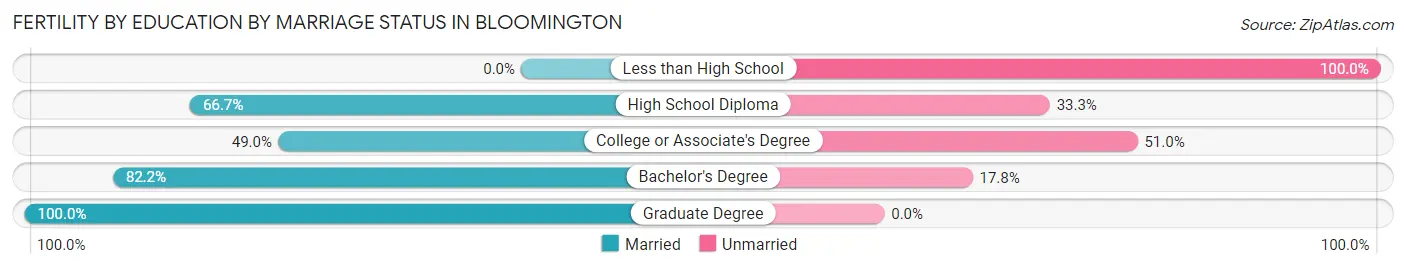
| Educational Attainment | Married | Unmarried |
| Less than High School | 0 (0.0%) | 11 (100.0%) |
| High School Diploma | 22 (66.7%) | 11 (33.3%) |
| College or Associate's Degree | 120 (49.0%) | 125 (51.0%) |
| Bachelor's Degree | 37 (82.2%) | 8 (17.8%) |
| Graduate Degree | 175 (100.0%) | 0 (0.0%) |
| Total | 354 (69.6%) | 155 (30.4%) |
Employment Characteristics in Bloomington
Employment by Class of Employer in Bloomington
Among the 37,306 employed individuals in Bloomington, private company employees (20,122 | 53.9%), state government employees (6,989 | 18.7%), and not-for-profit organizations (4,822 | 12.9%) make up the most common classes of employment.
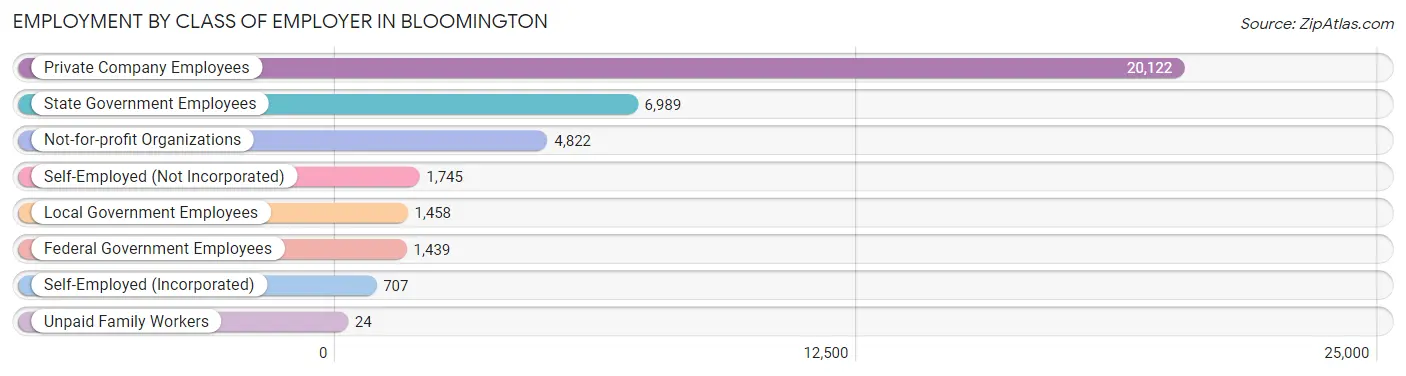
| Employer Class | # Employees | % Employees |
| Private Company Employees | 20,122 | 53.9% |
| Self-Employed (Incorporated) | 707 | 1.9% |
| Self-Employed (Not Incorporated) | 1,745 | 4.7% |
| Not-for-profit Organizations | 4,822 | 12.9% |
| Local Government Employees | 1,458 | 3.9% |
| State Government Employees | 6,989 | 18.7% |
| Federal Government Employees | 1,439 | 3.9% |
| Unpaid Family Workers | 24 | 0.1% |
| Total | 37,306 | 100.0% |
Employment Status by Age in Bloomington
According to the labor force statistics for Bloomington, out of the total population over 16 years of age (71,165), 58.5% or 41,632 individuals are in the labor force, with 6.5% or 2,706 of them unemployed. The age group with the highest labor force participation rate is 45 to 54 years, with 85.5% or 4,835 individuals in the labor force. Within the labor force, the 16 to 19 years age range has the highest percentage of unemployed individuals, with 17.0% or 702 of them being unemployed.
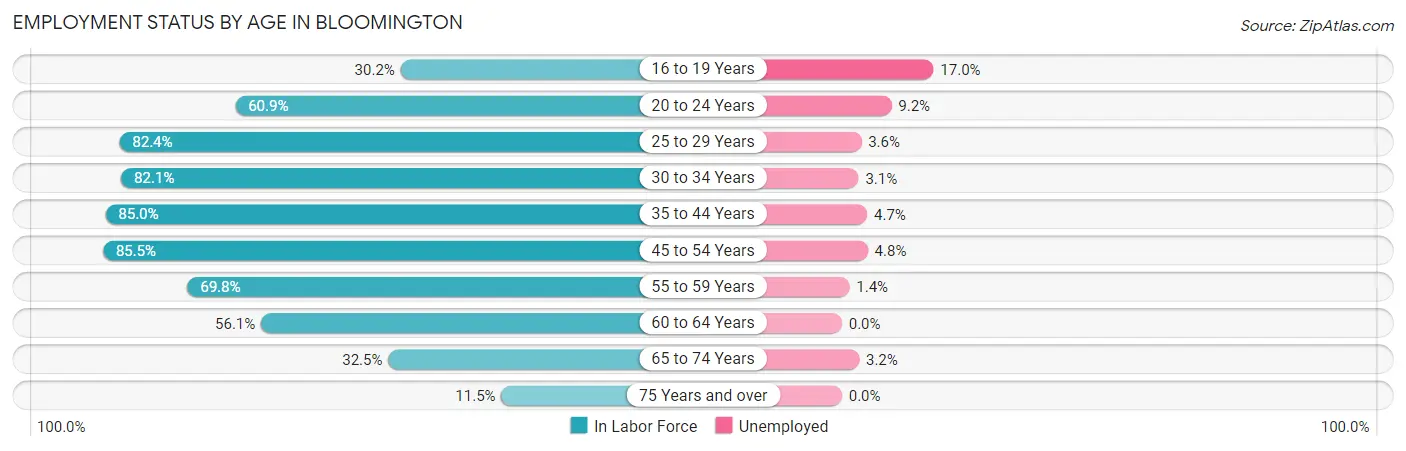
| Age Bracket | In Labor Force | Unemployed |
| 16 to 19 Years | 4,131 (30.2%) | 702 (17.0%) |
| 20 to 24 Years | 11,684 (60.9%) | 1,075 (9.2%) |
| 25 to 29 Years | 5,445 (82.4%) | 196 (3.6%) |
| 30 to 34 Years | 4,080 (82.1%) | 126 (3.1%) |
| 35 to 44 Years | 5,987 (85.0%) | 281 (4.7%) |
| 45 to 54 Years | 4,835 (85.5%) | 232 (4.8%) |
| 55 to 59 Years | 1,931 (69.8%) | 27 (1.4%) |
| 60 to 64 Years | 1,579 (56.1%) | 0 (0.0%) |
| 65 to 74 Years | 1,561 (32.5%) | 50 (3.2%) |
| 75 Years and over | 419 (11.5%) | 0 (0.0%) |
| Total | 41,632 (58.5%) | 2,706 (6.5%) |
Employment Status by Educational Attainment in Bloomington
According to labor force statistics for Bloomington, 79.9% of individuals (23,856) out of the total population between 25 and 64 years of age (29,857) are in the labor force, with 3.6% or 859 of them being unemployed. The group with the highest labor force participation rate are those with the educational attainment of bachelor's degree or higher, with 86.8% or 15,451 individuals in the labor force. Within the labor force, individuals with less than high school education have the highest percentage of unemployment, with 13.8% or 90 of them being unemployed.
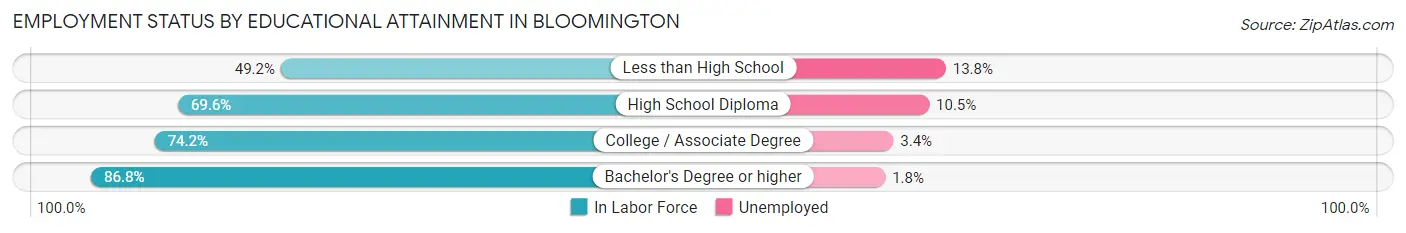
| Educational Attainment | In Labor Force | Unemployed |
| Less than High School | 652 (49.2%) | 183 (13.8%) |
| High School Diploma | 3,197 (69.6%) | 482 (10.5%) |
| College / Associate Degree | 4,553 (74.2%) | 209 (3.4%) |
| Bachelor's Degree or higher | 15,451 (86.8%) | 320 (1.8%) |
| Total | 23,856 (79.9%) | 1,075 (3.6%) |
Employment Occupations by Sex in Bloomington
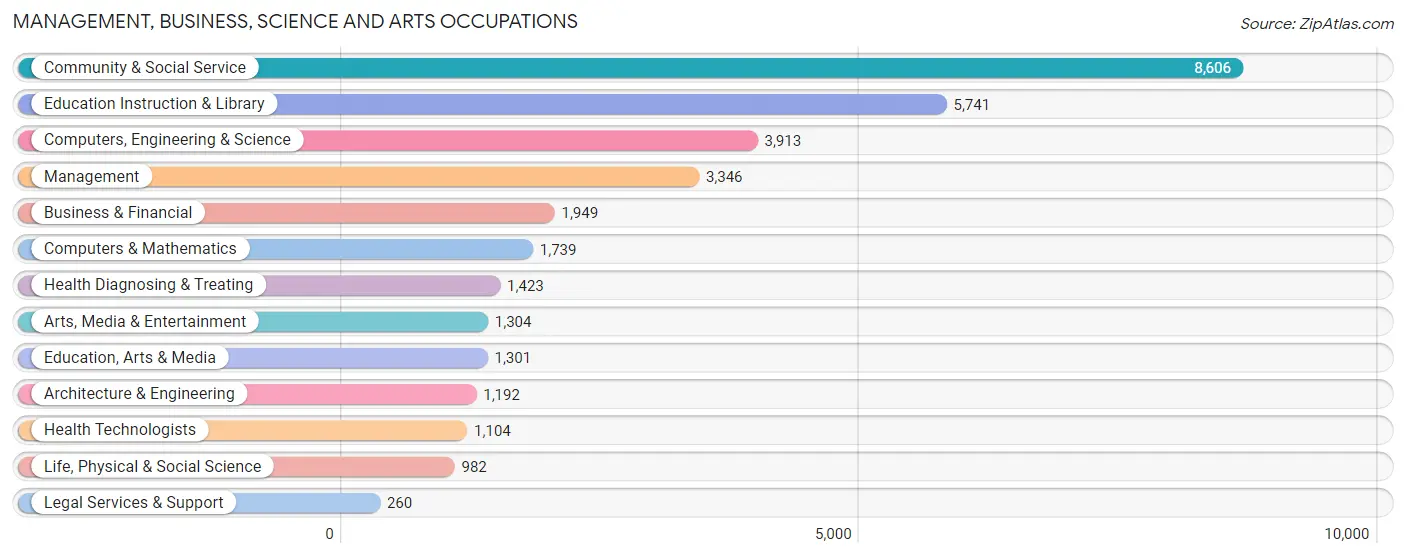
Management, Business, Science and Arts Occupations
The most common Management, Business, Science and Arts occupations in Bloomington are Community & Social Service (8,606 | 22.1%), Education Instruction & Library (5,741 | 14.7%), Computers, Engineering & Science (3,913 | 10.1%), Management (3,346 | 8.6%), and Business & Financial (1,949 | 5.0%).
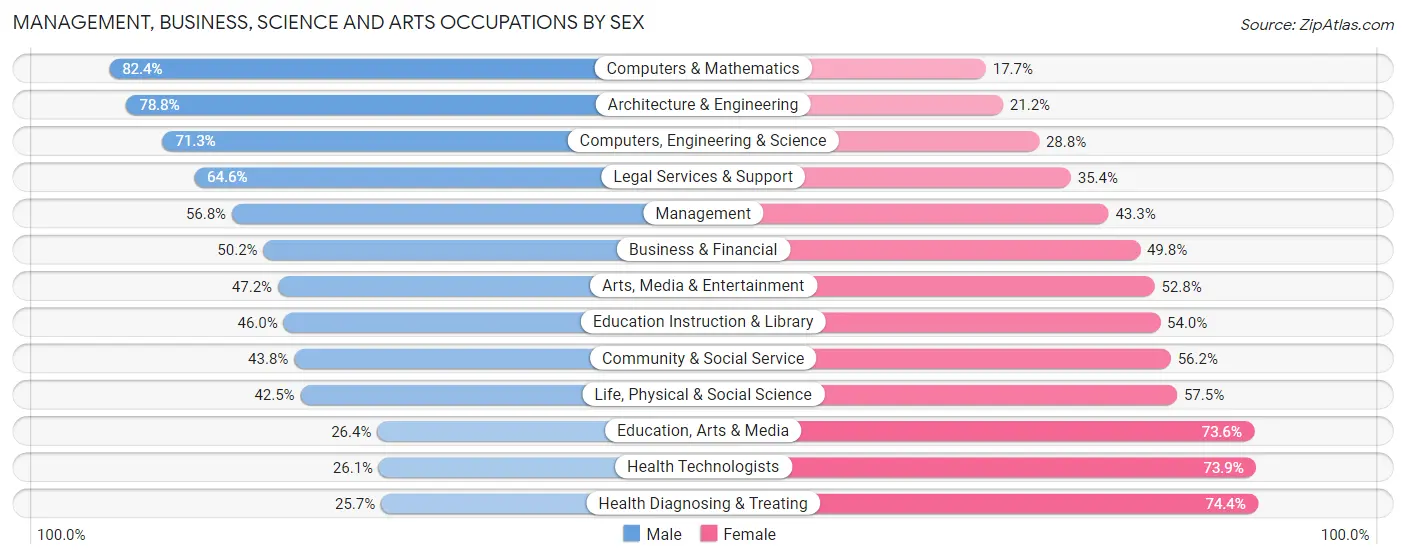
Management, Business, Science and Arts Occupations by Sex
Within the Management, Business, Science and Arts occupations in Bloomington, the most male-oriented occupations are Computers & Mathematics (82.4%), Architecture & Engineering (78.8%), and Computers, Engineering & Science (71.3%), while the most female-oriented occupations are Health Diagnosing & Treating (74.4%), Health Technologists (73.9%), and Education, Arts & Media (73.6%).
| Occupation | Male | Female |
| Management | 1,899 (56.8%) | 1,447 (43.2%) |
| Business & Financial | 978 (50.2%) | 971 (49.8%) |
| Computers, Engineering & Science | 2,788 (71.3%) | 1,125 (28.7%) |
| Computers & Mathematics | 1,432 (82.4%) | 307 (17.6%) |
| Architecture & Engineering | 939 (78.8%) | 253 (21.2%) |
| Life, Physical & Social Science | 417 (42.5%) | 565 (57.5%) |
| Community & Social Service | 3,767 (43.8%) | 4,839 (56.2%) |
| Education, Arts & Media | 344 (26.4%) | 957 (73.6%) |
| Legal Services & Support | 168 (64.6%) | 92 (35.4%) |
| Education Instruction & Library | 2,640 (46.0%) | 3,101 (54.0%) |
| Arts, Media & Entertainment | 615 (47.2%) | 689 (52.8%) |
| Health Diagnosing & Treating | 365 (25.7%) | 1,058 (74.4%) |
| Health Technologists | 288 (26.1%) | 816 (73.9%) |
| Total (Category) | 9,797 (50.9%) | 9,440 (49.1%) |
| Total (Overall) | 20,498 (52.7%) | 18,412 (47.3%) |
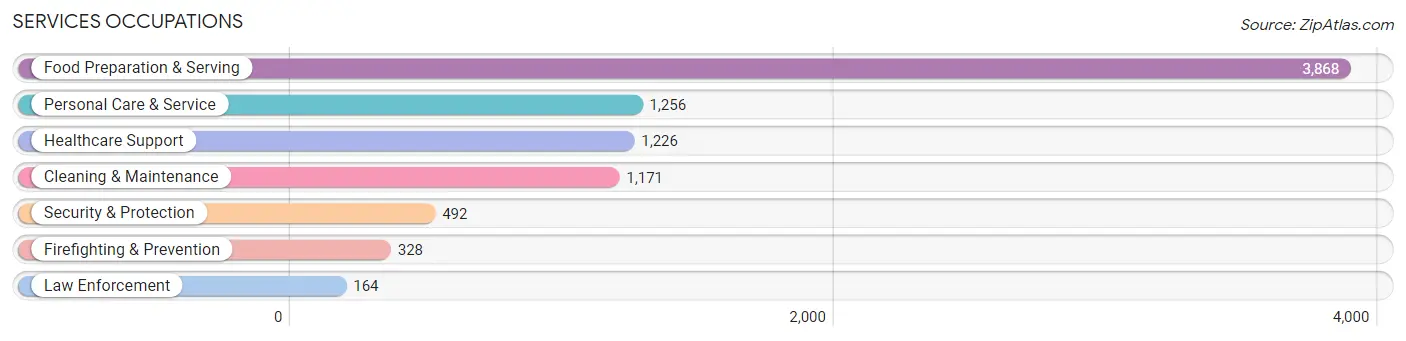
Services Occupations
The most common Services occupations in Bloomington are Food Preparation & Serving (3,868 | 9.9%), Personal Care & Service (1,256 | 3.2%), Healthcare Support (1,226 | 3.2%), Cleaning & Maintenance (1,171 | 3.0%), and Security & Protection (492 | 1.3%).
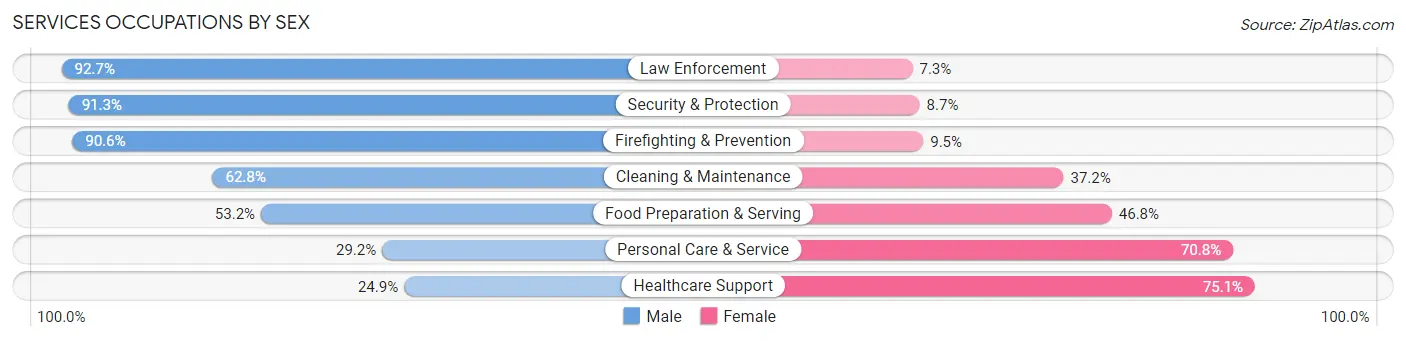
Services Occupations by Sex
Within the Services occupations in Bloomington, the most male-oriented occupations are Law Enforcement (92.7%), Security & Protection (91.3%), and Firefighting & Prevention (90.5%), while the most female-oriented occupations are Healthcare Support (75.1%), Personal Care & Service (70.8%), and Food Preparation & Serving (46.8%).
| Occupation | Male | Female |
| Healthcare Support | 305 (24.9%) | 921 (75.1%) |
| Security & Protection | 449 (91.3%) | 43 (8.7%) |
| Firefighting & Prevention | 297 (90.5%) | 31 (9.5%) |
| Law Enforcement | 152 (92.7%) | 12 (7.3%) |
| Food Preparation & Serving | 2,058 (53.2%) | 1,810 (46.8%) |
| Cleaning & Maintenance | 735 (62.8%) | 436 (37.2%) |
| Personal Care & Service | 367 (29.2%) | 889 (70.8%) |
| Total (Category) | 3,914 (48.8%) | 4,099 (51.1%) |
| Total (Overall) | 20,498 (52.7%) | 18,412 (47.3%) |
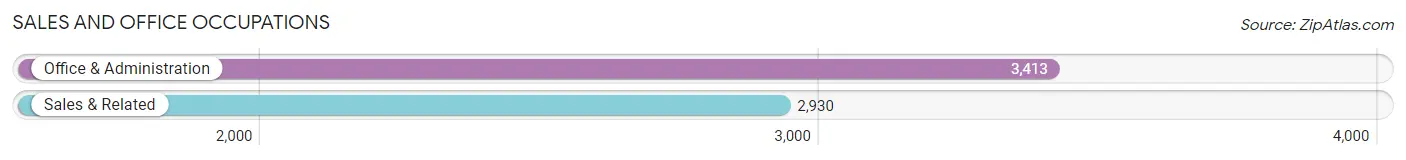
Sales and Office Occupations
The most common Sales and Office occupations in Bloomington are Office & Administration (3,413 | 8.8%), and Sales & Related (2,930 | 7.5%).
Sales and Office Occupations by Sex
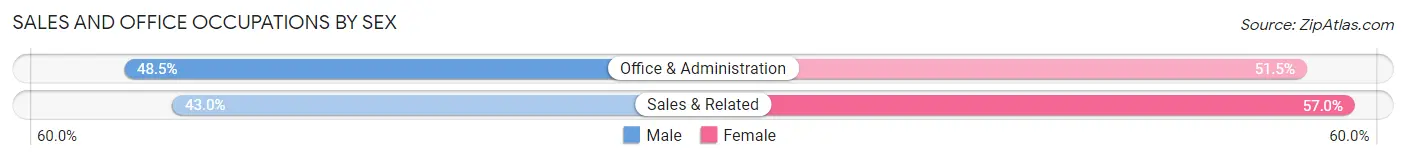
| Occupation | Male | Female |
| Sales & Related | 1,259 (43.0%) | 1,671 (57.0%) |
| Office & Administration | 1,656 (48.5%) | 1,757 (51.5%) |
| Total (Category) | 2,915 (46.0%) | 3,428 (54.0%) |
| Total (Overall) | 20,498 (52.7%) | 18,412 (47.3%) |
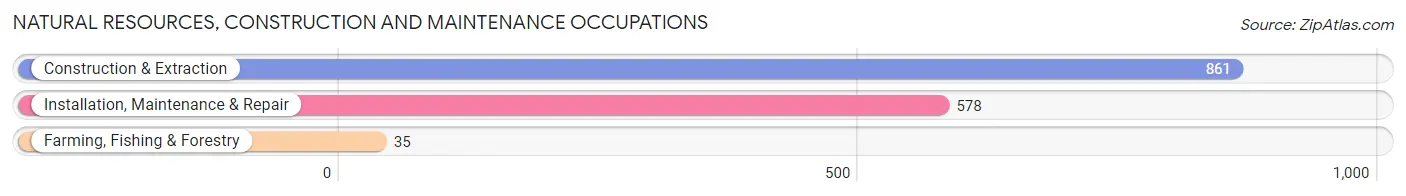
Natural Resources, Construction and Maintenance Occupations
The most common Natural Resources, Construction and Maintenance occupations in Bloomington are Construction & Extraction (861 | 2.2%), Installation, Maintenance & Repair (578 | 1.5%), and Farming, Fishing & Forestry (35 | 0.1%).
Natural Resources, Construction and Maintenance Occupations by Sex
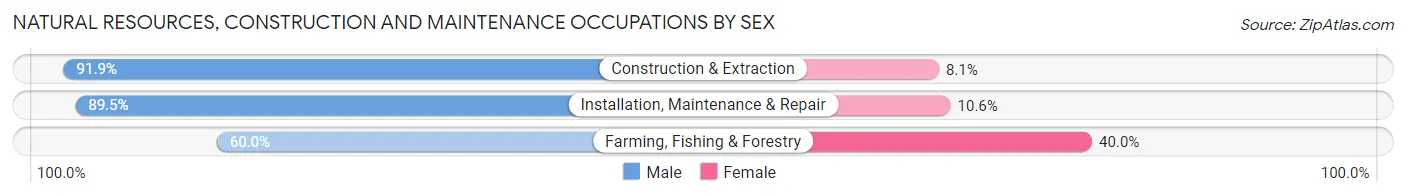
| Occupation | Male | Female |
| Farming, Fishing & Forestry | 21 (60.0%) | 14 (40.0%) |
| Construction & Extraction | 791 (91.9%) | 70 (8.1%) |
| Installation, Maintenance & Repair | 517 (89.4%) | 61 (10.5%) |
| Total (Category) | 1,329 (90.2%) | 145 (9.8%) |
| Total (Overall) | 20,498 (52.7%) | 18,412 (47.3%) |
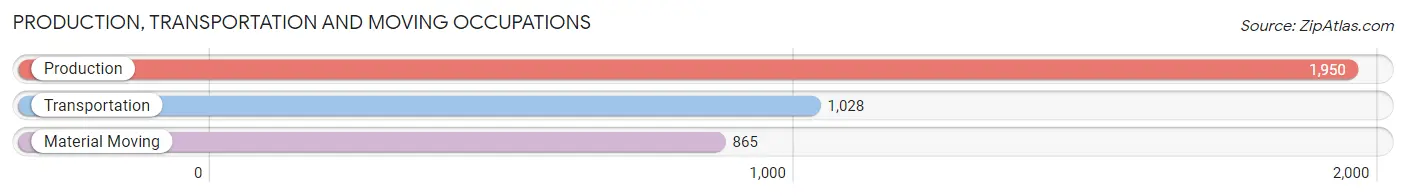
Production, Transportation and Moving Occupations
The most common Production, Transportation and Moving occupations in Bloomington are Production (1,950 | 5.0%), Transportation (1,028 | 2.6%), and Material Moving (865 | 2.2%).
Production, Transportation and Moving Occupations by Sex
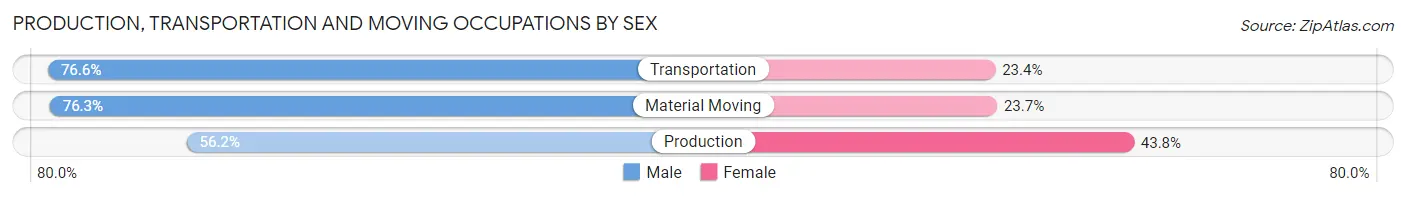
| Occupation | Male | Female |
| Production | 1,096 (56.2%) | 854 (43.8%) |
| Transportation | 787 (76.6%) | 241 (23.4%) |
| Material Moving | 660 (76.3%) | 205 (23.7%) |
| Total (Category) | 2,543 (66.2%) | 1,300 (33.8%) |
| Total (Overall) | 20,498 (52.7%) | 18,412 (47.3%) |
Employment Industries by Sex in Bloomington
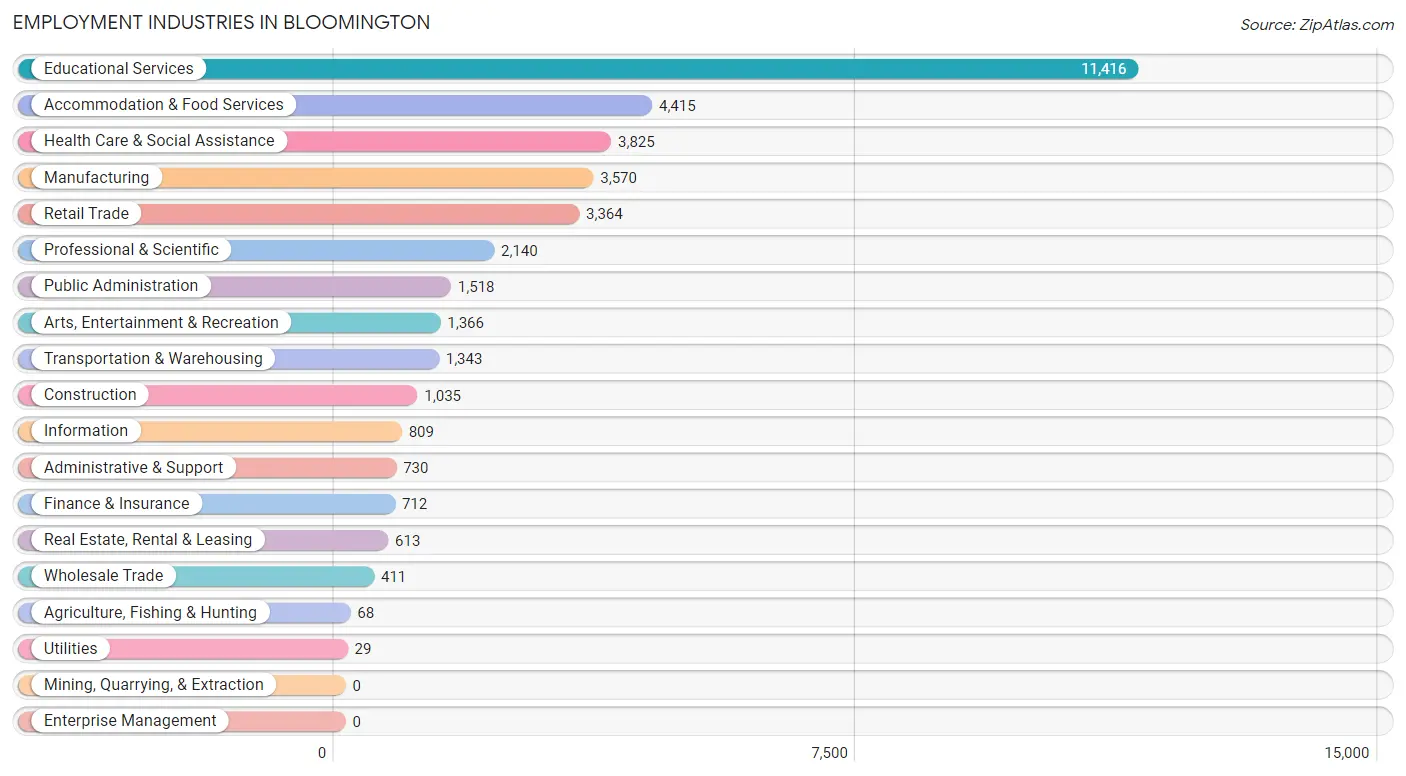
Employment Industries in Bloomington
The major employment industries in Bloomington include Educational Services (11,416 | 29.3%), Accommodation & Food Services (4,415 | 11.4%), Health Care & Social Assistance (3,825 | 9.8%), Manufacturing (3,570 | 9.2%), and Retail Trade (3,364 | 8.6%).
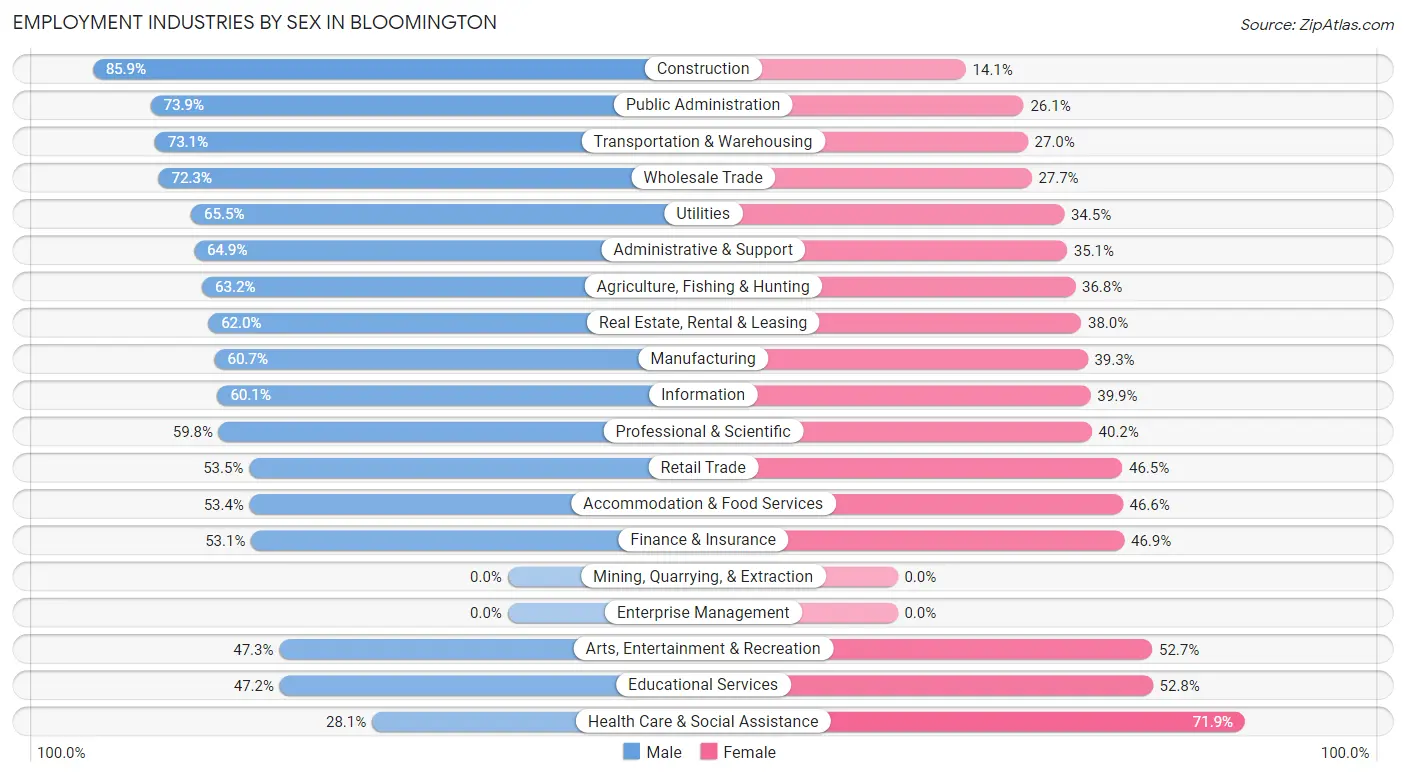
Employment Industries by Sex in Bloomington
The Bloomington industries that see more men than women are Construction (85.9%), Public Administration (73.9%), and Transportation & Warehousing (73.1%), whereas the industries that tend to have a higher number of women are Health Care & Social Assistance (71.9%), Educational Services (52.8%), and Arts, Entertainment & Recreation (52.7%).
| Industry | Male | Female |
| Agriculture, Fishing & Hunting | 43 (63.2%) | 25 (36.8%) |
| Mining, Quarrying, & Extraction | 0 (0.0%) | 0 (0.0%) |
| Construction | 889 (85.9%) | 146 (14.1%) |
| Manufacturing | 2,166 (60.7%) | 1,404 (39.3%) |
| Wholesale Trade | 297 (72.3%) | 114 (27.7%) |
| Retail Trade | 1,800 (53.5%) | 1,564 (46.5%) |
| Transportation & Warehousing | 981 (73.1%) | 362 (27.0%) |
| Utilities | 19 (65.5%) | 10 (34.5%) |
| Information | 486 (60.1%) | 323 (39.9%) |
| Finance & Insurance | 378 (53.1%) | 334 (46.9%) |
| Real Estate, Rental & Leasing | 380 (62.0%) | 233 (38.0%) |
| Professional & Scientific | 1,280 (59.8%) | 860 (40.2%) |
| Enterprise Management | 0 (0.0%) | 0 (0.0%) |
| Administrative & Support | 474 (64.9%) | 256 (35.1%) |
| Educational Services | 5,386 (47.2%) | 6,030 (52.8%) |
| Health Care & Social Assistance | 1,074 (28.1%) | 2,751 (71.9%) |
| Arts, Entertainment & Recreation | 646 (47.3%) | 720 (52.7%) |
| Accommodation & Food Services | 2,358 (53.4%) | 2,057 (46.6%) |
| Public Administration | 1,122 (73.9%) | 396 (26.1%) |
| Total | 20,498 (52.7%) | 18,412 (47.3%) |
Education in Bloomington
School Enrollment in Bloomington
The most common levels of schooling among the 38,901 students in Bloomington are college / undergraduate (26,275 | 67.5%), graduate / professional (5,960 | 15.3%), and high school (2,069 | 5.3%).
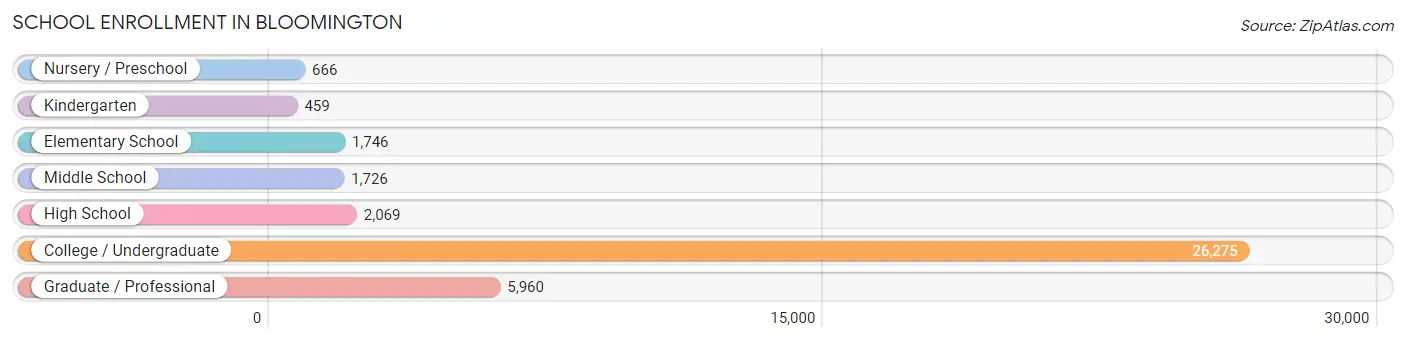
| School Level | # Students | % Students |
| Nursery / Preschool | 666 | 1.7% |
| Kindergarten | 459 | 1.2% |
| Elementary School | 1,746 | 4.5% |
| Middle School | 1,726 | 4.4% |
| High School | 2,069 | 5.3% |
| College / Undergraduate | 26,275 | 67.5% |
| Graduate / Professional | 5,960 | 15.3% |
| Total | 38,901 | 100.0% |
School Enrollment by Age by Funding Source in Bloomington
Out of a total of 38,901 students who are enrolled in schools in Bloomington, 1,751 (4.5%) attend a private institution, while the remaining 37,150 (95.5%) are enrolled in public schools. The age group of 3 to 4 year olds has the highest likelihood of being enrolled in private schools, with 238 (41.2% in the age bracket) enrolled. Conversely, the age group of 18 to 19 year olds has the lowest likelihood of being enrolled in a private school, with 11,963 (99.7% in the age bracket) attending a public institution.
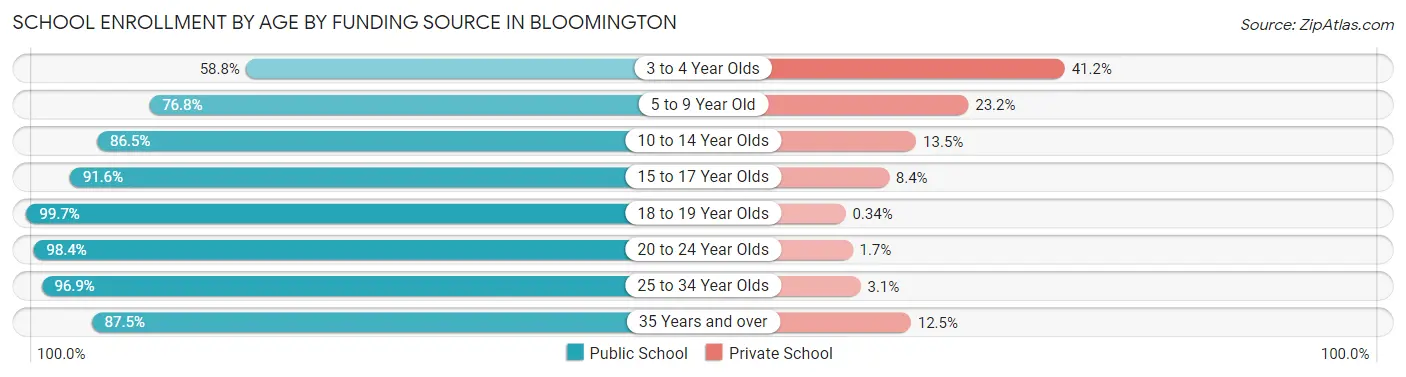
| Age Bracket | Public School | Private School |
| 3 to 4 Year Olds | 340 (58.8%) | 238 (41.2%) |
| 5 to 9 Year Old | 1,597 (76.8%) | 483 (23.2%) |
| 10 to 14 Year Olds | 1,788 (86.5%) | 279 (13.5%) |
| 15 to 17 Year Olds | 1,587 (91.6%) | 146 (8.4%) |
| 18 to 19 Year Olds | 11,963 (99.7%) | 41 (0.3%) |
| 20 to 24 Year Olds | 15,314 (98.4%) | 257 (1.7%) |
| 25 to 34 Year Olds | 3,305 (96.9%) | 107 (3.1%) |
| 35 Years and over | 1,274 (87.5%) | 182 (12.5%) |
| Total | 37,150 (95.5%) | 1,751 (4.5%) |
Educational Attainment by Field of Study in Bloomington
Social sciences (3,148 | 12.2%), literature & languages (2,514 | 9.8%), business (2,371 | 9.2%), education (2,177 | 8.5%), and liberal arts & history (2,152 | 8.4%) are the most common fields of study among 25,748 individuals in Bloomington who have obtained a bachelor's degree or higher.
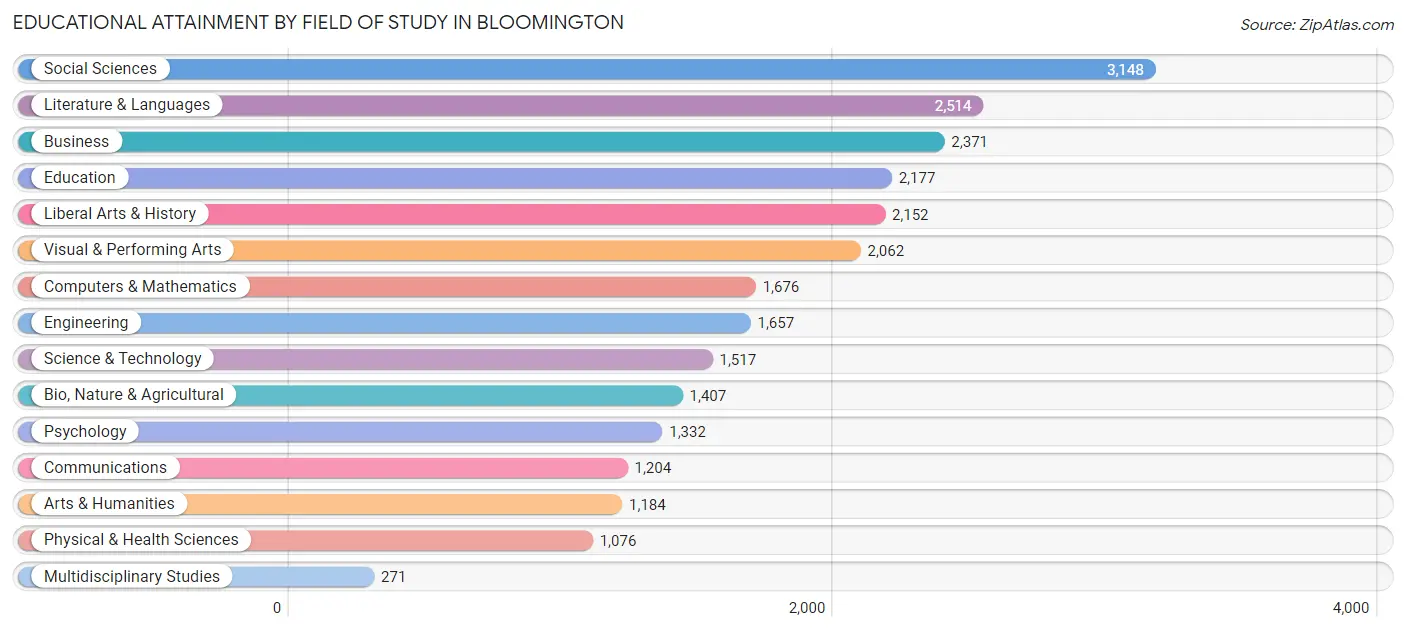
| Field of Study | # Graduates | % Graduates |
| Computers & Mathematics | 1,676 | 6.5% |
| Bio, Nature & Agricultural | 1,407 | 5.5% |
| Physical & Health Sciences | 1,076 | 4.2% |
| Psychology | 1,332 | 5.2% |
| Social Sciences | 3,148 | 12.2% |
| Engineering | 1,657 | 6.4% |
| Multidisciplinary Studies | 271 | 1.1% |
| Science & Technology | 1,517 | 5.9% |
| Business | 2,371 | 9.2% |
| Education | 2,177 | 8.5% |
| Literature & Languages | 2,514 | 9.8% |
| Liberal Arts & History | 2,152 | 8.4% |
| Visual & Performing Arts | 2,062 | 8.0% |
| Communications | 1,204 | 4.7% |
| Arts & Humanities | 1,184 | 4.6% |
| Total | 25,748 | 100.0% |
Transportation & Commute in Bloomington
Vehicle Availability by Sex in Bloomington
The most prevalent vehicle ownership categories in Bloomington are males with 2 vehicles (6,432, accounting for 35.3%) and females with 2 vehicles (5,491, making up 41.0%).
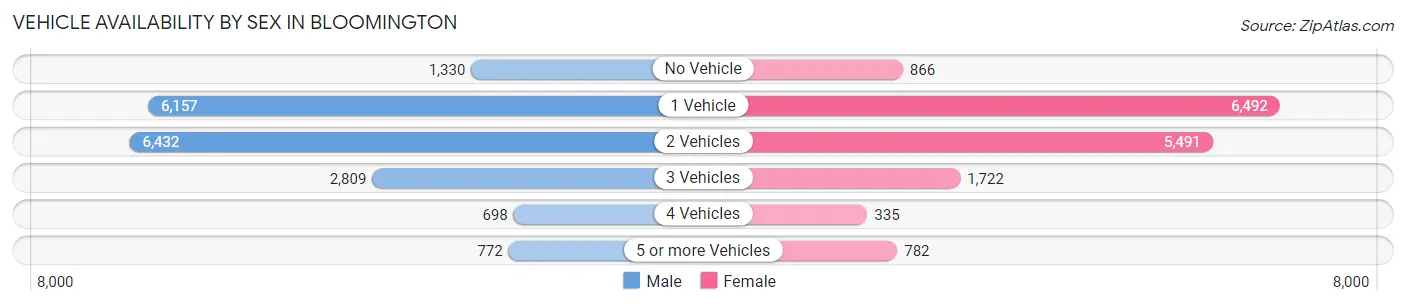
| Vehicles Available | Male | Female |
| No Vehicle | 1,330 (7.3%) | 866 (5.5%) |
| 1 Vehicle | 6,157 (33.8%) | 6,492 (41.4%) |
| 2 Vehicles | 6,432 (35.3%) | 5,491 (35.0%) |
| 3 Vehicles | 2,809 (15.4%) | 1,722 (11.0%) |
| 4 Vehicles | 698 (3.8%) | 335 (2.1%) |
| 5 or more Vehicles | 772 (4.2%) | 782 (5.0%) |
| Total | 18,198 (100.0%) | 15,688 (100.0%) |
Commute Time in Bloomington
The most frequently occuring commute durations in Bloomington are 10 to 14 minutes (8,521 commuters, 27.2%), 15 to 19 minutes (6,744 commuters, 21.5%), and 5 to 9 minutes (5,769 commuters, 18.4%).
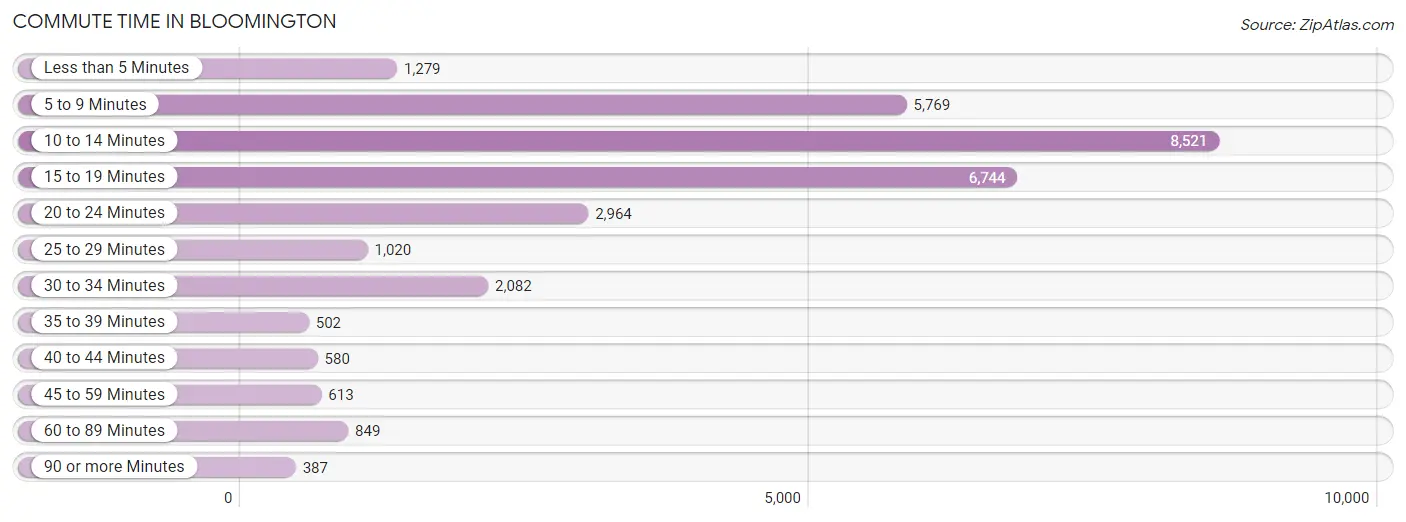
| Commute Time | # Commuters | % Commuters |
| Less than 5 Minutes | 1,279 | 4.1% |
| 5 to 9 Minutes | 5,769 | 18.4% |
| 10 to 14 Minutes | 8,521 | 27.2% |
| 15 to 19 Minutes | 6,744 | 21.5% |
| 20 to 24 Minutes | 2,964 | 9.5% |
| 25 to 29 Minutes | 1,020 | 3.3% |
| 30 to 34 Minutes | 2,082 | 6.7% |
| 35 to 39 Minutes | 502 | 1.6% |
| 40 to 44 Minutes | 580 | 1.8% |
| 45 to 59 Minutes | 613 | 2.0% |
| 60 to 89 Minutes | 849 | 2.7% |
| 90 or more Minutes | 387 | 1.2% |
Commute Time by Sex in Bloomington
The most common commute times in Bloomington are 10 to 14 minutes (4,485 commuters, 27.1%) for males and 10 to 14 minutes (4,036 commuters, 27.3%) for females.
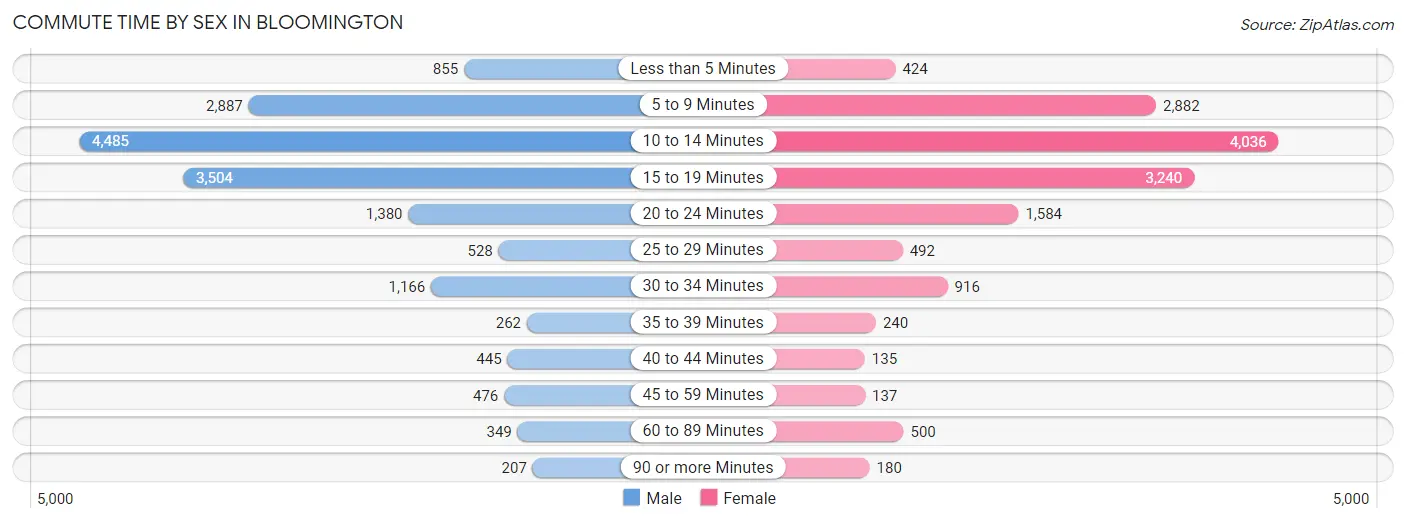
| Commute Time | Male | Female |
| Less than 5 Minutes | 855 (5.2%) | 424 (2.9%) |
| 5 to 9 Minutes | 2,887 (17.4%) | 2,882 (19.5%) |
| 10 to 14 Minutes | 4,485 (27.1%) | 4,036 (27.3%) |
| 15 to 19 Minutes | 3,504 (21.2%) | 3,240 (21.9%) |
| 20 to 24 Minutes | 1,380 (8.3%) | 1,584 (10.7%) |
| 25 to 29 Minutes | 528 (3.2%) | 492 (3.3%) |
| 30 to 34 Minutes | 1,166 (7.0%) | 916 (6.2%) |
| 35 to 39 Minutes | 262 (1.6%) | 240 (1.6%) |
| 40 to 44 Minutes | 445 (2.7%) | 135 (0.9%) |
| 45 to 59 Minutes | 476 (2.9%) | 137 (0.9%) |
| 60 to 89 Minutes | 349 (2.1%) | 500 (3.4%) |
| 90 or more Minutes | 207 (1.3%) | 180 (1.2%) |
Time of Departure to Work by Sex in Bloomington
The most frequent times of departure to work in Bloomington are 4:00 PM to 11:59 PM (2,097, 12.7%) for males and 7:30 AM to 7:59 AM (1,969, 13.3%) for females.
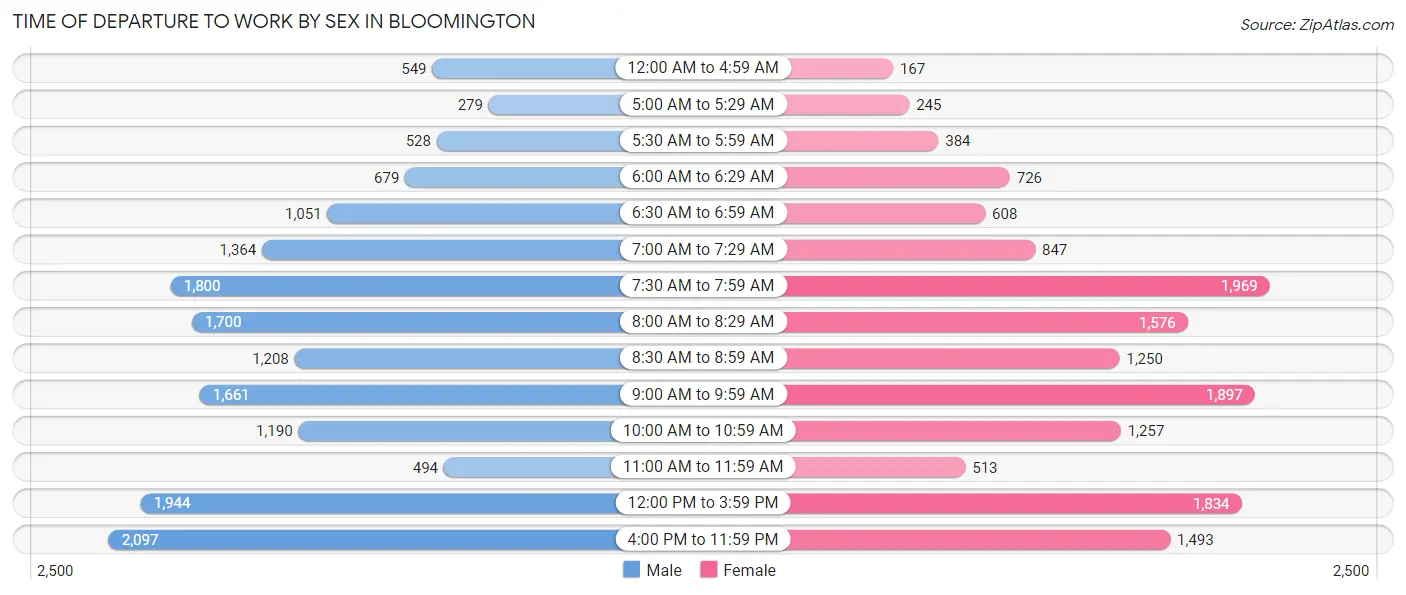
| Time of Departure | Male | Female |
| 12:00 AM to 4:59 AM | 549 (3.3%) | 167 (1.1%) |
| 5:00 AM to 5:29 AM | 279 (1.7%) | 245 (1.7%) |
| 5:30 AM to 5:59 AM | 528 (3.2%) | 384 (2.6%) |
| 6:00 AM to 6:29 AM | 679 (4.1%) | 726 (4.9%) |
| 6:30 AM to 6:59 AM | 1,051 (6.4%) | 608 (4.1%) |
| 7:00 AM to 7:29 AM | 1,364 (8.2%) | 847 (5.7%) |
| 7:30 AM to 7:59 AM | 1,800 (10.9%) | 1,969 (13.3%) |
| 8:00 AM to 8:29 AM | 1,700 (10.3%) | 1,576 (10.7%) |
| 8:30 AM to 8:59 AM | 1,208 (7.3%) | 1,250 (8.5%) |
| 9:00 AM to 9:59 AM | 1,661 (10.0%) | 1,897 (12.9%) |
| 10:00 AM to 10:59 AM | 1,190 (7.2%) | 1,257 (8.5%) |
| 11:00 AM to 11:59 AM | 494 (3.0%) | 513 (3.5%) |
| 12:00 PM to 3:59 PM | 1,944 (11.7%) | 1,834 (12.4%) |
| 4:00 PM to 11:59 PM | 2,097 (12.7%) | 1,493 (10.1%) |
| Total | 16,544 (100.0%) | 14,766 (100.0%) |
Housing Occupancy in Bloomington
Occupancy by Ownership in Bloomington
Of the total 32,592 dwellings in Bloomington, owner-occupied units account for 11,591 (35.6%), while renter-occupied units make up 21,001 (64.4%).
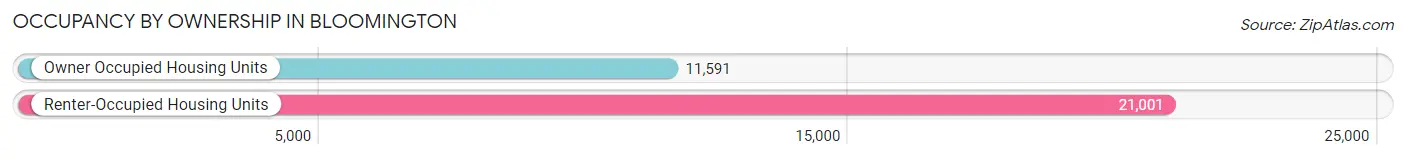
| Occupancy | # Housing Units | % Housing Units |
| Owner Occupied Housing Units | 11,591 | 35.6% |
| Renter-Occupied Housing Units | 21,001 | 64.4% |
| Total Occupied Housing Units | 32,592 | 100.0% |
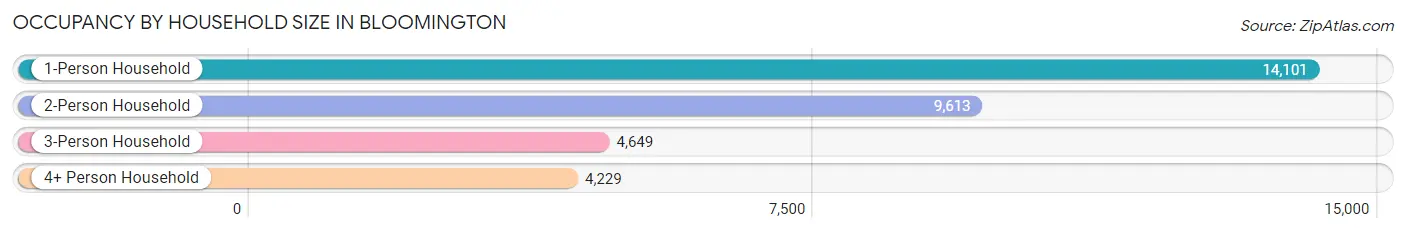
Occupancy by Household Size in Bloomington
| Household Size | # Housing Units | % Housing Units |
| 1-Person Household | 14,101 | 43.3% |
| 2-Person Household | 9,613 | 29.5% |
| 3-Person Household | 4,649 | 14.3% |
| 4+ Person Household | 4,229 | 13.0% |
| Total Housing Units | 32,592 | 100.0% |
Occupancy by Ownership by Household Size in Bloomington
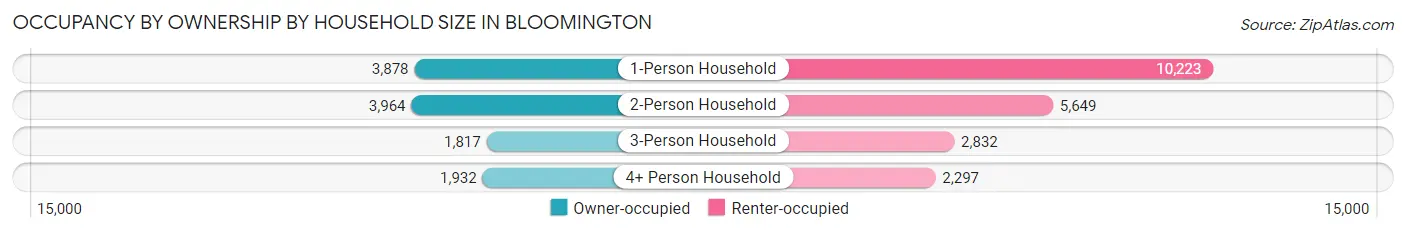
| Household Size | Owner-occupied | Renter-occupied |
| 1-Person Household | 3,878 (27.5%) | 10,223 (72.5%) |
| 2-Person Household | 3,964 (41.2%) | 5,649 (58.8%) |
| 3-Person Household | 1,817 (39.1%) | 2,832 (60.9%) |
| 4+ Person Household | 1,932 (45.7%) | 2,297 (54.3%) |
| Total Housing Units | 11,591 (35.6%) | 21,001 (64.4%) |
Occupancy by Educational Attainment in Bloomington
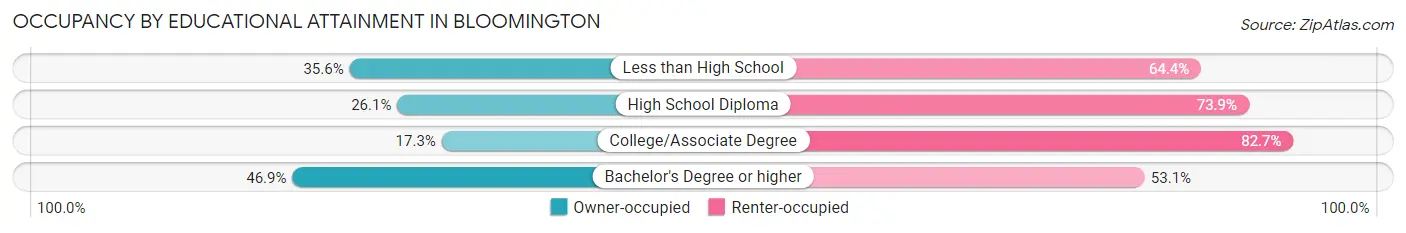
| Household Size | Owner-occupied | Renter-occupied |
| Less than High School | 358 (35.6%) | 648 (64.4%) |
| High School Diploma | 1,304 (26.1%) | 3,688 (73.9%) |
| College/Associate Degree | 1,490 (17.3%) | 7,118 (82.7%) |
| Bachelor's Degree or higher | 8,439 (46.9%) | 9,547 (53.1%) |
Occupancy by Age of Householder in Bloomington
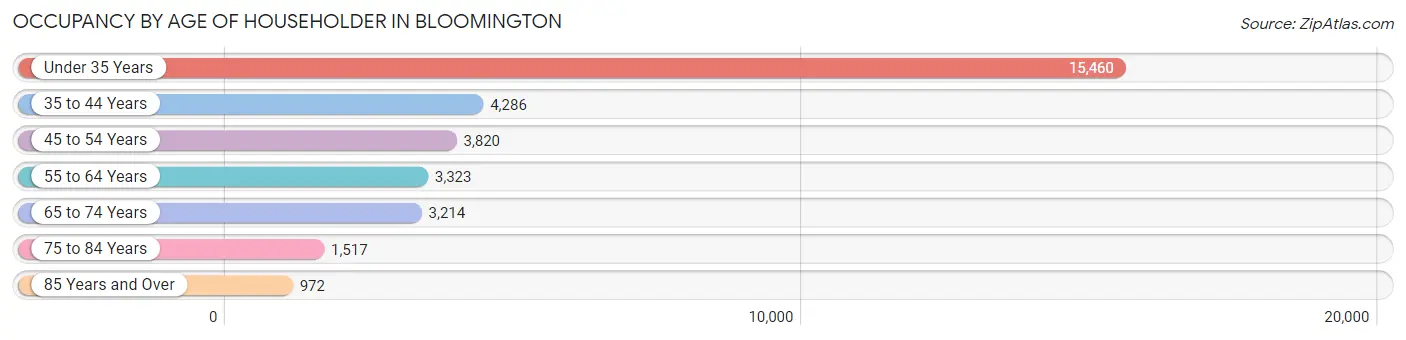
| Age Bracket | # Households | % Households |
| Under 35 Years | 15,460 | 47.4% |
| 35 to 44 Years | 4,286 | 13.2% |
| 45 to 54 Years | 3,820 | 11.7% |
| 55 to 64 Years | 3,323 | 10.2% |
| 65 to 74 Years | 3,214 | 9.9% |
| 75 to 84 Years | 1,517 | 4.6% |
| 85 Years and Over | 972 | 3.0% |
| Total | 32,592 | 100.0% |
Housing Finances in Bloomington
Median Income by Occupancy in Bloomington
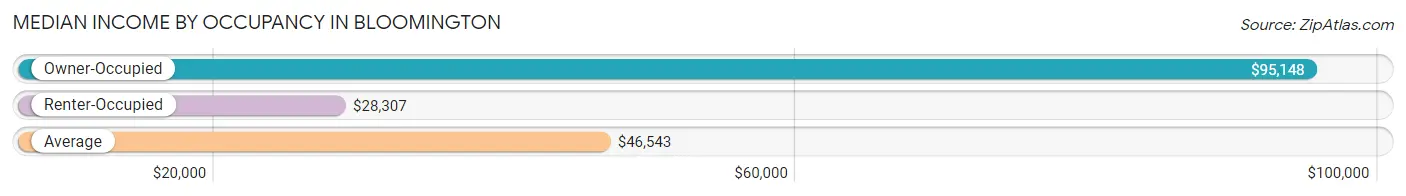
| Occupancy Type | # Households | Median Income |
| Owner-Occupied | 11,591 (35.6%) | $95,148 |
| Renter-Occupied | 21,001 (64.4%) | $28,307 |
| Average | 32,592 (100.0%) | $46,543 |
Occupancy by Householder Income Bracket in Bloomington
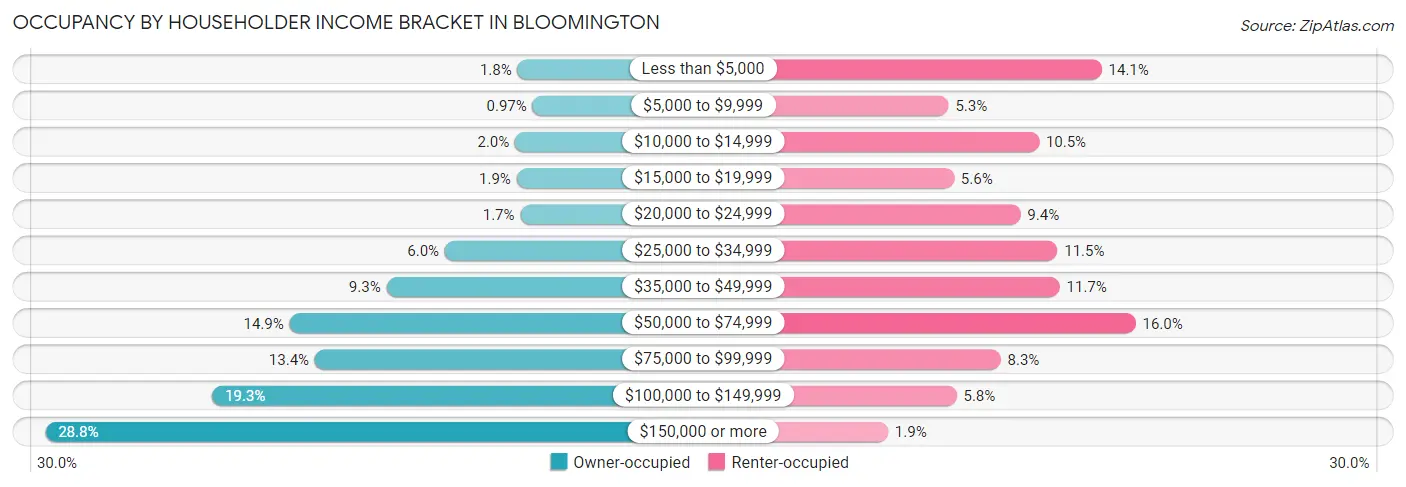
| Income Bracket | Owner-occupied | Renter-occupied |
| Less than $5,000 | 212 (1.8%) | 2,953 (14.1%) |
| $5,000 to $9,999 | 113 (1.0%) | 1,115 (5.3%) |
| $10,000 to $14,999 | 228 (2.0%) | 2,201 (10.5%) |
| $15,000 to $19,999 | 218 (1.9%) | 1,180 (5.6%) |
| $20,000 to $24,999 | 194 (1.7%) | 1,978 (9.4%) |
| $25,000 to $34,999 | 693 (6.0%) | 2,422 (11.5%) |
| $35,000 to $49,999 | 1,080 (9.3%) | 2,448 (11.7%) |
| $50,000 to $74,999 | 1,722 (14.9%) | 3,361 (16.0%) |
| $75,000 to $99,999 | 1,554 (13.4%) | 1,742 (8.3%) |
| $100,000 to $149,999 | 2,236 (19.3%) | 1,212 (5.8%) |
| $150,000 or more | 3,341 (28.8%) | 389 (1.8%) |
| Total | 11,591 (100.0%) | 21,001 (100.0%) |
Monthly Housing Cost Tiers in Bloomington
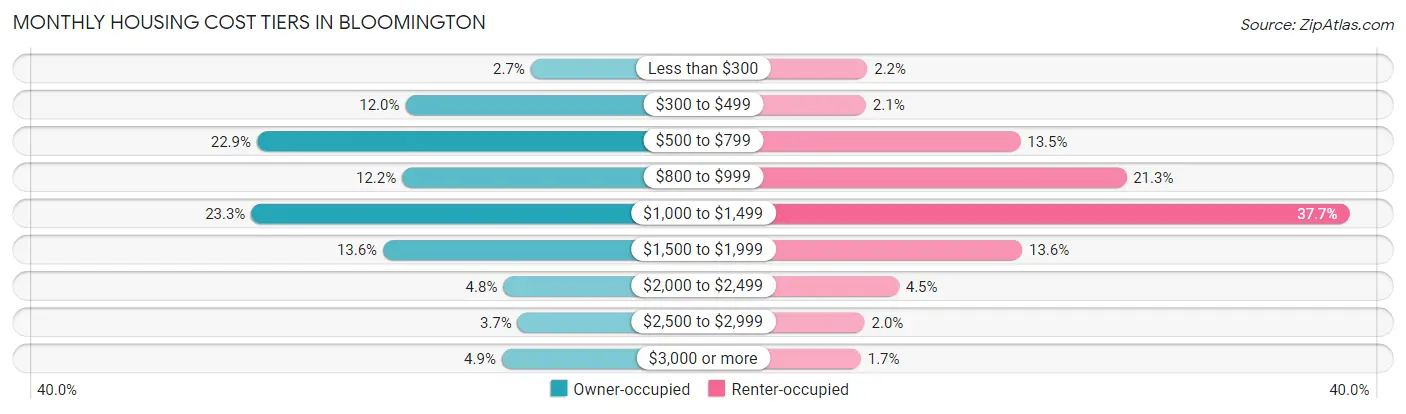
| Monthly Cost | Owner-occupied | Renter-occupied |
| Less than $300 | 316 (2.7%) | 462 (2.2%) |
| $300 to $499 | 1,386 (12.0%) | 442 (2.1%) |
| $500 to $799 | 2,654 (22.9%) | 2,829 (13.5%) |
| $800 to $999 | 1,414 (12.2%) | 4,466 (21.3%) |
| $1,000 to $1,499 | 2,702 (23.3%) | 7,917 (37.7%) |
| $1,500 to $1,999 | 1,577 (13.6%) | 2,857 (13.6%) |
| $2,000 to $2,499 | 551 (4.8%) | 950 (4.5%) |
| $2,500 to $2,999 | 428 (3.7%) | 419 (2.0%) |
| $3,000 or more | 563 (4.9%) | 362 (1.7%) |
| Total | 11,591 (100.0%) | 21,001 (100.0%) |
Physical Housing Characteristics in Bloomington
Housing Structures in Bloomington
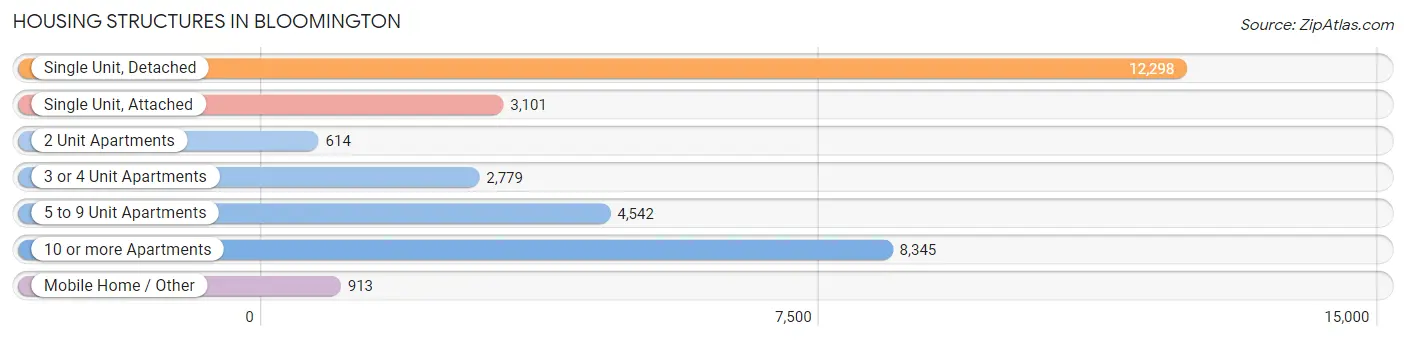
| Structure Type | # Housing Units | % Housing Units |
| Single Unit, Detached | 12,298 | 37.7% |
| Single Unit, Attached | 3,101 | 9.5% |
| 2 Unit Apartments | 614 | 1.9% |
| 3 or 4 Unit Apartments | 2,779 | 8.5% |
| 5 to 9 Unit Apartments | 4,542 | 13.9% |
| 10 or more Apartments | 8,345 | 25.6% |
| Mobile Home / Other | 913 | 2.8% |
| Total | 32,592 | 100.0% |
Housing Structures by Occupancy in Bloomington
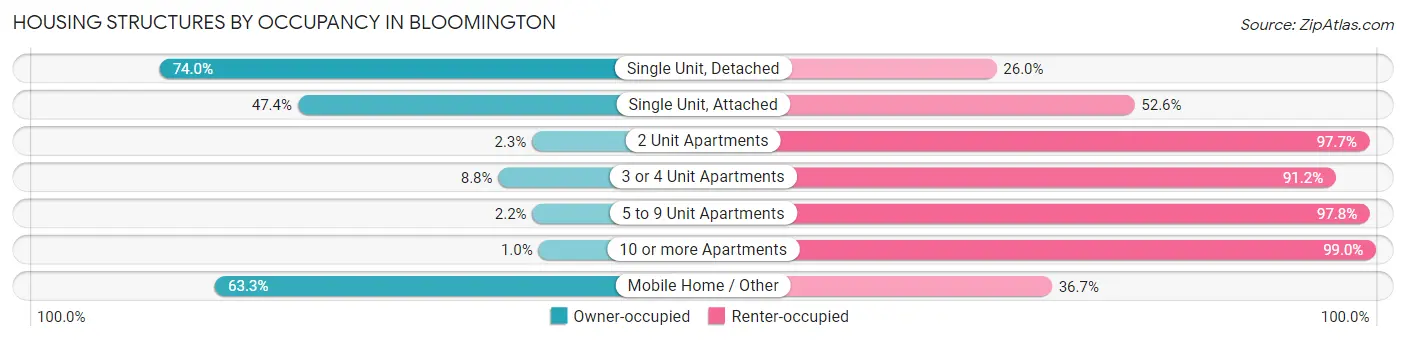
| Structure Type | Owner-occupied | Renter-occupied |
| Single Unit, Detached | 9,097 (74.0%) | 3,201 (26.0%) |
| Single Unit, Attached | 1,470 (47.4%) | 1,631 (52.6%) |
| 2 Unit Apartments | 14 (2.3%) | 600 (97.7%) |
| 3 or 4 Unit Apartments | 244 (8.8%) | 2,535 (91.2%) |
| 5 to 9 Unit Apartments | 101 (2.2%) | 4,441 (97.8%) |
| 10 or more Apartments | 87 (1.0%) | 8,258 (99.0%) |
| Mobile Home / Other | 578 (63.3%) | 335 (36.7%) |
| Total | 11,591 (35.6%) | 21,001 (64.4%) |
Housing Structures by Number of Rooms in Bloomington
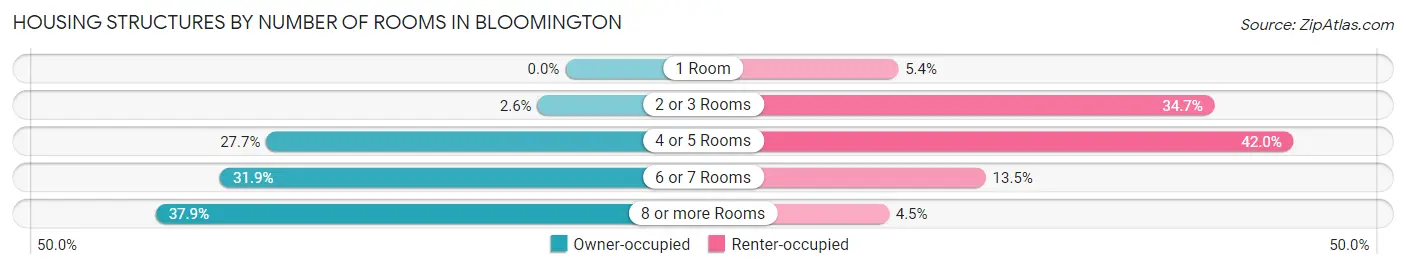
| Number of Rooms | Owner-occupied | Renter-occupied |
| 1 Room | 0 (0.0%) | 1,132 (5.4%) |
| 2 or 3 Rooms | 298 (2.6%) | 7,277 (34.6%) |
| 4 or 5 Rooms | 3,205 (27.7%) | 8,813 (42.0%) |
| 6 or 7 Rooms | 3,699 (31.9%) | 2,830 (13.5%) |
| 8 or more Rooms | 4,389 (37.9%) | 949 (4.5%) |
| Total | 11,591 (100.0%) | 21,001 (100.0%) |
Housing Structure by Heating Type in Bloomington
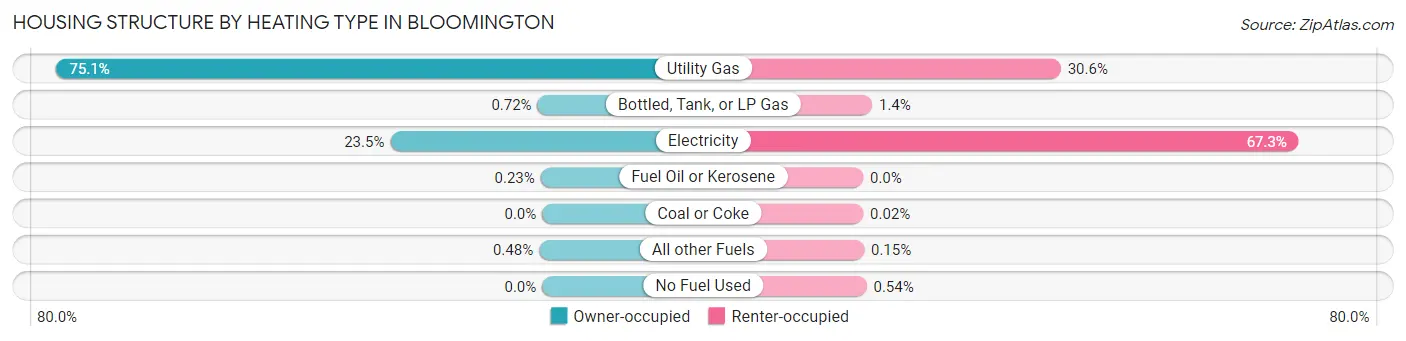
| Heating Type | Owner-occupied | Renter-occupied |
| Utility Gas | 8,703 (75.1%) | 6,417 (30.6%) |
| Bottled, Tank, or LP Gas | 83 (0.7%) | 292 (1.4%) |
| Electricity | 2,722 (23.5%) | 14,143 (67.3%) |
| Fuel Oil or Kerosene | 27 (0.2%) | 0 (0.0%) |
| Coal or Coke | 0 (0.0%) | 4 (0.0%) |
| All other Fuels | 56 (0.5%) | 31 (0.2%) |
| No Fuel Used | 0 (0.0%) | 114 (0.5%) |
| Total | 11,591 (100.0%) | 21,001 (100.0%) |
Household Vehicle Usage in Bloomington
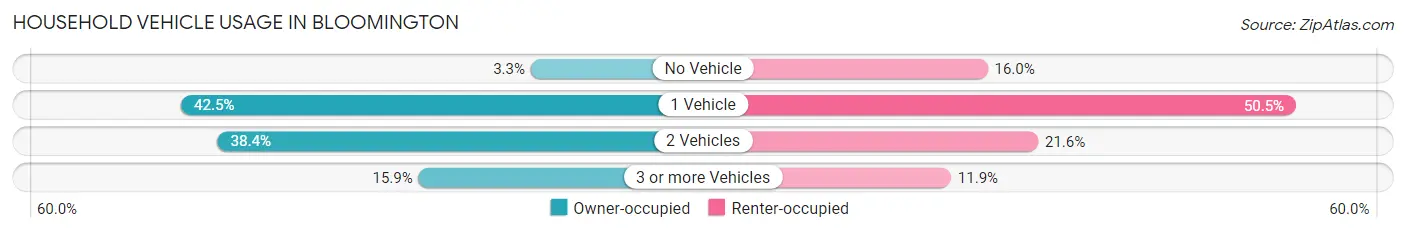
| Vehicles per Household | Owner-occupied | Renter-occupied |
| No Vehicle | 383 (3.3%) | 3,356 (16.0%) |
| 1 Vehicle | 4,921 (42.5%) | 10,610 (50.5%) |
| 2 Vehicles | 4,447 (38.4%) | 4,542 (21.6%) |
| 3 or more Vehicles | 1,840 (15.9%) | 2,493 (11.9%) |
| Total | 11,591 (100.0%) | 21,001 (100.0%) |
Real Estate & Mortgages in Bloomington
Real Estate and Mortgage Overview in Bloomington
| Characteristic | Without Mortgage | With Mortgage |
| Housing Units | 4,558 | 7,033 |
| Median Property Value | $268,400 | $267,600 |
| Median Household Income | $89,205 | $1,974 |
| Monthly Housing Costs | $573 | $563 |
| Real Estate Taxes | $2,318 | $185 |
Property Value by Mortgage Status in Bloomington
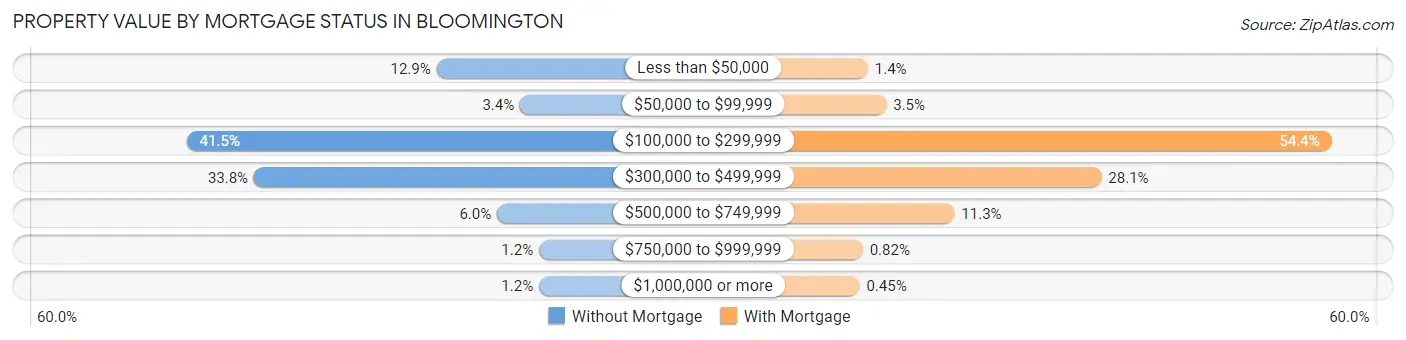
| Property Value | Without Mortgage | With Mortgage |
| Less than $50,000 | 589 (12.9%) | 99 (1.4%) |
| $50,000 to $99,999 | 154 (3.4%) | 247 (3.5%) |
| $100,000 to $299,999 | 1,891 (41.5%) | 3,826 (54.4%) |
| $300,000 to $499,999 | 1,540 (33.8%) | 1,976 (28.1%) |
| $500,000 to $749,999 | 274 (6.0%) | 795 (11.3%) |
| $750,000 to $999,999 | 55 (1.2%) | 58 (0.8%) |
| $1,000,000 or more | 55 (1.2%) | 32 (0.4%) |
| Total | 4,558 (100.0%) | 7,033 (100.0%) |
Household Income by Mortgage Status in Bloomington
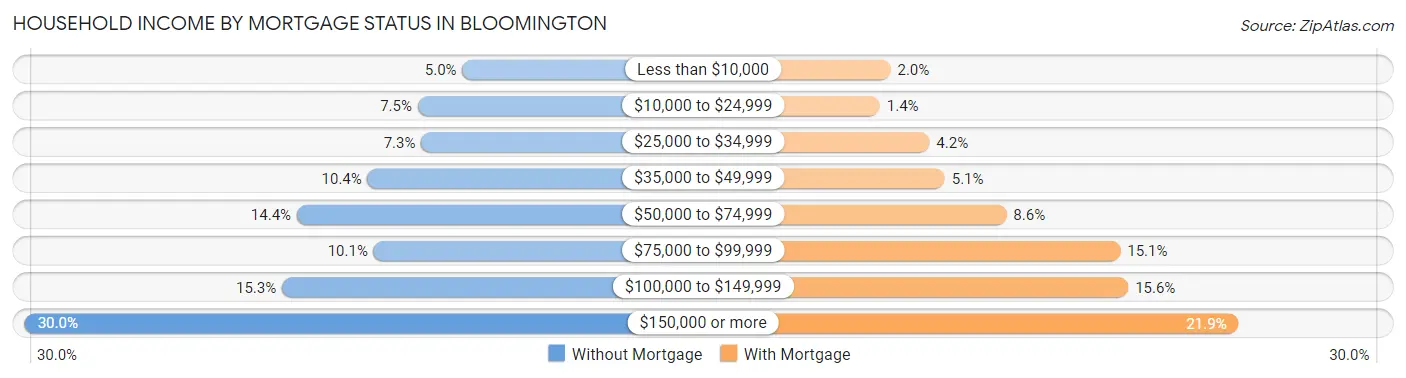
| Household Income | Without Mortgage | With Mortgage |
| Less than $10,000 | 227 (5.0%) | 141 (2.0%) |
| $10,000 to $24,999 | 343 (7.5%) | 98 (1.4%) |
| $25,000 to $34,999 | 334 (7.3%) | 297 (4.2%) |
| $35,000 to $49,999 | 474 (10.4%) | 359 (5.1%) |
| $50,000 to $74,999 | 658 (14.4%) | 606 (8.6%) |
| $75,000 to $99,999 | 458 (10.1%) | 1,064 (15.1%) |
| $100,000 to $149,999 | 697 (15.3%) | 1,096 (15.6%) |
| $150,000 or more | 1,367 (30.0%) | 1,539 (21.9%) |
| Total | 4,558 (100.0%) | 7,033 (100.0%) |
Property Value to Household Income Ratio in Bloomington
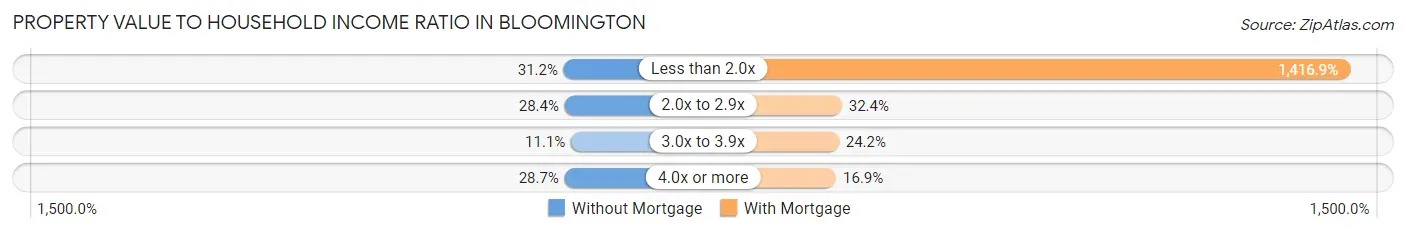
| Value-to-Income Ratio | Without Mortgage | With Mortgage |
| Less than 2.0x | 1,423 (31.2%) | 99,650 (1,416.9%) |
| 2.0x to 2.9x | 1,296 (28.4%) | 2,281 (32.4%) |
| 3.0x to 3.9x | 507 (11.1%) | 1,703 (24.2%) |
| 4.0x or more | 1,309 (28.7%) | 1,187 (16.9%) |
| Total | 4,558 (100.0%) | 7,033 (100.0%) |
Real Estate Taxes by Mortgage Status in Bloomington
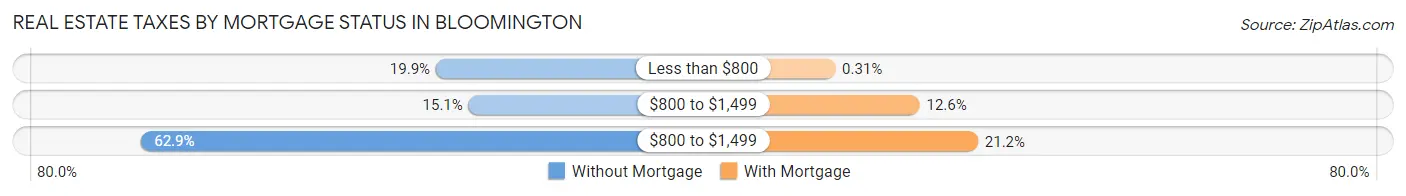
| Property Taxes | Without Mortgage | With Mortgage |
| Less than $800 | 907 (19.9%) | 22 (0.3%) |
| $800 to $1,499 | 689 (15.1%) | 889 (12.6%) |
| $800 to $1,499 | 2,869 (62.9%) | 1,488 (21.2%) |
| Total | 4,558 (100.0%) | 7,033 (100.0%) |
Health & Disability in Bloomington
Health Insurance Coverage by Age in Bloomington
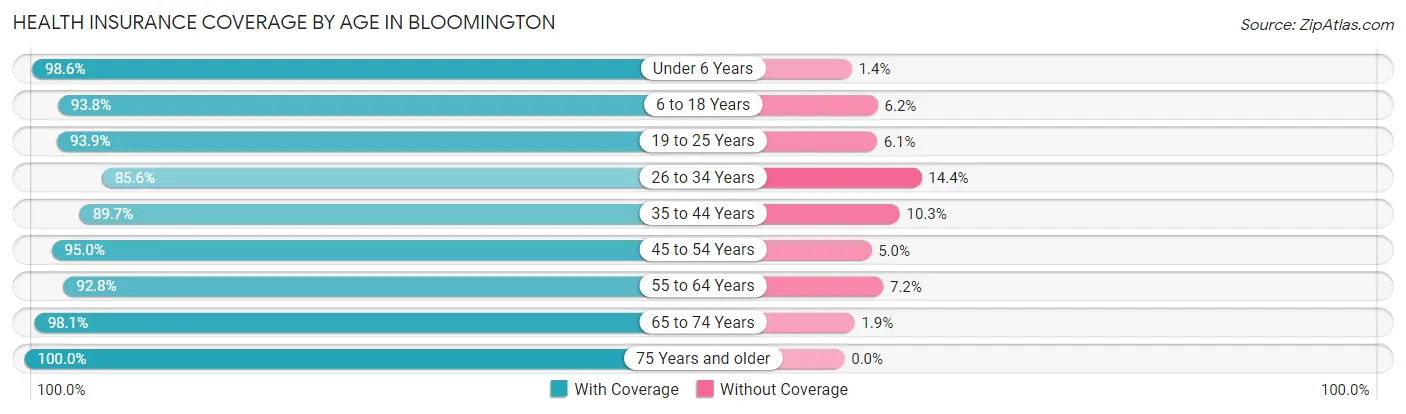
| Age Bracket | With Coverage | Without Coverage |
| Under 6 Years | 3,181 (98.6%) | 45 (1.4%) |
| 6 to 18 Years | 10,326 (93.8%) | 684 (6.2%) |
| 19 to 25 Years | 26,254 (93.9%) | 1,695 (6.1%) |
| 26 to 34 Years | 8,484 (85.6%) | 1,425 (14.4%) |
| 35 to 44 Years | 6,237 (89.7%) | 717 (10.3%) |
| 45 to 54 Years | 5,335 (95.0%) | 282 (5.0%) |
| 55 to 64 Years | 5,079 (92.8%) | 395 (7.2%) |
| 65 to 74 Years | 4,605 (98.1%) | 89 (1.9%) |
| 75 Years and older | 3,431 (100.0%) | 0 (0.0%) |
| Total | 72,932 (93.2%) | 5,332 (6.8%) |
Health Insurance Coverage by Citizenship Status in Bloomington
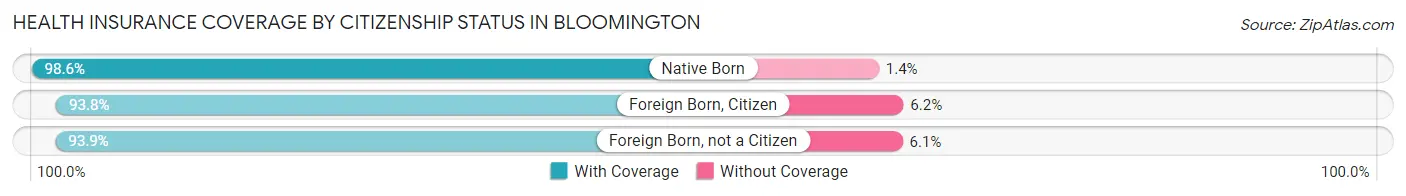
| Citizenship Status | With Coverage | Without Coverage |
| Native Born | 3,181 (98.6%) | 45 (1.4%) |
| Foreign Born, Citizen | 10,326 (93.8%) | 684 (6.2%) |
| Foreign Born, not a Citizen | 26,254 (93.9%) | 1,695 (6.1%) |
Health Insurance Coverage by Household Income in Bloomington
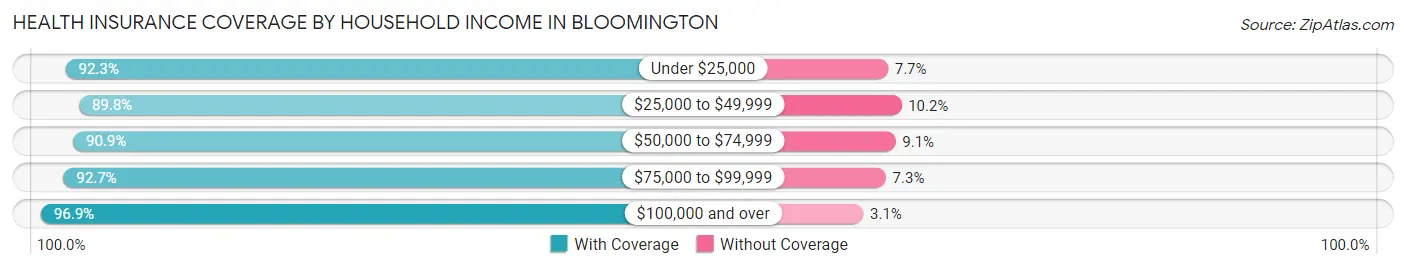
| Household Income | With Coverage | Without Coverage |
| Under $25,000 | 16,056 (92.3%) | 1,336 (7.7%) |
| $25,000 to $49,999 | 10,585 (89.8%) | 1,201 (10.2%) |
| $50,000 to $74,999 | 8,812 (90.9%) | 881 (9.1%) |
| $75,000 to $99,999 | 6,264 (92.7%) | 492 (7.3%) |
| $100,000 and over | 18,446 (96.9%) | 583 (3.1%) |
Public vs Private Health Insurance Coverage by Age in Bloomington
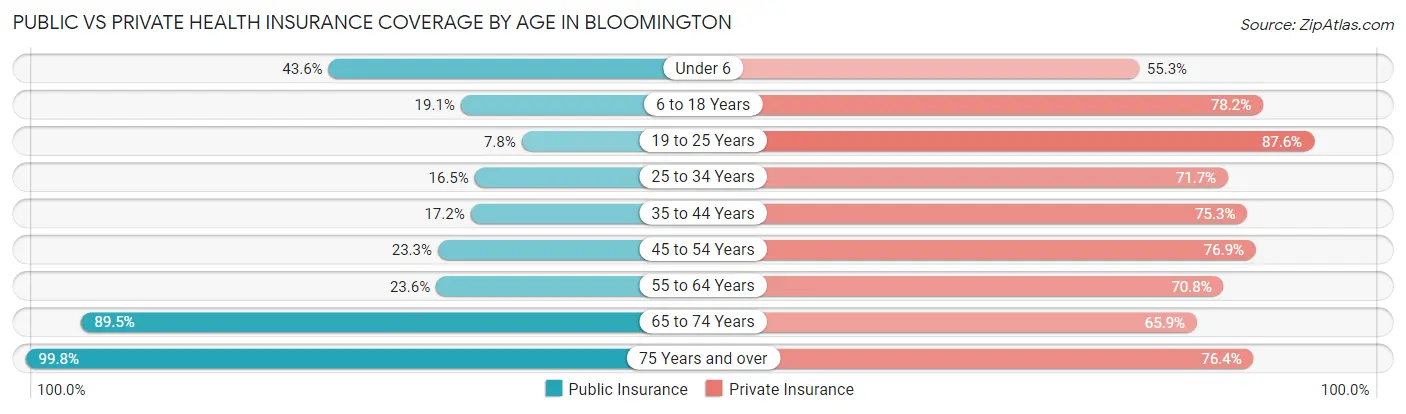
| Age Bracket | Public Insurance | Private Insurance |
| Under 6 | 1,407 (43.6%) | 1,785 (55.3%) |
| 6 to 18 Years | 2,098 (19.1%) | 8,609 (78.2%) |
| 19 to 25 Years | 2,168 (7.8%) | 24,492 (87.6%) |
| 25 to 34 Years | 1,632 (16.5%) | 7,102 (71.7%) |
| 35 to 44 Years | 1,199 (17.2%) | 5,233 (75.2%) |
| 45 to 54 Years | 1,309 (23.3%) | 4,317 (76.9%) |
| 55 to 64 Years | 1,294 (23.6%) | 3,878 (70.8%) |
| 65 to 74 Years | 4,199 (89.4%) | 3,094 (65.9%) |
| 75 Years and over | 3,424 (99.8%) | 2,622 (76.4%) |
| Total | 18,730 (23.9%) | 61,132 (78.1%) |
Disability Status by Sex by Age in Bloomington
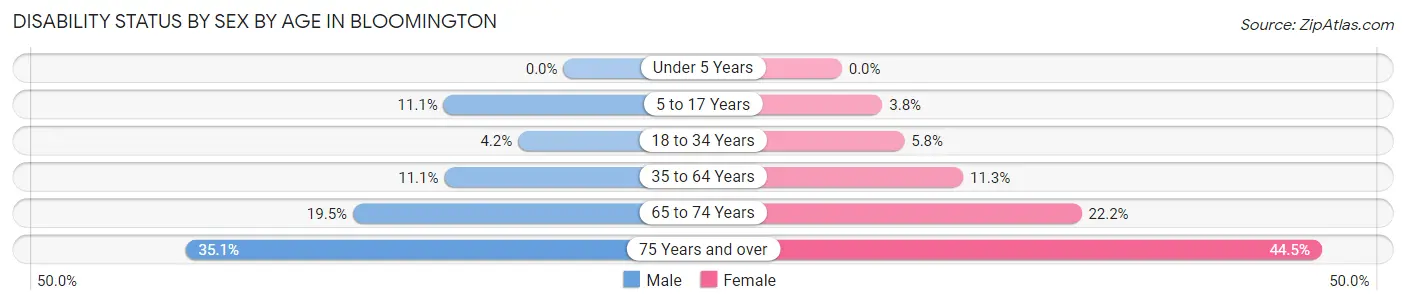
| Age Bracket | Male | Female |
| Under 5 Years | 0 (0.0%) | 0 (0.0%) |
| 5 to 17 Years | 353 (11.1%) | 111 (3.8%) |
| 18 to 34 Years | 934 (4.2%) | 1,213 (5.8%) |
| 35 to 64 Years | 1,022 (11.1%) | 989 (11.3%) |
| 65 to 74 Years | 410 (19.5%) | 577 (22.2%) |
| 75 Years and over | 455 (35.0%) | 950 (44.5%) |
Disability Class by Sex by Age in Bloomington
Disability Class: Hearing Difficulty
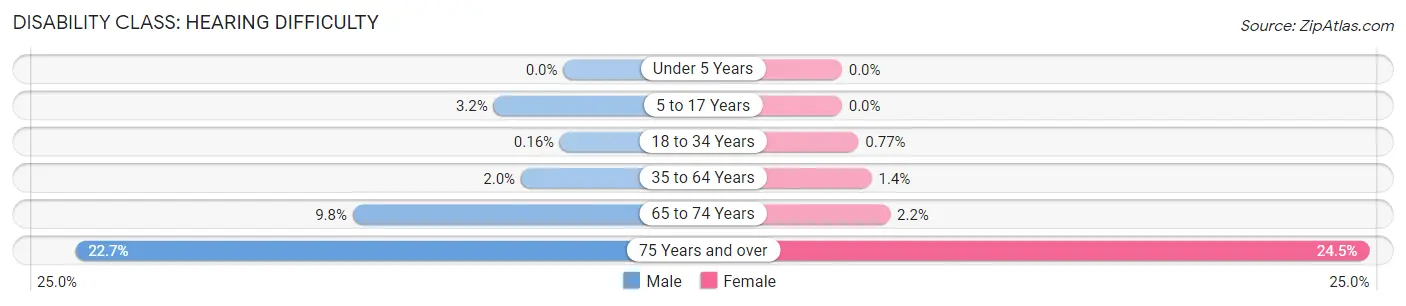
| Age Bracket | Male | Female |
| Under 5 Years | 0 (0.0%) | 0 (0.0%) |
| 5 to 17 Years | 103 (3.2%) | 0 (0.0%) |
| 18 to 34 Years | 35 (0.2%) | 161 (0.8%) |
| 35 to 64 Years | 182 (2.0%) | 121 (1.4%) |
| 65 to 74 Years | 205 (9.8%) | 58 (2.2%) |
| 75 Years and over | 294 (22.7%) | 522 (24.5%) |
Disability Class: Vision Difficulty
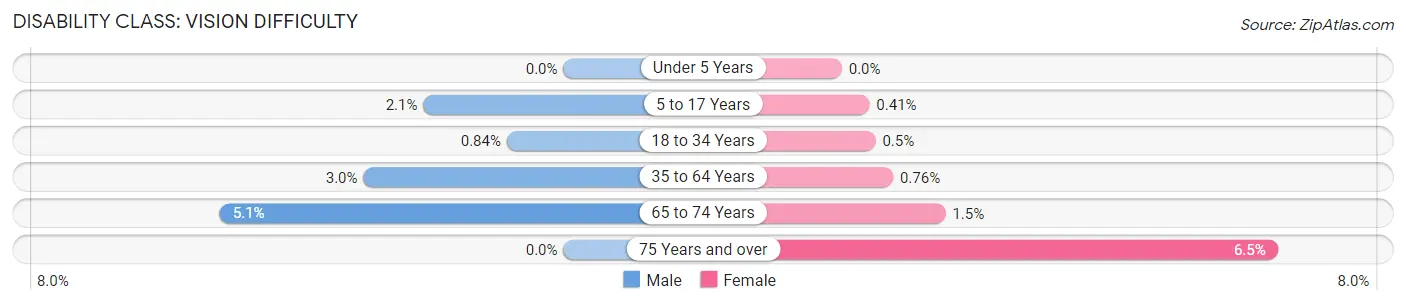
| Age Bracket | Male | Female |
| Under 5 Years | 0 (0.0%) | 0 (0.0%) |
| 5 to 17 Years | 66 (2.1%) | 12 (0.4%) |
| 18 to 34 Years | 186 (0.8%) | 104 (0.5%) |
| 35 to 64 Years | 275 (3.0%) | 67 (0.8%) |
| 65 to 74 Years | 107 (5.1%) | 40 (1.5%) |
| 75 Years and over | 0 (0.0%) | 138 (6.5%) |
Disability Class: Cognitive Difficulty
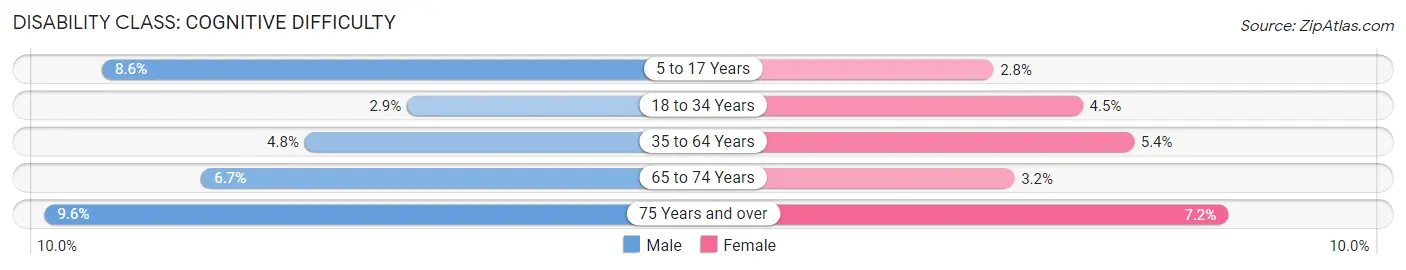
| Age Bracket | Male | Female |
| 5 to 17 Years | 272 (8.6%) | 83 (2.8%) |
| 18 to 34 Years | 646 (2.9%) | 935 (4.5%) |
| 35 to 64 Years | 444 (4.8%) | 477 (5.4%) |
| 65 to 74 Years | 141 (6.7%) | 83 (3.2%) |
| 75 Years and over | 125 (9.6%) | 153 (7.2%) |
Disability Class: Ambulatory Difficulty
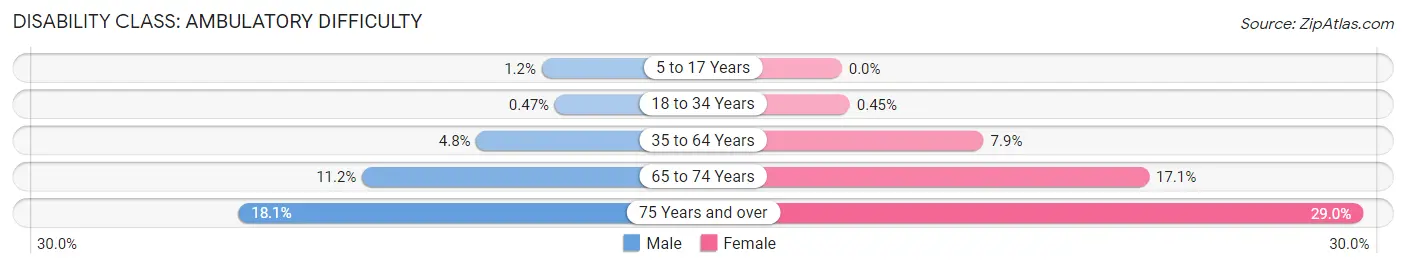
| Age Bracket | Male | Female |
| 5 to 17 Years | 38 (1.2%) | 0 (0.0%) |
| 18 to 34 Years | 105 (0.5%) | 95 (0.4%) |
| 35 to 64 Years | 448 (4.8%) | 695 (7.9%) |
| 65 to 74 Years | 235 (11.2%) | 444 (17.1%) |
| 75 Years and over | 235 (18.1%) | 619 (29.0%) |
Disability Class: Self-Care Difficulty
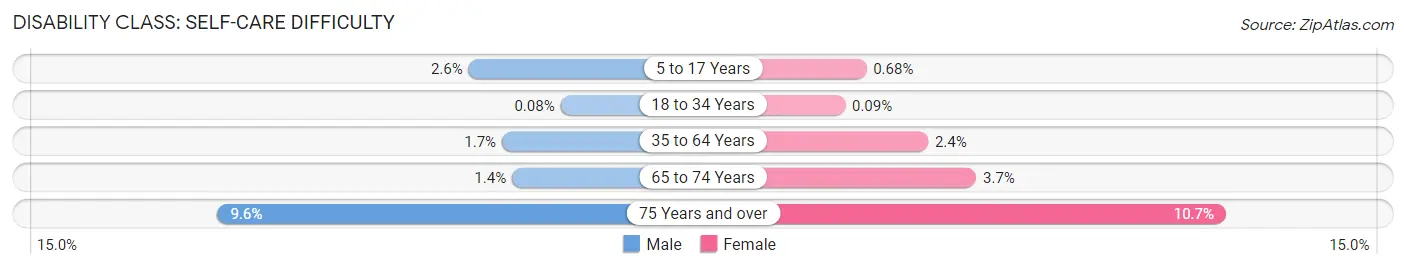
| Age Bracket | Male | Female |
| 5 to 17 Years | 84 (2.6%) | 20 (0.7%) |
| 18 to 34 Years | 17 (0.1%) | 19 (0.1%) |
| 35 to 64 Years | 158 (1.7%) | 211 (2.4%) |
| 65 to 74 Years | 30 (1.4%) | 97 (3.7%) |
| 75 Years and over | 125 (9.6%) | 228 (10.7%) |
Technology Access in Bloomington
Computing Device Access in Bloomington
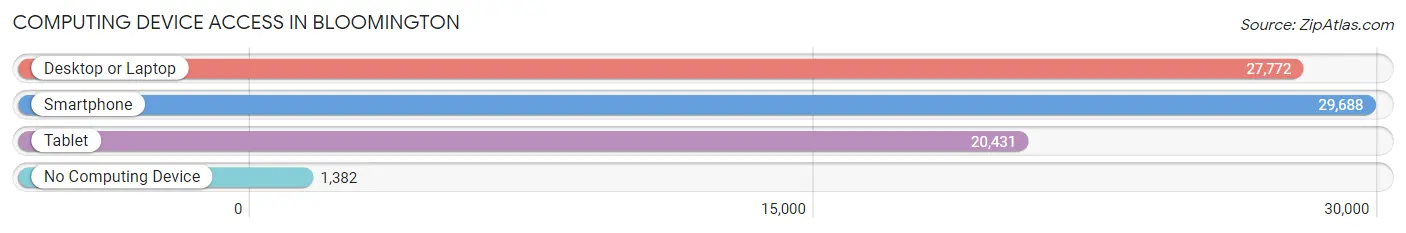
| Device Type | # Households | % Households |
| Desktop or Laptop | 27,772 | 85.2% |
| Smartphone | 29,688 | 91.1% |
| Tablet | 20,431 | 62.7% |
| No Computing Device | 1,382 | 4.2% |
| Total | 32,592 | 100.0% |
Internet Access in Bloomington
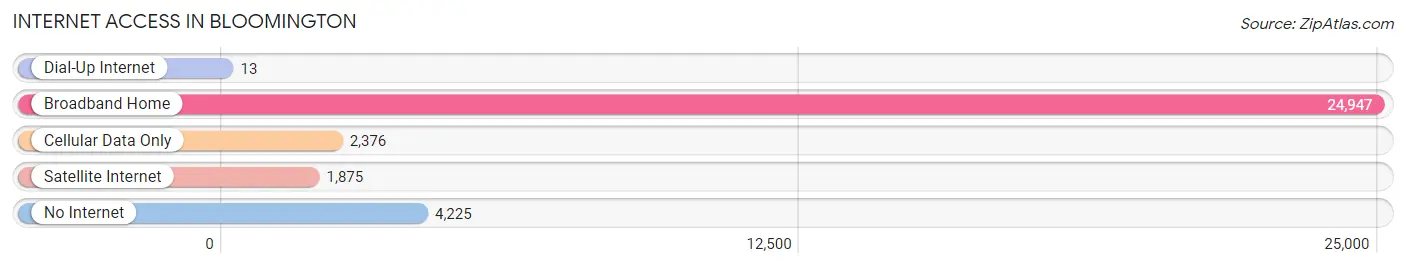
| Internet Type | # Households | % Households |
| Dial-Up Internet | 13 | 0.0% |
| Broadband Home | 24,947 | 76.5% |
| Cellular Data Only | 2,376 | 7.3% |
| Satellite Internet | 1,875 | 5.8% |
| No Internet | 4,225 | 13.0% |
| Total | 32,592 | 100.0% |
Bloomington Summary
Bloomington, Indiana is a city located in the south-central region of the state, in Monroe County. It is the county seat and the home of Indiana University. The city has a population of approximately 85,000 people, making it the seventh-largest city in Indiana. Bloomington is known for its vibrant culture, diverse economy, and its commitment to sustainability.
Geography
Bloomington is located in the rolling hills of south-central Indiana, approximately 50 miles south of Indianapolis. The city is situated in the center of Monroe County, and is bordered by the counties of Brown, Greene, Lawrence, and Owen. The city is located in the Wabash Valley, and is surrounded by the Hoosier National Forest. The city is situated on the banks of the East Fork of the White River, and is home to several lakes, including Lake Lemon, Griffy Lake, and Lake Monroe.
The city has a total area of 24.7 square miles, of which 24.3 square miles is land and 0.4 square miles is water. The city is divided into several distinct neighborhoods, including the Near West Side, the Near East Side, the Near North Side, and the Near South Side.
History
Bloomington was founded in 1818 by a group of settlers from Kentucky. The city was named after the blooming wildflowers that grew in the area. In 1820, the city was chosen as the county seat of Monroe County. In 1825, the city was incorporated, and in 1838, the city was designated as the home of Indiana University.
In the late 19th century, Bloomington experienced a period of rapid growth and development. The city was home to several factories, including the Bloomington Woolen Mills, the Bloomington Carriage Works, and the Bloomington Iron Works. The city also became a major center for the production of furniture, and was home to several furniture factories.
In the early 20th century, Bloomington experienced a period of decline. The city's factories closed, and the population began to decline. In the 1950s, the city began to experience a period of revitalization, and the population began to grow again.
Economy
Bloomington's economy is largely driven by the presence of Indiana University. The university is the city's largest employer, and is home to more than 40,000 students and faculty. The university also contributes significantly to the city's economy through research and development, and through the purchase of goods and services.
In addition to the university, Bloomington is home to several large employers, including Cook Group, Inc., a medical device manufacturer; Cummins, Inc., an engine manufacturer; and IU Health Bloomington, a hospital. The city is also home to several smaller businesses, including restaurants, retail stores, and professional services.
Demographics
As of the 2010 census, the population of Bloomington was 80,405. The city has a population density of 3,269 people per square mile. The racial makeup of the city is 79.2% White, 11.3% African American, 0.3% Native American, 4.2% Asian, 0.1% Pacific Islander, 2.2% from other races, and 2.9% from two or more races.
The median household income in Bloomington is $41,945, and the median family income is $54,817. The per capita income in the city is $25,945. The city's poverty rate is 17.3%.
Conclusion
Bloomington, Indiana is a vibrant city located in the south-central region of the state. The city is home to Indiana University, and is known for its diverse economy, vibrant culture, and commitment to sustainability. The city has a population of approximately 85,000 people, and is home to several large employers, including Cook Group, Inc., Cummins, Inc., and IU Health Bloomington. The city has a median household income of $41,945, and a poverty rate of 17.3%.
Common Questions
What is Per Capita Income in Bloomington?
Per Capita income in Bloomington is $31,069.
What is the Median Family Income in Bloomington?
Median Family Income in Bloomington is $85,448.
What is the Median Household income in Bloomington?
Median Household Income in Bloomington is $46,543.
What is Income or Wage Gap in Bloomington?
Income or Wage Gap in Bloomington is 27.3%.
Women in Bloomington earn 72.7 cents for every dollar earned by a man.
What is Family Income Deficit in Bloomington?
Family Income Deficit in Bloomington is $11,983.
Families that are below poverty line in Bloomington earn $11,983 less on average than the poverty threshold level.
What is Inequality or Gini Index in Bloomington?
Inequality or Gini Index in Bloomington is 0.54.
What is the Total Population of Bloomington?
Total Population of Bloomington is 79,006.
What is the Total Male Population of Bloomington?
Total Male Population of Bloomington is 39,839.
What is the Total Female Population of Bloomington?
Total Female Population of Bloomington is 39,167.
What is the Ratio of Males per 100 Females in Bloomington?
There are 101.72 Males per 100 Females in Bloomington.
What is the Ratio of Females per 100 Males in Bloomington?
There are 98.31 Females per 100 Males in Bloomington.
What is the Median Population Age in Bloomington?
Median Population Age in Bloomington is 24.4 Years.
What is the Average Family Size in Bloomington
Average Family Size in Bloomington is 2.7 People.
What is the Average Household Size in Bloomington
Average Household Size in Bloomington is 2.0 People.
How Large is the Labor Force in Bloomington?
There are 41,632 People in the Labor Forcein in Bloomington.
What is the Percentage of People in the Labor Force in Bloomington?
58.5% of People are in the Labor Force in Bloomington.
What is the Unemployment Rate in Bloomington?
Unemployment Rate in Bloomington is 6.5%.