Area Code 260 Map & Demographics
Area Code 260 Map
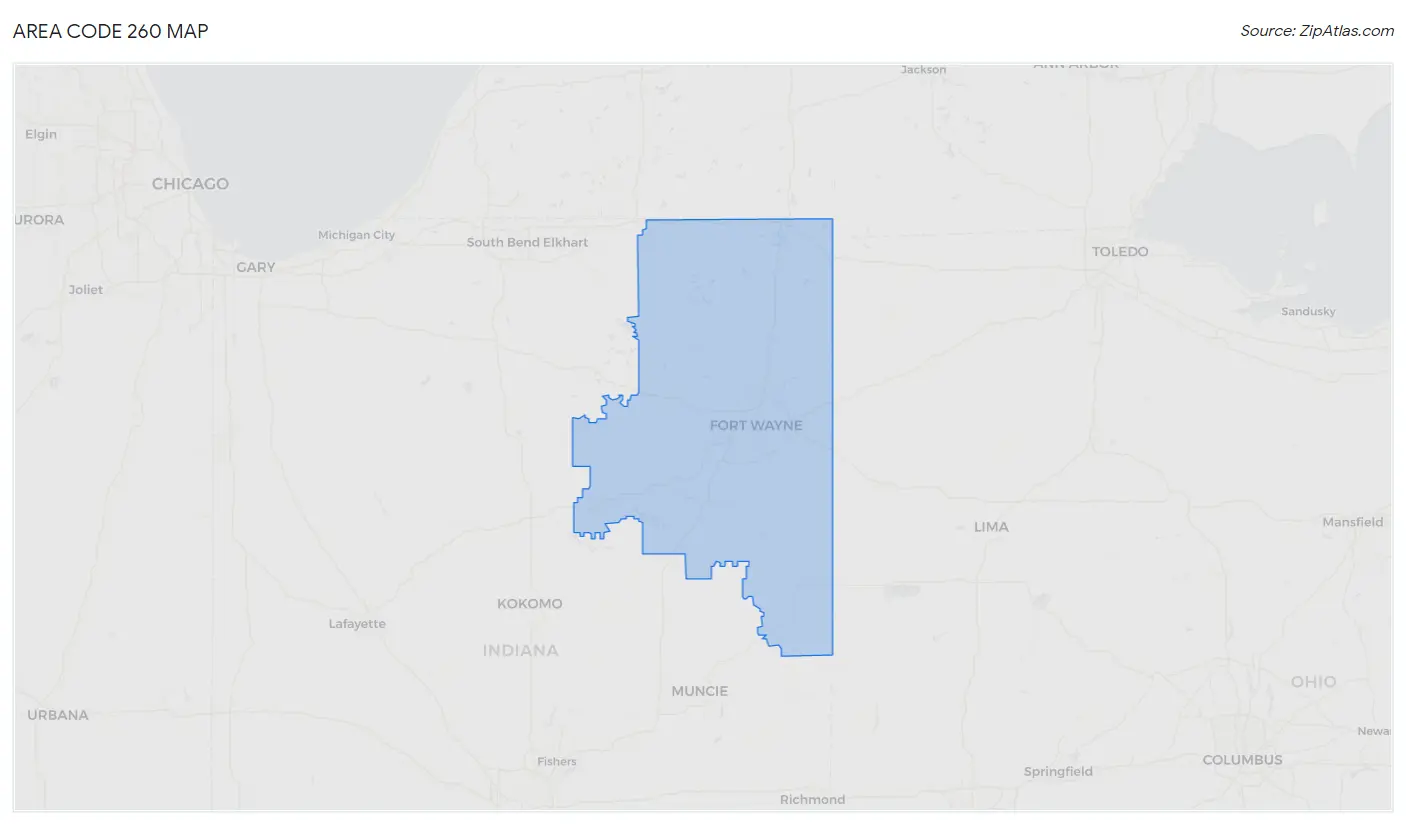
Area Code 260 Overview
$33,239
PER CAPITA INCOME
$82,837
AVG FAMILY INCOME
$71,006
AVG HOUSEHOLD INCOME
36.3%
WAGE / INCOME GAP [ % ]
63.7¢/ $1
WAGE / INCOME GAP [ $ ]
$10,677
FAMILY INCOME DEFICIT
35.77
INEQUALITY / GINI INDEX
740,196
TOTAL POPULATION
368,480
MALE POPULATION
371,716
FEMALE POPULATION
99.13
MALES / 100 FEMALES
100.88
FEMALES / 100 MALES
40.0
MEDIAN AGE
3.1
AVG FAMILY SIZE
2.6
AVG HOUSEHOLD SIZE
370,824
LABOR FORCE [ PEOPLE ]
64.3%
PERCENT IN LABOR FORCE
4.5%
UNEMPLOYMENT RATE
Income in Area Code 260
Income Overview in Area Code 260
Per Capita Income in Area Code 260 is $33,239, while median incomes of families and households are $82,837 and $71,006 respectively.
| Characteristic | Number | Measure |
| Per Capita Income | 740,196 | $33,239 |
| Median Family Income | 189,347 | $82,837 |
| Mean Family Income | 189,347 | $8,557,278 |
| Median Household Income | 287,980 | $71,006 |
| Mean Household Income | 287,980 | $7,630,469 |
| Income Deficit | 189,347 | $10,677 |
| Wage / Income Gap (%) | 740,196 | 36.34% |
| Wage / Income Gap ($) | 740,196 | 63.66¢ per $1 |
| Gini / Inequality Index | 740,196 | 35.77 |
Earnings by Sex in Area Code 260
Average Earnings in Area Code 260 are $40,751, $50,077 for men and $31,369 for women, a difference of 37.4%.
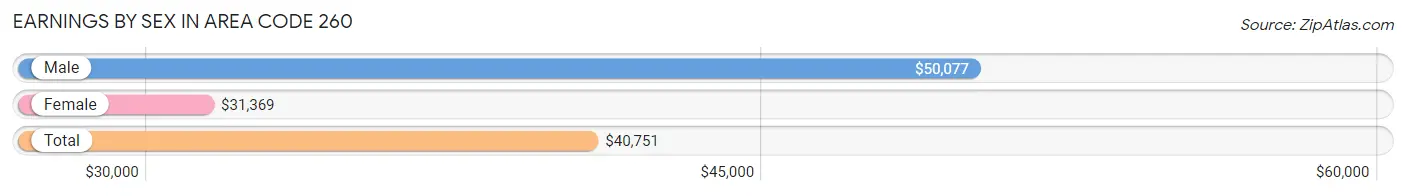
| Sex | Number | Average Earnings |
| Male | 213,599 (53.9%) | $50,077 |
| Female | 182,798 (46.1%) | $31,369 |
| Total | 396,397 (100.0%) | $40,751 |
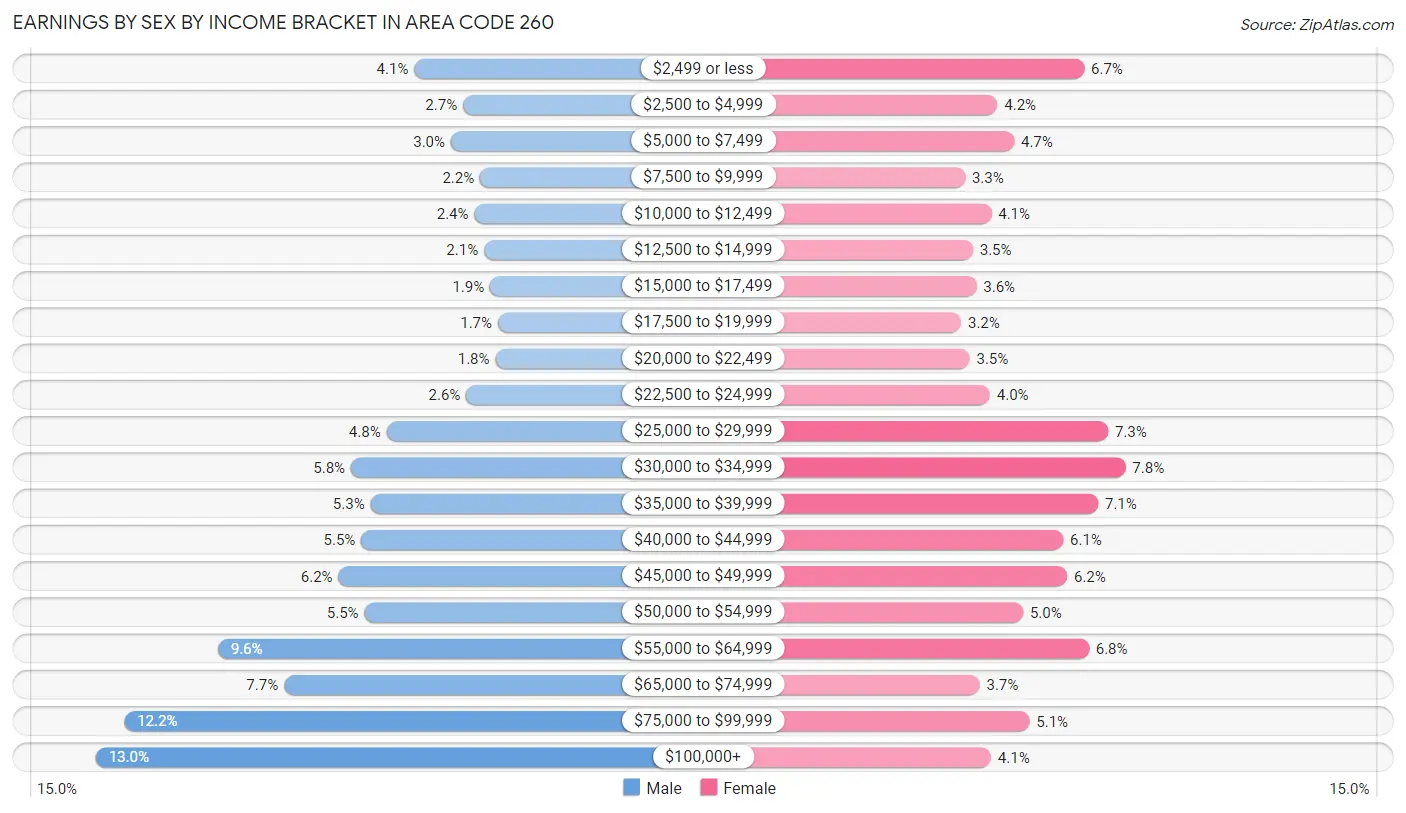
Earnings by Sex by Income Bracket in Area Code 260
The most common earnings brackets in Area Code 260 are $100,000+ for men (27,763 | 13.0%) and $30,000 to $34,999 for women (14,317 | 7.8%).
| Income | Male | Female |
| $2,499 or less | 8,657 (4.1%) | 12,198 (6.7%) |
| $2,500 to $4,999 | 5,727 (2.7%) | 7,730 (4.2%) |
| $5,000 to $7,499 | 6,456 (3.0%) | 8,587 (4.7%) |
| $7,500 to $9,999 | 4,707 (2.2%) | 6,070 (3.3%) |
| $10,000 to $12,499 | 5,038 (2.4%) | 7,424 (4.1%) |
| $12,500 to $14,999 | 4,464 (2.1%) | 6,477 (3.5%) |
| $15,000 to $17,499 | 4,106 (1.9%) | 6,645 (3.6%) |
| $17,500 to $19,999 | 3,631 (1.7%) | 5,868 (3.2%) |
| $20,000 to $22,499 | 3,789 (1.8%) | 6,304 (3.5%) |
| $22,500 to $24,999 | 5,536 (2.6%) | 7,344 (4.0%) |
| $25,000 to $29,999 | 10,314 (4.8%) | 13,414 (7.3%) |
| $30,000 to $34,999 | 12,458 (5.8%) | 14,317 (7.8%) |
| $35,000 to $39,999 | 11,287 (5.3%) | 12,903 (7.1%) |
| $40,000 to $44,999 | 11,837 (5.5%) | 11,116 (6.1%) |
| $45,000 to $49,999 | 13,208 (6.2%) | 11,318 (6.2%) |
| $50,000 to $54,999 | 11,647 (5.4%) | 9,052 (5.0%) |
| $55,000 to $64,999 | 20,433 (9.6%) | 12,428 (6.8%) |
| $65,000 to $74,999 | 16,479 (7.7%) | 6,812 (3.7%) |
| $75,000 to $99,999 | 26,062 (12.2%) | 9,381 (5.1%) |
| $100,000+ | 27,763 (13.0%) | 7,410 (4.1%) |
| Total | 213,599 (100.0%) | 182,798 (100.0%) |
Earnings by Sex by Educational Attainment in Area Code 260
Average earnings in Area Code 260 are $4,750,796 for men and $3,015,190 for women, a difference of 36.5%. Men with an educational attainment of bachelor's degree enjoy the highest average annual earnings of $5,410,186, while those with less than high school education earn the least with $2,878,616. Women with an educational attainment of bachelor's degree earn the most with the average annual earnings of $3,512,305, while those with less than high school education have the smallest earnings of $866,008.

| Educational Attainment | Male Income | Female Income |
| Less than High School | $2,878,616 | $866,008 |
| High School Diploma | $4,155,416 | $2,532,536 |
| College or Associate's Degree | $4,715,411 | $2,649,228 |
| Bachelor's Degree | $5,410,186 | $3,512,305 |
| Graduate Degree | $3,743,017 | $3,112,743 |
| Total | $4,750,796 | $3,015,190 |
Family Income in Area Code 260
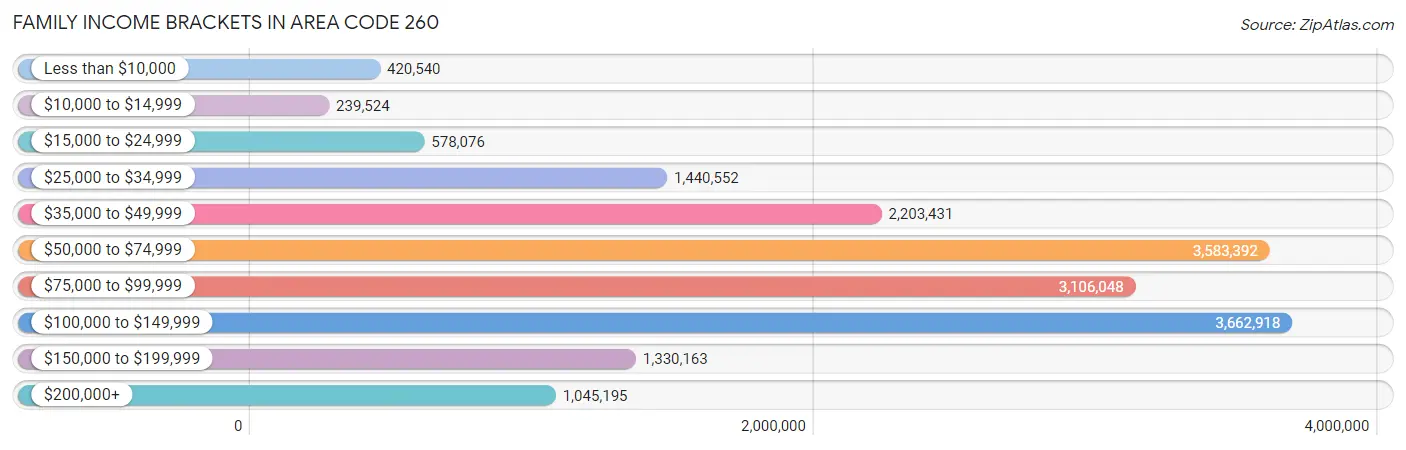
Family Income Brackets in Area Code 260
According to the Area Code 260 family income data, there are 3,662,918 families falling into the $100,000 to $149,999 income range, which is the most common income bracket and makes up 1,934.5% of all families. Conversely, the $10,000 to $14,999 income bracket is the least frequent group with only 239,524 families (126.5%) belonging to this category.
| Income Bracket | # Families | % Families |
| Less than $10,000 | 420,540 | 222.1% |
| $10,000 to $14,999 | 239,524 | 126.5% |
| $15,000 to $24,999 | 578,076 | 305.3% |
| $25,000 to $34,999 | 1,440,552 | 760.8% |
| $35,000 to $49,999 | 2,203,431 | 1,163.7% |
| $50,000 to $74,999 | 3,583,392 | 1,892.5% |
| $75,000 to $99,999 | 3,106,048 | 1,640.4% |
| $100,000 to $149,999 | 3,662,918 | 1,934.5% |
| $150,000 to $199,999 | 1,330,163 | 702.5% |
| $200,000+ | 1,045,195 | 552.0% |
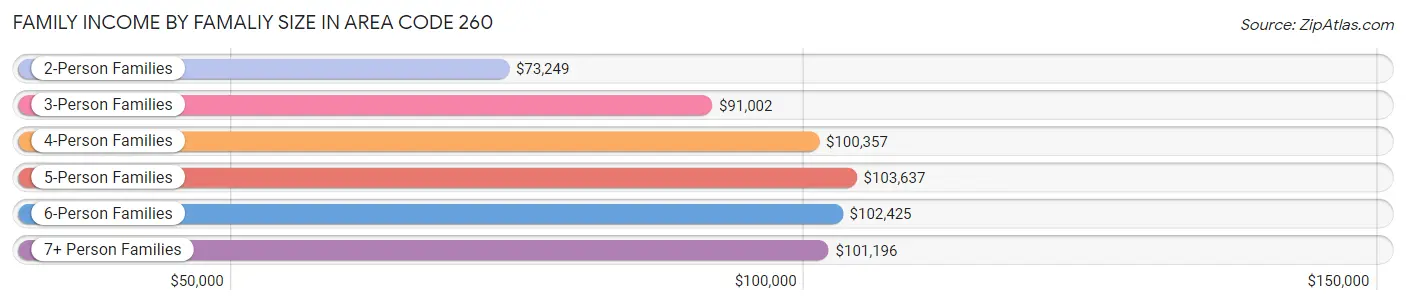
Family Income by Famaliy Size in Area Code 260
5-person families (16,325 | 8.6%) account for the highest median family income in Area Code 260 with $103,637 per family, while 2-person families (93,194 | 49.2%) have the highest median income of $36,625 per family member.
| Income Bracket | # Families | Median Income |
| 2-Person Families | 93,194 (49.2%) | $73,249 |
| 3-Person Families | 37,066 (19.6%) | $91,002 |
| 4-Person Families | 30,703 (16.2%) | $100,357 |
| 5-Person Families | 16,325 (8.6%) | $103,637 |
| 6-Person Families | 6,989 (3.7%) | $102,425 |
| 7+ Person Families | 5,070 (2.7%) | $101,196 |
| Total | 189,347 (100.0%) | $82,837 |
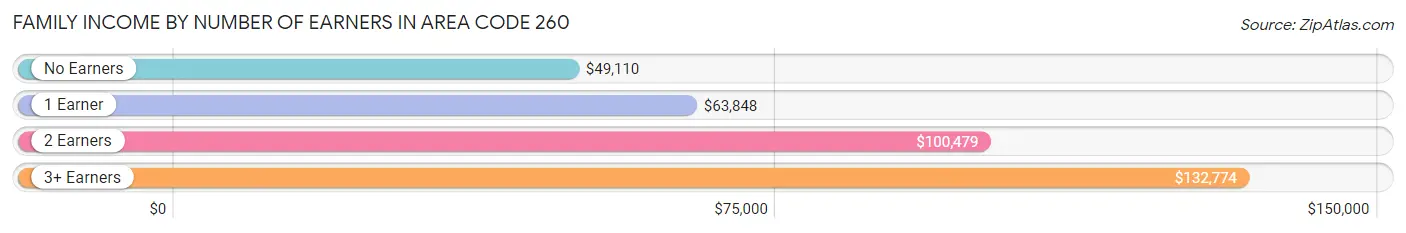
Family Income by Number of Earners in Area Code 260
The median family income in Area Code 260 is $82,837, with families comprising 3+ earners (22,566) having the highest median family income of $132,774, while families with no earners (25,542) have the lowest median family income of $49,110, accounting for 11.9% and 13.5% of families, respectively.
| Number of Earners | # Families | Median Income |
| No Earners | 25,542 (13.5%) | $49,110 |
| 1 Earner | 59,716 (31.5%) | $63,848 |
| 2 Earners | 81,523 (43.0%) | $100,479 |
| 3+ Earners | 22,566 (11.9%) | $132,774 |
| Total | 189,347 (100.0%) | $82,837 |
Household Income in Area Code 260
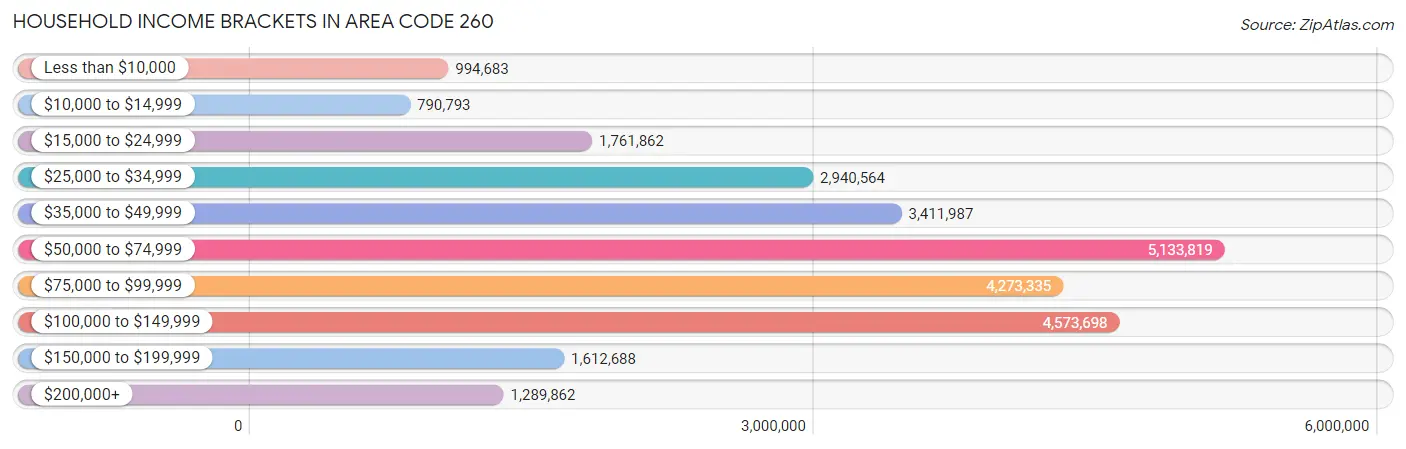
Household Income Brackets in Area Code 260
With 5,133,819 households falling in the category, the $50,000 to $74,999 income range is the most frequent in Area Code 260, accounting for 1,782.7% of all households. In contrast, only 790,793 households (274.6%) fall into the $10,000 to $14,999 income bracket, making it the least populous group.
| Income Bracket | # Households | % Households |
| Less than $10,000 | 994,683 | 345.4% |
| $10,000 to $14,999 | 790,793 | 274.6% |
| $15,000 to $24,999 | 1,761,862 | 611.8% |
| $25,000 to $34,999 | 2,940,564 | 1,021.1% |
| $35,000 to $49,999 | 3,411,987 | 1,184.8% |
| $50,000 to $74,999 | 5,133,819 | 1,782.7% |
| $75,000 to $99,999 | 4,273,335 | 1,483.9% |
| $100,000 to $149,999 | 4,573,698 | 1,588.2% |
| $150,000 to $199,999 | 1,612,688 | 560.0% |
| $200,000+ | 1,289,862 | 447.9% |
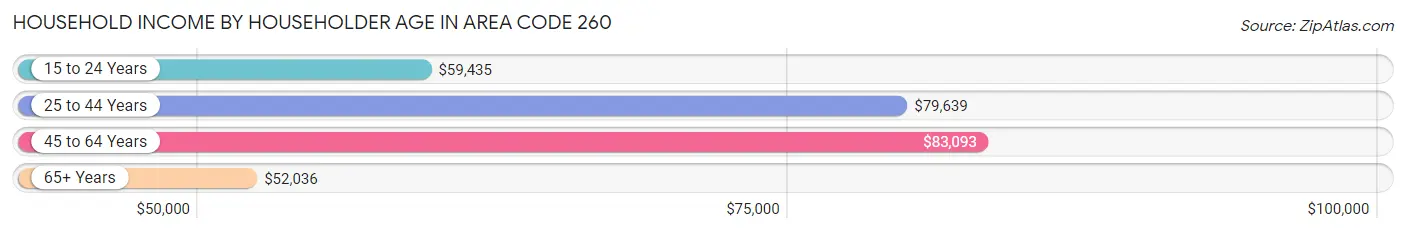
Household Income by Householder Age in Area Code 260
The median household income in Area Code 260 is $71,006, with the highest median household income of $83,093 found in the 45 to 64 years age bracket for the primary householder. A total of 104,798 households (36.4%) fall into this category. Meanwhile, the 65+ years age bracket for the primary householder has the lowest median household income of $52,036, with 75,463 households (26.2%) in this group.
| Income Bracket | # Households | Median Income |
| 15 to 24 Years | 13,238 (4.6%) | $59,435 |
| 25 to 44 Years | 94,481 (32.8%) | $79,639 |
| 45 to 64 Years | 104,798 (36.4%) | $83,093 |
| 65+ Years | 75,463 (26.2%) | $52,036 |
| Total | 287,980 (100.0%) | $71,006 |
Poverty in Area Code 260
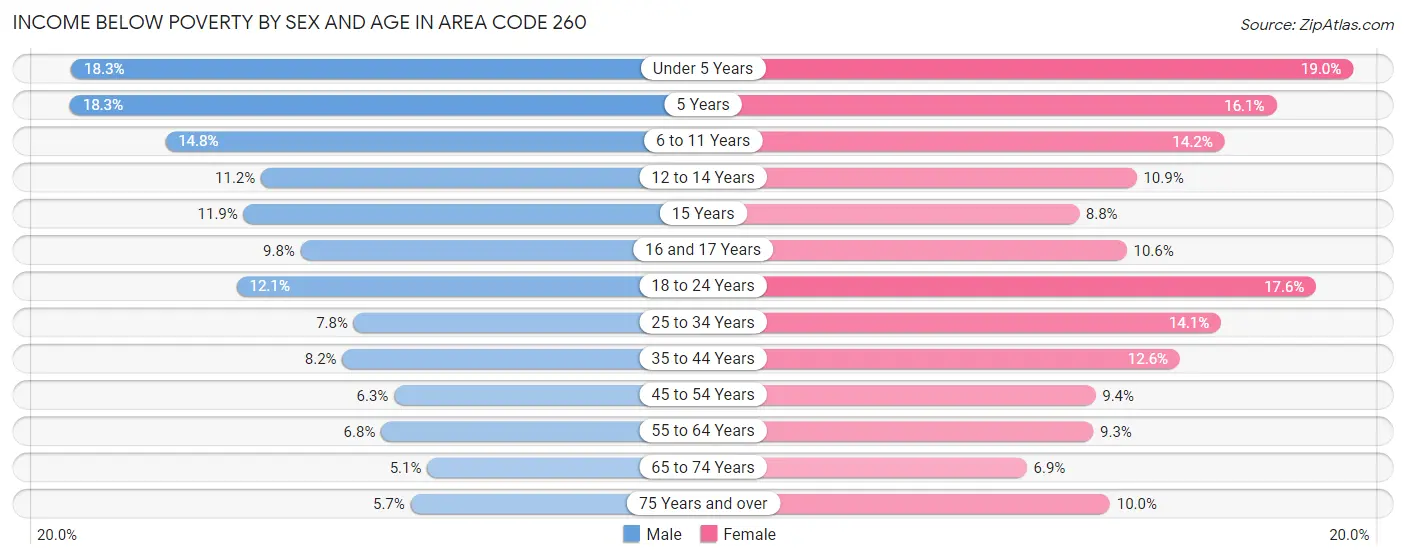
Income Below Poverty by Sex and Age in Area Code 260
With 9.3% poverty level for males and 12.0% for females among the residents of Area Code 260, 5 year old males and under 5 year old females are the most vulnerable to poverty, with 853 males (18.3%) and 4,430 females (19.0%) in their respective age groups living below the poverty level.
| Age Bracket | Male | Female |
| Under 5 Years | 4,537 (18.3%) | 4,430 (19.0%) |
| 5 Years | 853 (18.3%) | 705 (16.1%) |
| 6 to 11 Years | 4,432 (14.8%) | 4,238 (14.2%) |
| 12 to 14 Years | 1,891 (11.2%) | 1,670 (10.9%) |
| 15 Years | 680 (11.9%) | 429 (8.8%) |
| 16 and 17 Years | 1,013 (9.8%) | 1,114 (10.6%) |
| 18 to 24 Years | 3,964 (12.1%) | 5,378 (17.6%) |
| 25 to 34 Years | 3,693 (7.8%) | 6,636 (14.1%) |
| 35 to 44 Years | 3,635 (8.2%) | 5,515 (12.6%) |
| 45 to 54 Years | 2,797 (6.3%) | 4,097 (9.4%) |
| 55 to 64 Years | 3,170 (6.8%) | 4,421 (9.3%) |
| 65 to 74 Years | 1,716 (5.1%) | 2,524 (6.9%) |
| 75 Years and over | 1,052 (5.7%) | 2,634 (10.0%) |
| Total | 33,433 (9.3%) | 43,791 (12.0%) |
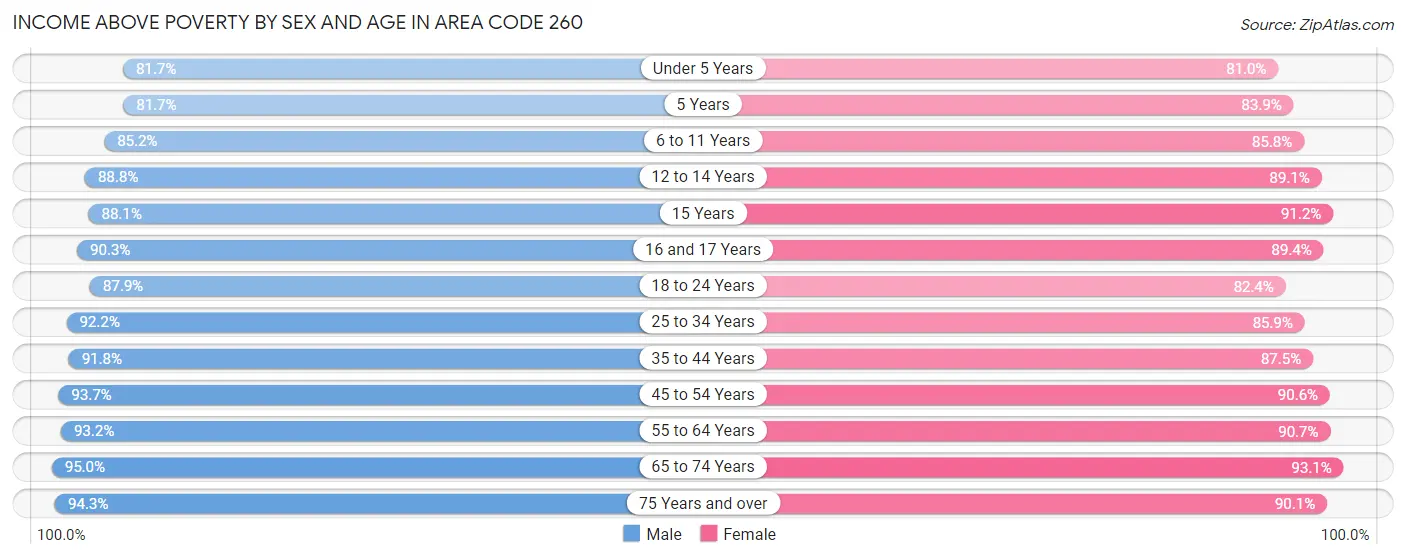
Income Above Poverty by Sex and Age in Area Code 260
According to the poverty statistics in Area Code 260, males aged 65 to 74 years and females aged 65 to 74 years are the age groups that are most secure financially, with 95.0% of males and 93.1% of females in these age groups living above the poverty line.
| Age Bracket | Male | Female |
| Under 5 Years | 20,290 (81.7%) | 18,914 (81.0%) |
| 5 Years | 3,802 (81.7%) | 3,667 (83.9%) |
| 6 to 11 Years | 25,551 (85.2%) | 25,578 (85.8%) |
| 12 to 14 Years | 14,965 (88.8%) | 13,590 (89.1%) |
| 15 Years | 5,049 (88.1%) | 4,445 (91.2%) |
| 16 and 17 Years | 9,381 (90.2%) | 9,425 (89.4%) |
| 18 to 24 Years | 28,723 (87.9%) | 25,154 (82.4%) |
| 25 to 34 Years | 43,748 (92.2%) | 40,495 (85.9%) |
| 35 to 44 Years | 40,674 (91.8%) | 38,431 (87.5%) |
| 45 to 54 Years | 41,725 (93.7%) | 39,423 (90.6%) |
| 55 to 64 Years | 43,719 (93.2%) | 42,960 (90.7%) |
| 65 to 74 Years | 32,282 (95.0%) | 34,259 (93.1%) |
| 75 Years and over | 17,486 (94.3%) | 23,835 (90.0%) |
| Total | 327,395 (90.7%) | 320,176 (88.0%) |
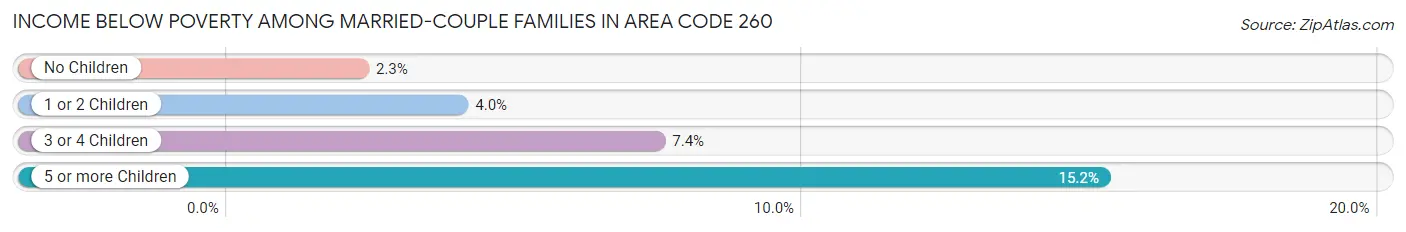
Income Below Poverty Among Married-Couple Families in Area Code 260
The poverty statistics for married-couple families in Area Code 260 show that 3.6% or 5,208 of the total 144,887 families live below the poverty line. Families with 5 or more children have the highest poverty rate of 15.2%, comprising of 470 families. On the other hand, families with no children have the lowest poverty rate of 2.3%, which includes 1,933 families.
| Children | Above Poverty | Below Poverty |
| No Children | 82,905 (97.7%) | 1,933 (2.3%) |
| 1 or 2 Children | 40,145 (96.0%) | 1,679 (4.0%) |
| 3 or 4 Children | 14,004 (92.6%) | 1,126 (7.4%) |
| 5 or more Children | 2,625 (84.8%) | 470 (15.2%) |
| Total | 139,679 (96.4%) | 5,208 (3.6%) |
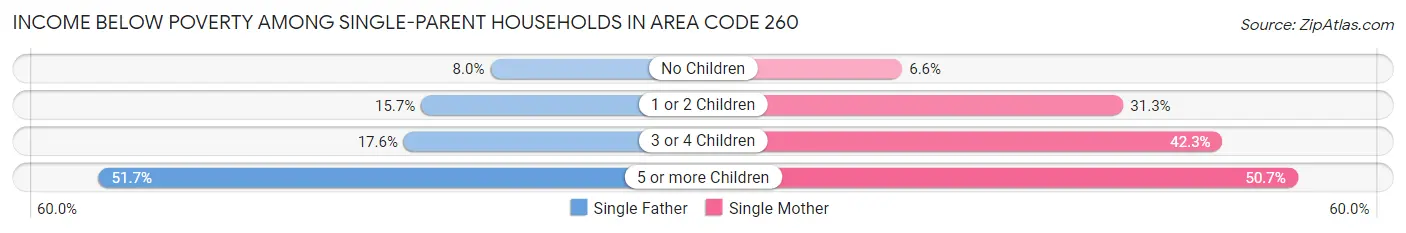
Income Below Poverty Among Single-Parent Households in Area Code 260
According to the poverty data in Area Code 260, 12.7% or 1,827 single-father households and 25.1% or 7,547 single-mother households are living below the poverty line. Among single-father households, those with 5 or more children have the highest poverty rate, with 30 households (51.7%) experiencing poverty. Likewise, among single-mother households, those with 5 or more children have the highest poverty rate, with 248 households (50.7%) falling below the poverty line.
| Children | Single Father | Single Mother |
| No Children | 489 (8.0%) | 637 (6.6%) |
| 1 or 2 Children | 1,060 (15.7%) | 4,960 (31.3%) |
| 3 or 4 Children | 248 (17.6%) | 1,702 (42.3%) |
| 5 or more Children | 30 (51.7%) | 248 (50.7%) |
| Total | 1,827 (12.7%) | 7,547 (25.1%) |
Income Below Poverty Among Married-Couple vs Single-Parent Households in Area Code 260
The poverty data for Area Code 260 shows that 5,208 of the married-couple family households (3.6%) and 9,374 of the single-parent households (21.1%) are living below the poverty level. Within the married-couple family households, those with 5 or more children have the highest poverty rate, with 470 households (15.2%) falling below the poverty line. Among the single-parent households, those with 5 or more children have the highest poverty rate, with 278 household (50.8%) living below poverty.
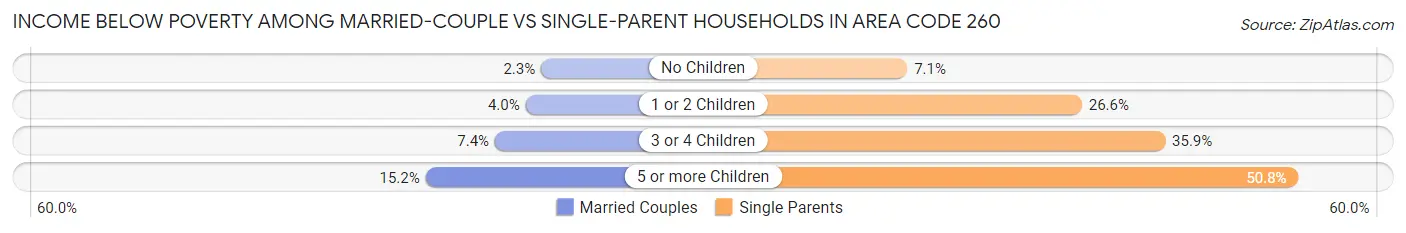
| Children | Married-Couple Families | Single-Parent Households |
| No Children | 1,933 (2.3%) | 1,126 (7.1%) |
| 1 or 2 Children | 1,679 (4.0%) | 6,020 (26.6%) |
| 3 or 4 Children | 1,126 (7.4%) | 1,950 (35.9%) |
| 5 or more Children | 470 (15.2%) | 278 (50.8%) |
| Total | 5,208 (3.6%) | 9,374 (21.1%) |
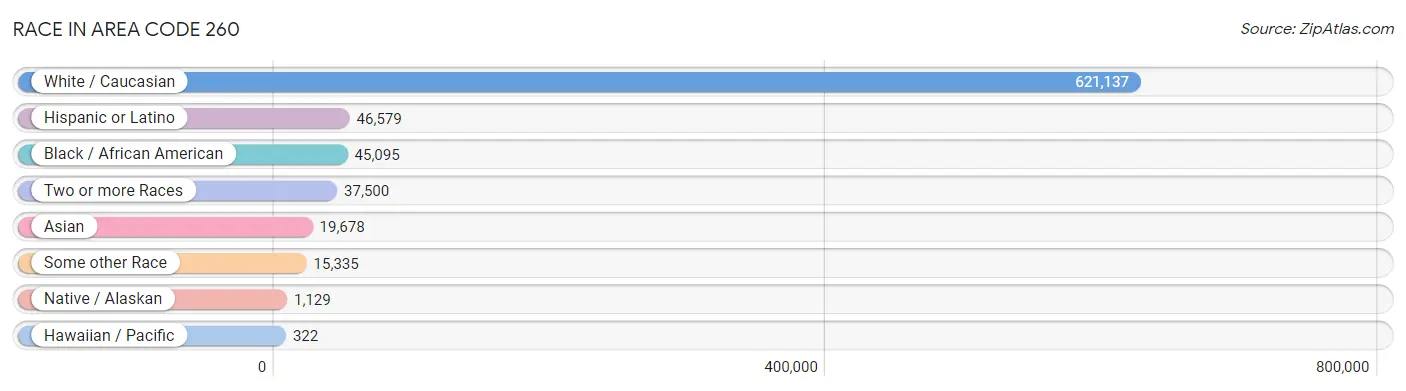
Race in Area Code 260
The most populous races in Area Code 260 are White / Caucasian (621,137 | 83.9%), Hispanic or Latino (46,579 | 6.3%), and Black / African American (45,095 | 6.1%).
| Race | # Population | % Population |
| Asian | 19,678 | 2.7% |
| Black / African American | 45,095 | 6.1% |
| Hawaiian / Pacific | 322 | 0.0% |
| Hispanic or Latino | 46,579 | 6.3% |
| Native / Alaskan | 1,129 | 0.2% |
| White / Caucasian | 621,137 | 83.9% |
| Two or more Races | 37,500 | 5.1% |
| Some other Race | 15,335 | 2.1% |
| Total | 740,196 | 100.0% |
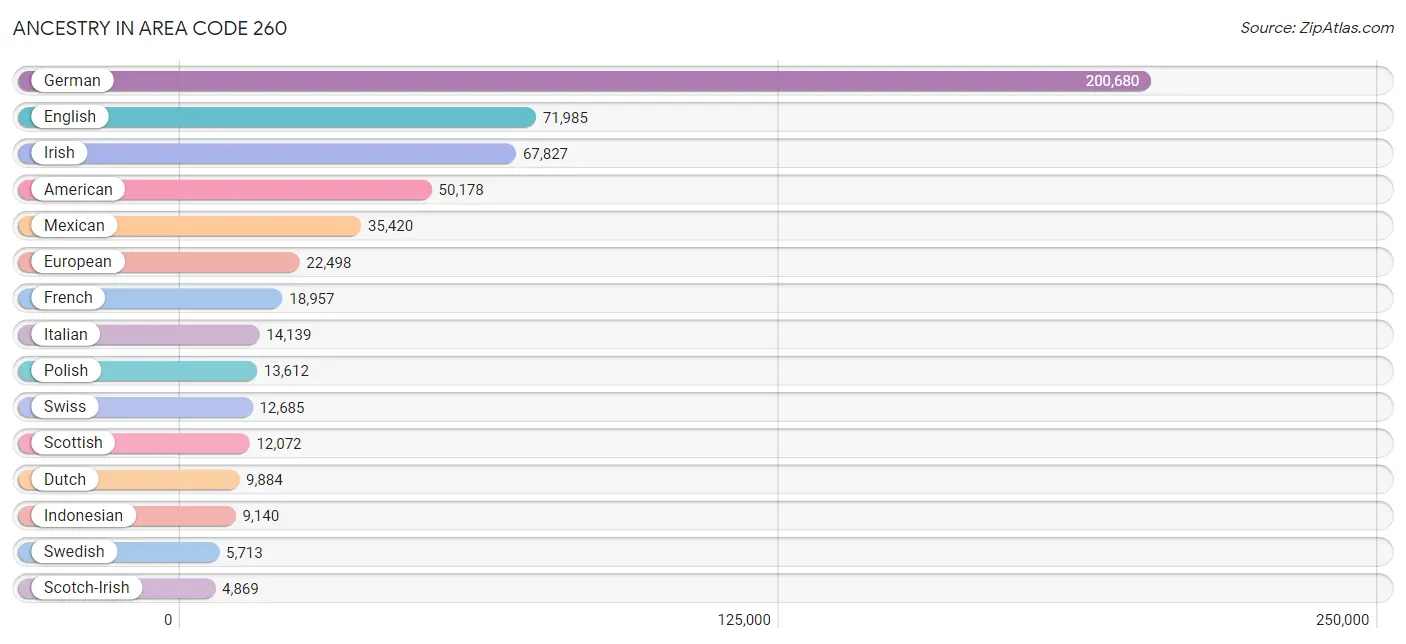
Ancestry in Area Code 260
The most populous ancestries reported in Area Code 260 are German (200,680 | 27.1%), English (71,985 | 9.7%), Irish (67,827 | 9.2%), American (50,178 | 6.8%), and Mexican (35,420 | 4.8%), together accounting for 57.6% of all Area Code 260 residents.
| Ancestry | # Population | % Population |
| Afghan | 15 | 0.0% |
| African | 1,785 | 0.2% |
| Alaska Native | 6 | 0.0% |
| Albanian | 56 | 0.0% |
| Alsatian | 8 | 0.0% |
| American | 50,178 | 6.8% |
| Apache | 187 | 0.0% |
| Arab | 2,391 | 0.3% |
| Argentinean | 97 | 0.0% |
| Armenian | 38 | 0.0% |
| Assyrian / Chaldean / Syriac | 15 | 0.0% |
| Australian | 108 | 0.0% |
| Austrian | 691 | 0.1% |
| Bahamian | 55 | 0.0% |
| Bangladeshi | 17 | 0.0% |
| Barbadian | 9 | 0.0% |
| Basque | 17 | 0.0% |
| Belgian | 1,013 | 0.1% |
| Belizean | 27 | 0.0% |
| Bhutanese | 664 | 0.1% |
| Blackfeet | 292 | 0.0% |
| Bolivian | 73 | 0.0% |
| Brazilian | 149 | 0.0% |
| British | 2,862 | 0.4% |
| British West Indian | 32 | 0.0% |
| Bulgarian | 215 | 0.0% |
| Burmese | 1,799 | 0.2% |
| Cajun | 23 | 0.0% |
| Canadian | 1,048 | 0.1% |
| Carpatho Rusyn | 66 | 0.0% |
| Celtic | 62 | 0.0% |
| Central American | 4,073 | 0.5% |
| Central American Indian | 227 | 0.0% |
| Cherokee | 2,000 | 0.3% |
| Cheyenne | 18 | 0.0% |
| Chickasaw | 26 | 0.0% |
| Chippewa | 152 | 0.0% |
| Choctaw | 163 | 0.0% |
| Colombian | 436 | 0.1% |
| Comanche | 49 | 0.0% |
| Costa Rican | 31 | 0.0% |
| Cree | 7 | 0.0% |
| Creek | 32 | 0.0% |
| Croatian | 763 | 0.1% |
| Crow | 4 | 0.0% |
| Cuban | 374 | 0.1% |
| Czech | 1,050 | 0.1% |
| Czechoslovakian | 356 | 0.1% |
| Danish | 890 | 0.1% |
| Dominican | 134 | 0.0% |
| Dutch | 9,884 | 1.3% |
| Dutch West Indian | 17 | 0.0% |
| Eastern European | 1,123 | 0.2% |
| Ecuadorian | 179 | 0.0% |
| Egyptian | 145 | 0.0% |
| English | 71,985 | 9.7% |
| Ethiopian | 481 | 0.1% |
| European | 22,498 | 3.0% |
| Filipino | 115 | 0.0% |
| Finnish | 842 | 0.1% |
| French | 18,957 | 2.6% |
| French American Indian | 32 | 0.0% |
| French Canadian | 1,734 | 0.2% |
| German | 200,680 | 27.1% |
| German Russian | 214 | 0.0% |
| Ghanaian | 202 | 0.0% |
| Greek | 1,662 | 0.2% |
| Guamanian / Chamorro | 191 | 0.0% |
| Guatemalan | 2,150 | 0.3% |
| Guyanese | 5 | 0.0% |
| Haitian | 109 | 0.0% |
| Honduran | 344 | 0.1% |
| Hungarian | 2,630 | 0.4% |
| Icelander | 10 | 0.0% |
| Indian (Asian) | 1,900 | 0.3% |
| Indonesian | 9,140 | 1.2% |
| Iranian | 340 | 0.1% |
| Iraqi | 79 | 0.0% |
| Irish | 67,827 | 9.2% |
| Iroquois | 66 | 0.0% |
| Israeli | 64 | 0.0% |
| Italian | 14,139 | 1.9% |
| Jamaican | 185 | 0.0% |
| Japanese | 61 | 0.0% |
| Jordanian | 40 | 0.0% |
| Kenyan | 386 | 0.1% |
| Korean | 2,858 | 0.4% |
| Laotian | 17 | 0.0% |
| Latvian | 101 | 0.0% |
| Lebanese | 391 | 0.1% |
| Liberian | 45 | 0.0% |
| Lithuanian | 359 | 0.1% |
| Lumbee | 10 | 0.0% |
| Luxembourger | 54 | 0.0% |
| Macedonian | 749 | 0.1% |
| Malaysian | 361 | 0.1% |
| Maltese | 7 | 0.0% |
| Mexican | 35,420 | 4.8% |
| Mexican American Indian | 283 | 0.0% |
| Mongolian | 303 | 0.0% |
| Moroccan | 249 | 0.0% |
| Native Hawaiian | 259 | 0.0% |
| Navajo | 107 | 0.0% |
| Nicaraguan | 75 | 0.0% |
| Nigerian | 333 | 0.0% |
| Northern European | 876 | 0.1% |
| Norwegian | 3,570 | 0.5% |
| Okinawan | 5 | 0.0% |
| Osage | 7 | 0.0% |
| Ottawa | 43 | 0.0% |
| Pakistani | 421 | 0.1% |
| Palestinian | 125 | 0.0% |
| Panamanian | 409 | 0.1% |
| Pennsylvania German | 4,453 | 0.6% |
| Peruvian | 104 | 0.0% |
| Pima | 10 | 0.0% |
| Polish | 13,612 | 1.8% |
| Portuguese | 434 | 0.1% |
| Potawatomi | 42 | 0.0% |
| Puerto Rican | 2,670 | 0.4% |
| Puget Sound Salish | 9 | 0.0% |
| Romanian | 815 | 0.1% |
| Russian | 1,318 | 0.2% |
| Salvadoran | 1,064 | 0.1% |
| Samoan | 64 | 0.0% |
| Scandinavian | 1,493 | 0.2% |
| Scotch-Irish | 4,869 | 0.7% |
| Scottish | 12,072 | 1.6% |
| Seminole | 54 | 0.0% |
| Serbian | 304 | 0.0% |
| Sioux | 385 | 0.1% |
| Slavic | 117 | 0.0% |
| Slovak | 664 | 0.1% |
| Slovene | 185 | 0.0% |
| Somali | 134 | 0.0% |
| South African | 86 | 0.0% |
| South American | 1,018 | 0.1% |
| South American Indian | 29 | 0.0% |
| Spaniard | 443 | 0.1% |
| Spanish | 425 | 0.1% |
| Sri Lankan | 2,046 | 0.3% |
| Subsaharan African | 4,113 | 0.6% |
| Sudanese | 412 | 0.1% |
| Swedish | 5,713 | 0.8% |
| Swiss | 12,685 | 1.7% |
| Syrian | 352 | 0.1% |
| Thai | 2,442 | 0.3% |
| Trinidadian and Tobagonian | 54 | 0.0% |
| Turkish | 30 | 0.0% |
| Ukrainian | 852 | 0.1% |
| Ute | 1 | 0.0% |
| Venezuelan | 129 | 0.0% |
| Vietnamese | 113 | 0.0% |
| Welsh | 4,466 | 0.6% |
| West Indian | 166 | 0.0% |
| Yaqui | 6 | 0.0% |
| Yugoslavian | 827 | 0.1% |
| Zimbabwean | 10 | 0.0% | View All 158 Rows |
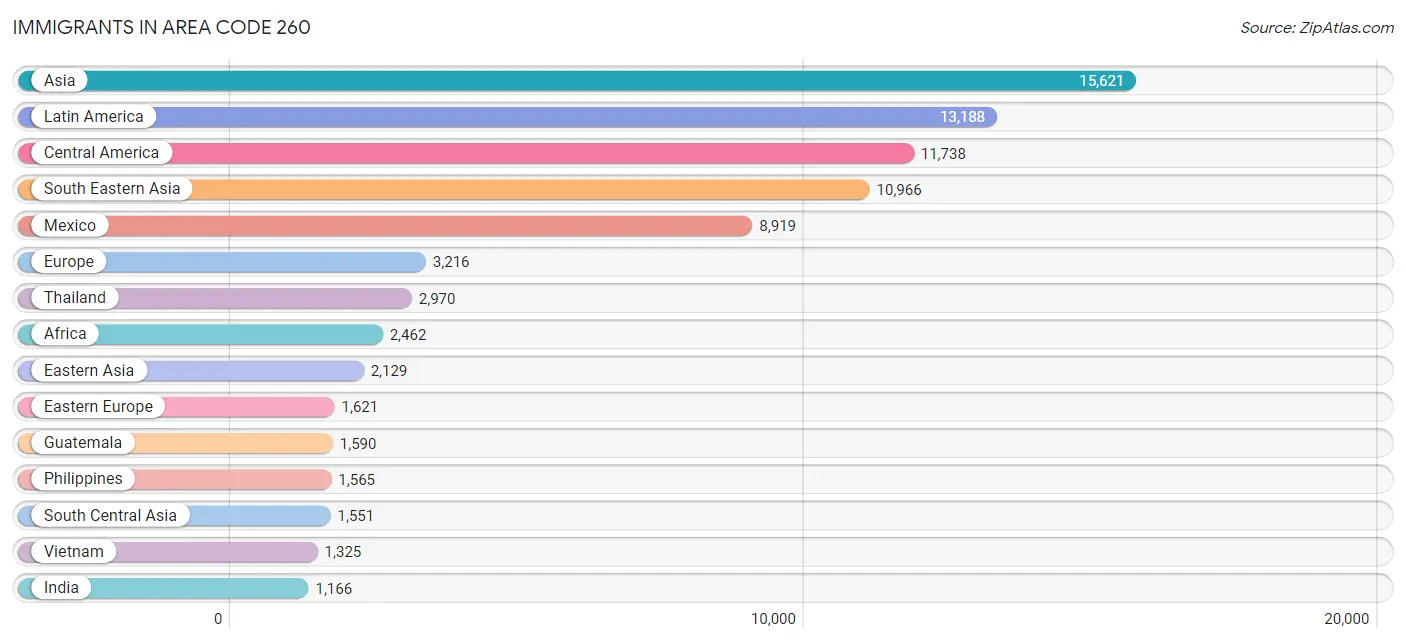
Immigrants in Area Code 260
The most numerous immigrant groups reported in Area Code 260 came from Asia (15,621 | 2.1%), Latin America (13,188 | 1.8%), Central America (11,738 | 1.6%), South Eastern Asia (10,966 | 1.5%), and Mexico (8,919 | 1.2%), together accounting for 8.2% of all Area Code 260 residents.
| Immigration Origin | # Population | % Population |
| Africa | 2,462 | 0.3% |
| Albania | 43 | 0.0% |
| Argentina | 66 | 0.0% |
| Asia | 15,621 | 2.1% |
| Australia | 111 | 0.0% |
| Bahamas | 71 | 0.0% |
| Bangladesh | 35 | 0.0% |
| Barbados | 119 | 0.0% |
| Belarus | 20 | 0.0% |
| Belgium | 11 | 0.0% |
| Bolivia | 37 | 0.0% |
| Bosnia and Herzegovina | 400 | 0.1% |
| Brazil | 241 | 0.0% |
| Bulgaria | 61 | 0.0% |
| Cameroon | 26 | 0.0% |
| Canada | 974 | 0.1% |
| Caribbean | 567 | 0.1% |
| Central America | 11,738 | 1.6% |
| China | 1,155 | 0.2% |
| Colombia | 297 | 0.0% |
| Congo | 140 | 0.0% |
| Costa Rica | 14 | 0.0% |
| Croatia | 21 | 0.0% |
| Cuba | 53 | 0.0% |
| Czechoslovakia | 39 | 0.0% |
| Denmark | 18 | 0.0% |
| Dominican Republic | 44 | 0.0% |
| Eastern Africa | 973 | 0.1% |
| Eastern Asia | 2,129 | 0.3% |
| Eastern Europe | 1,621 | 0.2% |
| Ecuador | 115 | 0.0% |
| Egypt | 59 | 0.0% |
| El Salvador | 877 | 0.1% |
| England | 224 | 0.0% |
| Ethiopia | 250 | 0.0% |
| Europe | 3,216 | 0.4% |
| France | 54 | 0.0% |
| Germany | 560 | 0.1% |
| Ghana | 199 | 0.0% |
| Greece | 111 | 0.0% |
| Grenada | 32 | 0.0% |
| Guatemala | 1,590 | 0.2% |
| Guyana | 15 | 0.0% |
| Haiti | 115 | 0.0% |
| Honduras | 239 | 0.0% |
| Hong Kong | 27 | 0.0% |
| Hungary | 81 | 0.0% |
| India | 1,166 | 0.2% |
| Indonesia | 49 | 0.0% |
| Iran | 36 | 0.0% |
| Iraq | 60 | 0.0% |
| Ireland | 59 | 0.0% |
| Israel | 26 | 0.0% |
| Italy | 145 | 0.0% |
| Jamaica | 41 | 0.0% |
| Japan | 186 | 0.0% |
| Jordan | 15 | 0.0% |
| Kazakhstan | 14 | 0.0% |
| Kenya | 363 | 0.1% |
| Korea | 788 | 0.1% |
| Kuwait | 29 | 0.0% |
| Laos | 132 | 0.0% |
| Latin America | 13,188 | 1.8% |
| Latvia | 52 | 0.0% |
| Lebanon | 49 | 0.0% |
| Liberia | 64 | 0.0% |
| Malaysia | 423 | 0.1% |
| Mexico | 8,919 | 1.2% |
| Middle Africa | 332 | 0.0% |
| Moldova | 16 | 0.0% |
| Morocco | 128 | 0.0% |
| Nepal | 136 | 0.0% |
| Netherlands | 66 | 0.0% |
| Nicaragua | 63 | 0.0% |
| Nigeria | 227 | 0.0% |
| Northern Africa | 407 | 0.1% |
| Northern Europe | 590 | 0.1% |
| Norway | 10 | 0.0% |
| Oceania | 153 | 0.0% |
| Pakistan | 162 | 0.0% |
| Panama | 36 | 0.0% |
| Peru | 30 | 0.0% |
| Philippines | 1,565 | 0.2% |
| Poland | 125 | 0.0% |
| Romania | 80 | 0.0% |
| Russia | 329 | 0.0% |
| Saudi Arabia | 106 | 0.0% |
| Scotland | 135 | 0.0% |
| Serbia | 114 | 0.0% |
| Somalia | 134 | 0.0% |
| South Africa | 225 | 0.0% |
| South America | 883 | 0.1% |
| South Central Asia | 1,551 | 0.2% |
| South Eastern Asia | 10,966 | 1.5% |
| Southern Europe | 298 | 0.0% |
| Spain | 42 | 0.0% |
| Sri Lanka | 2 | 0.0% |
| Sudan | 195 | 0.0% |
| Sweden | 11 | 0.0% |
| Switzerland | 16 | 0.0% |
| Syria | 107 | 0.0% |
| Taiwan | 217 | 0.0% |
| Thailand | 2,970 | 0.4% |
| Trinidad and Tobago | 92 | 0.0% |
| Turkey | 8 | 0.0% |
| Uganda | 13 | 0.0% |
| Ukraine | 186 | 0.0% |
| Venezuela | 82 | 0.0% |
| Vietnam | 1,325 | 0.2% |
| Western Africa | 525 | 0.1% |
| Western Asia | 851 | 0.1% |
| Western Europe | 707 | 0.1% |
| Yemen | 422 | 0.1% |
| Zaire | 82 | 0.0% |
| Zimbabwe | 10 | 0.0% | View All 115 Rows |
Sex and Age in Area Code 260
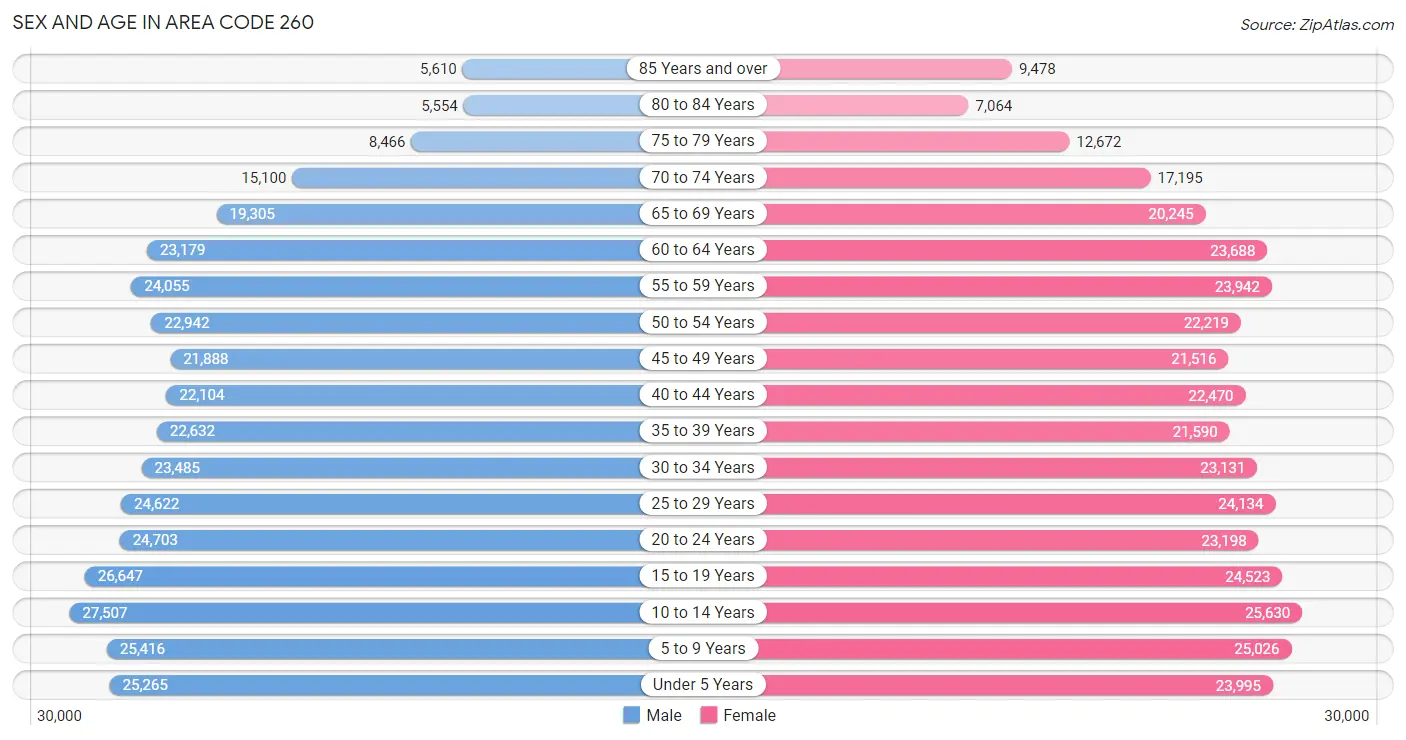
Sex and Age in Area Code 260
The most populous age groups in Area Code 260 are 10 to 14 Years (27,507 | 7.5%) for men and 10 to 14 Years (25,630 | 6.9%) for women.
| Age Bracket | Male | Female |
| Under 5 Years | 25,265 (6.9%) | 23,995 (6.5%) |
| 5 to 9 Years | 25,416 (6.9%) | 25,026 (6.7%) |
| 10 to 14 Years | 27,507 (7.5%) | 25,630 (6.9%) |
| 15 to 19 Years | 26,647 (7.2%) | 24,523 (6.6%) |
| 20 to 24 Years | 24,703 (6.7%) | 23,198 (6.2%) |
| 25 to 29 Years | 24,622 (6.7%) | 24,134 (6.5%) |
| 30 to 34 Years | 23,485 (6.4%) | 23,131 (6.2%) |
| 35 to 39 Years | 22,632 (6.1%) | 21,590 (5.8%) |
| 40 to 44 Years | 22,104 (6.0%) | 22,470 (6.0%) |
| 45 to 49 Years | 21,888 (5.9%) | 21,516 (5.8%) |
| 50 to 54 Years | 22,942 (6.2%) | 22,219 (6.0%) |
| 55 to 59 Years | 24,055 (6.5%) | 23,942 (6.4%) |
| 60 to 64 Years | 23,179 (6.3%) | 23,688 (6.4%) |
| 65 to 69 Years | 19,305 (5.2%) | 20,245 (5.4%) |
| 70 to 74 Years | 15,100 (4.1%) | 17,195 (4.6%) |
| 75 to 79 Years | 8,466 (2.3%) | 12,672 (3.4%) |
| 80 to 84 Years | 5,554 (1.5%) | 7,064 (1.9%) |
| 85 Years and over | 5,610 (1.5%) | 9,478 (2.5%) |
| Total | 368,480 (100.0%) | 371,716 (100.0%) |
Families and Households in Area Code 260
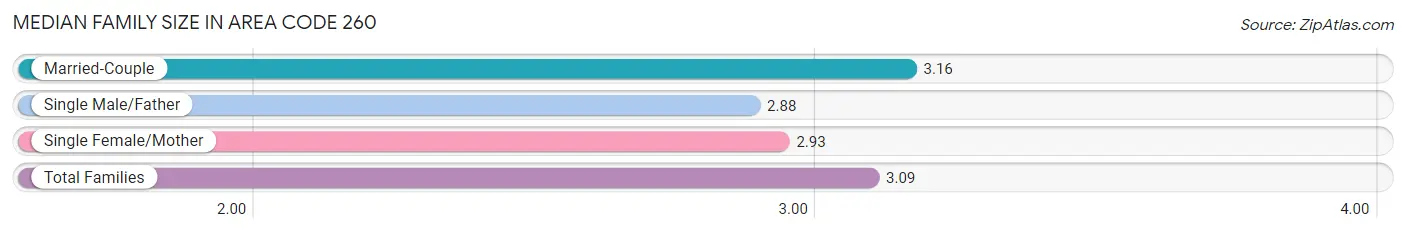
Median Family Size in Area Code 260
The median family size in Area Code 260 is 3.09 persons per family, with married-couple families (144,887 | 76.5%) accounting for the largest median family size of 3.16133 persons per family. On the other hand, single male/father families (14,363 | 7.6%) represent the smallest median family size with 2.88 persons per family.
| Family Type | # Families | Family Size |
| Married-Couple | 144,887 (76.5%) | 3.16 |
| Single Male/Father | 14,363 (7.6%) | 2.88 |
| Single Female/Mother | 30,097 (15.9%) | 2.93 |
| Total Families | 189,347 (100.0%) | 3.09 |
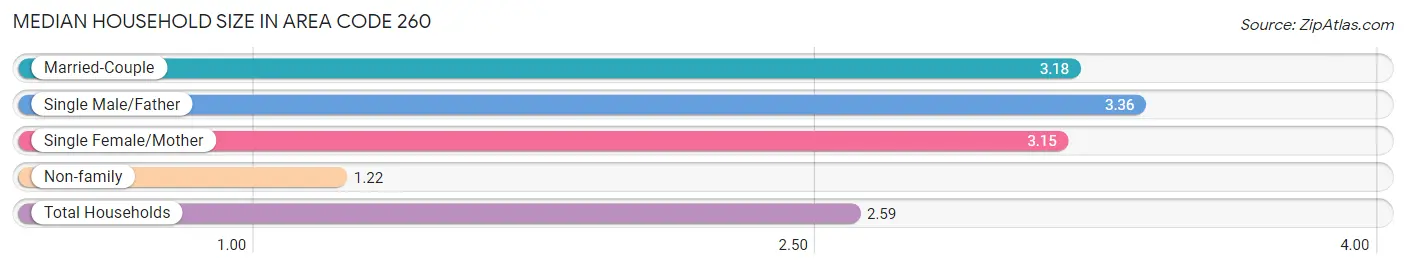
Median Household Size in Area Code 260
The median household size in Area Code 260 is 2.59 persons per household, with single male/father households (14,363 | 5.0%) accounting for the largest median household size of 3.35576 persons per household. non-family households (98,633 | 34.3%) represent the smallest median household size with 1.22 persons per household.
| Household Type | # Households | Household Size |
| Married-Couple | 144,887 (50.3%) | 3.18 |
| Single Male/Father | 14,363 (5.0%) | 3.36 |
| Single Female/Mother | 30,097 (10.4%) | 3.15 |
| Non-family | 98,633 (34.3%) | 1.22 |
| Total Households | 287,980 (100.0%) | 2.59 |
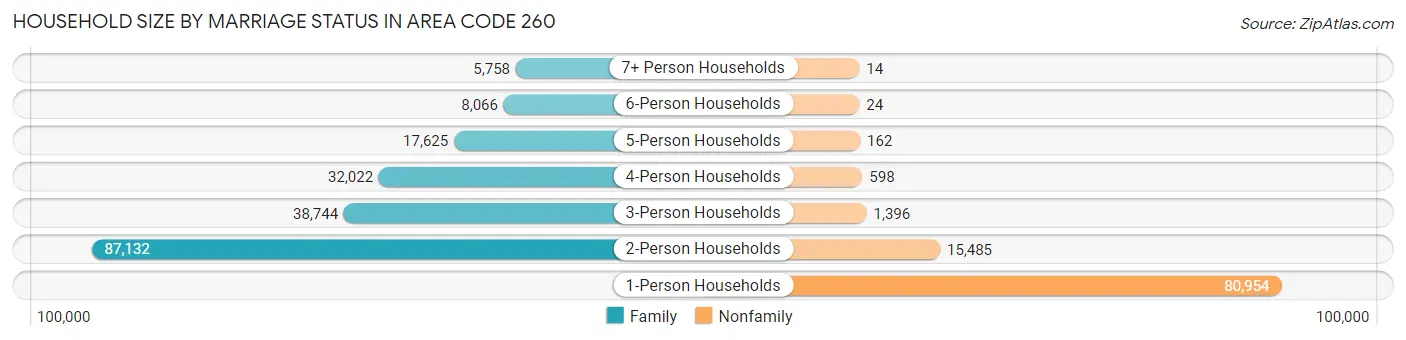
Household Size by Marriage Status in Area Code 260
Out of a total of 287,980 households in Area Code 260, 189,347 (65.7%) are family households, while 98,633 (34.3%) are nonfamily households. The most numerous type of family households are 2-person households, comprising 87,132, and the most common type of nonfamily households are 1-person households, comprising 80,954.
| Household Size | Family Households | Nonfamily Households |
| 1-Person Households | - | 80,954 (28.1%) |
| 2-Person Households | 87,132 (30.3%) | 15,485 (5.4%) |
| 3-Person Households | 38,744 (13.5%) | 1,396 (0.5%) |
| 4-Person Households | 32,022 (11.1%) | 598 (0.2%) |
| 5-Person Households | 17,625 (6.1%) | 162 (0.1%) |
| 6-Person Households | 8,066 (2.8%) | 24 (0.0%) |
| 7+ Person Households | 5,758 (2.0%) | 14 (0.0%) |
| Total | 189,347 (65.7%) | 98,633 (34.3%) |
Female Fertility in Area Code 260
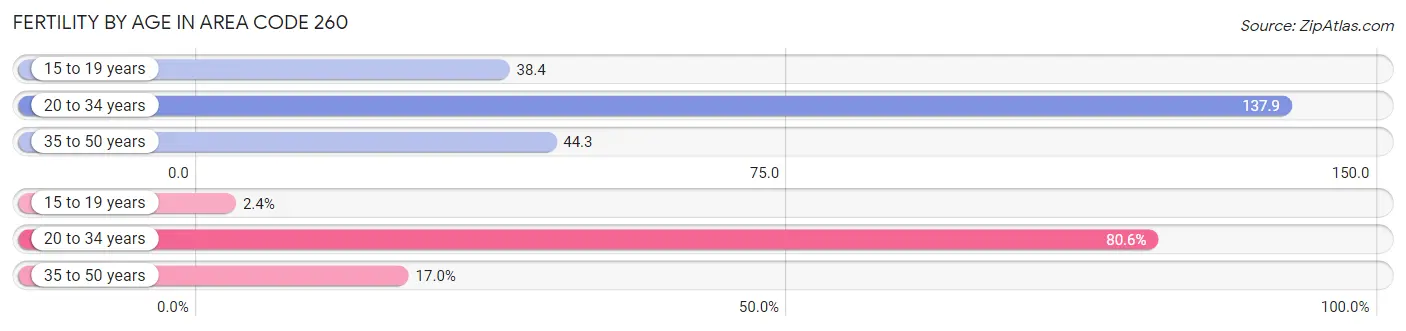
Fertility by Age in Area Code 260
Average fertility rate in Area Code 260 is 68.5 births per 1,000 women. Women in the age bracket of 20 to 34 years have the highest fertility rate with 137.9 births per 1,000 women. Women in the age bracket of 20 to 34 years acount for 80.6% of all women with births.
| Age Bracket | Women with Births | Births / 1,000 Women |
| 15 to 19 years | 245 (2.4%) | 38.4 |
| 20 to 34 years | 8,329 (80.6%) | 137.9 |
| 35 to 50 years | 1,759 (17.0%) | 44.3 |
| Total | 10,333 (100.0%) | 68.5 |
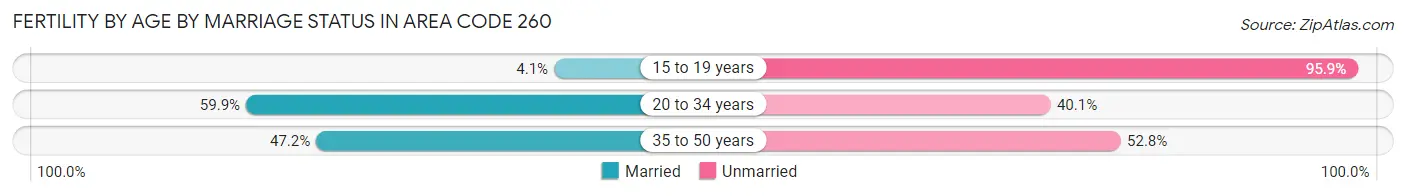
Fertility by Age by Marriage Status in Area Code 260
59.8% of women with births (10,333) in Area Code 260 are married. The highest percentage of unmarried women with births falls into 15 to 19 years age bracket with 95.9% of them unmarried at the time of birth, while the lowest percentage of unmarried women with births belong to 20 to 34 years age bracket with 40.1% of them unmarried.
| Age Bracket | Married | Unmarried |
| 15 to 19 years | 10 (4.1%) | 235 (95.9%) |
| 20 to 34 years | 4,989 (59.9%) | 3,340 (40.1%) |
| 35 to 50 years | 830 (47.2%) | 929 (52.8%) |
| Total | 6,181 (59.8%) | 4,152 (40.2%) |
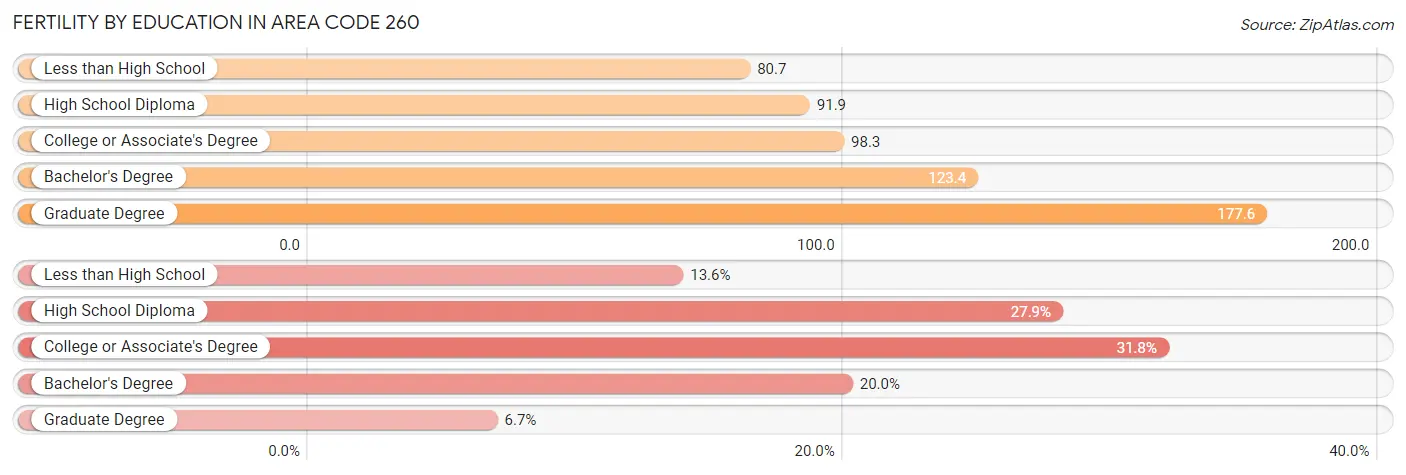
Fertility by Education in Area Code 260
Average fertility rate in Area Code 260 is 68.5 births per 1,000 women. Women with the education attainment of graduate degree have the highest fertility rate of 177.6 births per 1,000 women, while women with the education attainment of less than high school have the lowest fertility at 80.7 births per 1,000 women. Women with the education attainment of college or associate's degree represent 31.8% of all women with births.
| Educational Attainment | Women with Births | Births / 1,000 Women |
| Less than High School | 1,409 (13.6%) | 80.7 |
| High School Diploma | 2,879 (27.9%) | 91.9 |
| College or Associate's Degree | 3,289 (31.8%) | 98.3 |
| Bachelor's Degree | 2,066 (20.0%) | 123.4 |
| Graduate Degree | 690 (6.7%) | 177.6 |
| Total | 10,333 (100.0%) | 68.5 |
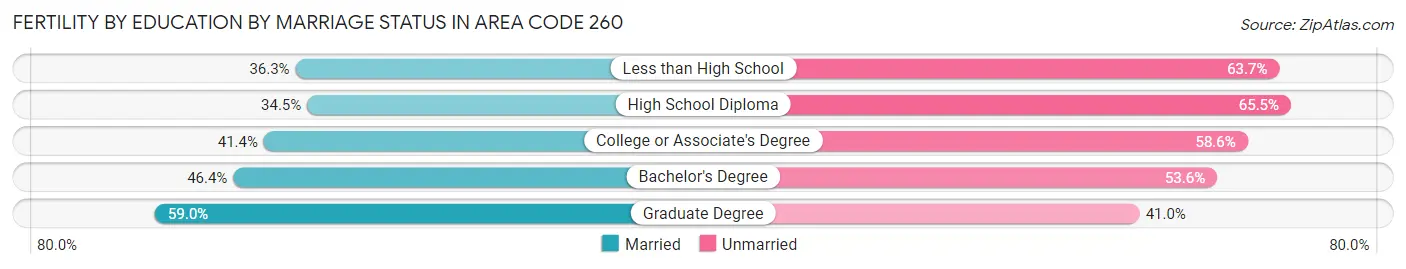
Fertility by Education by Marriage Status in Area Code 260
40.2% of women with births in Area Code 260 are unmarried. Women with the educational attainment of graduate degree are most likely to be married with 59.0% of them married at childbirth, while women with the educational attainment of high school diploma are least likely to be married with 65.5% of them unmarried at childbirth.
| Educational Attainment | Married | Unmarried |
| Less than High School | 512 (36.3%) | 897 (63.7%) |
| High School Diploma | 992 (34.5%) | 1,887 (65.5%) |
| College or Associate's Degree | 1,363 (41.4%) | 1,926 (58.6%) |
| Bachelor's Degree | 958 (46.4%) | 1,108 (53.6%) |
| Graduate Degree | 407 (59.0%) | 283 (41.0%) |
| Total | 6,181 (59.8%) | 4,152 (40.2%) |
Employment Characteristics in Area Code 260
Employment by Class of Employer in Area Code 260
Among the 352,842 employed individuals in Area Code 260, private company employees (254,343 | 72.1%), not-for-profit organizations (37,348 | 10.6%), and local government employees (20,977 | 5.9%) make up the most common classes of employment.
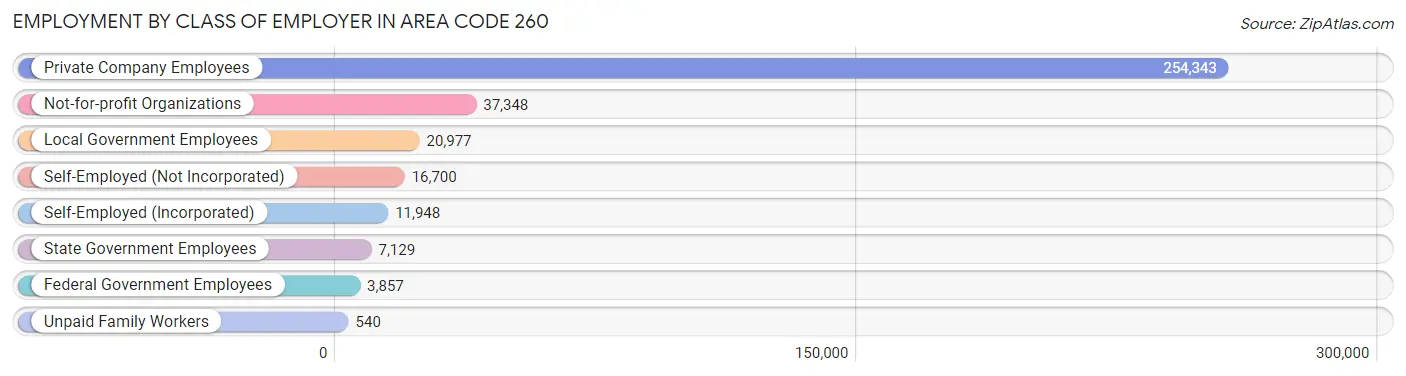
| Employer Class | # Employees | % Employees |
| Private Company Employees | 254,343 | 72.1% |
| Self-Employed (Incorporated) | 11,948 | 3.4% |
| Self-Employed (Not Incorporated) | 16,700 | 4.7% |
| Not-for-profit Organizations | 37,348 | 10.6% |
| Local Government Employees | 20,977 | 5.9% |
| State Government Employees | 7,129 | 2.0% |
| Federal Government Employees | 3,857 | 1.1% |
| Unpaid Family Workers | 540 | 0.2% |
| Total | 352,842 | 100.0% |
Employment Status by Age in Area Code 260
According to the labor force statistics for Area Code 260, out of the total population over 16 years of age (576,709), 64.3% or 370,824 individuals are in the labor force, with 4.4% or 16,502 of them unemployed. The age group with the highest labor force participation rate is 35 to 44 years, with 84.5% or 75,006 individuals in the labor force. Within the labor force, the 16 to 19 years age range has the highest percentage of unemployed individuals, with 1,103.1% or 233,559 of them being unemployed.
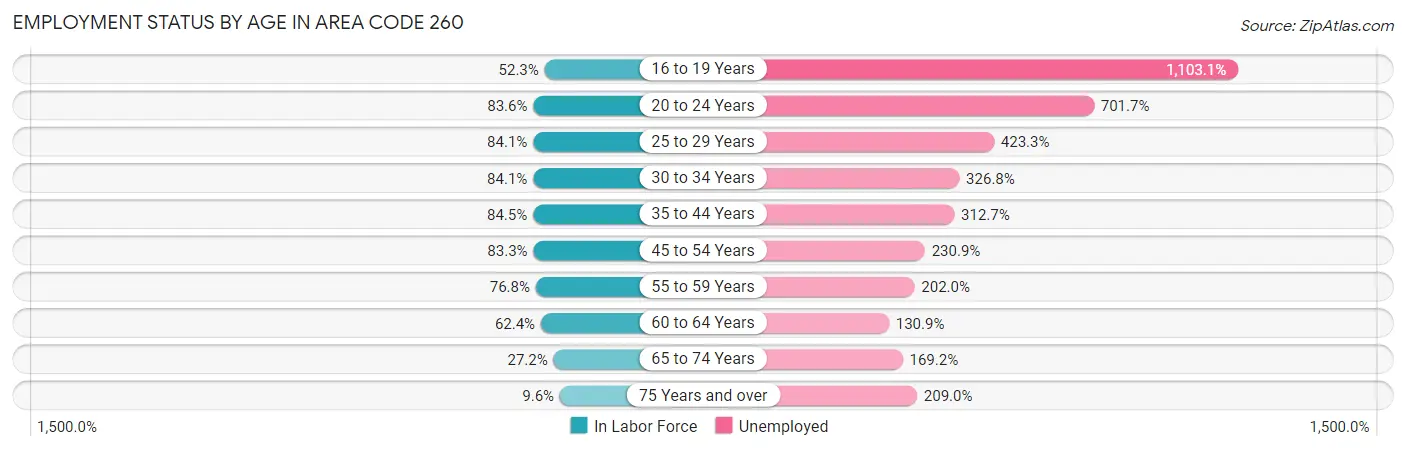
| Age Bracket | In Labor Force | Unemployed |
| 16 to 19 Years | 21,172 (52.2%) | 233,559 (1,103.1%) |
| 20 to 24 Years | 40,040 (83.6%) | 280,961 (701.7%) |
| 25 to 29 Years | 40,980 (84.1%) | 173,464 (423.3%) |
| 30 to 34 Years | 39,208 (84.1%) | 128,135 (326.8%) |
| 35 to 44 Years | 75,006 (84.5%) | 234,544 (312.7%) |
| 45 to 54 Years | 73,808 (83.3%) | 170,427 (230.9%) |
| 55 to 59 Years | 36,844 (76.8%) | 74,421 (202.0%) |
| 60 to 64 Years | 29,224 (62.4%) | 38,257 (130.9%) |
| 65 to 74 Years | 19,532 (27.2%) | 33,053 (169.2%) |
| 75 Years and over | 4,676 (9.6%) | 9,769 (209.0%) |
| Total | 370,824 (64.3%) | 16,513 (4.4%) |
Employment Status by Educational Attainment in Area Code 260
According to labor force statistics for Area Code 260, 80.3% of individuals (295,217) out of the total population between 25 and 64 years of age (367,597) are in the labor force, with 267.6% or 790,001 of them being unemployed. The group with the highest labor force participation rate are those with the educational attainment of bachelor's degree or higher, with 87.5% or 85,387 individuals in the labor force. Within the labor force, individuals with less than high school education have the highest percentage of unemployment, with 730.6% or 192,725 of them being unemployed.
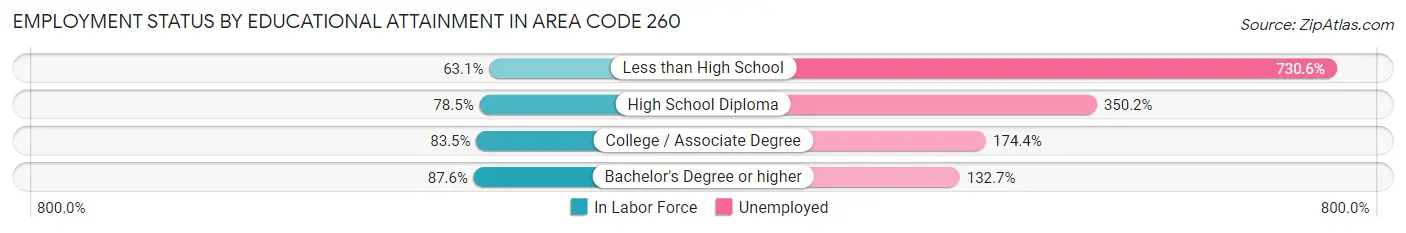
| Educational Attainment | In Labor Force | Unemployed |
| Less than High School | 26,378 (63.1%) | 305,625 (730.6%) |
| High School Diploma | 90,378 (78.5%) | 403,245 (350.2%) |
| College / Associate Degree | 94,371 (83.5%) | 197,227 (174.4%) |
| Bachelor's Degree or higher | 85,389 (87.5%) | 129,421 (132.7%) |
| Total | 295,224 (80.3%) | 983,690 (267.6%) |
Employment Occupations by Sex in Area Code 260
Management, Business, Science and Arts Occupations
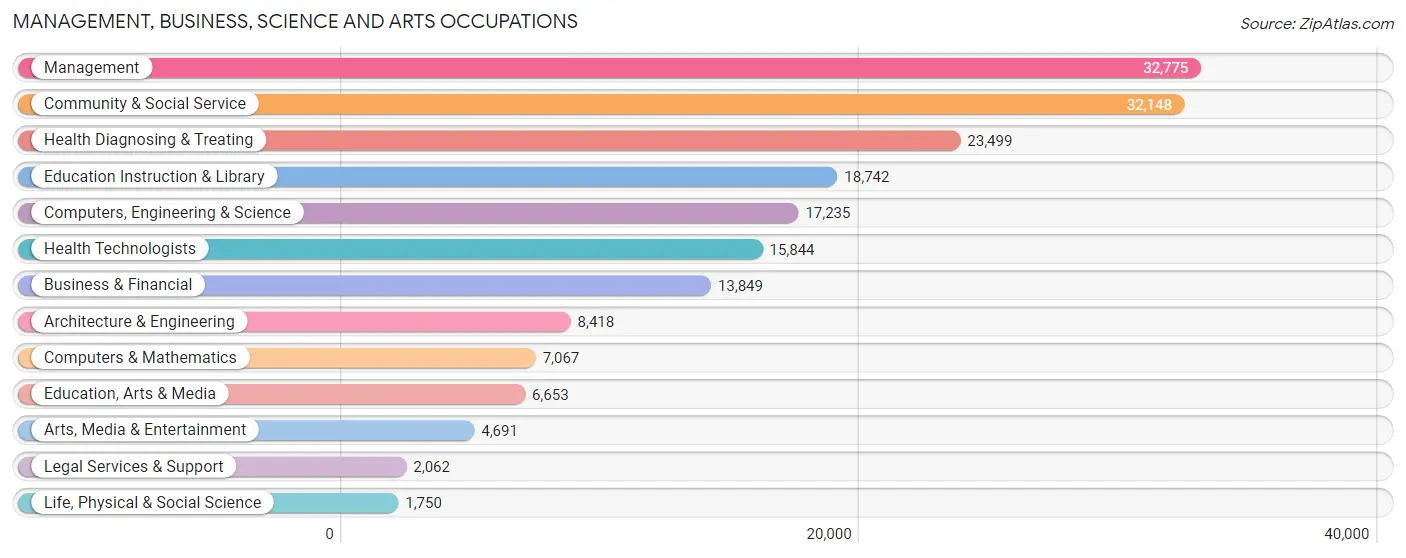
The most common Management, Business, Science and Arts occupations in Area Code 260 are Management (32,775 | 9.1%), Community & Social Service (32,148 | 8.9%), Health Diagnosing & Treating (23,499 | 6.5%), Education Instruction & Library (18,742 | 5.2%), and Computers, Engineering & Science (17,235 | 4.8%).
Management, Business, Science and Arts Occupations by Sex
Within the Management, Business, Science and Arts occupations in Area Code 260, the most male-oriented occupations are Architecture & Engineering (90.4%), Computers, Engineering & Science (79.9%), and Computers & Mathematics (72.6%), while the most female-oriented occupations are Health Diagnosing & Treating (78.3%), Health Technologists (77.2%), and Education Instruction & Library (76.2%).
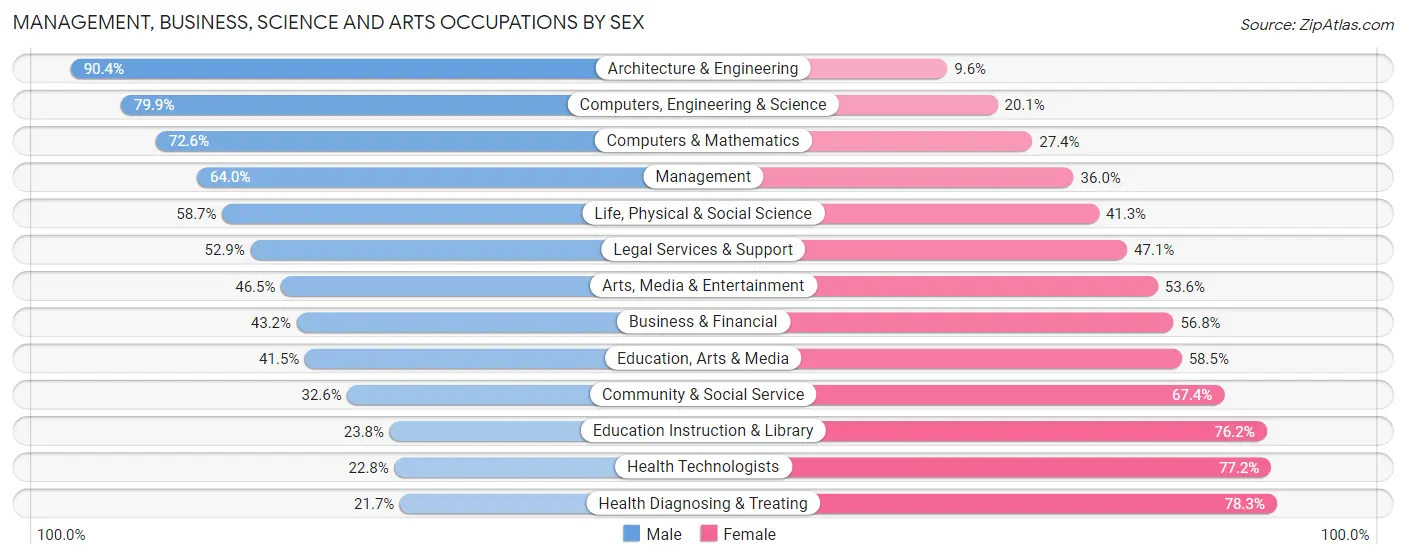
| Occupation | Male | Female |
| Management | 20,982 (64.0%) | 11,793 (36.0%) |
| Business & Financial | 5,983 (43.2%) | 7,866 (56.8%) |
| Computers, Engineering & Science | 13,768 (79.9%) | 3,467 (20.1%) |
| Computers & Mathematics | 5,133 (72.6%) | 1,934 (27.4%) |
| Architecture & Engineering | 7,607 (90.4%) | 811 (9.6%) |
| Life, Physical & Social Science | 1,028 (58.7%) | 722 (41.3%) |
| Community & Social Service | 10,489 (32.6%) | 21,659 (67.4%) |
| Education, Arts & Media | 2,759 (41.5%) | 3,894 (58.5%) |
| Legal Services & Support | 1,090 (52.9%) | 972 (47.1%) |
| Education Instruction & Library | 4,461 (23.8%) | 14,281 (76.2%) |
| Arts, Media & Entertainment | 2,179 (46.5%) | 2,512 (53.5%) |
| Health Diagnosing & Treating | 5,089 (21.7%) | 18,410 (78.3%) |
| Health Technologists | 3,615 (22.8%) | 12,229 (77.2%) |
| Total (Category) | 56,311 (47.1%) | 63,195 (52.9%) |
| Total (Overall) | 194,826 (54.2%) | 164,826 (45.8%) |
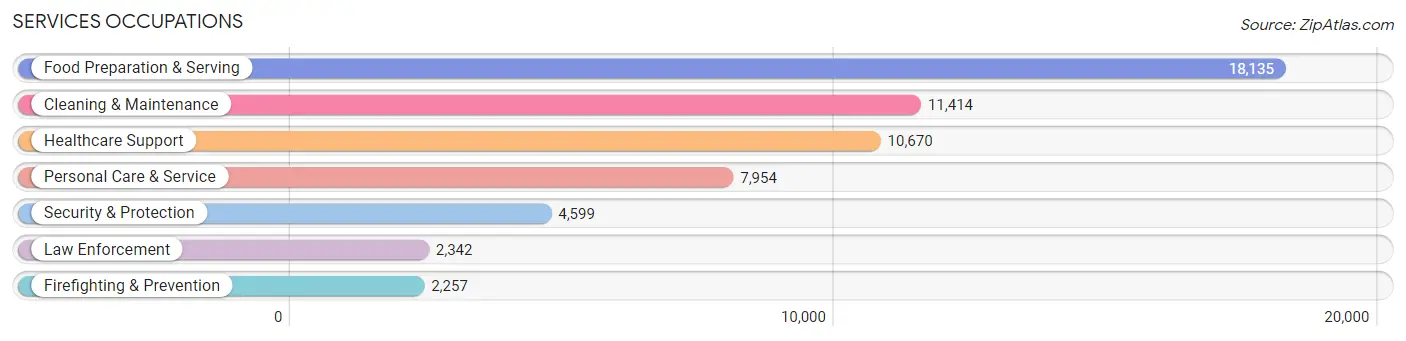
Services Occupations
The most common Services occupations in Area Code 260 are Food Preparation & Serving (18,135 | 5.0%), Cleaning & Maintenance (11,414 | 3.2%), Healthcare Support (10,670 | 3.0%), Personal Care & Service (7,954 | 2.2%), and Security & Protection (4,599 | 1.3%).
Services Occupations by Sex
Within the Services occupations in Area Code 260, the most male-oriented occupations are Law Enforcement (88.8%), Security & Protection (83.9%), and Firefighting & Prevention (78.8%), while the most female-oriented occupations are Healthcare Support (90.7%), Personal Care & Service (80.0%), and Food Preparation & Serving (62.5%).
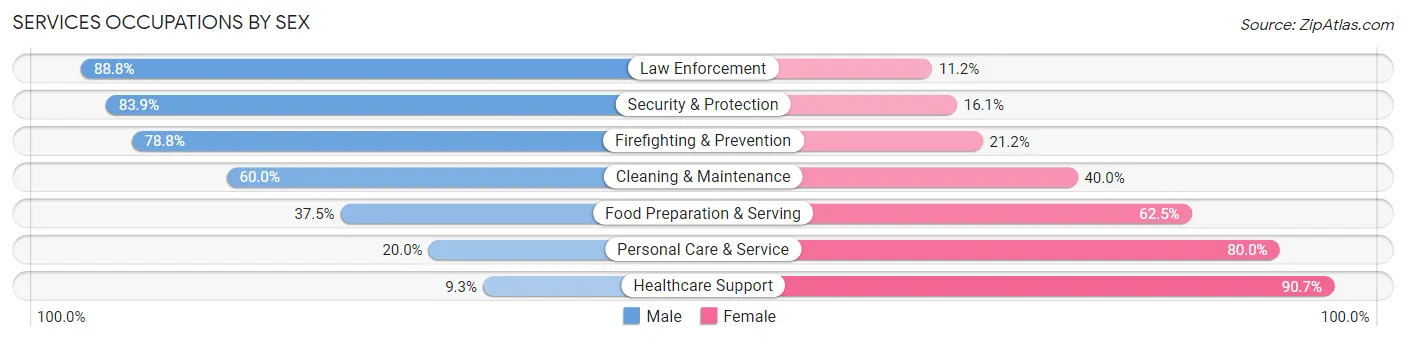
| Occupation | Male | Female |
| Healthcare Support | 988 (9.3%) | 9,682 (90.7%) |
| Security & Protection | 3,859 (83.9%) | 740 (16.1%) |
| Firefighting & Prevention | 1,779 (78.8%) | 478 (21.2%) |
| Law Enforcement | 2,080 (88.8%) | 262 (11.2%) |
| Food Preparation & Serving | 6,793 (37.5%) | 11,342 (62.5%) |
| Cleaning & Maintenance | 6,850 (60.0%) | 4,564 (40.0%) |
| Personal Care & Service | 1,593 (20.0%) | 6,361 (80.0%) |
| Total (Category) | 20,083 (38.1%) | 32,689 (61.9%) |
| Total (Overall) | 194,826 (54.2%) | 164,826 (45.8%) |
Sales and Office Occupations
The most common Sales and Office occupations in Area Code 260 are Office & Administration (36,565 | 10.2%), and Sales & Related (32,307 | 9.0%).
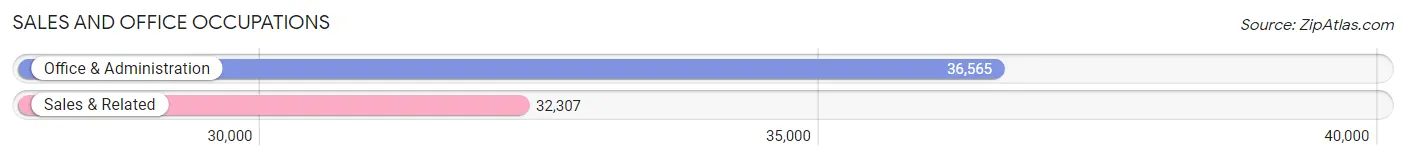
Sales and Office Occupations by Sex
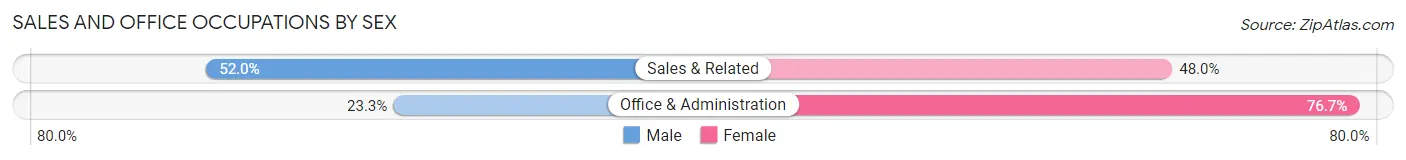
| Occupation | Male | Female |
| Sales & Related | 16,812 (52.0%) | 15,495 (48.0%) |
| Office & Administration | 8,522 (23.3%) | 28,043 (76.7%) |
| Total (Category) | 25,334 (36.8%) | 43,538 (63.2%) |
| Total (Overall) | 194,826 (54.2%) | 164,826 (45.8%) |
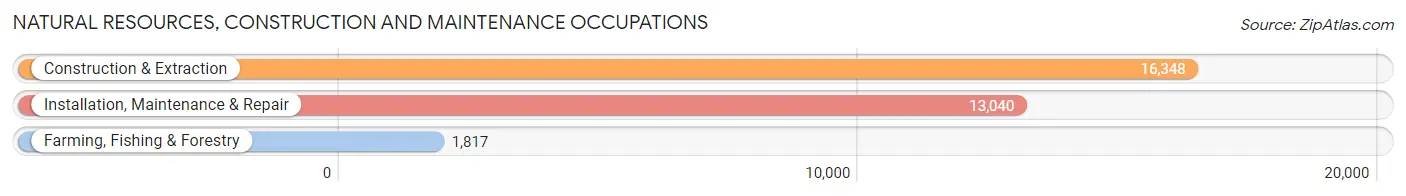
Natural Resources, Construction and Maintenance Occupations
The most common Natural Resources, Construction and Maintenance occupations in Area Code 260 are Construction & Extraction (16,348 | 4.5%), Installation, Maintenance & Repair (13,040 | 3.6%), and Farming, Fishing & Forestry (1,817 | 0.5%).
Natural Resources, Construction and Maintenance Occupations by Sex
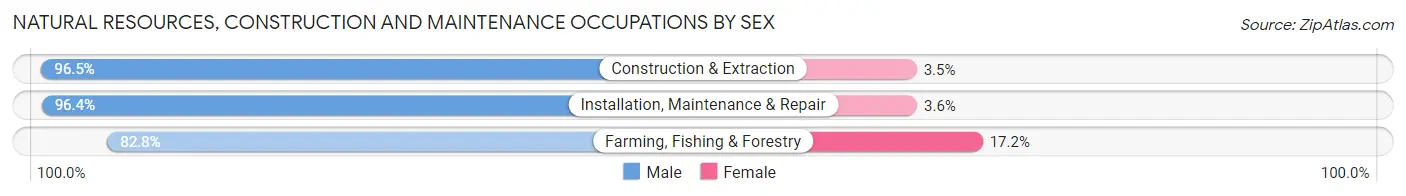
| Occupation | Male | Female |
| Farming, Fishing & Forestry | 1,504 (82.8%) | 313 (17.2%) |
| Construction & Extraction | 15,776 (96.5%) | 572 (3.5%) |
| Installation, Maintenance & Repair | 12,574 (96.4%) | 466 (3.6%) |
| Total (Category) | 29,854 (95.7%) | 1,351 (4.3%) |
| Total (Overall) | 194,826 (54.2%) | 164,826 (45.8%) |
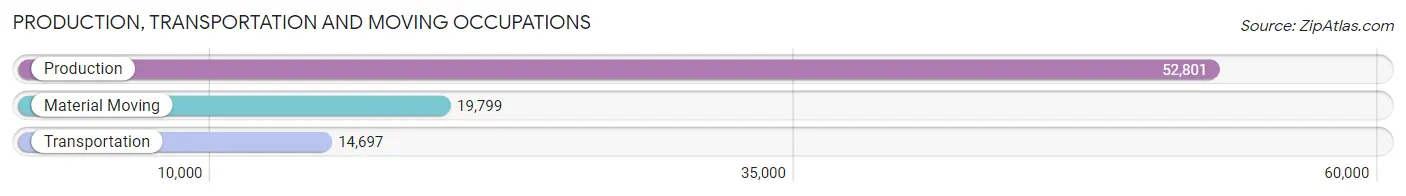
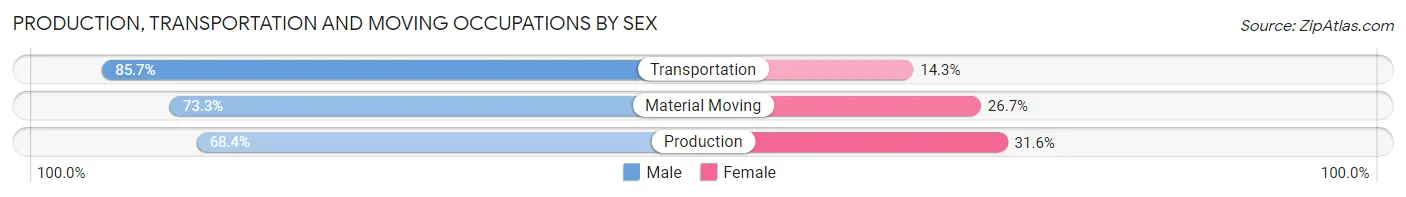
Production, Transportation and Moving Occupations
The most common Production, Transportation and Moving occupations in Area Code 260 are Production (52,801 | 14.7%), Material Moving (19,799 | 5.5%), and Transportation (14,697 | 4.1%).
Production, Transportation and Moving Occupations by Sex
| Occupation | Male | Female |
| Production | 36,125 (68.4%) | 16,676 (31.6%) |
| Transportation | 12,601 (85.7%) | 2,096 (14.3%) |
| Material Moving | 14,518 (73.3%) | 5,281 (26.7%) |
| Total (Category) | 63,244 (72.5%) | 24,053 (27.6%) |
| Total (Overall) | 194,826 (54.2%) | 164,826 (45.8%) |
Employment Industries by Sex in Area Code 260
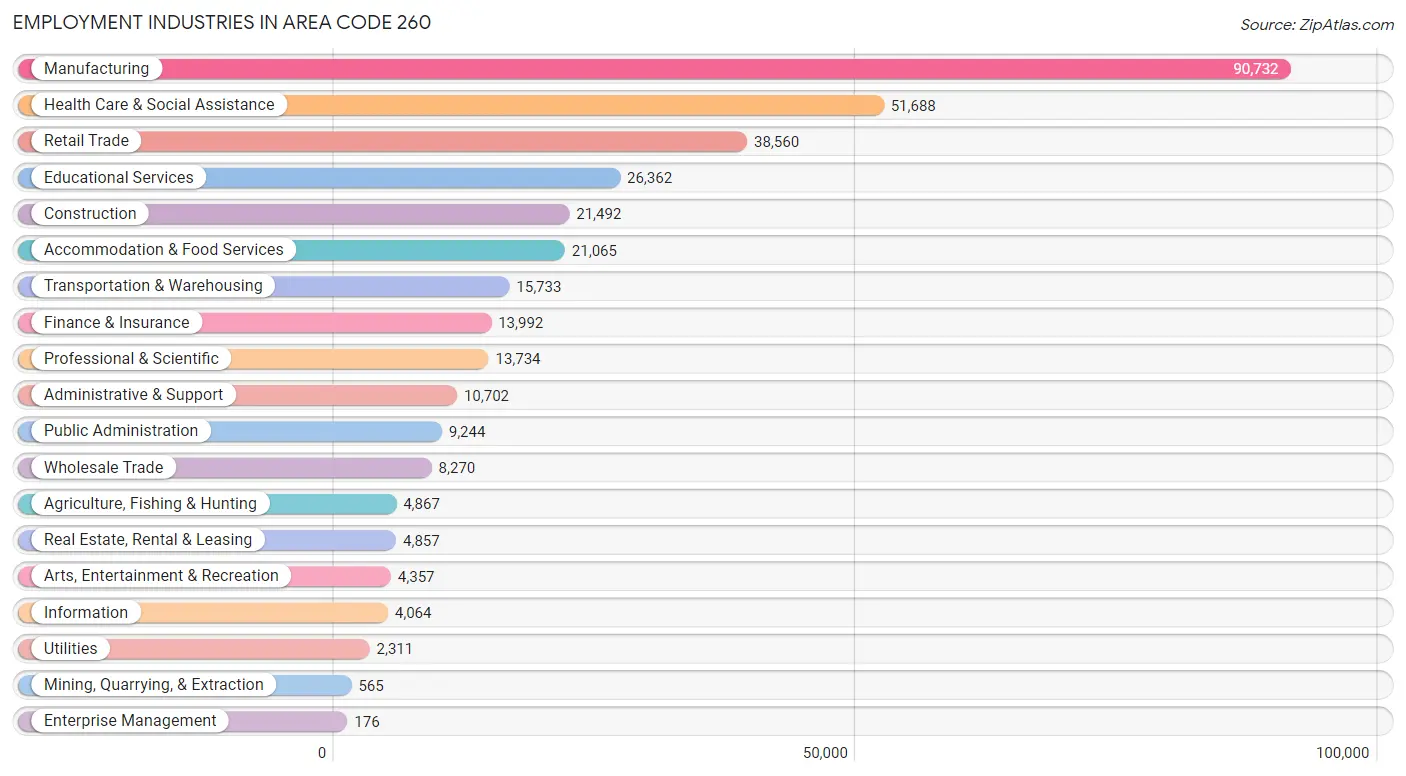
Employment Industries in Area Code 260
The major employment industries in Area Code 260 include Manufacturing (90,732 | 25.2%), Health Care & Social Assistance (51,688 | 14.4%), Retail Trade (38,560 | 10.7%), Educational Services (26,362 | 7.3%), and Construction (21,492 | 6.0%).
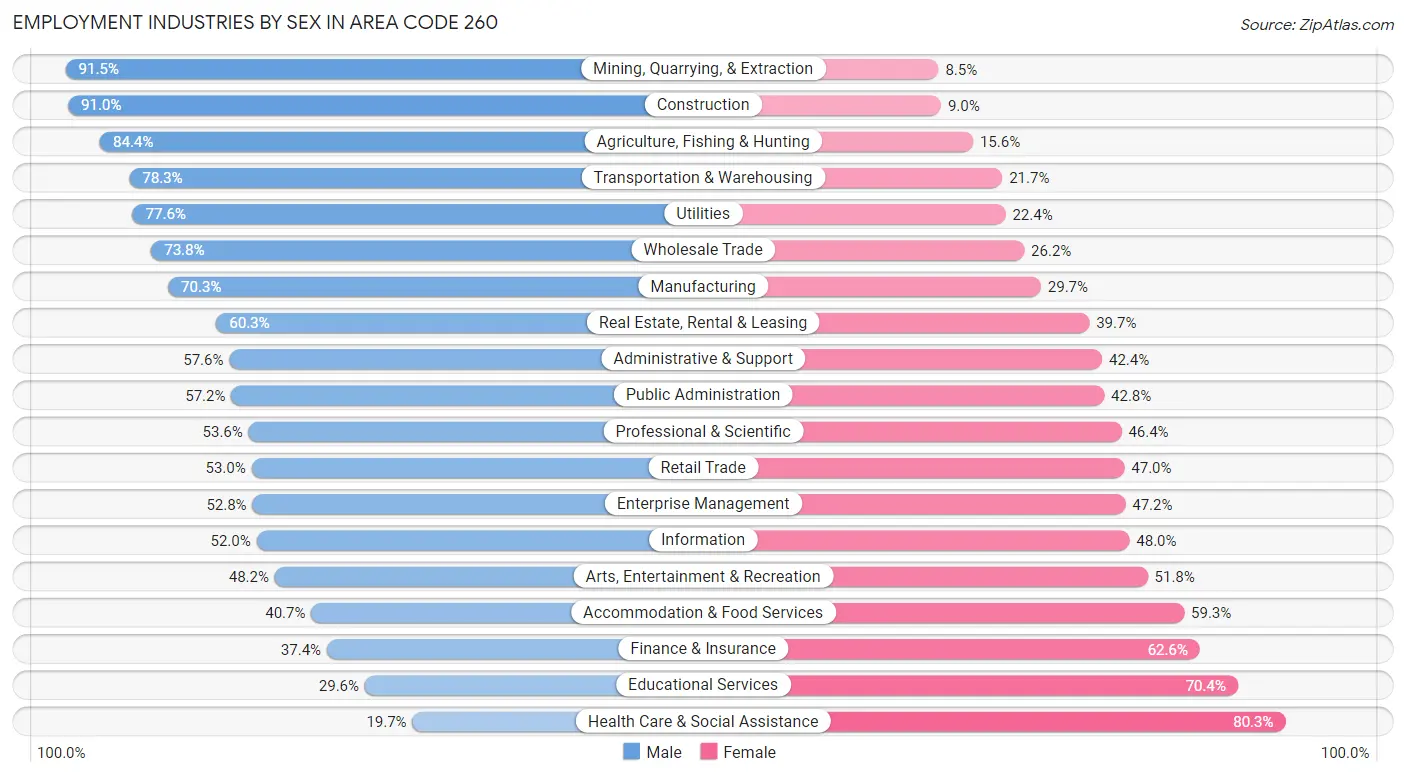
Employment Industries by Sex in Area Code 260
The Area Code 260 industries that see more men than women are Mining, Quarrying, & Extraction (91.5%), Construction (91.0%), and Agriculture, Fishing & Hunting (84.4%), whereas the industries that tend to have a higher number of women are Health Care & Social Assistance (80.3%), Educational Services (70.4%), and Finance & Insurance (62.6%).
| Industry | Male | Female |
| Agriculture, Fishing & Hunting | 4,106 (84.4%) | 761 (15.6%) |
| Mining, Quarrying, & Extraction | 517 (91.5%) | 48 (8.5%) |
| Construction | 19,556 (91.0%) | 1,936 (9.0%) |
| Manufacturing | 63,794 (70.3%) | 26,938 (29.7%) |
| Wholesale Trade | 6,101 (73.8%) | 2,169 (26.2%) |
| Retail Trade | 20,446 (53.0%) | 18,114 (47.0%) |
| Transportation & Warehousing | 12,321 (78.3%) | 3,412 (21.7%) |
| Utilities | 1,794 (77.6%) | 517 (22.4%) |
| Information | 2,113 (52.0%) | 1,951 (48.0%) |
| Finance & Insurance | 5,237 (37.4%) | 8,755 (62.6%) |
| Real Estate, Rental & Leasing | 2,929 (60.3%) | 1,928 (39.7%) |
| Professional & Scientific | 7,366 (53.6%) | 6,368 (46.4%) |
| Enterprise Management | 93 (52.8%) | 83 (47.2%) |
| Administrative & Support | 6,169 (57.6%) | 4,533 (42.4%) |
| Educational Services | 7,795 (29.6%) | 18,567 (70.4%) |
| Health Care & Social Assistance | 10,193 (19.7%) | 41,495 (80.3%) |
| Arts, Entertainment & Recreation | 2,101 (48.2%) | 2,256 (51.8%) |
| Accommodation & Food Services | 8,564 (40.7%) | 12,501 (59.3%) |
| Public Administration | 5,289 (57.2%) | 3,955 (42.8%) |
| Total | 194,826 (54.2%) | 164,826 (45.8%) |
Education in Area Code 260
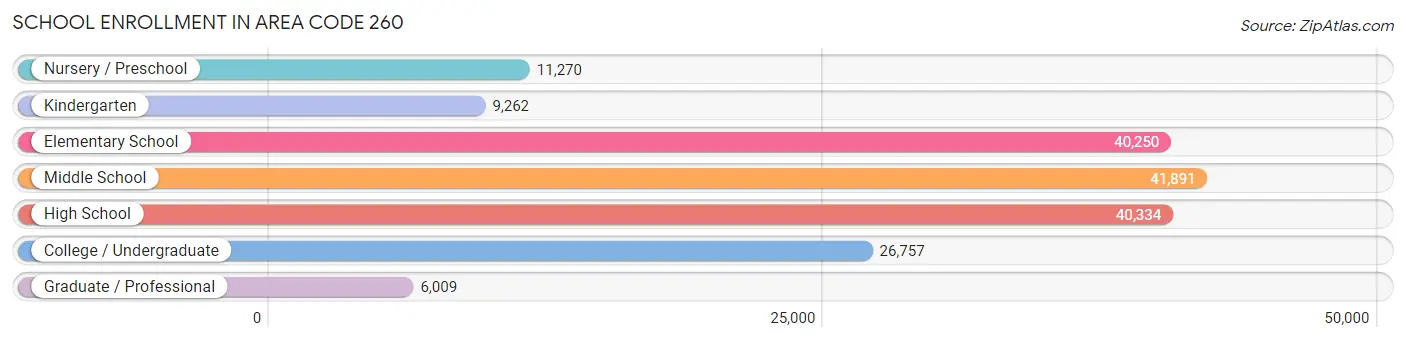
School Enrollment in Area Code 260
The most common levels of schooling among the 175,773 students in Area Code 260 are middle school (41,891 | 23.8%), high school (40,334 | 23.0%), and elementary school (40,250 | 22.9%).
| School Level | # Students | % Students |
| Nursery / Preschool | 11,270 | 6.4% |
| Kindergarten | 9,262 | 5.3% |
| Elementary School | 40,250 | 22.9% |
| Middle School | 41,891 | 23.8% |
| High School | 40,334 | 23.0% |
| College / Undergraduate | 26,757 | 15.2% |
| Graduate / Professional | 6,009 | 3.4% |
| Total | 175,773 | 100.0% |
School Enrollment by Age by Funding Source in Area Code 260
Out of a total of 175,773 students who are enrolled in schools in Area Code 260, 40,025 (22.8%) attend a private institution, while the remaining 135,748 (77.2%) are enrolled in public schools. The age group of 3 to 4 year olds has the highest likelihood of being enrolled in private schools, with 3,412 (44.3% in the age bracket) enrolled. Conversely, the age group of 15 to 17 year olds has the lowest likelihood of being enrolled in a private school, with 24,752 (83.7% in the age bracket) attending a public institution.
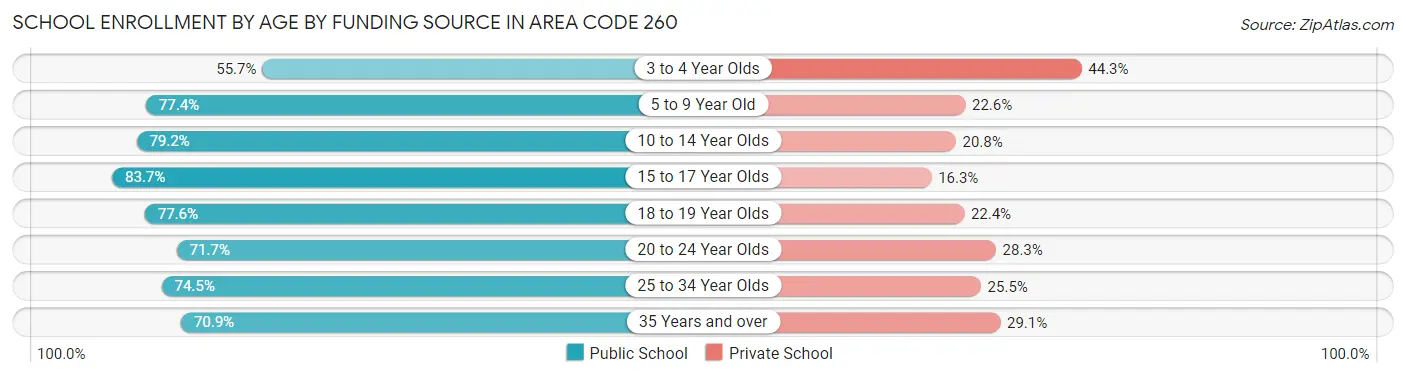
| Age Bracket | Public School | Private School |
| 3 to 4 Year Olds | 4,296 (55.7%) | 3,412 (44.3%) |
| 5 to 9 Year Old | 35,690 (77.4%) | 10,420 (22.6%) |
| 10 to 14 Year Olds | 41,081 (79.2%) | 10,817 (20.8%) |
| 15 to 17 Year Olds | 24,752 (83.7%) | 4,822 (16.3%) |
| 18 to 19 Year Olds | 9,619 (77.6%) | 2,777 (22.4%) |
| 20 to 24 Year Olds | 9,703 (71.7%) | 3,830 (28.3%) |
| 25 to 34 Year Olds | 5,887 (74.5%) | 2,017 (25.5%) |
| 35 Years and over | 4,713 (70.9%) | 1,937 (29.1%) |
| Total | 135,748 (77.2%) | 40,025 (22.8%) |
Educational Attainment by Field of Study in Area Code 260
Business (27,047 | 20.7%), education (22,332 | 17.1%), science & technology (17,054 | 13.0%), arts & humanities (9,082 | 6.9%), and engineering (8,738 | 6.7%) are the most common fields of study among 130,789 individuals in Area Code 260 who have obtained a bachelor's degree or higher.
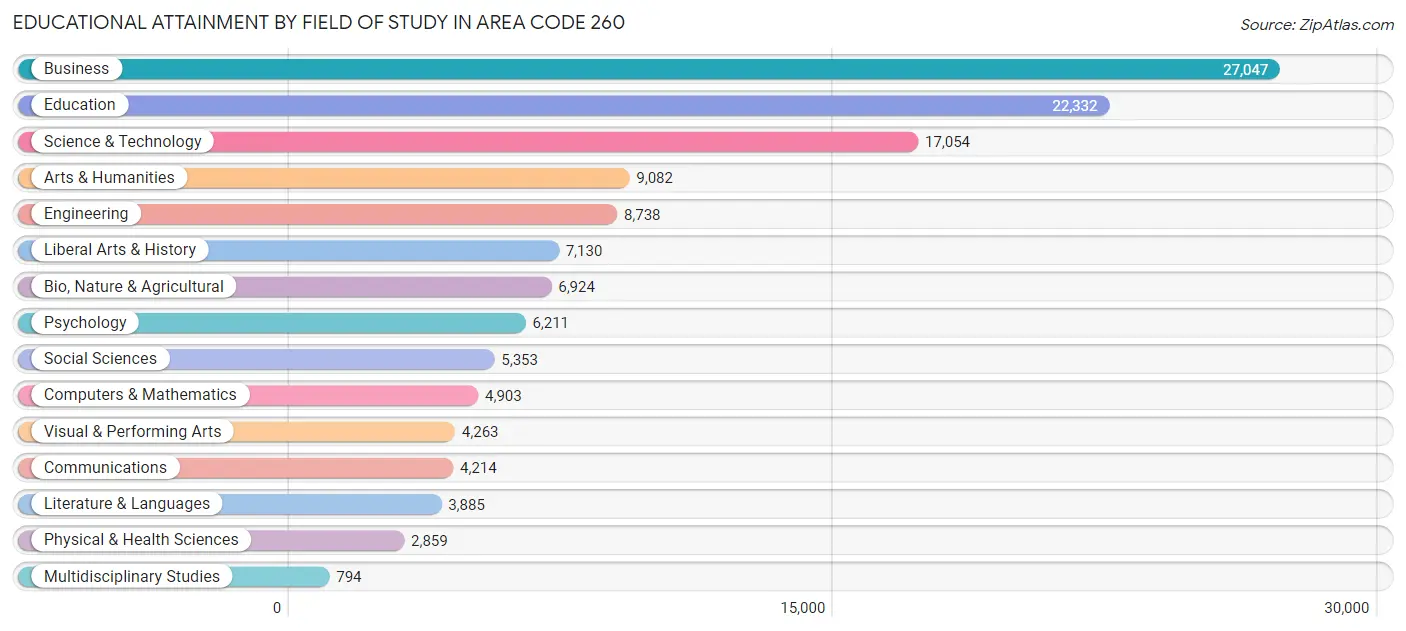
| Field of Study | # Graduates | % Graduates |
| Computers & Mathematics | 4,903 | 3.7% |
| Bio, Nature & Agricultural | 6,924 | 5.3% |
| Physical & Health Sciences | 2,859 | 2.2% |
| Psychology | 6,211 | 4.8% |
| Social Sciences | 5,353 | 4.1% |
| Engineering | 8,738 | 6.7% |
| Multidisciplinary Studies | 794 | 0.6% |
| Science & Technology | 17,054 | 13.0% |
| Business | 27,047 | 20.7% |
| Education | 22,332 | 17.1% |
| Literature & Languages | 3,885 | 3.0% |
| Liberal Arts & History | 7,130 | 5.4% |
| Visual & Performing Arts | 4,263 | 3.3% |
| Communications | 4,214 | 3.2% |
| Arts & Humanities | 9,082 | 6.9% |
| Total | 130,789 | 100.0% |
Transportation & Commute in Area Code 260
Vehicle Availability by Sex in Area Code 260
The most prevalent vehicle ownership categories in Area Code 260 are males with 2 vehicles (78,268, accounting for 41.0%) and females with 2 vehicles (64,387, making up 48.9%).
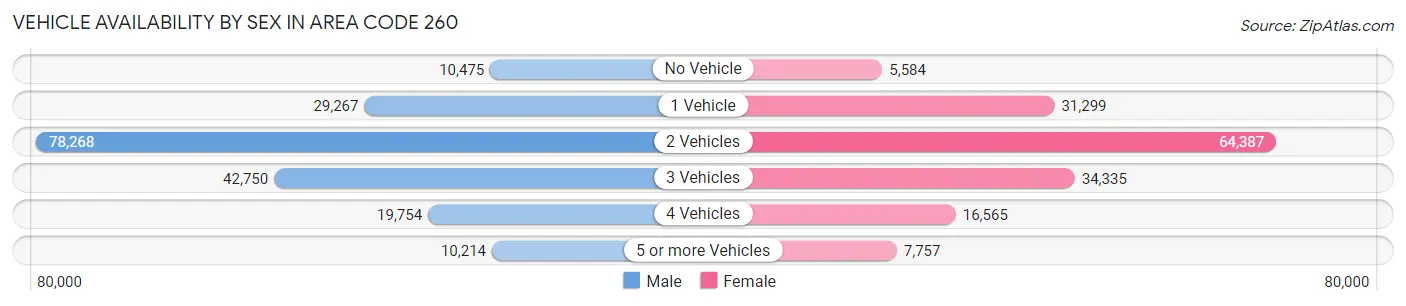
| Vehicles Available | Male | Female |
| No Vehicle | 10,475 (5.5%) | 5,584 (3.5%) |
| 1 Vehicle | 29,267 (15.3%) | 31,299 (19.6%) |
| 2 Vehicles | 78,268 (41.0%) | 64,387 (40.3%) |
| 3 Vehicles | 42,750 (22.4%) | 34,335 (21.5%) |
| 4 Vehicles | 19,754 (10.4%) | 16,565 (10.4%) |
| 5 or more Vehicles | 10,214 (5.4%) | 7,757 (4.9%) |
| Total | 190,728 (100.0%) | 159,927 (100.0%) |
Commute Time in Area Code 260
The most frequently occuring commute durations in Area Code 260 are 15 to 19 minutes (56,744 commuters, 17.2%), 20 to 24 minutes (53,387 commuters, 16.1%), and 10 to 14 minutes (53,206 commuters, 16.1%).
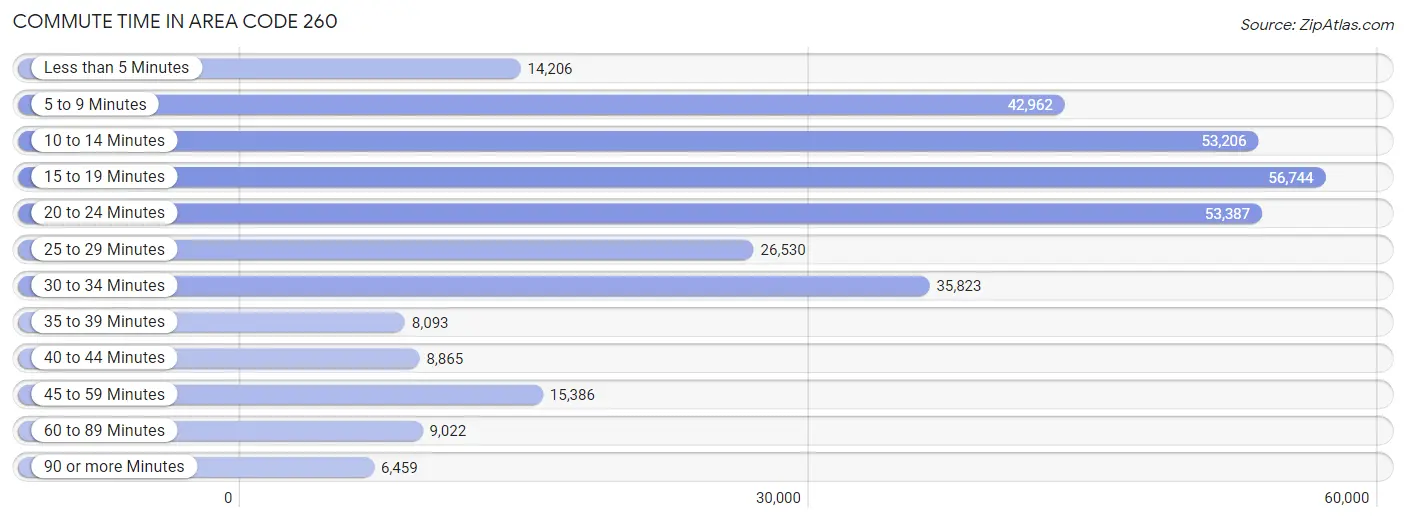
| Commute Time | # Commuters | % Commuters |
| Less than 5 Minutes | 14,206 | 4.3% |
| 5 to 9 Minutes | 42,962 | 13.0% |
| 10 to 14 Minutes | 53,206 | 16.1% |
| 15 to 19 Minutes | 56,744 | 17.2% |
| 20 to 24 Minutes | 53,387 | 16.1% |
| 25 to 29 Minutes | 26,530 | 8.0% |
| 30 to 34 Minutes | 35,823 | 10.8% |
| 35 to 39 Minutes | 8,093 | 2.5% |
| 40 to 44 Minutes | 8,865 | 2.7% |
| 45 to 59 Minutes | 15,386 | 4.6% |
| 60 to 89 Minutes | 9,022 | 2.7% |
| 90 or more Minutes | 6,459 | 1.9% |
Commute Time by Sex in Area Code 260
The most common commute times in Area Code 260 are 15 to 19 minutes (29,486 commuters, 16.3%) for males and 15 to 19 minutes (27,258 commuters, 18.2%) for females.
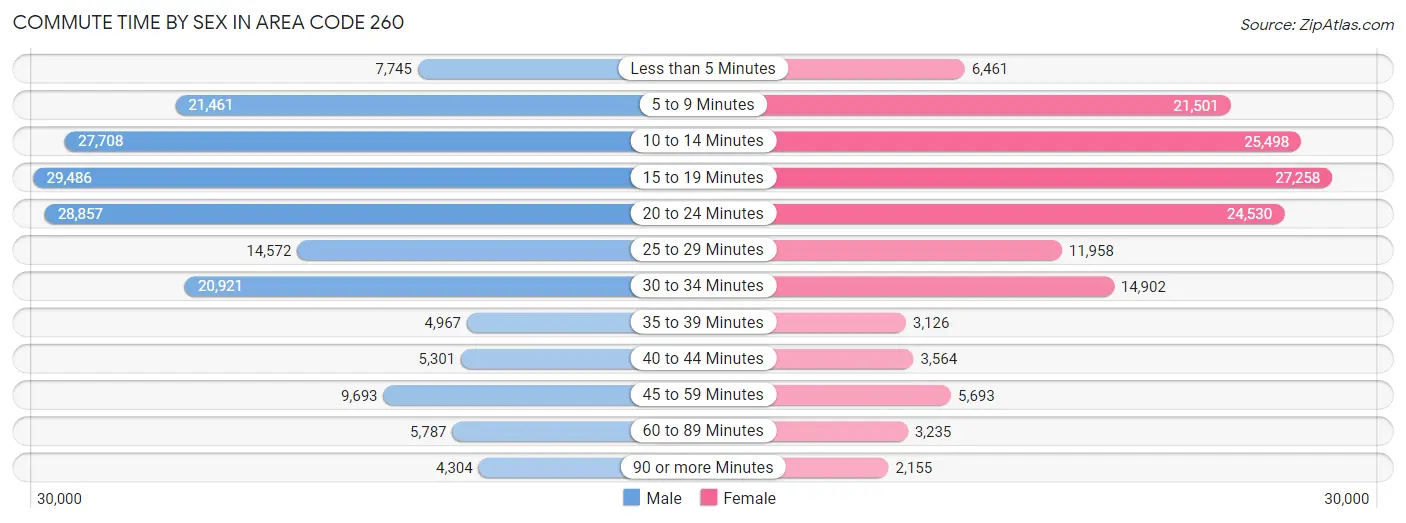
| Commute Time | Male | Female |
| Less than 5 Minutes | 7,745 (4.3%) | 6,461 (4.3%) |
| 5 to 9 Minutes | 21,461 (11.9%) | 21,501 (14.3%) |
| 10 to 14 Minutes | 27,708 (15.3%) | 25,498 (17.0%) |
| 15 to 19 Minutes | 29,486 (16.3%) | 27,258 (18.2%) |
| 20 to 24 Minutes | 28,857 (16.0%) | 24,530 (16.4%) |
| 25 to 29 Minutes | 14,572 (8.1%) | 11,958 (8.0%) |
| 30 to 34 Minutes | 20,921 (11.6%) | 14,902 (9.9%) |
| 35 to 39 Minutes | 4,967 (2.8%) | 3,126 (2.1%) |
| 40 to 44 Minutes | 5,301 (2.9%) | 3,564 (2.4%) |
| 45 to 59 Minutes | 9,693 (5.4%) | 5,693 (3.8%) |
| 60 to 89 Minutes | 5,787 (3.2%) | 3,235 (2.2%) |
| 90 or more Minutes | 4,304 (2.4%) | 2,155 (1.4%) |
Time of Departure to Work by Sex in Area Code 260
The most frequent times of departure to work in Area Code 260 are 7:00 AM to 7:29 AM (22,662, 12.5%) for males and 7:00 AM to 7:29 AM (22,084, 14.7%) for females.
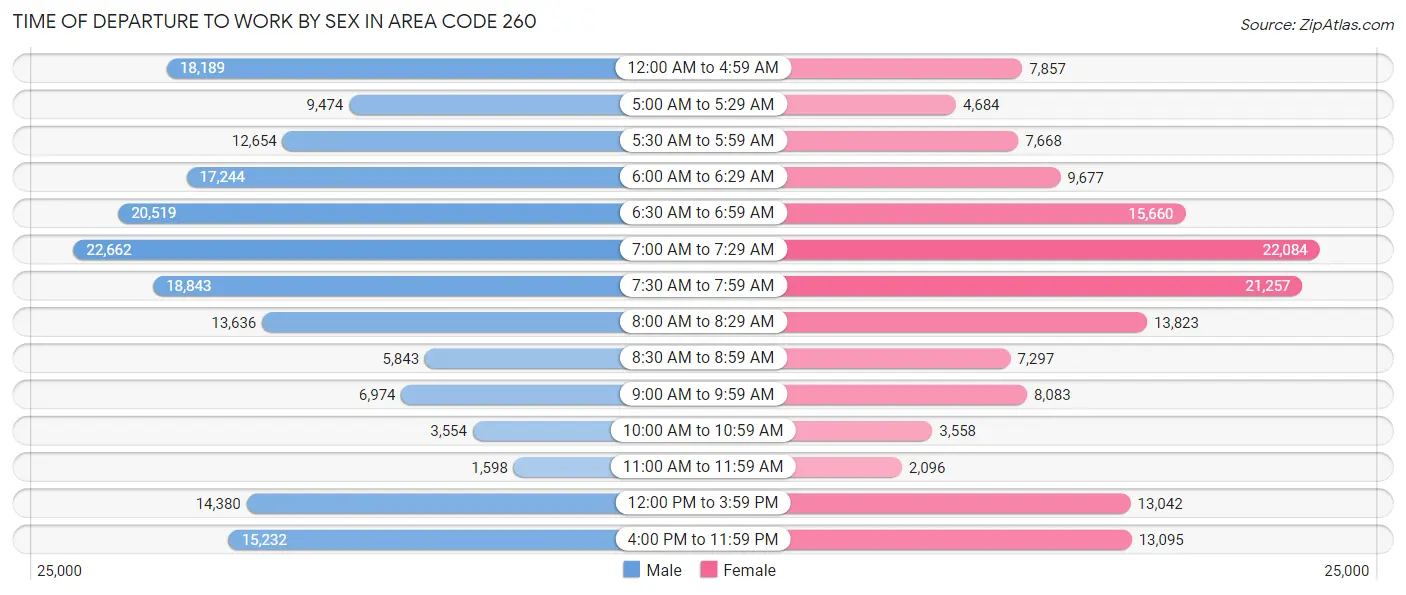
| Time of Departure | Male | Female |
| 12:00 AM to 4:59 AM | 18,189 (10.1%) | 7,857 (5.2%) |
| 5:00 AM to 5:29 AM | 9,474 (5.2%) | 4,684 (3.1%) |
| 5:30 AM to 5:59 AM | 12,654 (7.0%) | 7,668 (5.1%) |
| 6:00 AM to 6:29 AM | 17,244 (9.5%) | 9,677 (6.5%) |
| 6:30 AM to 6:59 AM | 20,519 (11.4%) | 15,660 (10.4%) |
| 7:00 AM to 7:29 AM | 22,662 (12.5%) | 22,084 (14.7%) |
| 7:30 AM to 7:59 AM | 18,843 (10.4%) | 21,257 (14.2%) |
| 8:00 AM to 8:29 AM | 13,636 (7.5%) | 13,823 (9.2%) |
| 8:30 AM to 8:59 AM | 5,843 (3.2%) | 7,297 (4.9%) |
| 9:00 AM to 9:59 AM | 6,974 (3.9%) | 8,083 (5.4%) |
| 10:00 AM to 10:59 AM | 3,554 (2.0%) | 3,558 (2.4%) |
| 11:00 AM to 11:59 AM | 1,598 (0.9%) | 2,096 (1.4%) |
| 12:00 PM to 3:59 PM | 14,380 (8.0%) | 13,042 (8.7%) |
| 4:00 PM to 11:59 PM | 15,232 (8.4%) | 13,095 (8.7%) |
| Total | 180,802 (100.0%) | 149,881 (100.0%) |
Housing Occupancy in Area Code 260
Occupancy by Ownership in Area Code 260
Of the total 287,980 dwellings in Area Code 260, owner-occupied units account for 213,754 (74.2%), while renter-occupied units make up 74,226 (25.8%).
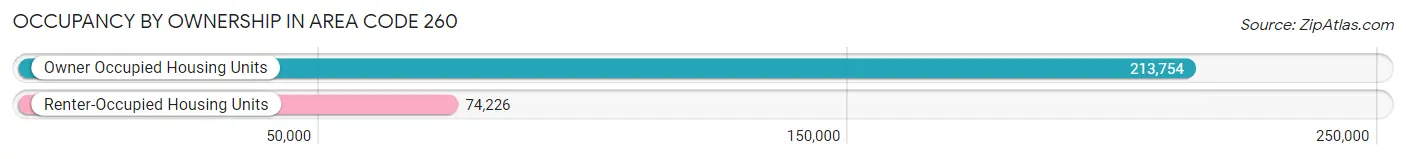
| Occupancy | # Housing Units | % Housing Units |
| Owner Occupied Housing Units | 213,754 | 74.2% |
| Renter-Occupied Housing Units | 74,226 | 25.8% |
| Total Occupied Housing Units | 287,980 | 100.0% |
Occupancy by Household Size in Area Code 260
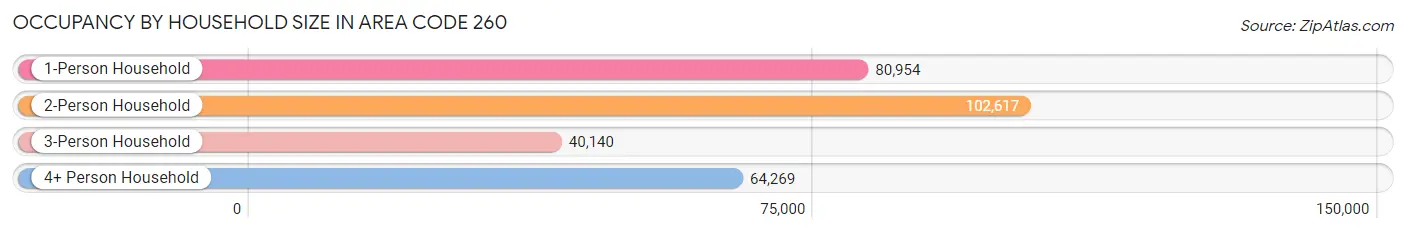
| Household Size | # Housing Units | % Housing Units |
| 1-Person Household | 80,954 | 28.1% |
| 2-Person Household | 102,617 | 35.6% |
| 3-Person Household | 40,140 | 13.9% |
| 4+ Person Household | 64,269 | 22.3% |
| Total Housing Units | 287,980 | 100.0% |
Occupancy by Ownership by Household Size in Area Code 260
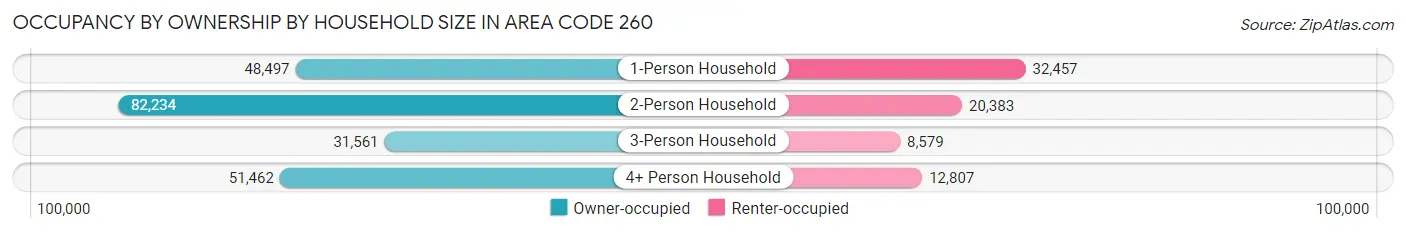
| Household Size | Owner-occupied | Renter-occupied |
| 1-Person Household | 48,497 (59.9%) | 32,457 (40.1%) |
| 2-Person Household | 82,234 (80.1%) | 20,383 (19.9%) |
| 3-Person Household | 31,561 (78.6%) | 8,579 (21.4%) |
| 4+ Person Household | 51,462 (80.1%) | 12,807 (19.9%) |
| Total Housing Units | 213,754 (74.2%) | 74,226 (25.8%) |
Occupancy by Educational Attainment in Area Code 260
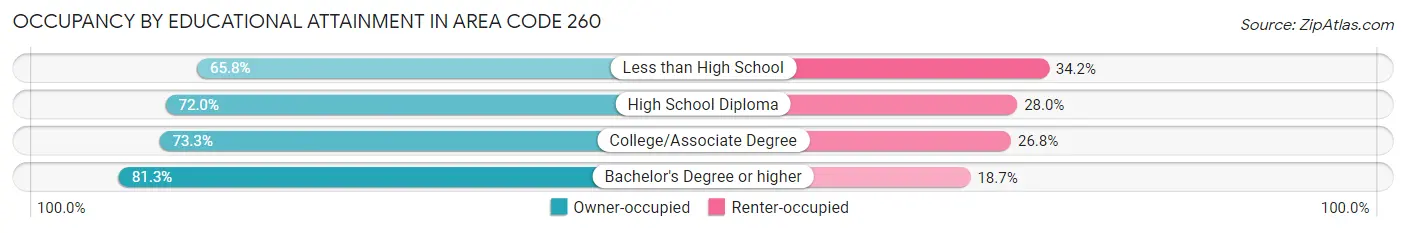
| Household Size | Owner-occupied | Renter-occupied |
| Less than High School | 19,021 (65.8%) | 9,894 (34.2%) |
| High School Diploma | 66,889 (72.0%) | 25,958 (28.0%) |
| College/Associate Degree | 66,315 (73.3%) | 24,223 (26.8%) |
| Bachelor's Degree or higher | 61,529 (81.3%) | 14,151 (18.7%) |
Occupancy by Age of Householder in Area Code 260
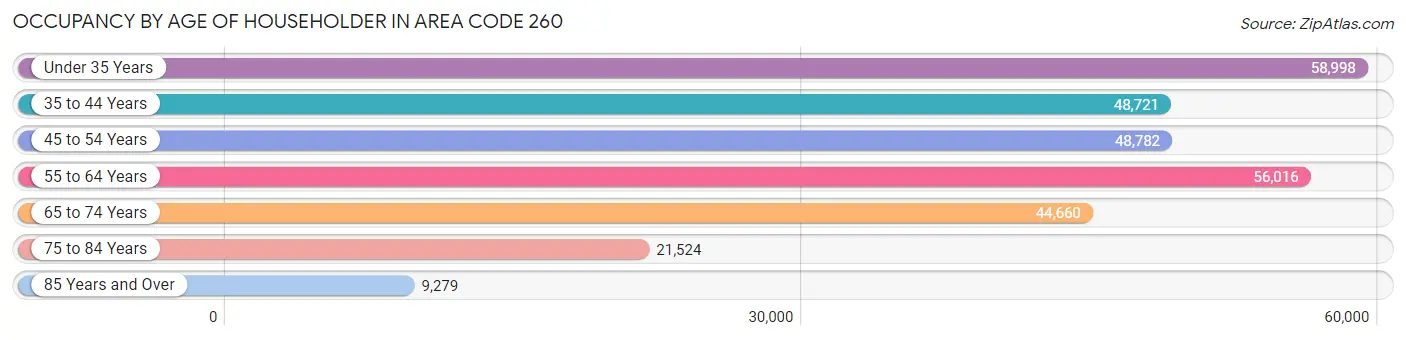
| Age Bracket | # Households | % Households |
| Under 35 Years | 58,998 | 20.5% |
| 35 to 44 Years | 48,721 | 16.9% |
| 45 to 54 Years | 48,782 | 16.9% |
| 55 to 64 Years | 56,016 | 19.5% |
| 65 to 74 Years | 44,660 | 15.5% |
| 75 to 84 Years | 21,524 | 7.5% |
| 85 Years and Over | 9,279 | 3.2% |
| Total | 287,980 | 100.0% |
Housing Finances in Area Code 260
Median Income by Occupancy in Area Code 260
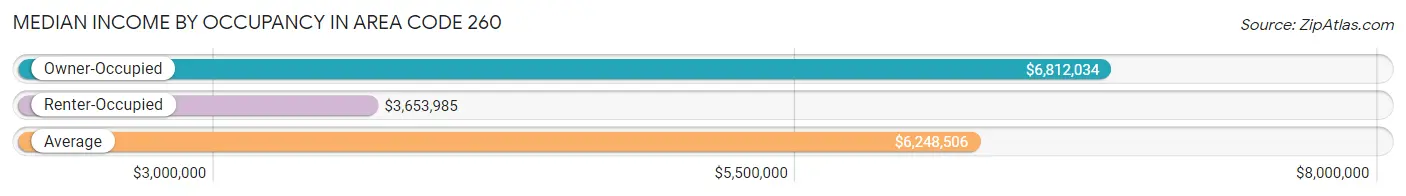
| Occupancy Type | # Households | Median Income |
| Owner-Occupied | 213,754 (74.2%) | $6,812,034 |
| Renter-Occupied | 74,226 (25.8%) | $3,653,985 |
| Average | 287,980 (100.0%) | $6,248,506 |
Occupancy by Householder Income Bracket in Area Code 260
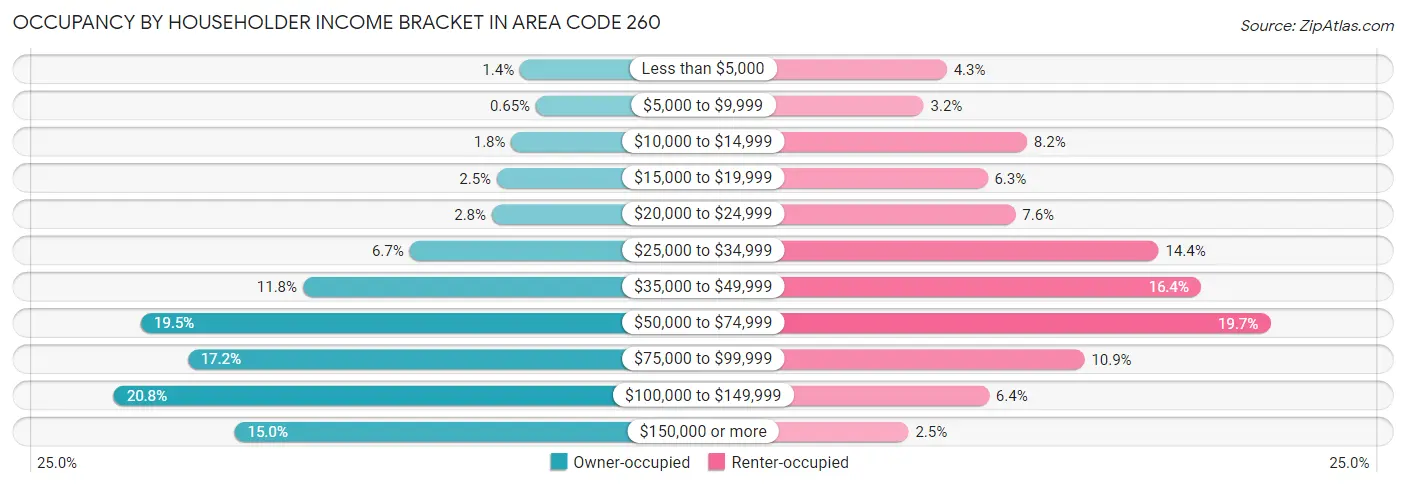
| Income Bracket | Owner-occupied | Renter-occupied |
| Less than $5,000 | 3,007 (1.4%) | 3,221 (4.3%) |
| $5,000 to $9,999 | 1,380 (0.6%) | 2,407 (3.2%) |
| $10,000 to $14,999 | 3,883 (1.8%) | 6,058 (8.2%) |
| $15,000 to $19,999 | 5,366 (2.5%) | 4,660 (6.3%) |
| $20,000 to $24,999 | 5,875 (2.8%) | 5,645 (7.6%) |
| $25,000 to $34,999 | 14,266 (6.7%) | 10,712 (14.4%) |
| $35,000 to $49,999 | 25,112 (11.7%) | 12,203 (16.4%) |
| $50,000 to $74,999 | 41,604 (19.5%) | 14,650 (19.7%) |
| $75,000 to $99,999 | 36,838 (17.2%) | 8,090 (10.9%) |
| $100,000 to $149,999 | 44,354 (20.7%) | 4,710 (6.4%) |
| $150,000 or more | 32,069 (15.0%) | 1,870 (2.5%) |
| Total | 213,754 (100.0%) | 74,226 (100.0%) |
Monthly Housing Cost Tiers in Area Code 260
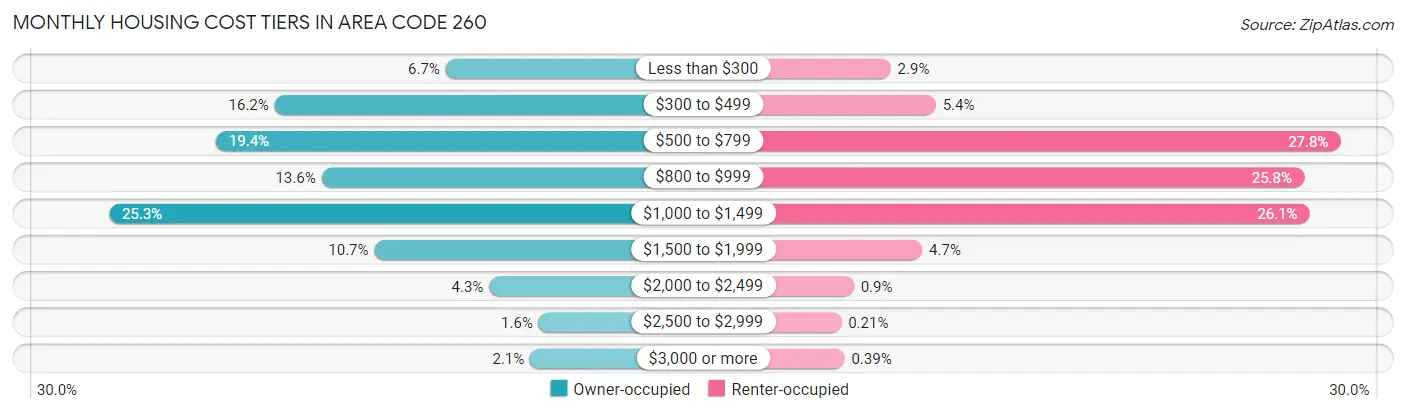
| Monthly Cost | Owner-occupied | Renter-occupied |
| Less than $300 | 14,414 (6.7%) | 2,182 (2.9%) |
| $300 to $499 | 34,613 (16.2%) | 4,029 (5.4%) |
| $500 to $799 | 41,522 (19.4%) | 20,612 (27.8%) |
| $800 to $999 | 29,070 (13.6%) | 19,118 (25.8%) |
| $1,000 to $1,499 | 54,162 (25.3%) | 19,351 (26.1%) |
| $1,500 to $1,999 | 22,827 (10.7%) | 3,471 (4.7%) |
| $2,000 to $2,499 | 9,279 (4.3%) | 668 (0.9%) |
| $2,500 to $2,999 | 3,430 (1.6%) | 158 (0.2%) |
| $3,000 or more | 4,437 (2.1%) | 288 (0.4%) |
| Total | 213,754 (100.0%) | 74,226 (100.0%) |
Physical Housing Characteristics in Area Code 260
Housing Structures in Area Code 260
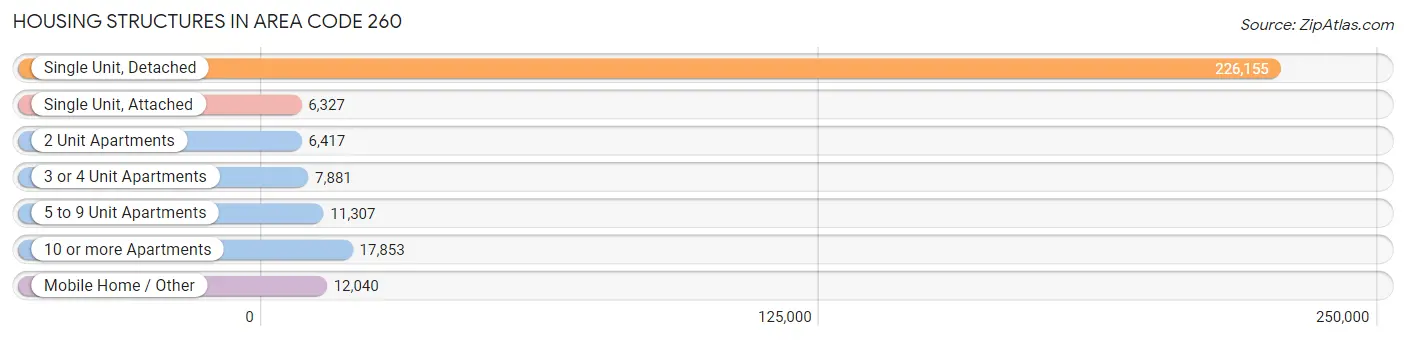
| Structure Type | # Housing Units | % Housing Units |
| Single Unit, Detached | 226,155 | 78.5% |
| Single Unit, Attached | 6,327 | 2.2% |
| 2 Unit Apartments | 6,417 | 2.2% |
| 3 or 4 Unit Apartments | 7,881 | 2.7% |
| 5 to 9 Unit Apartments | 11,307 | 3.9% |
| 10 or more Apartments | 17,853 | 6.2% |
| Mobile Home / Other | 12,040 | 4.2% |
| Total | 287,980 | 100.0% |
Housing Structures by Occupancy in Area Code 260
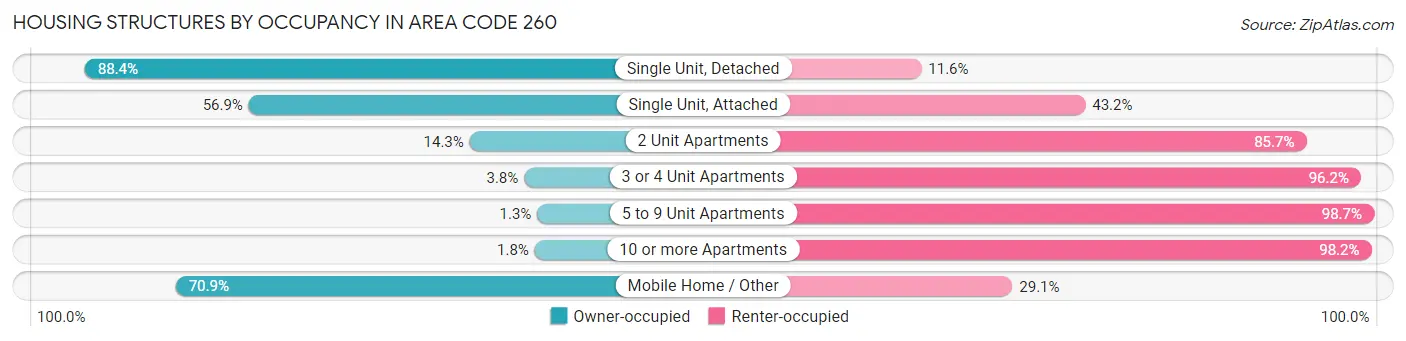
| Structure Type | Owner-occupied | Renter-occupied |
| Single Unit, Detached | 199,935 (88.4%) | 26,220 (11.6%) |
| Single Unit, Attached | 3,597 (56.9%) | 2,730 (43.1%) |
| 2 Unit Apartments | 919 (14.3%) | 5,498 (85.7%) |
| 3 or 4 Unit Apartments | 301 (3.8%) | 7,580 (96.2%) |
| 5 to 9 Unit Apartments | 148 (1.3%) | 11,159 (98.7%) |
| 10 or more Apartments | 319 (1.8%) | 17,534 (98.2%) |
| Mobile Home / Other | 8,535 (70.9%) | 3,505 (29.1%) |
| Total | 213,754 (74.2%) | 74,226 (25.8%) |
Housing Structures by Number of Rooms in Area Code 260
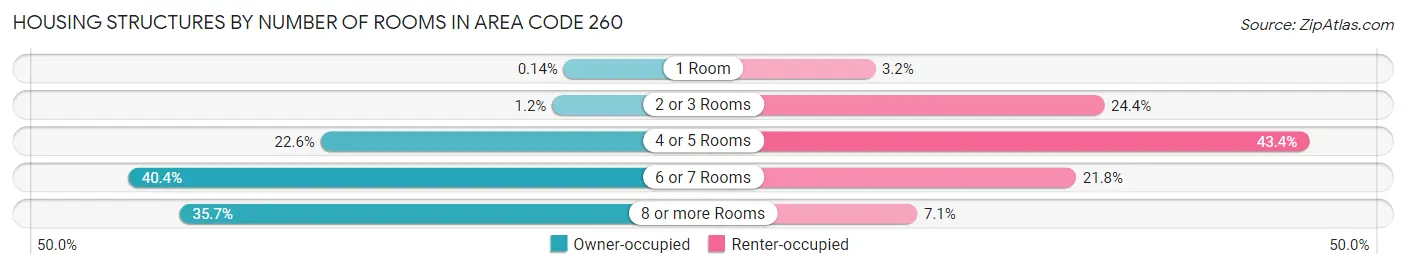
| Number of Rooms | Owner-occupied | Renter-occupied |
| 1 Room | 294 (0.1%) | 2,405 (3.2%) |
| 2 or 3 Rooms | 2,592 (1.2%) | 18,133 (24.4%) |
| 4 or 5 Rooms | 48,352 (22.6%) | 32,197 (43.4%) |
| 6 or 7 Rooms | 86,278 (40.4%) | 16,195 (21.8%) |
| 8 or more Rooms | 76,238 (35.7%) | 5,296 (7.1%) |
| Total | 213,754 (100.0%) | 74,226 (100.0%) |
Housing Structure by Heating Type in Area Code 260
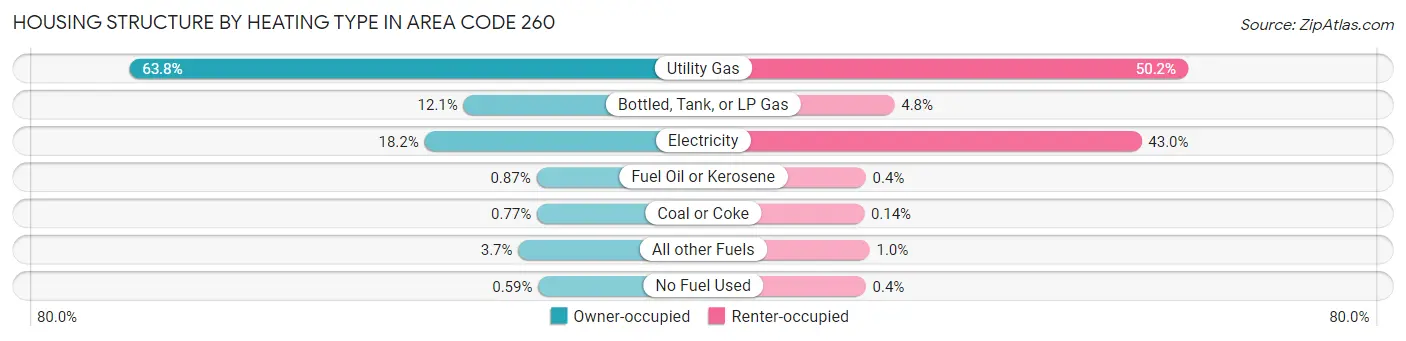
| Heating Type | Owner-occupied | Renter-occupied |
| Utility Gas | 136,387 (63.8%) | 37,266 (50.2%) |
| Bottled, Tank, or LP Gas | 25,927 (12.1%) | 3,586 (4.8%) |
| Electricity | 38,848 (18.2%) | 31,929 (43.0%) |
| Fuel Oil or Kerosene | 1,858 (0.9%) | 300 (0.4%) |
| Coal or Coke | 1,639 (0.8%) | 103 (0.1%) |
| All other Fuels | 7,835 (3.7%) | 742 (1.0%) |
| No Fuel Used | 1,260 (0.6%) | 300 (0.4%) |
| Total | 213,754 (100.0%) | 74,226 (100.0%) |
Household Vehicle Usage in Area Code 260
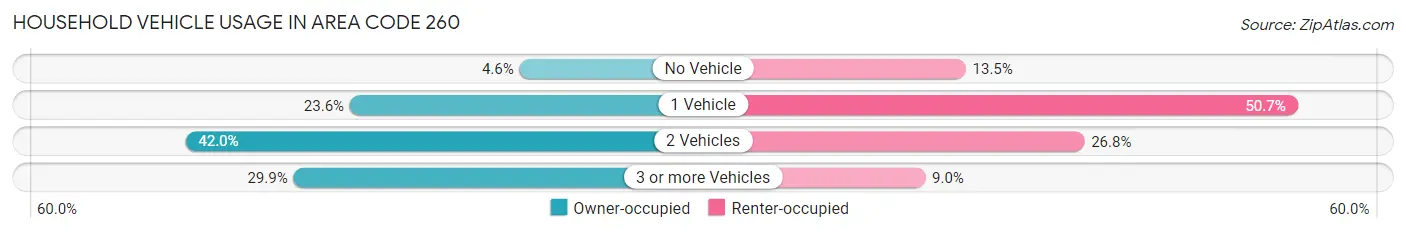
| Vehicles per Household | Owner-occupied | Renter-occupied |
| No Vehicle | 9,753 (4.6%) | 10,034 (13.5%) |
| 1 Vehicle | 50,370 (23.6%) | 37,628 (50.7%) |
| 2 Vehicles | 89,754 (42.0%) | 19,901 (26.8%) |
| 3 or more Vehicles | 63,877 (29.9%) | 6,663 (9.0%) |
| Total | 213,754 (100.0%) | 74,226 (100.0%) |
Real Estate & Mortgages in Area Code 260
Real Estate and Mortgage Overview in Area Code 260
| Characteristic | Without Mortgage | With Mortgage |
| Housing Units | 76,429 | 137,325 |
| Median Property Value | $13,485,900 | $15,650,200 |
| Median Household Income | $5,280,397 | $23,372 |
| Monthly Housing Costs | $39,093 | $4,312 |
| Real Estate Taxes | $91,095 | $3,908 |
Property Value by Mortgage Status in Area Code 260
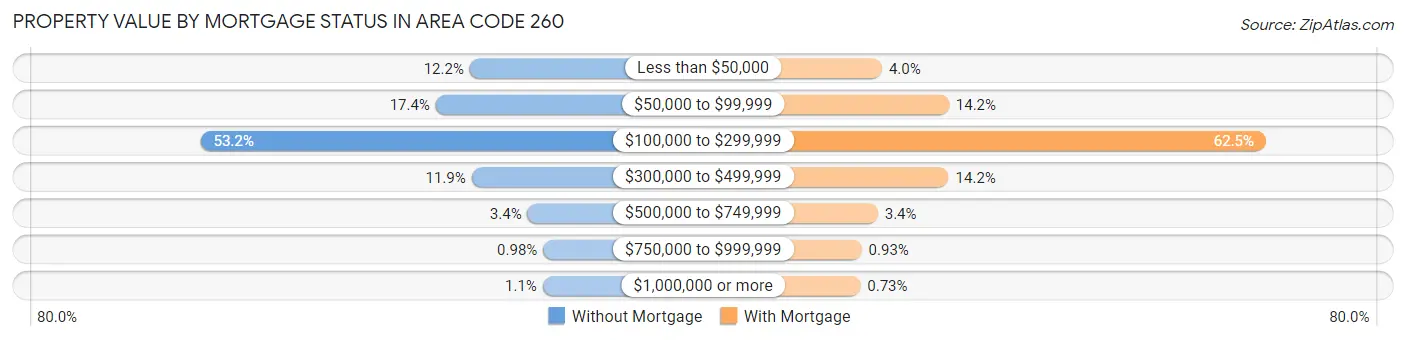
| Property Value | Without Mortgage | With Mortgage |
| Less than $50,000 | 9,302 (12.2%) | 5,535 (4.0%) |
| $50,000 to $99,999 | 13,270 (17.4%) | 19,521 (14.2%) |
| $100,000 to $299,999 | 40,651 (53.2%) | 85,859 (62.5%) |
| $300,000 to $499,999 | 9,084 (11.9%) | 19,483 (14.2%) |
| $500,000 to $749,999 | 2,573 (3.4%) | 4,658 (3.4%) |
| $750,000 to $999,999 | 747 (1.0%) | 1,272 (0.9%) |
| $1,000,000 or more | 802 (1.1%) | 997 (0.7%) |
| Total | 76,429 (100.0%) | 137,325 (100.0%) |
Household Income by Mortgage Status in Area Code 260
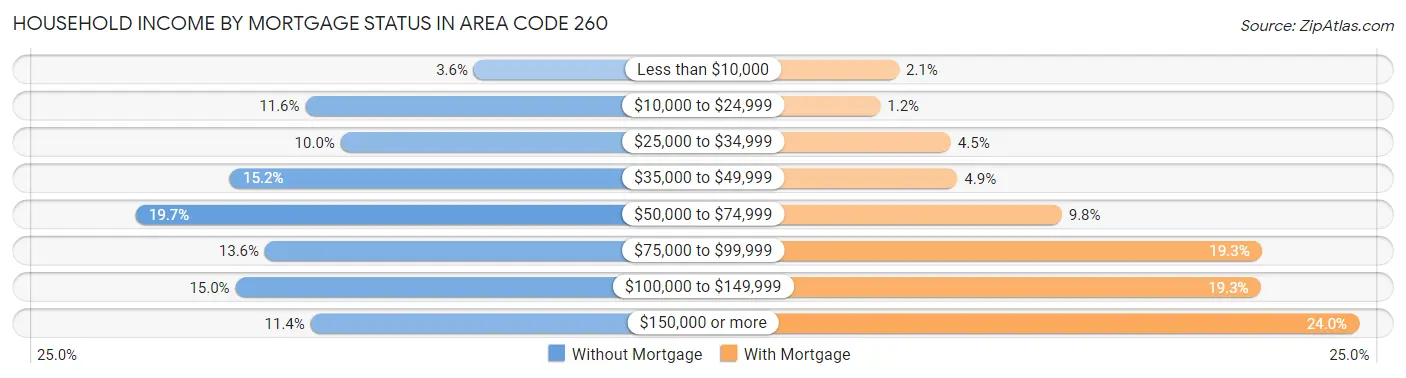
| Household Income | Without Mortgage | With Mortgage |
| Less than $10,000 | 2,761 (3.6%) | 2,842 (2.1%) |
| $10,000 to $24,999 | 8,891 (11.6%) | 1,626 (1.2%) |
| $25,000 to $34,999 | 7,608 (10.0%) | 6,233 (4.5%) |
| $35,000 to $49,999 | 11,622 (15.2%) | 6,658 (4.9%) |
| $50,000 to $74,999 | 15,057 (19.7%) | 13,490 (9.8%) |
| $75,000 to $99,999 | 10,361 (13.6%) | 26,547 (19.3%) |
| $100,000 to $149,999 | 11,432 (15.0%) | 26,477 (19.3%) |
| $150,000 or more | 8,697 (11.4%) | 32,922 (24.0%) |
| Total | 76,429 (100.0%) | 137,325 (100.0%) |
Property Value to Household Income Ratio in Area Code 260
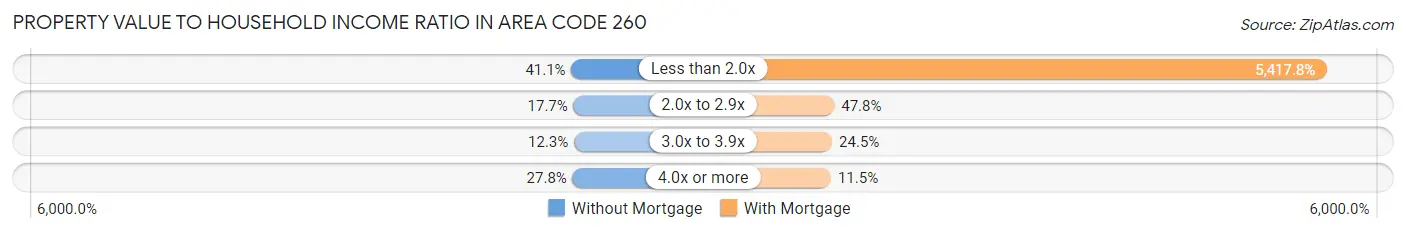
| Value-to-Income Ratio | Without Mortgage | With Mortgage |
| Less than 2.0x | 31,446 (41.1%) | 7,439,928 (5,417.8%) |
| 2.0x to 2.9x | 13,560 (17.7%) | 65,676 (47.8%) |
| 3.0x to 3.9x | 9,381 (12.3%) | 33,619 (24.5%) |
| 4.0x or more | 21,262 (27.8%) | 15,774 (11.5%) |
| Total | 76,429 (100.0%) | 137,325 (100.0%) |
Real Estate Taxes by Mortgage Status in Area Code 260
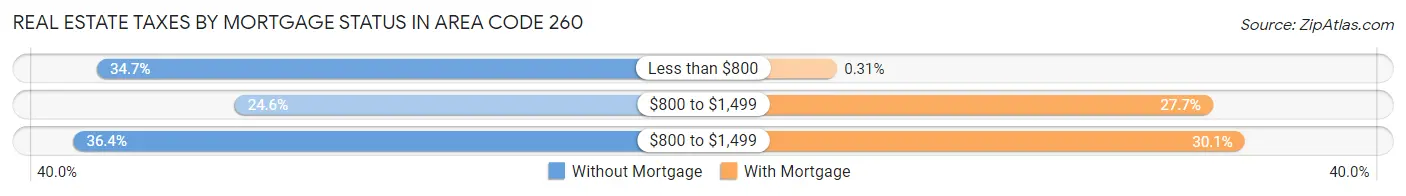
| Property Taxes | Without Mortgage | With Mortgage |
| Less than $800 | 26,522 (34.7%) | 419 (0.3%) |
| $800 to $1,499 | 18,831 (24.6%) | 38,083 (27.7%) |
| $800 to $1,499 | 27,837 (36.4%) | 41,274 (30.1%) |
| Total | 76,429 (100.0%) | 137,325 (100.0%) |
Health & Disability in Area Code 260
Health Insurance Coverage by Age in Area Code 260
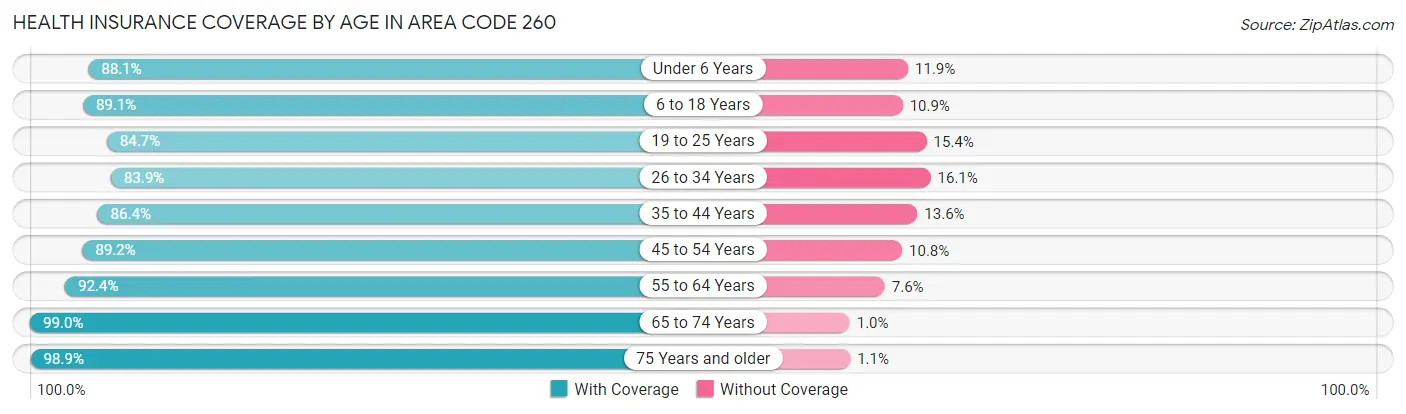
| Age Bracket | With Coverage | Without Coverage |
| Under 6 Years | 51,651 (88.1%) | 6,979 (11.9%) |
| 6 to 18 Years | 121,119 (89.1%) | 14,804 (10.9%) |
| 19 to 25 Years | 56,139 (84.7%) | 10,183 (15.3%) |
| 26 to 34 Years | 71,295 (83.9%) | 13,679 (16.1%) |
| 35 to 44 Years | 76,121 (86.4%) | 12,008 (13.6%) |
| 45 to 54 Years | 78,577 (89.2%) | 9,495 (10.8%) |
| 55 to 64 Years | 87,151 (92.4%) | 7,124 (7.6%) |
| 65 to 74 Years | 70,061 (99.0%) | 720 (1.0%) |
| 75 Years and older | 44,513 (98.9%) | 494 (1.1%) |
| Total | 656,627 (89.7%) | 75,486 (10.3%) |
Health Insurance Coverage by Citizenship Status in Area Code 260
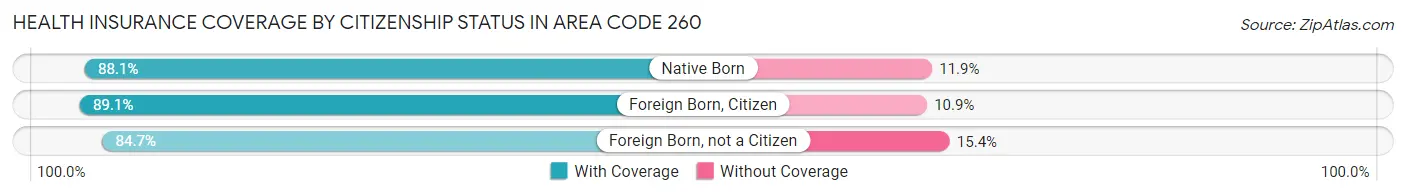
| Citizenship Status | With Coverage | Without Coverage |
| Native Born | 51,651 (88.1%) | 6,979 (11.9%) |
| Foreign Born, Citizen | 121,119 (89.1%) | 14,804 (10.9%) |
| Foreign Born, not a Citizen | 56,139 (84.7%) | 10,183 (15.3%) |
Health Insurance Coverage by Household Income in Area Code 260
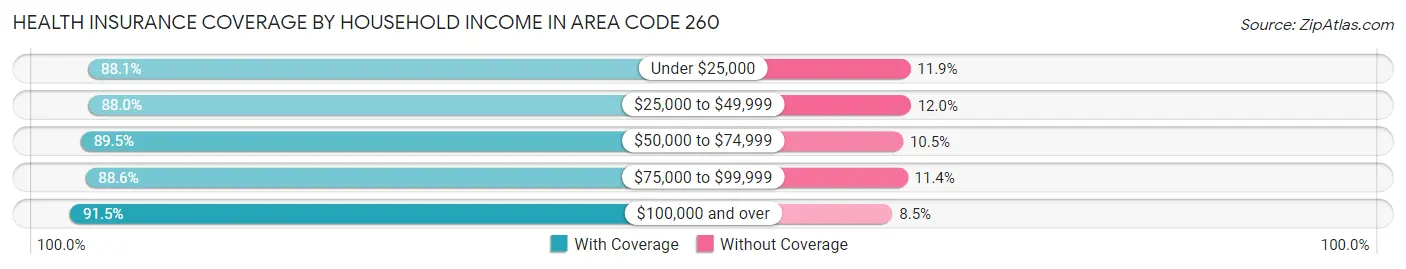
| Household Income | With Coverage | Without Coverage |
| Under $25,000 | 60,863 (88.1%) | 8,232 (11.9%) |
| $25,000 to $49,999 | 110,852 (88.0%) | 15,087 (12.0%) |
| $50,000 to $74,999 | 123,425 (89.5%) | 14,516 (10.5%) |
| $75,000 to $99,999 | 112,463 (88.6%) | 14,460 (11.4%) |
| $100,000 and over | 243,892 (91.5%) | 22,777 (8.5%) |
Public vs Private Health Insurance Coverage by Age in Area Code 260
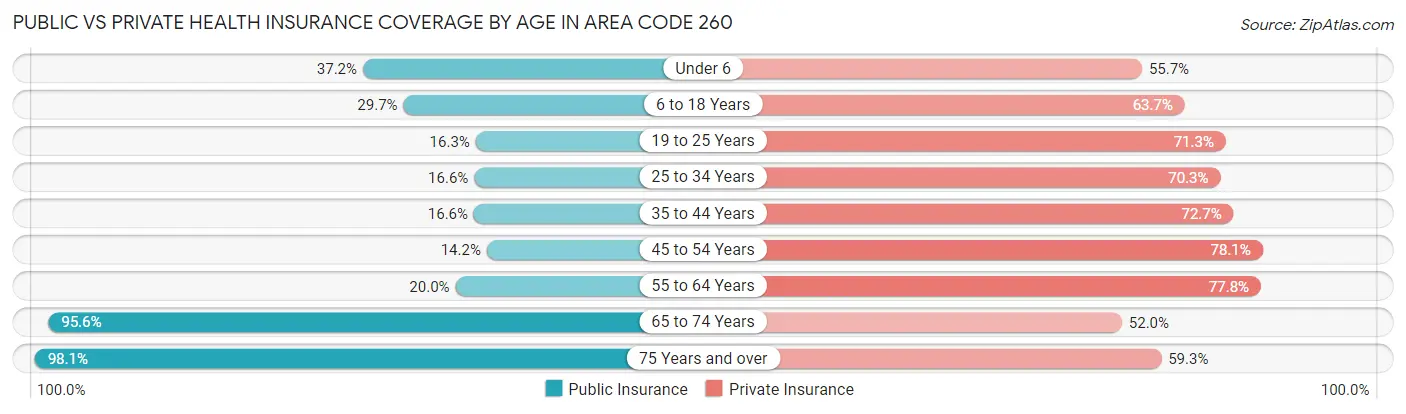
| Age Bracket | Public Insurance | Private Insurance |
| Under 6 | 21,817 (37.2%) | 32,663 (55.7%) |
| 6 to 18 Years | 40,352 (29.7%) | 86,509 (63.6%) |
| 19 to 25 Years | 10,800 (16.3%) | 47,263 (71.3%) |
| 25 to 34 Years | 14,071 (16.6%) | 59,699 (70.3%) |
| 35 to 44 Years | 14,642 (16.6%) | 64,077 (72.7%) |
| 45 to 54 Years | 12,525 (14.2%) | 68,788 (78.1%) |
| 55 to 64 Years | 18,888 (20.0%) | 73,340 (77.8%) |
| 65 to 74 Years | 67,670 (95.6%) | 36,802 (52.0%) |
| 75 Years and over | 44,163 (98.1%) | 26,686 (59.3%) |
| Total | 244,928 (33.5%) | 495,827 (67.7%) |
Disability Status by Sex by Age in Area Code 260

| Age Bracket | Male | Female |
| Under 5 Years | 233 (0.9%) | 98 (0.4%) |
| 5 to 17 Years | 5,086 (7.4%) | 2,886 (4.4%) |
| 18 to 34 Years | 6,817 (8.3%) | 6,481 (8.2%) |
| 35 to 64 Years | 17,929 (13.2%) | 18,315 (13.6%) |
| 65 to 74 Years | 8,255 (24.3%) | 7,986 (21.7%) |
| 75 Years and over | 9,373 (50.6%) | 11,548 (43.6%) |
Disability Class by Sex by Age in Area Code 260
Disability Class: Hearing Difficulty
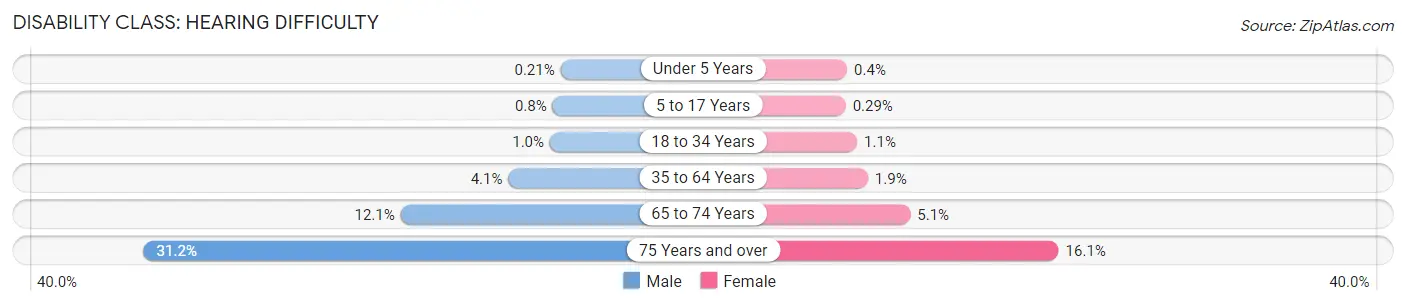
| Age Bracket | Male | Female |
| Under 5 Years | 54 (0.2%) | 95 (0.4%) |
| 5 to 17 Years | 549 (0.8%) | 193 (0.3%) |
| 18 to 34 Years | 819 (1.0%) | 902 (1.1%) |
| 35 to 64 Years | 5,547 (4.1%) | 2,613 (1.9%) |
| 65 to 74 Years | 4,112 (12.1%) | 1,871 (5.1%) |
| 75 Years and over | 5,777 (31.2%) | 4,262 (16.1%) |
Disability Class: Vision Difficulty
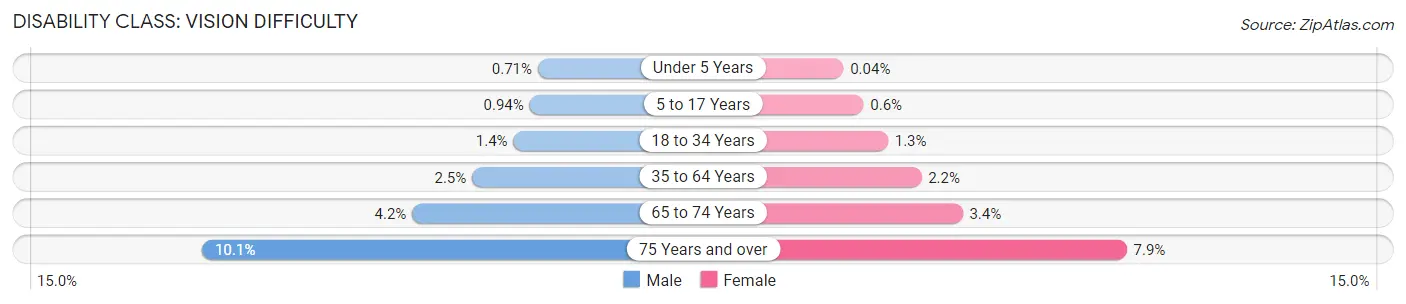
| Age Bracket | Male | Female |
| Under 5 Years | 179 (0.7%) | 9 (0.0%) |
| 5 to 17 Years | 646 (0.9%) | 397 (0.6%) |
| 18 to 34 Years | 1,145 (1.4%) | 1,013 (1.3%) |
| 35 to 64 Years | 3,448 (2.5%) | 2,981 (2.2%) |
| 65 to 74 Years | 1,430 (4.2%) | 1,235 (3.4%) |
| 75 Years and over | 1,864 (10.1%) | 2,100 (7.9%) |
Disability Class: Cognitive Difficulty
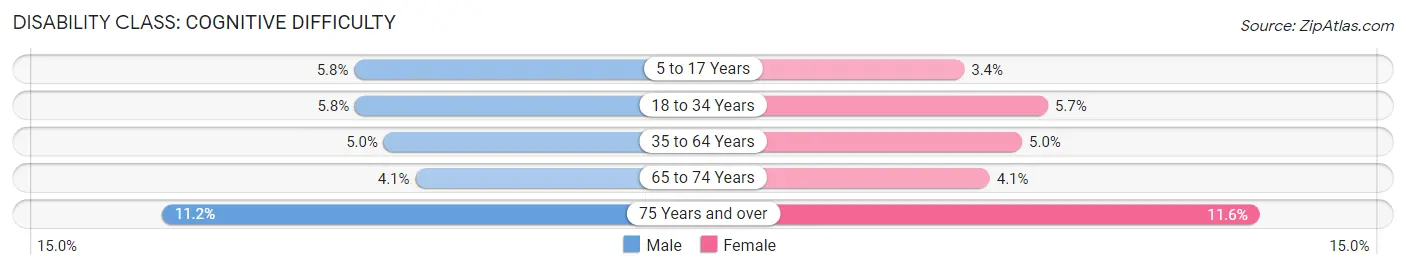
| Age Bracket | Male | Female |
| 5 to 17 Years | 4,021 (5.8%) | 2,252 (3.4%) |
| 18 to 34 Years | 4,759 (5.8%) | 4,555 (5.7%) |
| 35 to 64 Years | 6,778 (5.0%) | 6,771 (5.0%) |
| 65 to 74 Years | 1,400 (4.1%) | 1,516 (4.1%) |
| 75 Years and over | 2,073 (11.2%) | 3,078 (11.6%) |
Disability Class: Ambulatory Difficulty
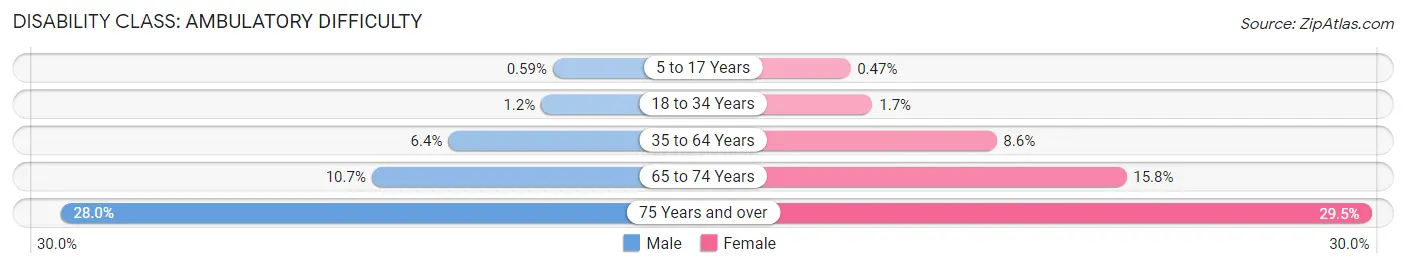
| Age Bracket | Male | Female |
| 5 to 17 Years | 407 (0.6%) | 308 (0.5%) |
| 18 to 34 Years | 1,020 (1.2%) | 1,349 (1.7%) |
| 35 to 64 Years | 8,691 (6.4%) | 11,607 (8.6%) |
| 65 to 74 Years | 3,628 (10.7%) | 5,825 (15.8%) |
| 75 Years and over | 5,190 (28.0%) | 7,806 (29.5%) |
Disability Class: Self-Care Difficulty
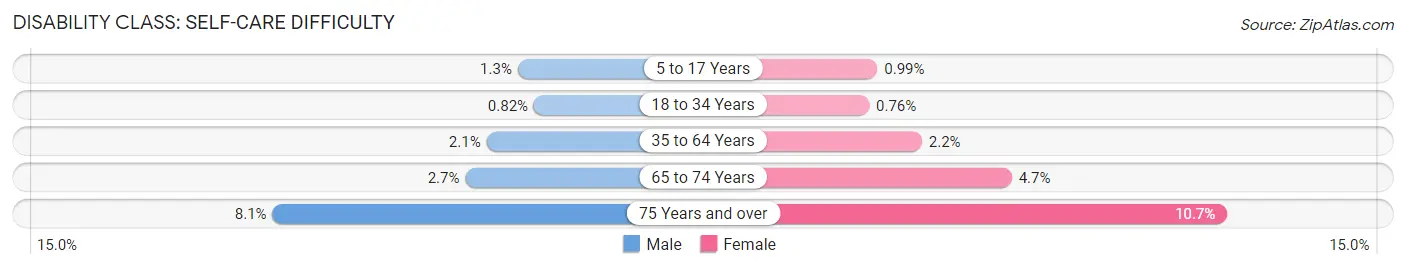
| Age Bracket | Male | Female |
| 5 to 17 Years | 874 (1.3%) | 654 (1.0%) |
| 18 to 34 Years | 674 (0.8%) | 604 (0.8%) |
| 35 to 64 Years | 2,901 (2.1%) | 3,009 (2.2%) |
| 65 to 74 Years | 927 (2.7%) | 1,739 (4.7%) |
| 75 Years and over | 1,501 (8.1%) | 2,839 (10.7%) |
Technology Access in Area Code 260
Computing Device Access in Area Code 260
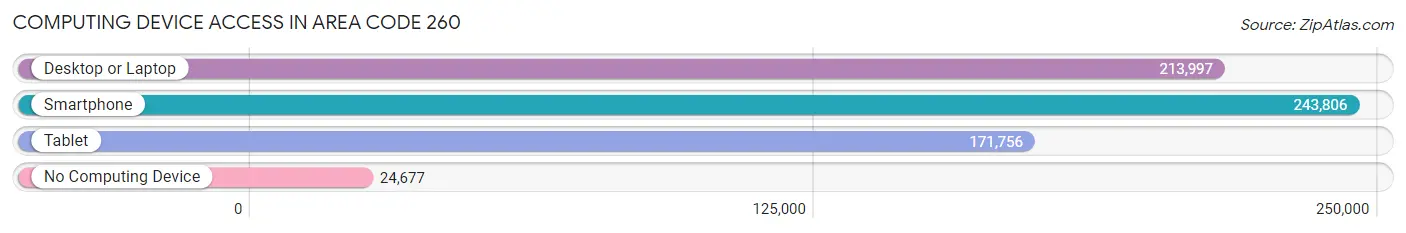
| Device Type | # Households | % Households |
| Desktop or Laptop | 213,997 | 74.3% |
| Smartphone | 243,806 | 84.7% |
| Tablet | 171,756 | 59.6% |
| No Computing Device | 24,677 | 8.6% |
| Total | 287,980 | 100.0% |
Internet Access in Area Code 260
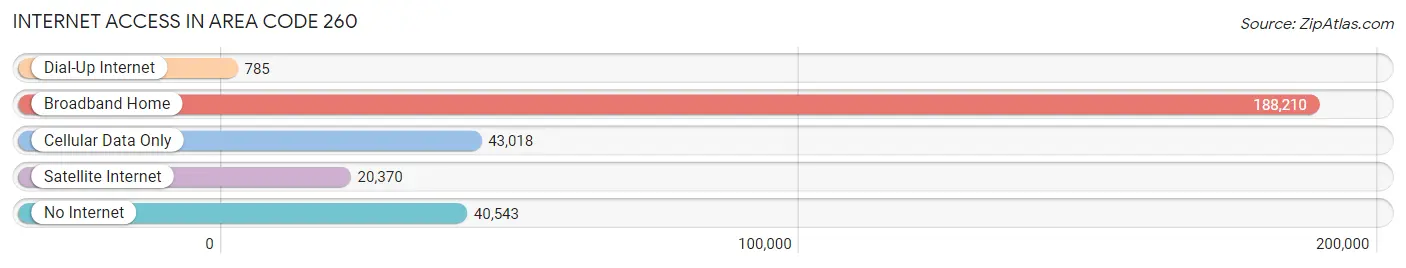
| Internet Type | # Households | % Households |
| Dial-Up Internet | 785 | 0.3% |
| Broadband Home | 188,210 | 65.4% |
| Cellular Data Only | 43,018 | 14.9% |
| Satellite Internet | 20,370 | 7.1% |
| No Internet | 40,543 | 14.1% |
| Total | 287,980 | 100.0% |
Area Code 260 Summary
Geography
Area code 260 is an area code in the North American Numbering Plan (NANP) for the northeastern Indiana region of the United States. It serves the cities of Fort Wayne, Angola, Auburn, Bluffton, Columbia City, Decatur, Huntington, Kendallville, and Warsaw.
Social
Area code 260 is home to a diverse population of people from all walks of life. The area is known for its strong sense of community and its friendly atmosphere. Residents of the area enjoy a variety of activities, from outdoor recreation to cultural events.
Economics
Area code 260 is a major economic hub in the region. The area is home to a number of large companies, including Steel Dynamics, Parkview Health, and Lincoln Financial Group. The area also has a thriving small business sector, with many local businesses providing goods and services to the community.
Demographics
Area code 260 is home to a population of over 500,000 people. The area is predominantly white, with a large Hispanic population. The median household income is around $50,000, and the unemployment rate is around 4%. The area is also home to a large number of college students, with several universities and colleges located in the area.
Common Questions
What is Per Capita Income in Area Code 260?
Per Capita income in Area Code 260 is $33,239.
What is the Median Family Income in Area Code 260?
Median Family Income in Area Code 260 is $82,837.
What is the Median Household income in Area Code 260?
Median Household Income in Area Code 260 is $71,006.
What is Income or Wage Gap in Area Code 260?
Income or Wage Gap in Area Code 260 is 36.3%.
Women in Area Code 260 earn 63.7 cents for every dollar earned by a man.
What is Family Income Deficit in Area Code 260?
Family Income Deficit in Area Code 260 is $10,677.
Families that are below poverty line in Area Code 260 earn $10,677 less on average than the poverty threshold level.
What is Inequality or Gini Index in Area Code 260?
Inequality or Gini Index in Area Code 260 is 35.77.
What is the Total Population of Area Code 260?
Total Population of Area Code 260 is 740,196.
What is the Total Male Population of Area Code 260?
Total Male Population of Area Code 260 is 368,480.
What is the Total Female Population of Area Code 260?
Total Female Population of Area Code 260 is 371,716.
What is the Ratio of Males per 100 Females in Area Code 260?
There are 99.13 Males per 100 Females in Area Code 260.
What is the Ratio of Females per 100 Males in Area Code 260?
There are 100.88 Females per 100 Males in Area Code 260.
What is the Median Population Age in Area Code 260?
Median Population Age in Area Code 260 is 40.0 Years.
What is the Average Family Size in Area Code 260
Average Family Size in Area Code 260 is 3.1 People.
What is the Average Household Size in Area Code 260
Average Household Size in Area Code 260 is 2.6 People.
How Large is the Labor Force in Area Code 260?
There are 370,824 People in the Labor Forcein in Area Code 260.
What is the Percentage of People in the Labor Force in Area Code 260?
64.3% of People are in the Labor Force in Area Code 260.
What is the Unemployment Rate in Area Code 260?
Unemployment Rate in Area Code 260 is 4.5%.