Anderson, IN Map & Demographics
Anderson Map
Anderson Overview
$26,475
PER CAPITA INCOME
$60,195
AVG FAMILY INCOME
$44,974
AVG HOUSEHOLD INCOME
34.2%
WAGE / INCOME GAP [ % ]
65.8¢/ $1
WAGE / INCOME GAP [ $ ]
$11,601
FAMILY INCOME DEFICIT
0.45
INEQUALITY / GINI INDEX
55,011
TOTAL POPULATION
26,953
MALE POPULATION
28,058
FEMALE POPULATION
96.06
MALES / 100 FEMALES
104.10
FEMALES / 100 MALES
38.8
MEDIAN AGE
3.0
AVG FAMILY SIZE
2.3
AVG HOUSEHOLD SIZE
25,643
LABOR FORCE [ PEOPLE ]
57.2%
PERCENT IN LABOR FORCE
7.0%
UNEMPLOYMENT RATE
Anderson Area Codes
Income in Anderson
Income Overview in Anderson
Per Capita Income in Anderson is $26,475, while median incomes of families and households are $60,195 and $44,974 respectively.
| Characteristic | Number | Measure |
| Per Capita Income | 55,011 | $26,475 |
| Median Family Income | 12,708 | $60,195 |
| Mean Family Income | 12,708 | $68,778 |
| Median Household Income | 23,279 | $44,974 |
| Mean Household Income | 23,279 | $58,977 |
| Income Deficit | 12,708 | $11,601 |
| Wage / Income Gap (%) | 55,011 | 34.18% |
| Wage / Income Gap ($) | 55,011 | 65.82¢ per $1 |
| Gini / Inequality Index | 55,011 | 0.45 |
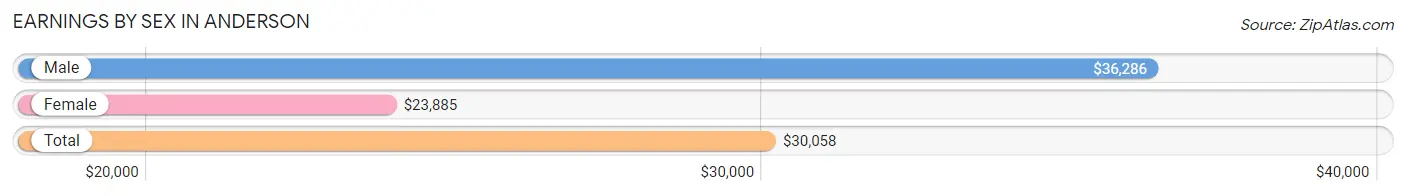
Earnings by Sex in Anderson
Average Earnings in Anderson are $30,058, $36,286 for men and $23,885 for women, a difference of 34.2%.
| Sex | Number | Average Earnings |
| Male | 14,269 (51.9%) | $36,286 |
| Female | 13,207 (48.1%) | $23,885 |
| Total | 27,476 (100.0%) | $30,058 |
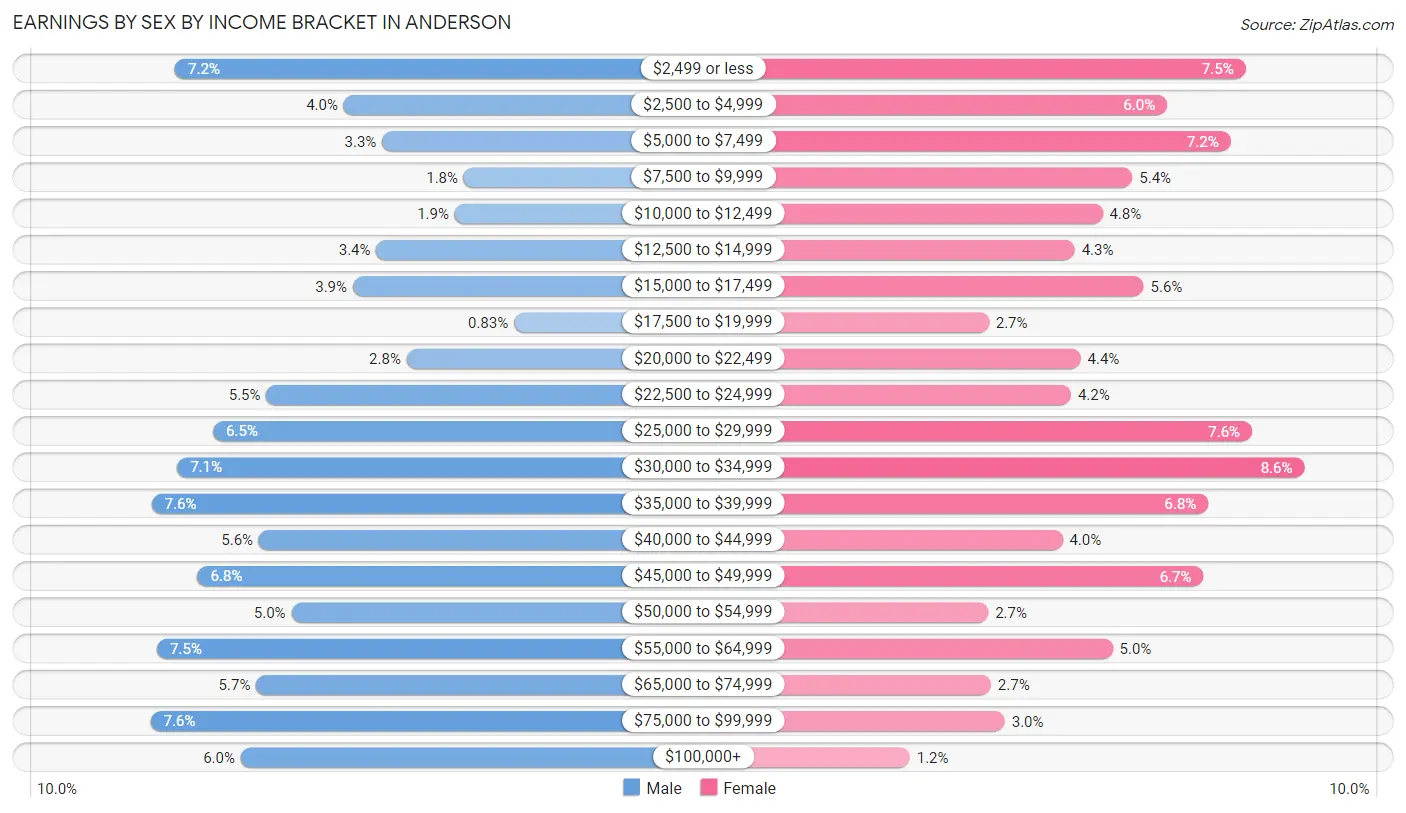
Earnings by Sex by Income Bracket in Anderson
The most common earnings brackets in Anderson are $75,000 to $99,999 for men (1,090 | 7.6%) and $30,000 to $34,999 for women (1,132 | 8.6%).
| Income | Male | Female |
| $2,499 or less | 1,024 (7.2%) | 987 (7.5%) |
| $2,500 to $4,999 | 574 (4.0%) | 793 (6.0%) |
| $5,000 to $7,499 | 471 (3.3%) | 950 (7.2%) |
| $7,500 to $9,999 | 253 (1.8%) | 707 (5.3%) |
| $10,000 to $12,499 | 277 (1.9%) | 632 (4.8%) |
| $12,500 to $14,999 | 487 (3.4%) | 564 (4.3%) |
| $15,000 to $17,499 | 550 (3.8%) | 734 (5.6%) |
| $17,500 to $19,999 | 119 (0.8%) | 351 (2.7%) |
| $20,000 to $22,499 | 405 (2.8%) | 578 (4.4%) |
| $22,500 to $24,999 | 780 (5.5%) | 555 (4.2%) |
| $25,000 to $29,999 | 923 (6.5%) | 1,003 (7.6%) |
| $30,000 to $34,999 | 1,019 (7.1%) | 1,132 (8.6%) |
| $35,000 to $39,999 | 1,087 (7.6%) | 894 (6.8%) |
| $40,000 to $44,999 | 801 (5.6%) | 534 (4.0%) |
| $45,000 to $49,999 | 965 (6.8%) | 882 (6.7%) |
| $50,000 to $54,999 | 714 (5.0%) | 350 (2.6%) |
| $55,000 to $64,999 | 1,073 (7.5%) | 658 (5.0%) |
| $65,000 to $74,999 | 808 (5.7%) | 356 (2.7%) |
| $75,000 to $99,999 | 1,090 (7.6%) | 391 (3.0%) |
| $100,000+ | 849 (5.9%) | 156 (1.2%) |
| Total | 14,269 (100.0%) | 13,207 (100.0%) |
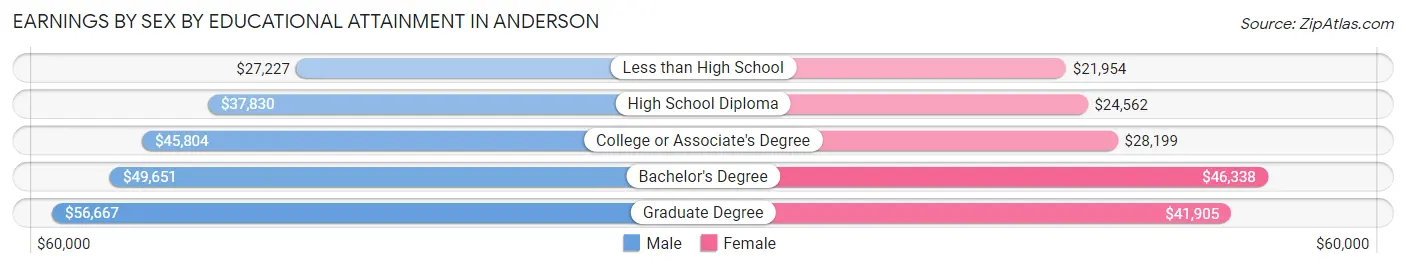
Earnings by Sex by Educational Attainment in Anderson
Average earnings in Anderson are $40,370 for men and $28,305 for women, a difference of 29.9%. Men with an educational attainment of graduate degree enjoy the highest average annual earnings of $56,667, while those with less than high school education earn the least with $27,227. Women with an educational attainment of bachelor's degree earn the most with the average annual earnings of $46,338, while those with less than high school education have the smallest earnings of $21,954.
| Educational Attainment | Male Income | Female Income |
| Less than High School | $27,227 | $21,954 |
| High School Diploma | $37,830 | $24,562 |
| College or Associate's Degree | $45,804 | $28,199 |
| Bachelor's Degree | $49,651 | $46,338 |
| Graduate Degree | $56,667 | $41,905 |
| Total | $40,370 | $28,305 |
Family Income in Anderson
Family Income Brackets in Anderson
According to the Anderson family income data, there are 3,037 families falling into the $50,000 to $74,999 income range, which is the most common income bracket and makes up 23.9% of all families. Conversely, the $200,000+ income bracket is the least frequent group with only 292 families (2.3%) belonging to this category.
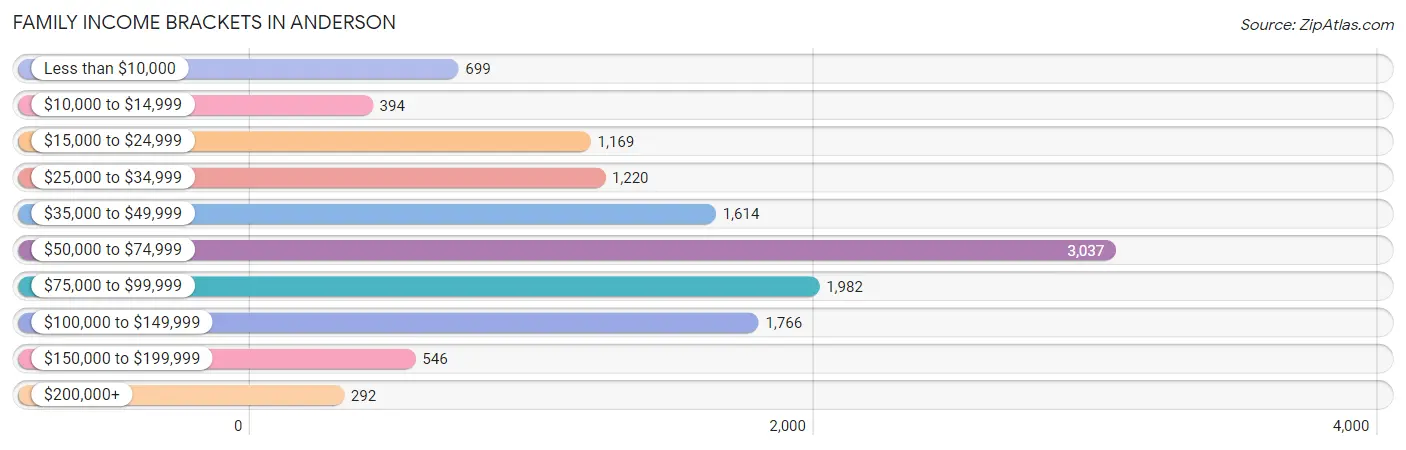
| Income Bracket | # Families | % Families |
| Less than $10,000 | 699 | 5.5% |
| $10,000 to $14,999 | 394 | 3.1% |
| $15,000 to $24,999 | 1,169 | 9.2% |
| $25,000 to $34,999 | 1,220 | 9.6% |
| $35,000 to $49,999 | 1,614 | 12.7% |
| $50,000 to $74,999 | 3,037 | 23.9% |
| $75,000 to $99,999 | 1,982 | 15.6% |
| $100,000 to $149,999 | 1,766 | 13.9% |
| $150,000 to $199,999 | 546 | 4.3% |
| $200,000+ | 292 | 2.3% |
Family Income by Famaliy Size in Anderson
6-person families (167 | 1.3%) account for the highest median family income in Anderson with $85,673 per family, while 2-person families (6,660 | 52.4%) have the highest median income of $30,181 per family member.
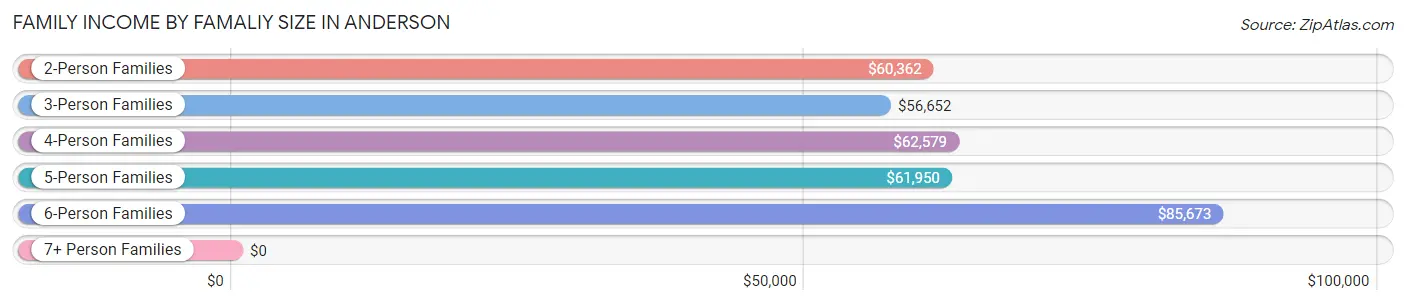
| Income Bracket | # Families | Median Income |
| 2-Person Families | 6,660 (52.4%) | $60,362 |
| 3-Person Families | 3,066 (24.1%) | $56,652 |
| 4-Person Families | 1,814 (14.3%) | $62,579 |
| 5-Person Families | 701 (5.5%) | $61,950 |
| 6-Person Families | 167 (1.3%) | $85,673 |
| 7+ Person Families | 300 (2.4%) | $0 |
| Total | 12,708 (100.0%) | $60,195 |
Family Income by Number of Earners in Anderson
The median family income in Anderson is $60,195, with families comprising 3+ earners (994) having the highest median family income of $105,572, while families with no earners (2,380) have the lowest median family income of $33,843, accounting for 7.8% and 18.7% of families, respectively.
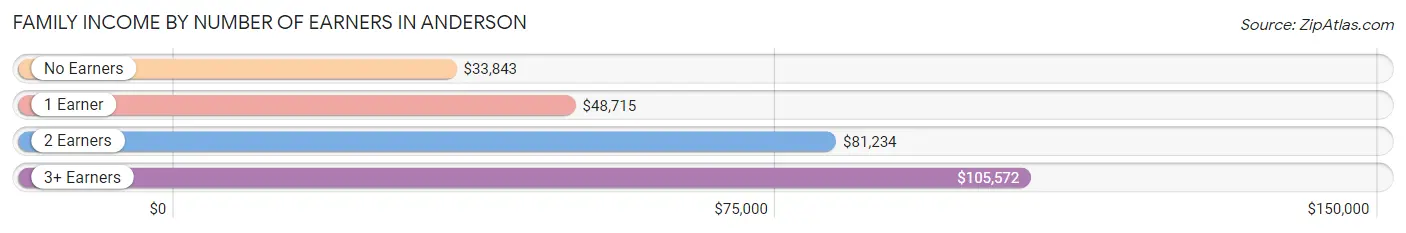
| Number of Earners | # Families | Median Income |
| No Earners | 2,380 (18.7%) | $33,843 |
| 1 Earner | 5,058 (39.8%) | $48,715 |
| 2 Earners | 4,276 (33.7%) | $81,234 |
| 3+ Earners | 994 (7.8%) | $105,572 |
| Total | 12,708 (100.0%) | $60,195 |
Household Income in Anderson
Household Income Brackets in Anderson
With 4,633 households falling in the category, the $50,000 to $74,999 income range is the most frequent in Anderson, accounting for 19.9% of all households. In contrast, only 372 households (1.6%) fall into the $200,000+ income bracket, making it the least populous group.
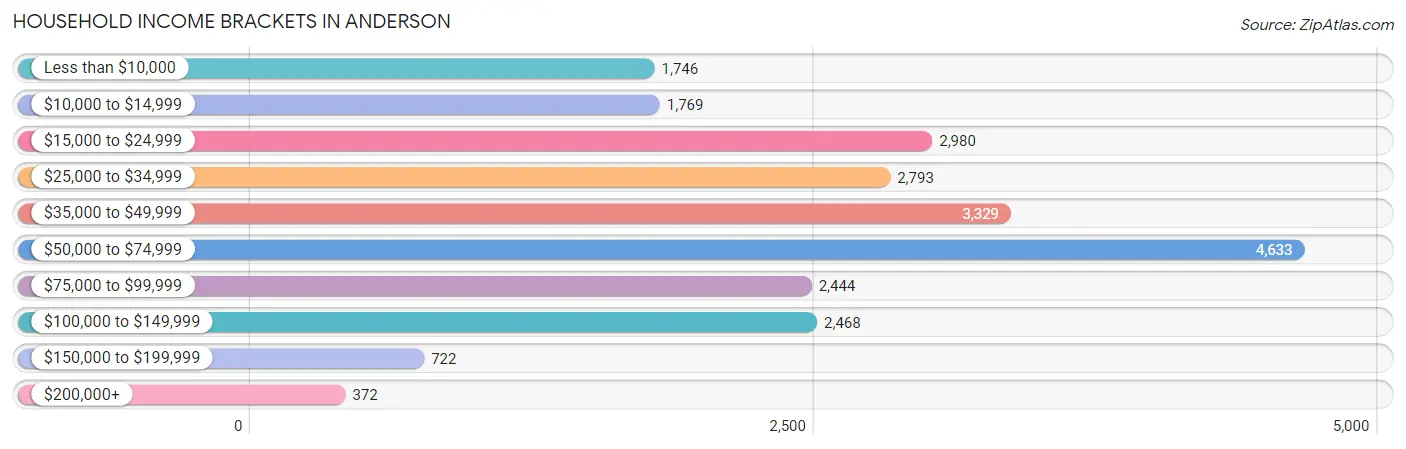
| Income Bracket | # Households | % Households |
| Less than $10,000 | 1,746 | 7.5% |
| $10,000 to $14,999 | 1,769 | 7.6% |
| $15,000 to $24,999 | 2,980 | 12.8% |
| $25,000 to $34,999 | 2,793 | 12.0% |
| $35,000 to $49,999 | 3,329 | 14.3% |
| $50,000 to $74,999 | 4,633 | 19.9% |
| $75,000 to $99,999 | 2,444 | 10.5% |
| $100,000 to $149,999 | 2,468 | 10.6% |
| $150,000 to $199,999 | 722 | 3.1% |
| $200,000+ | 372 | 1.6% |
Household Income by Householder Age in Anderson
The median household income in Anderson is $44,974, with the highest median household income of $51,176 found in the 45 to 64 years age bracket for the primary householder. A total of 7,800 households (33.5%) fall into this category. Meanwhile, the 15 to 24 years age bracket for the primary householder has the lowest median household income of $34,018, with 1,385 households (5.9%) in this group.
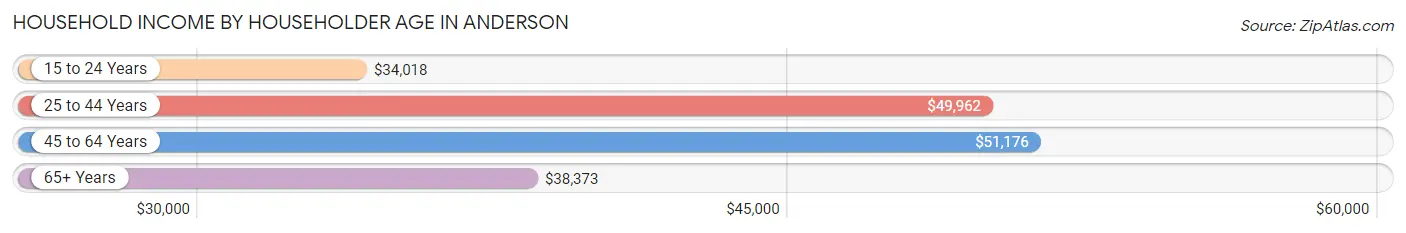
| Income Bracket | # Households | Median Income |
| 15 to 24 Years | 1,385 (5.9%) | $34,018 |
| 25 to 44 Years | 6,774 (29.1%) | $49,962 |
| 45 to 64 Years | 7,800 (33.5%) | $51,176 |
| 65+ Years | 7,320 (31.4%) | $38,373 |
| Total | 23,279 (100.0%) | $44,974 |
Poverty in Anderson
Income Below Poverty by Sex and Age in Anderson
With 19.5% poverty level for males and 24.0% for females among the residents of Anderson, 12 to 14 year old males and 15 year old females are the most vulnerable to poverty, with 392 males (47.3%) and 123 females (46.9%) in their respective age groups living below the poverty level.
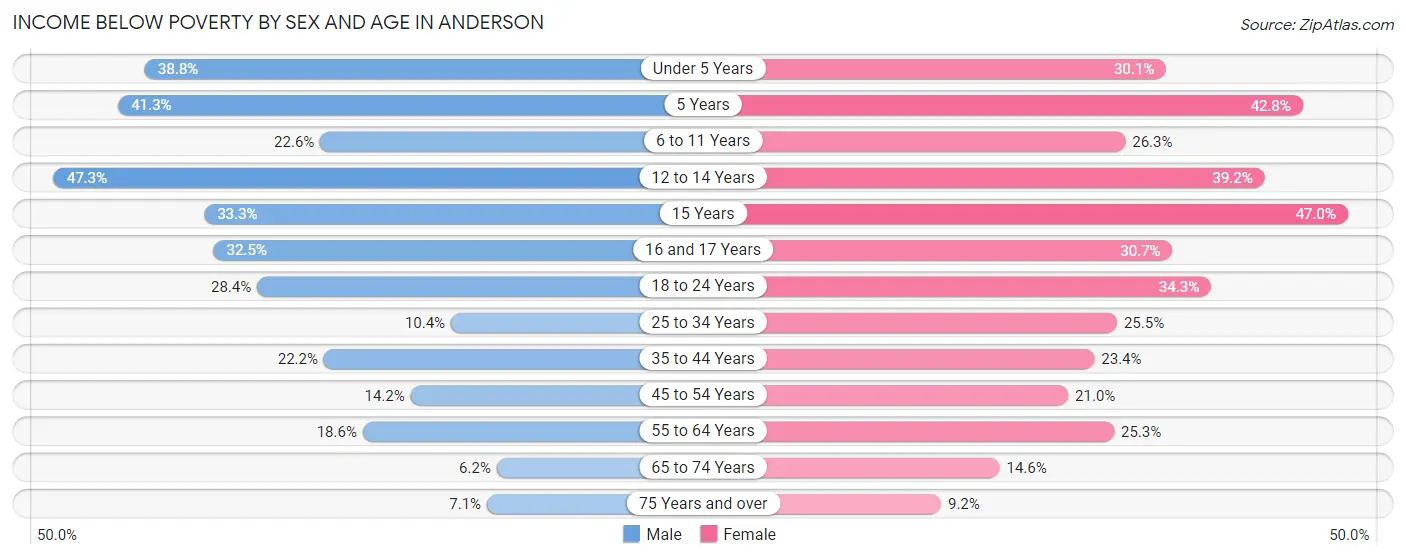
| Age Bracket | Male | Female |
| Under 5 Years | 629 (38.8%) | 527 (30.1%) |
| 5 Years | 164 (41.3%) | 142 (42.8%) |
| 6 to 11 Years | 399 (22.6%) | 398 (26.3%) |
| 12 to 14 Years | 392 (47.3%) | 304 (39.2%) |
| 15 Years | 117 (33.3%) | 123 (46.9%) |
| 16 and 17 Years | 186 (32.5%) | 177 (30.7%) |
| 18 to 24 Years | 675 (28.4%) | 858 (34.3%) |
| 25 to 34 Years | 381 (10.4%) | 1,043 (25.5%) |
| 35 to 44 Years | 666 (22.2%) | 619 (23.4%) |
| 45 to 54 Years | 476 (14.2%) | 668 (21.0%) |
| 55 to 64 Years | 623 (18.6%) | 912 (25.3%) |
| 65 to 74 Years | 164 (6.2%) | 465 (14.6%) |
| 75 Years and over | 125 (7.1%) | 237 (9.2%) |
| Total | 4,997 (19.5%) | 6,473 (24.0%) |
Income Above Poverty by Sex and Age in Anderson
According to the poverty statistics in Anderson, males aged 65 to 74 years and females aged 75 years and over are the age groups that are most secure financially, with 93.8% of males and 90.8% of females in these age groups living above the poverty line.
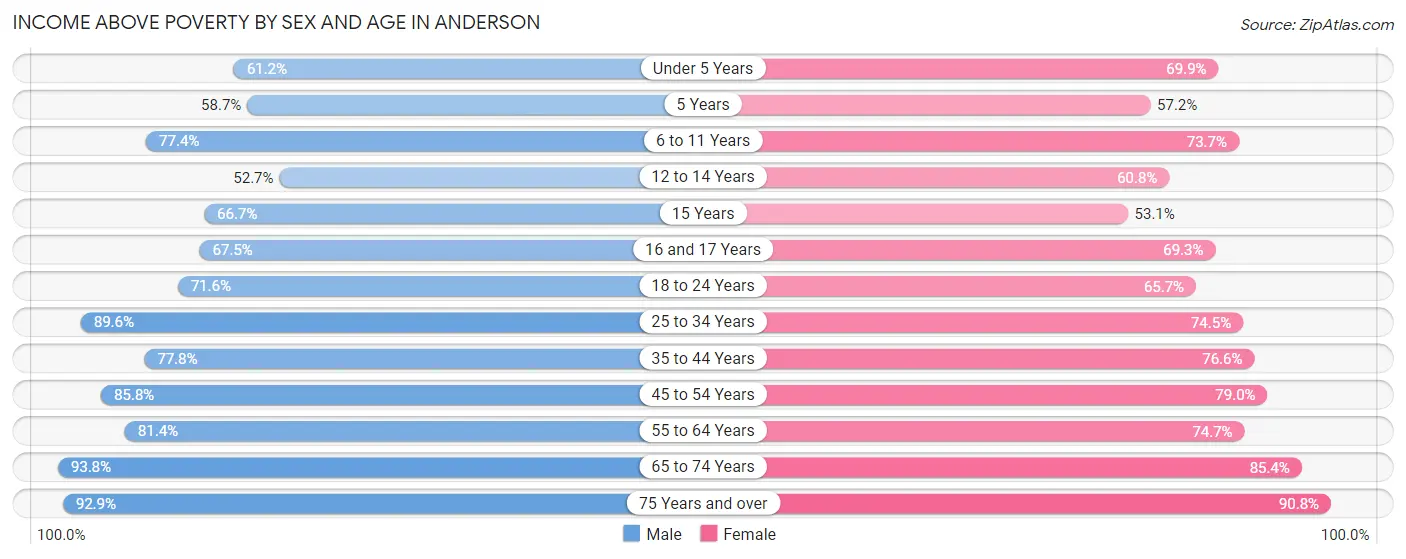
| Age Bracket | Male | Female |
| Under 5 Years | 991 (61.2%) | 1,224 (69.9%) |
| 5 Years | 233 (58.7%) | 190 (57.2%) |
| 6 to 11 Years | 1,369 (77.4%) | 1,115 (73.7%) |
| 12 to 14 Years | 437 (52.7%) | 471 (60.8%) |
| 15 Years | 234 (66.7%) | 139 (53.0%) |
| 16 and 17 Years | 387 (67.5%) | 400 (69.3%) |
| 18 to 24 Years | 1,699 (71.6%) | 1,646 (65.7%) |
| 25 to 34 Years | 3,271 (89.6%) | 3,040 (74.5%) |
| 35 to 44 Years | 2,330 (77.8%) | 2,022 (76.6%) |
| 45 to 54 Years | 2,880 (85.8%) | 2,511 (79.0%) |
| 55 to 64 Years | 2,723 (81.4%) | 2,697 (74.7%) |
| 65 to 74 Years | 2,490 (93.8%) | 2,712 (85.4%) |
| 75 Years and over | 1,637 (92.9%) | 2,335 (90.8%) |
| Total | 20,681 (80.5%) | 20,502 (76.0%) |
Income Below Poverty Among Married-Couple Families in Anderson
The poverty statistics for married-couple families in Anderson show that 6.3% or 506 of the total 7,988 families live below the poverty line. Families with 3 or 4 children have the highest poverty rate of 28.2%, comprising of 160 families. On the other hand, families with no children have the lowest poverty rate of 2.3%, which includes 119 families.
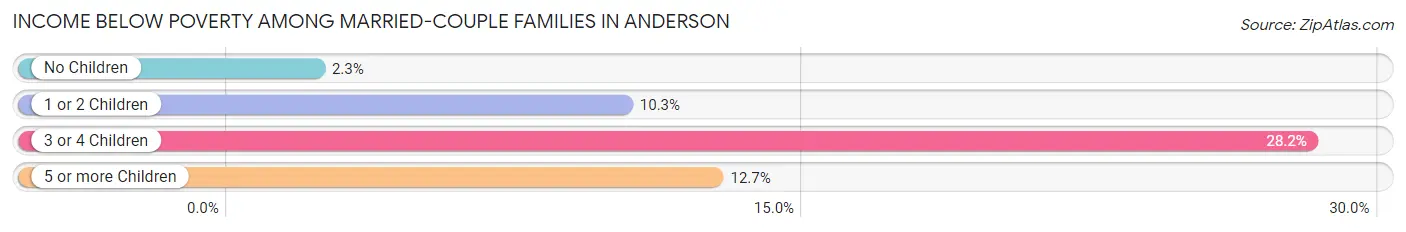
| Children | Above Poverty | Below Poverty |
| No Children | 5,117 (97.7%) | 119 (2.3%) |
| 1 or 2 Children | 1,896 (89.7%) | 218 (10.3%) |
| 3 or 4 Children | 407 (71.8%) | 160 (28.2%) |
| 5 or more Children | 62 (87.3%) | 9 (12.7%) |
| Total | 7,482 (93.7%) | 506 (6.3%) |
Income Below Poverty Among Single-Parent Households in Anderson
According to the poverty data in Anderson, 14.6% or 160 single-father households and 40.4% or 1,463 single-mother households are living below the poverty line. Among single-father households, those with 5 or more children have the highest poverty rate, with 37 households (100.0%) experiencing poverty. Likewise, among single-mother households, those with 3 or 4 children have the highest poverty rate, with 288 households (64.6%) falling below the poverty line.
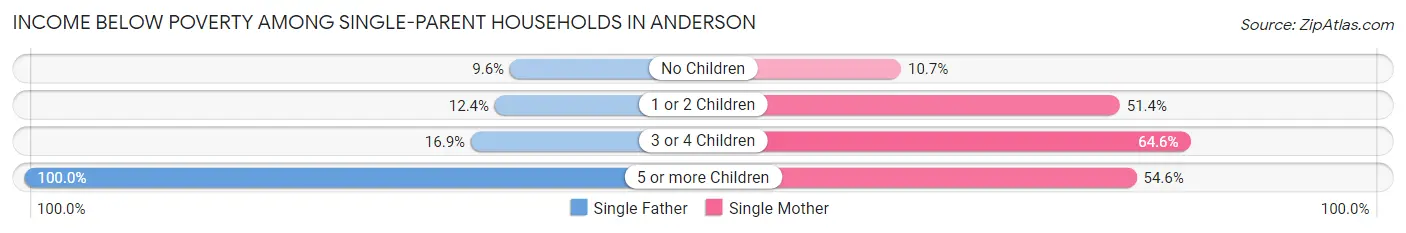
| Children | Single Father | Single Mother |
| No Children | 41 (9.6%) | 121 (10.7%) |
| 1 or 2 Children | 68 (12.4%) | 1,036 (51.4%) |
| 3 or 4 Children | 14 (16.9%) | 288 (64.6%) |
| 5 or more Children | 37 (100.0%) | 18 (54.5%) |
| Total | 160 (14.6%) | 1,463 (40.4%) |
Income Below Poverty Among Married-Couple vs Single-Parent Households in Anderson
The poverty data for Anderson shows that 506 of the married-couple family households (6.3%) and 1,623 of the single-parent households (34.4%) are living below the poverty level. Within the married-couple family households, those with 3 or 4 children have the highest poverty rate, with 160 households (28.2%) falling below the poverty line. Among the single-parent households, those with 5 or more children have the highest poverty rate, with 55 household (78.6%) living below poverty.
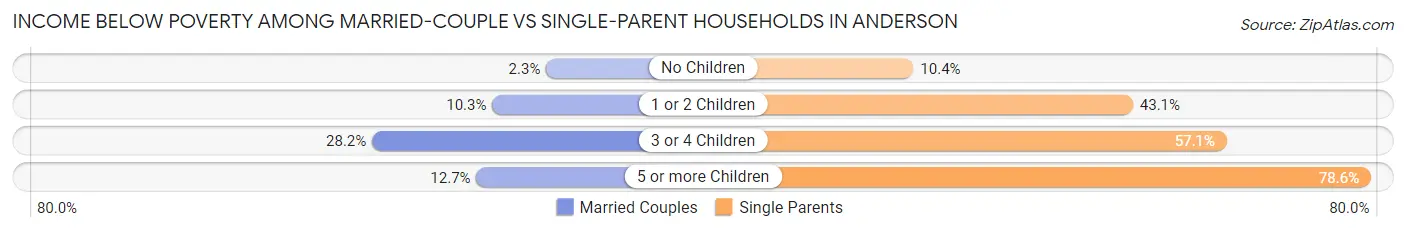
| Children | Married-Couple Families | Single-Parent Households |
| No Children | 119 (2.3%) | 162 (10.4%) |
| 1 or 2 Children | 218 (10.3%) | 1,104 (43.1%) |
| 3 or 4 Children | 160 (28.2%) | 302 (57.1%) |
| 5 or more Children | 9 (12.7%) | 55 (78.6%) |
| Total | 506 (6.3%) | 1,623 (34.4%) |
Race in Anderson
The most populous races in Anderson are White / Caucasian (41,672 | 75.7%), Black / African American (8,540 | 15.5%), and Hispanic or Latino (3,970 | 7.2%).
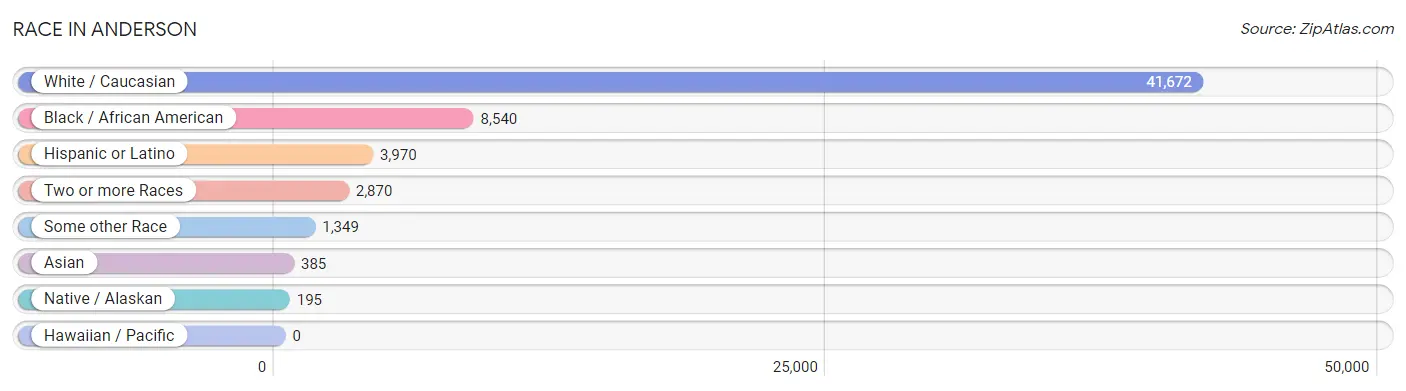
| Race | # Population | % Population |
| Asian | 385 | 0.7% |
| Black / African American | 8,540 | 15.5% |
| Hawaiian / Pacific | 0 | 0.0% |
| Hispanic or Latino | 3,970 | 7.2% |
| Native / Alaskan | 195 | 0.4% |
| White / Caucasian | 41,672 | 75.7% |
| Two or more Races | 2,870 | 5.2% |
| Some other Race | 1,349 | 2.5% |
| Total | 55,011 | 100.0% |
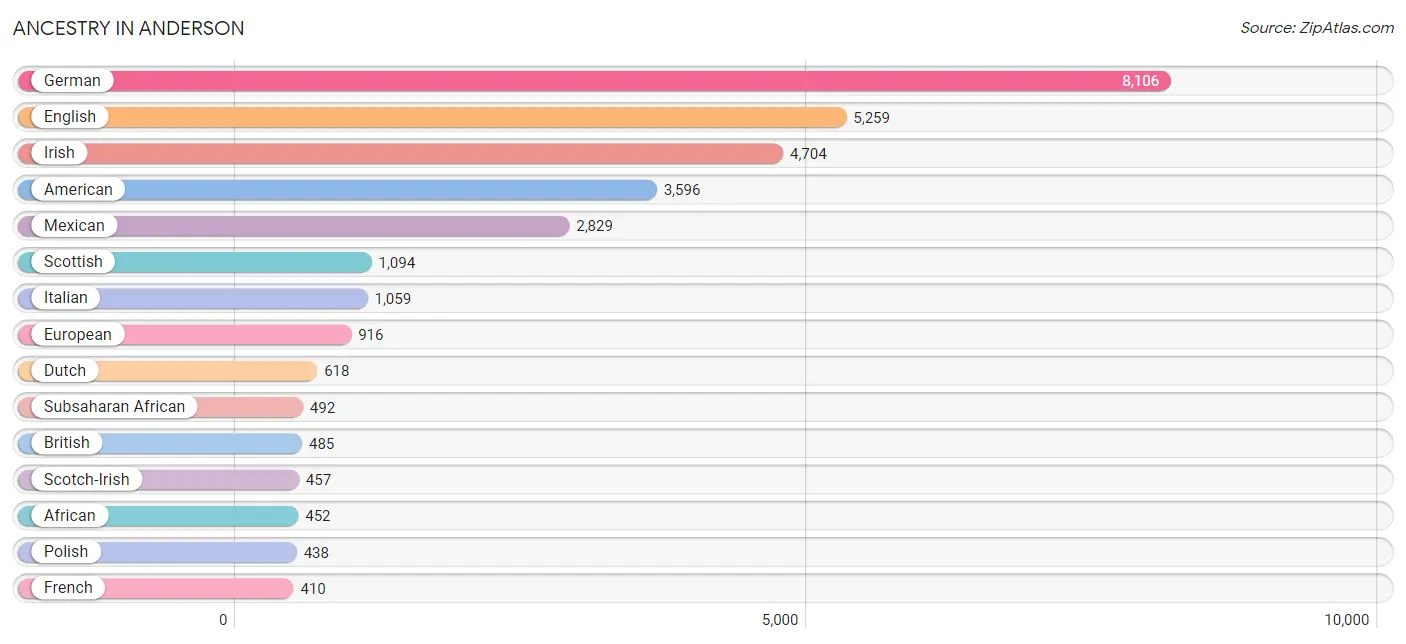
Ancestry in Anderson
The most populous ancestries reported in Anderson are German (8,106 | 14.7%), English (5,259 | 9.6%), Irish (4,704 | 8.6%), American (3,596 | 6.5%), and Mexican (2,829 | 5.1%), together accounting for 44.5% of all Anderson residents.
| Ancestry | # Population | % Population |
| African | 452 | 0.8% |
| American | 3,596 | 6.5% |
| Apache | 9 | 0.0% |
| Arab | 31 | 0.1% |
| Austrian | 56 | 0.1% |
| Belgian | 65 | 0.1% |
| Belizean | 43 | 0.1% |
| Bhutanese | 39 | 0.1% |
| Blackfeet | 31 | 0.1% |
| British | 485 | 0.9% |
| Burmese | 118 | 0.2% |
| Central American | 389 | 0.7% |
| Cherokee | 165 | 0.3% |
| Chippewa | 5 | 0.0% |
| Choctaw | 5 | 0.0% |
| Colombian | 58 | 0.1% |
| Creek | 22 | 0.0% |
| Croatian | 34 | 0.1% |
| Cuban | 40 | 0.1% |
| Czech | 59 | 0.1% |
| Czechoslovakian | 34 | 0.1% |
| Danish | 64 | 0.1% |
| Dominican | 16 | 0.0% |
| Dutch | 618 | 1.1% |
| Eastern European | 46 | 0.1% |
| Ecuadorian | 52 | 0.1% |
| English | 5,259 | 9.6% |
| Ethiopian | 29 | 0.1% |
| European | 916 | 1.7% |
| Filipino | 14 | 0.0% |
| Finnish | 34 | 0.1% |
| French | 410 | 0.7% |
| French Canadian | 65 | 0.1% |
| German | 8,106 | 14.7% |
| Greek | 82 | 0.2% |
| Guatemalan | 41 | 0.1% |
| Haitian | 59 | 0.1% |
| Honduran | 110 | 0.2% |
| Hopi | 9 | 0.0% |
| Hungarian | 25 | 0.1% |
| Indian (Asian) | 50 | 0.1% |
| Indonesian | 37 | 0.1% |
| Inupiat | 5 | 0.0% |
| Irish | 4,704 | 8.6% |
| Israeli | 10 | 0.0% |
| Italian | 1,059 | 1.9% |
| Jamaican | 43 | 0.1% |
| Jordanian | 15 | 0.0% |
| Korean | 52 | 0.1% |
| Lithuanian | 9 | 0.0% |
| Mexican | 2,829 | 5.1% |
| Mexican American Indian | 147 | 0.3% |
| Moroccan | 6 | 0.0% |
| Native Hawaiian | 33 | 0.1% |
| Nicaraguan | 70 | 0.1% |
| Nigerian | 11 | 0.0% |
| Northern European | 39 | 0.1% |
| Norwegian | 117 | 0.2% |
| Osage | 3 | 0.0% |
| Palestinian | 10 | 0.0% |
| Pennsylvania German | 25 | 0.1% |
| Peruvian | 7 | 0.0% |
| Polish | 438 | 0.8% |
| Portuguese | 14 | 0.0% |
| Puerto Rican | 409 | 0.7% |
| Romanian | 25 | 0.1% |
| Russian | 26 | 0.1% |
| Salvadoran | 168 | 0.3% |
| Scandinavian | 116 | 0.2% |
| Scotch-Irish | 457 | 0.8% |
| Scottish | 1,094 | 2.0% |
| Seminole | 44 | 0.1% |
| Sioux | 12 | 0.0% |
| Slovak | 18 | 0.0% |
| South American | 117 | 0.2% |
| Spaniard | 50 | 0.1% |
| Spanish | 14 | 0.0% |
| Sri Lankan | 179 | 0.3% |
| Subsaharan African | 492 | 0.9% |
| Swedish | 294 | 0.5% |
| Swiss | 37 | 0.1% |
| Thai | 36 | 0.1% |
| Tohono O'Odham | 14 | 0.0% |
| Ukrainian | 18 | 0.0% |
| Welsh | 275 | 0.5% |
| Yugoslavian | 38 | 0.1% | View All 86 Rows |
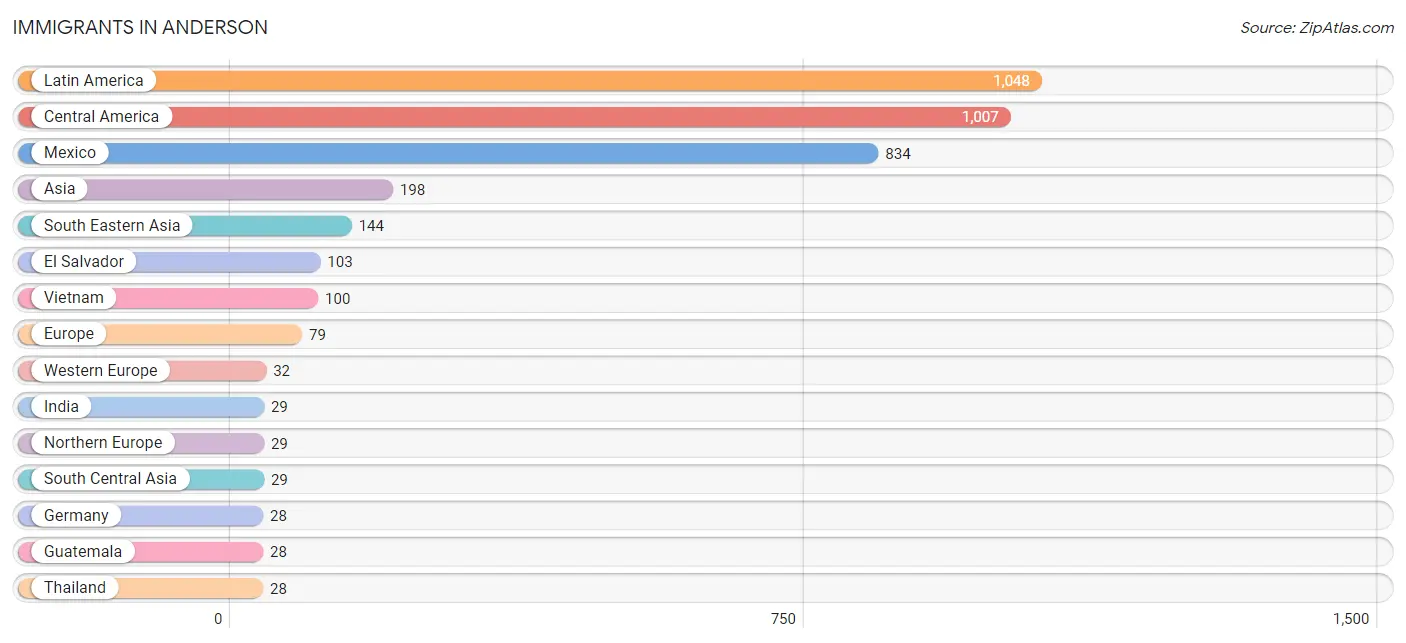
Immigrants in Anderson
The most numerous immigrant groups reported in Anderson came from Latin America (1,048 | 1.9%), Central America (1,007 | 1.8%), Mexico (834 | 1.5%), Asia (198 | 0.4%), and South Eastern Asia (144 | 0.3%), together accounting for 5.9% of all Anderson residents.
| Immigration Origin | # Population | % Population |
| Asia | 198 | 0.4% |
| Barbados | 7 | 0.0% |
| Belize | 27 | 0.1% |
| Caribbean | 14 | 0.0% |
| Central America | 1,007 | 1.8% |
| China | 4 | 0.0% |
| Colombia | 27 | 0.1% |
| Denmark | 13 | 0.0% |
| Eastern Asia | 10 | 0.0% |
| Eastern Europe | 18 | 0.0% |
| El Salvador | 103 | 0.2% |
| England | 16 | 0.0% |
| Europe | 79 | 0.1% |
| Germany | 28 | 0.1% |
| Guatemala | 28 | 0.1% |
| Honduras | 15 | 0.0% |
| India | 29 | 0.1% |
| Indonesia | 13 | 0.0% |
| Jordan | 15 | 0.0% |
| Korea | 6 | 0.0% |
| Latin America | 1,048 | 1.9% |
| Mexico | 834 | 1.5% |
| Netherlands | 4 | 0.0% |
| Northern Europe | 29 | 0.1% |
| Philippines | 3 | 0.0% |
| South America | 27 | 0.1% |
| South Central Asia | 29 | 0.1% |
| South Eastern Asia | 144 | 0.3% |
| Thailand | 28 | 0.1% |
| Trinidad and Tobago | 7 | 0.0% |
| Ukraine | 18 | 0.0% |
| Vietnam | 100 | 0.2% |
| Western Asia | 15 | 0.0% |
| Western Europe | 32 | 0.1% | View All 34 Rows |
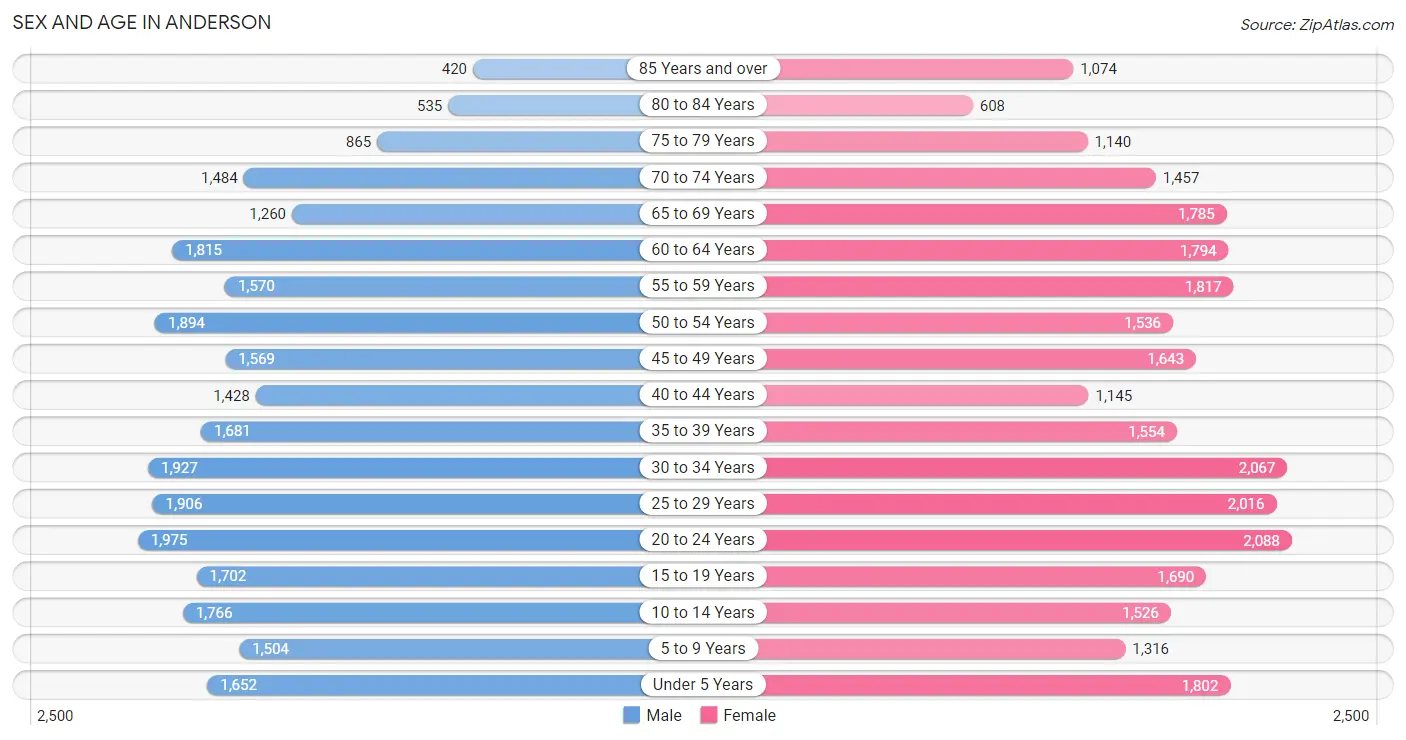
Sex and Age in Anderson
Sex and Age in Anderson
The most populous age groups in Anderson are 20 to 24 Years (1,975 | 7.3%) for men and 20 to 24 Years (2,088 | 7.4%) for women.
| Age Bracket | Male | Female |
| Under 5 Years | 1,652 (6.1%) | 1,802 (6.4%) |
| 5 to 9 Years | 1,504 (5.6%) | 1,316 (4.7%) |
| 10 to 14 Years | 1,766 (6.6%) | 1,526 (5.4%) |
| 15 to 19 Years | 1,702 (6.3%) | 1,690 (6.0%) |
| 20 to 24 Years | 1,975 (7.3%) | 2,088 (7.4%) |
| 25 to 29 Years | 1,906 (7.1%) | 2,016 (7.2%) |
| 30 to 34 Years | 1,927 (7.1%) | 2,067 (7.4%) |
| 35 to 39 Years | 1,681 (6.2%) | 1,554 (5.5%) |
| 40 to 44 Years | 1,428 (5.3%) | 1,145 (4.1%) |
| 45 to 49 Years | 1,569 (5.8%) | 1,643 (5.9%) |
| 50 to 54 Years | 1,894 (7.0%) | 1,536 (5.5%) |
| 55 to 59 Years | 1,570 (5.8%) | 1,817 (6.5%) |
| 60 to 64 Years | 1,815 (6.7%) | 1,794 (6.4%) |
| 65 to 69 Years | 1,260 (4.7%) | 1,785 (6.4%) |
| 70 to 74 Years | 1,484 (5.5%) | 1,457 (5.2%) |
| 75 to 79 Years | 865 (3.2%) | 1,140 (4.1%) |
| 80 to 84 Years | 535 (2.0%) | 608 (2.2%) |
| 85 Years and over | 420 (1.6%) | 1,074 (3.8%) |
| Total | 26,953 (100.0%) | 28,058 (100.0%) |
Families and Households in Anderson
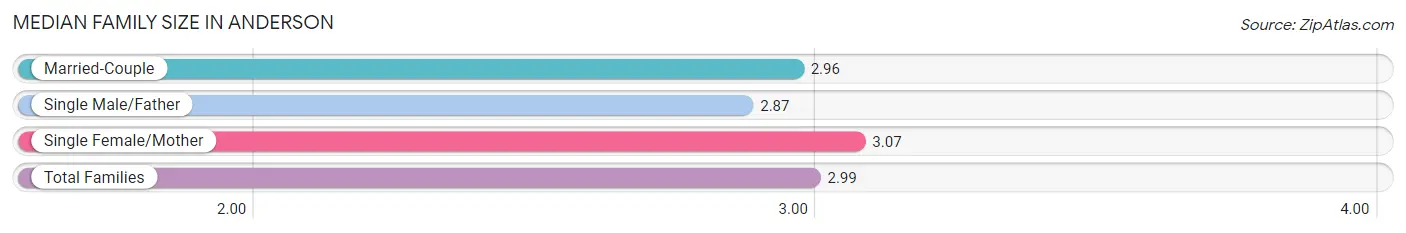
Median Family Size in Anderson
The median family size in Anderson is 2.99 persons per family, with single female/mother families (3,625 | 28.5%) accounting for the largest median family size of 3.07 persons per family. On the other hand, single male/father families (1,095 | 8.6%) represent the smallest median family size with 2.87 persons per family.
| Family Type | # Families | Family Size |
| Married-Couple | 7,988 (62.9%) | 2.96 |
| Single Male/Father | 1,095 (8.6%) | 2.87 |
| Single Female/Mother | 3,625 (28.5%) | 3.07 |
| Total Families | 12,708 (100.0%) | 2.99 |
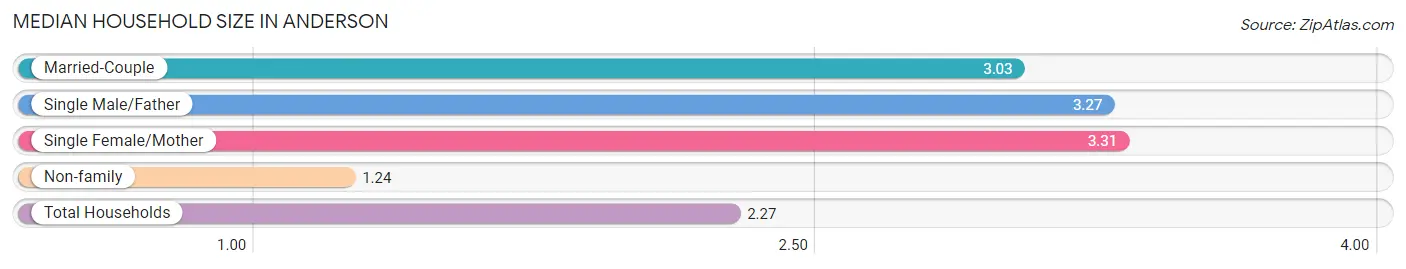
Median Household Size in Anderson
The median household size in Anderson is 2.27 persons per household, with single female/mother households (3,625 | 15.6%) accounting for the largest median household size of 3.31 persons per household. non-family households (10,571 | 45.4%) represent the smallest median household size with 1.24 persons per household.
| Household Type | # Households | Household Size |
| Married-Couple | 7,988 (34.3%) | 3.03 |
| Single Male/Father | 1,095 (4.7%) | 3.27 |
| Single Female/Mother | 3,625 (15.6%) | 3.31 |
| Non-family | 10,571 (45.4%) | 1.24 |
| Total Households | 23,279 (100.0%) | 2.27 |
Household Size by Marriage Status in Anderson
Out of a total of 23,279 households in Anderson, 12,708 (54.6%) are family households, while 10,571 (45.4%) are nonfamily households. The most numerous type of family households are 2-person households, comprising 6,050, and the most common type of nonfamily households are 1-person households, comprising 8,804.
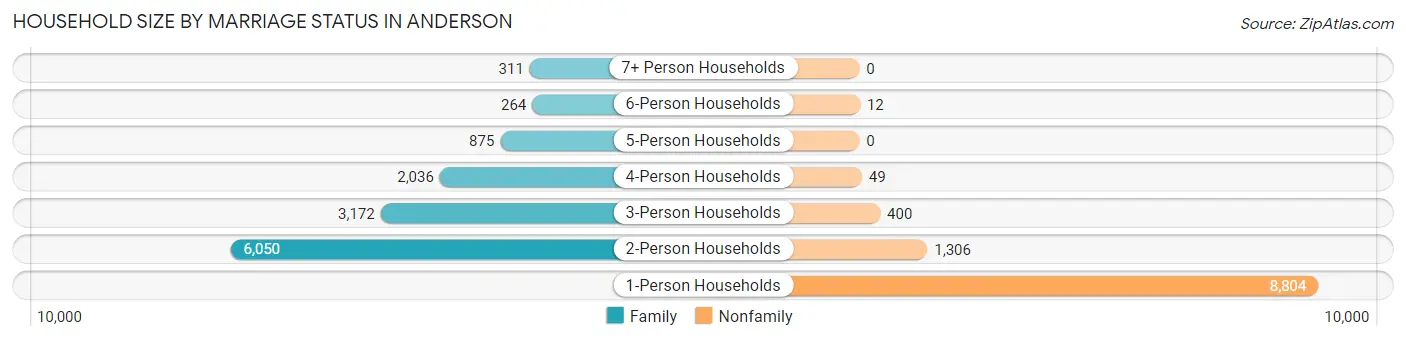
| Household Size | Family Households | Nonfamily Households |
| 1-Person Households | - | 8,804 (37.8%) |
| 2-Person Households | 6,050 (26.0%) | 1,306 (5.6%) |
| 3-Person Households | 3,172 (13.6%) | 400 (1.7%) |
| 4-Person Households | 2,036 (8.7%) | 49 (0.2%) |
| 5-Person Households | 875 (3.8%) | 0 (0.0%) |
| 6-Person Households | 264 (1.1%) | 12 (0.1%) |
| 7+ Person Households | 311 (1.3%) | 0 (0.0%) |
| Total | 12,708 (54.6%) | 10,571 (45.4%) |
Female Fertility in Anderson
Fertility by Age in Anderson
Average fertility rate in Anderson is 46.0 births per 1,000 women. Women in the age bracket of 20 to 34 years have the highest fertility rate with 81.0 births per 1,000 women. Women in the age bracket of 20 to 34 years acount for 86.4% of all women with births.
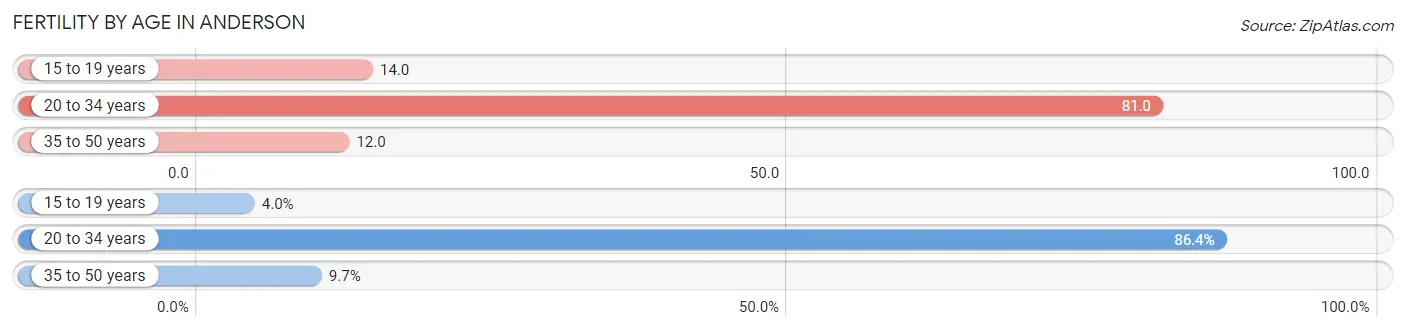
| Age Bracket | Women with Births | Births / 1,000 Women |
| 15 to 19 years | 23 (4.0%) | 14.0 |
| 20 to 34 years | 501 (86.4%) | 81.0 |
| 35 to 50 years | 56 (9.7%) | 12.0 |
| Total | 580 (100.0%) | 46.0 |
Fertility by Age by Marriage Status in Anderson
45.5% of women with births (580) in Anderson are married. The highest percentage of unmarried women with births falls into 15 to 19 years age bracket with 100.0% of them unmarried at the time of birth, while the lowest percentage of unmarried women with births belong to 35 to 50 years age bracket with 35.7% of them unmarried.
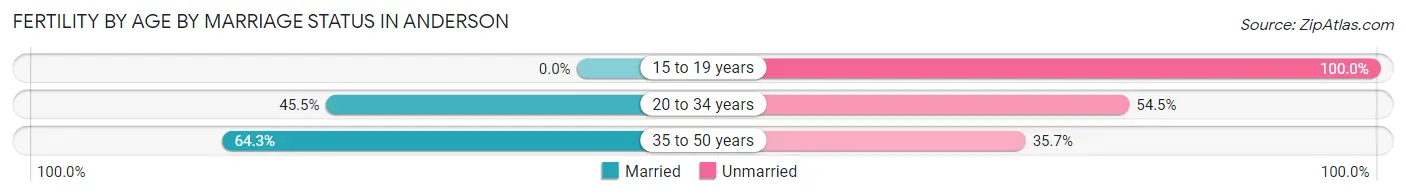
| Age Bracket | Married | Unmarried |
| 15 to 19 years | 0 (0.0%) | 23 (100.0%) |
| 20 to 34 years | 228 (45.5%) | 273 (54.5%) |
| 35 to 50 years | 36 (64.3%) | 20 (35.7%) |
| Total | 264 (45.5%) | 316 (54.5%) |
Fertility by Education in Anderson
Average fertility rate in Anderson is 46.0 births per 1,000 women. Women with the education attainment of college or associate's degree have the highest fertility rate of 52.0 births per 1,000 women, while women with the education attainment of graduate degree have the lowest fertility at 23.0 births per 1,000 women. Women with the education attainment of college or associate's degree represent 36.7% of all women with births.
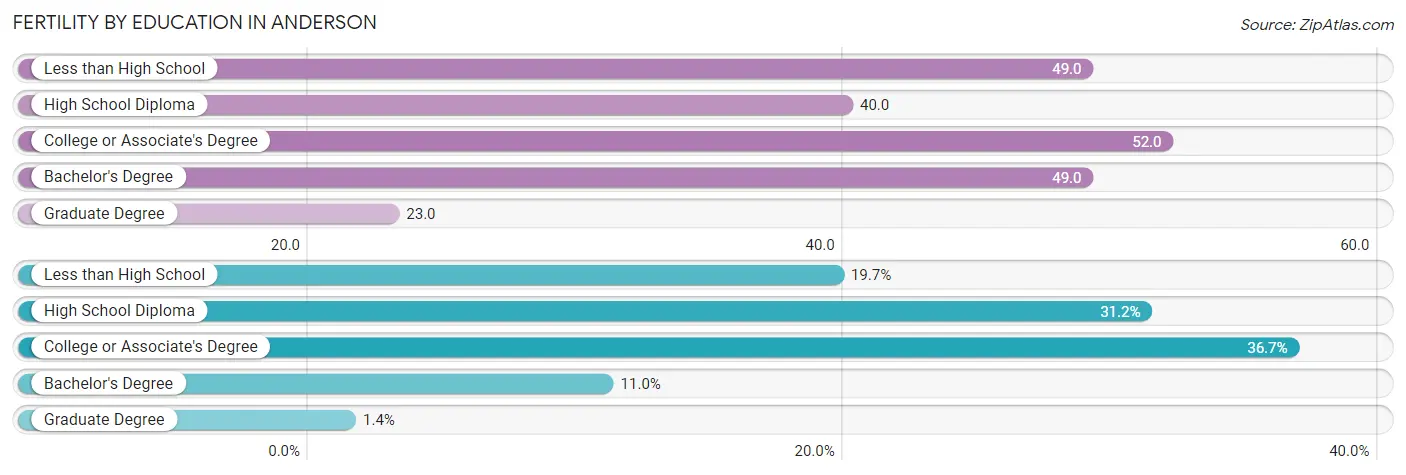
| Educational Attainment | Women with Births | Births / 1,000 Women |
| Less than High School | 114 (19.7%) | 49.0 |
| High School Diploma | 181 (31.2%) | 40.0 |
| College or Associate's Degree | 213 (36.7%) | 52.0 |
| Bachelor's Degree | 64 (11.0%) | 49.0 |
| Graduate Degree | 8 (1.4%) | 23.0 |
| Total | 580 (100.0%) | 46.0 |
Fertility by Education by Marriage Status in Anderson
54.5% of women with births in Anderson are unmarried. Women with the educational attainment of bachelor's degree are most likely to be married with 100.0% of them married at childbirth, while women with the educational attainment of less than high school are least likely to be married with 82.5% of them unmarried at childbirth.
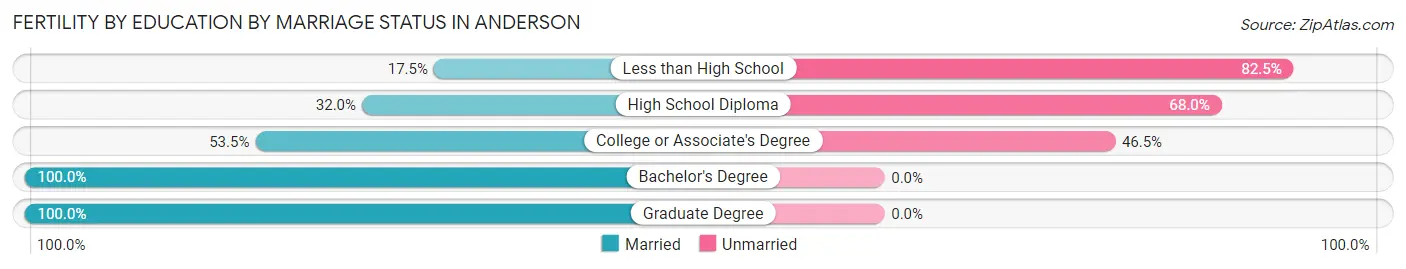
| Educational Attainment | Married | Unmarried |
| Less than High School | 20 (17.5%) | 94 (82.5%) |
| High School Diploma | 58 (32.0%) | 123 (68.0%) |
| College or Associate's Degree | 114 (53.5%) | 99 (46.5%) |
| Bachelor's Degree | 64 (100.0%) | 0 (0.0%) |
| Graduate Degree | 8 (100.0%) | 0 (0.0%) |
| Total | 264 (45.5%) | 316 (54.5%) |
Employment Characteristics in Anderson
Employment by Class of Employer in Anderson
Among the 23,277 employed individuals in Anderson, private company employees (17,812 | 76.5%), not-for-profit organizations (2,052 | 8.8%), and local government employees (1,059 | 4.5%) make up the most common classes of employment.
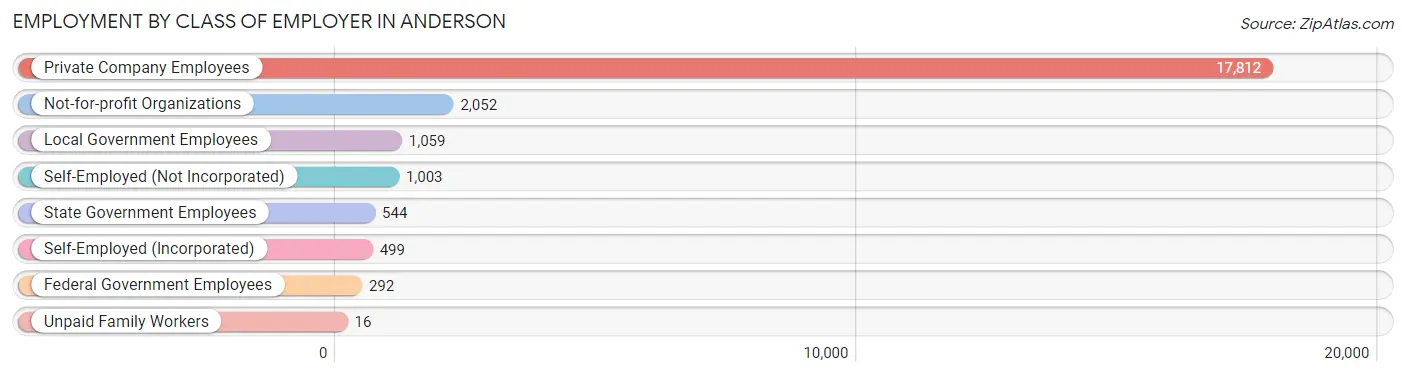
| Employer Class | # Employees | % Employees |
| Private Company Employees | 17,812 | 76.5% |
| Self-Employed (Incorporated) | 499 | 2.1% |
| Self-Employed (Not Incorporated) | 1,003 | 4.3% |
| Not-for-profit Organizations | 2,052 | 8.8% |
| Local Government Employees | 1,059 | 4.5% |
| State Government Employees | 544 | 2.3% |
| Federal Government Employees | 292 | 1.3% |
| Unpaid Family Workers | 16 | 0.1% |
| Total | 23,277 | 100.0% |
Employment Status by Age in Anderson
According to the labor force statistics for Anderson, out of the total population over 16 years of age (44,831), 57.2% or 25,643 individuals are in the labor force, with 7.0% or 1,795 of them unemployed. The age group with the highest labor force participation rate is 25 to 29 years, with 86.0% or 3,373 individuals in the labor force. Within the labor force, the 16 to 19 years age range has the highest percentage of unemployed individuals, with 16.3% or 226 of them being unemployed.
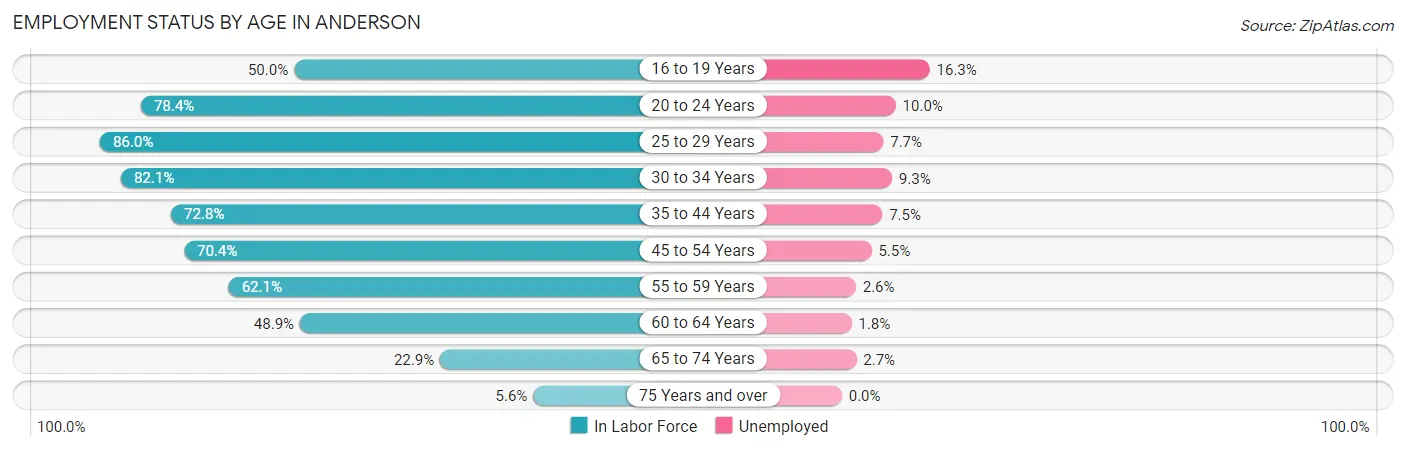
| Age Bracket | In Labor Force | Unemployed |
| 16 to 19 Years | 1,389 (50.0%) | 226 (16.3%) |
| 20 to 24 Years | 3,185 (78.4%) | 318 (10.0%) |
| 25 to 29 Years | 3,373 (86.0%) | 260 (7.7%) |
| 30 to 34 Years | 3,279 (82.1%) | 305 (9.3%) |
| 35 to 44 Years | 4,228 (72.8%) | 317 (7.5%) |
| 45 to 54 Years | 4,676 (70.4%) | 257 (5.5%) |
| 55 to 59 Years | 2,103 (62.1%) | 55 (2.6%) |
| 60 to 64 Years | 1,765 (48.9%) | 32 (1.8%) |
| 65 to 74 Years | 1,371 (22.9%) | 37 (2.7%) |
| 75 Years and over | 260 (5.6%) | 0 (0.0%) |
| Total | 25,643 (57.2%) | 1,795 (7.0%) |
Employment Status by Educational Attainment in Anderson
According to labor force statistics for Anderson, 71.0% of individuals (19,427) out of the total population between 25 and 64 years of age (27,362) are in the labor force, with 6.3% or 1,224 of them being unemployed. The group with the highest labor force participation rate are those with the educational attainment of bachelor's degree or higher, with 85.1% or 3,473 individuals in the labor force. Within the labor force, individuals with less than high school education have the highest percentage of unemployment, with 14.9% or 277 of them being unemployed.
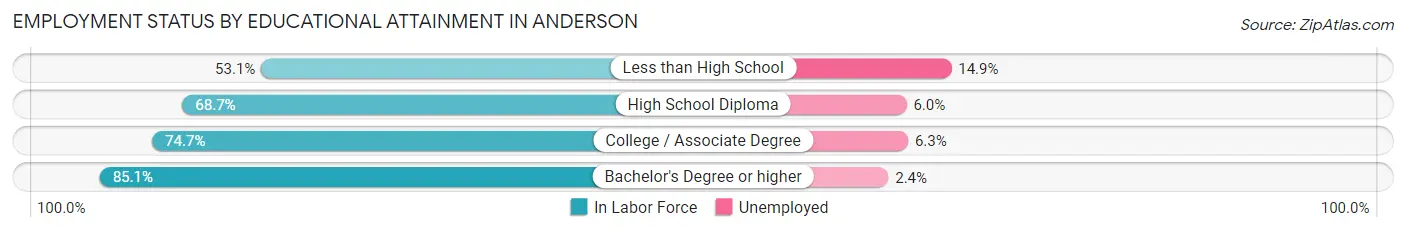
| Educational Attainment | In Labor Force | Unemployed |
| Less than High School | 1,860 (53.1%) | 522 (14.9%) |
| High School Diploma | 7,863 (68.7%) | 687 (6.0%) |
| College / Associate Degree | 6,225 (74.7%) | 525 (6.3%) |
| Bachelor's Degree or higher | 3,473 (85.1%) | 98 (2.4%) |
| Total | 19,427 (71.0%) | 1,724 (6.3%) |
Employment Occupations by Sex in Anderson
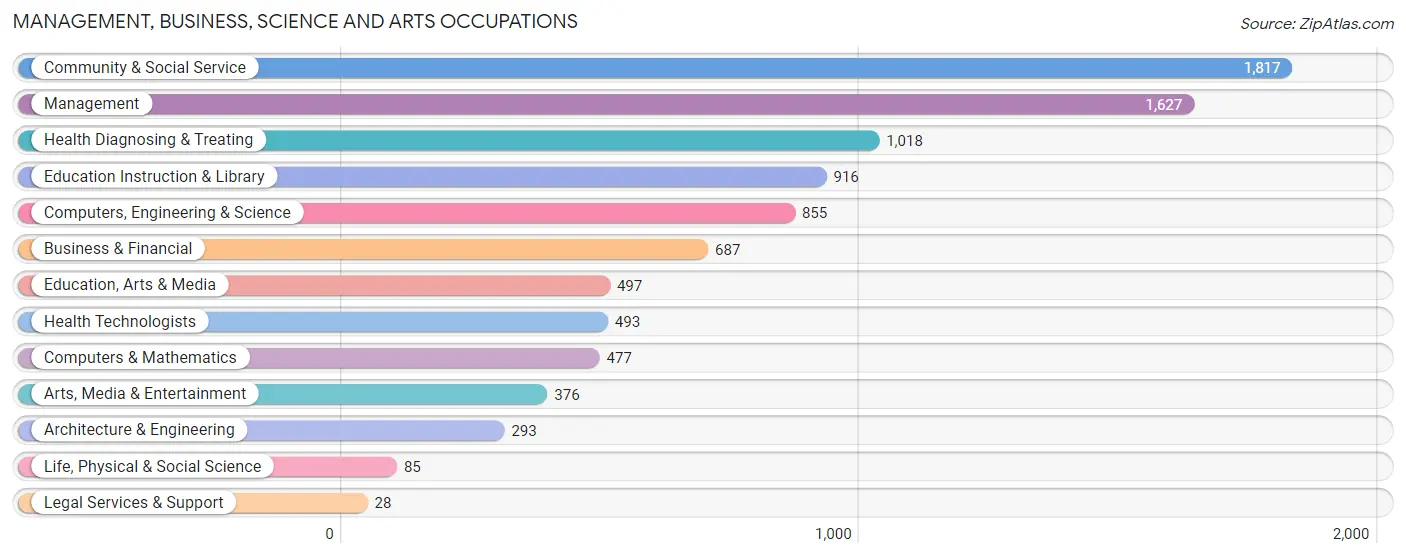
Management, Business, Science and Arts Occupations
The most common Management, Business, Science and Arts occupations in Anderson are Community & Social Service (1,817 | 7.6%), Management (1,627 | 6.8%), Health Diagnosing & Treating (1,018 | 4.3%), Education Instruction & Library (916 | 3.8%), and Computers, Engineering & Science (855 | 3.6%).
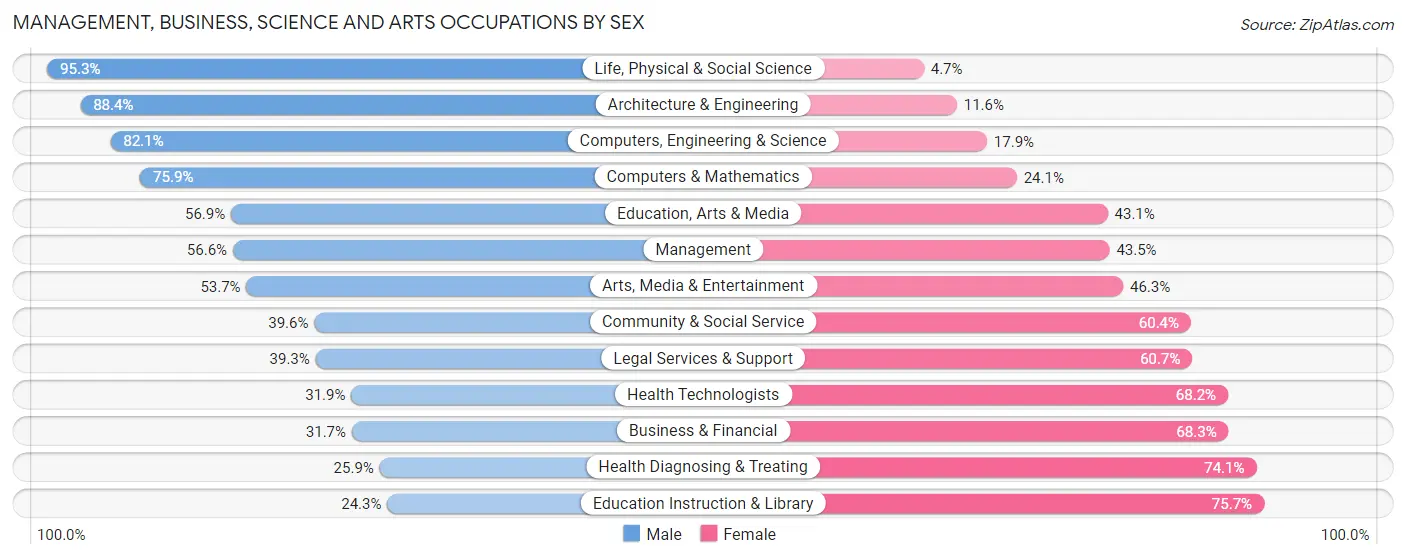
Management, Business, Science and Arts Occupations by Sex
Within the Management, Business, Science and Arts occupations in Anderson, the most male-oriented occupations are Life, Physical & Social Science (95.3%), Architecture & Engineering (88.4%), and Computers, Engineering & Science (82.1%), while the most female-oriented occupations are Education Instruction & Library (75.7%), Health Diagnosing & Treating (74.1%), and Business & Financial (68.3%).
| Occupation | Male | Female |
| Management | 920 (56.6%) | 707 (43.4%) |
| Business & Financial | 218 (31.7%) | 469 (68.3%) |
| Computers, Engineering & Science | 702 (82.1%) | 153 (17.9%) |
| Computers & Mathematics | 362 (75.9%) | 115 (24.1%) |
| Architecture & Engineering | 259 (88.4%) | 34 (11.6%) |
| Life, Physical & Social Science | 81 (95.3%) | 4 (4.7%) |
| Community & Social Service | 719 (39.6%) | 1,098 (60.4%) |
| Education, Arts & Media | 283 (56.9%) | 214 (43.1%) |
| Legal Services & Support | 11 (39.3%) | 17 (60.7%) |
| Education Instruction & Library | 223 (24.3%) | 693 (75.7%) |
| Arts, Media & Entertainment | 202 (53.7%) | 174 (46.3%) |
| Health Diagnosing & Treating | 264 (25.9%) | 754 (74.1%) |
| Health Technologists | 157 (31.9%) | 336 (68.1%) |
| Total (Category) | 2,823 (47.0%) | 3,181 (53.0%) |
| Total (Overall) | 12,483 (52.4%) | 11,319 (47.5%) |
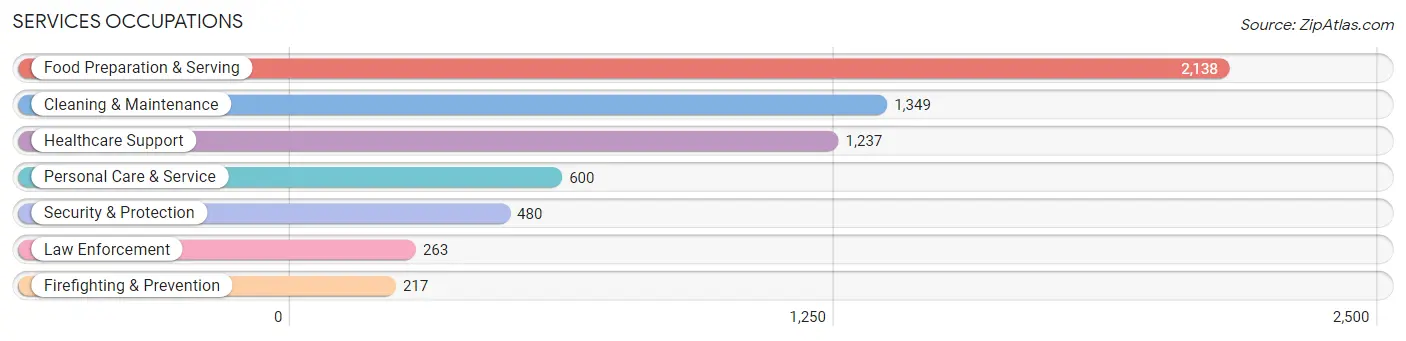
Services Occupations
The most common Services occupations in Anderson are Food Preparation & Serving (2,138 | 9.0%), Cleaning & Maintenance (1,349 | 5.7%), Healthcare Support (1,237 | 5.2%), Personal Care & Service (600 | 2.5%), and Security & Protection (480 | 2.0%).
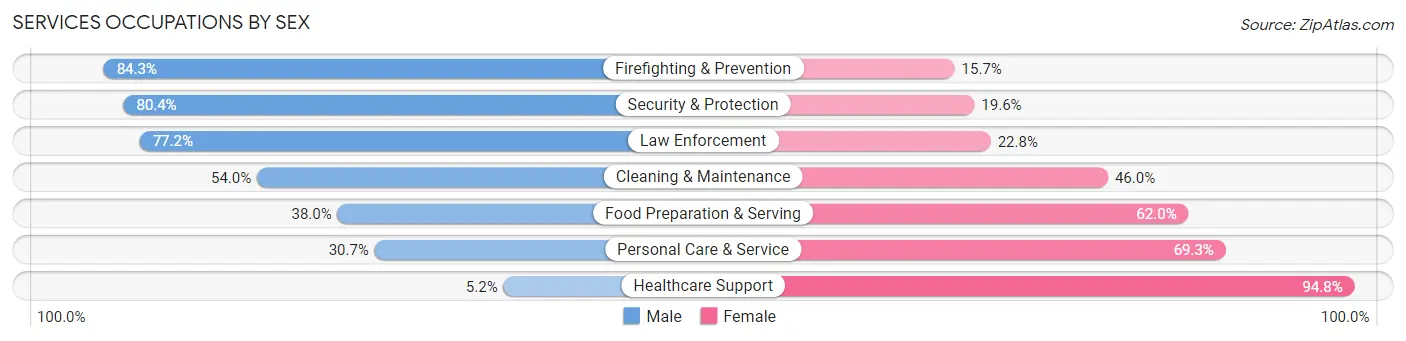
Services Occupations by Sex
Within the Services occupations in Anderson, the most male-oriented occupations are Firefighting & Prevention (84.3%), Security & Protection (80.4%), and Law Enforcement (77.2%), while the most female-oriented occupations are Healthcare Support (94.8%), Personal Care & Service (69.3%), and Food Preparation & Serving (62.0%).
| Occupation | Male | Female |
| Healthcare Support | 64 (5.2%) | 1,173 (94.8%) |
| Security & Protection | 386 (80.4%) | 94 (19.6%) |
| Firefighting & Prevention | 183 (84.3%) | 34 (15.7%) |
| Law Enforcement | 203 (77.2%) | 60 (22.8%) |
| Food Preparation & Serving | 813 (38.0%) | 1,325 (62.0%) |
| Cleaning & Maintenance | 728 (54.0%) | 621 (46.0%) |
| Personal Care & Service | 184 (30.7%) | 416 (69.3%) |
| Total (Category) | 2,175 (37.5%) | 3,629 (62.5%) |
| Total (Overall) | 12,483 (52.4%) | 11,319 (47.5%) |
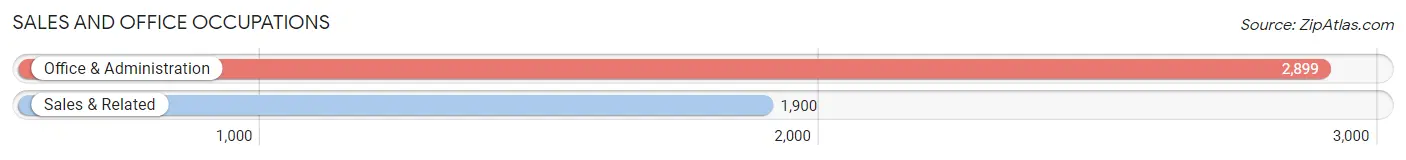
Sales and Office Occupations
The most common Sales and Office occupations in Anderson are Office & Administration (2,899 | 12.2%), and Sales & Related (1,900 | 8.0%).
Sales and Office Occupations by Sex
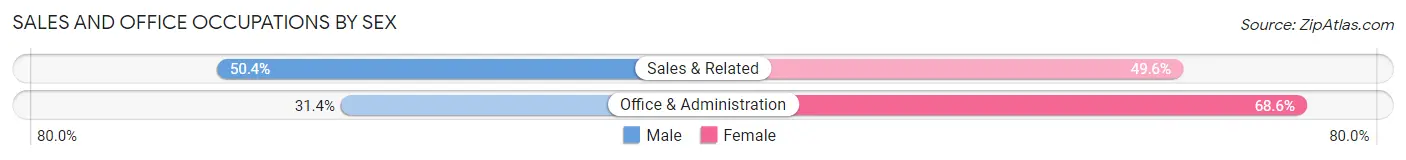
| Occupation | Male | Female |
| Sales & Related | 958 (50.4%) | 942 (49.6%) |
| Office & Administration | 909 (31.4%) | 1,990 (68.6%) |
| Total (Category) | 1,867 (38.9%) | 2,932 (61.1%) |
| Total (Overall) | 12,483 (52.4%) | 11,319 (47.5%) |
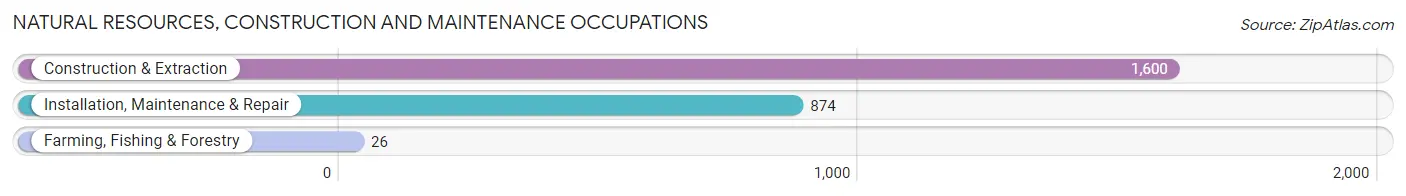
Natural Resources, Construction and Maintenance Occupations
The most common Natural Resources, Construction and Maintenance occupations in Anderson are Construction & Extraction (1,600 | 6.7%), Installation, Maintenance & Repair (874 | 3.7%), and Farming, Fishing & Forestry (26 | 0.1%).
Natural Resources, Construction and Maintenance Occupations by Sex
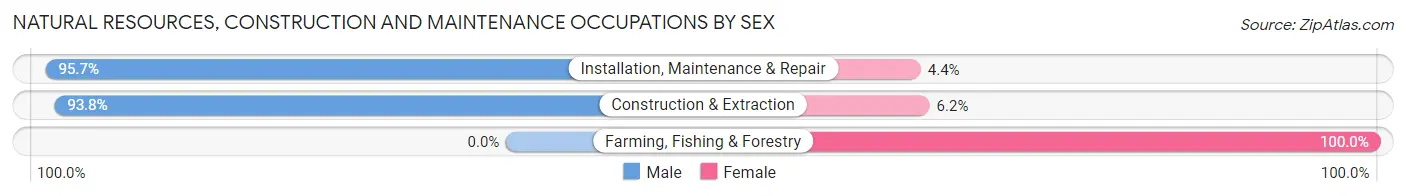
| Occupation | Male | Female |
| Farming, Fishing & Forestry | 0 (0.0%) | 26 (100.0%) |
| Construction & Extraction | 1,501 (93.8%) | 99 (6.2%) |
| Installation, Maintenance & Repair | 836 (95.7%) | 38 (4.3%) |
| Total (Category) | 2,337 (93.5%) | 163 (6.5%) |
| Total (Overall) | 12,483 (52.4%) | 11,319 (47.5%) |
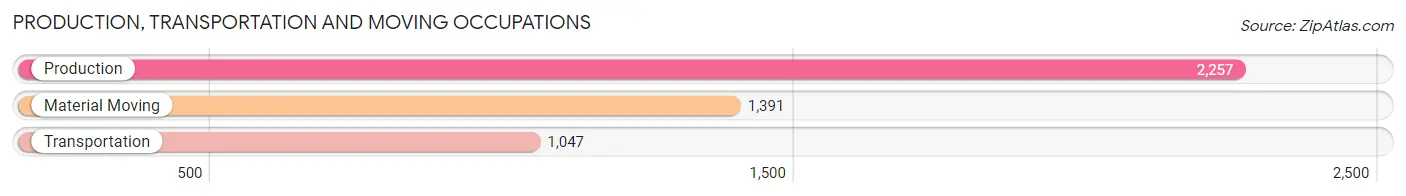
Production, Transportation and Moving Occupations
The most common Production, Transportation and Moving occupations in Anderson are Production (2,257 | 9.5%), Material Moving (1,391 | 5.8%), and Transportation (1,047 | 4.4%).
Production, Transportation and Moving Occupations by Sex
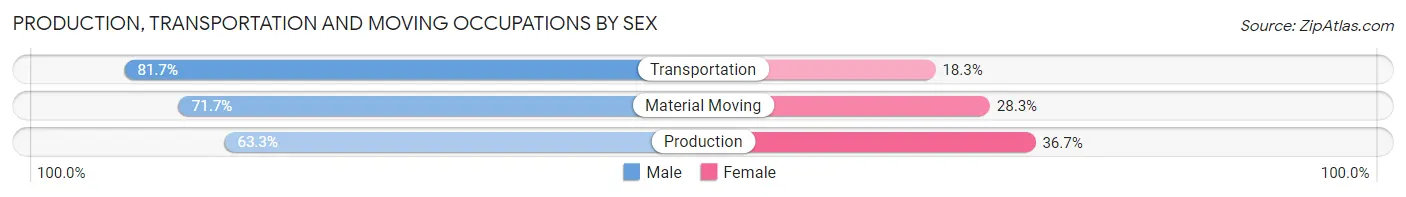
| Occupation | Male | Female |
| Production | 1,429 (63.3%) | 828 (36.7%) |
| Transportation | 855 (81.7%) | 192 (18.3%) |
| Material Moving | 997 (71.7%) | 394 (28.3%) |
| Total (Category) | 3,281 (69.9%) | 1,414 (30.1%) |
| Total (Overall) | 12,483 (52.4%) | 11,319 (47.5%) |
Employment Industries by Sex in Anderson
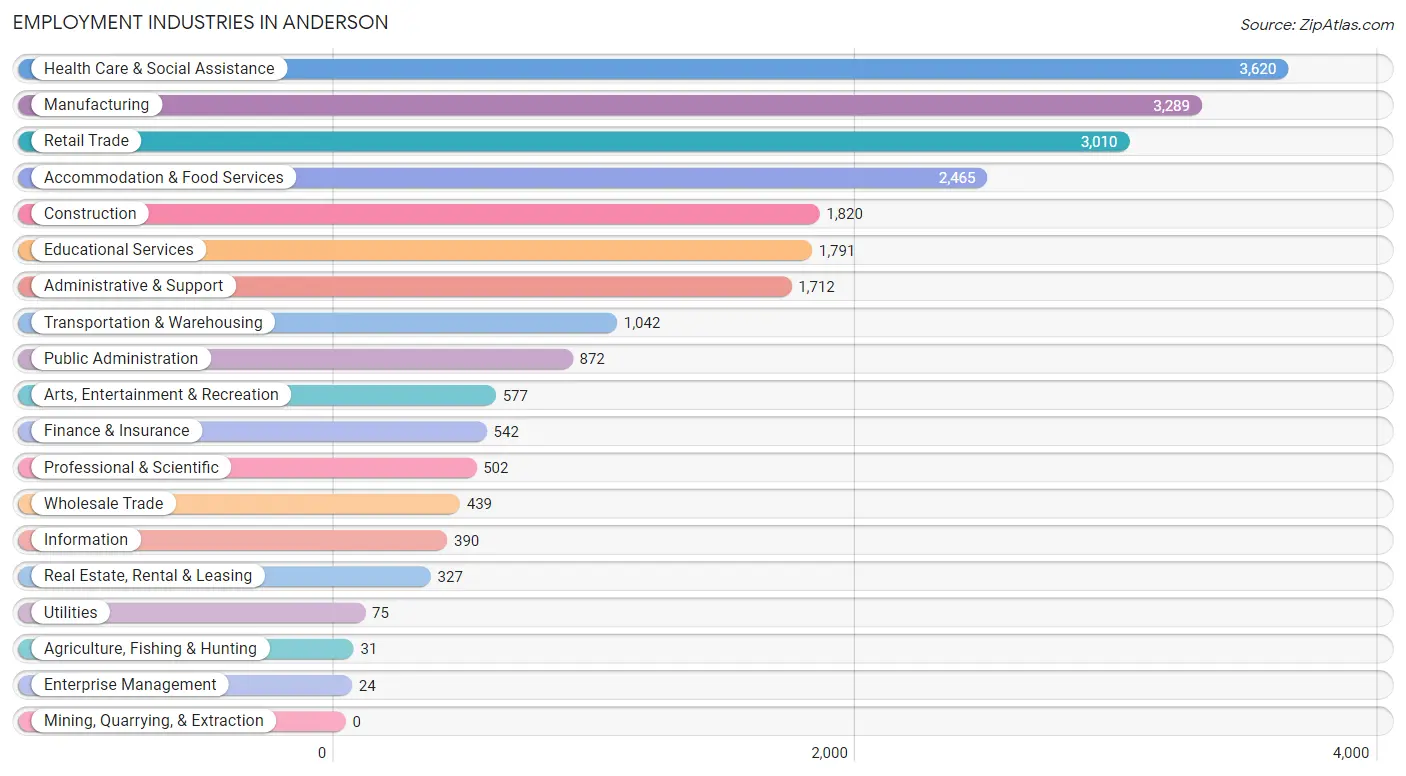
Employment Industries in Anderson
The major employment industries in Anderson include Health Care & Social Assistance (3,620 | 15.2%), Manufacturing (3,289 | 13.8%), Retail Trade (3,010 | 12.7%), Accommodation & Food Services (2,465 | 10.4%), and Construction (1,820 | 7.6%).
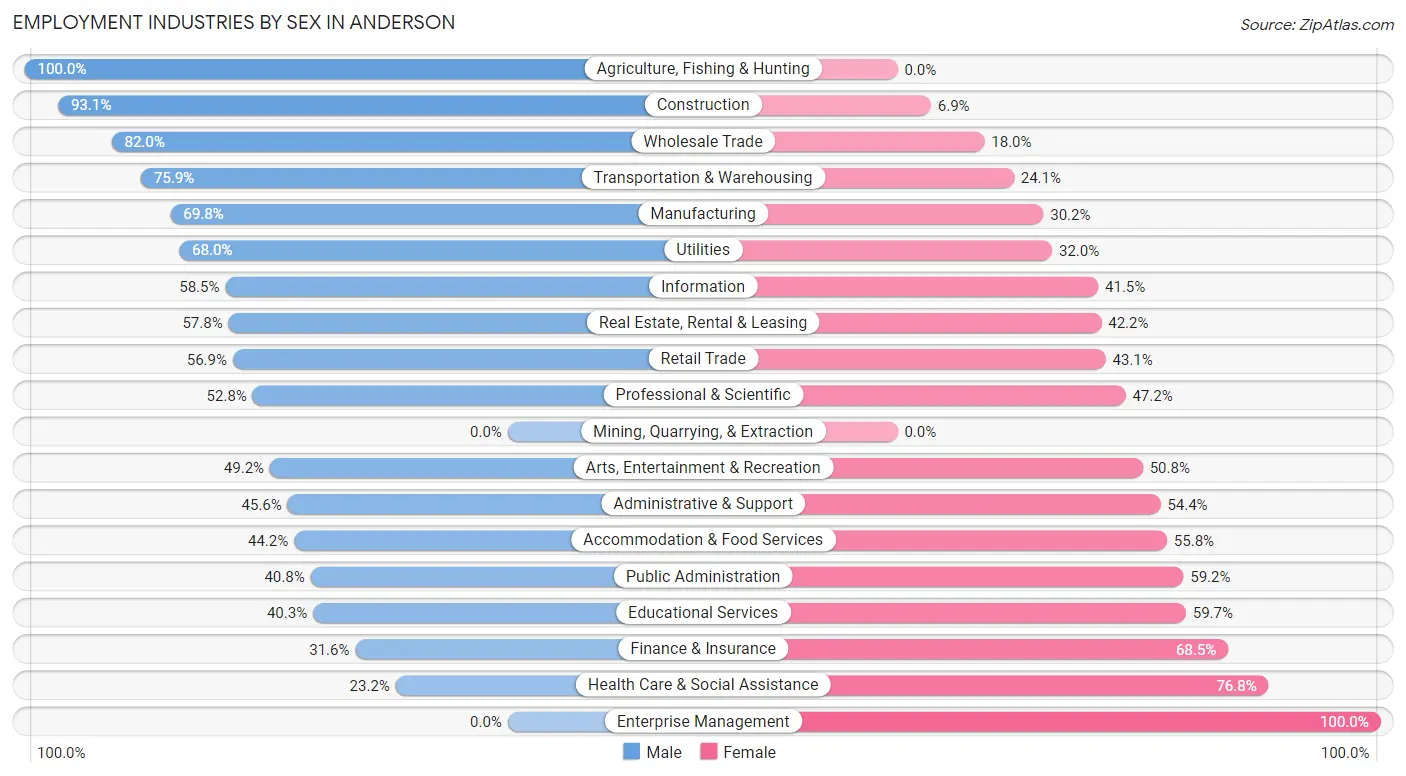
Employment Industries by Sex in Anderson
The Anderson industries that see more men than women are Agriculture, Fishing & Hunting (100.0%), Construction (93.1%), and Wholesale Trade (82.0%), whereas the industries that tend to have a higher number of women are Enterprise Management (100.0%), Health Care & Social Assistance (76.8%), and Finance & Insurance (68.4%).
| Industry | Male | Female |
| Agriculture, Fishing & Hunting | 31 (100.0%) | 0 (0.0%) |
| Mining, Quarrying, & Extraction | 0 (0.0%) | 0 (0.0%) |
| Construction | 1,694 (93.1%) | 126 (6.9%) |
| Manufacturing | 2,296 (69.8%) | 993 (30.2%) |
| Wholesale Trade | 360 (82.0%) | 79 (18.0%) |
| Retail Trade | 1,713 (56.9%) | 1,297 (43.1%) |
| Transportation & Warehousing | 791 (75.9%) | 251 (24.1%) |
| Utilities | 51 (68.0%) | 24 (32.0%) |
| Information | 228 (58.5%) | 162 (41.5%) |
| Finance & Insurance | 171 (31.6%) | 371 (68.4%) |
| Real Estate, Rental & Leasing | 189 (57.8%) | 138 (42.2%) |
| Professional & Scientific | 265 (52.8%) | 237 (47.2%) |
| Enterprise Management | 0 (0.0%) | 24 (100.0%) |
| Administrative & Support | 780 (45.6%) | 932 (54.4%) |
| Educational Services | 722 (40.3%) | 1,069 (59.7%) |
| Health Care & Social Assistance | 840 (23.2%) | 2,780 (76.8%) |
| Arts, Entertainment & Recreation | 284 (49.2%) | 293 (50.8%) |
| Accommodation & Food Services | 1,090 (44.2%) | 1,375 (55.8%) |
| Public Administration | 356 (40.8%) | 516 (59.2%) |
| Total | 12,483 (52.4%) | 11,319 (47.5%) |
Education in Anderson
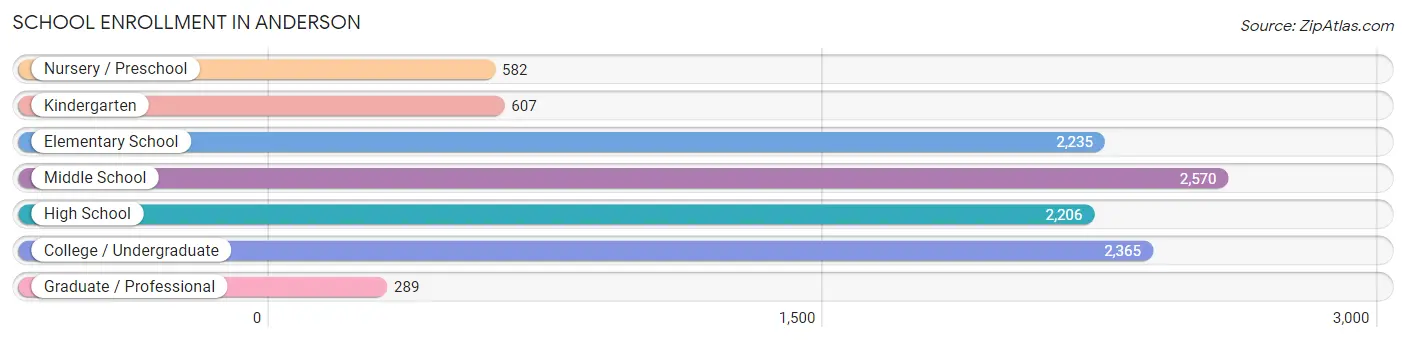
School Enrollment in Anderson
The most common levels of schooling among the 10,854 students in Anderson are middle school (2,570 | 23.7%), college / undergraduate (2,365 | 21.8%), and elementary school (2,235 | 20.6%).
| School Level | # Students | % Students |
| Nursery / Preschool | 582 | 5.4% |
| Kindergarten | 607 | 5.6% |
| Elementary School | 2,235 | 20.6% |
| Middle School | 2,570 | 23.7% |
| High School | 2,206 | 20.3% |
| College / Undergraduate | 2,365 | 21.8% |
| Graduate / Professional | 289 | 2.7% |
| Total | 10,854 | 100.0% |
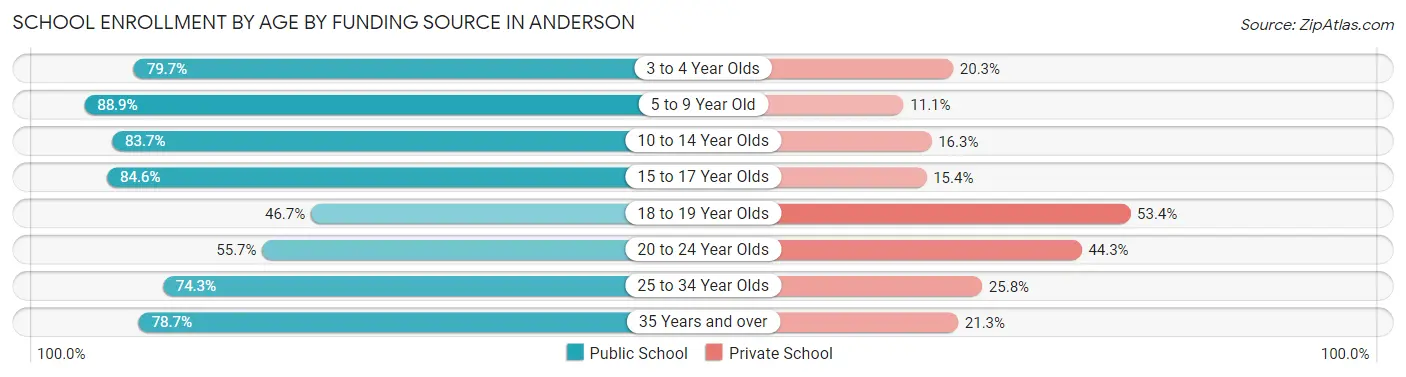
School Enrollment by Age by Funding Source in Anderson
Out of a total of 10,854 students who are enrolled in schools in Anderson, 2,410 (22.2%) attend a private institution, while the remaining 8,444 (77.8%) are enrolled in public schools. The age group of 18 to 19 year olds has the highest likelihood of being enrolled in private schools, with 541 (53.3% in the age bracket) enrolled. Conversely, the age group of 5 to 9 year old has the lowest likelihood of being enrolled in a private school, with 2,262 (88.9% in the age bracket) attending a public institution.
| Age Bracket | Public School | Private School |
| 3 to 4 Year Olds | 282 (79.7%) | 72 (20.3%) |
| 5 to 9 Year Old | 2,262 (88.9%) | 283 (11.1%) |
| 10 to 14 Year Olds | 2,551 (83.7%) | 497 (16.3%) |
| 15 to 17 Year Olds | 1,436 (84.6%) | 261 (15.4%) |
| 18 to 19 Year Olds | 473 (46.7%) | 541 (53.3%) |
| 20 to 24 Year Olds | 644 (55.7%) | 512 (44.3%) |
| 25 to 34 Year Olds | 444 (74.3%) | 154 (25.8%) |
| 35 Years and over | 348 (78.7%) | 94 (21.3%) |
| Total | 8,444 (77.8%) | 2,410 (22.2%) |
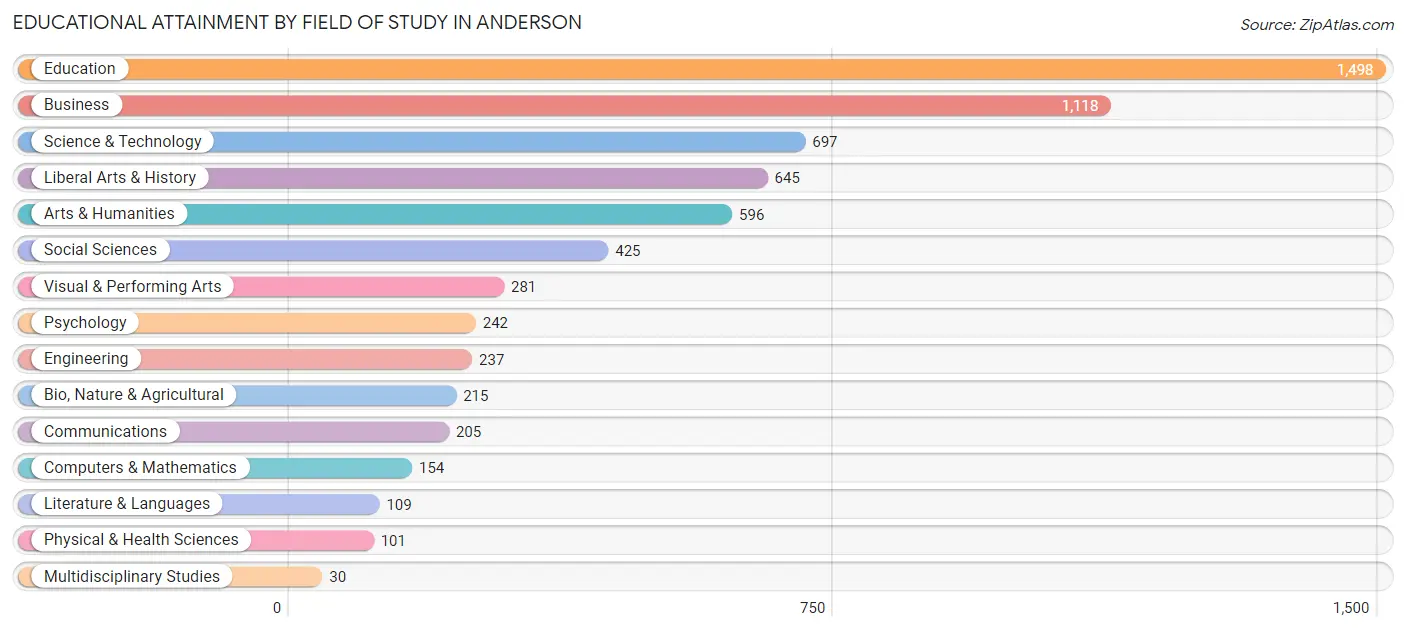
Educational Attainment by Field of Study in Anderson
Education (1,498 | 22.9%), business (1,118 | 17.1%), science & technology (697 | 10.6%), liberal arts & history (645 | 9.8%), and arts & humanities (596 | 9.1%) are the most common fields of study among 6,553 individuals in Anderson who have obtained a bachelor's degree or higher.
| Field of Study | # Graduates | % Graduates |
| Computers & Mathematics | 154 | 2.4% |
| Bio, Nature & Agricultural | 215 | 3.3% |
| Physical & Health Sciences | 101 | 1.5% |
| Psychology | 242 | 3.7% |
| Social Sciences | 425 | 6.5% |
| Engineering | 237 | 3.6% |
| Multidisciplinary Studies | 30 | 0.5% |
| Science & Technology | 697 | 10.6% |
| Business | 1,118 | 17.1% |
| Education | 1,498 | 22.9% |
| Literature & Languages | 109 | 1.7% |
| Liberal Arts & History | 645 | 9.8% |
| Visual & Performing Arts | 281 | 4.3% |
| Communications | 205 | 3.1% |
| Arts & Humanities | 596 | 9.1% |
| Total | 6,553 | 100.0% |
Transportation & Commute in Anderson
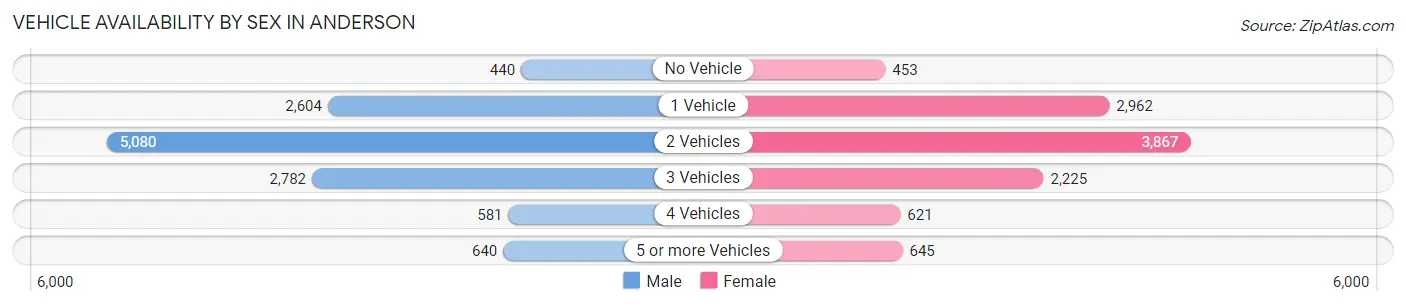
Vehicle Availability by Sex in Anderson
The most prevalent vehicle ownership categories in Anderson are males with 2 vehicles (5,080, accounting for 41.9%) and females with 2 vehicles (3,867, making up 47.1%).
| Vehicles Available | Male | Female |
| No Vehicle | 440 (3.6%) | 453 (4.2%) |
| 1 Vehicle | 2,604 (21.5%) | 2,962 (27.5%) |
| 2 Vehicles | 5,080 (41.9%) | 3,867 (35.9%) |
| 3 Vehicles | 2,782 (22.9%) | 2,225 (20.6%) |
| 4 Vehicles | 581 (4.8%) | 621 (5.8%) |
| 5 or more Vehicles | 640 (5.3%) | 645 (6.0%) |
| Total | 12,127 (100.0%) | 10,773 (100.0%) |
Commute Time in Anderson
The most frequently occuring commute durations in Anderson are 10 to 14 minutes (3,421 commuters, 15.8%), 5 to 9 minutes (3,087 commuters, 14.2%), and 15 to 19 minutes (2,697 commuters, 12.4%).
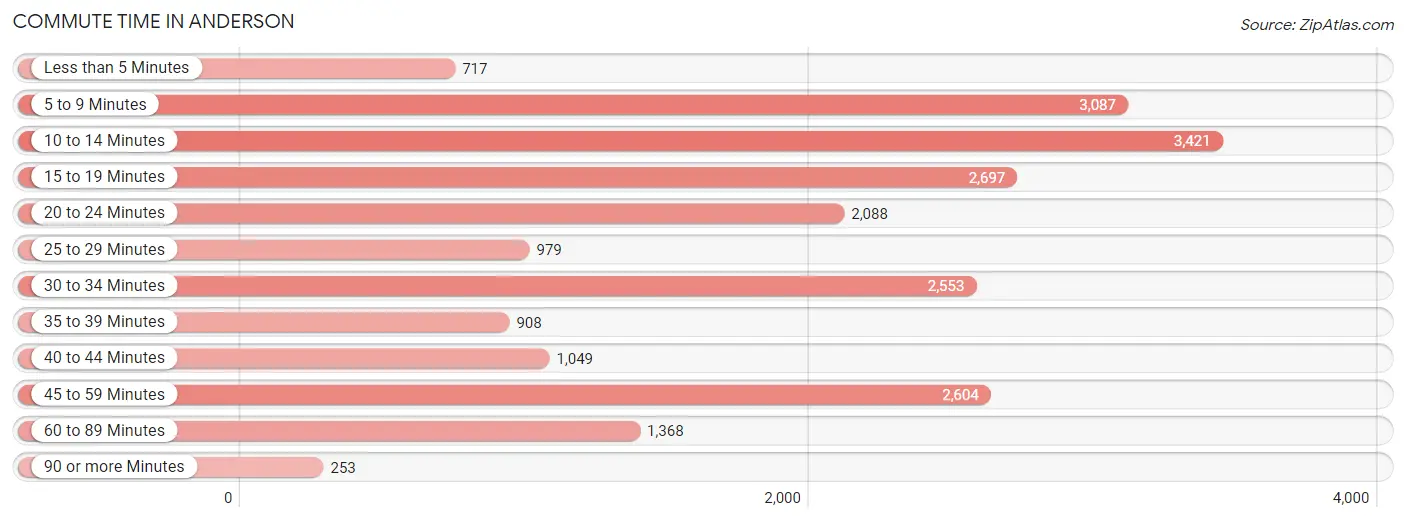
| Commute Time | # Commuters | % Commuters |
| Less than 5 Minutes | 717 | 3.3% |
| 5 to 9 Minutes | 3,087 | 14.2% |
| 10 to 14 Minutes | 3,421 | 15.8% |
| 15 to 19 Minutes | 2,697 | 12.4% |
| 20 to 24 Minutes | 2,088 | 9.6% |
| 25 to 29 Minutes | 979 | 4.5% |
| 30 to 34 Minutes | 2,553 | 11.7% |
| 35 to 39 Minutes | 908 | 4.2% |
| 40 to 44 Minutes | 1,049 | 4.8% |
| 45 to 59 Minutes | 2,604 | 12.0% |
| 60 to 89 Minutes | 1,368 | 6.3% |
| 90 or more Minutes | 253 | 1.2% |
Commute Time by Sex in Anderson
The most common commute times in Anderson are 30 to 34 minutes (1,668 commuters, 14.3%) for males and 10 to 14 minutes (1,758 commuters, 17.5%) for females.
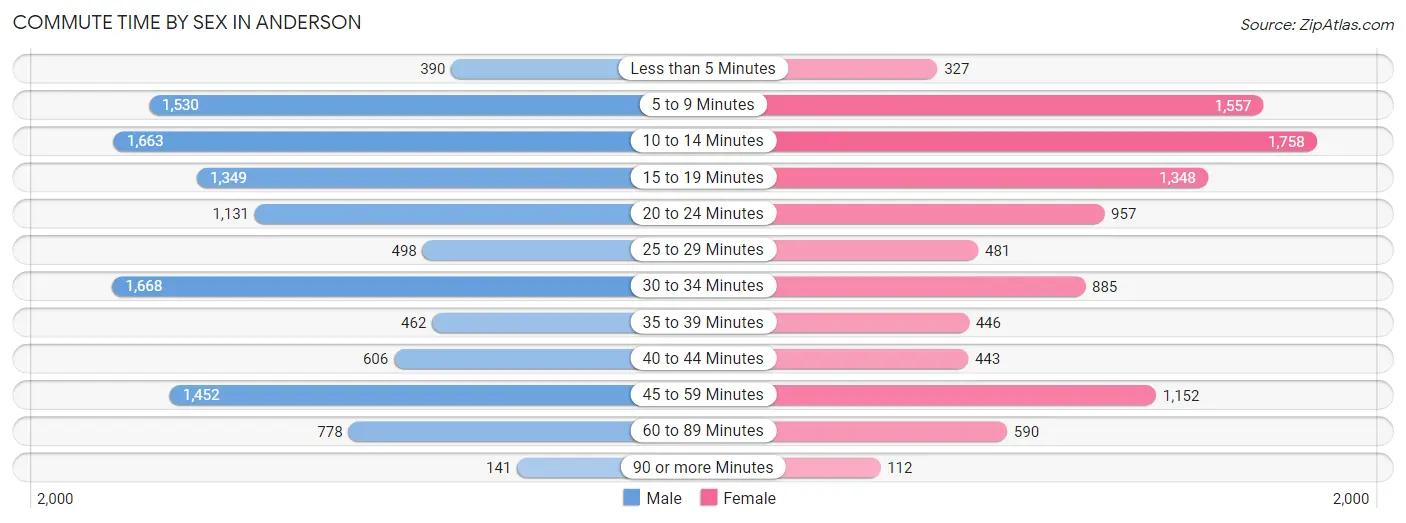
| Commute Time | Male | Female |
| Less than 5 Minutes | 390 (3.3%) | 327 (3.3%) |
| 5 to 9 Minutes | 1,530 (13.1%) | 1,557 (15.5%) |
| 10 to 14 Minutes | 1,663 (14.2%) | 1,758 (17.5%) |
| 15 to 19 Minutes | 1,349 (11.6%) | 1,348 (13.4%) |
| 20 to 24 Minutes | 1,131 (9.7%) | 957 (9.5%) |
| 25 to 29 Minutes | 498 (4.3%) | 481 (4.8%) |
| 30 to 34 Minutes | 1,668 (14.3%) | 885 (8.8%) |
| 35 to 39 Minutes | 462 (4.0%) | 446 (4.4%) |
| 40 to 44 Minutes | 606 (5.2%) | 443 (4.4%) |
| 45 to 59 Minutes | 1,452 (12.4%) | 1,152 (11.5%) |
| 60 to 89 Minutes | 778 (6.7%) | 590 (5.9%) |
| 90 or more Minutes | 141 (1.2%) | 112 (1.1%) |
Time of Departure to Work by Sex in Anderson
The most frequent times of departure to work in Anderson are 4:00 PM to 11:59 PM (1,373, 11.8%) for males and 7:00 AM to 7:29 AM (1,172, 11.7%) for females.
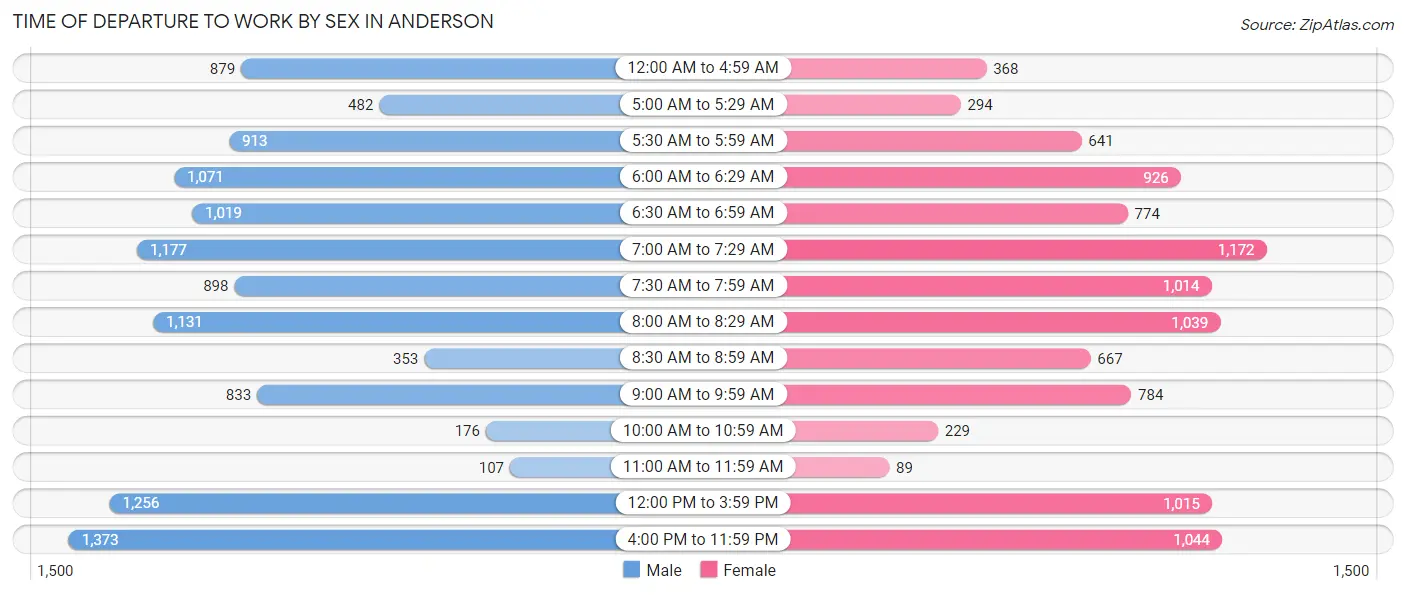
| Time of Departure | Male | Female |
| 12:00 AM to 4:59 AM | 879 (7.5%) | 368 (3.7%) |
| 5:00 AM to 5:29 AM | 482 (4.1%) | 294 (2.9%) |
| 5:30 AM to 5:59 AM | 913 (7.8%) | 641 (6.4%) |
| 6:00 AM to 6:29 AM | 1,071 (9.2%) | 926 (9.2%) |
| 6:30 AM to 6:59 AM | 1,019 (8.7%) | 774 (7.7%) |
| 7:00 AM to 7:29 AM | 1,177 (10.1%) | 1,172 (11.7%) |
| 7:30 AM to 7:59 AM | 898 (7.7%) | 1,014 (10.1%) |
| 8:00 AM to 8:29 AM | 1,131 (9.7%) | 1,039 (10.3%) |
| 8:30 AM to 8:59 AM | 353 (3.0%) | 667 (6.6%) |
| 9:00 AM to 9:59 AM | 833 (7.1%) | 784 (7.8%) |
| 10:00 AM to 10:59 AM | 176 (1.5%) | 229 (2.3%) |
| 11:00 AM to 11:59 AM | 107 (0.9%) | 89 (0.9%) |
| 12:00 PM to 3:59 PM | 1,256 (10.8%) | 1,015 (10.1%) |
| 4:00 PM to 11:59 PM | 1,373 (11.8%) | 1,044 (10.4%) |
| Total | 11,668 (100.0%) | 10,056 (100.0%) |
Housing Occupancy in Anderson
Occupancy by Ownership in Anderson
Of the total 23,279 dwellings in Anderson, owner-occupied units account for 13,076 (56.2%), while renter-occupied units make up 10,203 (43.8%).
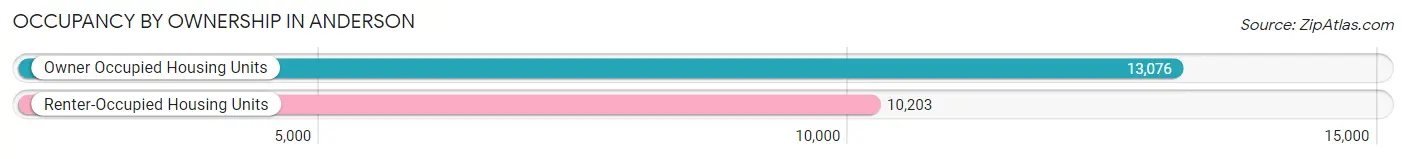
| Occupancy | # Housing Units | % Housing Units |
| Owner Occupied Housing Units | 13,076 | 56.2% |
| Renter-Occupied Housing Units | 10,203 | 43.8% |
| Total Occupied Housing Units | 23,279 | 100.0% |
Occupancy by Household Size in Anderson
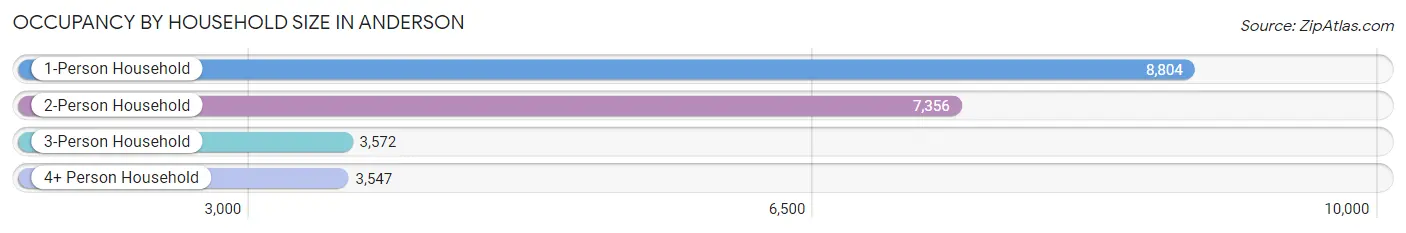
| Household Size | # Housing Units | % Housing Units |
| 1-Person Household | 8,804 | 37.8% |
| 2-Person Household | 7,356 | 31.6% |
| 3-Person Household | 3,572 | 15.3% |
| 4+ Person Household | 3,547 | 15.2% |
| Total Housing Units | 23,279 | 100.0% |
Occupancy by Ownership by Household Size in Anderson
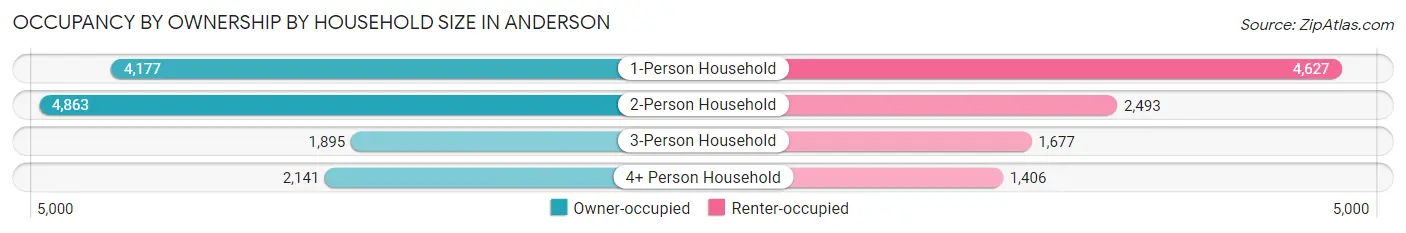
| Household Size | Owner-occupied | Renter-occupied |
| 1-Person Household | 4,177 (47.4%) | 4,627 (52.6%) |
| 2-Person Household | 4,863 (66.1%) | 2,493 (33.9%) |
| 3-Person Household | 1,895 (53.0%) | 1,677 (46.9%) |
| 4+ Person Household | 2,141 (60.4%) | 1,406 (39.6%) |
| Total Housing Units | 13,076 (56.2%) | 10,203 (43.8%) |
Occupancy by Educational Attainment in Anderson
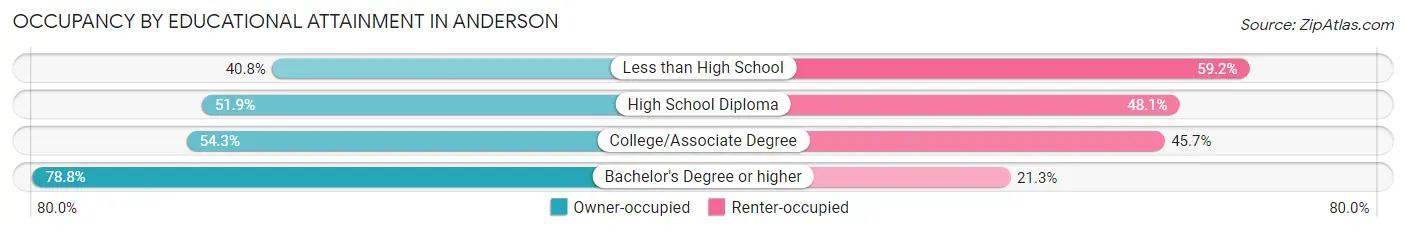
| Household Size | Owner-occupied | Renter-occupied |
| Less than High School | 1,068 (40.8%) | 1,549 (59.2%) |
| High School Diploma | 4,691 (51.9%) | 4,348 (48.1%) |
| College/Associate Degree | 4,081 (54.3%) | 3,433 (45.7%) |
| Bachelor's Degree or higher | 3,236 (78.7%) | 873 (21.2%) |
Occupancy by Age of Householder in Anderson
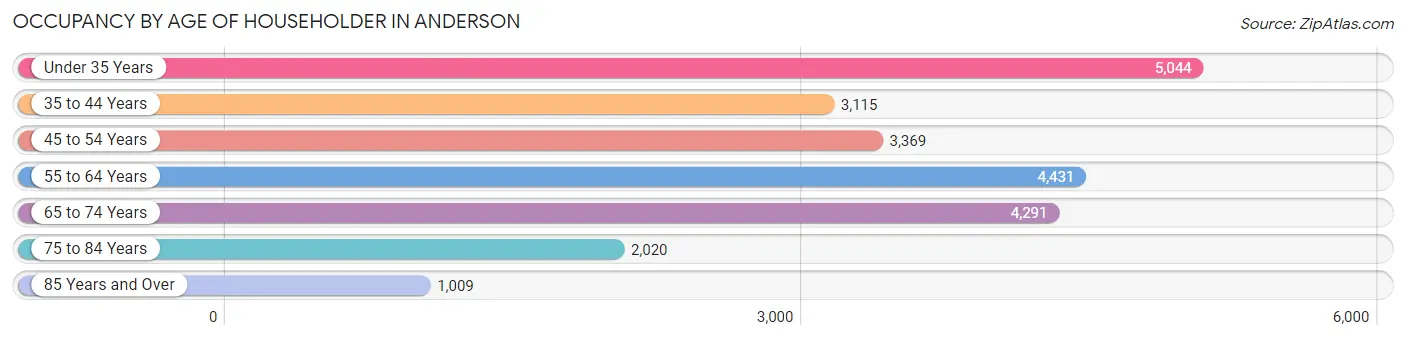
| Age Bracket | # Households | % Households |
| Under 35 Years | 5,044 | 21.7% |
| 35 to 44 Years | 3,115 | 13.4% |
| 45 to 54 Years | 3,369 | 14.5% |
| 55 to 64 Years | 4,431 | 19.0% |
| 65 to 74 Years | 4,291 | 18.4% |
| 75 to 84 Years | 2,020 | 8.7% |
| 85 Years and Over | 1,009 | 4.3% |
| Total | 23,279 | 100.0% |
Housing Finances in Anderson
Median Income by Occupancy in Anderson
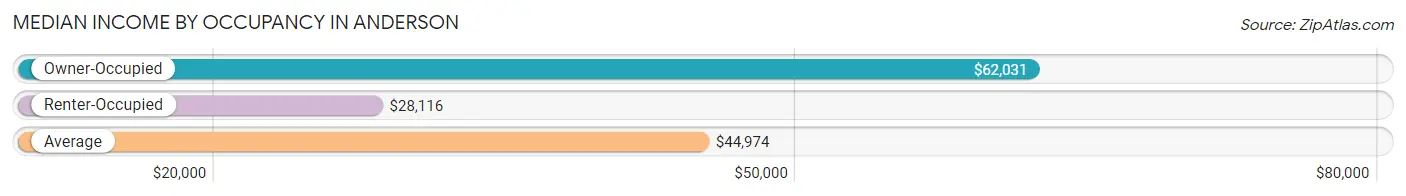
| Occupancy Type | # Households | Median Income |
| Owner-Occupied | 13,076 (56.2%) | $62,031 |
| Renter-Occupied | 10,203 (43.8%) | $28,116 |
| Average | 23,279 (100.0%) | $44,974 |
Occupancy by Householder Income Bracket in Anderson
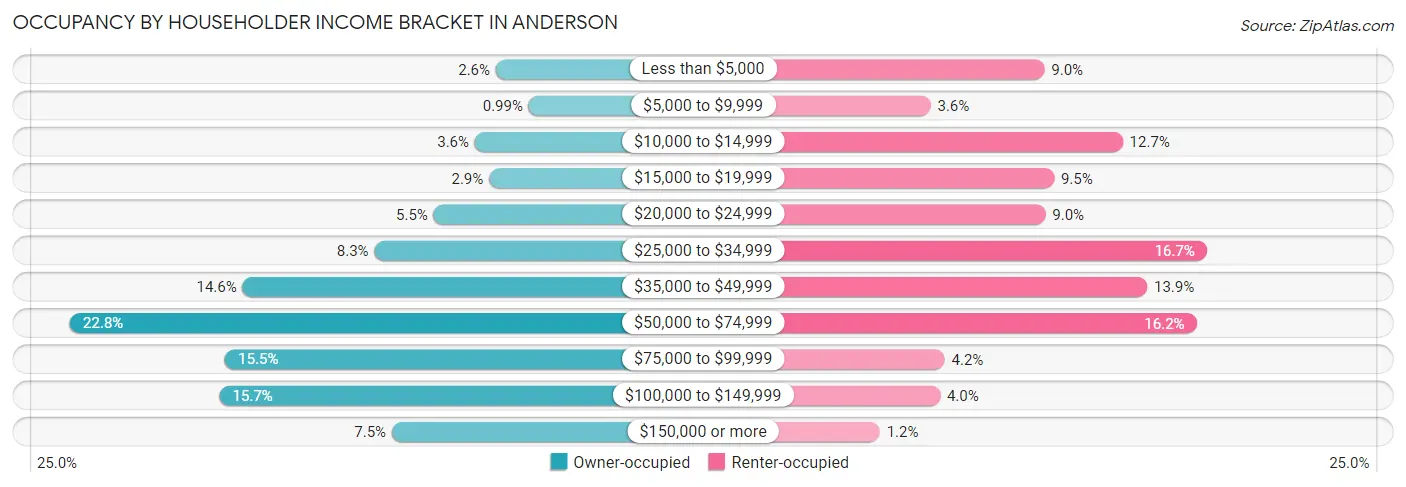
| Income Bracket | Owner-occupied | Renter-occupied |
| Less than $5,000 | 335 (2.6%) | 917 (9.0%) |
| $5,000 to $9,999 | 130 (1.0%) | 364 (3.6%) |
| $10,000 to $14,999 | 466 (3.6%) | 1,298 (12.7%) |
| $15,000 to $19,999 | 377 (2.9%) | 964 (9.5%) |
| $20,000 to $24,999 | 722 (5.5%) | 922 (9.0%) |
| $25,000 to $34,999 | 1,090 (8.3%) | 1,706 (16.7%) |
| $35,000 to $49,999 | 1,912 (14.6%) | 1,416 (13.9%) |
| $50,000 to $74,999 | 2,986 (22.8%) | 1,656 (16.2%) |
| $75,000 to $99,999 | 2,020 (15.4%) | 433 (4.2%) |
| $100,000 to $149,999 | 2,056 (15.7%) | 410 (4.0%) |
| $150,000 or more | 982 (7.5%) | 117 (1.1%) |
| Total | 13,076 (100.0%) | 10,203 (100.0%) |
Monthly Housing Cost Tiers in Anderson
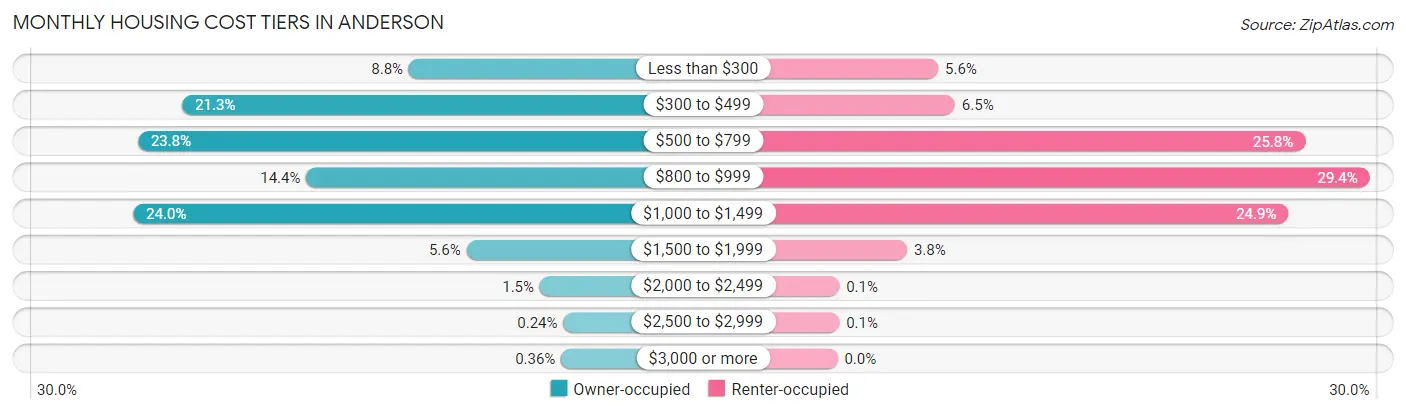
| Monthly Cost | Owner-occupied | Renter-occupied |
| Less than $300 | 1,147 (8.8%) | 567 (5.6%) |
| $300 to $499 | 2,785 (21.3%) | 662 (6.5%) |
| $500 to $799 | 3,105 (23.7%) | 2,635 (25.8%) |
| $800 to $999 | 1,888 (14.4%) | 2,999 (29.4%) |
| $1,000 to $1,499 | 3,140 (24.0%) | 2,541 (24.9%) |
| $1,500 to $1,999 | 731 (5.6%) | 392 (3.8%) |
| $2,000 to $2,499 | 202 (1.5%) | 10 (0.1%) |
| $2,500 to $2,999 | 31 (0.2%) | 10 (0.1%) |
| $3,000 or more | 47 (0.4%) | 0 (0.0%) |
| Total | 13,076 (100.0%) | 10,203 (100.0%) |
Physical Housing Characteristics in Anderson
Housing Structures in Anderson
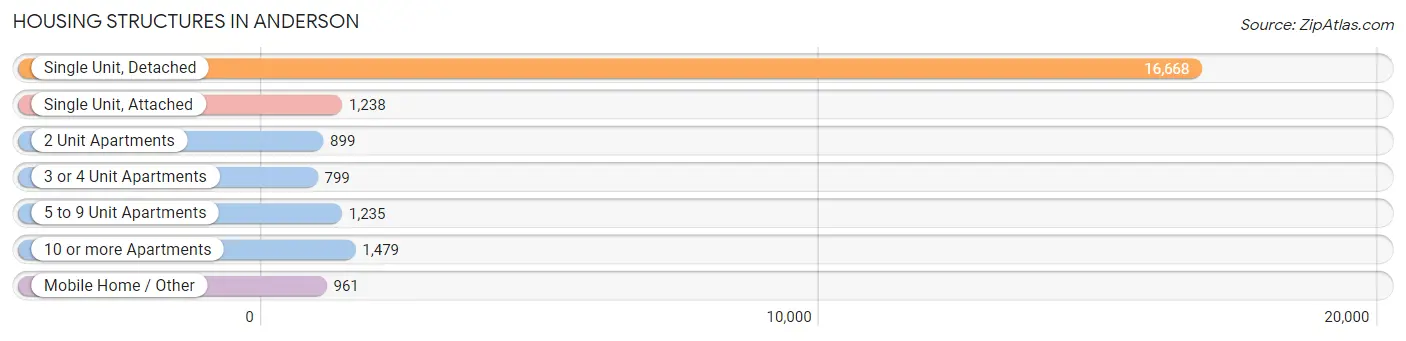
| Structure Type | # Housing Units | % Housing Units |
| Single Unit, Detached | 16,668 | 71.6% |
| Single Unit, Attached | 1,238 | 5.3% |
| 2 Unit Apartments | 899 | 3.9% |
| 3 or 4 Unit Apartments | 799 | 3.4% |
| 5 to 9 Unit Apartments | 1,235 | 5.3% |
| 10 or more Apartments | 1,479 | 6.4% |
| Mobile Home / Other | 961 | 4.1% |
| Total | 23,279 | 100.0% |
Housing Structures by Occupancy in Anderson
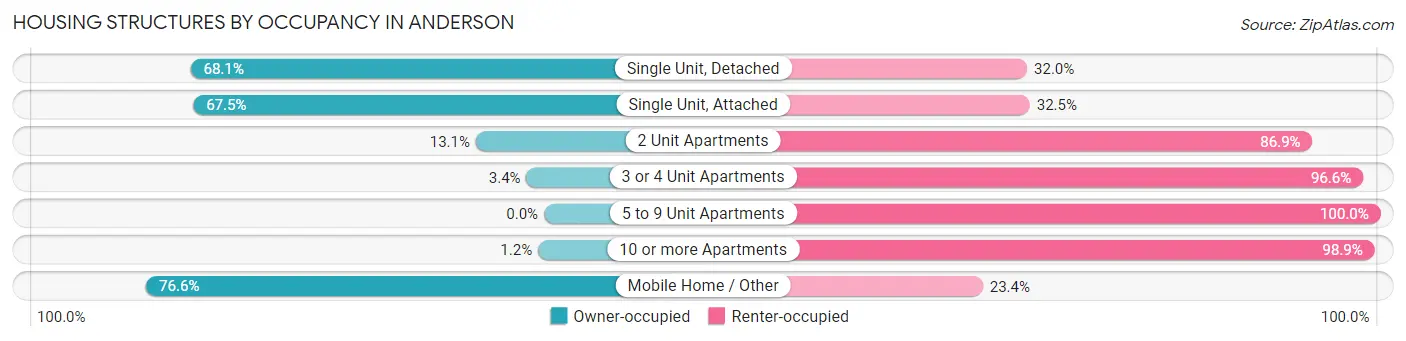
| Structure Type | Owner-occupied | Renter-occupied |
| Single Unit, Detached | 11,342 (68.0%) | 5,326 (32.0%) |
| Single Unit, Attached | 836 (67.5%) | 402 (32.5%) |
| 2 Unit Apartments | 118 (13.1%) | 781 (86.9%) |
| 3 or 4 Unit Apartments | 27 (3.4%) | 772 (96.6%) |
| 5 to 9 Unit Apartments | 0 (0.0%) | 1,235 (100.0%) |
| 10 or more Apartments | 17 (1.1%) | 1,462 (98.9%) |
| Mobile Home / Other | 736 (76.6%) | 225 (23.4%) |
| Total | 13,076 (56.2%) | 10,203 (43.8%) |
Housing Structures by Number of Rooms in Anderson
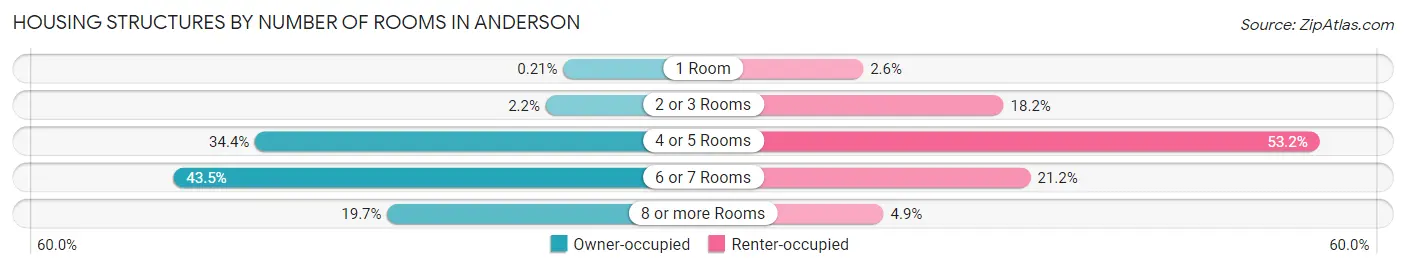
| Number of Rooms | Owner-occupied | Renter-occupied |
| 1 Room | 28 (0.2%) | 264 (2.6%) |
| 2 or 3 Rooms | 283 (2.2%) | 1,854 (18.2%) |
| 4 or 5 Rooms | 4,499 (34.4%) | 5,431 (53.2%) |
| 6 or 7 Rooms | 5,685 (43.5%) | 2,159 (21.2%) |
| 8 or more Rooms | 2,581 (19.7%) | 495 (4.9%) |
| Total | 13,076 (100.0%) | 10,203 (100.0%) |
Housing Structure by Heating Type in Anderson
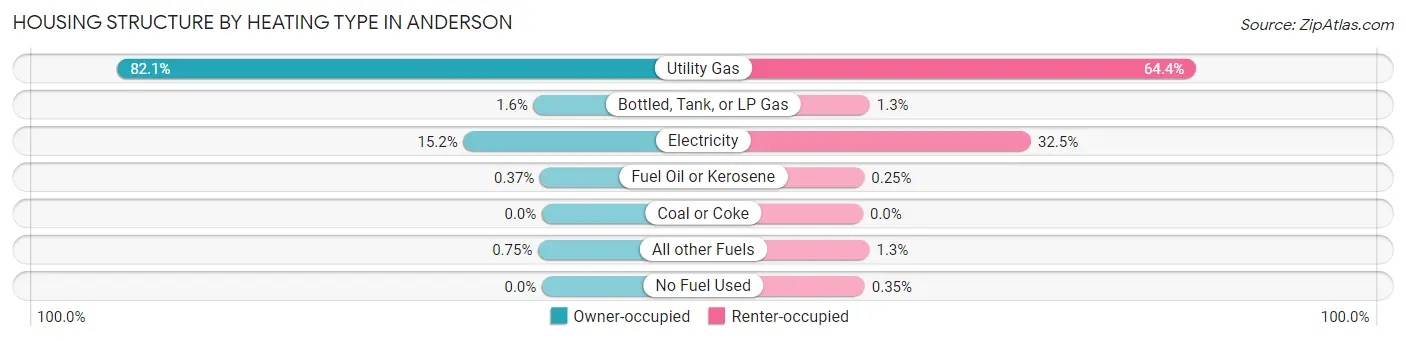
| Heating Type | Owner-occupied | Renter-occupied |
| Utility Gas | 10,736 (82.1%) | 6,567 (64.4%) |
| Bottled, Tank, or LP Gas | 208 (1.6%) | 134 (1.3%) |
| Electricity | 1,985 (15.2%) | 3,313 (32.5%) |
| Fuel Oil or Kerosene | 49 (0.4%) | 25 (0.3%) |
| Coal or Coke | 0 (0.0%) | 0 (0.0%) |
| All other Fuels | 98 (0.7%) | 128 (1.3%) |
| No Fuel Used | 0 (0.0%) | 36 (0.4%) |
| Total | 13,076 (100.0%) | 10,203 (100.0%) |
Household Vehicle Usage in Anderson
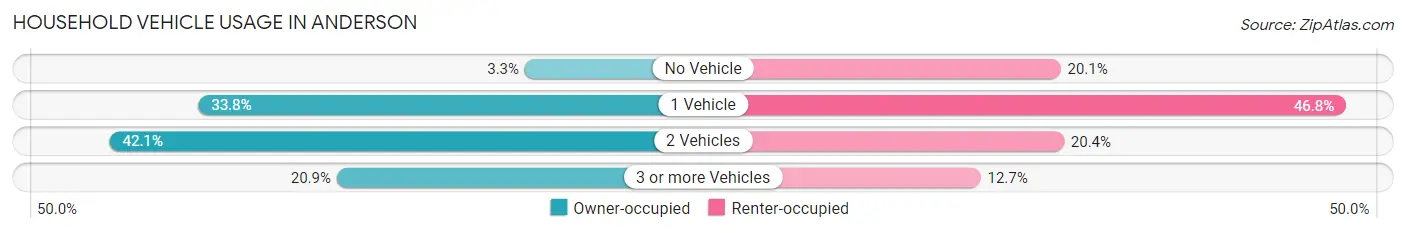
| Vehicles per Household | Owner-occupied | Renter-occupied |
| No Vehicle | 432 (3.3%) | 2,054 (20.1%) |
| 1 Vehicle | 4,417 (33.8%) | 4,772 (46.8%) |
| 2 Vehicles | 5,500 (42.1%) | 2,085 (20.4%) |
| 3 or more Vehicles | 2,727 (20.9%) | 1,292 (12.7%) |
| Total | 13,076 (100.0%) | 10,203 (100.0%) |
Real Estate & Mortgages in Anderson
Real Estate and Mortgage Overview in Anderson
| Characteristic | Without Mortgage | With Mortgage |
| Housing Units | 5,577 | 7,499 |
| Median Property Value | $81,500 | $116,500 |
| Median Household Income | $45,261 | $767 |
| Monthly Housing Costs | $430 | $47 |
| Real Estate Taxes | $752 | $389 |
Property Value by Mortgage Status in Anderson
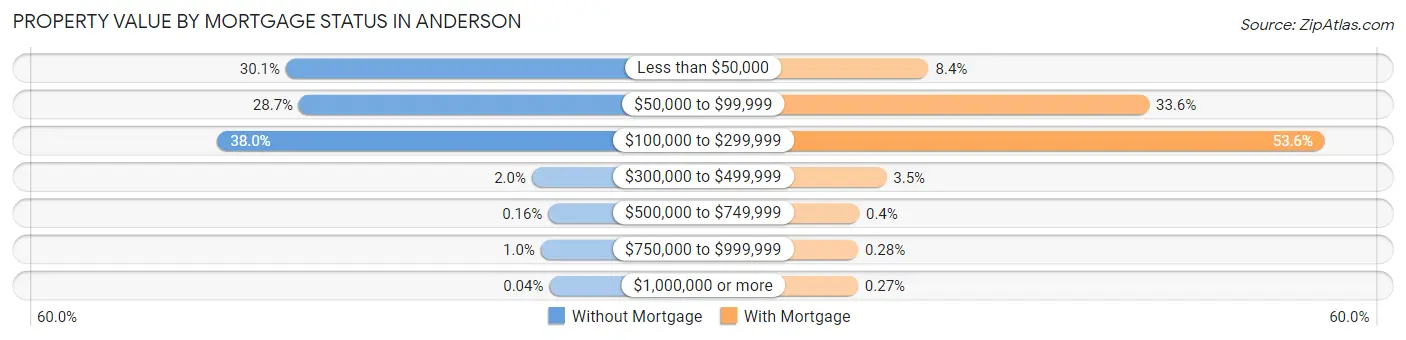
| Property Value | Without Mortgage | With Mortgage |
| Less than $50,000 | 1,681 (30.1%) | 626 (8.4%) |
| $50,000 to $99,999 | 1,598 (28.6%) | 2,516 (33.6%) |
| $100,000 to $299,999 | 2,117 (38.0%) | 4,022 (53.6%) |
| $300,000 to $499,999 | 113 (2.0%) | 264 (3.5%) |
| $500,000 to $749,999 | 9 (0.2%) | 30 (0.4%) |
| $750,000 to $999,999 | 57 (1.0%) | 21 (0.3%) |
| $1,000,000 or more | 2 (0.0%) | 20 (0.3%) |
| Total | 5,577 (100.0%) | 7,499 (100.0%) |
Household Income by Mortgage Status in Anderson
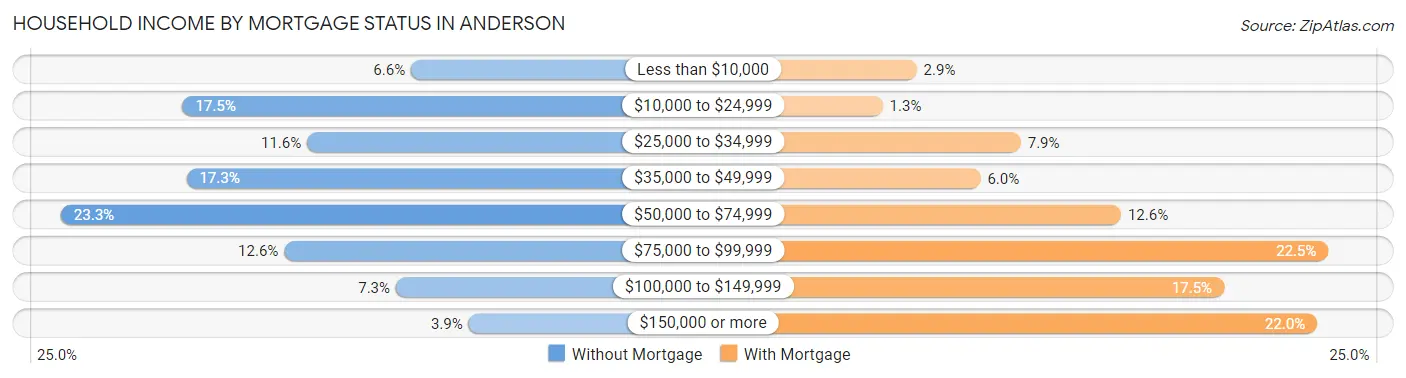
| Household Income | Without Mortgage | With Mortgage |
| Less than $10,000 | 368 (6.6%) | 218 (2.9%) |
| $10,000 to $24,999 | 975 (17.5%) | 97 (1.3%) |
| $25,000 to $34,999 | 644 (11.6%) | 590 (7.9%) |
| $35,000 to $49,999 | 964 (17.3%) | 446 (5.9%) |
| $50,000 to $74,999 | 1,298 (23.3%) | 948 (12.6%) |
| $75,000 to $99,999 | 705 (12.6%) | 1,688 (22.5%) |
| $100,000 to $149,999 | 408 (7.3%) | 1,315 (17.5%) |
| $150,000 or more | 215 (3.9%) | 1,648 (22.0%) |
| Total | 5,577 (100.0%) | 7,499 (100.0%) |
Property Value to Household Income Ratio in Anderson
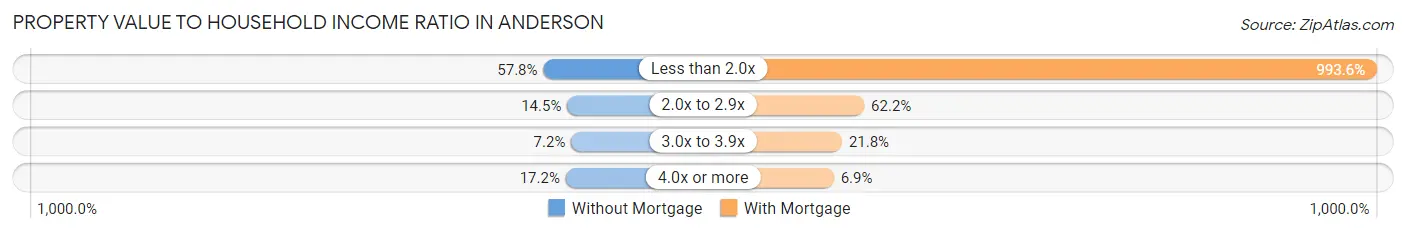
| Value-to-Income Ratio | Without Mortgage | With Mortgage |
| Less than 2.0x | 3,225 (57.8%) | 74,513 (993.6%) |
| 2.0x to 2.9x | 808 (14.5%) | 4,663 (62.2%) |
| 3.0x to 3.9x | 402 (7.2%) | 1,638 (21.8%) |
| 4.0x or more | 960 (17.2%) | 518 (6.9%) |
| Total | 5,577 (100.0%) | 7,499 (100.0%) |
Real Estate Taxes by Mortgage Status in Anderson
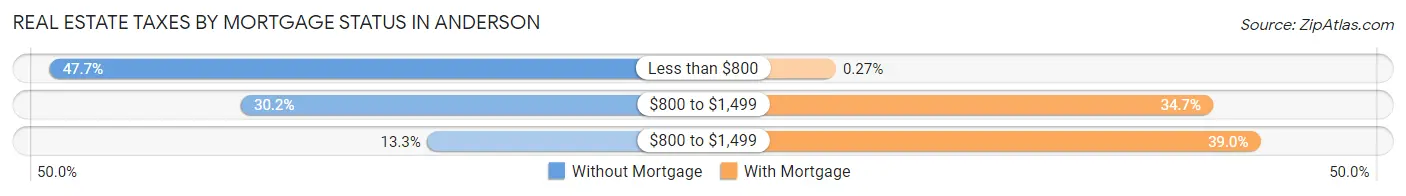
| Property Taxes | Without Mortgage | With Mortgage |
| Less than $800 | 2,660 (47.7%) | 20 (0.3%) |
| $800 to $1,499 | 1,686 (30.2%) | 2,601 (34.7%) |
| $800 to $1,499 | 741 (13.3%) | 2,925 (39.0%) |
| Total | 5,577 (100.0%) | 7,499 (100.0%) |
Health & Disability in Anderson
Health Insurance Coverage by Age in Anderson
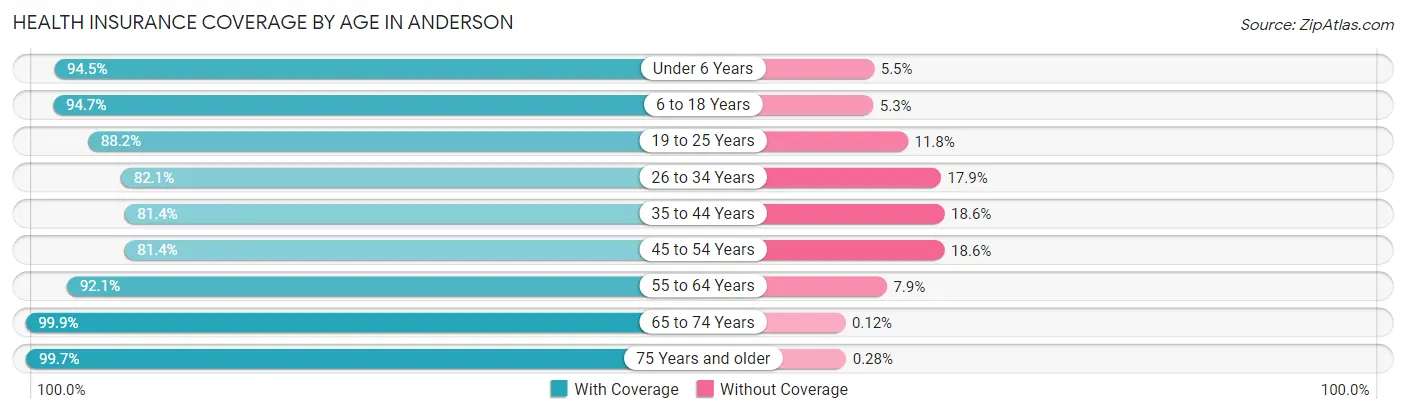
| Age Bracket | With Coverage | Without Coverage |
| Under 6 Years | 3,983 (94.5%) | 232 (5.5%) |
| 6 to 18 Years | 7,479 (94.7%) | 420 (5.3%) |
| 19 to 25 Years | 5,069 (88.2%) | 678 (11.8%) |
| 26 to 34 Years | 5,621 (82.1%) | 1,229 (17.9%) |
| 35 to 44 Years | 4,598 (81.4%) | 1,052 (18.6%) |
| 45 to 54 Years | 5,318 (81.4%) | 1,217 (18.6%) |
| 55 to 64 Years | 6,414 (92.1%) | 547 (7.9%) |
| 65 to 74 Years | 5,824 (99.9%) | 7 (0.1%) |
| 75 Years and older | 4,322 (99.7%) | 12 (0.3%) |
| Total | 48,628 (90.0%) | 5,394 (10.0%) |
Health Insurance Coverage by Citizenship Status in Anderson
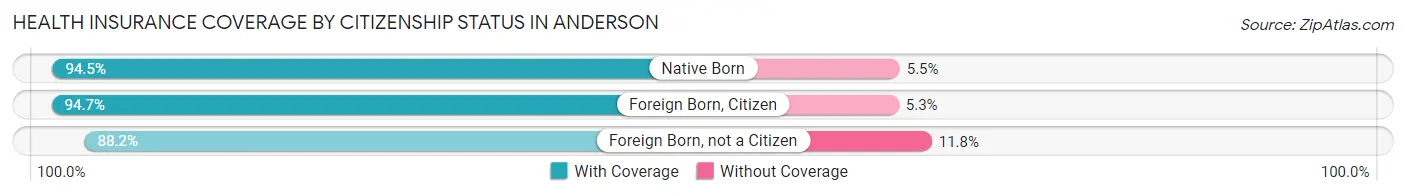
| Citizenship Status | With Coverage | Without Coverage |
| Native Born | 3,983 (94.5%) | 232 (5.5%) |
| Foreign Born, Citizen | 7,479 (94.7%) | 420 (5.3%) |
| Foreign Born, not a Citizen | 5,069 (88.2%) | 678 (11.8%) |
Health Insurance Coverage by Household Income in Anderson
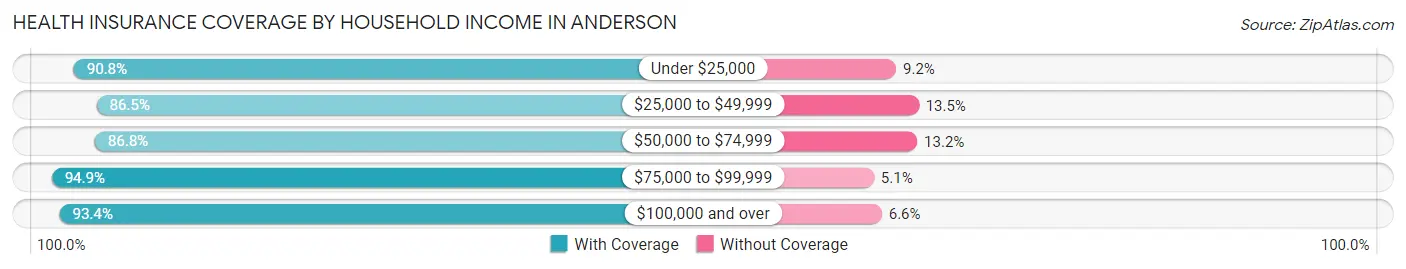
| Household Income | With Coverage | Without Coverage |
| Under $25,000 | 9,696 (90.8%) | 986 (9.2%) |
| $25,000 to $49,999 | 10,942 (86.5%) | 1,703 (13.5%) |
| $50,000 to $74,999 | 10,351 (86.8%) | 1,572 (13.2%) |
| $75,000 to $99,999 | 6,544 (94.9%) | 350 (5.1%) |
| $100,000 and over | 10,064 (93.4%) | 706 (6.6%) |
Public vs Private Health Insurance Coverage by Age in Anderson
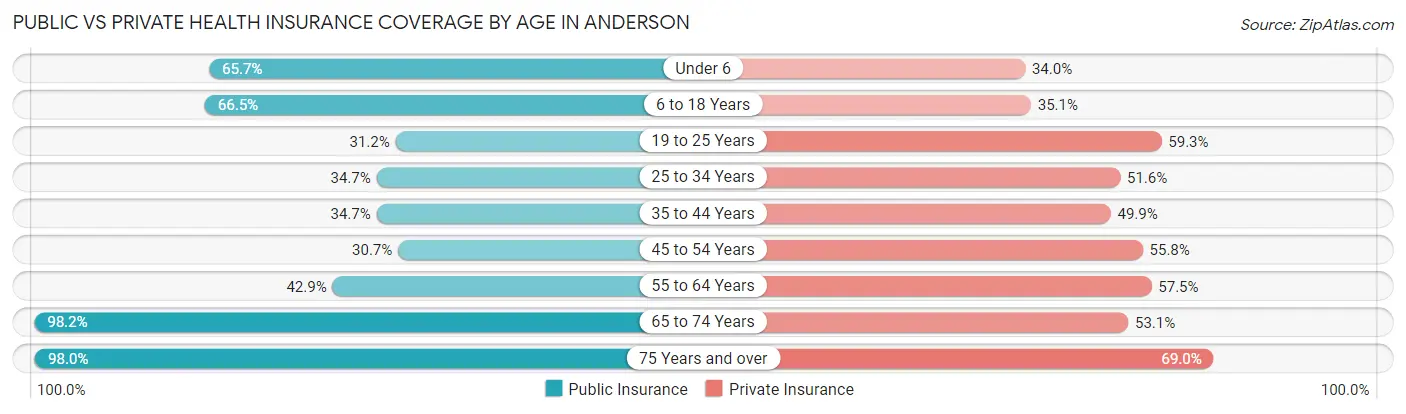
| Age Bracket | Public Insurance | Private Insurance |
| Under 6 | 2,771 (65.7%) | 1,433 (34.0%) |
| 6 to 18 Years | 5,255 (66.5%) | 2,771 (35.1%) |
| 19 to 25 Years | 1,790 (31.1%) | 3,409 (59.3%) |
| 25 to 34 Years | 2,375 (34.7%) | 3,537 (51.6%) |
| 35 to 44 Years | 1,959 (34.7%) | 2,819 (49.9%) |
| 45 to 54 Years | 2,004 (30.7%) | 3,649 (55.8%) |
| 55 to 64 Years | 2,983 (42.8%) | 4,000 (57.5%) |
| 65 to 74 Years | 5,726 (98.2%) | 3,098 (53.1%) |
| 75 Years and over | 4,249 (98.0%) | 2,991 (69.0%) |
| Total | 29,112 (53.9%) | 27,707 (51.3%) |
Disability Status by Sex by Age in Anderson
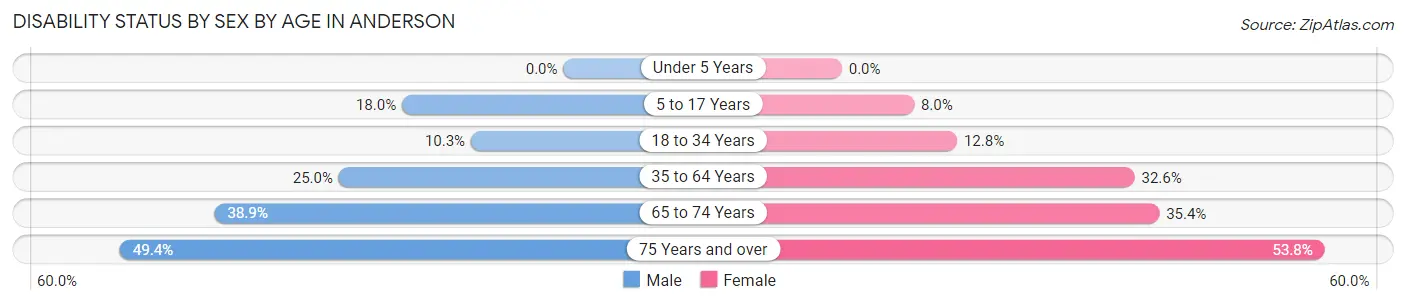
| Age Bracket | Male | Female |
| Under 5 Years | 0 (0.0%) | 0 (0.0%) |
| 5 to 17 Years | 755 (18.0%) | 296 (8.0%) |
| 18 to 34 Years | 655 (10.3%) | 899 (12.8%) |
| 35 to 64 Years | 2,430 (25.0%) | 3,074 (32.6%) |
| 65 to 74 Years | 1,031 (38.9%) | 1,123 (35.3%) |
| 75 Years and over | 870 (49.4%) | 1,383 (53.8%) |
Disability Class by Sex by Age in Anderson
Disability Class: Hearing Difficulty
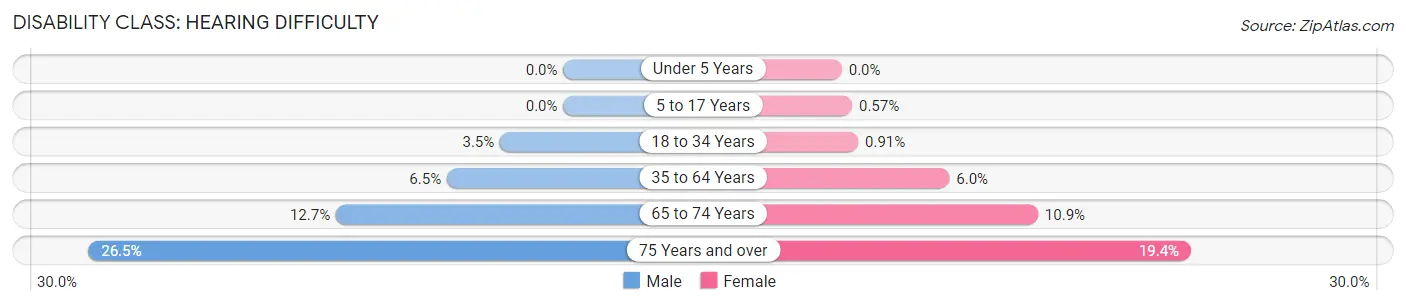
| Age Bracket | Male | Female |
| Under 5 Years | 0 (0.0%) | 0 (0.0%) |
| 5 to 17 Years | 0 (0.0%) | 21 (0.6%) |
| 18 to 34 Years | 224 (3.5%) | 64 (0.9%) |
| 35 to 64 Years | 630 (6.5%) | 565 (6.0%) |
| 65 to 74 Years | 336 (12.7%) | 347 (10.9%) |
| 75 Years and over | 466 (26.5%) | 500 (19.4%) |
Disability Class: Vision Difficulty
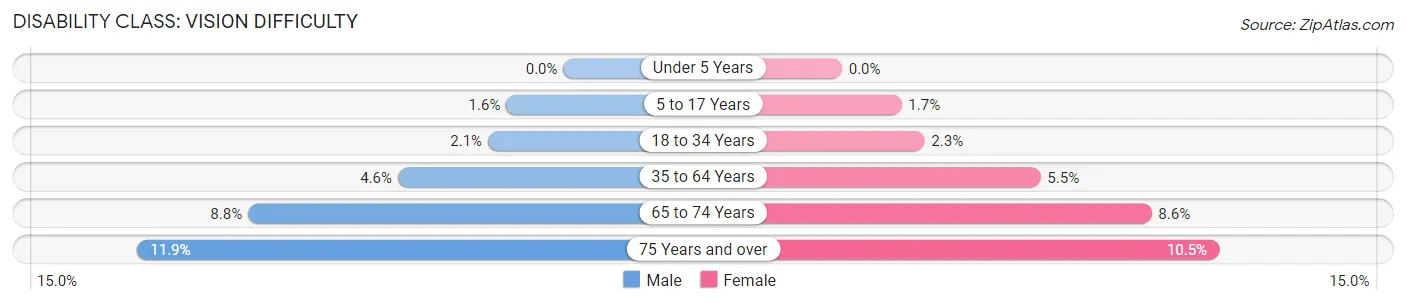
| Age Bracket | Male | Female |
| Under 5 Years | 0 (0.0%) | 0 (0.0%) |
| 5 to 17 Years | 67 (1.6%) | 61 (1.7%) |
| 18 to 34 Years | 134 (2.1%) | 161 (2.3%) |
| 35 to 64 Years | 448 (4.6%) | 521 (5.5%) |
| 65 to 74 Years | 233 (8.8%) | 274 (8.6%) |
| 75 Years and over | 209 (11.9%) | 270 (10.5%) |
Disability Class: Cognitive Difficulty
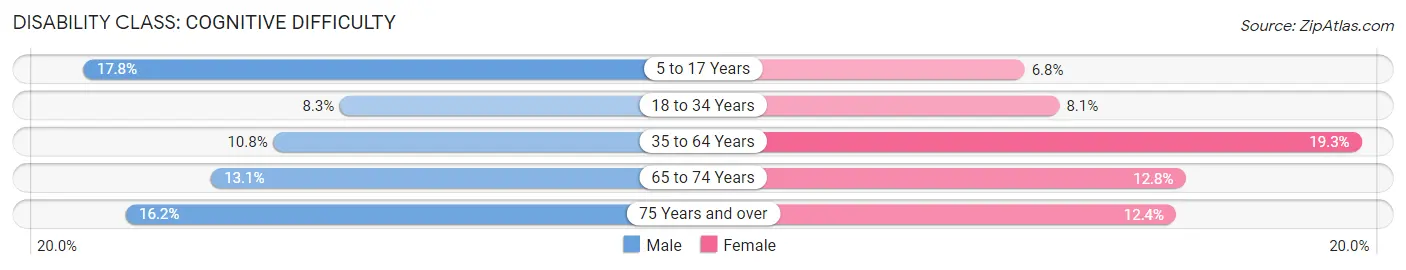
| Age Bracket | Male | Female |
| 5 to 17 Years | 748 (17.8%) | 250 (6.8%) |
| 18 to 34 Years | 528 (8.3%) | 566 (8.1%) |
| 35 to 64 Years | 1,046 (10.8%) | 1,819 (19.3%) |
| 65 to 74 Years | 347 (13.1%) | 405 (12.8%) |
| 75 Years and over | 286 (16.2%) | 319 (12.4%) |
Disability Class: Ambulatory Difficulty
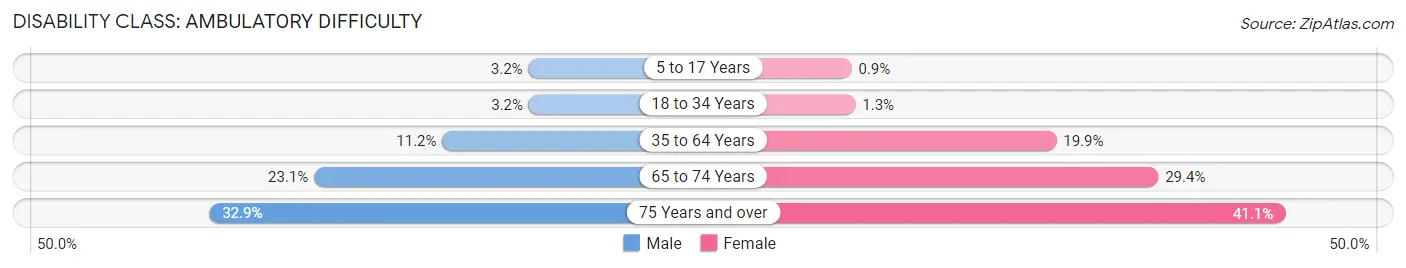
| Age Bracket | Male | Female |
| 5 to 17 Years | 136 (3.2%) | 33 (0.9%) |
| 18 to 34 Years | 204 (3.2%) | 88 (1.3%) |
| 35 to 64 Years | 1,091 (11.2%) | 1,877 (19.9%) |
| 65 to 74 Years | 614 (23.1%) | 933 (29.4%) |
| 75 Years and over | 579 (32.9%) | 1,058 (41.1%) |
Disability Class: Self-Care Difficulty
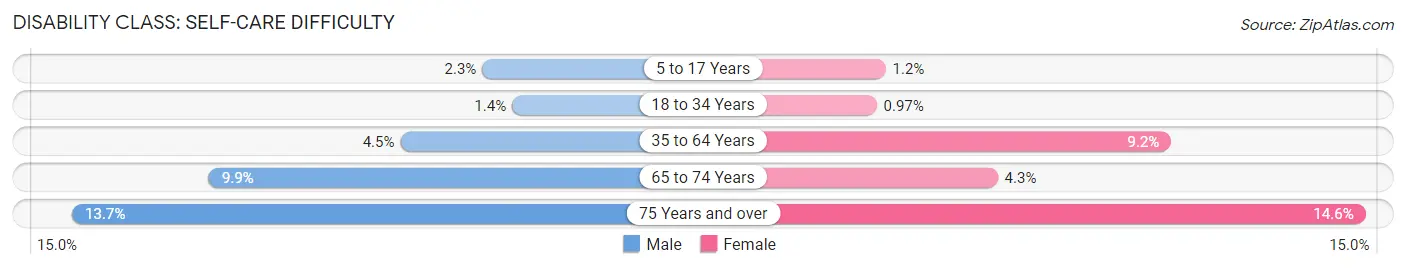
| Age Bracket | Male | Female |
| 5 to 17 Years | 95 (2.3%) | 45 (1.2%) |
| 18 to 34 Years | 91 (1.4%) | 68 (1.0%) |
| 35 to 64 Years | 441 (4.5%) | 865 (9.2%) |
| 65 to 74 Years | 262 (9.9%) | 138 (4.3%) |
| 75 Years and over | 241 (13.7%) | 375 (14.6%) |
Technology Access in Anderson
Computing Device Access in Anderson
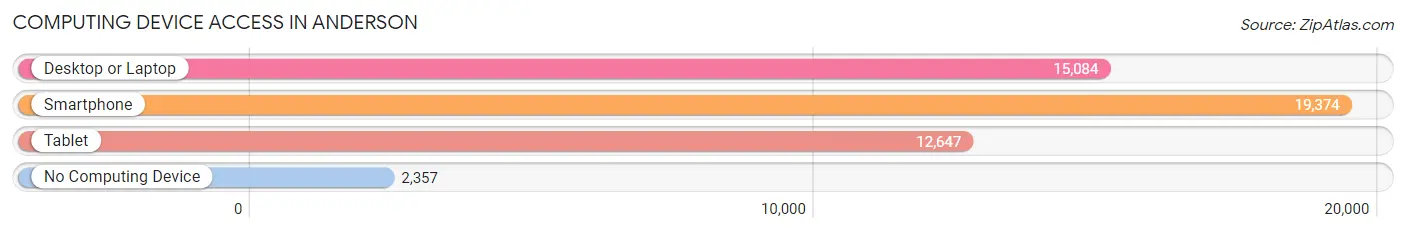
| Device Type | # Households | % Households |
| Desktop or Laptop | 15,084 | 64.8% |
| Smartphone | 19,374 | 83.2% |
| Tablet | 12,647 | 54.3% |
| No Computing Device | 2,357 | 10.1% |
| Total | 23,279 | 100.0% |
Internet Access in Anderson
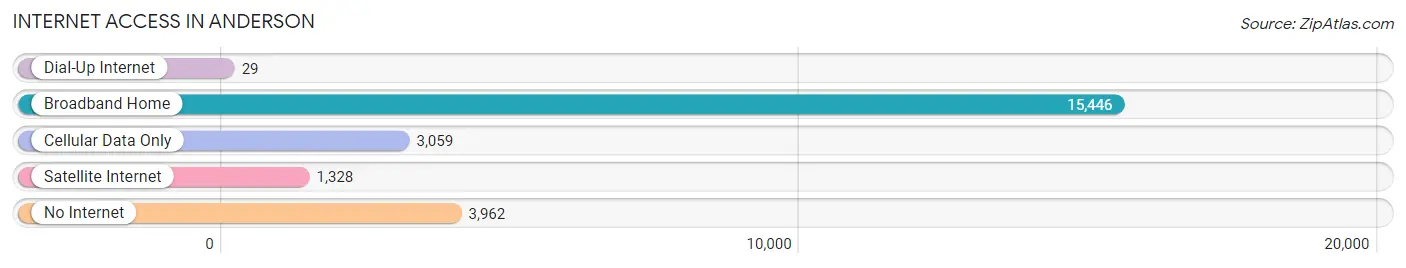
| Internet Type | # Households | % Households |
| Dial-Up Internet | 29 | 0.1% |
| Broadband Home | 15,446 | 66.3% |
| Cellular Data Only | 3,059 | 13.1% |
| Satellite Internet | 1,328 | 5.7% |
| No Internet | 3,962 | 17.0% |
| Total | 23,279 | 100.0% |
Anderson Summary
Anderson is a city located in Madison County, Indiana, United States. It is the county seat of Madison County and is located in the central part of the state. The city is situated along the White River and is part of the Indianapolis metropolitan area. As of the 2010 census, the city had a population of 56,129.
History
The area around Anderson was first settled in 1823 by the Quakers, who established the town of Andersonville. The town was named after Chief William Anderson, a local Native American leader. In 1838, the town was incorporated as Anderson.
The city grew rapidly in the late 19th century, becoming an important industrial center. The city was home to several major industries, including the Anderson Carriage Company, the Anderson Car Company, and the Anderson Glass Company. The city also became a major center for the production of automobiles, with the Anderson Automobile Company being established in 1902.
In the early 20th century, Anderson experienced a period of growth and prosperity. The city was home to several major industries, including the Anderson Carriage Company, the Anderson Car Company, and the Anderson Glass Company. The city also became a major center for the production of automobiles, with the Anderson Automobile Company being established in 1902.
The city experienced a period of decline in the mid-20th century, as the local industries began to close or move away. The city's population declined from a peak of over 70,000 in 1950 to just over 56,000 in 2010.
Geography
Anderson is located in central Indiana, about 25 miles northeast of Indianapolis. The city is situated along the White River and is part of the Indianapolis metropolitan area. The city has a total area of 24.3 square miles, of which 24.2 square miles is land and 0.1 square miles is water.
Economy
Anderson's economy is largely based on manufacturing. The city is home to several major employers, including the Anderson Carriage Company, the Anderson Car Company, and the Anderson Glass Company. The city is also home to several automotive-related companies, including the Anderson Automobile Company and the Anderson Automotive Parts Company.
The city is also home to several educational institutions, including Anderson University and Ivy Tech Community College.
Demographics
As of the 2010 census, the city had a population of 56,129. The racial makeup of the city was 79.2% White, 15.3% African American, 0.4% Native American, 1.2% Asian, 0.1% Pacific Islander, 1.3% from other races, and 2.5% from two or more races. Hispanic or Latino of any race were 4.2% of the population.
The median income for a household in the city was $37,945, and the median income for a family was $45,945. The per capita income for the city was $20,845. About 14.3% of families and 17.7% of the population were below the poverty line, including 25.2% of those under age 18 and 8.7% of those age 65 or over.
Common Questions
What is Per Capita Income in Anderson?
Per Capita income in Anderson is $26,475.
What is the Median Family Income in Anderson?
Median Family Income in Anderson is $60,195.
What is the Median Household income in Anderson?
Median Household Income in Anderson is $44,974.
What is Income or Wage Gap in Anderson?
Income or Wage Gap in Anderson is 34.2%.
Women in Anderson earn 65.8 cents for every dollar earned by a man.
What is Family Income Deficit in Anderson?
Family Income Deficit in Anderson is $11,601.
Families that are below poverty line in Anderson earn $11,601 less on average than the poverty threshold level.
What is Inequality or Gini Index in Anderson?
Inequality or Gini Index in Anderson is 0.45.
What is the Total Population of Anderson?
Total Population of Anderson is 55,011.
What is the Total Male Population of Anderson?
Total Male Population of Anderson is 26,953.
What is the Total Female Population of Anderson?
Total Female Population of Anderson is 28,058.
What is the Ratio of Males per 100 Females in Anderson?
There are 96.06 Males per 100 Females in Anderson.
What is the Ratio of Females per 100 Males in Anderson?
There are 104.10 Females per 100 Males in Anderson.
What is the Median Population Age in Anderson?
Median Population Age in Anderson is 38.8 Years.
What is the Average Family Size in Anderson
Average Family Size in Anderson is 3.0 People.
What is the Average Household Size in Anderson
Average Household Size in Anderson is 2.3 People.
How Large is the Labor Force in Anderson?
There are 25,643 People in the Labor Forcein in Anderson.
What is the Percentage of People in the Labor Force in Anderson?
57.2% of People are in the Labor Force in Anderson.
What is the Unemployment Rate in Anderson?
Unemployment Rate in Anderson is 7.0%.