Brentwood, MD Map & Demographics
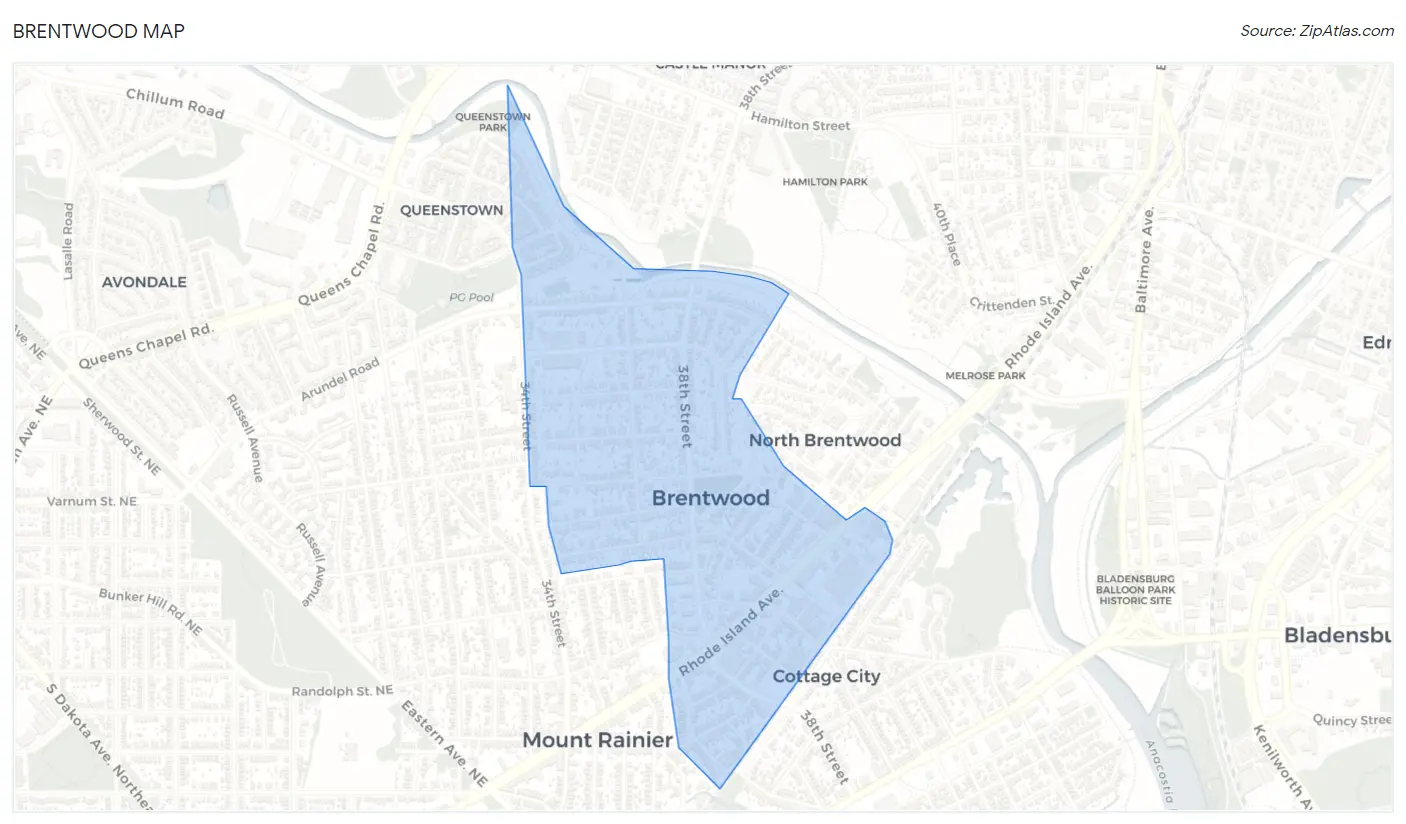
Brentwood Map
Brentwood Overview
$33,393
PER CAPITA INCOME
$96,053
AVG FAMILY INCOME
$78,494
AVG HOUSEHOLD INCOME
1.8%
WAGE / INCOME GAP [ % ]
98.2¢/ $1
WAGE / INCOME GAP [ $ ]
0.42
INEQUALITY / GINI INDEX
3,782
TOTAL POPULATION
1,824
MALE POPULATION
1,958
FEMALE POPULATION
93.16
MALES / 100 FEMALES
107.35
FEMALES / 100 MALES
34.1
MEDIAN AGE
4.0
AVG FAMILY SIZE
2.9
AVG HOUSEHOLD SIZE
2,153
LABOR FORCE [ PEOPLE ]
73.1%
PERCENT IN LABOR FORCE
5.6%
UNEMPLOYMENT RATE
Brentwood Zip Codes
Income in Brentwood
Income Overview in Brentwood
Per Capita Income in Brentwood is $33,393, while median incomes of families and households are $96,053 and $78,494 respectively.
| Characteristic | Number | Measure |
| Per Capita Income | 3,782 | $33,393 |
| Median Family Income | 710 | $96,053 |
| Mean Family Income | 710 | $106,565 |
| Median Household Income | 1,293 | $78,494 |
| Mean Household Income | 1,293 | $95,382 |
| Income Deficit | 710 | $0 |
| Wage / Income Gap (%) | 3,782 | 1.77% |
| Wage / Income Gap ($) | 3,782 | 98.23¢ per $1 |
| Gini / Inequality Index | 3,782 | 0.42 |
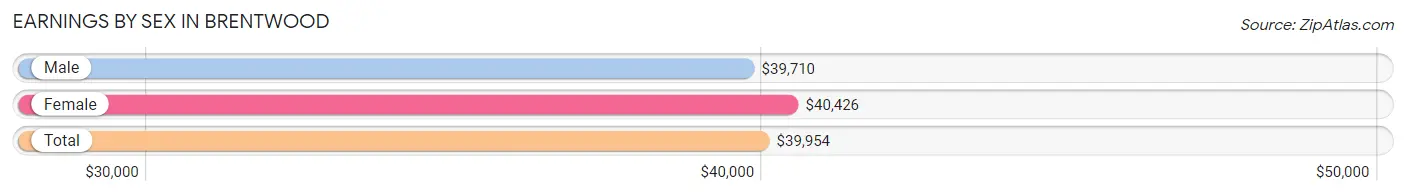
Earnings by Sex in Brentwood
Average Earnings in Brentwood are $39,954, $39,710 for men and $40,426 for women, a difference of 1.8%.
| Sex | Number | Average Earnings |
| Male | 1,075 (48.4%) | $39,710 |
| Female | 1,148 (51.6%) | $40,426 |
| Total | 2,223 (100.0%) | $39,954 |
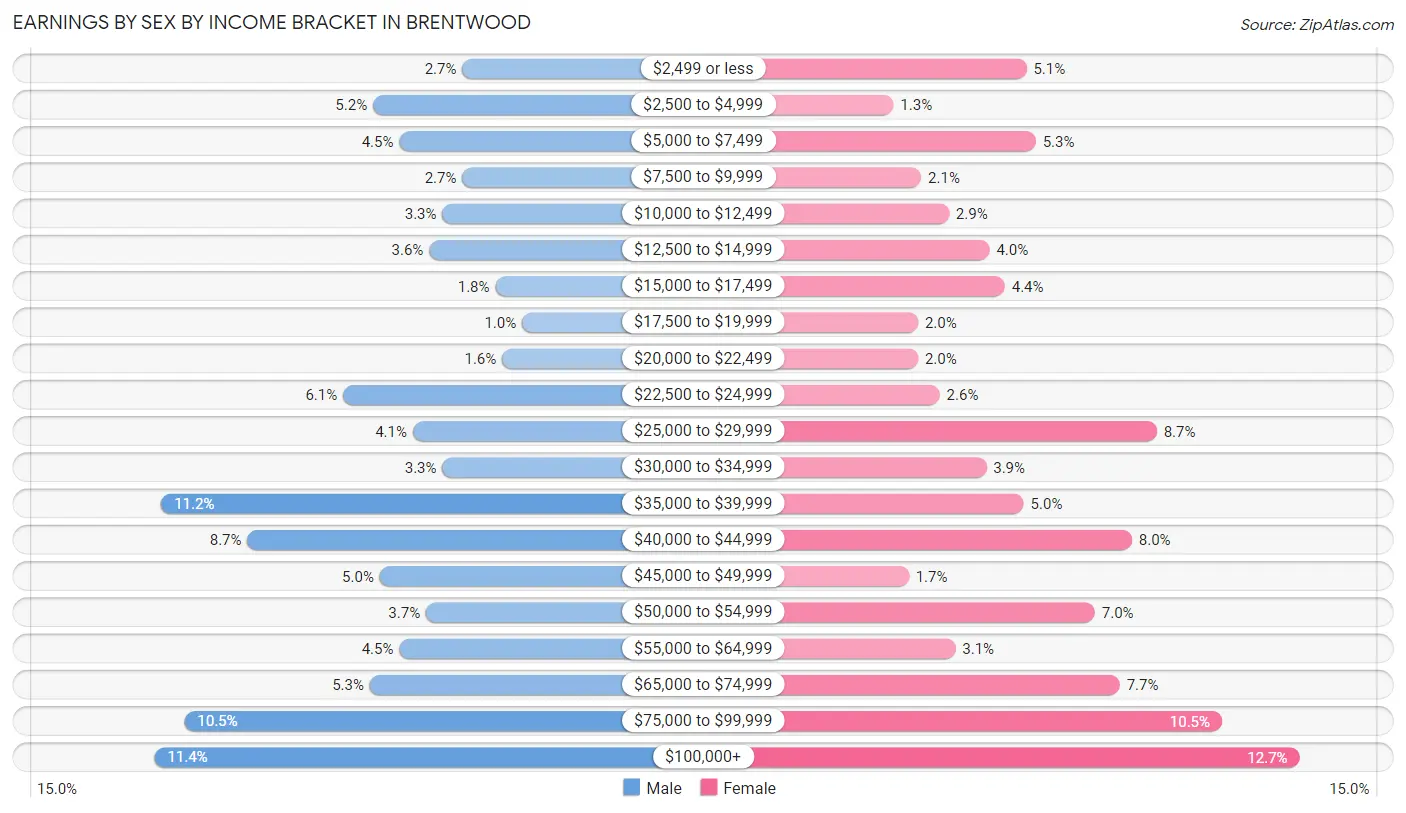
Earnings by Sex by Income Bracket in Brentwood
The most common earnings brackets in Brentwood are $100,000+ for men (122 | 11.4%) and $100,000+ for women (146 | 12.7%).
| Income | Male | Female |
| $2,499 or less | 29 (2.7%) | 58 (5.1%) |
| $2,500 to $4,999 | 56 (5.2%) | 15 (1.3%) |
| $5,000 to $7,499 | 48 (4.5%) | 61 (5.3%) |
| $7,500 to $9,999 | 29 (2.7%) | 24 (2.1%) |
| $10,000 to $12,499 | 35 (3.3%) | 33 (2.9%) |
| $12,500 to $14,999 | 39 (3.6%) | 46 (4.0%) |
| $15,000 to $17,499 | 19 (1.8%) | 51 (4.4%) |
| $17,500 to $19,999 | 11 (1.0%) | 23 (2.0%) |
| $20,000 to $22,499 | 17 (1.6%) | 23 (2.0%) |
| $22,500 to $24,999 | 65 (6.0%) | 30 (2.6%) |
| $25,000 to $29,999 | 44 (4.1%) | 100 (8.7%) |
| $30,000 to $34,999 | 35 (3.3%) | 45 (3.9%) |
| $35,000 to $39,999 | 120 (11.2%) | 57 (5.0%) |
| $40,000 to $44,999 | 94 (8.7%) | 92 (8.0%) |
| $45,000 to $49,999 | 54 (5.0%) | 20 (1.7%) |
| $50,000 to $54,999 | 40 (3.7%) | 80 (7.0%) |
| $55,000 to $64,999 | 48 (4.5%) | 35 (3.0%) |
| $65,000 to $74,999 | 57 (5.3%) | 88 (7.7%) |
| $75,000 to $99,999 | 113 (10.5%) | 121 (10.5%) |
| $100,000+ | 122 (11.4%) | 146 (12.7%) |
| Total | 1,075 (100.0%) | 1,148 (100.0%) |
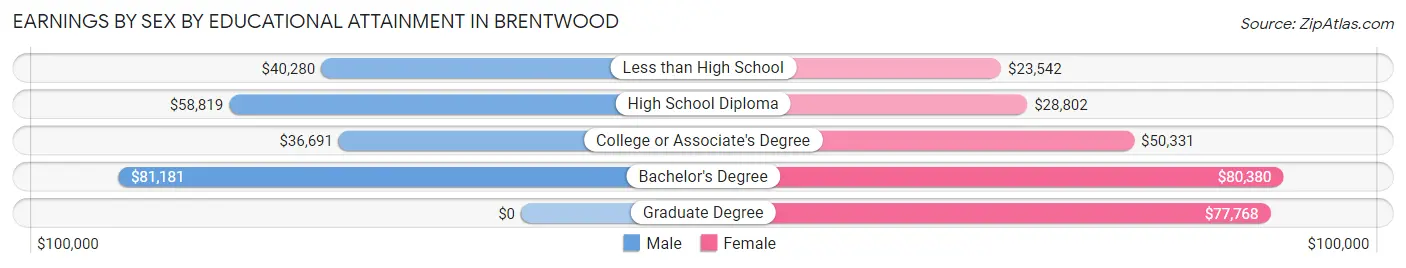
Earnings by Sex by Educational Attainment in Brentwood
Average earnings in Brentwood are $41,574 for men and $43,750 for women, a difference of 5.0%. Men with an educational attainment of bachelor's degree enjoy the highest average annual earnings of $81,181, while those with college or associate's degree education earn the least with $36,691. Women with an educational attainment of bachelor's degree earn the most with the average annual earnings of $80,380, while those with less than high school education have the smallest earnings of $23,542.
| Educational Attainment | Male Income | Female Income |
| Less than High School | $40,280 | $23,542 |
| High School Diploma | $58,819 | $28,802 |
| College or Associate's Degree | $36,691 | $50,331 |
| Bachelor's Degree | $81,181 | $80,380 |
| Graduate Degree | - | - |
| Total | $41,574 | $43,750 |
Family Income in Brentwood
Family Income Brackets in Brentwood
According to the Brentwood family income data, there are 182 families falling into the $100,000 to $149,999 income range, which is the most common income bracket and makes up 25.6% of all families. Conversely, the $15,000 to $24,999 income bracket is the least frequent group with only 7 families (1.0%) belonging to this category.
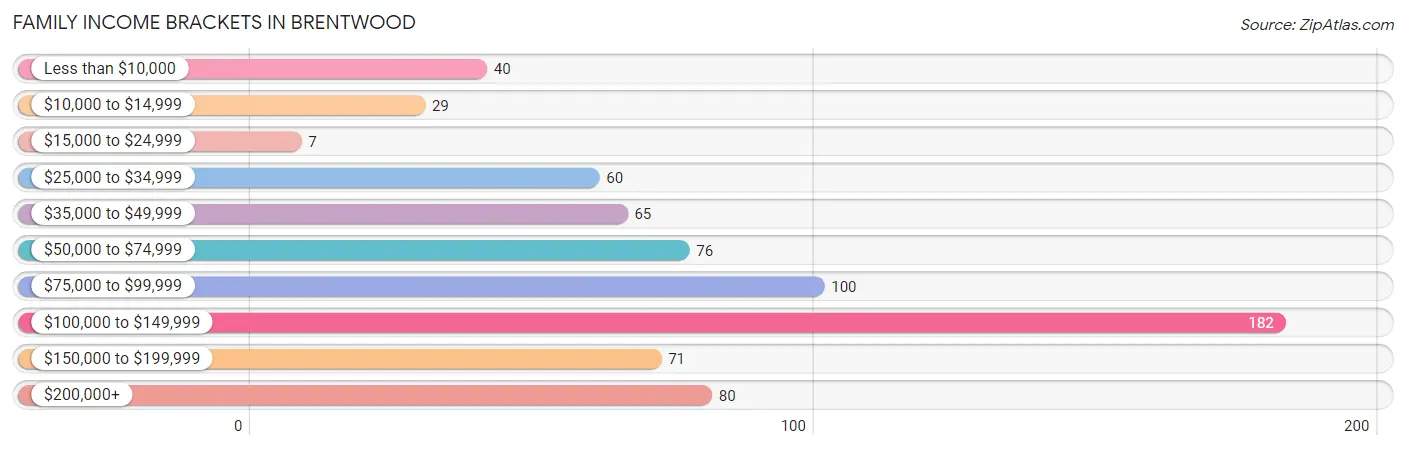
| Income Bracket | # Families | % Families |
| Less than $10,000 | 40 | 5.6% |
| $10,000 to $14,999 | 29 | 4.1% |
| $15,000 to $24,999 | 7 | 1.0% |
| $25,000 to $34,999 | 60 | 8.5% |
| $35,000 to $49,999 | 65 | 9.2% |
| $50,000 to $74,999 | 76 | 10.7% |
| $75,000 to $99,999 | 100 | 14.1% |
| $100,000 to $149,999 | 182 | 25.6% |
| $150,000 to $199,999 | 71 | 10.0% |
| $200,000+ | 80 | 11.3% |
Family Income by Famaliy Size in Brentwood
7+ person families (69 | 9.7%) account for the highest median family income in Brentwood with $250,001 per family, while 7+ person families (69 | 9.7%) have the highest median income of $35,714 per family member.
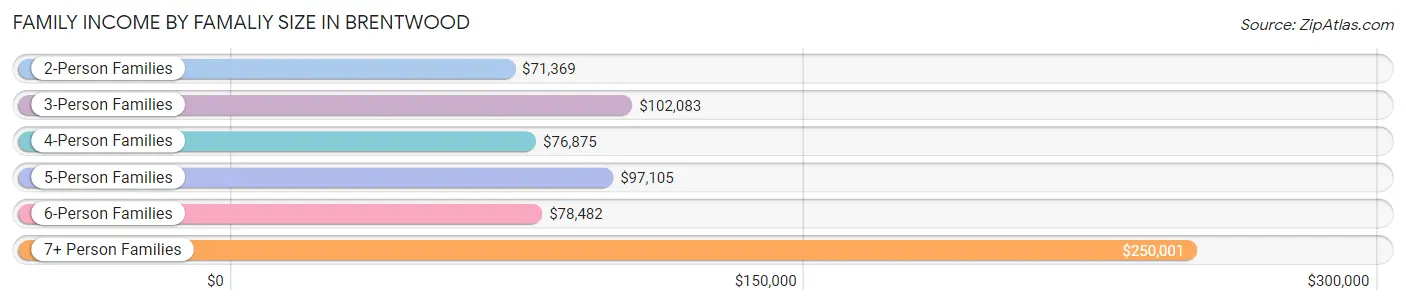
| Income Bracket | # Families | Median Income |
| 2-Person Families | 221 (31.1%) | $71,369 |
| 3-Person Families | 176 (24.8%) | $102,083 |
| 4-Person Families | 111 (15.6%) | $76,875 |
| 5-Person Families | 64 (9.0%) | $97,105 |
| 6-Person Families | 69 (9.7%) | $78,482 |
| 7+ Person Families | 69 (9.7%) | $250,001 |
| Total | 710 (100.0%) | $96,053 |
Family Income by Number of Earners in Brentwood
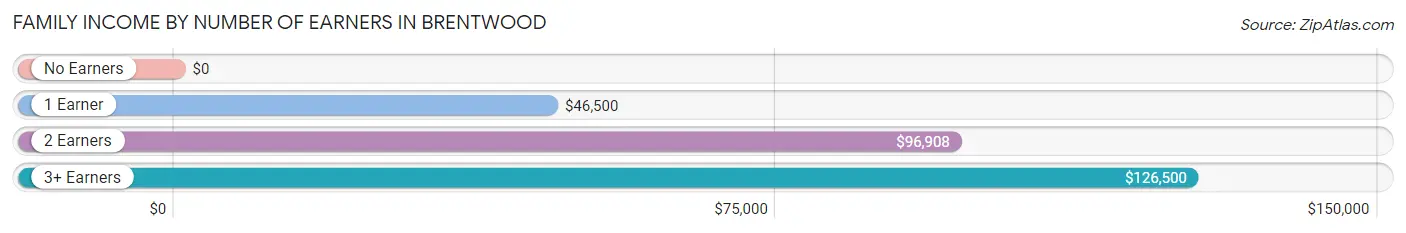
| Number of Earners | # Families | Median Income |
| No Earners | 34 (4.8%) | $0 |
| 1 Earner | 138 (19.4%) | $46,500 |
| 2 Earners | 384 (54.1%) | $96,908 |
| 3+ Earners | 154 (21.7%) | $126,500 |
| Total | 710 (100.0%) | $96,053 |
Household Income in Brentwood
Household Income Brackets in Brentwood
With 234 households falling in the category, the $75,000 to $99,999 income range is the most frequent in Brentwood, accounting for 18.1% of all households. In contrast, only 48 households (3.7%) fall into the $15,000 to $24,999 income bracket, making it the least populous group.
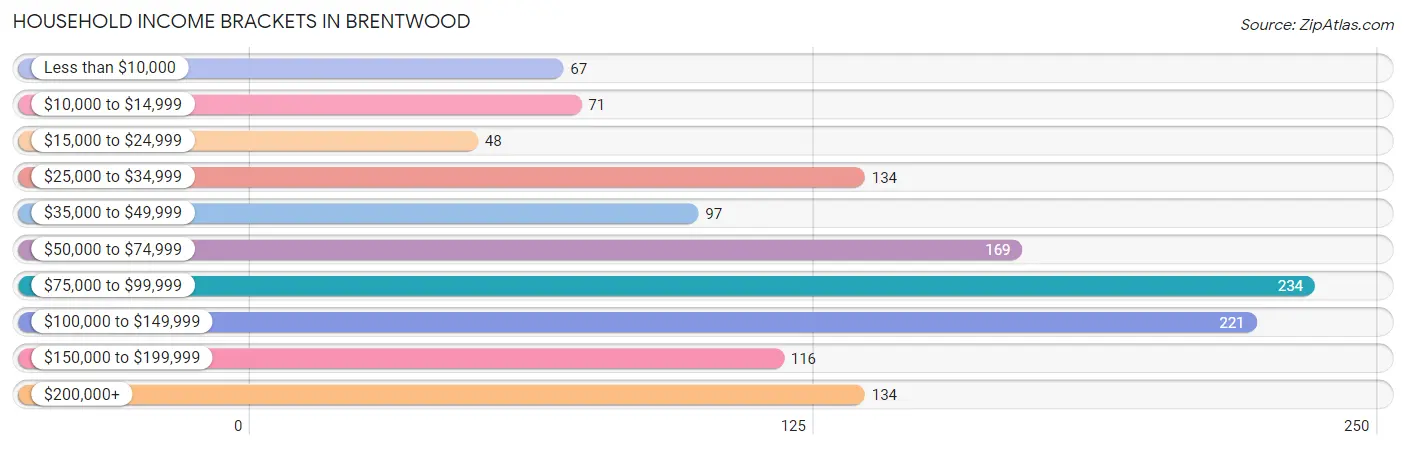
| Income Bracket | # Households | % Households |
| Less than $10,000 | 67 | 5.2% |
| $10,000 to $14,999 | 71 | 5.5% |
| $15,000 to $24,999 | 48 | 3.7% |
| $25,000 to $34,999 | 134 | 10.4% |
| $35,000 to $49,999 | 97 | 7.5% |
| $50,000 to $74,999 | 169 | 13.1% |
| $75,000 to $99,999 | 234 | 18.1% |
| $100,000 to $149,999 | 221 | 17.1% |
| $150,000 to $199,999 | 116 | 9.0% |
| $200,000+ | 134 | 10.4% |
Household Income by Householder Age in Brentwood
The median household income in Brentwood is $78,494, with the highest median household income of $87,097 found in the 45 to 64 years age bracket for the primary householder. A total of 340 households (26.3%) fall into this category. Meanwhile, the 15 to 24 years age bracket for the primary householder has the lowest median household income of $0, with 40 households (3.1%) in this group.
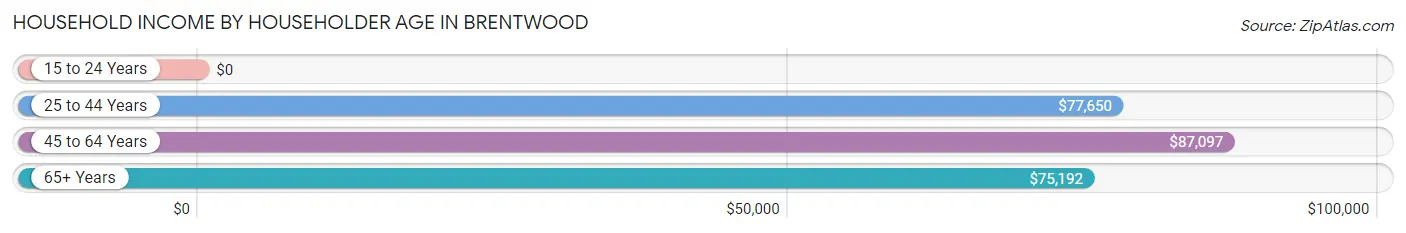
| Income Bracket | # Households | Median Income |
| 15 to 24 Years | 40 (3.1%) | $0 |
| 25 to 44 Years | 655 (50.7%) | $77,650 |
| 45 to 64 Years | 340 (26.3%) | $87,097 |
| 65+ Years | 258 (20.0%) | $75,192 |
| Total | 1,293 (100.0%) | $78,494 |
Poverty in Brentwood
Income Below Poverty by Sex and Age in Brentwood
With 12.1% poverty level for males and 14.1% for females among the residents of Brentwood, 55 to 64 year old males and 15 year old females are the most vulnerable to poverty, with 36 males (27.5%) and 21 females (77.8%) in their respective age groups living below the poverty level.
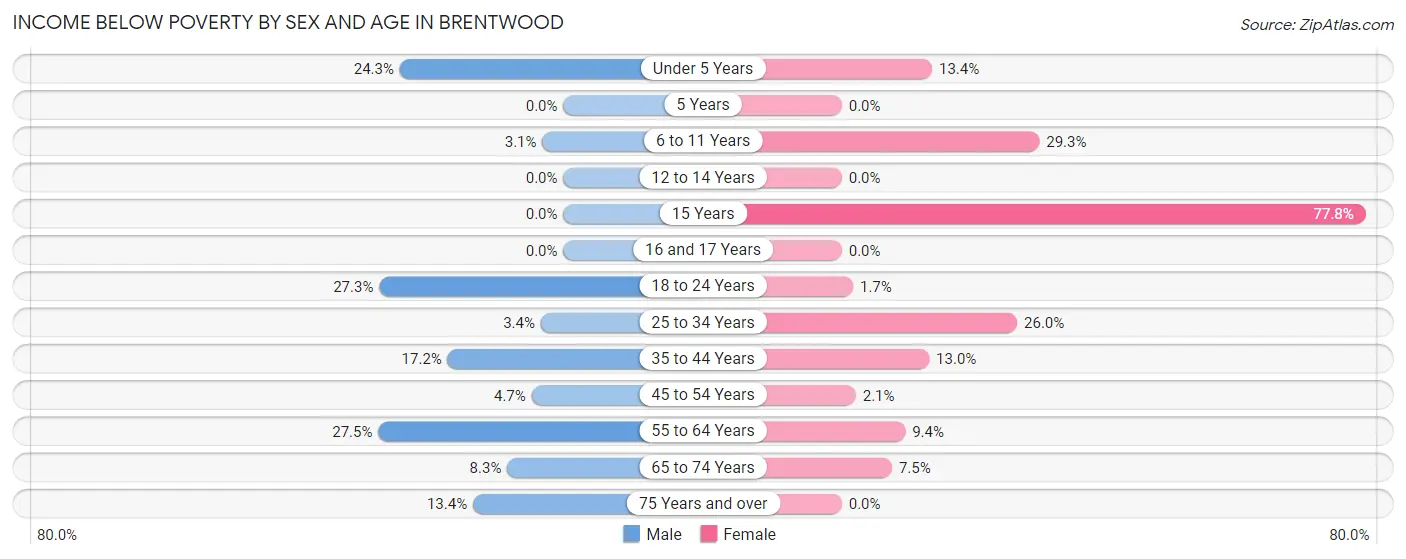
| Age Bracket | Male | Female |
| Under 5 Years | 51 (24.3%) | 13 (13.4%) |
| 5 Years | 0 (0.0%) | 0 (0.0%) |
| 6 to 11 Years | 5 (3.1%) | 61 (29.3%) |
| 12 to 14 Years | 0 (0.0%) | 0 (0.0%) |
| 15 Years | 0 (0.0%) | 21 (77.8%) |
| 16 and 17 Years | 0 (0.0%) | 0 (0.0%) |
| 18 to 24 Years | 35 (27.3%) | 3 (1.7%) |
| 25 to 34 Years | 13 (3.4%) | 101 (26.0%) |
| 35 to 44 Years | 39 (17.2%) | 41 (13.0%) |
| 45 to 54 Years | 9 (4.7%) | 6 (2.1%) |
| 55 to 64 Years | 36 (27.5%) | 21 (9.4%) |
| 65 to 74 Years | 10 (8.3%) | 7 (7.4%) |
| 75 Years and over | 20 (13.4%) | 0 (0.0%) |
| Total | 218 (12.1%) | 274 (14.1%) |
Income Above Poverty by Sex and Age in Brentwood
According to the poverty statistics in Brentwood, males aged 12 to 14 years and females aged 5 years are the age groups that are most secure financially, with 100.0% of males and 100.0% of females in these age groups living above the poverty line.
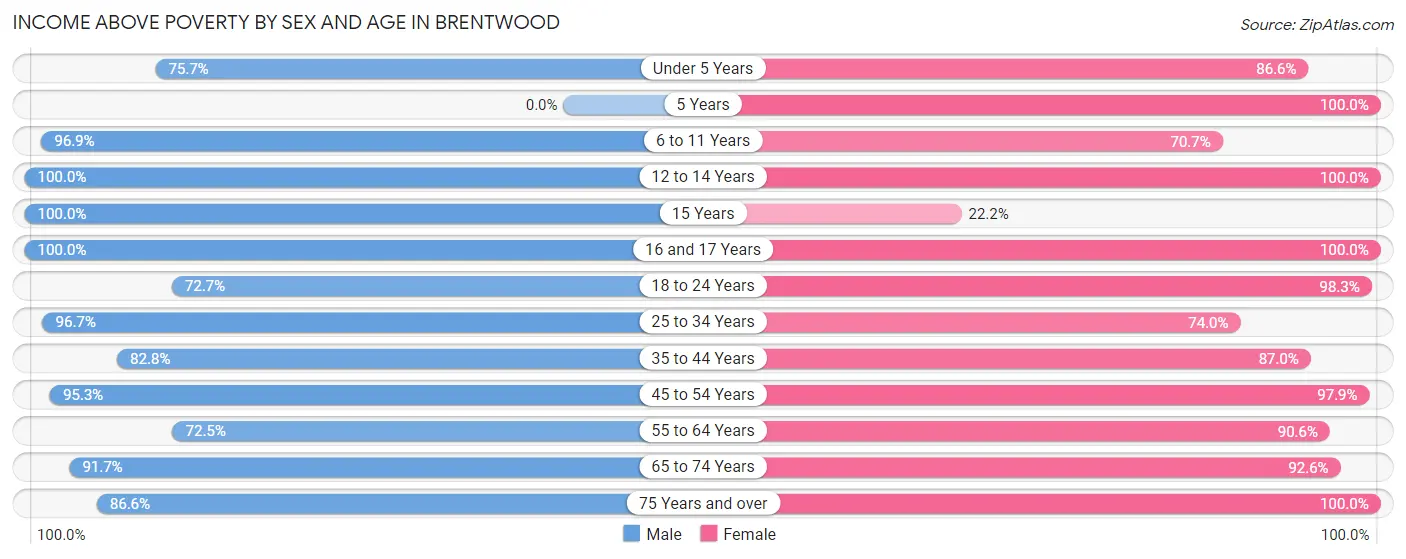
| Age Bracket | Male | Female |
| Under 5 Years | 159 (75.7%) | 84 (86.6%) |
| 5 Years | 0 (0.0%) | 16 (100.0%) |
| 6 to 11 Years | 155 (96.9%) | 147 (70.7%) |
| 12 to 14 Years | 18 (100.0%) | 51 (100.0%) |
| 15 Years | 28 (100.0%) | 6 (22.2%) |
| 16 and 17 Years | 52 (100.0%) | 7 (100.0%) |
| 18 to 24 Years | 93 (72.7%) | 177 (98.3%) |
| 25 to 34 Years | 375 (96.7%) | 287 (74.0%) |
| 35 to 44 Years | 188 (82.8%) | 275 (87.0%) |
| 45 to 54 Years | 182 (95.3%) | 283 (97.9%) |
| 55 to 64 Years | 95 (72.5%) | 202 (90.6%) |
| 65 to 74 Years | 110 (91.7%) | 87 (92.5%) |
| 75 Years and over | 129 (86.6%) | 52 (100.0%) |
| Total | 1,584 (87.9%) | 1,674 (85.9%) |
Income Below Poverty Among Married-Couple Families in Brentwood
The poverty statistics for married-couple families in Brentwood show that 2.3% or 11 of the total 473 families live below the poverty line. Families with 1 or 2 children have the highest poverty rate of 6.0%, comprising of 11 families. On the other hand, families with no children have the lowest poverty rate of 0.0%, which includes 0 families.
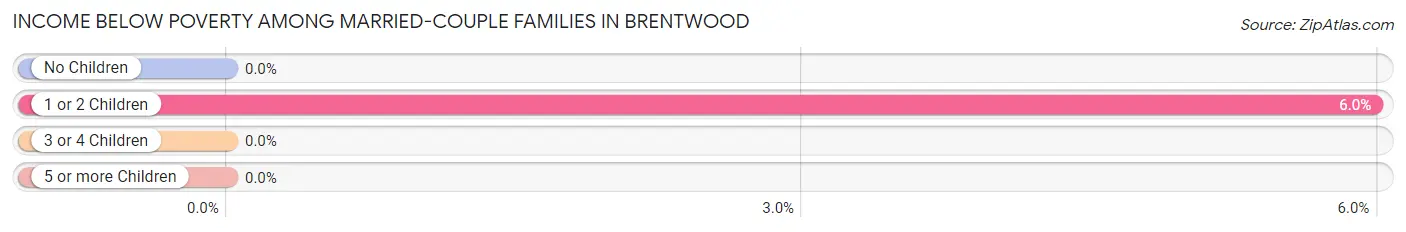
| Children | Above Poverty | Below Poverty |
| No Children | 241 (100.0%) | 0 (0.0%) |
| 1 or 2 Children | 173 (94.0%) | 11 (6.0%) |
| 3 or 4 Children | 48 (100.0%) | 0 (0.0%) |
| 5 or more Children | 0 (0.0%) | 0 (0.0%) |
| Total | 462 (97.7%) | 11 (2.3%) |
Income Below Poverty Among Single-Parent Households in Brentwood
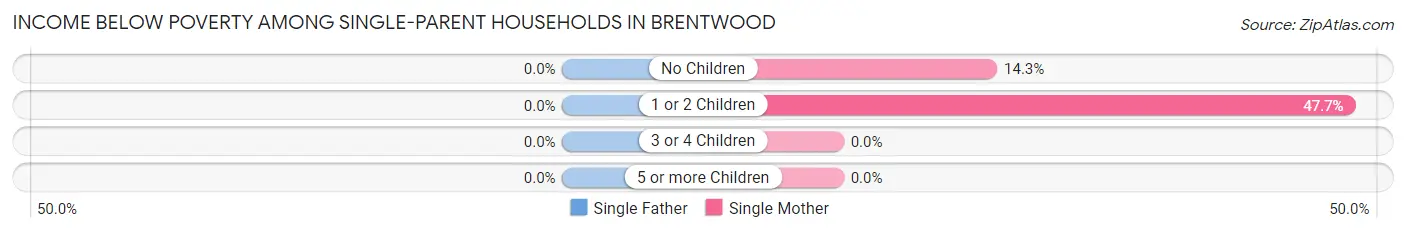
| Children | Single Father | Single Mother |
| No Children | 0 (0.0%) | 12 (14.3%) |
| 1 or 2 Children | 0 (0.0%) | 51 (47.7%) |
| 3 or 4 Children | 0 (0.0%) | 0 (0.0%) |
| 5 or more Children | 0 (0.0%) | 0 (0.0%) |
| Total | 0 (0.0%) | 63 (31.7%) |
Income Below Poverty Among Married-Couple vs Single-Parent Households in Brentwood
The poverty data for Brentwood shows that 11 of the married-couple family households (2.3%) and 63 of the single-parent households (26.6%) are living below the poverty level. Within the married-couple family households, those with 1 or 2 children have the highest poverty rate, with 11 households (6.0%) falling below the poverty line. Among the single-parent households, those with 1 or 2 children have the highest poverty rate, with 51 household (45.5%) living below poverty.
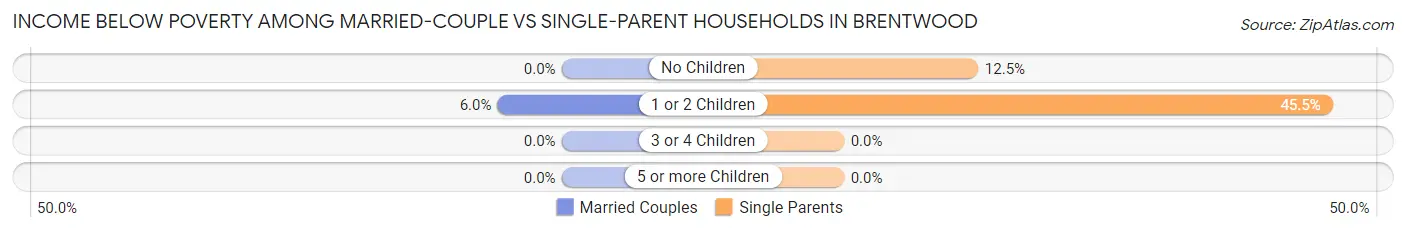
| Children | Married-Couple Families | Single-Parent Households |
| No Children | 0 (0.0%) | 12 (12.5%) |
| 1 or 2 Children | 11 (6.0%) | 51 (45.5%) |
| 3 or 4 Children | 0 (0.0%) | 0 (0.0%) |
| 5 or more Children | 0 (0.0%) | 0 (0.0%) |
| Total | 11 (2.3%) | 63 (26.6%) |
Race in Brentwood
The most populous races in Brentwood are Hispanic or Latino (1,873 | 49.5%), Black / African American (1,483 | 39.2%), and Some other Race (1,226 | 32.4%).
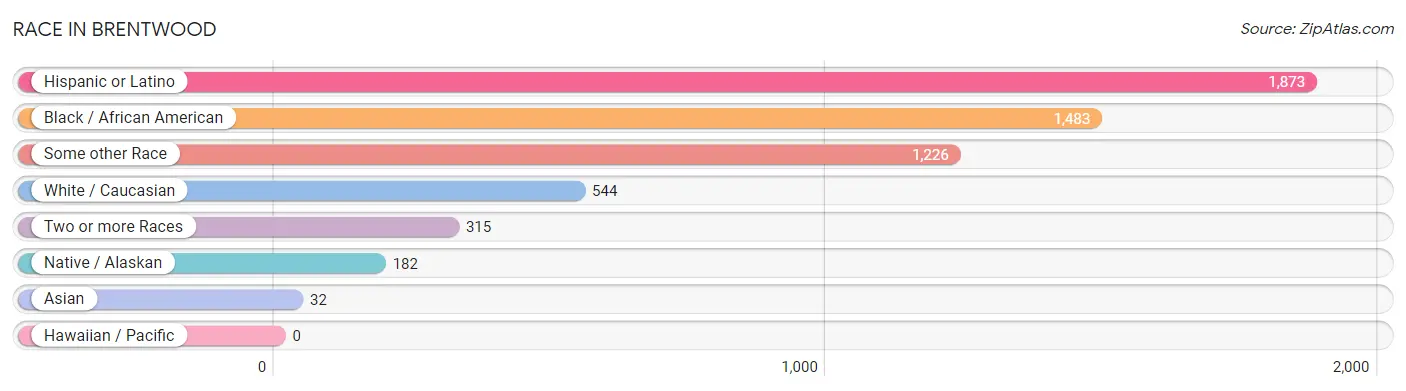
| Race | # Population | % Population |
| Asian | 32 | 0.9% |
| Black / African American | 1,483 | 39.2% |
| Hawaiian / Pacific | 0 | 0.0% |
| Hispanic or Latino | 1,873 | 49.5% |
| Native / Alaskan | 182 | 4.8% |
| White / Caucasian | 544 | 14.4% |
| Two or more Races | 315 | 8.3% |
| Some other Race | 1,226 | 32.4% |
| Total | 3,782 | 100.0% |
Ancestry in Brentwood
The most populous ancestries reported in Brentwood are Central American (1,360 | 36.0%), Salvadoran (1,023 | 27.1%), Mexican (288 | 7.6%), Subsaharan African (257 | 6.8%), and Guatemalan (237 | 6.3%), together accounting for 83.7% of all Brentwood residents.
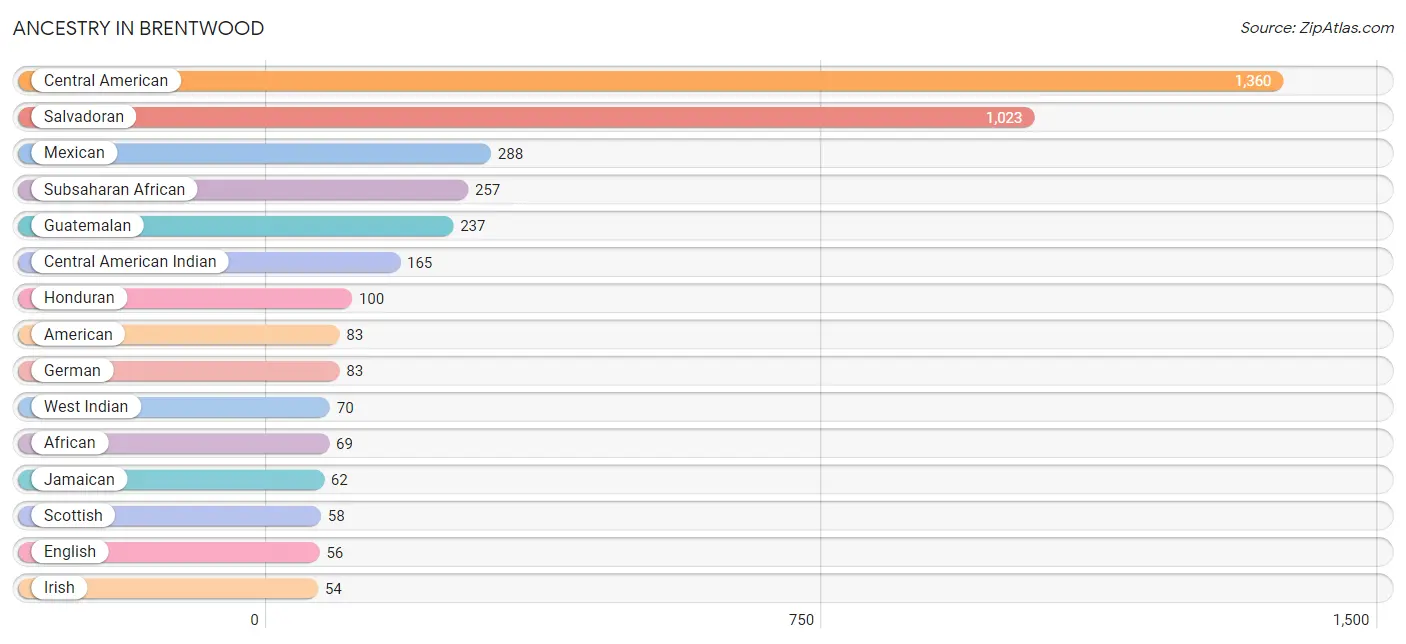
| Ancestry | # Population | % Population |
| African | 69 | 1.8% |
| American | 83 | 2.2% |
| Argentinean | 6 | 0.2% |
| Austrian | 7 | 0.2% |
| Belizean | 31 | 0.8% |
| Bhutanese | 3 | 0.1% |
| Bolivian | 47 | 1.2% |
| British | 21 | 0.6% |
| British West Indian | 17 | 0.4% |
| Cape Verdean | 34 | 0.9% |
| Central American | 1,360 | 36.0% |
| Central American Indian | 165 | 4.4% |
| Cuban | 19 | 0.5% |
| Danish | 5 | 0.1% |
| Dominican | 52 | 1.4% |
| Dutch | 6 | 0.2% |
| Eastern European | 7 | 0.2% |
| English | 56 | 1.5% |
| European | 43 | 1.1% |
| Finnish | 4 | 0.1% |
| French | 29 | 0.8% |
| French Canadian | 13 | 0.3% |
| German | 83 | 2.2% |
| Greek | 12 | 0.3% |
| Guatemalan | 237 | 6.3% |
| Guyanese | 10 | 0.3% |
| Haitian | 7 | 0.2% |
| Honduran | 100 | 2.6% |
| Indian (Asian) | 13 | 0.3% |
| Irish | 54 | 1.4% |
| Italian | 23 | 0.6% |
| Jamaican | 62 | 1.6% |
| Korean | 52 | 1.4% |
| Mexican | 288 | 7.6% |
| Mexican American Indian | 17 | 0.4% |
| Norwegian | 50 | 1.3% |
| Polish | 24 | 0.6% |
| Puerto Rican | 45 | 1.2% |
| Russian | 4 | 0.1% |
| Salvadoran | 1,023 | 27.1% |
| Scotch-Irish | 7 | 0.2% |
| Scottish | 58 | 1.5% |
| Senegalese | 14 | 0.4% |
| Sierra Leonean | 10 | 0.3% |
| South American | 53 | 1.4% |
| Subsaharan African | 257 | 6.8% |
| Swedish | 18 | 0.5% |
| Thai | 16 | 0.4% |
| Ukrainian | 7 | 0.2% |
| Welsh | 12 | 0.3% |
| West Indian | 70 | 1.8% | View All 51 Rows |
Immigrants in Brentwood
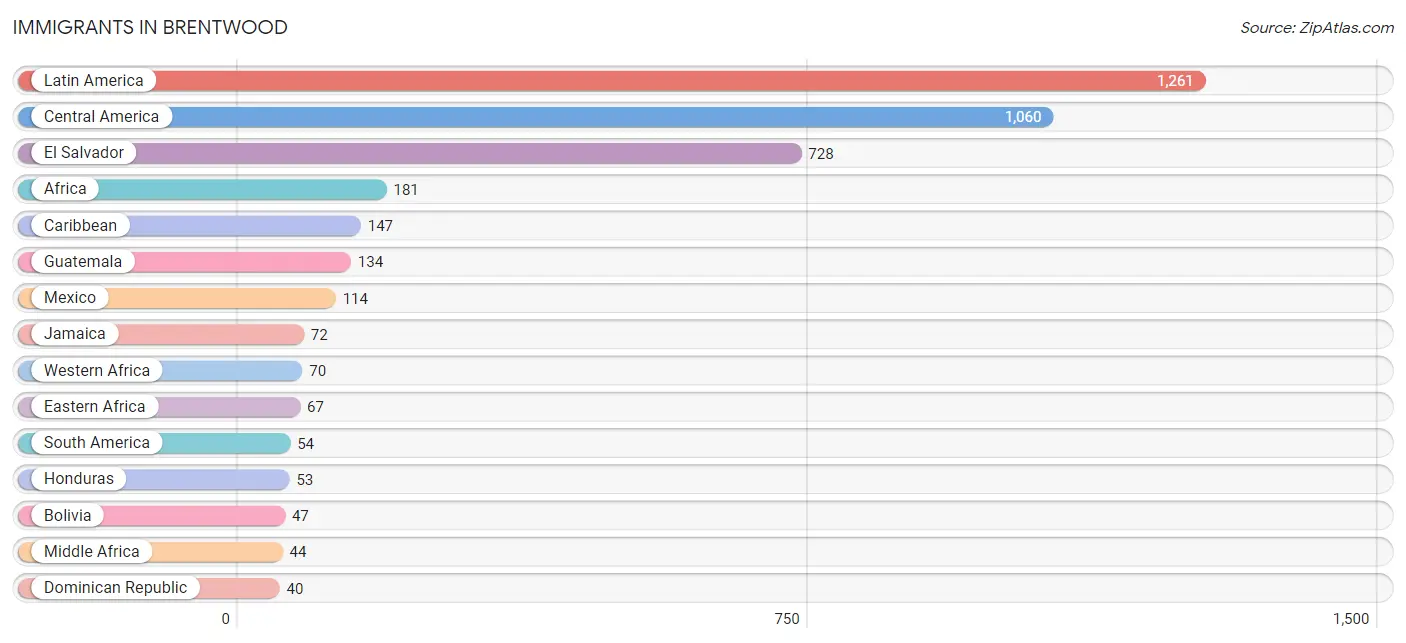
The most numerous immigrant groups reported in Brentwood came from Latin America (1,261 | 33.3%), Central America (1,060 | 28.0%), El Salvador (728 | 19.3%), Africa (181 | 4.8%), and Caribbean (147 | 3.9%), together accounting for 89.3% of all Brentwood residents.
| Immigration Origin | # Population | % Population |
| Africa | 181 | 4.8% |
| Asia | 25 | 0.7% |
| Belize | 31 | 0.8% |
| Bolivia | 47 | 1.2% |
| Cameroon | 26 | 0.7% |
| Caribbean | 147 | 3.9% |
| Central America | 1,060 | 28.0% |
| China | 13 | 0.3% |
| Dominica | 17 | 0.4% |
| Dominican Republic | 40 | 1.1% |
| Eastern Africa | 67 | 1.8% |
| Eastern Asia | 16 | 0.4% |
| Eastern Europe | 7 | 0.2% |
| El Salvador | 728 | 19.3% |
| Europe | 7 | 0.2% |
| Ghana | 17 | 0.4% |
| Guatemala | 134 | 3.5% |
| Guyana | 7 | 0.2% |
| Haiti | 3 | 0.1% |
| Honduras | 53 | 1.4% |
| Jamaica | 72 | 1.9% |
| Japan | 3 | 0.1% |
| Kenya | 5 | 0.1% |
| Latin America | 1,261 | 33.3% |
| Liberia | 14 | 0.4% |
| Mexico | 114 | 3.0% |
| Middle Africa | 44 | 1.2% |
| Philippines | 9 | 0.2% |
| Senegal | 14 | 0.4% |
| Sierra Leone | 10 | 0.3% |
| South America | 54 | 1.4% |
| South Eastern Asia | 9 | 0.2% |
| Ukraine | 7 | 0.2% |
| Western Africa | 70 | 1.8% | View All 34 Rows |
Sex and Age in Brentwood
Sex and Age in Brentwood
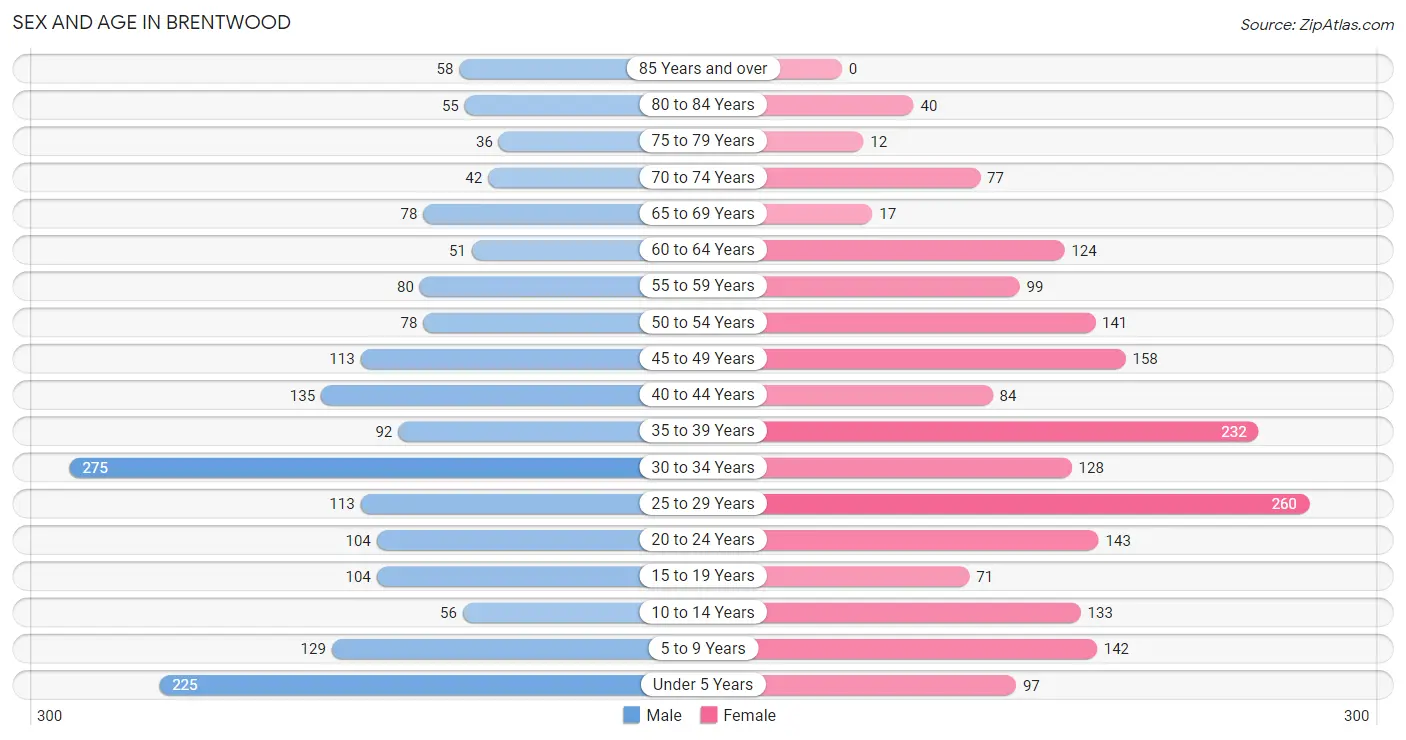
The most populous age groups in Brentwood are 30 to 34 Years (275 | 15.1%) for men and 25 to 29 Years (260 | 13.3%) for women.
| Age Bracket | Male | Female |
| Under 5 Years | 225 (12.3%) | 97 (5.0%) |
| 5 to 9 Years | 129 (7.1%) | 142 (7.2%) |
| 10 to 14 Years | 56 (3.1%) | 133 (6.8%) |
| 15 to 19 Years | 104 (5.7%) | 71 (3.6%) |
| 20 to 24 Years | 104 (5.7%) | 143 (7.3%) |
| 25 to 29 Years | 113 (6.2%) | 260 (13.3%) |
| 30 to 34 Years | 275 (15.1%) | 128 (6.5%) |
| 35 to 39 Years | 92 (5.0%) | 232 (11.8%) |
| 40 to 44 Years | 135 (7.4%) | 84 (4.3%) |
| 45 to 49 Years | 113 (6.2%) | 158 (8.1%) |
| 50 to 54 Years | 78 (4.3%) | 141 (7.2%) |
| 55 to 59 Years | 80 (4.4%) | 99 (5.1%) |
| 60 to 64 Years | 51 (2.8%) | 124 (6.3%) |
| 65 to 69 Years | 78 (4.3%) | 17 (0.9%) |
| 70 to 74 Years | 42 (2.3%) | 77 (3.9%) |
| 75 to 79 Years | 36 (2.0%) | 12 (0.6%) |
| 80 to 84 Years | 55 (3.0%) | 40 (2.0%) |
| 85 Years and over | 58 (3.2%) | 0 (0.0%) |
| Total | 1,824 (100.0%) | 1,958 (100.0%) |
Families and Households in Brentwood
Median Family Size in Brentwood
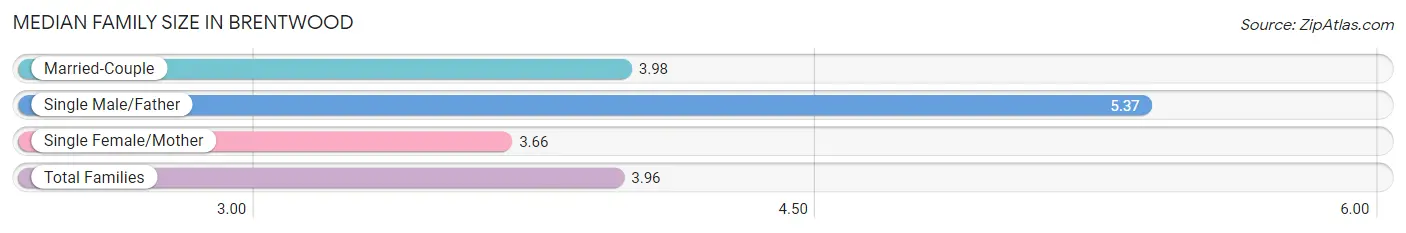
The median family size in Brentwood is 3.96 persons per family, with single male/father families (38 | 5.3%) accounting for the largest median family size of 5.37 persons per family. On the other hand, single female/mother families (199 | 28.0%) represent the smallest median family size with 3.66 persons per family.
| Family Type | # Families | Family Size |
| Married-Couple | 473 (66.6%) | 3.98 |
| Single Male/Father | 38 (5.3%) | 5.37 |
| Single Female/Mother | 199 (28.0%) | 3.66 |
| Total Families | 710 (100.0%) | 3.96 |
Median Household Size in Brentwood
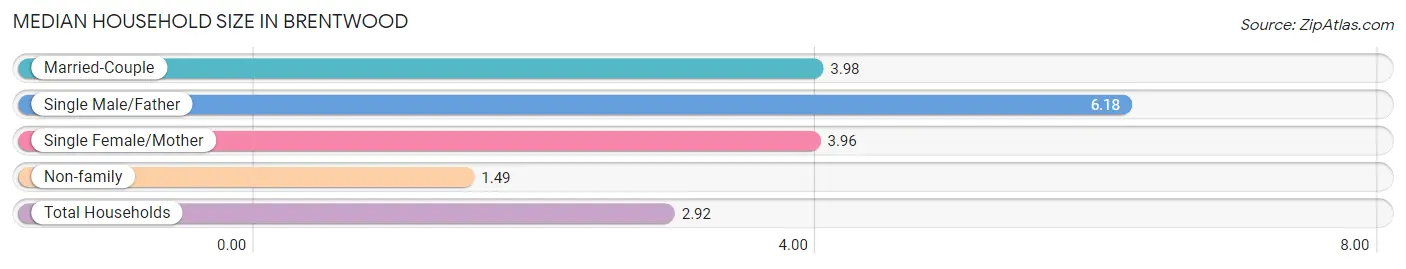
The median household size in Brentwood is 2.92 persons per household, with single male/father households (38 | 2.9%) accounting for the largest median household size of 6.18 persons per household. non-family households (583 | 45.1%) represent the smallest median household size with 1.49 persons per household.
| Household Type | # Households | Household Size |
| Married-Couple | 473 (36.6%) | 3.98 |
| Single Male/Father | 38 (2.9%) | 6.18 |
| Single Female/Mother | 199 (15.4%) | 3.96 |
| Non-family | 583 (45.1%) | 1.49 |
| Total Households | 1,293 (100.0%) | 2.92 |
Household Size by Marriage Status in Brentwood
Out of a total of 1,293 households in Brentwood, 710 (54.9%) are family households, while 583 (45.1%) are nonfamily households. The most numerous type of family households are 2-person households, comprising 211, and the most common type of nonfamily households are 1-person households, comprising 402.
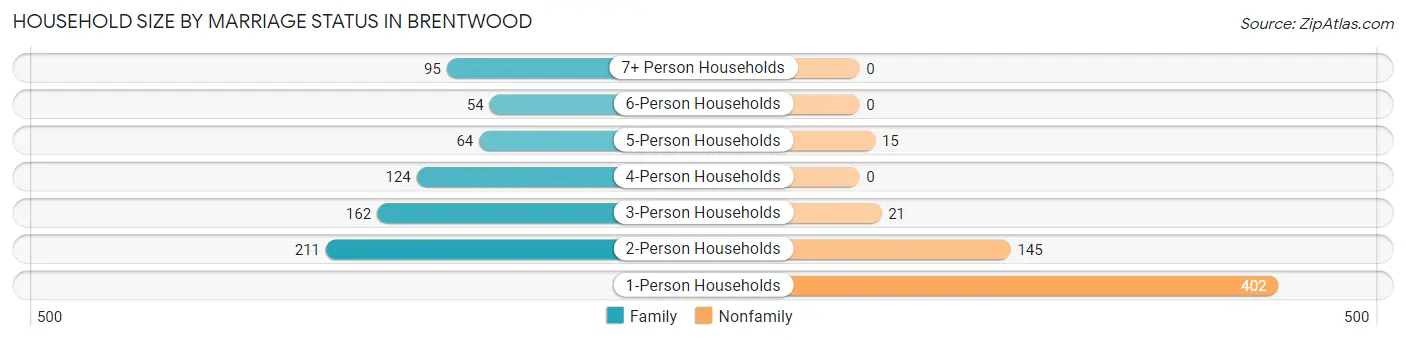
| Household Size | Family Households | Nonfamily Households |
| 1-Person Households | - | 402 (31.1%) |
| 2-Person Households | 211 (16.3%) | 145 (11.2%) |
| 3-Person Households | 162 (12.5%) | 21 (1.6%) |
| 4-Person Households | 124 (9.6%) | 0 (0.0%) |
| 5-Person Households | 64 (5.0%) | 15 (1.2%) |
| 6-Person Households | 54 (4.2%) | 0 (0.0%) |
| 7+ Person Households | 95 (7.3%) | 0 (0.0%) |
| Total | 710 (54.9%) | 583 (45.1%) |
Female Fertility in Brentwood
Fertility by Age in Brentwood
Average fertility rate in Brentwood is 82.0 births per 1,000 women. Women in the age bracket of 20 to 34 years have the highest fertility rate with 136.0 births per 1,000 women. Women in the age bracket of 20 to 34 years acount for 80.9% of all women with births.
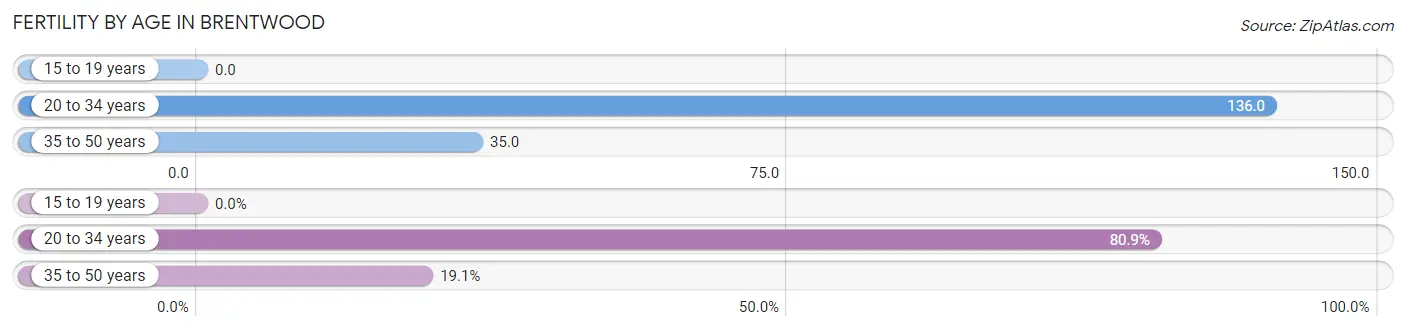
| Age Bracket | Women with Births | Births / 1,000 Women |
| 15 to 19 years | 0 (0.0%) | 0.0 |
| 20 to 34 years | 72 (80.9%) | 136.0 |
| 35 to 50 years | 17 (19.1%) | 35.0 |
| Total | 89 (100.0%) | 82.0 |
Fertility by Age by Marriage Status in Brentwood
43.8% of women with births (89) in Brentwood are married. The highest percentage of unmarried women with births falls into 20 to 34 years age bracket with 59.7% of them unmarried at the time of birth, while the lowest percentage of unmarried women with births belong to 35 to 50 years age bracket with 41.2% of them unmarried.
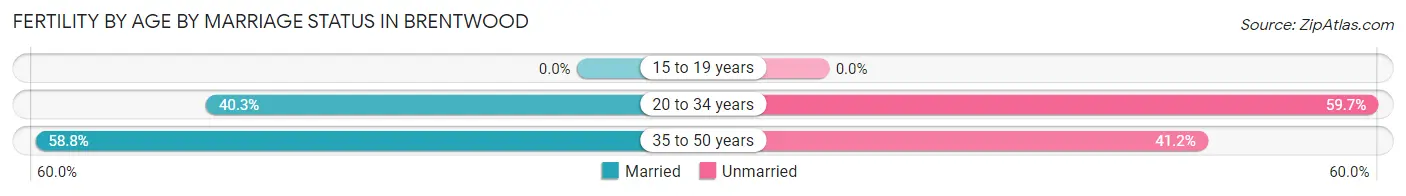
| Age Bracket | Married | Unmarried |
| 15 to 19 years | 0 (0.0%) | 0 (0.0%) |
| 20 to 34 years | 29 (40.3%) | 43 (59.7%) |
| 35 to 50 years | 10 (58.8%) | 7 (41.2%) |
| Total | 39 (43.8%) | 50 (56.2%) |
Fertility by Education in Brentwood
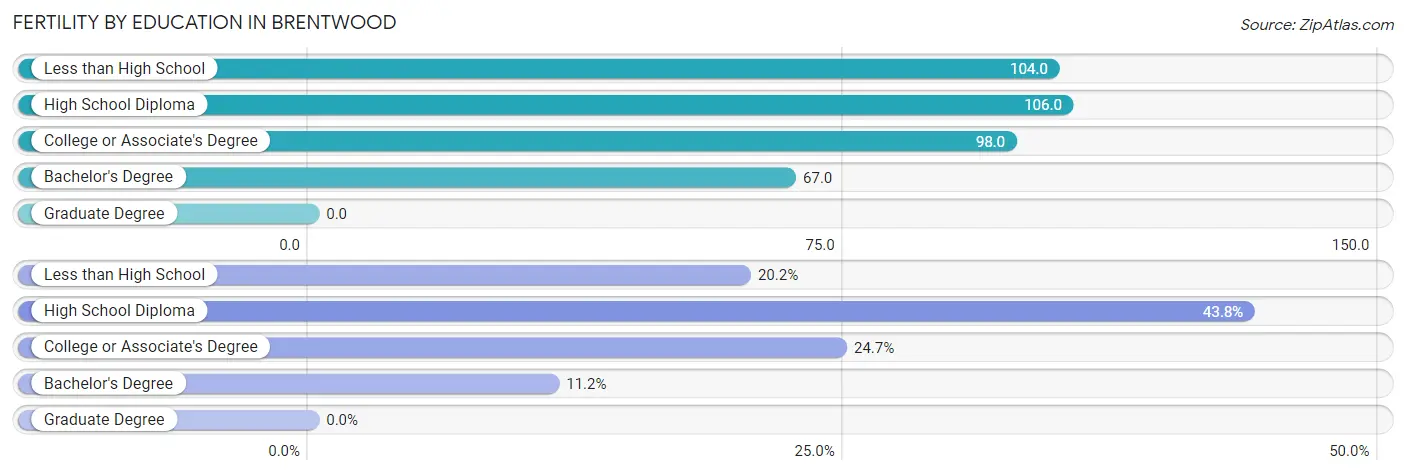
| Educational Attainment | Women with Births | Births / 1,000 Women |
| Less than High School | 18 (20.2%) | 104.0 |
| High School Diploma | 39 (43.8%) | 106.0 |
| College or Associate's Degree | 22 (24.7%) | 98.0 |
| Bachelor's Degree | 10 (11.2%) | 67.0 |
| Graduate Degree | 0 (0.0%) | 0.0 |
| Total | 89 (100.0%) | 82.0 |
Fertility by Education by Marriage Status in Brentwood
56.2% of women with births in Brentwood are unmarried. Women with the educational attainment of high school diploma are most likely to be married with 100.0% of them married at childbirth, while women with the educational attainment of less than high school are least likely to be married with 100.0% of them unmarried at childbirth.
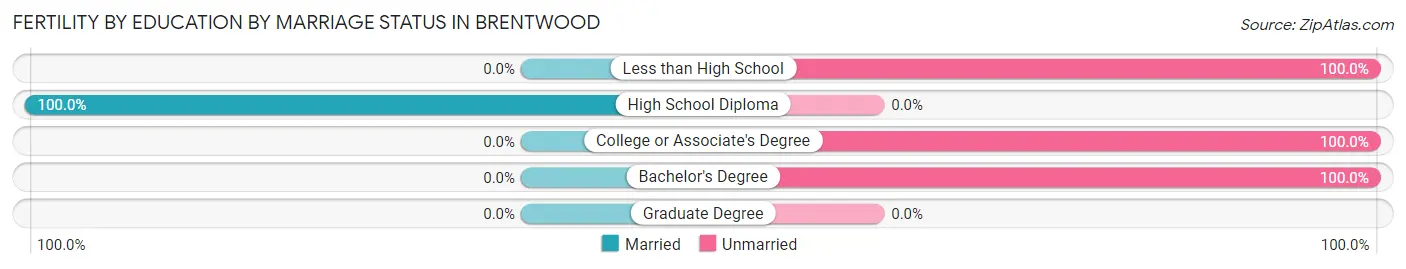
| Educational Attainment | Married | Unmarried |
| Less than High School | 0 (0.0%) | 18 (100.0%) |
| High School Diploma | 39 (100.0%) | 0 (0.0%) |
| College or Associate's Degree | 0 (0.0%) | 22 (100.0%) |
| Bachelor's Degree | 0 (0.0%) | 10 (100.0%) |
| Graduate Degree | 0 (0.0%) | 0 (0.0%) |
| Total | 39 (43.8%) | 50 (56.2%) |
Employment Characteristics in Brentwood
Employment by Class of Employer in Brentwood
Among the 1,982 employed individuals in Brentwood, private company employees (1,154 | 58.2%), federal government employees (241 | 12.2%), and not-for-profit organizations (188 | 9.5%) make up the most common classes of employment.
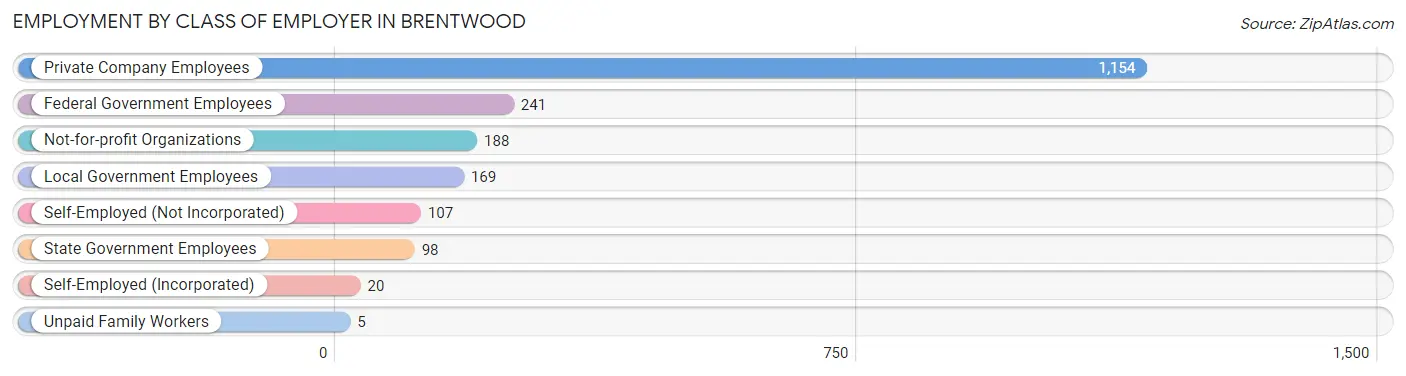
| Employer Class | # Employees | % Employees |
| Private Company Employees | 1,154 | 58.2% |
| Self-Employed (Incorporated) | 20 | 1.0% |
| Self-Employed (Not Incorporated) | 107 | 5.4% |
| Not-for-profit Organizations | 188 | 9.5% |
| Local Government Employees | 169 | 8.5% |
| State Government Employees | 98 | 4.9% |
| Federal Government Employees | 241 | 12.2% |
| Unpaid Family Workers | 5 | 0.3% |
| Total | 1,982 | 100.0% |
Employment Status by Age in Brentwood
According to the labor force statistics for Brentwood, out of the total population over 16 years of age (2,945), 73.1% or 2,153 individuals are in the labor force, with 5.6% or 121 of them unemployed. The age group with the highest labor force participation rate is 35 to 44 years, with 90.8% or 493 individuals in the labor force. Within the labor force, the 16 to 19 years age range has the highest percentage of unemployed individuals, with 51.3% or 20 of them being unemployed.
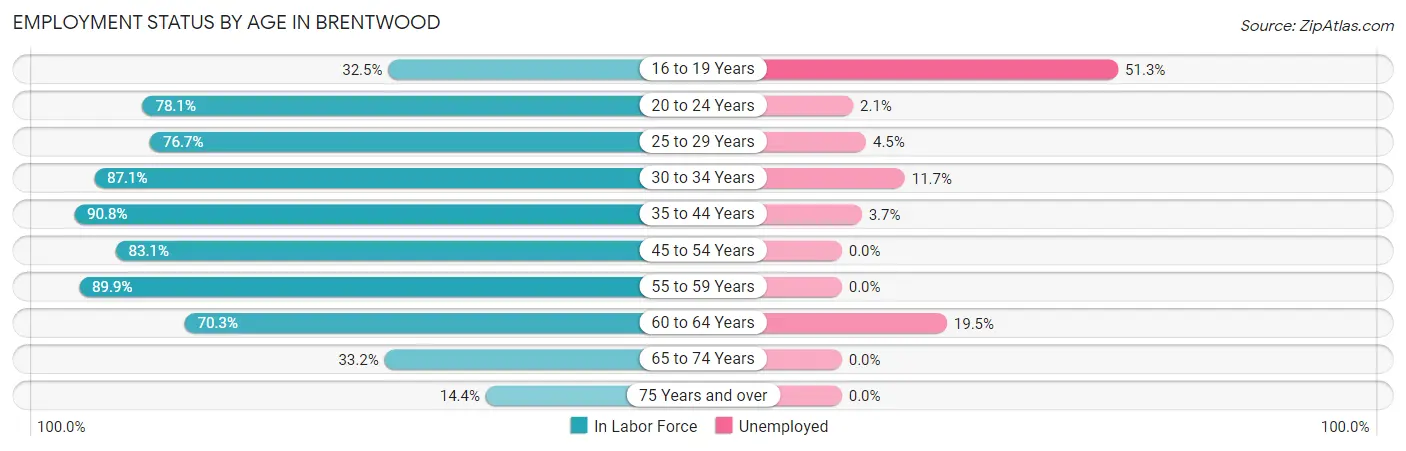
| Age Bracket | In Labor Force | Unemployed |
| 16 to 19 Years | 39 (32.5%) | 20 (51.3%) |
| 20 to 24 Years | 193 (78.1%) | 4 (2.1%) |
| 25 to 29 Years | 286 (76.7%) | 13 (4.5%) |
| 30 to 34 Years | 351 (87.1%) | 41 (11.7%) |
| 35 to 44 Years | 493 (90.8%) | 18 (3.7%) |
| 45 to 54 Years | 407 (83.1%) | 0 (0.0%) |
| 55 to 59 Years | 161 (89.9%) | 0 (0.0%) |
| 60 to 64 Years | 123 (70.3%) | 24 (19.5%) |
| 65 to 74 Years | 71 (33.2%) | 0 (0.0%) |
| 75 Years and over | 29 (14.4%) | 0 (0.0%) |
| Total | 2,153 (73.1%) | 121 (5.6%) |
Employment Status by Educational Attainment in Brentwood
According to labor force statistics for Brentwood, 84.2% of individuals (1,821) out of the total population between 25 and 64 years of age (2,163) are in the labor force, with 5.3% or 97 of them being unemployed. The group with the highest labor force participation rate are those with the educational attainment of bachelor's degree or higher, with 98.4% or 548 individuals in the labor force. Within the labor force, individuals with less than high school education have the highest percentage of unemployment, with 13.3% or 75 of them being unemployed.
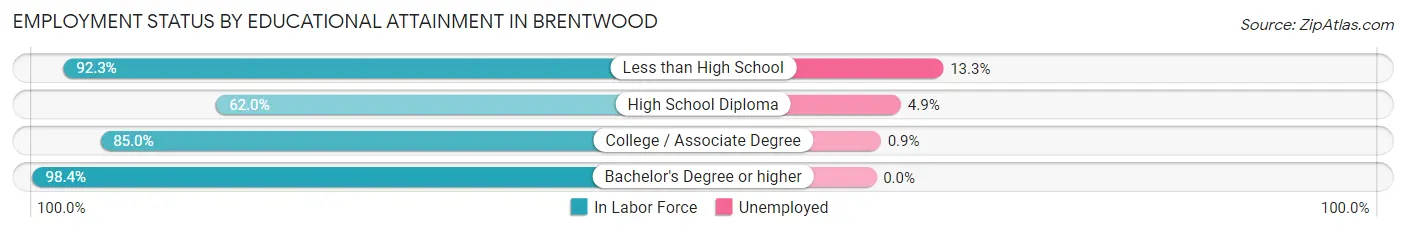
| Educational Attainment | In Labor Force | Unemployed |
| Less than High School | 563 (92.3%) | 81 (13.3%) |
| High School Diploma | 369 (62.0%) | 29 (4.9%) |
| College / Associate Degree | 341 (85.0%) | 4 (0.9%) |
| Bachelor's Degree or higher | 548 (98.4%) | 0 (0.0%) |
| Total | 1,821 (84.2%) | 115 (5.3%) |
Employment Occupations by Sex in Brentwood
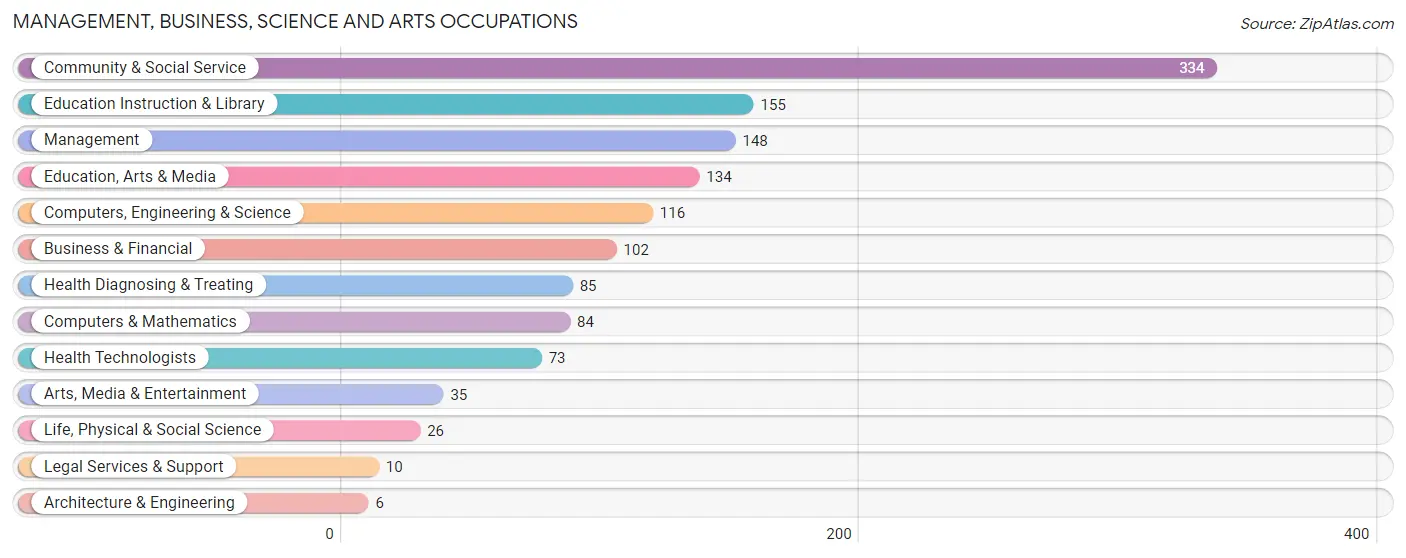
Management, Business, Science and Arts Occupations
The most common Management, Business, Science and Arts occupations in Brentwood are Community & Social Service (334 | 16.4%), Education Instruction & Library (155 | 7.6%), Management (148 | 7.3%), Education, Arts & Media (134 | 6.6%), and Computers, Engineering & Science (116 | 5.7%).
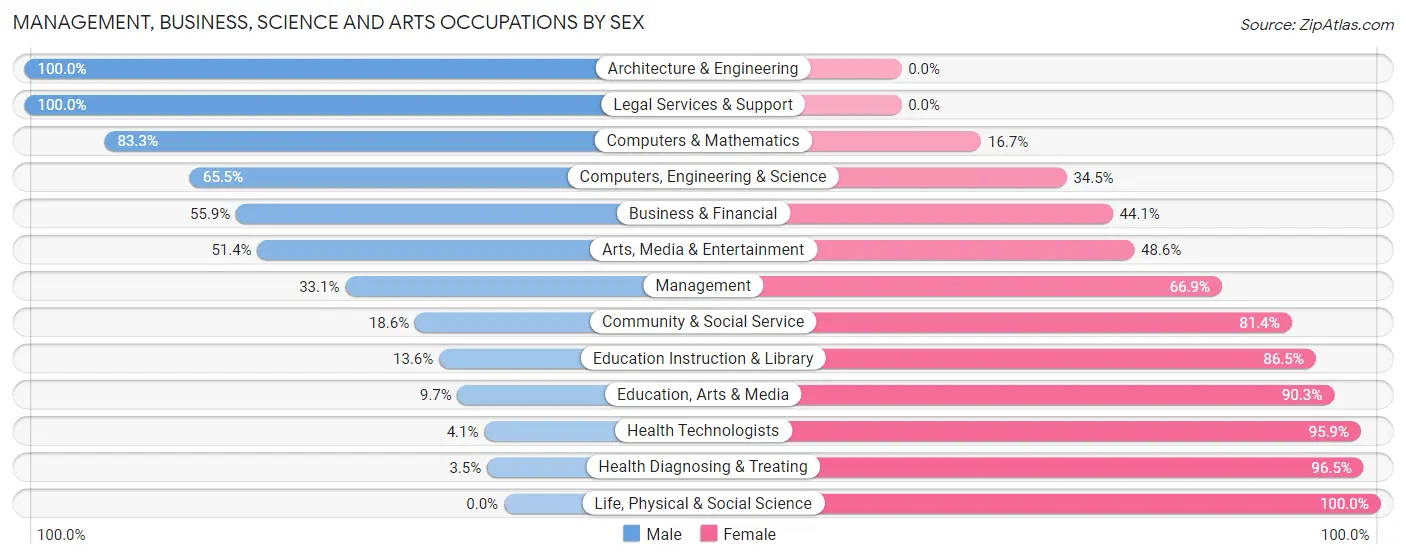
Management, Business, Science and Arts Occupations by Sex
Within the Management, Business, Science and Arts occupations in Brentwood, the most male-oriented occupations are Architecture & Engineering (100.0%), Legal Services & Support (100.0%), and Computers & Mathematics (83.3%), while the most female-oriented occupations are Life, Physical & Social Science (100.0%), Health Diagnosing & Treating (96.5%), and Health Technologists (95.9%).
| Occupation | Male | Female |
| Management | 49 (33.1%) | 99 (66.9%) |
| Business & Financial | 57 (55.9%) | 45 (44.1%) |
| Computers, Engineering & Science | 76 (65.5%) | 40 (34.5%) |
| Computers & Mathematics | 70 (83.3%) | 14 (16.7%) |
| Architecture & Engineering | 6 (100.0%) | 0 (0.0%) |
| Life, Physical & Social Science | 0 (0.0%) | 26 (100.0%) |
| Community & Social Service | 62 (18.6%) | 272 (81.4%) |
| Education, Arts & Media | 13 (9.7%) | 121 (90.3%) |
| Legal Services & Support | 10 (100.0%) | 0 (0.0%) |
| Education Instruction & Library | 21 (13.6%) | 134 (86.5%) |
| Arts, Media & Entertainment | 18 (51.4%) | 17 (48.6%) |
| Health Diagnosing & Treating | 3 (3.5%) | 82 (96.5%) |
| Health Technologists | 3 (4.1%) | 70 (95.9%) |
| Total (Category) | 247 (31.5%) | 538 (68.5%) |
| Total (Overall) | 914 (45.0%) | 1,119 (55.0%) |
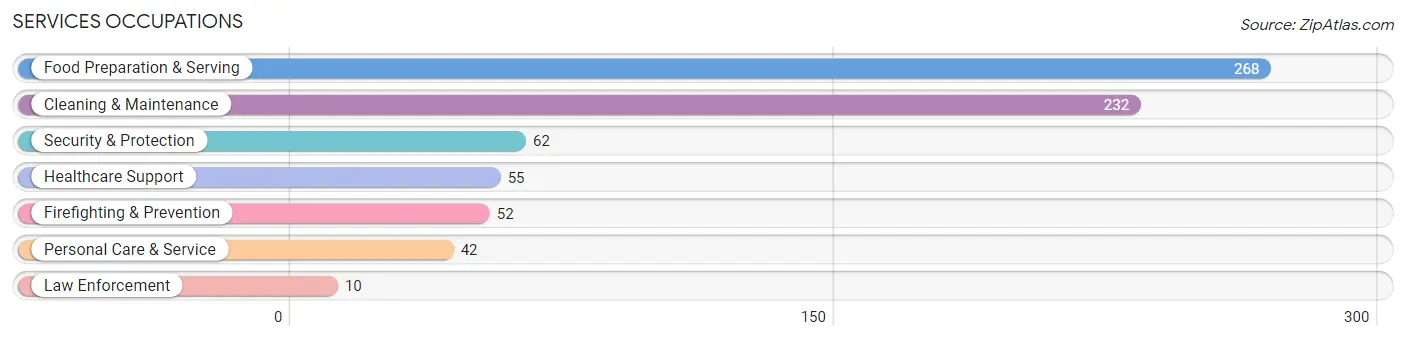
Services Occupations
The most common Services occupations in Brentwood are Food Preparation & Serving (268 | 13.2%), Cleaning & Maintenance (232 | 11.4%), Security & Protection (62 | 3.0%), Healthcare Support (55 | 2.7%), and Firefighting & Prevention (52 | 2.6%).
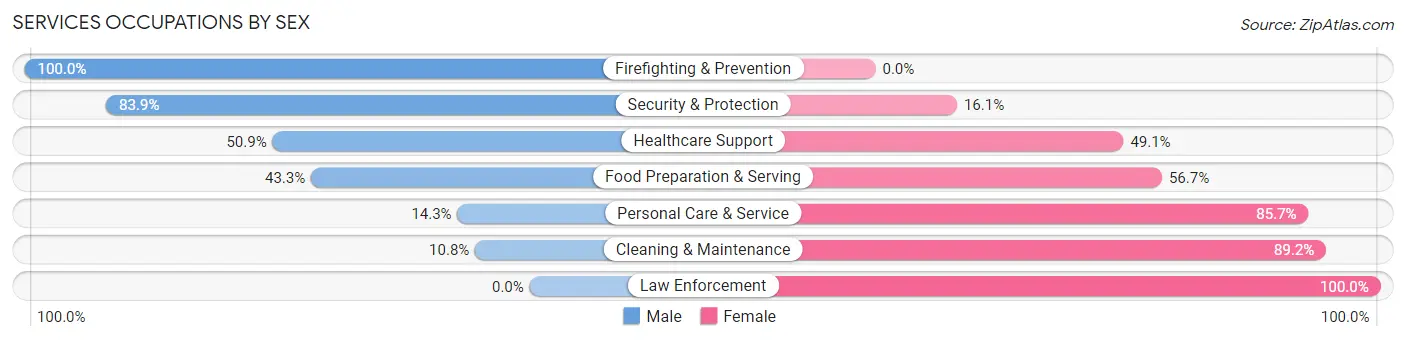
Services Occupations by Sex
Within the Services occupations in Brentwood, the most male-oriented occupations are Firefighting & Prevention (100.0%), Security & Protection (83.9%), and Healthcare Support (50.9%), while the most female-oriented occupations are Law Enforcement (100.0%), Cleaning & Maintenance (89.2%), and Personal Care & Service (85.7%).
| Occupation | Male | Female |
| Healthcare Support | 28 (50.9%) | 27 (49.1%) |
| Security & Protection | 52 (83.9%) | 10 (16.1%) |
| Firefighting & Prevention | 52 (100.0%) | 0 (0.0%) |
| Law Enforcement | 0 (0.0%) | 10 (100.0%) |
| Food Preparation & Serving | 116 (43.3%) | 152 (56.7%) |
| Cleaning & Maintenance | 25 (10.8%) | 207 (89.2%) |
| Personal Care & Service | 6 (14.3%) | 36 (85.7%) |
| Total (Category) | 227 (34.4%) | 432 (65.5%) |
| Total (Overall) | 914 (45.0%) | 1,119 (55.0%) |
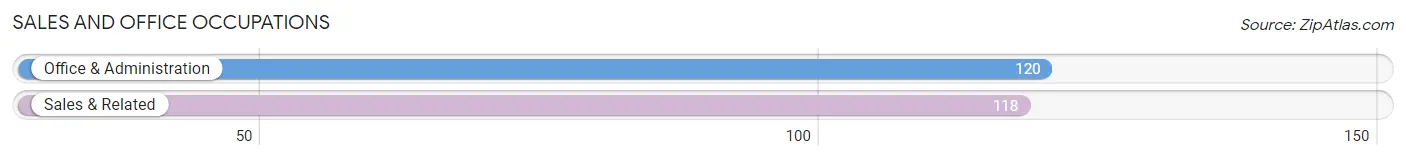
Sales and Office Occupations
The most common Sales and Office occupations in Brentwood are Office & Administration (120 | 5.9%), and Sales & Related (118 | 5.8%).
Sales and Office Occupations by Sex
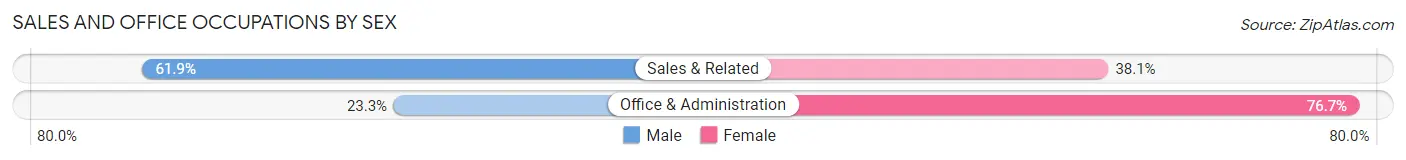
| Occupation | Male | Female |
| Sales & Related | 73 (61.9%) | 45 (38.1%) |
| Office & Administration | 28 (23.3%) | 92 (76.7%) |
| Total (Category) | 101 (42.4%) | 137 (57.6%) |
| Total (Overall) | 914 (45.0%) | 1,119 (55.0%) |
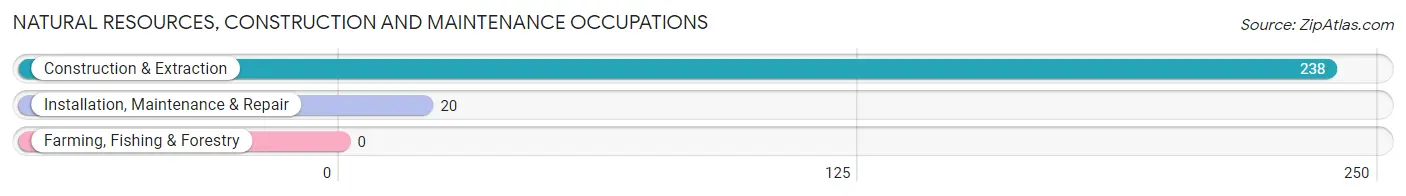
Natural Resources, Construction and Maintenance Occupations
The most common Natural Resources, Construction and Maintenance occupations in Brentwood are Construction & Extraction (238 | 11.7%), and Installation, Maintenance & Repair (20 | 1.0%).
Natural Resources, Construction and Maintenance Occupations by Sex
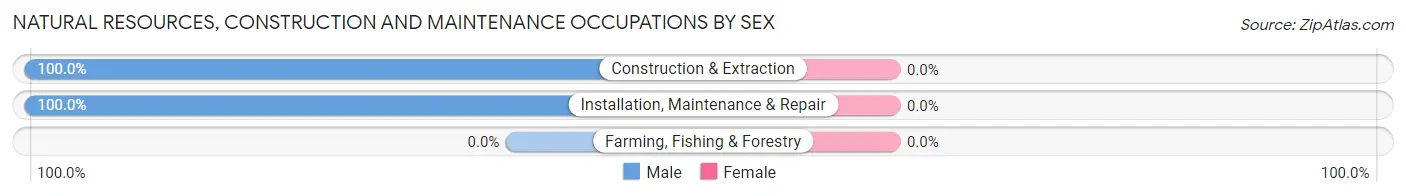
| Occupation | Male | Female |
| Farming, Fishing & Forestry | 0 (0.0%) | 0 (0.0%) |
| Construction & Extraction | 238 (100.0%) | 0 (0.0%) |
| Installation, Maintenance & Repair | 20 (100.0%) | 0 (0.0%) |
| Total (Category) | 258 (100.0%) | 0 (0.0%) |
| Total (Overall) | 914 (45.0%) | 1,119 (55.0%) |
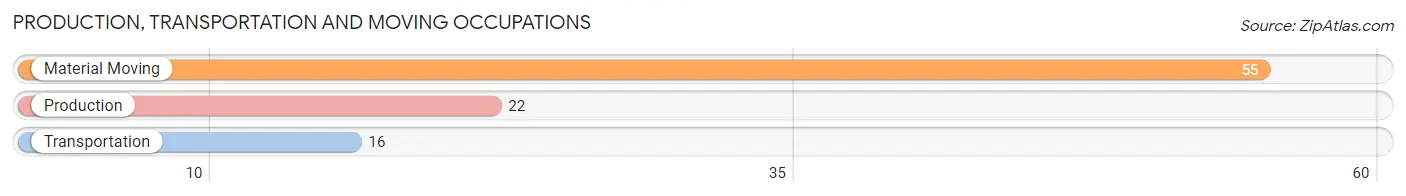
Production, Transportation and Moving Occupations
The most common Production, Transportation and Moving occupations in Brentwood are Material Moving (55 | 2.7%), Production (22 | 1.1%), and Transportation (16 | 0.8%).
Production, Transportation and Moving Occupations by Sex
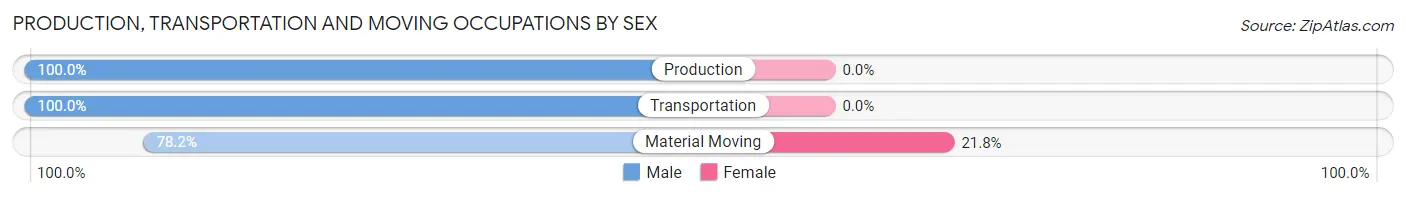
| Occupation | Male | Female |
| Production | 22 (100.0%) | 0 (0.0%) |
| Transportation | 16 (100.0%) | 0 (0.0%) |
| Material Moving | 43 (78.2%) | 12 (21.8%) |
| Total (Category) | 81 (87.1%) | 12 (12.9%) |
| Total (Overall) | 914 (45.0%) | 1,119 (55.0%) |
Employment Industries by Sex in Brentwood
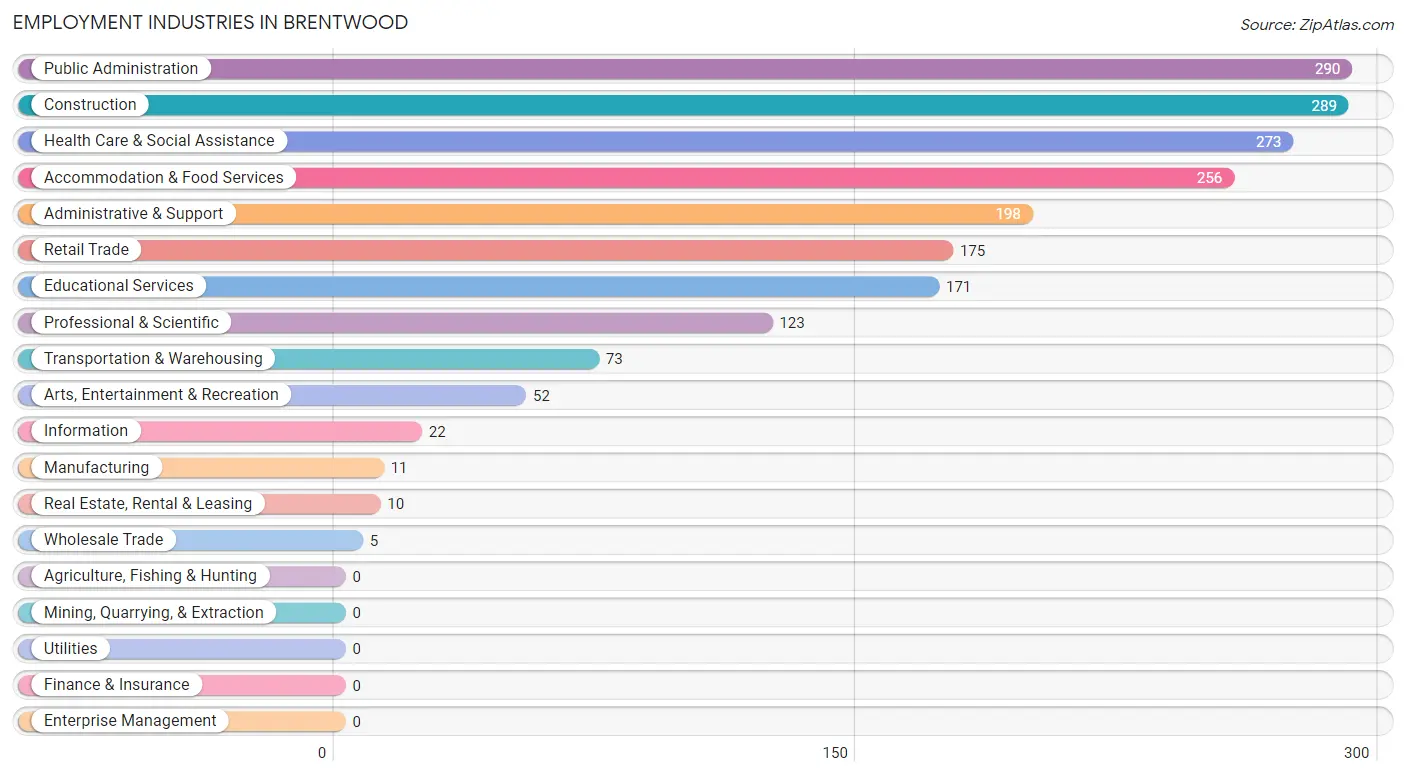
Employment Industries in Brentwood
The major employment industries in Brentwood include Public Administration (290 | 14.3%), Construction (289 | 14.2%), Health Care & Social Assistance (273 | 13.4%), Accommodation & Food Services (256 | 12.6%), and Administrative & Support (198 | 9.7%).
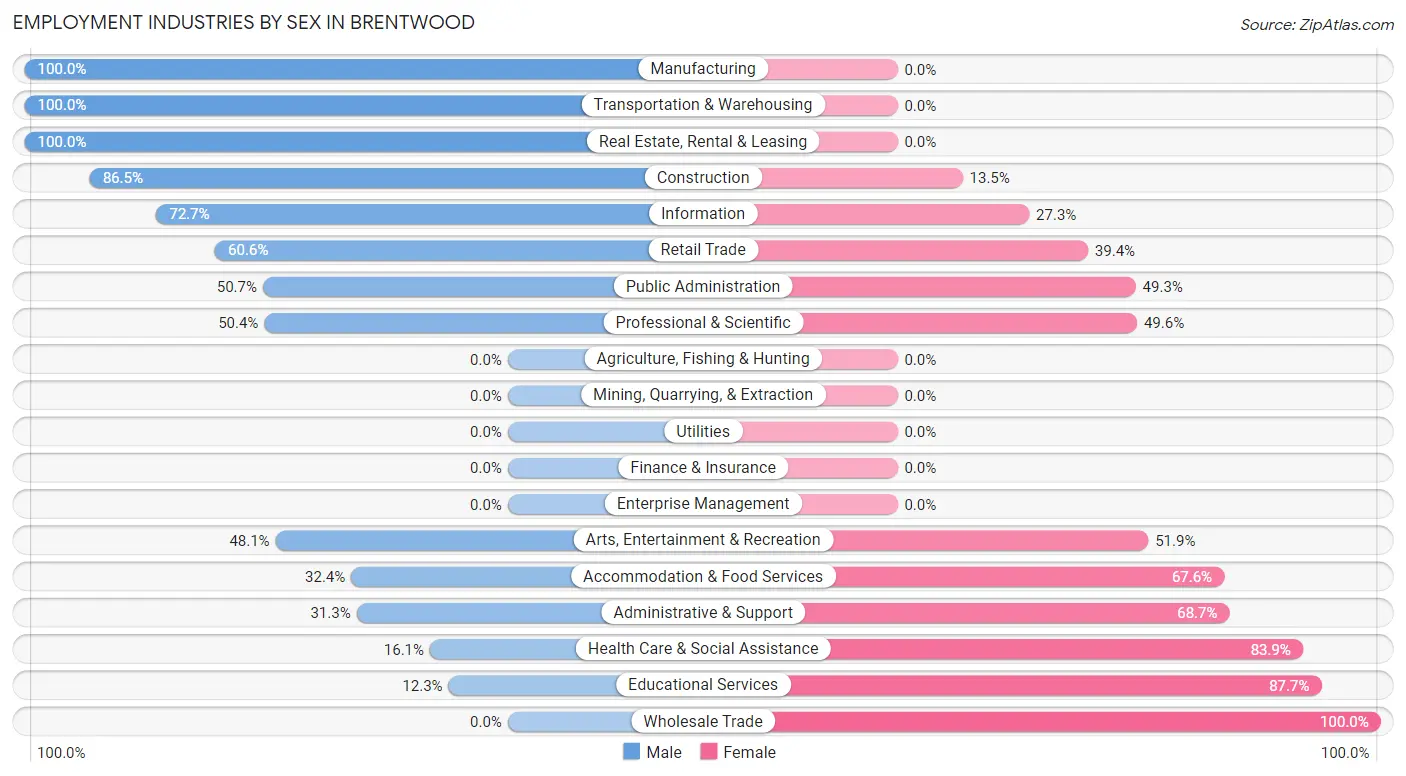
Employment Industries by Sex in Brentwood
The Brentwood industries that see more men than women are Manufacturing (100.0%), Transportation & Warehousing (100.0%), and Real Estate, Rental & Leasing (100.0%), whereas the industries that tend to have a higher number of women are Wholesale Trade (100.0%), Educational Services (87.7%), and Health Care & Social Assistance (83.9%).
| Industry | Male | Female |
| Agriculture, Fishing & Hunting | 0 (0.0%) | 0 (0.0%) |
| Mining, Quarrying, & Extraction | 0 (0.0%) | 0 (0.0%) |
| Construction | 250 (86.5%) | 39 (13.5%) |
| Manufacturing | 11 (100.0%) | 0 (0.0%) |
| Wholesale Trade | 0 (0.0%) | 5 (100.0%) |
| Retail Trade | 106 (60.6%) | 69 (39.4%) |
| Transportation & Warehousing | 73 (100.0%) | 0 (0.0%) |
| Utilities | 0 (0.0%) | 0 (0.0%) |
| Information | 16 (72.7%) | 6 (27.3%) |
| Finance & Insurance | 0 (0.0%) | 0 (0.0%) |
| Real Estate, Rental & Leasing | 10 (100.0%) | 0 (0.0%) |
| Professional & Scientific | 62 (50.4%) | 61 (49.6%) |
| Enterprise Management | 0 (0.0%) | 0 (0.0%) |
| Administrative & Support | 62 (31.3%) | 136 (68.7%) |
| Educational Services | 21 (12.3%) | 150 (87.7%) |
| Health Care & Social Assistance | 44 (16.1%) | 229 (83.9%) |
| Arts, Entertainment & Recreation | 25 (48.1%) | 27 (51.9%) |
| Accommodation & Food Services | 83 (32.4%) | 173 (67.6%) |
| Public Administration | 147 (50.7%) | 143 (49.3%) |
| Total | 914 (45.0%) | 1,119 (55.0%) |
Education in Brentwood
School Enrollment in Brentwood
The most common levels of schooling among the 863 students in Brentwood are elementary school (270 | 31.3%), high school (172 | 19.9%), and college / undergraduate (162 | 18.8%).
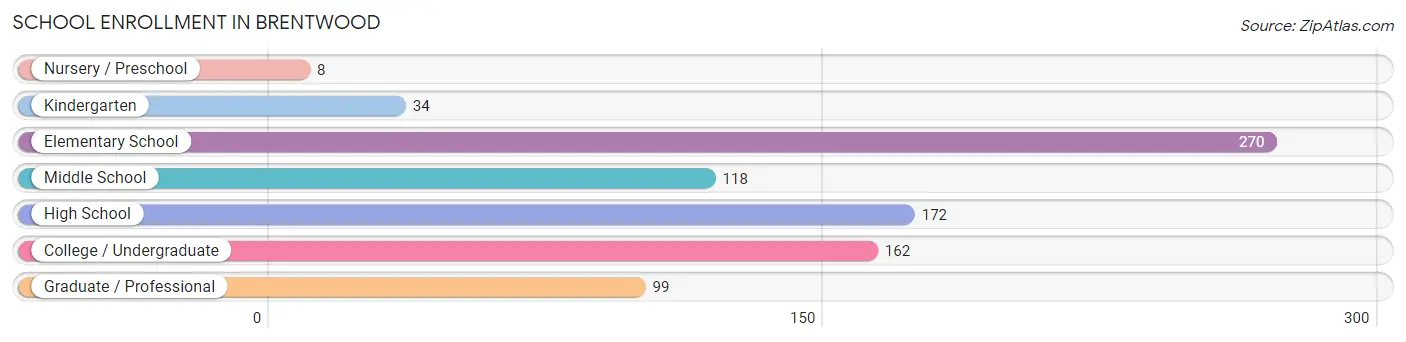
| School Level | # Students | % Students |
| Nursery / Preschool | 8 | 0.9% |
| Kindergarten | 34 | 3.9% |
| Elementary School | 270 | 31.3% |
| Middle School | 118 | 13.7% |
| High School | 172 | 19.9% |
| College / Undergraduate | 162 | 18.8% |
| Graduate / Professional | 99 | 11.5% |
| Total | 863 | 100.0% |
School Enrollment by Age by Funding Source in Brentwood
Out of a total of 863 students who are enrolled in schools in Brentwood, 73 (8.5%) attend a private institution, while the remaining 790 (91.5%) are enrolled in public schools. The age group of 3 to 4 year olds has the highest likelihood of being enrolled in private schools, with 8 (100.0% in the age bracket) enrolled. Conversely, the age group of 10 to 14 year olds has the lowest likelihood of being enrolled in a private school, with 189 (100.0% in the age bracket) attending a public institution.
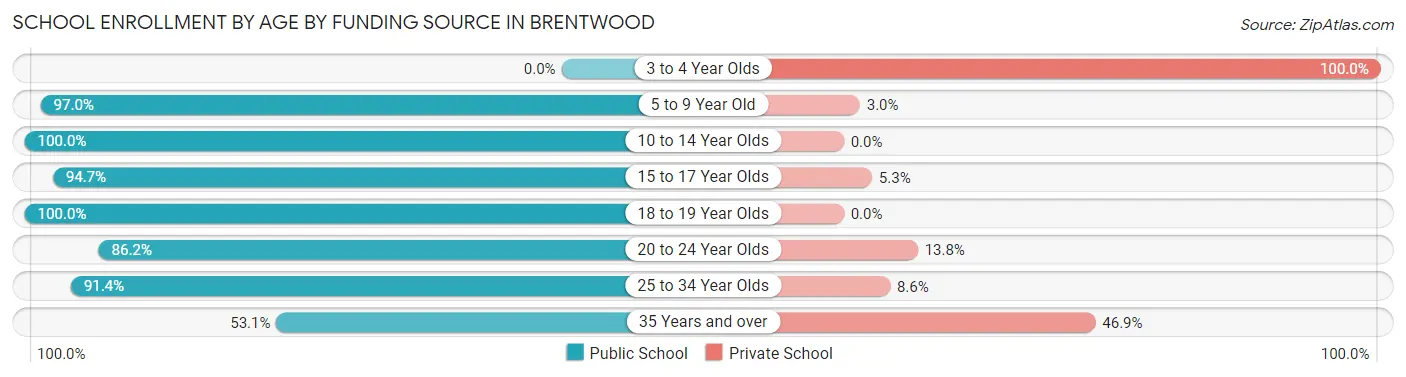
| Age Bracket | Public School | Private School |
| 3 to 4 Year Olds | 0 (0.0%) | 8 (100.0%) |
| 5 to 9 Year Old | 226 (97.0%) | 7 (3.0%) |
| 10 to 14 Year Olds | 189 (100.0%) | 0 (0.0%) |
| 15 to 17 Year Olds | 108 (94.7%) | 6 (5.3%) |
| 18 to 19 Year Olds | 52 (100.0%) | 0 (0.0%) |
| 20 to 24 Year Olds | 75 (86.2%) | 12 (13.8%) |
| 25 to 34 Year Olds | 106 (91.4%) | 10 (8.6%) |
| 35 Years and over | 34 (53.1%) | 30 (46.9%) |
| Total | 790 (91.5%) | 73 (8.5%) |
Educational Attainment by Field of Study in Brentwood
Social sciences (89 | 12.3%), business (82 | 11.3%), arts & humanities (79 | 10.9%), science & technology (72 | 9.9%), and liberal arts & history (67 | 9.2%) are the most common fields of study among 725 individuals in Brentwood who have obtained a bachelor's degree or higher.
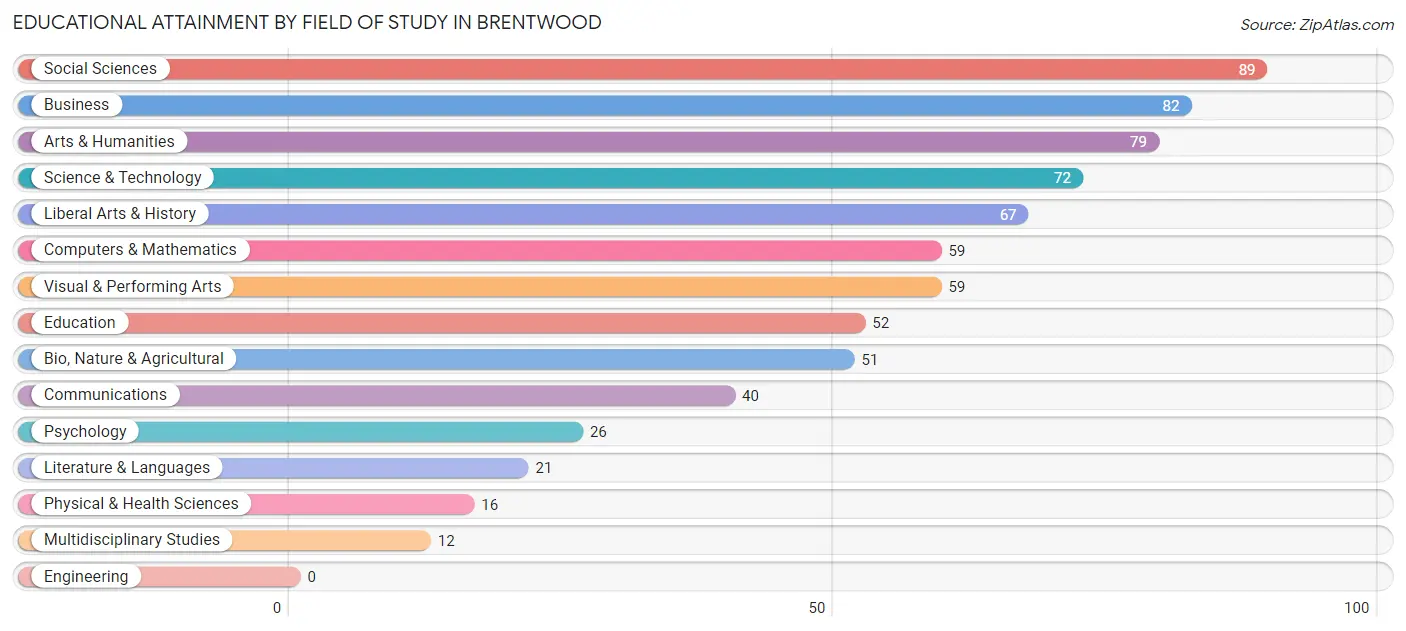
| Field of Study | # Graduates | % Graduates |
| Computers & Mathematics | 59 | 8.1% |
| Bio, Nature & Agricultural | 51 | 7.0% |
| Physical & Health Sciences | 16 | 2.2% |
| Psychology | 26 | 3.6% |
| Social Sciences | 89 | 12.3% |
| Engineering | 0 | 0.0% |
| Multidisciplinary Studies | 12 | 1.7% |
| Science & Technology | 72 | 9.9% |
| Business | 82 | 11.3% |
| Education | 52 | 7.2% |
| Literature & Languages | 21 | 2.9% |
| Liberal Arts & History | 67 | 9.2% |
| Visual & Performing Arts | 59 | 8.1% |
| Communications | 40 | 5.5% |
| Arts & Humanities | 79 | 10.9% |
| Total | 725 | 100.0% |
Transportation & Commute in Brentwood
Vehicle Availability by Sex in Brentwood
The most prevalent vehicle ownership categories in Brentwood are males with 1 vehicle (298, accounting for 33.3%) and females with 1 vehicle (361, making up 27.4%).
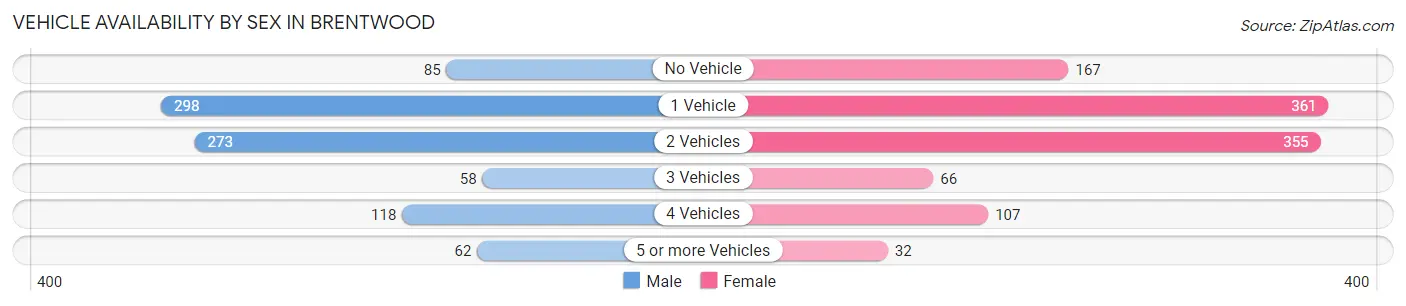
| Vehicles Available | Male | Female |
| No Vehicle | 85 (9.5%) | 167 (15.3%) |
| 1 Vehicle | 298 (33.3%) | 361 (33.2%) |
| 2 Vehicles | 273 (30.5%) | 355 (32.6%) |
| 3 Vehicles | 58 (6.5%) | 66 (6.1%) |
| 4 Vehicles | 118 (13.2%) | 107 (9.8%) |
| 5 or more Vehicles | 62 (6.9%) | 32 (2.9%) |
| Total | 894 (100.0%) | 1,088 (100.0%) |
Commute Time in Brentwood
The most frequently occuring commute durations in Brentwood are 30 to 34 minutes (393 commuters, 21.4%), 45 to 59 minutes (312 commuters, 17.0%), and 20 to 24 minutes (252 commuters, 13.7%).
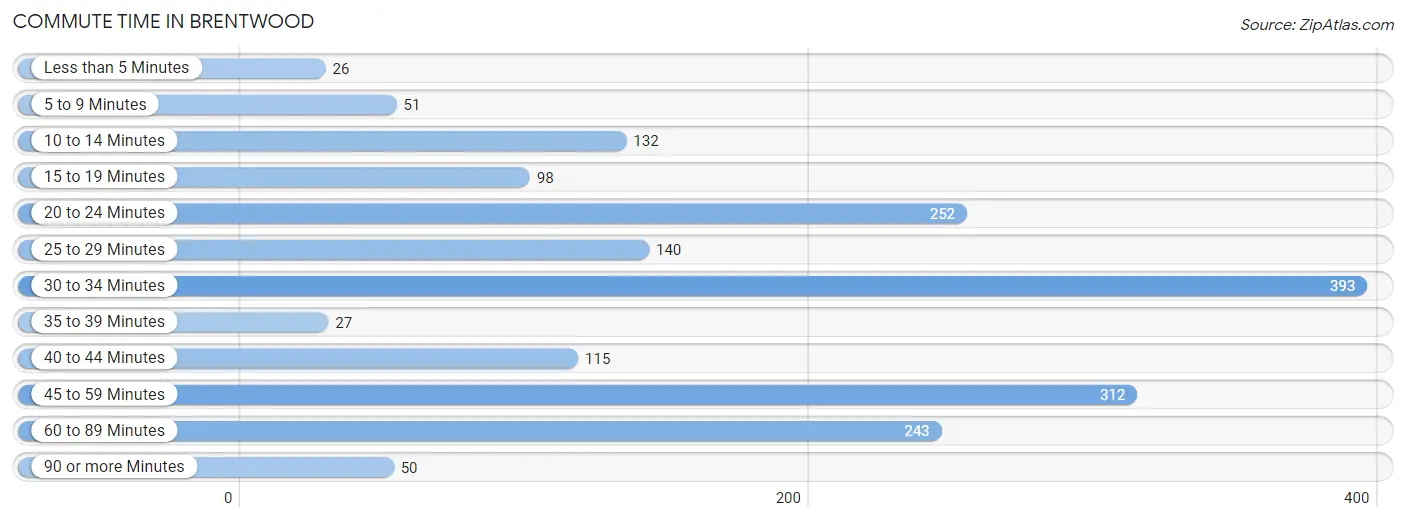
| Commute Time | # Commuters | % Commuters |
| Less than 5 Minutes | 26 | 1.4% |
| 5 to 9 Minutes | 51 | 2.8% |
| 10 to 14 Minutes | 132 | 7.2% |
| 15 to 19 Minutes | 98 | 5.3% |
| 20 to 24 Minutes | 252 | 13.7% |
| 25 to 29 Minutes | 140 | 7.6% |
| 30 to 34 Minutes | 393 | 21.4% |
| 35 to 39 Minutes | 27 | 1.5% |
| 40 to 44 Minutes | 115 | 6.2% |
| 45 to 59 Minutes | 312 | 17.0% |
| 60 to 89 Minutes | 243 | 13.2% |
| 90 or more Minutes | 50 | 2.7% |
Commute Time by Sex in Brentwood
The most common commute times in Brentwood are 30 to 34 minutes (188 commuters, 22.9%) for males and 30 to 34 minutes (205 commuters, 20.1%) for females.
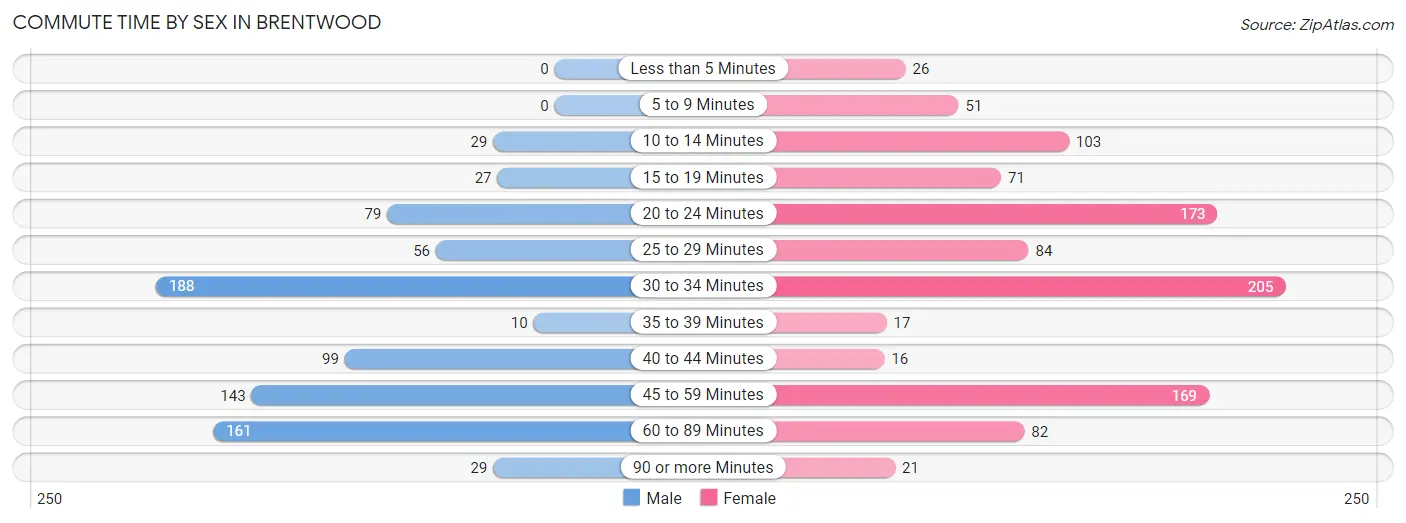
| Commute Time | Male | Female |
| Less than 5 Minutes | 0 (0.0%) | 26 (2.5%) |
| 5 to 9 Minutes | 0 (0.0%) | 51 (5.0%) |
| 10 to 14 Minutes | 29 (3.5%) | 103 (10.1%) |
| 15 to 19 Minutes | 27 (3.3%) | 71 (7.0%) |
| 20 to 24 Minutes | 79 (9.6%) | 173 (17.0%) |
| 25 to 29 Minutes | 56 (6.8%) | 84 (8.3%) |
| 30 to 34 Minutes | 188 (22.9%) | 205 (20.1%) |
| 35 to 39 Minutes | 10 (1.2%) | 17 (1.7%) |
| 40 to 44 Minutes | 99 (12.1%) | 16 (1.6%) |
| 45 to 59 Minutes | 143 (17.4%) | 169 (16.6%) |
| 60 to 89 Minutes | 161 (19.6%) | 82 (8.1%) |
| 90 or more Minutes | 29 (3.5%) | 21 (2.1%) |
Time of Departure to Work by Sex in Brentwood
The most frequent times of departure to work in Brentwood are 6:00 AM to 6:29 AM (144, 17.5%) for males and 8:00 AM to 8:29 AM (143, 14.1%) for females.
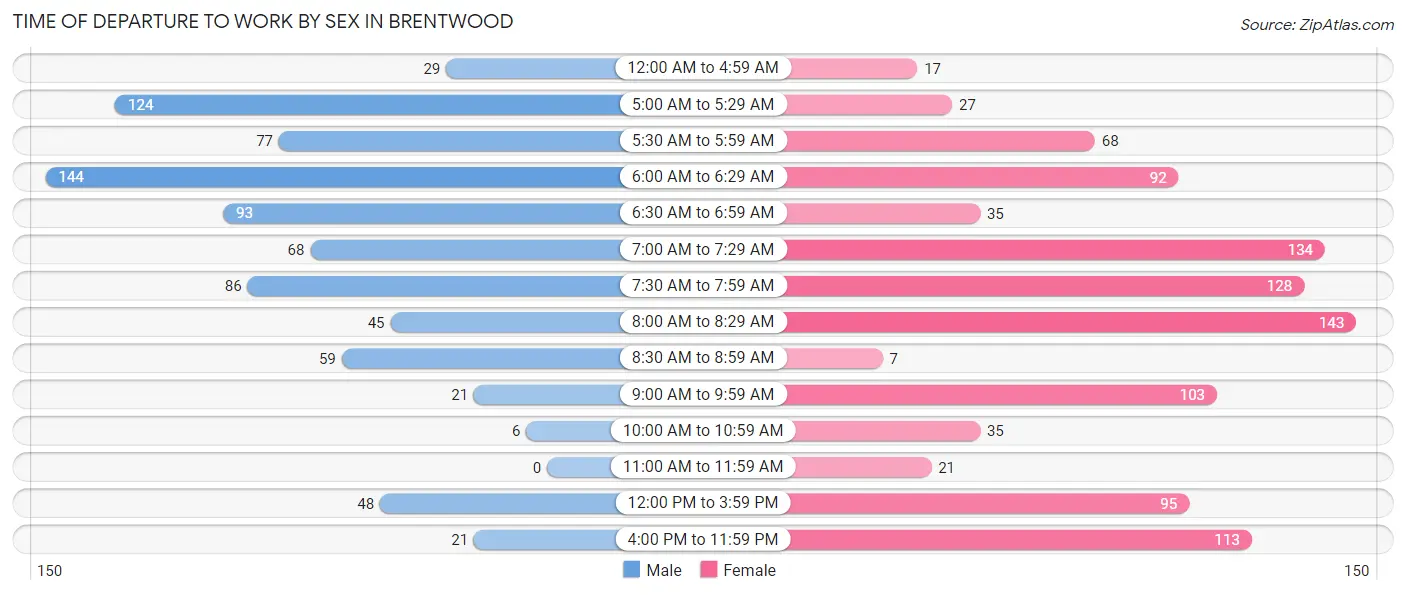
| Time of Departure | Male | Female |
| 12:00 AM to 4:59 AM | 29 (3.5%) | 17 (1.7%) |
| 5:00 AM to 5:29 AM | 124 (15.1%) | 27 (2.6%) |
| 5:30 AM to 5:59 AM | 77 (9.4%) | 68 (6.7%) |
| 6:00 AM to 6:29 AM | 144 (17.5%) | 92 (9.0%) |
| 6:30 AM to 6:59 AM | 93 (11.3%) | 35 (3.4%) |
| 7:00 AM to 7:29 AM | 68 (8.3%) | 134 (13.2%) |
| 7:30 AM to 7:59 AM | 86 (10.5%) | 128 (12.6%) |
| 8:00 AM to 8:29 AM | 45 (5.5%) | 143 (14.1%) |
| 8:30 AM to 8:59 AM | 59 (7.2%) | 7 (0.7%) |
| 9:00 AM to 9:59 AM | 21 (2.6%) | 103 (10.1%) |
| 10:00 AM to 10:59 AM | 6 (0.7%) | 35 (3.4%) |
| 11:00 AM to 11:59 AM | 0 (0.0%) | 21 (2.1%) |
| 12:00 PM to 3:59 PM | 48 (5.9%) | 95 (9.3%) |
| 4:00 PM to 11:59 PM | 21 (2.6%) | 113 (11.1%) |
| Total | 821 (100.0%) | 1,018 (100.0%) |
Housing Occupancy in Brentwood
Occupancy by Ownership in Brentwood
Of the total 1,293 dwellings in Brentwood, owner-occupied units account for 569 (44.0%), while renter-occupied units make up 724 (56.0%).
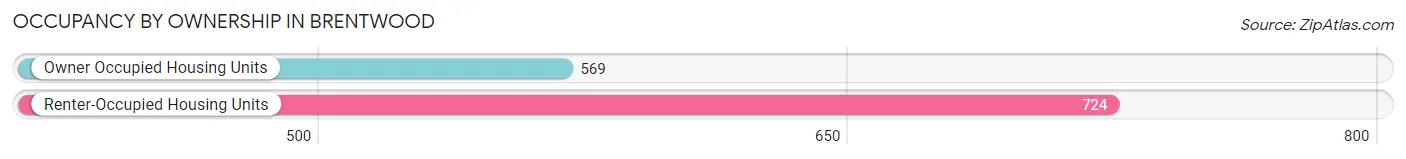
| Occupancy | # Housing Units | % Housing Units |
| Owner Occupied Housing Units | 569 | 44.0% |
| Renter-Occupied Housing Units | 724 | 56.0% |
| Total Occupied Housing Units | 1,293 | 100.0% |
Occupancy by Household Size in Brentwood
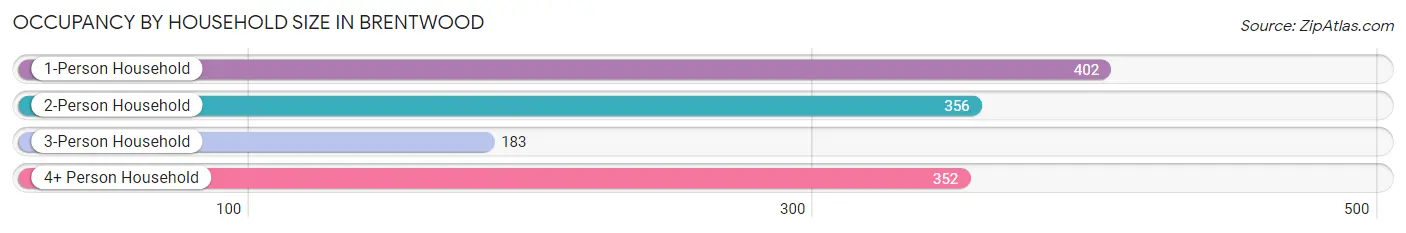
| Household Size | # Housing Units | % Housing Units |
| 1-Person Household | 402 | 31.1% |
| 2-Person Household | 356 | 27.5% |
| 3-Person Household | 183 | 14.1% |
| 4+ Person Household | 352 | 27.2% |
| Total Housing Units | 1,293 | 100.0% |
Occupancy by Ownership by Household Size in Brentwood
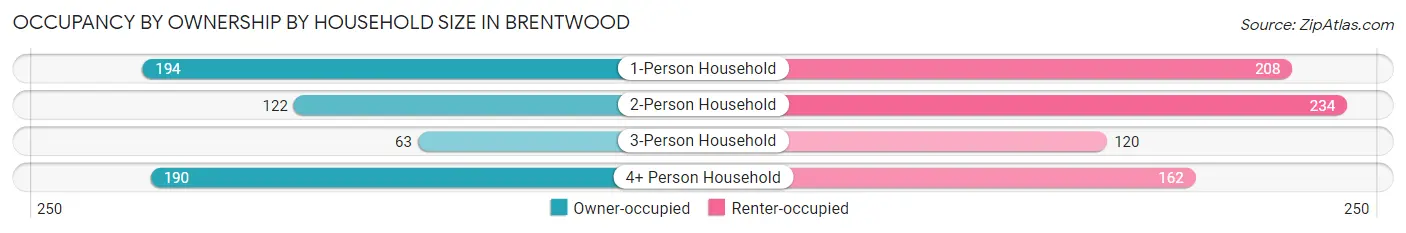
| Household Size | Owner-occupied | Renter-occupied |
| 1-Person Household | 194 (48.3%) | 208 (51.7%) |
| 2-Person Household | 122 (34.3%) | 234 (65.7%) |
| 3-Person Household | 63 (34.4%) | 120 (65.6%) |
| 4+ Person Household | 190 (54.0%) | 162 (46.0%) |
| Total Housing Units | 569 (44.0%) | 724 (56.0%) |
Occupancy by Educational Attainment in Brentwood
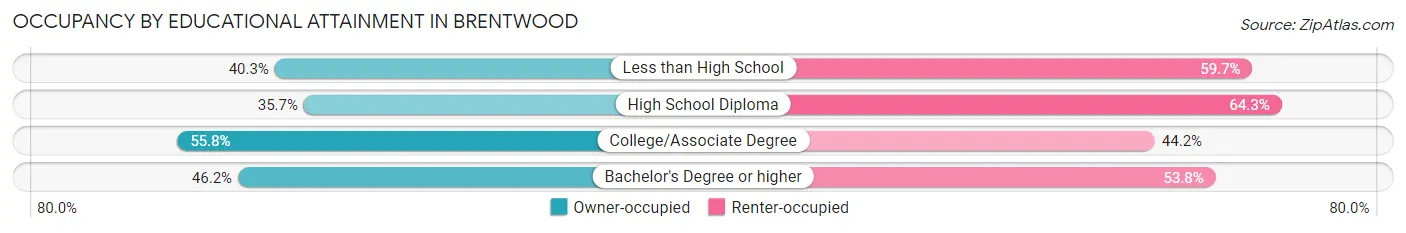
| Household Size | Owner-occupied | Renter-occupied |
| Less than High School | 146 (40.3%) | 216 (59.7%) |
| High School Diploma | 100 (35.7%) | 180 (64.3%) |
| College/Associate Degree | 130 (55.8%) | 103 (44.2%) |
| Bachelor's Degree or higher | 193 (46.2%) | 225 (53.8%) |
Occupancy by Age of Householder in Brentwood
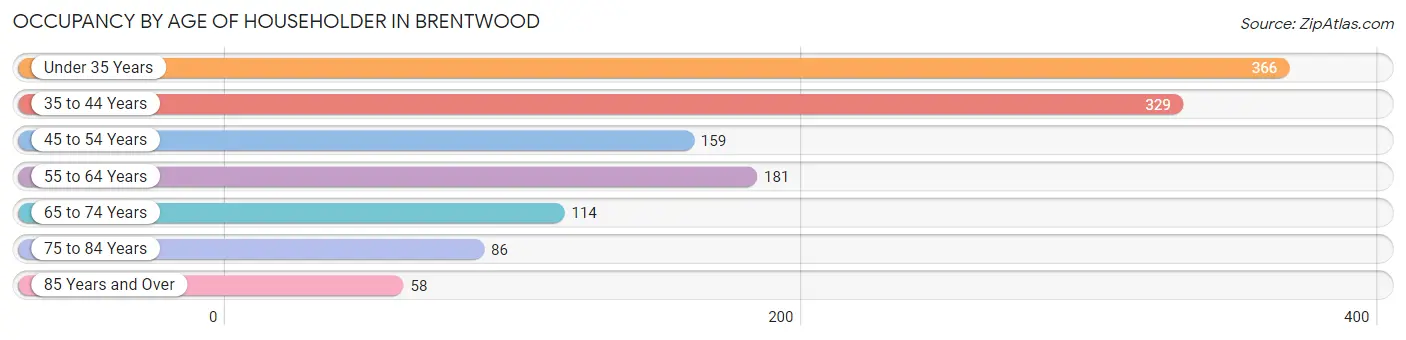
| Age Bracket | # Households | % Households |
| Under 35 Years | 366 | 28.3% |
| 35 to 44 Years | 329 | 25.4% |
| 45 to 54 Years | 159 | 12.3% |
| 55 to 64 Years | 181 | 14.0% |
| 65 to 74 Years | 114 | 8.8% |
| 75 to 84 Years | 86 | 6.7% |
| 85 Years and Over | 58 | 4.5% |
| Total | 1,293 | 100.0% |
Housing Finances in Brentwood
Median Income by Occupancy in Brentwood
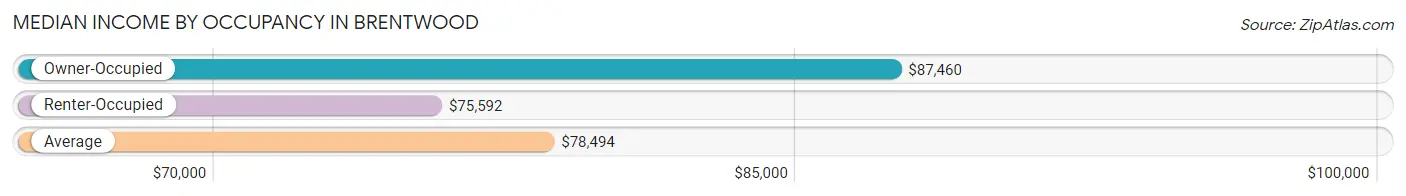
| Occupancy Type | # Households | Median Income |
| Owner-Occupied | 569 (44.0%) | $87,460 |
| Renter-Occupied | 724 (56.0%) | $75,592 |
| Average | 1,293 (100.0%) | $78,494 |
Occupancy by Householder Income Bracket in Brentwood
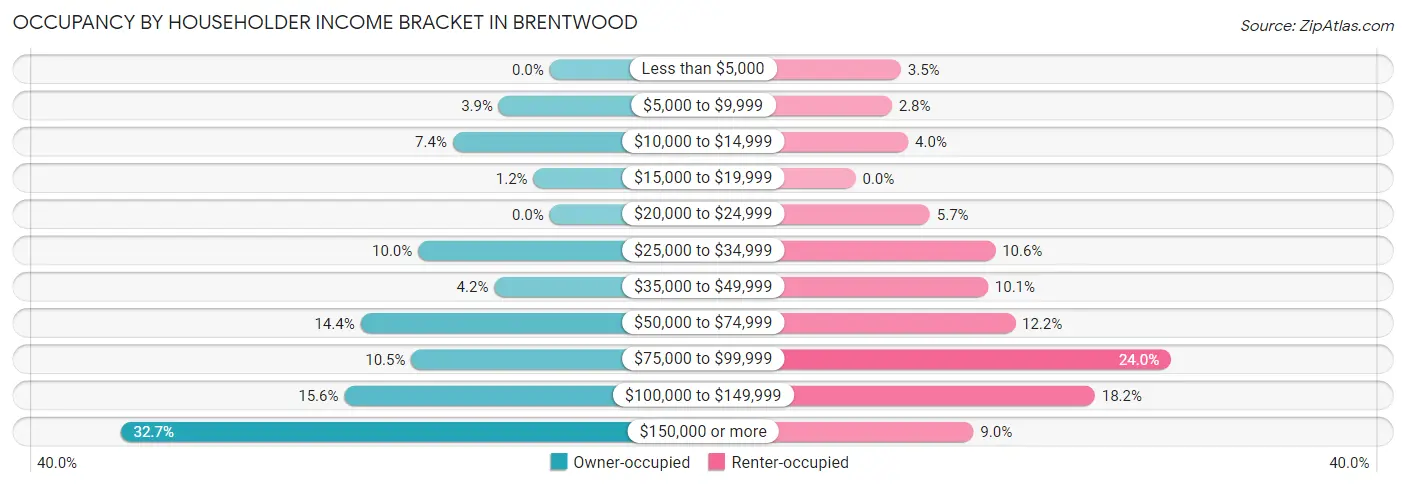
| Income Bracket | Owner-occupied | Renter-occupied |
| Less than $5,000 | 0 (0.0%) | 25 (3.5%) |
| $5,000 to $9,999 | 22 (3.9%) | 20 (2.8%) |
| $10,000 to $14,999 | 42 (7.4%) | 29 (4.0%) |
| $15,000 to $19,999 | 7 (1.2%) | 0 (0.0%) |
| $20,000 to $24,999 | 0 (0.0%) | 41 (5.7%) |
| $25,000 to $34,999 | 57 (10.0%) | 77 (10.6%) |
| $35,000 to $49,999 | 24 (4.2%) | 73 (10.1%) |
| $50,000 to $74,999 | 82 (14.4%) | 88 (12.1%) |
| $75,000 to $99,999 | 60 (10.5%) | 174 (24.0%) |
| $100,000 to $149,999 | 89 (15.6%) | 132 (18.2%) |
| $150,000 or more | 186 (32.7%) | 65 (9.0%) |
| Total | 569 (100.0%) | 724 (100.0%) |
Monthly Housing Cost Tiers in Brentwood
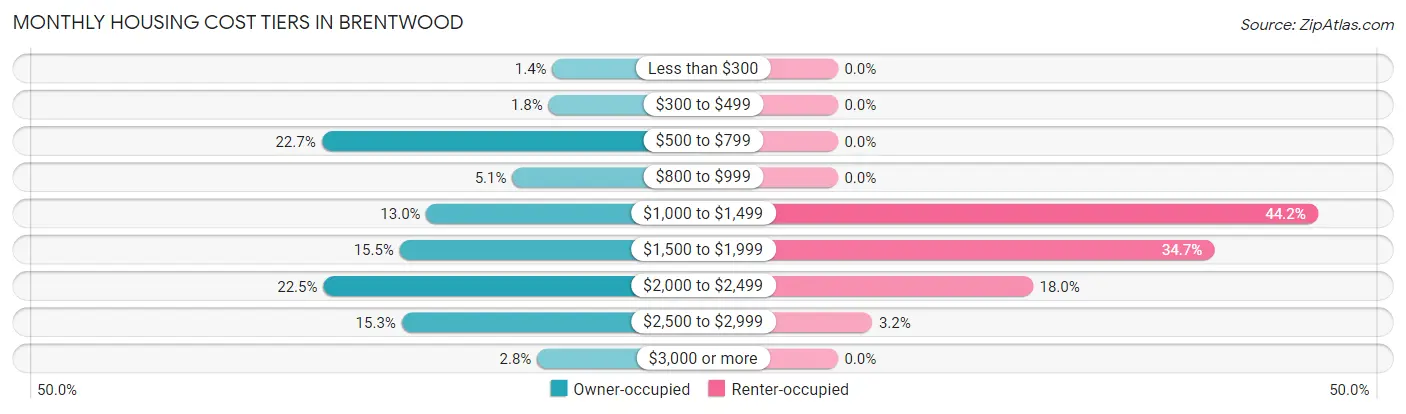
| Monthly Cost | Owner-occupied | Renter-occupied |
| Less than $300 | 8 (1.4%) | 0 (0.0%) |
| $300 to $499 | 10 (1.8%) | 0 (0.0%) |
| $500 to $799 | 129 (22.7%) | 0 (0.0%) |
| $800 to $999 | 29 (5.1%) | 0 (0.0%) |
| $1,000 to $1,499 | 74 (13.0%) | 320 (44.2%) |
| $1,500 to $1,999 | 88 (15.5%) | 251 (34.7%) |
| $2,000 to $2,499 | 128 (22.5%) | 130 (18.0%) |
| $2,500 to $2,999 | 87 (15.3%) | 23 (3.2%) |
| $3,000 or more | 16 (2.8%) | 0 (0.0%) |
| Total | 569 (100.0%) | 724 (100.0%) |
Physical Housing Characteristics in Brentwood
Housing Structures in Brentwood
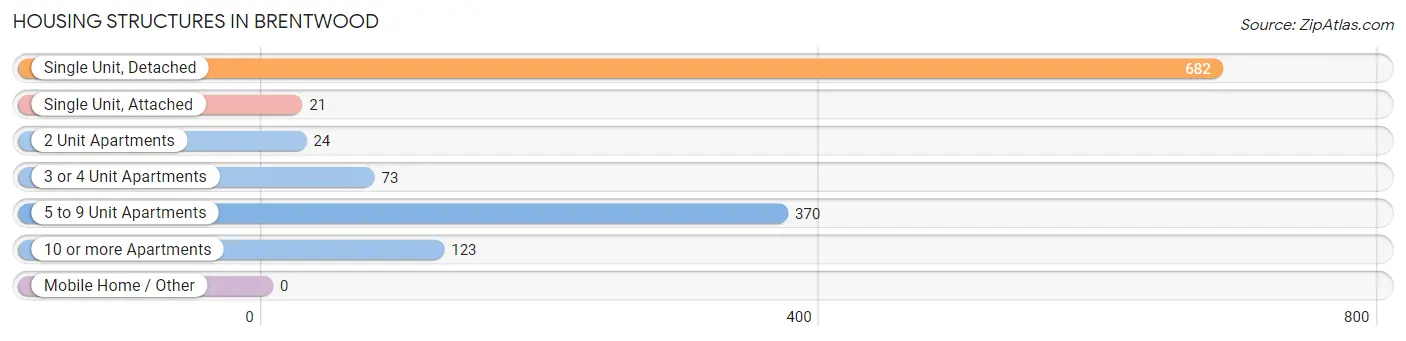
| Structure Type | # Housing Units | % Housing Units |
| Single Unit, Detached | 682 | 52.7% |
| Single Unit, Attached | 21 | 1.6% |
| 2 Unit Apartments | 24 | 1.9% |
| 3 or 4 Unit Apartments | 73 | 5.7% |
| 5 to 9 Unit Apartments | 370 | 28.6% |
| 10 or more Apartments | 123 | 9.5% |
| Mobile Home / Other | 0 | 0.0% |
| Total | 1,293 | 100.0% |
Housing Structures by Occupancy in Brentwood
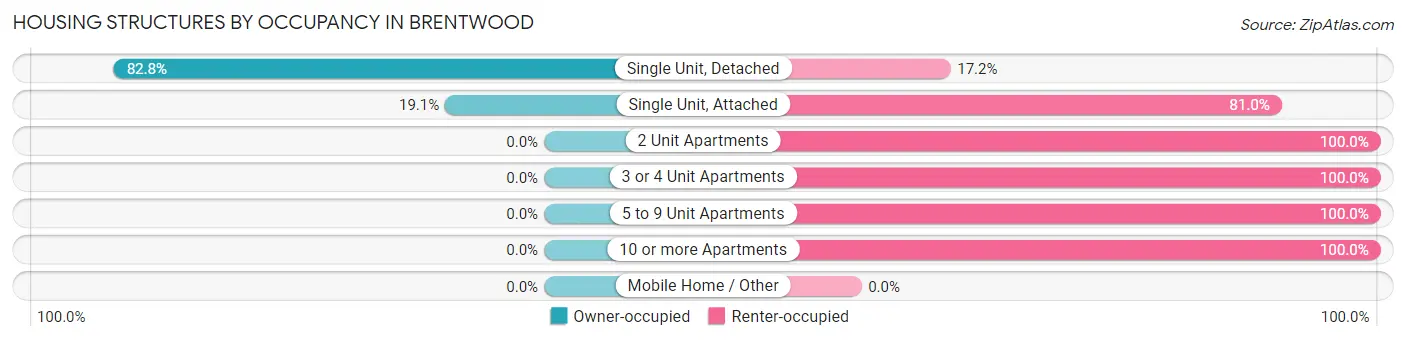
| Structure Type | Owner-occupied | Renter-occupied |
| Single Unit, Detached | 565 (82.8%) | 117 (17.2%) |
| Single Unit, Attached | 4 (19.1%) | 17 (80.9%) |
| 2 Unit Apartments | 0 (0.0%) | 24 (100.0%) |
| 3 or 4 Unit Apartments | 0 (0.0%) | 73 (100.0%) |
| 5 to 9 Unit Apartments | 0 (0.0%) | 370 (100.0%) |
| 10 or more Apartments | 0 (0.0%) | 123 (100.0%) |
| Mobile Home / Other | 0 (0.0%) | 0 (0.0%) |
| Total | 569 (44.0%) | 724 (56.0%) |
Housing Structures by Number of Rooms in Brentwood
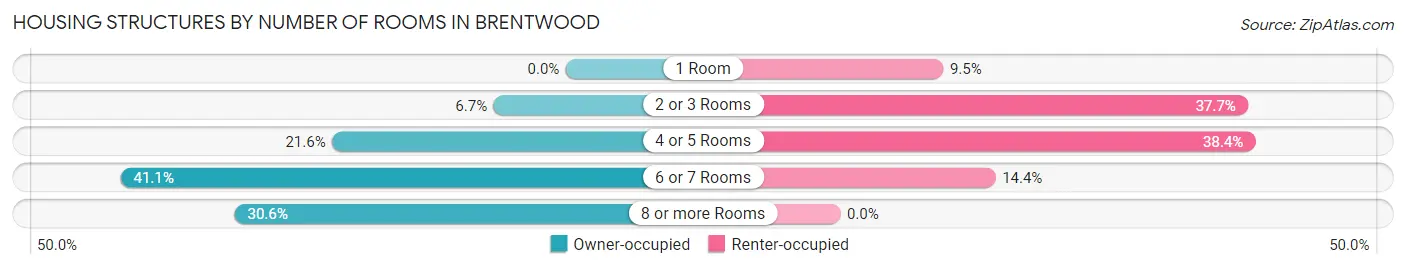
| Number of Rooms | Owner-occupied | Renter-occupied |
| 1 Room | 0 (0.0%) | 69 (9.5%) |
| 2 or 3 Rooms | 38 (6.7%) | 273 (37.7%) |
| 4 or 5 Rooms | 123 (21.6%) | 278 (38.4%) |
| 6 or 7 Rooms | 234 (41.1%) | 104 (14.4%) |
| 8 or more Rooms | 174 (30.6%) | 0 (0.0%) |
| Total | 569 (100.0%) | 724 (100.0%) |
Housing Structure by Heating Type in Brentwood
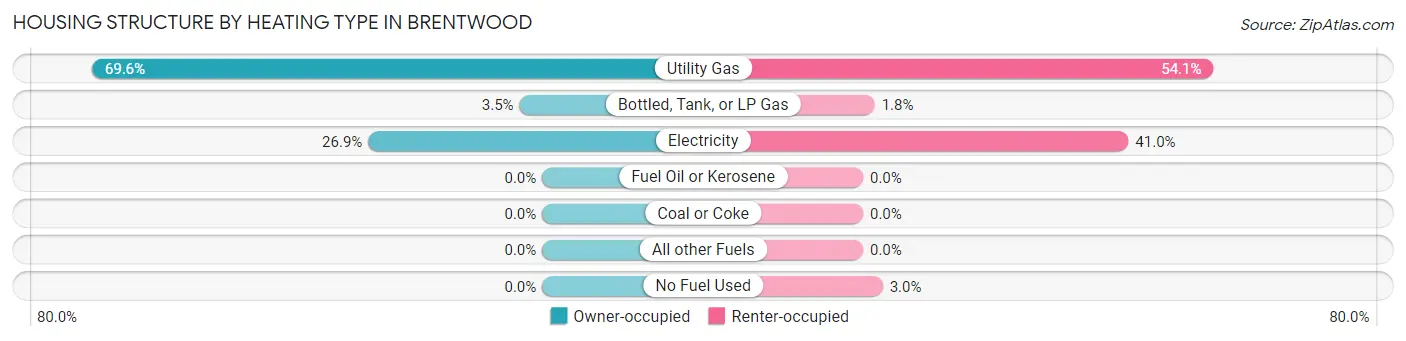
| Heating Type | Owner-occupied | Renter-occupied |
| Utility Gas | 396 (69.6%) | 392 (54.1%) |
| Bottled, Tank, or LP Gas | 20 (3.5%) | 13 (1.8%) |
| Electricity | 153 (26.9%) | 297 (41.0%) |
| Fuel Oil or Kerosene | 0 (0.0%) | 0 (0.0%) |
| Coal or Coke | 0 (0.0%) | 0 (0.0%) |
| All other Fuels | 0 (0.0%) | 0 (0.0%) |
| No Fuel Used | 0 (0.0%) | 22 (3.0%) |
| Total | 569 (100.0%) | 724 (100.0%) |
Household Vehicle Usage in Brentwood
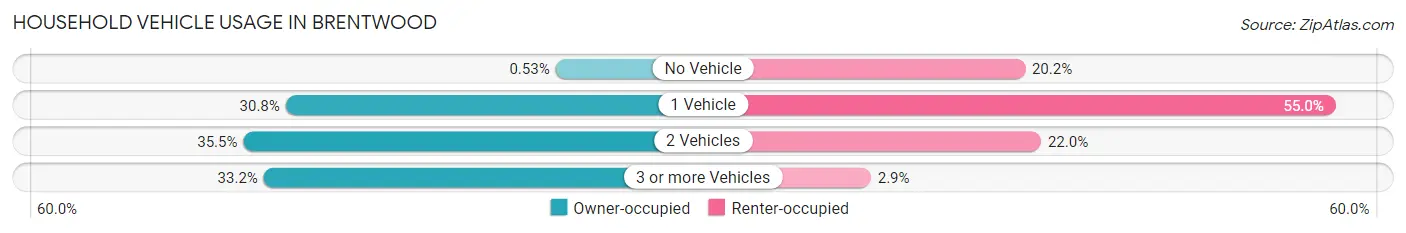
| Vehicles per Household | Owner-occupied | Renter-occupied |
| No Vehicle | 3 (0.5%) | 146 (20.2%) |
| 1 Vehicle | 175 (30.8%) | 398 (55.0%) |
| 2 Vehicles | 202 (35.5%) | 159 (22.0%) |
| 3 or more Vehicles | 189 (33.2%) | 21 (2.9%) |
| Total | 569 (100.0%) | 724 (100.0%) |
Real Estate & Mortgages in Brentwood
Real Estate and Mortgage Overview in Brentwood
| Characteristic | Without Mortgage | With Mortgage |
| Housing Units | 181 | 388 |
| Median Property Value | $427,900 | $384,800 |
| Median Household Income | $87,298 | $142 |
| Monthly Housing Costs | $659 | $16 |
| Real Estate Taxes | $4,375 | $0 |
Property Value by Mortgage Status in Brentwood
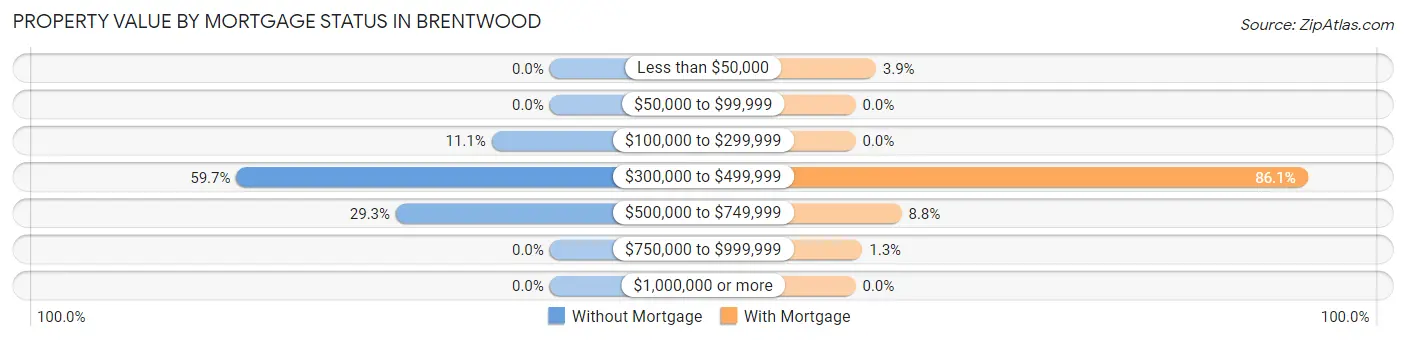
| Property Value | Without Mortgage | With Mortgage |
| Less than $50,000 | 0 (0.0%) | 15 (3.9%) |
| $50,000 to $99,999 | 0 (0.0%) | 0 (0.0%) |
| $100,000 to $299,999 | 20 (11.1%) | 0 (0.0%) |
| $300,000 to $499,999 | 108 (59.7%) | 334 (86.1%) |
| $500,000 to $749,999 | 53 (29.3%) | 34 (8.8%) |
| $750,000 to $999,999 | 0 (0.0%) | 5 (1.3%) |
| $1,000,000 or more | 0 (0.0%) | 0 (0.0%) |
| Total | 181 (100.0%) | 388 (100.0%) |
Household Income by Mortgage Status in Brentwood
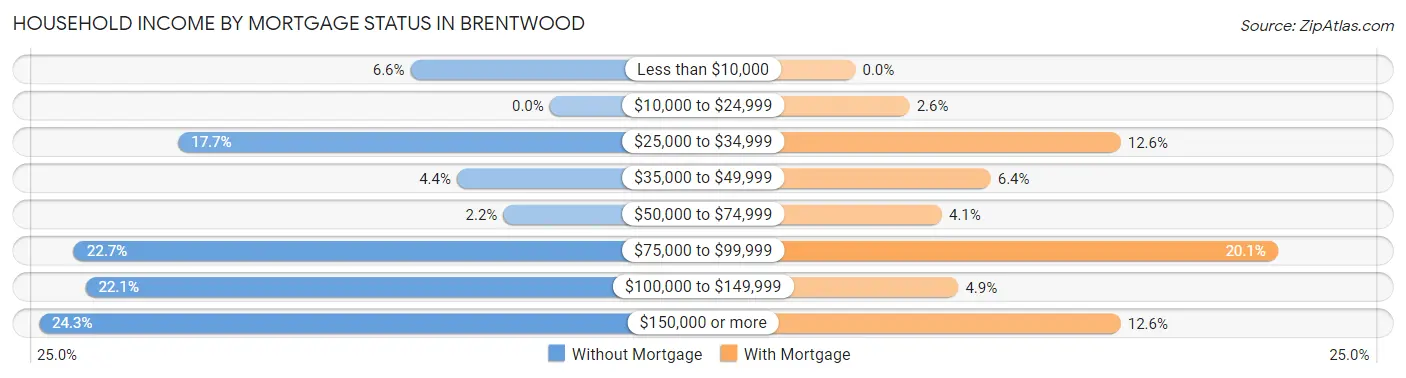
| Household Income | Without Mortgage | With Mortgage |
| Less than $10,000 | 12 (6.6%) | 0 (0.0%) |
| $10,000 to $24,999 | 0 (0.0%) | 10 (2.6%) |
| $25,000 to $34,999 | 32 (17.7%) | 49 (12.6%) |
| $35,000 to $49,999 | 8 (4.4%) | 25 (6.4%) |
| $50,000 to $74,999 | 4 (2.2%) | 16 (4.1%) |
| $75,000 to $99,999 | 41 (22.7%) | 78 (20.1%) |
| $100,000 to $149,999 | 40 (22.1%) | 19 (4.9%) |
| $150,000 or more | 44 (24.3%) | 49 (12.6%) |
| Total | 181 (100.0%) | 388 (100.0%) |
Property Value to Household Income Ratio in Brentwood
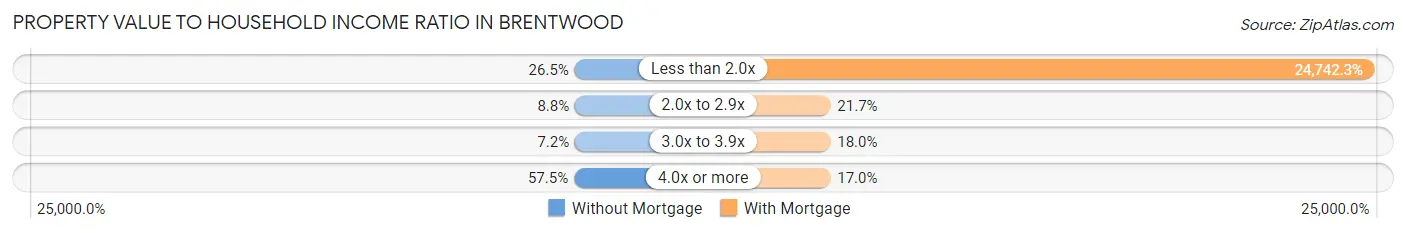
| Value-to-Income Ratio | Without Mortgage | With Mortgage |
| Less than 2.0x | 48 (26.5%) | 96,000 (24,742.3%) |
| 2.0x to 2.9x | 16 (8.8%) | 84 (21.6%) |
| 3.0x to 3.9x | 13 (7.2%) | 70 (18.0%) |
| 4.0x or more | 104 (57.5%) | 66 (17.0%) |
| Total | 181 (100.0%) | 388 (100.0%) |
Real Estate Taxes by Mortgage Status in Brentwood
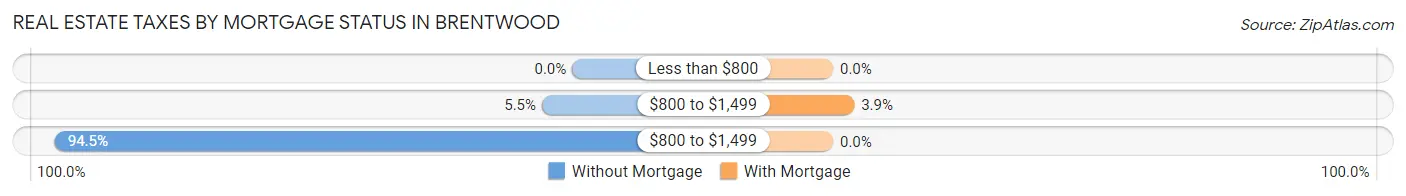
| Property Taxes | Without Mortgage | With Mortgage |
| Less than $800 | 0 (0.0%) | 0 (0.0%) |
| $800 to $1,499 | 10 (5.5%) | 15 (3.9%) |
| $800 to $1,499 | 171 (94.5%) | 0 (0.0%) |
| Total | 181 (100.0%) | 388 (100.0%) |
Health & Disability in Brentwood
Health Insurance Coverage by Age in Brentwood
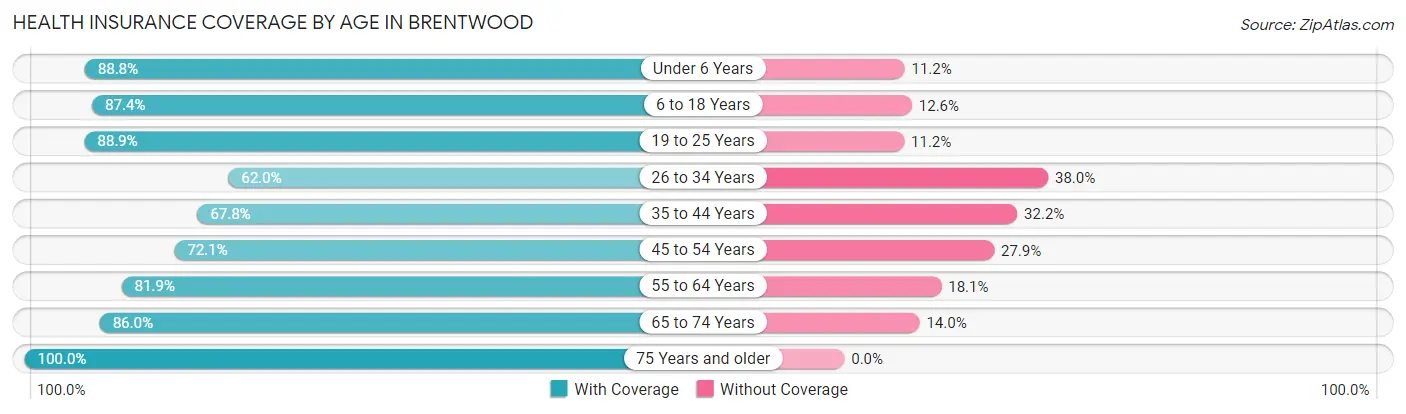
| Age Bracket | With Coverage | Without Coverage |
| Under 6 Years | 300 (88.8%) | 38 (11.2%) |
| 6 to 18 Years | 541 (87.4%) | 78 (12.6%) |
| 19 to 25 Years | 247 (88.8%) | 31 (11.2%) |
| 26 to 34 Years | 462 (62.0%) | 283 (38.0%) |
| 35 to 44 Years | 368 (67.8%) | 175 (32.2%) |
| 45 to 54 Years | 346 (72.1%) | 134 (27.9%) |
| 55 to 64 Years | 290 (81.9%) | 64 (18.1%) |
| 65 to 74 Years | 184 (86.0%) | 30 (14.0%) |
| 75 Years and older | 201 (100.0%) | 0 (0.0%) |
| Total | 2,939 (77.9%) | 833 (22.1%) |
Health Insurance Coverage by Citizenship Status in Brentwood
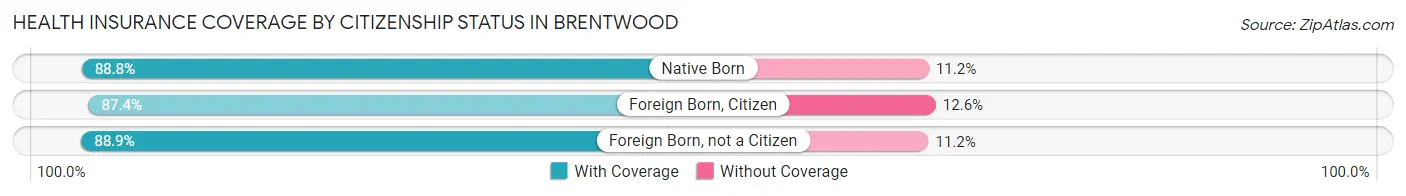
| Citizenship Status | With Coverage | Without Coverage |
| Native Born | 300 (88.8%) | 38 (11.2%) |
| Foreign Born, Citizen | 541 (87.4%) | 78 (12.6%) |
| Foreign Born, not a Citizen | 247 (88.8%) | 31 (11.2%) |
Health Insurance Coverage by Household Income in Brentwood
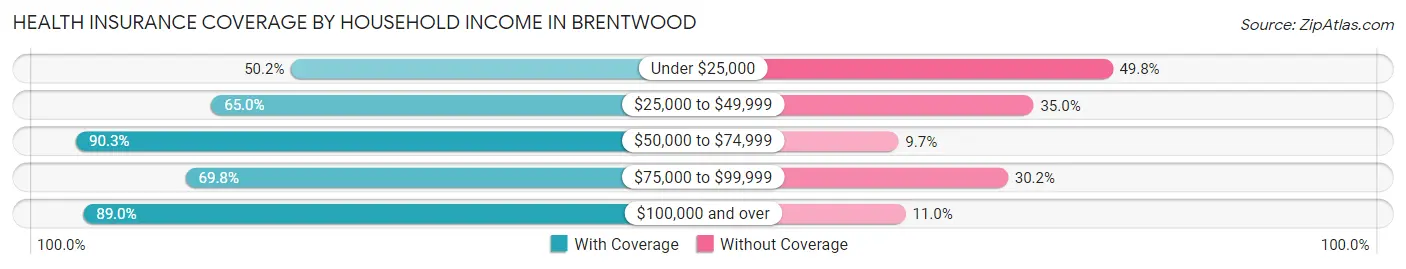
| Household Income | With Coverage | Without Coverage |
| Under $25,000 | 216 (50.2%) | 214 (49.8%) |
| $25,000 to $49,999 | 290 (65.0%) | 156 (35.0%) |
| $50,000 to $74,999 | 327 (90.3%) | 35 (9.7%) |
| $75,000 to $99,999 | 544 (69.8%) | 235 (30.2%) |
| $100,000 and over | 1,562 (89.0%) | 193 (11.0%) |
Public vs Private Health Insurance Coverage by Age in Brentwood
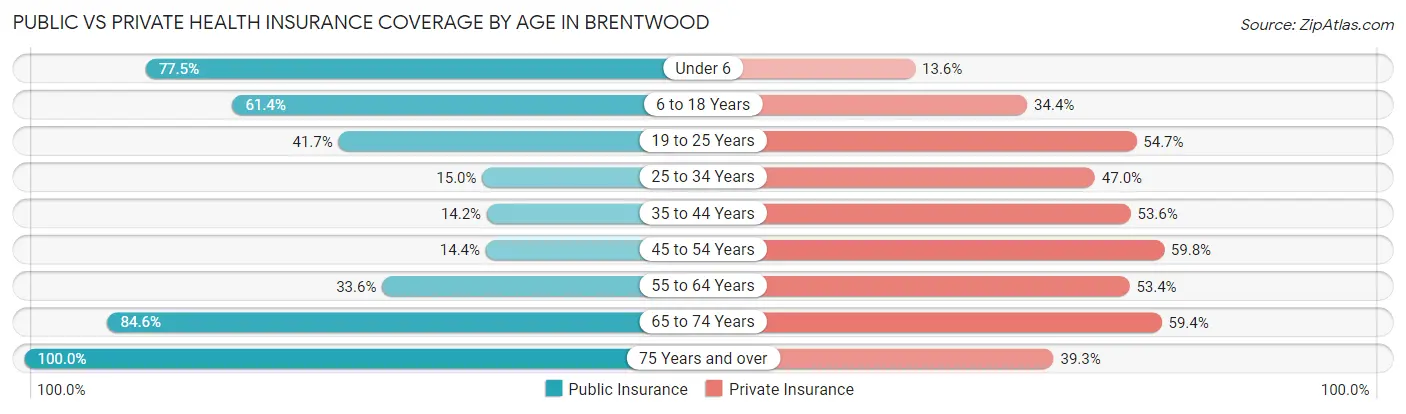
| Age Bracket | Public Insurance | Private Insurance |
| Under 6 | 262 (77.5%) | 46 (13.6%) |
| 6 to 18 Years | 380 (61.4%) | 213 (34.4%) |
| 19 to 25 Years | 116 (41.7%) | 152 (54.7%) |
| 25 to 34 Years | 112 (15.0%) | 350 (47.0%) |
| 35 to 44 Years | 77 (14.2%) | 291 (53.6%) |
| 45 to 54 Years | 69 (14.4%) | 287 (59.8%) |
| 55 to 64 Years | 119 (33.6%) | 189 (53.4%) |
| 65 to 74 Years | 181 (84.6%) | 127 (59.4%) |
| 75 Years and over | 201 (100.0%) | 79 (39.3%) |
| Total | 1,517 (40.2%) | 1,734 (46.0%) |
Disability Status by Sex by Age in Brentwood
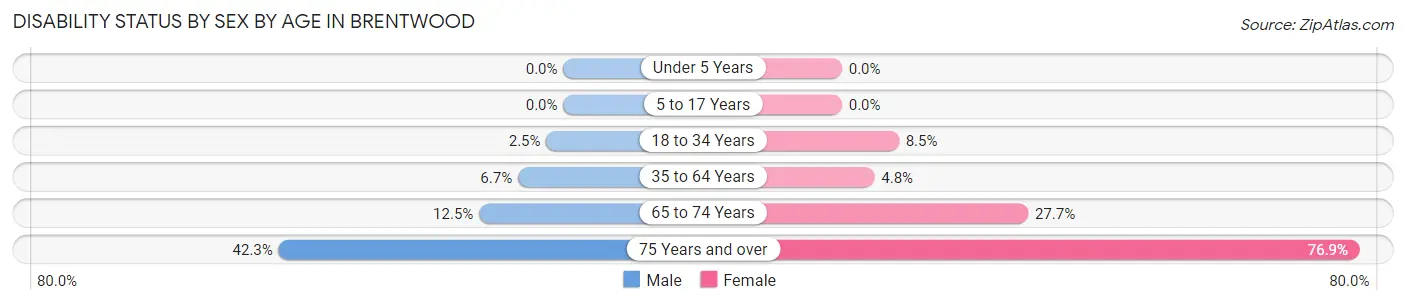
| Age Bracket | Male | Female |
| Under 5 Years | 0 (0.0%) | 0 (0.0%) |
| 5 to 17 Years | 0 (0.0%) | 0 (0.0%) |
| 18 to 34 Years | 13 (2.5%) | 48 (8.5%) |
| 35 to 64 Years | 37 (6.7%) | 40 (4.8%) |
| 65 to 74 Years | 15 (12.5%) | 26 (27.7%) |
| 75 Years and over | 63 (42.3%) | 40 (76.9%) |
Disability Class by Sex by Age in Brentwood
Disability Class: Hearing Difficulty
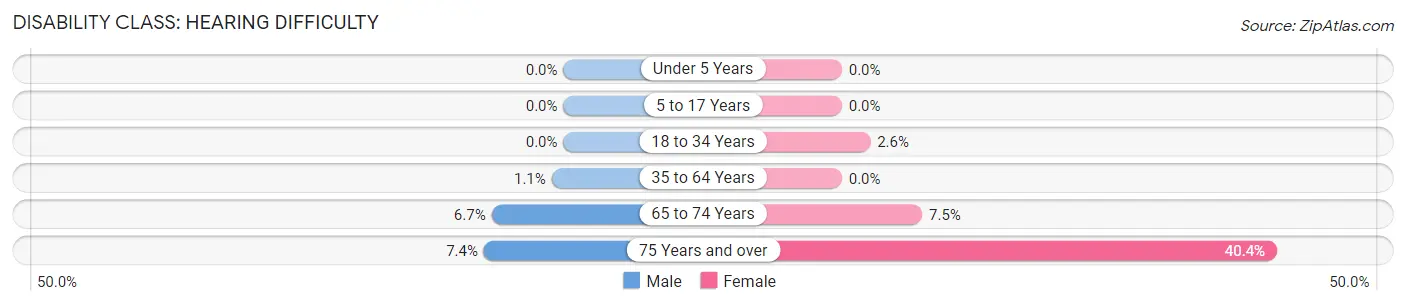
| Age Bracket | Male | Female |
| Under 5 Years | 0 (0.0%) | 0 (0.0%) |
| 5 to 17 Years | 0 (0.0%) | 0 (0.0%) |
| 18 to 34 Years | 0 (0.0%) | 15 (2.6%) |
| 35 to 64 Years | 6 (1.1%) | 0 (0.0%) |
| 65 to 74 Years | 8 (6.7%) | 7 (7.4%) |
| 75 Years and over | 11 (7.4%) | 21 (40.4%) |
Disability Class: Vision Difficulty
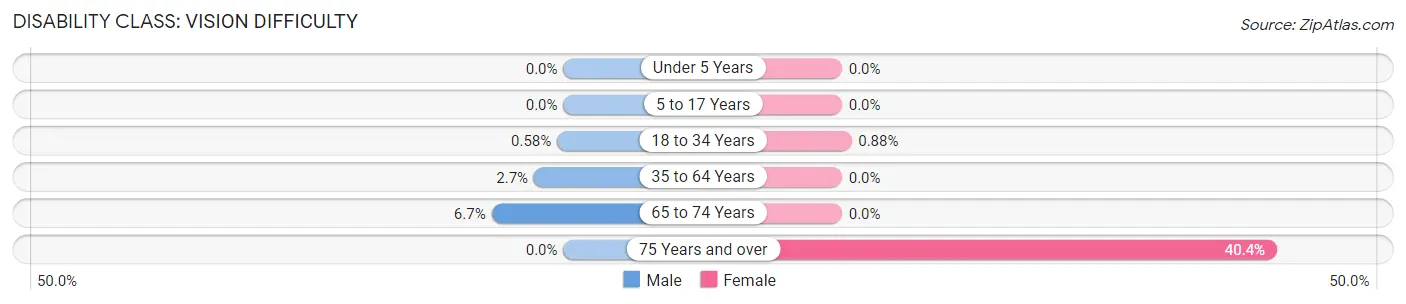
| Age Bracket | Male | Female |
| Under 5 Years | 0 (0.0%) | 0 (0.0%) |
| 5 to 17 Years | 0 (0.0%) | 0 (0.0%) |
| 18 to 34 Years | 3 (0.6%) | 5 (0.9%) |
| 35 to 64 Years | 15 (2.7%) | 0 (0.0%) |
| 65 to 74 Years | 8 (6.7%) | 0 (0.0%) |
| 75 Years and over | 0 (0.0%) | 21 (40.4%) |
Disability Class: Cognitive Difficulty
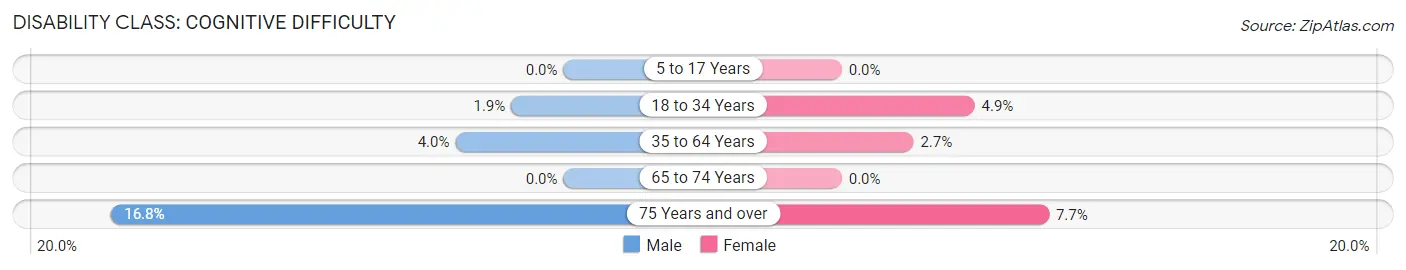
| Age Bracket | Male | Female |
| 5 to 17 Years | 0 (0.0%) | 0 (0.0%) |
| 18 to 34 Years | 10 (1.9%) | 28 (4.9%) |
| 35 to 64 Years | 22 (4.0%) | 22 (2.7%) |
| 65 to 74 Years | 0 (0.0%) | 0 (0.0%) |
| 75 Years and over | 25 (16.8%) | 4 (7.7%) |
Disability Class: Ambulatory Difficulty
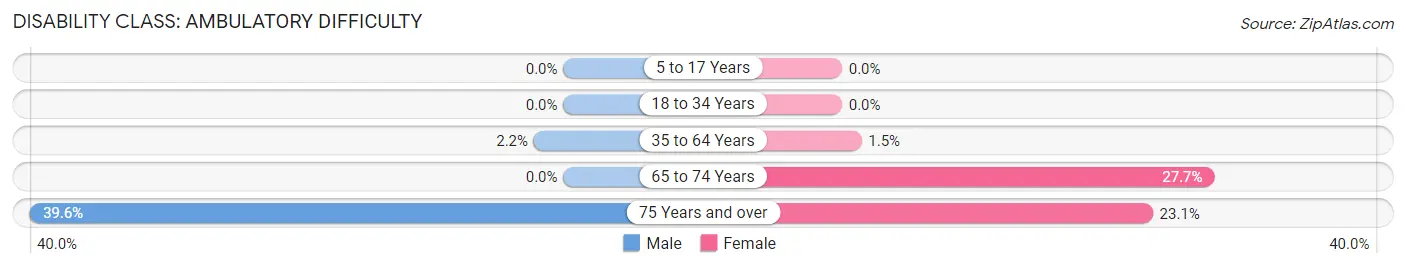
| Age Bracket | Male | Female |
| 5 to 17 Years | 0 (0.0%) | 0 (0.0%) |
| 18 to 34 Years | 0 (0.0%) | 0 (0.0%) |
| 35 to 64 Years | 12 (2.2%) | 12 (1.5%) |
| 65 to 74 Years | 0 (0.0%) | 26 (27.7%) |
| 75 Years and over | 59 (39.6%) | 12 (23.1%) |
Disability Class: Self-Care Difficulty
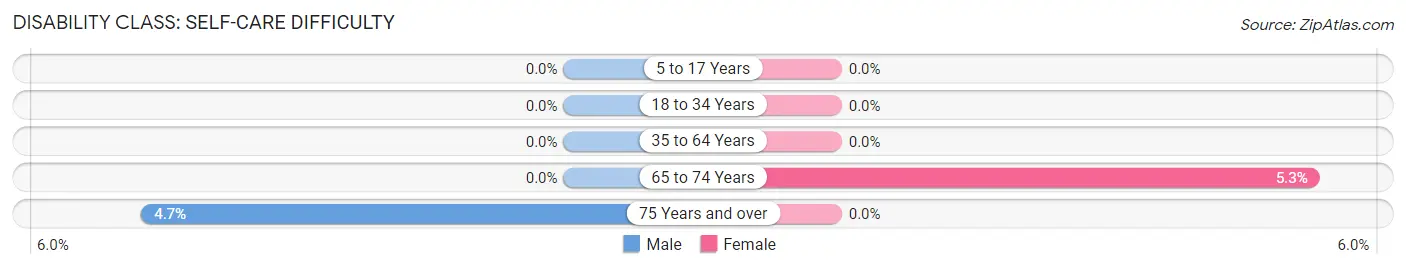
| Age Bracket | Male | Female |
| 5 to 17 Years | 0 (0.0%) | 0 (0.0%) |
| 18 to 34 Years | 0 (0.0%) | 0 (0.0%) |
| 35 to 64 Years | 0 (0.0%) | 0 (0.0%) |
| 65 to 74 Years | 0 (0.0%) | 5 (5.3%) |
| 75 Years and over | 7 (4.7%) | 0 (0.0%) |
Technology Access in Brentwood
Computing Device Access in Brentwood
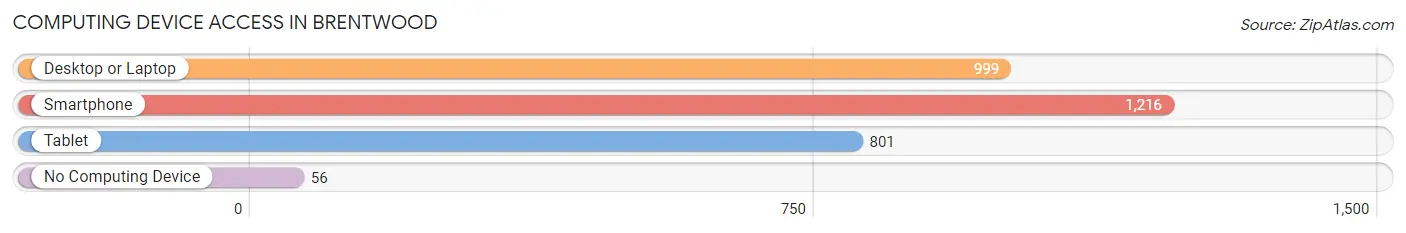
| Device Type | # Households | % Households |
| Desktop or Laptop | 999 | 77.3% |
| Smartphone | 1,216 | 94.0% |
| Tablet | 801 | 62.0% |
| No Computing Device | 56 | 4.3% |
| Total | 1,293 | 100.0% |
Internet Access in Brentwood
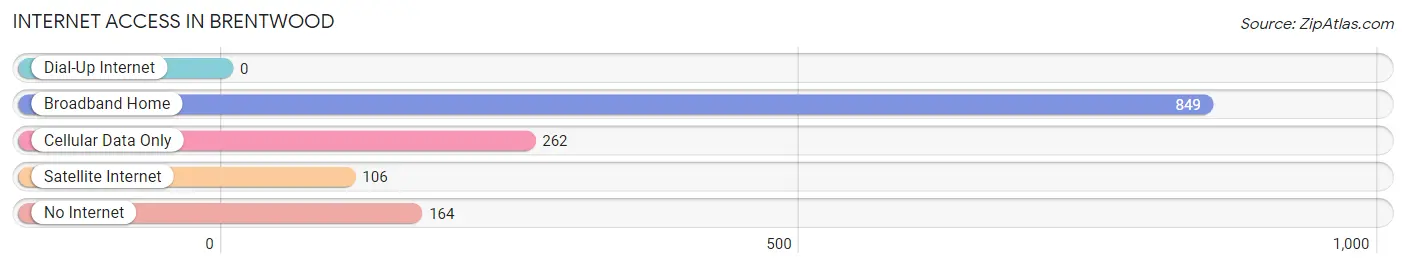
| Internet Type | # Households | % Households |
| Dial-Up Internet | 0 | 0.0% |
| Broadband Home | 849 | 65.7% |
| Cellular Data Only | 262 | 20.3% |
| Satellite Internet | 106 | 8.2% |
| No Internet | 164 | 12.7% |
| Total | 1,293 | 100.0% |
Brentwood Summary
Brentwood is a small town located in Prince George’s County, Maryland. It is situated in the Washington, D.C. metropolitan area and is part of the larger Washington-Arlington-Alexandria metropolitan statistical area. The town has a population of approximately 4,000 people and is located about 10 miles east of Washington, D.C.
History
Brentwood was first settled in the late 1700s by a group of Quakers from Pennsylvania. The town was originally known as “Friendship” and was later renamed “Brentwood” after a local landowner. The town was incorporated in 1878 and has remained relatively unchanged since then.
Geography
Brentwood is located in Prince George’s County, Maryland. It is situated in the Washington, D.C. metropolitan area and is part of the larger Washington-Arlington-Alexandria metropolitan statistical area. The town is located about 10 miles east of Washington, D.C. and is bordered by the towns of Hyattsville, Riverdale Park, and University Park. The town is situated on a plateau and is surrounded by rolling hills. The town is located in a temperate climate zone and experiences hot, humid summers and cold, wet winters.
Economy
Brentwood’s economy is largely based on the service industry. The town is home to a variety of restaurants, retail stores, and other businesses. The town is also home to a number of government offices, including the U.S. Department of Agriculture and the U.S. Department of Housing and Urban Development. The town is also home to a number of educational institutions, including the University of Maryland, College Park and the University of the District of Columbia.
Demographics
As of the 2010 census, Brentwood had a population of 4,000 people. The town is predominantly white, with a population that is approximately 75% white and 25% African American. The median household income in Brentwood is $60,000, and the median home value is $250,000. The town has a high rate of homeownership, with approximately 75% of residents owning their own homes. The town also has a high rate of educational attainment, with approximately 90% of residents having at least a high school diploma.
Common Questions
What is Per Capita Income in Brentwood?
Per Capita income in Brentwood is $33,393.
What is the Median Family Income in Brentwood?
Median Family Income in Brentwood is $96,053.
What is the Median Household income in Brentwood?
Median Household Income in Brentwood is $78,494.
What is Income or Wage Gap in Brentwood?
Income or Wage Gap in Brentwood is 1.8%.
Women in Brentwood earn 98.2 cents for every dollar earned by a man.
What is Inequality or Gini Index in Brentwood?
Inequality or Gini Index in Brentwood is 0.42.
What is the Total Population of Brentwood?
Total Population of Brentwood is 3,782.
What is the Total Male Population of Brentwood?
Total Male Population of Brentwood is 1,824.
What is the Total Female Population of Brentwood?
Total Female Population of Brentwood is 1,958.
What is the Ratio of Males per 100 Females in Brentwood?
There are 93.16 Males per 100 Females in Brentwood.
What is the Ratio of Females per 100 Males in Brentwood?
There are 107.35 Females per 100 Males in Brentwood.
What is the Median Population Age in Brentwood?
Median Population Age in Brentwood is 34.1 Years.
What is the Average Family Size in Brentwood
Average Family Size in Brentwood is 4.0 People.
What is the Average Household Size in Brentwood
Average Household Size in Brentwood is 2.9 People.
How Large is the Labor Force in Brentwood?
There are 2,153 People in the Labor Forcein in Brentwood.
What is the Percentage of People in the Labor Force in Brentwood?
73.1% of People are in the Labor Force in Brentwood.
What is the Unemployment Rate in Brentwood?
Unemployment Rate in Brentwood is 5.6%.