Haverstraw, NY Map & Demographics
Haverstraw Map
Haverstraw Overview
$33,244
PER CAPITA INCOME
$78,321
AVG FAMILY INCOME
$77,254
AVG HOUSEHOLD INCOME
32.6%
WAGE / INCOME GAP [ % ]
67.4¢/ $1
WAGE / INCOME GAP [ $ ]
$14,584
FAMILY INCOME DEFICIT
0.48
INEQUALITY / GINI INDEX
12,286
TOTAL POPULATION
6,548
MALE POPULATION
5,738
FEMALE POPULATION
114.12
MALES / 100 FEMALES
87.63
FEMALES / 100 MALES
36.8
MEDIAN AGE
3.7
AVG FAMILY SIZE
3.2
AVG HOUSEHOLD SIZE
6,071
LABOR FORCE [ PEOPLE ]
63.9%
PERCENT IN LABOR FORCE
8.8%
UNEMPLOYMENT RATE
Haverstraw Zip Codes
Haverstraw Area Codes
Income in Haverstraw
Income Overview in Haverstraw
Per Capita Income in Haverstraw is $33,244, while median incomes of families and households are $78,321 and $77,254 respectively.
| Characteristic | Number | Measure |
| Per Capita Income | 12,286 | $33,244 |
| Median Family Income | 2,788 | $78,321 |
| Mean Family Income | 2,788 | $108,797 |
| Median Household Income | 3,686 | $77,254 |
| Mean Household Income | 3,686 | $102,566 |
| Income Deficit | 2,788 | $14,584 |
| Wage / Income Gap (%) | 12,286 | 32.56% |
| Wage / Income Gap ($) | 12,286 | 67.44¢ per $1 |
| Gini / Inequality Index | 12,286 | 0.48 |
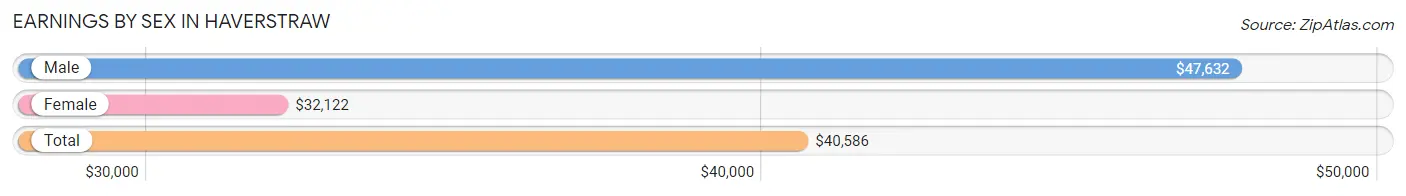
Earnings by Sex in Haverstraw
Average Earnings in Haverstraw are $40,586, $47,632 for men and $32,122 for women, a difference of 32.6%.
| Sex | Number | Average Earnings |
| Male | 3,270 (53.0%) | $47,632 |
| Female | 2,897 (47.0%) | $32,122 |
| Total | 6,167 (100.0%) | $40,586 |
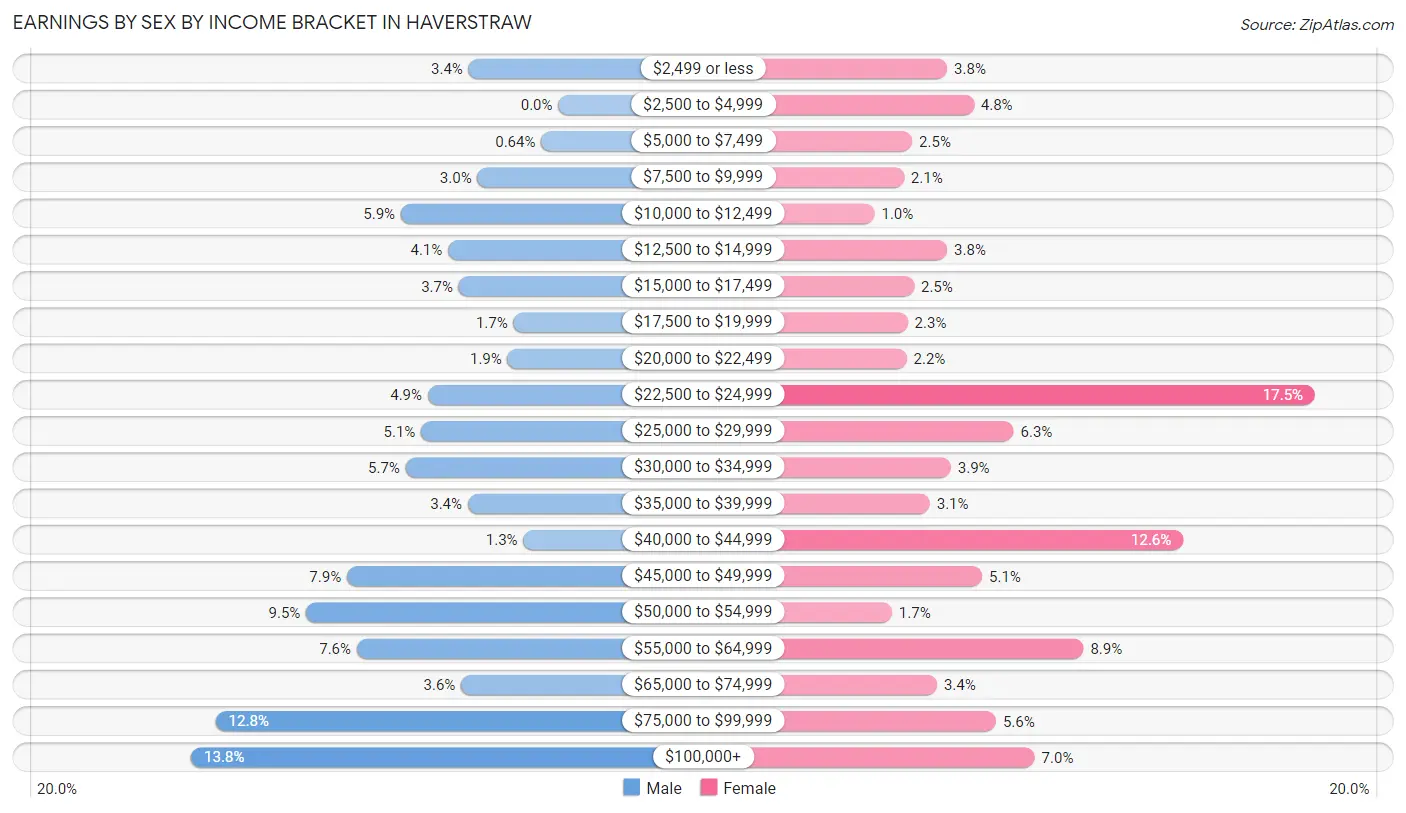
Earnings by Sex by Income Bracket in Haverstraw
The most common earnings brackets in Haverstraw are $100,000+ for men (450 | 13.8%) and $22,500 to $24,999 for women (508 | 17.5%).
| Income | Male | Female |
| $2,499 or less | 110 (3.4%) | 109 (3.8%) |
| $2,500 to $4,999 | 0 (0.0%) | 138 (4.8%) |
| $5,000 to $7,499 | 21 (0.6%) | 71 (2.5%) |
| $7,500 to $9,999 | 99 (3.0%) | 62 (2.1%) |
| $10,000 to $12,499 | 193 (5.9%) | 30 (1.0%) |
| $12,500 to $14,999 | 135 (4.1%) | 109 (3.8%) |
| $15,000 to $17,499 | 122 (3.7%) | 73 (2.5%) |
| $17,500 to $19,999 | 55 (1.7%) | 66 (2.3%) |
| $20,000 to $22,499 | 62 (1.9%) | 65 (2.2%) |
| $22,500 to $24,999 | 160 (4.9%) | 508 (17.5%) |
| $25,000 to $29,999 | 168 (5.1%) | 181 (6.2%) |
| $30,000 to $34,999 | 187 (5.7%) | 113 (3.9%) |
| $35,000 to $39,999 | 111 (3.4%) | 90 (3.1%) |
| $40,000 to $44,999 | 43 (1.3%) | 365 (12.6%) |
| $45,000 to $49,999 | 259 (7.9%) | 147 (5.1%) |
| $50,000 to $54,999 | 309 (9.5%) | 49 (1.7%) |
| $55,000 to $64,999 | 247 (7.5%) | 257 (8.9%) |
| $65,000 to $74,999 | 119 (3.6%) | 98 (3.4%) |
| $75,000 to $99,999 | 420 (12.8%) | 162 (5.6%) |
| $100,000+ | 450 (13.8%) | 204 (7.0%) |
| Total | 3,270 (100.0%) | 2,897 (100.0%) |
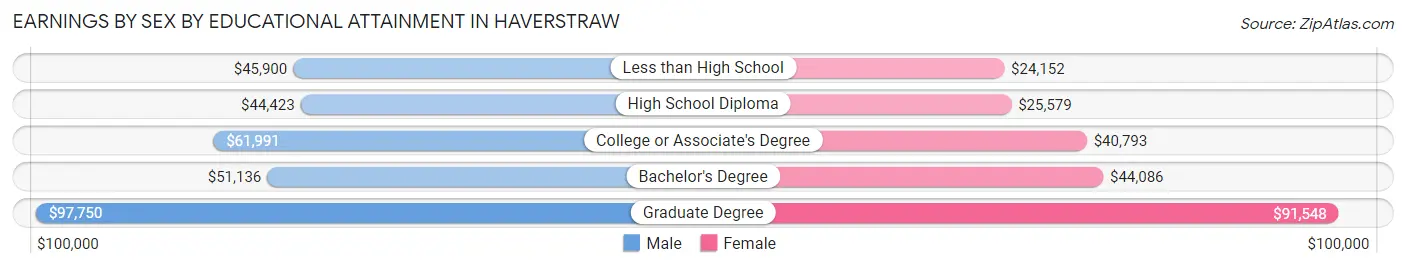
Earnings by Sex by Educational Attainment in Haverstraw
Average earnings in Haverstraw are $51,368 for men and $40,869 for women, a difference of 20.4%. Men with an educational attainment of graduate degree enjoy the highest average annual earnings of $97,750, while those with high school diploma education earn the least with $44,423. Women with an educational attainment of graduate degree earn the most with the average annual earnings of $91,548, while those with less than high school education have the smallest earnings of $24,152.
| Educational Attainment | Male Income | Female Income |
| Less than High School | $45,900 | $24,152 |
| High School Diploma | $44,423 | $25,579 |
| College or Associate's Degree | $61,991 | $40,793 |
| Bachelor's Degree | $51,136 | $44,086 |
| Graduate Degree | $97,750 | $91,548 |
| Total | $51,368 | $40,869 |
Family Income in Haverstraw
Family Income Brackets in Haverstraw
According to the Haverstraw family income data, there are 563 families falling into the $75,000 to $99,999 income range, which is the most common income bracket and makes up 20.2% of all families. Conversely, the $10,000 to $14,999 income bracket is the least frequent group with only 78 families (2.8%) belonging to this category.
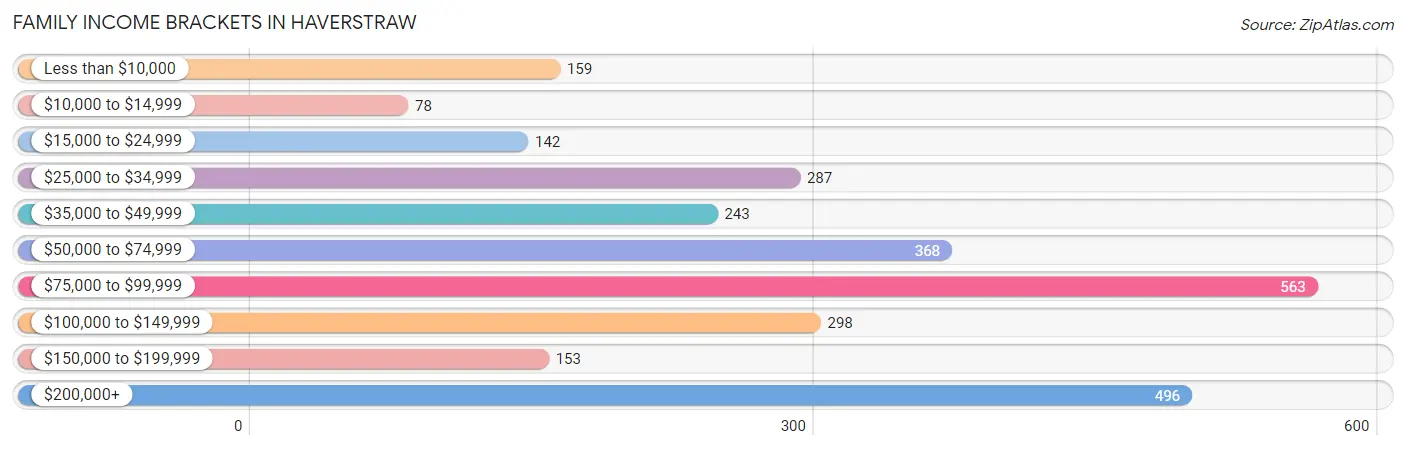
| Income Bracket | # Families | % Families |
| Less than $10,000 | 159 | 5.7% |
| $10,000 to $14,999 | 78 | 2.8% |
| $15,000 to $24,999 | 142 | 5.1% |
| $25,000 to $34,999 | 287 | 10.3% |
| $35,000 to $49,999 | 243 | 8.7% |
| $50,000 to $74,999 | 368 | 13.2% |
| $75,000 to $99,999 | 563 | 20.2% |
| $100,000 to $149,999 | 298 | 10.7% |
| $150,000 to $199,999 | 153 | 5.5% |
| $200,000+ | 496 | 17.8% |
Family Income by Famaliy Size in Haverstraw
5-person families (509 | 18.3%) account for the highest median family income in Haverstraw with $116,250 per family, while 2-person families (901 | 32.3%) have the highest median income of $26,438 per family member.
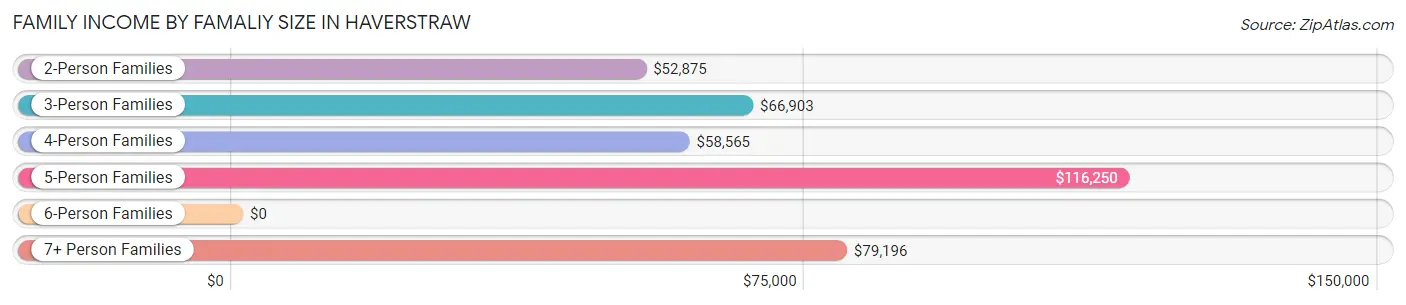
| Income Bracket | # Families | Median Income |
| 2-Person Families | 901 (32.3%) | $52,875 |
| 3-Person Families | 577 (20.7%) | $66,903 |
| 4-Person Families | 613 (22.0%) | $58,565 |
| 5-Person Families | 509 (18.3%) | $116,250 |
| 6-Person Families | 112 (4.0%) | $0 |
| 7+ Person Families | 76 (2.7%) | $79,196 |
| Total | 2,788 (100.0%) | $78,321 |
Family Income by Number of Earners in Haverstraw
The median family income in Haverstraw is $78,321, with families comprising 3+ earners (644) having the highest median family income of $115,800, while families with no earners (316) have the lowest median family income of $32,581, accounting for 23.1% and 11.3% of families, respectively.
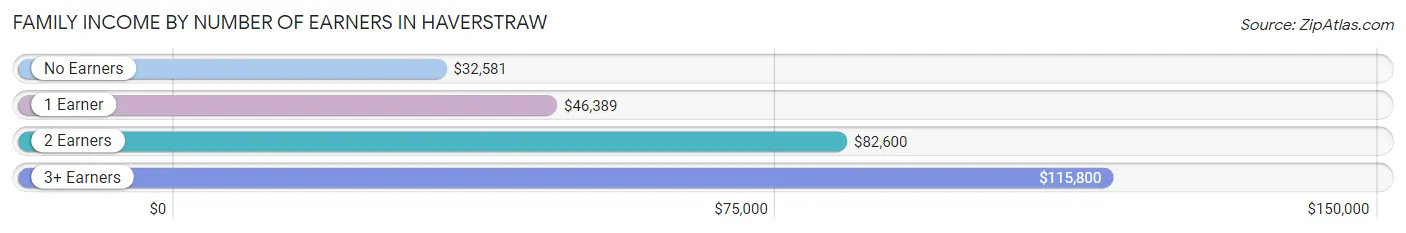
| Number of Earners | # Families | Median Income |
| No Earners | 316 (11.3%) | $32,581 |
| 1 Earner | 996 (35.7%) | $46,389 |
| 2 Earners | 832 (29.8%) | $82,600 |
| 3+ Earners | 644 (23.1%) | $115,800 |
| Total | 2,788 (100.0%) | $78,321 |
Household Income in Haverstraw
Household Income Brackets in Haverstraw
With 700 households falling in the category, the $75,000 to $99,999 income range is the most frequent in Haverstraw, accounting for 19.0% of all households. In contrast, only 129 households (3.5%) fall into the $10,000 to $14,999 income bracket, making it the least populous group.
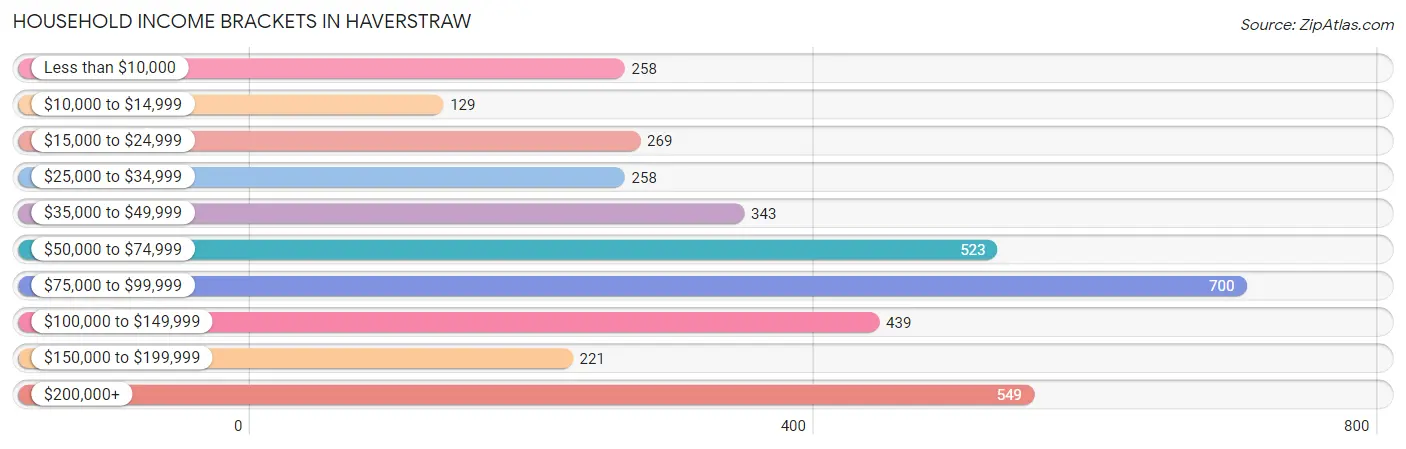
| Income Bracket | # Households | % Households |
| Less than $10,000 | 258 | 7.0% |
| $10,000 to $14,999 | 129 | 3.5% |
| $15,000 to $24,999 | 269 | 7.3% |
| $25,000 to $34,999 | 258 | 7.0% |
| $35,000 to $49,999 | 343 | 9.3% |
| $50,000 to $74,999 | 523 | 14.2% |
| $75,000 to $99,999 | 700 | 19.0% |
| $100,000 to $149,999 | 439 | 11.9% |
| $150,000 to $199,999 | 221 | 6.0% |
| $200,000+ | 549 | 14.9% |
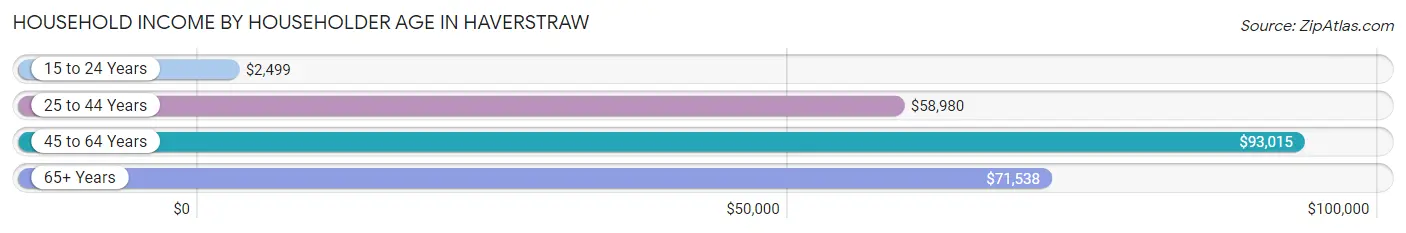
Household Income by Householder Age in Haverstraw
The median household income in Haverstraw is $77,254, with the highest median household income of $93,015 found in the 45 to 64 years age bracket for the primary householder. A total of 1,594 households (43.2%) fall into this category. Meanwhile, the 15 to 24 years age bracket for the primary householder has the lowest median household income of $2,499, with 96 households (2.6%) in this group.
| Income Bracket | # Households | Median Income |
| 15 to 24 Years | 96 (2.6%) | $2,499 |
| 25 to 44 Years | 1,016 (27.6%) | $58,980 |
| 45 to 64 Years | 1,594 (43.2%) | $93,015 |
| 65+ Years | 980 (26.6%) | $71,538 |
| Total | 3,686 (100.0%) | $77,254 |
Poverty in Haverstraw
Income Below Poverty by Sex and Age in Haverstraw
With 11.2% poverty level for males and 13.9% for females among the residents of Haverstraw, 16 and 17 year old males and 5 year old females are the most vulnerable to poverty, with 75 males (55.1%) and 48 females (100.0%) in their respective age groups living below the poverty level.
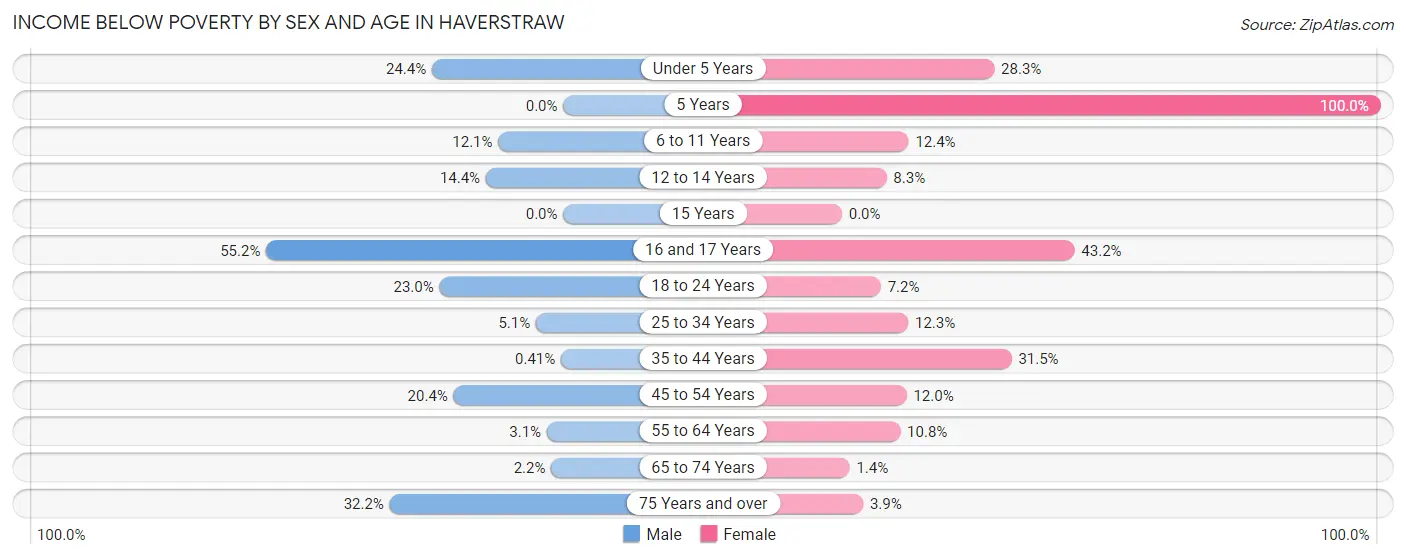
| Age Bracket | Male | Female |
| Under 5 Years | 174 (24.4%) | 97 (28.3%) |
| 5 Years | 0 (0.0%) | 48 (100.0%) |
| 6 to 11 Years | 48 (12.1%) | 35 (12.4%) |
| 12 to 14 Years | 51 (14.4%) | 24 (8.3%) |
| 15 Years | 0 (0.0%) | 0 (0.0%) |
| 16 and 17 Years | 75 (55.1%) | 38 (43.2%) |
| 18 to 24 Years | 91 (23.0%) | 51 (7.2%) |
| 25 to 34 Years | 59 (5.1%) | 87 (12.3%) |
| 35 to 44 Years | 3 (0.4%) | 188 (31.5%) |
| 45 to 54 Years | 112 (20.4%) | 107 (12.0%) |
| 55 to 64 Years | 29 (3.0%) | 90 (10.8%) |
| 65 to 74 Years | 11 (2.2%) | 8 (1.4%) |
| 75 Years and over | 68 (32.2%) | 13 (3.9%) |
| Total | 721 (11.2%) | 786 (13.9%) |
Income Above Poverty by Sex and Age in Haverstraw
According to the poverty statistics in Haverstraw, males aged 5 years and females aged 65 to 74 years are the age groups that are most secure financially, with 100.0% of males and 98.6% of females in these age groups living above the poverty line.
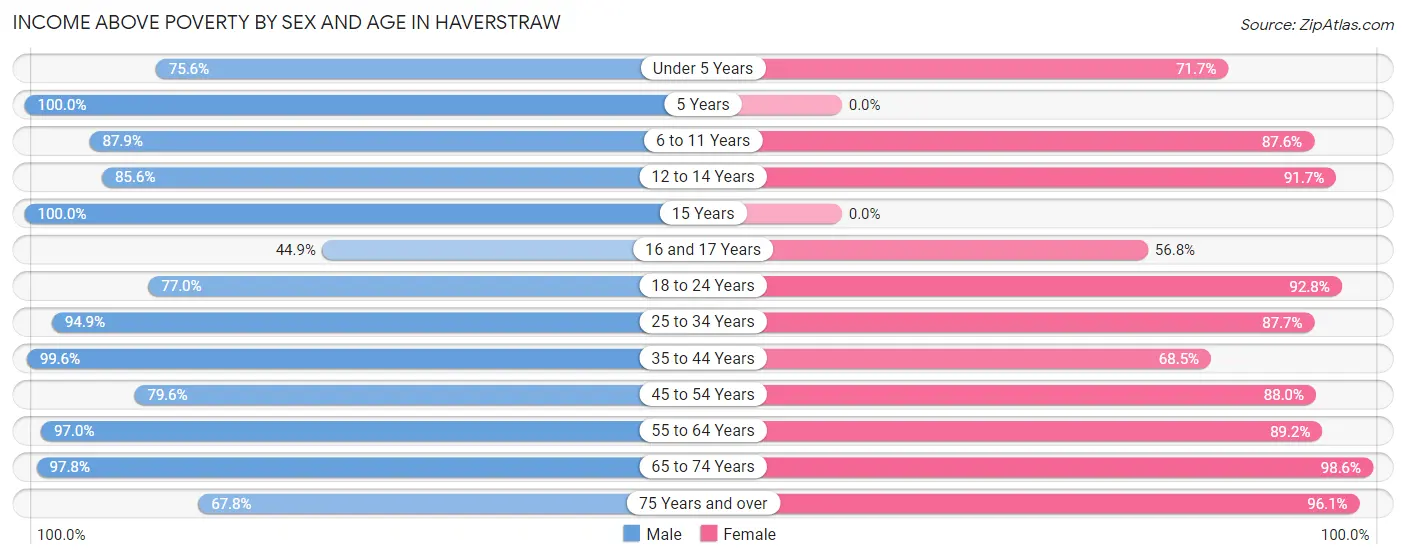
| Age Bracket | Male | Female |
| Under 5 Years | 540 (75.6%) | 246 (71.7%) |
| 5 Years | 151 (100.0%) | 0 (0.0%) |
| 6 to 11 Years | 350 (87.9%) | 248 (87.6%) |
| 12 to 14 Years | 304 (85.6%) | 266 (91.7%) |
| 15 Years | 201 (100.0%) | 0 (0.0%) |
| 16 and 17 Years | 61 (44.9%) | 50 (56.8%) |
| 18 to 24 Years | 305 (77.0%) | 654 (92.8%) |
| 25 to 34 Years | 1,105 (94.9%) | 621 (87.7%) |
| 35 to 44 Years | 729 (99.6%) | 409 (68.5%) |
| 45 to 54 Years | 438 (79.6%) | 784 (88.0%) |
| 55 to 64 Years | 923 (97.0%) | 741 (89.2%) |
| 65 to 74 Years | 479 (97.8%) | 553 (98.6%) |
| 75 Years and over | 143 (67.8%) | 318 (96.1%) |
| Total | 5,729 (88.8%) | 4,890 (86.2%) |
Income Below Poverty Among Married-Couple Families in Haverstraw
The poverty statistics for married-couple families in Haverstraw show that 4.6% or 71 of the total 1,558 families live below the poverty line. Families with 1 or 2 children have the highest poverty rate of 10.1%, comprising of 71 families. On the other hand, families with no children have the lowest poverty rate of 0.0%, which includes 0 families.
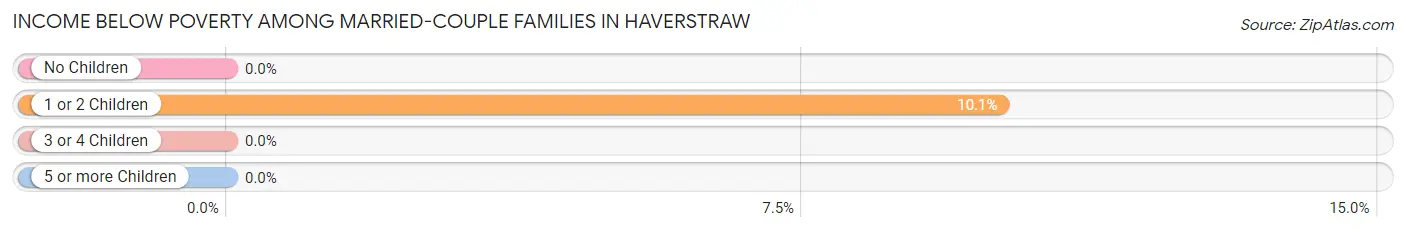
| Children | Above Poverty | Below Poverty |
| No Children | 727 (100.0%) | 0 (0.0%) |
| 1 or 2 Children | 634 (89.9%) | 71 (10.1%) |
| 3 or 4 Children | 126 (100.0%) | 0 (0.0%) |
| 5 or more Children | 0 (0.0%) | 0 (0.0%) |
| Total | 1,487 (95.4%) | 71 (4.6%) |
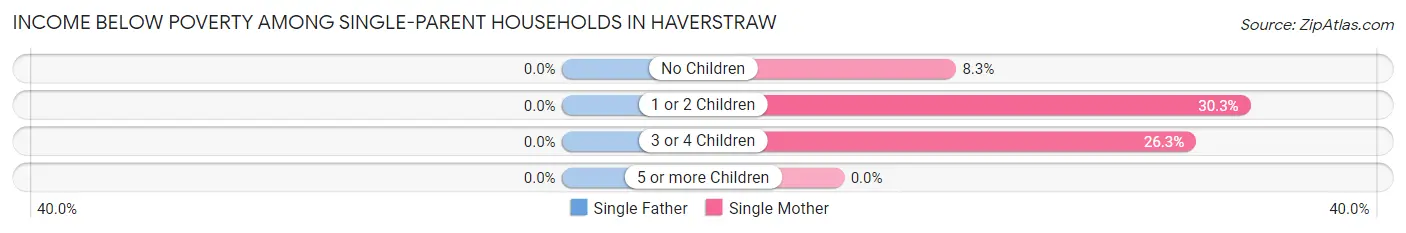
Income Below Poverty Among Single-Parent Households in Haverstraw
| Children | Single Father | Single Mother |
| No Children | 0 (0.0%) | 27 (8.3%) |
| 1 or 2 Children | 0 (0.0%) | 190 (30.3%) |
| 3 or 4 Children | 0 (0.0%) | 21 (26.3%) |
| 5 or more Children | 0 (0.0%) | 0 (0.0%) |
| Total | 0 (0.0%) | 238 (23.1%) |
Income Below Poverty Among Married-Couple vs Single-Parent Households in Haverstraw
The poverty data for Haverstraw shows that 71 of the married-couple family households (4.6%) and 238 of the single-parent households (19.4%) are living below the poverty level. Within the married-couple family households, those with 1 or 2 children have the highest poverty rate, with 71 households (10.1%) falling below the poverty line. Among the single-parent households, those with 1 or 2 children have the highest poverty rate, with 190 household (28.0%) living below poverty.
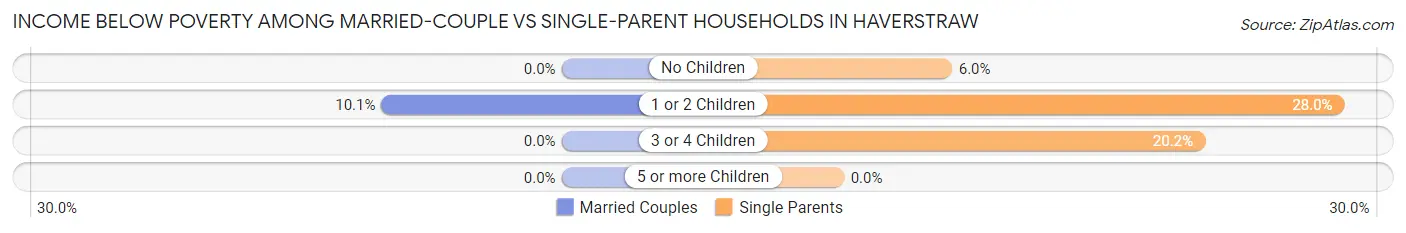
| Children | Married-Couple Families | Single-Parent Households |
| No Children | 0 (0.0%) | 27 (6.0%) |
| 1 or 2 Children | 71 (10.1%) | 190 (28.0%) |
| 3 or 4 Children | 0 (0.0%) | 21 (20.2%) |
| 5 or more Children | 0 (0.0%) | 0 (0.0%) |
| Total | 71 (4.6%) | 238 (19.4%) |
Race in Haverstraw
The most populous races in Haverstraw are Hispanic or Latino (6,850 | 55.7%), White / Caucasian (3,636 | 29.6%), and Some other Race (3,251 | 26.5%).
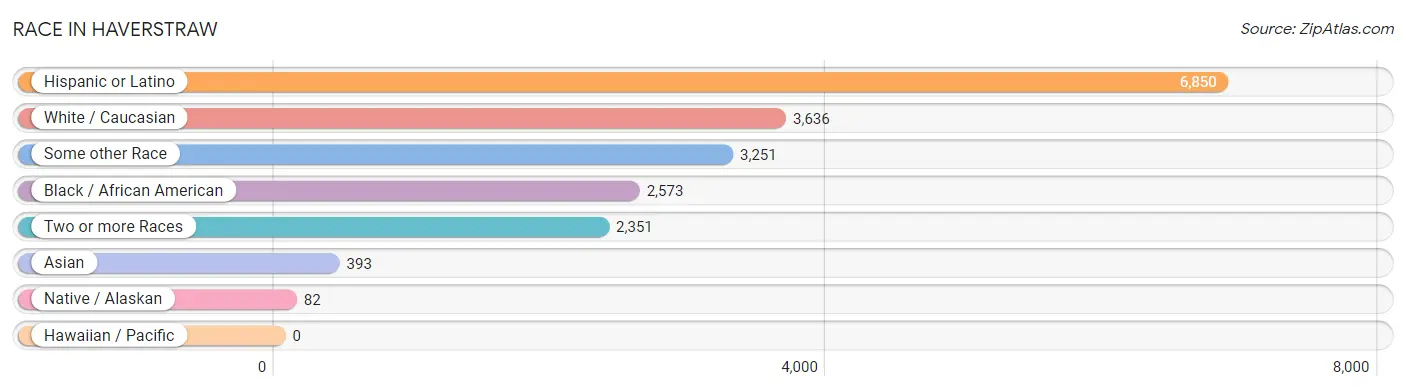
| Race | # Population | % Population |
| Asian | 393 | 3.2% |
| Black / African American | 2,573 | 20.9% |
| Hawaiian / Pacific | 0 | 0.0% |
| Hispanic or Latino | 6,850 | 55.7% |
| Native / Alaskan | 82 | 0.7% |
| White / Caucasian | 3,636 | 29.6% |
| Two or more Races | 2,351 | 19.1% |
| Some other Race | 3,251 | 26.5% |
| Total | 12,286 | 100.0% |
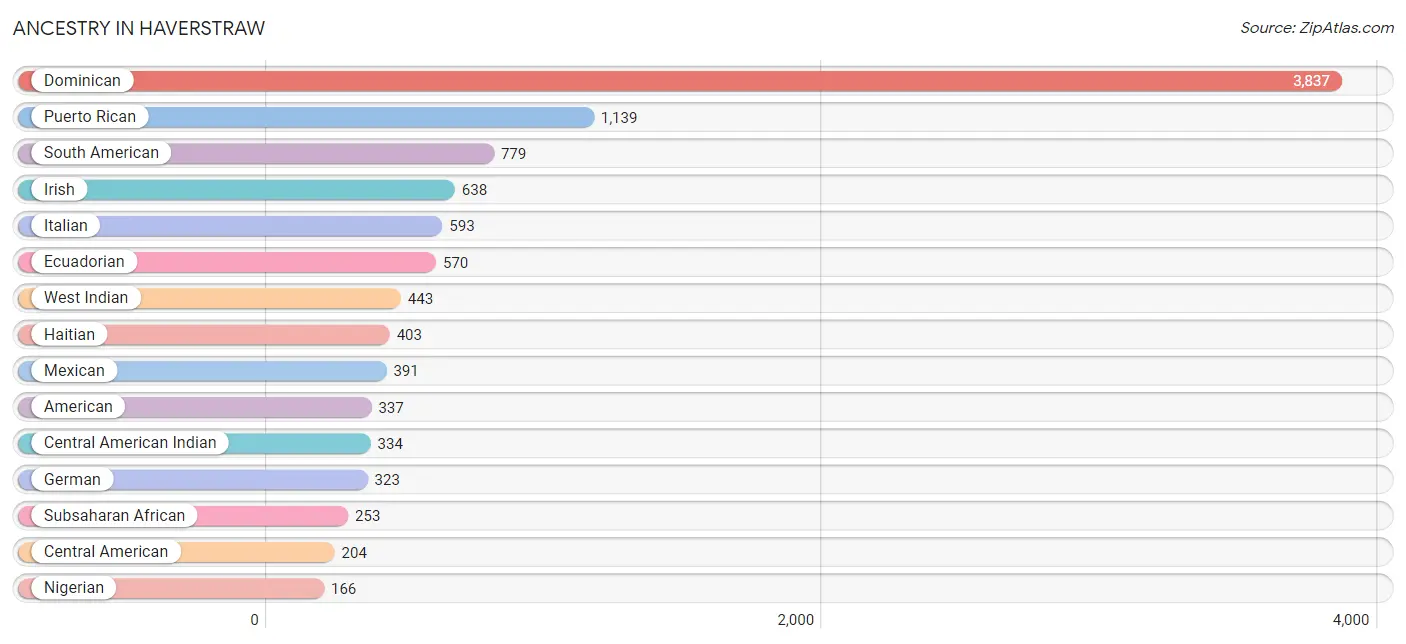
Ancestry in Haverstraw
The most populous ancestries reported in Haverstraw are Dominican (3,837 | 31.2%), Puerto Rican (1,139 | 9.3%), South American (779 | 6.3%), Irish (638 | 5.2%), and Italian (593 | 4.8%), together accounting for 56.9% of all Haverstraw residents.
| Ancestry | # Population | % Population |
| African | 72 | 0.6% |
| American | 337 | 2.7% |
| Arab | 39 | 0.3% |
| Argentinean | 41 | 0.3% |
| Bhutanese | 53 | 0.4% |
| British | 5 | 0.0% |
| British West Indian | 16 | 0.1% |
| Central American | 204 | 1.7% |
| Central American Indian | 334 | 2.7% |
| Chilean | 10 | 0.1% |
| Colombian | 26 | 0.2% |
| Cuban | 102 | 0.8% |
| Cypriot | 22 | 0.2% |
| Czech | 8 | 0.1% |
| Czechoslovakian | 25 | 0.2% |
| Dominican | 3,837 | 31.2% |
| Dutch | 29 | 0.2% |
| Eastern European | 28 | 0.2% |
| Ecuadorian | 570 | 4.6% |
| English | 124 | 1.0% |
| European | 12 | 0.1% |
| French | 17 | 0.1% |
| French Canadian | 18 | 0.2% |
| German | 323 | 2.6% |
| Greek | 113 | 0.9% |
| Guatemalan | 7 | 0.1% |
| Haitian | 403 | 3.3% |
| Honduran | 31 | 0.3% |
| Hungarian | 25 | 0.2% |
| Indian (Asian) | 20 | 0.2% |
| Irish | 638 | 5.2% |
| Italian | 593 | 4.8% |
| Jamaican | 12 | 0.1% |
| Japanese | 124 | 1.0% |
| Korean | 122 | 1.0% |
| Lebanese | 39 | 0.3% |
| Lithuanian | 24 | 0.2% |
| Mexican | 391 | 3.2% |
| Nigerian | 166 | 1.3% |
| Norwegian | 56 | 0.5% |
| Pennsylvania German | 6 | 0.1% |
| Peruvian | 132 | 1.1% |
| Polish | 162 | 1.3% |
| Puerto Rican | 1,139 | 9.3% |
| Russian | 150 | 1.2% |
| Salvadoran | 166 | 1.3% |
| Scotch-Irish | 2 | 0.0% |
| Scottish | 35 | 0.3% |
| Serbian | 2 | 0.0% |
| Slovak | 17 | 0.1% |
| South American | 779 | 6.3% |
| South American Indian | 26 | 0.2% |
| Subsaharan African | 253 | 2.1% |
| Swedish | 37 | 0.3% |
| Thai | 146 | 1.2% |
| Trinidadian and Tobagonian | 6 | 0.1% |
| Turkish | 14 | 0.1% |
| Ukrainian | 14 | 0.1% |
| West Indian | 443 | 3.6% | View All 59 Rows |
Immigrants in Haverstraw
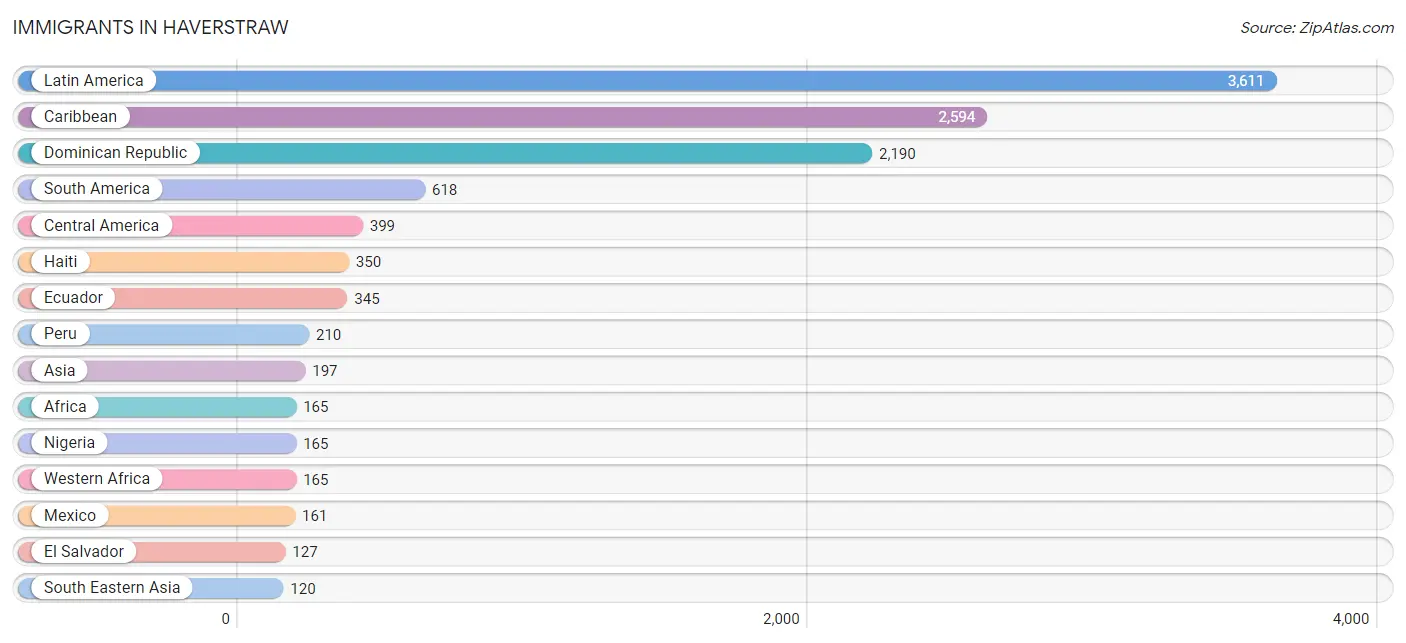
The most numerous immigrant groups reported in Haverstraw came from Latin America (3,611 | 29.4%), Caribbean (2,594 | 21.1%), Dominican Republic (2,190 | 17.8%), South America (618 | 5.0%), and Central America (399 | 3.3%), together accounting for 76.6% of all Haverstraw residents.
| Immigration Origin | # Population | % Population |
| Africa | 165 | 1.3% |
| Argentina | 41 | 0.3% |
| Asia | 197 | 1.6% |
| Bulgaria | 8 | 0.1% |
| Cambodia | 35 | 0.3% |
| Caribbean | 2,594 | 21.1% |
| Central America | 399 | 3.3% |
| Chile | 10 | 0.1% |
| China | 17 | 0.1% |
| Colombia | 12 | 0.1% |
| Costa Rica | 40 | 0.3% |
| Cuba | 48 | 0.4% |
| Dominican Republic | 2,190 | 17.8% |
| Eastern Asia | 17 | 0.1% |
| Eastern Europe | 56 | 0.5% |
| Ecuador | 345 | 2.8% |
| El Salvador | 127 | 1.0% |
| Europe | 115 | 0.9% |
| France | 15 | 0.1% |
| Germany | 27 | 0.2% |
| Guatemala | 29 | 0.2% |
| Haiti | 350 | 2.9% |
| Honduras | 14 | 0.1% |
| Hungary | 5 | 0.0% |
| India | 60 | 0.5% |
| Ireland | 8 | 0.1% |
| Italy | 9 | 0.1% |
| Latin America | 3,611 | 29.4% |
| Mexico | 161 | 1.3% |
| Nicaragua | 28 | 0.2% |
| Nigeria | 165 | 1.3% |
| Northern Europe | 8 | 0.1% |
| Peru | 210 | 1.7% |
| Philippines | 85 | 0.7% |
| Poland | 9 | 0.1% |
| Russia | 34 | 0.3% |
| South America | 618 | 5.0% |
| South Central Asia | 60 | 0.5% |
| South Eastern Asia | 120 | 1.0% |
| Southern Europe | 9 | 0.1% |
| Trinidad and Tobago | 6 | 0.1% |
| Western Africa | 165 | 1.3% |
| Western Europe | 42 | 0.3% | View All 43 Rows |
Sex and Age in Haverstraw
Sex and Age in Haverstraw
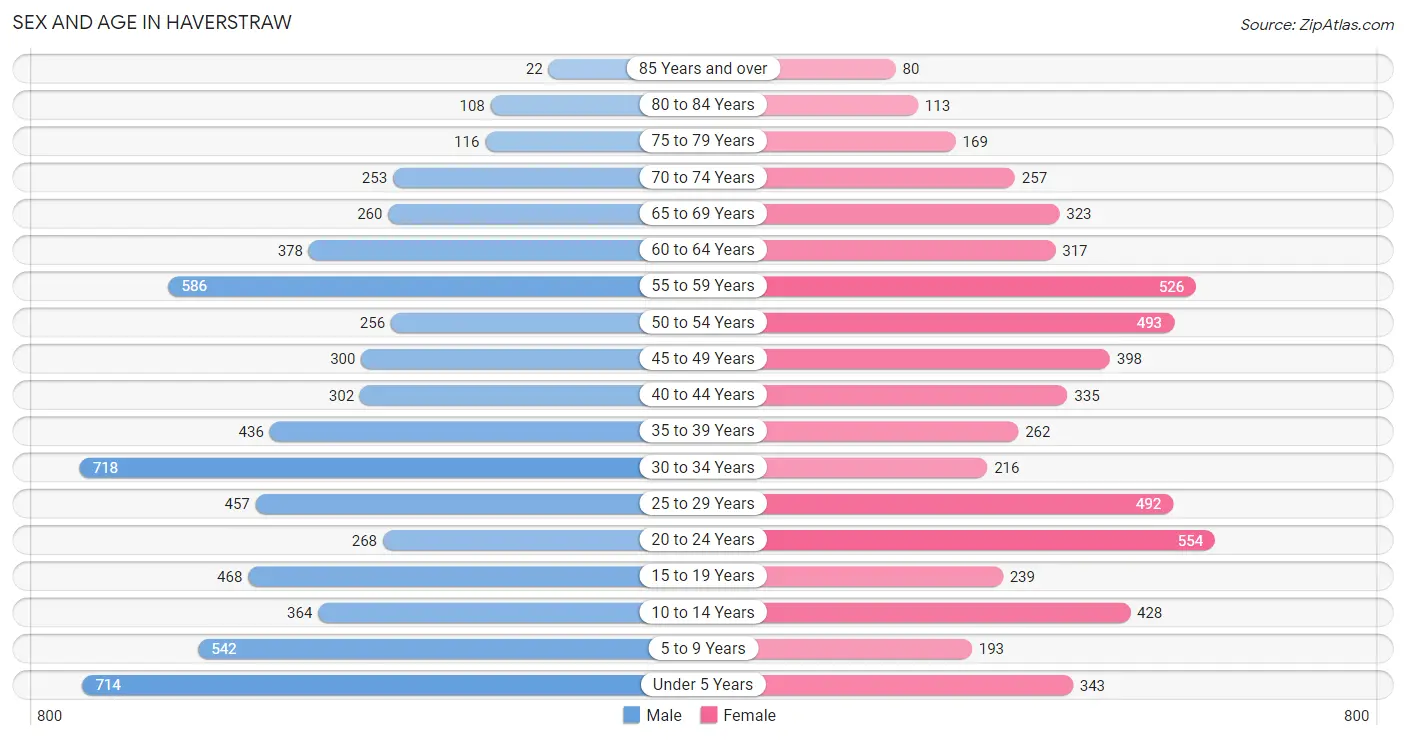
The most populous age groups in Haverstraw are 30 to 34 Years (718 | 11.0%) for men and 20 to 24 Years (554 | 9.7%) for women.
| Age Bracket | Male | Female |
| Under 5 Years | 714 (10.9%) | 343 (6.0%) |
| 5 to 9 Years | 542 (8.3%) | 193 (3.4%) |
| 10 to 14 Years | 364 (5.6%) | 428 (7.5%) |
| 15 to 19 Years | 468 (7.1%) | 239 (4.2%) |
| 20 to 24 Years | 268 (4.1%) | 554 (9.7%) |
| 25 to 29 Years | 457 (7.0%) | 492 (8.6%) |
| 30 to 34 Years | 718 (11.0%) | 216 (3.8%) |
| 35 to 39 Years | 436 (6.7%) | 262 (4.6%) |
| 40 to 44 Years | 302 (4.6%) | 335 (5.8%) |
| 45 to 49 Years | 300 (4.6%) | 398 (6.9%) |
| 50 to 54 Years | 256 (3.9%) | 493 (8.6%) |
| 55 to 59 Years | 586 (8.9%) | 526 (9.2%) |
| 60 to 64 Years | 378 (5.8%) | 317 (5.5%) |
| 65 to 69 Years | 260 (4.0%) | 323 (5.6%) |
| 70 to 74 Years | 253 (3.9%) | 257 (4.5%) |
| 75 to 79 Years | 116 (1.8%) | 169 (2.9%) |
| 80 to 84 Years | 108 (1.7%) | 113 (2.0%) |
| 85 Years and over | 22 (0.3%) | 80 (1.4%) |
| Total | 6,548 (100.0%) | 5,738 (100.0%) |
Families and Households in Haverstraw
Median Family Size in Haverstraw
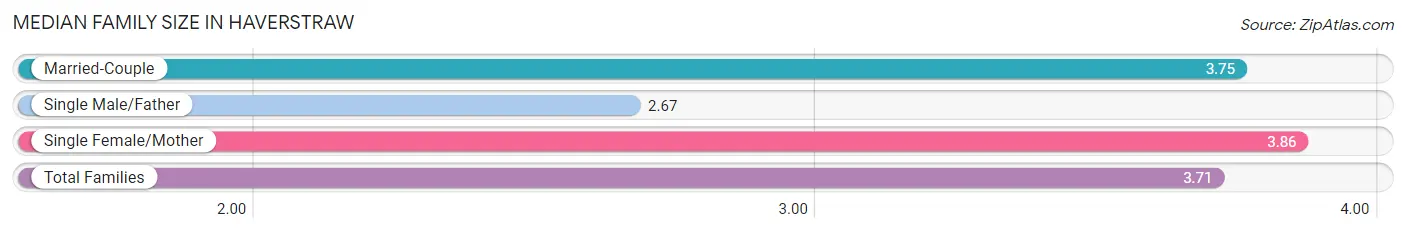
The median family size in Haverstraw is 3.71 persons per family, with single female/mother families (1,031 | 37.0%) accounting for the largest median family size of 3.86 persons per family. On the other hand, single male/father families (199 | 7.1%) represent the smallest median family size with 2.67 persons per family.
| Family Type | # Families | Family Size |
| Married-Couple | 1,558 (55.9%) | 3.75 |
| Single Male/Father | 199 (7.1%) | 2.67 |
| Single Female/Mother | 1,031 (37.0%) | 3.86 |
| Total Families | 2,788 (100.0%) | 3.71 |
Median Household Size in Haverstraw
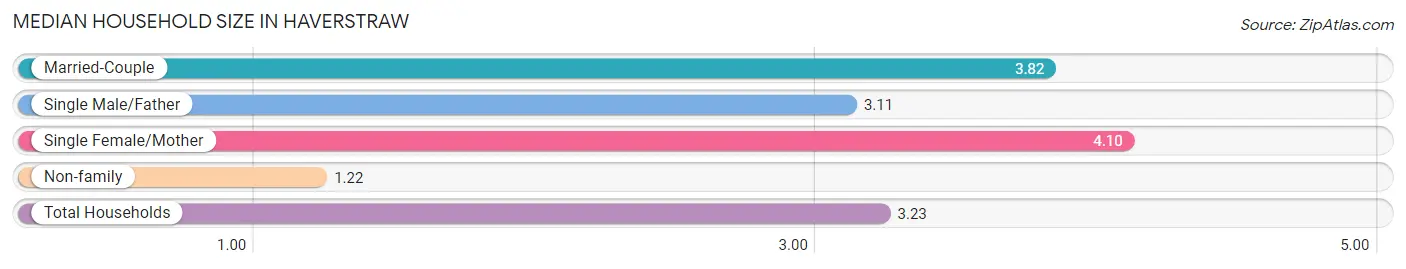
The median household size in Haverstraw is 3.23 persons per household, with single female/mother households (1,031 | 28.0%) accounting for the largest median household size of 4.1 persons per household. non-family households (898 | 24.4%) represent the smallest median household size with 1.22 persons per household.
| Household Type | # Households | Household Size |
| Married-Couple | 1,558 (42.3%) | 3.82 |
| Single Male/Father | 199 (5.4%) | 3.11 |
| Single Female/Mother | 1,031 (28.0%) | 4.10 |
| Non-family | 898 (24.4%) | 1.22 |
| Total Households | 3,686 (100.0%) | 3.23 |
Household Size by Marriage Status in Haverstraw
Out of a total of 3,686 households in Haverstraw, 2,788 (75.6%) are family households, while 898 (24.4%) are nonfamily households. The most numerous type of family households are 2-person households, comprising 707, and the most common type of nonfamily households are 1-person households, comprising 730.
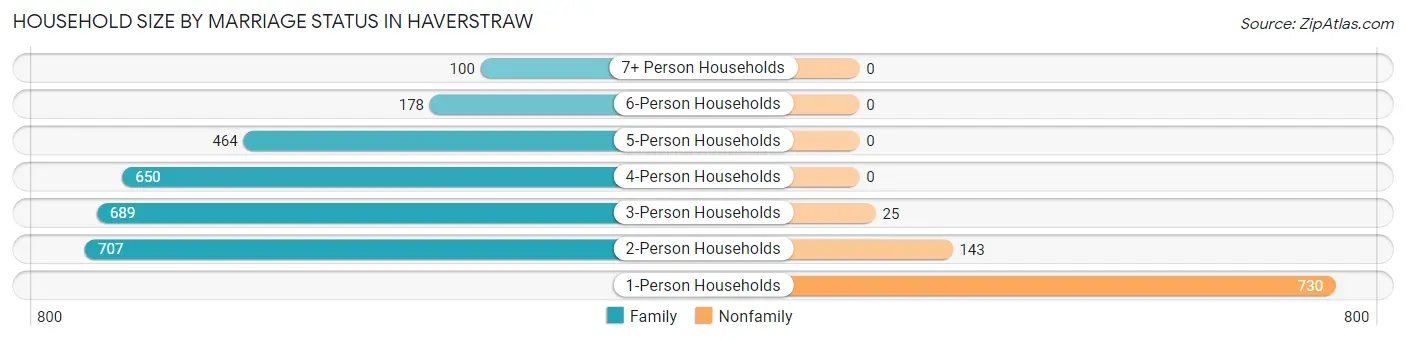
| Household Size | Family Households | Nonfamily Households |
| 1-Person Households | - | 730 (19.8%) |
| 2-Person Households | 707 (19.2%) | 143 (3.9%) |
| 3-Person Households | 689 (18.7%) | 25 (0.7%) |
| 4-Person Households | 650 (17.6%) | 0 (0.0%) |
| 5-Person Households | 464 (12.6%) | 0 (0.0%) |
| 6-Person Households | 178 (4.8%) | 0 (0.0%) |
| 7+ Person Households | 100 (2.7%) | 0 (0.0%) |
| Total | 2,788 (75.6%) | 898 (24.4%) |
Female Fertility in Haverstraw
Fertility by Age in Haverstraw
Average fertility rate in Haverstraw is 115.0 births per 1,000 women. Women in the age bracket of 20 to 34 years have the highest fertility rate with 212.0 births per 1,000 women. Women in the age bracket of 20 to 34 years acount for 87.0% of all women with births.
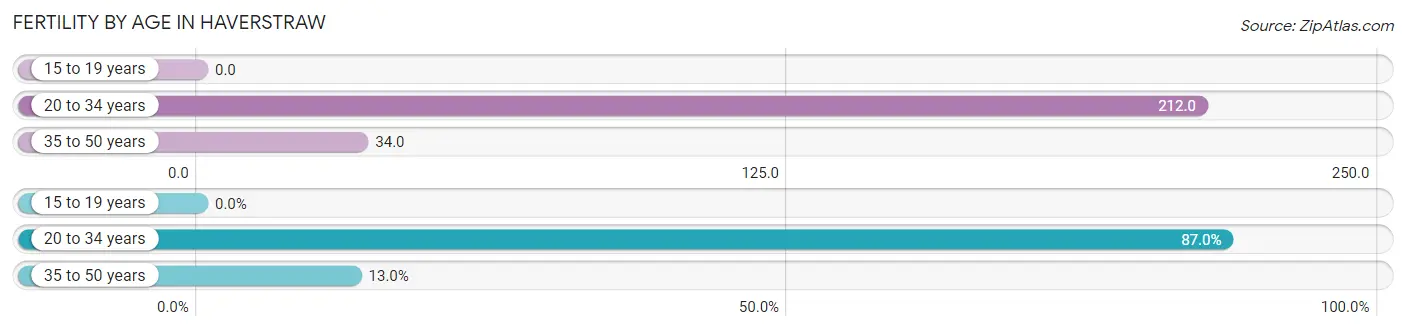
| Age Bracket | Women with Births | Births / 1,000 Women |
| 15 to 19 years | 0 (0.0%) | 0.0 |
| 20 to 34 years | 267 (87.0%) | 212.0 |
| 35 to 50 years | 40 (13.0%) | 34.0 |
| Total | 307 (100.0%) | 115.0 |
Fertility by Age by Marriage Status in Haverstraw
17.9% of women with births (307) in Haverstraw are married. The highest percentage of unmarried women with births falls into 35 to 50 years age bracket with 100.0% of them unmarried at the time of birth, while the lowest percentage of unmarried women with births belong to 20 to 34 years age bracket with 79.4% of them unmarried.
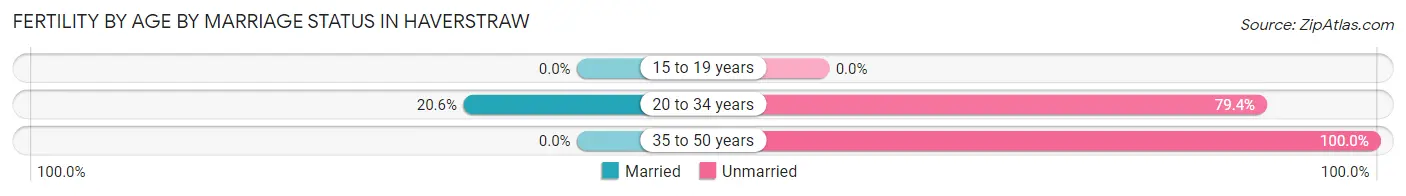
| Age Bracket | Married | Unmarried |
| 15 to 19 years | 0 (0.0%) | 0 (0.0%) |
| 20 to 34 years | 55 (20.6%) | 212 (79.4%) |
| 35 to 50 years | 0 (0.0%) | 40 (100.0%) |
| Total | 55 (17.9%) | 252 (82.1%) |
Fertility by Education in Haverstraw
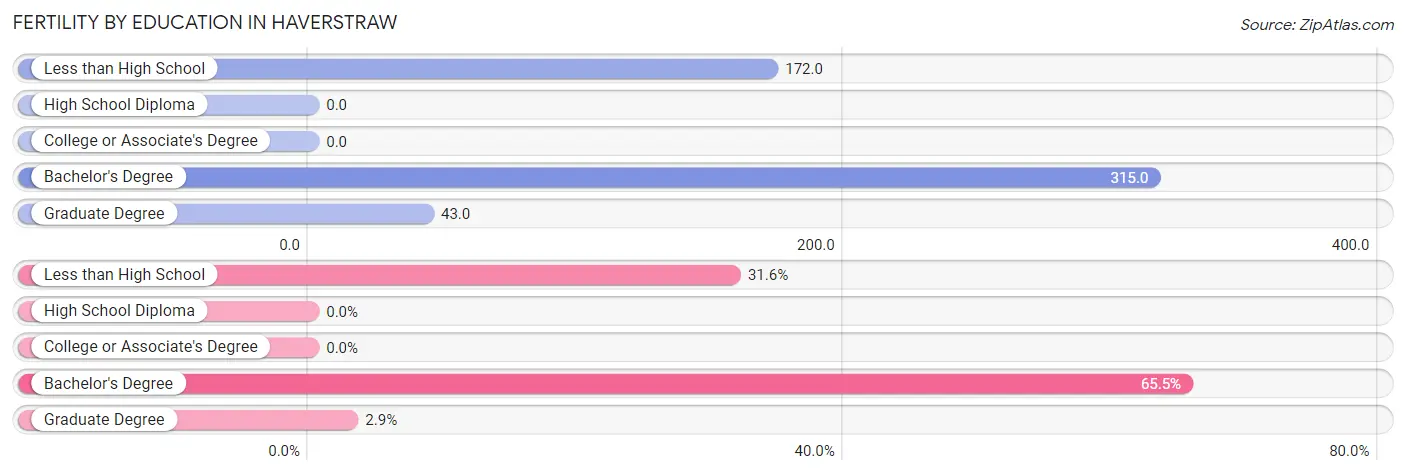
| Educational Attainment | Women with Births | Births / 1,000 Women |
| Less than High School | 97 (31.6%) | 172.0 |
| High School Diploma | 0 (0.0%) | 0.0 |
| College or Associate's Degree | 0 (0.0%) | 0.0 |
| Bachelor's Degree | 201 (65.5%) | 315.0 |
| Graduate Degree | 9 (2.9%) | 43.0 |
| Total | 307 (100.0%) | 115.0 |
Fertility by Education by Marriage Status in Haverstraw
82.1% of women with births in Haverstraw are unmarried. Women with the educational attainment of graduate degree are most likely to be married with 100.0% of them married at childbirth, while women with the educational attainment of bachelor's degree are least likely to be married with 100.0% of them unmarried at childbirth.
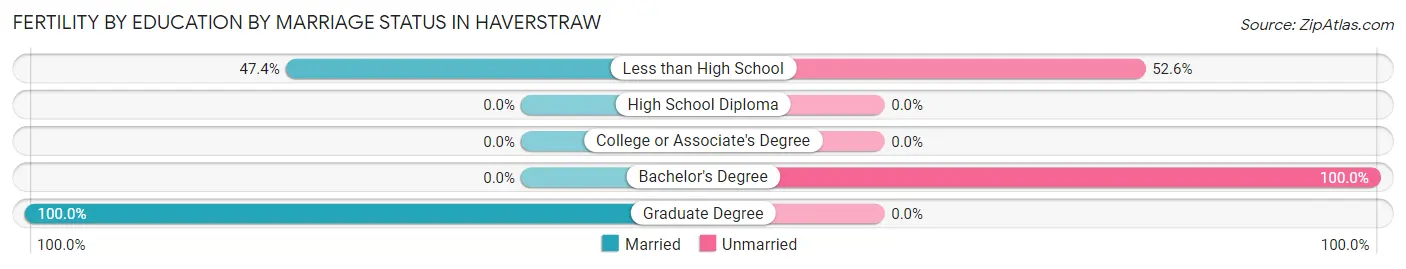
| Educational Attainment | Married | Unmarried |
| Less than High School | 46 (47.4%) | 51 (52.6%) |
| High School Diploma | 0 (0.0%) | 0 (0.0%) |
| College or Associate's Degree | 0 (0.0%) | 0 (0.0%) |
| Bachelor's Degree | 0 (0.0%) | 201 (100.0%) |
| Graduate Degree | 9 (100.0%) | 0 (0.0%) |
| Total | 55 (17.9%) | 252 (82.1%) |
Employment Characteristics in Haverstraw
Employment by Class of Employer in Haverstraw
Among the 5,245 employed individuals in Haverstraw, private company employees (3,194 | 60.9%), not-for-profit organizations (585 | 11.2%), and federal government employees (483 | 9.2%) make up the most common classes of employment.
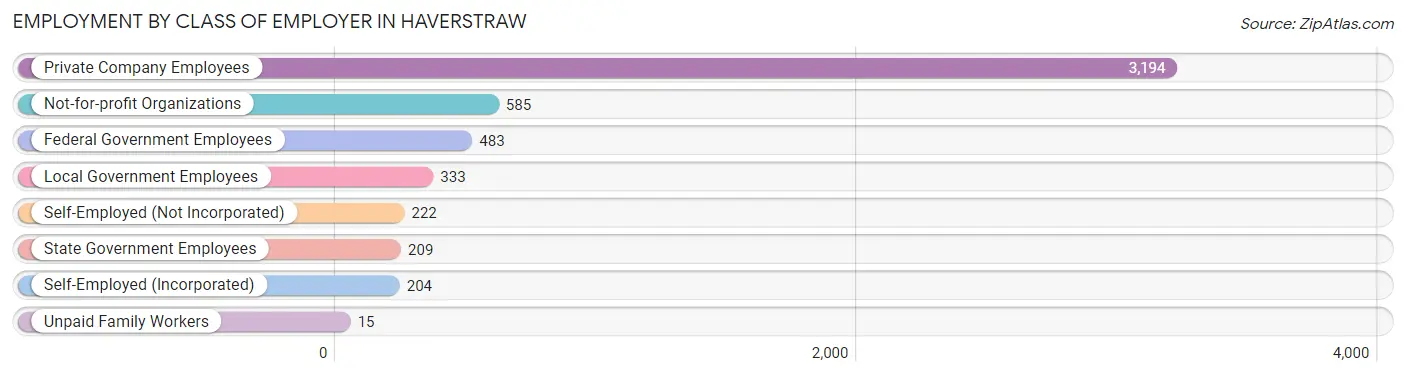
| Employer Class | # Employees | % Employees |
| Private Company Employees | 3,194 | 60.9% |
| Self-Employed (Incorporated) | 204 | 3.9% |
| Self-Employed (Not Incorporated) | 222 | 4.2% |
| Not-for-profit Organizations | 585 | 11.2% |
| Local Government Employees | 333 | 6.4% |
| State Government Employees | 209 | 4.0% |
| Federal Government Employees | 483 | 9.2% |
| Unpaid Family Workers | 15 | 0.3% |
| Total | 5,245 | 100.0% |
Employment Status by Age in Haverstraw
According to the labor force statistics for Haverstraw, out of the total population over 16 years of age (9,501), 63.9% or 6,071 individuals are in the labor force, with 8.8% or 534 of them unemployed. The age group with the highest labor force participation rate is 30 to 34 years, with 89.7% or 838 individuals in the labor force. Within the labor force, the 16 to 19 years age range has the highest percentage of unemployed individuals, with 35.0% or 96 of them being unemployed.
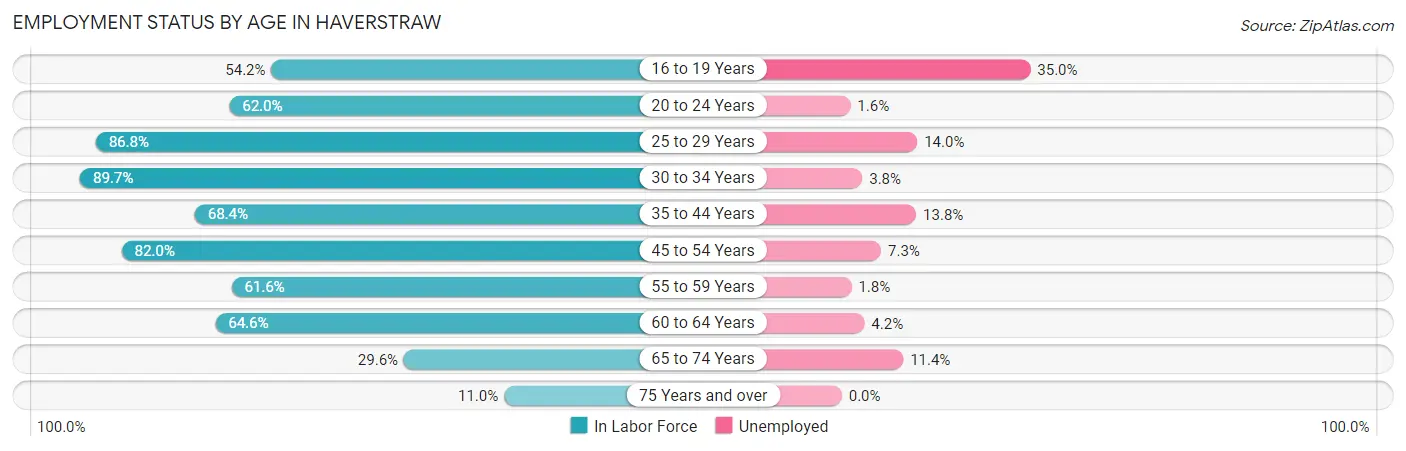
| Age Bracket | In Labor Force | Unemployed |
| 16 to 19 Years | 274 (54.2%) | 96 (35.0%) |
| 20 to 24 Years | 510 (62.0%) | 8 (1.6%) |
| 25 to 29 Years | 824 (86.8%) | 115 (14.0%) |
| 30 to 34 Years | 838 (89.7%) | 32 (3.8%) |
| 35 to 44 Years | 913 (68.4%) | 126 (13.8%) |
| 45 to 54 Years | 1,187 (82.0%) | 87 (7.3%) |
| 55 to 59 Years | 685 (61.6%) | 12 (1.8%) |
| 60 to 64 Years | 449 (64.6%) | 19 (4.2%) |
| 65 to 74 Years | 324 (29.6%) | 37 (11.4%) |
| 75 Years and over | 67 (11.0%) | 0 (0.0%) |
| Total | 6,071 (63.9%) | 534 (8.8%) |
Employment Status by Educational Attainment in Haverstraw
According to labor force statistics for Haverstraw, 75.6% of individuals (4,893) out of the total population between 25 and 64 years of age (6,472) are in the labor force, with 8.0% or 391 of them being unemployed. The group with the highest labor force participation rate are those with the educational attainment of college / associate degree, with 90.4% or 1,450 individuals in the labor force. Within the labor force, individuals with less than high school education have the highest percentage of unemployment, with 12.7% or 111 of them being unemployed.
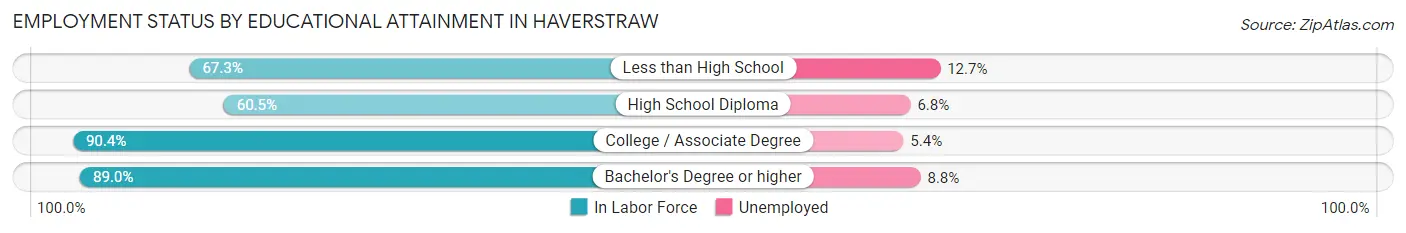
| Educational Attainment | In Labor Force | Unemployed |
| Less than High School | 874 (67.3%) | 165 (12.7%) |
| High School Diploma | 1,287 (60.5%) | 145 (6.8%) |
| College / Associate Degree | 1,450 (90.4%) | 87 (5.4%) |
| Bachelor's Degree or higher | 1,284 (89.0%) | 127 (8.8%) |
| Total | 4,893 (75.6%) | 518 (8.0%) |
Employment Occupations by Sex in Haverstraw
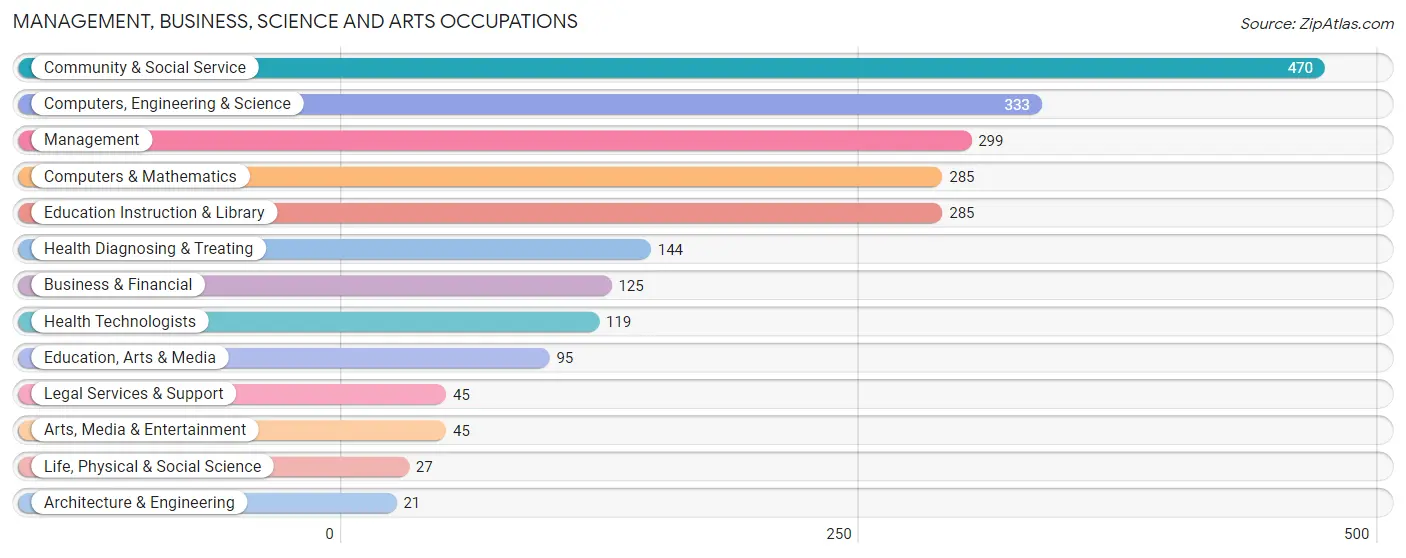
Management, Business, Science and Arts Occupations
The most common Management, Business, Science and Arts occupations in Haverstraw are Community & Social Service (470 | 8.5%), Computers, Engineering & Science (333 | 6.0%), Management (299 | 5.4%), Computers & Mathematics (285 | 5.1%), and Education Instruction & Library (285 | 5.1%).
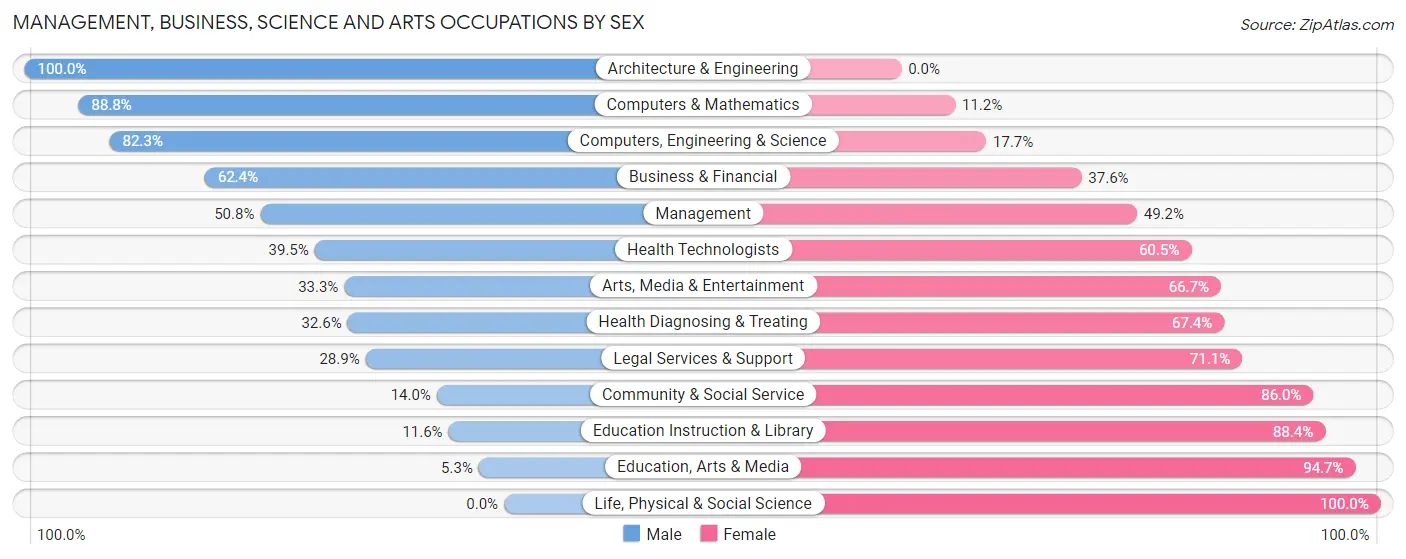
Management, Business, Science and Arts Occupations by Sex
Within the Management, Business, Science and Arts occupations in Haverstraw, the most male-oriented occupations are Architecture & Engineering (100.0%), Computers & Mathematics (88.8%), and Computers, Engineering & Science (82.3%), while the most female-oriented occupations are Life, Physical & Social Science (100.0%), Education, Arts & Media (94.7%), and Education Instruction & Library (88.4%).
| Occupation | Male | Female |
| Management | 152 (50.8%) | 147 (49.2%) |
| Business & Financial | 78 (62.4%) | 47 (37.6%) |
| Computers, Engineering & Science | 274 (82.3%) | 59 (17.7%) |
| Computers & Mathematics | 253 (88.8%) | 32 (11.2%) |
| Architecture & Engineering | 21 (100.0%) | 0 (0.0%) |
| Life, Physical & Social Science | 0 (0.0%) | 27 (100.0%) |
| Community & Social Service | 66 (14.0%) | 404 (86.0%) |
| Education, Arts & Media | 5 (5.3%) | 90 (94.7%) |
| Legal Services & Support | 13 (28.9%) | 32 (71.1%) |
| Education Instruction & Library | 33 (11.6%) | 252 (88.4%) |
| Arts, Media & Entertainment | 15 (33.3%) | 30 (66.7%) |
| Health Diagnosing & Treating | 47 (32.6%) | 97 (67.4%) |
| Health Technologists | 47 (39.5%) | 72 (60.5%) |
| Total (Category) | 617 (45.0%) | 754 (55.0%) |
| Total (Overall) | 2,899 (52.3%) | 2,639 (47.6%) |
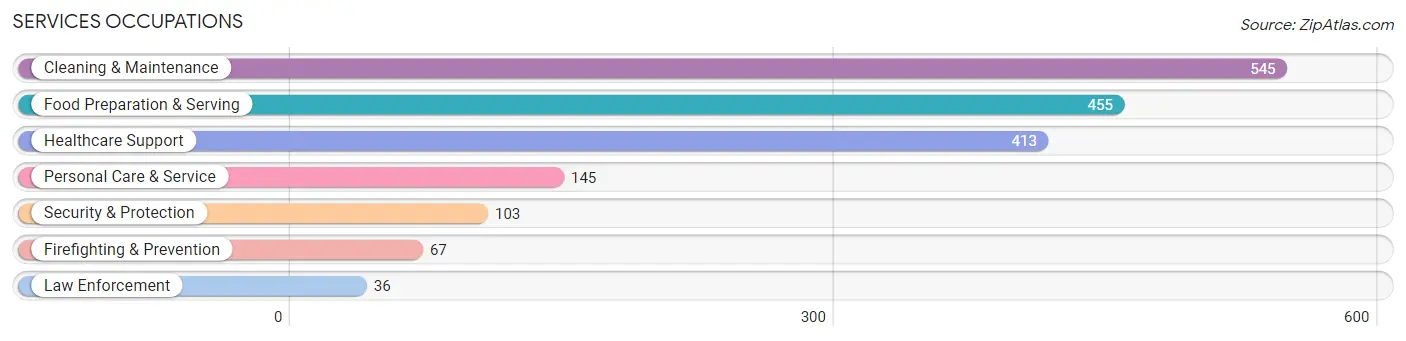
Services Occupations
The most common Services occupations in Haverstraw are Cleaning & Maintenance (545 | 9.8%), Food Preparation & Serving (455 | 8.2%), Healthcare Support (413 | 7.5%), Personal Care & Service (145 | 2.6%), and Security & Protection (103 | 1.9%).
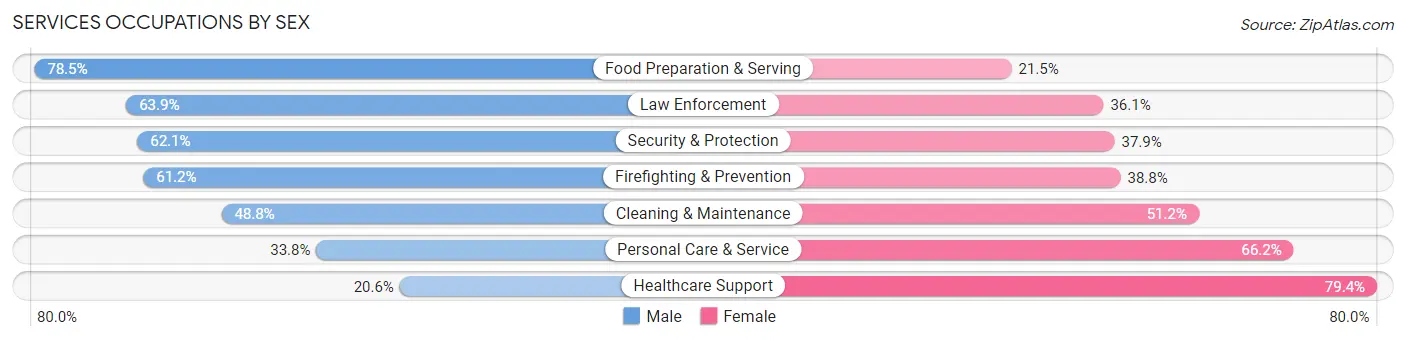
Services Occupations by Sex
Within the Services occupations in Haverstraw, the most male-oriented occupations are Food Preparation & Serving (78.5%), Law Enforcement (63.9%), and Security & Protection (62.1%), while the most female-oriented occupations are Healthcare Support (79.4%), Personal Care & Service (66.2%), and Cleaning & Maintenance (51.2%).
| Occupation | Male | Female |
| Healthcare Support | 85 (20.6%) | 328 (79.4%) |
| Security & Protection | 64 (62.1%) | 39 (37.9%) |
| Firefighting & Prevention | 41 (61.2%) | 26 (38.8%) |
| Law Enforcement | 23 (63.9%) | 13 (36.1%) |
| Food Preparation & Serving | 357 (78.5%) | 98 (21.5%) |
| Cleaning & Maintenance | 266 (48.8%) | 279 (51.2%) |
| Personal Care & Service | 49 (33.8%) | 96 (66.2%) |
| Total (Category) | 821 (49.4%) | 840 (50.6%) |
| Total (Overall) | 2,899 (52.3%) | 2,639 (47.6%) |
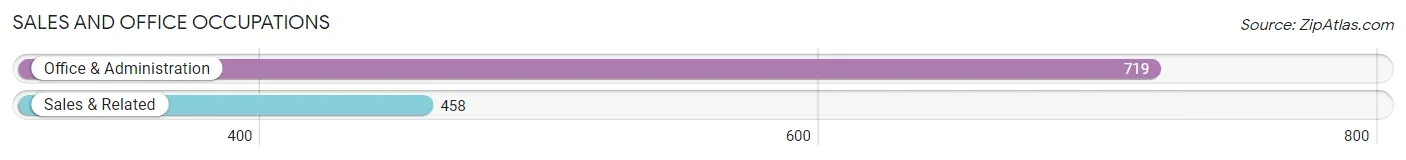
Sales and Office Occupations
The most common Sales and Office occupations in Haverstraw are Office & Administration (719 | 13.0%), and Sales & Related (458 | 8.3%).
Sales and Office Occupations by Sex
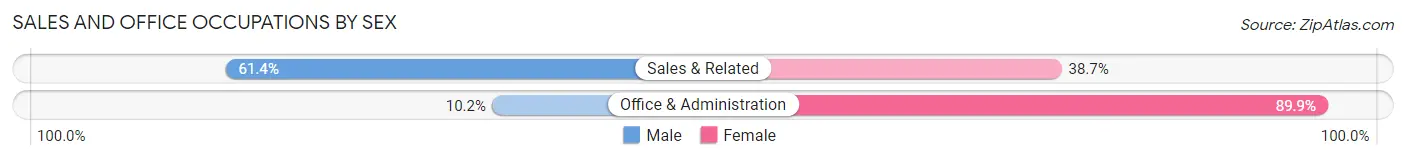
| Occupation | Male | Female |
| Sales & Related | 281 (61.4%) | 177 (38.7%) |
| Office & Administration | 73 (10.2%) | 646 (89.8%) |
| Total (Category) | 354 (30.1%) | 823 (69.9%) |
| Total (Overall) | 2,899 (52.3%) | 2,639 (47.6%) |
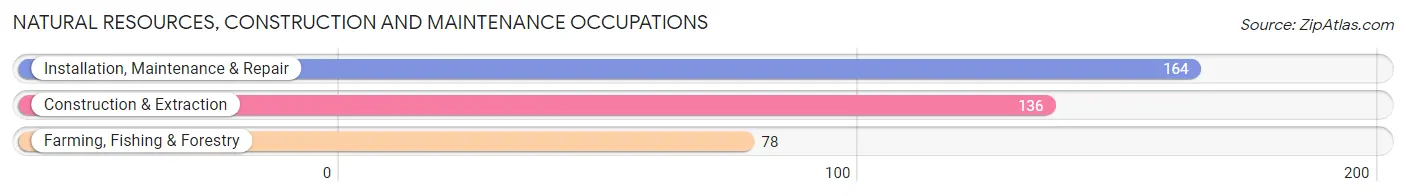
Natural Resources, Construction and Maintenance Occupations
The most common Natural Resources, Construction and Maintenance occupations in Haverstraw are Installation, Maintenance & Repair (164 | 3.0%), Construction & Extraction (136 | 2.5%), and Farming, Fishing & Forestry (78 | 1.4%).
Natural Resources, Construction and Maintenance Occupations by Sex
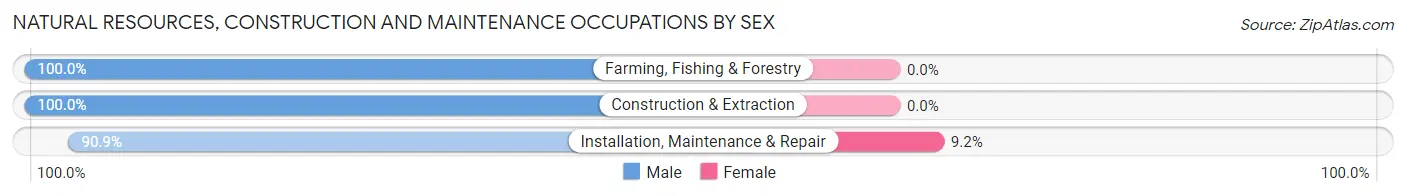
| Occupation | Male | Female |
| Farming, Fishing & Forestry | 78 (100.0%) | 0 (0.0%) |
| Construction & Extraction | 136 (100.0%) | 0 (0.0%) |
| Installation, Maintenance & Repair | 149 (90.8%) | 15 (9.1%) |
| Total (Category) | 363 (96.0%) | 15 (4.0%) |
| Total (Overall) | 2,899 (52.3%) | 2,639 (47.6%) |
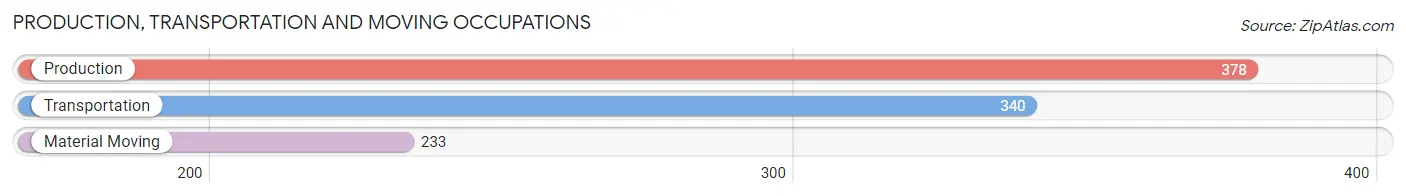
Production, Transportation and Moving Occupations
The most common Production, Transportation and Moving occupations in Haverstraw are Production (378 | 6.8%), Transportation (340 | 6.1%), and Material Moving (233 | 4.2%).
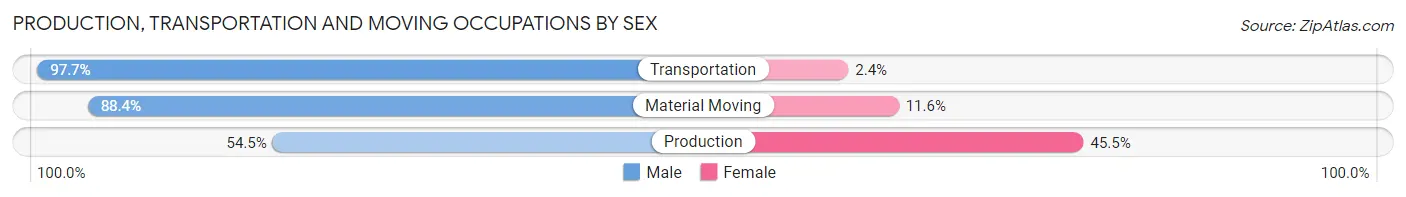
Production, Transportation and Moving Occupations by Sex
| Occupation | Male | Female |
| Production | 206 (54.5%) | 172 (45.5%) |
| Transportation | 332 (97.7%) | 8 (2.4%) |
| Material Moving | 206 (88.4%) | 27 (11.6%) |
| Total (Category) | 744 (78.2%) | 207 (21.8%) |
| Total (Overall) | 2,899 (52.3%) | 2,639 (47.6%) |
Employment Industries by Sex in Haverstraw
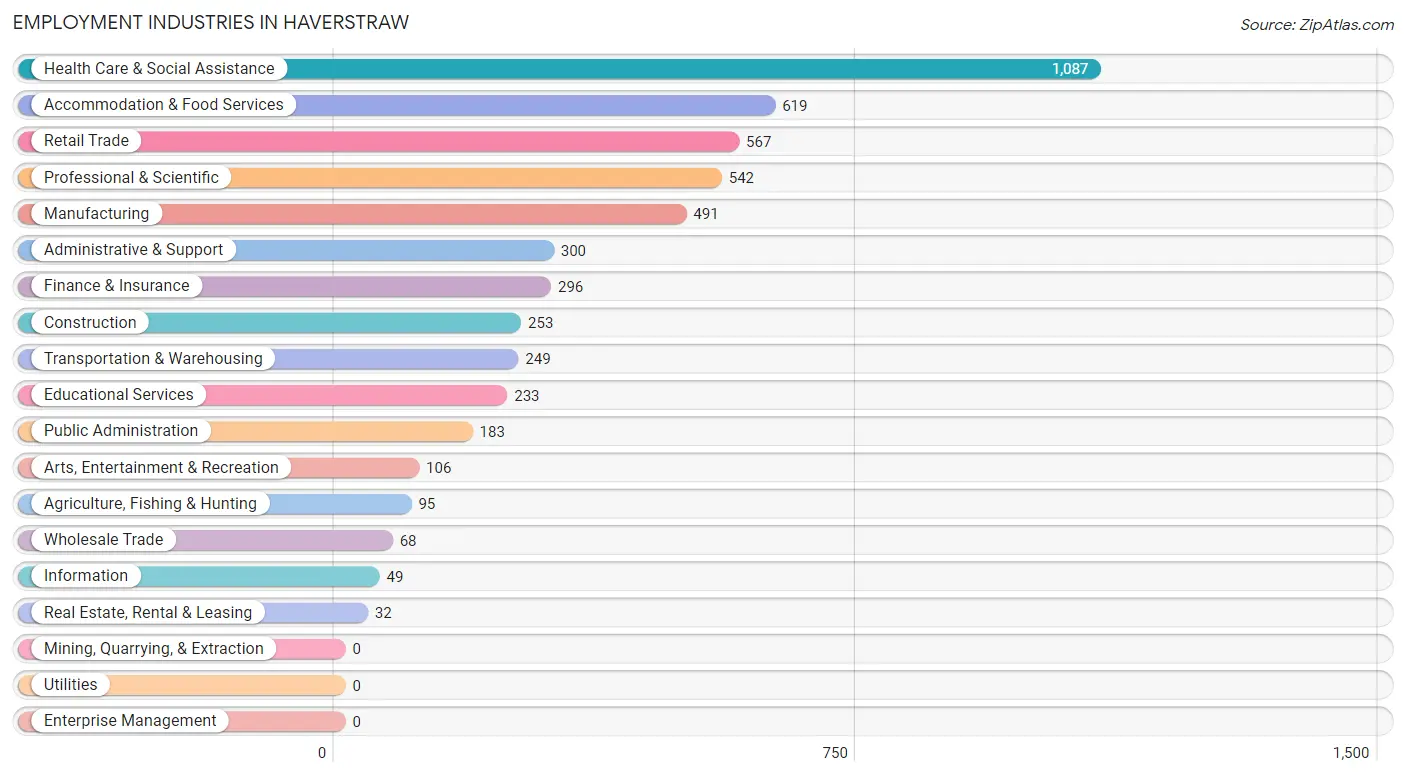
Employment Industries in Haverstraw
The major employment industries in Haverstraw include Health Care & Social Assistance (1,087 | 19.6%), Accommodation & Food Services (619 | 11.2%), Retail Trade (567 | 10.2%), Professional & Scientific (542 | 9.8%), and Manufacturing (491 | 8.9%).
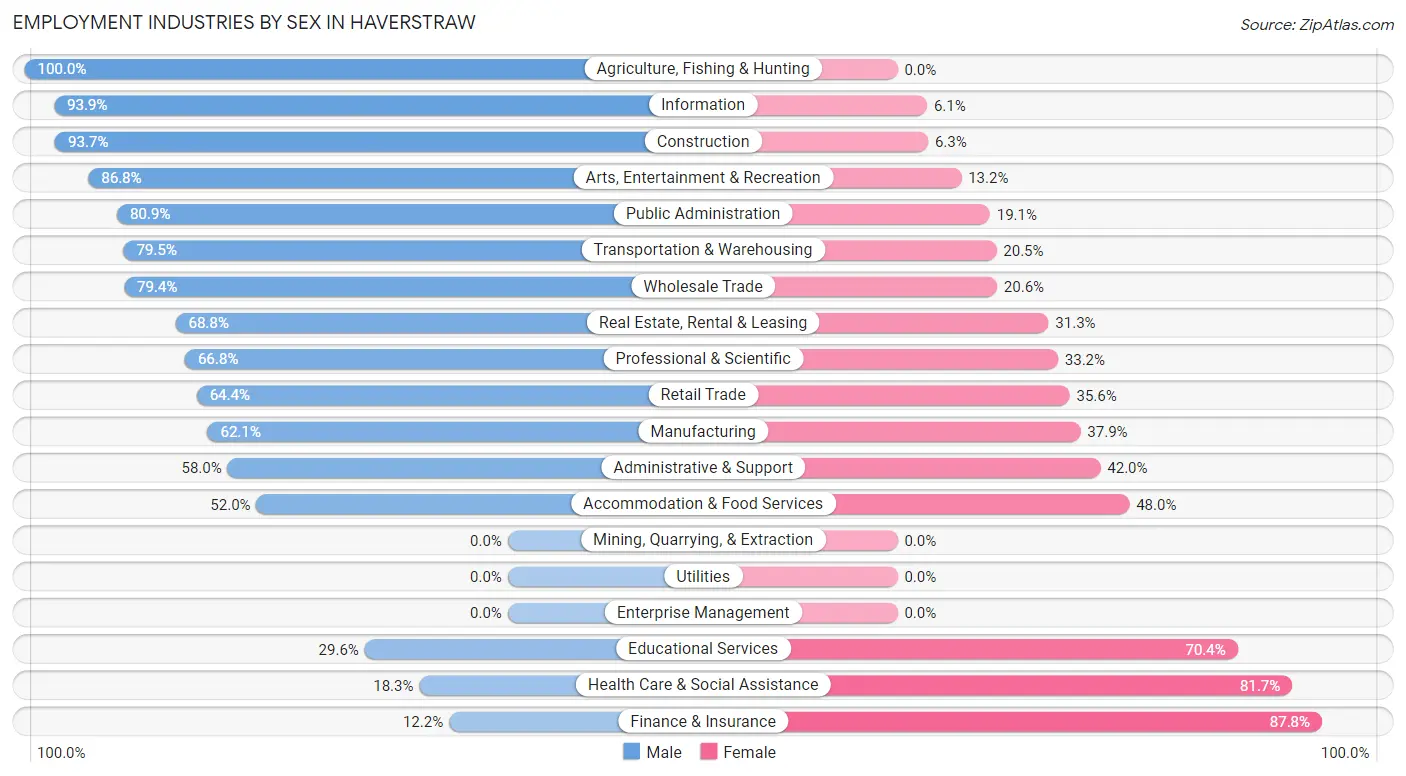
Employment Industries by Sex in Haverstraw
The Haverstraw industries that see more men than women are Agriculture, Fishing & Hunting (100.0%), Information (93.9%), and Construction (93.7%), whereas the industries that tend to have a higher number of women are Finance & Insurance (87.8%), Health Care & Social Assistance (81.7%), and Educational Services (70.4%).
| Industry | Male | Female |
| Agriculture, Fishing & Hunting | 95 (100.0%) | 0 (0.0%) |
| Mining, Quarrying, & Extraction | 0 (0.0%) | 0 (0.0%) |
| Construction | 237 (93.7%) | 16 (6.3%) |
| Manufacturing | 305 (62.1%) | 186 (37.9%) |
| Wholesale Trade | 54 (79.4%) | 14 (20.6%) |
| Retail Trade | 365 (64.4%) | 202 (35.6%) |
| Transportation & Warehousing | 198 (79.5%) | 51 (20.5%) |
| Utilities | 0 (0.0%) | 0 (0.0%) |
| Information | 46 (93.9%) | 3 (6.1%) |
| Finance & Insurance | 36 (12.2%) | 260 (87.8%) |
| Real Estate, Rental & Leasing | 22 (68.8%) | 10 (31.2%) |
| Professional & Scientific | 362 (66.8%) | 180 (33.2%) |
| Enterprise Management | 0 (0.0%) | 0 (0.0%) |
| Administrative & Support | 174 (58.0%) | 126 (42.0%) |
| Educational Services | 69 (29.6%) | 164 (70.4%) |
| Health Care & Social Assistance | 199 (18.3%) | 888 (81.7%) |
| Arts, Entertainment & Recreation | 92 (86.8%) | 14 (13.2%) |
| Accommodation & Food Services | 322 (52.0%) | 297 (48.0%) |
| Public Administration | 148 (80.9%) | 35 (19.1%) |
| Total | 2,899 (52.3%) | 2,639 (47.6%) |
Education in Haverstraw
School Enrollment in Haverstraw
The most common levels of schooling among the 2,978 students in Haverstraw are middle school (739 | 24.8%), high school (571 | 19.2%), and college / undergraduate (561 | 18.8%).
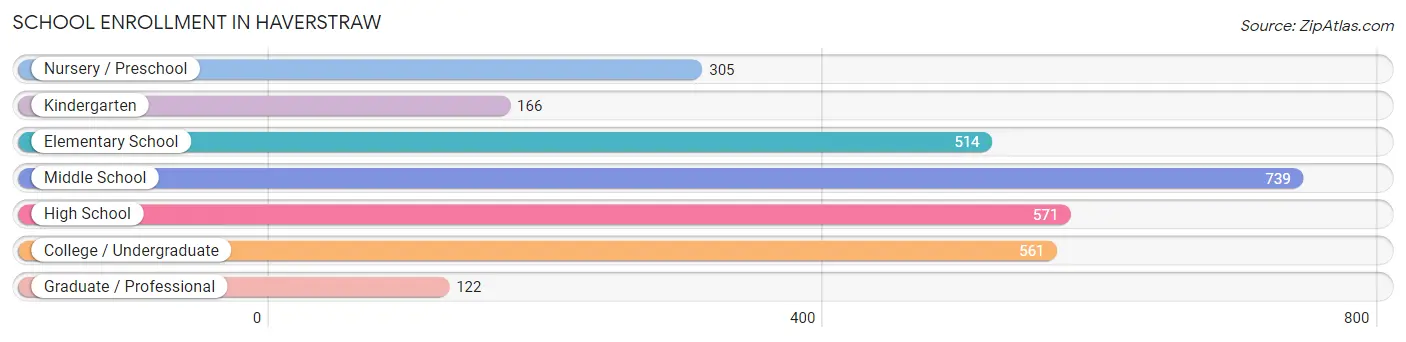
| School Level | # Students | % Students |
| Nursery / Preschool | 305 | 10.2% |
| Kindergarten | 166 | 5.6% |
| Elementary School | 514 | 17.3% |
| Middle School | 739 | 24.8% |
| High School | 571 | 19.2% |
| College / Undergraduate | 561 | 18.8% |
| Graduate / Professional | 122 | 4.1% |
| Total | 2,978 | 100.0% |
School Enrollment by Age by Funding Source in Haverstraw
Out of a total of 2,978 students who are enrolled in schools in Haverstraw, 399 (13.4%) attend a private institution, while the remaining 2,579 (86.6%) are enrolled in public schools. The age group of 25 to 34 year olds has the highest likelihood of being enrolled in private schools, with 62 (56.9% in the age bracket) enrolled. Conversely, the age group of 5 to 9 year old has the lowest likelihood of being enrolled in a private school, with 709 (96.5% in the age bracket) attending a public institution.
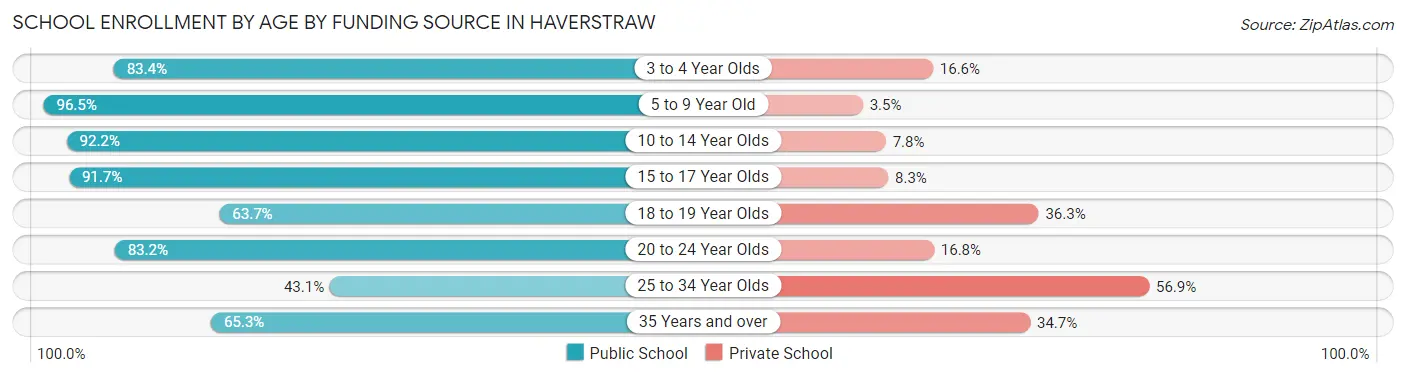
| Age Bracket | Public School | Private School |
| 3 to 4 Year Olds | 226 (83.4%) | 45 (16.6%) |
| 5 to 9 Year Old | 709 (96.5%) | 26 (3.5%) |
| 10 to 14 Year Olds | 730 (92.2%) | 62 (7.8%) |
| 15 to 17 Year Olds | 366 (91.7%) | 33 (8.3%) |
| 18 to 19 Year Olds | 151 (63.7%) | 86 (36.3%) |
| 20 to 24 Year Olds | 302 (83.2%) | 61 (16.8%) |
| 25 to 34 Year Olds | 47 (43.1%) | 62 (56.9%) |
| 35 Years and over | 47 (65.3%) | 25 (34.7%) |
| Total | 2,579 (86.6%) | 399 (13.4%) |
Educational Attainment by Field of Study in Haverstraw
Business (328 | 15.4%), psychology (252 | 11.9%), education (214 | 10.1%), arts & humanities (213 | 10.0%), and science & technology (188 | 8.8%) are the most common fields of study among 2,124 individuals in Haverstraw who have obtained a bachelor's degree or higher.
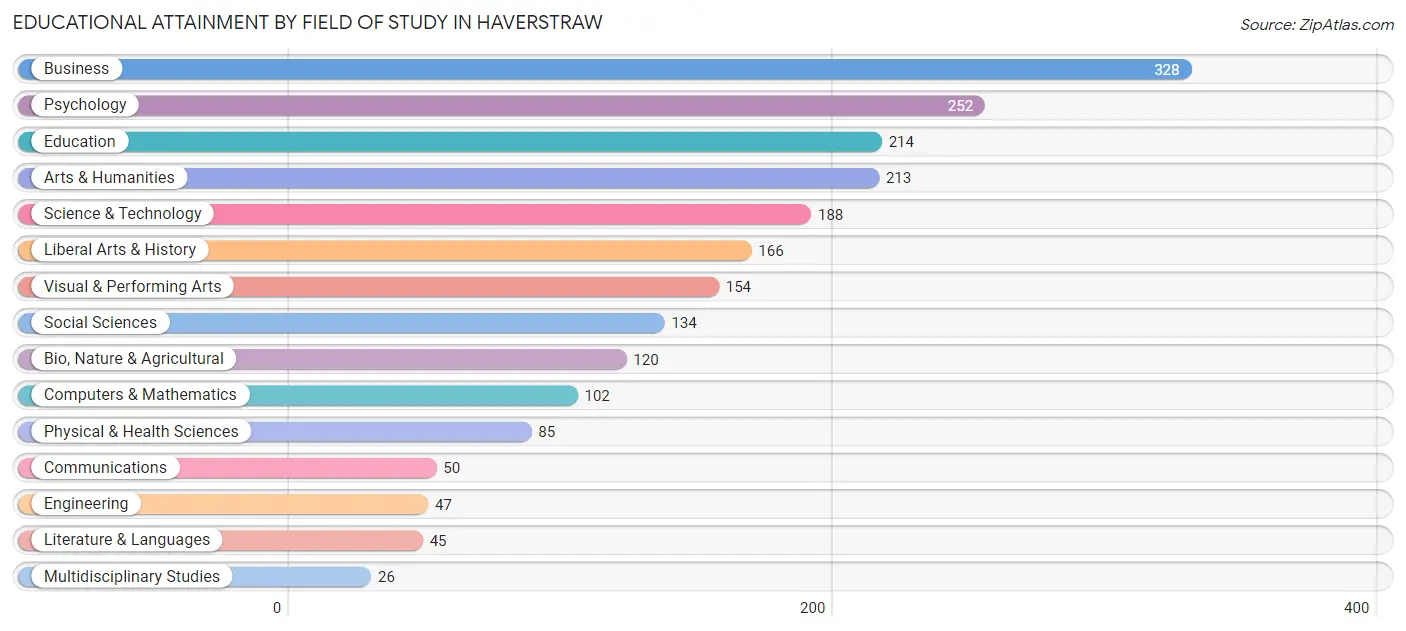
| Field of Study | # Graduates | % Graduates |
| Computers & Mathematics | 102 | 4.8% |
| Bio, Nature & Agricultural | 120 | 5.7% |
| Physical & Health Sciences | 85 | 4.0% |
| Psychology | 252 | 11.9% |
| Social Sciences | 134 | 6.3% |
| Engineering | 47 | 2.2% |
| Multidisciplinary Studies | 26 | 1.2% |
| Science & Technology | 188 | 8.8% |
| Business | 328 | 15.4% |
| Education | 214 | 10.1% |
| Literature & Languages | 45 | 2.1% |
| Liberal Arts & History | 166 | 7.8% |
| Visual & Performing Arts | 154 | 7.2% |
| Communications | 50 | 2.4% |
| Arts & Humanities | 213 | 10.0% |
| Total | 2,124 | 100.0% |
Transportation & Commute in Haverstraw
Vehicle Availability by Sex in Haverstraw
The most prevalent vehicle ownership categories in Haverstraw are males with 2 vehicles (908, accounting for 33.1%) and females with 2 vehicles (698, making up 36.4%).
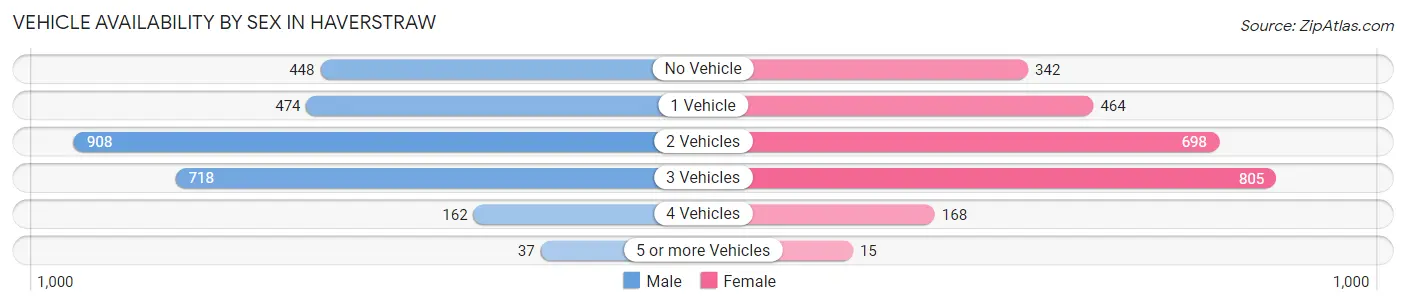
| Vehicles Available | Male | Female |
| No Vehicle | 448 (16.3%) | 342 (13.7%) |
| 1 Vehicle | 474 (17.3%) | 464 (18.6%) |
| 2 Vehicles | 908 (33.1%) | 698 (28.0%) |
| 3 Vehicles | 718 (26.1%) | 805 (32.3%) |
| 4 Vehicles | 162 (5.9%) | 168 (6.7%) |
| 5 or more Vehicles | 37 (1.3%) | 15 (0.6%) |
| Total | 2,747 (100.0%) | 2,492 (100.0%) |
Commute Time in Haverstraw
The most frequently occuring commute durations in Haverstraw are 30 to 34 minutes (1,029 commuters, 20.8%), 20 to 24 minutes (701 commuters, 14.2%), and 45 to 59 minutes (604 commuters, 12.2%).
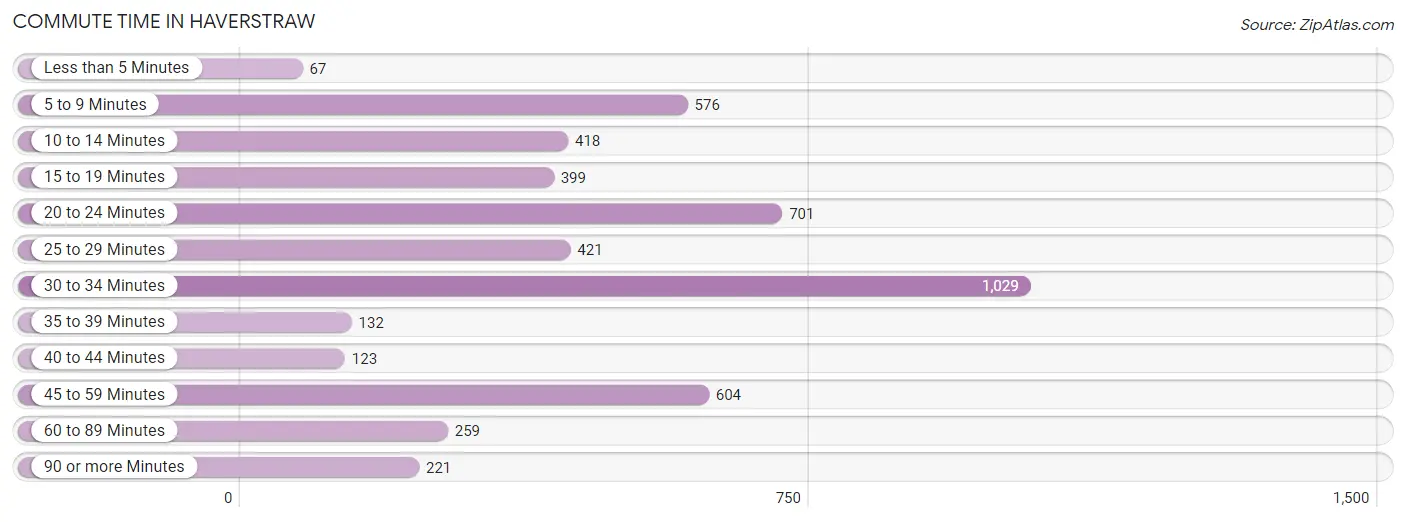
| Commute Time | # Commuters | % Commuters |
| Less than 5 Minutes | 67 | 1.3% |
| 5 to 9 Minutes | 576 | 11.6% |
| 10 to 14 Minutes | 418 | 8.4% |
| 15 to 19 Minutes | 399 | 8.1% |
| 20 to 24 Minutes | 701 | 14.2% |
| 25 to 29 Minutes | 421 | 8.5% |
| 30 to 34 Minutes | 1,029 | 20.8% |
| 35 to 39 Minutes | 132 | 2.7% |
| 40 to 44 Minutes | 123 | 2.5% |
| 45 to 59 Minutes | 604 | 12.2% |
| 60 to 89 Minutes | 259 | 5.2% |
| 90 or more Minutes | 221 | 4.5% |
Commute Time by Sex in Haverstraw
The most common commute times in Haverstraw are 20 to 24 minutes (434 commuters, 16.0%) for males and 30 to 34 minutes (785 commuters, 35.1%) for females.
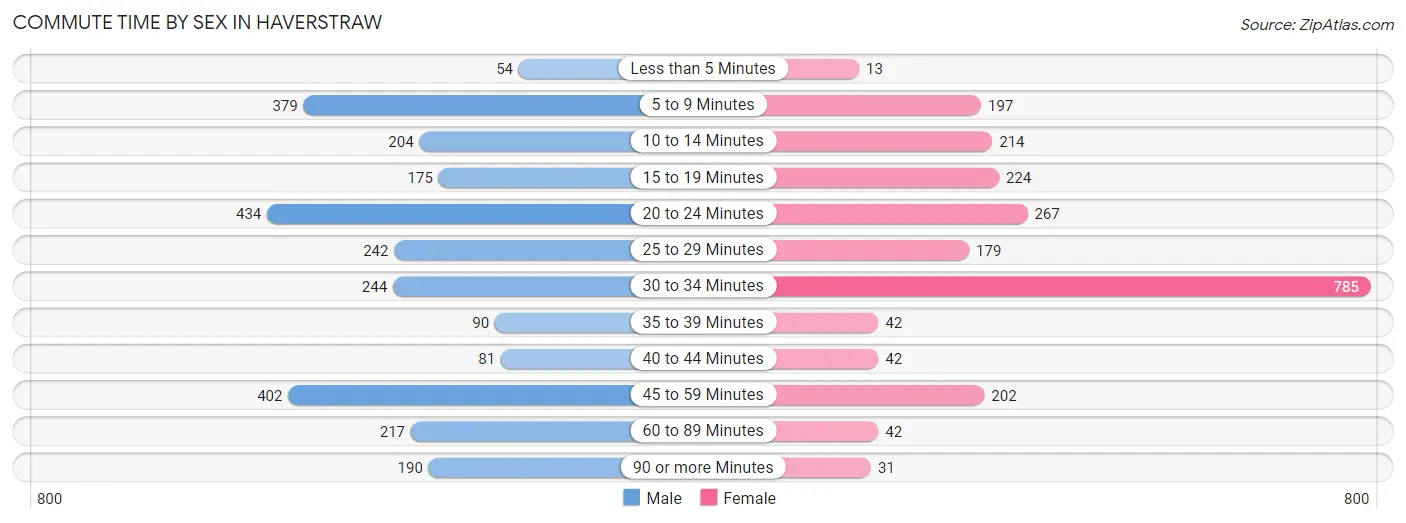
| Commute Time | Male | Female |
| Less than 5 Minutes | 54 (2.0%) | 13 (0.6%) |
| 5 to 9 Minutes | 379 (14.0%) | 197 (8.8%) |
| 10 to 14 Minutes | 204 (7.5%) | 214 (9.6%) |
| 15 to 19 Minutes | 175 (6.5%) | 224 (10.0%) |
| 20 to 24 Minutes | 434 (16.0%) | 267 (11.9%) |
| 25 to 29 Minutes | 242 (8.9%) | 179 (8.0%) |
| 30 to 34 Minutes | 244 (9.0%) | 785 (35.1%) |
| 35 to 39 Minutes | 90 (3.3%) | 42 (1.9%) |
| 40 to 44 Minutes | 81 (3.0%) | 42 (1.9%) |
| 45 to 59 Minutes | 402 (14.8%) | 202 (9.0%) |
| 60 to 89 Minutes | 217 (8.0%) | 42 (1.9%) |
| 90 or more Minutes | 190 (7.0%) | 31 (1.4%) |
Time of Departure to Work by Sex in Haverstraw
The most frequent times of departure to work in Haverstraw are 7:00 AM to 7:29 AM (538, 19.8%) for males and 7:00 AM to 7:29 AM (436, 19.5%) for females.
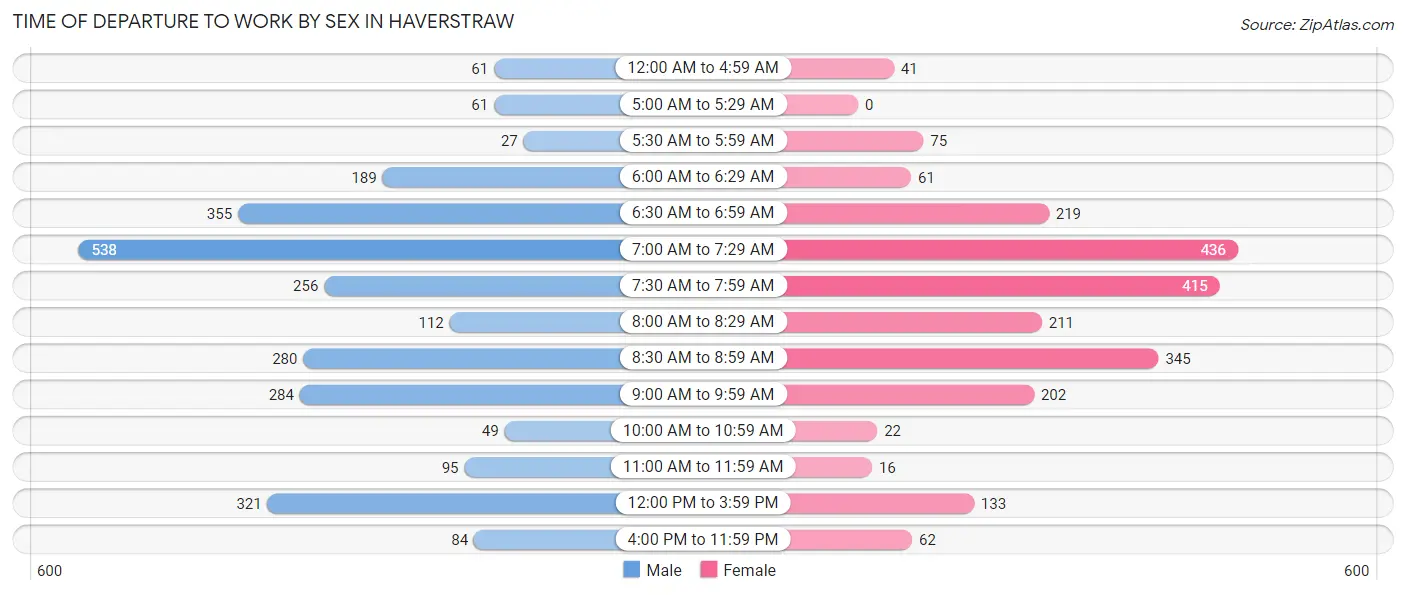
| Time of Departure | Male | Female |
| 12:00 AM to 4:59 AM | 61 (2.2%) | 41 (1.8%) |
| 5:00 AM to 5:29 AM | 61 (2.2%) | 0 (0.0%) |
| 5:30 AM to 5:59 AM | 27 (1.0%) | 75 (3.4%) |
| 6:00 AM to 6:29 AM | 189 (7.0%) | 61 (2.7%) |
| 6:30 AM to 6:59 AM | 355 (13.1%) | 219 (9.8%) |
| 7:00 AM to 7:29 AM | 538 (19.8%) | 436 (19.5%) |
| 7:30 AM to 7:59 AM | 256 (9.4%) | 415 (18.5%) |
| 8:00 AM to 8:29 AM | 112 (4.1%) | 211 (9.4%) |
| 8:30 AM to 8:59 AM | 280 (10.3%) | 345 (15.4%) |
| 9:00 AM to 9:59 AM | 284 (10.5%) | 202 (9.0%) |
| 10:00 AM to 10:59 AM | 49 (1.8%) | 22 (1.0%) |
| 11:00 AM to 11:59 AM | 95 (3.5%) | 16 (0.7%) |
| 12:00 PM to 3:59 PM | 321 (11.8%) | 133 (5.9%) |
| 4:00 PM to 11:59 PM | 84 (3.1%) | 62 (2.8%) |
| Total | 2,712 (100.0%) | 2,238 (100.0%) |
Housing Occupancy in Haverstraw
Occupancy by Ownership in Haverstraw
Of the total 3,686 dwellings in Haverstraw, owner-occupied units account for 1,914 (51.9%), while renter-occupied units make up 1,772 (48.1%).
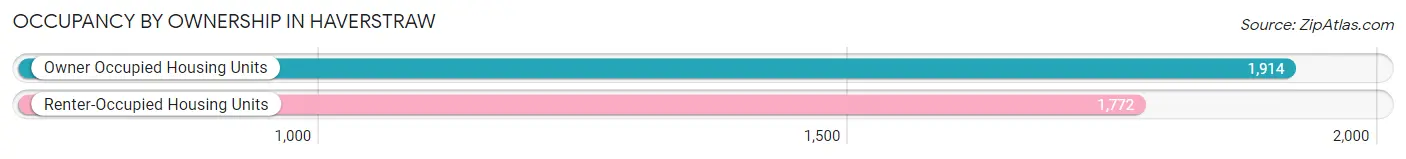
| Occupancy | # Housing Units | % Housing Units |
| Owner Occupied Housing Units | 1,914 | 51.9% |
| Renter-Occupied Housing Units | 1,772 | 48.1% |
| Total Occupied Housing Units | 3,686 | 100.0% |
Occupancy by Household Size in Haverstraw
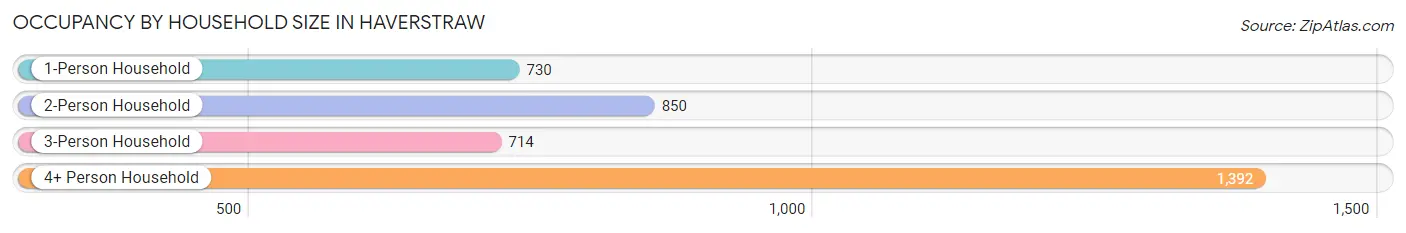
| Household Size | # Housing Units | % Housing Units |
| 1-Person Household | 730 | 19.8% |
| 2-Person Household | 850 | 23.1% |
| 3-Person Household | 714 | 19.4% |
| 4+ Person Household | 1,392 | 37.8% |
| Total Housing Units | 3,686 | 100.0% |
Occupancy by Ownership by Household Size in Haverstraw
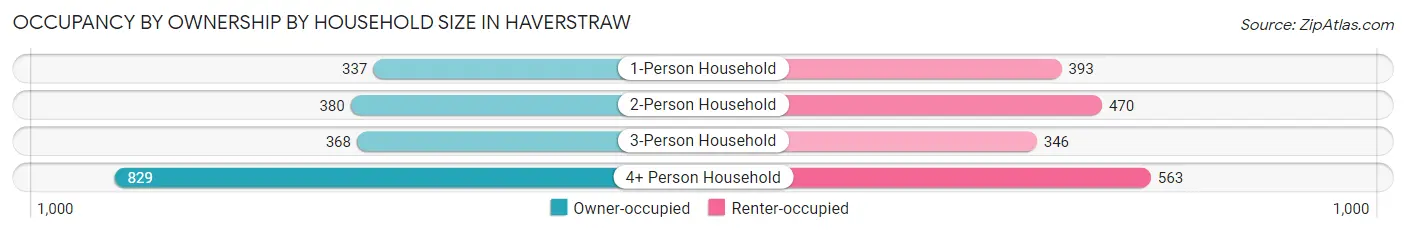
| Household Size | Owner-occupied | Renter-occupied |
| 1-Person Household | 337 (46.2%) | 393 (53.8%) |
| 2-Person Household | 380 (44.7%) | 470 (55.3%) |
| 3-Person Household | 368 (51.5%) | 346 (48.5%) |
| 4+ Person Household | 829 (59.6%) | 563 (40.5%) |
| Total Housing Units | 1,914 (51.9%) | 1,772 (48.1%) |
Occupancy by Educational Attainment in Haverstraw
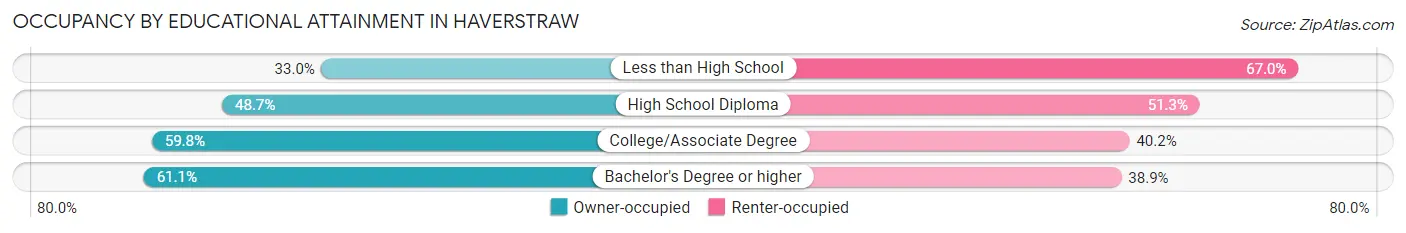
| Household Size | Owner-occupied | Renter-occupied |
| Less than High School | 266 (33.0%) | 539 (67.0%) |
| High School Diploma | 383 (48.7%) | 404 (51.3%) |
| College/Associate Degree | 676 (59.8%) | 454 (40.2%) |
| Bachelor's Degree or higher | 589 (61.1%) | 375 (38.9%) |
Occupancy by Age of Householder in Haverstraw
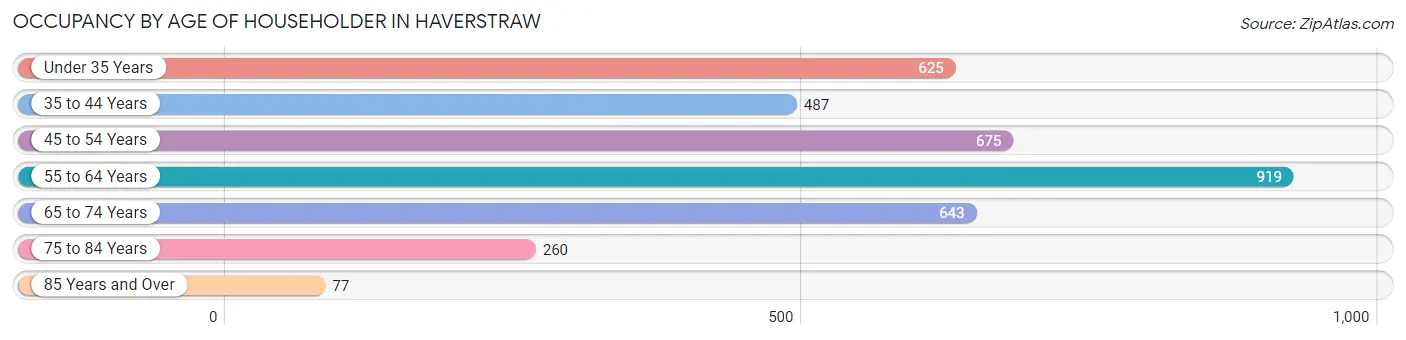
| Age Bracket | # Households | % Households |
| Under 35 Years | 625 | 17.0% |
| 35 to 44 Years | 487 | 13.2% |
| 45 to 54 Years | 675 | 18.3% |
| 55 to 64 Years | 919 | 24.9% |
| 65 to 74 Years | 643 | 17.4% |
| 75 to 84 Years | 260 | 7.0% |
| 85 Years and Over | 77 | 2.1% |
| Total | 3,686 | 100.0% |
Housing Finances in Haverstraw
Median Income by Occupancy in Haverstraw
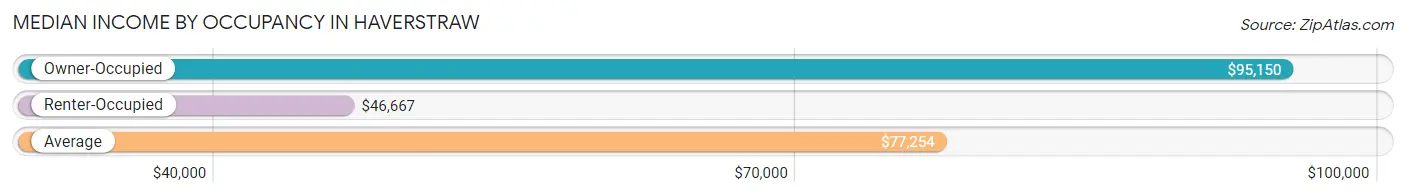
| Occupancy Type | # Households | Median Income |
| Owner-Occupied | 1,914 (51.9%) | $95,150 |
| Renter-Occupied | 1,772 (48.1%) | $46,667 |
| Average | 3,686 (100.0%) | $77,254 |
Occupancy by Householder Income Bracket in Haverstraw
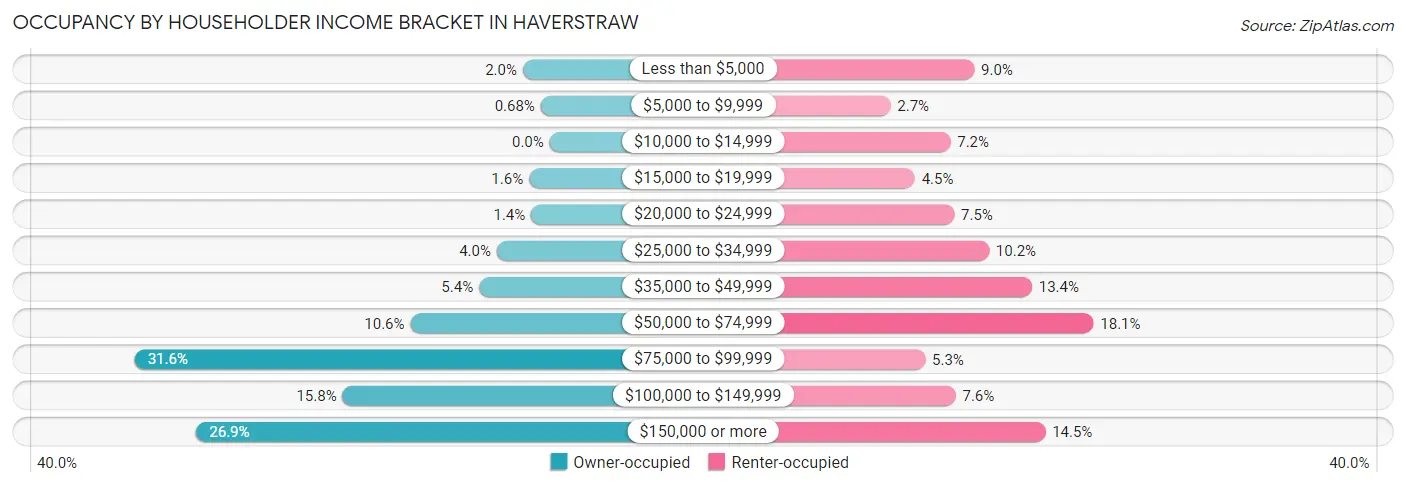
| Income Bracket | Owner-occupied | Renter-occupied |
| Less than $5,000 | 39 (2.0%) | 160 (9.0%) |
| $5,000 to $9,999 | 13 (0.7%) | 47 (2.6%) |
| $10,000 to $14,999 | 0 (0.0%) | 128 (7.2%) |
| $15,000 to $19,999 | 30 (1.6%) | 80 (4.5%) |
| $20,000 to $24,999 | 27 (1.4%) | 133 (7.5%) |
| $25,000 to $34,999 | 77 (4.0%) | 180 (10.2%) |
| $35,000 to $49,999 | 103 (5.4%) | 238 (13.4%) |
| $50,000 to $74,999 | 203 (10.6%) | 321 (18.1%) |
| $75,000 to $99,999 | 605 (31.6%) | 94 (5.3%) |
| $100,000 to $149,999 | 302 (15.8%) | 135 (7.6%) |
| $150,000 or more | 515 (26.9%) | 256 (14.4%) |
| Total | 1,914 (100.0%) | 1,772 (100.0%) |
Monthly Housing Cost Tiers in Haverstraw
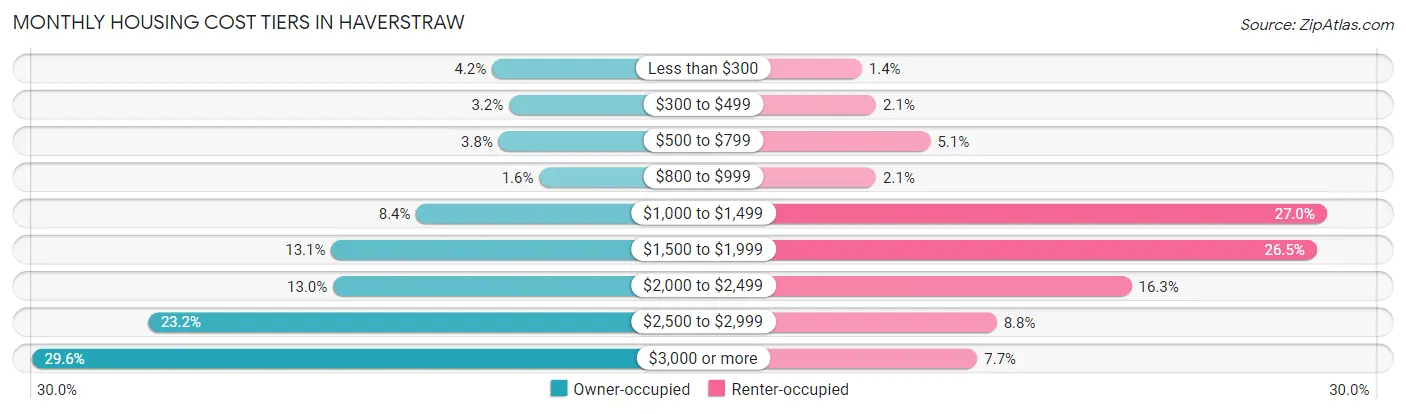
| Monthly Cost | Owner-occupied | Renter-occupied |
| Less than $300 | 80 (4.2%) | 24 (1.3%) |
| $300 to $499 | 62 (3.2%) | 38 (2.1%) |
| $500 to $799 | 73 (3.8%) | 91 (5.1%) |
| $800 to $999 | 30 (1.6%) | 38 (2.1%) |
| $1,000 to $1,499 | 160 (8.4%) | 479 (27.0%) |
| $1,500 to $1,999 | 250 (13.1%) | 469 (26.5%) |
| $2,000 to $2,499 | 248 (13.0%) | 288 (16.3%) |
| $2,500 to $2,999 | 444 (23.2%) | 156 (8.8%) |
| $3,000 or more | 567 (29.6%) | 137 (7.7%) |
| Total | 1,914 (100.0%) | 1,772 (100.0%) |
Physical Housing Characteristics in Haverstraw
Housing Structures in Haverstraw
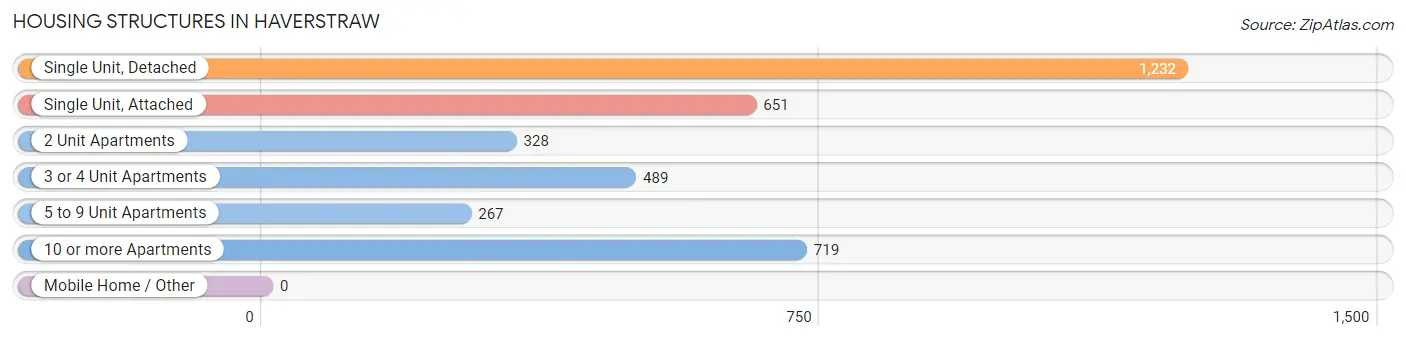
| Structure Type | # Housing Units | % Housing Units |
| Single Unit, Detached | 1,232 | 33.4% |
| Single Unit, Attached | 651 | 17.7% |
| 2 Unit Apartments | 328 | 8.9% |
| 3 or 4 Unit Apartments | 489 | 13.3% |
| 5 to 9 Unit Apartments | 267 | 7.2% |
| 10 or more Apartments | 719 | 19.5% |
| Mobile Home / Other | 0 | 0.0% |
| Total | 3,686 | 100.0% |
Housing Structures by Occupancy in Haverstraw
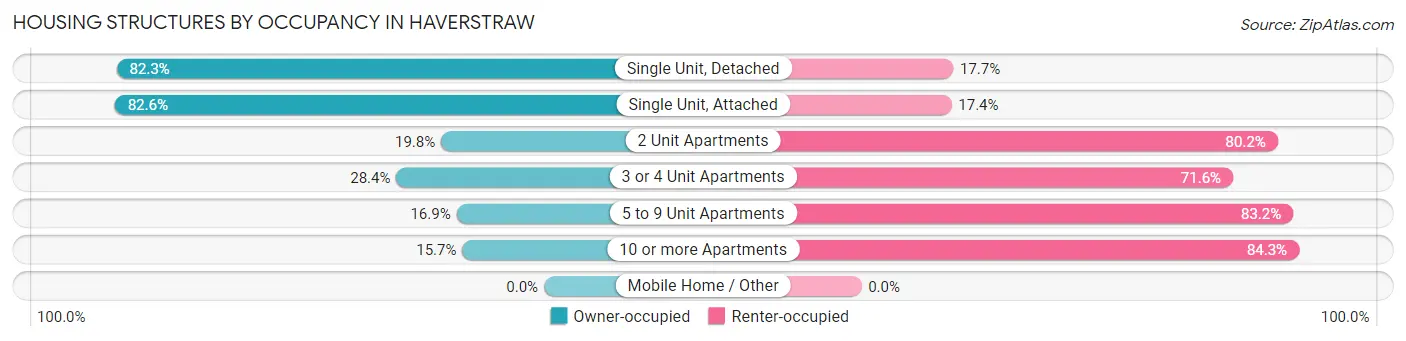
| Structure Type | Owner-occupied | Renter-occupied |
| Single Unit, Detached | 1,014 (82.3%) | 218 (17.7%) |
| Single Unit, Attached | 538 (82.6%) | 113 (17.4%) |
| 2 Unit Apartments | 65 (19.8%) | 263 (80.2%) |
| 3 or 4 Unit Apartments | 139 (28.4%) | 350 (71.6%) |
| 5 to 9 Unit Apartments | 45 (16.9%) | 222 (83.2%) |
| 10 or more Apartments | 113 (15.7%) | 606 (84.3%) |
| Mobile Home / Other | 0 (0.0%) | 0 (0.0%) |
| Total | 1,914 (51.9%) | 1,772 (48.1%) |
Housing Structures by Number of Rooms in Haverstraw
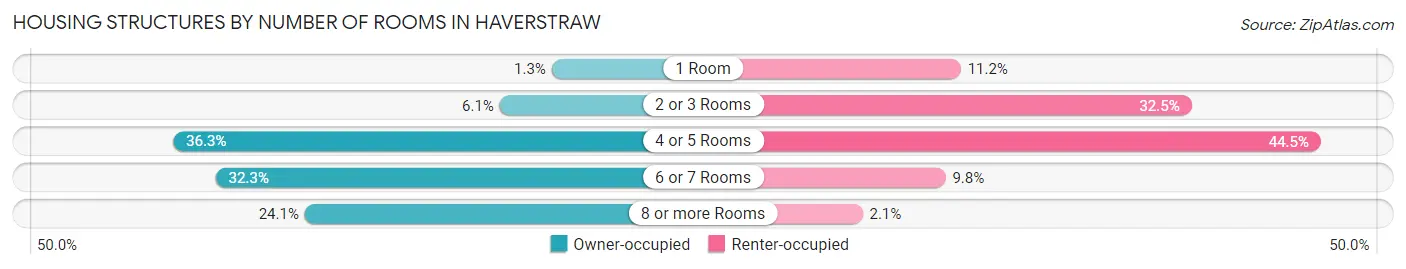
| Number of Rooms | Owner-occupied | Renter-occupied |
| 1 Room | 24 (1.3%) | 198 (11.2%) |
| 2 or 3 Rooms | 116 (6.1%) | 576 (32.5%) |
| 4 or 5 Rooms | 694 (36.3%) | 788 (44.5%) |
| 6 or 7 Rooms | 619 (32.3%) | 173 (9.8%) |
| 8 or more Rooms | 461 (24.1%) | 37 (2.1%) |
| Total | 1,914 (100.0%) | 1,772 (100.0%) |
Housing Structure by Heating Type in Haverstraw
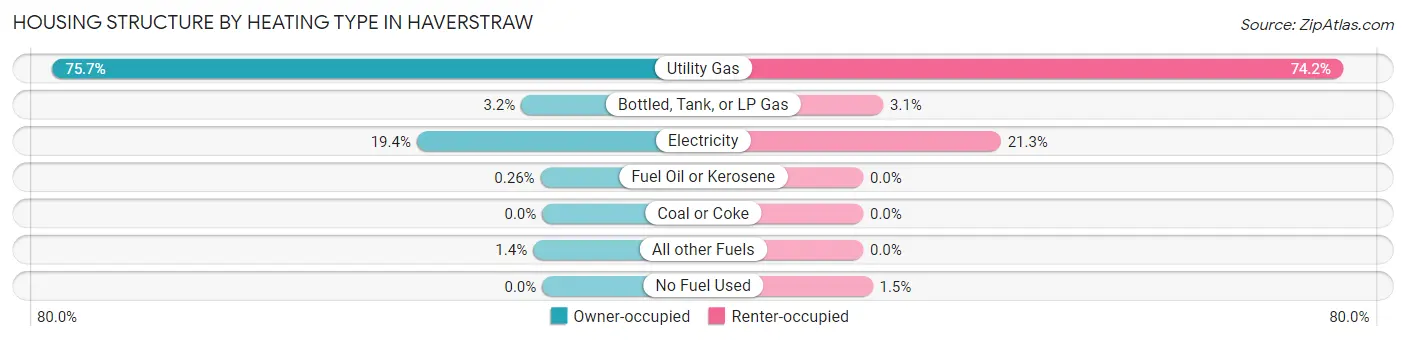
| Heating Type | Owner-occupied | Renter-occupied |
| Utility Gas | 1,449 (75.7%) | 1,314 (74.2%) |
| Bottled, Tank, or LP Gas | 62 (3.2%) | 55 (3.1%) |
| Electricity | 371 (19.4%) | 377 (21.3%) |
| Fuel Oil or Kerosene | 5 (0.3%) | 0 (0.0%) |
| Coal or Coke | 0 (0.0%) | 0 (0.0%) |
| All other Fuels | 27 (1.4%) | 0 (0.0%) |
| No Fuel Used | 0 (0.0%) | 26 (1.5%) |
| Total | 1,914 (100.0%) | 1,772 (100.0%) |
Household Vehicle Usage in Haverstraw
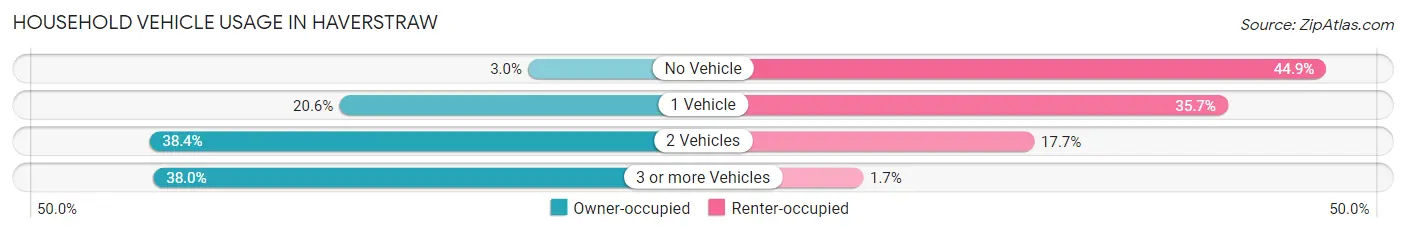
| Vehicles per Household | Owner-occupied | Renter-occupied |
| No Vehicle | 58 (3.0%) | 796 (44.9%) |
| 1 Vehicle | 395 (20.6%) | 633 (35.7%) |
| 2 Vehicles | 734 (38.4%) | 313 (17.7%) |
| 3 or more Vehicles | 727 (38.0%) | 30 (1.7%) |
| Total | 1,914 (100.0%) | 1,772 (100.0%) |
Real Estate & Mortgages in Haverstraw
Real Estate and Mortgage Overview in Haverstraw
| Characteristic | Without Mortgage | With Mortgage |
| Housing Units | 476 | 1,438 |
| Median Property Value | $332,500 | $322,300 |
| Median Household Income | $84,643 | $429 |
| Monthly Housing Costs | $1,241 | $567 |
| Real Estate Taxes | $10,001 | $22 |
Property Value by Mortgage Status in Haverstraw
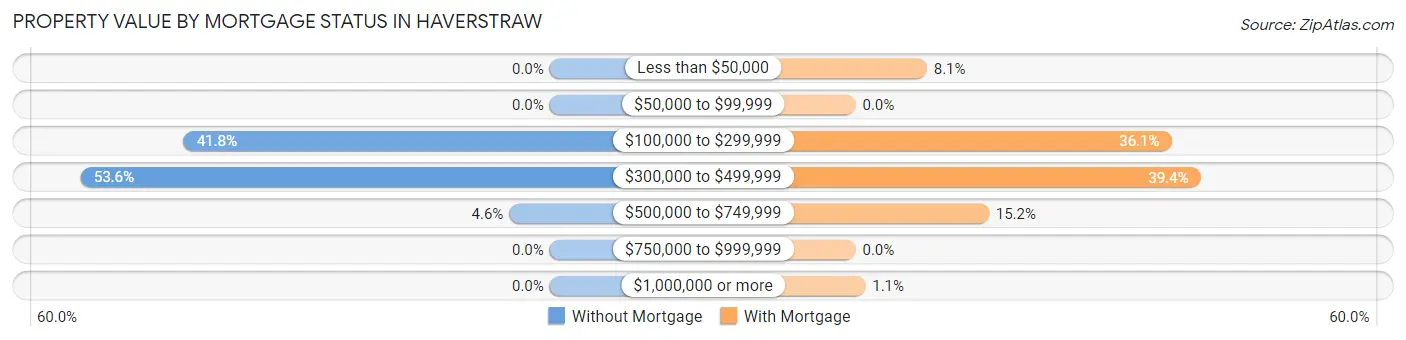
| Property Value | Without Mortgage | With Mortgage |
| Less than $50,000 | 0 (0.0%) | 117 (8.1%) |
| $50,000 to $99,999 | 0 (0.0%) | 0 (0.0%) |
| $100,000 to $299,999 | 199 (41.8%) | 519 (36.1%) |
| $300,000 to $499,999 | 255 (53.6%) | 567 (39.4%) |
| $500,000 to $749,999 | 22 (4.6%) | 219 (15.2%) |
| $750,000 to $999,999 | 0 (0.0%) | 0 (0.0%) |
| $1,000,000 or more | 0 (0.0%) | 16 (1.1%) |
| Total | 476 (100.0%) | 1,438 (100.0%) |
Household Income by Mortgage Status in Haverstraw
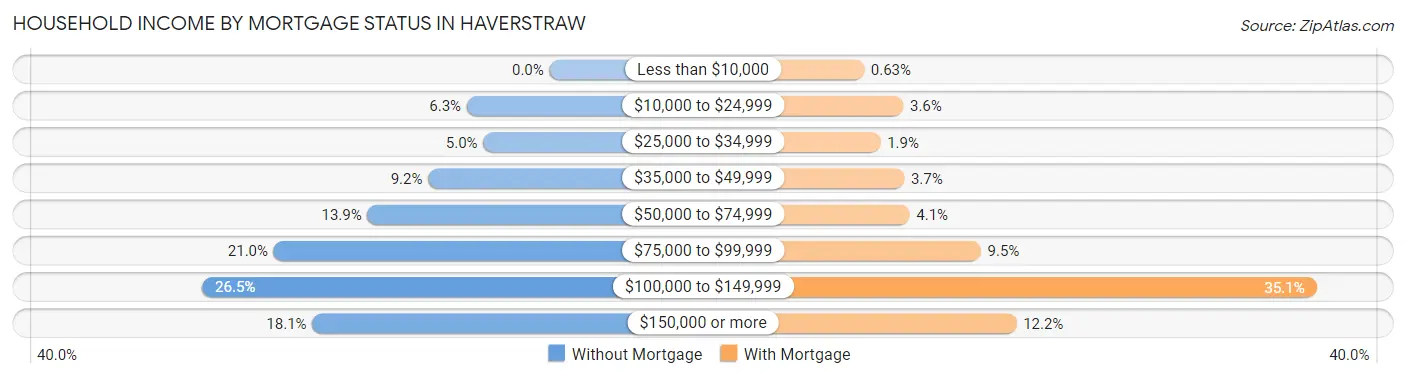
| Household Income | Without Mortgage | With Mortgage |
| Less than $10,000 | 0 (0.0%) | 9 (0.6%) |
| $10,000 to $24,999 | 30 (6.3%) | 52 (3.6%) |
| $25,000 to $34,999 | 24 (5.0%) | 27 (1.9%) |
| $35,000 to $49,999 | 44 (9.2%) | 53 (3.7%) |
| $50,000 to $74,999 | 66 (13.9%) | 59 (4.1%) |
| $75,000 to $99,999 | 100 (21.0%) | 137 (9.5%) |
| $100,000 to $149,999 | 126 (26.5%) | 505 (35.1%) |
| $150,000 or more | 86 (18.1%) | 176 (12.2%) |
| Total | 476 (100.0%) | 1,438 (100.0%) |
Property Value to Household Income Ratio in Haverstraw
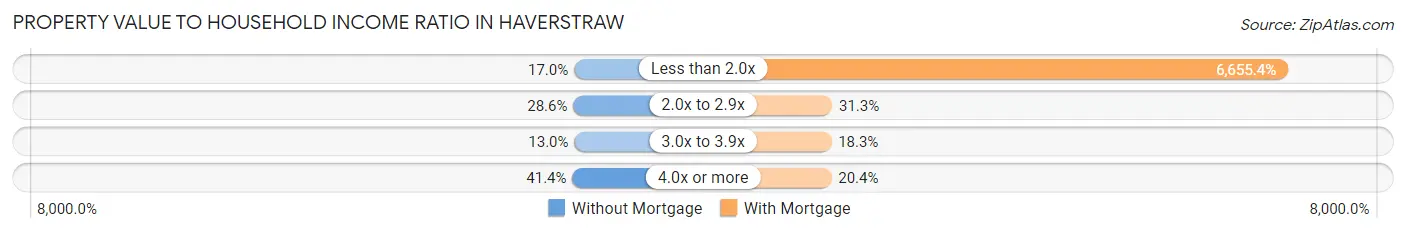
| Value-to-Income Ratio | Without Mortgage | With Mortgage |
| Less than 2.0x | 81 (17.0%) | 95,705 (6,655.4%) |
| 2.0x to 2.9x | 136 (28.6%) | 450 (31.3%) |
| 3.0x to 3.9x | 62 (13.0%) | 263 (18.3%) |
| 4.0x or more | 197 (41.4%) | 293 (20.4%) |
| Total | 476 (100.0%) | 1,438 (100.0%) |
Real Estate Taxes by Mortgage Status in Haverstraw
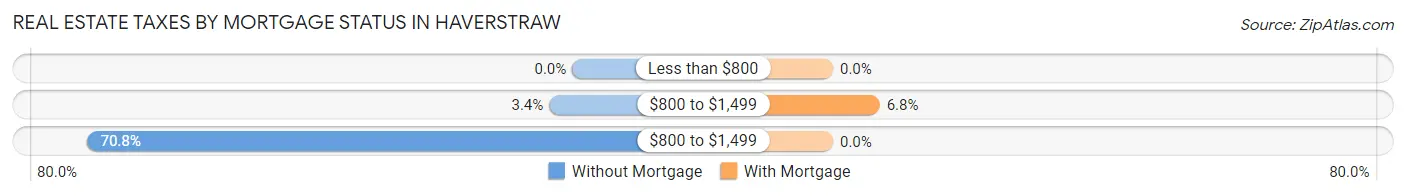
| Property Taxes | Without Mortgage | With Mortgage |
| Less than $800 | 0 (0.0%) | 0 (0.0%) |
| $800 to $1,499 | 16 (3.4%) | 98 (6.8%) |
| $800 to $1,499 | 337 (70.8%) | 0 (0.0%) |
| Total | 476 (100.0%) | 1,438 (100.0%) |
Health & Disability in Haverstraw
Health Insurance Coverage by Age in Haverstraw
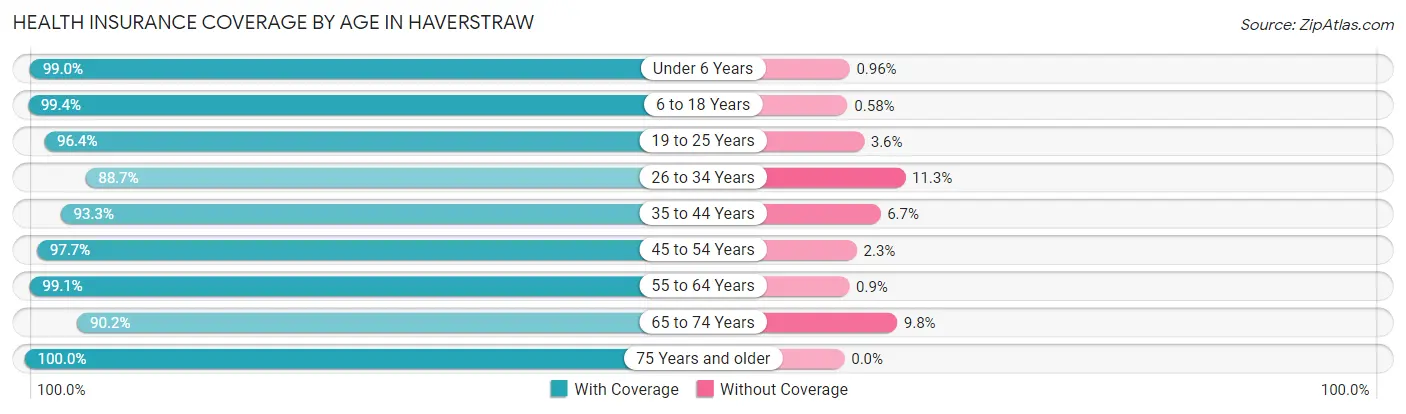
| Age Bracket | With Coverage | Without Coverage |
| Under 6 Years | 1,244 (99.0%) | 12 (1.0%) |
| 6 to 18 Years | 1,889 (99.4%) | 11 (0.6%) |
| 19 to 25 Years | 1,301 (96.4%) | 49 (3.6%) |
| 26 to 34 Years | 1,308 (88.7%) | 167 (11.3%) |
| 35 to 44 Years | 1,240 (93.3%) | 89 (6.7%) |
| 45 to 54 Years | 1,408 (97.7%) | 33 (2.3%) |
| 55 to 64 Years | 1,767 (99.1%) | 16 (0.9%) |
| 65 to 74 Years | 948 (90.2%) | 103 (9.8%) |
| 75 Years and older | 542 (100.0%) | 0 (0.0%) |
| Total | 11,647 (96.0%) | 480 (4.0%) |
Health Insurance Coverage by Citizenship Status in Haverstraw
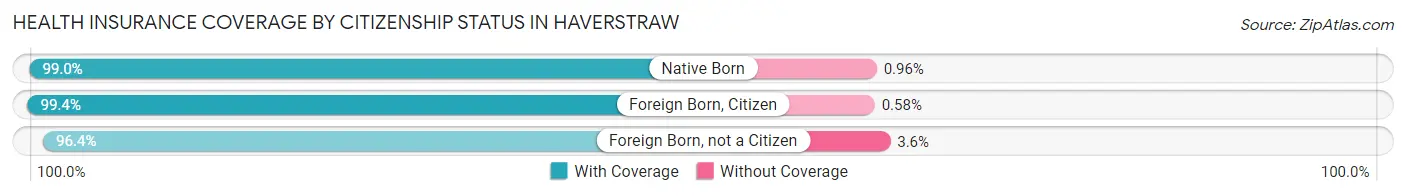
| Citizenship Status | With Coverage | Without Coverage |
| Native Born | 1,244 (99.0%) | 12 (1.0%) |
| Foreign Born, Citizen | 1,889 (99.4%) | 11 (0.6%) |
| Foreign Born, not a Citizen | 1,301 (96.4%) | 49 (3.6%) |
Health Insurance Coverage by Household Income in Haverstraw
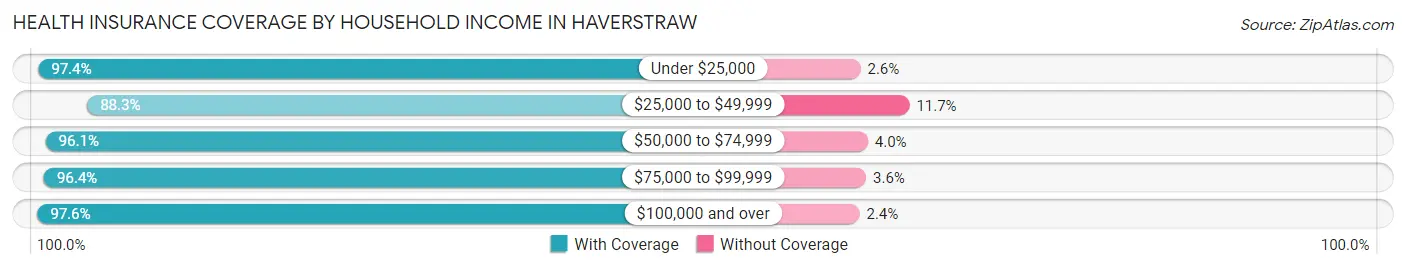
| Household Income | With Coverage | Without Coverage |
| Under $25,000 | 1,401 (97.4%) | 37 (2.6%) |
| $25,000 to $49,999 | 1,241 (88.3%) | 165 (11.7%) |
| $50,000 to $74,999 | 1,558 (96.1%) | 64 (4.0%) |
| $75,000 to $99,999 | 2,851 (96.4%) | 107 (3.6%) |
| $100,000 and over | 4,370 (97.6%) | 107 (2.4%) |
Public vs Private Health Insurance Coverage by Age in Haverstraw
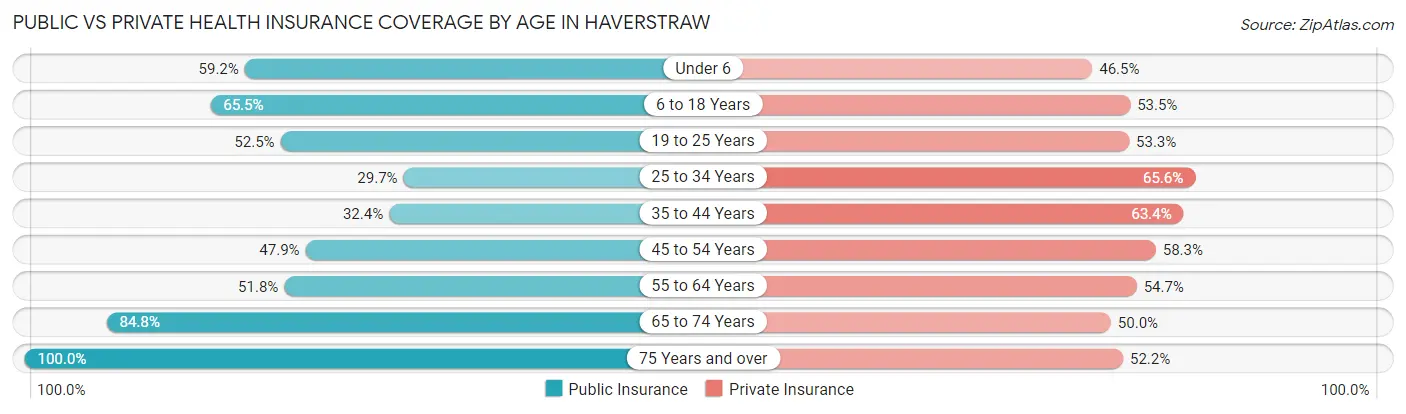
| Age Bracket | Public Insurance | Private Insurance |
| Under 6 | 743 (59.2%) | 584 (46.5%) |
| 6 to 18 Years | 1,245 (65.5%) | 1,017 (53.5%) |
| 19 to 25 Years | 709 (52.5%) | 720 (53.3%) |
| 25 to 34 Years | 438 (29.7%) | 967 (65.6%) |
| 35 to 44 Years | 430 (32.4%) | 843 (63.4%) |
| 45 to 54 Years | 690 (47.9%) | 840 (58.3%) |
| 55 to 64 Years | 924 (51.8%) | 976 (54.7%) |
| 65 to 74 Years | 891 (84.8%) | 525 (49.9%) |
| 75 Years and over | 542 (100.0%) | 283 (52.2%) |
| Total | 6,612 (54.5%) | 6,755 (55.7%) |
Disability Status by Sex by Age in Haverstraw
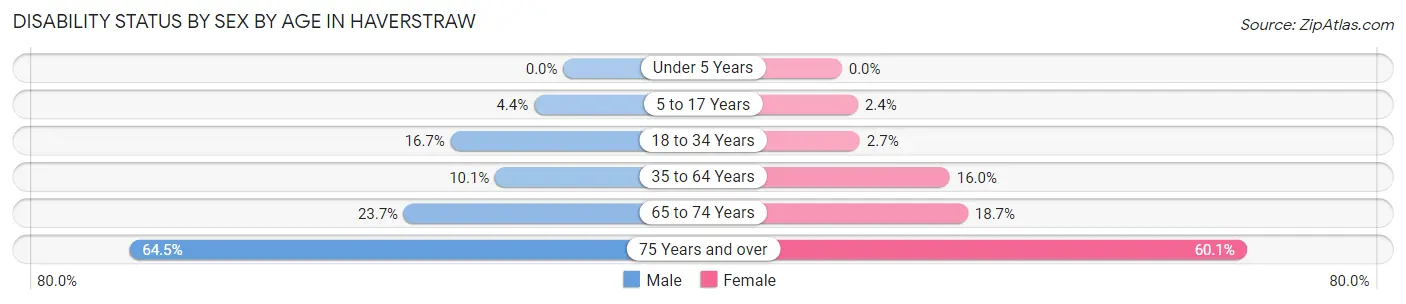
| Age Bracket | Male | Female |
| Under 5 Years | 0 (0.0%) | 0 (0.0%) |
| 5 to 17 Years | 54 (4.3%) | 17 (2.4%) |
| 18 to 34 Years | 261 (16.7%) | 38 (2.7%) |
| 35 to 64 Years | 226 (10.1%) | 372 (16.0%) |
| 65 to 74 Years | 116 (23.7%) | 105 (18.7%) |
| 75 Years and over | 136 (64.4%) | 199 (60.1%) |
Disability Class by Sex by Age in Haverstraw
Disability Class: Hearing Difficulty
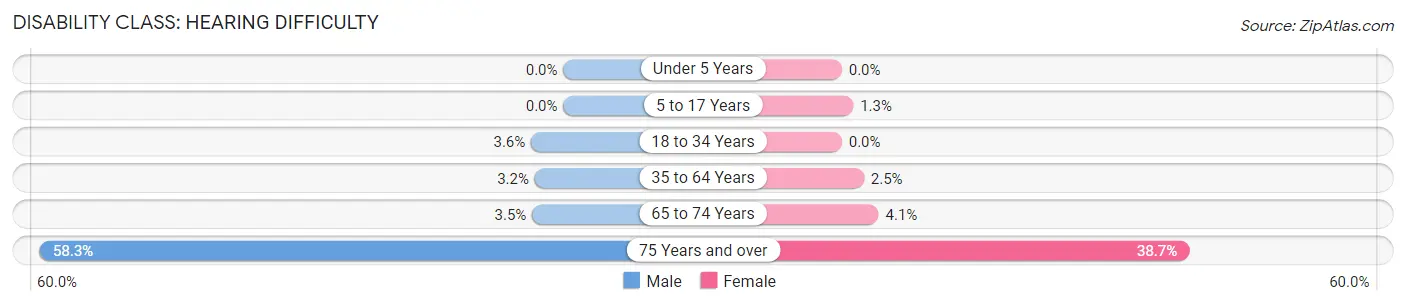
| Age Bracket | Male | Female |
| Under 5 Years | 0 (0.0%) | 0 (0.0%) |
| 5 to 17 Years | 0 (0.0%) | 9 (1.3%) |
| 18 to 34 Years | 56 (3.6%) | 0 (0.0%) |
| 35 to 64 Years | 71 (3.2%) | 57 (2.5%) |
| 65 to 74 Years | 17 (3.5%) | 23 (4.1%) |
| 75 Years and over | 123 (58.3%) | 128 (38.7%) |
Disability Class: Vision Difficulty
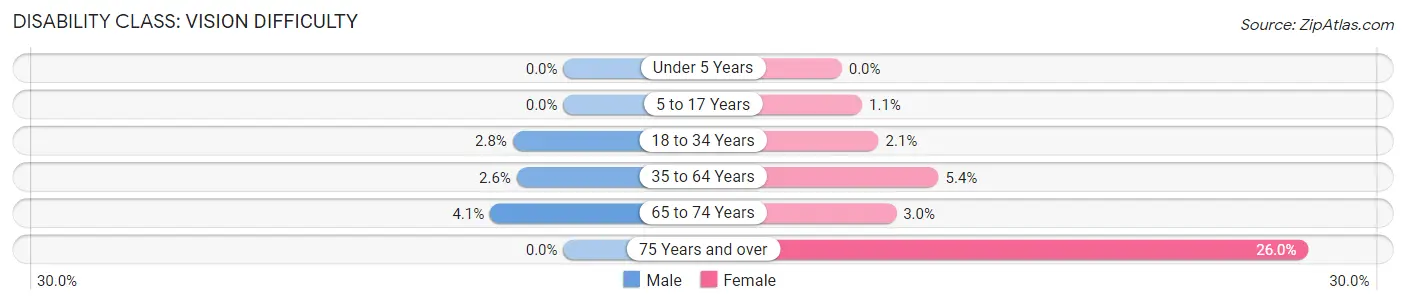
| Age Bracket | Male | Female |
| Under 5 Years | 0 (0.0%) | 0 (0.0%) |
| 5 to 17 Years | 0 (0.0%) | 8 (1.1%) |
| 18 to 34 Years | 44 (2.8%) | 29 (2.1%) |
| 35 to 64 Years | 58 (2.6%) | 125 (5.4%) |
| 65 to 74 Years | 20 (4.1%) | 17 (3.0%) |
| 75 Years and over | 0 (0.0%) | 86 (26.0%) |
Disability Class: Cognitive Difficulty
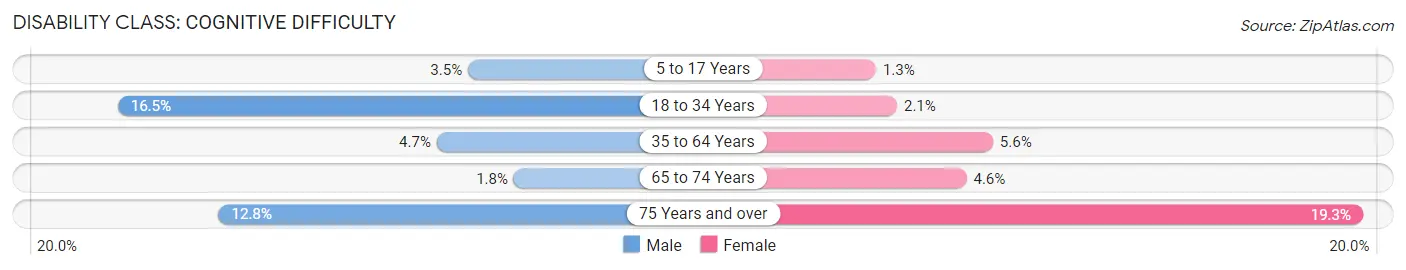
| Age Bracket | Male | Female |
| 5 to 17 Years | 44 (3.5%) | 9 (1.3%) |
| 18 to 34 Years | 258 (16.5%) | 29 (2.1%) |
| 35 to 64 Years | 105 (4.7%) | 130 (5.6%) |
| 65 to 74 Years | 9 (1.8%) | 26 (4.6%) |
| 75 Years and over | 27 (12.8%) | 64 (19.3%) |
Disability Class: Ambulatory Difficulty
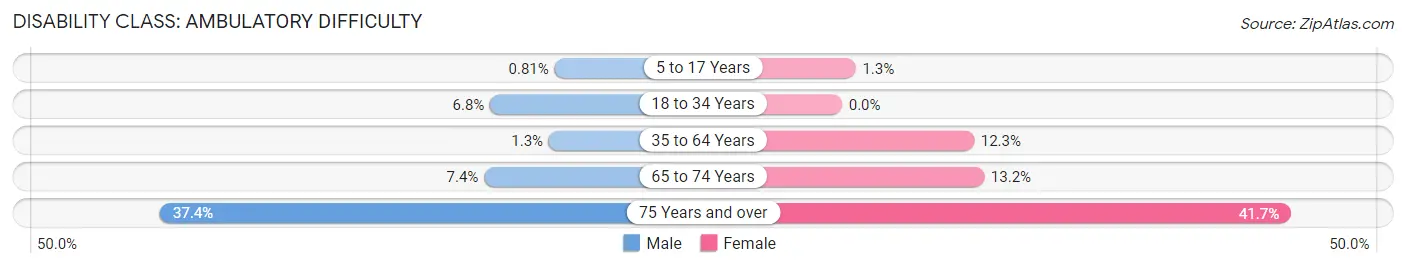
| Age Bracket | Male | Female |
| 5 to 17 Years | 10 (0.8%) | 9 (1.3%) |
| 18 to 34 Years | 106 (6.8%) | 0 (0.0%) |
| 35 to 64 Years | 30 (1.3%) | 284 (12.2%) |
| 65 to 74 Years | 36 (7.3%) | 74 (13.2%) |
| 75 Years and over | 79 (37.4%) | 138 (41.7%) |
Disability Class: Self-Care Difficulty
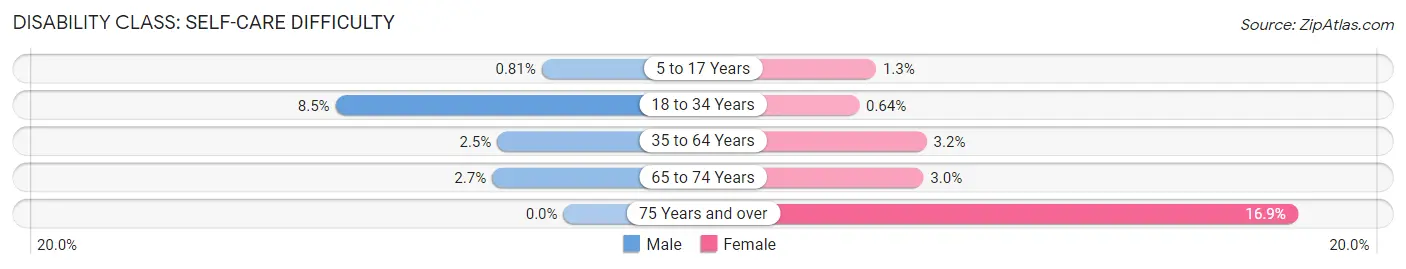
| Age Bracket | Male | Female |
| 5 to 17 Years | 10 (0.8%) | 9 (1.3%) |
| 18 to 34 Years | 132 (8.5%) | 9 (0.6%) |
| 35 to 64 Years | 55 (2.5%) | 73 (3.2%) |
| 65 to 74 Years | 13 (2.6%) | 17 (3.0%) |
| 75 Years and over | 0 (0.0%) | 56 (16.9%) |
Technology Access in Haverstraw
Computing Device Access in Haverstraw
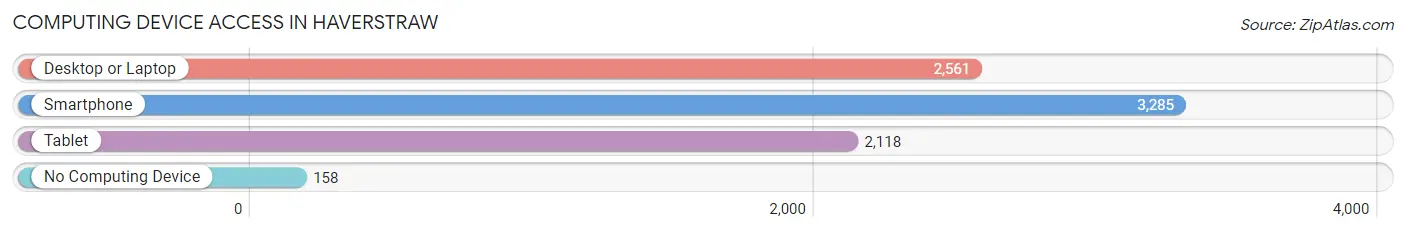
| Device Type | # Households | % Households |
| Desktop or Laptop | 2,561 | 69.5% |
| Smartphone | 3,285 | 89.1% |
| Tablet | 2,118 | 57.5% |
| No Computing Device | 158 | 4.3% |
| Total | 3,686 | 100.0% |
Internet Access in Haverstraw
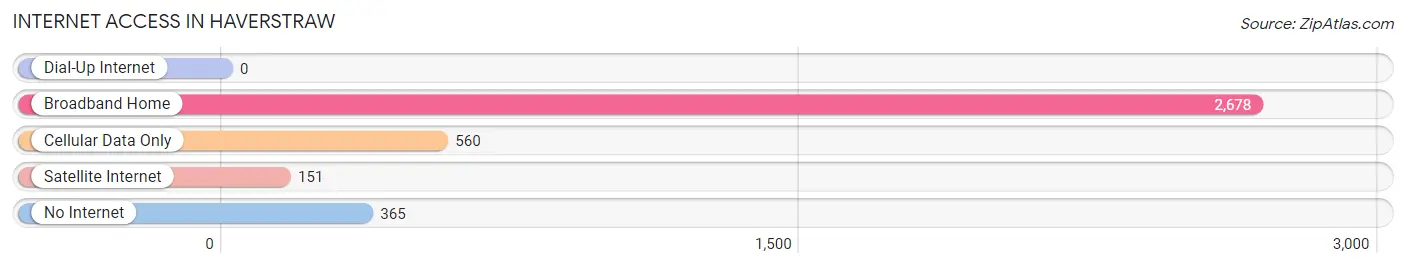
| Internet Type | # Households | % Households |
| Dial-Up Internet | 0 | 0.0% |
| Broadband Home | 2,678 | 72.7% |
| Cellular Data Only | 560 | 15.2% |
| Satellite Internet | 151 | 4.1% |
| No Internet | 365 | 9.9% |
| Total | 3,686 | 100.0% |
Haverstraw Summary
Haverstraw is a village located in the town of Haverstraw in Rockland County, New York. It is located on the west bank of the Hudson River, about 30 miles north of New York City. The village has a population of 10,165 as of the 2010 census.
History
Haverstraw was originally inhabited by the Lenape Native Americans. The first European settlers arrived in the area in 1666, and the village was officially incorporated in 1854. The village was named after the Dutch word for “stone”, as the area was known for its abundance of stone quarries.
The village was an important port for the Hudson River during the 19th century. It was a major center for the production of bricks, and the village was known as the “Brickmaking Capital of the World”. The village was also home to a large number of immigrants, including Irish, Italian, and Jewish immigrants.
Geography
Haverstraw is located in the town of Haverstraw in Rockland County, New York. It is located on the west bank of the Hudson River, about 30 miles north of New York City. The village has a total area of 2.2 square miles, all of which is land.
The village is located in the Hudson Valley region of New York. The terrain is mostly flat, with some hills in the northern part of the village. The village is located in a temperate climate, with hot summers and cold winters.
Economy
Haverstraw’s economy is largely based on tourism and manufacturing. The village is home to several tourist attractions, including the Hudson River Museum, the Haverstraw Brick Museum, and the Rockland County Historical Society.
The village is also home to several manufacturing companies, including the Haverstraw Brick Company, the Haverstraw Brick and Tile Company, and the Haverstraw Glass Company. The village is also home to several retail stores, restaurants, and other businesses.
Demographics
As of the 2010 census, the village had a population of 10,165. The racial makeup of the village was 57.2% White, 22.3% African American, 0.3% Native American, 8.2% Asian, 0.1% Pacific Islander, 8.2% from other races, and 3.9% from two or more races. Hispanic or Latino of any race were 22.3% of the population.
The median income for a household in the village was $50,945, and the median income for a family was $60,945. The per capita income for the village was $25,945. About 8.2% of families and 10.2% of the population were below the poverty line, including 14.2% of those under age 18 and 8.2% of those age 65 or over.
Common Questions
What is Per Capita Income in Haverstraw?
Per Capita income in Haverstraw is $33,244.
What is the Median Family Income in Haverstraw?
Median Family Income in Haverstraw is $78,321.
What is the Median Household income in Haverstraw?
Median Household Income in Haverstraw is $77,254.
What is Income or Wage Gap in Haverstraw?
Income or Wage Gap in Haverstraw is 32.6%.
Women in Haverstraw earn 67.4 cents for every dollar earned by a man.
What is Family Income Deficit in Haverstraw?
Family Income Deficit in Haverstraw is $14,584.
Families that are below poverty line in Haverstraw earn $14,584 less on average than the poverty threshold level.
What is Inequality or Gini Index in Haverstraw?
Inequality or Gini Index in Haverstraw is 0.48.
What is the Total Population of Haverstraw?
Total Population of Haverstraw is 12,286.
What is the Total Male Population of Haverstraw?
Total Male Population of Haverstraw is 6,548.
What is the Total Female Population of Haverstraw?
Total Female Population of Haverstraw is 5,738.
What is the Ratio of Males per 100 Females in Haverstraw?
There are 114.12 Males per 100 Females in Haverstraw.
What is the Ratio of Females per 100 Males in Haverstraw?
There are 87.63 Females per 100 Males in Haverstraw.
What is the Median Population Age in Haverstraw?
Median Population Age in Haverstraw is 36.8 Years.
What is the Average Family Size in Haverstraw
Average Family Size in Haverstraw is 3.7 People.
What is the Average Household Size in Haverstraw
Average Household Size in Haverstraw is 3.2 People.
How Large is the Labor Force in Haverstraw?
There are 6,071 People in the Labor Forcein in Haverstraw.
What is the Percentage of People in the Labor Force in Haverstraw?
63.9% of People are in the Labor Force in Haverstraw.
What is the Unemployment Rate in Haverstraw?
Unemployment Rate in Haverstraw is 8.8%.