North, SC Map & Demographics
North Map
North Overview
$20,403
PER CAPITA INCOME
$47,143
AVG FAMILY INCOME
$40,069
AVG HOUSEHOLD INCOME
23.2%
WAGE / INCOME GAP [ % ]
76.8¢/ $1
WAGE / INCOME GAP [ $ ]
0.44
INEQUALITY / GINI INDEX
916
TOTAL POPULATION
508
MALE POPULATION
408
FEMALE POPULATION
124.51
MALES / 100 FEMALES
80.31
FEMALES / 100 MALES
45.9
MEDIAN AGE
3.6
AVG FAMILY SIZE
2.6
AVG HOUSEHOLD SIZE
366
LABOR FORCE [ PEOPLE ]
53.8%
PERCENT IN LABOR FORCE
7.7%
UNEMPLOYMENT RATE
North Zip Codes
North Area Codes
Income in North
Income Overview in North
Per Capita Income in North is $20,403, while median incomes of families and households are $47,143 and $40,069 respectively.
| Characteristic | Number | Measure |
| Per Capita Income | 916 | $20,403 |
| Median Family Income | 208 | $47,143 |
| Mean Family Income | 208 | $61,641 |
| Median Household Income | 355 | $40,069 |
| Mean Household Income | 355 | $49,508 |
| Income Deficit | 208 | $0 |
| Wage / Income Gap (%) | 916 | 23.20% |
| Wage / Income Gap ($) | 916 | 76.80¢ per $1 |
| Gini / Inequality Index | 916 | 0.44 |
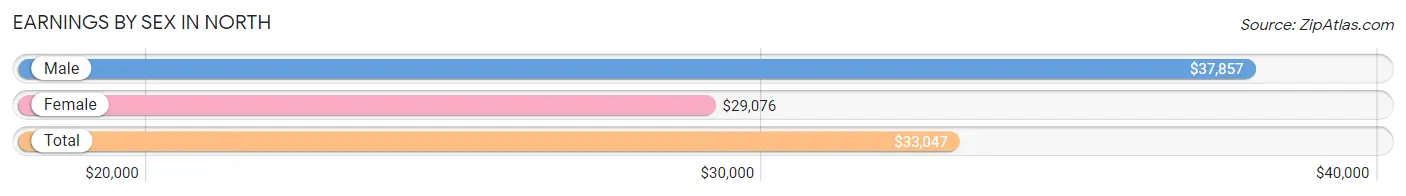
Earnings by Sex in North
Average Earnings in North are $33,047, $37,857 for men and $29,076 for women, a difference of 23.2%.
| Sex | Number | Average Earnings |
| Male | 204 (53.5%) | $37,857 |
| Female | 177 (46.5%) | $29,076 |
| Total | 381 (100.0%) | $33,047 |
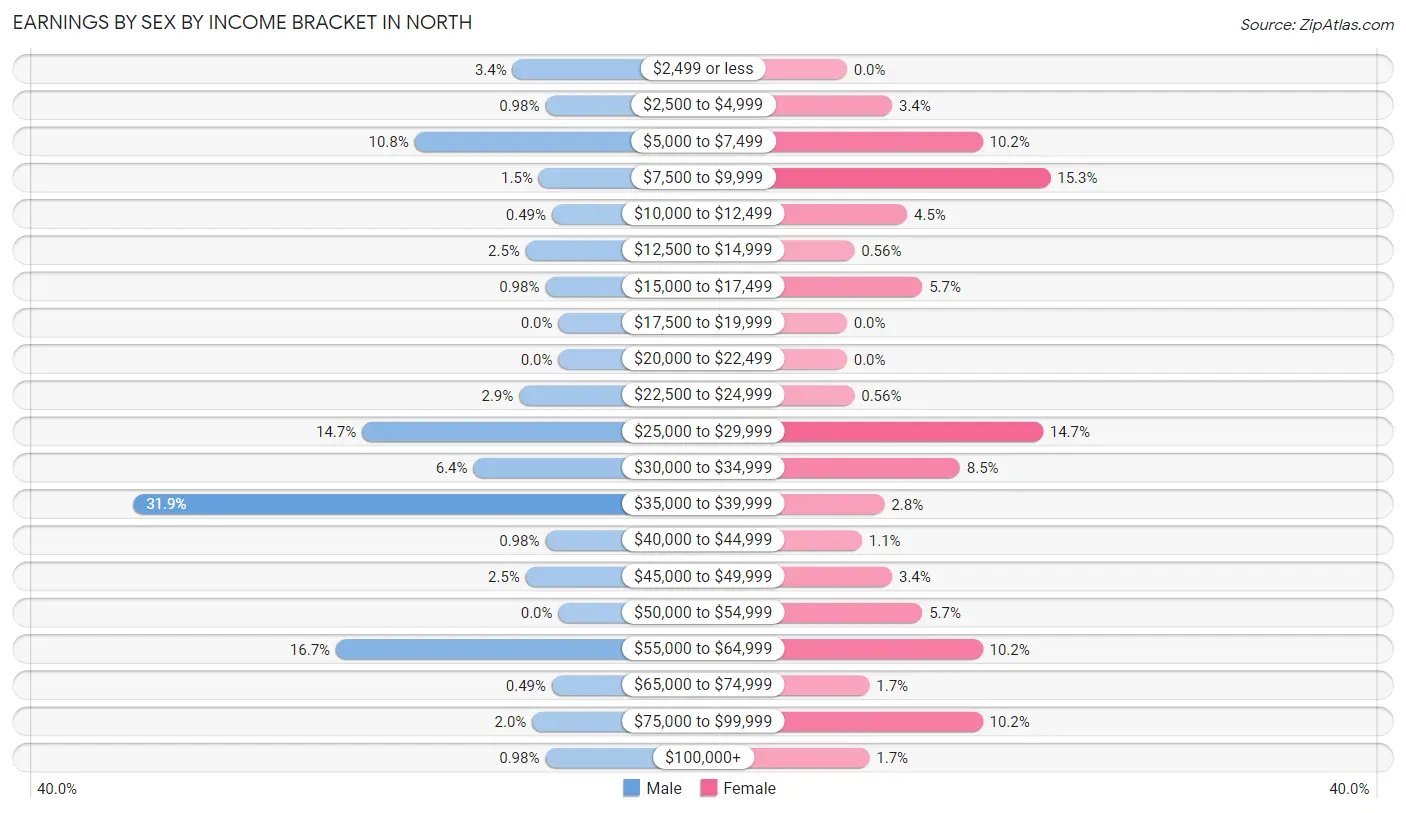
Earnings by Sex by Income Bracket in North
The most common earnings brackets in North are $35,000 to $39,999 for men (65 | 31.9%) and $7,500 to $9,999 for women (27 | 15.2%).
| Income | Male | Female |
| $2,499 or less | 7 (3.4%) | 0 (0.0%) |
| $2,500 to $4,999 | 2 (1.0%) | 6 (3.4%) |
| $5,000 to $7,499 | 22 (10.8%) | 18 (10.2%) |
| $7,500 to $9,999 | 3 (1.5%) | 27 (15.2%) |
| $10,000 to $12,499 | 1 (0.5%) | 8 (4.5%) |
| $12,500 to $14,999 | 5 (2.5%) | 1 (0.6%) |
| $15,000 to $17,499 | 2 (1.0%) | 10 (5.7%) |
| $17,500 to $19,999 | 0 (0.0%) | 0 (0.0%) |
| $20,000 to $22,499 | 0 (0.0%) | 0 (0.0%) |
| $22,500 to $24,999 | 6 (2.9%) | 1 (0.6%) |
| $25,000 to $29,999 | 30 (14.7%) | 26 (14.7%) |
| $30,000 to $34,999 | 13 (6.4%) | 15 (8.5%) |
| $35,000 to $39,999 | 65 (31.9%) | 5 (2.8%) |
| $40,000 to $44,999 | 2 (1.0%) | 2 (1.1%) |
| $45,000 to $49,999 | 5 (2.5%) | 6 (3.4%) |
| $50,000 to $54,999 | 0 (0.0%) | 10 (5.7%) |
| $55,000 to $64,999 | 34 (16.7%) | 18 (10.2%) |
| $65,000 to $74,999 | 1 (0.5%) | 3 (1.7%) |
| $75,000 to $99,999 | 4 (2.0%) | 18 (10.2%) |
| $100,000+ | 2 (1.0%) | 3 (1.7%) |
| Total | 204 (100.0%) | 177 (100.0%) |
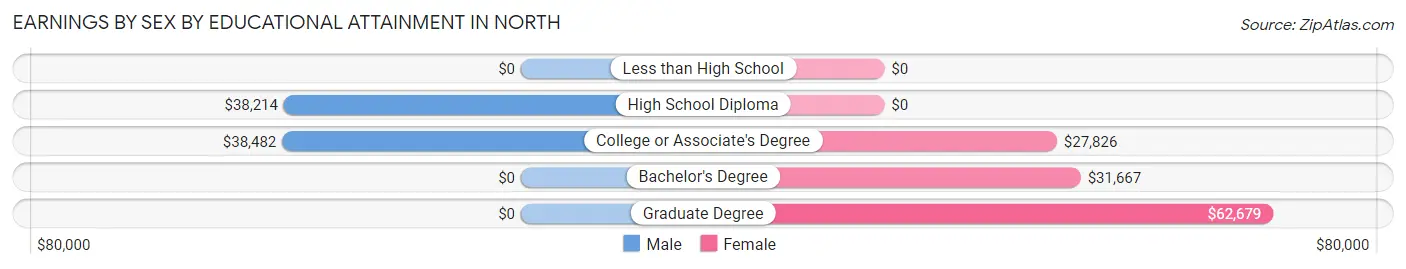
Earnings by Sex by Educational Attainment in North
Average earnings in North are $38,016 for men and $29,130 for women, a difference of 23.4%. Men with an educational attainment of college or associate's degree enjoy the highest average annual earnings of $38,482, while those with high school diploma education earn the least with $38,214. Women with an educational attainment of graduate degree earn the most with the average annual earnings of $62,679, while those with college or associate's degree education have the smallest earnings of $27,826.
| Educational Attainment | Male Income | Female Income |
| Less than High School | - | - |
| High School Diploma | $38,214 | $0 |
| College or Associate's Degree | $38,482 | $27,826 |
| Bachelor's Degree | - | - |
| Graduate Degree | - | - |
| Total | $38,016 | $29,130 |
Family Income in North
Family Income Brackets in North
According to the North family income data, there are 47 families falling into the $35,000 to $49,999 income range, which is the most common income bracket and makes up 22.6% of all families.
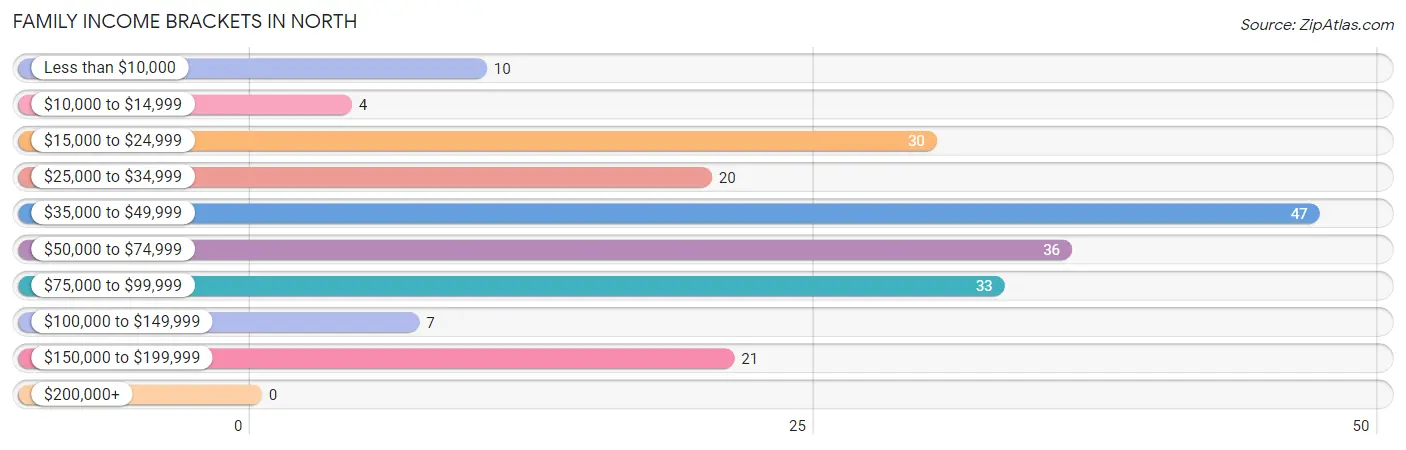
| Income Bracket | # Families | % Families |
| Less than $10,000 | 10 | 4.8% |
| $10,000 to $14,999 | 4 | 1.9% |
| $15,000 to $24,999 | 30 | 14.4% |
| $25,000 to $34,999 | 20 | 9.6% |
| $35,000 to $49,999 | 47 | 22.6% |
| $50,000 to $74,999 | 36 | 17.3% |
| $75,000 to $99,999 | 33 | 15.9% |
| $100,000 to $149,999 | 7 | 3.4% |
| $150,000 to $199,999 | 21 | 10.1% |
| $200,000+ | 0 | 0.0% |
Family Income by Famaliy Size in North
2-person families (124 | 59.6%) account for the highest median family income in North with $55,000 per family, while 2-person families (124 | 59.6%) have the highest median income of $27,500 per family member.
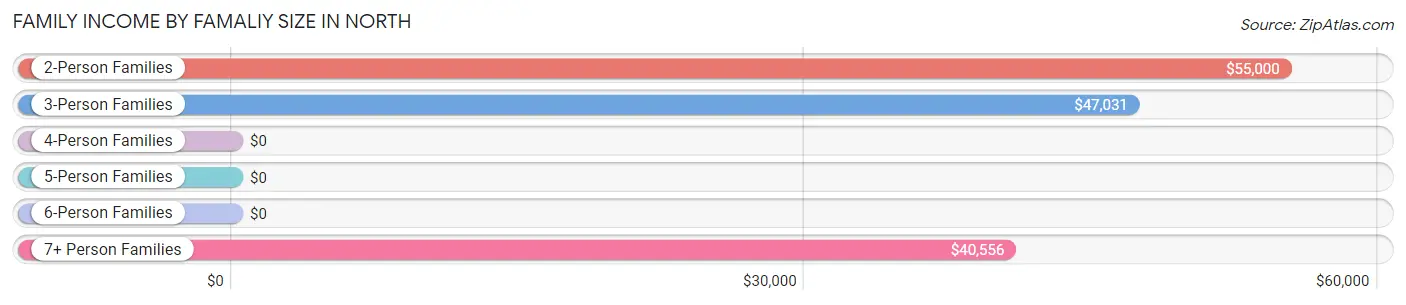
| Income Bracket | # Families | Median Income |
| 2-Person Families | 124 (59.6%) | $55,000 |
| 3-Person Families | 35 (16.8%) | $47,031 |
| 4-Person Families | 9 (4.3%) | $0 |
| 5-Person Families | 22 (10.6%) | $0 |
| 6-Person Families | 0 (0.0%) | $0 |
| 7+ Person Families | 18 (8.6%) | $40,556 |
| Total | 208 (100.0%) | $47,143 |
Family Income by Number of Earners in North
The median family income in North is $47,143, with families comprising 2 earners (81) having the highest median family income of $89,028, while families with no earners (30) have the lowest median family income of $25,625, accounting for 38.9% and 14.4% of families, respectively.
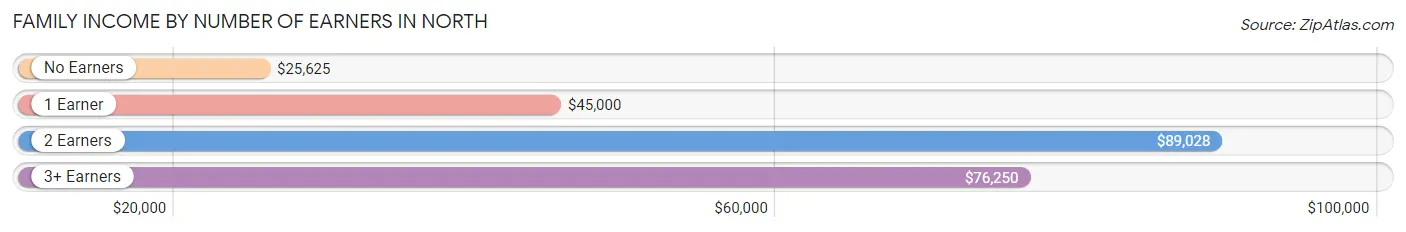
| Number of Earners | # Families | Median Income |
| No Earners | 30 (14.4%) | $25,625 |
| 1 Earner | 86 (41.3%) | $45,000 |
| 2 Earners | 81 (38.9%) | $89,028 |
| 3+ Earners | 11 (5.3%) | $76,250 |
| Total | 208 (100.0%) | $47,143 |
Household Income in North
Household Income Brackets in North
With 69 households falling in the category, the $50,000 to $74,999 income range is the most frequent in North, accounting for 19.4% of all households.
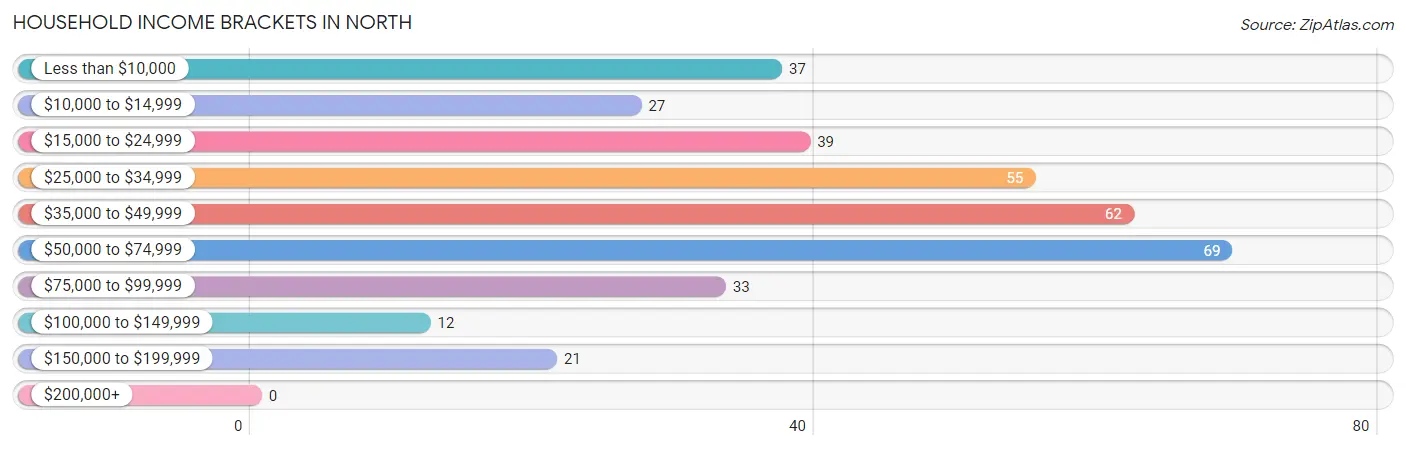
| Income Bracket | # Households | % Households |
| Less than $10,000 | 37 | 10.4% |
| $10,000 to $14,999 | 27 | 7.6% |
| $15,000 to $24,999 | 39 | 11.0% |
| $25,000 to $34,999 | 55 | 15.5% |
| $35,000 to $49,999 | 62 | 17.5% |
| $50,000 to $74,999 | 69 | 19.4% |
| $75,000 to $99,999 | 33 | 9.3% |
| $100,000 to $149,999 | 12 | 3.4% |
| $150,000 to $199,999 | 21 | 5.9% |
| $200,000+ | 0 | 0.0% |
Household Income by Householder Age in North
The median household income in North is $40,069, with the highest median household income of $62,574 found in the 45 to 64 years age bracket for the primary householder. A total of 143 households (40.3%) fall into this category. Meanwhile, the 15 to 24 years age bracket for the primary householder has the lowest median household income of $0, with 3 households (0.9%) in this group.
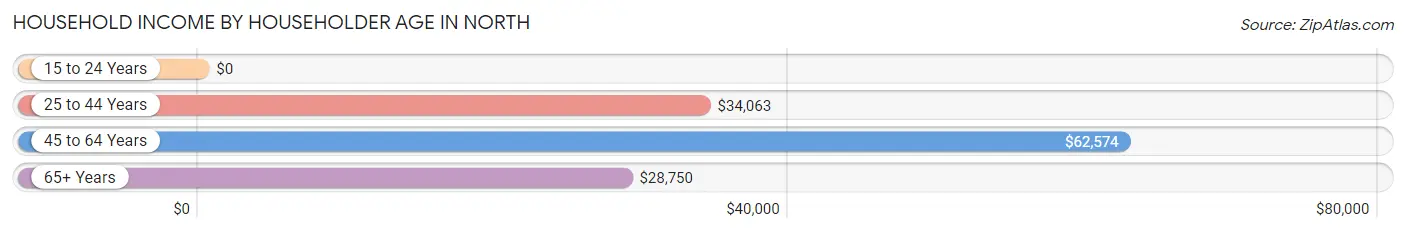
| Income Bracket | # Households | Median Income |
| 15 to 24 Years | 3 (0.9%) | $0 |
| 25 to 44 Years | 63 (17.7%) | $34,063 |
| 45 to 64 Years | 143 (40.3%) | $62,574 |
| 65+ Years | 146 (41.1%) | $28,750 |
| Total | 355 (100.0%) | $40,069 |
Poverty in North
Income Below Poverty by Sex and Age in North
With 37.0% poverty level for males and 40.2% for females among the residents of North, 6 to 11 year old males and 12 to 14 year old females are the most vulnerable to poverty, with 96 males (85.7%) and 16 females (88.9%) in their respective age groups living below the poverty level.
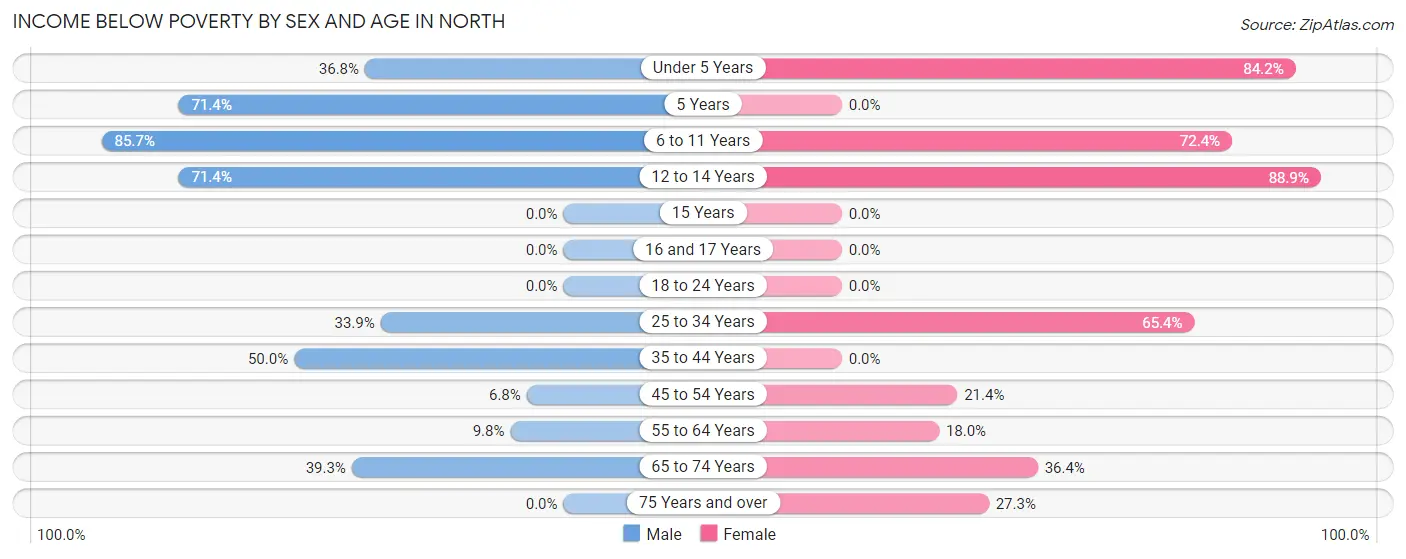
| Age Bracket | Male | Female |
| Under 5 Years | 7 (36.8%) | 16 (84.2%) |
| 5 Years | 5 (71.4%) | 0 (0.0%) |
| 6 to 11 Years | 96 (85.7%) | 21 (72.4%) |
| 12 to 14 Years | 20 (71.4%) | 16 (88.9%) |
| 15 Years | 0 (0.0%) | 0 (0.0%) |
| 16 and 17 Years | 0 (0.0%) | 0 (0.0%) |
| 18 to 24 Years | 0 (0.0%) | 0 (0.0%) |
| 25 to 34 Years | 19 (33.9%) | 53 (65.4%) |
| 35 to 44 Years | 15 (50.0%) | 0 (0.0%) |
| 45 to 54 Years | 3 (6.8%) | 15 (21.4%) |
| 55 to 64 Years | 12 (9.8%) | 11 (18.0%) |
| 65 to 74 Years | 11 (39.3%) | 20 (36.4%) |
| 75 Years and over | 0 (0.0%) | 12 (27.3%) |
| Total | 188 (37.0%) | 164 (40.2%) |
Income Above Poverty by Sex and Age in North
According to the poverty statistics in North, males aged 16 and 17 years and females aged 15 years are the age groups that are most secure financially, with 100.0% of males and 100.0% of females in these age groups living above the poverty line.
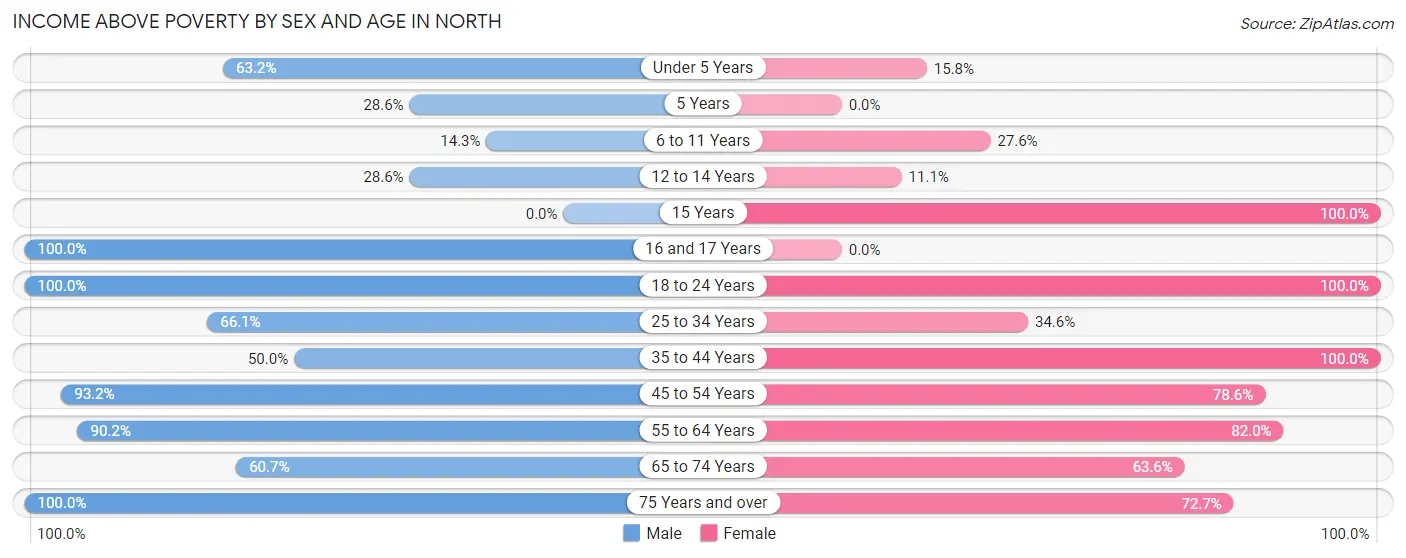
| Age Bracket | Male | Female |
| Under 5 Years | 12 (63.2%) | 3 (15.8%) |
| 5 Years | 2 (28.6%) | 0 (0.0%) |
| 6 to 11 Years | 16 (14.3%) | 8 (27.6%) |
| 12 to 14 Years | 8 (28.6%) | 2 (11.1%) |
| 15 Years | 0 (0.0%) | 4 (100.0%) |
| 16 and 17 Years | 8 (100.0%) | 0 (0.0%) |
| 18 to 24 Years | 8 (100.0%) | 7 (100.0%) |
| 25 to 34 Years | 37 (66.1%) | 28 (34.6%) |
| 35 to 44 Years | 15 (50.0%) | 20 (100.0%) |
| 45 to 54 Years | 41 (93.2%) | 55 (78.6%) |
| 55 to 64 Years | 110 (90.2%) | 50 (82.0%) |
| 65 to 74 Years | 17 (60.7%) | 35 (63.6%) |
| 75 Years and over | 46 (100.0%) | 32 (72.7%) |
| Total | 320 (63.0%) | 244 (59.8%) |
Income Below Poverty Among Married-Couple Families in North
The poverty statistics for married-couple families in North show that 13.9% or 19 of the total 137 families live below the poverty line. Families with 5 or more children have the highest poverty rate of 100.0%, comprising of 16 families. On the other hand, families with 1 or 2 children have the lowest poverty rate of 0.0%, which includes 0 families.
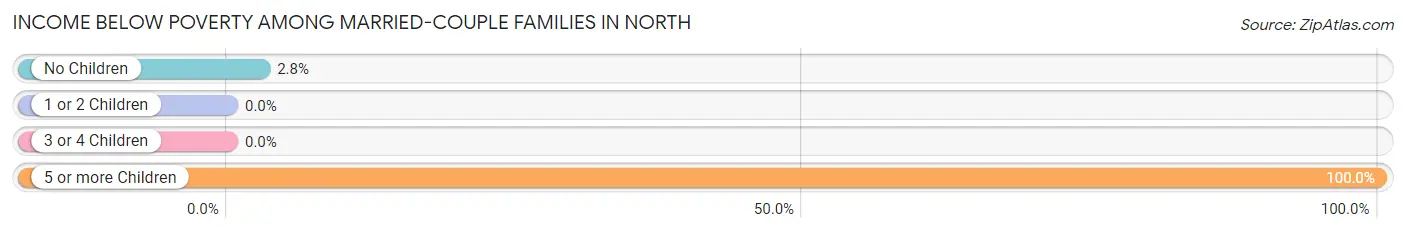
| Children | Above Poverty | Below Poverty |
| No Children | 104 (97.2%) | 3 (2.8%) |
| 1 or 2 Children | 10 (100.0%) | 0 (0.0%) |
| 3 or 4 Children | 4 (100.0%) | 0 (0.0%) |
| 5 or more Children | 0 (0.0%) | 16 (100.0%) |
| Total | 118 (86.1%) | 19 (13.9%) |
Income Below Poverty Among Single-Parent Households in North
According to the poverty data in North, 16.7% or 5 single-father households and 73.2% or 30 single-mother households are living below the poverty line. Among single-father households, those with 1 or 2 children have the highest poverty rate, with 5 households (71.4%) experiencing poverty. Likewise, among single-mother households, those with no children have the highest poverty rate, with 4 households (100.0%) falling below the poverty line.
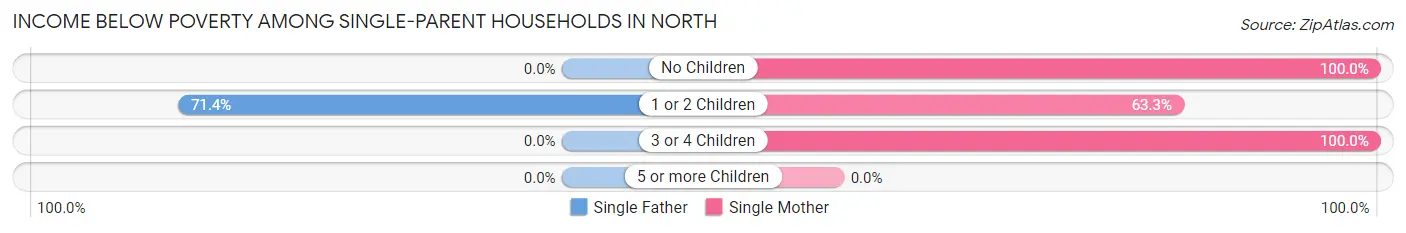
| Children | Single Father | Single Mother |
| No Children | 0 (0.0%) | 4 (100.0%) |
| 1 or 2 Children | 5 (71.4%) | 19 (63.3%) |
| 3 or 4 Children | 0 (0.0%) | 7 (100.0%) |
| 5 or more Children | 0 (0.0%) | 0 (0.0%) |
| Total | 5 (16.7%) | 30 (73.2%) |
Income Below Poverty Among Married-Couple vs Single-Parent Households in North
The poverty data for North shows that 19 of the married-couple family households (13.9%) and 35 of the single-parent households (49.3%) are living below the poverty level. Within the married-couple family households, those with 5 or more children have the highest poverty rate, with 16 households (100.0%) falling below the poverty line. Among the single-parent households, those with 3 or 4 children have the highest poverty rate, with 7 household (100.0%) living below poverty.
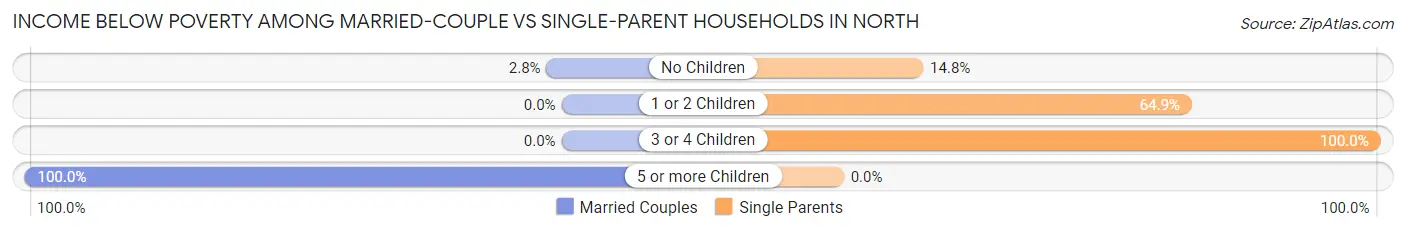
| Children | Married-Couple Families | Single-Parent Households |
| No Children | 3 (2.8%) | 4 (14.8%) |
| 1 or 2 Children | 0 (0.0%) | 24 (64.9%) |
| 3 or 4 Children | 0 (0.0%) | 7 (100.0%) |
| 5 or more Children | 16 (100.0%) | 0 (0.0%) |
| Total | 19 (13.9%) | 35 (49.3%) |
Race in North
The most populous races in North are Black / African American (489 | 53.4%), White / Caucasian (414 | 45.2%), and Hispanic or Latino (16 | 1.8%).
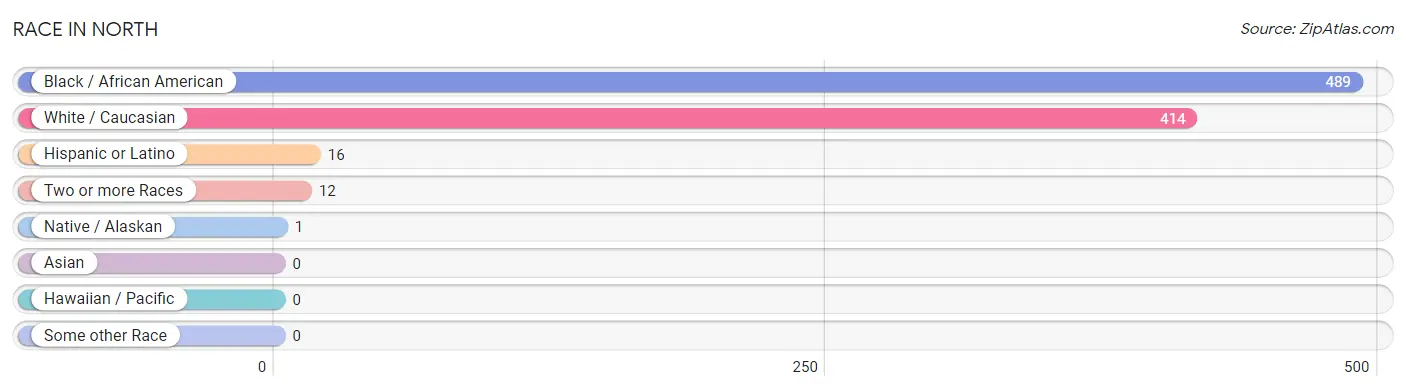
| Race | # Population | % Population |
| Asian | 0 | 0.0% |
| Black / African American | 489 | 53.4% |
| Hawaiian / Pacific | 0 | 0.0% |
| Hispanic or Latino | 16 | 1.8% |
| Native / Alaskan | 1 | 0.1% |
| White / Caucasian | 414 | 45.2% |
| Two or more Races | 12 | 1.3% |
| Some other Race | 0 | 0.0% |
| Total | 916 | 100.0% |
Ancestry in North
The most populous ancestries reported in North are American (120 | 13.1%), German (96 | 10.5%), West Indian (24 | 2.6%), English (18 | 2.0%), and Mexican (12 | 1.3%), together accounting for 29.5% of all North residents.
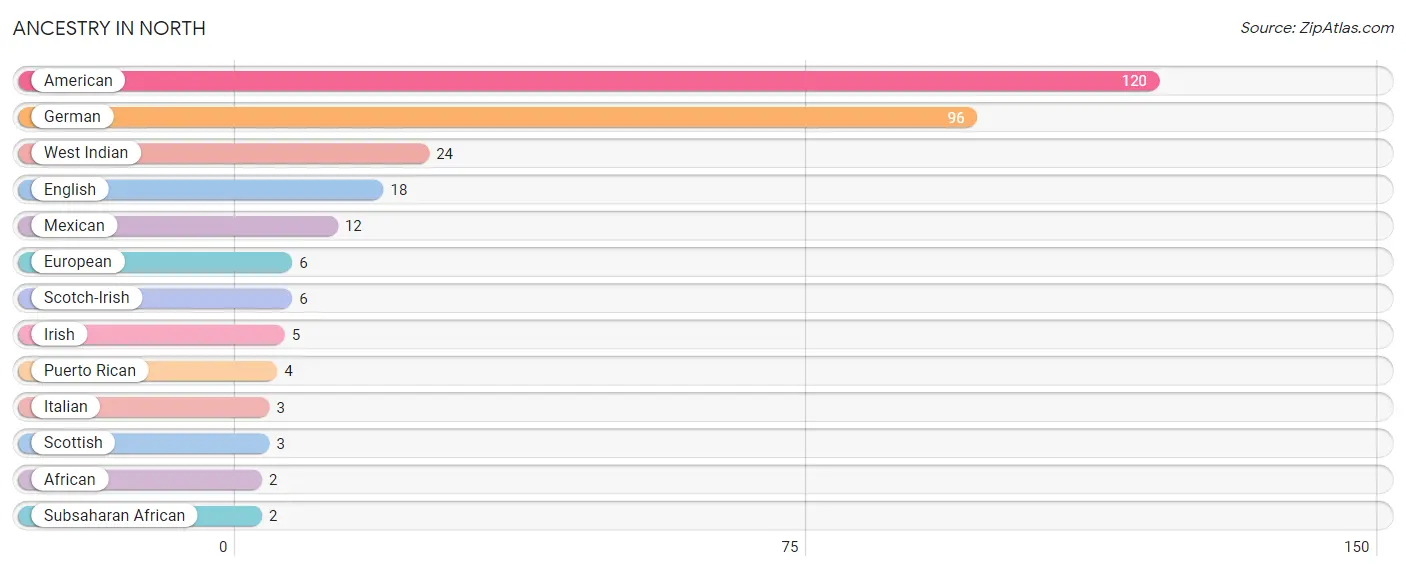
| Ancestry | # Population | % Population |
| African | 2 | 0.2% |
| American | 120 | 13.1% |
| English | 18 | 2.0% |
| European | 6 | 0.7% |
| German | 96 | 10.5% |
| Irish | 5 | 0.5% |
| Italian | 3 | 0.3% |
| Mexican | 12 | 1.3% |
| Puerto Rican | 4 | 0.4% |
| Scotch-Irish | 6 | 0.7% |
| Scottish | 3 | 0.3% |
| Subsaharan African | 2 | 0.2% |
| West Indian | 24 | 2.6% | View All 13 Rows |
Immigrants in North
The most numerous immigrant groups reported in North came from Central America (4 | 0.4%), Latin America (4 | 0.4%), and Mexico (4 | 0.4%), together accounting for 1.3% of all North residents.
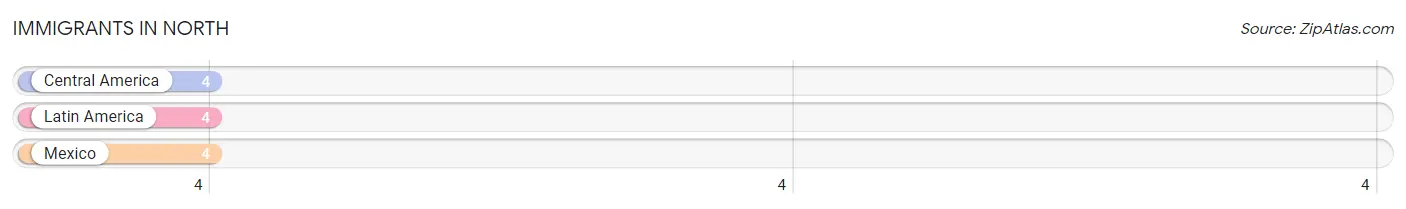
| Immigration Origin | # Population | % Population |
| Central America | 4 | 0.4% |
| Latin America | 4 | 0.4% |
| Mexico | 4 | 0.4% | View All 3 Rows |
Sex and Age in North
Sex and Age in North
The most populous age groups in North are 5 to 9 Years (83 | 16.3%) for men and 30 to 34 Years (71 | 17.4%) for women.
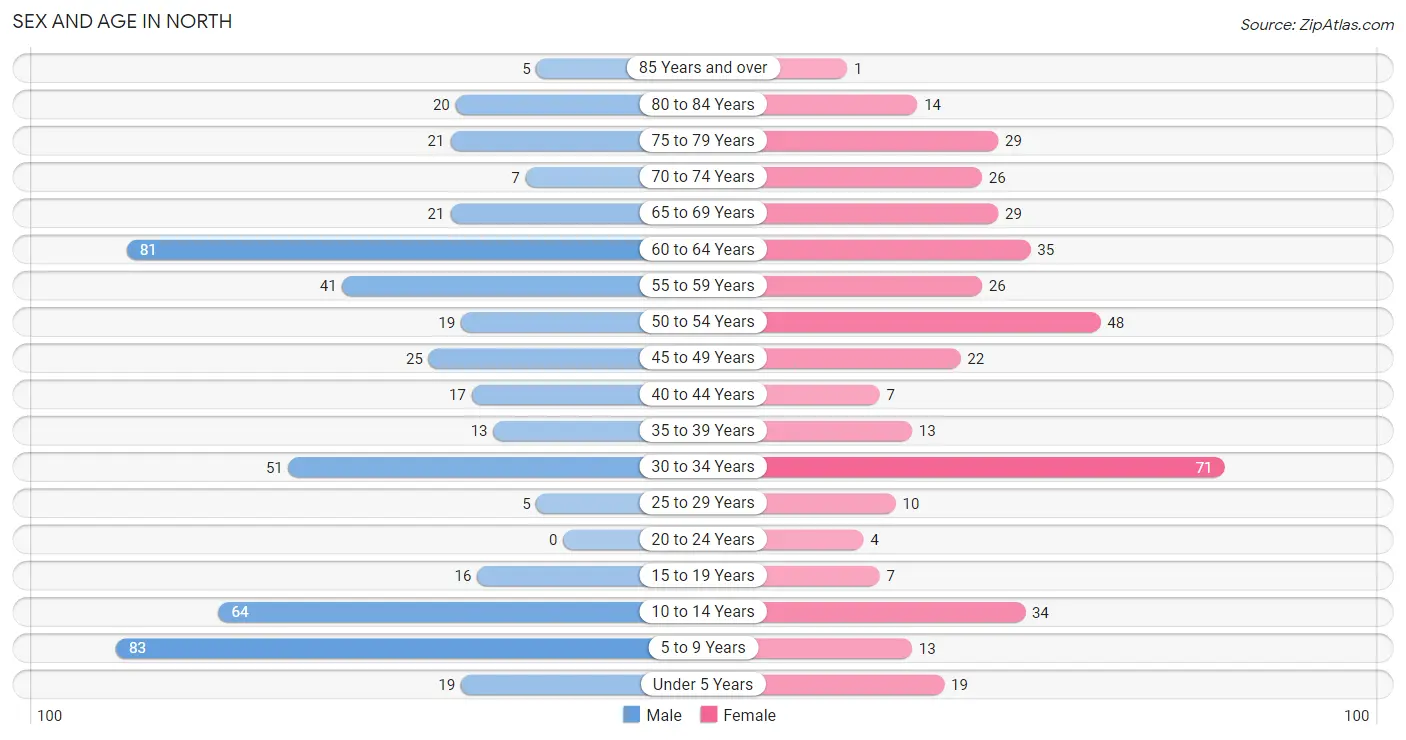
| Age Bracket | Male | Female |
| Under 5 Years | 19 (3.7%) | 19 (4.7%) |
| 5 to 9 Years | 83 (16.3%) | 13 (3.2%) |
| 10 to 14 Years | 64 (12.6%) | 34 (8.3%) |
| 15 to 19 Years | 16 (3.2%) | 7 (1.7%) |
| 20 to 24 Years | 0 (0.0%) | 4 (1.0%) |
| 25 to 29 Years | 5 (1.0%) | 10 (2.5%) |
| 30 to 34 Years | 51 (10.0%) | 71 (17.4%) |
| 35 to 39 Years | 13 (2.6%) | 13 (3.2%) |
| 40 to 44 Years | 17 (3.4%) | 7 (1.7%) |
| 45 to 49 Years | 25 (4.9%) | 22 (5.4%) |
| 50 to 54 Years | 19 (3.7%) | 48 (11.8%) |
| 55 to 59 Years | 41 (8.1%) | 26 (6.4%) |
| 60 to 64 Years | 81 (15.9%) | 35 (8.6%) |
| 65 to 69 Years | 21 (4.1%) | 29 (7.1%) |
| 70 to 74 Years | 7 (1.4%) | 26 (6.4%) |
| 75 to 79 Years | 21 (4.1%) | 29 (7.1%) |
| 80 to 84 Years | 20 (3.9%) | 14 (3.4%) |
| 85 Years and over | 5 (1.0%) | 1 (0.3%) |
| Total | 508 (100.0%) | 408 (100.0%) |
Families and Households in North
Median Family Size in North
The median family size in North is 3.63 persons per family, with single female/mother families (41 | 19.7%) accounting for the largest median family size of 4.39 persons per family. On the other hand, married-couple families (137 | 65.9%) represent the smallest median family size with 3.32 persons per family.
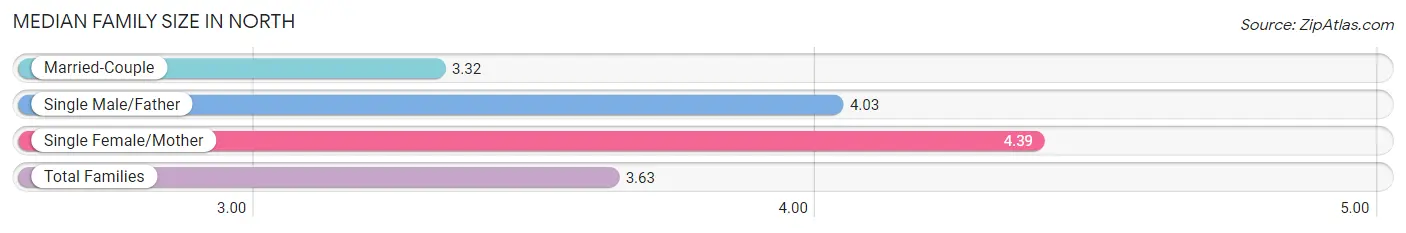
| Family Type | # Families | Family Size |
| Married-Couple | 137 (65.9%) | 3.32 |
| Single Male/Father | 30 (14.4%) | 4.03 |
| Single Female/Mother | 41 (19.7%) | 4.39 |
| Total Families | 208 (100.0%) | 3.63 |
Median Household Size in North
The median household size in North is 2.58 persons per household, with single female/mother households (41 | 11.6%) accounting for the largest median household size of 4.39 persons per household. non-family households (147 | 41.4%) represent the smallest median household size with 1.07 persons per household.
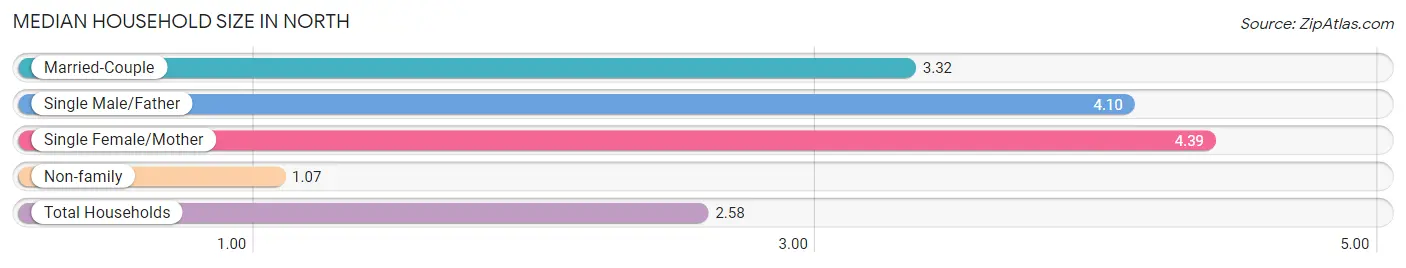
| Household Type | # Households | Household Size |
| Married-Couple | 137 (38.6%) | 3.32 |
| Single Male/Father | 30 (8.5%) | 4.10 |
| Single Female/Mother | 41 (11.6%) | 4.39 |
| Non-family | 147 (41.4%) | 1.07 |
| Total Households | 355 (100.0%) | 2.58 |
Household Size by Marriage Status in North
Out of a total of 355 households in North, 208 (58.6%) are family households, while 147 (41.4%) are nonfamily households. The most numerous type of family households are 2-person households, comprising 122, and the most common type of nonfamily households are 1-person households, comprising 137.
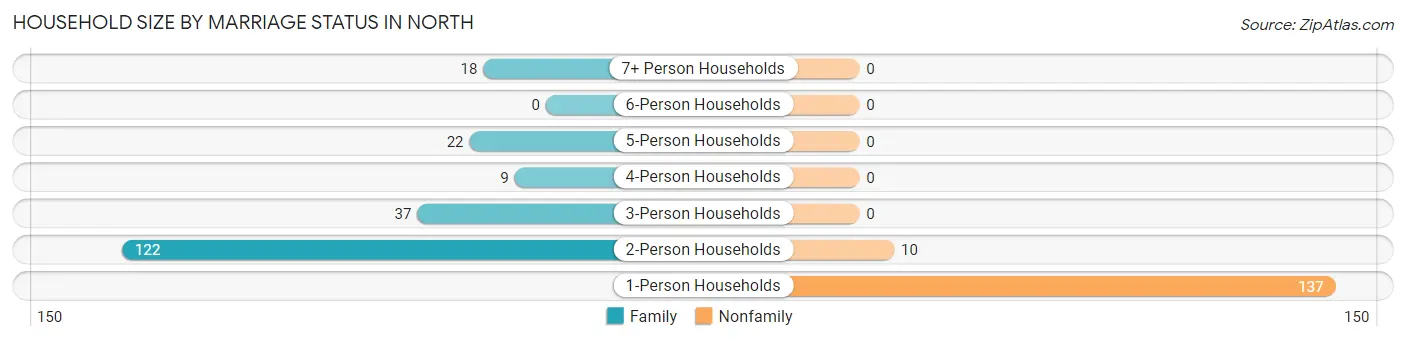
| Household Size | Family Households | Nonfamily Households |
| 1-Person Households | - | 137 (38.6%) |
| 2-Person Households | 122 (34.4%) | 10 (2.8%) |
| 3-Person Households | 37 (10.4%) | 0 (0.0%) |
| 4-Person Households | 9 (2.5%) | 0 (0.0%) |
| 5-Person Households | 22 (6.2%) | 0 (0.0%) |
| 6-Person Households | 0 (0.0%) | 0 (0.0%) |
| 7+ Person Households | 18 (5.1%) | 0 (0.0%) |
| Total | 208 (58.6%) | 147 (41.4%) |
Female Fertility in North
Fertility by Age in North
Average fertility rate in North is 14.0 births per 1,000 women. Women in the age bracket of 20 to 34 years have the highest fertility rate with 24.0 births per 1,000 women. Women in the age bracket of 20 to 34 years acount for 100.0% of all women with births.
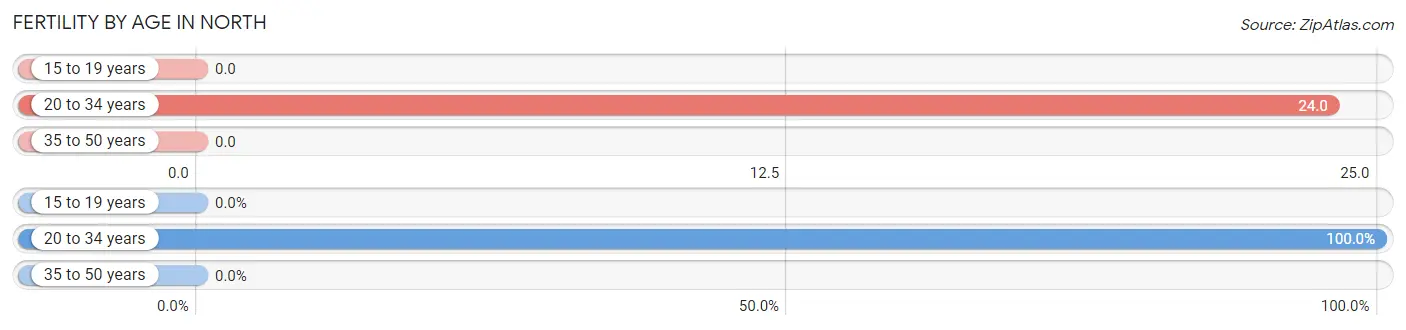
| Age Bracket | Women with Births | Births / 1,000 Women |
| 15 to 19 years | 0 (0.0%) | 0.0 |
| 20 to 34 years | 2 (100.0%) | 24.0 |
| 35 to 50 years | 0 (0.0%) | 0.0 |
| Total | 2 (100.0%) | 14.0 |
Fertility by Age by Marriage Status in North
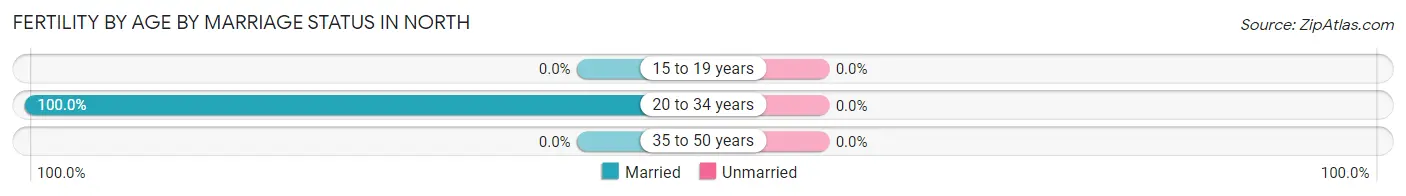
| Age Bracket | Married | Unmarried |
| 15 to 19 years | 0 (0.0%) | 0 (0.0%) |
| 20 to 34 years | 2 (100.0%) | 0 (0.0%) |
| 35 to 50 years | 0 (0.0%) | 0 (0.0%) |
| Total | 2 (100.0%) | 0 (0.0%) |
Fertility by Education in North
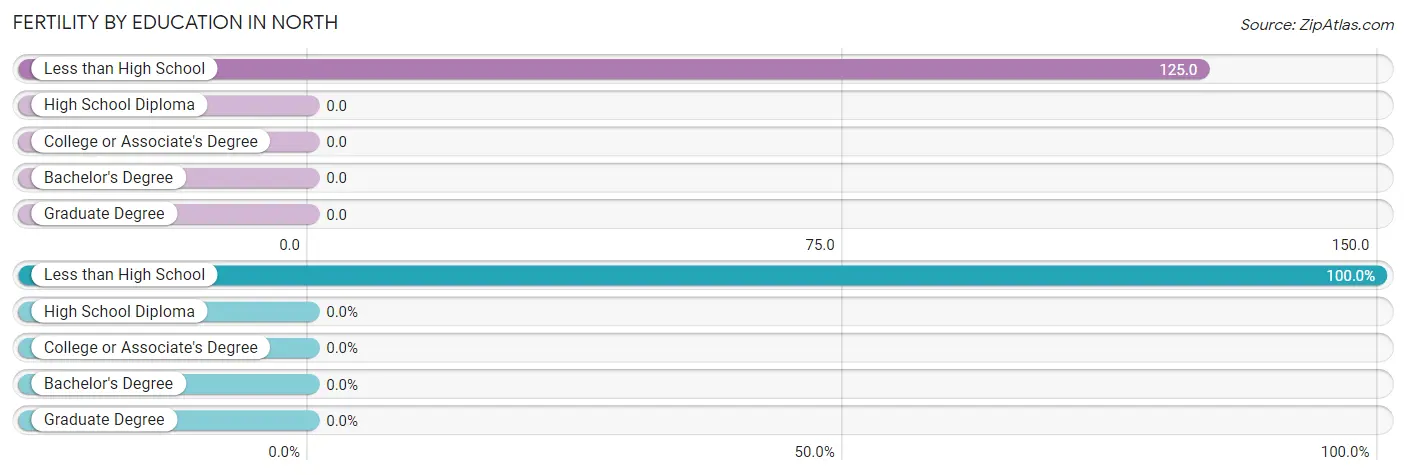
| Educational Attainment | Women with Births | Births / 1,000 Women |
| Less than High School | 2 (100.0%) | 125.0 |
| High School Diploma | 0 (0.0%) | 0.0 |
| College or Associate's Degree | 0 (0.0%) | 0.0 |
| Bachelor's Degree | 0 (0.0%) | 0.0 |
| Graduate Degree | 0 (0.0%) | 0.0 |
| Total | 2 (100.0%) | 14.0 |
Fertility by Education by Marriage Status in North
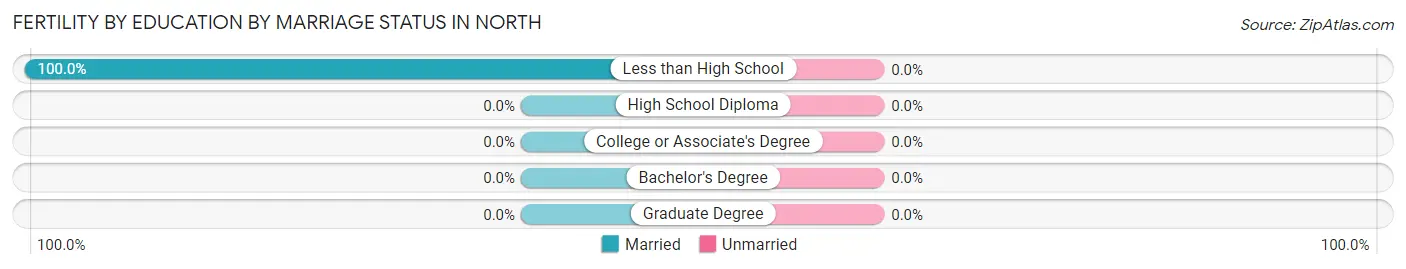
| Educational Attainment | Married | Unmarried |
| Less than High School | 2 (100.0%) | 0 (0.0%) |
| High School Diploma | 0 (0.0%) | 0 (0.0%) |
| College or Associate's Degree | 0 (0.0%) | 0 (0.0%) |
| Bachelor's Degree | 0 (0.0%) | 0 (0.0%) |
| Graduate Degree | 0 (0.0%) | 0 (0.0%) |
| Total | 2 (100.0%) | 0 (0.0%) |
Employment Characteristics in North
Employment by Class of Employer in North
Among the 330 employed individuals in North, private company employees (266 | 80.6%), state government employees (24 | 7.3%), and local government employees (14 | 4.2%) make up the most common classes of employment.
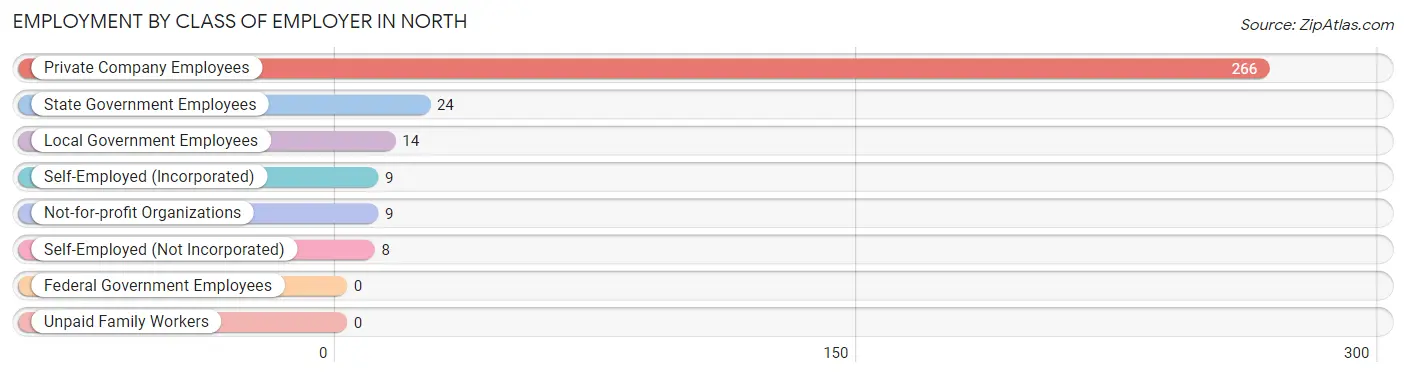
| Employer Class | # Employees | % Employees |
| Private Company Employees | 266 | 80.6% |
| Self-Employed (Incorporated) | 9 | 2.7% |
| Self-Employed (Not Incorporated) | 8 | 2.4% |
| Not-for-profit Organizations | 9 | 2.7% |
| Local Government Employees | 14 | 4.2% |
| State Government Employees | 24 | 7.3% |
| Federal Government Employees | 0 | 0.0% |
| Unpaid Family Workers | 0 | 0.0% |
| Total | 330 | 100.0% |
Employment Status by Age in North
According to the labor force statistics for North, out of the total population over 16 years of age (680), 53.8% or 366 individuals are in the labor force, with 7.7% or 28 of them unemployed. The age group with the highest labor force participation rate is 20 to 24 years, with 100.0% or 4 individuals in the labor force. Within the labor force, the 55 to 59 years age range has the highest percentage of unemployed individuals, with 27.9% or 12 of them being unemployed.
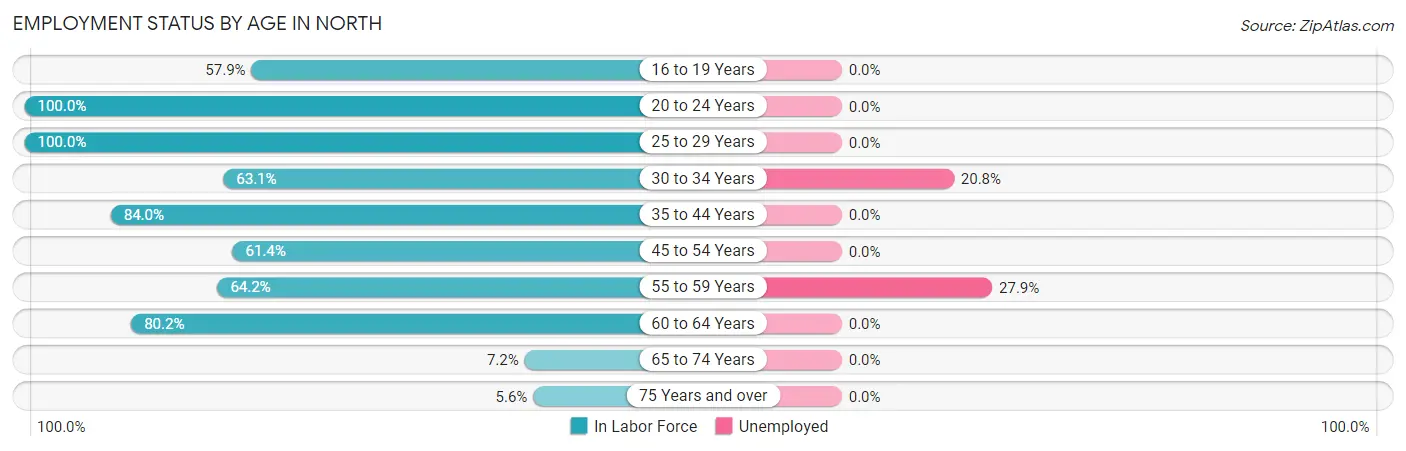
| Age Bracket | In Labor Force | Unemployed |
| 16 to 19 Years | 11 (57.9%) | 0 (0.0%) |
| 20 to 24 Years | 4 (100.0%) | 0 (0.0%) |
| 25 to 29 Years | 15 (100.0%) | 0 (0.0%) |
| 30 to 34 Years | 77 (63.1%) | 16 (20.8%) |
| 35 to 44 Years | 42 (84.0%) | 0 (0.0%) |
| 45 to 54 Years | 70 (61.4%) | 0 (0.0%) |
| 55 to 59 Years | 43 (64.2%) | 12 (27.9%) |
| 60 to 64 Years | 93 (80.2%) | 0 (0.0%) |
| 65 to 74 Years | 6 (7.2%) | 0 (0.0%) |
| 75 Years and over | 5 (5.6%) | 0 (0.0%) |
| Total | 366 (53.8%) | 28 (7.7%) |
Employment Status by Educational Attainment in North
According to labor force statistics for North, 70.2% of individuals (340) out of the total population between 25 and 64 years of age (484) are in the labor force, with 8.2% or 28 of them being unemployed. The group with the highest labor force participation rate are those with the educational attainment of bachelor's degree or higher, with 87.9% or 29 individuals in the labor force. Within the labor force, individuals with college / associate degree education have the highest percentage of unemployment, with 16.5% or 28 of them being unemployed.
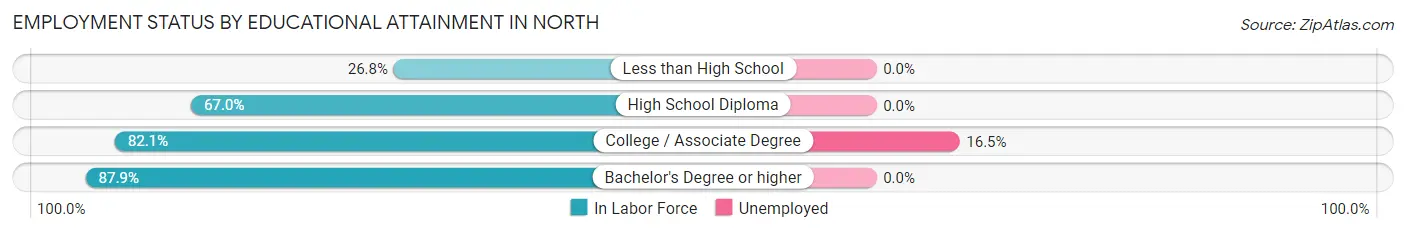
| Educational Attainment | In Labor Force | Unemployed |
| Less than High School | 15 (26.8%) | 0 (0.0%) |
| High School Diploma | 126 (67.0%) | 0 (0.0%) |
| College / Associate Degree | 170 (82.1%) | 34 (16.5%) |
| Bachelor's Degree or higher | 29 (87.9%) | 0 (0.0%) |
| Total | 340 (70.2%) | 40 (8.2%) |
Employment Occupations by Sex in North
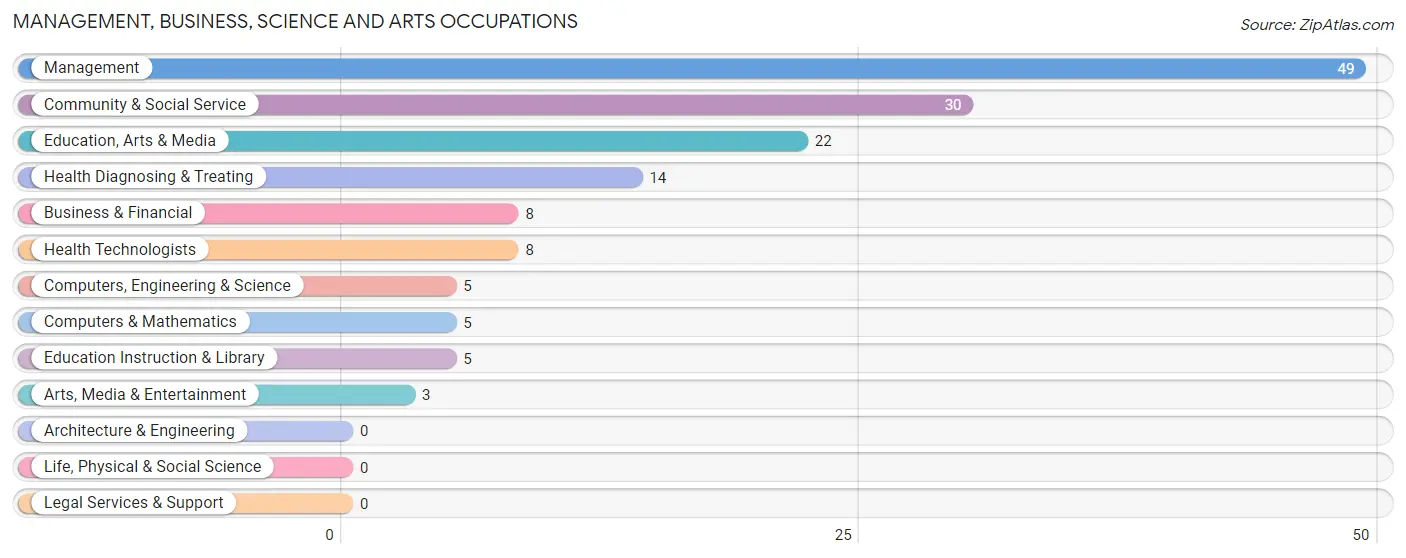
Management, Business, Science and Arts Occupations
The most common Management, Business, Science and Arts occupations in North are Management (49 | 14.5%), Community & Social Service (30 | 8.9%), Education, Arts & Media (22 | 6.5%), Health Diagnosing & Treating (14 | 4.1%), and Business & Financial (8 | 2.4%).
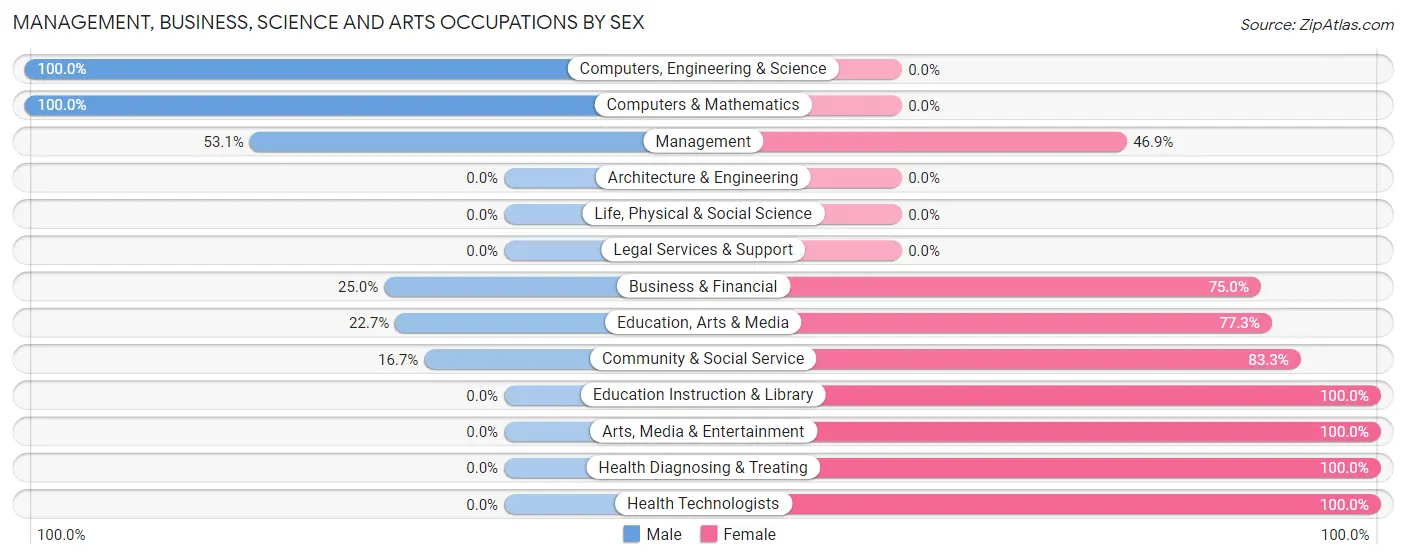
Management, Business, Science and Arts Occupations by Sex
Within the Management, Business, Science and Arts occupations in North, the most male-oriented occupations are Computers, Engineering & Science (100.0%), Computers & Mathematics (100.0%), and Management (53.1%), while the most female-oriented occupations are Education Instruction & Library (100.0%), Arts, Media & Entertainment (100.0%), and Health Diagnosing & Treating (100.0%).
| Occupation | Male | Female |
| Management | 26 (53.1%) | 23 (46.9%) |
| Business & Financial | 2 (25.0%) | 6 (75.0%) |
| Computers, Engineering & Science | 5 (100.0%) | 0 (0.0%) |
| Computers & Mathematics | 5 (100.0%) | 0 (0.0%) |
| Architecture & Engineering | 0 (0.0%) | 0 (0.0%) |
| Life, Physical & Social Science | 0 (0.0%) | 0 (0.0%) |
| Community & Social Service | 5 (16.7%) | 25 (83.3%) |
| Education, Arts & Media | 5 (22.7%) | 17 (77.3%) |
| Legal Services & Support | 0 (0.0%) | 0 (0.0%) |
| Education Instruction & Library | 0 (0.0%) | 5 (100.0%) |
| Arts, Media & Entertainment | 0 (0.0%) | 3 (100.0%) |
| Health Diagnosing & Treating | 0 (0.0%) | 14 (100.0%) |
| Health Technologists | 0 (0.0%) | 8 (100.0%) |
| Total (Category) | 38 (35.8%) | 68 (64.1%) |
| Total (Overall) | 192 (56.8%) | 146 (43.2%) |
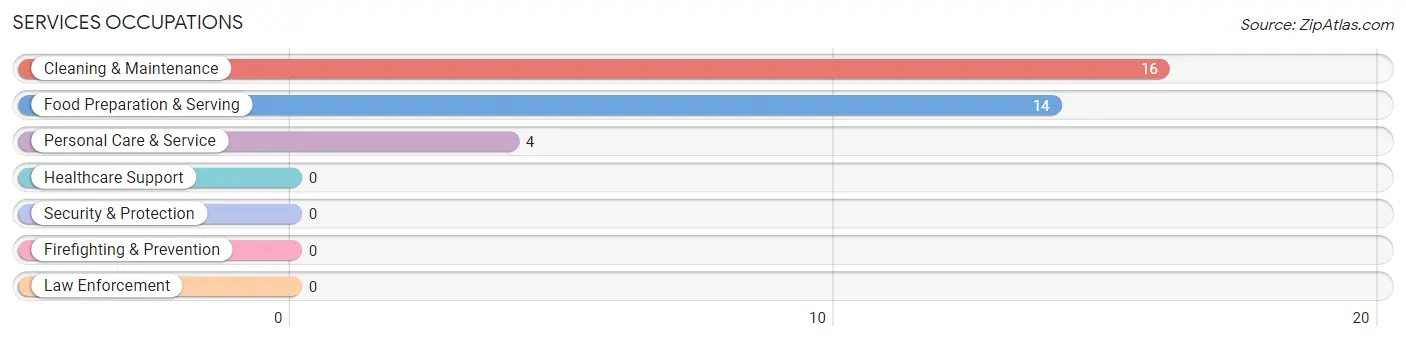
Services Occupations
The most common Services occupations in North are Cleaning & Maintenance (16 | 4.7%), Food Preparation & Serving (14 | 4.1%), and Personal Care & Service (4 | 1.2%).
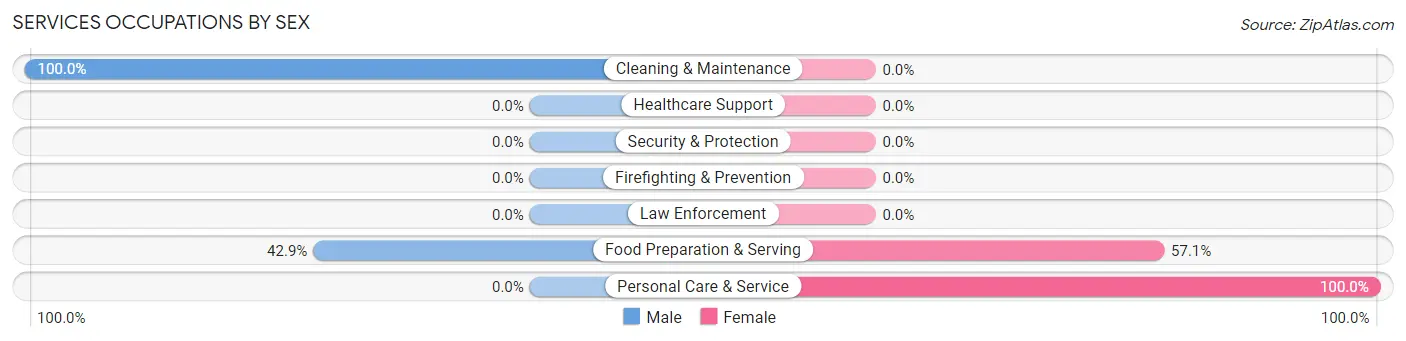
Services Occupations by Sex
Within the Services occupations in North, the most male-oriented occupations are Cleaning & Maintenance (100.0%), and Food Preparation & Serving (42.9%), while the most female-oriented occupations are Personal Care & Service (100.0%), and Food Preparation & Serving (57.1%).
| Occupation | Male | Female |
| Healthcare Support | 0 (0.0%) | 0 (0.0%) |
| Security & Protection | 0 (0.0%) | 0 (0.0%) |
| Firefighting & Prevention | 0 (0.0%) | 0 (0.0%) |
| Law Enforcement | 0 (0.0%) | 0 (0.0%) |
| Food Preparation & Serving | 6 (42.9%) | 8 (57.1%) |
| Cleaning & Maintenance | 16 (100.0%) | 0 (0.0%) |
| Personal Care & Service | 0 (0.0%) | 4 (100.0%) |
| Total (Category) | 22 (64.7%) | 12 (35.3%) |
| Total (Overall) | 192 (56.8%) | 146 (43.2%) |
Sales and Office Occupations
The most common Sales and Office occupations in North are Sales & Related (22 | 6.5%), and Office & Administration (11 | 3.3%).
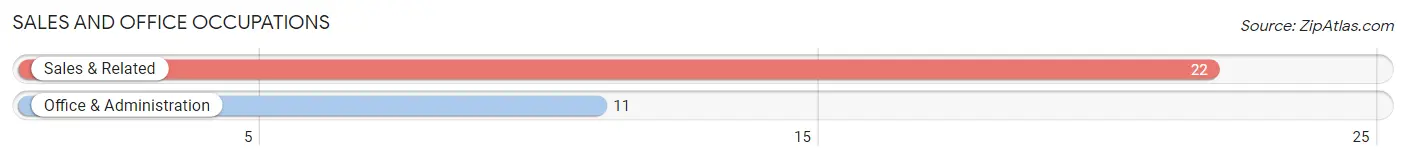
Sales and Office Occupations by Sex
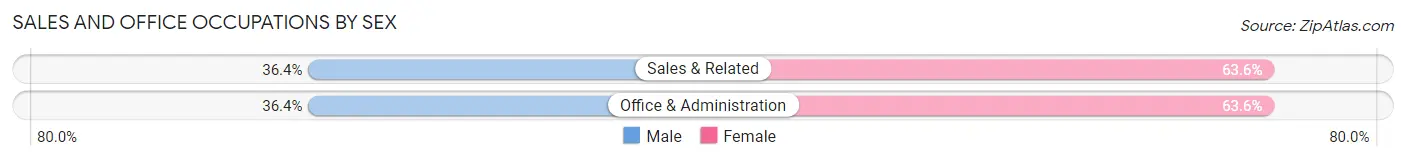
| Occupation | Male | Female |
| Sales & Related | 8 (36.4%) | 14 (63.6%) |
| Office & Administration | 4 (36.4%) | 7 (63.6%) |
| Total (Category) | 12 (36.4%) | 21 (63.6%) |
| Total (Overall) | 192 (56.8%) | 146 (43.2%) |
Natural Resources, Construction and Maintenance Occupations
The most common Natural Resources, Construction and Maintenance occupations in North are Installation, Maintenance & Repair (24 | 7.1%), Construction & Extraction (13 | 3.8%), and Farming, Fishing & Forestry (12 | 3.5%).
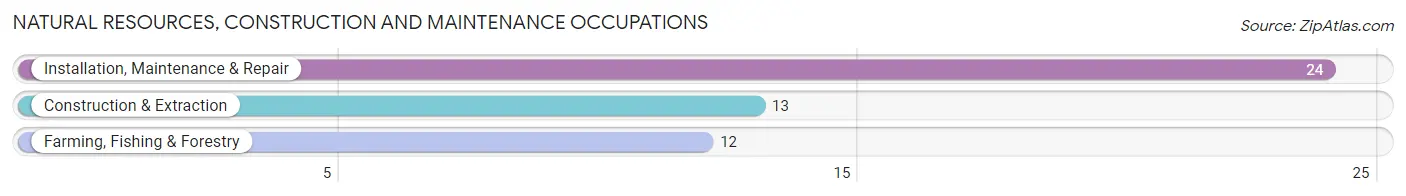
Natural Resources, Construction and Maintenance Occupations by Sex
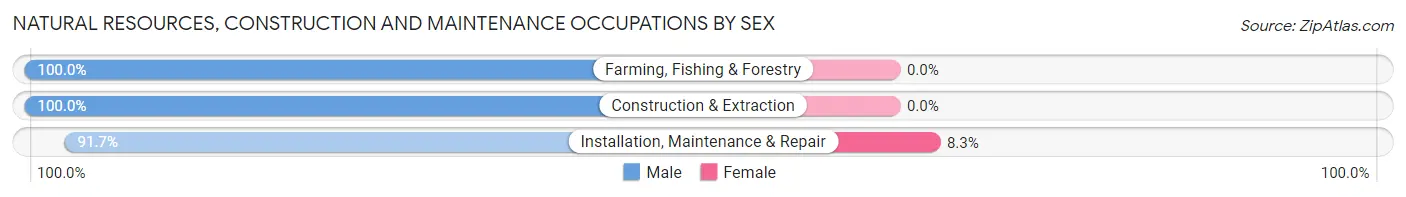
| Occupation | Male | Female |
| Farming, Fishing & Forestry | 12 (100.0%) | 0 (0.0%) |
| Construction & Extraction | 13 (100.0%) | 0 (0.0%) |
| Installation, Maintenance & Repair | 22 (91.7%) | 2 (8.3%) |
| Total (Category) | 47 (95.9%) | 2 (4.1%) |
| Total (Overall) | 192 (56.8%) | 146 (43.2%) |
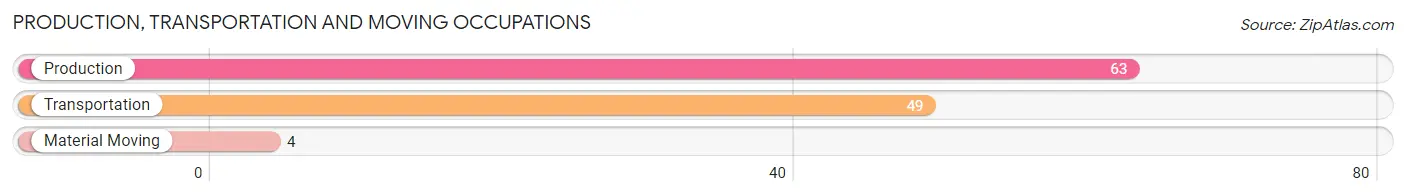
Production, Transportation and Moving Occupations
The most common Production, Transportation and Moving occupations in North are Production (63 | 18.6%), Transportation (49 | 14.5%), and Material Moving (4 | 1.2%).
Production, Transportation and Moving Occupations by Sex
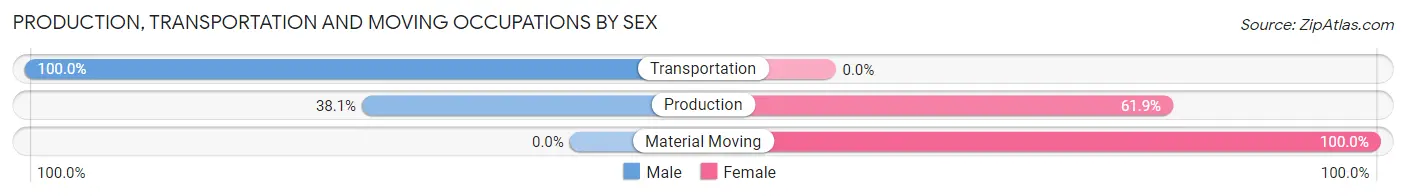
| Occupation | Male | Female |
| Production | 24 (38.1%) | 39 (61.9%) |
| Transportation | 49 (100.0%) | 0 (0.0%) |
| Material Moving | 0 (0.0%) | 4 (100.0%) |
| Total (Category) | 73 (62.9%) | 43 (37.1%) |
| Total (Overall) | 192 (56.8%) | 146 (43.2%) |
Employment Industries by Sex in North
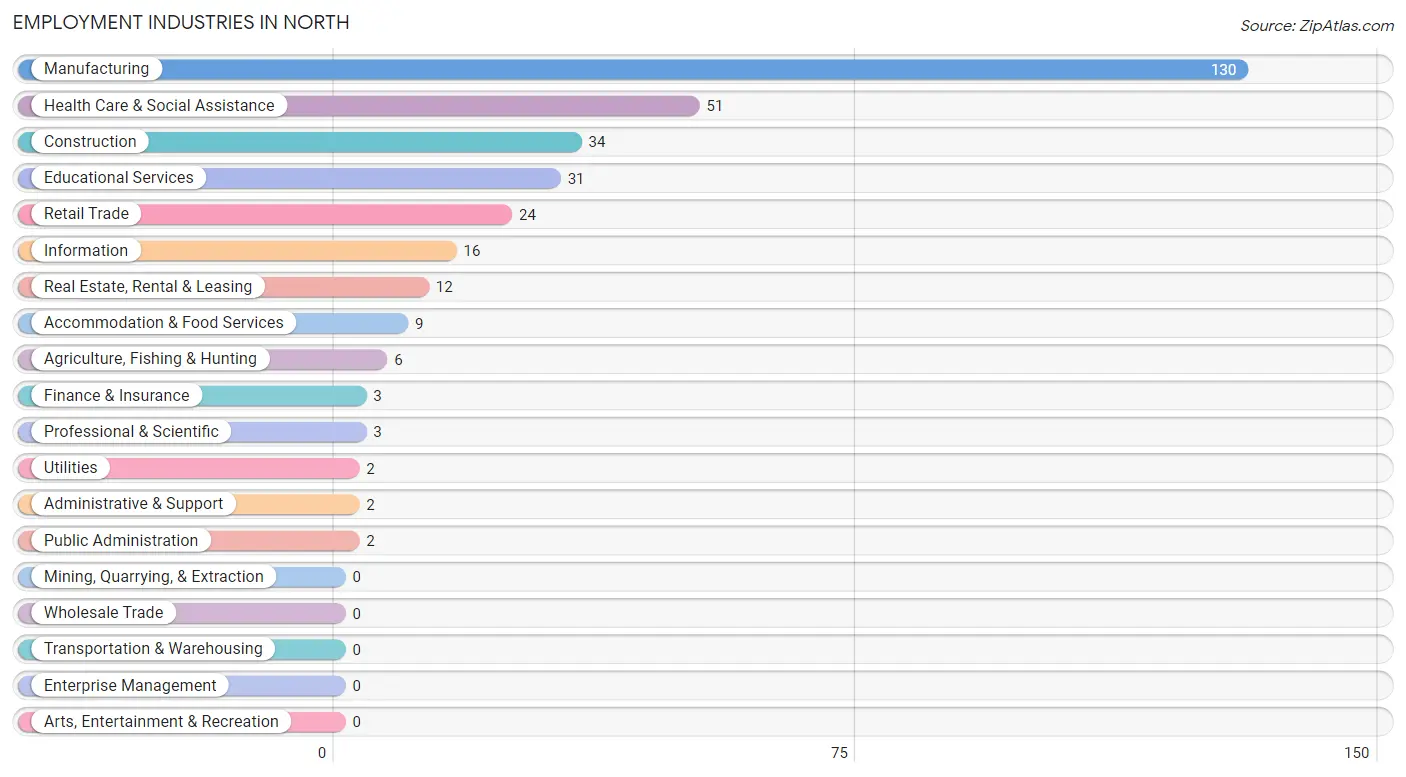
Employment Industries in North
The major employment industries in North include Manufacturing (130 | 38.5%), Health Care & Social Assistance (51 | 15.1%), Construction (34 | 10.1%), Educational Services (31 | 9.2%), and Retail Trade (24 | 7.1%).
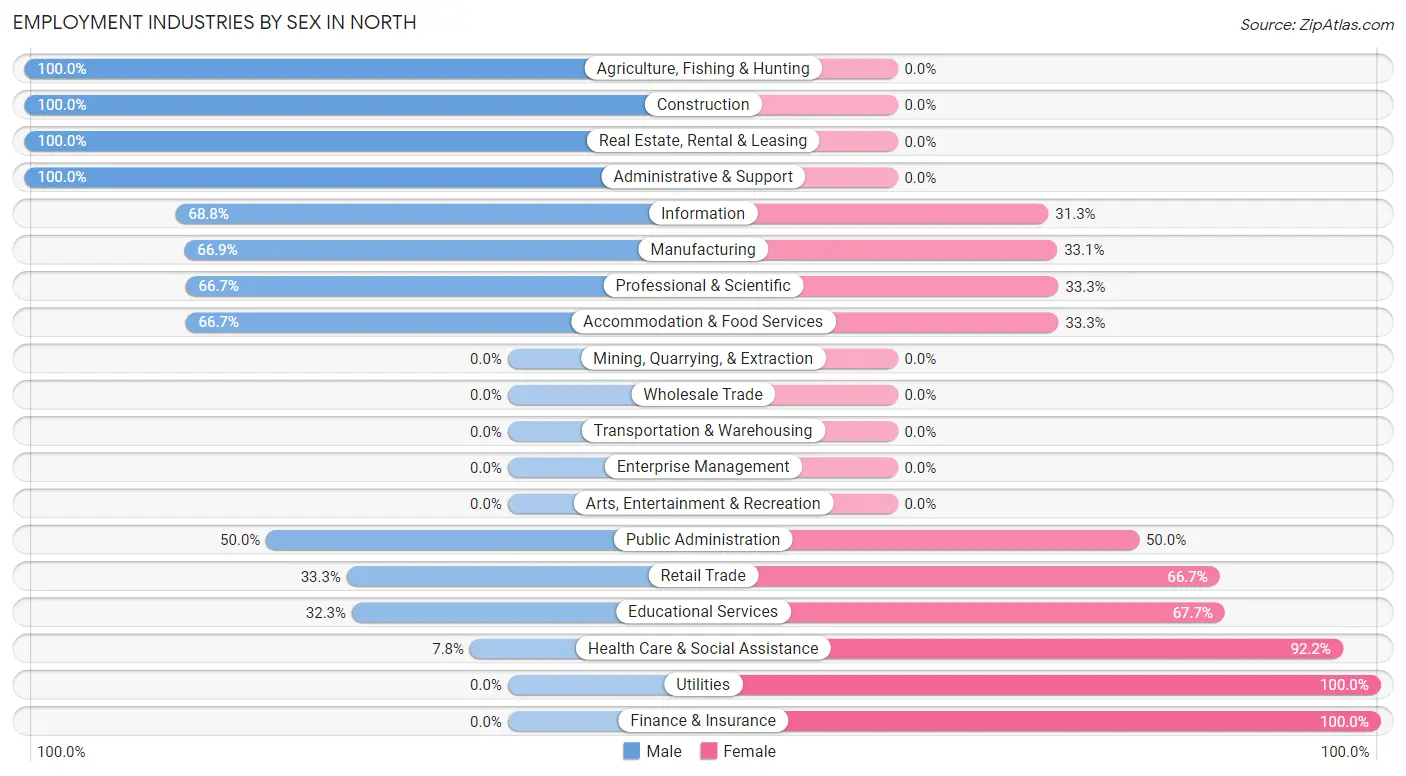
Employment Industries by Sex in North
The North industries that see more men than women are Agriculture, Fishing & Hunting (100.0%), Construction (100.0%), and Real Estate, Rental & Leasing (100.0%), whereas the industries that tend to have a higher number of women are Utilities (100.0%), Finance & Insurance (100.0%), and Health Care & Social Assistance (92.2%).
| Industry | Male | Female |
| Agriculture, Fishing & Hunting | 6 (100.0%) | 0 (0.0%) |
| Mining, Quarrying, & Extraction | 0 (0.0%) | 0 (0.0%) |
| Construction | 34 (100.0%) | 0 (0.0%) |
| Manufacturing | 87 (66.9%) | 43 (33.1%) |
| Wholesale Trade | 0 (0.0%) | 0 (0.0%) |
| Retail Trade | 8 (33.3%) | 16 (66.7%) |
| Transportation & Warehousing | 0 (0.0%) | 0 (0.0%) |
| Utilities | 0 (0.0%) | 2 (100.0%) |
| Information | 11 (68.8%) | 5 (31.2%) |
| Finance & Insurance | 0 (0.0%) | 3 (100.0%) |
| Real Estate, Rental & Leasing | 12 (100.0%) | 0 (0.0%) |
| Professional & Scientific | 2 (66.7%) | 1 (33.3%) |
| Enterprise Management | 0 (0.0%) | 0 (0.0%) |
| Administrative & Support | 2 (100.0%) | 0 (0.0%) |
| Educational Services | 10 (32.3%) | 21 (67.7%) |
| Health Care & Social Assistance | 4 (7.8%) | 47 (92.2%) |
| Arts, Entertainment & Recreation | 0 (0.0%) | 0 (0.0%) |
| Accommodation & Food Services | 6 (66.7%) | 3 (33.3%) |
| Public Administration | 1 (50.0%) | 1 (50.0%) |
| Total | 192 (56.8%) | 146 (43.2%) |
Education in North
School Enrollment in North
The most common levels of schooling among the 213 students in North are middle school (92 | 43.2%), elementary school (78 | 36.6%), and kindergarten (18 | 8.5%).
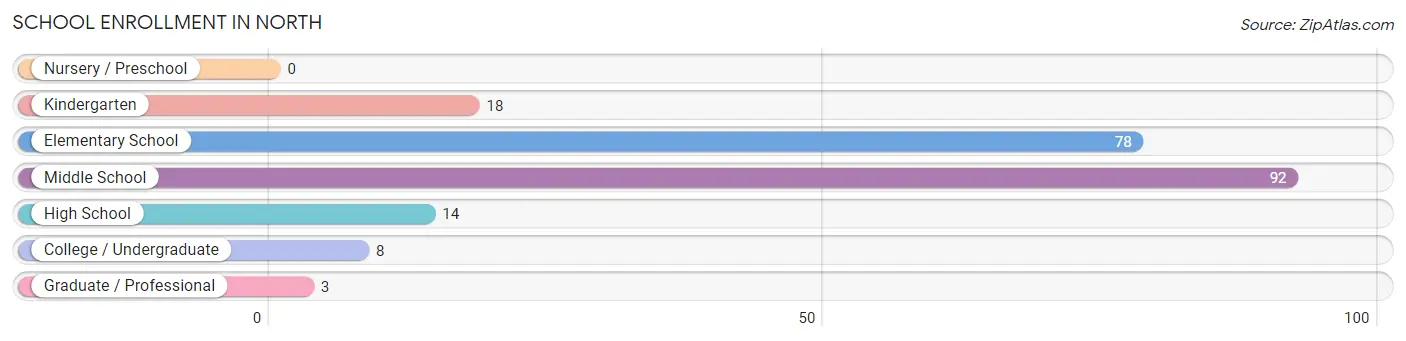
| School Level | # Students | % Students |
| Nursery / Preschool | 0 | 0.0% |
| Kindergarten | 18 | 8.5% |
| Elementary School | 78 | 36.6% |
| Middle School | 92 | 43.2% |
| High School | 14 | 6.6% |
| College / Undergraduate | 8 | 3.8% |
| Graduate / Professional | 3 | 1.4% |
| Total | 213 | 100.0% |
School Enrollment by Age by Funding Source in North
Out of a total of 213 students who are enrolled in schools in North, 18 (8.5%) attend a private institution, while the remaining 195 (91.5%) are enrolled in public schools. The age group of 15 to 17 year olds has the highest likelihood of being enrolled in private schools, with 7 (58.3% in the age bracket) enrolled. Conversely, the age group of 18 to 19 year olds has the lowest likelihood of being enrolled in a private school, with 3 (100.0% in the age bracket) attending a public institution.
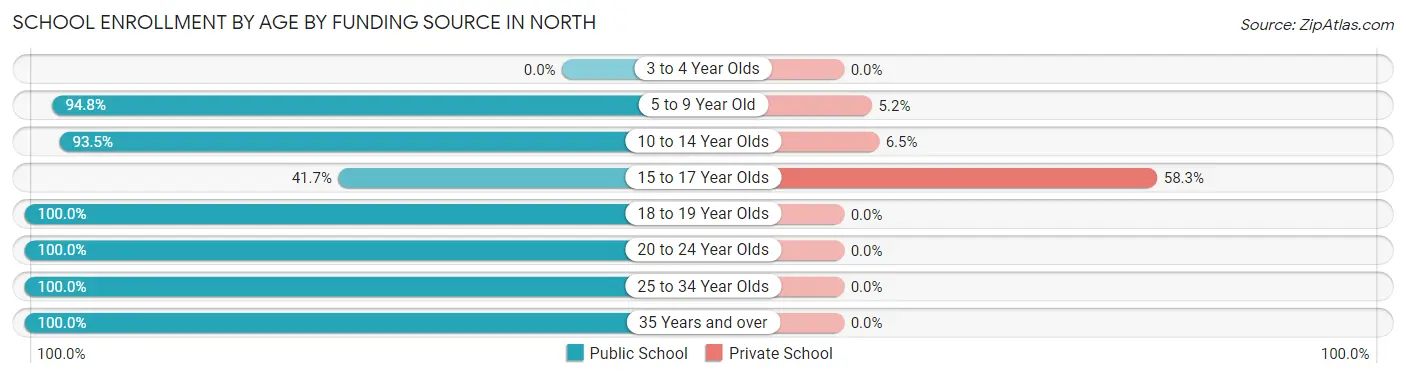
| Age Bracket | Public School | Private School |
| 3 to 4 Year Olds | 0 (0.0%) | 0 (0.0%) |
| 5 to 9 Year Old | 91 (94.8%) | 5 (5.2%) |
| 10 to 14 Year Olds | 86 (93.5%) | 6 (6.5%) |
| 15 to 17 Year Olds | 5 (41.7%) | 7 (58.3%) |
| 18 to 19 Year Olds | 3 (100.0%) | 0 (0.0%) |
| 20 to 24 Year Olds | 1 (100.0%) | 0 (0.0%) |
| 25 to 34 Year Olds | 2 (100.0%) | 0 (0.0%) |
| 35 Years and over | 7 (100.0%) | 0 (0.0%) |
| Total | 195 (91.5%) | 18 (8.5%) |
Educational Attainment by Field of Study in North
Science & technology (13 | 29.5%), liberal arts & history (9 | 20.4%), business (6 | 13.6%), arts & humanities (6 | 13.6%), and education (3 | 6.8%) are the most common fields of study among 44 individuals in North who have obtained a bachelor's degree or higher.
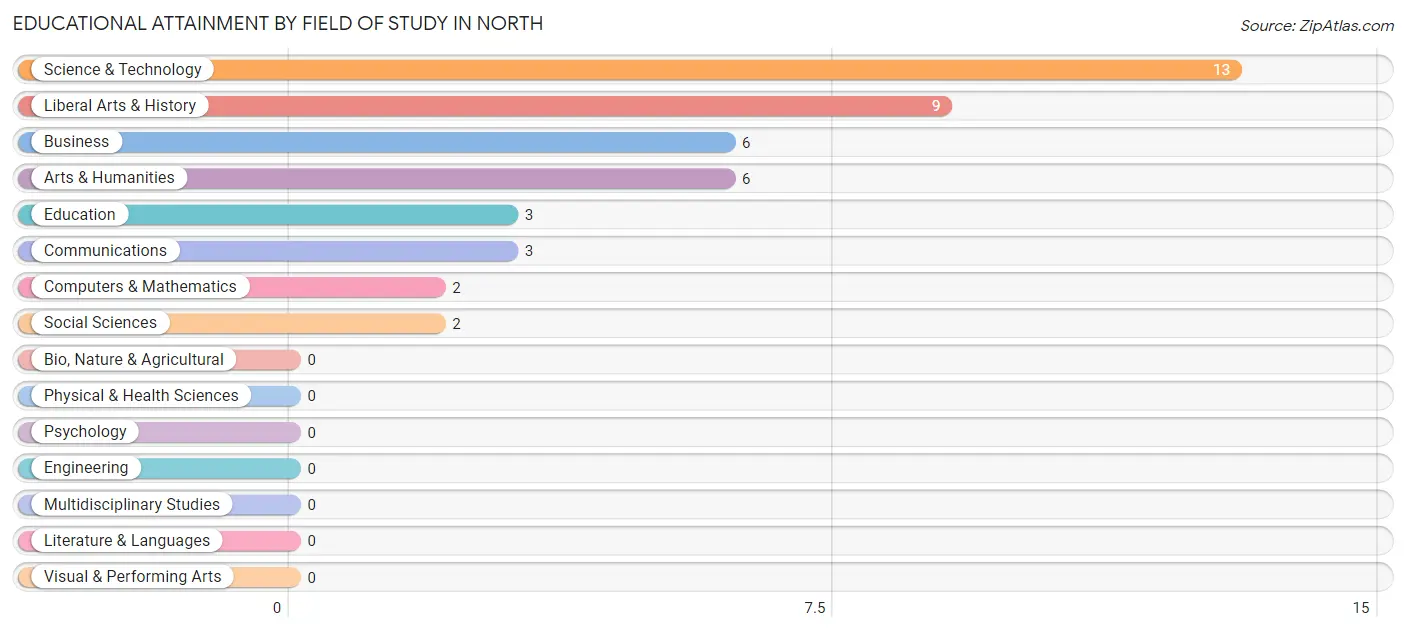
| Field of Study | # Graduates | % Graduates |
| Computers & Mathematics | 2 | 4.5% |
| Bio, Nature & Agricultural | 0 | 0.0% |
| Physical & Health Sciences | 0 | 0.0% |
| Psychology | 0 | 0.0% |
| Social Sciences | 2 | 4.5% |
| Engineering | 0 | 0.0% |
| Multidisciplinary Studies | 0 | 0.0% |
| Science & Technology | 13 | 29.5% |
| Business | 6 | 13.6% |
| Education | 3 | 6.8% |
| Literature & Languages | 0 | 0.0% |
| Liberal Arts & History | 9 | 20.4% |
| Visual & Performing Arts | 0 | 0.0% |
| Communications | 3 | 6.8% |
| Arts & Humanities | 6 | 13.6% |
| Total | 44 | 100.0% |
Transportation & Commute in North
Vehicle Availability by Sex in North
The most prevalent vehicle ownership categories in North are males with 2 vehicles (105, accounting for 57.1%) and females with 2 vehicles (58, making up 71.9%).
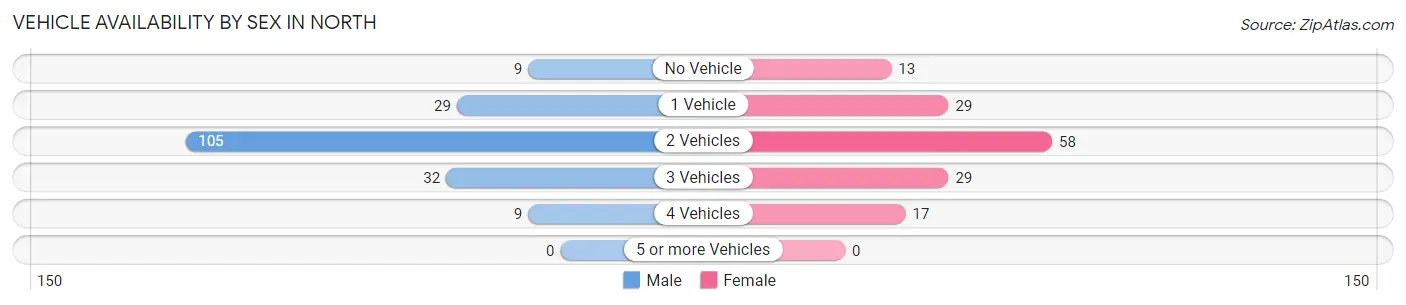
| Vehicles Available | Male | Female |
| No Vehicle | 9 (4.9%) | 13 (8.9%) |
| 1 Vehicle | 29 (15.8%) | 29 (19.9%) |
| 2 Vehicles | 105 (57.1%) | 58 (39.7%) |
| 3 Vehicles | 32 (17.4%) | 29 (19.9%) |
| 4 Vehicles | 9 (4.9%) | 17 (11.6%) |
| 5 or more Vehicles | 0 (0.0%) | 0 (0.0%) |
| Total | 184 (100.0%) | 146 (100.0%) |
Commute Time in North
The most frequently occuring commute durations in North are 45 to 59 minutes (67 commuters, 20.3%), 20 to 24 minutes (65 commuters, 19.7%), and 40 to 44 minutes (40 commuters, 12.1%).
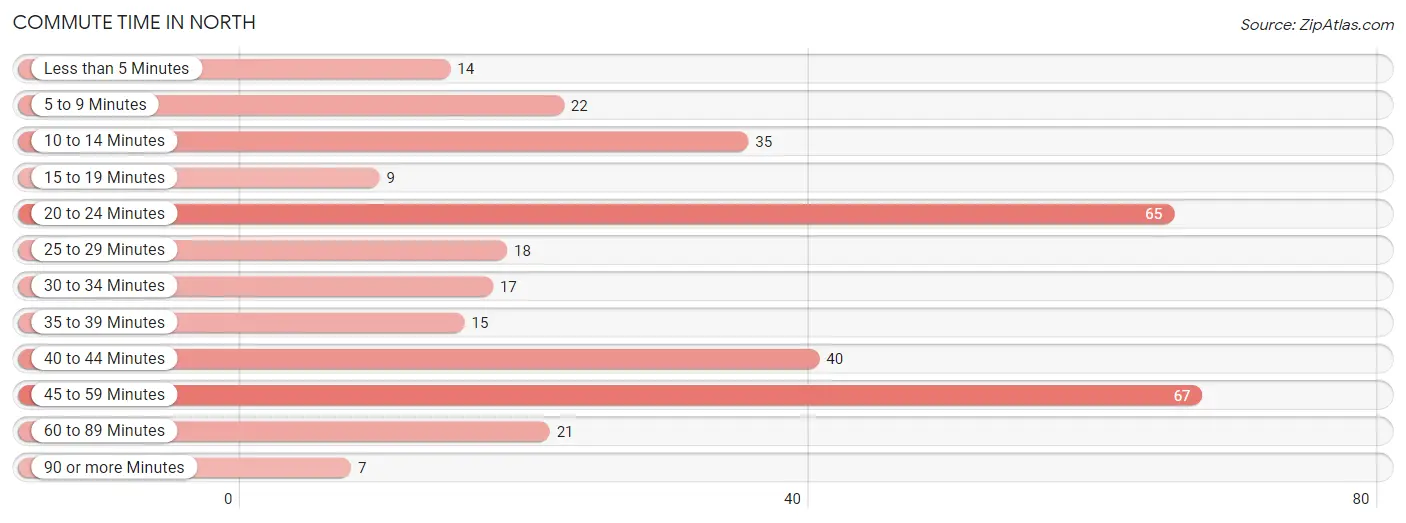
| Commute Time | # Commuters | % Commuters |
| Less than 5 Minutes | 14 | 4.2% |
| 5 to 9 Minutes | 22 | 6.7% |
| 10 to 14 Minutes | 35 | 10.6% |
| 15 to 19 Minutes | 9 | 2.7% |
| 20 to 24 Minutes | 65 | 19.7% |
| 25 to 29 Minutes | 18 | 5.4% |
| 30 to 34 Minutes | 17 | 5.1% |
| 35 to 39 Minutes | 15 | 4.5% |
| 40 to 44 Minutes | 40 | 12.1% |
| 45 to 59 Minutes | 67 | 20.3% |
| 60 to 89 Minutes | 21 | 6.4% |
| 90 or more Minutes | 7 | 2.1% |
Commute Time by Sex in North
The most common commute times in North are 20 to 24 minutes (53 commuters, 28.8%) for males and 45 to 59 minutes (52 commuters, 35.6%) for females.
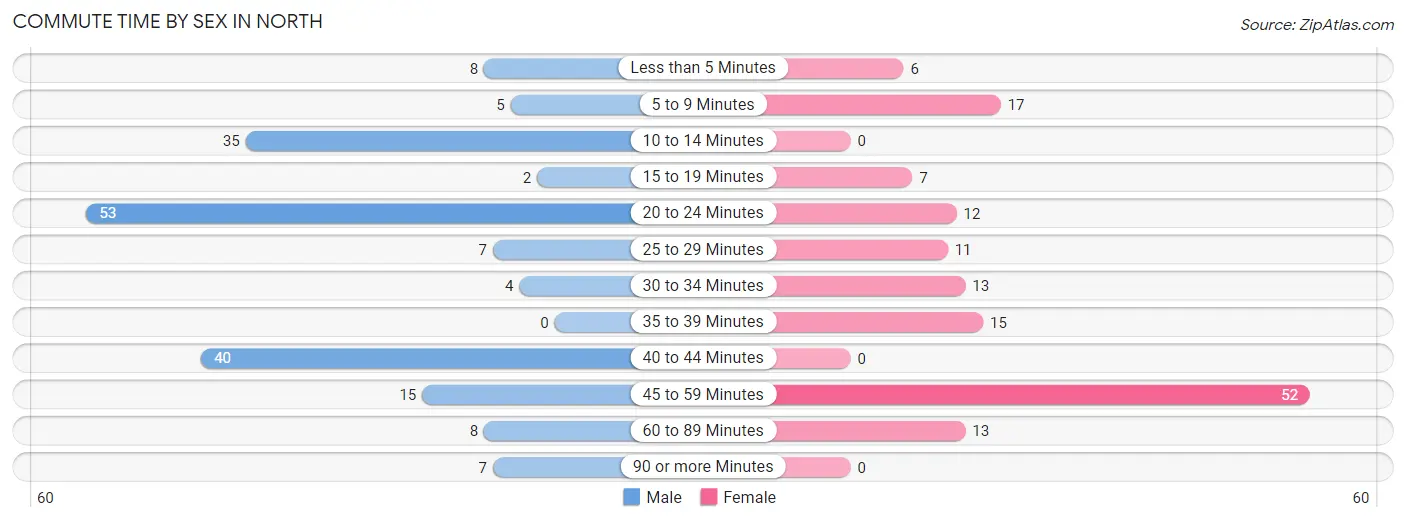
| Commute Time | Male | Female |
| Less than 5 Minutes | 8 (4.3%) | 6 (4.1%) |
| 5 to 9 Minutes | 5 (2.7%) | 17 (11.6%) |
| 10 to 14 Minutes | 35 (19.0%) | 0 (0.0%) |
| 15 to 19 Minutes | 2 (1.1%) | 7 (4.8%) |
| 20 to 24 Minutes | 53 (28.8%) | 12 (8.2%) |
| 25 to 29 Minutes | 7 (3.8%) | 11 (7.5%) |
| 30 to 34 Minutes | 4 (2.2%) | 13 (8.9%) |
| 35 to 39 Minutes | 0 (0.0%) | 15 (10.3%) |
| 40 to 44 Minutes | 40 (21.7%) | 0 (0.0%) |
| 45 to 59 Minutes | 15 (8.2%) | 52 (35.6%) |
| 60 to 89 Minutes | 8 (4.3%) | 13 (8.9%) |
| 90 or more Minutes | 7 (3.8%) | 0 (0.0%) |
Time of Departure to Work by Sex in North
The most frequent times of departure to work in North are 6:30 AM to 6:59 AM (53, 28.8%) for males and 6:00 AM to 6:29 AM (76, 52.0%) for females.
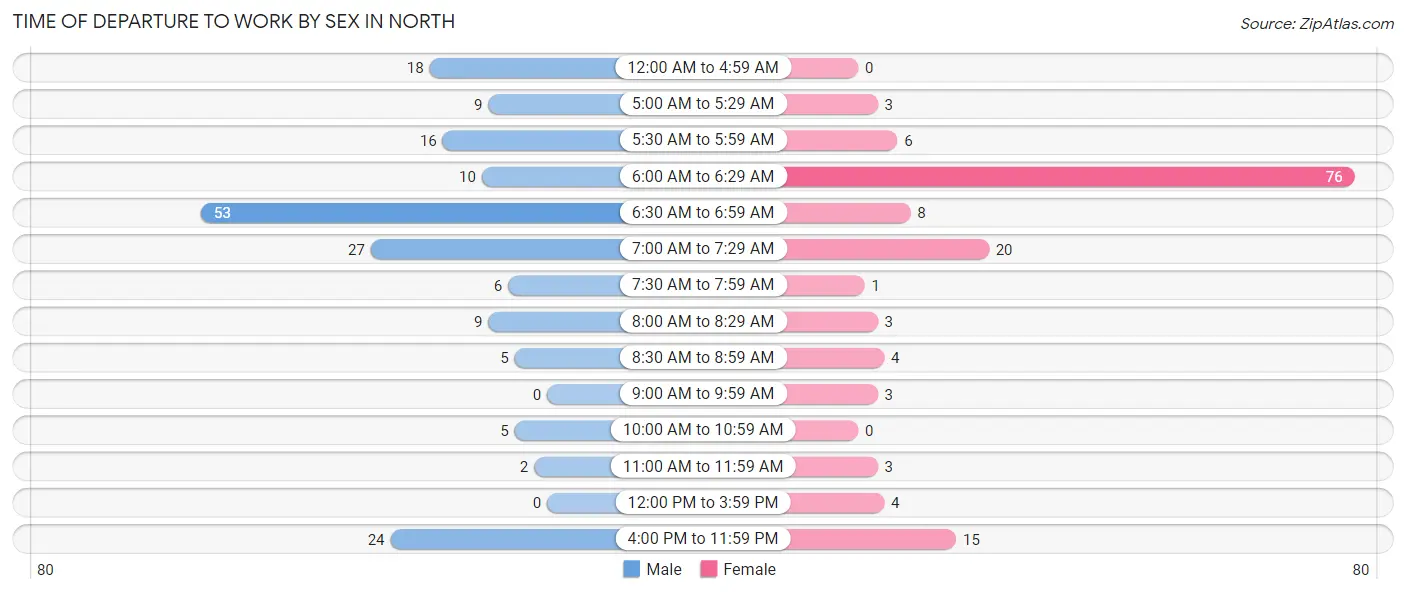
| Time of Departure | Male | Female |
| 12:00 AM to 4:59 AM | 18 (9.8%) | 0 (0.0%) |
| 5:00 AM to 5:29 AM | 9 (4.9%) | 3 (2.1%) |
| 5:30 AM to 5:59 AM | 16 (8.7%) | 6 (4.1%) |
| 6:00 AM to 6:29 AM | 10 (5.4%) | 76 (52.0%) |
| 6:30 AM to 6:59 AM | 53 (28.8%) | 8 (5.5%) |
| 7:00 AM to 7:29 AM | 27 (14.7%) | 20 (13.7%) |
| 7:30 AM to 7:59 AM | 6 (3.3%) | 1 (0.7%) |
| 8:00 AM to 8:29 AM | 9 (4.9%) | 3 (2.1%) |
| 8:30 AM to 8:59 AM | 5 (2.7%) | 4 (2.7%) |
| 9:00 AM to 9:59 AM | 0 (0.0%) | 3 (2.1%) |
| 10:00 AM to 10:59 AM | 5 (2.7%) | 0 (0.0%) |
| 11:00 AM to 11:59 AM | 2 (1.1%) | 3 (2.1%) |
| 12:00 PM to 3:59 PM | 0 (0.0%) | 4 (2.7%) |
| 4:00 PM to 11:59 PM | 24 (13.0%) | 15 (10.3%) |
| Total | 184 (100.0%) | 146 (100.0%) |
Housing Occupancy in North
Occupancy by Ownership in North
Of the total 355 dwellings in North, owner-occupied units account for 216 (60.9%), while renter-occupied units make up 139 (39.2%).
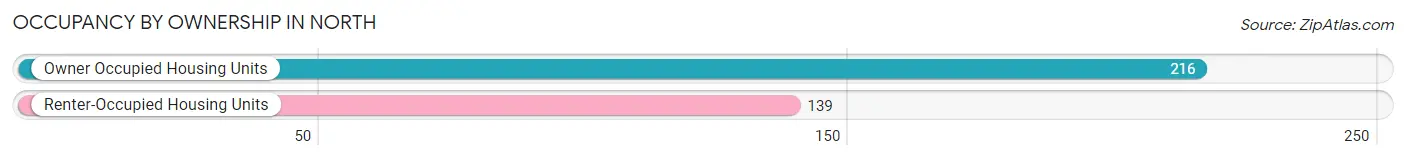
| Occupancy | # Housing Units | % Housing Units |
| Owner Occupied Housing Units | 216 | 60.9% |
| Renter-Occupied Housing Units | 139 | 39.2% |
| Total Occupied Housing Units | 355 | 100.0% |
Occupancy by Household Size in North
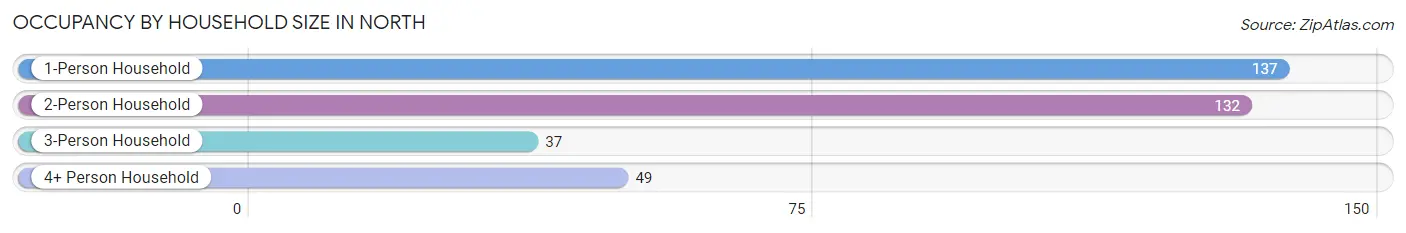
| Household Size | # Housing Units | % Housing Units |
| 1-Person Household | 137 | 38.6% |
| 2-Person Household | 132 | 37.2% |
| 3-Person Household | 37 | 10.4% |
| 4+ Person Household | 49 | 13.8% |
| Total Housing Units | 355 | 100.0% |
Occupancy by Ownership by Household Size in North
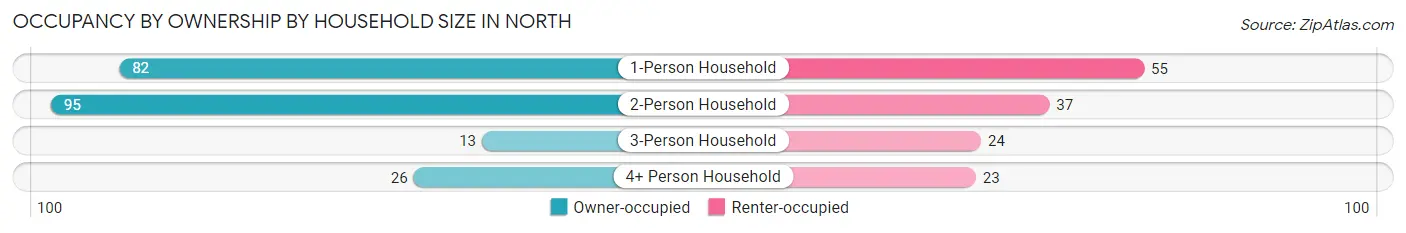
| Household Size | Owner-occupied | Renter-occupied |
| 1-Person Household | 82 (59.9%) | 55 (40.2%) |
| 2-Person Household | 95 (72.0%) | 37 (28.0%) |
| 3-Person Household | 13 (35.1%) | 24 (64.9%) |
| 4+ Person Household | 26 (53.1%) | 23 (46.9%) |
| Total Housing Units | 216 (60.9%) | 139 (39.2%) |
Occupancy by Educational Attainment in North
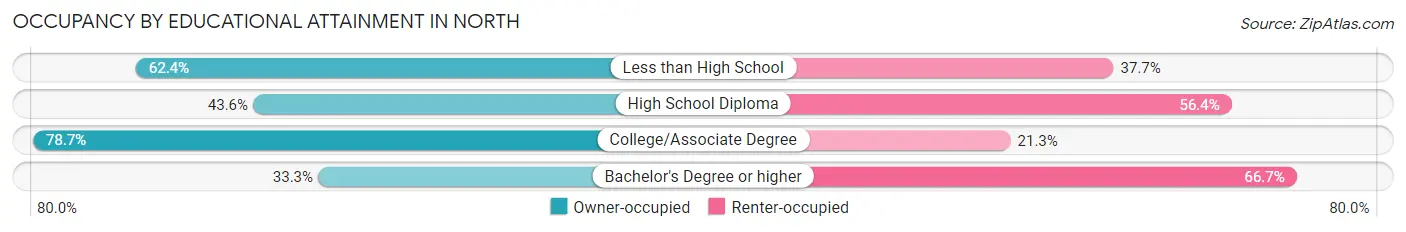
| Household Size | Owner-occupied | Renter-occupied |
| Less than High School | 53 (62.4%) | 32 (37.7%) |
| High School Diploma | 48 (43.6%) | 62 (56.4%) |
| College/Associate Degree | 107 (78.7%) | 29 (21.3%) |
| Bachelor's Degree or higher | 8 (33.3%) | 16 (66.7%) |
Occupancy by Age of Householder in North
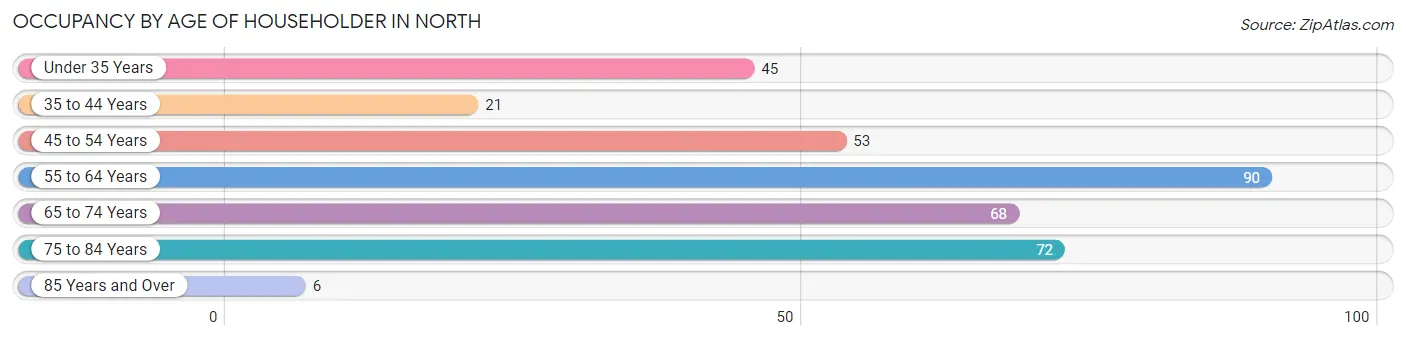
| Age Bracket | # Households | % Households |
| Under 35 Years | 45 | 12.7% |
| 35 to 44 Years | 21 | 5.9% |
| 45 to 54 Years | 53 | 14.9% |
| 55 to 64 Years | 90 | 25.4% |
| 65 to 74 Years | 68 | 19.2% |
| 75 to 84 Years | 72 | 20.3% |
| 85 Years and Over | 6 | 1.7% |
| Total | 355 | 100.0% |
Housing Finances in North
Median Income by Occupancy in North
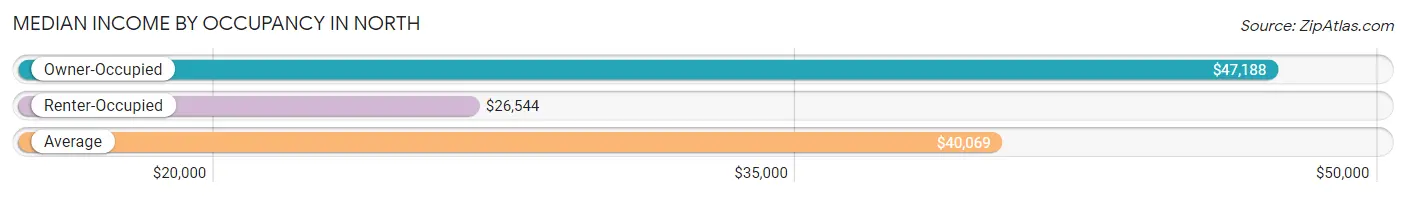
| Occupancy Type | # Households | Median Income |
| Owner-Occupied | 216 (60.9%) | $47,188 |
| Renter-Occupied | 139 (39.2%) | $26,544 |
| Average | 355 (100.0%) | $40,069 |
Occupancy by Householder Income Bracket in North
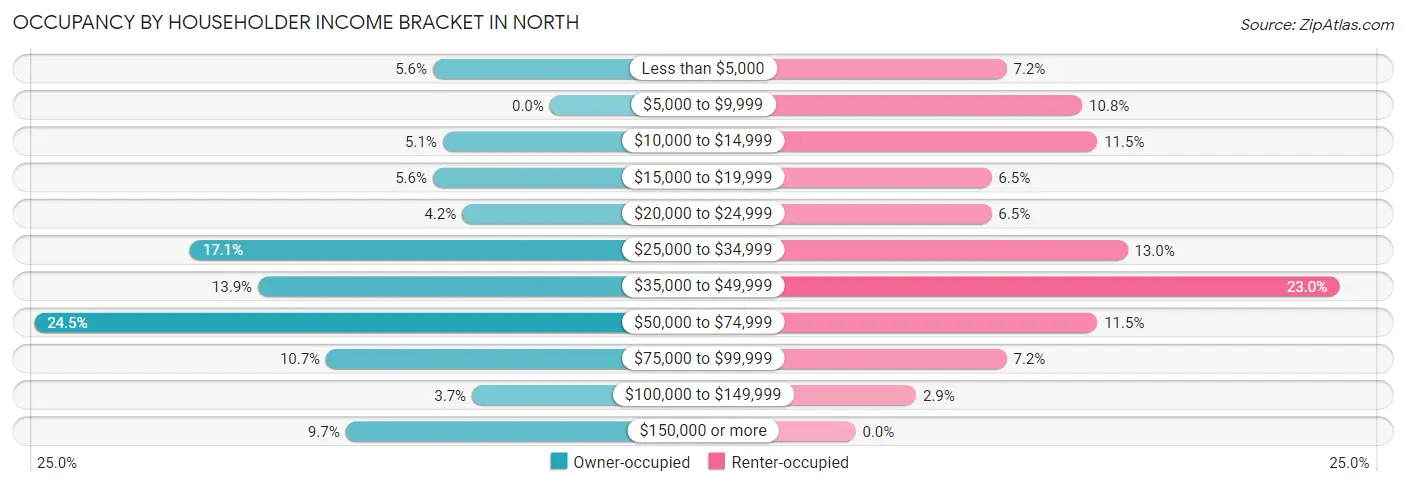
| Income Bracket | Owner-occupied | Renter-occupied |
| Less than $5,000 | 12 (5.6%) | 10 (7.2%) |
| $5,000 to $9,999 | 0 (0.0%) | 15 (10.8%) |
| $10,000 to $14,999 | 11 (5.1%) | 16 (11.5%) |
| $15,000 to $19,999 | 12 (5.6%) | 9 (6.5%) |
| $20,000 to $24,999 | 9 (4.2%) | 9 (6.5%) |
| $25,000 to $34,999 | 37 (17.1%) | 18 (13.0%) |
| $35,000 to $49,999 | 30 (13.9%) | 32 (23.0%) |
| $50,000 to $74,999 | 53 (24.5%) | 16 (11.5%) |
| $75,000 to $99,999 | 23 (10.6%) | 10 (7.2%) |
| $100,000 to $149,999 | 8 (3.7%) | 4 (2.9%) |
| $150,000 or more | 21 (9.7%) | 0 (0.0%) |
| Total | 216 (100.0%) | 139 (100.0%) |
Monthly Housing Cost Tiers in North
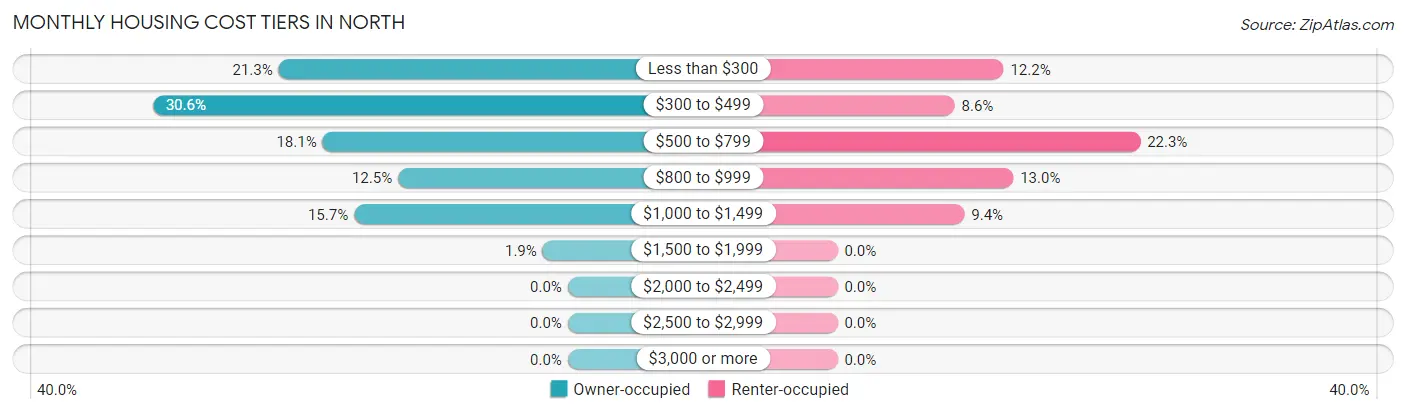
| Monthly Cost | Owner-occupied | Renter-occupied |
| Less than $300 | 46 (21.3%) | 17 (12.2%) |
| $300 to $499 | 66 (30.6%) | 12 (8.6%) |
| $500 to $799 | 39 (18.1%) | 31 (22.3%) |
| $800 to $999 | 27 (12.5%) | 18 (13.0%) |
| $1,000 to $1,499 | 34 (15.7%) | 13 (9.3%) |
| $1,500 to $1,999 | 4 (1.8%) | 0 (0.0%) |
| $2,000 to $2,499 | 0 (0.0%) | 0 (0.0%) |
| $2,500 to $2,999 | 0 (0.0%) | 0 (0.0%) |
| $3,000 or more | 0 (0.0%) | 0 (0.0%) |
| Total | 216 (100.0%) | 139 (100.0%) |
Physical Housing Characteristics in North
Housing Structures in North
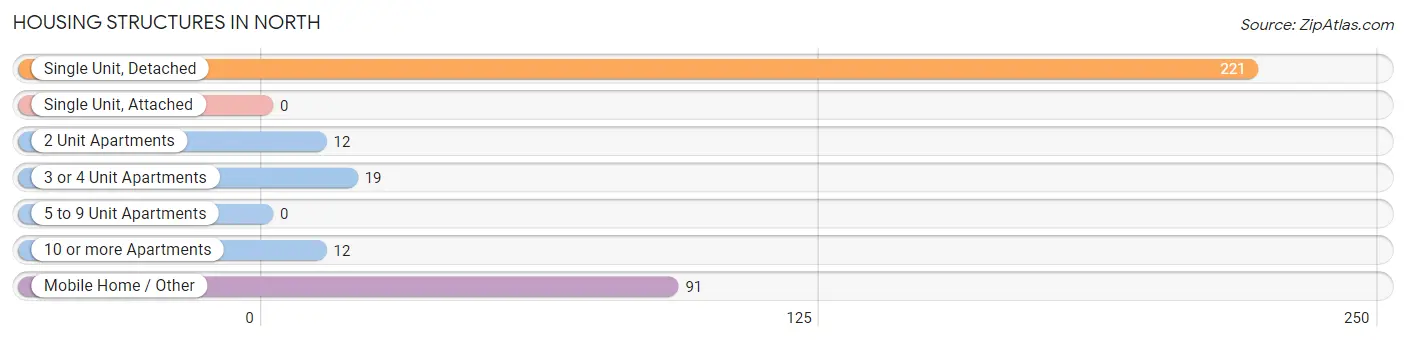
| Structure Type | # Housing Units | % Housing Units |
| Single Unit, Detached | 221 | 62.3% |
| Single Unit, Attached | 0 | 0.0% |
| 2 Unit Apartments | 12 | 3.4% |
| 3 or 4 Unit Apartments | 19 | 5.3% |
| 5 to 9 Unit Apartments | 0 | 0.0% |
| 10 or more Apartments | 12 | 3.4% |
| Mobile Home / Other | 91 | 25.6% |
| Total | 355 | 100.0% |
Housing Structures by Occupancy in North
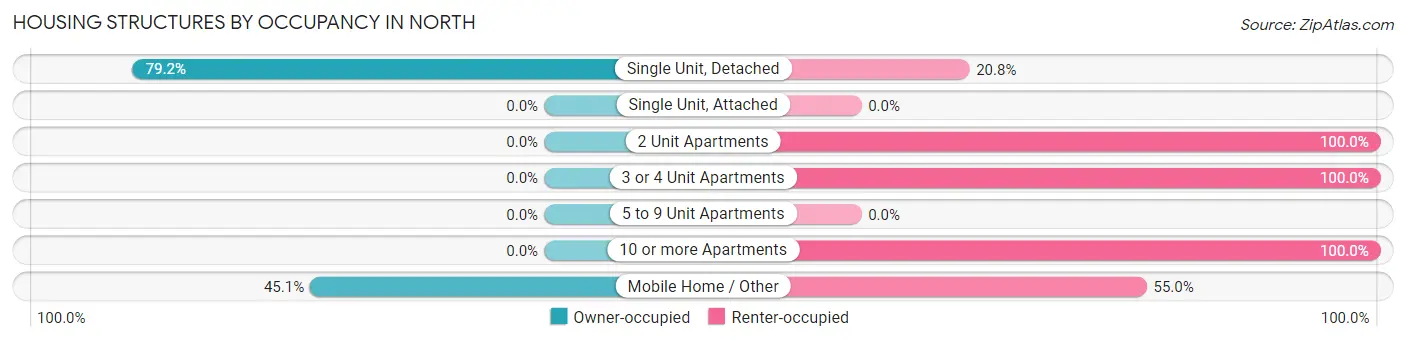
| Structure Type | Owner-occupied | Renter-occupied |
| Single Unit, Detached | 175 (79.2%) | 46 (20.8%) |
| Single Unit, Attached | 0 (0.0%) | 0 (0.0%) |
| 2 Unit Apartments | 0 (0.0%) | 12 (100.0%) |
| 3 or 4 Unit Apartments | 0 (0.0%) | 19 (100.0%) |
| 5 to 9 Unit Apartments | 0 (0.0%) | 0 (0.0%) |
| 10 or more Apartments | 0 (0.0%) | 12 (100.0%) |
| Mobile Home / Other | 41 (45.1%) | 50 (54.9%) |
| Total | 216 (60.9%) | 139 (39.2%) |
Housing Structures by Number of Rooms in North
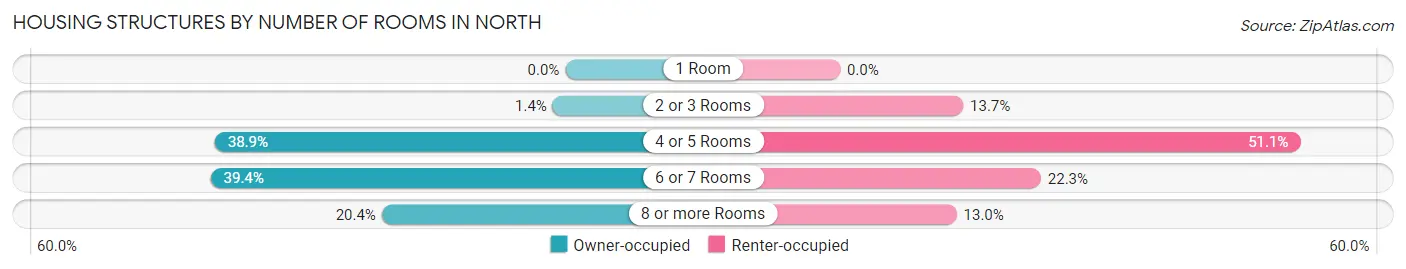
| Number of Rooms | Owner-occupied | Renter-occupied |
| 1 Room | 0 (0.0%) | 0 (0.0%) |
| 2 or 3 Rooms | 3 (1.4%) | 19 (13.7%) |
| 4 or 5 Rooms | 84 (38.9%) | 71 (51.1%) |
| 6 or 7 Rooms | 85 (39.4%) | 31 (22.3%) |
| 8 or more Rooms | 44 (20.4%) | 18 (13.0%) |
| Total | 216 (100.0%) | 139 (100.0%) |
Housing Structure by Heating Type in North
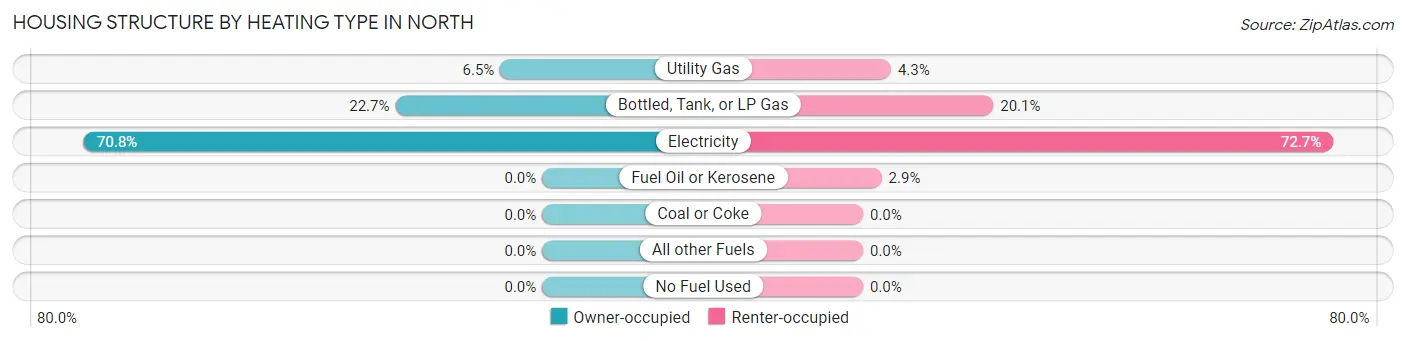
| Heating Type | Owner-occupied | Renter-occupied |
| Utility Gas | 14 (6.5%) | 6 (4.3%) |
| Bottled, Tank, or LP Gas | 49 (22.7%) | 28 (20.1%) |
| Electricity | 153 (70.8%) | 101 (72.7%) |
| Fuel Oil or Kerosene | 0 (0.0%) | 4 (2.9%) |
| Coal or Coke | 0 (0.0%) | 0 (0.0%) |
| All other Fuels | 0 (0.0%) | 0 (0.0%) |
| No Fuel Used | 0 (0.0%) | 0 (0.0%) |
| Total | 216 (100.0%) | 139 (100.0%) |
Household Vehicle Usage in North
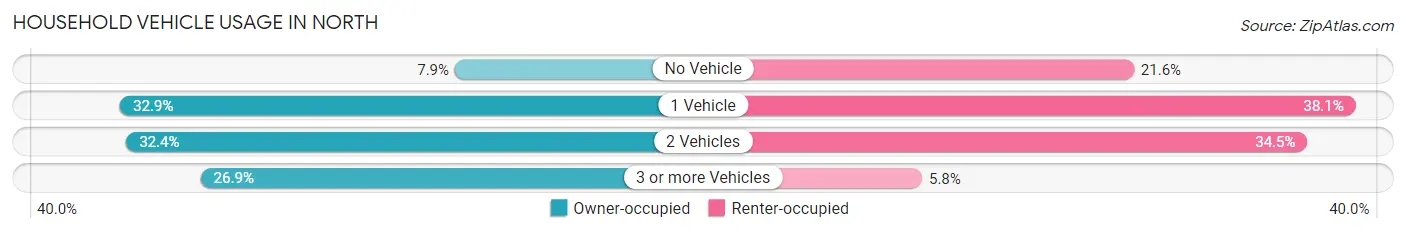
| Vehicles per Household | Owner-occupied | Renter-occupied |
| No Vehicle | 17 (7.9%) | 30 (21.6%) |
| 1 Vehicle | 71 (32.9%) | 53 (38.1%) |
| 2 Vehicles | 70 (32.4%) | 48 (34.5%) |
| 3 or more Vehicles | 58 (26.9%) | 8 (5.8%) |
| Total | 216 (100.0%) | 139 (100.0%) |
Real Estate & Mortgages in North
Real Estate and Mortgage Overview in North
| Characteristic | Without Mortgage | With Mortgage |
| Housing Units | 155 | 61 |
| Median Property Value | - | - |
| Median Household Income | $53,693 | $0 |
| Monthly Housing Costs | $418 | $0 |
| Real Estate Taxes | $662 | $11 |
Property Value by Mortgage Status in North
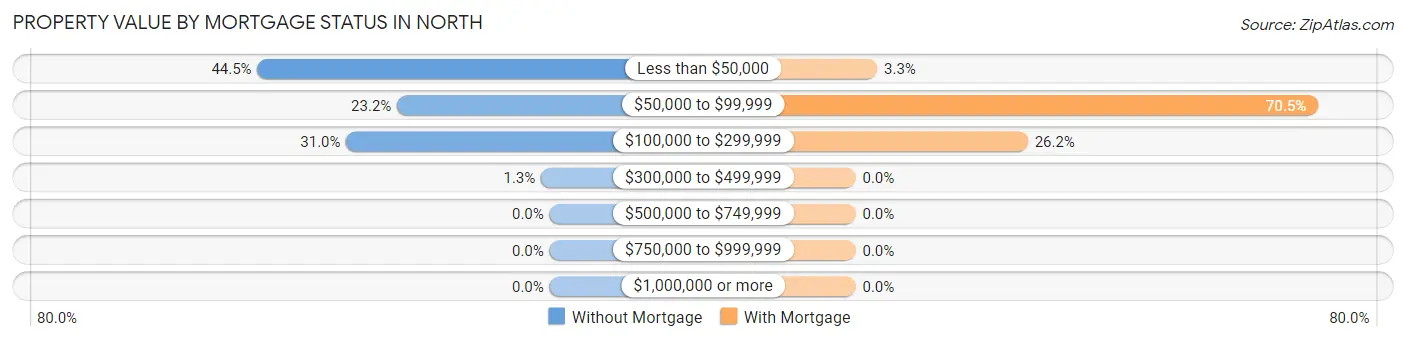
| Property Value | Without Mortgage | With Mortgage |
| Less than $50,000 | 69 (44.5%) | 2 (3.3%) |
| $50,000 to $99,999 | 36 (23.2%) | 43 (70.5%) |
| $100,000 to $299,999 | 48 (31.0%) | 16 (26.2%) |
| $300,000 to $499,999 | 2 (1.3%) | 0 (0.0%) |
| $500,000 to $749,999 | 0 (0.0%) | 0 (0.0%) |
| $750,000 to $999,999 | 0 (0.0%) | 0 (0.0%) |
| $1,000,000 or more | 0 (0.0%) | 0 (0.0%) |
| Total | 155 (100.0%) | 61 (100.0%) |
Household Income by Mortgage Status in North
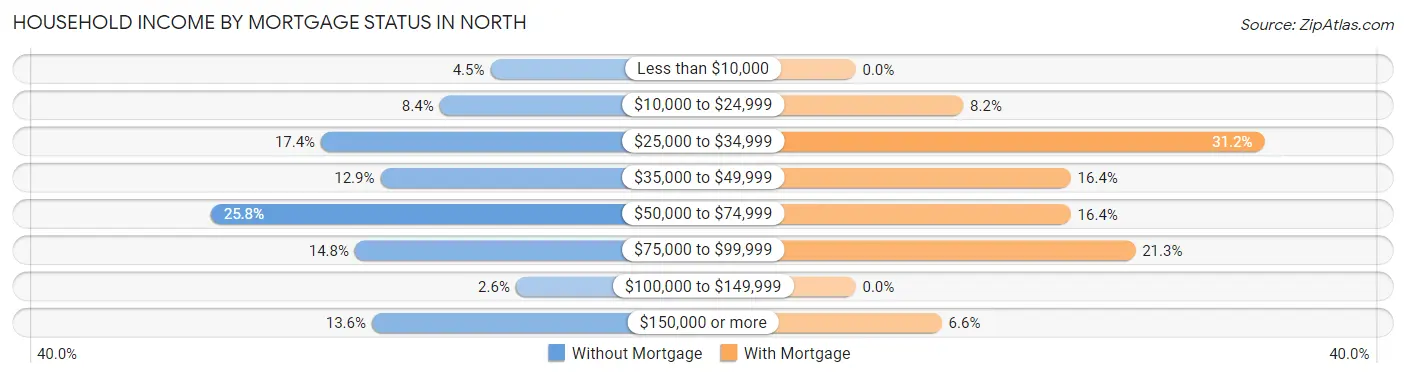
| Household Income | Without Mortgage | With Mortgage |
| Less than $10,000 | 7 (4.5%) | 0 (0.0%) |
| $10,000 to $24,999 | 13 (8.4%) | 5 (8.2%) |
| $25,000 to $34,999 | 27 (17.4%) | 19 (31.1%) |
| $35,000 to $49,999 | 20 (12.9%) | 10 (16.4%) |
| $50,000 to $74,999 | 40 (25.8%) | 10 (16.4%) |
| $75,000 to $99,999 | 23 (14.8%) | 13 (21.3%) |
| $100,000 to $149,999 | 4 (2.6%) | 0 (0.0%) |
| $150,000 or more | 21 (13.6%) | 4 (6.6%) |
| Total | 155 (100.0%) | 61 (100.0%) |
Property Value to Household Income Ratio in North
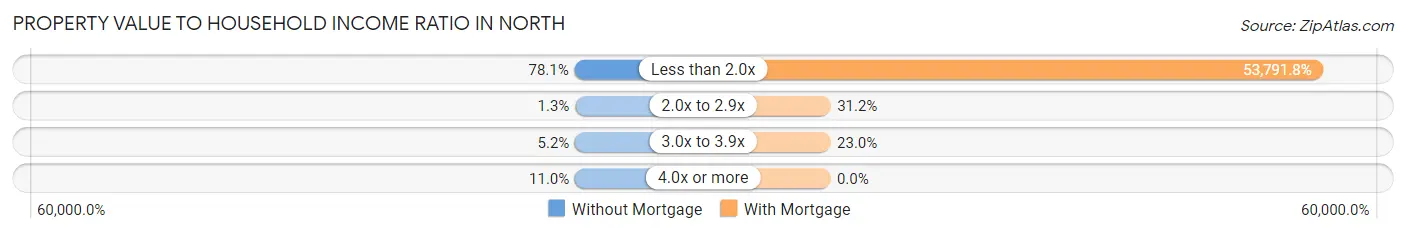
| Value-to-Income Ratio | Without Mortgage | With Mortgage |
| Less than 2.0x | 121 (78.1%) | 32,813 (53,791.8%) |
| 2.0x to 2.9x | 2 (1.3%) | 19 (31.1%) |
| 3.0x to 3.9x | 8 (5.2%) | 14 (23.0%) |
| 4.0x or more | 17 (11.0%) | 0 (0.0%) |
| Total | 155 (100.0%) | 61 (100.0%) |
Real Estate Taxes by Mortgage Status in North
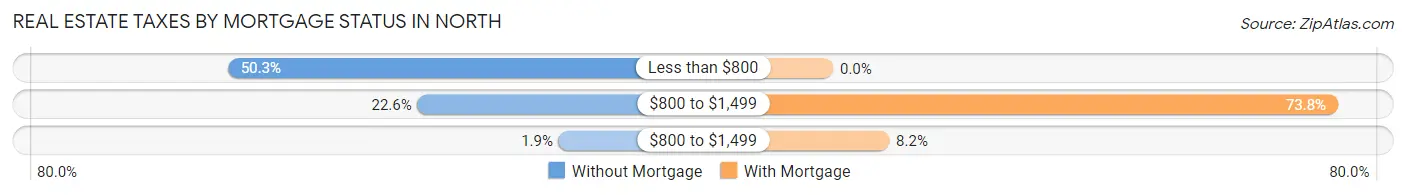
| Property Taxes | Without Mortgage | With Mortgage |
| Less than $800 | 78 (50.3%) | 0 (0.0%) |
| $800 to $1,499 | 35 (22.6%) | 45 (73.8%) |
| $800 to $1,499 | 3 (1.9%) | 5 (8.2%) |
| Total | 155 (100.0%) | 61 (100.0%) |
Health & Disability in North
Health Insurance Coverage by Age in North
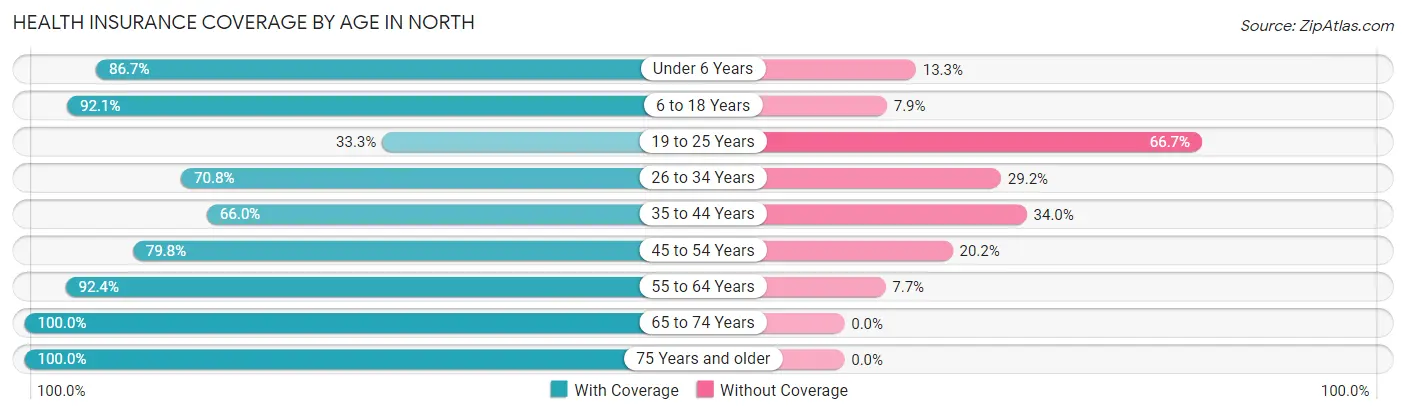
| Age Bracket | With Coverage | Without Coverage |
| Under 6 Years | 39 (86.7%) | 6 (13.3%) |
| 6 to 18 Years | 186 (92.1%) | 16 (7.9%) |
| 19 to 25 Years | 4 (33.3%) | 8 (66.7%) |
| 26 to 34 Years | 97 (70.8%) | 40 (29.2%) |
| 35 to 44 Years | 33 (66.0%) | 17 (34.0%) |
| 45 to 54 Years | 91 (79.8%) | 23 (20.2%) |
| 55 to 64 Years | 169 (92.3%) | 14 (7.6%) |
| 65 to 74 Years | 83 (100.0%) | 0 (0.0%) |
| 75 Years and older | 90 (100.0%) | 0 (0.0%) |
| Total | 792 (86.5%) | 124 (13.5%) |
Health Insurance Coverage by Citizenship Status in North
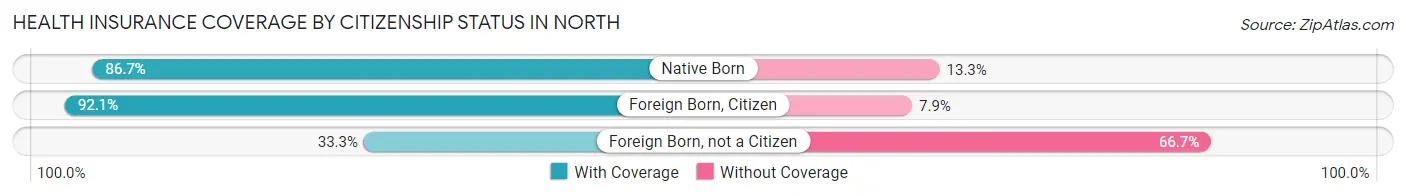
| Citizenship Status | With Coverage | Without Coverage |
| Native Born | 39 (86.7%) | 6 (13.3%) |
| Foreign Born, Citizen | 186 (92.1%) | 16 (7.9%) |
| Foreign Born, not a Citizen | 4 (33.3%) | 8 (66.7%) |
Health Insurance Coverage by Household Income in North
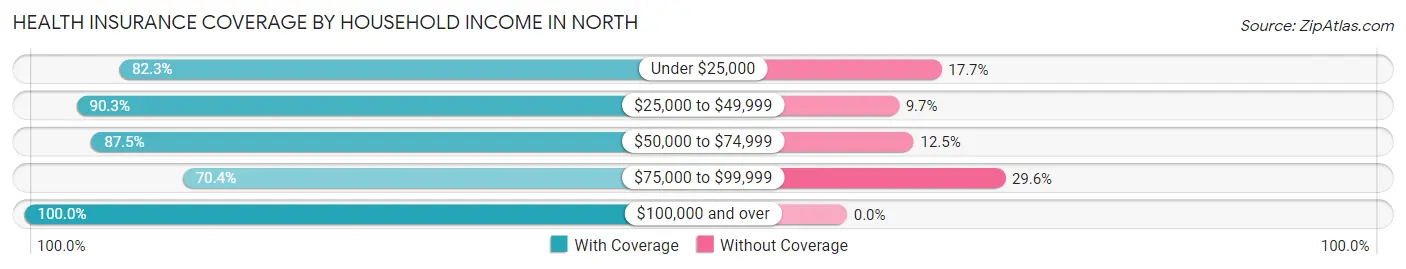
| Household Income | With Coverage | Without Coverage |
| Under $25,000 | 209 (82.3%) | 45 (17.7%) |
| $25,000 to $49,999 | 306 (90.3%) | 33 (9.7%) |
| $50,000 to $74,999 | 154 (87.5%) | 22 (12.5%) |
| $75,000 to $99,999 | 57 (70.4%) | 24 (29.6%) |
| $100,000 and over | 66 (100.0%) | 0 (0.0%) |
Public vs Private Health Insurance Coverage by Age in North
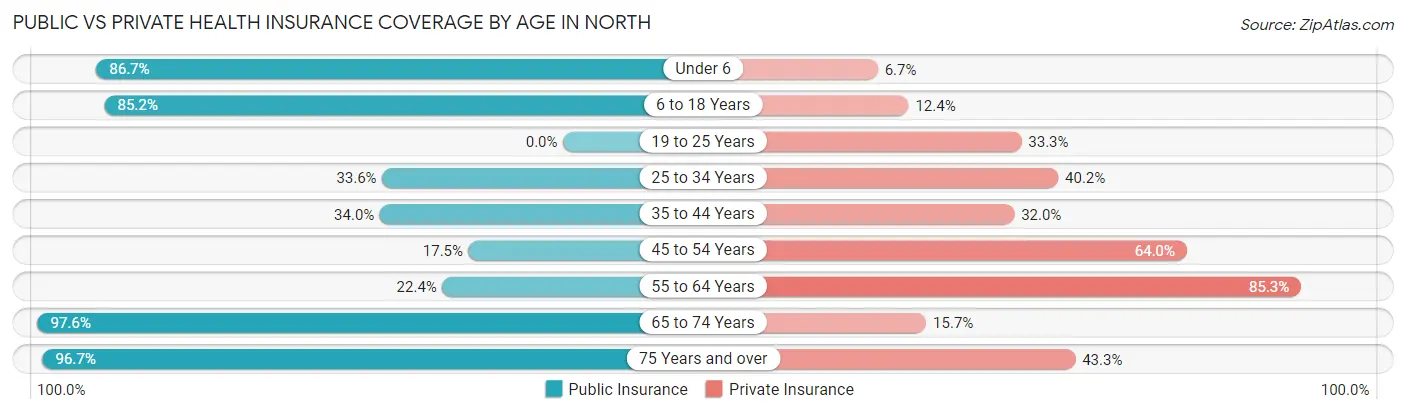
| Age Bracket | Public Insurance | Private Insurance |
| Under 6 | 39 (86.7%) | 3 (6.7%) |
| 6 to 18 Years | 172 (85.2%) | 25 (12.4%) |
| 19 to 25 Years | 0 (0.0%) | 4 (33.3%) |
| 25 to 34 Years | 46 (33.6%) | 55 (40.2%) |
| 35 to 44 Years | 17 (34.0%) | 16 (32.0%) |
| 45 to 54 Years | 20 (17.5%) | 73 (64.0%) |
| 55 to 64 Years | 41 (22.4%) | 156 (85.3%) |
| 65 to 74 Years | 81 (97.6%) | 13 (15.7%) |
| 75 Years and over | 87 (96.7%) | 39 (43.3%) |
| Total | 503 (54.9%) | 384 (41.9%) |
Disability Status by Sex by Age in North
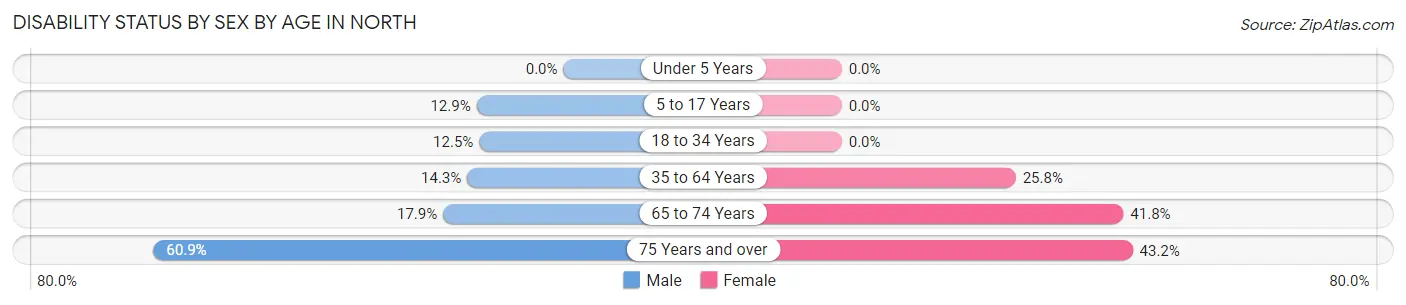
| Age Bracket | Male | Female |
| Under 5 Years | 0 (0.0%) | 0 (0.0%) |
| 5 to 17 Years | 20 (12.9%) | 0 (0.0%) |
| 18 to 34 Years | 8 (12.5%) | 0 (0.0%) |
| 35 to 64 Years | 28 (14.3%) | 39 (25.8%) |
| 65 to 74 Years | 5 (17.9%) | 23 (41.8%) |
| 75 Years and over | 28 (60.9%) | 19 (43.2%) |
Disability Class by Sex by Age in North
Disability Class: Hearing Difficulty
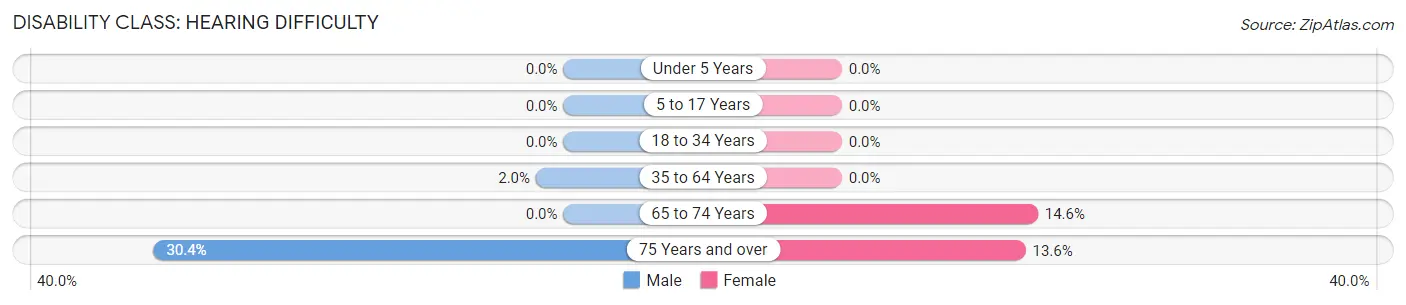
| Age Bracket | Male | Female |
| Under 5 Years | 0 (0.0%) | 0 (0.0%) |
| 5 to 17 Years | 0 (0.0%) | 0 (0.0%) |
| 18 to 34 Years | 0 (0.0%) | 0 (0.0%) |
| 35 to 64 Years | 4 (2.0%) | 0 (0.0%) |
| 65 to 74 Years | 0 (0.0%) | 8 (14.5%) |
| 75 Years and over | 14 (30.4%) | 6 (13.6%) |
Disability Class: Vision Difficulty

| Age Bracket | Male | Female |
| Under 5 Years | 0 (0.0%) | 0 (0.0%) |
| 5 to 17 Years | 0 (0.0%) | 0 (0.0%) |
| 18 to 34 Years | 0 (0.0%) | 0 (0.0%) |
| 35 to 64 Years | 12 (6.1%) | 10 (6.6%) |
| 65 to 74 Years | 3 (10.7%) | 8 (14.5%) |
| 75 Years and over | 10 (21.7%) | 5 (11.4%) |
Disability Class: Cognitive Difficulty
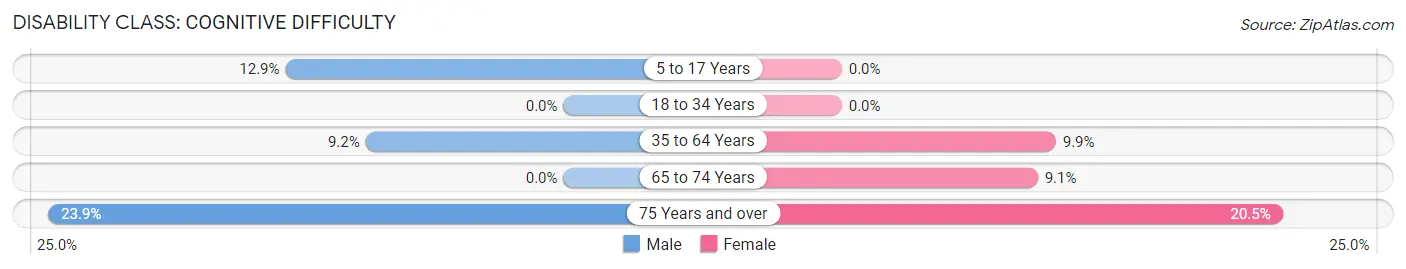
| Age Bracket | Male | Female |
| 5 to 17 Years | 20 (12.9%) | 0 (0.0%) |
| 18 to 34 Years | 0 (0.0%) | 0 (0.0%) |
| 35 to 64 Years | 18 (9.2%) | 15 (9.9%) |
| 65 to 74 Years | 0 (0.0%) | 5 (9.1%) |
| 75 Years and over | 11 (23.9%) | 9 (20.4%) |
Disability Class: Ambulatory Difficulty
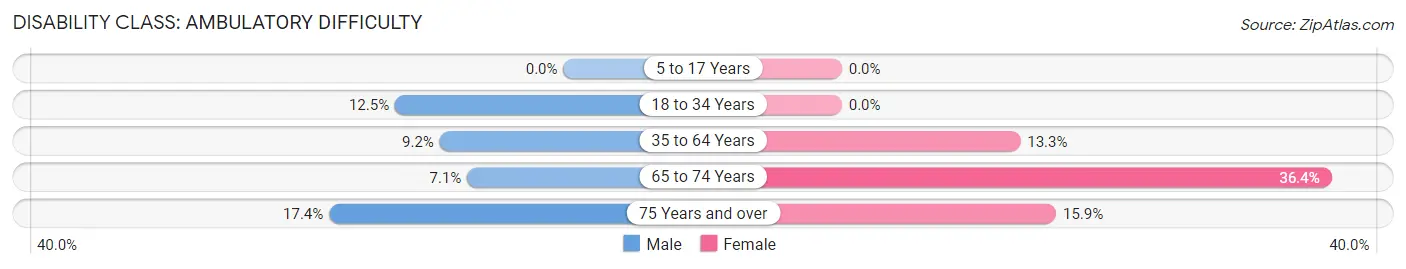
| Age Bracket | Male | Female |
| 5 to 17 Years | 0 (0.0%) | 0 (0.0%) |
| 18 to 34 Years | 8 (12.5%) | 0 (0.0%) |
| 35 to 64 Years | 18 (9.2%) | 20 (13.3%) |
| 65 to 74 Years | 2 (7.1%) | 20 (36.4%) |
| 75 Years and over | 8 (17.4%) | 7 (15.9%) |
Disability Class: Self-Care Difficulty
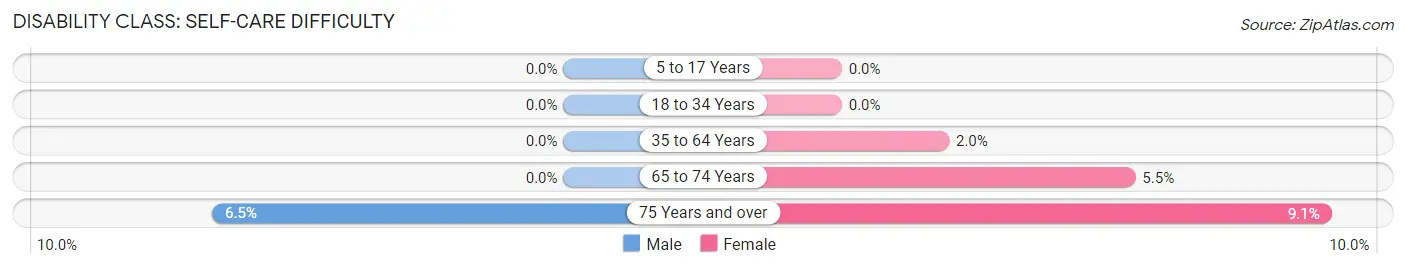
| Age Bracket | Male | Female |
| 5 to 17 Years | 0 (0.0%) | 0 (0.0%) |
| 18 to 34 Years | 0 (0.0%) | 0 (0.0%) |
| 35 to 64 Years | 0 (0.0%) | 3 (2.0%) |
| 65 to 74 Years | 0 (0.0%) | 3 (5.4%) |
| 75 Years and over | 3 (6.5%) | 4 (9.1%) |
Technology Access in North
Computing Device Access in North
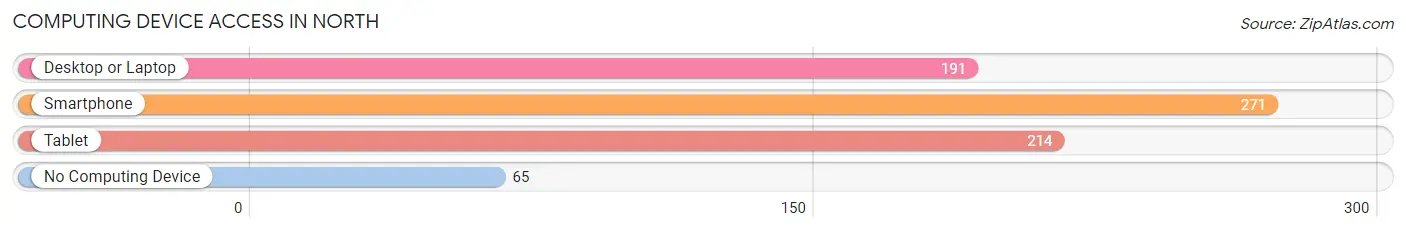
| Device Type | # Households | % Households |
| Desktop or Laptop | 191 | 53.8% |
| Smartphone | 271 | 76.3% |
| Tablet | 214 | 60.3% |
| No Computing Device | 65 | 18.3% |
| Total | 355 | 100.0% |
Internet Access in North
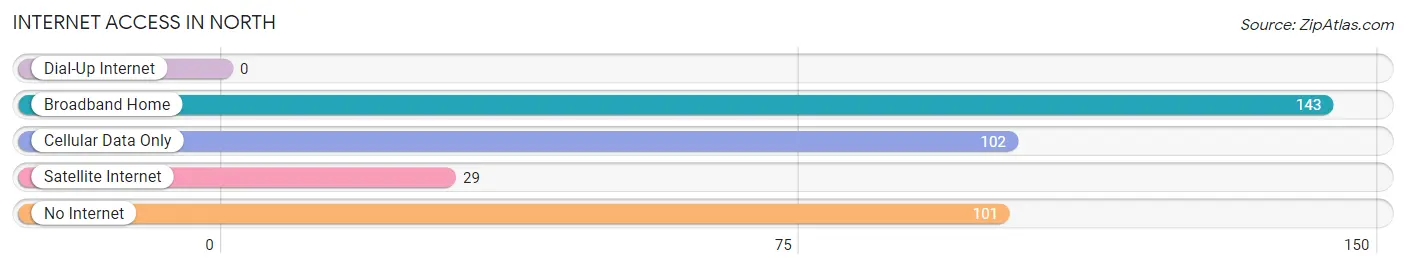
| Internet Type | # Households | % Households |
| Dial-Up Internet | 0 | 0.0% |
| Broadband Home | 143 | 40.3% |
| Cellular Data Only | 102 | 28.7% |
| Satellite Internet | 29 | 8.2% |
| No Internet | 101 | 28.4% |
| Total | 355 | 100.0% |
North Summary
North Carolina is a state located in the southeastern United States. It is bordered by South Carolina to the south, Georgia to the southwest, Tennessee to the west, Virginia to the north, and the Atlantic Ocean to the east. North Carolina is the 28th most populous state in the United States, with an estimated population of 10.4 million in 2019.
History
The area that is now North Carolina was inhabited by Native Americans for thousands of years before the arrival of Europeans. The first Europeans to explore the area were Spanish explorers in the 16th century. The first permanent European settlement in the area was established in 1585 by Sir Walter Raleigh. The area was part of the Province of Carolina, which was established in 1663. The Province of Carolina was divided into North Carolina and South Carolina in 1729.
North Carolina was one of the original 13 colonies that declared independence from Britain in 1776. During the American Revolution, North Carolina was the site of several battles, including the Battle of Moore's Creek Bridge and the Battle of Guilford Courthouse. After the war, North Carolina became the 12th state to ratify the United States Constitution in 1789.
Geography
North Carolina is located in the southeastern United States. It is bordered by South Carolina to the south, Georgia to the southwest, Tennessee to the west, Virginia to the north, and the Atlantic Ocean to the east. The state has three distinct geographic regions: the Coastal Plain, the Piedmont, and the Appalachian Mountains.
The Coastal Plain is a flat, low-lying area that stretches along the Atlantic coast. It is home to many of the state’s beaches and coastal towns. The Piedmont is a hilly region located in the central part of the state. It is home to the state’s largest cities, including Charlotte, Raleigh, and Durham. The Appalachian Mountains are located in the western part of the state. They are home to the Great Smoky Mountains National Park.
Economy
North Carolina’s economy is largely based on agriculture, manufacturing, and services. The state is a major producer of tobacco, cotton, and other agricultural products. It is also a major producer of furniture, textiles, and other manufactured goods. The state’s service sector is also important, with tourism, banking, and other services contributing to the economy.
Demographics
North Carolina is a diverse state with a population of 10.4 million in 2019. The largest racial group is white, making up 68.5% of the population. African Americans make up 22.1% of the population, while Hispanics and Latinos make up 8.3%. The state’s largest cities are Charlotte, Raleigh, and Durham. The state’s capital is Raleigh.
North Carolina is a diverse state with a rich history and culture. It is home to a variety of industries and is a major producer of agricultural and manufactured goods. The state’s population is diverse, with a variety of racial and ethnic groups. North Carolina is a great place to live, work, and visit.
Common Questions
What is Per Capita Income in North?
Per Capita income in North is $20,403.
What is the Median Family Income in North?
Median Family Income in North is $47,143.
What is the Median Household income in North?
Median Household Income in North is $40,069.
What is Income or Wage Gap in North?
Income or Wage Gap in North is 23.2%.
Women in North earn 76.8 cents for every dollar earned by a man.
What is Inequality or Gini Index in North?
Inequality or Gini Index in North is 0.44.
What is the Total Population of North?
Total Population of North is 916.
What is the Total Male Population of North?
Total Male Population of North is 508.
What is the Total Female Population of North?
Total Female Population of North is 408.
What is the Ratio of Males per 100 Females in North?
There are 124.51 Males per 100 Females in North.
What is the Ratio of Females per 100 Males in North?
There are 80.31 Females per 100 Males in North.
What is the Median Population Age in North?
Median Population Age in North is 45.9 Years.
What is the Average Family Size in North
Average Family Size in North is 3.6 People.
What is the Average Household Size in North
Average Household Size in North is 2.6 People.
How Large is the Labor Force in North?
There are 366 People in the Labor Forcein in North.
What is the Percentage of People in the Labor Force in North?
53.8% of People are in the Labor Force in North.
What is the Unemployment Rate in North?
Unemployment Rate in North is 7.7%.