Groton, MA Map & Demographics
Groton Map
Groton Overview
$53,561
PER CAPITA INCOME
$191,250
AVG FAMILY INCOME
$121,484
AVG HOUSEHOLD INCOME
69.9%
WAGE / INCOME GAP [ % ]
30.1¢/ $1
WAGE / INCOME GAP [ $ ]
0.59
INEQUALITY / GINI INDEX
1,472
TOTAL POPULATION
700
MALE POPULATION
772
FEMALE POPULATION
90.67
MALES / 100 FEMALES
110.29
FEMALES / 100 MALES
29.5
MEDIAN AGE
5.0
AVG FAMILY SIZE
3.4
AVG HOUSEHOLD SIZE
787
LABOR FORCE [ PEOPLE ]
65.7%
PERCENT IN LABOR FORCE
3.4%
UNEMPLOYMENT RATE
Groton Zip Codes
Income in Groton
Income Overview in Groton
Per Capita Income in Groton is $53,561, while median incomes of families and households are $191,250 and $121,484 respectively.
| Characteristic | Number | Measure |
| Per Capita Income | 1,472 | $53,561 |
| Median Family Income | 210 | $191,250 |
| Mean Family Income | 210 | $278,714 |
| Median Household Income | 381 | $121,484 |
| Mean Household Income | 381 | $193,179 |
| Income Deficit | 210 | $0 |
| Wage / Income Gap (%) | 1,472 | 69.92% |
| Wage / Income Gap ($) | 1,472 | 30.08¢ per $1 |
| Gini / Inequality Index | 1,472 | 0.59 |
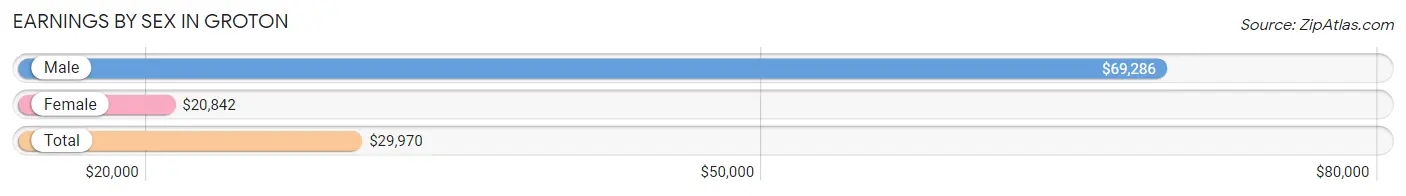
Earnings by Sex in Groton
Average Earnings in Groton are $29,970, $69,286 for men and $20,842 for women, a difference of 69.9%.
| Sex | Number | Average Earnings |
| Male | 348 (41.7%) | $69,286 |
| Female | 487 (58.3%) | $20,842 |
| Total | 835 (100.0%) | $29,970 |
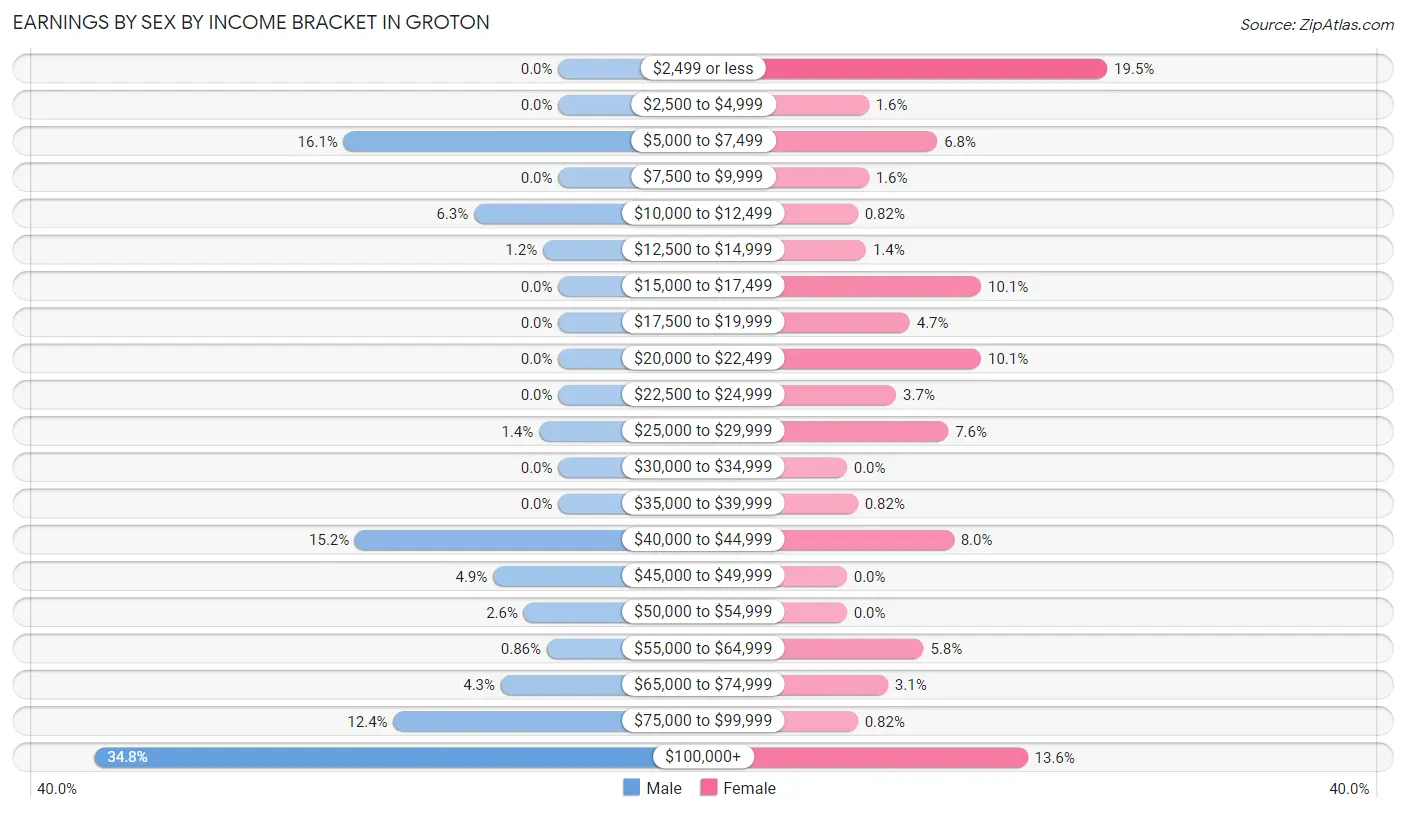
Earnings by Sex by Income Bracket in Groton
The most common earnings brackets in Groton are $100,000+ for men (121 | 34.8%) and $2,499 or less for women (95 | 19.5%).
| Income | Male | Female |
| $2,499 or less | 0 (0.0%) | 95 (19.5%) |
| $2,500 to $4,999 | 0 (0.0%) | 8 (1.6%) |
| $5,000 to $7,499 | 56 (16.1%) | 33 (6.8%) |
| $7,500 to $9,999 | 0 (0.0%) | 8 (1.6%) |
| $10,000 to $12,499 | 22 (6.3%) | 4 (0.8%) |
| $12,500 to $14,999 | 4 (1.1%) | 7 (1.4%) |
| $15,000 to $17,499 | 0 (0.0%) | 49 (10.1%) |
| $17,500 to $19,999 | 0 (0.0%) | 23 (4.7%) |
| $20,000 to $22,499 | 0 (0.0%) | 49 (10.1%) |
| $22,500 to $24,999 | 0 (0.0%) | 18 (3.7%) |
| $25,000 to $29,999 | 5 (1.4%) | 37 (7.6%) |
| $30,000 to $34,999 | 0 (0.0%) | 0 (0.0%) |
| $35,000 to $39,999 | 0 (0.0%) | 4 (0.8%) |
| $40,000 to $44,999 | 53 (15.2%) | 39 (8.0%) |
| $45,000 to $49,999 | 17 (4.9%) | 0 (0.0%) |
| $50,000 to $54,999 | 9 (2.6%) | 0 (0.0%) |
| $55,000 to $64,999 | 3 (0.9%) | 28 (5.8%) |
| $65,000 to $74,999 | 15 (4.3%) | 15 (3.1%) |
| $75,000 to $99,999 | 43 (12.4%) | 4 (0.8%) |
| $100,000+ | 121 (34.8%) | 66 (13.6%) |
| Total | 348 (100.0%) | 487 (100.0%) |
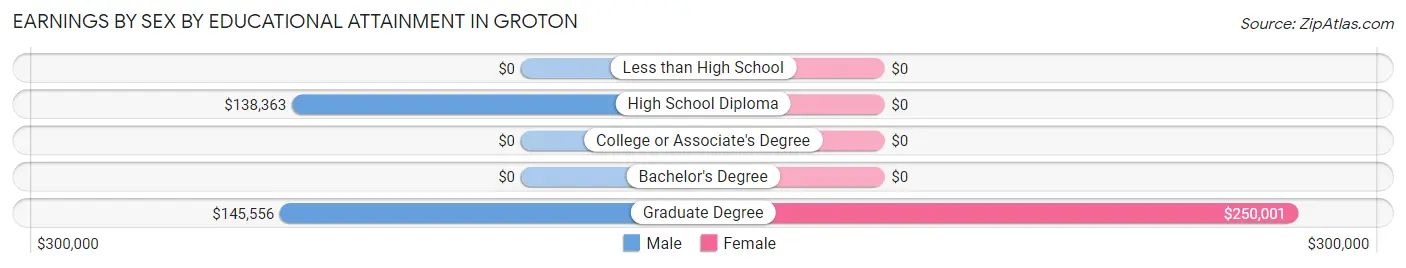
Earnings by Sex by Educational Attainment in Groton
| Educational Attainment | Male Income | Female Income |
| Less than High School | - | - |
| High School Diploma | $138,363 | $0 |
| College or Associate's Degree | - | - |
| Bachelor's Degree | - | - |
| Graduate Degree | $145,556 | $250,001 |
| Total | - | - |
Family Income in Groton
Family Income Brackets in Groton
According to the Groton family income data, there are 90 families falling into the $200,000+ income range, which is the most common income bracket and makes up 42.9% of all families.
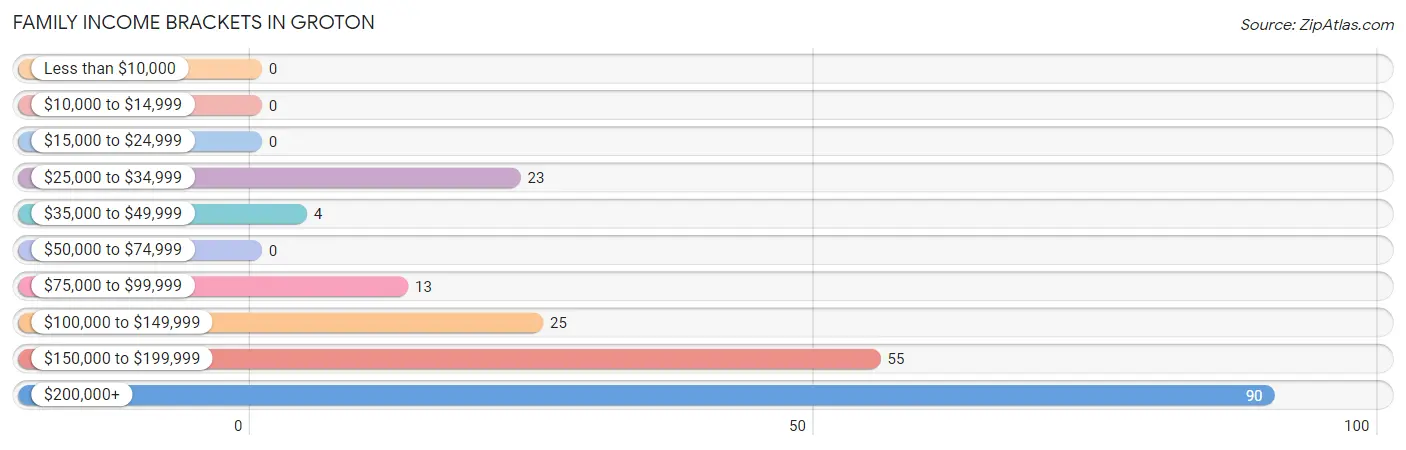
| Income Bracket | # Families | % Families |
| Less than $10,000 | 0 | 0.0% |
| $10,000 to $14,999 | 0 | 0.0% |
| $15,000 to $24,999 | 0 | 0.0% |
| $25,000 to $34,999 | 23 | 11.0% |
| $35,000 to $49,999 | 4 | 1.9% |
| $50,000 to $74,999 | 0 | 0.0% |
| $75,000 to $99,999 | 13 | 6.2% |
| $100,000 to $149,999 | 25 | 11.9% |
| $150,000 to $199,999 | 55 | 26.2% |
| $200,000+ | 90 | 42.9% |
Family Income by Famaliy Size in Groton
4-person families (71 | 33.8%) account for the highest median family income in Groton with $250,001 per family, while 4-person families (71 | 33.8%) have the highest median income of $62,500 per family member.
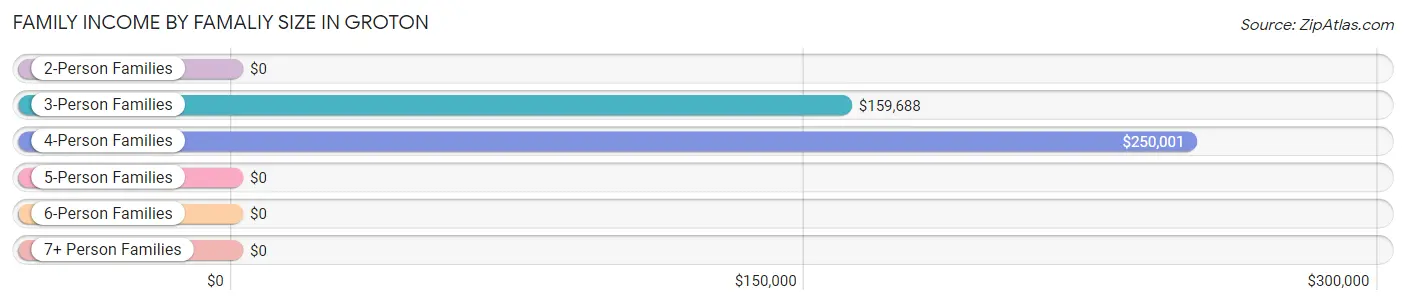
| Income Bracket | # Families | Median Income |
| 2-Person Families | 62 (29.5%) | $0 |
| 3-Person Families | 35 (16.7%) | $159,688 |
| 4-Person Families | 71 (33.8%) | $250,001 |
| 5-Person Families | 0 (0.0%) | $0 |
| 6-Person Families | 0 (0.0%) | $0 |
| 7+ Person Families | 42 (20.0%) | $0 |
| Total | 210 (100.0%) | $191,250 |
Family Income by Number of Earners in Groton
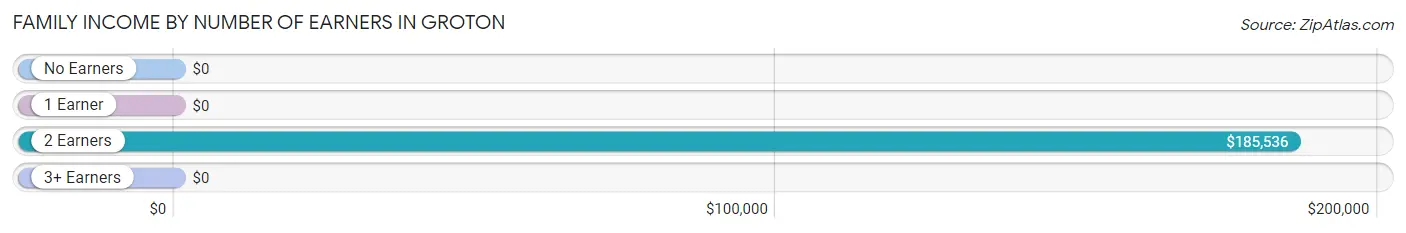
| Number of Earners | # Families | Median Income |
| No Earners | 0 (0.0%) | $0 |
| 1 Earner | 62 (29.5%) | $0 |
| 2 Earners | 101 (48.1%) | $185,536 |
| 3+ Earners | 47 (22.4%) | $0 |
| Total | 210 (100.0%) | $191,250 |
Household Income in Groton
Household Income Brackets in Groton
With 112 households falling in the category, the $200,000+ income range is the most frequent in Groton, accounting for 29.4% of all households. In contrast, only 8 households (2.1%) fall into the $35,000 to $49,999 income bracket, making it the least populous group.
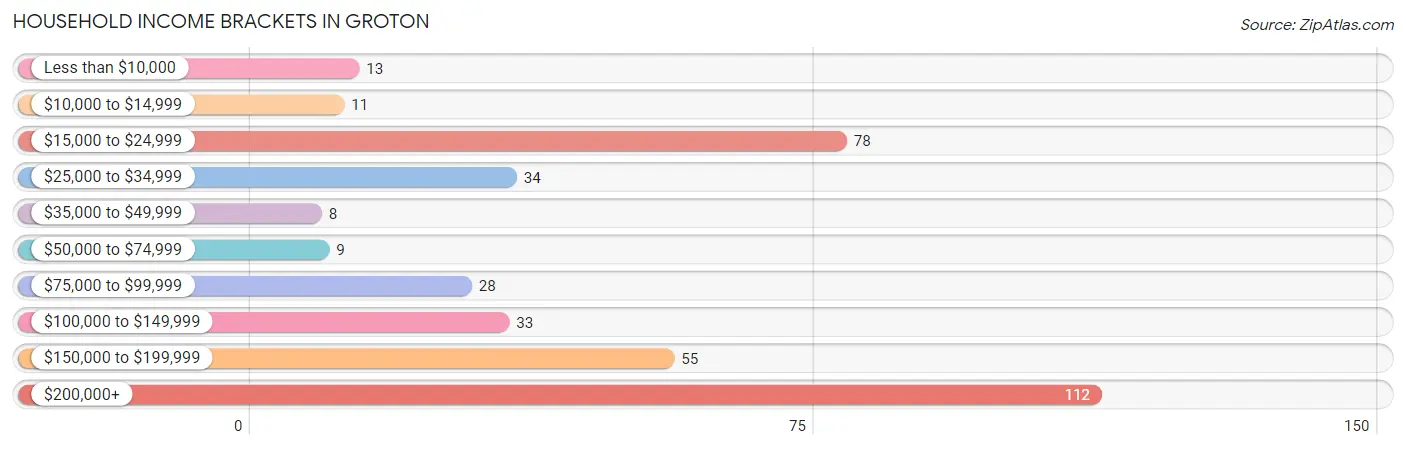
| Income Bracket | # Households | % Households |
| Less than $10,000 | 13 | 3.4% |
| $10,000 to $14,999 | 11 | 2.9% |
| $15,000 to $24,999 | 78 | 20.5% |
| $25,000 to $34,999 | 34 | 8.9% |
| $35,000 to $49,999 | 8 | 2.1% |
| $50,000 to $74,999 | 9 | 2.4% |
| $75,000 to $99,999 | 28 | 7.3% |
| $100,000 to $149,999 | 33 | 8.7% |
| $150,000 to $199,999 | 55 | 14.4% |
| $200,000+ | 112 | 29.4% |
Household Income by Householder Age in Groton
The median household income in Groton is $121,484, with the highest median household income of $193,417 found in the 45 to 64 years age bracket for the primary householder. A total of 199 households (52.2%) fall into this category.
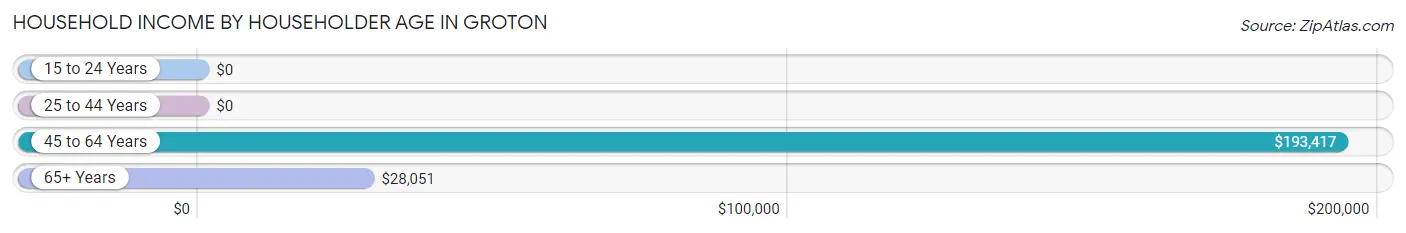
| Income Bracket | # Households | Median Income |
| 15 to 24 Years | 0 (0.0%) | $0 |
| 25 to 44 Years | 9 (2.4%) | $0 |
| 45 to 64 Years | 199 (52.2%) | $193,417 |
| 65+ Years | 173 (45.4%) | $28,051 |
| Total | 381 (100.0%) | $121,484 |
Poverty in Groton
Income Below Poverty by Sex and Age in Groton
With 4.5% poverty level for males and 5.2% for females among the residents of Groton, 45 to 54 year old males and 65 to 74 year old females are the most vulnerable to poverty, with 22 males (26.2%) and 24 females (28.2%) in their respective age groups living below the poverty level.
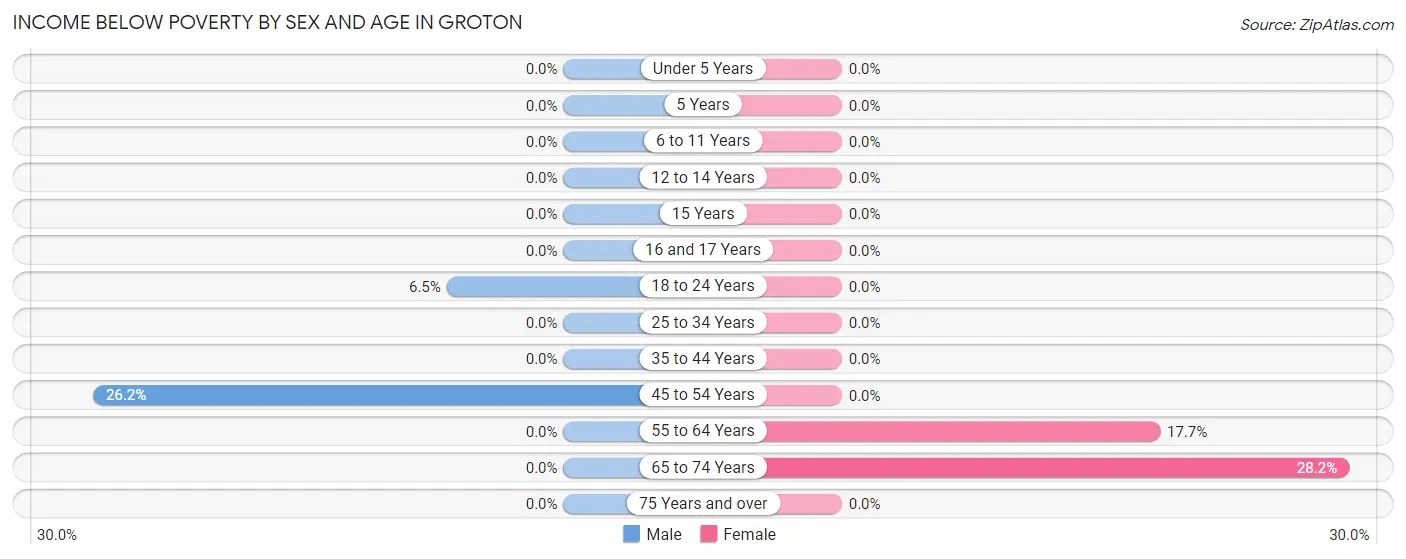
| Age Bracket | Male | Female |
| Under 5 Years | 0 (0.0%) | 0 (0.0%) |
| 5 Years | 0 (0.0%) | 0 (0.0%) |
| 6 to 11 Years | 0 (0.0%) | 0 (0.0%) |
| 12 to 14 Years | 0 (0.0%) | 0 (0.0%) |
| 15 Years | 0 (0.0%) | 0 (0.0%) |
| 16 and 17 Years | 0 (0.0%) | 0 (0.0%) |
| 18 to 24 Years | 8 (6.5%) | 0 (0.0%) |
| 25 to 34 Years | 0 (0.0%) | 0 (0.0%) |
| 35 to 44 Years | 0 (0.0%) | 0 (0.0%) |
| 45 to 54 Years | 22 (26.2%) | 0 (0.0%) |
| 55 to 64 Years | 0 (0.0%) | 14 (17.7%) |
| 65 to 74 Years | 0 (0.0%) | 24 (28.2%) |
| 75 Years and over | 0 (0.0%) | 0 (0.0%) |
| Total | 30 (4.5%) | 38 (5.2%) |
Income Above Poverty by Sex and Age in Groton
According to the poverty statistics in Groton, males aged under 5 years and females aged under 5 years are the age groups that are most secure financially, with 100.0% of males and 100.0% of females in these age groups living above the poverty line.
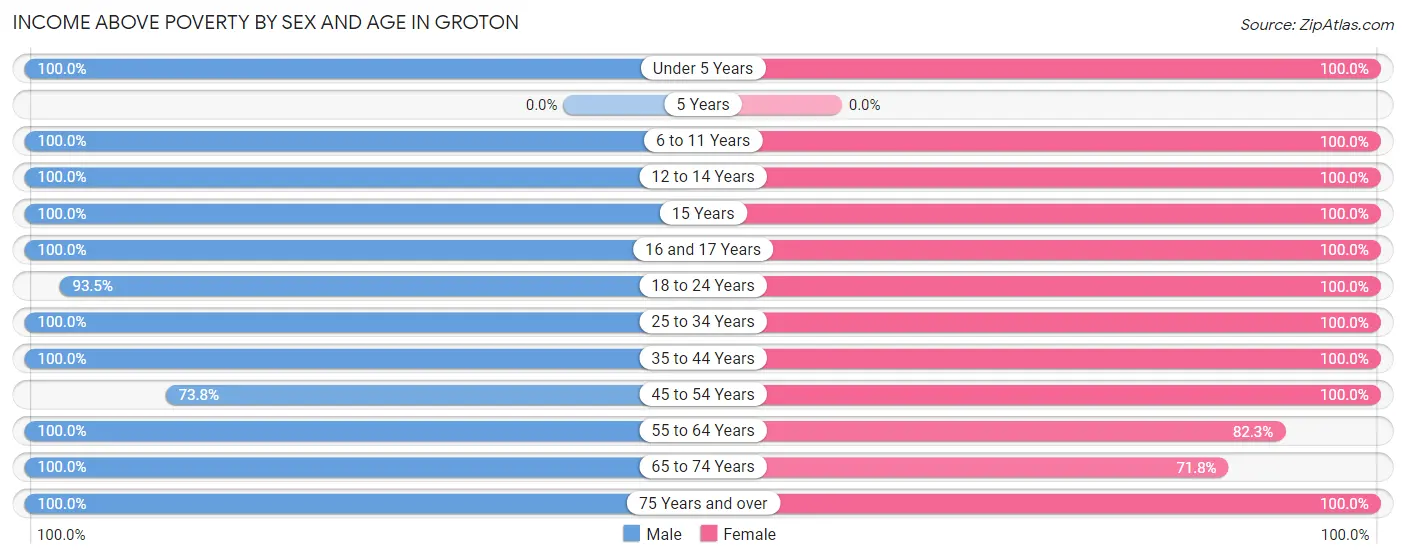
| Age Bracket | Male | Female |
| Under 5 Years | 40 (100.0%) | 8 (100.0%) |
| 5 Years | 0 (0.0%) | 0 (0.0%) |
| 6 to 11 Years | 34 (100.0%) | 41 (100.0%) |
| 12 to 14 Years | 48 (100.0%) | 28 (100.0%) |
| 15 Years | 26 (100.0%) | 20 (100.0%) |
| 16 and 17 Years | 59 (100.0%) | 8 (100.0%) |
| 18 to 24 Years | 115 (93.5%) | 226 (100.0%) |
| 25 to 34 Years | 59 (100.0%) | 32 (100.0%) |
| 35 to 44 Years | 54 (100.0%) | 39 (100.0%) |
| 45 to 54 Years | 62 (73.8%) | 89 (100.0%) |
| 55 to 64 Years | 105 (100.0%) | 65 (82.3%) |
| 65 to 74 Years | 15 (100.0%) | 61 (71.8%) |
| 75 Years and over | 20 (100.0%) | 81 (100.0%) |
| Total | 637 (95.5%) | 698 (94.8%) |
Income Below Poverty Among Married-Couple Families in Groton
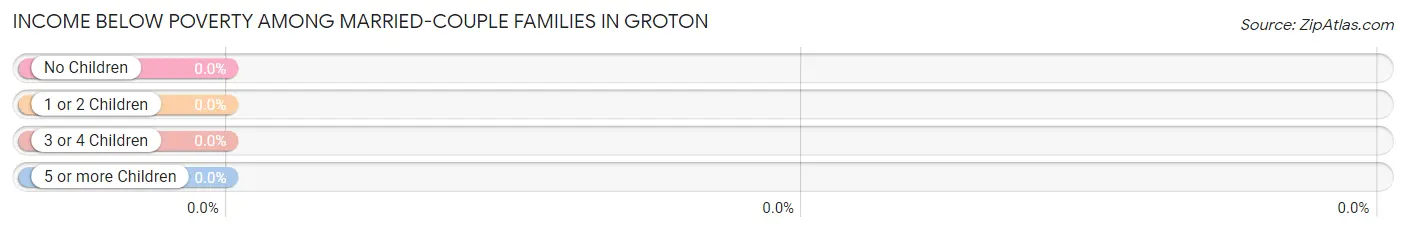
| Children | Above Poverty | Below Poverty |
| No Children | 43 (100.0%) | 0 (0.0%) |
| 1 or 2 Children | 94 (100.0%) | 0 (0.0%) |
| 3 or 4 Children | 0 (0.0%) | 0 (0.0%) |
| 5 or more Children | 0 (0.0%) | 0 (0.0%) |
| Total | 137 (100.0%) | 0 (0.0%) |
Income Below Poverty Among Single-Parent Households in Groton
| Children | Single Father | Single Mother |
| No Children | 0 (0.0%) | 0 (0.0%) |
| 1 or 2 Children | 0 (0.0%) | 0 (0.0%) |
| 3 or 4 Children | 0 (0.0%) | 0 (0.0%) |
| 5 or more Children | 0 (0.0%) | 0 (0.0%) |
| Total | 0 (0.0%) | 0 (0.0%) |
Income Below Poverty Among Married-Couple vs Single-Parent Households in Groton
| Children | Married-Couple Families | Single-Parent Households |
| No Children | 0 (0.0%) | 0 (0.0%) |
| 1 or 2 Children | 0 (0.0%) | 0 (0.0%) |
| 3 or 4 Children | 0 (0.0%) | 0 (0.0%) |
| 5 or more Children | 0 (0.0%) | 0 (0.0%) |
| Total | 0 (0.0%) | 0 (0.0%) |
Race in Groton
The most populous races in Groton are White / Caucasian (1,249 | 84.9%), Hispanic or Latino (87 | 5.9%), and Two or more Races (77 | 5.2%).
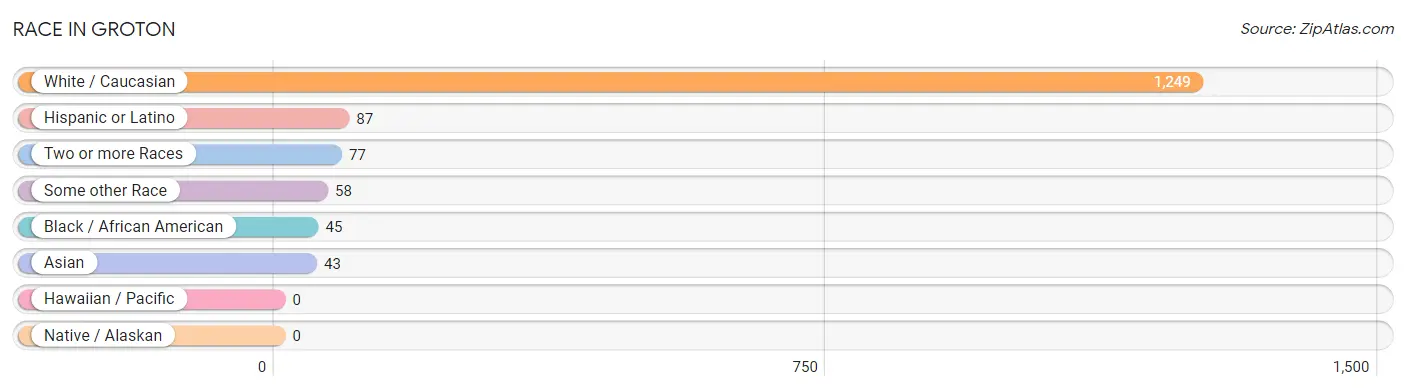
| Race | # Population | % Population |
| Asian | 43 | 2.9% |
| Black / African American | 45 | 3.1% |
| Hawaiian / Pacific | 0 | 0.0% |
| Hispanic or Latino | 87 | 5.9% |
| Native / Alaskan | 0 | 0.0% |
| White / Caucasian | 1,249 | 84.9% |
| Two or more Races | 77 | 5.2% |
| Some other Race | 58 | 3.9% |
| Total | 1,472 | 100.0% |
Ancestry in Groton
The most populous ancestries reported in Groton are English (307 | 20.9%), German (173 | 11.7%), Irish (125 | 8.5%), Italian (89 | 6.0%), and French (88 | 6.0%), together accounting for 53.1% of all Groton residents.
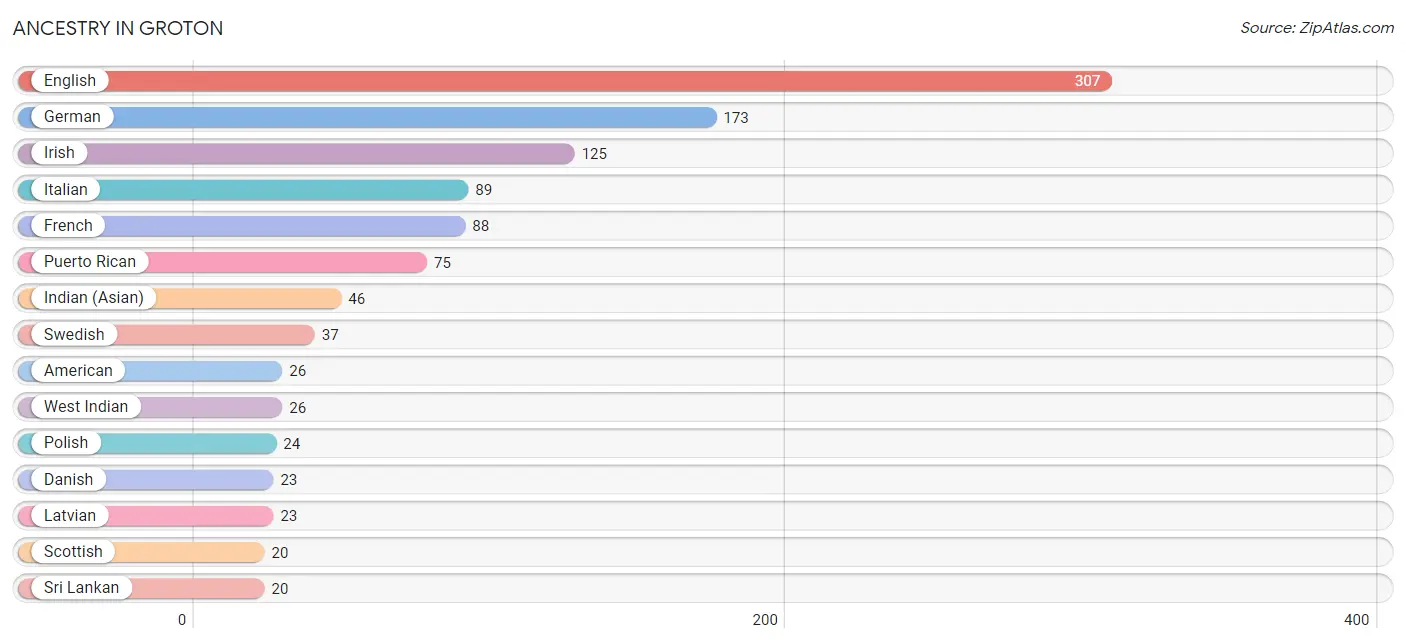
| Ancestry | # Population | % Population |
| American | 26 | 1.8% |
| British | 8 | 0.5% |
| Danish | 23 | 1.6% |
| Dominican | 8 | 0.5% |
| English | 307 | 20.9% |
| European | 14 | 0.9% |
| French | 88 | 6.0% |
| French Canadian | 4 | 0.3% |
| German | 173 | 11.7% |
| Greek | 11 | 0.7% |
| Guamanian / Chamorro | 5 | 0.3% |
| Indian (Asian) | 46 | 3.1% |
| Irish | 125 | 8.5% |
| Italian | 89 | 6.0% |
| Kenyan | 4 | 0.3% |
| Latvian | 23 | 1.6% |
| Lithuanian | 13 | 0.9% |
| Polish | 24 | 1.6% |
| Puerto Rican | 75 | 5.1% |
| Scottish | 20 | 1.4% |
| Slovene | 8 | 0.5% |
| Sri Lankan | 20 | 1.4% |
| Subsaharan African | 4 | 0.3% |
| Swedish | 37 | 2.5% |
| Ukrainian | 16 | 1.1% |
| Welsh | 15 | 1.0% |
| West Indian | 26 | 1.8% | View All 27 Rows |
Immigrants in Groton
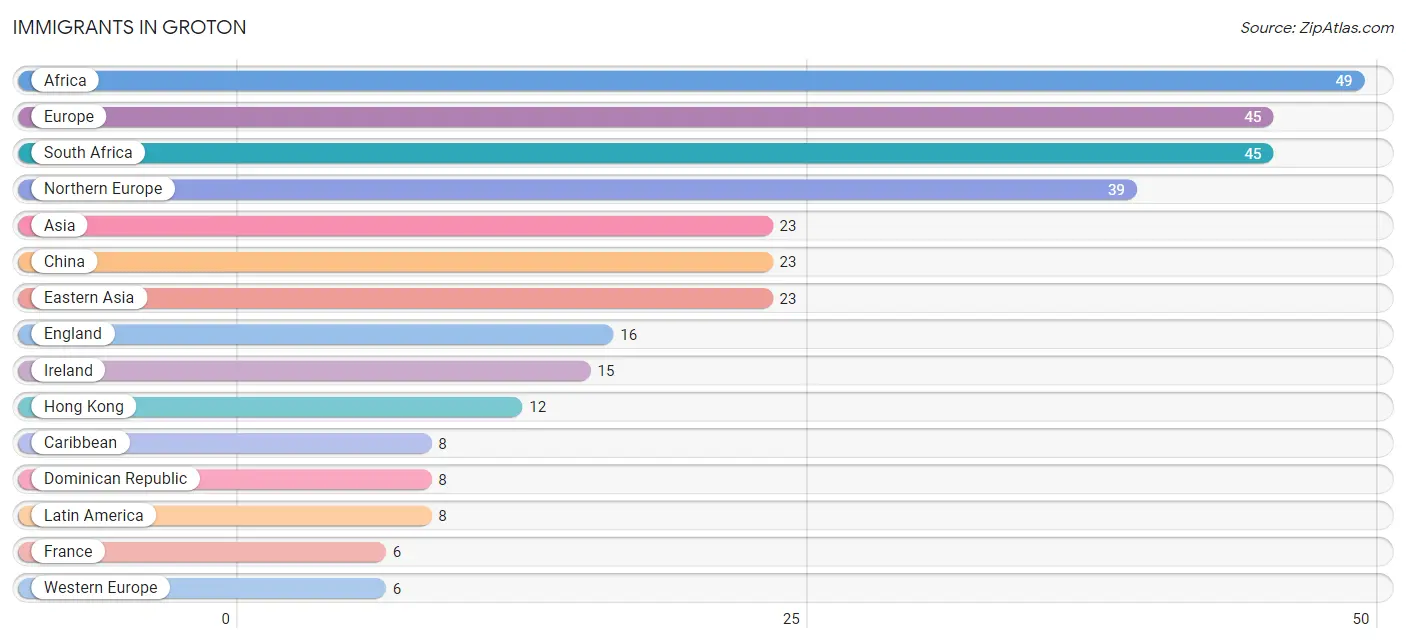
The most numerous immigrant groups reported in Groton came from Africa (49 | 3.3%), Europe (45 | 3.1%), South Africa (45 | 3.1%), Northern Europe (39 | 2.6%), and Asia (23 | 1.6%), together accounting for 13.7% of all Groton residents.
| Immigration Origin | # Population | % Population |
| Africa | 49 | 3.3% |
| Asia | 23 | 1.6% |
| Caribbean | 8 | 0.5% |
| China | 23 | 1.6% |
| Dominican Republic | 8 | 0.5% |
| Eastern Africa | 4 | 0.3% |
| Eastern Asia | 23 | 1.6% |
| England | 16 | 1.1% |
| Europe | 45 | 3.1% |
| France | 6 | 0.4% |
| Hong Kong | 12 | 0.8% |
| Ireland | 15 | 1.0% |
| Kenya | 4 | 0.3% |
| Latin America | 8 | 0.5% |
| Northern Europe | 39 | 2.6% |
| South Africa | 45 | 3.1% |
| Western Europe | 6 | 0.4% | View All 17 Rows |
Sex and Age in Groton
Sex and Age in Groton
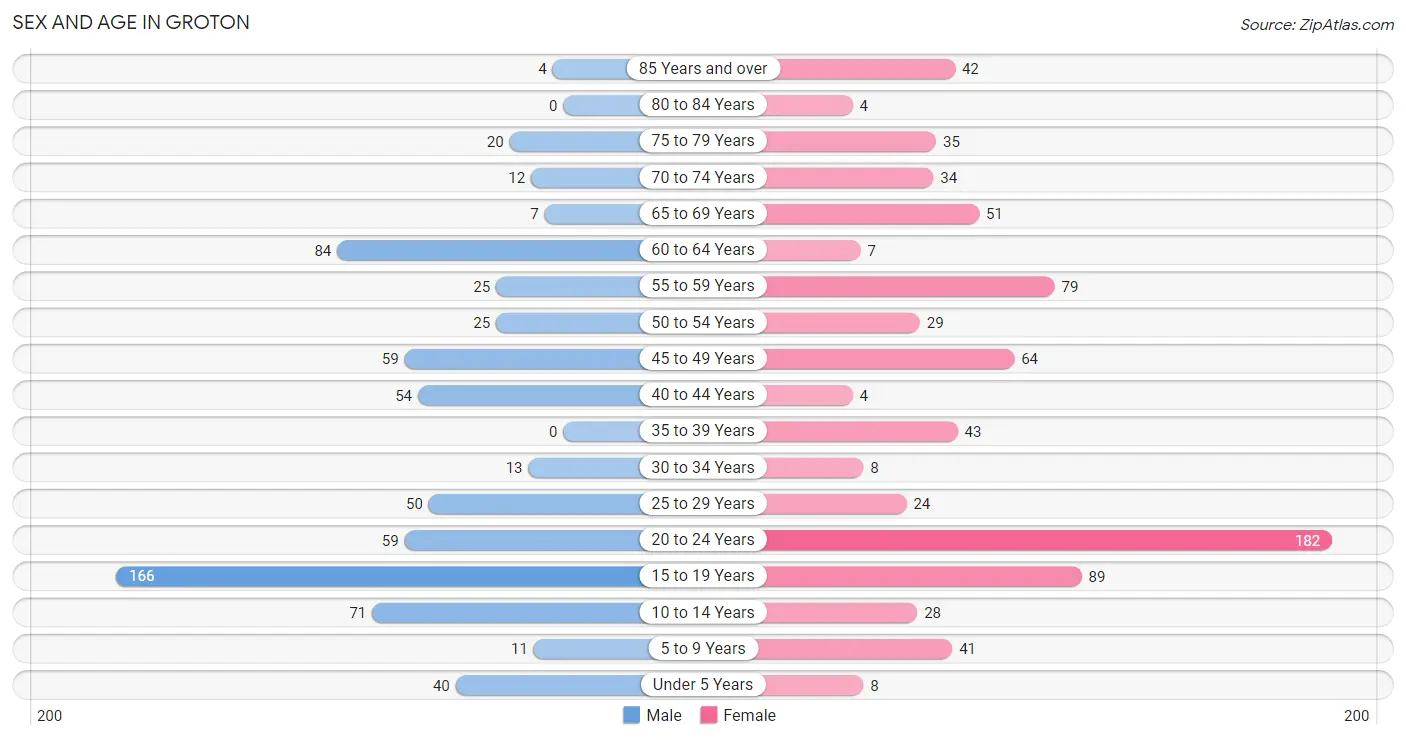
The most populous age groups in Groton are 15 to 19 Years (166 | 23.7%) for men and 20 to 24 Years (182 | 23.6%) for women.
| Age Bracket | Male | Female |
| Under 5 Years | 40 (5.7%) | 8 (1.0%) |
| 5 to 9 Years | 11 (1.6%) | 41 (5.3%) |
| 10 to 14 Years | 71 (10.1%) | 28 (3.6%) |
| 15 to 19 Years | 166 (23.7%) | 89 (11.5%) |
| 20 to 24 Years | 59 (8.4%) | 182 (23.6%) |
| 25 to 29 Years | 50 (7.1%) | 24 (3.1%) |
| 30 to 34 Years | 13 (1.9%) | 8 (1.0%) |
| 35 to 39 Years | 0 (0.0%) | 43 (5.6%) |
| 40 to 44 Years | 54 (7.7%) | 4 (0.5%) |
| 45 to 49 Years | 59 (8.4%) | 64 (8.3%) |
| 50 to 54 Years | 25 (3.6%) | 29 (3.8%) |
| 55 to 59 Years | 25 (3.6%) | 79 (10.2%) |
| 60 to 64 Years | 84 (12.0%) | 7 (0.9%) |
| 65 to 69 Years | 7 (1.0%) | 51 (6.6%) |
| 70 to 74 Years | 12 (1.7%) | 34 (4.4%) |
| 75 to 79 Years | 20 (2.9%) | 35 (4.5%) |
| 80 to 84 Years | 0 (0.0%) | 4 (0.5%) |
| 85 Years and over | 4 (0.6%) | 42 (5.4%) |
| Total | 700 (100.0%) | 772 (100.0%) |
Families and Households in Groton
Median Family Size in Groton
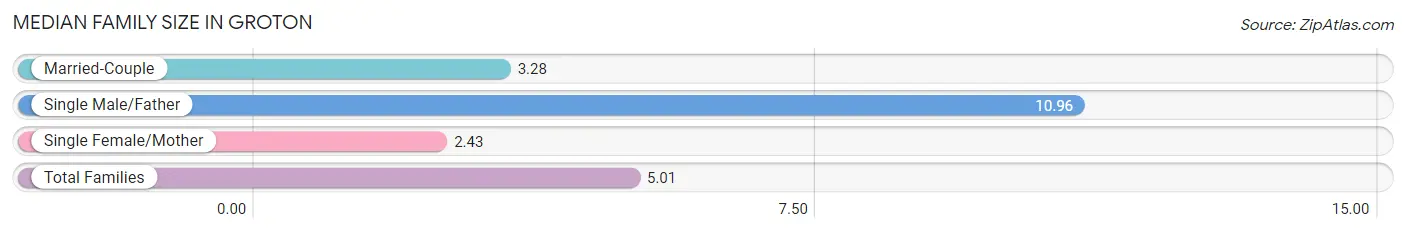
The median family size in Groton is 5.01 persons per family, with single male/father families (50 | 23.8%) accounting for the largest median family size of 10.96 persons per family. On the other hand, single female/mother families (23 | 11.0%) represent the smallest median family size with 2.43 persons per family.
| Family Type | # Families | Family Size |
| Married-Couple | 137 (65.2%) | 3.28 |
| Single Male/Father | 50 (23.8%) | 10.96 |
| Single Female/Mother | 23 (11.0%) | 2.43 |
| Total Families | 210 (100.0%) | 5.01 |
Median Household Size in Groton
| Household Type | # Households | Household Size |
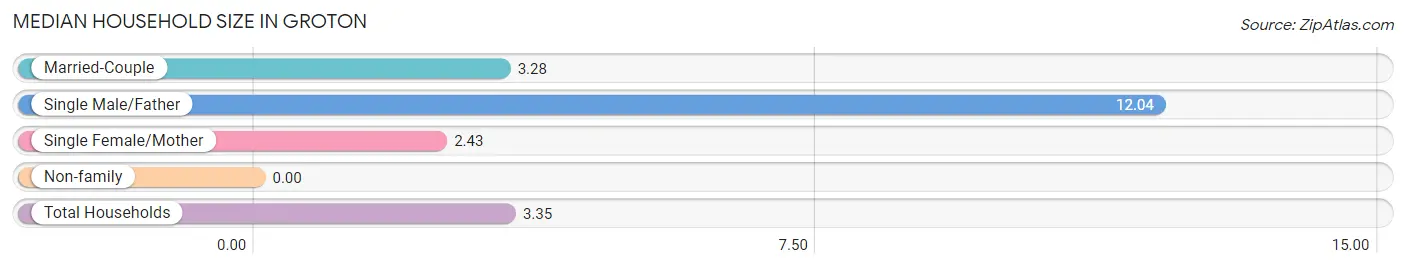
| Married-Couple | 137 (36.0%) | 3.28 |
| Single Male/Father | 50 (13.1%) | 12.04 |
| Single Female/Mother | 23 (6.0%) | 2.43 |
| Non-family | 171 (44.9%) | - |
| Total Households | 381 (100.0%) | 3.35 |
Household Size by Marriage Status in Groton
Out of a total of 381 households in Groton, 210 (55.1%) are family households, while 171 (44.9%) are nonfamily households. The most numerous type of family households are 4-person households, comprising 71, and the most common type of nonfamily households are 1-person households, comprising 171.
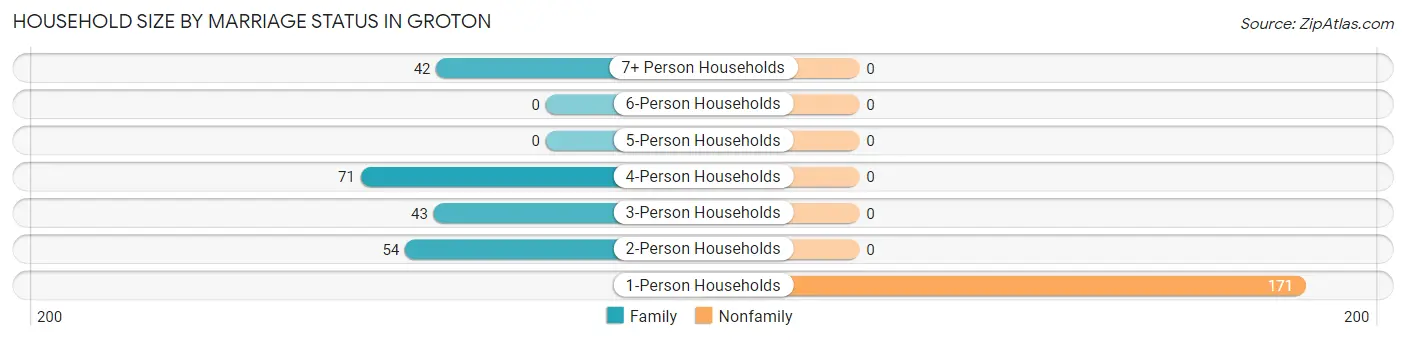
| Household Size | Family Households | Nonfamily Households |
| 1-Person Households | - | 171 (44.9%) |
| 2-Person Households | 54 (14.2%) | 0 (0.0%) |
| 3-Person Households | 43 (11.3%) | 0 (0.0%) |
| 4-Person Households | 71 (18.6%) | 0 (0.0%) |
| 5-Person Households | 0 (0.0%) | 0 (0.0%) |
| 6-Person Households | 0 (0.0%) | 0 (0.0%) |
| 7+ Person Households | 42 (11.0%) | 0 (0.0%) |
| Total | 210 (55.1%) | 171 (44.9%) |
Female Fertility in Groton
Fertility by Age in Groton
| Age Bracket | Women with Births | Births / 1,000 Women |
| 15 to 19 years | 0 (0.0%) | 0.0 |
| 20 to 34 years | 0 (0.0%) | 0.0 |
| 35 to 50 years | 0 (0.0%) | 0.0 |
| Total | 0 (0.0%) | 0.0 |
Fertility by Age by Marriage Status in Groton
| Age Bracket | Married | Unmarried |
| 15 to 19 years | 0 (0.0%) | 0 (0.0%) |
| 20 to 34 years | 0 (0.0%) | 0 (0.0%) |
| 35 to 50 years | 0 (0.0%) | 0 (0.0%) |
| Total | 0 (0.0%) | 0 (0.0%) |
Fertility by Education in Groton
| Educational Attainment | Women with Births | Births / 1,000 Women |
| Less than High School | 0 (0.0%) | 0.0 |
| High School Diploma | 0 (0.0%) | 0.0 |
| College or Associate's Degree | 0 (0.0%) | 0.0 |
| Bachelor's Degree | 0 (0.0%) | 0.0 |
| Graduate Degree | 0 (0.0%) | 0.0 |
| Total | 0 (0.0%) | 0.0 |
Fertility by Education by Marriage Status in Groton
| Educational Attainment | Married | Unmarried |
| Less than High School | 0 (0.0%) | 0 (0.0%) |
| High School Diploma | 0 (0.0%) | 0 (0.0%) |
| College or Associate's Degree | 0 (0.0%) | 0 (0.0%) |
| Bachelor's Degree | 0 (0.0%) | 0 (0.0%) |
| Graduate Degree | 0 (0.0%) | 0 (0.0%) |
| Total | 0 (0.0%) | 0 (0.0%) |
Employment Characteristics in Groton
Employment by Class of Employer in Groton
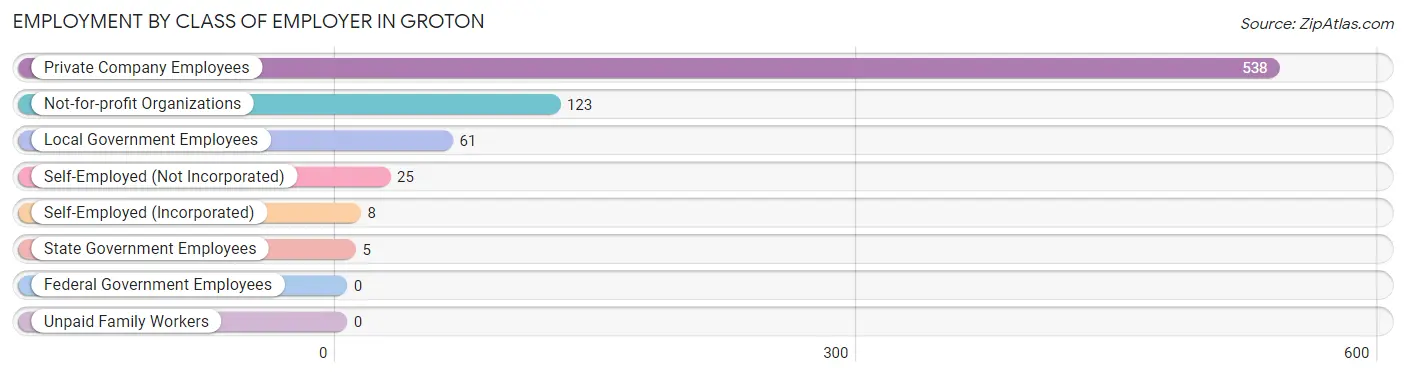
Among the 760 employed individuals in Groton, private company employees (538 | 70.8%), not-for-profit organizations (123 | 16.2%), and local government employees (61 | 8.0%) make up the most common classes of employment.
| Employer Class | # Employees | % Employees |
| Private Company Employees | 538 | 70.8% |
| Self-Employed (Incorporated) | 8 | 1.1% |
| Self-Employed (Not Incorporated) | 25 | 3.3% |
| Not-for-profit Organizations | 123 | 16.2% |
| Local Government Employees | 61 | 8.0% |
| State Government Employees | 5 | 0.7% |
| Federal Government Employees | 0 | 0.0% |
| Unpaid Family Workers | 0 | 0.0% |
| Total | 760 | 100.0% |
Employment Status by Age in Groton
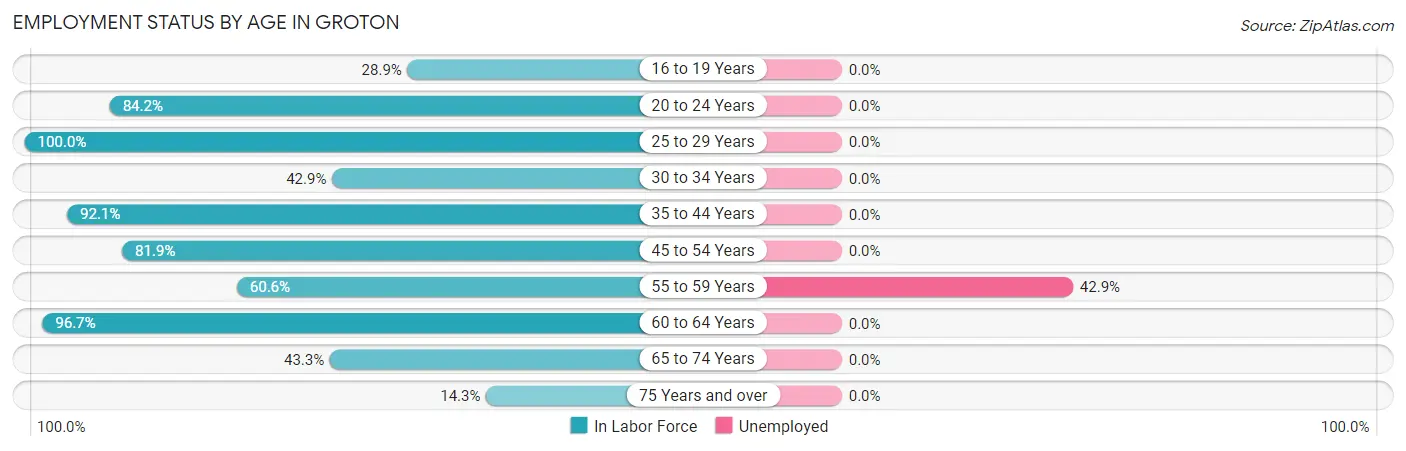
According to the labor force statistics for Groton, out of the total population over 16 years of age (1,198), 65.7% or 787 individuals are in the labor force, with 3.4% or 27 of them unemployed. The age group with the highest labor force participation rate is 25 to 29 years, with 100.0% or 74 individuals in the labor force. Within the labor force, the 55 to 59 years age range has the highest percentage of unemployed individuals, with 42.9% or 27 of them being unemployed.
| Age Bracket | In Labor Force | Unemployed |
| 16 to 19 Years | 52 (28.9%) | 0 (0.0%) |
| 20 to 24 Years | 203 (84.2%) | 0 (0.0%) |
| 25 to 29 Years | 74 (100.0%) | 0 (0.0%) |
| 30 to 34 Years | 9 (42.9%) | 0 (0.0%) |
| 35 to 44 Years | 93 (92.1%) | 0 (0.0%) |
| 45 to 54 Years | 145 (81.9%) | 0 (0.0%) |
| 55 to 59 Years | 63 (60.6%) | 27 (42.9%) |
| 60 to 64 Years | 88 (96.7%) | 0 (0.0%) |
| 65 to 74 Years | 45 (43.3%) | 0 (0.0%) |
| 75 Years and over | 15 (14.3%) | 0 (0.0%) |
| Total | 787 (65.7%) | 27 (3.4%) |
Employment Status by Educational Attainment in Groton
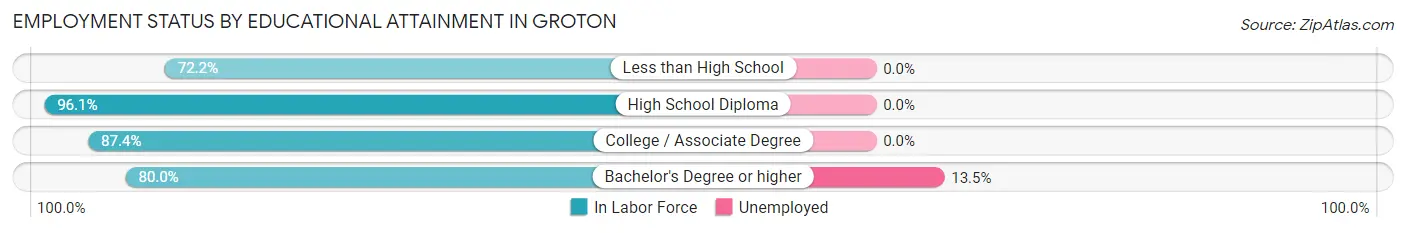
According to labor force statistics for Groton, 83.1% of individuals (472) out of the total population between 25 and 64 years of age (568) are in the labor force, with 5.7% or 27 of them being unemployed. The group with the highest labor force participation rate are those with the educational attainment of high school diploma, with 96.1% or 98 individuals in the labor force. Within the labor force, individuals with bachelor's degree or higher education have the highest percentage of unemployment, with 13.5% or 27 of them being unemployed.
| Educational Attainment | In Labor Force | Unemployed |
| Less than High School | 70 (72.2%) | 0 (0.0%) |
| High School Diploma | 98 (96.1%) | 0 (0.0%) |
| College / Associate Degree | 104 (87.4%) | 0 (0.0%) |
| Bachelor's Degree or higher | 200 (80.0%) | 34 (13.5%) |
| Total | 472 (83.1%) | 32 (5.7%) |
Employment Occupations by Sex in Groton
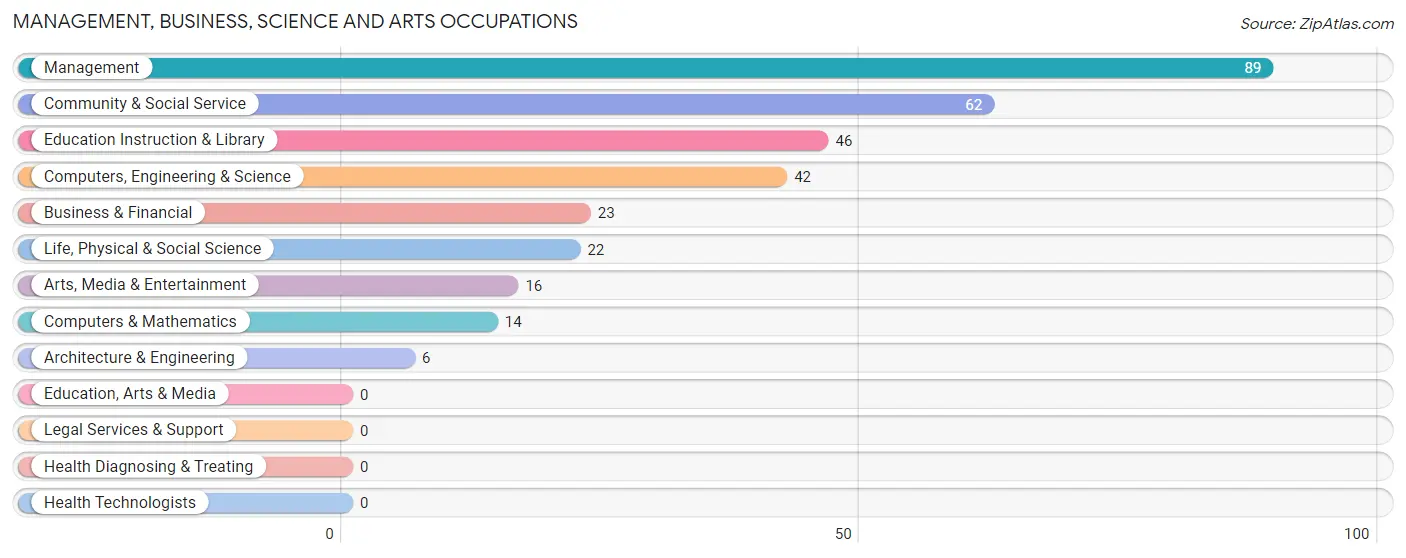
Management, Business, Science and Arts Occupations
The most common Management, Business, Science and Arts occupations in Groton are Management (89 | 11.7%), Community & Social Service (62 | 8.2%), Education Instruction & Library (46 | 6.0%), Computers, Engineering & Science (42 | 5.5%), and Business & Financial (23 | 3.0%).
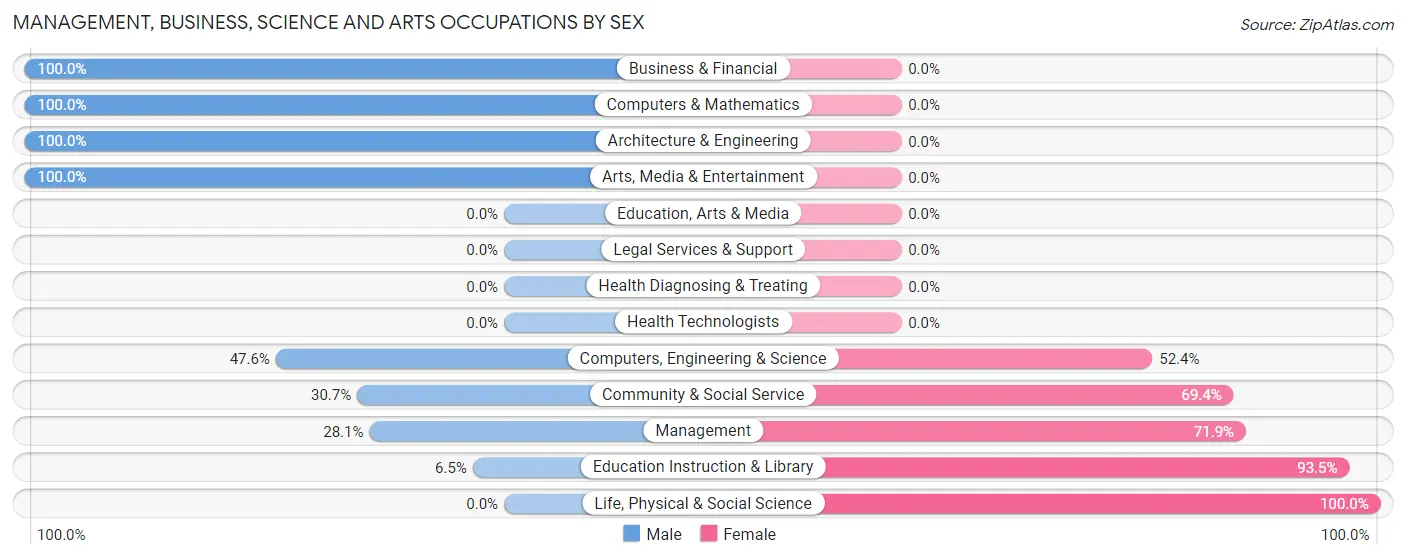
Management, Business, Science and Arts Occupations by Sex
Within the Management, Business, Science and Arts occupations in Groton, the most male-oriented occupations are Business & Financial (100.0%), Computers & Mathematics (100.0%), and Architecture & Engineering (100.0%), while the most female-oriented occupations are Life, Physical & Social Science (100.0%), Education Instruction & Library (93.5%), and Management (71.9%).
| Occupation | Male | Female |
| Management | 25 (28.1%) | 64 (71.9%) |
| Business & Financial | 23 (100.0%) | 0 (0.0%) |
| Computers, Engineering & Science | 20 (47.6%) | 22 (52.4%) |
| Computers & Mathematics | 14 (100.0%) | 0 (0.0%) |
| Architecture & Engineering | 6 (100.0%) | 0 (0.0%) |
| Life, Physical & Social Science | 0 (0.0%) | 22 (100.0%) |
| Community & Social Service | 19 (30.6%) | 43 (69.4%) |
| Education, Arts & Media | 0 (0.0%) | 0 (0.0%) |
| Legal Services & Support | 0 (0.0%) | 0 (0.0%) |
| Education Instruction & Library | 3 (6.5%) | 43 (93.5%) |
| Arts, Media & Entertainment | 16 (100.0%) | 0 (0.0%) |
| Health Diagnosing & Treating | 0 (0.0%) | 0 (0.0%) |
| Health Technologists | 0 (0.0%) | 0 (0.0%) |
| Total (Category) | 87 (40.3%) | 129 (59.7%) |
| Total (Overall) | 330 (43.4%) | 430 (56.6%) |
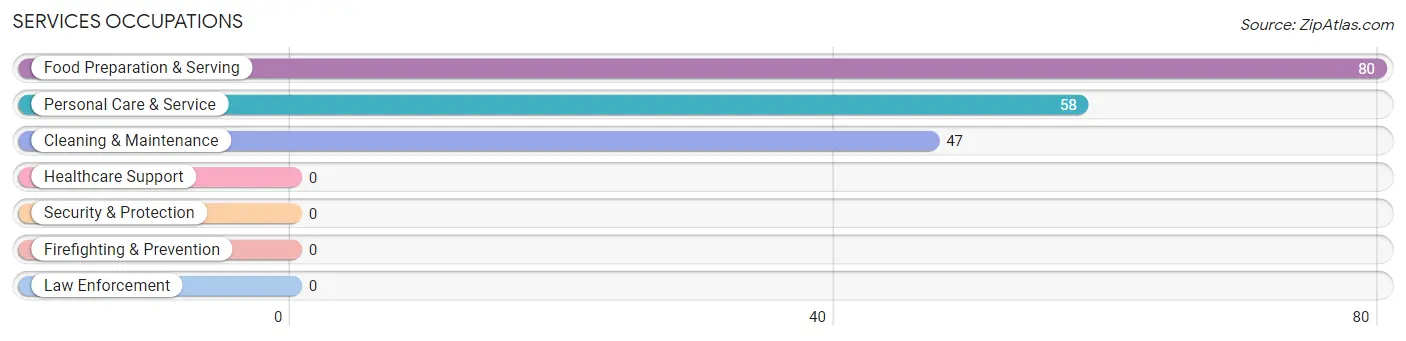
Services Occupations
The most common Services occupations in Groton are Food Preparation & Serving (80 | 10.5%), Personal Care & Service (58 | 7.6%), and Cleaning & Maintenance (47 | 6.2%).
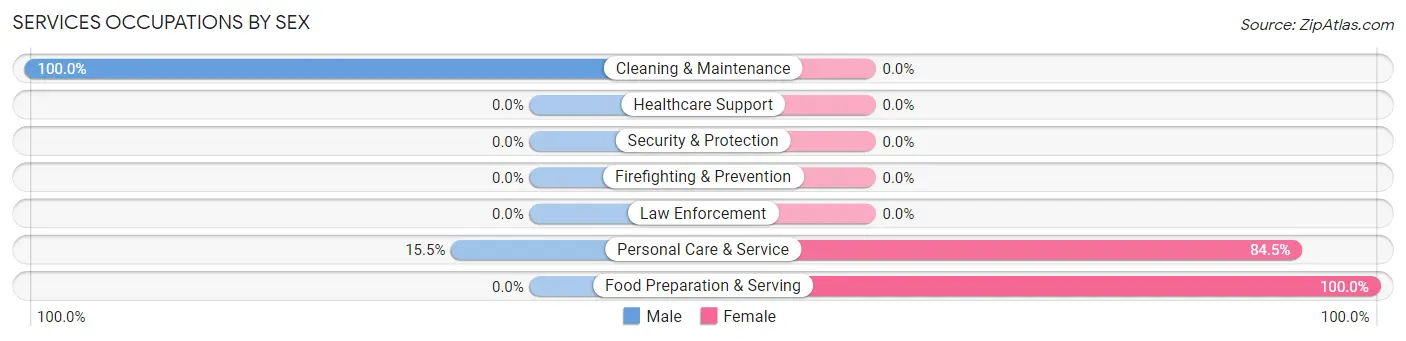
Services Occupations by Sex
Within the Services occupations in Groton, the most male-oriented occupations are Cleaning & Maintenance (100.0%), and Personal Care & Service (15.5%), while the most female-oriented occupations are Food Preparation & Serving (100.0%), and Personal Care & Service (84.5%).
| Occupation | Male | Female |
| Healthcare Support | 0 (0.0%) | 0 (0.0%) |
| Security & Protection | 0 (0.0%) | 0 (0.0%) |
| Firefighting & Prevention | 0 (0.0%) | 0 (0.0%) |
| Law Enforcement | 0 (0.0%) | 0 (0.0%) |
| Food Preparation & Serving | 0 (0.0%) | 80 (100.0%) |
| Cleaning & Maintenance | 47 (100.0%) | 0 (0.0%) |
| Personal Care & Service | 9 (15.5%) | 49 (84.5%) |
| Total (Category) | 56 (30.3%) | 129 (69.7%) |
| Total (Overall) | 330 (43.4%) | 430 (56.6%) |
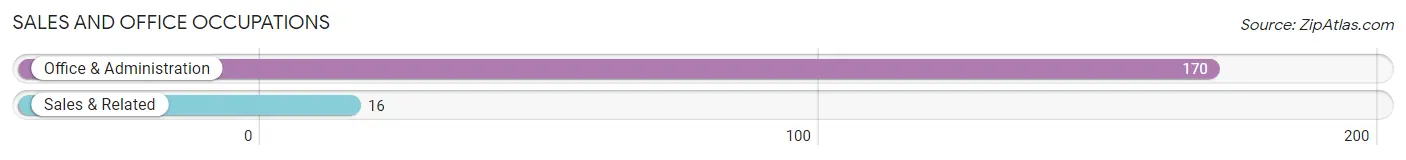
Sales and Office Occupations
The most common Sales and Office occupations in Groton are Office & Administration (170 | 22.4%), and Sales & Related (16 | 2.1%).
Sales and Office Occupations by Sex
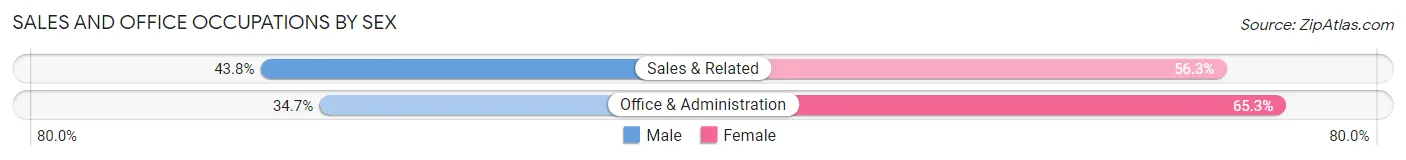
| Occupation | Male | Female |
| Sales & Related | 7 (43.8%) | 9 (56.2%) |
| Office & Administration | 59 (34.7%) | 111 (65.3%) |
| Total (Category) | 66 (35.5%) | 120 (64.5%) |
| Total (Overall) | 330 (43.4%) | 430 (56.6%) |
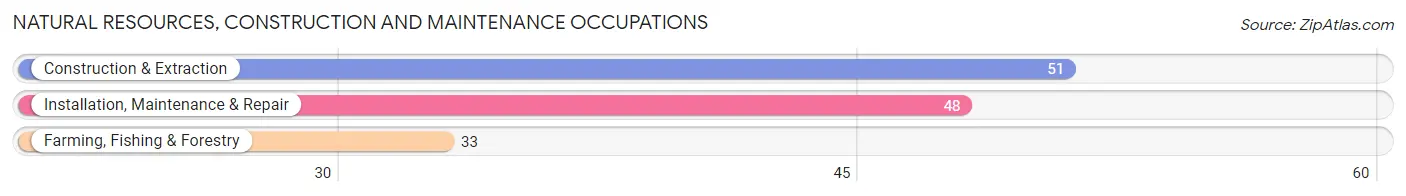
Natural Resources, Construction and Maintenance Occupations
The most common Natural Resources, Construction and Maintenance occupations in Groton are Construction & Extraction (51 | 6.7%), Installation, Maintenance & Repair (48 | 6.3%), and Farming, Fishing & Forestry (33 | 4.3%).
Natural Resources, Construction and Maintenance Occupations by Sex
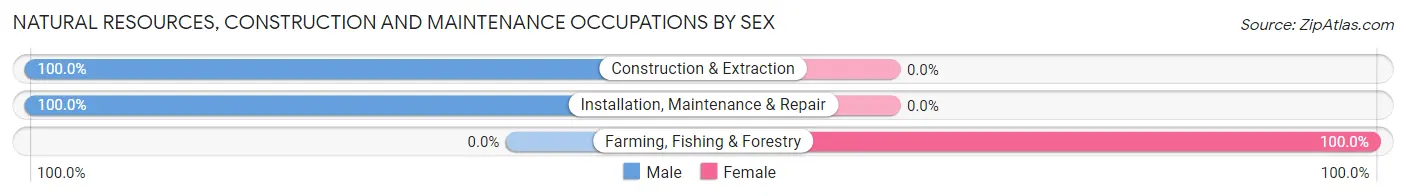
| Occupation | Male | Female |
| Farming, Fishing & Forestry | 0 (0.0%) | 33 (100.0%) |
| Construction & Extraction | 51 (100.0%) | 0 (0.0%) |
| Installation, Maintenance & Repair | 48 (100.0%) | 0 (0.0%) |
| Total (Category) | 99 (75.0%) | 33 (25.0%) |
| Total (Overall) | 330 (43.4%) | 430 (56.6%) |
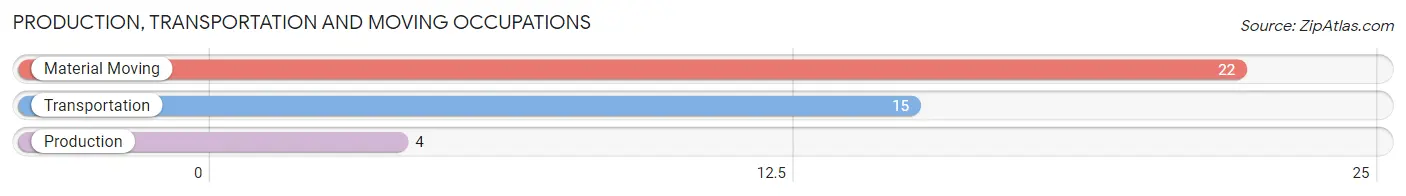
Production, Transportation and Moving Occupations
The most common Production, Transportation and Moving occupations in Groton are Material Moving (22 | 2.9%), Transportation (15 | 2.0%), and Production (4 | 0.5%).
Production, Transportation and Moving Occupations by Sex
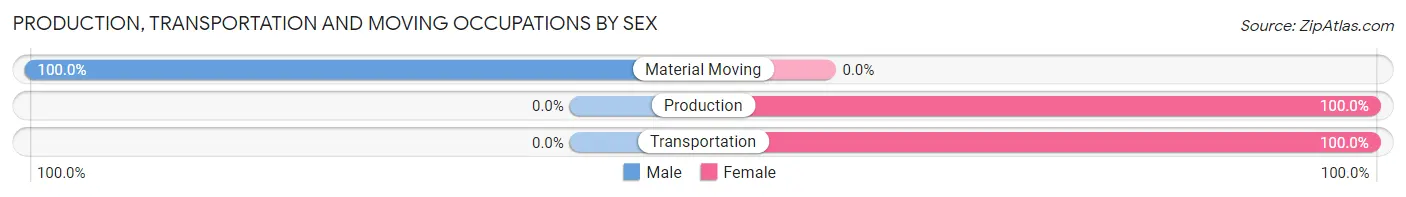
| Occupation | Male | Female |
| Production | 0 (0.0%) | 4 (100.0%) |
| Transportation | 0 (0.0%) | 15 (100.0%) |
| Material Moving | 22 (100.0%) | 0 (0.0%) |
| Total (Category) | 22 (53.7%) | 19 (46.3%) |
| Total (Overall) | 330 (43.4%) | 430 (56.6%) |
Employment Industries by Sex in Groton
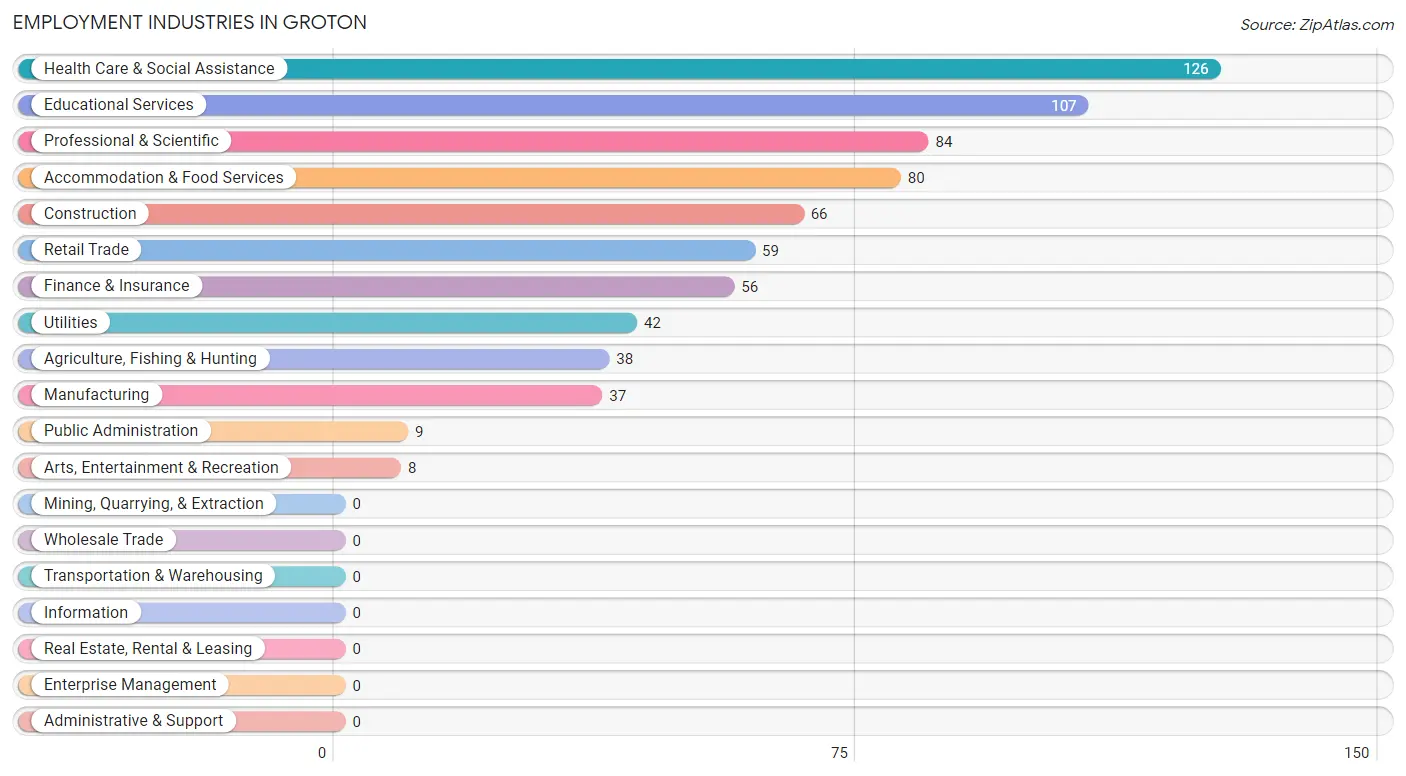
Employment Industries in Groton
The major employment industries in Groton include Health Care & Social Assistance (126 | 16.6%), Educational Services (107 | 14.1%), Professional & Scientific (84 | 11.1%), Accommodation & Food Services (80 | 10.5%), and Construction (66 | 8.7%).
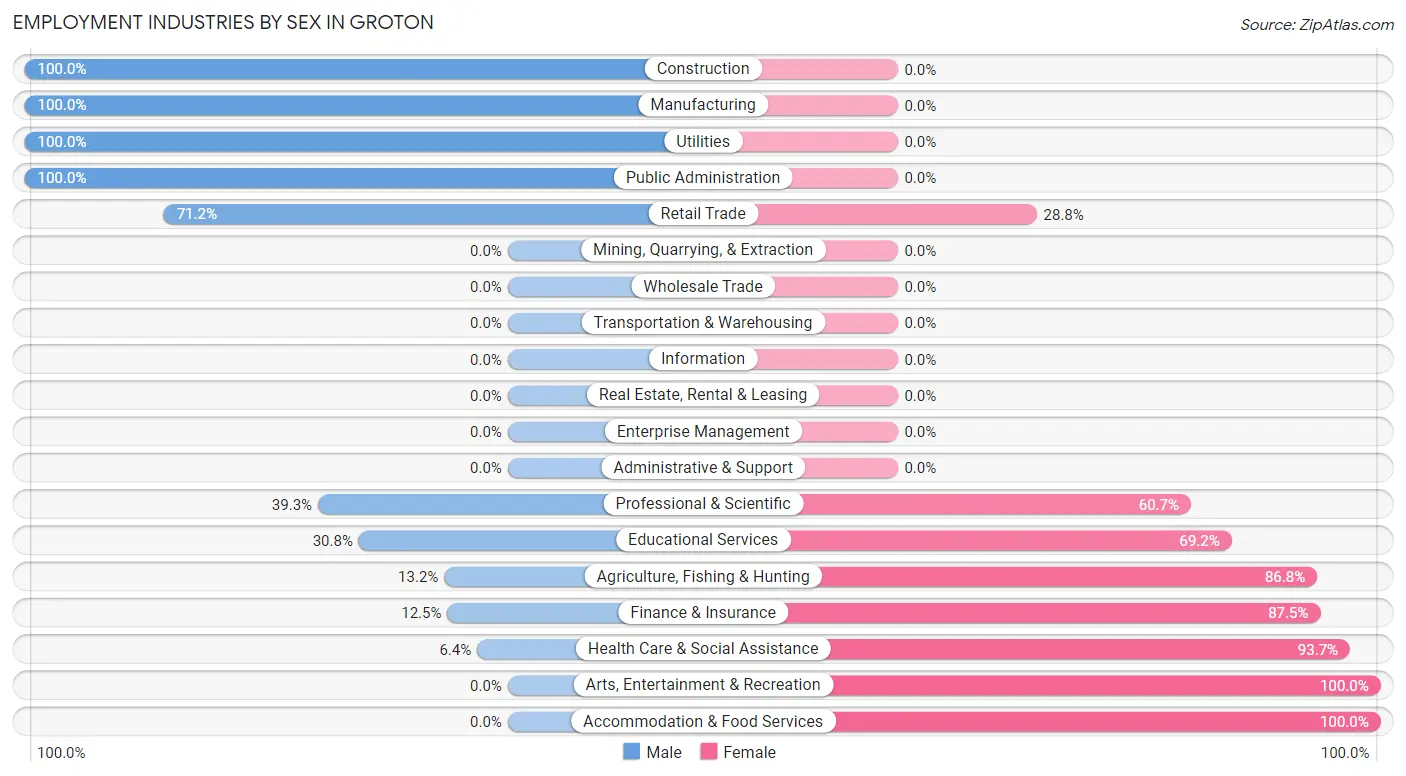
Employment Industries by Sex in Groton
The Groton industries that see more men than women are Construction (100.0%), Manufacturing (100.0%), and Utilities (100.0%), whereas the industries that tend to have a higher number of women are Arts, Entertainment & Recreation (100.0%), Accommodation & Food Services (100.0%), and Health Care & Social Assistance (93.6%).
| Industry | Male | Female |
| Agriculture, Fishing & Hunting | 5 (13.2%) | 33 (86.8%) |
| Mining, Quarrying, & Extraction | 0 (0.0%) | 0 (0.0%) |
| Construction | 66 (100.0%) | 0 (0.0%) |
| Manufacturing | 37 (100.0%) | 0 (0.0%) |
| Wholesale Trade | 0 (0.0%) | 0 (0.0%) |
| Retail Trade | 42 (71.2%) | 17 (28.8%) |
| Transportation & Warehousing | 0 (0.0%) | 0 (0.0%) |
| Utilities | 42 (100.0%) | 0 (0.0%) |
| Information | 0 (0.0%) | 0 (0.0%) |
| Finance & Insurance | 7 (12.5%) | 49 (87.5%) |
| Real Estate, Rental & Leasing | 0 (0.0%) | 0 (0.0%) |
| Professional & Scientific | 33 (39.3%) | 51 (60.7%) |
| Enterprise Management | 0 (0.0%) | 0 (0.0%) |
| Administrative & Support | 0 (0.0%) | 0 (0.0%) |
| Educational Services | 33 (30.8%) | 74 (69.2%) |
| Health Care & Social Assistance | 8 (6.4%) | 118 (93.6%) |
| Arts, Entertainment & Recreation | 0 (0.0%) | 8 (100.0%) |
| Accommodation & Food Services | 0 (0.0%) | 80 (100.0%) |
| Public Administration | 9 (100.0%) | 0 (0.0%) |
| Total | 330 (43.4%) | 430 (56.6%) |
Education in Groton
School Enrollment in Groton
The most common levels of schooling among the 471 students in Groton are high school (221 | 46.9%), middle school (109 | 23.1%), and elementary school (64 | 13.6%).
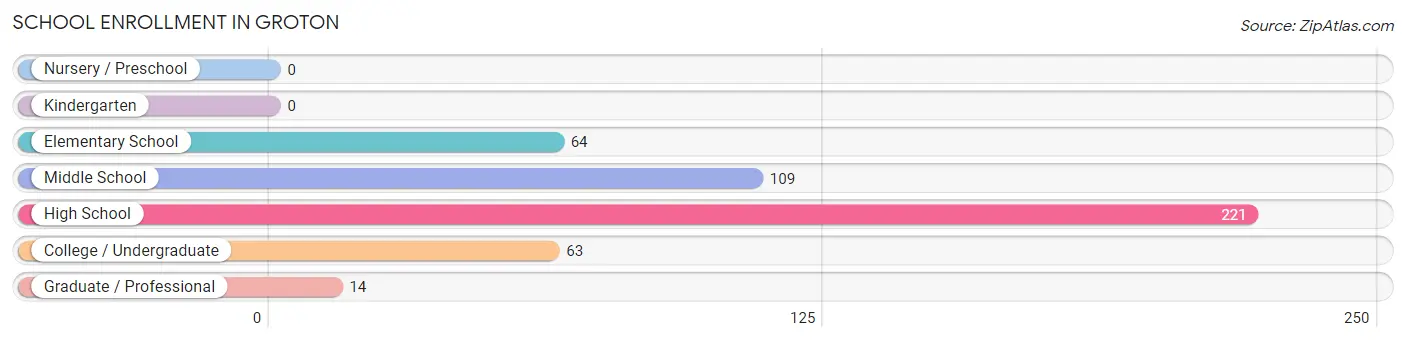
| School Level | # Students | % Students |
| Nursery / Preschool | 0 | 0.0% |
| Kindergarten | 0 | 0.0% |
| Elementary School | 64 | 13.6% |
| Middle School | 109 | 23.1% |
| High School | 221 | 46.9% |
| College / Undergraduate | 63 | 13.4% |
| Graduate / Professional | 14 | 3.0% |
| Total | 471 | 100.0% |
School Enrollment by Age by Funding Source in Groton
Out of a total of 471 students who are enrolled in schools in Groton, 119 (25.3%) attend a private institution, while the remaining 352 (74.7%) are enrolled in public schools. The age group of 35 years and over has the highest likelihood of being enrolled in private schools, with 14 (100.0% in the age bracket) enrolled. Conversely, the age group of 5 to 9 year old has the lowest likelihood of being enrolled in a private school, with 52 (100.0% in the age bracket) attending a public institution.
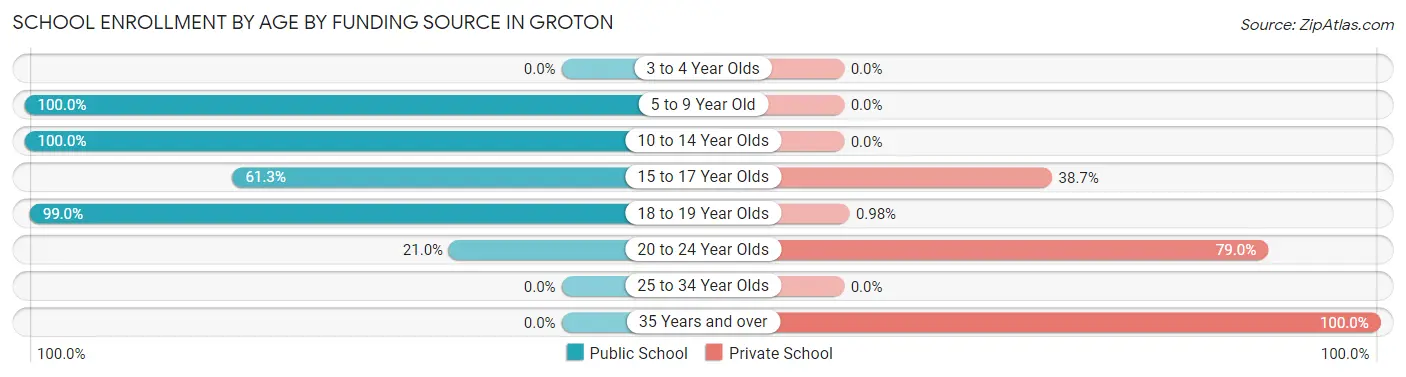
| Age Bracket | Public School | Private School |
| 3 to 4 Year Olds | 0 (0.0%) | 0 (0.0%) |
| 5 to 9 Year Old | 52 (100.0%) | 0 (0.0%) |
| 10 to 14 Year Olds | 99 (100.0%) | 0 (0.0%) |
| 15 to 17 Year Olds | 87 (61.3%) | 55 (38.7%) |
| 18 to 19 Year Olds | 101 (99.0%) | 1 (1.0%) |
| 20 to 24 Year Olds | 13 (21.0%) | 49 (79.0%) |
| 25 to 34 Year Olds | 0 (0.0%) | 0 (0.0%) |
| 35 Years and over | 0 (0.0%) | 14 (100.0%) |
| Total | 352 (74.7%) | 119 (25.3%) |
Educational Attainment by Field of Study in Groton
Psychology (72 | 20.1%), social sciences (60 | 16.8%), literature & languages (43 | 12.0%), bio, nature & agricultural (39 | 10.9%), and physical & health sciences (28 | 7.8%) are the most common fields of study among 358 individuals in Groton who have obtained a bachelor's degree or higher.
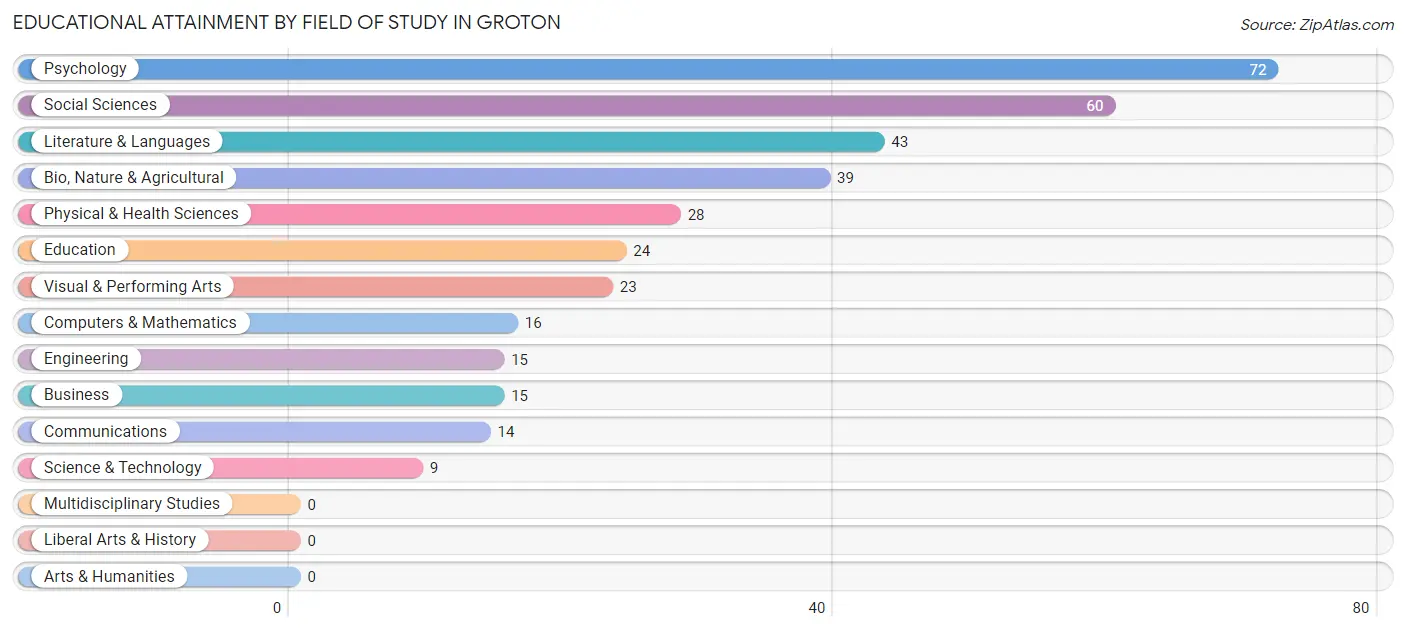
| Field of Study | # Graduates | % Graduates |
| Computers & Mathematics | 16 | 4.5% |
| Bio, Nature & Agricultural | 39 | 10.9% |
| Physical & Health Sciences | 28 | 7.8% |
| Psychology | 72 | 20.1% |
| Social Sciences | 60 | 16.8% |
| Engineering | 15 | 4.2% |
| Multidisciplinary Studies | 0 | 0.0% |
| Science & Technology | 9 | 2.5% |
| Business | 15 | 4.2% |
| Education | 24 | 6.7% |
| Literature & Languages | 43 | 12.0% |
| Liberal Arts & History | 0 | 0.0% |
| Visual & Performing Arts | 23 | 6.4% |
| Communications | 14 | 3.9% |
| Arts & Humanities | 0 | 0.0% |
| Total | 358 | 100.0% |
Transportation & Commute in Groton
Vehicle Availability by Sex in Groton
The most prevalent vehicle ownership categories in Groton are males with 5 or more vehicles (179, accounting for 60.5%) and females with 5 or more vehicles (206, making up 45.8%).
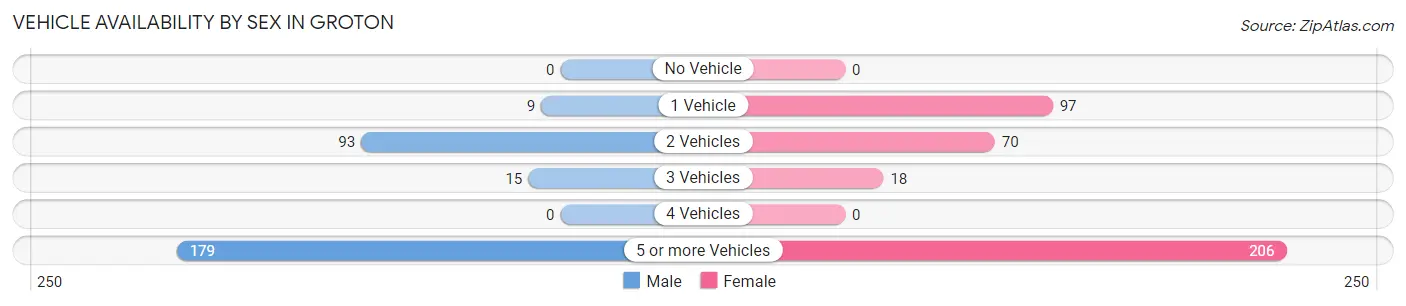
| Vehicles Available | Male | Female |
| No Vehicle | 0 (0.0%) | 0 (0.0%) |
| 1 Vehicle | 9 (3.0%) | 97 (24.8%) |
| 2 Vehicles | 93 (31.4%) | 70 (17.9%) |
| 3 Vehicles | 15 (5.1%) | 18 (4.6%) |
| 4 Vehicles | 0 (0.0%) | 0 (0.0%) |
| 5 or more Vehicles | 179 (60.5%) | 206 (52.7%) |
| Total | 296 (100.0%) | 391 (100.0%) |
Commute Time in Groton
The most frequently occuring commute durations in Groton are 25 to 29 minutes (95 commuters, 14.9%), 30 to 34 minutes (88 commuters, 13.8%), and 20 to 24 minutes (82 commuters, 12.9%).
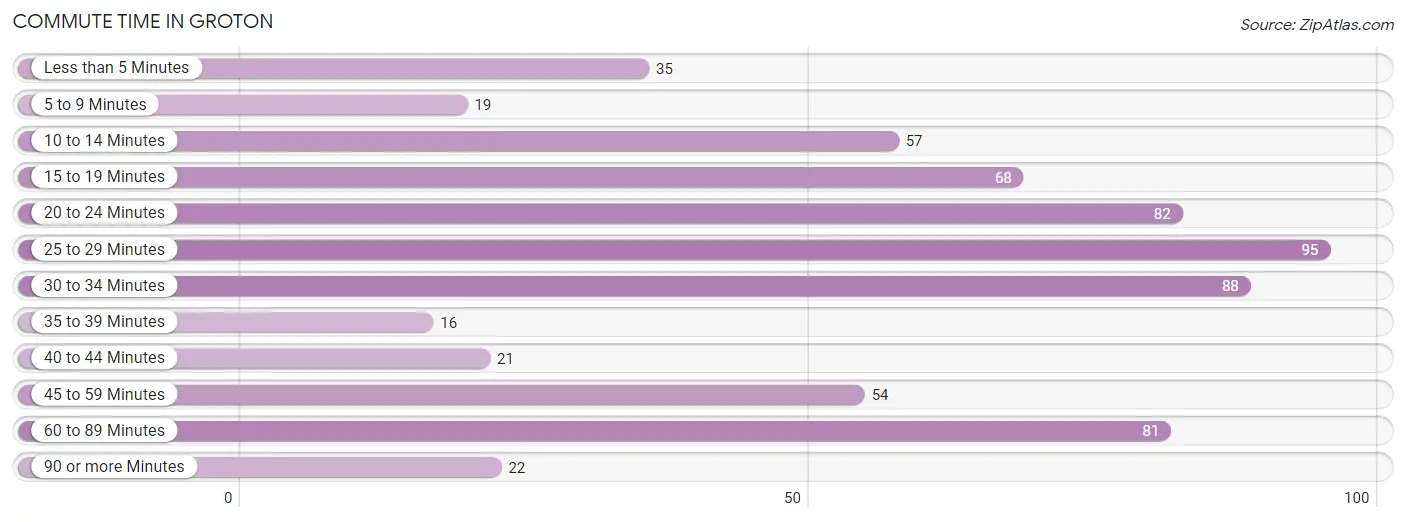
| Commute Time | # Commuters | % Commuters |
| Less than 5 Minutes | 35 | 5.5% |
| 5 to 9 Minutes | 19 | 3.0% |
| 10 to 14 Minutes | 57 | 8.9% |
| 15 to 19 Minutes | 68 | 10.7% |
| 20 to 24 Minutes | 82 | 12.9% |
| 25 to 29 Minutes | 95 | 14.9% |
| 30 to 34 Minutes | 88 | 13.8% |
| 35 to 39 Minutes | 16 | 2.5% |
| 40 to 44 Minutes | 21 | 3.3% |
| 45 to 59 Minutes | 54 | 8.5% |
| 60 to 89 Minutes | 81 | 12.7% |
| 90 or more Minutes | 22 | 3.5% |
Commute Time by Sex in Groton
The most common commute times in Groton are 60 to 89 minutes (63 commuters, 22.8%) for males and 30 to 34 minutes (79 commuters, 21.8%) for females.
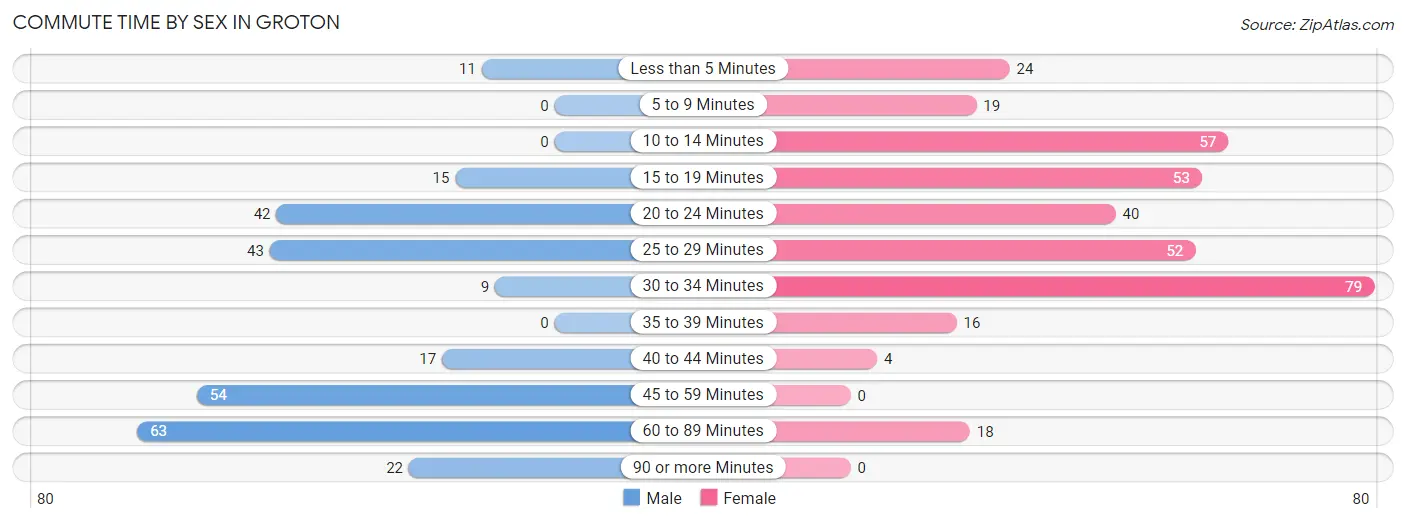
| Commute Time | Male | Female |
| Less than 5 Minutes | 11 (4.0%) | 24 (6.6%) |
| 5 to 9 Minutes | 0 (0.0%) | 19 (5.2%) |
| 10 to 14 Minutes | 0 (0.0%) | 57 (15.8%) |
| 15 to 19 Minutes | 15 (5.4%) | 53 (14.6%) |
| 20 to 24 Minutes | 42 (15.2%) | 40 (11.1%) |
| 25 to 29 Minutes | 43 (15.6%) | 52 (14.4%) |
| 30 to 34 Minutes | 9 (3.3%) | 79 (21.8%) |
| 35 to 39 Minutes | 0 (0.0%) | 16 (4.4%) |
| 40 to 44 Minutes | 17 (6.2%) | 4 (1.1%) |
| 45 to 59 Minutes | 54 (19.6%) | 0 (0.0%) |
| 60 to 89 Minutes | 63 (22.8%) | 18 (5.0%) |
| 90 or more Minutes | 22 (8.0%) | 0 (0.0%) |
Time of Departure to Work by Sex in Groton
The most frequent times of departure to work in Groton are 9:00 AM to 9:59 AM (48, 17.4%) for males and 8:00 AM to 8:29 AM (180, 49.7%) for females.
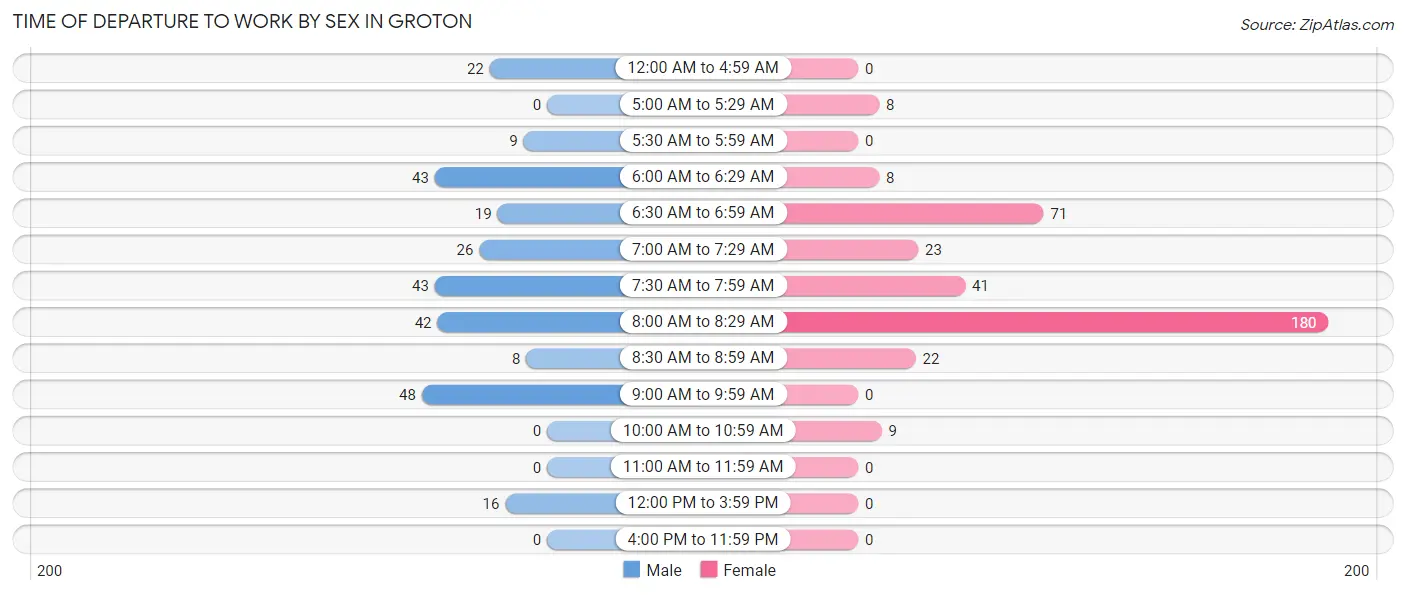
| Time of Departure | Male | Female |
| 12:00 AM to 4:59 AM | 22 (8.0%) | 0 (0.0%) |
| 5:00 AM to 5:29 AM | 0 (0.0%) | 8 (2.2%) |
| 5:30 AM to 5:59 AM | 9 (3.3%) | 0 (0.0%) |
| 6:00 AM to 6:29 AM | 43 (15.6%) | 8 (2.2%) |
| 6:30 AM to 6:59 AM | 19 (6.9%) | 71 (19.6%) |
| 7:00 AM to 7:29 AM | 26 (9.4%) | 23 (6.4%) |
| 7:30 AM to 7:59 AM | 43 (15.6%) | 41 (11.3%) |
| 8:00 AM to 8:29 AM | 42 (15.2%) | 180 (49.7%) |
| 8:30 AM to 8:59 AM | 8 (2.9%) | 22 (6.1%) |
| 9:00 AM to 9:59 AM | 48 (17.4%) | 0 (0.0%) |
| 10:00 AM to 10:59 AM | 0 (0.0%) | 9 (2.5%) |
| 11:00 AM to 11:59 AM | 0 (0.0%) | 0 (0.0%) |
| 12:00 PM to 3:59 PM | 16 (5.8%) | 0 (0.0%) |
| 4:00 PM to 11:59 PM | 0 (0.0%) | 0 (0.0%) |
| Total | 276 (100.0%) | 362 (100.0%) |
Housing Occupancy in Groton
Occupancy by Ownership in Groton
Of the total 381 dwellings in Groton, owner-occupied units account for 210 (55.1%), while renter-occupied units make up 171 (44.9%).
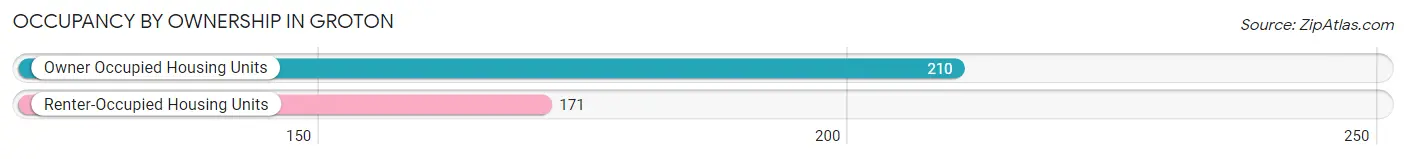
| Occupancy | # Housing Units | % Housing Units |
| Owner Occupied Housing Units | 210 | 55.1% |
| Renter-Occupied Housing Units | 171 | 44.9% |
| Total Occupied Housing Units | 381 | 100.0% |
Occupancy by Household Size in Groton
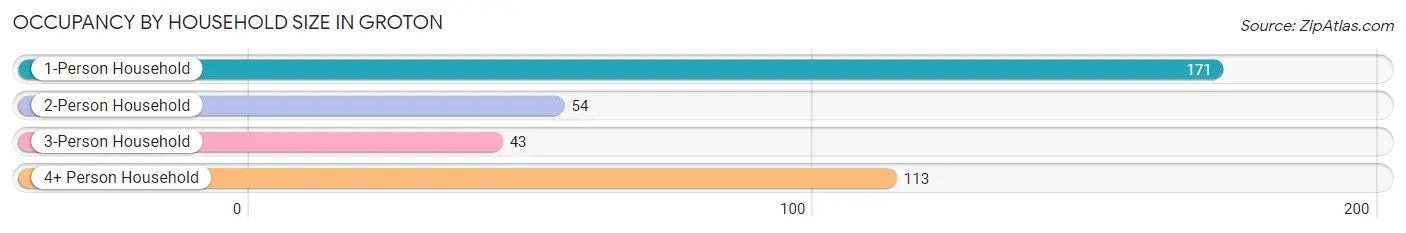
| Household Size | # Housing Units | % Housing Units |
| 1-Person Household | 171 | 44.9% |
| 2-Person Household | 54 | 14.2% |
| 3-Person Household | 43 | 11.3% |
| 4+ Person Household | 113 | 29.7% |
| Total Housing Units | 381 | 100.0% |
Occupancy by Ownership by Household Size in Groton
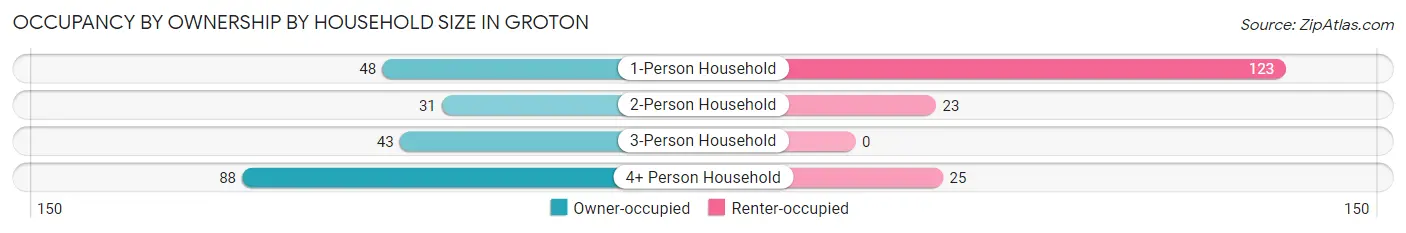
| Household Size | Owner-occupied | Renter-occupied |
| 1-Person Household | 48 (28.1%) | 123 (71.9%) |
| 2-Person Household | 31 (57.4%) | 23 (42.6%) |
| 3-Person Household | 43 (100.0%) | 0 (0.0%) |
| 4+ Person Household | 88 (77.9%) | 25 (22.1%) |
| Total Housing Units | 210 (55.1%) | 171 (44.9%) |
Occupancy by Educational Attainment in Groton
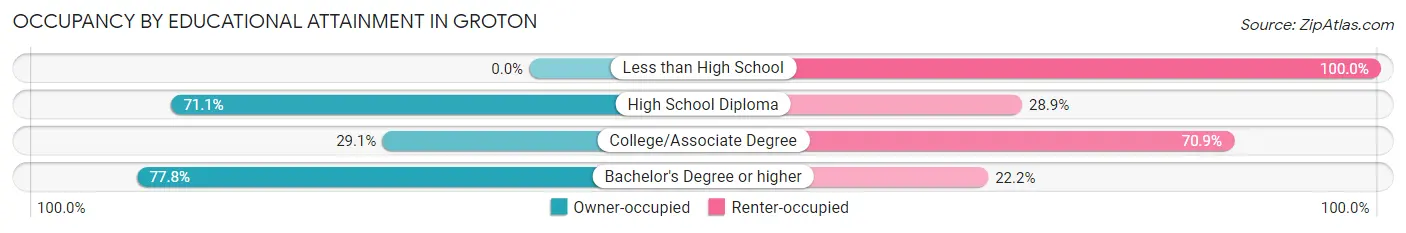
| Household Size | Owner-occupied | Renter-occupied |
| Less than High School | 0 (0.0%) | 20 (100.0%) |
| High School Diploma | 59 (71.1%) | 24 (28.9%) |
| College/Associate Degree | 39 (29.1%) | 95 (70.9%) |
| Bachelor's Degree or higher | 112 (77.8%) | 32 (22.2%) |
Occupancy by Age of Householder in Groton
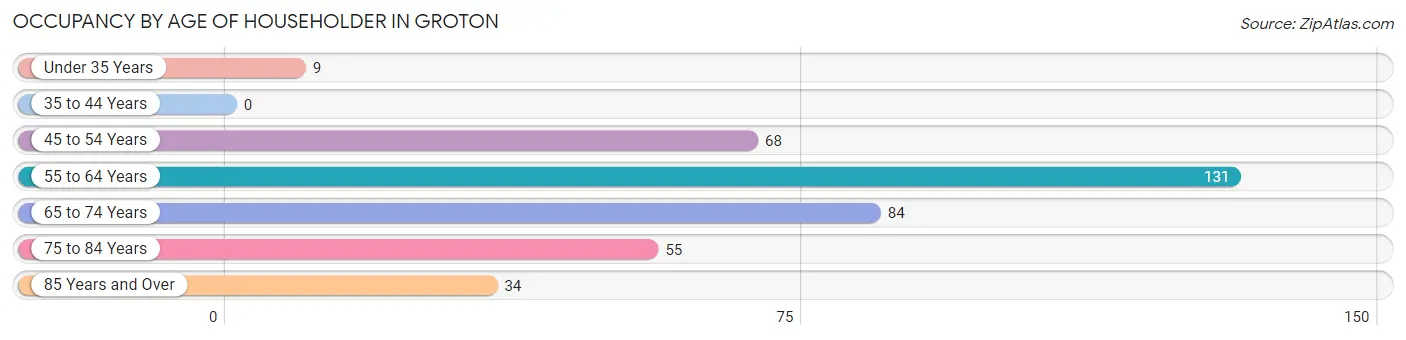
| Age Bracket | # Households | % Households |
| Under 35 Years | 9 | 2.4% |
| 35 to 44 Years | 0 | 0.0% |
| 45 to 54 Years | 68 | 17.8% |
| 55 to 64 Years | 131 | 34.4% |
| 65 to 74 Years | 84 | 22.1% |
| 75 to 84 Years | 55 | 14.4% |
| 85 Years and Over | 34 | 8.9% |
| Total | 381 | 100.0% |
Housing Finances in Groton
Median Income by Occupancy in Groton
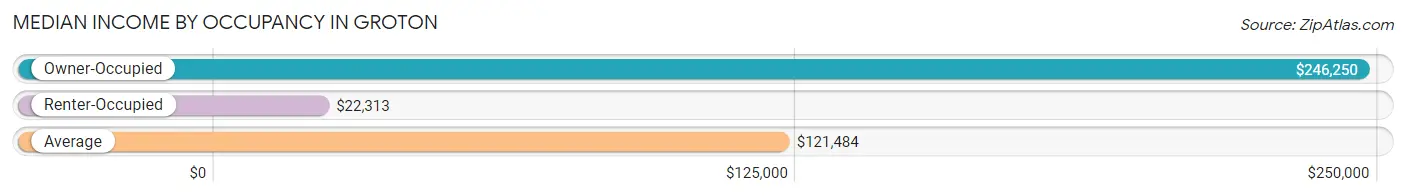
| Occupancy Type | # Households | Median Income |
| Owner-Occupied | 210 (55.1%) | $246,250 |
| Renter-Occupied | 171 (44.9%) | $22,313 |
| Average | 381 (100.0%) | $121,484 |
Occupancy by Householder Income Bracket in Groton
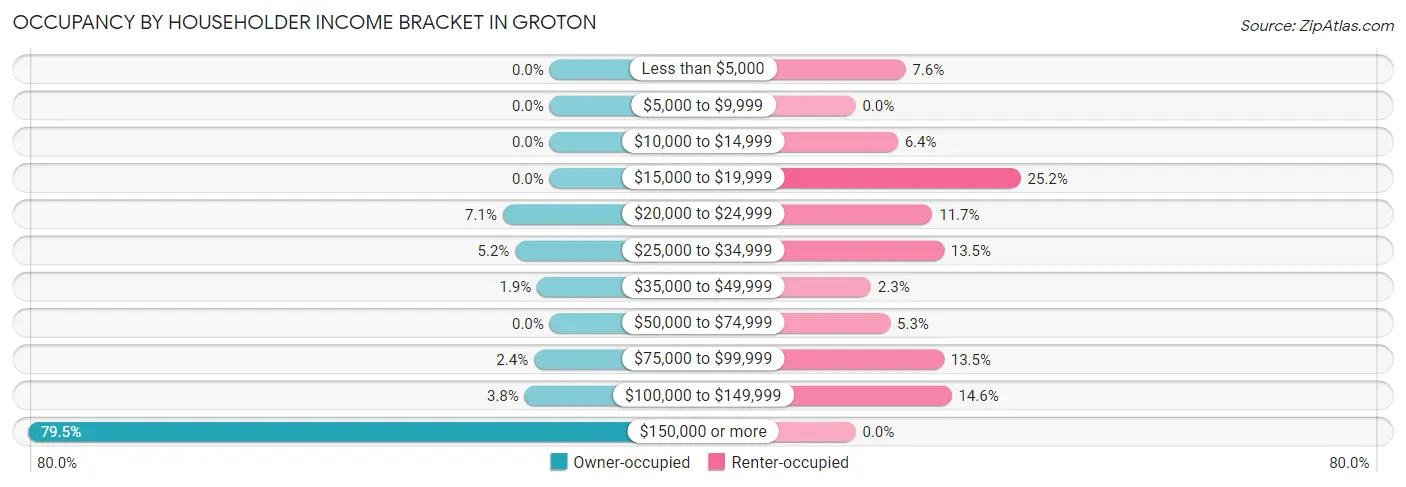
| Income Bracket | Owner-occupied | Renter-occupied |
| Less than $5,000 | 0 (0.0%) | 13 (7.6%) |
| $5,000 to $9,999 | 0 (0.0%) | 0 (0.0%) |
| $10,000 to $14,999 | 0 (0.0%) | 11 (6.4%) |
| $15,000 to $19,999 | 0 (0.0%) | 43 (25.2%) |
| $20,000 to $24,999 | 15 (7.1%) | 20 (11.7%) |
| $25,000 to $34,999 | 11 (5.2%) | 23 (13.5%) |
| $35,000 to $49,999 | 4 (1.9%) | 4 (2.3%) |
| $50,000 to $74,999 | 0 (0.0%) | 9 (5.3%) |
| $75,000 to $99,999 | 5 (2.4%) | 23 (13.5%) |
| $100,000 to $149,999 | 8 (3.8%) | 25 (14.6%) |
| $150,000 or more | 167 (79.5%) | 0 (0.0%) |
| Total | 210 (100.0%) | 171 (100.0%) |
Monthly Housing Cost Tiers in Groton
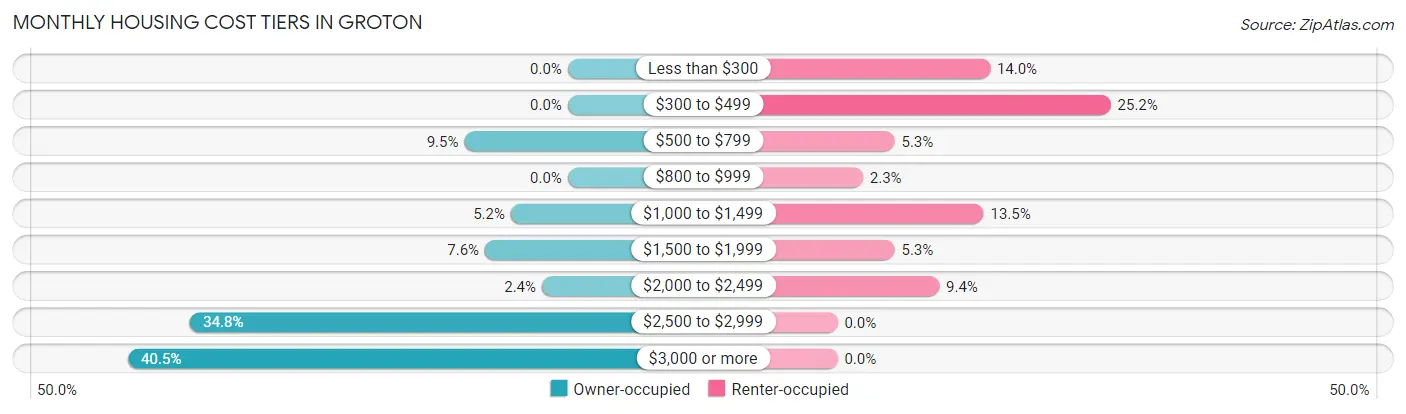
| Monthly Cost | Owner-occupied | Renter-occupied |
| Less than $300 | 0 (0.0%) | 24 (14.0%) |
| $300 to $499 | 0 (0.0%) | 43 (25.2%) |
| $500 to $799 | 20 (9.5%) | 9 (5.3%) |
| $800 to $999 | 0 (0.0%) | 4 (2.3%) |
| $1,000 to $1,499 | 11 (5.2%) | 23 (13.5%) |
| $1,500 to $1,999 | 16 (7.6%) | 9 (5.3%) |
| $2,000 to $2,499 | 5 (2.4%) | 16 (9.4%) |
| $2,500 to $2,999 | 73 (34.8%) | 0 (0.0%) |
| $3,000 or more | 85 (40.5%) | 0 (0.0%) |
| Total | 210 (100.0%) | 171 (100.0%) |
Physical Housing Characteristics in Groton
Housing Structures in Groton
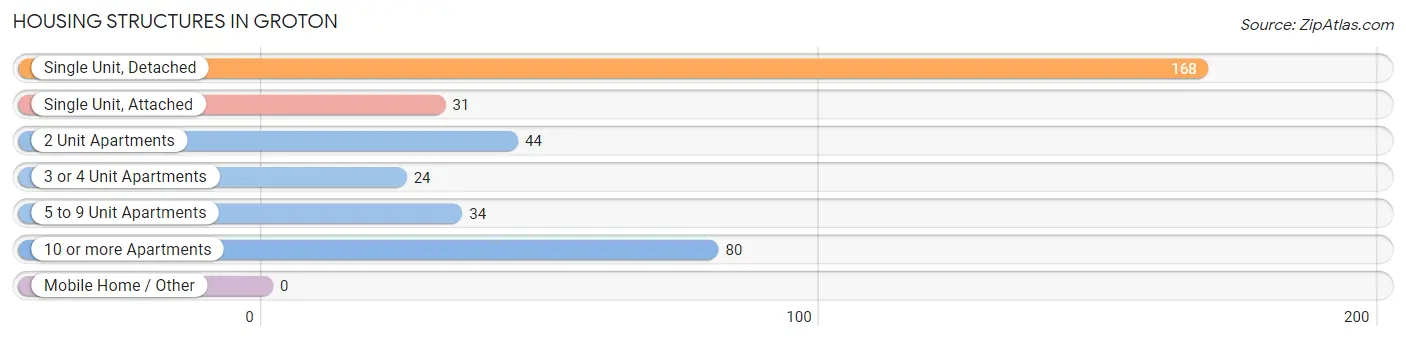
| Structure Type | # Housing Units | % Housing Units |
| Single Unit, Detached | 168 | 44.1% |
| Single Unit, Attached | 31 | 8.1% |
| 2 Unit Apartments | 44 | 11.6% |
| 3 or 4 Unit Apartments | 24 | 6.3% |
| 5 to 9 Unit Apartments | 34 | 8.9% |
| 10 or more Apartments | 80 | 21.0% |
| Mobile Home / Other | 0 | 0.0% |
| Total | 381 | 100.0% |
Housing Structures by Occupancy in Groton
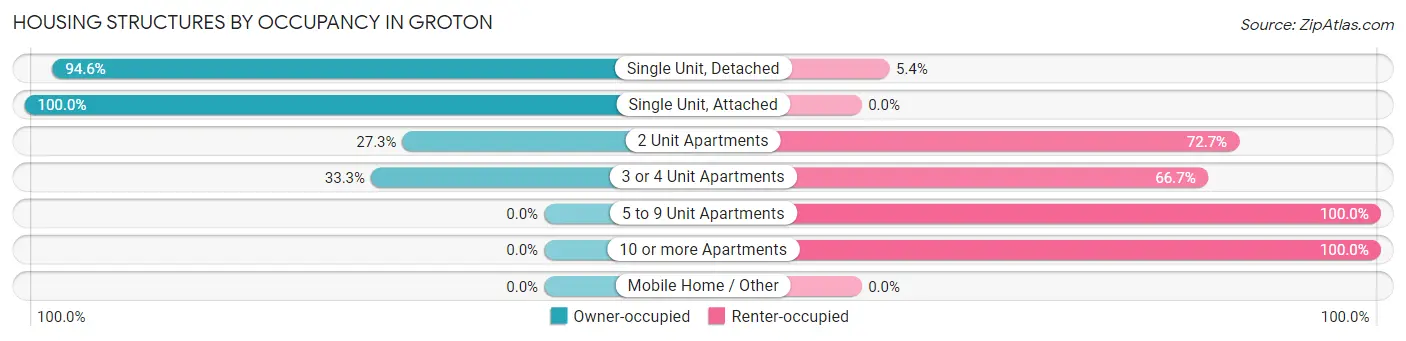
| Structure Type | Owner-occupied | Renter-occupied |
| Single Unit, Detached | 159 (94.6%) | 9 (5.4%) |
| Single Unit, Attached | 31 (100.0%) | 0 (0.0%) |
| 2 Unit Apartments | 12 (27.3%) | 32 (72.7%) |
| 3 or 4 Unit Apartments | 8 (33.3%) | 16 (66.7%) |
| 5 to 9 Unit Apartments | 0 (0.0%) | 34 (100.0%) |
| 10 or more Apartments | 0 (0.0%) | 80 (100.0%) |
| Mobile Home / Other | 0 (0.0%) | 0 (0.0%) |
| Total | 210 (55.1%) | 171 (44.9%) |
Housing Structures by Number of Rooms in Groton
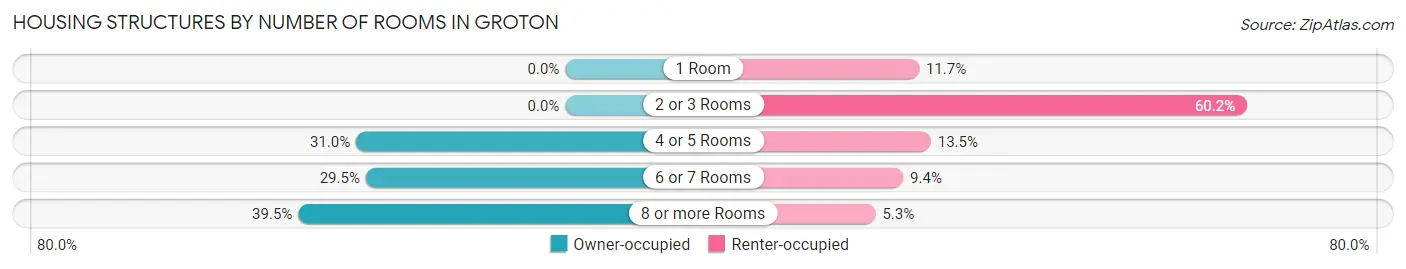
| Number of Rooms | Owner-occupied | Renter-occupied |
| 1 Room | 0 (0.0%) | 20 (11.7%) |
| 2 or 3 Rooms | 0 (0.0%) | 103 (60.2%) |
| 4 or 5 Rooms | 65 (30.9%) | 23 (13.5%) |
| 6 or 7 Rooms | 62 (29.5%) | 16 (9.4%) |
| 8 or more Rooms | 83 (39.5%) | 9 (5.3%) |
| Total | 210 (100.0%) | 171 (100.0%) |
Housing Structure by Heating Type in Groton
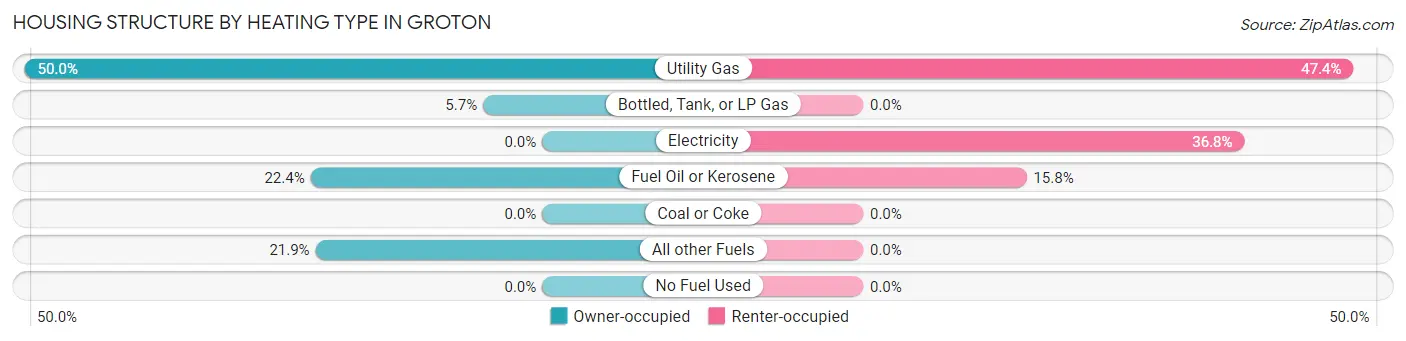
| Heating Type | Owner-occupied | Renter-occupied |
| Utility Gas | 105 (50.0%) | 81 (47.4%) |
| Bottled, Tank, or LP Gas | 12 (5.7%) | 0 (0.0%) |
| Electricity | 0 (0.0%) | 63 (36.8%) |
| Fuel Oil or Kerosene | 47 (22.4%) | 27 (15.8%) |
| Coal or Coke | 0 (0.0%) | 0 (0.0%) |
| All other Fuels | 46 (21.9%) | 0 (0.0%) |
| No Fuel Used | 0 (0.0%) | 0 (0.0%) |
| Total | 210 (100.0%) | 171 (100.0%) |
Household Vehicle Usage in Groton
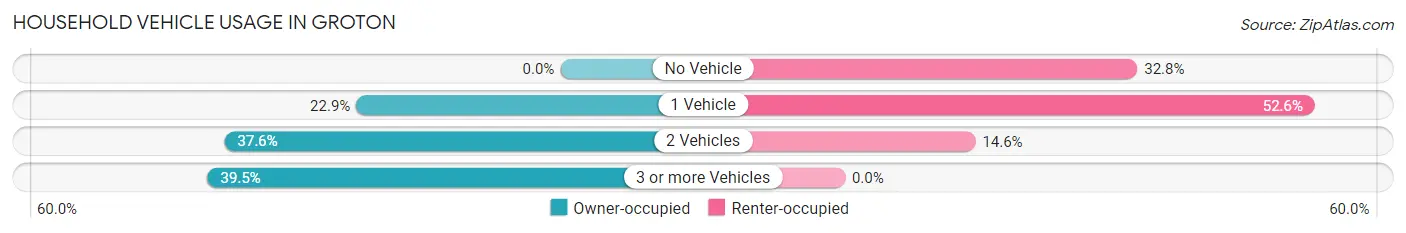
| Vehicles per Household | Owner-occupied | Renter-occupied |
| No Vehicle | 0 (0.0%) | 56 (32.8%) |
| 1 Vehicle | 48 (22.9%) | 90 (52.6%) |
| 2 Vehicles | 79 (37.6%) | 25 (14.6%) |
| 3 or more Vehicles | 83 (39.5%) | 0 (0.0%) |
| Total | 210 (100.0%) | 171 (100.0%) |
Real Estate & Mortgages in Groton
Real Estate and Mortgage Overview in Groton
| Characteristic | Without Mortgage | With Mortgage |
| Housing Units | 33 | 177 |
| Median Property Value | $757,400 | $626,400 |
| Median Household Income | - | - |
| Monthly Housing Costs | $1,501 | $85 |
| Real Estate Taxes | $10,001 | $15 |
Property Value by Mortgage Status in Groton
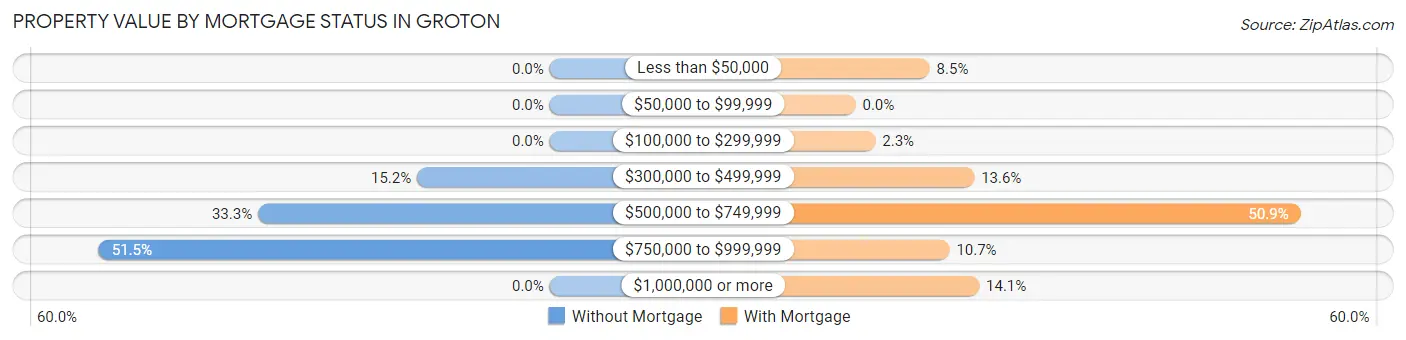
| Property Value | Without Mortgage | With Mortgage |
| Less than $50,000 | 0 (0.0%) | 15 (8.5%) |
| $50,000 to $99,999 | 0 (0.0%) | 0 (0.0%) |
| $100,000 to $299,999 | 0 (0.0%) | 4 (2.3%) |
| $300,000 to $499,999 | 5 (15.1%) | 24 (13.6%) |
| $500,000 to $749,999 | 11 (33.3%) | 90 (50.8%) |
| $750,000 to $999,999 | 17 (51.5%) | 19 (10.7%) |
| $1,000,000 or more | 0 (0.0%) | 25 (14.1%) |
| Total | 33 (100.0%) | 177 (100.0%) |
Household Income by Mortgage Status in Groton
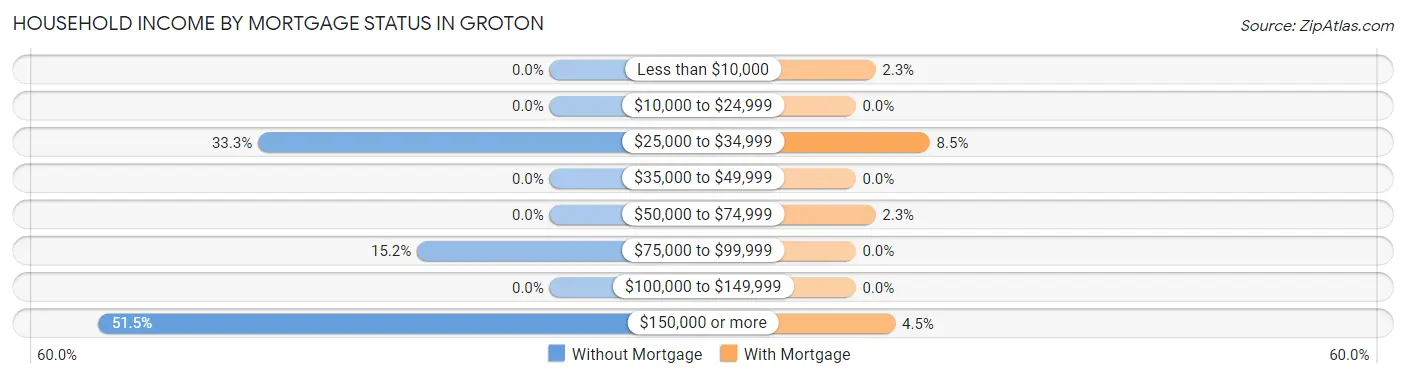
| Household Income | Without Mortgage | With Mortgage |
| Less than $10,000 | 0 (0.0%) | 4 (2.3%) |
| $10,000 to $24,999 | 0 (0.0%) | 0 (0.0%) |
| $25,000 to $34,999 | 11 (33.3%) | 15 (8.5%) |
| $35,000 to $49,999 | 0 (0.0%) | 0 (0.0%) |
| $50,000 to $74,999 | 0 (0.0%) | 4 (2.3%) |
| $75,000 to $99,999 | 5 (15.1%) | 0 (0.0%) |
| $100,000 to $149,999 | 0 (0.0%) | 0 (0.0%) |
| $150,000 or more | 17 (51.5%) | 8 (4.5%) |
| Total | 33 (100.0%) | 177 (100.0%) |
Property Value to Household Income Ratio in Groton
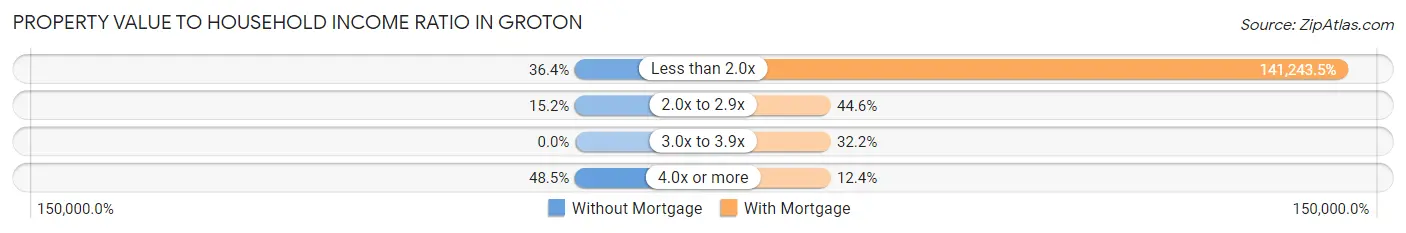
| Value-to-Income Ratio | Without Mortgage | With Mortgage |
| Less than 2.0x | 12 (36.4%) | 250,001 (141,243.5%) |
| 2.0x to 2.9x | 5 (15.1%) | 79 (44.6%) |
| 3.0x to 3.9x | 0 (0.0%) | 57 (32.2%) |
| 4.0x or more | 16 (48.5%) | 22 (12.4%) |
| Total | 33 (100.0%) | 177 (100.0%) |
Real Estate Taxes by Mortgage Status in Groton
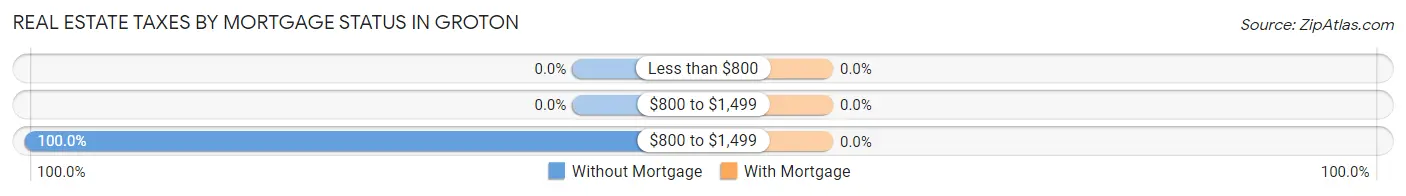
| Property Taxes | Without Mortgage | With Mortgage |
| Less than $800 | 0 (0.0%) | 0 (0.0%) |
| $800 to $1,499 | 0 (0.0%) | 0 (0.0%) |
| $800 to $1,499 | 33 (100.0%) | 0 (0.0%) |
| Total | 33 (100.0%) | 177 (100.0%) |
Health & Disability in Groton
Health Insurance Coverage by Age in Groton
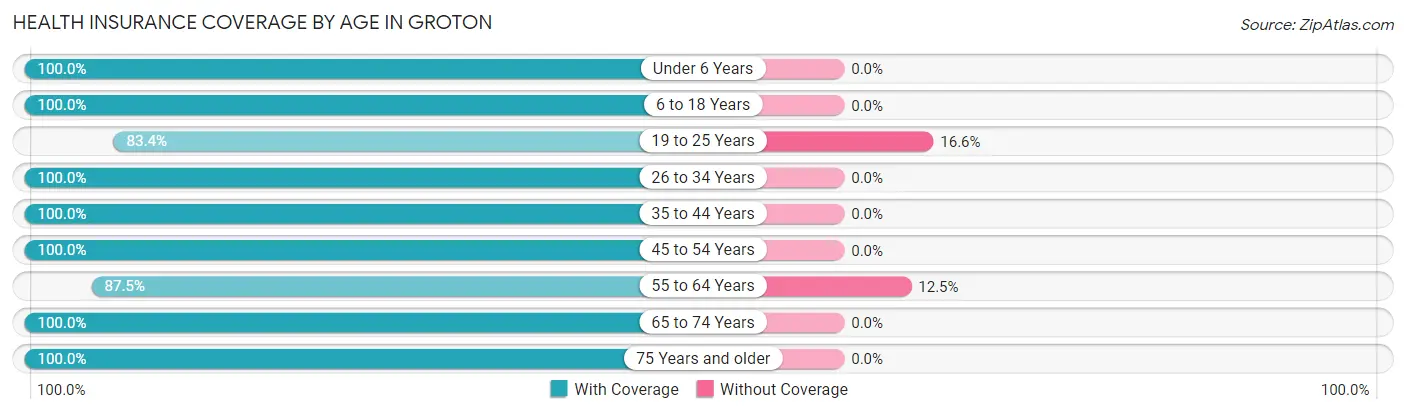
| Age Bracket | With Coverage | Without Coverage |
| Under 6 Years | 48 (100.0%) | 0 (0.0%) |
| 6 to 18 Years | 319 (100.0%) | 0 (0.0%) |
| 19 to 25 Years | 246 (83.4%) | 49 (16.6%) |
| 26 to 34 Years | 91 (100.0%) | 0 (0.0%) |
| 35 to 44 Years | 93 (100.0%) | 0 (0.0%) |
| 45 to 54 Years | 173 (100.0%) | 0 (0.0%) |
| 55 to 64 Years | 161 (87.5%) | 23 (12.5%) |
| 65 to 74 Years | 100 (100.0%) | 0 (0.0%) |
| 75 Years and older | 101 (100.0%) | 0 (0.0%) |
| Total | 1,332 (94.9%) | 72 (5.1%) |
Health Insurance Coverage by Citizenship Status in Groton
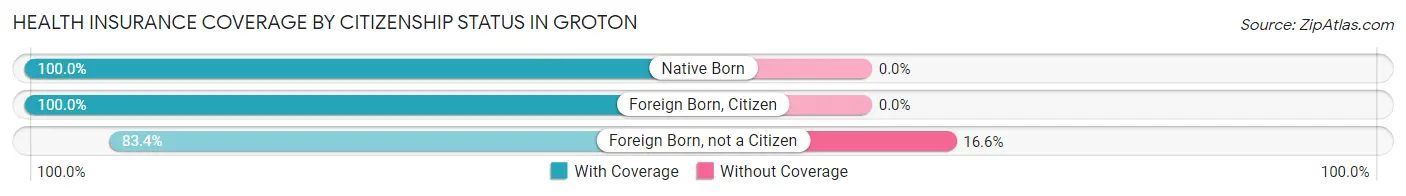
| Citizenship Status | With Coverage | Without Coverage |
| Native Born | 48 (100.0%) | 0 (0.0%) |
| Foreign Born, Citizen | 319 (100.0%) | 0 (0.0%) |
| Foreign Born, not a Citizen | 246 (83.4%) | 49 (16.6%) |
Health Insurance Coverage by Household Income in Groton
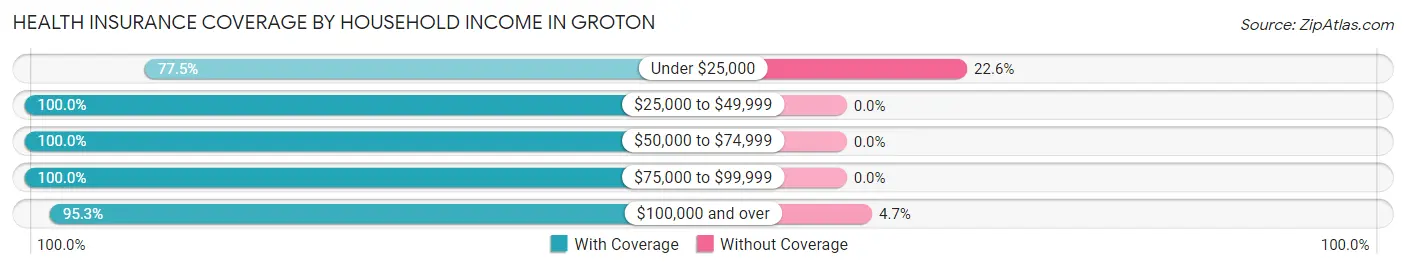
| Household Income | With Coverage | Without Coverage |
| Under $25,000 | 79 (77.4%) | 23 (22.6%) |
| $25,000 to $49,999 | 80 (100.0%) | 0 (0.0%) |
| $50,000 to $74,999 | 9 (100.0%) | 0 (0.0%) |
| $75,000 to $99,999 | 54 (100.0%) | 0 (0.0%) |
| $100,000 and over | 984 (95.3%) | 49 (4.7%) |
Public vs Private Health Insurance Coverage by Age in Groton
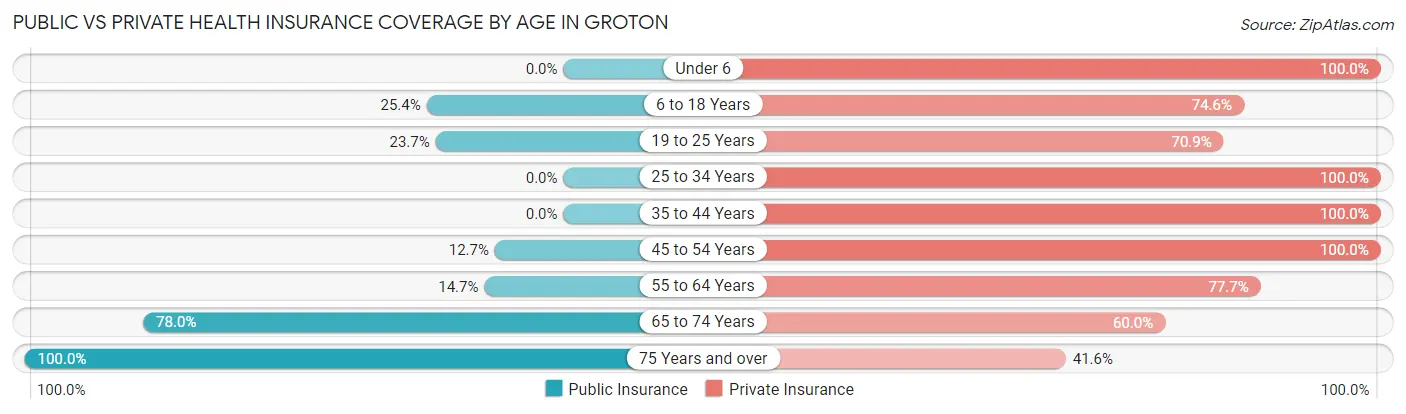
| Age Bracket | Public Insurance | Private Insurance |
| Under 6 | 0 (0.0%) | 48 (100.0%) |
| 6 to 18 Years | 81 (25.4%) | 238 (74.6%) |
| 19 to 25 Years | 70 (23.7%) | 209 (70.9%) |
| 25 to 34 Years | 0 (0.0%) | 91 (100.0%) |
| 35 to 44 Years | 0 (0.0%) | 93 (100.0%) |
| 45 to 54 Years | 22 (12.7%) | 173 (100.0%) |
| 55 to 64 Years | 27 (14.7%) | 143 (77.7%) |
| 65 to 74 Years | 78 (78.0%) | 60 (60.0%) |
| 75 Years and over | 101 (100.0%) | 42 (41.6%) |
| Total | 379 (27.0%) | 1,097 (78.1%) |
Disability Status by Sex by Age in Groton
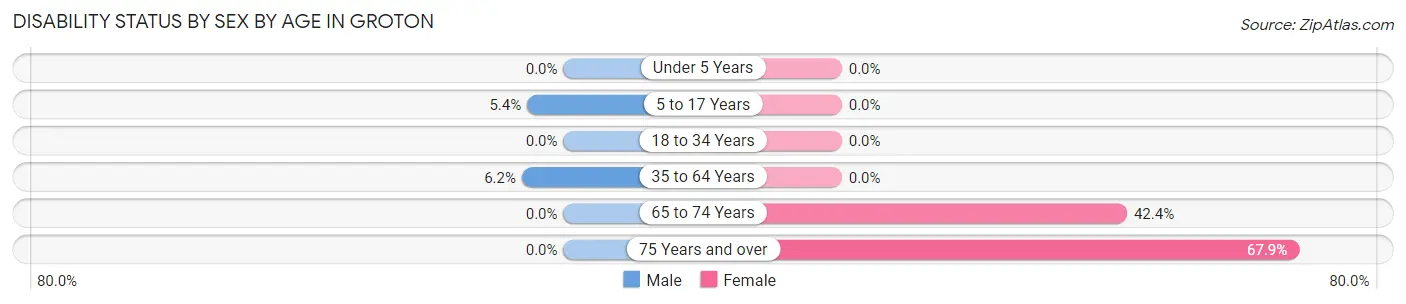
| Age Bracket | Male | Female |
| Under 5 Years | 0 (0.0%) | 0 (0.0%) |
| 5 to 17 Years | 9 (5.4%) | 0 (0.0%) |
| 18 to 34 Years | 0 (0.0%) | 0 (0.0%) |
| 35 to 64 Years | 15 (6.2%) | 0 (0.0%) |
| 65 to 74 Years | 0 (0.0%) | 36 (42.3%) |
| 75 Years and over | 0 (0.0%) | 55 (67.9%) |
Disability Class by Sex by Age in Groton
Disability Class: Hearing Difficulty
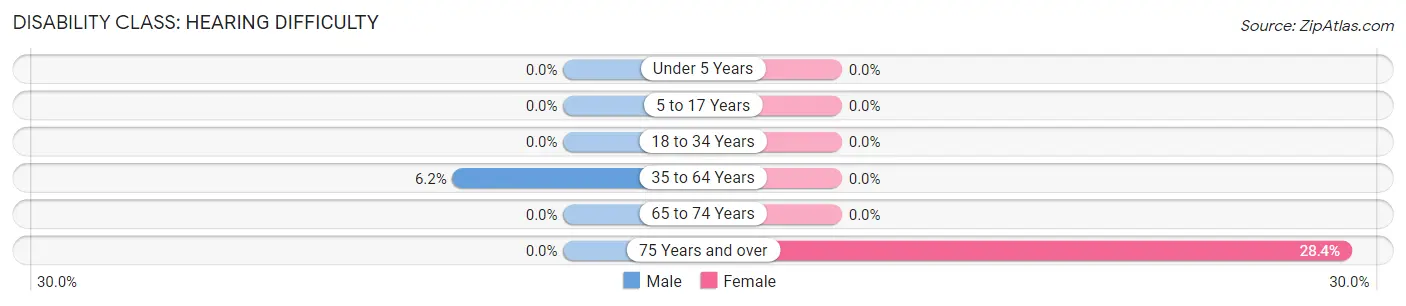
| Age Bracket | Male | Female |
| Under 5 Years | 0 (0.0%) | 0 (0.0%) |
| 5 to 17 Years | 0 (0.0%) | 0 (0.0%) |
| 18 to 34 Years | 0 (0.0%) | 0 (0.0%) |
| 35 to 64 Years | 15 (6.2%) | 0 (0.0%) |
| 65 to 74 Years | 0 (0.0%) | 0 (0.0%) |
| 75 Years and over | 0 (0.0%) | 23 (28.4%) |
Disability Class: Vision Difficulty
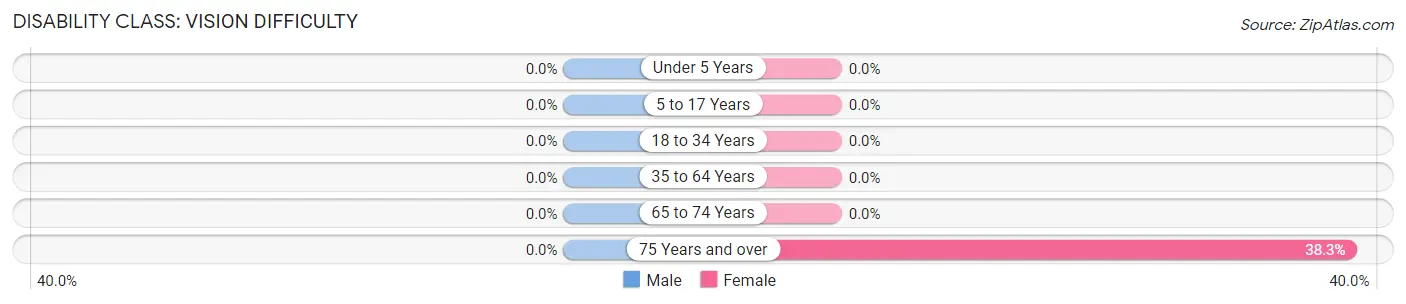
| Age Bracket | Male | Female |
| Under 5 Years | 0 (0.0%) | 0 (0.0%) |
| 5 to 17 Years | 0 (0.0%) | 0 (0.0%) |
| 18 to 34 Years | 0 (0.0%) | 0 (0.0%) |
| 35 to 64 Years | 0 (0.0%) | 0 (0.0%) |
| 65 to 74 Years | 0 (0.0%) | 0 (0.0%) |
| 75 Years and over | 0 (0.0%) | 31 (38.3%) |
Disability Class: Cognitive Difficulty
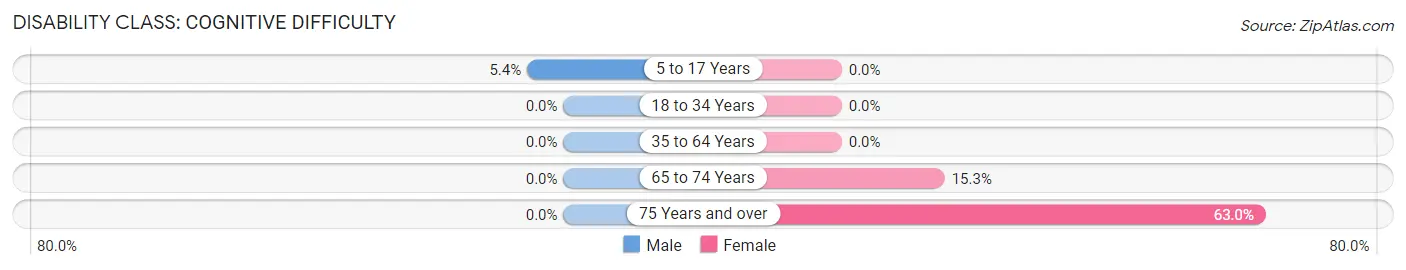
| Age Bracket | Male | Female |
| 5 to 17 Years | 9 (5.4%) | 0 (0.0%) |
| 18 to 34 Years | 0 (0.0%) | 0 (0.0%) |
| 35 to 64 Years | 0 (0.0%) | 0 (0.0%) |
| 65 to 74 Years | 0 (0.0%) | 13 (15.3%) |
| 75 Years and over | 0 (0.0%) | 51 (63.0%) |
Disability Class: Ambulatory Difficulty
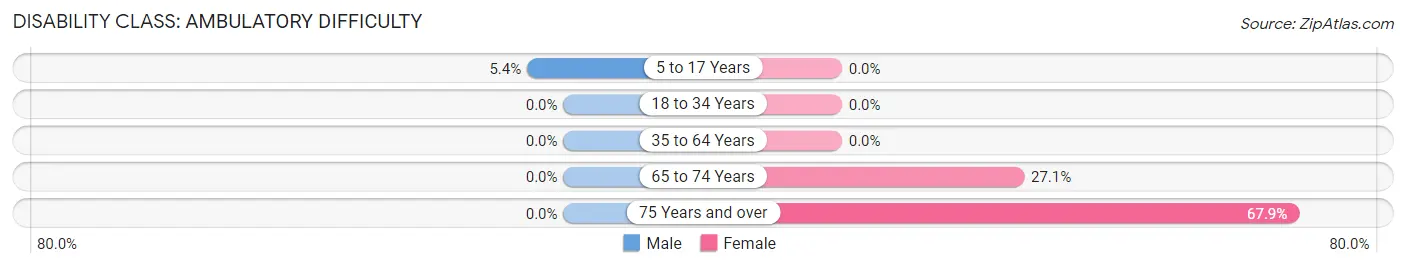
| Age Bracket | Male | Female |
| 5 to 17 Years | 9 (5.4%) | 0 (0.0%) |
| 18 to 34 Years | 0 (0.0%) | 0 (0.0%) |
| 35 to 64 Years | 0 (0.0%) | 0 (0.0%) |
| 65 to 74 Years | 0 (0.0%) | 23 (27.1%) |
| 75 Years and over | 0 (0.0%) | 55 (67.9%) |
Disability Class: Self-Care Difficulty
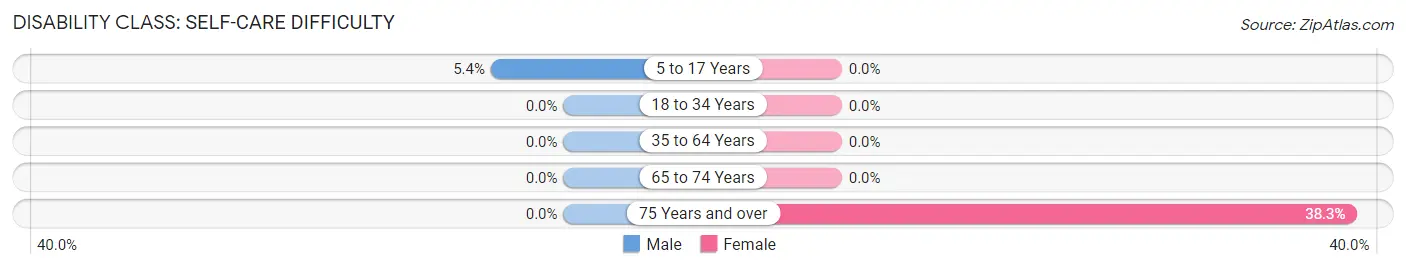
| Age Bracket | Male | Female |
| 5 to 17 Years | 9 (5.4%) | 0 (0.0%) |
| 18 to 34 Years | 0 (0.0%) | 0 (0.0%) |
| 35 to 64 Years | 0 (0.0%) | 0 (0.0%) |
| 65 to 74 Years | 0 (0.0%) | 0 (0.0%) |
| 75 Years and over | 0 (0.0%) | 31 (38.3%) |
Technology Access in Groton
Computing Device Access in Groton
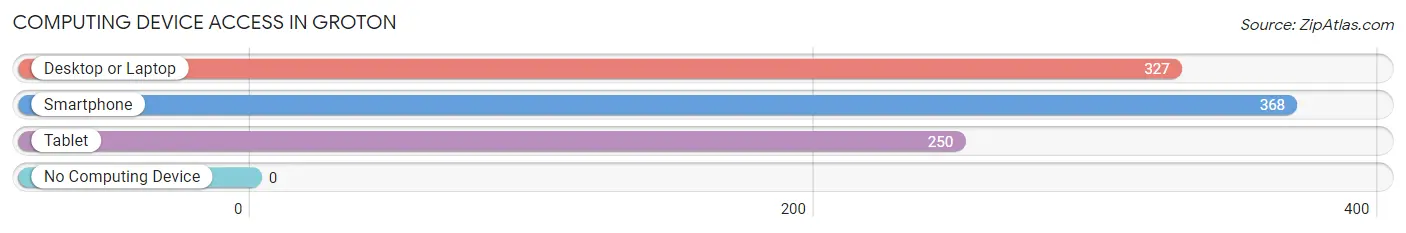
| Device Type | # Households | % Households |
| Desktop or Laptop | 327 | 85.8% |
| Smartphone | 368 | 96.6% |
| Tablet | 250 | 65.6% |
| No Computing Device | 0 | 0.0% |
| Total | 381 | 100.0% |
Internet Access in Groton
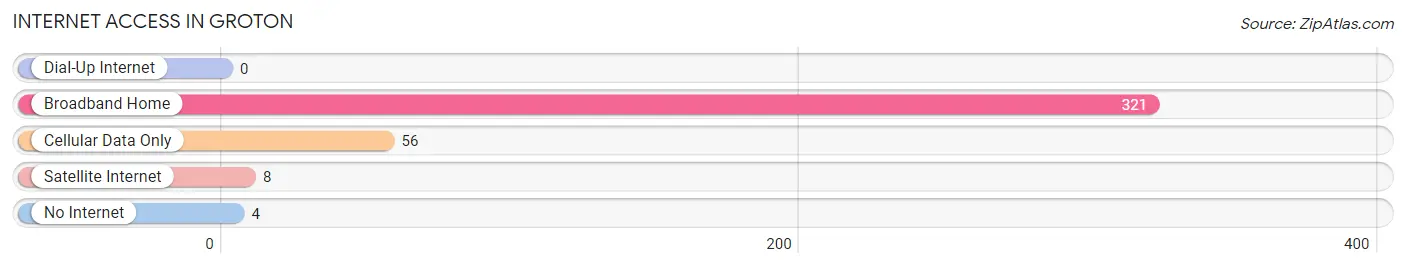
| Internet Type | # Households | % Households |
| Dial-Up Internet | 0 | 0.0% |
| Broadband Home | 321 | 84.3% |
| Cellular Data Only | 56 | 14.7% |
| Satellite Internet | 8 | 2.1% |
| No Internet | 4 | 1.1% |
| Total | 381 | 100.0% |
Groton Summary
Introduction
Groton is a town located in Middlesex County, Massachusetts, United States. It is situated along the Nashua River and is bordered by the towns of Pepperell, Dunstable, Tyngsborough, Westford, Littleton, and Ayer. The town was incorporated in 1655 and is the largest town in Middlesex County. It is home to the Groton School, a prestigious private boarding school, and the Lawrence Academy at Groton, a private preparatory school. The town is also home to the Groton-Dunstable Regional School District, which serves the towns of Groton and Dunstable.
History
The area that is now Groton was originally inhabited by the Nashaway tribe of Native Americans. The first European settlers arrived in the area in 1655, when the town was incorporated as part of the Massachusetts Bay Colony. The town was named after Groton in Suffolk, England.
In the late 1700s, the town was a major center of the Revolutionary War. The Battle of Groton Heights was fought in the town in 1781, and the town was the site of the first naval battle of the war.
In the 19th century, the town was a major center of the Industrial Revolution. The town was home to several factories, including the Groton Iron Works, which produced iron products for the Union Army during the Civil War.
Geography
Groton is located in northeastern Massachusetts, about 25 miles northwest of Boston. The town is situated along the Nashua River and is bordered by the towns of Pepperell, Dunstable, Tyngsborough, Westford, Littleton, and Ayer. The town has a total area of 28.2 square miles, of which 27.7 square miles is land and 0.5 square miles is water.
The town is located in the Merrimack Valley region of Massachusetts and is part of the Greater Boston metropolitan area. The town is located in the Nashoba Valley, which is a region of rolling hills and valleys. The highest point in the town is the summit of Bald Hill, which has an elevation of 590 feet.
Economy
The economy of Groton is largely based on manufacturing and technology. The town is home to several major employers, including Raytheon, a defense contractor, and BAE Systems, a defense and aerospace company. The town is also home to several smaller companies, including Groton Industries, a manufacturer of medical devices, and Groton Pharmaceuticals, a pharmaceutical company.
The town is also home to several educational institutions, including the Groton School, a prestigious private boarding school, and the Lawrence Academy at Groton, a private preparatory school. The town is also home to the Groton-Dunstable Regional School District, which serves the towns of Groton and Dunstable.
Demographics
As of the 2010 census, the town had a population of 10,873. The racial makeup of the town was 94.3% White, 1.7% African American, 0.3% Native American, 1.7% Asian, 0.1% Pacific Islander, 0.7% from other races, and 1.6% from two or more races. Hispanic or Latino of any race were 2.3% of the population.
The median household income in the town was $90,945, and the median family income was $106,945. The per capita income in the town was $41,945. About 3.3% of families and 4.7% of the population were below the poverty line, including 5.2% of those under age 18 and 4.2% of those age 65 or over.
Conclusion
Groton is a town located in Middlesex County, Massachusetts, United States. It is situated along the Nashua River and is bordered by the towns of Pepperell, Dunstable, Tyngsborough, Westford, Littleton, and Ayer. The town was incorporated in 1655 and is the largest town in Middlesex County. It is home to the Groton School, a prestigious private boarding school, and the Lawrence Academy at Groton, a private preparatory school. The town is also home to the Groton-Dunstable Regional School District, which serves the towns of Groton and Dunstable. The economy of Groton is largely based on manufacturing and technology, and the town is home to several major employers. The town has a population of 10,873, and the median household income is $90,945.
Common Questions
What is Per Capita Income in Groton?
Per Capita income in Groton is $53,561.
What is the Median Family Income in Groton?
Median Family Income in Groton is $191,250.
What is the Median Household income in Groton?
Median Household Income in Groton is $121,484.
What is Income or Wage Gap in Groton?
Income or Wage Gap in Groton is 69.9%.
Women in Groton earn 30.1 cents for every dollar earned by a man.
What is Inequality or Gini Index in Groton?
Inequality or Gini Index in Groton is 0.59.
What is the Total Population of Groton?
Total Population of Groton is 1,472.
What is the Total Male Population of Groton?
Total Male Population of Groton is 700.
What is the Total Female Population of Groton?
Total Female Population of Groton is 772.
What is the Ratio of Males per 100 Females in Groton?
There are 90.67 Males per 100 Females in Groton.
What is the Ratio of Females per 100 Males in Groton?
There are 110.29 Females per 100 Males in Groton.
What is the Median Population Age in Groton?
Median Population Age in Groton is 29.5 Years.
What is the Average Family Size in Groton
Average Family Size in Groton is 5.0 People.
What is the Average Household Size in Groton
Average Household Size in Groton is 3.4 People.
How Large is the Labor Force in Groton?
There are 787 People in the Labor Forcein in Groton.
What is the Percentage of People in the Labor Force in Groton?
65.7% of People are in the Labor Force in Groton.
What is the Unemployment Rate in Groton?
Unemployment Rate in Groton is 3.4%.