Thurmont, MD Map & Demographics
Thurmont Map
Thurmont Overview
$43,977
PER CAPITA INCOME
$101,824
AVG FAMILY INCOME
$88,243
AVG HOUSEHOLD INCOME
27.8%
WAGE / INCOME GAP [ % ]
72.2¢/ $1
WAGE / INCOME GAP [ $ ]
$11,034
FAMILY INCOME DEFICIT
0.41
INEQUALITY / GINI INDEX
6,313
TOTAL POPULATION
3,115
MALE POPULATION
3,198
FEMALE POPULATION
97.40
MALES / 100 FEMALES
102.66
FEMALES / 100 MALES
42.0
MEDIAN AGE
2.9
AVG FAMILY SIZE
2.5
AVG HOUSEHOLD SIZE
3,635
LABOR FORCE [ PEOPLE ]
71.8%
PERCENT IN LABOR FORCE
2.5%
UNEMPLOYMENT RATE
Thurmont Zip Codes
Income in Thurmont
Income Overview in Thurmont
Per Capita Income in Thurmont is $43,977, while median incomes of families and households are $101,824 and $88,243 respectively.
| Characteristic | Number | Measure |
| Per Capita Income | 6,313 | $43,977 |
| Median Family Income | 1,858 | $101,824 |
| Mean Family Income | 1,858 | $124,038 |
| Median Household Income | 2,512 | $88,243 |
| Mean Household Income | 2,512 | $108,947 |
| Income Deficit | 1,858 | $11,034 |
| Wage / Income Gap (%) | 6,313 | 27.85% |
| Wage / Income Gap ($) | 6,313 | 72.15¢ per $1 |
| Gini / Inequality Index | 6,313 | 0.41 |
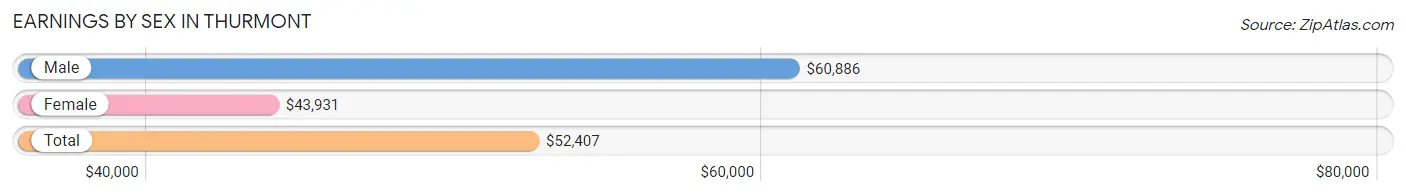
Earnings by Sex in Thurmont
Average Earnings in Thurmont are $52,407, $60,886 for men and $43,931 for women, a difference of 27.9%.
| Sex | Number | Average Earnings |
| Male | 1,939 (52.1%) | $60,886 |
| Female | 1,783 (47.9%) | $43,931 |
| Total | 3,722 (100.0%) | $52,407 |
Earnings by Sex by Income Bracket in Thurmont
The most common earnings brackets in Thurmont are $100,000+ for men (373 | 19.2%) and $75,000 to $99,999 for women (238 | 13.4%).
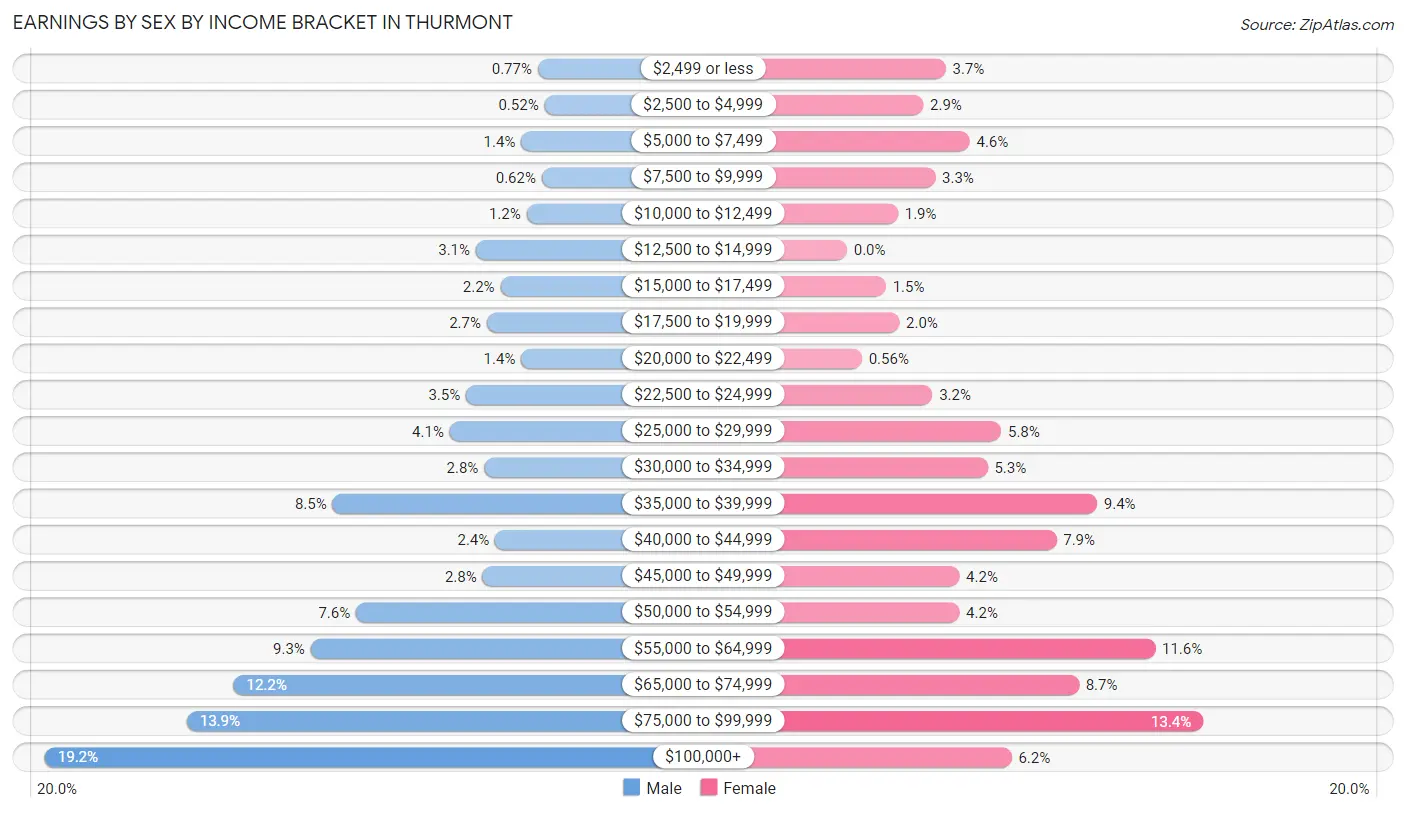
| Income | Male | Female |
| $2,499 or less | 15 (0.8%) | 66 (3.7%) |
| $2,500 to $4,999 | 10 (0.5%) | 51 (2.9%) |
| $5,000 to $7,499 | 27 (1.4%) | 82 (4.6%) |
| $7,500 to $9,999 | 12 (0.6%) | 59 (3.3%) |
| $10,000 to $12,499 | 23 (1.2%) | 34 (1.9%) |
| $12,500 to $14,999 | 60 (3.1%) | 0 (0.0%) |
| $15,000 to $17,499 | 42 (2.2%) | 26 (1.5%) |
| $17,500 to $19,999 | 52 (2.7%) | 35 (2.0%) |
| $20,000 to $22,499 | 27 (1.4%) | 10 (0.6%) |
| $22,500 to $24,999 | 67 (3.5%) | 57 (3.2%) |
| $25,000 to $29,999 | 79 (4.1%) | 103 (5.8%) |
| $30,000 to $34,999 | 54 (2.8%) | 94 (5.3%) |
| $35,000 to $39,999 | 164 (8.5%) | 167 (9.4%) |
| $40,000 to $44,999 | 46 (2.4%) | 140 (7.9%) |
| $45,000 to $49,999 | 55 (2.8%) | 75 (4.2%) |
| $50,000 to $54,999 | 147 (7.6%) | 75 (4.2%) |
| $55,000 to $64,999 | 180 (9.3%) | 206 (11.6%) |
| $65,000 to $74,999 | 236 (12.2%) | 155 (8.7%) |
| $75,000 to $99,999 | 270 (13.9%) | 238 (13.4%) |
| $100,000+ | 373 (19.2%) | 110 (6.2%) |
| Total | 1,939 (100.0%) | 1,783 (100.0%) |
Earnings by Sex by Educational Attainment in Thurmont
Average earnings in Thurmont are $63,545 for men and $47,891 for women, a difference of 24.6%. Men with an educational attainment of graduate degree enjoy the highest average annual earnings of $178,750, while those with high school diploma education earn the least with $51,619. Women with an educational attainment of bachelor's degree earn the most with the average annual earnings of $66,932, while those with high school diploma education have the smallest earnings of $40,625.
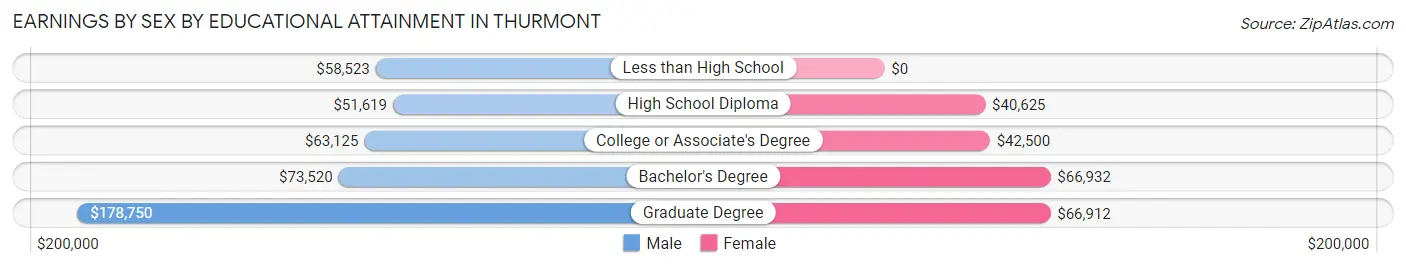
| Educational Attainment | Male Income | Female Income |
| Less than High School | $58,523 | $0 |
| High School Diploma | $51,619 | $40,625 |
| College or Associate's Degree | $63,125 | $42,500 |
| Bachelor's Degree | $73,520 | $66,932 |
| Graduate Degree | $178,750 | $66,912 |
| Total | $63,545 | $47,891 |
Family Income in Thurmont
Family Income Brackets in Thurmont
According to the Thurmont family income data, there are 502 families falling into the $100,000 to $149,999 income range, which is the most common income bracket and makes up 27.0% of all families.
| Income Bracket | # Families | % Families |
| Less than $10,000 | 45 | 2.4% |
| $10,000 to $14,999 | 0 | 0.0% |
| $15,000 to $24,999 | 61 | 3.3% |
| $25,000 to $34,999 | 119 | 6.4% |
| $35,000 to $49,999 | 128 | 6.9% |
| $50,000 to $74,999 | 212 | 11.4% |
| $75,000 to $99,999 | 336 | 18.1% |
| $100,000 to $149,999 | 502 | 27.0% |
| $150,000 to $199,999 | 167 | 9.0% |
| $200,000+ | 286 | 15.4% |
Family Income by Famaliy Size in Thurmont
4-person families (278 | 15.0%) account for the highest median family income in Thurmont with $155,577 per family, while 2-person families (916 | 49.3%) have the highest median income of $43,572 per family member.
| Income Bracket | # Families | Median Income |
| 2-Person Families | 916 (49.3%) | $87,143 |
| 3-Person Families | 514 (27.7%) | $123,382 |
| 4-Person Families | 278 (15.0%) | $155,577 |
| 5-Person Families | 132 (7.1%) | $100,714 |
| 6-Person Families | 18 (1.0%) | $0 |
| 7+ Person Families | 0 (0.0%) | $0 |
| Total | 1,858 (100.0%) | $101,824 |
Family Income by Number of Earners in Thurmont
The median family income in Thurmont is $101,824, with families comprising 3+ earners (216) having the highest median family income of $154,773, while families with no earners (183) have the lowest median family income of $31,477, accounting for 11.6% and 9.9% of families, respectively.
| Number of Earners | # Families | Median Income |
| No Earners | 183 (9.9%) | $31,477 |
| 1 Earner | 602 (32.4%) | $75,993 |
| 2 Earners | 857 (46.1%) | $125,450 |
| 3+ Earners | 216 (11.6%) | $154,773 |
| Total | 1,858 (100.0%) | $101,824 |
Household Income in Thurmont
Household Income Brackets in Thurmont
With 538 households falling in the category, the $100,000 to $149,999 income range is the most frequent in Thurmont, accounting for 21.4% of all households. In contrast, only 60 households (2.4%) fall into the less than $10,000 income bracket, making it the least populous group.
| Income Bracket | # Households | % Households |
| Less than $10,000 | 60 | 2.4% |
| $10,000 to $14,999 | 103 | 4.1% |
| $15,000 to $24,999 | 136 | 5.4% |
| $25,000 to $34,999 | 133 | 5.3% |
| $35,000 to $49,999 | 171 | 6.8% |
| $50,000 to $74,999 | 404 | 16.1% |
| $75,000 to $99,999 | 467 | 18.6% |
| $100,000 to $149,999 | 538 | 21.4% |
| $150,000 to $199,999 | 166 | 6.6% |
| $200,000+ | 334 | 13.3% |
Household Income by Householder Age in Thurmont
The median household income in Thurmont is $88,243, with the highest median household income of $111,927 found in the 45 to 64 years age bracket for the primary householder. A total of 1,049 households (41.8%) fall into this category. Meanwhile, the 15 to 24 years age bracket for the primary householder has the lowest median household income of $0, with 48 households (1.9%) in this group.
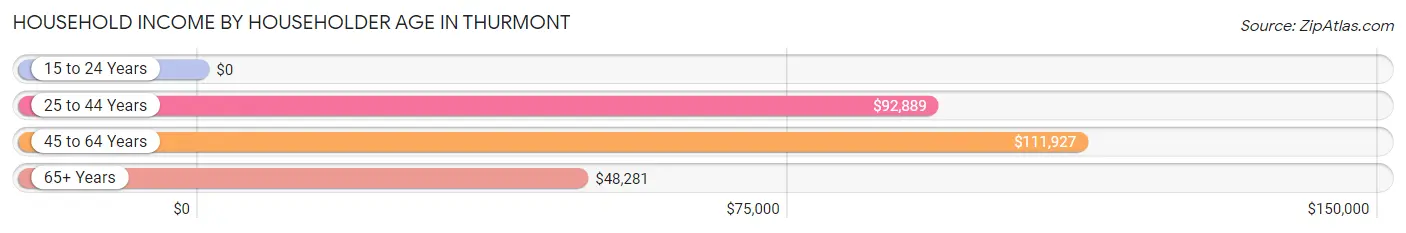
| Income Bracket | # Households | Median Income |
| 15 to 24 Years | 48 (1.9%) | $0 |
| 25 to 44 Years | 762 (30.3%) | $92,889 |
| 45 to 64 Years | 1,049 (41.8%) | $111,927 |
| 65+ Years | 653 (26.0%) | $48,281 |
| Total | 2,512 (100.0%) | $88,243 |
Poverty in Thurmont
Income Below Poverty by Sex and Age in Thurmont
With 7.3% poverty level for males and 10.8% for females among the residents of Thurmont, 12 to 14 year old males and 15 year old females are the most vulnerable to poverty, with 36 males (25.7%) and 19 females (43.2%) in their respective age groups living below the poverty level.
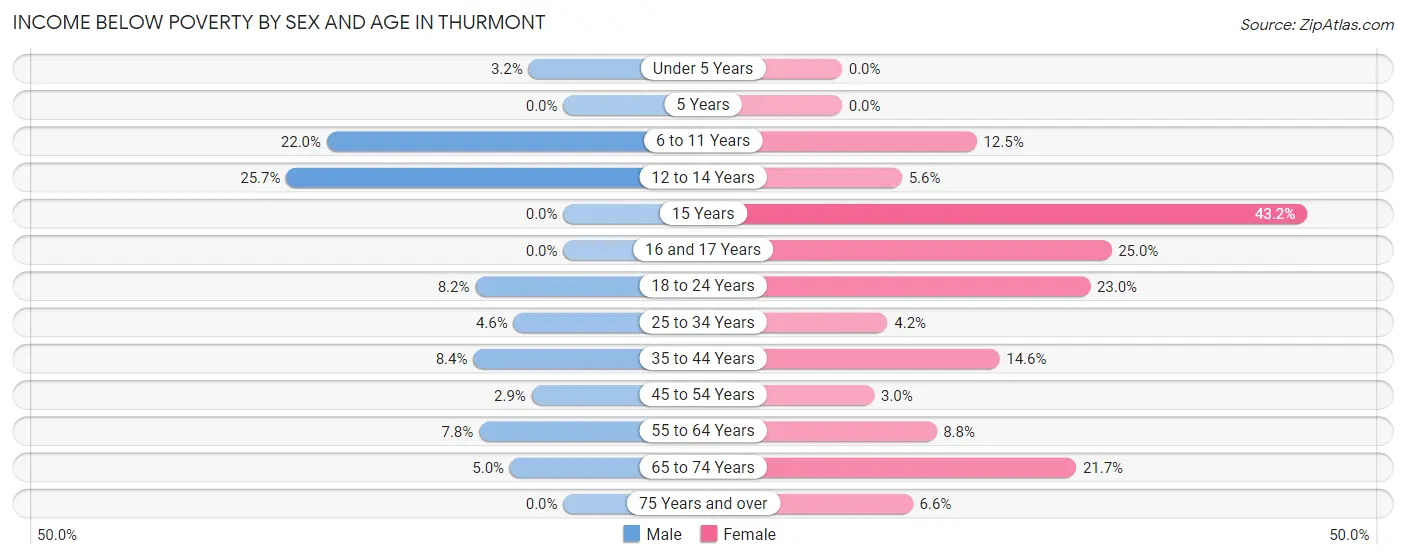
| Age Bracket | Male | Female |
| Under 5 Years | 4 (3.2%) | 0 (0.0%) |
| 5 Years | 0 (0.0%) | 0 (0.0%) |
| 6 to 11 Years | 54 (22.0%) | 14 (12.5%) |
| 12 to 14 Years | 36 (25.7%) | 13 (5.6%) |
| 15 Years | 0 (0.0%) | 19 (43.2%) |
| 16 and 17 Years | 0 (0.0%) | 21 (25.0%) |
| 18 to 24 Years | 25 (8.2%) | 38 (23.0%) |
| 25 to 34 Years | 22 (4.6%) | 17 (4.2%) |
| 35 to 44 Years | 26 (8.4%) | 56 (14.6%) |
| 45 to 54 Years | 15 (2.9%) | 15 (3.0%) |
| 55 to 64 Years | 34 (7.8%) | 46 (8.8%) |
| 65 to 74 Years | 12 (5.0%) | 98 (21.7%) |
| 75 Years and over | 0 (0.0%) | 9 (6.6%) |
| Total | 228 (7.3%) | 346 (10.8%) |
Income Above Poverty by Sex and Age in Thurmont
According to the poverty statistics in Thurmont, males aged 5 years and females aged under 5 years are the age groups that are most secure financially, with 100.0% of males and 100.0% of females in these age groups living above the poverty line.
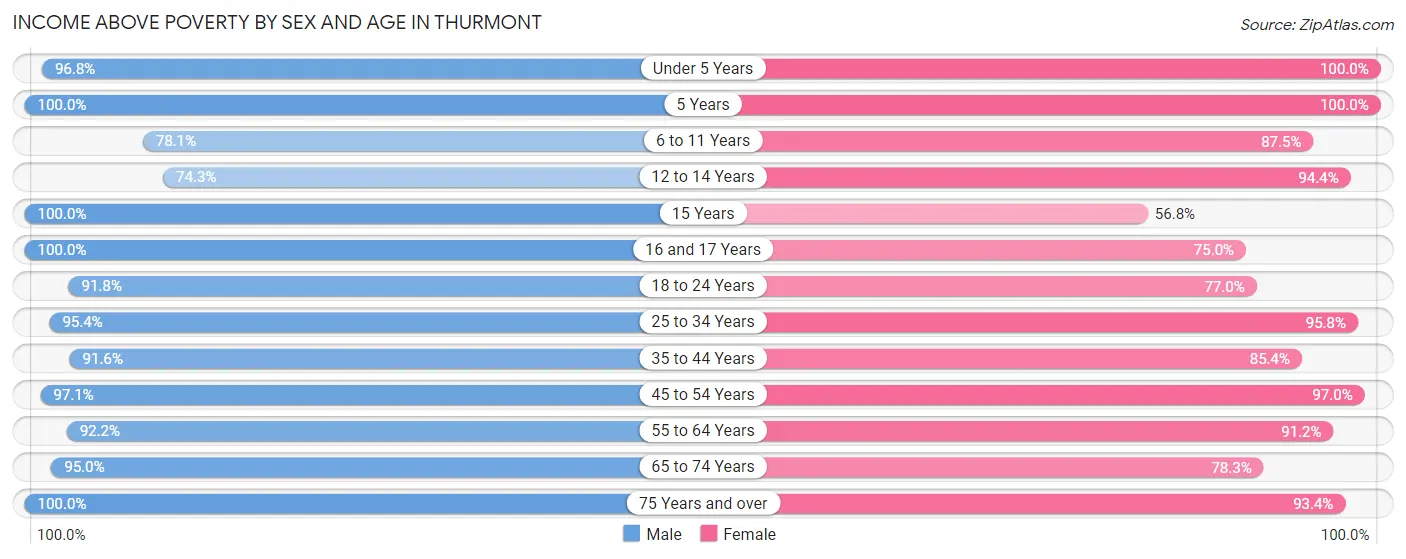
| Age Bracket | Male | Female |
| Under 5 Years | 120 (96.8%) | 135 (100.0%) |
| 5 Years | 19 (100.0%) | 24 (100.0%) |
| 6 to 11 Years | 192 (78.0%) | 98 (87.5%) |
| 12 to 14 Years | 104 (74.3%) | 221 (94.4%) |
| 15 Years | 173 (100.0%) | 25 (56.8%) |
| 16 and 17 Years | 12 (100.0%) | 63 (75.0%) |
| 18 to 24 Years | 281 (91.8%) | 127 (77.0%) |
| 25 to 34 Years | 454 (95.4%) | 385 (95.8%) |
| 35 to 44 Years | 285 (91.6%) | 327 (85.4%) |
| 45 to 54 Years | 495 (97.1%) | 487 (97.0%) |
| 55 to 64 Years | 401 (92.2%) | 479 (91.2%) |
| 65 to 74 Years | 230 (95.0%) | 353 (78.3%) |
| 75 Years and over | 121 (100.0%) | 128 (93.4%) |
| Total | 2,887 (92.7%) | 2,852 (89.2%) |
Income Below Poverty Among Married-Couple Families in Thurmont
The poverty statistics for married-couple families in Thurmont show that 3.7% or 53 of the total 1,412 families live below the poverty line. Families with 1 or 2 children have the highest poverty rate of 5.8%, comprising of 26 families. On the other hand, families with 3 or 4 children have the lowest poverty rate of 0.0%, which includes 0 families.
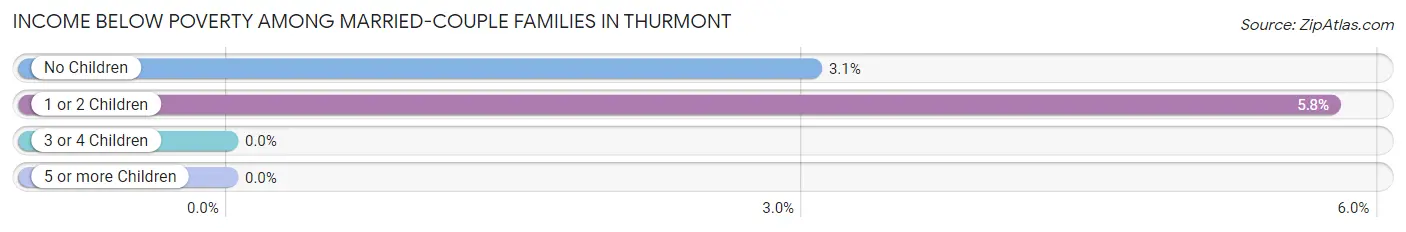
| Children | Above Poverty | Below Poverty |
| No Children | 857 (97.0%) | 27 (3.0%) |
| 1 or 2 Children | 425 (94.2%) | 26 (5.8%) |
| 3 or 4 Children | 77 (100.0%) | 0 (0.0%) |
| 5 or more Children | 0 (0.0%) | 0 (0.0%) |
| Total | 1,359 (96.3%) | 53 (3.7%) |
Income Below Poverty Among Single-Parent Households in Thurmont
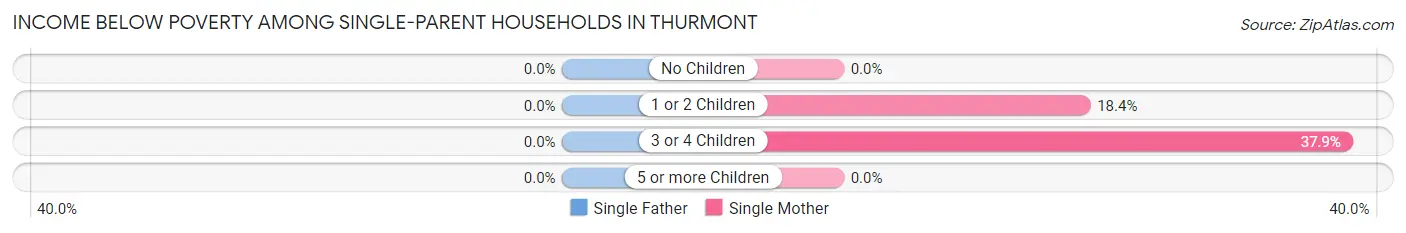
| Children | Single Father | Single Mother |
| No Children | 0 (0.0%) | 0 (0.0%) |
| 1 or 2 Children | 0 (0.0%) | 45 (18.4%) |
| 3 or 4 Children | 0 (0.0%) | 11 (37.9%) |
| 5 or more Children | 0 (0.0%) | 0 (0.0%) |
| Total | 0 (0.0%) | 56 (15.4%) |
Income Below Poverty Among Married-Couple vs Single-Parent Households in Thurmont
The poverty data for Thurmont shows that 53 of the married-couple family households (3.7%) and 56 of the single-parent households (12.6%) are living below the poverty level. Within the married-couple family households, those with 1 or 2 children have the highest poverty rate, with 26 households (5.8%) falling below the poverty line. Among the single-parent households, those with 3 or 4 children have the highest poverty rate, with 11 household (37.9%) living below poverty.
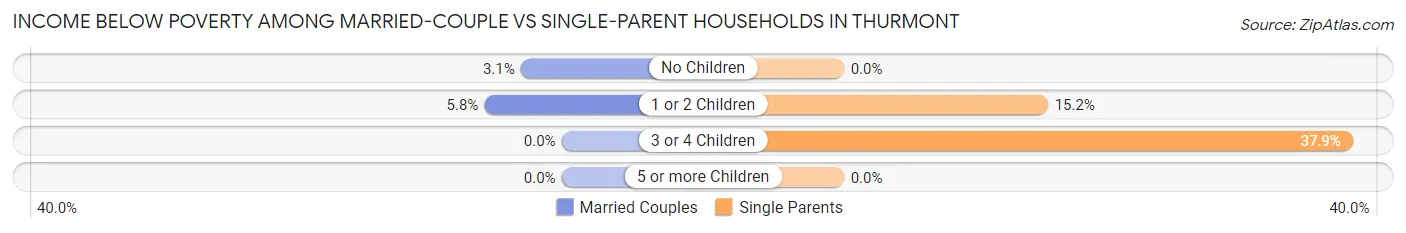
| Children | Married-Couple Families | Single-Parent Households |
| No Children | 27 (3.0%) | 0 (0.0%) |
| 1 or 2 Children | 26 (5.8%) | 45 (15.2%) |
| 3 or 4 Children | 0 (0.0%) | 11 (37.9%) |
| 5 or more Children | 0 (0.0%) | 0 (0.0%) |
| Total | 53 (3.7%) | 56 (12.6%) |
Race in Thurmont
The most populous races in Thurmont are White / Caucasian (5,769 | 91.4%), Two or more Races (313 | 5.0%), and Hispanic or Latino (263 | 4.2%).
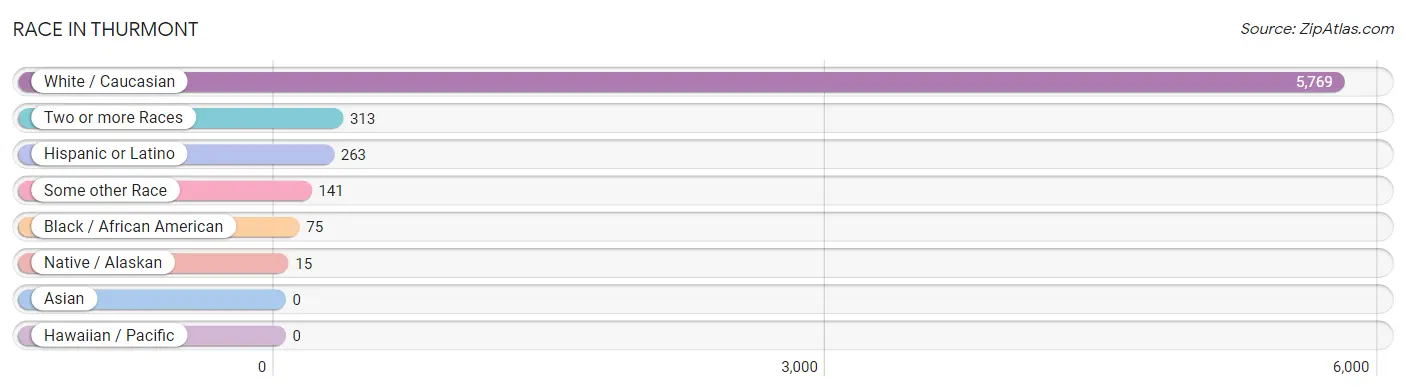
| Race | # Population | % Population |
| Asian | 0 | 0.0% |
| Black / African American | 75 | 1.2% |
| Hawaiian / Pacific | 0 | 0.0% |
| Hispanic or Latino | 263 | 4.2% |
| Native / Alaskan | 15 | 0.2% |
| White / Caucasian | 5,769 | 91.4% |
| Two or more Races | 313 | 5.0% |
| Some other Race | 141 | 2.2% |
| Total | 6,313 | 100.0% |
Ancestry in Thurmont
The most populous ancestries reported in Thurmont are German (1,722 | 27.3%), English (869 | 13.8%), Irish (755 | 12.0%), Scottish (411 | 6.5%), and American (390 | 6.2%), together accounting for 65.7% of all Thurmont residents.
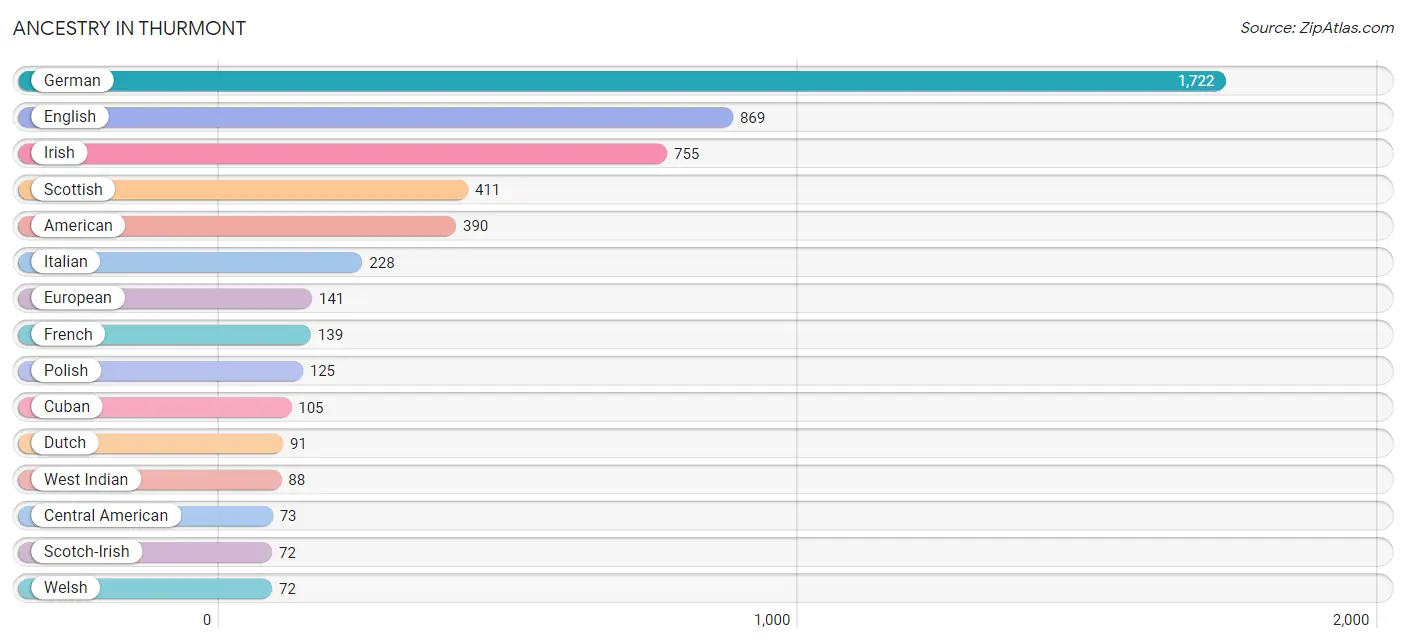
| Ancestry | # Population | % Population |
| American | 390 | 6.2% |
| Arab | 8 | 0.1% |
| Austrian | 9 | 0.1% |
| Bhutanese | 10 | 0.2% |
| British | 19 | 0.3% |
| Central American | 73 | 1.2% |
| Central American Indian | 15 | 0.2% |
| Cherokee | 2 | 0.0% |
| Colombian | 24 | 0.4% |
| Costa Rican | 4 | 0.1% |
| Croatian | 7 | 0.1% |
| Cuban | 105 | 1.7% |
| Czech | 18 | 0.3% |
| Danish | 9 | 0.1% |
| Dutch | 91 | 1.4% |
| English | 869 | 13.8% |
| European | 141 | 2.2% |
| French | 139 | 2.2% |
| French Canadian | 13 | 0.2% |
| German | 1,722 | 27.3% |
| Greek | 59 | 0.9% |
| Guatemalan | 61 | 1.0% |
| Guyanese | 9 | 0.1% |
| Irish | 755 | 12.0% |
| Italian | 228 | 3.6% |
| Korean | 38 | 0.6% |
| Laotian | 30 | 0.5% |
| Lebanese | 8 | 0.1% |
| Mexican | 37 | 0.6% |
| Norwegian | 11 | 0.2% |
| Polish | 125 | 2.0% |
| Portuguese | 26 | 0.4% |
| Russian | 23 | 0.4% |
| Salvadoran | 8 | 0.1% |
| Scandinavian | 16 | 0.3% |
| Scotch-Irish | 72 | 1.1% |
| Scottish | 411 | 6.5% |
| Slovak | 7 | 0.1% |
| Slovene | 16 | 0.3% |
| South American | 24 | 0.4% |
| Spaniard | 16 | 0.3% |
| Spanish | 8 | 0.1% |
| Swedish | 32 | 0.5% |
| Ukrainian | 23 | 0.4% |
| Welsh | 72 | 1.1% |
| West Indian | 88 | 1.4% | View All 46 Rows |
Immigrants in Thurmont
The most numerous immigrant groups reported in Thurmont came from Latin America (67 | 1.1%), Europe (44 | 0.7%), South America (33 | 0.5%), Caribbean (26 | 0.4%), and Trinidad and Tobago (26 | 0.4%), together accounting for 3.1% of all Thurmont residents.
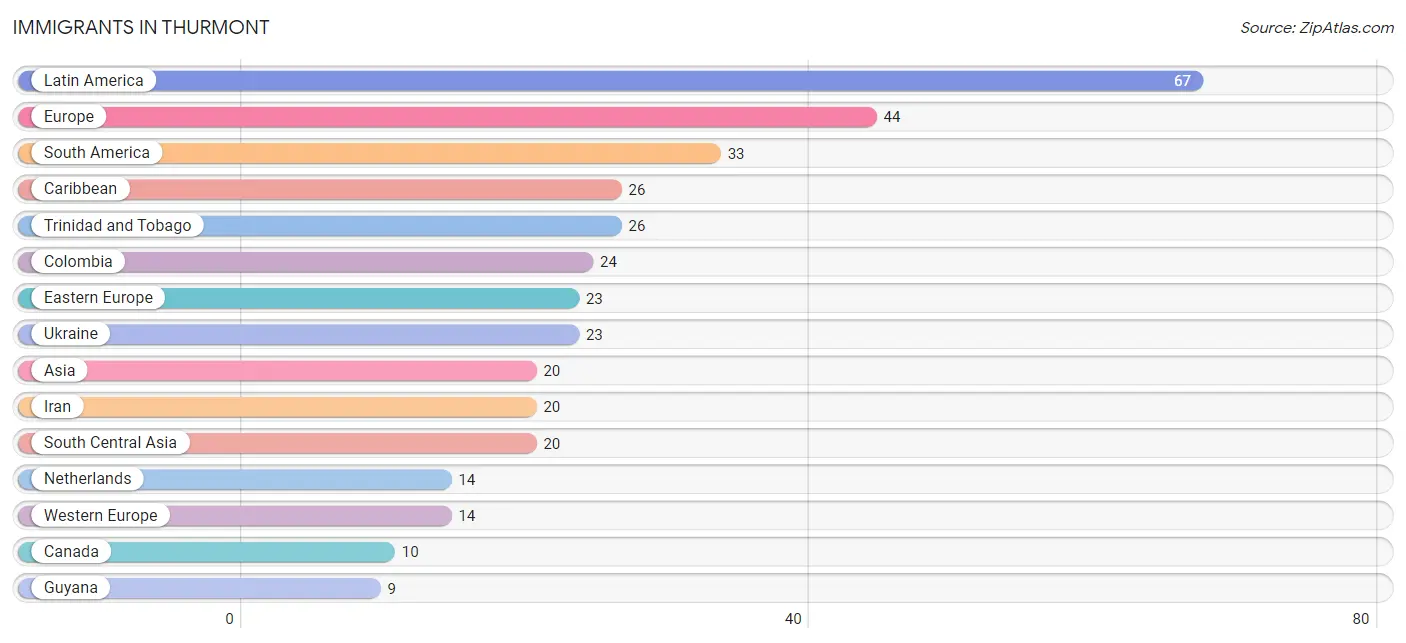
| Immigration Origin | # Population | % Population |
| Asia | 20 | 0.3% |
| Canada | 10 | 0.2% |
| Caribbean | 26 | 0.4% |
| Central America | 8 | 0.1% |
| Colombia | 24 | 0.4% |
| Eastern Europe | 23 | 0.4% |
| El Salvador | 8 | 0.1% |
| England | 7 | 0.1% |
| Europe | 44 | 0.7% |
| Guyana | 9 | 0.1% |
| Iran | 20 | 0.3% |
| Latin America | 67 | 1.1% |
| Netherlands | 14 | 0.2% |
| Northern Europe | 7 | 0.1% |
| South America | 33 | 0.5% |
| South Central Asia | 20 | 0.3% |
| Trinidad and Tobago | 26 | 0.4% |
| Ukraine | 23 | 0.4% |
| Western Europe | 14 | 0.2% | View All 19 Rows |
Sex and Age in Thurmont
Sex and Age in Thurmont
The most populous age groups in Thurmont are 50 to 54 Years (358 | 11.5%) for men and 55 to 59 Years (313 | 9.8%) for women.
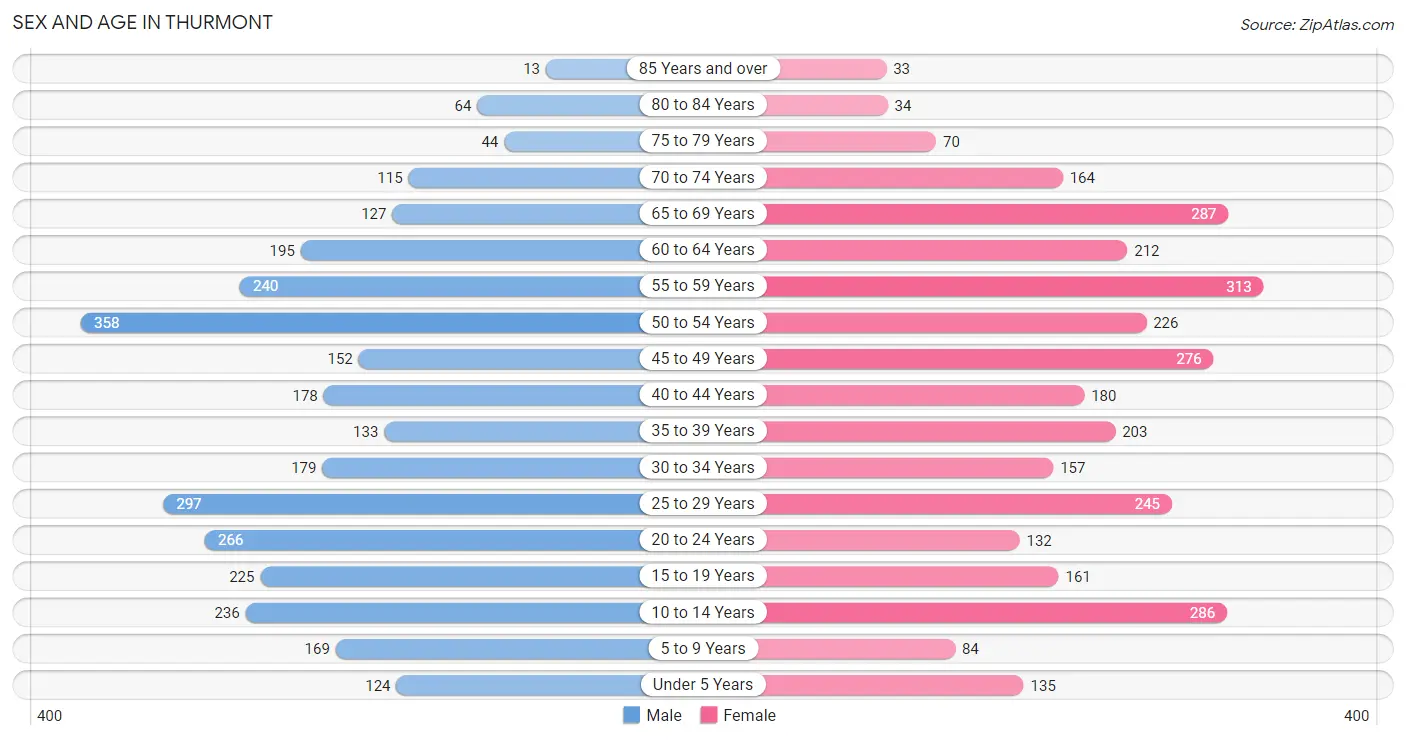
| Age Bracket | Male | Female |
| Under 5 Years | 124 (4.0%) | 135 (4.2%) |
| 5 to 9 Years | 169 (5.4%) | 84 (2.6%) |
| 10 to 14 Years | 236 (7.6%) | 286 (8.9%) |
| 15 to 19 Years | 225 (7.2%) | 161 (5.0%) |
| 20 to 24 Years | 266 (8.5%) | 132 (4.1%) |
| 25 to 29 Years | 297 (9.5%) | 245 (7.7%) |
| 30 to 34 Years | 179 (5.8%) | 157 (4.9%) |
| 35 to 39 Years | 133 (4.3%) | 203 (6.4%) |
| 40 to 44 Years | 178 (5.7%) | 180 (5.6%) |
| 45 to 49 Years | 152 (4.9%) | 276 (8.6%) |
| 50 to 54 Years | 358 (11.5%) | 226 (7.1%) |
| 55 to 59 Years | 240 (7.7%) | 313 (9.8%) |
| 60 to 64 Years | 195 (6.3%) | 212 (6.6%) |
| 65 to 69 Years | 127 (4.1%) | 287 (9.0%) |
| 70 to 74 Years | 115 (3.7%) | 164 (5.1%) |
| 75 to 79 Years | 44 (1.4%) | 70 (2.2%) |
| 80 to 84 Years | 64 (2.1%) | 34 (1.1%) |
| 85 Years and over | 13 (0.4%) | 33 (1.0%) |
| Total | 3,115 (100.0%) | 3,198 (100.0%) |
Families and Households in Thurmont
Median Family Size in Thurmont
The median family size in Thurmont is 2.87 persons per family, with married-couple families (1,412 | 76.0%) accounting for the largest median family size of 2.92 persons per family. On the other hand, single male/father families (83 | 4.5%) represent the smallest median family size with 2.23 persons per family.
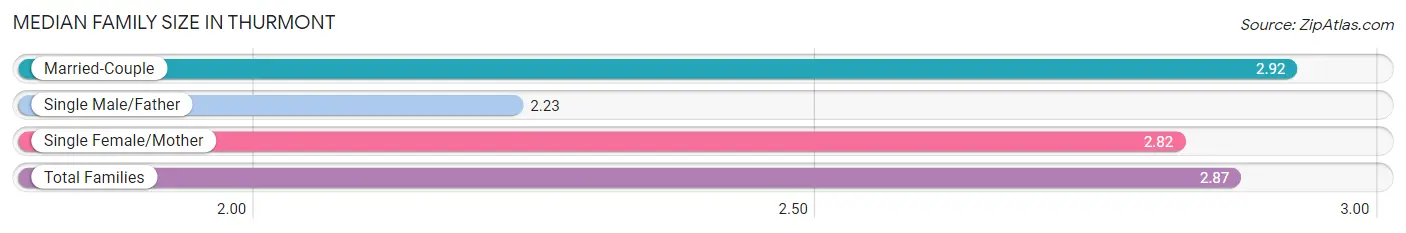
| Family Type | # Families | Family Size |
| Married-Couple | 1,412 (76.0%) | 2.92 |
| Single Male/Father | 83 (4.5%) | 2.23 |
| Single Female/Mother | 363 (19.5%) | 2.82 |
| Total Families | 1,858 (100.0%) | 2.87 |
Median Household Size in Thurmont
The median household size in Thurmont is 2.51 persons per household, with single female/mother households (363 | 14.4%) accounting for the largest median household size of 3.06 persons per household. non-family households (654 | 26.0%) represent the smallest median household size with 1.21 persons per household.
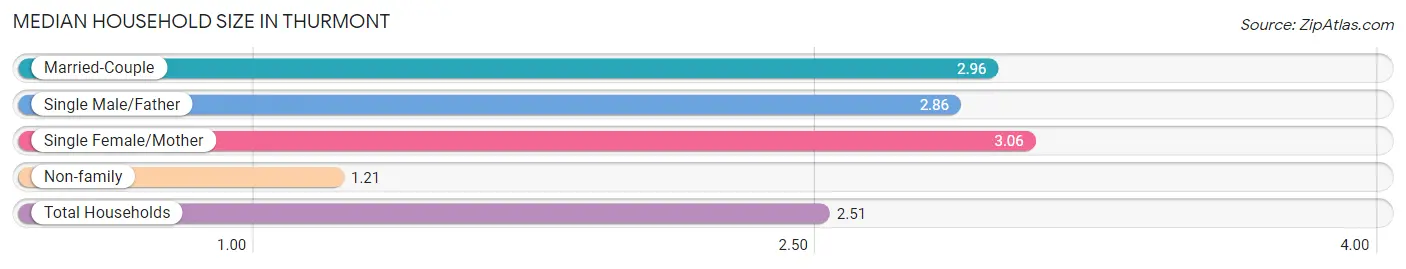
| Household Type | # Households | Household Size |
| Married-Couple | 1,412 (56.2%) | 2.96 |
| Single Male/Father | 83 (3.3%) | 2.86 |
| Single Female/Mother | 363 (14.4%) | 3.06 |
| Non-family | 654 (26.0%) | 1.21 |
| Total Households | 2,512 (100.0%) | 2.51 |
Household Size by Marriage Status in Thurmont
Out of a total of 2,512 households in Thurmont, 1,858 (74.0%) are family households, while 654 (26.0%) are nonfamily households. The most numerous type of family households are 2-person households, comprising 831, and the most common type of nonfamily households are 1-person households, comprising 524.
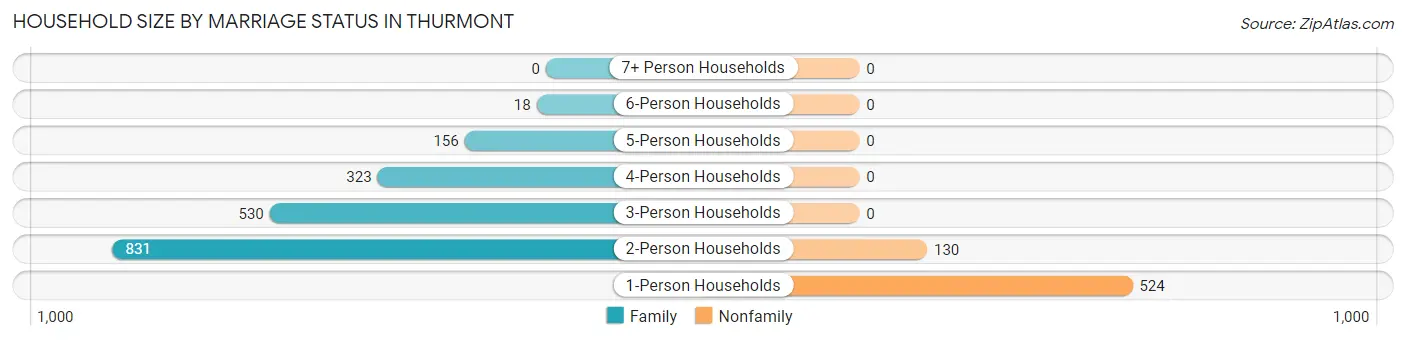
| Household Size | Family Households | Nonfamily Households |
| 1-Person Households | - | 524 (20.9%) |
| 2-Person Households | 831 (33.1%) | 130 (5.2%) |
| 3-Person Households | 530 (21.1%) | 0 (0.0%) |
| 4-Person Households | 323 (12.9%) | 0 (0.0%) |
| 5-Person Households | 156 (6.2%) | 0 (0.0%) |
| 6-Person Households | 18 (0.7%) | 0 (0.0%) |
| 7+ Person Households | 0 (0.0%) | 0 (0.0%) |
| Total | 1,858 (74.0%) | 654 (26.0%) |
Female Fertility in Thurmont
Fertility by Age in Thurmont
Average fertility rate in Thurmont is 52.0 births per 1,000 women. Women in the age bracket of 20 to 34 years have the highest fertility rate with 137.0 births per 1,000 women. Women in the age bracket of 20 to 34 years acount for 100.0% of all women with births.
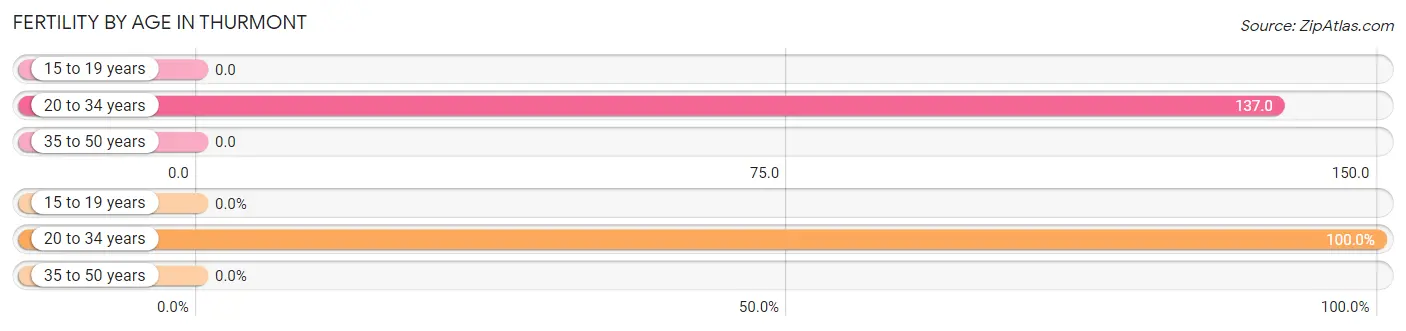
| Age Bracket | Women with Births | Births / 1,000 Women |
| 15 to 19 years | 0 (0.0%) | 0.0 |
| 20 to 34 years | 73 (100.0%) | 137.0 |
| 35 to 50 years | 0 (0.0%) | 0.0 |
| Total | 73 (100.0%) | 52.0 |
Fertility by Age by Marriage Status in Thurmont
17.8% of women with births (73) in Thurmont are married. The highest percentage of unmarried women with births falls into 20 to 34 years age bracket with 82.2% of them unmarried at the time of birth, while the lowest percentage of unmarried women with births belong to 20 to 34 years age bracket with 82.2% of them unmarried.
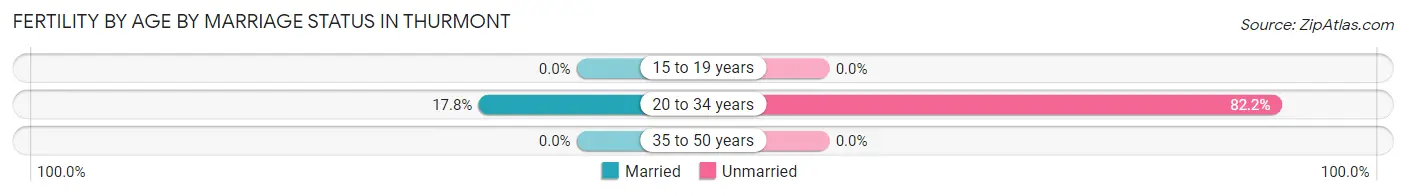
| Age Bracket | Married | Unmarried |
| 15 to 19 years | 0 (0.0%) | 0 (0.0%) |
| 20 to 34 years | 13 (17.8%) | 60 (82.2%) |
| 35 to 50 years | 0 (0.0%) | 0 (0.0%) |
| Total | 13 (17.8%) | 60 (82.2%) |
Fertility by Education in Thurmont
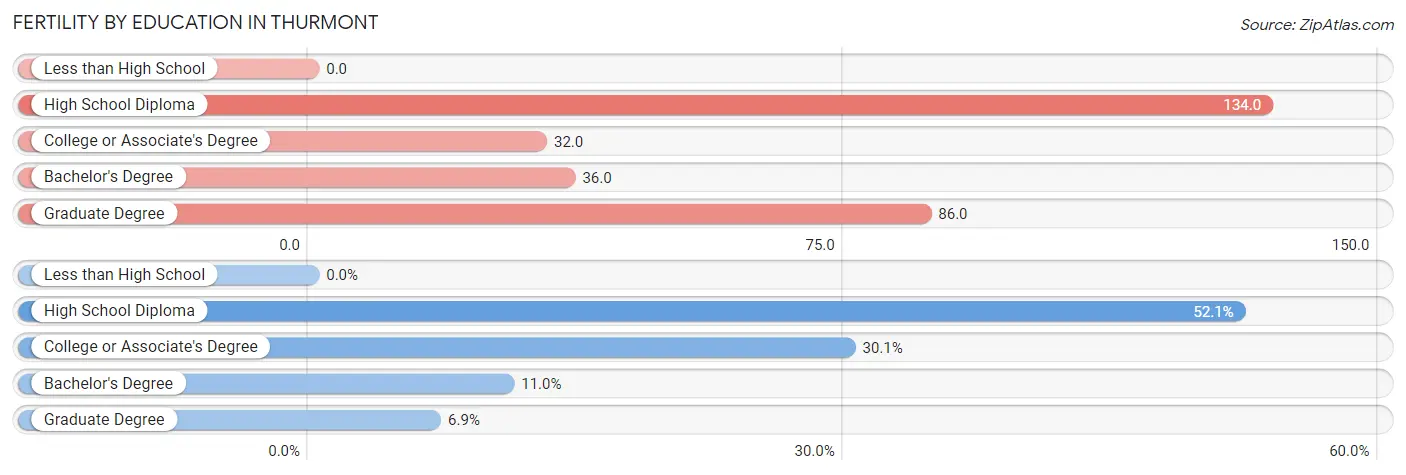
| Educational Attainment | Women with Births | Births / 1,000 Women |
| Less than High School | 0 (0.0%) | 0.0 |
| High School Diploma | 38 (52.0%) | 134.0 |
| College or Associate's Degree | 22 (30.1%) | 32.0 |
| Bachelor's Degree | 8 (11.0%) | 36.0 |
| Graduate Degree | 5 (6.9%) | 86.0 |
| Total | 73 (100.0%) | 52.0 |
Fertility by Education by Marriage Status in Thurmont
82.2% of women with births in Thurmont are unmarried. Women with the educational attainment of bachelor's degree are most likely to be married with 100.0% of them married at childbirth, while women with the educational attainment of high school diploma are least likely to be married with 100.0% of them unmarried at childbirth.
| Educational Attainment | Married | Unmarried |
| Less than High School | 0 (0.0%) | 0 (0.0%) |
| High School Diploma | 0 (0.0%) | 38 (100.0%) |
| College or Associate's Degree | 0 (0.0%) | 22 (100.0%) |
| Bachelor's Degree | 8 (100.0%) | 0 (0.0%) |
| Graduate Degree | 5 (100.0%) | 0 (0.0%) |
| Total | 13 (17.8%) | 60 (82.2%) |
Employment Characteristics in Thurmont
Employment by Class of Employer in Thurmont
Among the 3,488 employed individuals in Thurmont, private company employees (2,007 | 57.5%), local government employees (506 | 14.5%), and not-for-profit organizations (401 | 11.5%) make up the most common classes of employment.
| Employer Class | # Employees | % Employees |
| Private Company Employees | 2,007 | 57.5% |
| Self-Employed (Incorporated) | 160 | 4.6% |
| Self-Employed (Not Incorporated) | 99 | 2.8% |
| Not-for-profit Organizations | 401 | 11.5% |
| Local Government Employees | 506 | 14.5% |
| State Government Employees | 116 | 3.3% |
| Federal Government Employees | 186 | 5.3% |
| Unpaid Family Workers | 13 | 0.4% |
| Total | 3,488 | 100.0% |
Employment Status by Age in Thurmont
According to the labor force statistics for Thurmont, out of the total population over 16 years of age (5,062), 71.8% or 3,635 individuals are in the labor force, with 2.5% or 91 of them unemployed. The age group with the highest labor force participation rate is 30 to 34 years, with 95.8% or 322 individuals in the labor force. Within the labor force, the 65 to 74 years age range has the highest percentage of unemployed individuals, with 27.0% or 51 of them being unemployed.
| Age Bracket | In Labor Force | Unemployed |
| 16 to 19 Years | 105 (62.1%) | 0 (0.0%) |
| 20 to 24 Years | 337 (84.7%) | 0 (0.0%) |
| 25 to 29 Years | 458 (84.5%) | 8 (1.7%) |
| 30 to 34 Years | 322 (95.8%) | 0 (0.0%) |
| 35 to 44 Years | 623 (89.8%) | 20 (3.2%) |
| 45 to 54 Years | 825 (81.5%) | 10 (1.2%) |
| 55 to 59 Years | 449 (81.2%) | 0 (0.0%) |
| 60 to 64 Years | 312 (76.7%) | 0 (0.0%) |
| 65 to 74 Years | 189 (27.3%) | 51 (27.0%) |
| 75 Years and over | 15 (5.8%) | 0 (0.0%) |
| Total | 3,635 (71.8%) | 91 (2.5%) |
Employment Status by Educational Attainment in Thurmont
According to labor force statistics for Thurmont, 84.3% of individuals (2,988) out of the total population between 25 and 64 years of age (3,544) are in the labor force, with 1.3% or 39 of them being unemployed. The group with the highest labor force participation rate are those with the educational attainment of bachelor's degree or higher, with 93.2% or 778 individuals in the labor force. Within the labor force, individuals with college / associate degree education have the highest percentage of unemployment, with 1.8% or 20 of them being unemployed.
| Educational Attainment | In Labor Force | Unemployed |
| Less than High School | 132 (74.6%) | 0 (0.0%) |
| High School Diploma | 967 (81.7%) | 12 (1.0%) |
| College / Associate Degree | 1,113 (82.5%) | 24 (1.8%) |
| Bachelor's Degree or higher | 778 (93.2%) | 8 (1.0%) |
| Total | 2,988 (84.3%) | 46 (1.3%) |
Employment Occupations by Sex in Thurmont
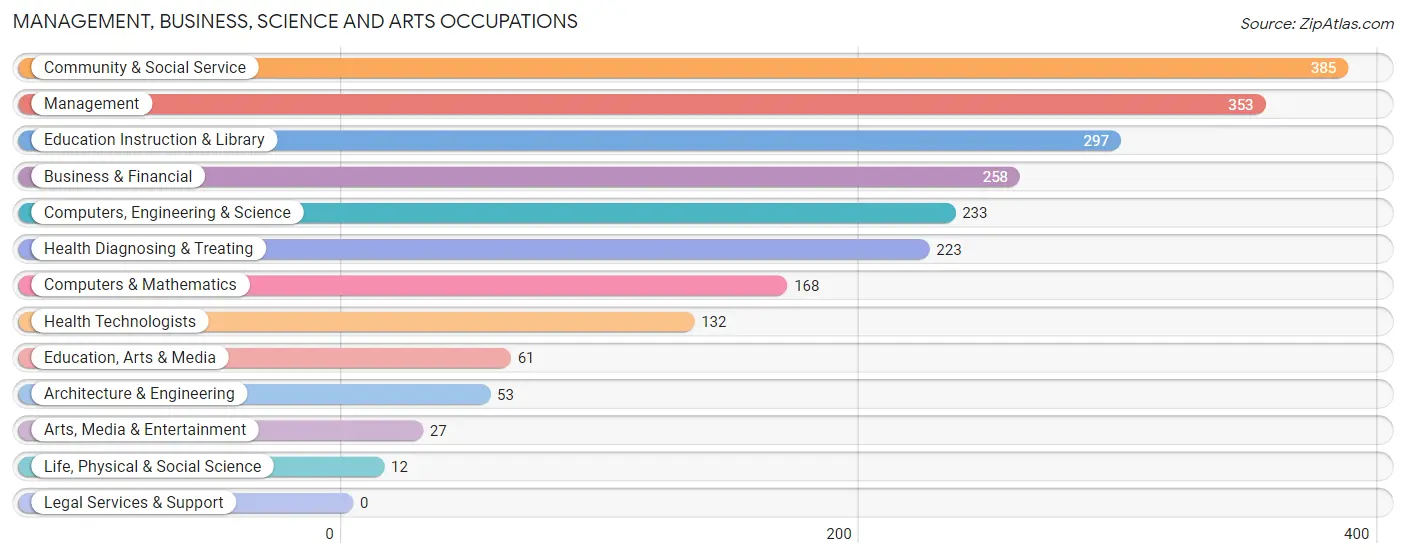
Management, Business, Science and Arts Occupations
The most common Management, Business, Science and Arts occupations in Thurmont are Community & Social Service (385 | 10.9%), Management (353 | 10.0%), Education Instruction & Library (297 | 8.4%), Business & Financial (258 | 7.3%), and Computers, Engineering & Science (233 | 6.6%).
Management, Business, Science and Arts Occupations by Sex
Within the Management, Business, Science and Arts occupations in Thurmont, the most male-oriented occupations are Arts, Media & Entertainment (100.0%), Architecture & Engineering (94.3%), and Computers & Mathematics (80.4%), while the most female-oriented occupations are Life, Physical & Social Science (100.0%), Health Technologists (92.4%), and Health Diagnosing & Treating (90.1%).
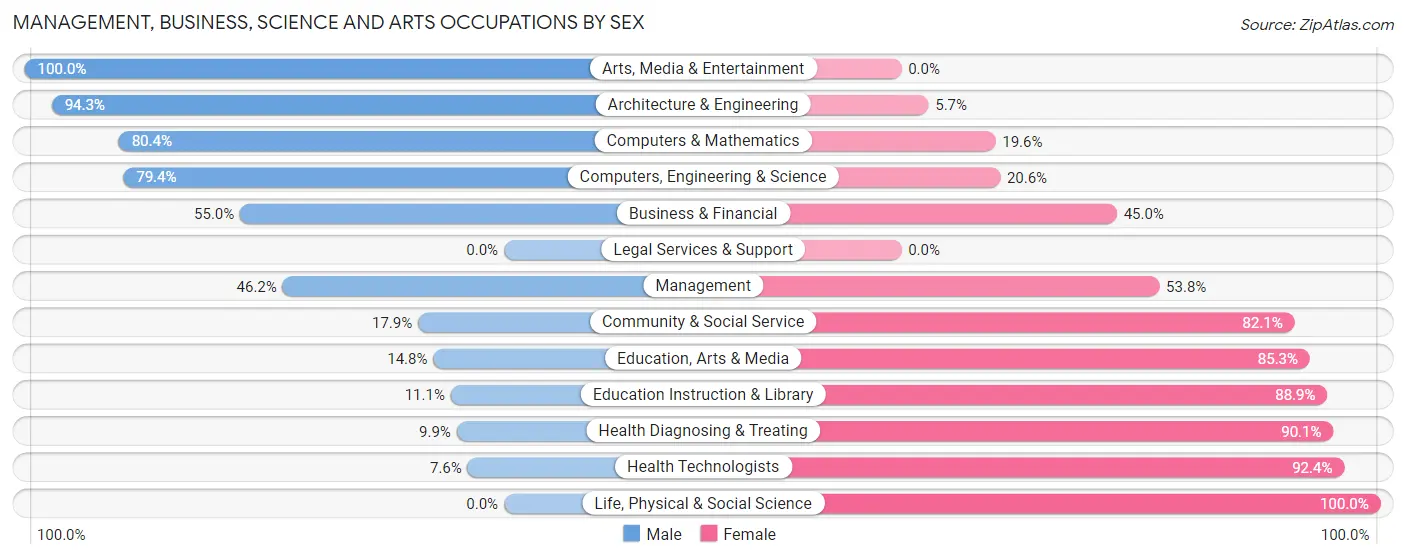
| Occupation | Male | Female |
| Management | 163 (46.2%) | 190 (53.8%) |
| Business & Financial | 142 (55.0%) | 116 (45.0%) |
| Computers, Engineering & Science | 185 (79.4%) | 48 (20.6%) |
| Computers & Mathematics | 135 (80.4%) | 33 (19.6%) |
| Architecture & Engineering | 50 (94.3%) | 3 (5.7%) |
| Life, Physical & Social Science | 0 (0.0%) | 12 (100.0%) |
| Community & Social Service | 69 (17.9%) | 316 (82.1%) |
| Education, Arts & Media | 9 (14.7%) | 52 (85.3%) |
| Legal Services & Support | 0 (0.0%) | 0 (0.0%) |
| Education Instruction & Library | 33 (11.1%) | 264 (88.9%) |
| Arts, Media & Entertainment | 27 (100.0%) | 0 (0.0%) |
| Health Diagnosing & Treating | 22 (9.9%) | 201 (90.1%) |
| Health Technologists | 10 (7.6%) | 122 (92.4%) |
| Total (Category) | 581 (40.0%) | 871 (60.0%) |
| Total (Overall) | 1,867 (52.9%) | 1,660 (47.1%) |
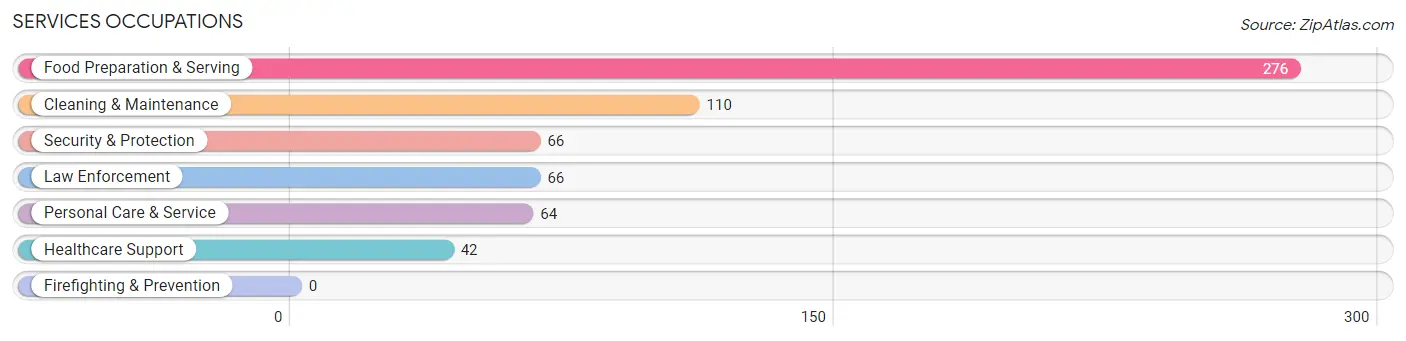
Services Occupations
The most common Services occupations in Thurmont are Food Preparation & Serving (276 | 7.8%), Cleaning & Maintenance (110 | 3.1%), Security & Protection (66 | 1.9%), Law Enforcement (66 | 1.9%), and Personal Care & Service (64 | 1.8%).
Services Occupations by Sex
Within the Services occupations in Thurmont, the most male-oriented occupations are Security & Protection (100.0%), Law Enforcement (100.0%), and Food Preparation & Serving (72.8%), while the most female-oriented occupations are Healthcare Support (100.0%), Personal Care & Service (100.0%), and Cleaning & Maintenance (49.1%).
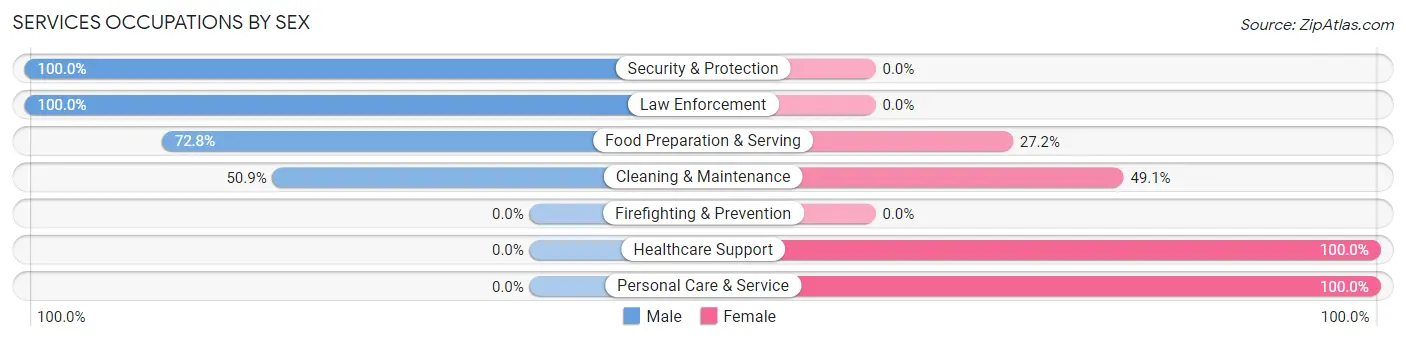
| Occupation | Male | Female |
| Healthcare Support | 0 (0.0%) | 42 (100.0%) |
| Security & Protection | 66 (100.0%) | 0 (0.0%) |
| Firefighting & Prevention | 0 (0.0%) | 0 (0.0%) |
| Law Enforcement | 66 (100.0%) | 0 (0.0%) |
| Food Preparation & Serving | 201 (72.8%) | 75 (27.2%) |
| Cleaning & Maintenance | 56 (50.9%) | 54 (49.1%) |
| Personal Care & Service | 0 (0.0%) | 64 (100.0%) |
| Total (Category) | 323 (57.9%) | 235 (42.1%) |
| Total (Overall) | 1,867 (52.9%) | 1,660 (47.1%) |
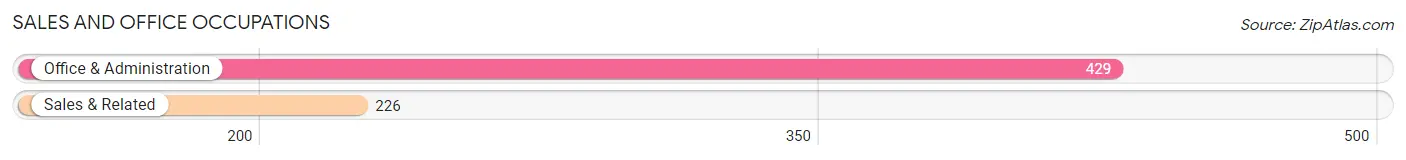
Sales and Office Occupations
The most common Sales and Office occupations in Thurmont are Office & Administration (429 | 12.2%), and Sales & Related (226 | 6.4%).
Sales and Office Occupations by Sex
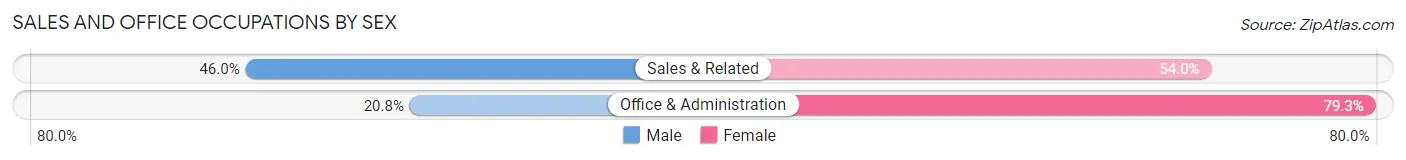
| Occupation | Male | Female |
| Sales & Related | 104 (46.0%) | 122 (54.0%) |
| Office & Administration | 89 (20.7%) | 340 (79.2%) |
| Total (Category) | 193 (29.5%) | 462 (70.5%) |
| Total (Overall) | 1,867 (52.9%) | 1,660 (47.1%) |
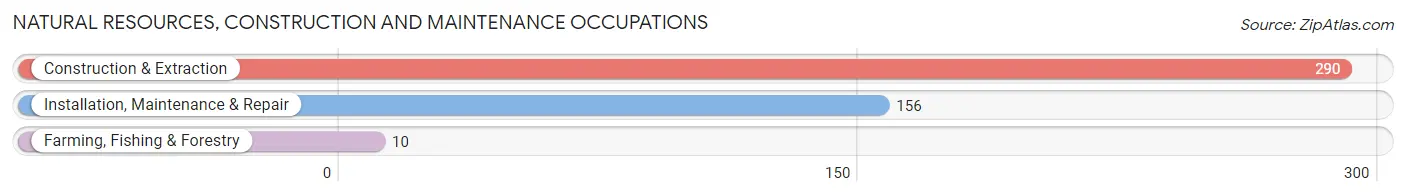
Natural Resources, Construction and Maintenance Occupations
The most common Natural Resources, Construction and Maintenance occupations in Thurmont are Construction & Extraction (290 | 8.2%), Installation, Maintenance & Repair (156 | 4.4%), and Farming, Fishing & Forestry (10 | 0.3%).
Natural Resources, Construction and Maintenance Occupations by Sex
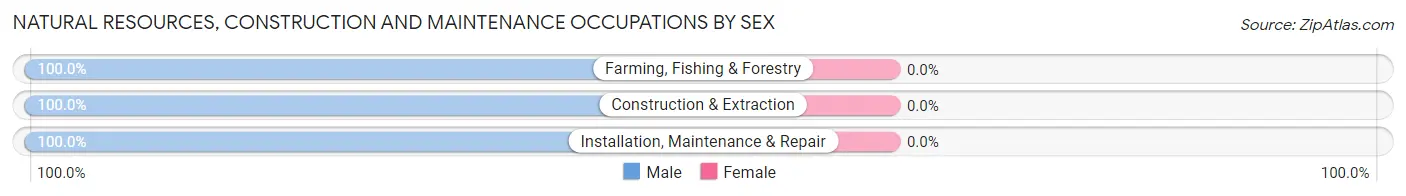
| Occupation | Male | Female |
| Farming, Fishing & Forestry | 10 (100.0%) | 0 (0.0%) |
| Construction & Extraction | 290 (100.0%) | 0 (0.0%) |
| Installation, Maintenance & Repair | 156 (100.0%) | 0 (0.0%) |
| Total (Category) | 456 (100.0%) | 0 (0.0%) |
| Total (Overall) | 1,867 (52.9%) | 1,660 (47.1%) |
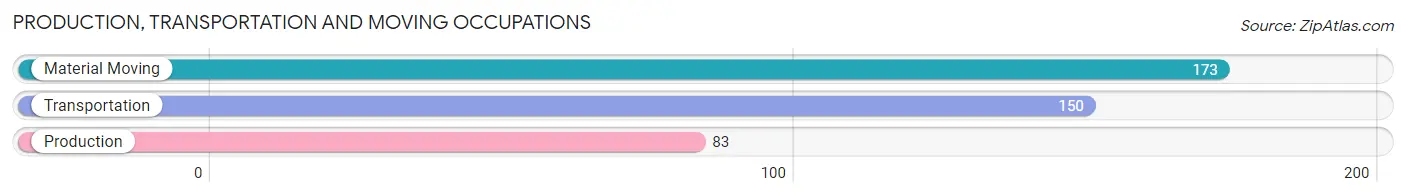
Production, Transportation and Moving Occupations
The most common Production, Transportation and Moving occupations in Thurmont are Material Moving (173 | 4.9%), Transportation (150 | 4.3%), and Production (83 | 2.4%).
Production, Transportation and Moving Occupations by Sex
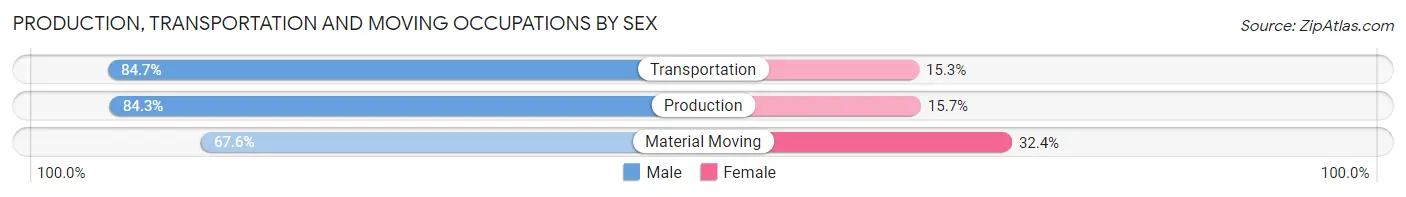
| Occupation | Male | Female |
| Production | 70 (84.3%) | 13 (15.7%) |
| Transportation | 127 (84.7%) | 23 (15.3%) |
| Material Moving | 117 (67.6%) | 56 (32.4%) |
| Total (Category) | 314 (77.3%) | 92 (22.7%) |
| Total (Overall) | 1,867 (52.9%) | 1,660 (47.1%) |
Employment Industries by Sex in Thurmont
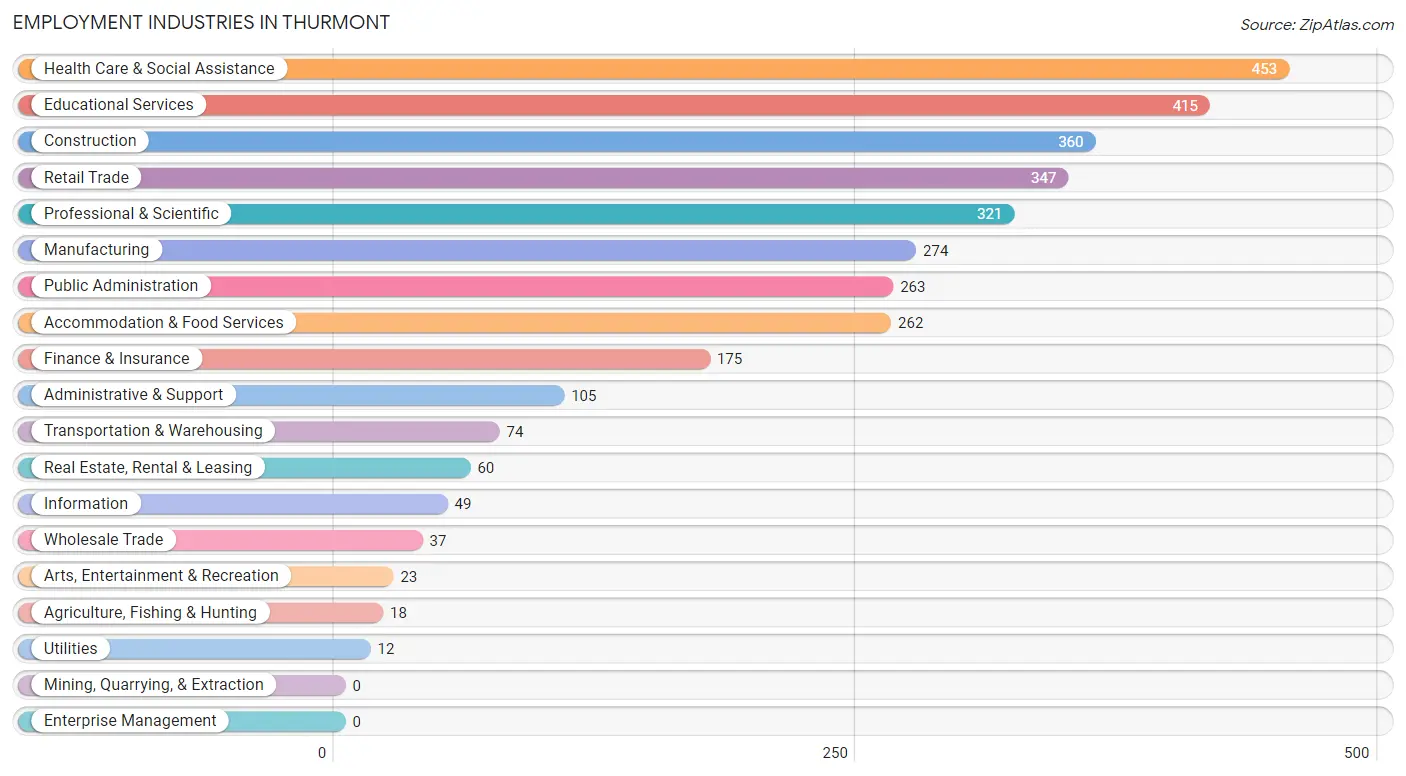
Employment Industries in Thurmont
The major employment industries in Thurmont include Health Care & Social Assistance (453 | 12.8%), Educational Services (415 | 11.8%), Construction (360 | 10.2%), Retail Trade (347 | 9.8%), and Professional & Scientific (321 | 9.1%).
Employment Industries by Sex in Thurmont
The Thurmont industries that see more men than women are Agriculture, Fishing & Hunting (100.0%), Wholesale Trade (100.0%), and Utilities (100.0%), whereas the industries that tend to have a higher number of women are Health Care & Social Assistance (79.9%), Educational Services (73.5%), and Professional & Scientific (62.0%).
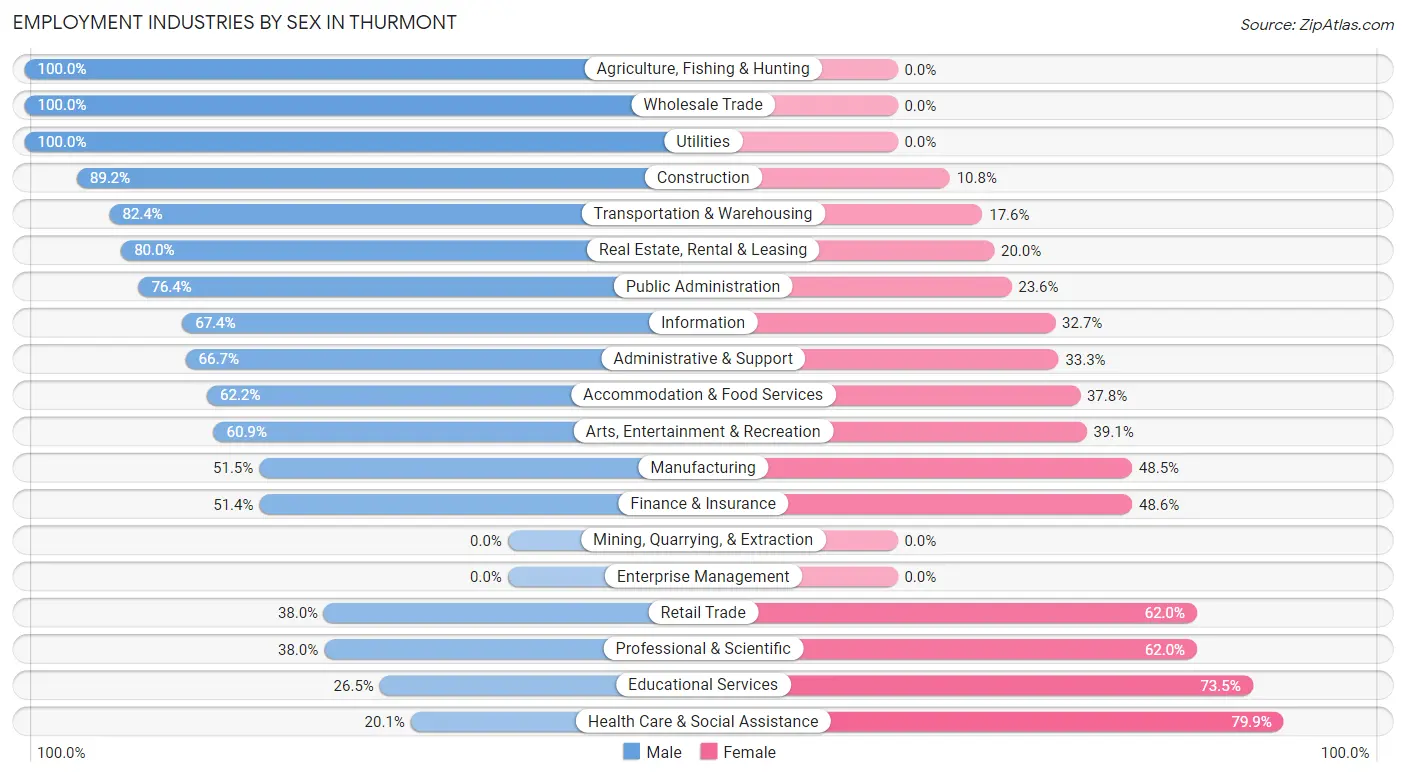
| Industry | Male | Female |
| Agriculture, Fishing & Hunting | 18 (100.0%) | 0 (0.0%) |
| Mining, Quarrying, & Extraction | 0 (0.0%) | 0 (0.0%) |
| Construction | 321 (89.2%) | 39 (10.8%) |
| Manufacturing | 141 (51.5%) | 133 (48.5%) |
| Wholesale Trade | 37 (100.0%) | 0 (0.0%) |
| Retail Trade | 132 (38.0%) | 215 (62.0%) |
| Transportation & Warehousing | 61 (82.4%) | 13 (17.6%) |
| Utilities | 12 (100.0%) | 0 (0.0%) |
| Information | 33 (67.3%) | 16 (32.7%) |
| Finance & Insurance | 90 (51.4%) | 85 (48.6%) |
| Real Estate, Rental & Leasing | 48 (80.0%) | 12 (20.0%) |
| Professional & Scientific | 122 (38.0%) | 199 (62.0%) |
| Enterprise Management | 0 (0.0%) | 0 (0.0%) |
| Administrative & Support | 70 (66.7%) | 35 (33.3%) |
| Educational Services | 110 (26.5%) | 305 (73.5%) |
| Health Care & Social Assistance | 91 (20.1%) | 362 (79.9%) |
| Arts, Entertainment & Recreation | 14 (60.9%) | 9 (39.1%) |
| Accommodation & Food Services | 163 (62.2%) | 99 (37.8%) |
| Public Administration | 201 (76.4%) | 62 (23.6%) |
| Total | 1,867 (52.9%) | 1,660 (47.1%) |
Education in Thurmont
School Enrollment in Thurmont
The most common levels of schooling among the 1,444 students in Thurmont are high school (455 | 31.5%), middle school (364 | 25.2%), and elementary school (258 | 17.9%).
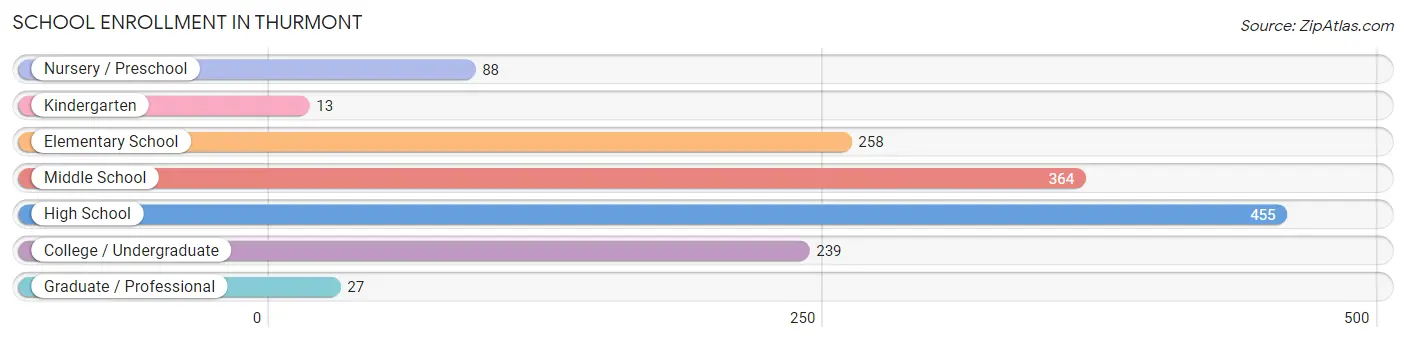
| School Level | # Students | % Students |
| Nursery / Preschool | 88 | 6.1% |
| Kindergarten | 13 | 0.9% |
| Elementary School | 258 | 17.9% |
| Middle School | 364 | 25.2% |
| High School | 455 | 31.5% |
| College / Undergraduate | 239 | 16.6% |
| Graduate / Professional | 27 | 1.9% |
| Total | 1,444 | 100.0% |
School Enrollment by Age by Funding Source in Thurmont
Out of a total of 1,444 students who are enrolled in schools in Thurmont, 139 (9.6%) attend a private institution, while the remaining 1,305 (90.4%) are enrolled in public schools. The age group of 25 to 34 year olds has the highest likelihood of being enrolled in private schools, with 49 (66.2% in the age bracket) enrolled. Conversely, the age group of 18 to 19 year olds has the lowest likelihood of being enrolled in a private school, with 33 (100.0% in the age bracket) attending a public institution.
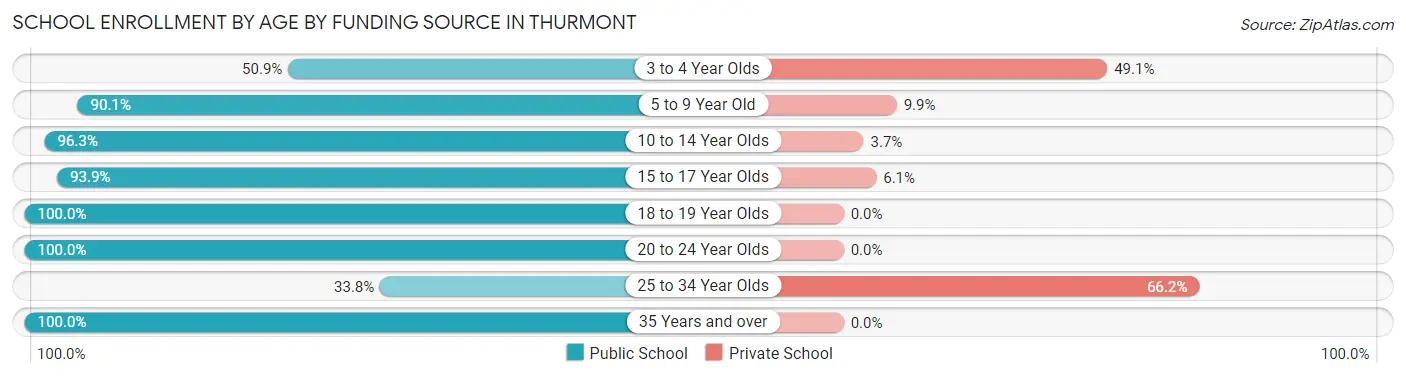
| Age Bracket | Public School | Private School |
| 3 to 4 Year Olds | 28 (50.9%) | 27 (49.1%) |
| 5 to 9 Year Old | 228 (90.1%) | 25 (9.9%) |
| 10 to 14 Year Olds | 467 (96.3%) | 18 (3.7%) |
| 15 to 17 Year Olds | 294 (93.9%) | 19 (6.1%) |
| 18 to 19 Year Olds | 33 (100.0%) | 0 (0.0%) |
| 20 to 24 Year Olds | 153 (100.0%) | 0 (0.0%) |
| 25 to 34 Year Olds | 25 (33.8%) | 49 (66.2%) |
| 35 Years and over | 78 (100.0%) | 0 (0.0%) |
| Total | 1,305 (90.4%) | 139 (9.6%) |
Educational Attainment by Field of Study in Thurmont
Science & technology (194 | 18.4%), business (126 | 12.0%), arts & humanities (119 | 11.3%), bio, nature & agricultural (91 | 8.6%), and social sciences (83 | 7.9%) are the most common fields of study among 1,052 individuals in Thurmont who have obtained a bachelor's degree or higher.
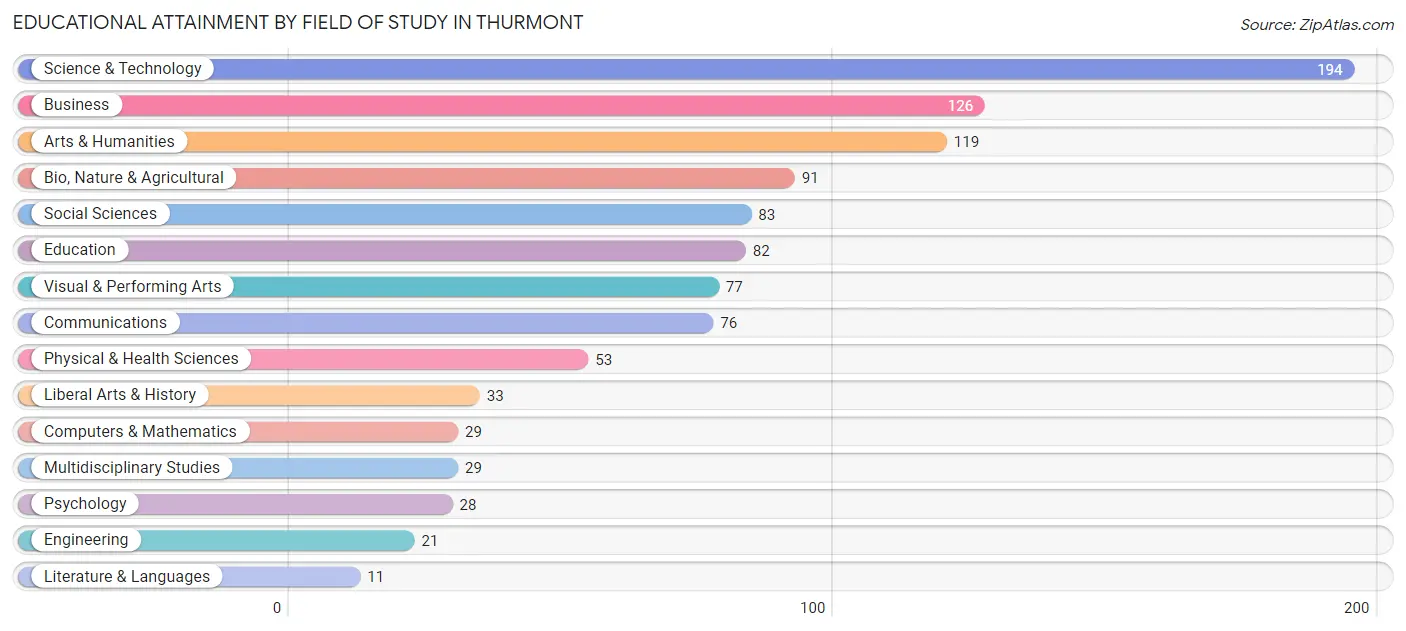
| Field of Study | # Graduates | % Graduates |
| Computers & Mathematics | 29 | 2.8% |
| Bio, Nature & Agricultural | 91 | 8.6% |
| Physical & Health Sciences | 53 | 5.0% |
| Psychology | 28 | 2.7% |
| Social Sciences | 83 | 7.9% |
| Engineering | 21 | 2.0% |
| Multidisciplinary Studies | 29 | 2.8% |
| Science & Technology | 194 | 18.4% |
| Business | 126 | 12.0% |
| Education | 82 | 7.8% |
| Literature & Languages | 11 | 1.1% |
| Liberal Arts & History | 33 | 3.1% |
| Visual & Performing Arts | 77 | 7.3% |
| Communications | 76 | 7.2% |
| Arts & Humanities | 119 | 11.3% |
| Total | 1,052 | 100.0% |
Transportation & Commute in Thurmont
Vehicle Availability by Sex in Thurmont
The most prevalent vehicle ownership categories in Thurmont are males with 3 vehicles (784, accounting for 41.8%) and females with 3 vehicles (639, making up 48.6%).
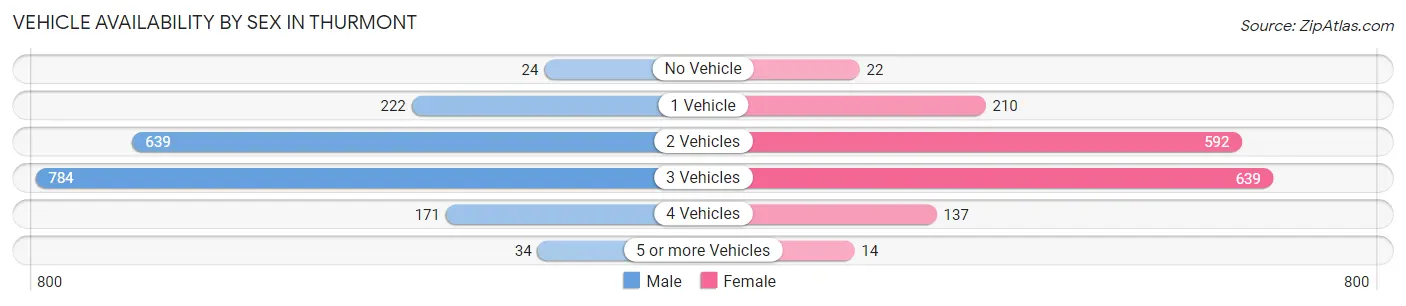
| Vehicles Available | Male | Female |
| No Vehicle | 24 (1.3%) | 22 (1.4%) |
| 1 Vehicle | 222 (11.8%) | 210 (13.0%) |
| 2 Vehicles | 639 (34.1%) | 592 (36.7%) |
| 3 Vehicles | 784 (41.8%) | 639 (39.6%) |
| 4 Vehicles | 171 (9.1%) | 137 (8.5%) |
| 5 or more Vehicles | 34 (1.8%) | 14 (0.9%) |
| Total | 1,874 (100.0%) | 1,614 (100.0%) |
Commute Time in Thurmont
The most frequently occuring commute durations in Thurmont are 20 to 24 minutes (579 commuters, 18.6%), 30 to 34 minutes (439 commuters, 14.1%), and 5 to 9 minutes (423 commuters, 13.6%).
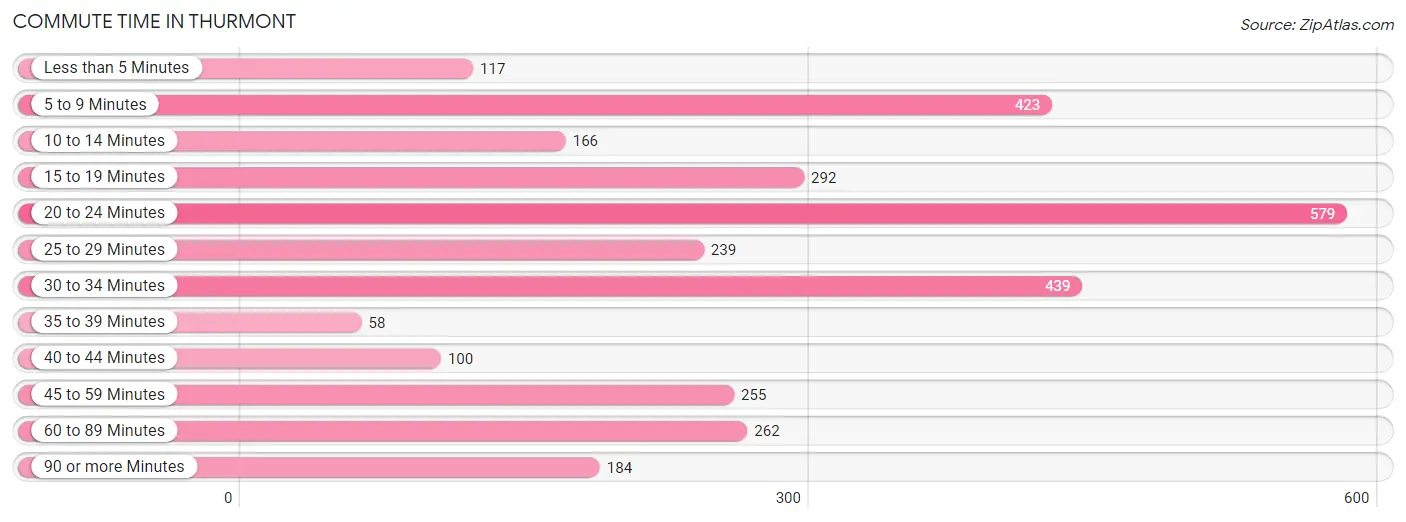
| Commute Time | # Commuters | % Commuters |
| Less than 5 Minutes | 117 | 3.8% |
| 5 to 9 Minutes | 423 | 13.6% |
| 10 to 14 Minutes | 166 | 5.3% |
| 15 to 19 Minutes | 292 | 9.4% |
| 20 to 24 Minutes | 579 | 18.6% |
| 25 to 29 Minutes | 239 | 7.7% |
| 30 to 34 Minutes | 439 | 14.1% |
| 35 to 39 Minutes | 58 | 1.9% |
| 40 to 44 Minutes | 100 | 3.2% |
| 45 to 59 Minutes | 255 | 8.2% |
| 60 to 89 Minutes | 262 | 8.4% |
| 90 or more Minutes | 184 | 5.9% |
Commute Time by Sex in Thurmont
The most common commute times in Thurmont are 30 to 34 minutes (268 commuters, 16.2%) for males and 20 to 24 minutes (332 commuters, 22.8%) for females.
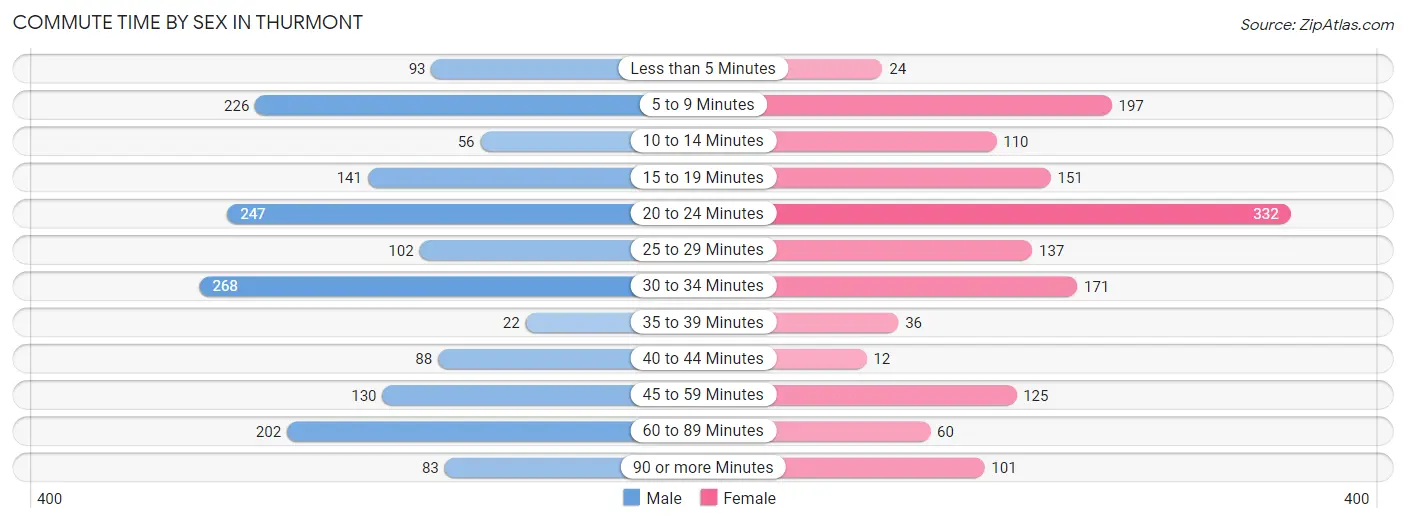
| Commute Time | Male | Female |
| Less than 5 Minutes | 93 (5.6%) | 24 (1.7%) |
| 5 to 9 Minutes | 226 (13.6%) | 197 (13.5%) |
| 10 to 14 Minutes | 56 (3.4%) | 110 (7.5%) |
| 15 to 19 Minutes | 141 (8.5%) | 151 (10.4%) |
| 20 to 24 Minutes | 247 (14.9%) | 332 (22.8%) |
| 25 to 29 Minutes | 102 (6.1%) | 137 (9.4%) |
| 30 to 34 Minutes | 268 (16.2%) | 171 (11.7%) |
| 35 to 39 Minutes | 22 (1.3%) | 36 (2.5%) |
| 40 to 44 Minutes | 88 (5.3%) | 12 (0.8%) |
| 45 to 59 Minutes | 130 (7.8%) | 125 (8.6%) |
| 60 to 89 Minutes | 202 (12.2%) | 60 (4.1%) |
| 90 or more Minutes | 83 (5.0%) | 101 (6.9%) |
Time of Departure to Work by Sex in Thurmont
The most frequent times of departure to work in Thurmont are 6:00 AM to 6:29 AM (279, 16.8%) for males and 7:00 AM to 7:29 AM (298, 20.5%) for females.
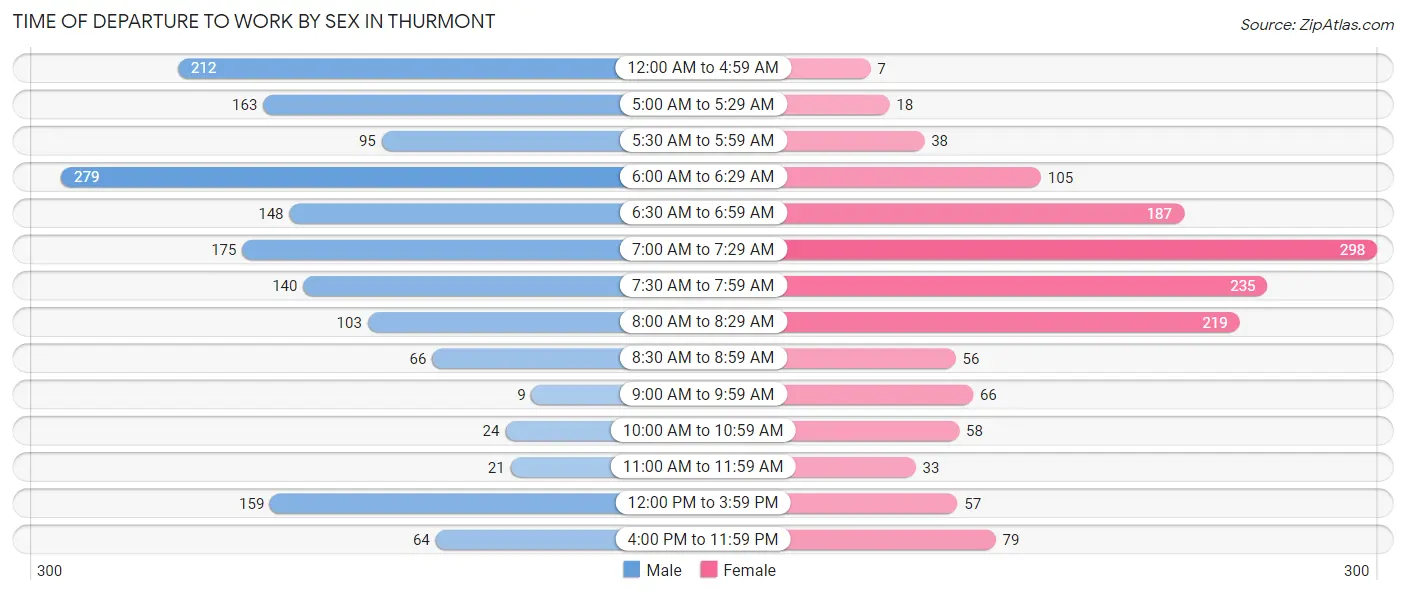
| Time of Departure | Male | Female |
| 12:00 AM to 4:59 AM | 212 (12.8%) | 7 (0.5%) |
| 5:00 AM to 5:29 AM | 163 (9.8%) | 18 (1.2%) |
| 5:30 AM to 5:59 AM | 95 (5.7%) | 38 (2.6%) |
| 6:00 AM to 6:29 AM | 279 (16.8%) | 105 (7.2%) |
| 6:30 AM to 6:59 AM | 148 (8.9%) | 187 (12.8%) |
| 7:00 AM to 7:29 AM | 175 (10.5%) | 298 (20.5%) |
| 7:30 AM to 7:59 AM | 140 (8.4%) | 235 (16.1%) |
| 8:00 AM to 8:29 AM | 103 (6.2%) | 219 (15.0%) |
| 8:30 AM to 8:59 AM | 66 (4.0%) | 56 (3.8%) |
| 9:00 AM to 9:59 AM | 9 (0.5%) | 66 (4.5%) |
| 10:00 AM to 10:59 AM | 24 (1.5%) | 58 (4.0%) |
| 11:00 AM to 11:59 AM | 21 (1.3%) | 33 (2.3%) |
| 12:00 PM to 3:59 PM | 159 (9.6%) | 57 (3.9%) |
| 4:00 PM to 11:59 PM | 64 (3.9%) | 79 (5.4%) |
| Total | 1,658 (100.0%) | 1,456 (100.0%) |
Housing Occupancy in Thurmont
Occupancy by Ownership in Thurmont
Of the total 2,512 dwellings in Thurmont, owner-occupied units account for 1,880 (74.8%), while renter-occupied units make up 632 (25.2%).
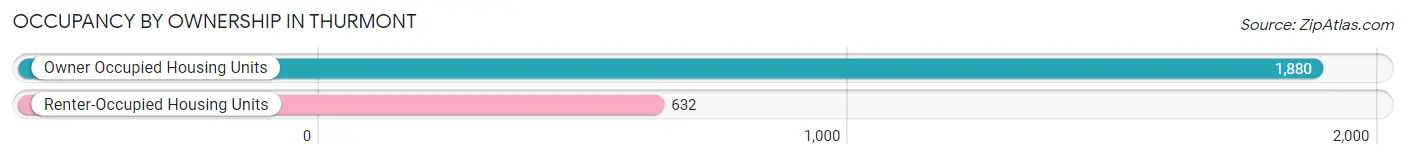
| Occupancy | # Housing Units | % Housing Units |
| Owner Occupied Housing Units | 1,880 | 74.8% |
| Renter-Occupied Housing Units | 632 | 25.2% |
| Total Occupied Housing Units | 2,512 | 100.0% |
Occupancy by Household Size in Thurmont
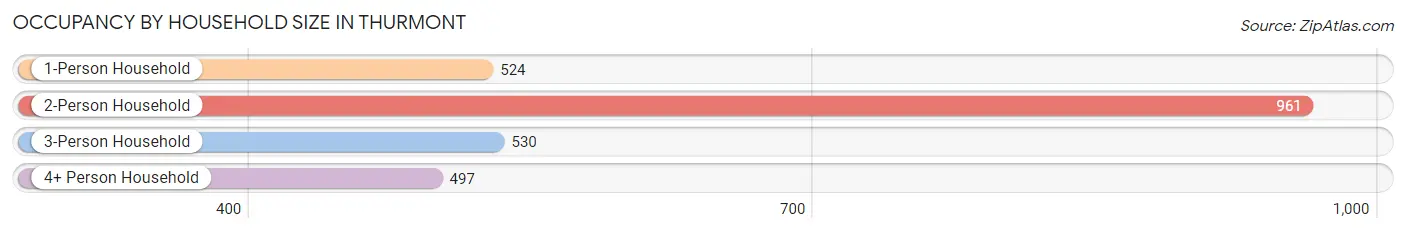
| Household Size | # Housing Units | % Housing Units |
| 1-Person Household | 524 | 20.9% |
| 2-Person Household | 961 | 38.3% |
| 3-Person Household | 530 | 21.1% |
| 4+ Person Household | 497 | 19.8% |
| Total Housing Units | 2,512 | 100.0% |
Occupancy by Ownership by Household Size in Thurmont
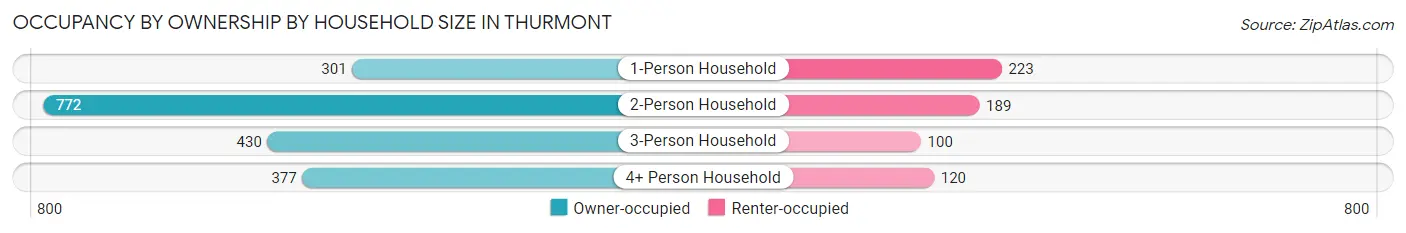
| Household Size | Owner-occupied | Renter-occupied |
| 1-Person Household | 301 (57.4%) | 223 (42.6%) |
| 2-Person Household | 772 (80.3%) | 189 (19.7%) |
| 3-Person Household | 430 (81.1%) | 100 (18.9%) |
| 4+ Person Household | 377 (75.9%) | 120 (24.1%) |
| Total Housing Units | 1,880 (74.8%) | 632 (25.2%) |
Occupancy by Educational Attainment in Thurmont
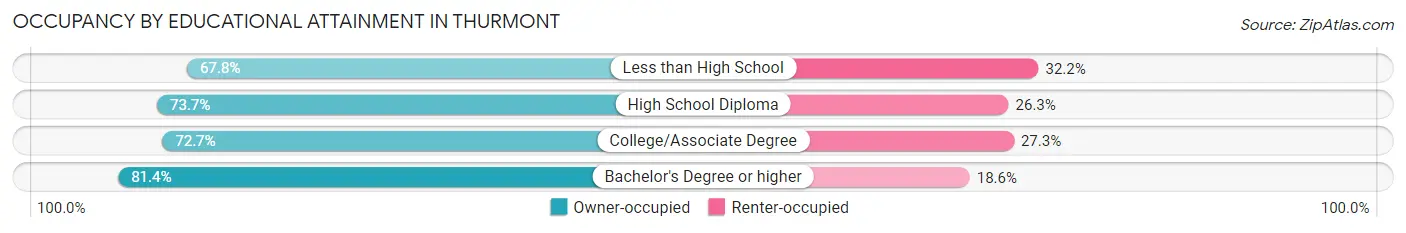
| Household Size | Owner-occupied | Renter-occupied |
| Less than High School | 179 (67.8%) | 85 (32.2%) |
| High School Diploma | 511 (73.7%) | 182 (26.3%) |
| College/Associate Degree | 633 (72.7%) | 238 (27.3%) |
| Bachelor's Degree or higher | 557 (81.4%) | 127 (18.6%) |
Occupancy by Age of Householder in Thurmont
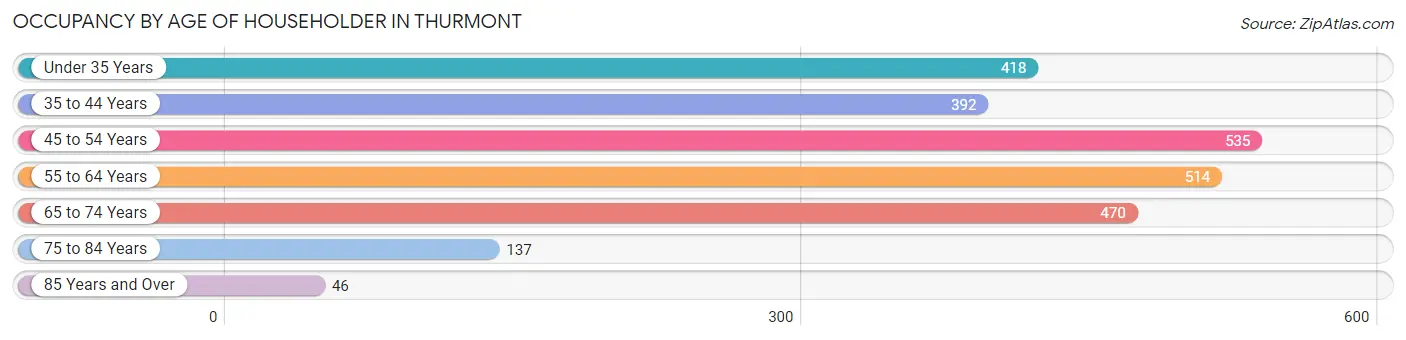
| Age Bracket | # Households | % Households |
| Under 35 Years | 418 | 16.6% |
| 35 to 44 Years | 392 | 15.6% |
| 45 to 54 Years | 535 | 21.3% |
| 55 to 64 Years | 514 | 20.5% |
| 65 to 74 Years | 470 | 18.7% |
| 75 to 84 Years | 137 | 5.4% |
| 85 Years and Over | 46 | 1.8% |
| Total | 2,512 | 100.0% |
Housing Finances in Thurmont
Median Income by Occupancy in Thurmont
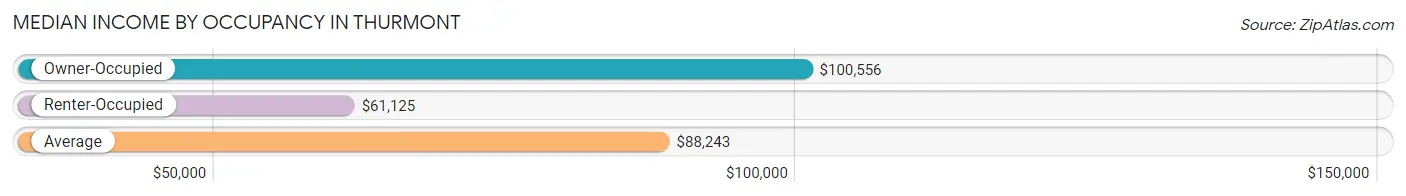
| Occupancy Type | # Households | Median Income |
| Owner-Occupied | 1,880 (74.8%) | $100,556 |
| Renter-Occupied | 632 (25.2%) | $61,125 |
| Average | 2,512 (100.0%) | $88,243 |
Occupancy by Householder Income Bracket in Thurmont
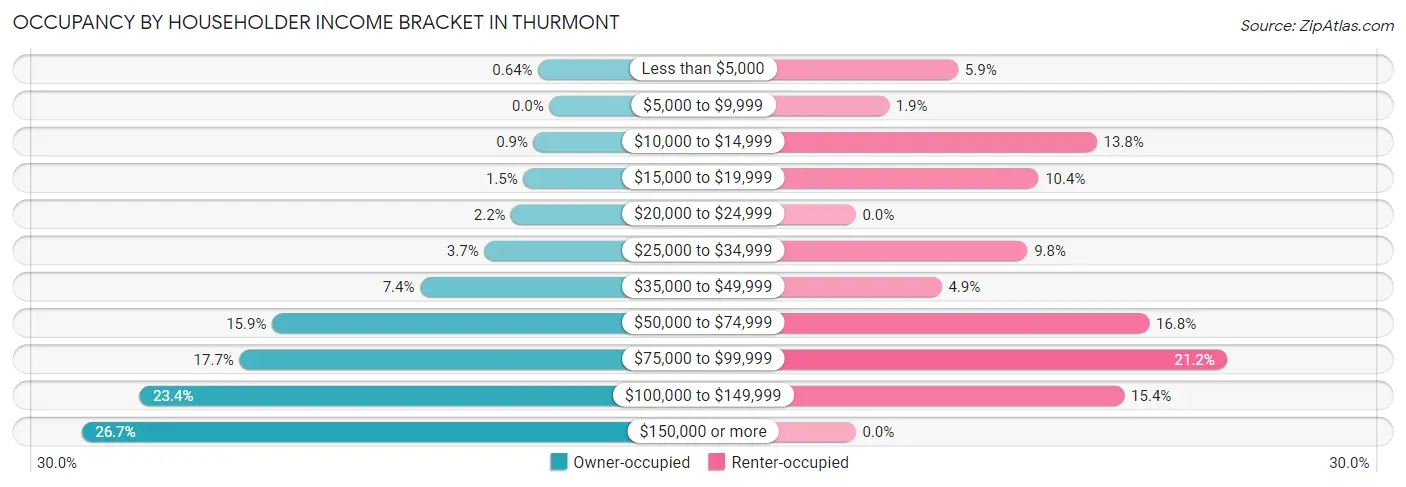
| Income Bracket | Owner-occupied | Renter-occupied |
| Less than $5,000 | 12 (0.6%) | 37 (5.9%) |
| $5,000 to $9,999 | 0 (0.0%) | 12 (1.9%) |
| $10,000 to $14,999 | 17 (0.9%) | 87 (13.8%) |
| $15,000 to $19,999 | 28 (1.5%) | 66 (10.4%) |
| $20,000 to $24,999 | 41 (2.2%) | 0 (0.0%) |
| $25,000 to $34,999 | 70 (3.7%) | 62 (9.8%) |
| $35,000 to $49,999 | 139 (7.4%) | 31 (4.9%) |
| $50,000 to $74,999 | 298 (15.9%) | 106 (16.8%) |
| $75,000 to $99,999 | 333 (17.7%) | 134 (21.2%) |
| $100,000 to $149,999 | 440 (23.4%) | 97 (15.3%) |
| $150,000 or more | 502 (26.7%) | 0 (0.0%) |
| Total | 1,880 (100.0%) | 632 (100.0%) |
Monthly Housing Cost Tiers in Thurmont
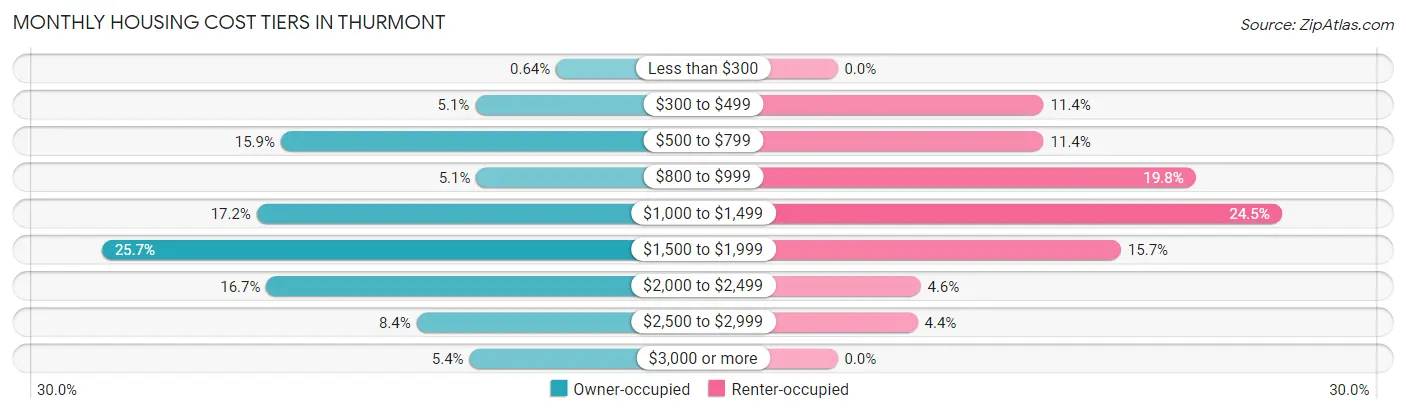
| Monthly Cost | Owner-occupied | Renter-occupied |
| Less than $300 | 12 (0.6%) | 0 (0.0%) |
| $300 to $499 | 96 (5.1%) | 72 (11.4%) |
| $500 to $799 | 298 (15.9%) | 72 (11.4%) |
| $800 to $999 | 95 (5.1%) | 125 (19.8%) |
| $1,000 to $1,499 | 323 (17.2%) | 155 (24.5%) |
| $1,500 to $1,999 | 484 (25.7%) | 99 (15.7%) |
| $2,000 to $2,499 | 313 (16.7%) | 29 (4.6%) |
| $2,500 to $2,999 | 157 (8.4%) | 28 (4.4%) |
| $3,000 or more | 102 (5.4%) | 0 (0.0%) |
| Total | 1,880 (100.0%) | 632 (100.0%) |
Physical Housing Characteristics in Thurmont
Housing Structures in Thurmont
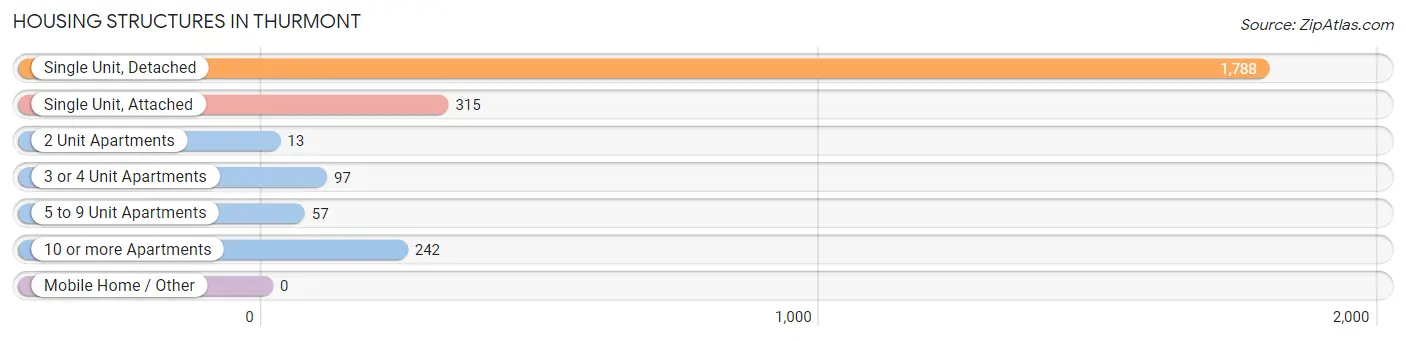
| Structure Type | # Housing Units | % Housing Units |
| Single Unit, Detached | 1,788 | 71.2% |
| Single Unit, Attached | 315 | 12.5% |
| 2 Unit Apartments | 13 | 0.5% |
| 3 or 4 Unit Apartments | 97 | 3.9% |
| 5 to 9 Unit Apartments | 57 | 2.3% |
| 10 or more Apartments | 242 | 9.6% |
| Mobile Home / Other | 0 | 0.0% |
| Total | 2,512 | 100.0% |
Housing Structures by Occupancy in Thurmont
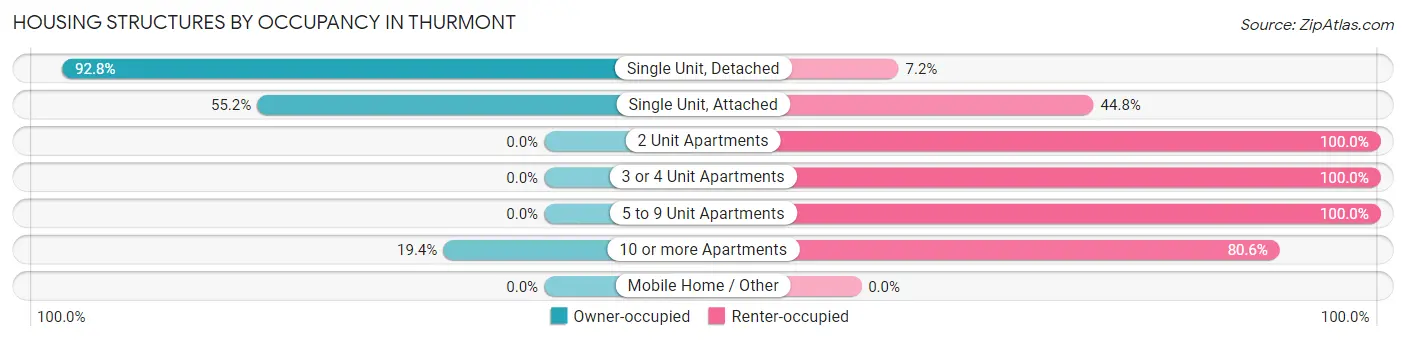
| Structure Type | Owner-occupied | Renter-occupied |
| Single Unit, Detached | 1,659 (92.8%) | 129 (7.2%) |
| Single Unit, Attached | 174 (55.2%) | 141 (44.8%) |
| 2 Unit Apartments | 0 (0.0%) | 13 (100.0%) |
| 3 or 4 Unit Apartments | 0 (0.0%) | 97 (100.0%) |
| 5 to 9 Unit Apartments | 0 (0.0%) | 57 (100.0%) |
| 10 or more Apartments | 47 (19.4%) | 195 (80.6%) |
| Mobile Home / Other | 0 (0.0%) | 0 (0.0%) |
| Total | 1,880 (74.8%) | 632 (25.2%) |
Housing Structures by Number of Rooms in Thurmont
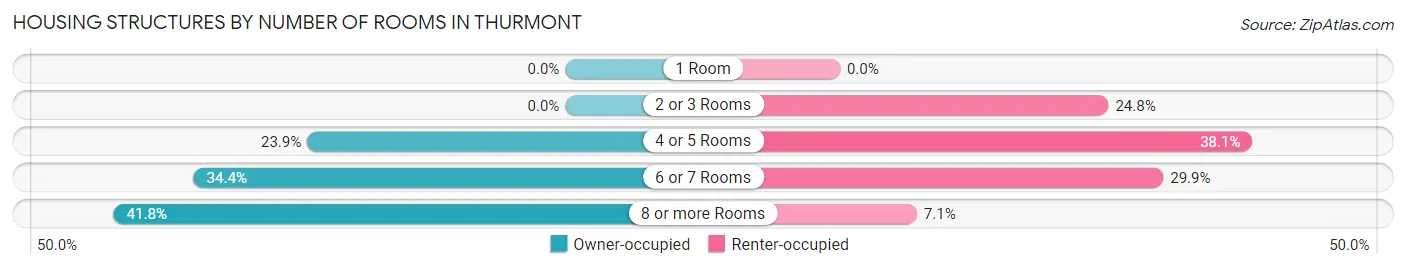
| Number of Rooms | Owner-occupied | Renter-occupied |
| 1 Room | 0 (0.0%) | 0 (0.0%) |
| 2 or 3 Rooms | 0 (0.0%) | 157 (24.8%) |
| 4 or 5 Rooms | 449 (23.9%) | 241 (38.1%) |
| 6 or 7 Rooms | 646 (34.4%) | 189 (29.9%) |
| 8 or more Rooms | 785 (41.8%) | 45 (7.1%) |
| Total | 1,880 (100.0%) | 632 (100.0%) |
Housing Structure by Heating Type in Thurmont
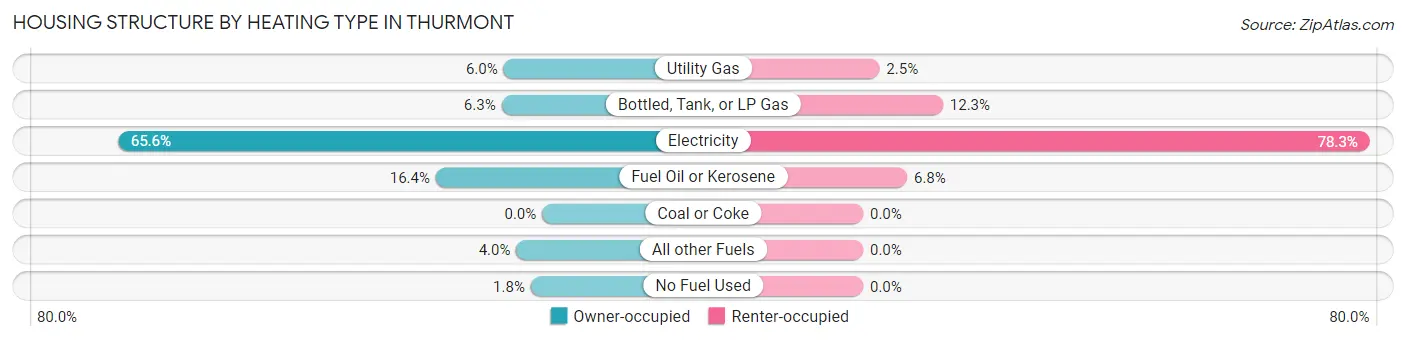
| Heating Type | Owner-occupied | Renter-occupied |
| Utility Gas | 112 (6.0%) | 16 (2.5%) |
| Bottled, Tank, or LP Gas | 118 (6.3%) | 78 (12.3%) |
| Electricity | 1,233 (65.6%) | 495 (78.3%) |
| Fuel Oil or Kerosene | 309 (16.4%) | 43 (6.8%) |
| Coal or Coke | 0 (0.0%) | 0 (0.0%) |
| All other Fuels | 75 (4.0%) | 0 (0.0%) |
| No Fuel Used | 33 (1.8%) | 0 (0.0%) |
| Total | 1,880 (100.0%) | 632 (100.0%) |
Household Vehicle Usage in Thurmont
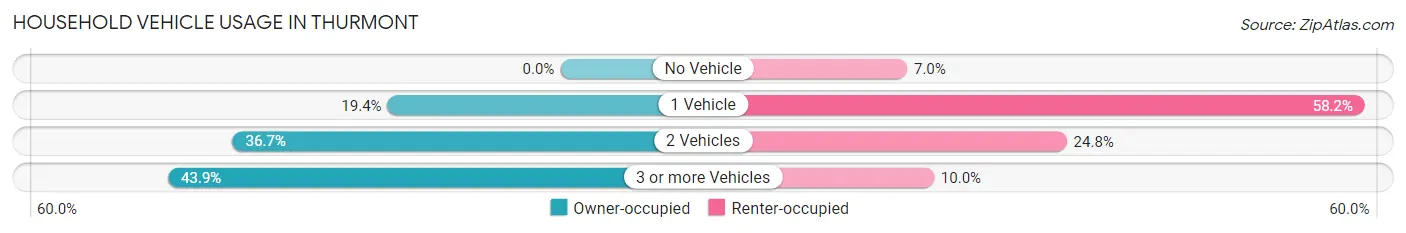
| Vehicles per Household | Owner-occupied | Renter-occupied |
| No Vehicle | 0 (0.0%) | 44 (7.0%) |
| 1 Vehicle | 364 (19.4%) | 368 (58.2%) |
| 2 Vehicles | 690 (36.7%) | 157 (24.8%) |
| 3 or more Vehicles | 826 (43.9%) | 63 (10.0%) |
| Total | 1,880 (100.0%) | 632 (100.0%) |
Real Estate & Mortgages in Thurmont
Real Estate and Mortgage Overview in Thurmont
| Characteristic | Without Mortgage | With Mortgage |
| Housing Units | 398 | 1,482 |
| Median Property Value | $317,700 | $315,200 |
| Median Household Income | $70,455 | $435 |
| Monthly Housing Costs | $637 | $102 |
| Real Estate Taxes | $3,348 | $10 |
Property Value by Mortgage Status in Thurmont
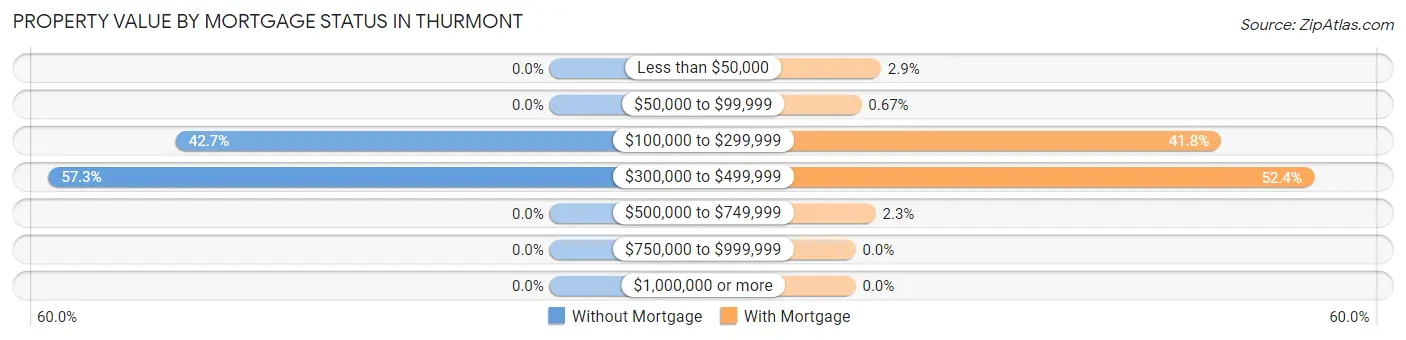
| Property Value | Without Mortgage | With Mortgage |
| Less than $50,000 | 0 (0.0%) | 43 (2.9%) |
| $50,000 to $99,999 | 0 (0.0%) | 10 (0.7%) |
| $100,000 to $299,999 | 170 (42.7%) | 619 (41.8%) |
| $300,000 to $499,999 | 228 (57.3%) | 776 (52.4%) |
| $500,000 to $749,999 | 0 (0.0%) | 34 (2.3%) |
| $750,000 to $999,999 | 0 (0.0%) | 0 (0.0%) |
| $1,000,000 or more | 0 (0.0%) | 0 (0.0%) |
| Total | 398 (100.0%) | 1,482 (100.0%) |
Household Income by Mortgage Status in Thurmont
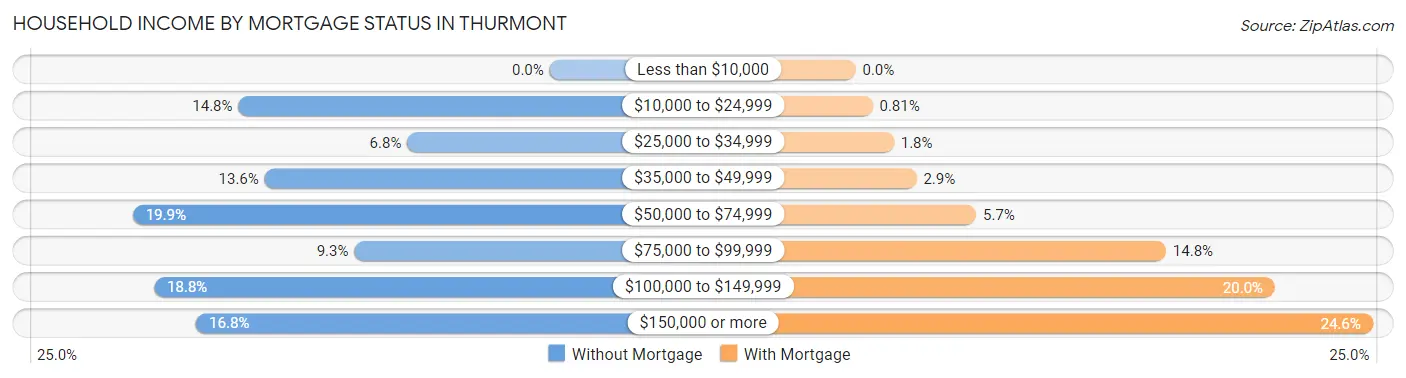
| Household Income | Without Mortgage | With Mortgage |
| Less than $10,000 | 0 (0.0%) | 0 (0.0%) |
| $10,000 to $24,999 | 59 (14.8%) | 12 (0.8%) |
| $25,000 to $34,999 | 27 (6.8%) | 27 (1.8%) |
| $35,000 to $49,999 | 54 (13.6%) | 43 (2.9%) |
| $50,000 to $74,999 | 79 (19.9%) | 85 (5.7%) |
| $75,000 to $99,999 | 37 (9.3%) | 219 (14.8%) |
| $100,000 to $149,999 | 75 (18.8%) | 296 (20.0%) |
| $150,000 or more | 67 (16.8%) | 365 (24.6%) |
| Total | 398 (100.0%) | 1,482 (100.0%) |
Property Value to Household Income Ratio in Thurmont
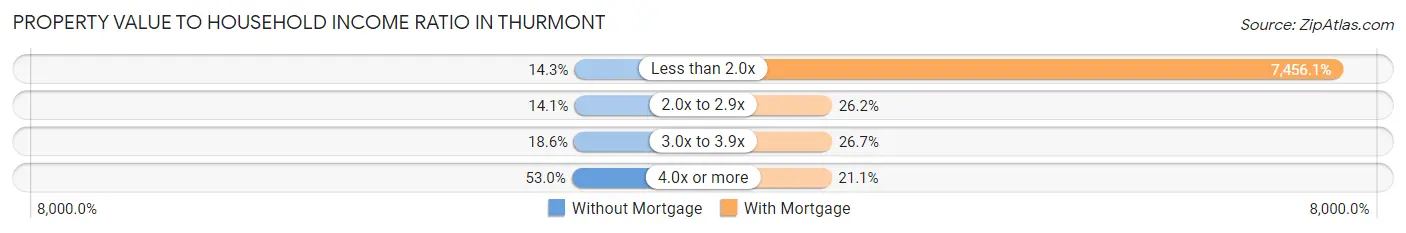
| Value-to-Income Ratio | Without Mortgage | With Mortgage |
| Less than 2.0x | 57 (14.3%) | 110,500 (7,456.1%) |
| 2.0x to 2.9x | 56 (14.1%) | 388 (26.2%) |
| 3.0x to 3.9x | 74 (18.6%) | 395 (26.7%) |
| 4.0x or more | 211 (53.0%) | 312 (21.0%) |
| Total | 398 (100.0%) | 1,482 (100.0%) |
Real Estate Taxes by Mortgage Status in Thurmont
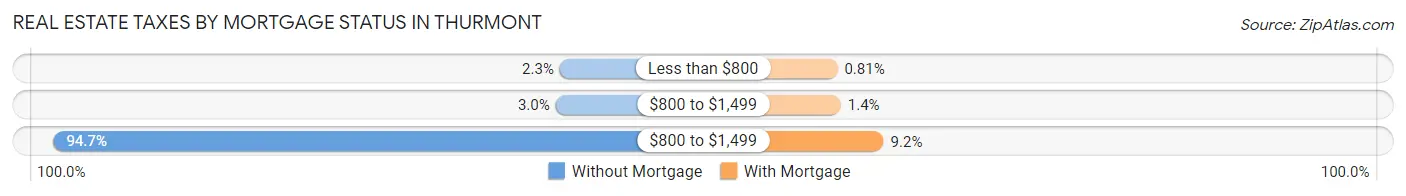
| Property Taxes | Without Mortgage | With Mortgage |
| Less than $800 | 9 (2.3%) | 12 (0.8%) |
| $800 to $1,499 | 12 (3.0%) | 21 (1.4%) |
| $800 to $1,499 | 377 (94.7%) | 137 (9.2%) |
| Total | 398 (100.0%) | 1,482 (100.0%) |
Health & Disability in Thurmont
Health Insurance Coverage by Age in Thurmont
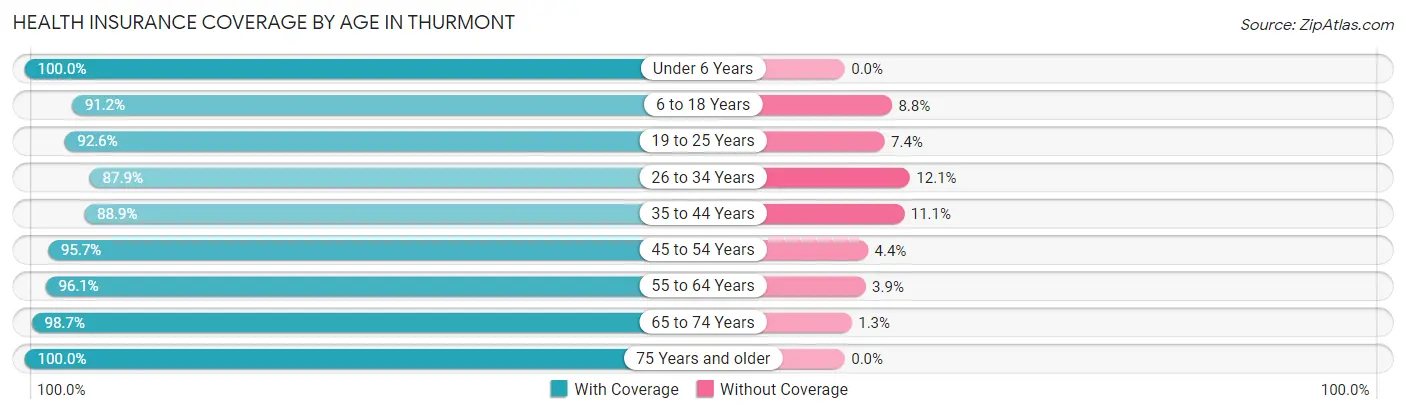
| Age Bracket | With Coverage | Without Coverage |
| Under 6 Years | 302 (100.0%) | 0 (0.0%) |
| 6 to 18 Years | 995 (91.2%) | 96 (8.8%) |
| 19 to 25 Years | 449 (92.6%) | 36 (7.4%) |
| 26 to 34 Years | 709 (87.9%) | 98 (12.1%) |
| 35 to 44 Years | 617 (88.9%) | 77 (11.1%) |
| 45 to 54 Years | 968 (95.7%) | 44 (4.3%) |
| 55 to 64 Years | 915 (96.1%) | 37 (3.9%) |
| 65 to 74 Years | 684 (98.7%) | 9 (1.3%) |
| 75 Years and older | 258 (100.0%) | 0 (0.0%) |
| Total | 5,897 (93.7%) | 397 (6.3%) |
Health Insurance Coverage by Citizenship Status in Thurmont
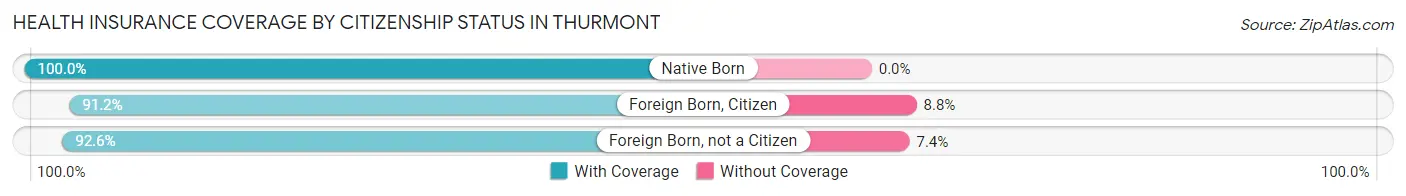
| Citizenship Status | With Coverage | Without Coverage |
| Native Born | 302 (100.0%) | 0 (0.0%) |
| Foreign Born, Citizen | 995 (91.2%) | 96 (8.8%) |
| Foreign Born, not a Citizen | 449 (92.6%) | 36 (7.4%) |
Health Insurance Coverage by Household Income in Thurmont
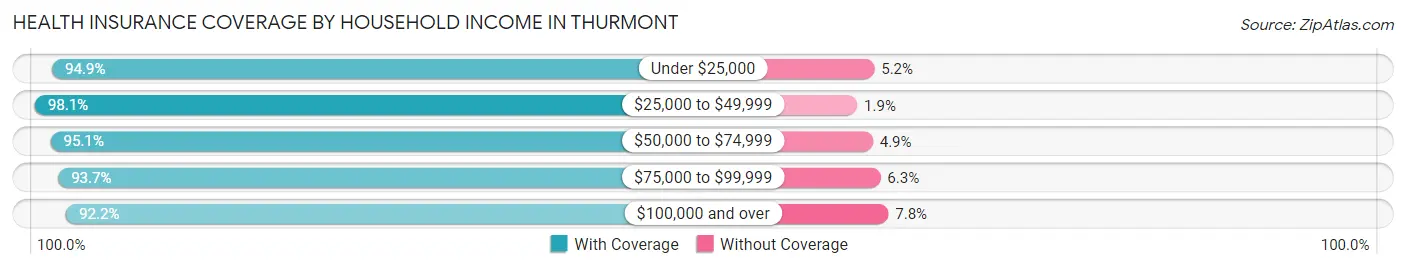
| Household Income | With Coverage | Without Coverage |
| Under $25,000 | 405 (94.9%) | 22 (5.1%) |
| $25,000 to $49,999 | 656 (98.1%) | 13 (1.9%) |
| $50,000 to $74,999 | 918 (95.1%) | 47 (4.9%) |
| $75,000 to $99,999 | 937 (93.7%) | 63 (6.3%) |
| $100,000 and over | 2,981 (92.2%) | 252 (7.8%) |
Public vs Private Health Insurance Coverage by Age in Thurmont
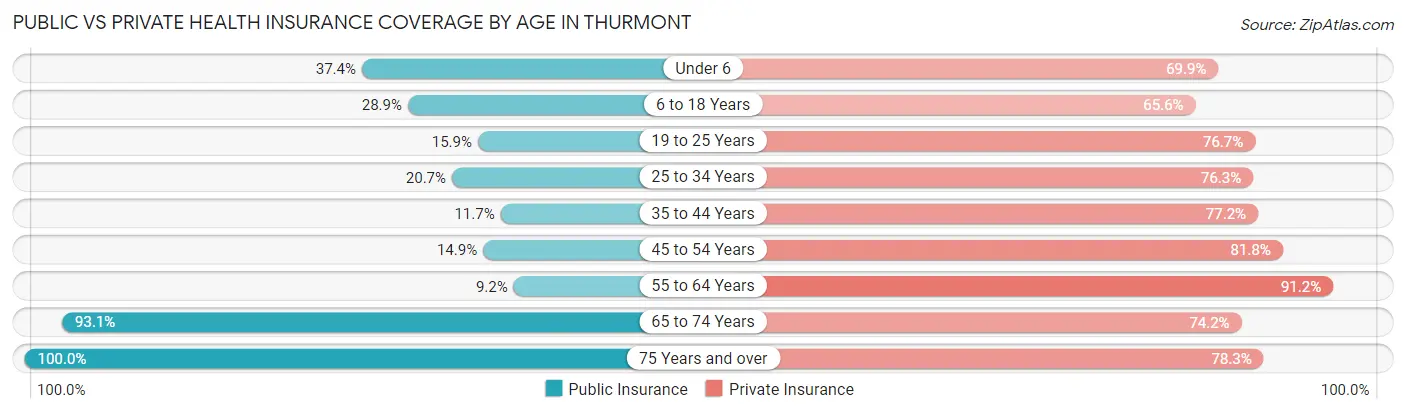
| Age Bracket | Public Insurance | Private Insurance |
| Under 6 | 113 (37.4%) | 211 (69.9%) |
| 6 to 18 Years | 315 (28.9%) | 716 (65.6%) |
| 19 to 25 Years | 77 (15.9%) | 372 (76.7%) |
| 25 to 34 Years | 167 (20.7%) | 616 (76.3%) |
| 35 to 44 Years | 81 (11.7%) | 536 (77.2%) |
| 45 to 54 Years | 151 (14.9%) | 828 (81.8%) |
| 55 to 64 Years | 88 (9.2%) | 868 (91.2%) |
| 65 to 74 Years | 645 (93.1%) | 514 (74.2%) |
| 75 Years and over | 258 (100.0%) | 202 (78.3%) |
| Total | 1,895 (30.1%) | 4,863 (77.3%) |
Disability Status by Sex by Age in Thurmont
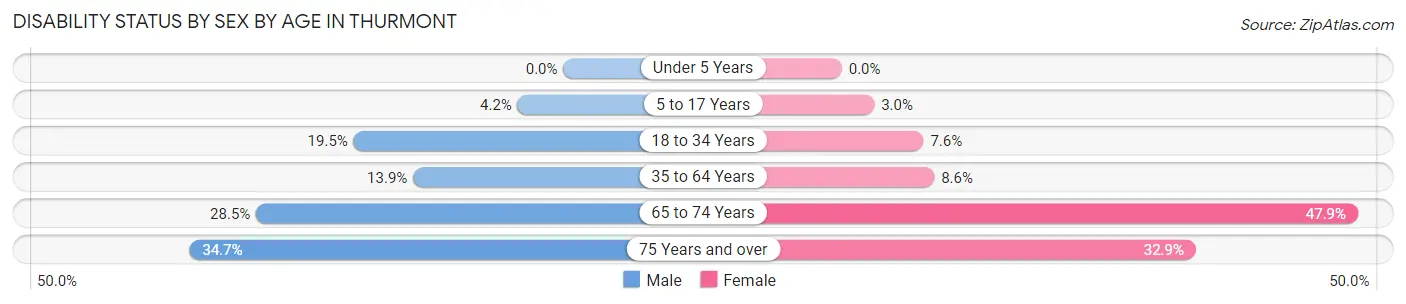
| Age Bracket | Male | Female |
| Under 5 Years | 0 (0.0%) | 0 (0.0%) |
| 5 to 17 Years | 25 (4.2%) | 15 (3.0%) |
| 18 to 34 Years | 150 (19.5%) | 43 (7.6%) |
| 35 to 64 Years | 174 (13.9%) | 121 (8.6%) |
| 65 to 74 Years | 69 (28.5%) | 216 (47.9%) |
| 75 Years and over | 42 (34.7%) | 45 (32.9%) |
Disability Class by Sex by Age in Thurmont
Disability Class: Hearing Difficulty
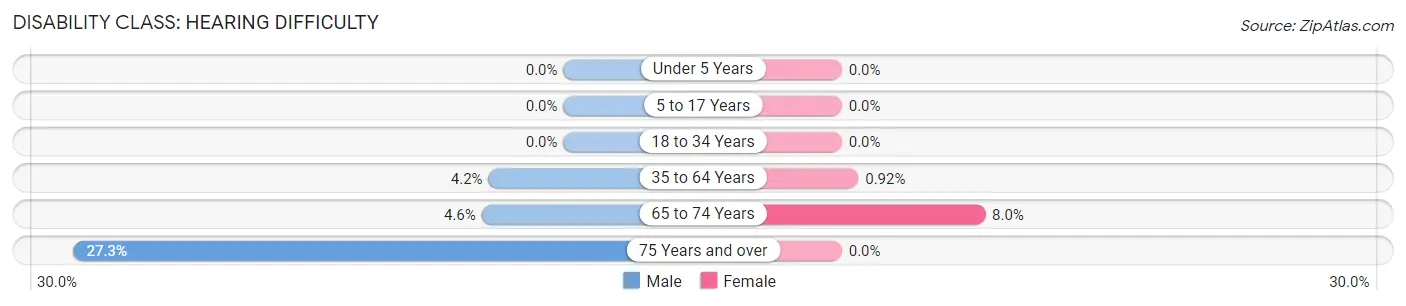
| Age Bracket | Male | Female |
| Under 5 Years | 0 (0.0%) | 0 (0.0%) |
| 5 to 17 Years | 0 (0.0%) | 0 (0.0%) |
| 18 to 34 Years | 0 (0.0%) | 0 (0.0%) |
| 35 to 64 Years | 52 (4.2%) | 13 (0.9%) |
| 65 to 74 Years | 11 (4.5%) | 36 (8.0%) |
| 75 Years and over | 33 (27.3%) | 0 (0.0%) |
Disability Class: Vision Difficulty
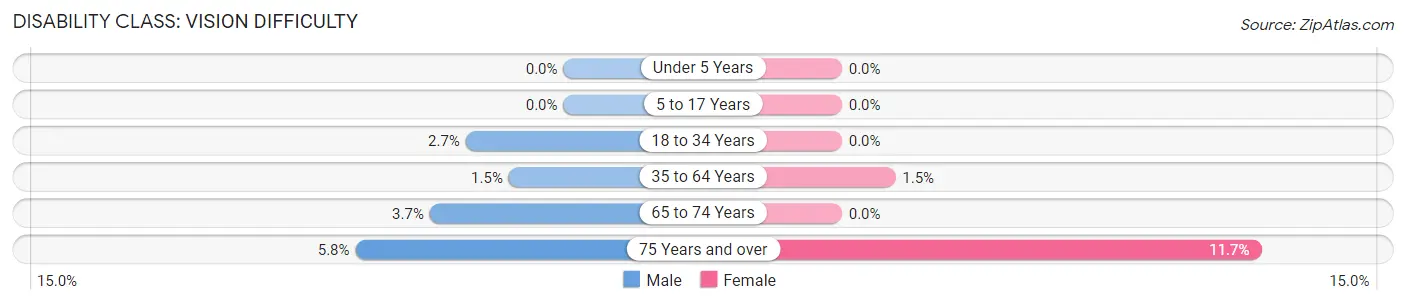
| Age Bracket | Male | Female |
| Under 5 Years | 0 (0.0%) | 0 (0.0%) |
| 5 to 17 Years | 0 (0.0%) | 0 (0.0%) |
| 18 to 34 Years | 21 (2.7%) | 0 (0.0%) |
| 35 to 64 Years | 19 (1.5%) | 21 (1.5%) |
| 65 to 74 Years | 9 (3.7%) | 0 (0.0%) |
| 75 Years and over | 7 (5.8%) | 16 (11.7%) |
Disability Class: Cognitive Difficulty
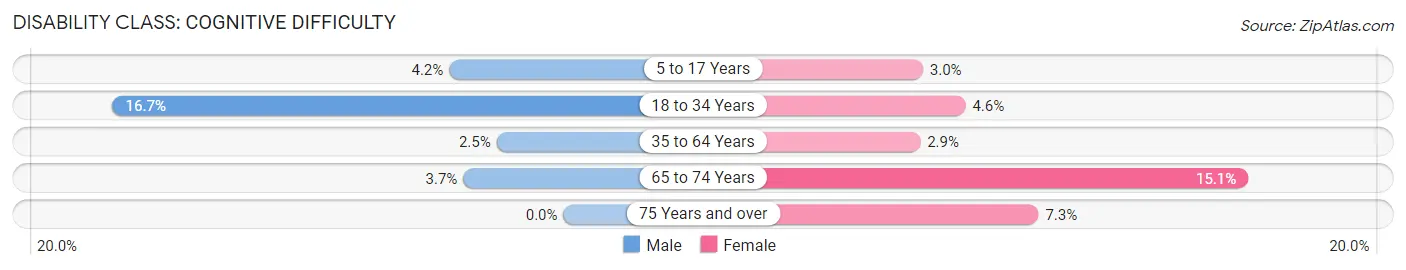
| Age Bracket | Male | Female |
| 5 to 17 Years | 25 (4.2%) | 15 (3.0%) |
| 18 to 34 Years | 129 (16.7%) | 26 (4.6%) |
| 35 to 64 Years | 31 (2.5%) | 41 (2.9%) |
| 65 to 74 Years | 9 (3.7%) | 68 (15.1%) |
| 75 Years and over | 0 (0.0%) | 10 (7.3%) |
Disability Class: Ambulatory Difficulty
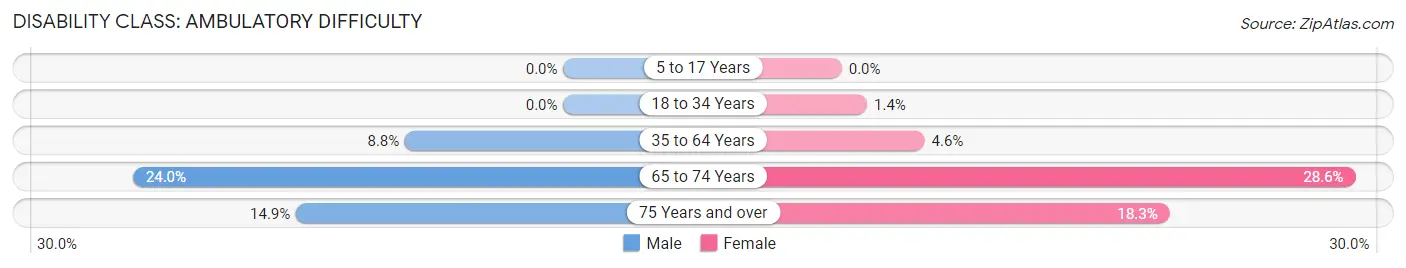
| Age Bracket | Male | Female |
| 5 to 17 Years | 0 (0.0%) | 0 (0.0%) |
| 18 to 34 Years | 0 (0.0%) | 8 (1.4%) |
| 35 to 64 Years | 110 (8.8%) | 65 (4.6%) |
| 65 to 74 Years | 58 (24.0%) | 129 (28.6%) |
| 75 Years and over | 18 (14.9%) | 25 (18.2%) |
Disability Class: Self-Care Difficulty
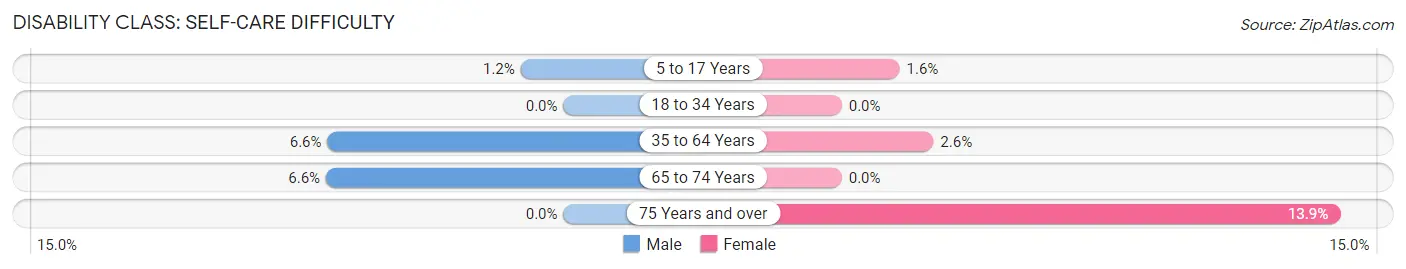
| Age Bracket | Male | Female |
| 5 to 17 Years | 7 (1.2%) | 8 (1.6%) |
| 18 to 34 Years | 0 (0.0%) | 0 (0.0%) |
| 35 to 64 Years | 82 (6.6%) | 36 (2.5%) |
| 65 to 74 Years | 16 (6.6%) | 0 (0.0%) |
| 75 Years and over | 0 (0.0%) | 19 (13.9%) |
Technology Access in Thurmont
Computing Device Access in Thurmont
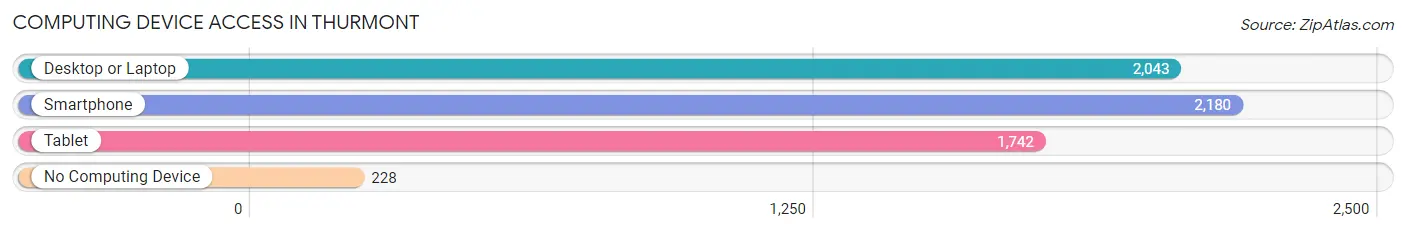
| Device Type | # Households | % Households |
| Desktop or Laptop | 2,043 | 81.3% |
| Smartphone | 2,180 | 86.8% |
| Tablet | 1,742 | 69.4% |
| No Computing Device | 228 | 9.1% |
| Total | 2,512 | 100.0% |
Internet Access in Thurmont
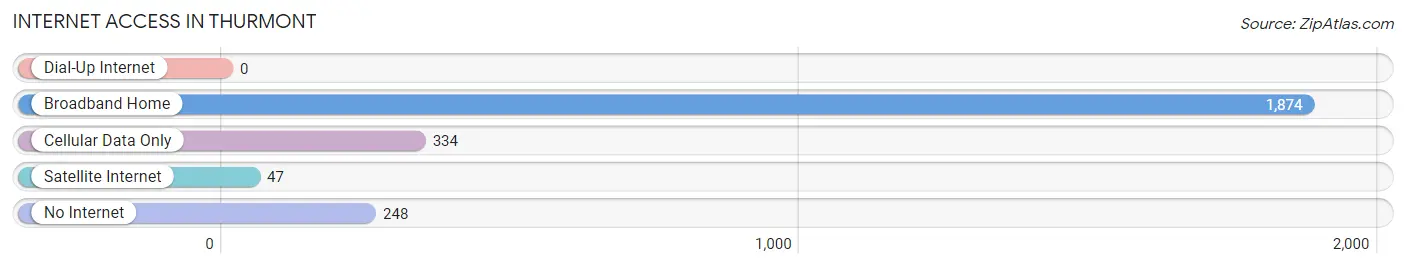
| Internet Type | # Households | % Households |
| Dial-Up Internet | 0 | 0.0% |
| Broadband Home | 1,874 | 74.6% |
| Cellular Data Only | 334 | 13.3% |
| Satellite Internet | 47 | 1.9% |
| No Internet | 248 | 9.9% |
| Total | 2,512 | 100.0% |
Thurmont Summary
Thurmont, Maryland is a small town located in Frederick County, Maryland. It is situated in the Catoctin Valley, approximately 30 miles north of Washington, D.C. and is part of the Baltimore-Washington Metropolitan Area. Thurmont is known for its picturesque scenery, historic sites, and recreational activities.
History
The area that is now Thurmont was first settled in the late 1700s by German and Swiss immigrants. The town was originally known as Mechanicstown, and was later renamed Thurmont in 1824. The name is derived from the German word “Thurm”, which means “gate”. The town was officially incorporated in 1894.
During the Civil War, Thurmont was a major supply center for the Union Army. The town was also the site of the Battle of Catoctin Mountain, which was fought between Union and Confederate forces in 1862.
In the late 19th century, Thurmont was a popular tourist destination. The town was home to several resorts, including the Catoctin Mountain House, which was built in 1877. The resort was a popular destination for wealthy families from Washington, D.C. and Baltimore.
Geography
Thurmont is located in the Catoctin Valley, which is part of the Appalachian Mountains. The town is situated at the base of Catoctin Mountain, which is part of the Blue Ridge Mountains. The town is surrounded by forests and rolling hills.
The town is located approximately 30 miles north of Washington, D.C. and is part of the Baltimore-Washington Metropolitan Area. The closest major cities are Frederick, Maryland and Hagerstown, Maryland.
Economy
Thurmont’s economy is largely based on tourism. The town is home to several historic sites, including the Catoctin Mountain House, which is now a museum. The town is also home to several recreational activities, such as camping, fishing, and hiking.
The town is also home to several businesses, including manufacturing, retail, and service industries. The town is home to several small businesses, including restaurants, shops, and galleries.
Demographics
As of the 2010 census, Thurmont had a population of 6,170. The town has a median household income of $60,000 and a median age of 42. The town is predominantly white (94.3%), with a small percentage of African Americans (2.3%) and Hispanics (2.2%).
Thurmont is a small town with a rich history and a vibrant economy. The town is home to several historic sites, recreational activities, and businesses. The town is also home to a diverse population, with a median age of 42 and a median household income of $60,000.
Common Questions
What is Per Capita Income in Thurmont?
Per Capita income in Thurmont is $43,977.
What is the Median Family Income in Thurmont?
Median Family Income in Thurmont is $101,824.
What is the Median Household income in Thurmont?
Median Household Income in Thurmont is $88,243.
What is Income or Wage Gap in Thurmont?
Income or Wage Gap in Thurmont is 27.8%.
Women in Thurmont earn 72.2 cents for every dollar earned by a man.
What is Family Income Deficit in Thurmont?
Family Income Deficit in Thurmont is $11,034.
Families that are below poverty line in Thurmont earn $11,034 less on average than the poverty threshold level.
What is Inequality or Gini Index in Thurmont?
Inequality or Gini Index in Thurmont is 0.41.
What is the Total Population of Thurmont?
Total Population of Thurmont is 6,313.
What is the Total Male Population of Thurmont?
Total Male Population of Thurmont is 3,115.
What is the Total Female Population of Thurmont?
Total Female Population of Thurmont is 3,198.
What is the Ratio of Males per 100 Females in Thurmont?
There are 97.40 Males per 100 Females in Thurmont.
What is the Ratio of Females per 100 Males in Thurmont?
There are 102.66 Females per 100 Males in Thurmont.
What is the Median Population Age in Thurmont?
Median Population Age in Thurmont is 42.0 Years.
What is the Average Family Size in Thurmont
Average Family Size in Thurmont is 2.9 People.
What is the Average Household Size in Thurmont
Average Household Size in Thurmont is 2.5 People.
How Large is the Labor Force in Thurmont?
There are 3,635 People in the Labor Forcein in Thurmont.
What is the Percentage of People in the Labor Force in Thurmont?
71.8% of People are in the Labor Force in Thurmont.
What is the Unemployment Rate in Thurmont?
Unemployment Rate in Thurmont is 2.5%.