West Burke, VT Map & Demographics
West Burke Map
West Burke Overview
$26,337
PER CAPITA INCOME
$60,938
AVG FAMILY INCOME
$24,750
AVG HOUSEHOLD INCOME
18.9%
WAGE / INCOME GAP [ % ]
81.1¢/ $1
WAGE / INCOME GAP [ $ ]
0.51
INEQUALITY / GINI INDEX
175
TOTAL POPULATION
81
MALE POPULATION
94
FEMALE POPULATION
86.17
MALES / 100 FEMALES
116.05
FEMALES / 100 MALES
45.9
MEDIAN AGE
2.4
AVG FAMILY SIZE
1.8
AVG HOUSEHOLD SIZE
77
LABOR FORCE [ PEOPLE ]
50.7%
PERCENT IN LABOR FORCE
11.7%
UNEMPLOYMENT RATE
West Burke Zip Codes
West Burke Area Codes
Income in West Burke
Income Overview in West Burke
Per Capita Income in West Burke is $26,337, while median incomes of families and households are $60,938 and $24,750 respectively.
| Characteristic | Number | Measure |
| Per Capita Income | 175 | $26,337 |
| Median Family Income | 39 | $60,938 |
| Mean Family Income | 39 | $76,913 |
| Median Household Income | 97 | $24,750 |
| Mean Household Income | 97 | $50,042 |
| Income Deficit | 39 | $0 |
| Wage / Income Gap (%) | 175 | 18.89% |
| Wage / Income Gap ($) | 175 | 81.11¢ per $1 |
| Gini / Inequality Index | 175 | 0.51 |
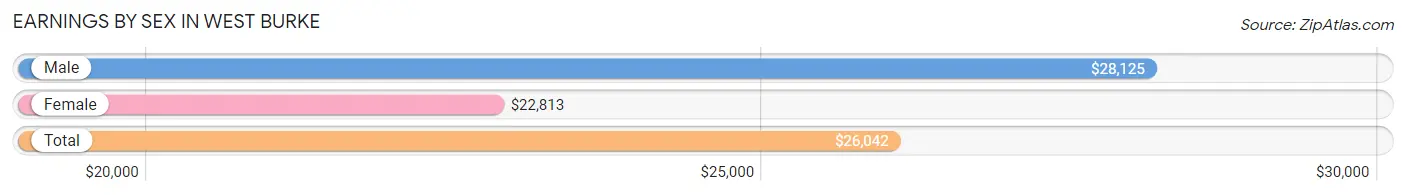
Earnings by Sex in West Burke
Average Earnings in West Burke are $26,042, $28,125 for men and $22,813 for women, a difference of 18.9%.
| Sex | Number | Average Earnings |
| Male | 40 (49.4%) | $28,125 |
| Female | 41 (50.6%) | $22,813 |
| Total | 81 (100.0%) | $26,042 |
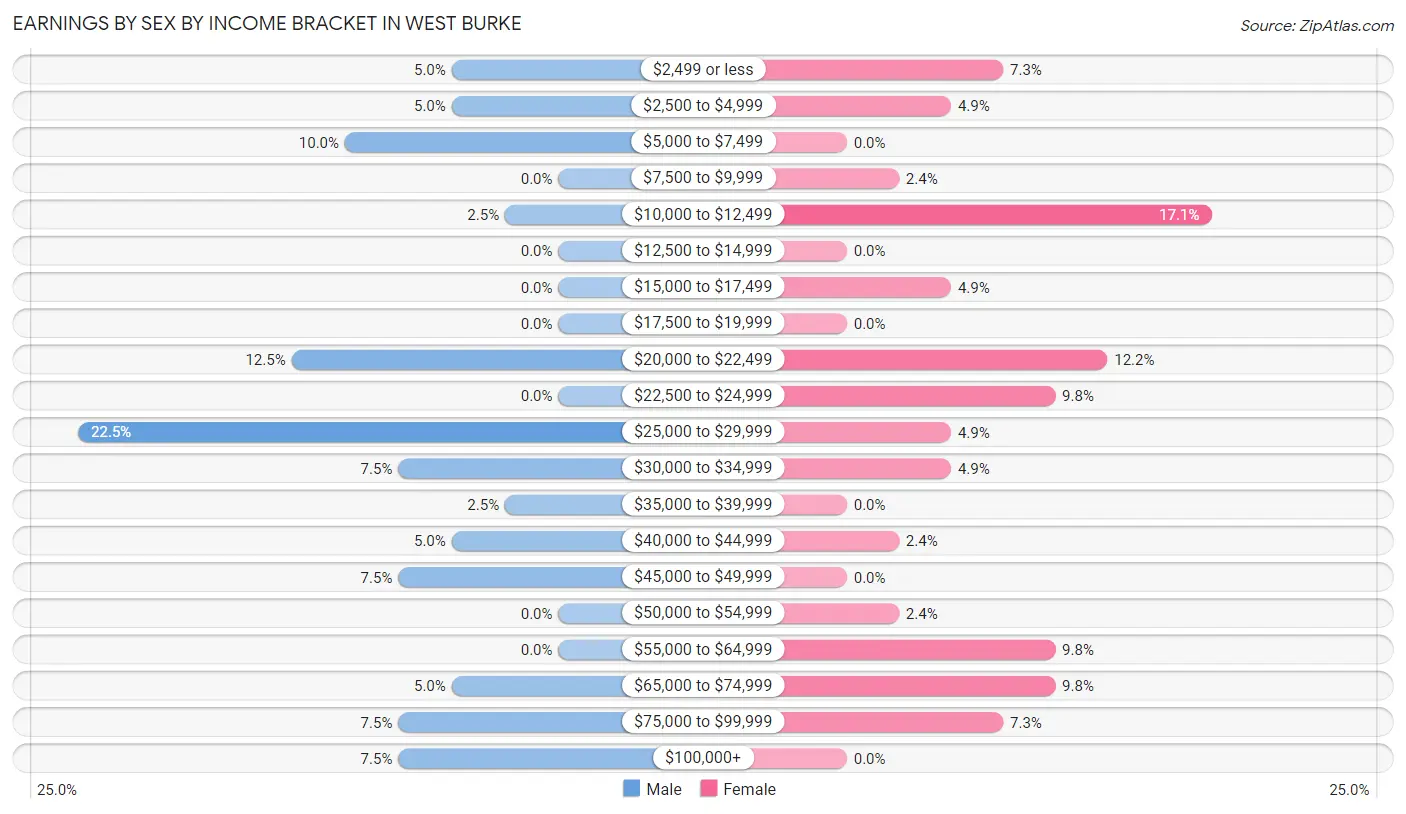
Earnings by Sex by Income Bracket in West Burke
The most common earnings brackets in West Burke are $25,000 to $29,999 for men (9 | 22.5%) and $10,000 to $12,499 for women (7 | 17.1%).
| Income | Male | Female |
| $2,499 or less | 2 (5.0%) | 3 (7.3%) |
| $2,500 to $4,999 | 2 (5.0%) | 2 (4.9%) |
| $5,000 to $7,499 | 4 (10.0%) | 0 (0.0%) |
| $7,500 to $9,999 | 0 (0.0%) | 1 (2.4%) |
| $10,000 to $12,499 | 1 (2.5%) | 7 (17.1%) |
| $12,500 to $14,999 | 0 (0.0%) | 0 (0.0%) |
| $15,000 to $17,499 | 0 (0.0%) | 2 (4.9%) |
| $17,500 to $19,999 | 0 (0.0%) | 0 (0.0%) |
| $20,000 to $22,499 | 5 (12.5%) | 5 (12.2%) |
| $22,500 to $24,999 | 0 (0.0%) | 4 (9.8%) |
| $25,000 to $29,999 | 9 (22.5%) | 2 (4.9%) |
| $30,000 to $34,999 | 3 (7.5%) | 2 (4.9%) |
| $35,000 to $39,999 | 1 (2.5%) | 0 (0.0%) |
| $40,000 to $44,999 | 2 (5.0%) | 1 (2.4%) |
| $45,000 to $49,999 | 3 (7.5%) | 0 (0.0%) |
| $50,000 to $54,999 | 0 (0.0%) | 1 (2.4%) |
| $55,000 to $64,999 | 0 (0.0%) | 4 (9.8%) |
| $65,000 to $74,999 | 2 (5.0%) | 4 (9.8%) |
| $75,000 to $99,999 | 3 (7.5%) | 3 (7.3%) |
| $100,000+ | 3 (7.5%) | 0 (0.0%) |
| Total | 40 (100.0%) | 41 (100.0%) |
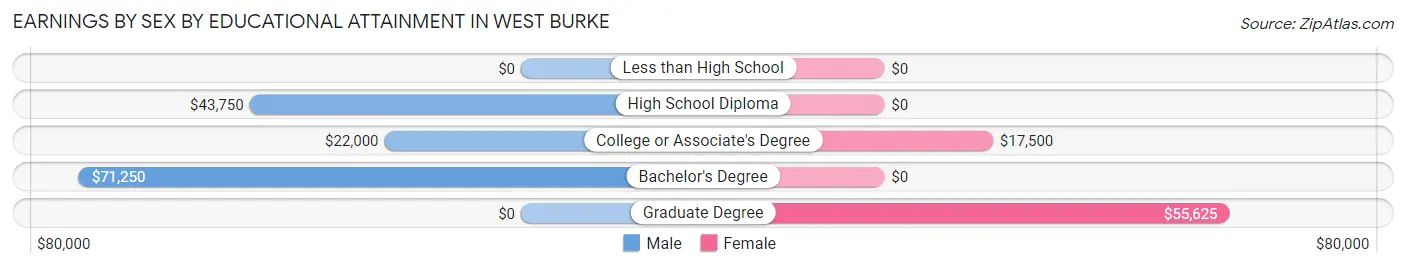
Earnings by Sex by Educational Attainment in West Burke
Average earnings in West Burke are $30,000 for men and $25,000 for women, a difference of 16.7%. Men with an educational attainment of bachelor's degree enjoy the highest average annual earnings of $71,250, while those with college or associate's degree education earn the least with $22,000. Women with an educational attainment of graduate degree earn the most with the average annual earnings of $55,625, while those with college or associate's degree education have the smallest earnings of $17,500.
| Educational Attainment | Male Income | Female Income |
| Less than High School | - | - |
| High School Diploma | $43,750 | $0 |
| College or Associate's Degree | $22,000 | $17,500 |
| Bachelor's Degree | $71,250 | $0 |
| Graduate Degree | - | - |
| Total | $30,000 | $25,000 |
Family Income in West Burke
Family Income Brackets in West Burke
According to the West Burke family income data, there are 9 families falling into the $50,000 to $74,999 income range, which is the most common income bracket and makes up 23.1% of all families.
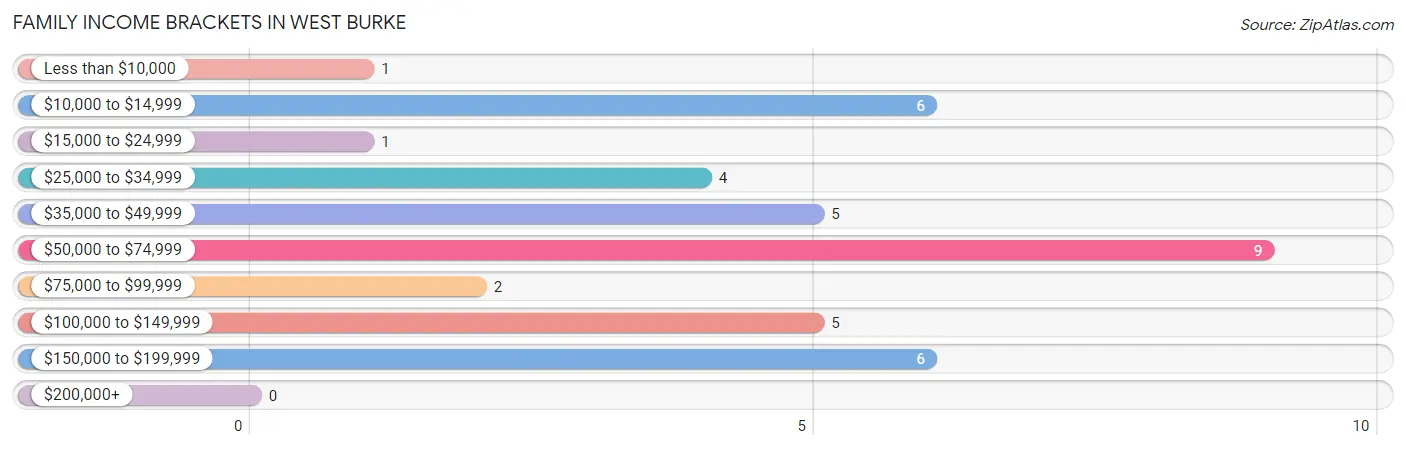
| Income Bracket | # Families | % Families |
| Less than $10,000 | 1 | 2.6% |
| $10,000 to $14,999 | 6 | 15.4% |
| $15,000 to $24,999 | 1 | 2.6% |
| $25,000 to $34,999 | 4 | 10.3% |
| $35,000 to $49,999 | 5 | 12.8% |
| $50,000 to $74,999 | 9 | 23.1% |
| $75,000 to $99,999 | 2 | 5.1% |
| $100,000 to $149,999 | 5 | 12.8% |
| $150,000 to $199,999 | 6 | 15.4% |
| $200,000+ | 0 | 0.0% |
Family Income by Famaliy Size in West Burke
| Income Bracket | # Families | Median Income |
| 2-Person Families | 24 (61.5%) | $0 |
| 3-Person Families | 10 (25.6%) | $0 |
| 4-Person Families | 5 (12.8%) | $0 |
| 5-Person Families | 0 (0.0%) | $0 |
| 6-Person Families | 0 (0.0%) | $0 |
| 7+ Person Families | 0 (0.0%) | $0 |
| Total | 39 (100.0%) | $60,938 |
Family Income by Number of Earners in West Burke
| Number of Earners | # Families | Median Income |
| No Earners | 3 (7.7%) | $0 |
| 1 Earner | 12 (30.8%) | $0 |
| 2 Earners | 23 (59.0%) | $0 |
| 3+ Earners | 1 (2.6%) | $0 |
| Total | 39 (100.0%) | $60,938 |
Household Income in West Burke
Household Income Brackets in West Burke
With 24 households falling in the category, the $15,000 to $24,999 income range is the most frequent in West Burke, accounting for 24.7% of all households.
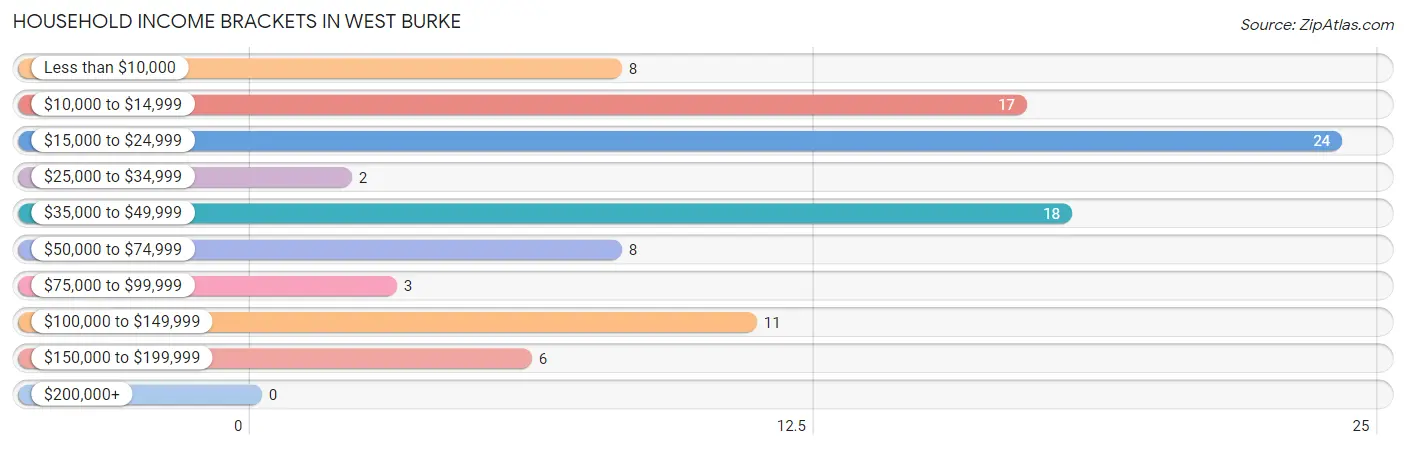
| Income Bracket | # Households | % Households |
| Less than $10,000 | 8 | 8.2% |
| $10,000 to $14,999 | 17 | 17.5% |
| $15,000 to $24,999 | 24 | 24.7% |
| $25,000 to $34,999 | 2 | 2.1% |
| $35,000 to $49,999 | 18 | 18.6% |
| $50,000 to $74,999 | 8 | 8.2% |
| $75,000 to $99,999 | 3 | 3.1% |
| $100,000 to $149,999 | 11 | 11.3% |
| $150,000 to $199,999 | 6 | 6.2% |
| $200,000+ | 0 | 0.0% |
Household Income by Householder Age in West Burke
The median household income in West Burke is $24,750, with the highest median household income of $35,536 found in the 45 to 64 years age bracket for the primary householder. A total of 27 households (27.8%) fall into this category. Meanwhile, the 15 to 24 years age bracket for the primary householder has the lowest median household income of $0, with 5 households (5.1%) in this group.
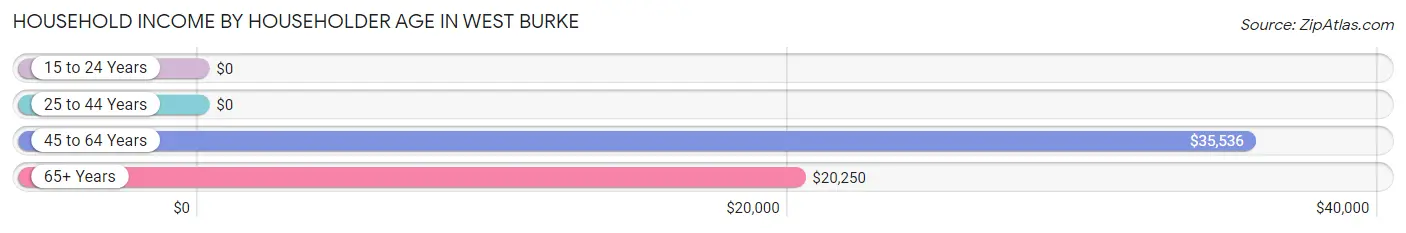
| Income Bracket | # Households | Median Income |
| 15 to 24 Years | 5 (5.1%) | $0 |
| 25 to 44 Years | 26 (26.8%) | $0 |
| 45 to 64 Years | 27 (27.8%) | $35,536 |
| 65+ Years | 39 (40.2%) | $20,250 |
| Total | 97 (100.0%) | $24,750 |
Poverty in West Burke
Income Below Poverty by Sex and Age in West Burke
With 28.4% poverty level for males and 23.4% for females among the residents of West Burke, 75 year old and over males and 6 to 11 year old females are the most vulnerable to poverty, with 4 males (100.0%) and 3 females (75.0%) in their respective age groups living below the poverty level.
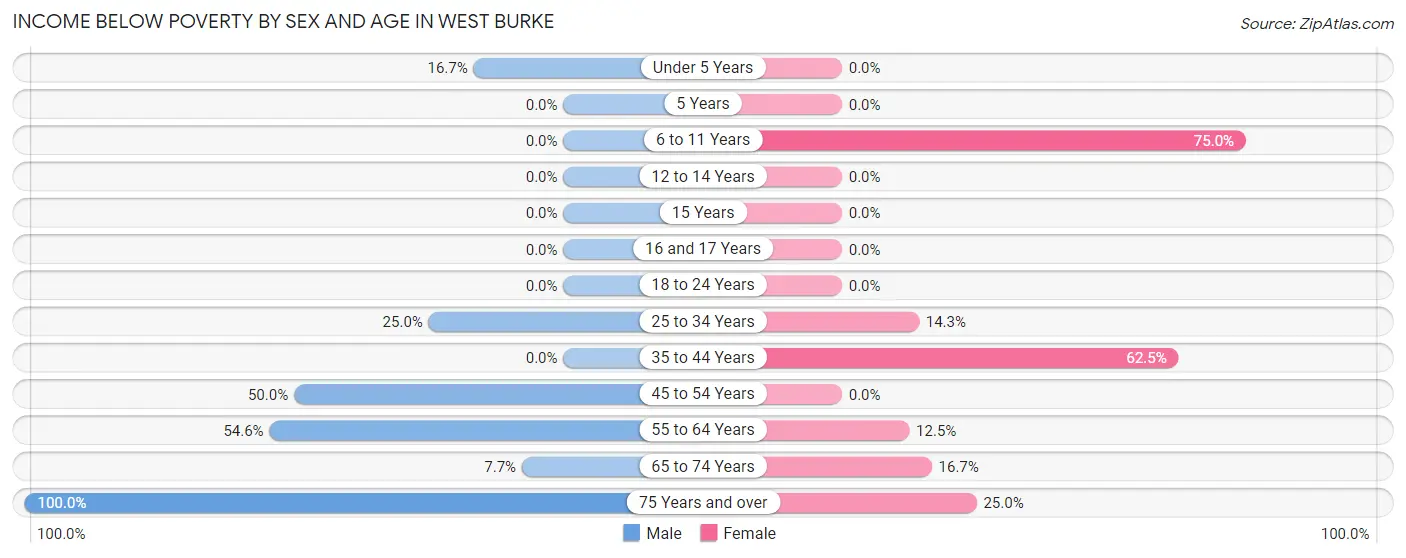
| Age Bracket | Male | Female |
| Under 5 Years | 2 (16.7%) | 0 (0.0%) |
| 5 Years | 0 (0.0%) | 0 (0.0%) |
| 6 to 11 Years | 0 (0.0%) | 3 (75.0%) |
| 12 to 14 Years | 0 (0.0%) | 0 (0.0%) |
| 15 Years | 0 (0.0%) | 0 (0.0%) |
| 16 and 17 Years | 0 (0.0%) | 0 (0.0%) |
| 18 to 24 Years | 0 (0.0%) | 0 (0.0%) |
| 25 to 34 Years | 3 (25.0%) | 1 (14.3%) |
| 35 to 44 Years | 0 (0.0%) | 10 (62.5%) |
| 45 to 54 Years | 7 (50.0%) | 0 (0.0%) |
| 55 to 64 Years | 6 (54.5%) | 2 (12.5%) |
| 65 to 74 Years | 1 (7.7%) | 4 (16.7%) |
| 75 Years and over | 4 (100.0%) | 2 (25.0%) |
| Total | 23 (28.4%) | 22 (23.4%) |
Income Above Poverty by Sex and Age in West Burke
According to the poverty statistics in West Burke, males aged 12 to 14 years and females aged under 5 years are the age groups that are most secure financially, with 100.0% of males and 100.0% of females in these age groups living above the poverty line.
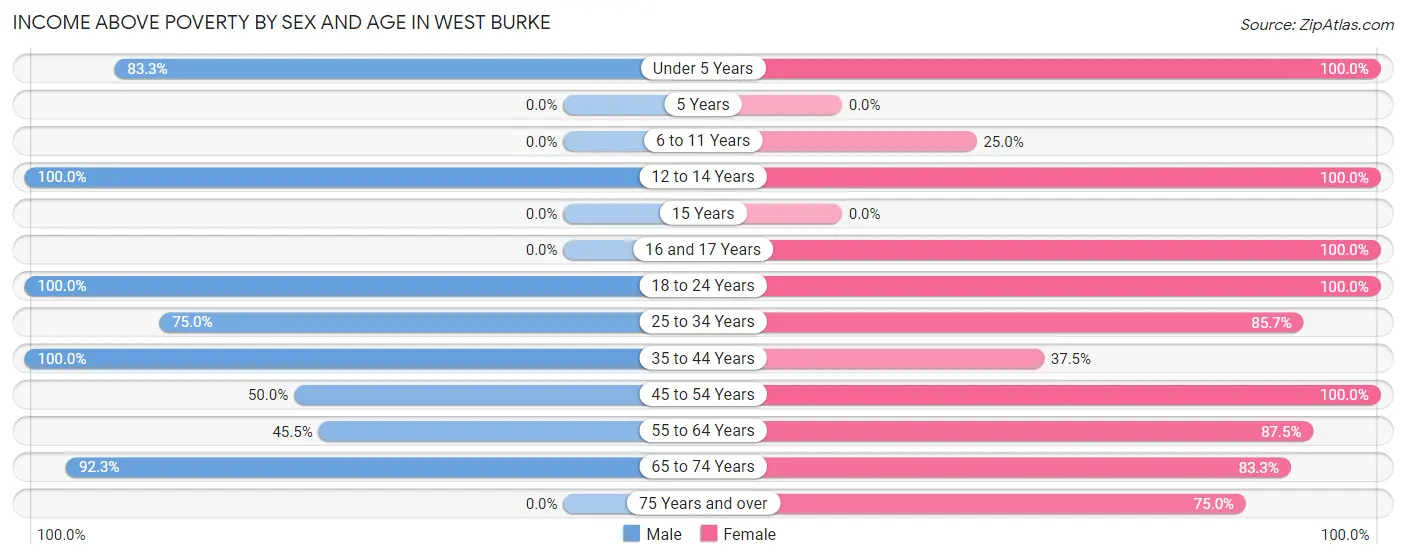
| Age Bracket | Male | Female |
| Under 5 Years | 10 (83.3%) | 4 (100.0%) |
| 5 Years | 0 (0.0%) | 0 (0.0%) |
| 6 to 11 Years | 0 (0.0%) | 1 (25.0%) |
| 12 to 14 Years | 1 (100.0%) | 2 (100.0%) |
| 15 Years | 0 (0.0%) | 0 (0.0%) |
| 16 and 17 Years | 0 (0.0%) | 2 (100.0%) |
| 18 to 24 Years | 6 (100.0%) | 5 (100.0%) |
| 25 to 34 Years | 9 (75.0%) | 6 (85.7%) |
| 35 to 44 Years | 8 (100.0%) | 6 (37.5%) |
| 45 to 54 Years | 7 (50.0%) | 6 (100.0%) |
| 55 to 64 Years | 5 (45.5%) | 14 (87.5%) |
| 65 to 74 Years | 12 (92.3%) | 20 (83.3%) |
| 75 Years and over | 0 (0.0%) | 6 (75.0%) |
| Total | 58 (71.6%) | 72 (76.6%) |
Income Below Poverty Among Married-Couple Families in West Burke
The poverty statistics for married-couple families in West Burke show that 7.1% or 2 of the total 28 families live below the poverty line. Families with no children have the highest poverty rate of 12.5%, comprising of 2 families. On the other hand, families with 1 or 2 children have the lowest poverty rate of 0.0%, which includes 0 families.
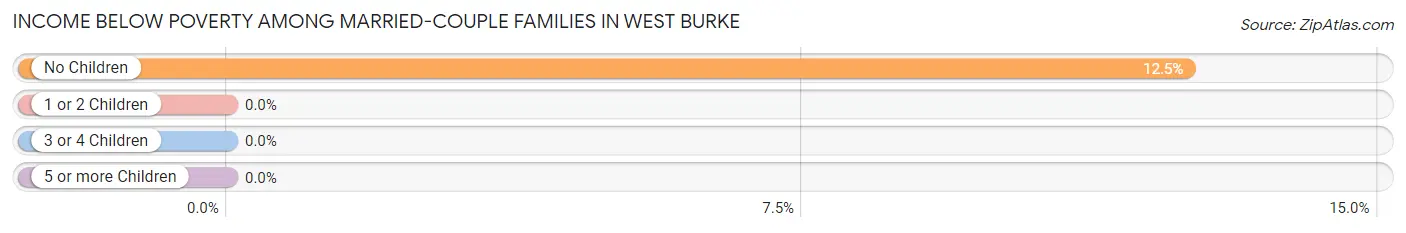
| Children | Above Poverty | Below Poverty |
| No Children | 14 (87.5%) | 2 (12.5%) |
| 1 or 2 Children | 12 (100.0%) | 0 (0.0%) |
| 3 or 4 Children | 0 (0.0%) | 0 (0.0%) |
| 5 or more Children | 0 (0.0%) | 0 (0.0%) |
| Total | 26 (92.9%) | 2 (7.1%) |
Income Below Poverty Among Single-Parent Households in West Burke
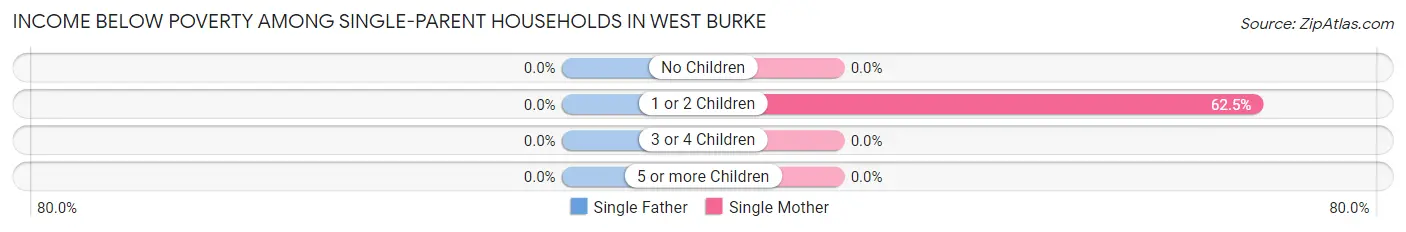
| Children | Single Father | Single Mother |
| No Children | 0 (0.0%) | 0 (0.0%) |
| 1 or 2 Children | 0 (0.0%) | 5 (62.5%) |
| 3 or 4 Children | 0 (0.0%) | 0 (0.0%) |
| 5 or more Children | 0 (0.0%) | 0 (0.0%) |
| Total | 0 (0.0%) | 5 (55.6%) |
Income Below Poverty Among Married-Couple vs Single-Parent Households in West Burke
The poverty data for West Burke shows that 2 of the married-couple family households (7.1%) and 5 of the single-parent households (45.5%) are living below the poverty level. Within the married-couple family households, those with no children have the highest poverty rate, with 2 households (12.5%) falling below the poverty line. Among the single-parent households, those with 1 or 2 children have the highest poverty rate, with 5 household (50.0%) living below poverty.
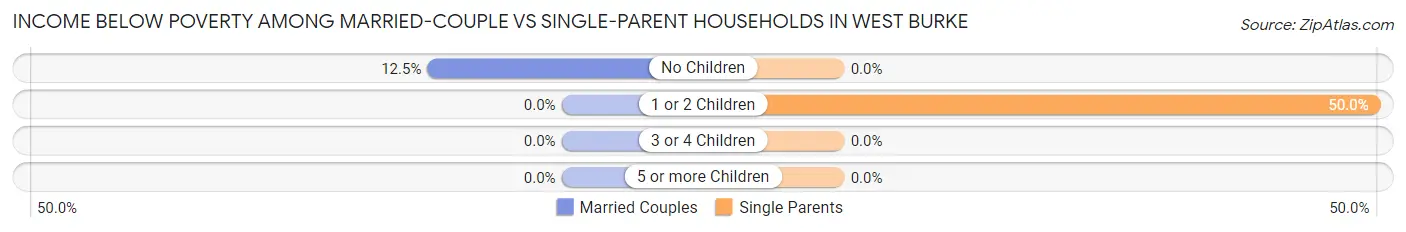
| Children | Married-Couple Families | Single-Parent Households |
| No Children | 2 (12.5%) | 0 (0.0%) |
| 1 or 2 Children | 0 (0.0%) | 5 (50.0%) |
| 3 or 4 Children | 0 (0.0%) | 0 (0.0%) |
| 5 or more Children | 0 (0.0%) | 0 (0.0%) |
| Total | 2 (7.1%) | 5 (45.5%) |
Race in West Burke
The most populous races in West Burke are White / Caucasian (165 | 94.3%), Hispanic or Latino (10 | 5.7%), and Two or more Races (7 | 4.0%).
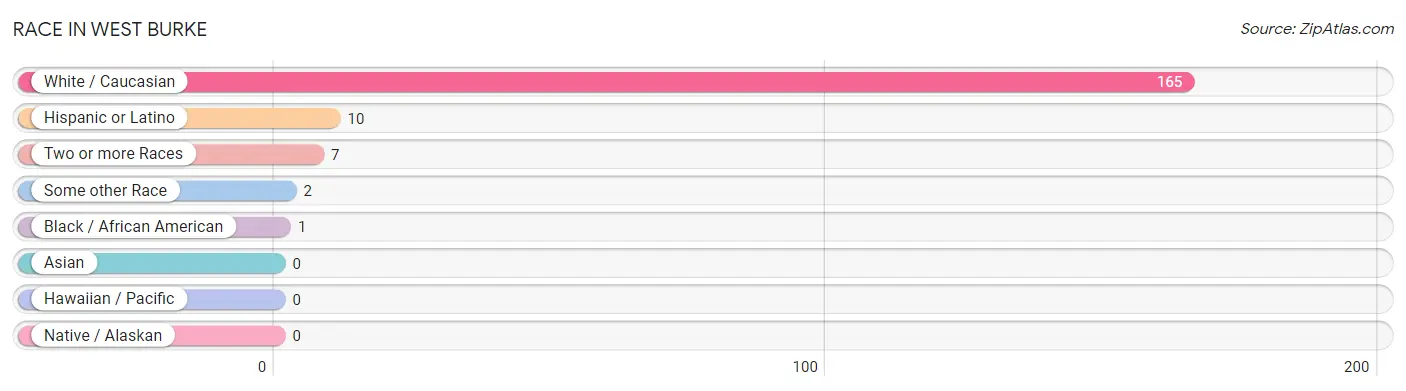
| Race | # Population | % Population |
| Asian | 0 | 0.0% |
| Black / African American | 1 | 0.6% |
| Hawaiian / Pacific | 0 | 0.0% |
| Hispanic or Latino | 10 | 5.7% |
| Native / Alaskan | 0 | 0.0% |
| White / Caucasian | 165 | 94.3% |
| Two or more Races | 7 | 4.0% |
| Some other Race | 2 | 1.1% |
| Total | 175 | 100.0% |
Ancestry in West Burke
The most populous ancestries reported in West Burke are English (36 | 20.6%), German (22 | 12.6%), Irish (17 | 9.7%), French (11 | 6.3%), and Scottish (11 | 6.3%), together accounting for 55.4% of all West Burke residents.
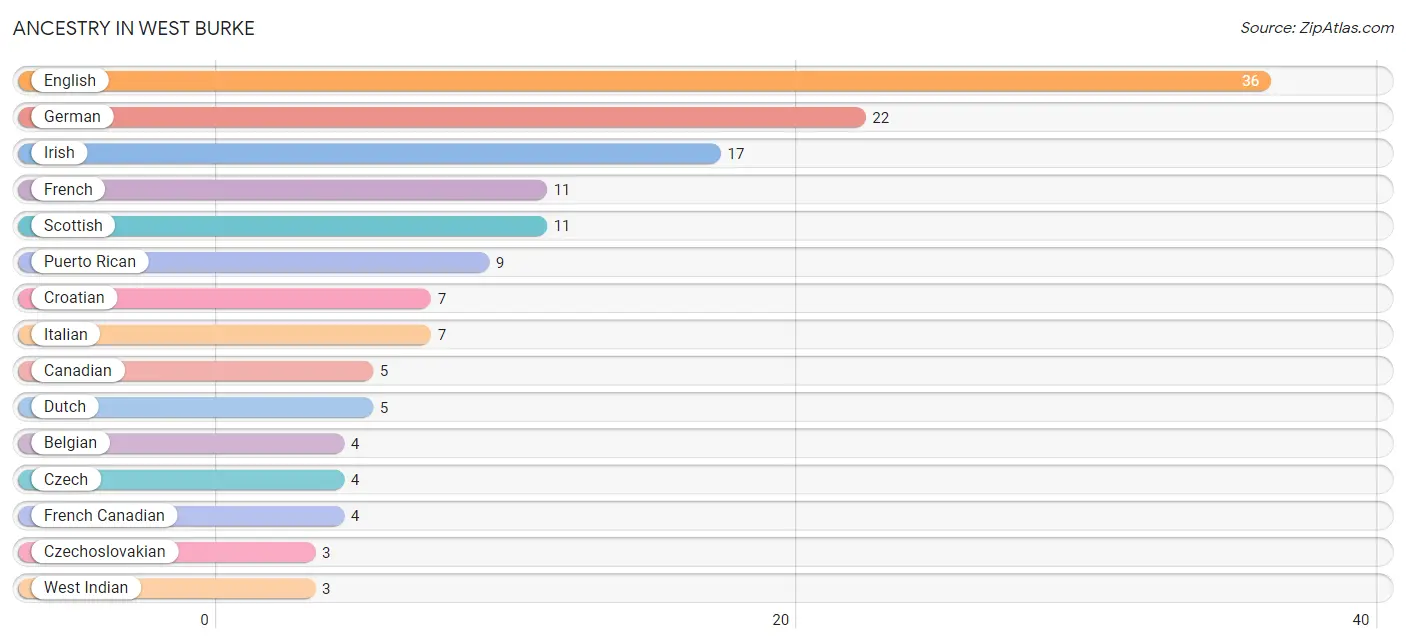
| Ancestry | # Population | % Population |
| Belgian | 4 | 2.3% |
| Blackfeet | 1 | 0.6% |
| Canadian | 5 | 2.9% |
| Croatian | 7 | 4.0% |
| Czech | 4 | 2.3% |
| Czechoslovakian | 3 | 1.7% |
| Dutch | 5 | 2.9% |
| Eastern European | 2 | 1.1% |
| English | 36 | 20.6% |
| French | 11 | 6.3% |
| French Canadian | 4 | 2.3% |
| German | 22 | 12.6% |
| Hungarian | 2 | 1.1% |
| Irish | 17 | 9.7% |
| Italian | 7 | 4.0% |
| Mexican | 1 | 0.6% |
| Norwegian | 1 | 0.6% |
| Portuguese | 1 | 0.6% |
| Puerto Rican | 9 | 5.1% |
| Scottish | 11 | 6.3% |
| Swedish | 2 | 1.1% |
| West Indian | 3 | 1.7% | View All 22 Rows |
Immigrants in West Burke
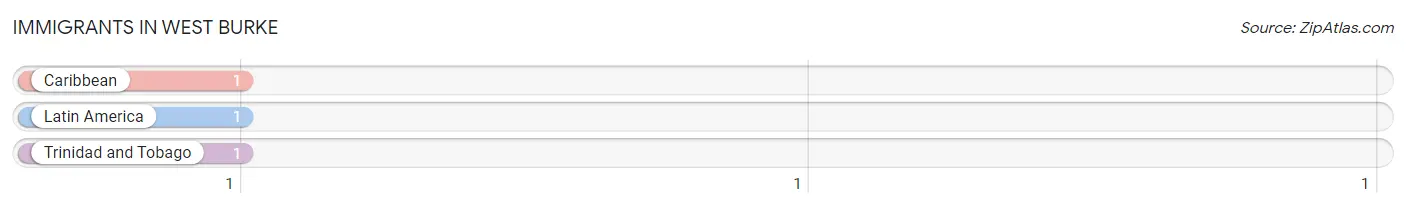
The most numerous immigrant groups reported in West Burke came from Caribbean (1 | 0.6%), Latin America (1 | 0.6%), and Trinidad and Tobago (1 | 0.6%), together accounting for 1.7% of all West Burke residents.
| Immigration Origin | # Population | % Population |
| Caribbean | 1 | 0.6% |
| Latin America | 1 | 0.6% |
| Trinidad and Tobago | 1 | 0.6% | View All 3 Rows |
Sex and Age in West Burke
Sex and Age in West Burke
The most populous age groups in West Burke are Under 5 Years (12 | 14.8%) for men and 65 to 69 Years (15 | 16.0%) for women.
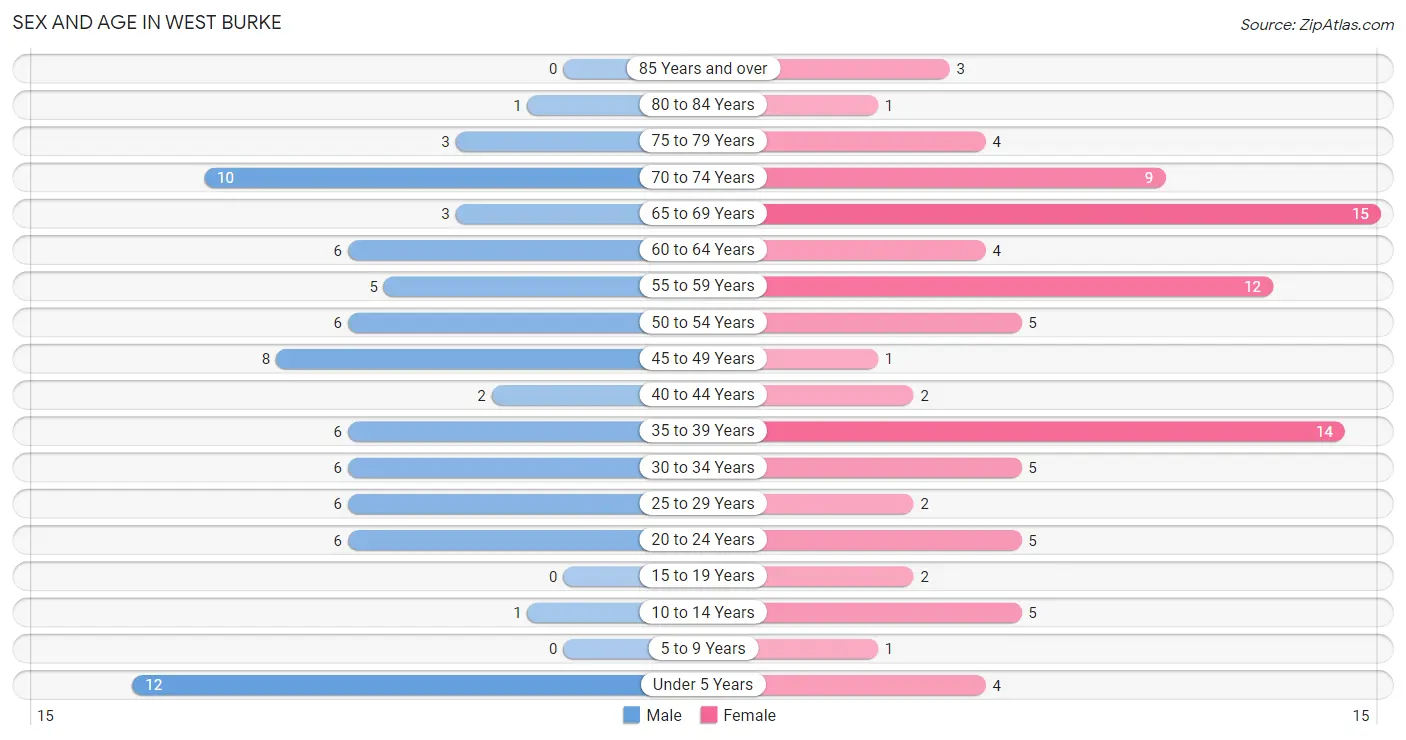
| Age Bracket | Male | Female |
| Under 5 Years | 12 (14.8%) | 4 (4.3%) |
| 5 to 9 Years | 0 (0.0%) | 1 (1.1%) |
| 10 to 14 Years | 1 (1.2%) | 5 (5.3%) |
| 15 to 19 Years | 0 (0.0%) | 2 (2.1%) |
| 20 to 24 Years | 6 (7.4%) | 5 (5.3%) |
| 25 to 29 Years | 6 (7.4%) | 2 (2.1%) |
| 30 to 34 Years | 6 (7.4%) | 5 (5.3%) |
| 35 to 39 Years | 6 (7.4%) | 14 (14.9%) |
| 40 to 44 Years | 2 (2.5%) | 2 (2.1%) |
| 45 to 49 Years | 8 (9.9%) | 1 (1.1%) |
| 50 to 54 Years | 6 (7.4%) | 5 (5.3%) |
| 55 to 59 Years | 5 (6.2%) | 12 (12.8%) |
| 60 to 64 Years | 6 (7.4%) | 4 (4.3%) |
| 65 to 69 Years | 3 (3.7%) | 15 (16.0%) |
| 70 to 74 Years | 10 (12.3%) | 9 (9.6%) |
| 75 to 79 Years | 3 (3.7%) | 4 (4.3%) |
| 80 to 84 Years | 1 (1.2%) | 1 (1.1%) |
| 85 Years and over | 0 (0.0%) | 3 (3.2%) |
| Total | 81 (100.0%) | 94 (100.0%) |
Families and Households in West Burke
Median Family Size in West Burke
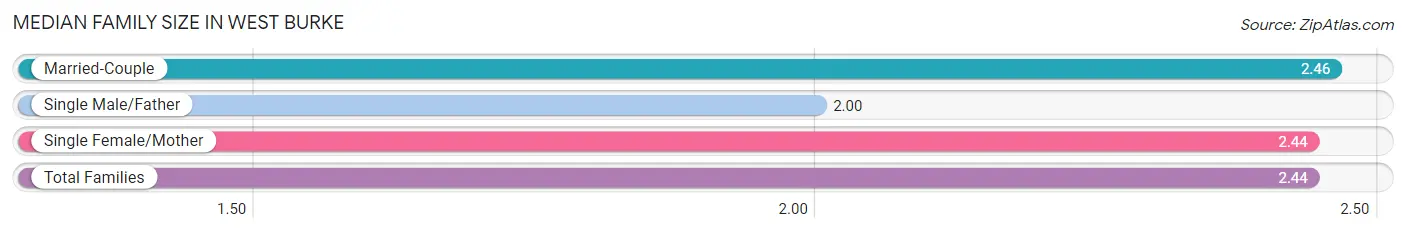
The median family size in West Burke is 2.44 persons per family, with married-couple families (28 | 71.8%) accounting for the largest median family size of 2.46 persons per family. On the other hand, single male/father families (2 | 5.1%) represent the smallest median family size with 2.00 persons per family.
| Family Type | # Families | Family Size |
| Married-Couple | 28 (71.8%) | 2.46 |
| Single Male/Father | 2 (5.1%) | 2.00 |
| Single Female/Mother | 9 (23.1%) | 2.44 |
| Total Families | 39 (100.0%) | 2.44 |
Median Household Size in West Burke
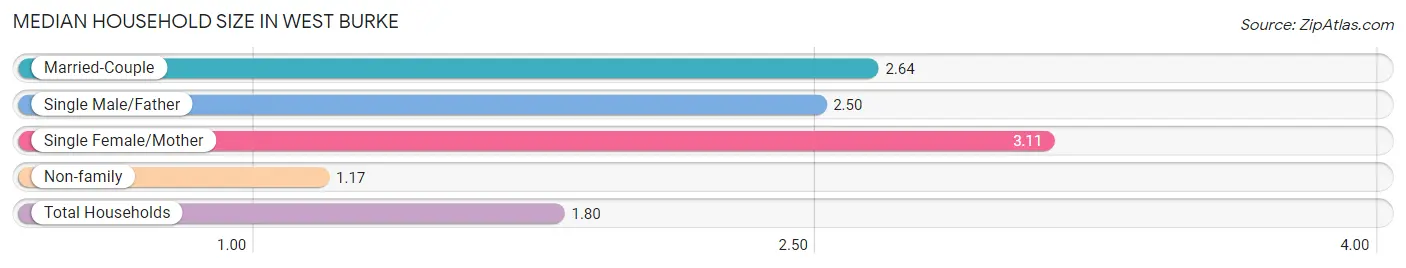
The median household size in West Burke is 1.80 persons per household, with single female/mother households (9 | 9.3%) accounting for the largest median household size of 3.11 persons per household. non-family households (58 | 59.8%) represent the smallest median household size with 1.17 persons per household.
| Household Type | # Households | Household Size |
| Married-Couple | 28 (28.9%) | 2.64 |
| Single Male/Father | 2 (2.1%) | 2.50 |
| Single Female/Mother | 9 (9.3%) | 3.11 |
| Non-family | 58 (59.8%) | 1.17 |
| Total Households | 97 (100.0%) | 1.80 |
Household Size by Marriage Status in West Burke
Out of a total of 97 households in West Burke, 39 (40.2%) are family households, while 58 (59.8%) are nonfamily households. The most numerous type of family households are 3-person households, comprising 16, and the most common type of nonfamily households are 1-person households, comprising 49.
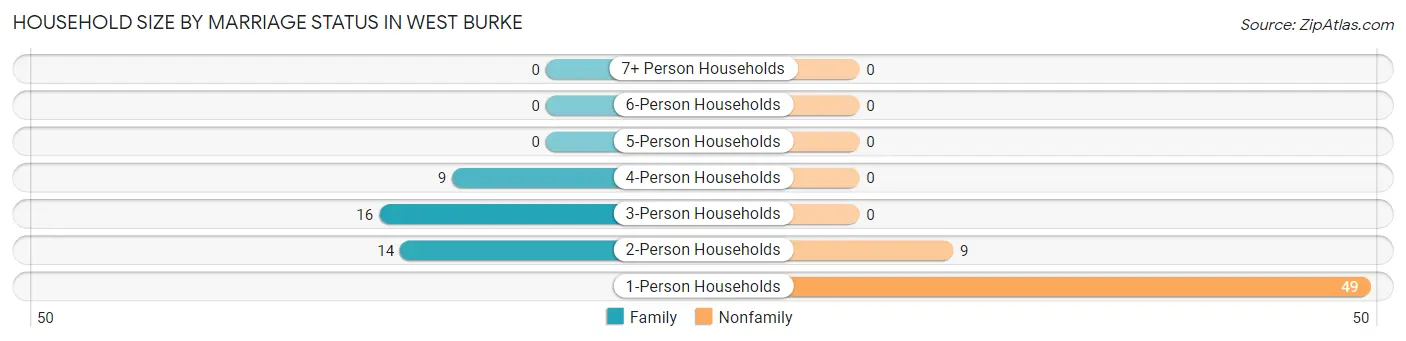
| Household Size | Family Households | Nonfamily Households |
| 1-Person Households | - | 49 (50.5%) |
| 2-Person Households | 14 (14.4%) | 9 (9.3%) |
| 3-Person Households | 16 (16.5%) | 0 (0.0%) |
| 4-Person Households | 9 (9.3%) | 0 (0.0%) |
| 5-Person Households | 0 (0.0%) | 0 (0.0%) |
| 6-Person Households | 0 (0.0%) | 0 (0.0%) |
| 7+ Person Households | 0 (0.0%) | 0 (0.0%) |
| Total | 39 (40.2%) | 58 (59.8%) |
Female Fertility in West Burke
Fertility by Age in West Burke
Average fertility rate in West Burke is 258.0 births per 1,000 women. Women in the age bracket of 20 to 34 years have the highest fertility rate with 667.0 births per 1,000 women. Women in the age bracket of 20 to 34 years acount for 100.0% of all women with births.
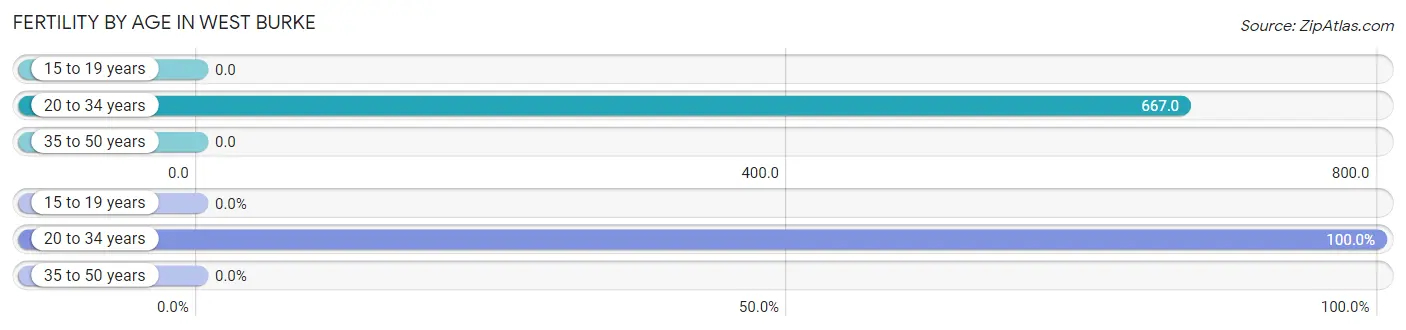
| Age Bracket | Women with Births | Births / 1,000 Women |
| 15 to 19 years | 0 (0.0%) | 0.0 |
| 20 to 34 years | 8 (100.0%) | 667.0 |
| 35 to 50 years | 0 (0.0%) | 0.0 |
| Total | 8 (100.0%) | 258.0 |
Fertility by Age by Marriage Status in West Burke
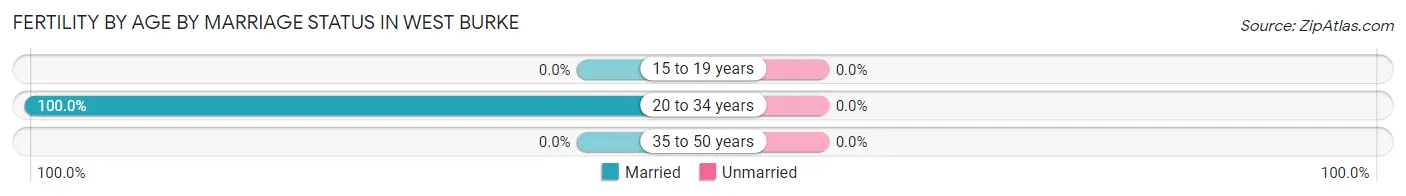
| Age Bracket | Married | Unmarried |
| 15 to 19 years | 0 (0.0%) | 0 (0.0%) |
| 20 to 34 years | 8 (100.0%) | 0 (0.0%) |
| 35 to 50 years | 0 (0.0%) | 0 (0.0%) |
| Total | 8 (100.0%) | 0 (0.0%) |
Fertility by Education in West Burke
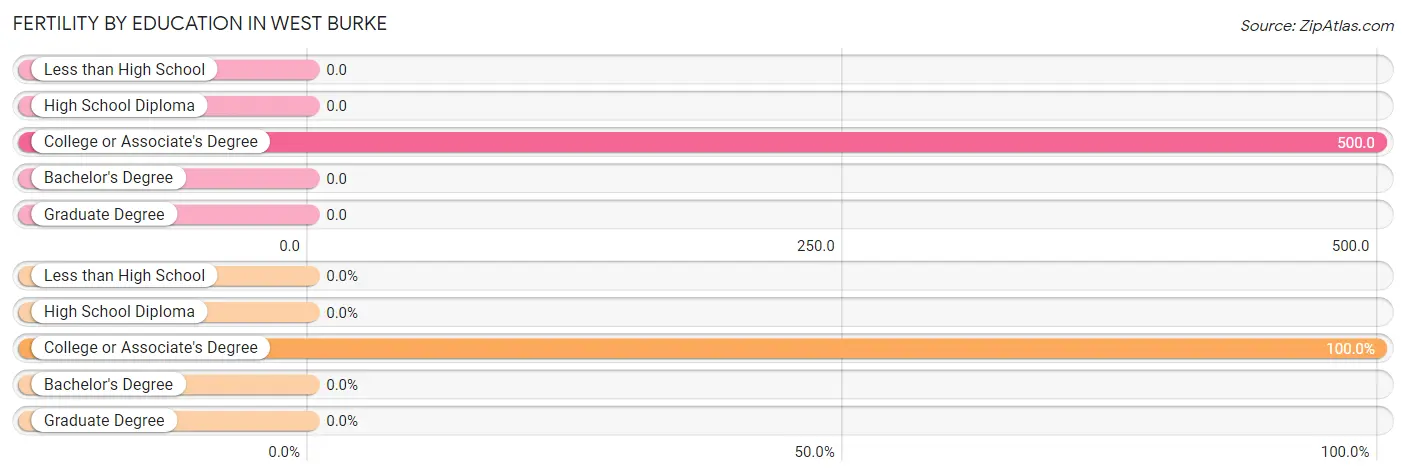
| Educational Attainment | Women with Births | Births / 1,000 Women |
| Less than High School | 0 (0.0%) | 0.0 |
| High School Diploma | 0 (0.0%) | 0.0 |
| College or Associate's Degree | 8 (100.0%) | 500.0 |
| Bachelor's Degree | 0 (0.0%) | 0.0 |
| Graduate Degree | 0 (0.0%) | 0.0 |
| Total | 8 (100.0%) | 258.0 |
Fertility by Education by Marriage Status in West Burke
| Educational Attainment | Married | Unmarried |
| Less than High School | 0 (0.0%) | 0 (0.0%) |
| High School Diploma | 0 (0.0%) | 0 (0.0%) |
| College or Associate's Degree | 8 (100.0%) | 0 (0.0%) |
| Bachelor's Degree | 0 (0.0%) | 0 (0.0%) |
| Graduate Degree | 0 (0.0%) | 0 (0.0%) |
| Total | 8 (100.0%) | 0 (0.0%) |
Employment Characteristics in West Burke
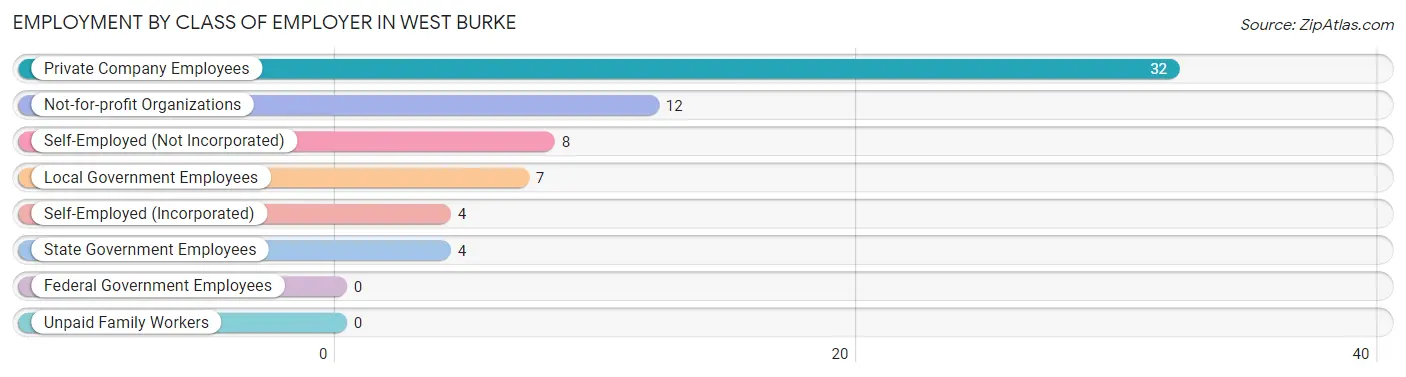
Employment by Class of Employer in West Burke
Among the 67 employed individuals in West Burke, private company employees (32 | 47.8%), not-for-profit organizations (12 | 17.9%), and self-employed (not incorporated) (8 | 11.9%) make up the most common classes of employment.
| Employer Class | # Employees | % Employees |
| Private Company Employees | 32 | 47.8% |
| Self-Employed (Incorporated) | 4 | 6.0% |
| Self-Employed (Not Incorporated) | 8 | 11.9% |
| Not-for-profit Organizations | 12 | 17.9% |
| Local Government Employees | 7 | 10.4% |
| State Government Employees | 4 | 6.0% |
| Federal Government Employees | 0 | 0.0% |
| Unpaid Family Workers | 0 | 0.0% |
| Total | 67 | 100.0% |
Employment Status by Age in West Burke
According to the labor force statistics for West Burke, out of the total population over 16 years of age (152), 50.7% or 77 individuals are in the labor force, with 11.7% or 9 of them unemployed. The age group with the highest labor force participation rate is 20 to 24 years, with 100.0% or 11 individuals in the labor force. Within the labor force, the 45 to 54 years age range has the highest percentage of unemployed individuals, with 40.0% or 8 of them being unemployed.
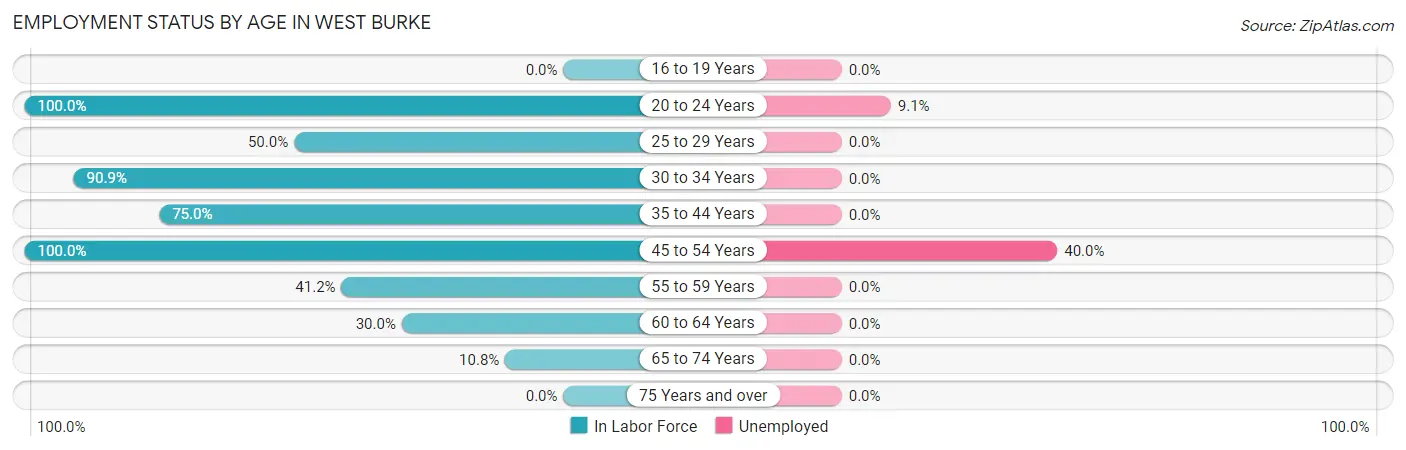
| Age Bracket | In Labor Force | Unemployed |
| 16 to 19 Years | 0 (0.0%) | 0 (0.0%) |
| 20 to 24 Years | 11 (100.0%) | 1 (9.1%) |
| 25 to 29 Years | 4 (50.0%) | 0 (0.0%) |
| 30 to 34 Years | 10 (90.9%) | 0 (0.0%) |
| 35 to 44 Years | 18 (75.0%) | 0 (0.0%) |
| 45 to 54 Years | 20 (100.0%) | 8 (40.0%) |
| 55 to 59 Years | 7 (41.2%) | 0 (0.0%) |
| 60 to 64 Years | 3 (30.0%) | 0 (0.0%) |
| 65 to 74 Years | 4 (10.8%) | 0 (0.0%) |
| 75 Years and over | 0 (0.0%) | 0 (0.0%) |
| Total | 77 (50.7%) | 9 (11.7%) |
Employment Status by Educational Attainment in West Burke
According to labor force statistics for West Burke, 68.9% of individuals (62) out of the total population between 25 and 64 years of age (90) are in the labor force, with 12.9% or 8 of them being unemployed. The group with the highest labor force participation rate are those with the educational attainment of bachelor's degree or higher, with 77.8% or 14 individuals in the labor force. Within the labor force, individuals with less than high school education have the highest percentage of unemployment, with 88.9% or 8 of them being unemployed.
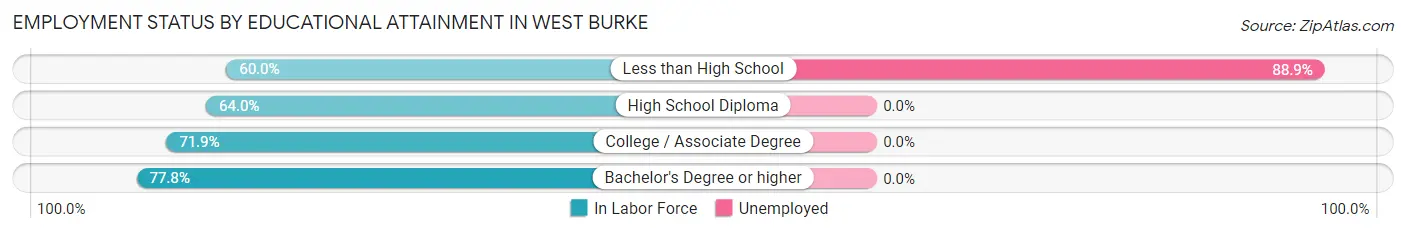
| Educational Attainment | In Labor Force | Unemployed |
| Less than High School | 9 (60.0%) | 13 (88.9%) |
| High School Diploma | 16 (64.0%) | 0 (0.0%) |
| College / Associate Degree | 23 (71.9%) | 0 (0.0%) |
| Bachelor's Degree or higher | 14 (77.8%) | 0 (0.0%) |
| Total | 62 (68.9%) | 12 (12.9%) |
Employment Occupations by Sex in West Burke
Management, Business, Science and Arts Occupations
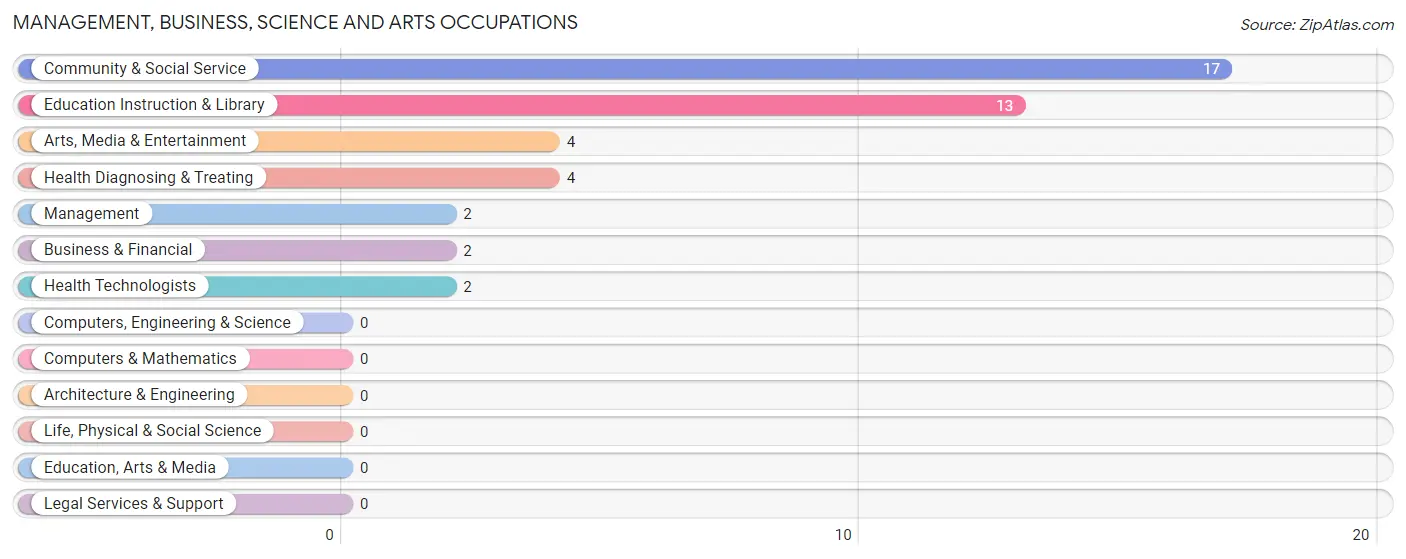
The most common Management, Business, Science and Arts occupations in West Burke are Community & Social Service (17 | 25.0%), Education Instruction & Library (13 | 19.1%), Arts, Media & Entertainment (4 | 5.9%), Health Diagnosing & Treating (4 | 5.9%), and Management (2 | 2.9%).
Management, Business, Science and Arts Occupations by Sex
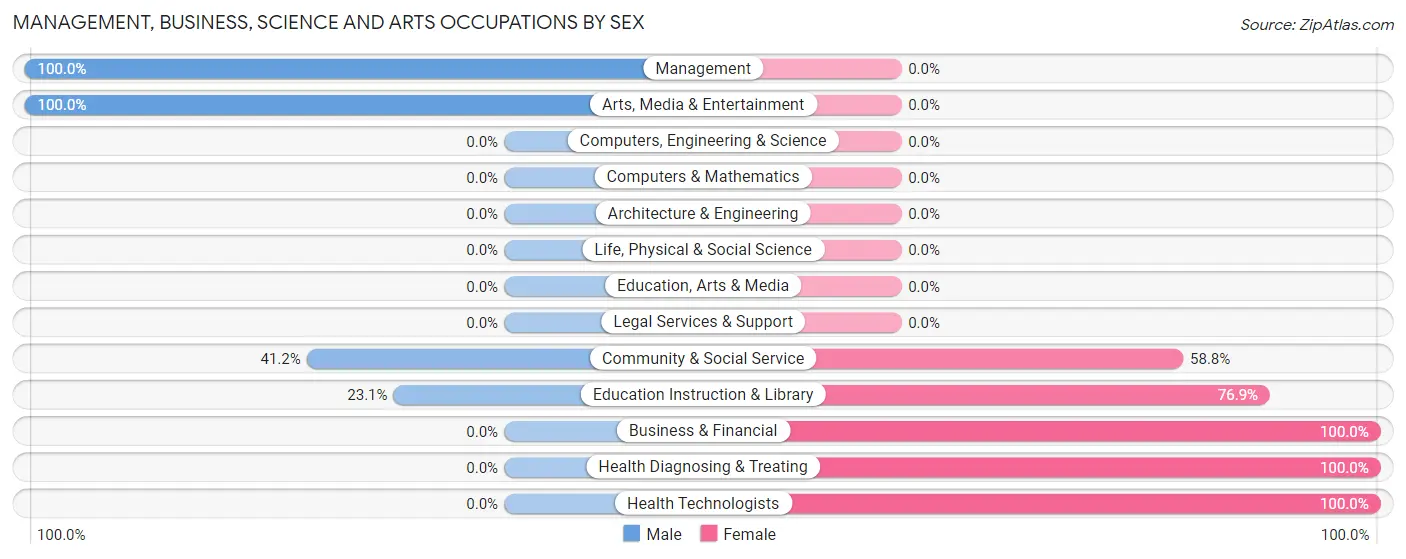
Within the Management, Business, Science and Arts occupations in West Burke, the most male-oriented occupations are Management (100.0%), Arts, Media & Entertainment (100.0%), and Community & Social Service (41.2%), while the most female-oriented occupations are Business & Financial (100.0%), Health Diagnosing & Treating (100.0%), and Health Technologists (100.0%).
| Occupation | Male | Female |
| Management | 2 (100.0%) | 0 (0.0%) |
| Business & Financial | 0 (0.0%) | 2 (100.0%) |
| Computers, Engineering & Science | 0 (0.0%) | 0 (0.0%) |
| Computers & Mathematics | 0 (0.0%) | 0 (0.0%) |
| Architecture & Engineering | 0 (0.0%) | 0 (0.0%) |
| Life, Physical & Social Science | 0 (0.0%) | 0 (0.0%) |
| Community & Social Service | 7 (41.2%) | 10 (58.8%) |
| Education, Arts & Media | 0 (0.0%) | 0 (0.0%) |
| Legal Services & Support | 0 (0.0%) | 0 (0.0%) |
| Education Instruction & Library | 3 (23.1%) | 10 (76.9%) |
| Arts, Media & Entertainment | 4 (100.0%) | 0 (0.0%) |
| Health Diagnosing & Treating | 0 (0.0%) | 4 (100.0%) |
| Health Technologists | 0 (0.0%) | 2 (100.0%) |
| Total (Category) | 9 (36.0%) | 16 (64.0%) |
| Total (Overall) | 30 (44.1%) | 38 (55.9%) |
Services Occupations
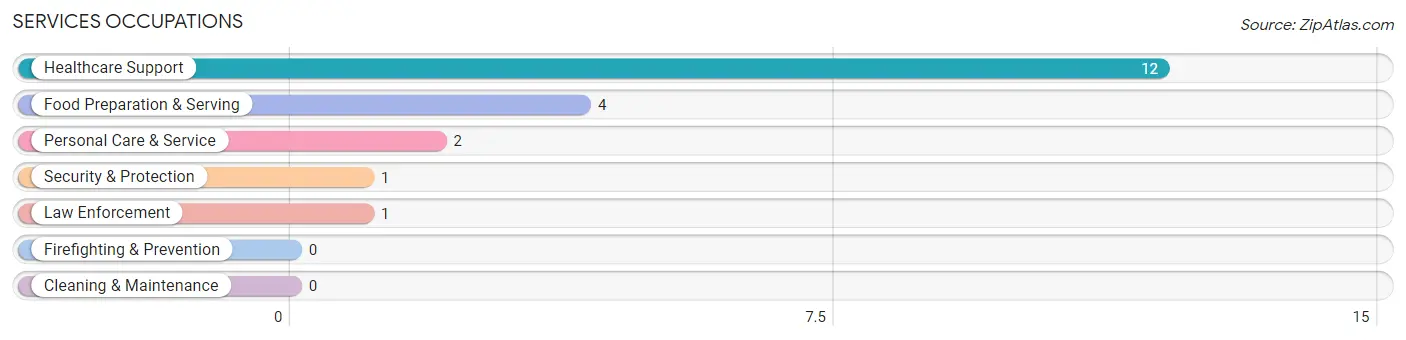
The most common Services occupations in West Burke are Healthcare Support (12 | 17.6%), Food Preparation & Serving (4 | 5.9%), Personal Care & Service (2 | 2.9%), Security & Protection (1 | 1.5%), and Law Enforcement (1 | 1.5%).
Services Occupations by Sex
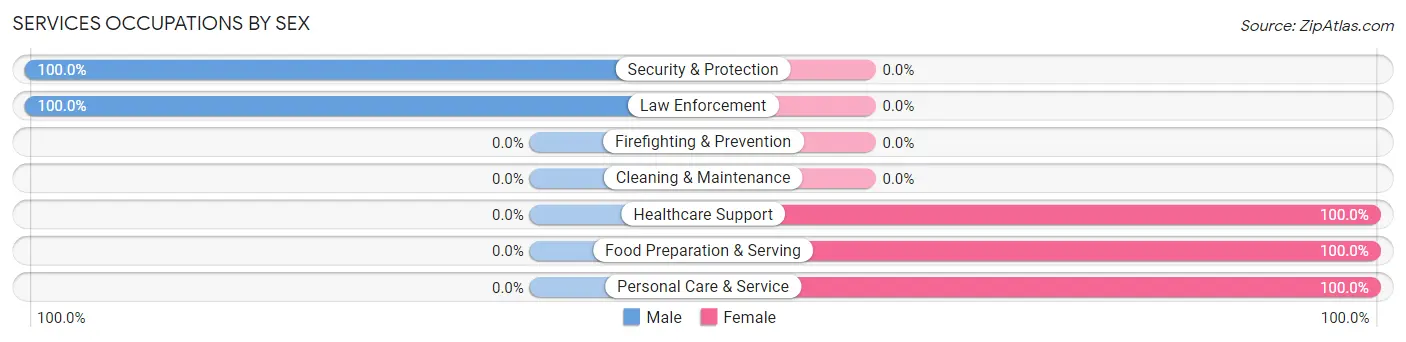
Within the Services occupations in West Burke, the most male-oriented occupations are Security & Protection (100.0%), and Law Enforcement (100.0%), while the most female-oriented occupations are Healthcare Support (100.0%), Food Preparation & Serving (100.0%), and Personal Care & Service (100.0%).
| Occupation | Male | Female |
| Healthcare Support | 0 (0.0%) | 12 (100.0%) |
| Security & Protection | 1 (100.0%) | 0 (0.0%) |
| Firefighting & Prevention | 0 (0.0%) | 0 (0.0%) |
| Law Enforcement | 1 (100.0%) | 0 (0.0%) |
| Food Preparation & Serving | 0 (0.0%) | 4 (100.0%) |
| Cleaning & Maintenance | 0 (0.0%) | 0 (0.0%) |
| Personal Care & Service | 0 (0.0%) | 2 (100.0%) |
| Total (Category) | 1 (5.3%) | 18 (94.7%) |
| Total (Overall) | 30 (44.1%) | 38 (55.9%) |
Sales and Office Occupations
The most common Sales and Office occupations in West Burke are Sales & Related (1 | 1.5%), and Office & Administration (1 | 1.5%).

Sales and Office Occupations by Sex
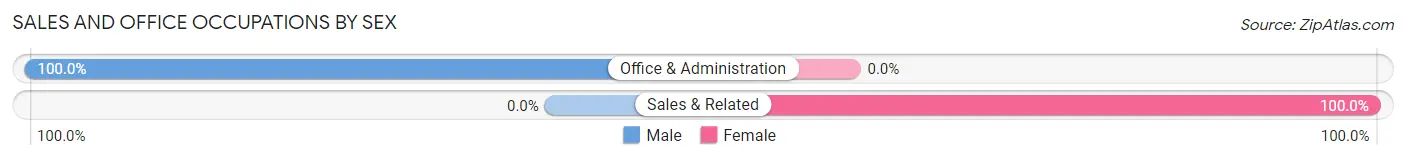
| Occupation | Male | Female |
| Sales & Related | 0 (0.0%) | 1 (100.0%) |
| Office & Administration | 1 (100.0%) | 0 (0.0%) |
| Total (Category) | 1 (50.0%) | 1 (50.0%) |
| Total (Overall) | 30 (44.1%) | 38 (55.9%) |
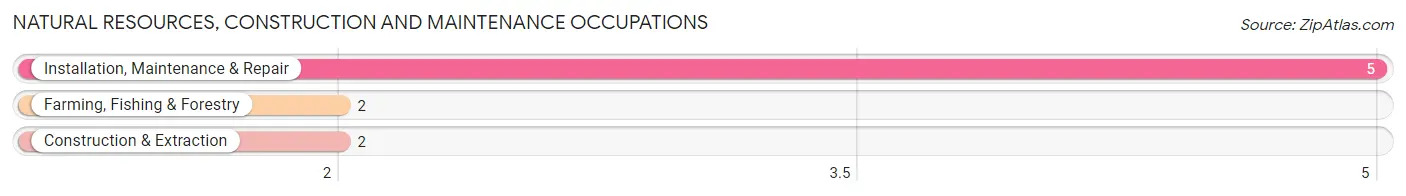
Natural Resources, Construction and Maintenance Occupations
The most common Natural Resources, Construction and Maintenance occupations in West Burke are Installation, Maintenance & Repair (5 | 7.3%), Farming, Fishing & Forestry (2 | 2.9%), and Construction & Extraction (2 | 2.9%).
Natural Resources, Construction and Maintenance Occupations by Sex
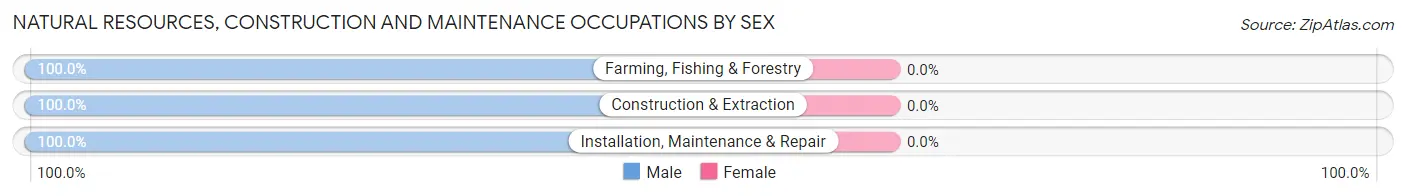
| Occupation | Male | Female |
| Farming, Fishing & Forestry | 2 (100.0%) | 0 (0.0%) |
| Construction & Extraction | 2 (100.0%) | 0 (0.0%) |
| Installation, Maintenance & Repair | 5 (100.0%) | 0 (0.0%) |
| Total (Category) | 9 (100.0%) | 0 (0.0%) |
| Total (Overall) | 30 (44.1%) | 38 (55.9%) |
Production, Transportation and Moving Occupations
The most common Production, Transportation and Moving occupations in West Burke are Production (8 | 11.8%), and Transportation (5 | 7.3%).
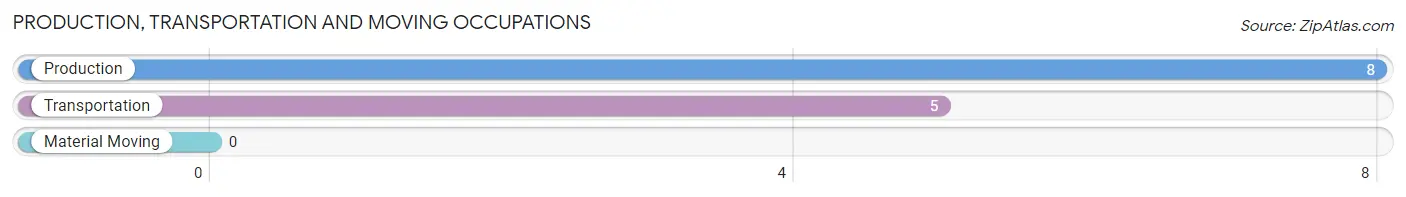
Production, Transportation and Moving Occupations by Sex
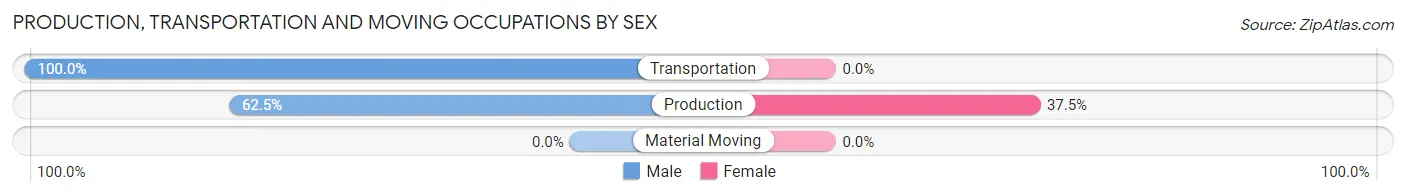
| Occupation | Male | Female |
| Production | 5 (62.5%) | 3 (37.5%) |
| Transportation | 5 (100.0%) | 0 (0.0%) |
| Material Moving | 0 (0.0%) | 0 (0.0%) |
| Total (Category) | 10 (76.9%) | 3 (23.1%) |
| Total (Overall) | 30 (44.1%) | 38 (55.9%) |
Employment Industries by Sex in West Burke
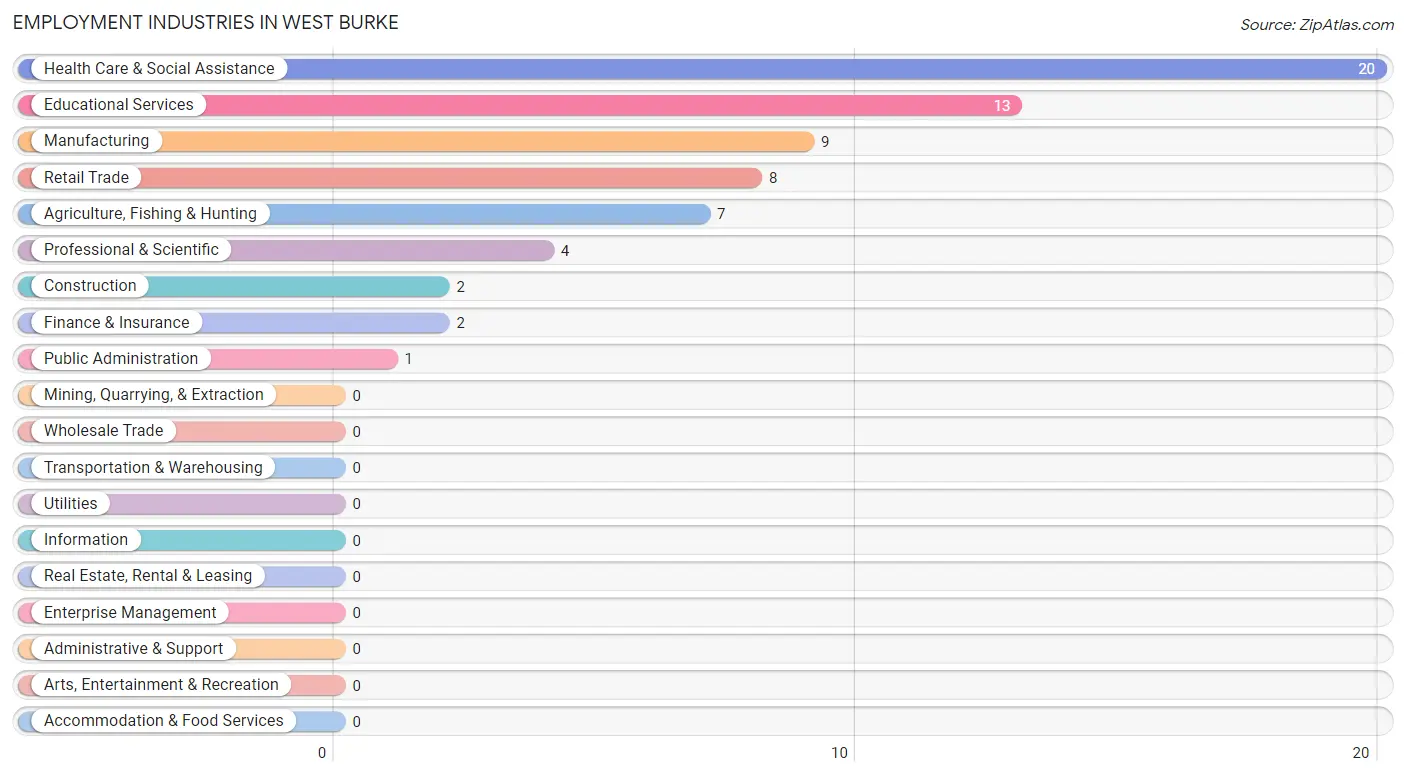
Employment Industries in West Burke
The major employment industries in West Burke include Health Care & Social Assistance (20 | 29.4%), Educational Services (13 | 19.1%), Manufacturing (9 | 13.2%), Retail Trade (8 | 11.8%), and Agriculture, Fishing & Hunting (7 | 10.3%).
Employment Industries by Sex in West Burke
The West Burke industries that see more men than women are Agriculture, Fishing & Hunting (100.0%), Construction (100.0%), and Professional & Scientific (100.0%), whereas the industries that tend to have a higher number of women are Finance & Insurance (100.0%), Health Care & Social Assistance (100.0%), and Educational Services (76.9%).
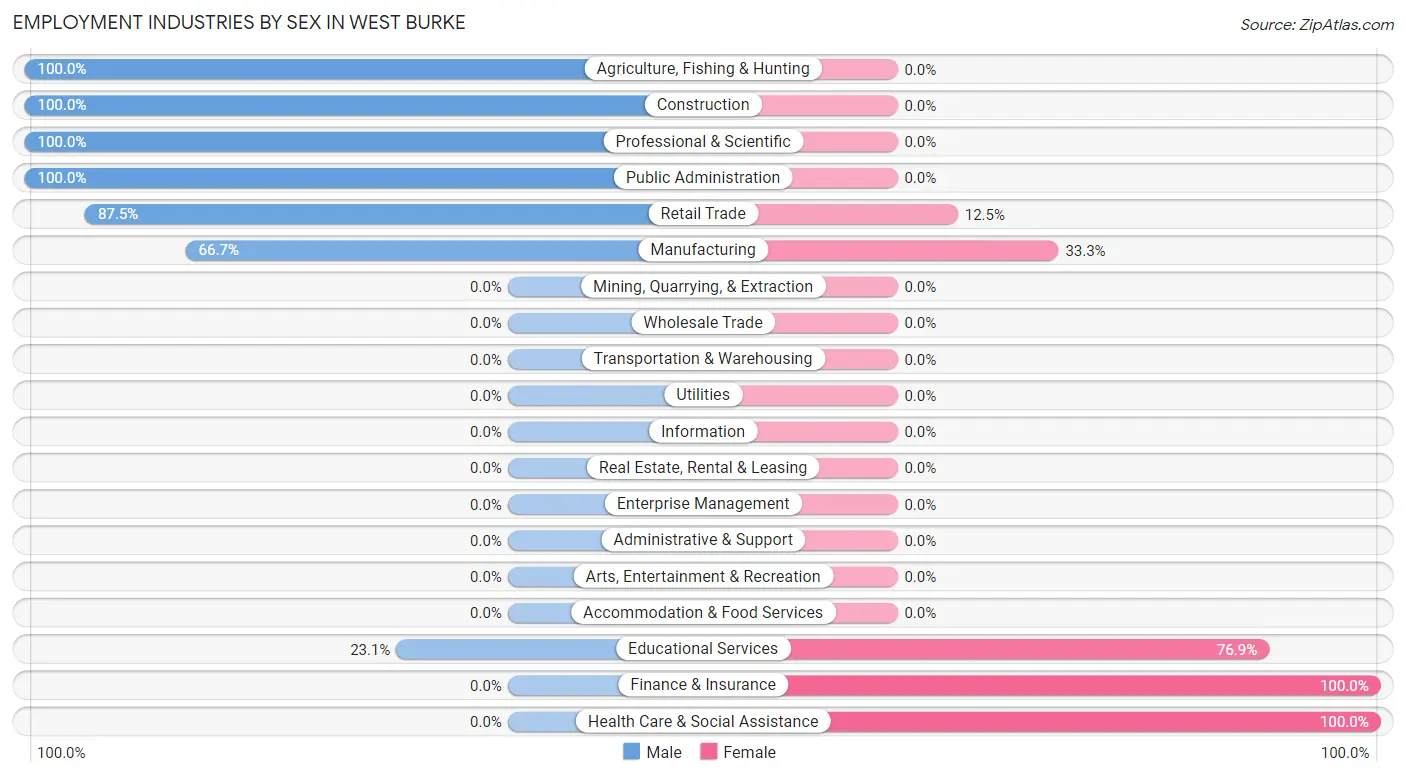
| Industry | Male | Female |
| Agriculture, Fishing & Hunting | 7 (100.0%) | 0 (0.0%) |
| Mining, Quarrying, & Extraction | 0 (0.0%) | 0 (0.0%) |
| Construction | 2 (100.0%) | 0 (0.0%) |
| Manufacturing | 6 (66.7%) | 3 (33.3%) |
| Wholesale Trade | 0 (0.0%) | 0 (0.0%) |
| Retail Trade | 7 (87.5%) | 1 (12.5%) |
| Transportation & Warehousing | 0 (0.0%) | 0 (0.0%) |
| Utilities | 0 (0.0%) | 0 (0.0%) |
| Information | 0 (0.0%) | 0 (0.0%) |
| Finance & Insurance | 0 (0.0%) | 2 (100.0%) |
| Real Estate, Rental & Leasing | 0 (0.0%) | 0 (0.0%) |
| Professional & Scientific | 4 (100.0%) | 0 (0.0%) |
| Enterprise Management | 0 (0.0%) | 0 (0.0%) |
| Administrative & Support | 0 (0.0%) | 0 (0.0%) |
| Educational Services | 3 (23.1%) | 10 (76.9%) |
| Health Care & Social Assistance | 0 (0.0%) | 20 (100.0%) |
| Arts, Entertainment & Recreation | 0 (0.0%) | 0 (0.0%) |
| Accommodation & Food Services | 0 (0.0%) | 0 (0.0%) |
| Public Administration | 1 (100.0%) | 0 (0.0%) |
| Total | 30 (44.1%) | 38 (55.9%) |
Education in West Burke
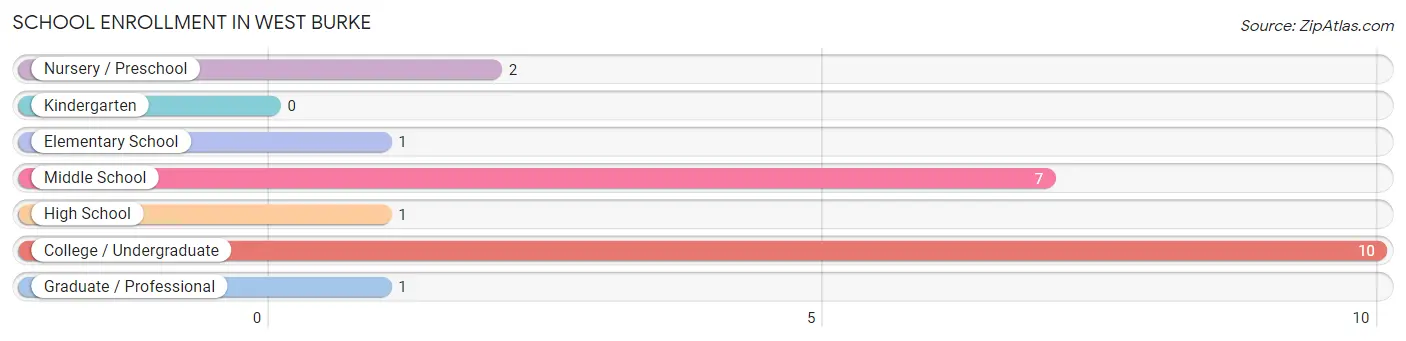
School Enrollment in West Burke
The most common levels of schooling among the 22 students in West Burke are college / undergraduate (10 | 45.5%), middle school (7 | 31.8%), and nursery / preschool (2 | 9.1%).
| School Level | # Students | % Students |
| Nursery / Preschool | 2 | 9.1% |
| Kindergarten | 0 | 0.0% |
| Elementary School | 1 | 4.5% |
| Middle School | 7 | 31.8% |
| High School | 1 | 4.5% |
| College / Undergraduate | 10 | 45.5% |
| Graduate / Professional | 1 | 4.5% |
| Total | 22 | 100.0% |
School Enrollment by Age by Funding Source in West Burke
Out of a total of 22 students who are enrolled in schools in West Burke, 2 (9.1%) attend a private institution, while the remaining 20 (90.9%) are enrolled in public schools. The age group of 25 to 34 year olds has the highest likelihood of being enrolled in private schools, with 2 (33.3% in the age bracket) enrolled. Conversely, the age group of 3 to 4 year olds has the lowest likelihood of being enrolled in a private school, with 2 (100.0% in the age bracket) attending a public institution.
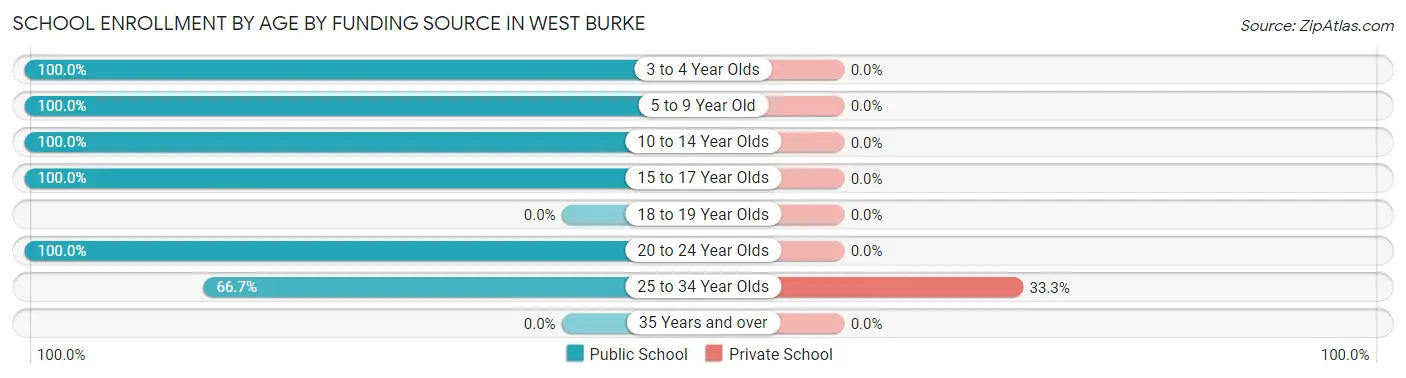
| Age Bracket | Public School | Private School |
| 3 to 4 Year Olds | 2 (100.0%) | 0 (0.0%) |
| 5 to 9 Year Old | 1 (100.0%) | 0 (0.0%) |
| 10 to 14 Year Olds | 6 (100.0%) | 0 (0.0%) |
| 15 to 17 Year Olds | 2 (100.0%) | 0 (0.0%) |
| 18 to 19 Year Olds | 0 (0.0%) | 0 (0.0%) |
| 20 to 24 Year Olds | 5 (100.0%) | 0 (0.0%) |
| 25 to 34 Year Olds | 4 (66.7%) | 2 (33.3%) |
| 35 Years and over | 0 (0.0%) | 0 (0.0%) |
| Total | 20 (90.9%) | 2 (9.1%) |
Educational Attainment by Field of Study in West Burke
Education (16 | 53.3%), business (4 | 13.3%), computers & mathematics (2 | 6.7%), psychology (2 | 6.7%), and social sciences (2 | 6.7%) are the most common fields of study among 30 individuals in West Burke who have obtained a bachelor's degree or higher.
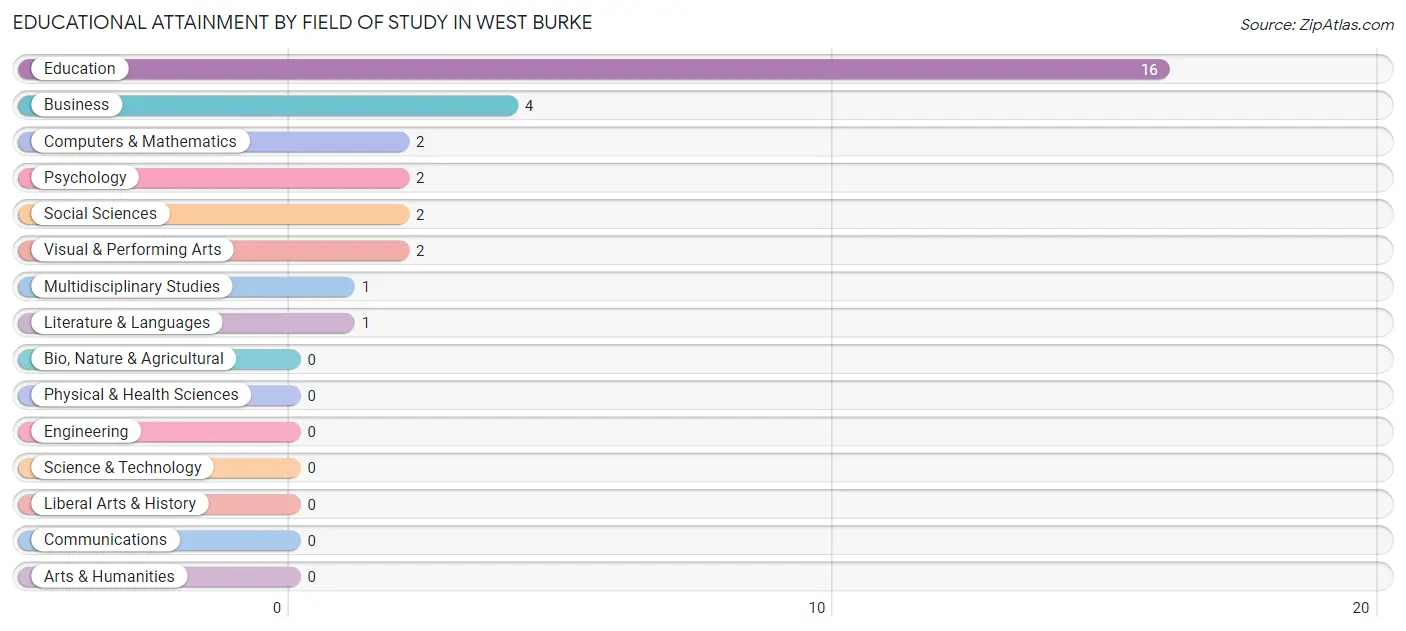
| Field of Study | # Graduates | % Graduates |
| Computers & Mathematics | 2 | 6.7% |
| Bio, Nature & Agricultural | 0 | 0.0% |
| Physical & Health Sciences | 0 | 0.0% |
| Psychology | 2 | 6.7% |
| Social Sciences | 2 | 6.7% |
| Engineering | 0 | 0.0% |
| Multidisciplinary Studies | 1 | 3.3% |
| Science & Technology | 0 | 0.0% |
| Business | 4 | 13.3% |
| Education | 16 | 53.3% |
| Literature & Languages | 1 | 3.3% |
| Liberal Arts & History | 0 | 0.0% |
| Visual & Performing Arts | 2 | 6.7% |
| Communications | 0 | 0.0% |
| Arts & Humanities | 0 | 0.0% |
| Total | 30 | 100.0% |
Transportation & Commute in West Burke
Vehicle Availability by Sex in West Burke
The most prevalent vehicle ownership categories in West Burke are males with 2 vehicles (13, accounting for 43.3%) and females with 2 vehicles (20, making up 35.1%).
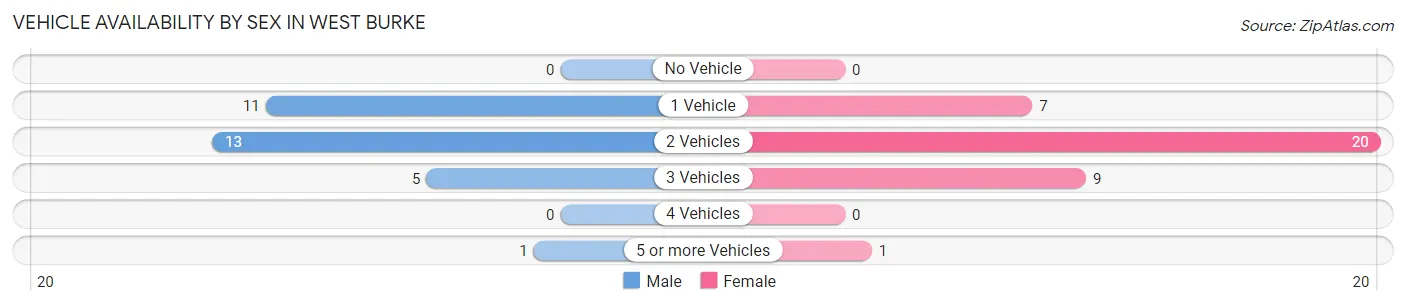
| Vehicles Available | Male | Female |
| No Vehicle | 0 (0.0%) | 0 (0.0%) |
| 1 Vehicle | 11 (36.7%) | 7 (18.9%) |
| 2 Vehicles | 13 (43.3%) | 20 (54.0%) |
| 3 Vehicles | 5 (16.7%) | 9 (24.3%) |
| 4 Vehicles | 0 (0.0%) | 0 (0.0%) |
| 5 or more Vehicles | 1 (3.3%) | 1 (2.7%) |
| Total | 30 (100.0%) | 37 (100.0%) |
Commute Time in West Burke
The most frequently occuring commute durations in West Burke are 20 to 24 minutes (16 commuters, 28.6%), 45 to 59 minutes (8 commuters, 14.3%), and 10 to 14 minutes (6 commuters, 10.7%).
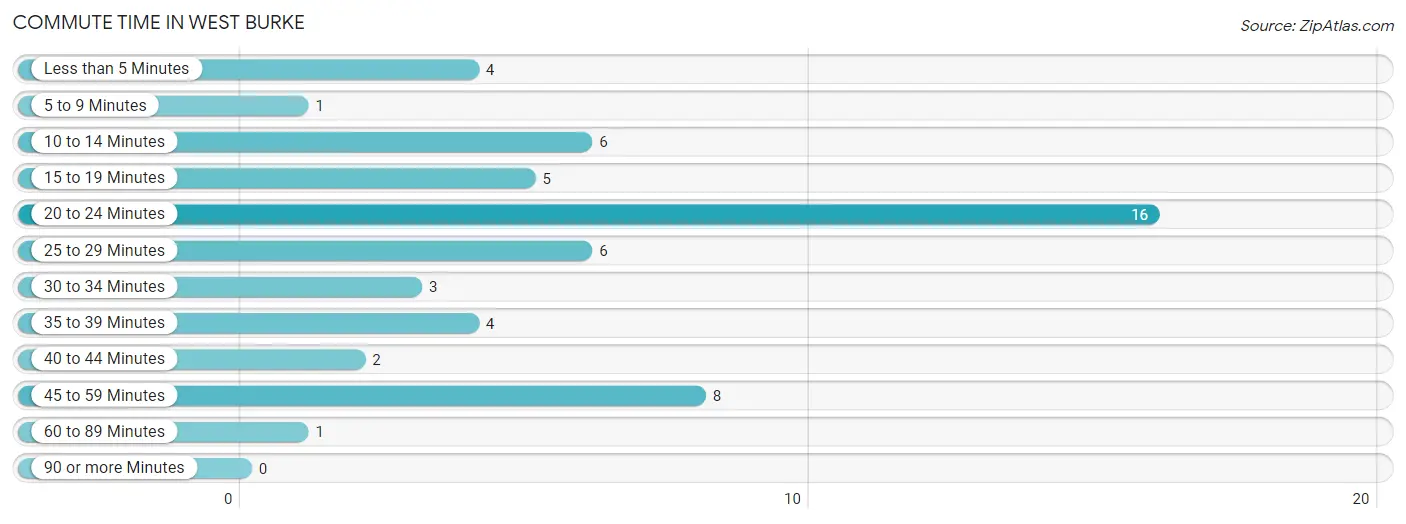
| Commute Time | # Commuters | % Commuters |
| Less than 5 Minutes | 4 | 7.1% |
| 5 to 9 Minutes | 1 | 1.8% |
| 10 to 14 Minutes | 6 | 10.7% |
| 15 to 19 Minutes | 5 | 8.9% |
| 20 to 24 Minutes | 16 | 28.6% |
| 25 to 29 Minutes | 6 | 10.7% |
| 30 to 34 Minutes | 3 | 5.4% |
| 35 to 39 Minutes | 4 | 7.1% |
| 40 to 44 Minutes | 2 | 3.6% |
| 45 to 59 Minutes | 8 | 14.3% |
| 60 to 89 Minutes | 1 | 1.8% |
| 90 or more Minutes | 0 | 0.0% |
Commute Time by Sex in West Burke
The most common commute times in West Burke are 20 to 24 minutes (15 commuters, 53.6%) for males and 15 to 19 minutes (5 commuters, 17.9%) for females.
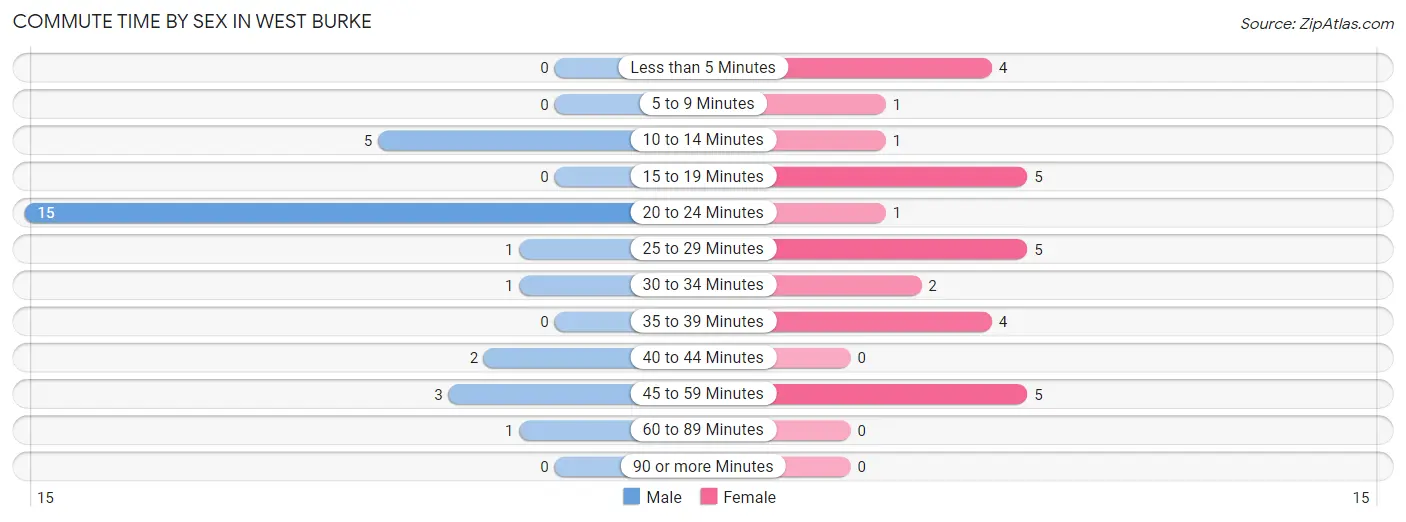
| Commute Time | Male | Female |
| Less than 5 Minutes | 0 (0.0%) | 4 (14.3%) |
| 5 to 9 Minutes | 0 (0.0%) | 1 (3.6%) |
| 10 to 14 Minutes | 5 (17.9%) | 1 (3.6%) |
| 15 to 19 Minutes | 0 (0.0%) | 5 (17.9%) |
| 20 to 24 Minutes | 15 (53.6%) | 1 (3.6%) |
| 25 to 29 Minutes | 1 (3.6%) | 5 (17.9%) |
| 30 to 34 Minutes | 1 (3.6%) | 2 (7.1%) |
| 35 to 39 Minutes | 0 (0.0%) | 4 (14.3%) |
| 40 to 44 Minutes | 2 (7.1%) | 0 (0.0%) |
| 45 to 59 Minutes | 3 (10.7%) | 5 (17.9%) |
| 60 to 89 Minutes | 1 (3.6%) | 0 (0.0%) |
| 90 or more Minutes | 0 (0.0%) | 0 (0.0%) |
Time of Departure to Work by Sex in West Burke
The most frequent times of departure to work in West Burke are 6:30 AM to 6:59 AM (7, 25.0%) for males and 7:30 AM to 7:59 AM (8, 28.6%) for females.
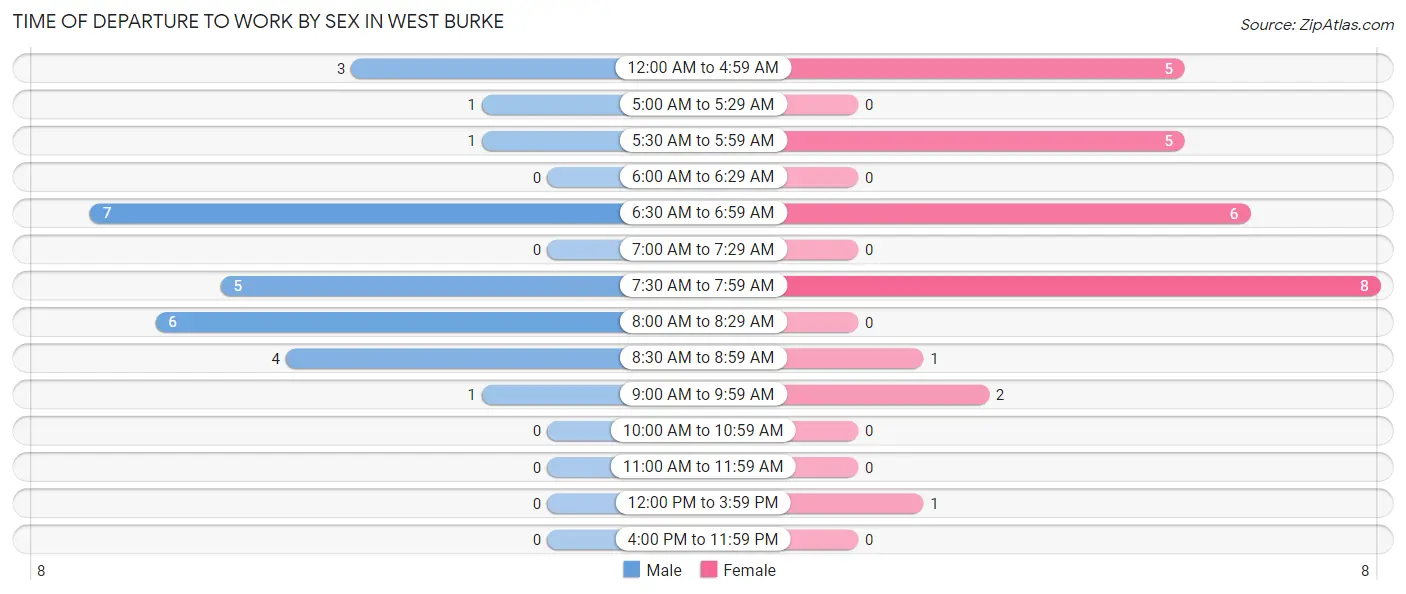
| Time of Departure | Male | Female |
| 12:00 AM to 4:59 AM | 3 (10.7%) | 5 (17.9%) |
| 5:00 AM to 5:29 AM | 1 (3.6%) | 0 (0.0%) |
| 5:30 AM to 5:59 AM | 1 (3.6%) | 5 (17.9%) |
| 6:00 AM to 6:29 AM | 0 (0.0%) | 0 (0.0%) |
| 6:30 AM to 6:59 AM | 7 (25.0%) | 6 (21.4%) |
| 7:00 AM to 7:29 AM | 0 (0.0%) | 0 (0.0%) |
| 7:30 AM to 7:59 AM | 5 (17.9%) | 8 (28.6%) |
| 8:00 AM to 8:29 AM | 6 (21.4%) | 0 (0.0%) |
| 8:30 AM to 8:59 AM | 4 (14.3%) | 1 (3.6%) |
| 9:00 AM to 9:59 AM | 1 (3.6%) | 2 (7.1%) |
| 10:00 AM to 10:59 AM | 0 (0.0%) | 0 (0.0%) |
| 11:00 AM to 11:59 AM | 0 (0.0%) | 0 (0.0%) |
| 12:00 PM to 3:59 PM | 0 (0.0%) | 1 (3.6%) |
| 4:00 PM to 11:59 PM | 0 (0.0%) | 0 (0.0%) |
| Total | 28 (100.0%) | 28 (100.0%) |
Housing Occupancy in West Burke
Occupancy by Ownership in West Burke
Of the total 97 dwellings in West Burke, owner-occupied units account for 47 (48.4%), while renter-occupied units make up 50 (51.5%).
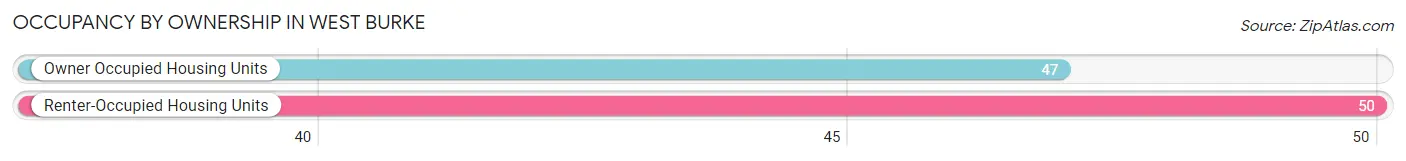
| Occupancy | # Housing Units | % Housing Units |
| Owner Occupied Housing Units | 47 | 48.4% |
| Renter-Occupied Housing Units | 50 | 51.5% |
| Total Occupied Housing Units | 97 | 100.0% |
Occupancy by Household Size in West Burke
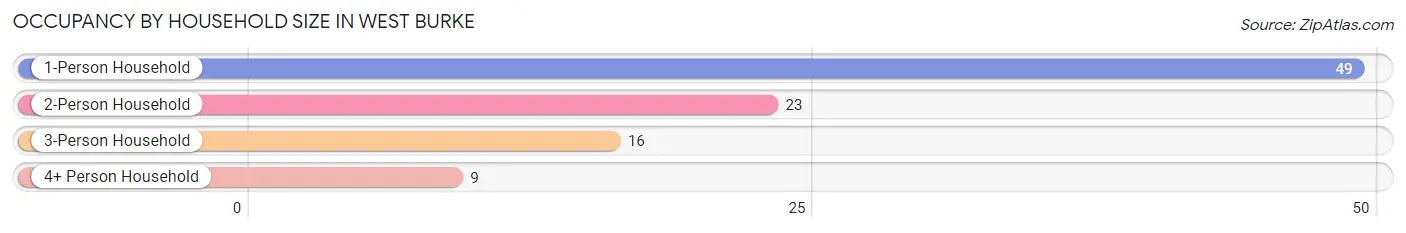
| Household Size | # Housing Units | % Housing Units |
| 1-Person Household | 49 | 50.5% |
| 2-Person Household | 23 | 23.7% |
| 3-Person Household | 16 | 16.5% |
| 4+ Person Household | 9 | 9.3% |
| Total Housing Units | 97 | 100.0% |
Occupancy by Ownership by Household Size in West Burke
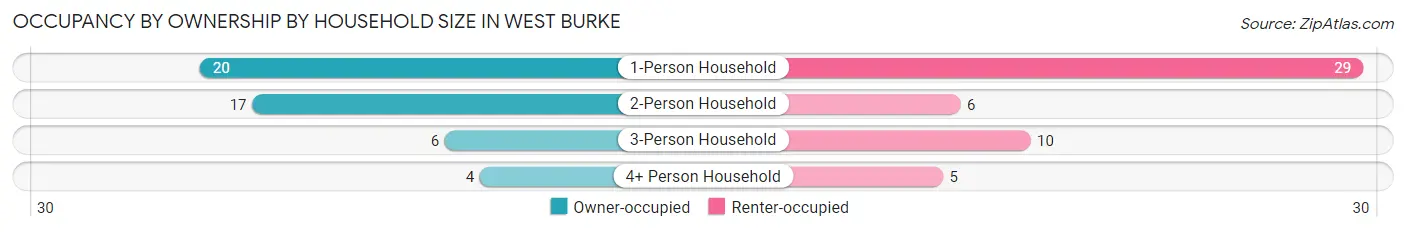
| Household Size | Owner-occupied | Renter-occupied |
| 1-Person Household | 20 (40.8%) | 29 (59.2%) |
| 2-Person Household | 17 (73.9%) | 6 (26.1%) |
| 3-Person Household | 6 (37.5%) | 10 (62.5%) |
| 4+ Person Household | 4 (44.4%) | 5 (55.6%) |
| Total Housing Units | 47 (48.4%) | 50 (51.5%) |
Occupancy by Educational Attainment in West Burke
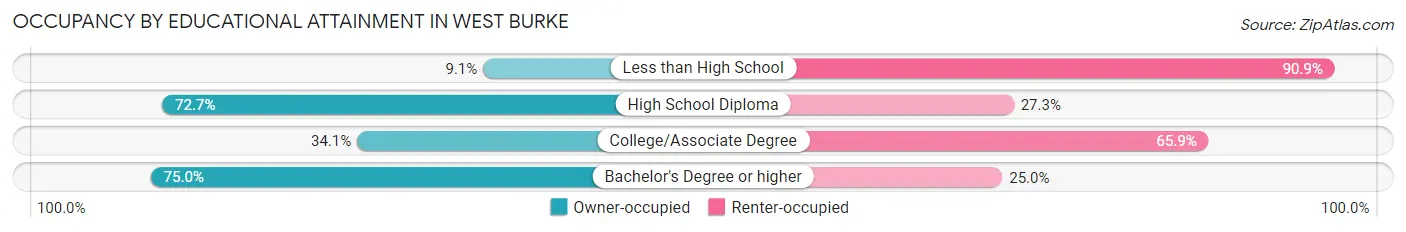
| Household Size | Owner-occupied | Renter-occupied |
| Less than High School | 1 (9.1%) | 10 (90.9%) |
| High School Diploma | 16 (72.7%) | 6 (27.3%) |
| College/Associate Degree | 15 (34.1%) | 29 (65.9%) |
| Bachelor's Degree or higher | 15 (75.0%) | 5 (25.0%) |
Occupancy by Age of Householder in West Burke
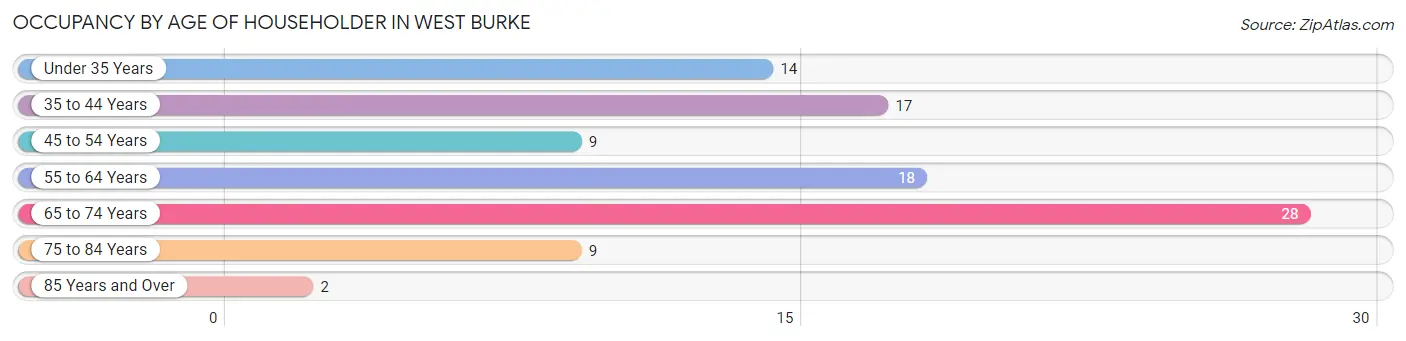
| Age Bracket | # Households | % Households |
| Under 35 Years | 14 | 14.4% |
| 35 to 44 Years | 17 | 17.5% |
| 45 to 54 Years | 9 | 9.3% |
| 55 to 64 Years | 18 | 18.6% |
| 65 to 74 Years | 28 | 28.9% |
| 75 to 84 Years | 9 | 9.3% |
| 85 Years and Over | 2 | 2.1% |
| Total | 97 | 100.0% |
Housing Finances in West Burke
Median Income by Occupancy in West Burke
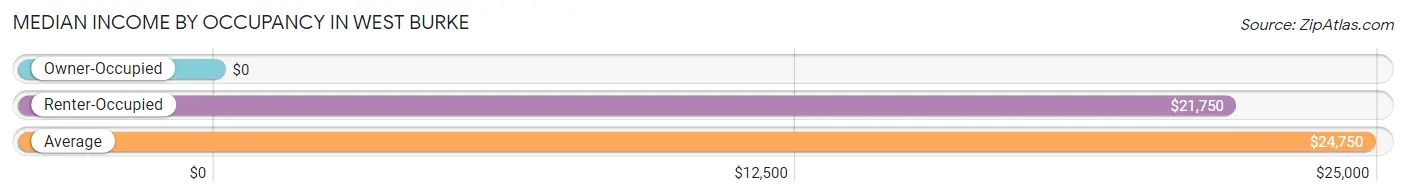
| Occupancy Type | # Households | Median Income |
| Owner-Occupied | 47 (48.4%) | $0 |
| Renter-Occupied | 50 (51.5%) | $21,750 |
| Average | 97 (100.0%) | $24,750 |
Occupancy by Householder Income Bracket in West Burke
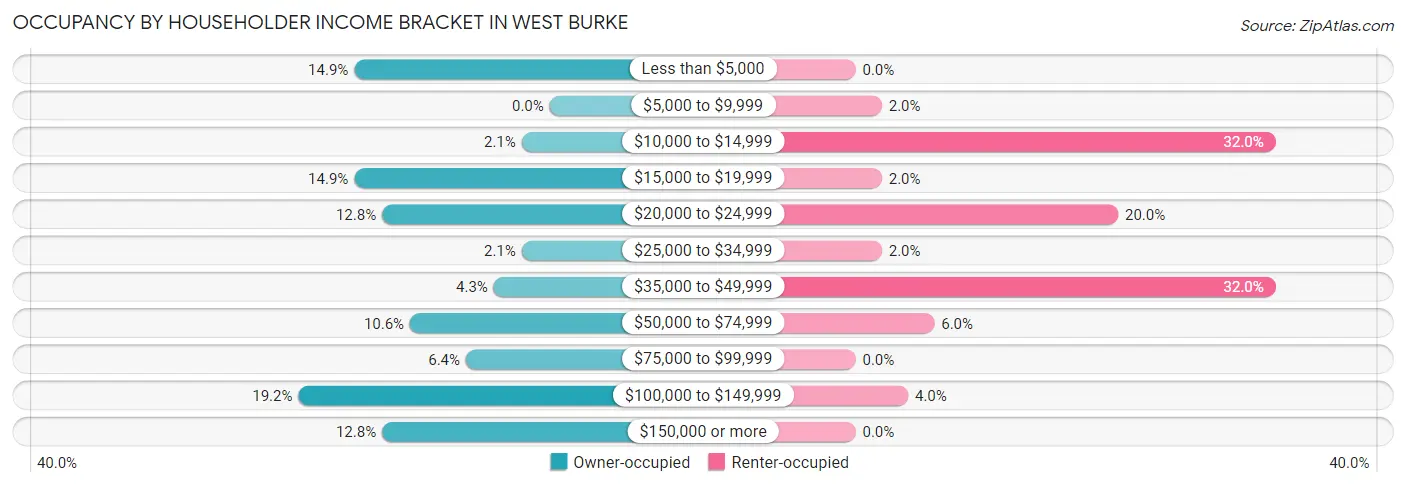
| Income Bracket | Owner-occupied | Renter-occupied |
| Less than $5,000 | 7 (14.9%) | 0 (0.0%) |
| $5,000 to $9,999 | 0 (0.0%) | 1 (2.0%) |
| $10,000 to $14,999 | 1 (2.1%) | 16 (32.0%) |
| $15,000 to $19,999 | 7 (14.9%) | 1 (2.0%) |
| $20,000 to $24,999 | 6 (12.8%) | 10 (20.0%) |
| $25,000 to $34,999 | 1 (2.1%) | 1 (2.0%) |
| $35,000 to $49,999 | 2 (4.3%) | 16 (32.0%) |
| $50,000 to $74,999 | 5 (10.6%) | 3 (6.0%) |
| $75,000 to $99,999 | 3 (6.4%) | 0 (0.0%) |
| $100,000 to $149,999 | 9 (19.2%) | 2 (4.0%) |
| $150,000 or more | 6 (12.8%) | 0 (0.0%) |
| Total | 47 (100.0%) | 50 (100.0%) |
Monthly Housing Cost Tiers in West Burke
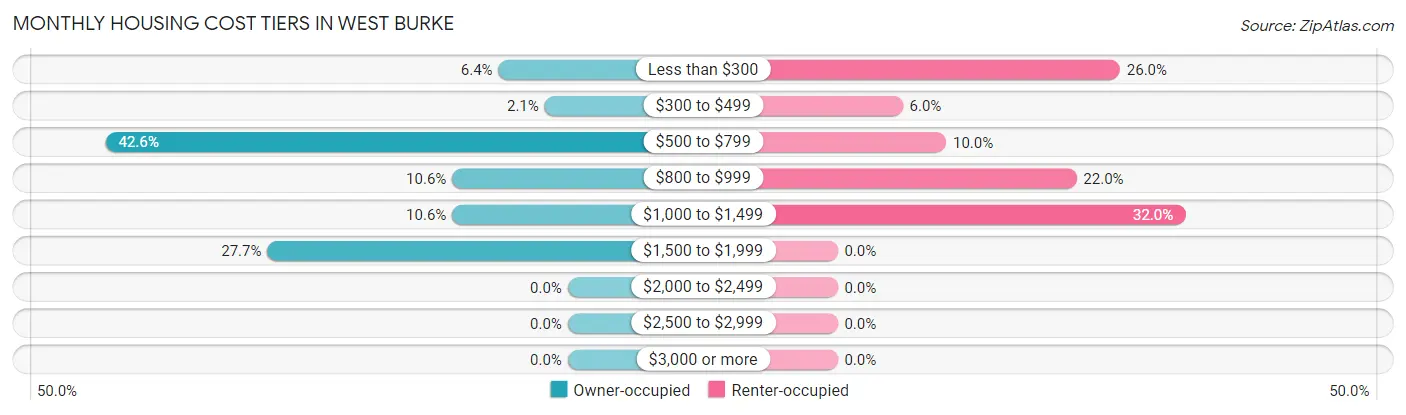
| Monthly Cost | Owner-occupied | Renter-occupied |
| Less than $300 | 3 (6.4%) | 13 (26.0%) |
| $300 to $499 | 1 (2.1%) | 3 (6.0%) |
| $500 to $799 | 20 (42.5%) | 5 (10.0%) |
| $800 to $999 | 5 (10.6%) | 11 (22.0%) |
| $1,000 to $1,499 | 5 (10.6%) | 16 (32.0%) |
| $1,500 to $1,999 | 13 (27.7%) | 0 (0.0%) |
| $2,000 to $2,499 | 0 (0.0%) | 0 (0.0%) |
| $2,500 to $2,999 | 0 (0.0%) | 0 (0.0%) |
| $3,000 or more | 0 (0.0%) | 0 (0.0%) |
| Total | 47 (100.0%) | 50 (100.0%) |
Physical Housing Characteristics in West Burke
Housing Structures in West Burke
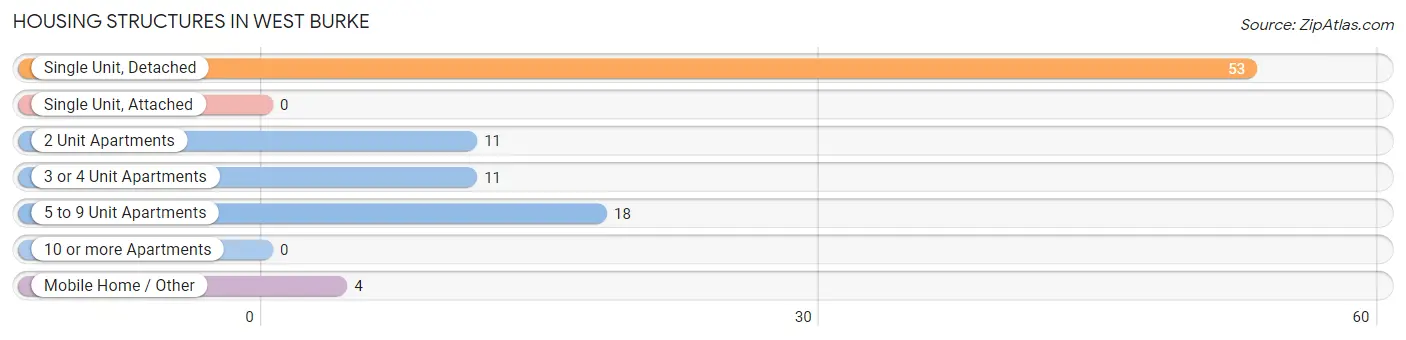
| Structure Type | # Housing Units | % Housing Units |
| Single Unit, Detached | 53 | 54.6% |
| Single Unit, Attached | 0 | 0.0% |
| 2 Unit Apartments | 11 | 11.3% |
| 3 or 4 Unit Apartments | 11 | 11.3% |
| 5 to 9 Unit Apartments | 18 | 18.6% |
| 10 or more Apartments | 0 | 0.0% |
| Mobile Home / Other | 4 | 4.1% |
| Total | 97 | 100.0% |
Housing Structures by Occupancy in West Burke
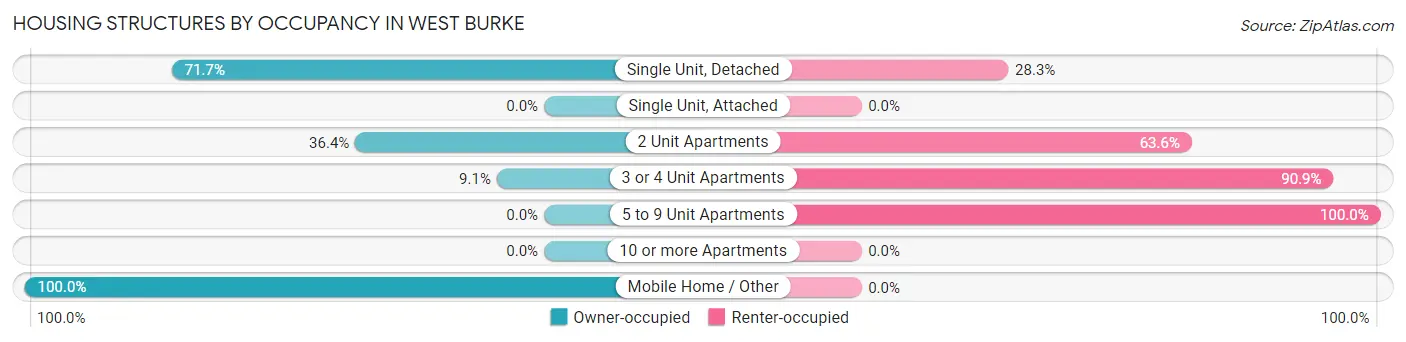
| Structure Type | Owner-occupied | Renter-occupied |
| Single Unit, Detached | 38 (71.7%) | 15 (28.3%) |
| Single Unit, Attached | 0 (0.0%) | 0 (0.0%) |
| 2 Unit Apartments | 4 (36.4%) | 7 (63.6%) |
| 3 or 4 Unit Apartments | 1 (9.1%) | 10 (90.9%) |
| 5 to 9 Unit Apartments | 0 (0.0%) | 18 (100.0%) |
| 10 or more Apartments | 0 (0.0%) | 0 (0.0%) |
| Mobile Home / Other | 4 (100.0%) | 0 (0.0%) |
| Total | 47 (48.4%) | 50 (51.5%) |
Housing Structures by Number of Rooms in West Burke
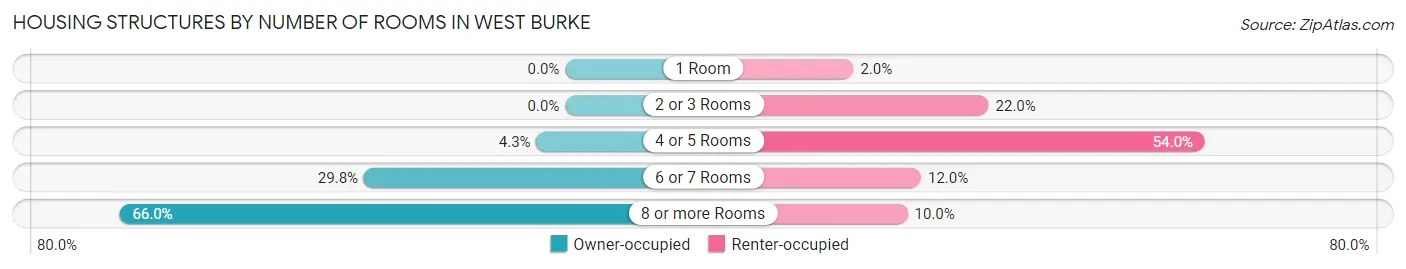
| Number of Rooms | Owner-occupied | Renter-occupied |
| 1 Room | 0 (0.0%) | 1 (2.0%) |
| 2 or 3 Rooms | 0 (0.0%) | 11 (22.0%) |
| 4 or 5 Rooms | 2 (4.3%) | 27 (54.0%) |
| 6 or 7 Rooms | 14 (29.8%) | 6 (12.0%) |
| 8 or more Rooms | 31 (66.0%) | 5 (10.0%) |
| Total | 47 (100.0%) | 50 (100.0%) |
Housing Structure by Heating Type in West Burke
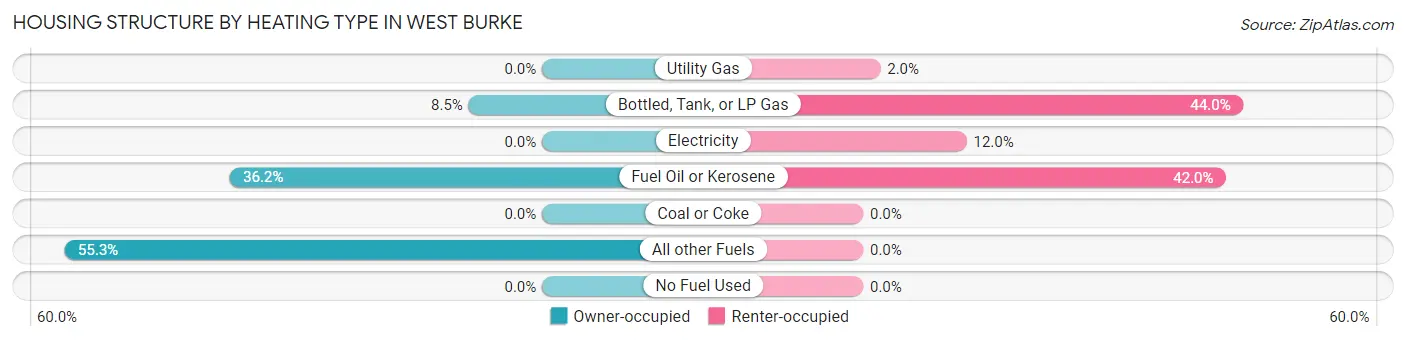
| Heating Type | Owner-occupied | Renter-occupied |
| Utility Gas | 0 (0.0%) | 1 (2.0%) |
| Bottled, Tank, or LP Gas | 4 (8.5%) | 22 (44.0%) |
| Electricity | 0 (0.0%) | 6 (12.0%) |
| Fuel Oil or Kerosene | 17 (36.2%) | 21 (42.0%) |
| Coal or Coke | 0 (0.0%) | 0 (0.0%) |
| All other Fuels | 26 (55.3%) | 0 (0.0%) |
| No Fuel Used | 0 (0.0%) | 0 (0.0%) |
| Total | 47 (100.0%) | 50 (100.0%) |
Household Vehicle Usage in West Burke
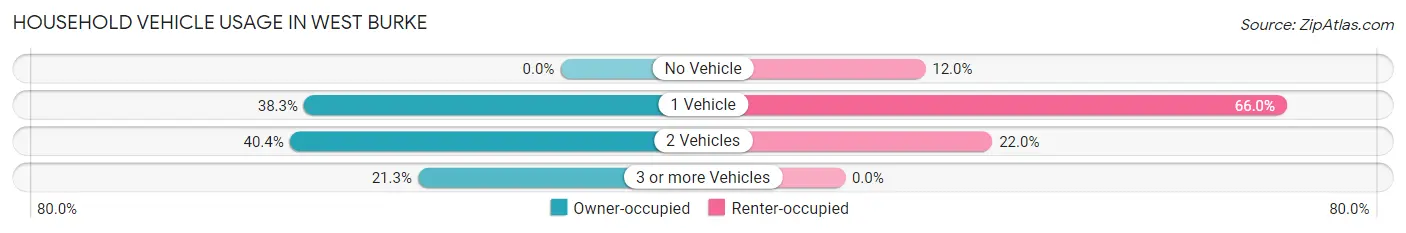
| Vehicles per Household | Owner-occupied | Renter-occupied |
| No Vehicle | 0 (0.0%) | 6 (12.0%) |
| 1 Vehicle | 18 (38.3%) | 33 (66.0%) |
| 2 Vehicles | 19 (40.4%) | 11 (22.0%) |
| 3 or more Vehicles | 10 (21.3%) | 0 (0.0%) |
| Total | 47 (100.0%) | 50 (100.0%) |
Real Estate & Mortgages in West Burke
Real Estate and Mortgage Overview in West Burke
| Characteristic | Without Mortgage | With Mortgage |
| Housing Units | 21 | 26 |
| Median Property Value | $215,000 | $200,000 |
| Median Household Income | $19,107 | $6 |
| Monthly Housing Costs | $541 | $0 |
| Real Estate Taxes | $3,313 | $0 |
Property Value by Mortgage Status in West Burke
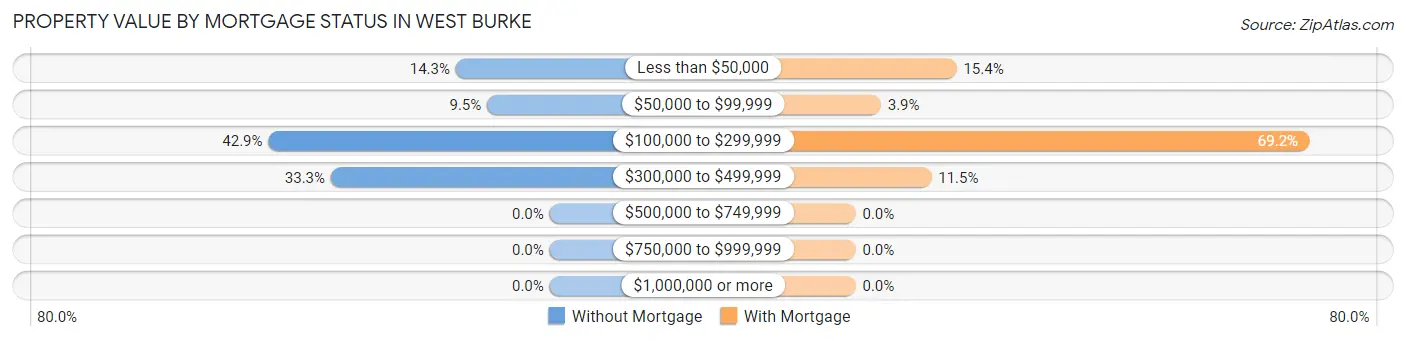
| Property Value | Without Mortgage | With Mortgage |
| Less than $50,000 | 3 (14.3%) | 4 (15.4%) |
| $50,000 to $99,999 | 2 (9.5%) | 1 (3.8%) |
| $100,000 to $299,999 | 9 (42.9%) | 18 (69.2%) |
| $300,000 to $499,999 | 7 (33.3%) | 3 (11.5%) |
| $500,000 to $749,999 | 0 (0.0%) | 0 (0.0%) |
| $750,000 to $999,999 | 0 (0.0%) | 0 (0.0%) |
| $1,000,000 or more | 0 (0.0%) | 0 (0.0%) |
| Total | 21 (100.0%) | 26 (100.0%) |
Household Income by Mortgage Status in West Burke
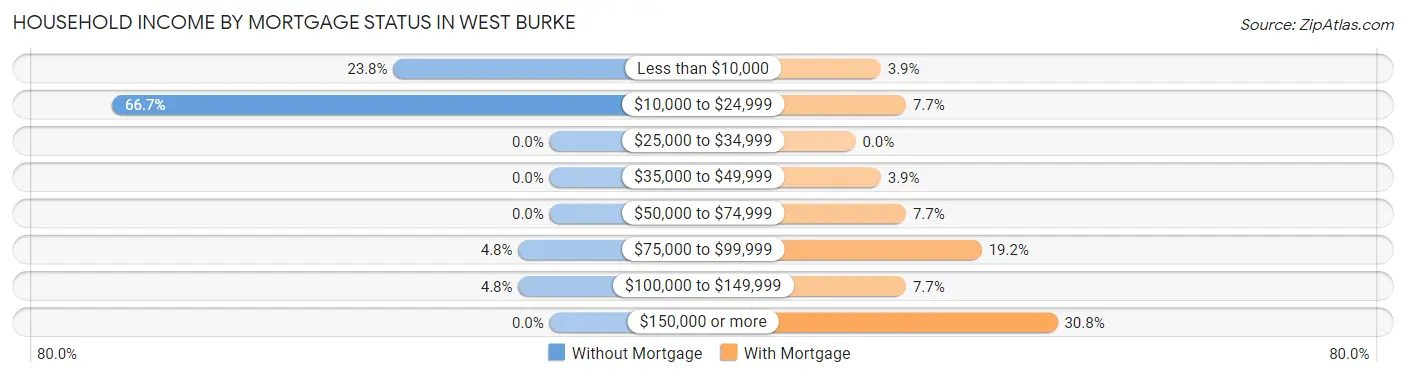
| Household Income | Without Mortgage | With Mortgage |
| Less than $10,000 | 5 (23.8%) | 1 (3.8%) |
| $10,000 to $24,999 | 14 (66.7%) | 2 (7.7%) |
| $25,000 to $34,999 | 0 (0.0%) | 0 (0.0%) |
| $35,000 to $49,999 | 0 (0.0%) | 1 (3.8%) |
| $50,000 to $74,999 | 0 (0.0%) | 2 (7.7%) |
| $75,000 to $99,999 | 1 (4.8%) | 5 (19.2%) |
| $100,000 to $149,999 | 1 (4.8%) | 2 (7.7%) |
| $150,000 or more | 0 (0.0%) | 8 (30.8%) |
| Total | 21 (100.0%) | 26 (100.0%) |
Property Value to Household Income Ratio in West Burke
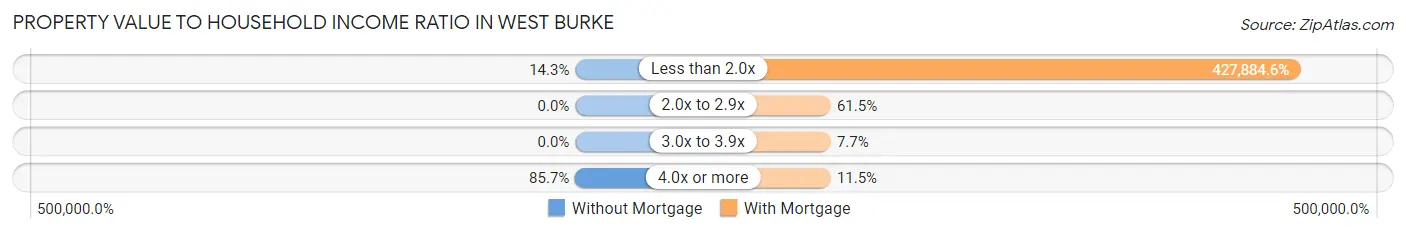
| Value-to-Income Ratio | Without Mortgage | With Mortgage |
| Less than 2.0x | 3 (14.3%) | 111,250 (427,884.6%) |
| 2.0x to 2.9x | 0 (0.0%) | 16 (61.5%) |
| 3.0x to 3.9x | 0 (0.0%) | 2 (7.7%) |
| 4.0x or more | 18 (85.7%) | 3 (11.5%) |
| Total | 21 (100.0%) | 26 (100.0%) |
Real Estate Taxes by Mortgage Status in West Burke
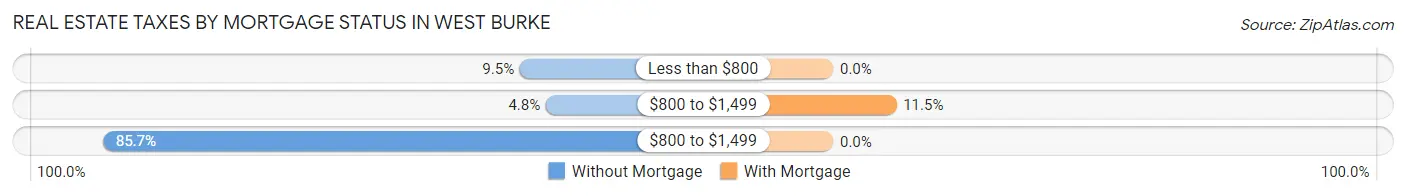
| Property Taxes | Without Mortgage | With Mortgage |
| Less than $800 | 2 (9.5%) | 0 (0.0%) |
| $800 to $1,499 | 1 (4.8%) | 3 (11.5%) |
| $800 to $1,499 | 18 (85.7%) | 0 (0.0%) |
| Total | 21 (100.0%) | 26 (100.0%) |
Health & Disability in West Burke
Health Insurance Coverage by Age in West Burke
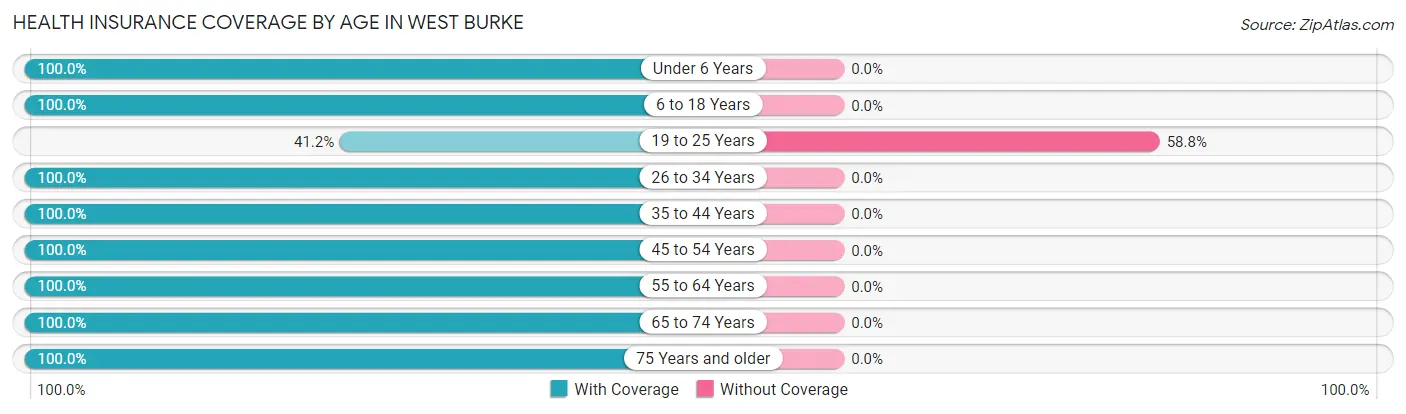
| Age Bracket | With Coverage | Without Coverage |
| Under 6 Years | 16 (100.0%) | 0 (0.0%) |
| 6 to 18 Years | 9 (100.0%) | 0 (0.0%) |
| 19 to 25 Years | 7 (41.2%) | 10 (58.8%) |
| 26 to 34 Years | 13 (100.0%) | 0 (0.0%) |
| 35 to 44 Years | 24 (100.0%) | 0 (0.0%) |
| 45 to 54 Years | 20 (100.0%) | 0 (0.0%) |
| 55 to 64 Years | 27 (100.0%) | 0 (0.0%) |
| 65 to 74 Years | 37 (100.0%) | 0 (0.0%) |
| 75 Years and older | 12 (100.0%) | 0 (0.0%) |
| Total | 165 (94.3%) | 10 (5.7%) |
Health Insurance Coverage by Citizenship Status in West Burke
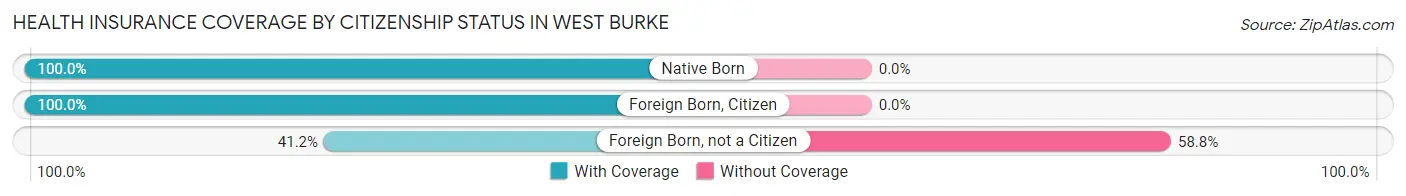
| Citizenship Status | With Coverage | Without Coverage |
| Native Born | 16 (100.0%) | 0 (0.0%) |
| Foreign Born, Citizen | 9 (100.0%) | 0 (0.0%) |
| Foreign Born, not a Citizen | 7 (41.2%) | 10 (58.8%) |
Health Insurance Coverage by Household Income in West Burke
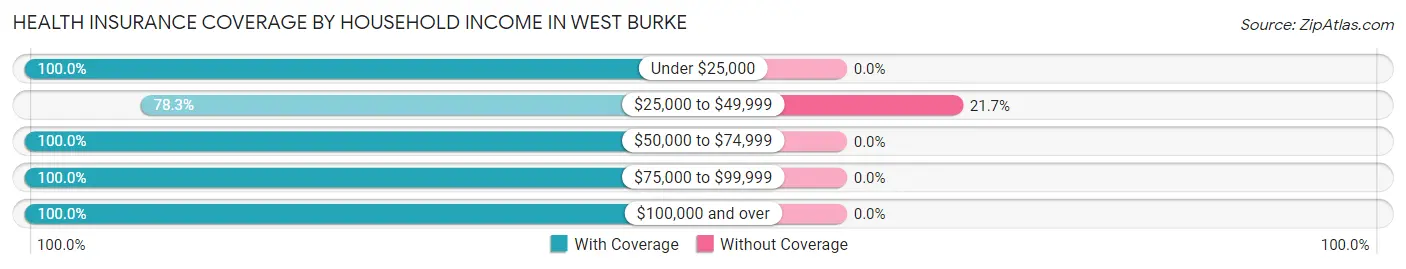
| Household Income | With Coverage | Without Coverage |
| Under $25,000 | 62 (100.0%) | 0 (0.0%) |
| $25,000 to $49,999 | 36 (78.3%) | 10 (21.7%) |
| $50,000 to $74,999 | 21 (100.0%) | 0 (0.0%) |
| $75,000 to $99,999 | 6 (100.0%) | 0 (0.0%) |
| $100,000 and over | 40 (100.0%) | 0 (0.0%) |
Public vs Private Health Insurance Coverage by Age in West Burke
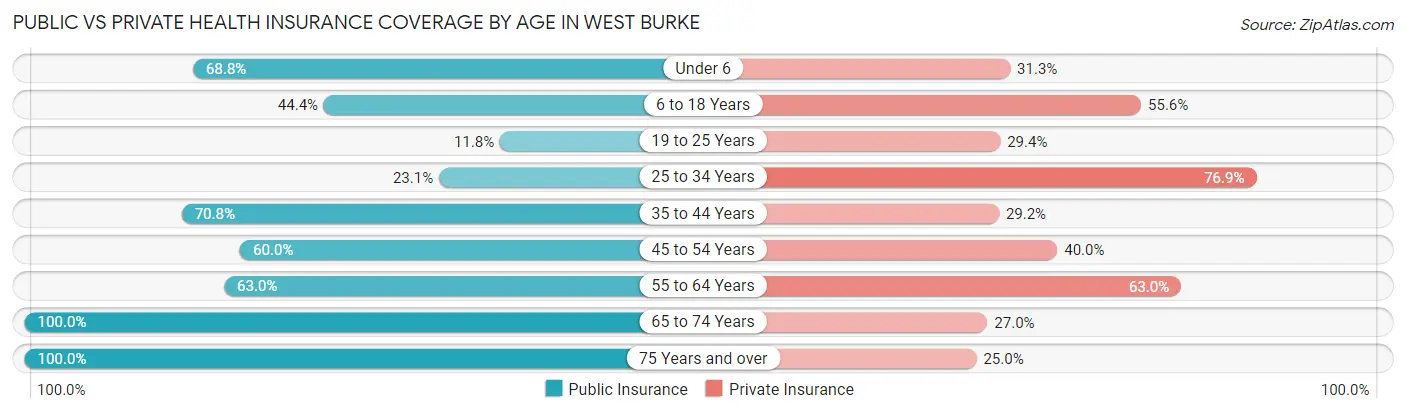
| Age Bracket | Public Insurance | Private Insurance |
| Under 6 | 11 (68.8%) | 5 (31.2%) |
| 6 to 18 Years | 4 (44.4%) | 5 (55.6%) |
| 19 to 25 Years | 2 (11.8%) | 5 (29.4%) |
| 25 to 34 Years | 3 (23.1%) | 10 (76.9%) |
| 35 to 44 Years | 17 (70.8%) | 7 (29.2%) |
| 45 to 54 Years | 12 (60.0%) | 8 (40.0%) |
| 55 to 64 Years | 17 (63.0%) | 17 (63.0%) |
| 65 to 74 Years | 37 (100.0%) | 10 (27.0%) |
| 75 Years and over | 12 (100.0%) | 3 (25.0%) |
| Total | 115 (65.7%) | 70 (40.0%) |
Disability Status by Sex by Age in West Burke
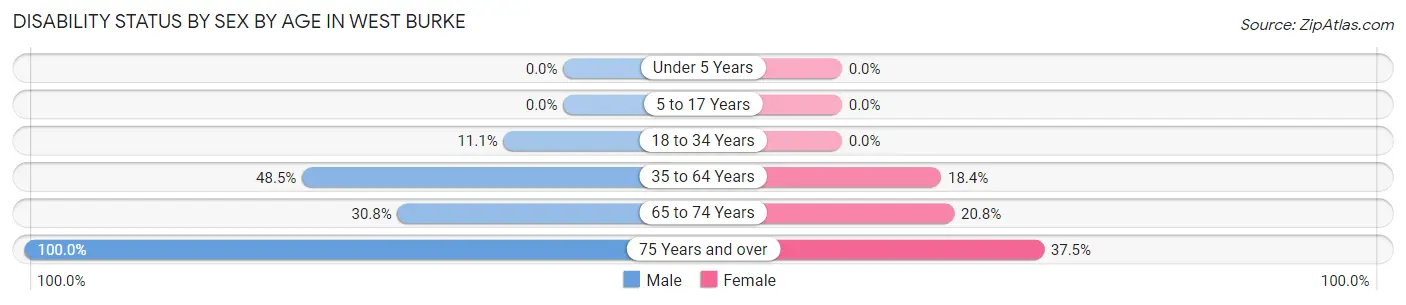
| Age Bracket | Male | Female |
| Under 5 Years | 0 (0.0%) | 0 (0.0%) |
| 5 to 17 Years | 0 (0.0%) | 0 (0.0%) |
| 18 to 34 Years | 2 (11.1%) | 0 (0.0%) |
| 35 to 64 Years | 16 (48.5%) | 7 (18.4%) |
| 65 to 74 Years | 4 (30.8%) | 5 (20.8%) |
| 75 Years and over | 4 (100.0%) | 3 (37.5%) |
Disability Class by Sex by Age in West Burke
Disability Class: Hearing Difficulty
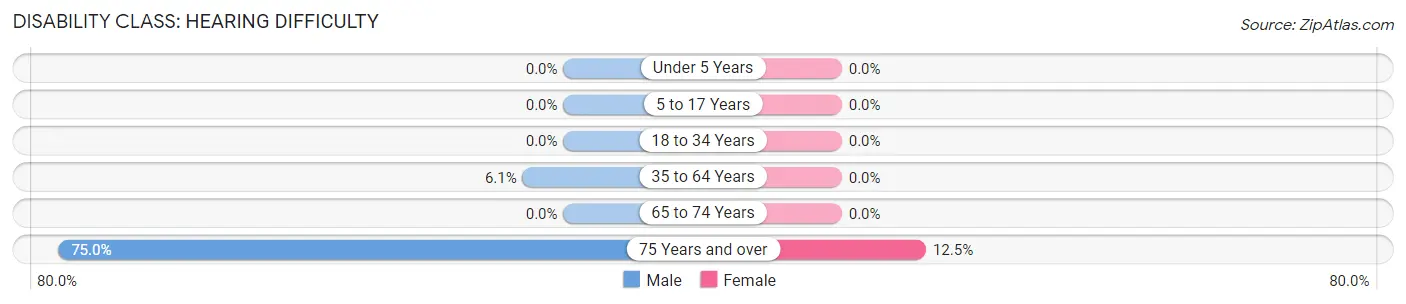
| Age Bracket | Male | Female |
| Under 5 Years | 0 (0.0%) | 0 (0.0%) |
| 5 to 17 Years | 0 (0.0%) | 0 (0.0%) |
| 18 to 34 Years | 0 (0.0%) | 0 (0.0%) |
| 35 to 64 Years | 2 (6.1%) | 0 (0.0%) |
| 65 to 74 Years | 0 (0.0%) | 0 (0.0%) |
| 75 Years and over | 3 (75.0%) | 1 (12.5%) |
Disability Class: Vision Difficulty
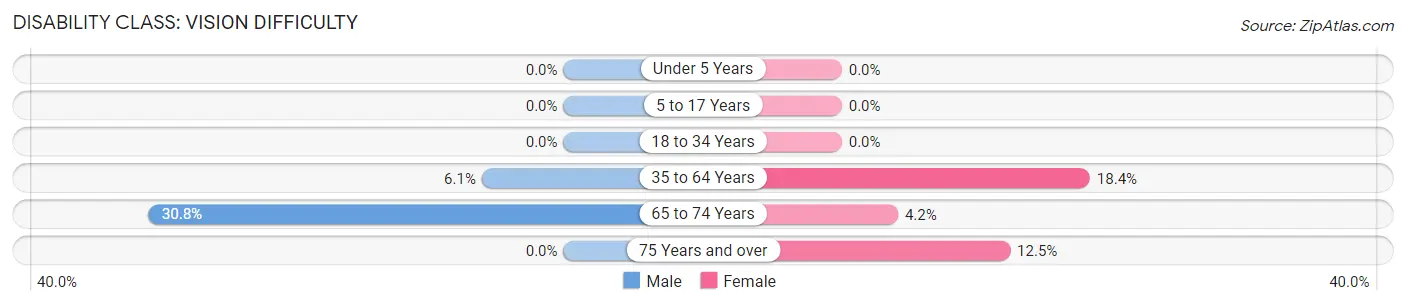
| Age Bracket | Male | Female |
| Under 5 Years | 0 (0.0%) | 0 (0.0%) |
| 5 to 17 Years | 0 (0.0%) | 0 (0.0%) |
| 18 to 34 Years | 0 (0.0%) | 0 (0.0%) |
| 35 to 64 Years | 2 (6.1%) | 7 (18.4%) |
| 65 to 74 Years | 4 (30.8%) | 1 (4.2%) |
| 75 Years and over | 0 (0.0%) | 1 (12.5%) |
Disability Class: Cognitive Difficulty
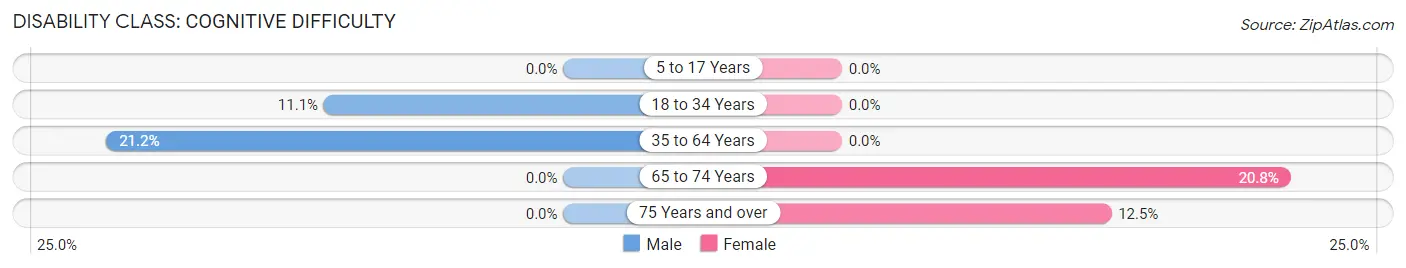
| Age Bracket | Male | Female |
| 5 to 17 Years | 0 (0.0%) | 0 (0.0%) |
| 18 to 34 Years | 2 (11.1%) | 0 (0.0%) |
| 35 to 64 Years | 7 (21.2%) | 0 (0.0%) |
| 65 to 74 Years | 0 (0.0%) | 5 (20.8%) |
| 75 Years and over | 0 (0.0%) | 1 (12.5%) |
Disability Class: Ambulatory Difficulty
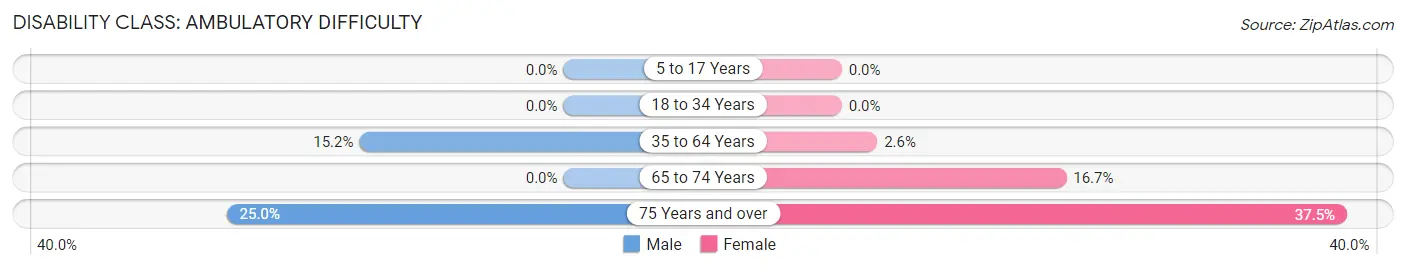
| Age Bracket | Male | Female |
| 5 to 17 Years | 0 (0.0%) | 0 (0.0%) |
| 18 to 34 Years | 0 (0.0%) | 0 (0.0%) |
| 35 to 64 Years | 5 (15.1%) | 1 (2.6%) |
| 65 to 74 Years | 0 (0.0%) | 4 (16.7%) |
| 75 Years and over | 1 (25.0%) | 3 (37.5%) |
Disability Class: Self-Care Difficulty
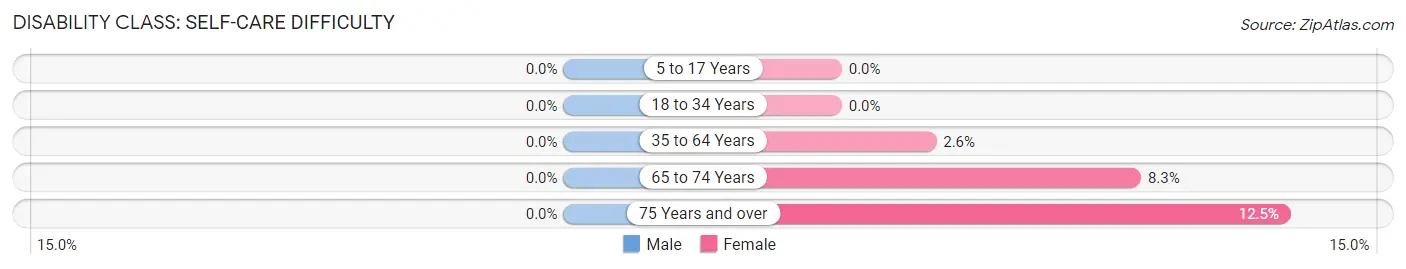
| Age Bracket | Male | Female |
| 5 to 17 Years | 0 (0.0%) | 0 (0.0%) |
| 18 to 34 Years | 0 (0.0%) | 0 (0.0%) |
| 35 to 64 Years | 0 (0.0%) | 1 (2.6%) |
| 65 to 74 Years | 0 (0.0%) | 2 (8.3%) |
| 75 Years and over | 0 (0.0%) | 1 (12.5%) |
Technology Access in West Burke
Computing Device Access in West Burke
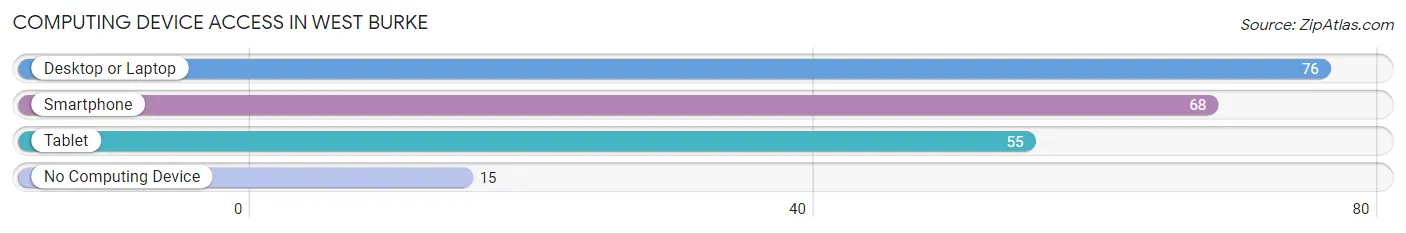
| Device Type | # Households | % Households |
| Desktop or Laptop | 76 | 78.3% |
| Smartphone | 68 | 70.1% |
| Tablet | 55 | 56.7% |
| No Computing Device | 15 | 15.5% |
| Total | 97 | 100.0% |
Internet Access in West Burke
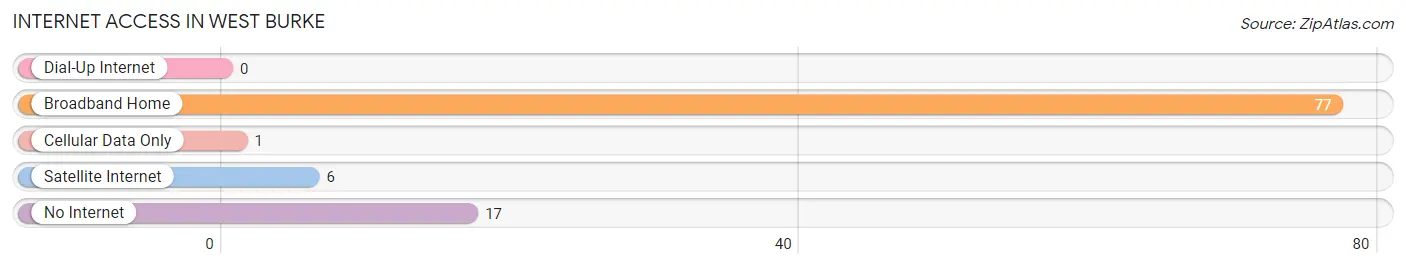
| Internet Type | # Households | % Households |
| Dial-Up Internet | 0 | 0.0% |
| Broadband Home | 77 | 79.4% |
| Cellular Data Only | 1 | 1.0% |
| Satellite Internet | 6 | 6.2% |
| No Internet | 17 | 17.5% |
| Total | 97 | 100.0% |
West Burke Summary
Burke, Vermont is a small town located in the northeastern corner of the state, in Caledonia County. It is situated in the Green Mountains, and is bordered by the Connecticut River to the east. The town was first settled in 1790, and was incorporated in 1796. The town was named after Edmund Burke, an Irish statesman and philosopher.
Geography
Burke is located in the northeastern corner of Vermont, in Caledonia County. It is situated in the Green Mountains, and is bordered by the Connecticut River to the east. The town has a total area of 24.2 square miles, of which 24.1 square miles is land and 0.1 square miles is water. The highest point in the town is Burke Mountain, which has an elevation of 3,890 feet.
The town is home to several bodies of water, including the Clyde River, the Passumpsic River, and the Wells River. The town is also home to several small ponds, including Little Pond, Long Pond, and Mud Pond.
Demographics
As of the 2010 census, Burke had a population of 1,764. The racial makeup of the town was 97.3% White, 0.3% African American, 0.3% Native American, 0.2% Asian, 0.1% Pacific Islander, 0.2% from other races, and 1.5% from two or more races. Hispanic or Latino of any race were 0.7% of the population.
The median income for a household in the town was $41,250, and the median income for a family was $50,000. The per capita income for the town was $20,945. About 8.3% of families and 11.2% of the population were below the poverty line, including 14.2% of those under age 18 and 8.3% of those age 65 or over.
Economy
Burke is a rural town, and the economy is largely based on agriculture and forestry. The town is home to several small farms, and the main crops grown in the area are hay, corn, and potatoes. The town is also home to several sawmills and lumber yards, which provide employment for many of the town's residents.
The town is also home to Burke Mountain Ski Resort, which is a popular destination for skiing and snowboarding. The resort is open year-round, and offers a variety of activities, including skiing, snowboarding, tubing, and mountain biking.
History
Burke was first settled in 1790, and was incorporated in 1796. The town was named after Edmund Burke, an Irish statesman and philosopher.
The town was originally an agricultural community, and the main crops grown in the area were hay, corn, and potatoes. The town was also home to several sawmills and lumber yards, which provided employment for many of the town's residents.
In the late 19th century, the town began to develop a tourism industry. The town was home to several resorts, including the Burke Mountain House, which was a popular destination for skiing and snowboarding. The resort was open year-round, and offered a variety of activities, including skiing, snowboarding, tubing, and mountain biking.
In the early 20th century, the town began to develop a manufacturing industry. The town was home to several factories, including a paper mill, a furniture factory, and a shoe factory. The factories provided employment for many of the town's residents.
Today, Burke is a small, rural town. The economy is largely based on agriculture and forestry, and the town is home to several small farms and sawmills. The town is also home to Burke Mountain Ski Resort, which is a popular destination for skiing and snowboarding.
Common Questions
What is Per Capita Income in West Burke?
Per Capita income in West Burke is $26,337.
What is the Median Family Income in West Burke?
Median Family Income in West Burke is $60,938.
What is the Median Household income in West Burke?
Median Household Income in West Burke is $24,750.
What is Income or Wage Gap in West Burke?
Income or Wage Gap in West Burke is 18.9%.
Women in West Burke earn 81.1 cents for every dollar earned by a man.
What is Inequality or Gini Index in West Burke?
Inequality or Gini Index in West Burke is 0.51.
What is the Total Population of West Burke?
Total Population of West Burke is 175.
What is the Total Male Population of West Burke?
Total Male Population of West Burke is 81.
What is the Total Female Population of West Burke?
Total Female Population of West Burke is 94.
What is the Ratio of Males per 100 Females in West Burke?
There are 86.17 Males per 100 Females in West Burke.
What is the Ratio of Females per 100 Males in West Burke?
There are 116.05 Females per 100 Males in West Burke.
What is the Median Population Age in West Burke?
Median Population Age in West Burke is 45.9 Years.
What is the Average Family Size in West Burke
Average Family Size in West Burke is 2.4 People.
What is the Average Household Size in West Burke
Average Household Size in West Burke is 1.8 People.
How Large is the Labor Force in West Burke?
There are 77 People in the Labor Forcein in West Burke.
What is the Percentage of People in the Labor Force in West Burke?
50.7% of People are in the Labor Force in West Burke.
What is the Unemployment Rate in West Burke?
Unemployment Rate in West Burke is 11.7%.