Horsham, PA Map & Demographics
Horsham Map
Horsham Overview
$45,576
PER CAPITA INCOME
$119,883
AVG FAMILY INCOME
$96,284
AVG HOUSEHOLD INCOME
19.8%
WAGE / INCOME GAP [ % ]
80.2¢/ $1
WAGE / INCOME GAP [ $ ]
0.43
INEQUALITY / GINI INDEX
15,683
TOTAL POPULATION
7,825
MALE POPULATION
7,858
FEMALE POPULATION
99.58
MALES / 100 FEMALES
100.42
FEMALES / 100 MALES
35.7
MEDIAN AGE
3.4
AVG FAMILY SIZE
2.7
AVG HOUSEHOLD SIZE
9,152
LABOR FORCE [ PEOPLE ]
74.7%
PERCENT IN LABOR FORCE
2.9%
UNEMPLOYMENT RATE
Horsham Zip Codes
Income in Horsham
Income Overview in Horsham
Per Capita Income in Horsham is $45,576, while median incomes of families and households are $119,883 and $96,284 respectively.
| Characteristic | Number | Measure |
| Per Capita Income | 15,683 | $45,576 |
| Median Family Income | 3,956 | $119,883 |
| Mean Family Income | 3,956 | $143,642 |
| Median Household Income | 5,674 | $96,284 |
| Mean Household Income | 5,674 | $126,361 |
| Income Deficit | 3,956 | $0 |
| Wage / Income Gap (%) | 15,683 | 19.76% |
| Wage / Income Gap ($) | 15,683 | 80.24¢ per $1 |
| Gini / Inequality Index | 15,683 | 0.43 |
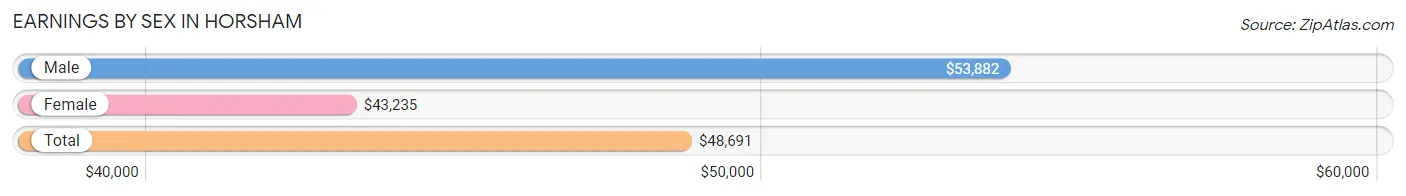
Earnings by Sex in Horsham
Average Earnings in Horsham are $48,691, $53,882 for men and $43,235 for women, a difference of 19.8%.
| Sex | Number | Average Earnings |
| Male | 4,721 (50.5%) | $53,882 |
| Female | 4,634 (49.5%) | $43,235 |
| Total | 9,355 (100.0%) | $48,691 |
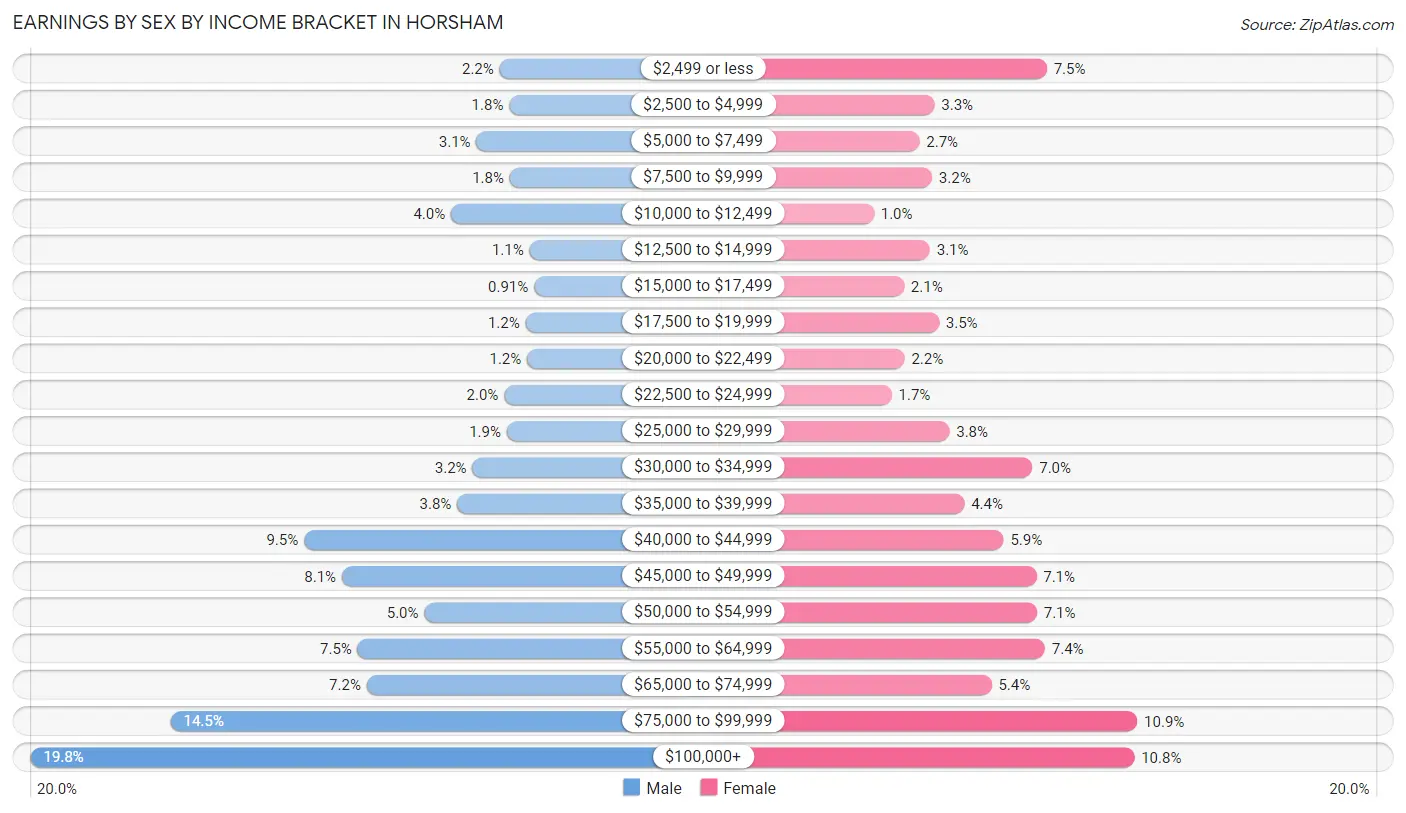
Earnings by Sex by Income Bracket in Horsham
The most common earnings brackets in Horsham are $100,000+ for men (934 | 19.8%) and $75,000 to $99,999 for women (504 | 10.9%).
| Income | Male | Female |
| $2,499 or less | 104 (2.2%) | 347 (7.5%) |
| $2,500 to $4,999 | 87 (1.8%) | 152 (3.3%) |
| $5,000 to $7,499 | 145 (3.1%) | 126 (2.7%) |
| $7,500 to $9,999 | 86 (1.8%) | 148 (3.2%) |
| $10,000 to $12,499 | 190 (4.0%) | 47 (1.0%) |
| $12,500 to $14,999 | 51 (1.1%) | 144 (3.1%) |
| $15,000 to $17,499 | 43 (0.9%) | 99 (2.1%) |
| $17,500 to $19,999 | 58 (1.2%) | 160 (3.5%) |
| $20,000 to $22,499 | 55 (1.2%) | 100 (2.2%) |
| $22,500 to $24,999 | 96 (2.0%) | 78 (1.7%) |
| $25,000 to $29,999 | 91 (1.9%) | 178 (3.8%) |
| $30,000 to $34,999 | 152 (3.2%) | 322 (7.0%) |
| $35,000 to $39,999 | 179 (3.8%) | 204 (4.4%) |
| $40,000 to $44,999 | 450 (9.5%) | 272 (5.9%) |
| $45,000 to $49,999 | 383 (8.1%) | 329 (7.1%) |
| $50,000 to $54,999 | 237 (5.0%) | 330 (7.1%) |
| $55,000 to $64,999 | 355 (7.5%) | 344 (7.4%) |
| $65,000 to $74,999 | 339 (7.2%) | 251 (5.4%) |
| $75,000 to $99,999 | 686 (14.5%) | 504 (10.9%) |
| $100,000+ | 934 (19.8%) | 499 (10.8%) |
| Total | 4,721 (100.0%) | 4,634 (100.0%) |
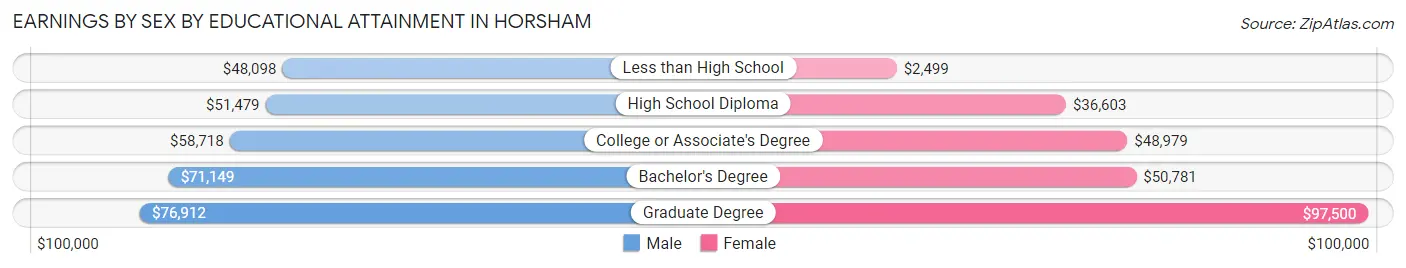
Earnings by Sex by Educational Attainment in Horsham
Average earnings in Horsham are $58,580 for men and $48,415 for women, a difference of 17.3%. Men with an educational attainment of graduate degree enjoy the highest average annual earnings of $76,912, while those with less than high school education earn the least with $48,098. Women with an educational attainment of graduate degree earn the most with the average annual earnings of $97,500, while those with less than high school education have the smallest earnings of $2,499.
| Educational Attainment | Male Income | Female Income |
| Less than High School | $48,098 | $2,499 |
| High School Diploma | $51,479 | $36,603 |
| College or Associate's Degree | $58,718 | $48,979 |
| Bachelor's Degree | $71,149 | $50,781 |
| Graduate Degree | $76,912 | $97,500 |
| Total | $58,580 | $48,415 |
Family Income in Horsham
Family Income Brackets in Horsham
According to the Horsham family income data, there are 902 families falling into the $100,000 to $149,999 income range, which is the most common income bracket and makes up 22.8% of all families. Conversely, the less than $10,000 income bracket is the least frequent group with only 8 families (0.2%) belonging to this category.
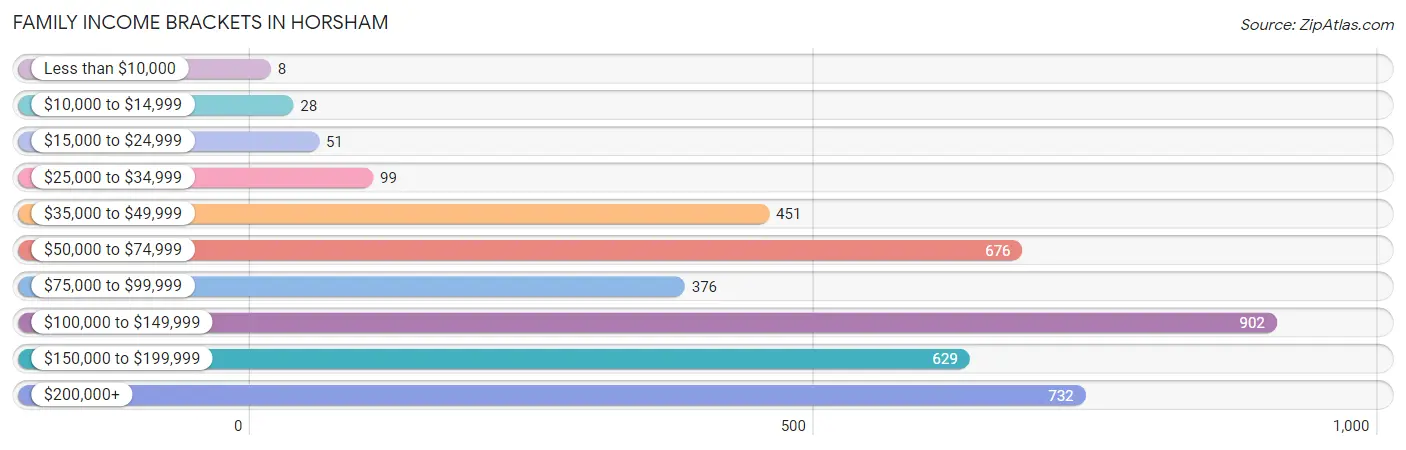
| Income Bracket | # Families | % Families |
| Less than $10,000 | 8 | 0.2% |
| $10,000 to $14,999 | 28 | 0.7% |
| $15,000 to $24,999 | 51 | 1.3% |
| $25,000 to $34,999 | 99 | 2.5% |
| $35,000 to $49,999 | 451 | 11.4% |
| $50,000 to $74,999 | 676 | 17.1% |
| $75,000 to $99,999 | 376 | 9.5% |
| $100,000 to $149,999 | 902 | 22.8% |
| $150,000 to $199,999 | 629 | 15.9% |
| $200,000+ | 732 | 18.5% |
Family Income by Famaliy Size in Horsham
5-person families (224 | 5.7%) account for the highest median family income in Horsham with $176,429 per family, while 2-person families (1,679 | 42.4%) have the highest median income of $50,098 per family member.
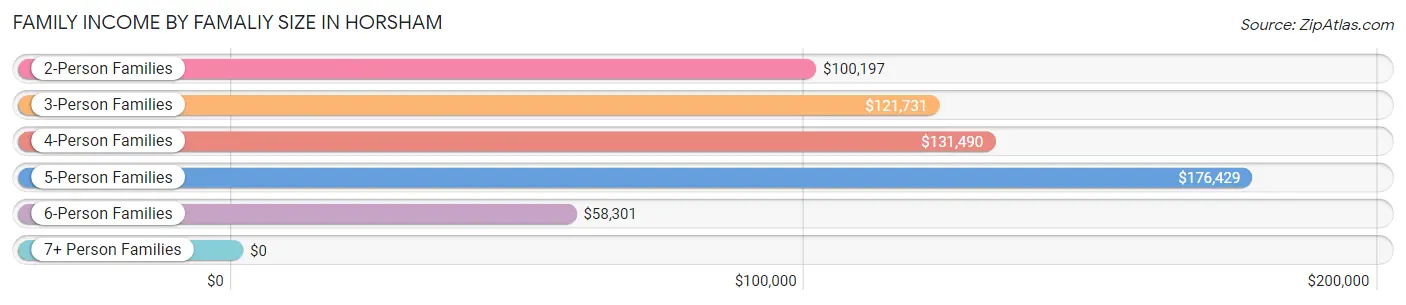
| Income Bracket | # Families | Median Income |
| 2-Person Families | 1,679 (42.4%) | $100,197 |
| 3-Person Families | 740 (18.7%) | $121,731 |
| 4-Person Families | 927 (23.4%) | $131,490 |
| 5-Person Families | 224 (5.7%) | $176,429 |
| 6-Person Families | 237 (6.0%) | $58,301 |
| 7+ Person Families | 149 (3.8%) | $0 |
| Total | 3,956 (100.0%) | $119,883 |
Family Income by Number of Earners in Horsham
The median family income in Horsham is $119,883, with families comprising 3+ earners (730) having the highest median family income of $179,348, while families with no earners (249) have the lowest median family income of $70,160, accounting for 18.4% and 6.3% of families, respectively.
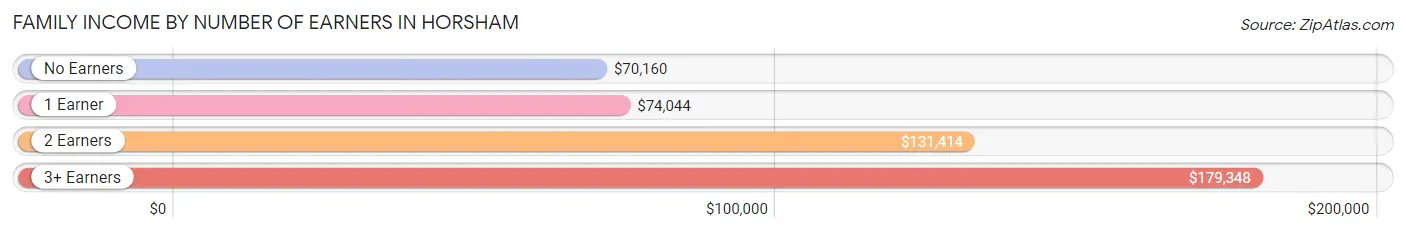
| Number of Earners | # Families | Median Income |
| No Earners | 249 (6.3%) | $70,160 |
| 1 Earner | 1,248 (31.6%) | $74,044 |
| 2 Earners | 1,729 (43.7%) | $131,414 |
| 3+ Earners | 730 (18.4%) | $179,348 |
| Total | 3,956 (100.0%) | $119,883 |
Household Income in Horsham
Household Income Brackets in Horsham
With 1,078 households falling in the category, the $100,000 to $149,999 income range is the most frequent in Horsham, accounting for 19.0% of all households. In contrast, only 51 households (0.9%) fall into the less than $10,000 income bracket, making it the least populous group.
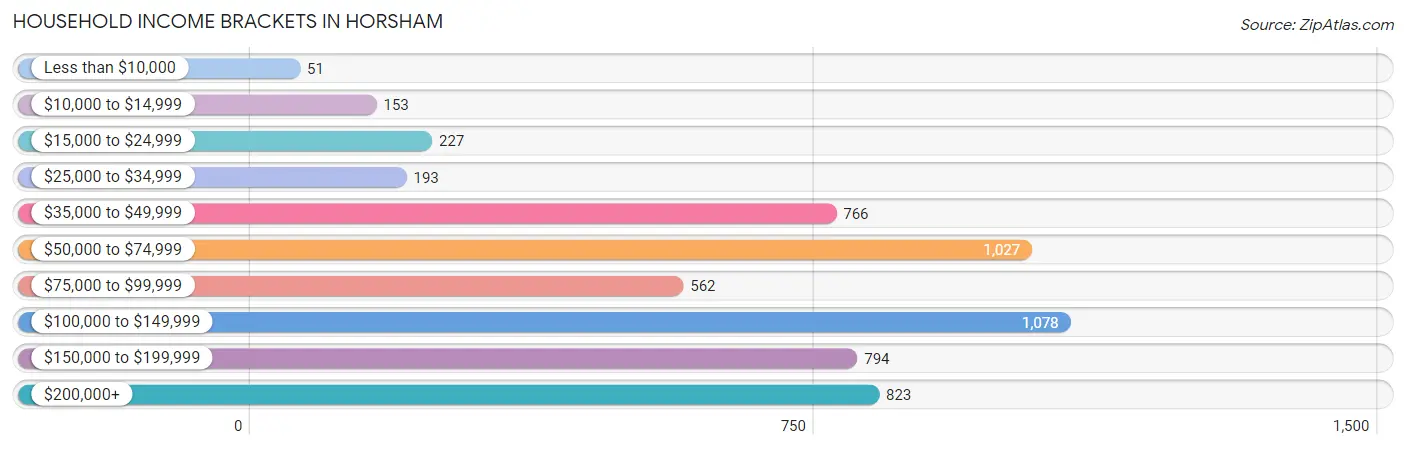
| Income Bracket | # Households | % Households |
| Less than $10,000 | 51 | 0.9% |
| $10,000 to $14,999 | 153 | 2.7% |
| $15,000 to $24,999 | 227 | 4.0% |
| $25,000 to $34,999 | 193 | 3.4% |
| $35,000 to $49,999 | 766 | 13.5% |
| $50,000 to $74,999 | 1,027 | 18.1% |
| $75,000 to $99,999 | 562 | 9.9% |
| $100,000 to $149,999 | 1,078 | 19.0% |
| $150,000 to $199,999 | 794 | 14.0% |
| $200,000+ | 823 | 14.5% |
Household Income by Householder Age in Horsham
The median household income in Horsham is $96,284, with the highest median household income of $182,943 found in the 15 to 24 years age bracket for the primary householder. A total of 158 households (2.8%) fall into this category. Meanwhile, the 65+ years age bracket for the primary householder has the lowest median household income of $71,898, with 1,409 households (24.8%) in this group.
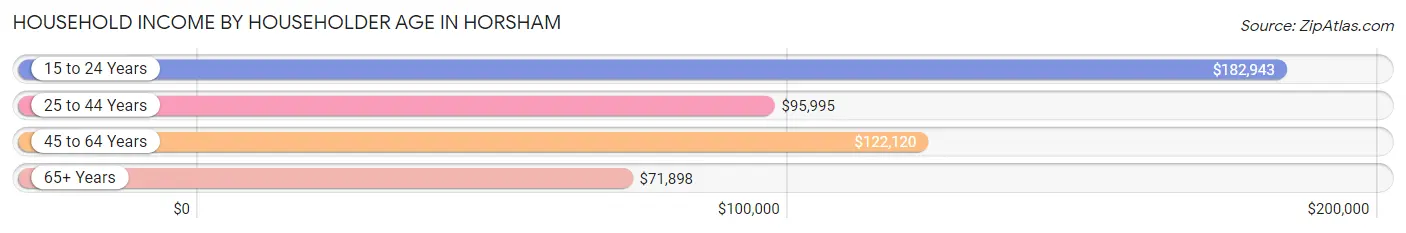
| Income Bracket | # Households | Median Income |
| 15 to 24 Years | 158 (2.8%) | $182,943 |
| 25 to 44 Years | 2,132 (37.6%) | $95,995 |
| 45 to 64 Years | 1,975 (34.8%) | $122,120 |
| 65+ Years | 1,409 (24.8%) | $71,898 |
| Total | 5,674 (100.0%) | $96,284 |
Poverty in Horsham
Income Below Poverty by Sex and Age in Horsham
With 4.2% poverty level for males and 4.7% for females among the residents of Horsham, 5 year old males and 12 to 14 year old females are the most vulnerable to poverty, with 66 males (85.7%) and 75 females (22.1%) in their respective age groups living below the poverty level.
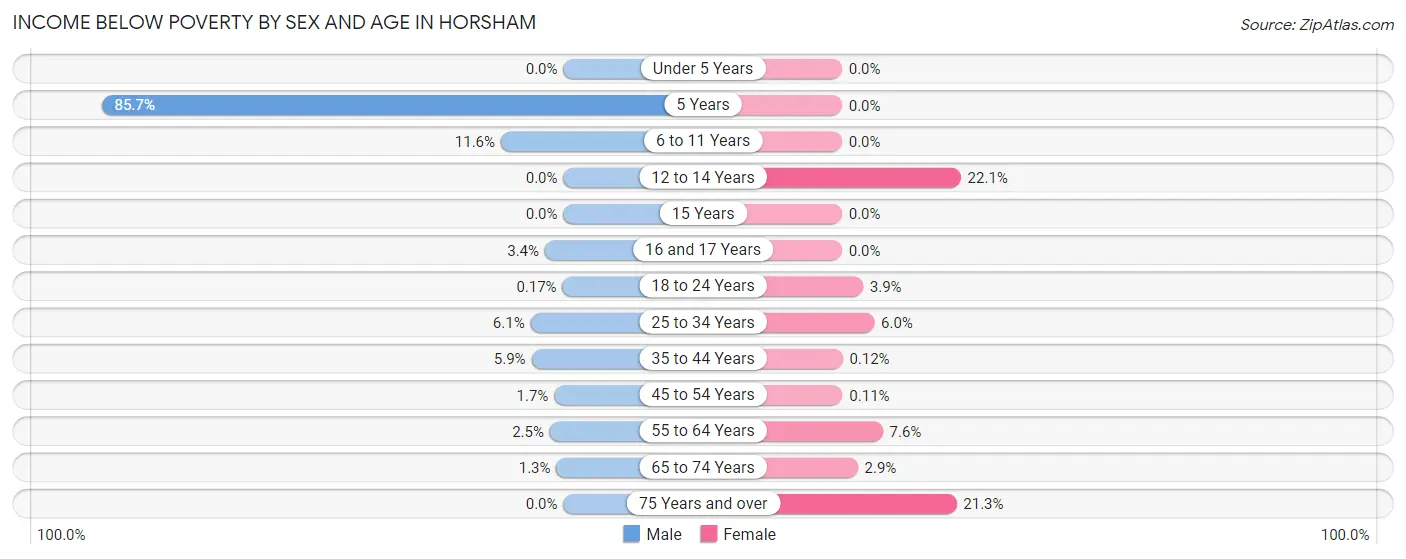
| Age Bracket | Male | Female |
| Under 5 Years | 0 (0.0%) | 0 (0.0%) |
| 5 Years | 66 (85.7%) | 0 (0.0%) |
| 6 to 11 Years | 66 (11.6%) | 0 (0.0%) |
| 12 to 14 Years | 0 (0.0%) | 75 (22.1%) |
| 15 Years | 0 (0.0%) | 0 (0.0%) |
| 16 and 17 Years | 8 (3.4%) | 0 (0.0%) |
| 18 to 24 Years | 1 (0.2%) | 28 (3.9%) |
| 25 to 34 Years | 67 (6.1%) | 84 (6.0%) |
| 35 to 44 Years | 69 (5.9%) | 1 (0.1%) |
| 45 to 54 Years | 9 (1.7%) | 1 (0.1%) |
| 55 to 64 Years | 27 (2.5%) | 75 (7.6%) |
| 65 to 74 Years | 12 (1.3%) | 23 (2.9%) |
| 75 Years and over | 0 (0.0%) | 74 (21.3%) |
| Total | 325 (4.2%) | 361 (4.7%) |
Income Above Poverty by Sex and Age in Horsham
According to the poverty statistics in Horsham, males aged under 5 years and females aged under 5 years are the age groups that are most secure financially, with 100.0% of males and 100.0% of females in these age groups living above the poverty line.
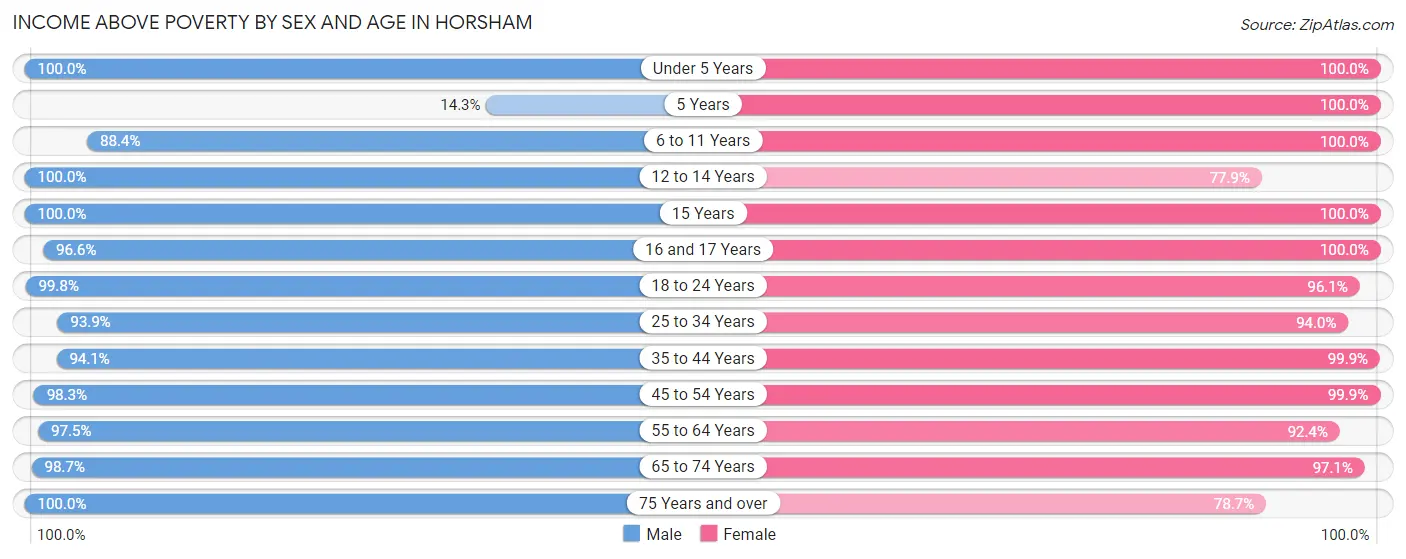
| Age Bracket | Male | Female |
| Under 5 Years | 410 (100.0%) | 320 (100.0%) |
| 5 Years | 11 (14.3%) | 89 (100.0%) |
| 6 to 11 Years | 503 (88.4%) | 606 (100.0%) |
| 12 to 14 Years | 750 (100.0%) | 265 (77.9%) |
| 15 Years | 49 (100.0%) | 221 (100.0%) |
| 16 and 17 Years | 225 (96.6%) | 237 (100.0%) |
| 18 to 24 Years | 578 (99.8%) | 688 (96.1%) |
| 25 to 34 Years | 1,031 (93.9%) | 1,317 (94.0%) |
| 35 to 44 Years | 1,097 (94.1%) | 799 (99.9%) |
| 45 to 54 Years | 519 (98.3%) | 898 (99.9%) |
| 55 to 64 Years | 1,048 (97.5%) | 915 (92.4%) |
| 65 to 74 Years | 914 (98.7%) | 760 (97.1%) |
| 75 Years and over | 323 (100.0%) | 274 (78.7%) |
| Total | 7,458 (95.8%) | 7,389 (95.3%) |
Income Below Poverty Among Married-Couple Families in Horsham
The poverty statistics for married-couple families in Horsham show that 2.7% or 77 of the total 2,872 families live below the poverty line. Families with 3 or 4 children have the highest poverty rate of 22.4%, comprising of 68 families. On the other hand, families with 1 or 2 children have the lowest poverty rate of 0.0%, which includes 0 families.
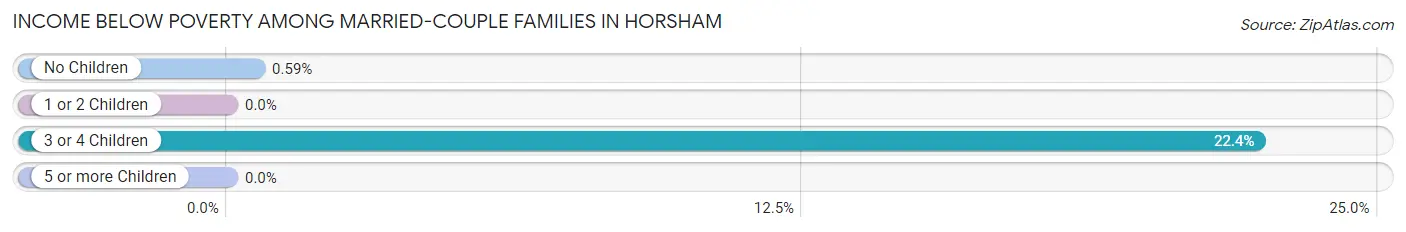
| Children | Above Poverty | Below Poverty |
| No Children | 1,514 (99.4%) | 9 (0.6%) |
| 1 or 2 Children | 1,045 (100.0%) | 0 (0.0%) |
| 3 or 4 Children | 236 (77.6%) | 68 (22.4%) |
| 5 or more Children | 0 (0.0%) | 0 (0.0%) |
| Total | 2,795 (97.3%) | 77 (2.7%) |
Income Below Poverty Among Single-Parent Households in Horsham
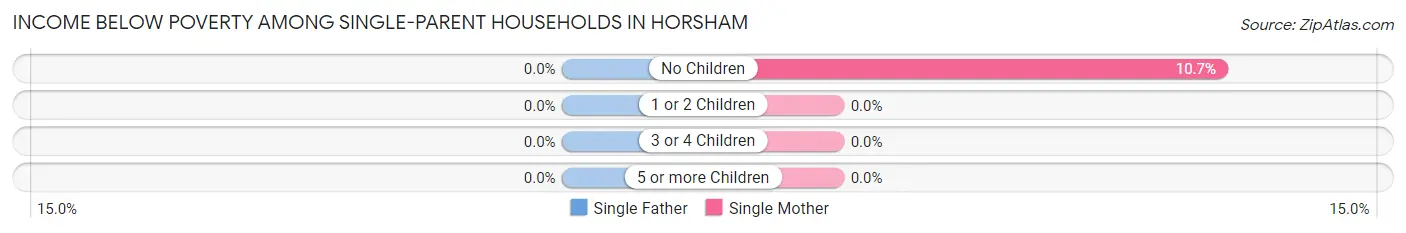
| Children | Single Father | Single Mother |
| No Children | 0 (0.0%) | 28 (10.7%) |
| 1 or 2 Children | 0 (0.0%) | 0 (0.0%) |
| 3 or 4 Children | 0 (0.0%) | 0 (0.0%) |
| 5 or more Children | 0 (0.0%) | 0 (0.0%) |
| Total | 0 (0.0%) | 28 (4.3%) |
Income Below Poverty Among Married-Couple vs Single-Parent Households in Horsham
The poverty data for Horsham shows that 77 of the married-couple family households (2.7%) and 28 of the single-parent households (2.6%) are living below the poverty level. Within the married-couple family households, those with 3 or 4 children have the highest poverty rate, with 68 households (22.4%) falling below the poverty line. Among the single-parent households, those with no children have the highest poverty rate, with 28 household (7.3%) living below poverty.
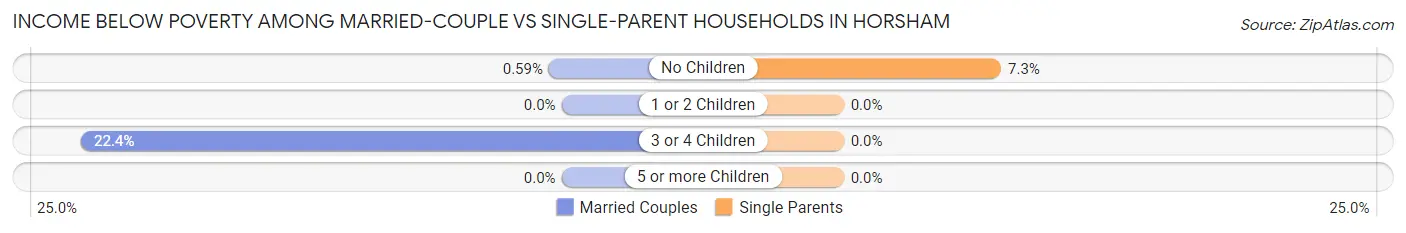
| Children | Married-Couple Families | Single-Parent Households |
| No Children | 9 (0.6%) | 28 (7.3%) |
| 1 or 2 Children | 0 (0.0%) | 0 (0.0%) |
| 3 or 4 Children | 68 (22.4%) | 0 (0.0%) |
| 5 or more Children | 0 (0.0%) | 0 (0.0%) |
| Total | 77 (2.7%) | 28 (2.6%) |
Race in Horsham
The most populous races in Horsham are White / Caucasian (12,423 | 79.2%), Hispanic or Latino (1,918 | 12.2%), and Asian (1,466 | 9.3%).
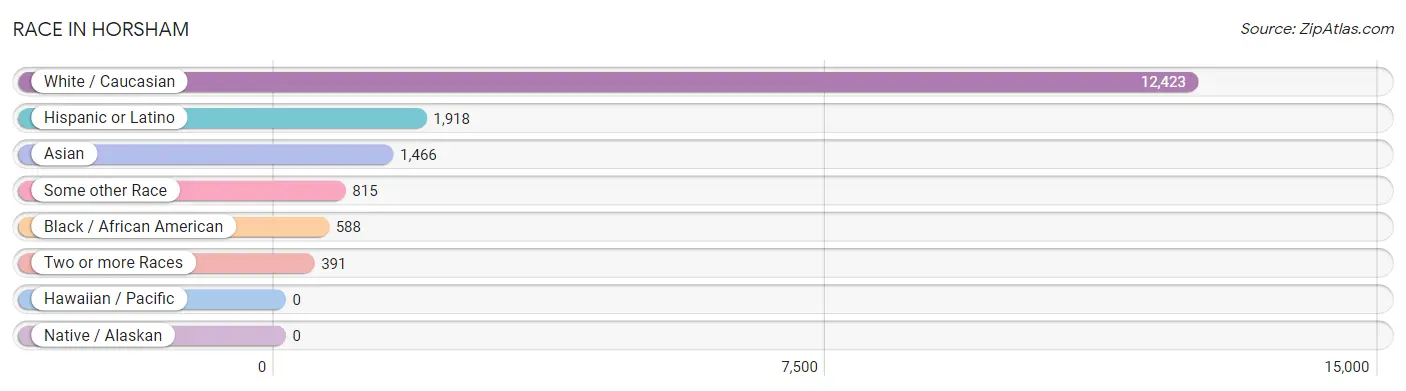
| Race | # Population | % Population |
| Asian | 1,466 | 9.3% |
| Black / African American | 588 | 3.7% |
| Hawaiian / Pacific | 0 | 0.0% |
| Hispanic or Latino | 1,918 | 12.2% |
| Native / Alaskan | 0 | 0.0% |
| White / Caucasian | 12,423 | 79.2% |
| Two or more Races | 391 | 2.5% |
| Some other Race | 815 | 5.2% |
| Total | 15,683 | 100.0% |
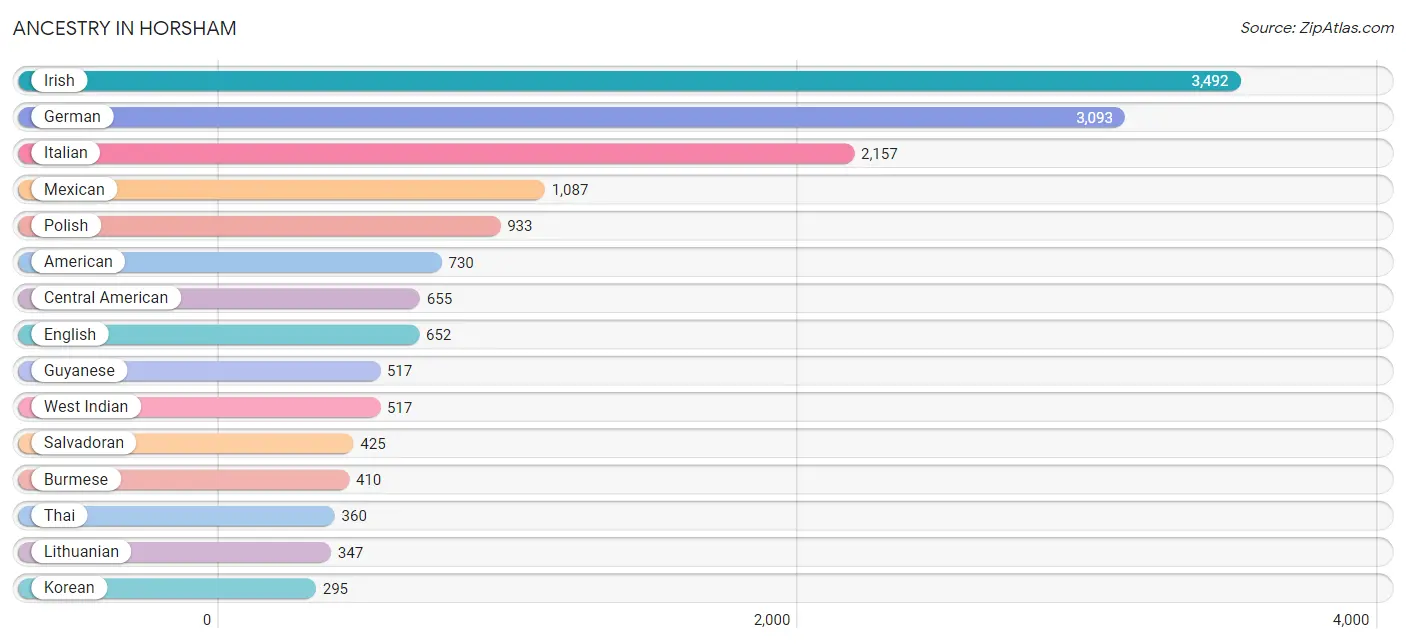
Ancestry in Horsham
The most populous ancestries reported in Horsham are Irish (3,492 | 22.3%), German (3,093 | 19.7%), Italian (2,157 | 13.8%), Mexican (1,087 | 6.9%), and Polish (933 | 5.9%), together accounting for 68.6% of all Horsham residents.
| Ancestry | # Population | % Population |
| African | 31 | 0.2% |
| American | 730 | 4.6% |
| Arab | 57 | 0.4% |
| Armenian | 10 | 0.1% |
| Austrian | 68 | 0.4% |
| British | 17 | 0.1% |
| Burmese | 410 | 2.6% |
| Canadian | 10 | 0.1% |
| Central American | 655 | 4.2% |
| Cherokee | 4 | 0.0% |
| Czech | 74 | 0.5% |
| Danish | 61 | 0.4% |
| Dutch | 80 | 0.5% |
| Eastern European | 61 | 0.4% |
| English | 652 | 4.2% |
| European | 99 | 0.6% |
| Finnish | 7 | 0.0% |
| French | 107 | 0.7% |
| French Canadian | 22 | 0.1% |
| German | 3,093 | 19.7% |
| Greek | 5 | 0.0% |
| Guatemalan | 230 | 1.5% |
| Guyanese | 517 | 3.3% |
| Haitian | 15 | 0.1% |
| Indian (Asian) | 139 | 0.9% |
| Irish | 3,492 | 22.3% |
| Italian | 2,157 | 13.8% |
| Jamaican | 57 | 0.4% |
| Korean | 295 | 1.9% |
| Lebanese | 5 | 0.0% |
| Lithuanian | 347 | 2.2% |
| Malaysian | 37 | 0.2% |
| Mexican | 1,087 | 6.9% |
| Northern European | 47 | 0.3% |
| Norwegian | 58 | 0.4% |
| Pennsylvania German | 125 | 0.8% |
| Peruvian | 5 | 0.0% |
| Polish | 933 | 5.9% |
| Portuguese | 48 | 0.3% |
| Puerto Rican | 109 | 0.7% |
| Romanian | 24 | 0.2% |
| Russian | 221 | 1.4% |
| Salvadoran | 425 | 2.7% |
| Scotch-Irish | 95 | 0.6% |
| Scottish | 117 | 0.7% |
| Slovak | 73 | 0.5% |
| South American | 23 | 0.2% |
| Spaniard | 23 | 0.2% |
| Sri Lankan | 15 | 0.1% |
| Subsaharan African | 31 | 0.2% |
| Swedish | 27 | 0.2% |
| Swiss | 85 | 0.5% |
| Thai | 360 | 2.3% |
| Turkish | 125 | 0.8% |
| Ukrainian | 226 | 1.4% |
| Venezuelan | 18 | 0.1% |
| Welsh | 26 | 0.2% |
| West Indian | 517 | 3.3% | View All 58 Rows |
Immigrants in Horsham
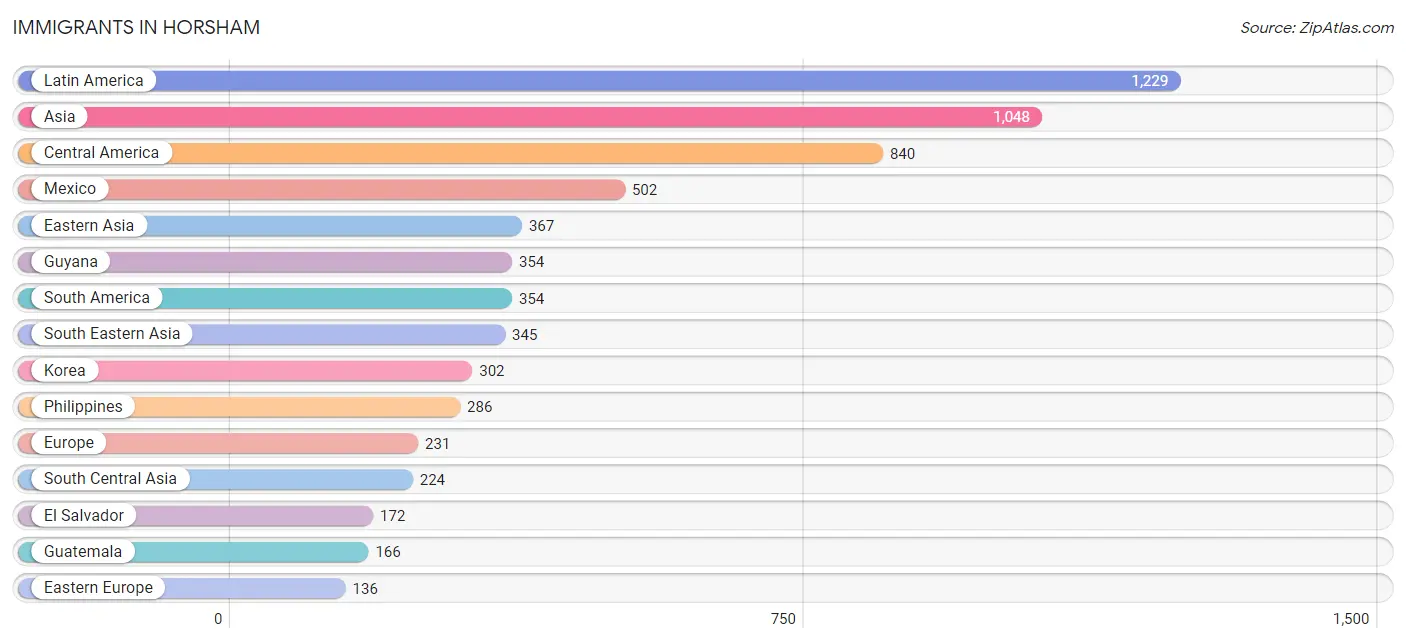
The most numerous immigrant groups reported in Horsham came from Latin America (1,229 | 7.8%), Asia (1,048 | 6.7%), Central America (840 | 5.4%), Mexico (502 | 3.2%), and Eastern Asia (367 | 2.3%), together accounting for 25.4% of all Horsham residents.
| Immigration Origin | # Population | % Population |
| Asia | 1,048 | 6.7% |
| Canada | 10 | 0.1% |
| Caribbean | 35 | 0.2% |
| Central America | 840 | 5.4% |
| China | 65 | 0.4% |
| Dominican Republic | 5 | 0.0% |
| Eastern Asia | 367 | 2.3% |
| Eastern Europe | 136 | 0.9% |
| El Salvador | 172 | 1.1% |
| Europe | 231 | 1.5% |
| Guatemala | 166 | 1.1% |
| Guyana | 354 | 2.3% |
| Haiti | 15 | 0.1% |
| Hong Kong | 18 | 0.1% |
| India | 112 | 0.7% |
| Iraq | 24 | 0.2% |
| Ireland | 23 | 0.2% |
| Italy | 10 | 0.1% |
| Korea | 302 | 1.9% |
| Laos | 37 | 0.2% |
| Latin America | 1,229 | 7.8% |
| Lebanon | 5 | 0.0% |
| Mexico | 502 | 3.2% |
| Moldova | 7 | 0.0% |
| Northern Europe | 49 | 0.3% |
| Philippines | 286 | 1.8% |
| Poland | 27 | 0.2% |
| Portugal | 26 | 0.2% |
| Russia | 7 | 0.0% |
| Scotland | 4 | 0.0% |
| South America | 354 | 2.3% |
| South Central Asia | 224 | 1.4% |
| South Eastern Asia | 345 | 2.2% |
| Southern Europe | 46 | 0.3% |
| Spain | 10 | 0.1% |
| Turkey | 83 | 0.5% |
| Ukraine | 77 | 0.5% |
| Vietnam | 22 | 0.1% |
| Western Asia | 112 | 0.7% | View All 39 Rows |
Sex and Age in Horsham
Sex and Age in Horsham
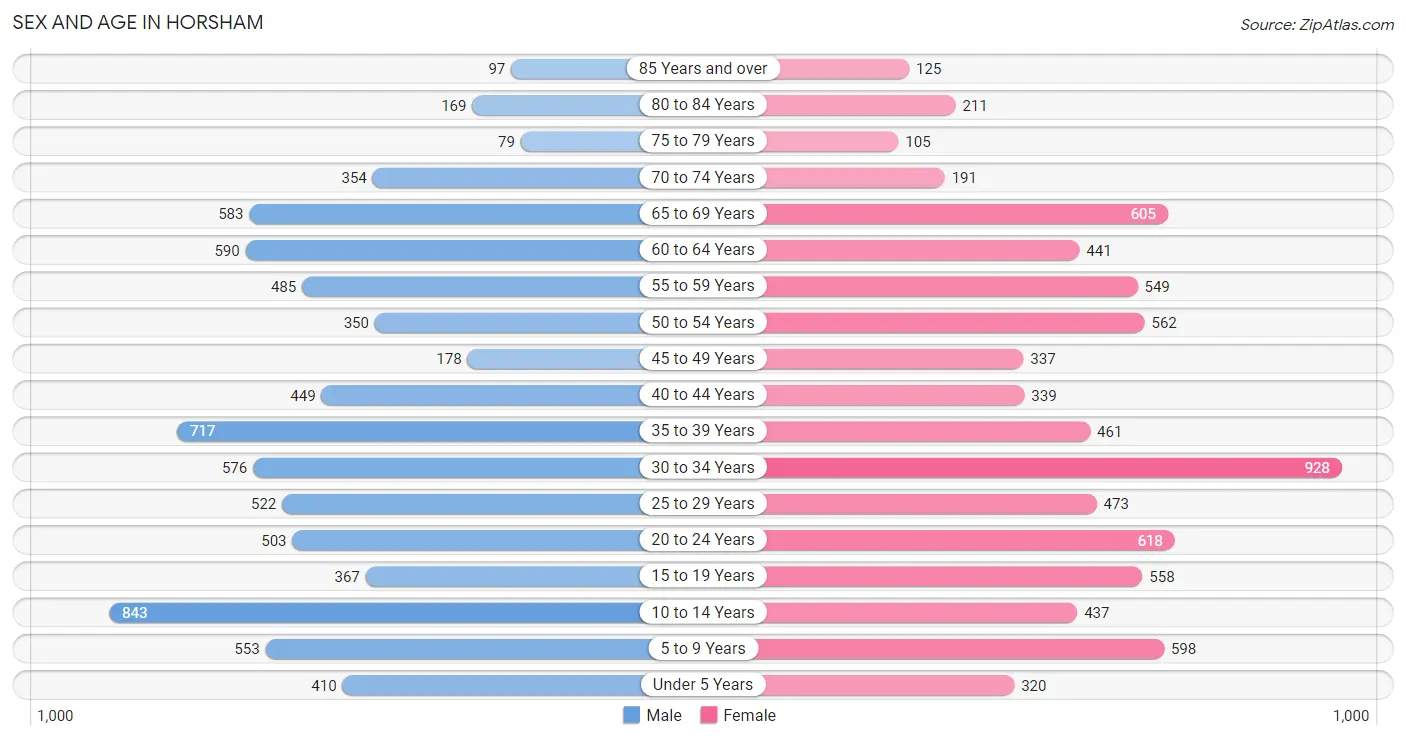
The most populous age groups in Horsham are 10 to 14 Years (843 | 10.8%) for men and 30 to 34 Years (928 | 11.8%) for women.
| Age Bracket | Male | Female |
| Under 5 Years | 410 (5.2%) | 320 (4.1%) |
| 5 to 9 Years | 553 (7.1%) | 598 (7.6%) |
| 10 to 14 Years | 843 (10.8%) | 437 (5.6%) |
| 15 to 19 Years | 367 (4.7%) | 558 (7.1%) |
| 20 to 24 Years | 503 (6.4%) | 618 (7.9%) |
| 25 to 29 Years | 522 (6.7%) | 473 (6.0%) |
| 30 to 34 Years | 576 (7.4%) | 928 (11.8%) |
| 35 to 39 Years | 717 (9.2%) | 461 (5.9%) |
| 40 to 44 Years | 449 (5.7%) | 339 (4.3%) |
| 45 to 49 Years | 178 (2.3%) | 337 (4.3%) |
| 50 to 54 Years | 350 (4.5%) | 562 (7.1%) |
| 55 to 59 Years | 485 (6.2%) | 549 (7.0%) |
| 60 to 64 Years | 590 (7.5%) | 441 (5.6%) |
| 65 to 69 Years | 583 (7.4%) | 605 (7.7%) |
| 70 to 74 Years | 354 (4.5%) | 191 (2.4%) |
| 75 to 79 Years | 79 (1.0%) | 105 (1.3%) |
| 80 to 84 Years | 169 (2.2%) | 211 (2.7%) |
| 85 Years and over | 97 (1.2%) | 125 (1.6%) |
| Total | 7,825 (100.0%) | 7,858 (100.0%) |
Families and Households in Horsham
Median Family Size in Horsham
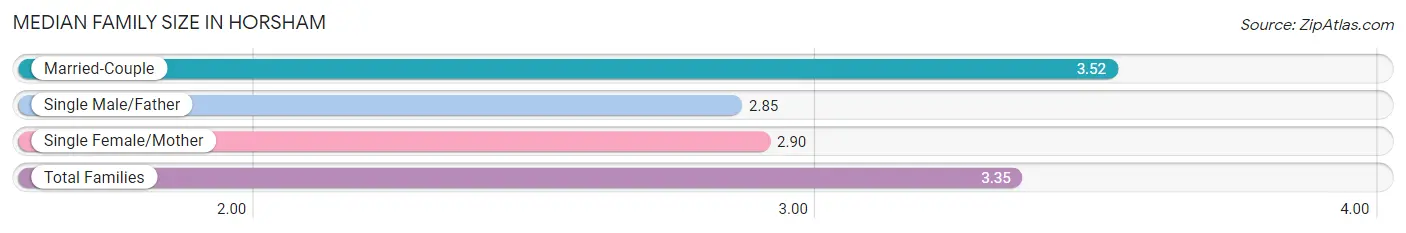
The median family size in Horsham is 3.35 persons per family, with married-couple families (2,872 | 72.6%) accounting for the largest median family size of 3.52 persons per family. On the other hand, single male/father families (426 | 10.8%) represent the smallest median family size with 2.85 persons per family.
| Family Type | # Families | Family Size |
| Married-Couple | 2,872 (72.6%) | 3.52 |
| Single Male/Father | 426 (10.8%) | 2.85 |
| Single Female/Mother | 658 (16.6%) | 2.90 |
| Total Families | 3,956 (100.0%) | 3.35 |
Median Household Size in Horsham
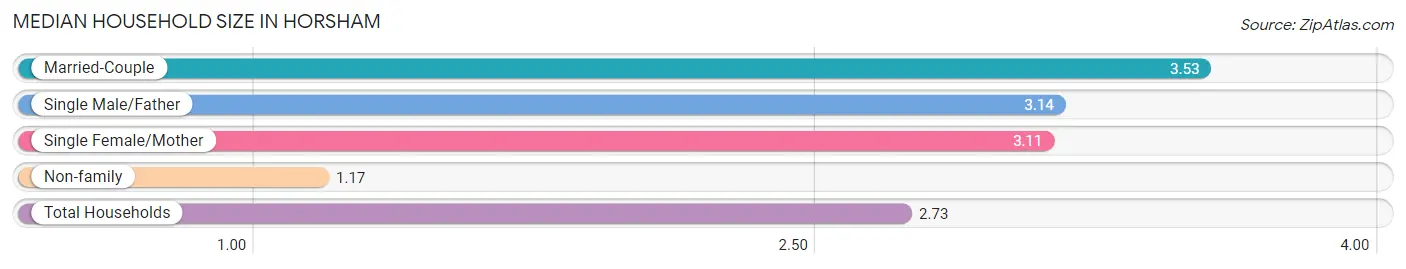
The median household size in Horsham is 2.73 persons per household, with married-couple households (2,872 | 50.6%) accounting for the largest median household size of 3.53 persons per household. non-family households (1,718 | 30.3%) represent the smallest median household size with 1.17 persons per household.
| Household Type | # Households | Household Size |
| Married-Couple | 2,872 (50.6%) | 3.53 |
| Single Male/Father | 426 (7.5%) | 3.14 |
| Single Female/Mother | 658 (11.6%) | 3.11 |
| Non-family | 1,718 (30.3%) | 1.17 |
| Total Households | 5,674 (100.0%) | 2.73 |
Household Size by Marriage Status in Horsham
Out of a total of 5,674 households in Horsham, 3,956 (69.7%) are family households, while 1,718 (30.3%) are nonfamily households. The most numerous type of family households are 2-person households, comprising 1,543, and the most common type of nonfamily households are 1-person households, comprising 1,452.
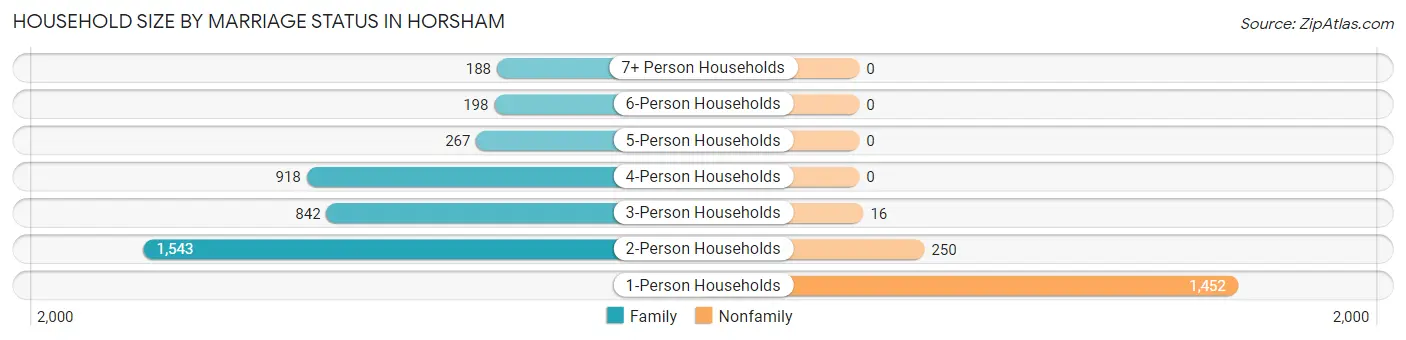
| Household Size | Family Households | Nonfamily Households |
| 1-Person Households | - | 1,452 (25.6%) |
| 2-Person Households | 1,543 (27.2%) | 250 (4.4%) |
| 3-Person Households | 842 (14.8%) | 16 (0.3%) |
| 4-Person Households | 918 (16.2%) | 0 (0.0%) |
| 5-Person Households | 267 (4.7%) | 0 (0.0%) |
| 6-Person Households | 198 (3.5%) | 0 (0.0%) |
| 7+ Person Households | 188 (3.3%) | 0 (0.0%) |
| Total | 3,956 (69.7%) | 1,718 (30.3%) |
Female Fertility in Horsham
Fertility by Age in Horsham
Average fertility rate in Horsham is 20.0 births per 1,000 women. Women in the age bracket of 20 to 34 years have the highest fertility rate with 34.0 births per 1,000 women. Women in the age bracket of 20 to 34 years acount for 90.7% of all women with births.
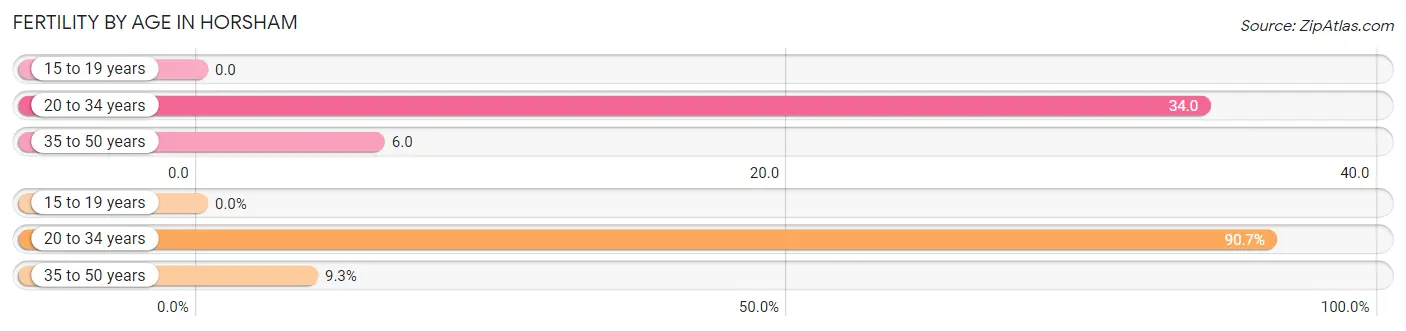
| Age Bracket | Women with Births | Births / 1,000 Women |
| 15 to 19 years | 0 (0.0%) | 0.0 |
| 20 to 34 years | 68 (90.7%) | 34.0 |
| 35 to 50 years | 7 (9.3%) | 6.0 |
| Total | 75 (100.0%) | 20.0 |
Fertility by Age by Marriage Status in Horsham
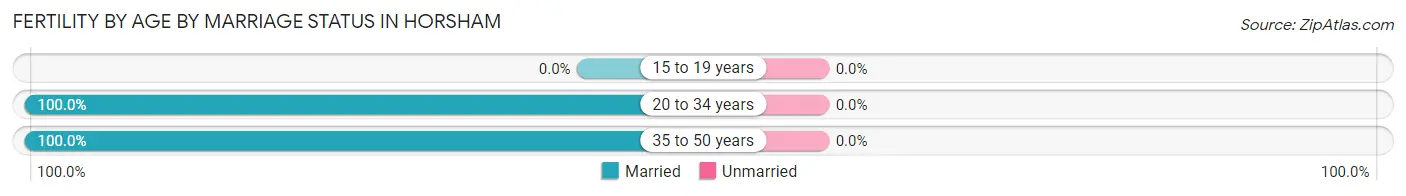
| Age Bracket | Married | Unmarried |
| 15 to 19 years | 0 (0.0%) | 0 (0.0%) |
| 20 to 34 years | 68 (100.0%) | 0 (0.0%) |
| 35 to 50 years | 7 (100.0%) | 0 (0.0%) |
| Total | 75 (100.0%) | 0 (0.0%) |
Fertility by Education in Horsham
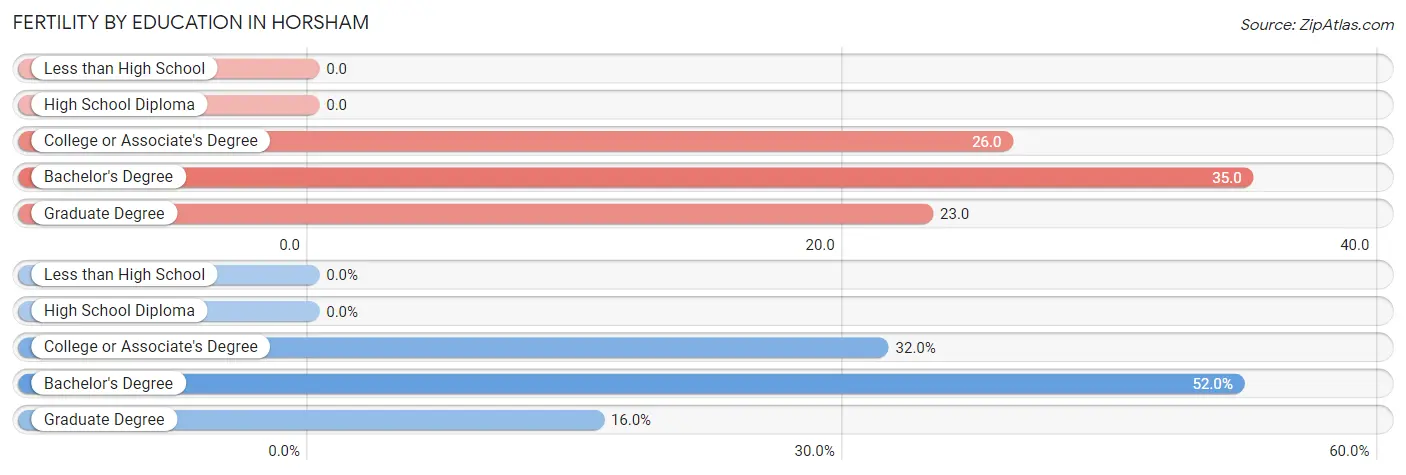
| Educational Attainment | Women with Births | Births / 1,000 Women |
| Less than High School | 0 (0.0%) | 0.0 |
| High School Diploma | 0 (0.0%) | 0.0 |
| College or Associate's Degree | 24 (32.0%) | 26.0 |
| Bachelor's Degree | 39 (52.0%) | 35.0 |
| Graduate Degree | 12 (16.0%) | 23.0 |
| Total | 75 (100.0%) | 20.0 |
Fertility by Education by Marriage Status in Horsham
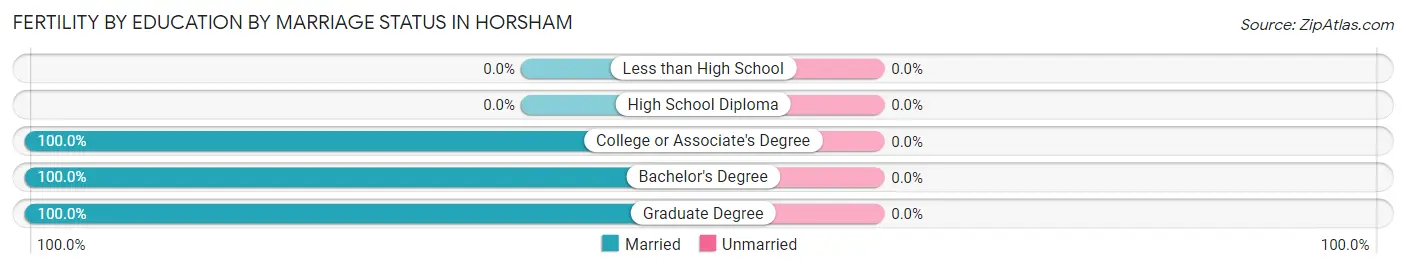
| Educational Attainment | Married | Unmarried |
| Less than High School | 0 (0.0%) | 0 (0.0%) |
| High School Diploma | 0 (0.0%) | 0 (0.0%) |
| College or Associate's Degree | 24 (100.0%) | 0 (0.0%) |
| Bachelor's Degree | 39 (100.0%) | 0 (0.0%) |
| Graduate Degree | 12 (100.0%) | 0 (0.0%) |
| Total | 75 (100.0%) | 0 (0.0%) |
Employment Characteristics in Horsham
Employment by Class of Employer in Horsham
Among the 8,836 employed individuals in Horsham, private company employees (6,784 | 76.8%), not-for-profit organizations (882 | 10.0%), and local government employees (376 | 4.3%) make up the most common classes of employment.
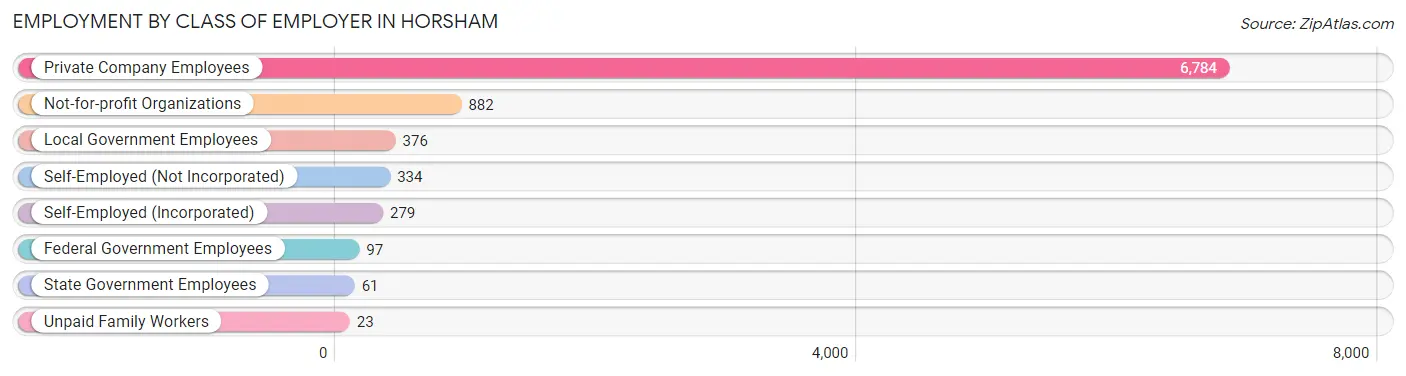
| Employer Class | # Employees | % Employees |
| Private Company Employees | 6,784 | 76.8% |
| Self-Employed (Incorporated) | 279 | 3.2% |
| Self-Employed (Not Incorporated) | 334 | 3.8% |
| Not-for-profit Organizations | 882 | 10.0% |
| Local Government Employees | 376 | 4.3% |
| State Government Employees | 61 | 0.7% |
| Federal Government Employees | 97 | 1.1% |
| Unpaid Family Workers | 23 | 0.3% |
| Total | 8,836 | 100.0% |
Employment Status by Age in Horsham
According to the labor force statistics for Horsham, out of the total population over 16 years of age (12,252), 74.7% or 9,152 individuals are in the labor force, with 2.9% or 265 of them unemployed. The age group with the highest labor force participation rate is 25 to 29 years, with 97.3% or 968 individuals in the labor force. Within the labor force, the 20 to 24 years age range has the highest percentage of unemployed individuals, with 9.4% or 88 of them being unemployed.
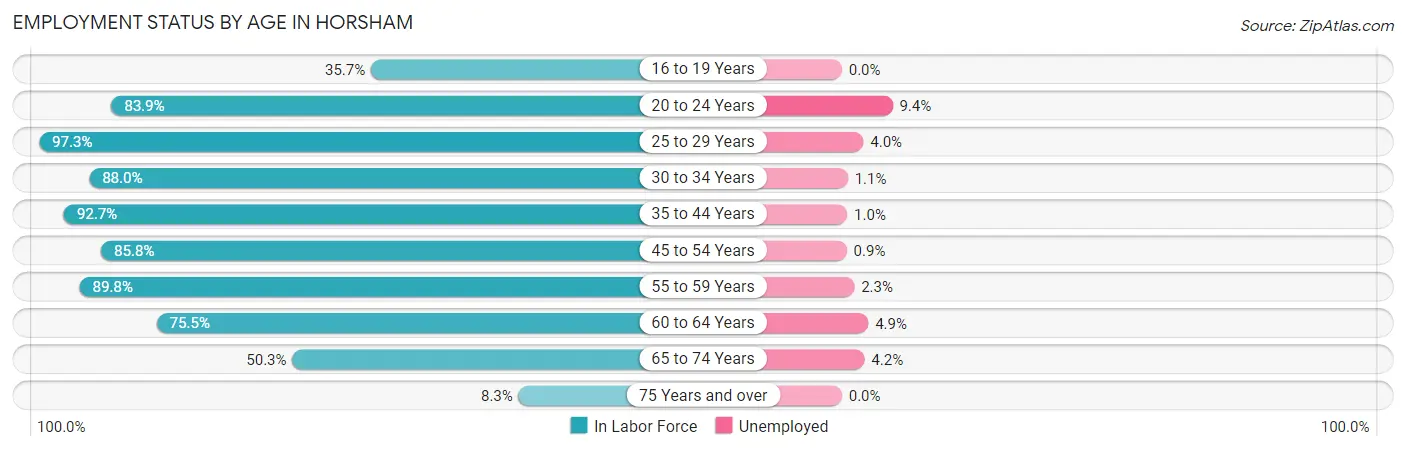
| Age Bracket | In Labor Force | Unemployed |
| 16 to 19 Years | 234 (35.7%) | 0 (0.0%) |
| 20 to 24 Years | 941 (83.9%) | 88 (9.4%) |
| 25 to 29 Years | 968 (97.3%) | 39 (4.0%) |
| 30 to 34 Years | 1,324 (88.0%) | 15 (1.1%) |
| 35 to 44 Years | 1,822 (92.7%) | 18 (1.0%) |
| 45 to 54 Years | 1,224 (85.8%) | 11 (0.9%) |
| 55 to 59 Years | 929 (89.8%) | 21 (2.3%) |
| 60 to 64 Years | 778 (75.5%) | 38 (4.9%) |
| 65 to 74 Years | 872 (50.3%) | 37 (4.2%) |
| 75 Years and over | 65 (8.3%) | 0 (0.0%) |
| Total | 9,152 (74.7%) | 265 (2.9%) |
Employment Status by Educational Attainment in Horsham
According to labor force statistics for Horsham, 88.5% of individuals (7,042) out of the total population between 25 and 64 years of age (7,957) are in the labor force, with 2.0% or 141 of them being unemployed. The group with the highest labor force participation rate are those with the educational attainment of less than high school, with 94.1% or 791 individuals in the labor force. Within the labor force, individuals with high school diploma education have the highest percentage of unemployment, with 5.6% or 81 of them being unemployed.
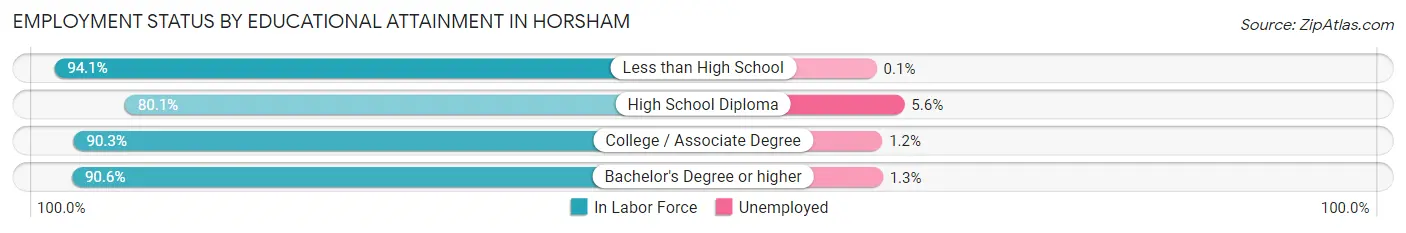
| Educational Attainment | In Labor Force | Unemployed |
| Less than High School | 791 (94.1%) | 1 (0.1%) |
| High School Diploma | 1,439 (80.1%) | 101 (5.6%) |
| College / Associate Degree | 1,513 (90.3%) | 20 (1.2%) |
| Bachelor's Degree or higher | 3,301 (90.6%) | 47 (1.3%) |
| Total | 7,042 (88.5%) | 159 (2.0%) |
Employment Occupations by Sex in Horsham
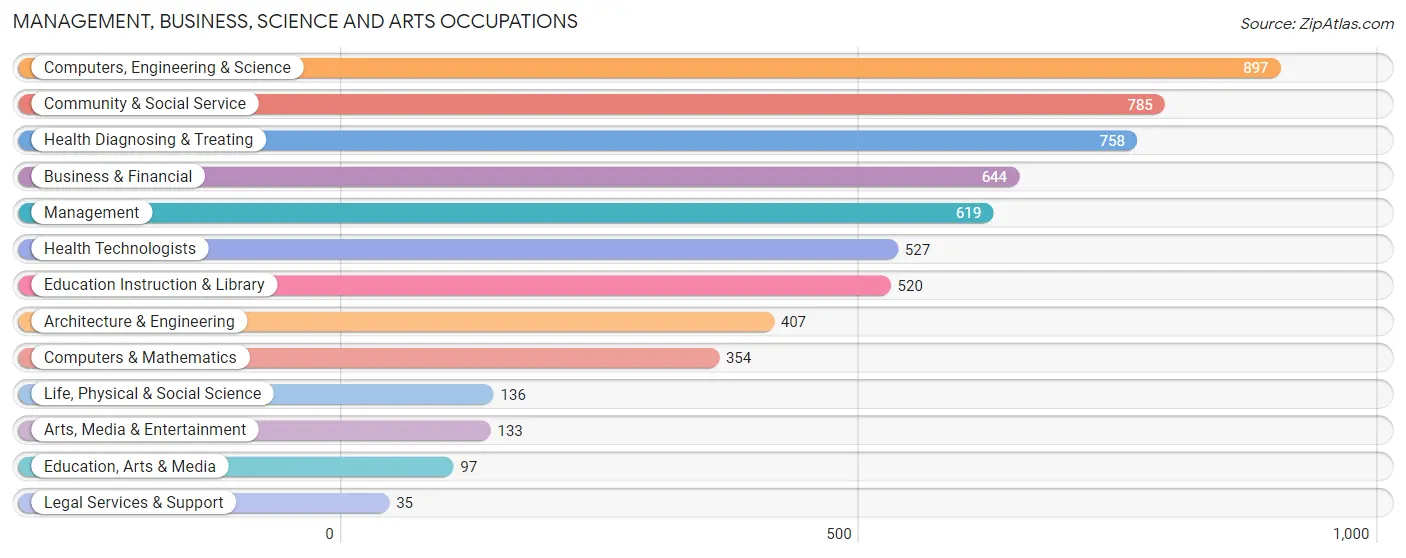
Management, Business, Science and Arts Occupations
The most common Management, Business, Science and Arts occupations in Horsham are Computers, Engineering & Science (897 | 10.1%), Community & Social Service (785 | 8.8%), Health Diagnosing & Treating (758 | 8.5%), Business & Financial (644 | 7.2%), and Management (619 | 7.0%).
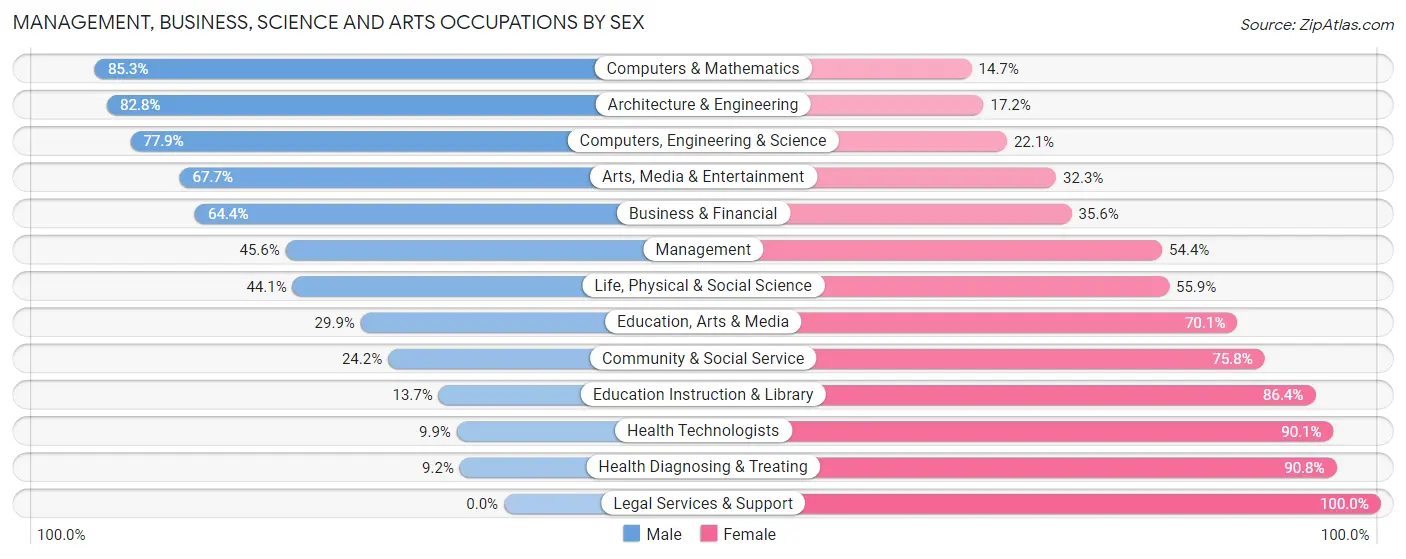
Management, Business, Science and Arts Occupations by Sex
Within the Management, Business, Science and Arts occupations in Horsham, the most male-oriented occupations are Computers & Mathematics (85.3%), Architecture & Engineering (82.8%), and Computers, Engineering & Science (77.9%), while the most female-oriented occupations are Legal Services & Support (100.0%), Health Diagnosing & Treating (90.8%), and Health Technologists (90.1%).
| Occupation | Male | Female |
| Management | 282 (45.6%) | 337 (54.4%) |
| Business & Financial | 415 (64.4%) | 229 (35.6%) |
| Computers, Engineering & Science | 699 (77.9%) | 198 (22.1%) |
| Computers & Mathematics | 302 (85.3%) | 52 (14.7%) |
| Architecture & Engineering | 337 (82.8%) | 70 (17.2%) |
| Life, Physical & Social Science | 60 (44.1%) | 76 (55.9%) |
| Community & Social Service | 190 (24.2%) | 595 (75.8%) |
| Education, Arts & Media | 29 (29.9%) | 68 (70.1%) |
| Legal Services & Support | 0 (0.0%) | 35 (100.0%) |
| Education Instruction & Library | 71 (13.7%) | 449 (86.4%) |
| Arts, Media & Entertainment | 90 (67.7%) | 43 (32.3%) |
| Health Diagnosing & Treating | 70 (9.2%) | 688 (90.8%) |
| Health Technologists | 52 (9.9%) | 475 (90.1%) |
| Total (Category) | 1,656 (44.7%) | 2,047 (55.3%) |
| Total (Overall) | 4,498 (50.6%) | 4,390 (49.4%) |
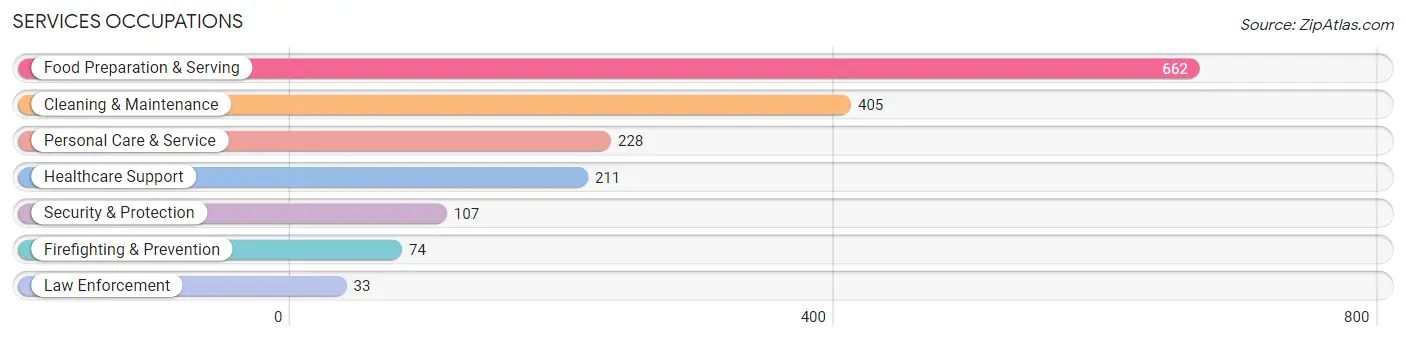
Services Occupations
The most common Services occupations in Horsham are Food Preparation & Serving (662 | 7.4%), Cleaning & Maintenance (405 | 4.6%), Personal Care & Service (228 | 2.6%), Healthcare Support (211 | 2.4%), and Security & Protection (107 | 1.2%).
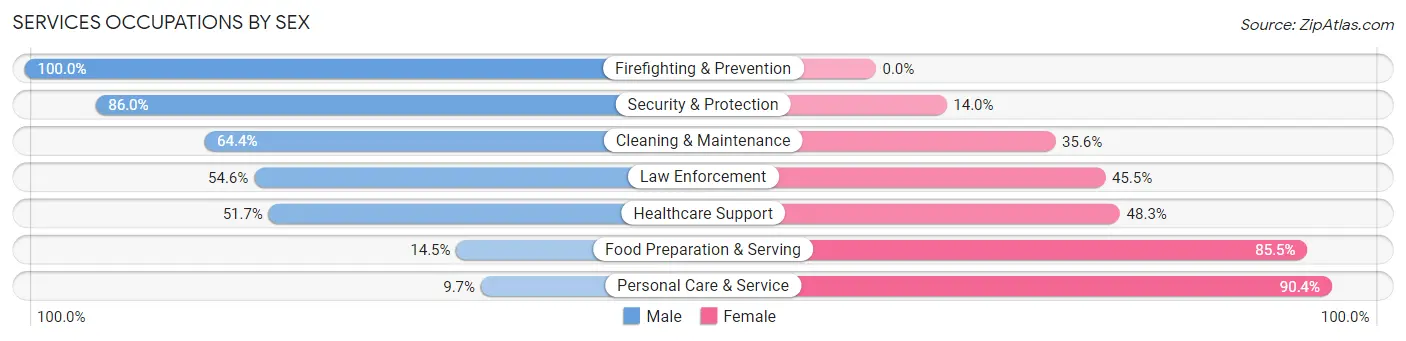
Services Occupations by Sex
Within the Services occupations in Horsham, the most male-oriented occupations are Firefighting & Prevention (100.0%), Security & Protection (86.0%), and Cleaning & Maintenance (64.4%), while the most female-oriented occupations are Personal Care & Service (90.3%), Food Preparation & Serving (85.5%), and Healthcare Support (48.3%).
| Occupation | Male | Female |
| Healthcare Support | 109 (51.7%) | 102 (48.3%) |
| Security & Protection | 92 (86.0%) | 15 (14.0%) |
| Firefighting & Prevention | 74 (100.0%) | 0 (0.0%) |
| Law Enforcement | 18 (54.5%) | 15 (45.5%) |
| Food Preparation & Serving | 96 (14.5%) | 566 (85.5%) |
| Cleaning & Maintenance | 261 (64.4%) | 144 (35.6%) |
| Personal Care & Service | 22 (9.7%) | 206 (90.3%) |
| Total (Category) | 580 (36.0%) | 1,033 (64.0%) |
| Total (Overall) | 4,498 (50.6%) | 4,390 (49.4%) |
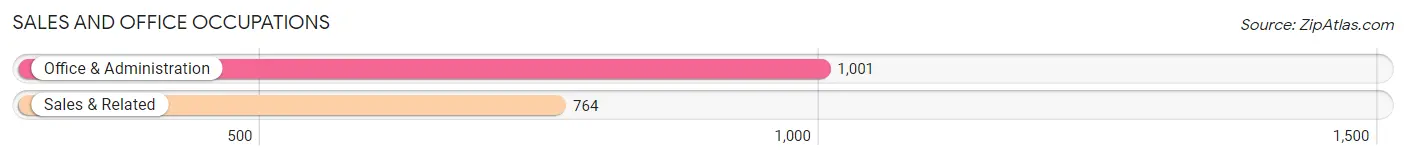
Sales and Office Occupations
The most common Sales and Office occupations in Horsham are Office & Administration (1,001 | 11.3%), and Sales & Related (764 | 8.6%).
Sales and Office Occupations by Sex
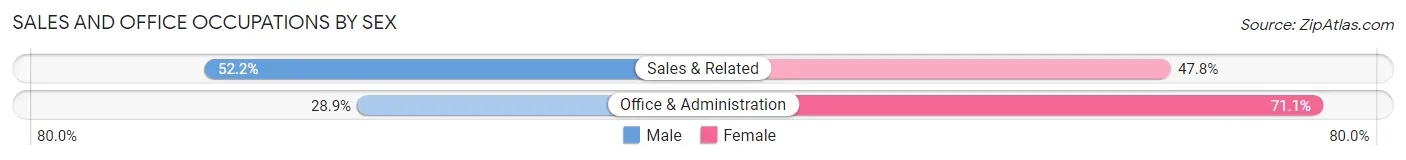
| Occupation | Male | Female |
| Sales & Related | 399 (52.2%) | 365 (47.8%) |
| Office & Administration | 289 (28.9%) | 712 (71.1%) |
| Total (Category) | 688 (39.0%) | 1,077 (61.0%) |
| Total (Overall) | 4,498 (50.6%) | 4,390 (49.4%) |
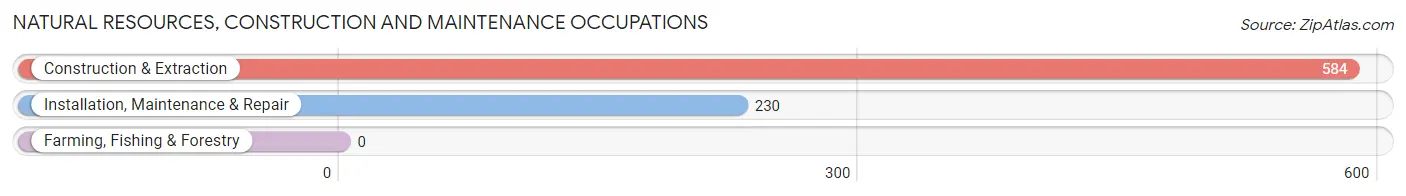
Natural Resources, Construction and Maintenance Occupations
The most common Natural Resources, Construction and Maintenance occupations in Horsham are Construction & Extraction (584 | 6.6%), and Installation, Maintenance & Repair (230 | 2.6%).
Natural Resources, Construction and Maintenance Occupations by Sex
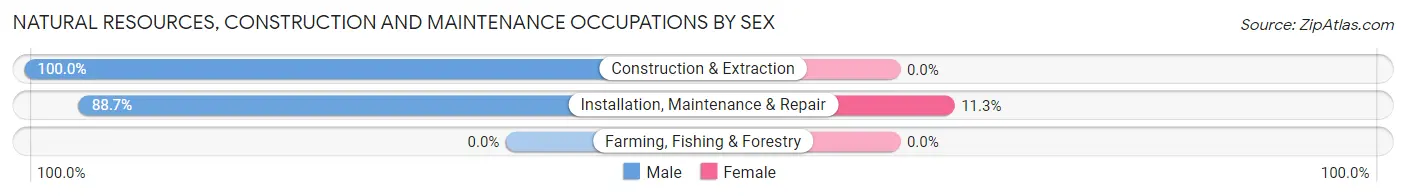
| Occupation | Male | Female |
| Farming, Fishing & Forestry | 0 (0.0%) | 0 (0.0%) |
| Construction & Extraction | 584 (100.0%) | 0 (0.0%) |
| Installation, Maintenance & Repair | 204 (88.7%) | 26 (11.3%) |
| Total (Category) | 788 (96.8%) | 26 (3.2%) |
| Total (Overall) | 4,498 (50.6%) | 4,390 (49.4%) |
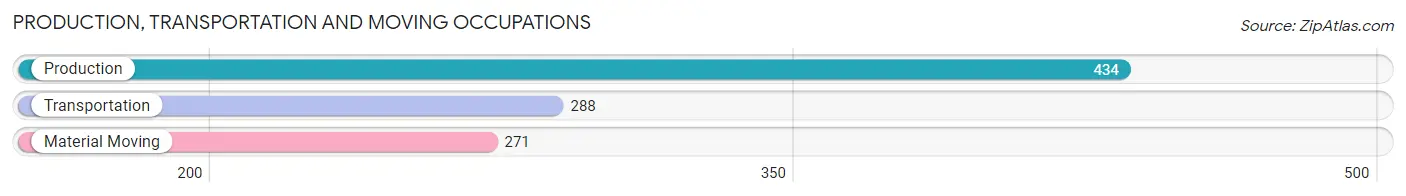
Production, Transportation and Moving Occupations
The most common Production, Transportation and Moving occupations in Horsham are Production (434 | 4.9%), Transportation (288 | 3.2%), and Material Moving (271 | 3.0%).
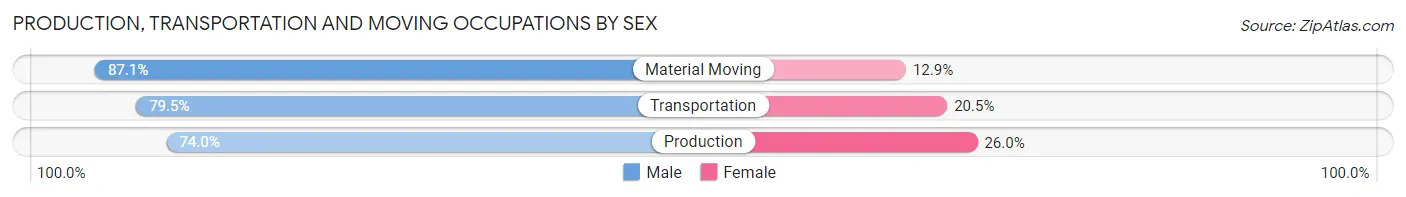
Production, Transportation and Moving Occupations by Sex
| Occupation | Male | Female |
| Production | 321 (74.0%) | 113 (26.0%) |
| Transportation | 229 (79.5%) | 59 (20.5%) |
| Material Moving | 236 (87.1%) | 35 (12.9%) |
| Total (Category) | 786 (79.1%) | 207 (20.8%) |
| Total (Overall) | 4,498 (50.6%) | 4,390 (49.4%) |
Employment Industries by Sex in Horsham
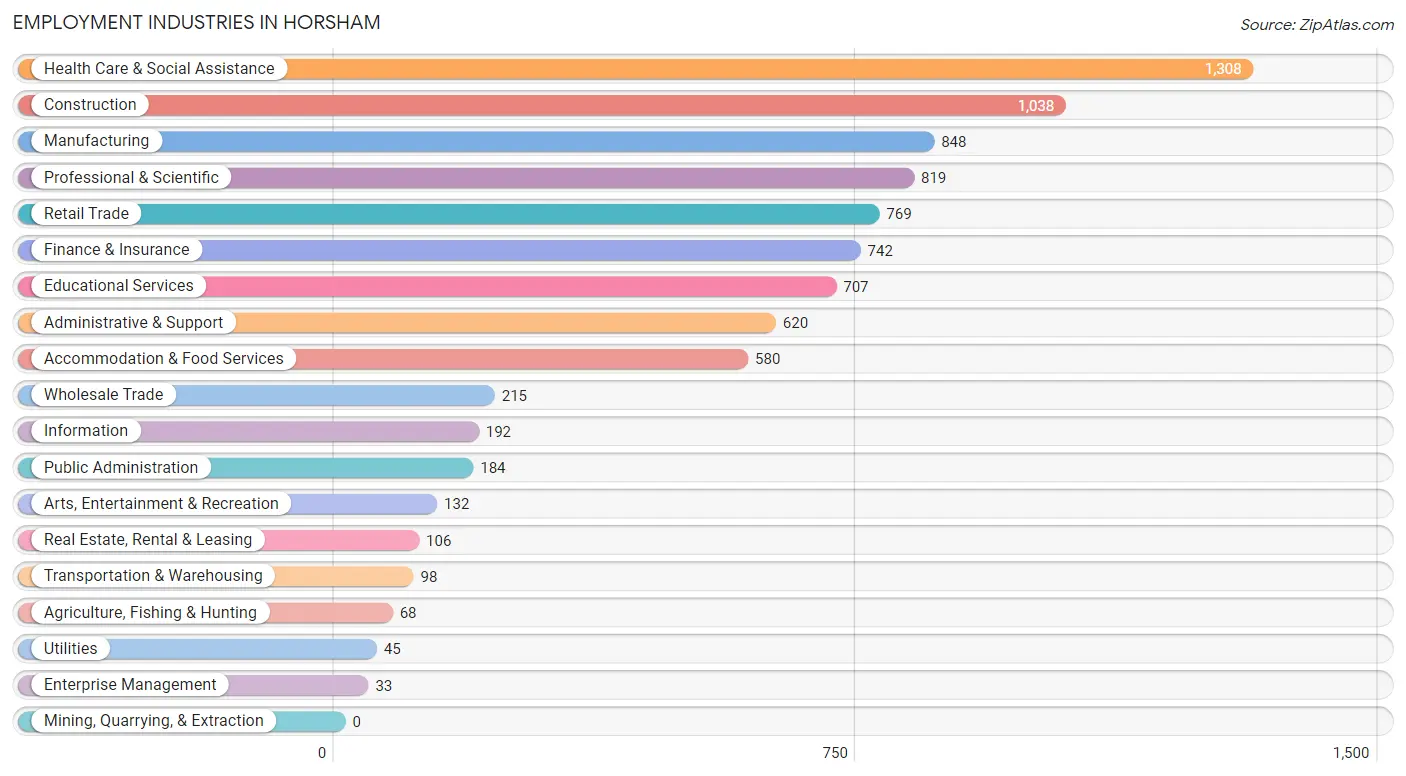
Employment Industries in Horsham
The major employment industries in Horsham include Health Care & Social Assistance (1,308 | 14.7%), Construction (1,038 | 11.7%), Manufacturing (848 | 9.5%), Professional & Scientific (819 | 9.2%), and Retail Trade (769 | 8.6%).
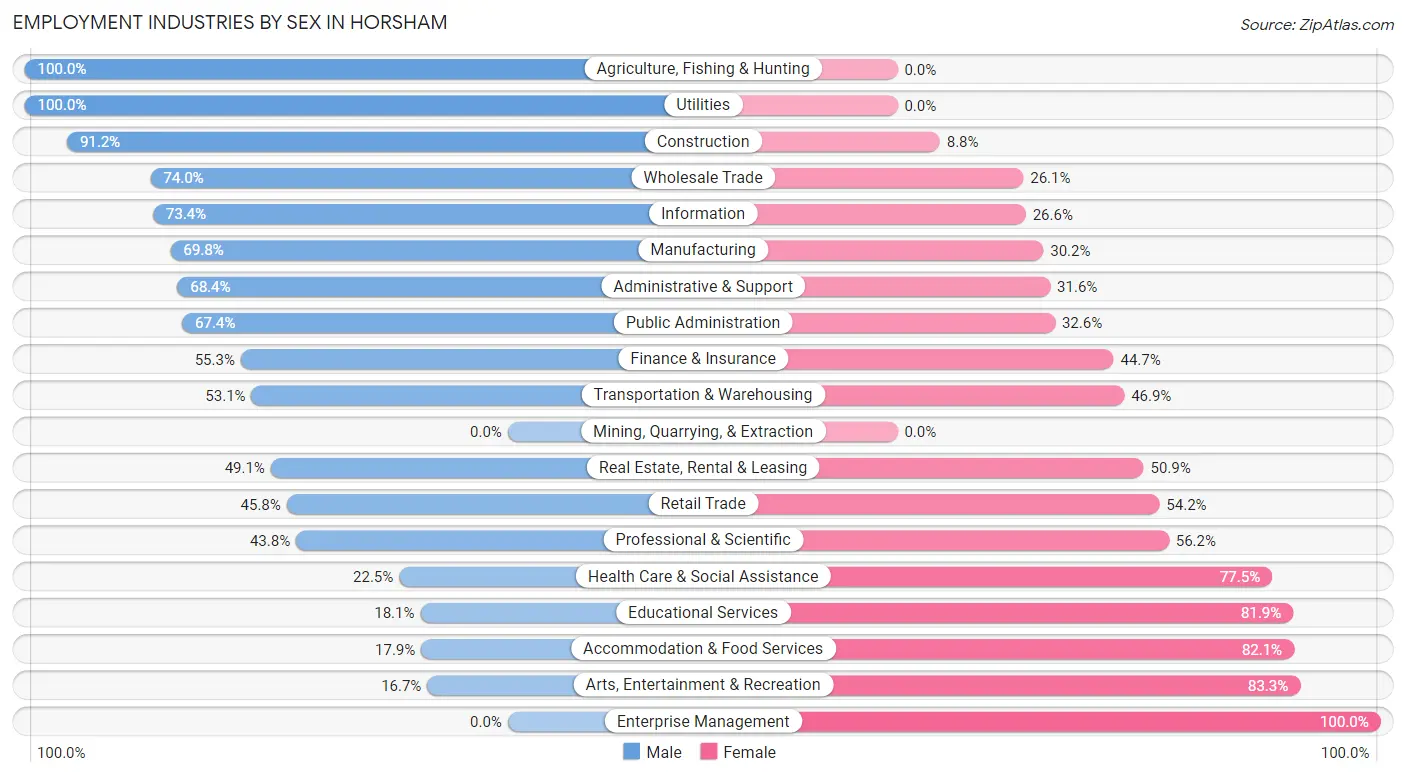
Employment Industries by Sex in Horsham
The Horsham industries that see more men than women are Agriculture, Fishing & Hunting (100.0%), Utilities (100.0%), and Construction (91.2%), whereas the industries that tend to have a higher number of women are Enterprise Management (100.0%), Arts, Entertainment & Recreation (83.3%), and Accommodation & Food Services (82.1%).
| Industry | Male | Female |
| Agriculture, Fishing & Hunting | 68 (100.0%) | 0 (0.0%) |
| Mining, Quarrying, & Extraction | 0 (0.0%) | 0 (0.0%) |
| Construction | 947 (91.2%) | 91 (8.8%) |
| Manufacturing | 592 (69.8%) | 256 (30.2%) |
| Wholesale Trade | 159 (74.0%) | 56 (26.1%) |
| Retail Trade | 352 (45.8%) | 417 (54.2%) |
| Transportation & Warehousing | 52 (53.1%) | 46 (46.9%) |
| Utilities | 45 (100.0%) | 0 (0.0%) |
| Information | 141 (73.4%) | 51 (26.6%) |
| Finance & Insurance | 410 (55.3%) | 332 (44.7%) |
| Real Estate, Rental & Leasing | 52 (49.1%) | 54 (50.9%) |
| Professional & Scientific | 359 (43.8%) | 460 (56.2%) |
| Enterprise Management | 0 (0.0%) | 33 (100.0%) |
| Administrative & Support | 424 (68.4%) | 196 (31.6%) |
| Educational Services | 128 (18.1%) | 579 (81.9%) |
| Health Care & Social Assistance | 294 (22.5%) | 1,014 (77.5%) |
| Arts, Entertainment & Recreation | 22 (16.7%) | 110 (83.3%) |
| Accommodation & Food Services | 104 (17.9%) | 476 (82.1%) |
| Public Administration | 124 (67.4%) | 60 (32.6%) |
| Total | 4,498 (50.6%) | 4,390 (49.4%) |
Education in Horsham
School Enrollment in Horsham
The most common levels of schooling among the 3,896 students in Horsham are high school (936 | 24.0%), middle school (909 | 23.3%), and elementary school (732 | 18.8%).
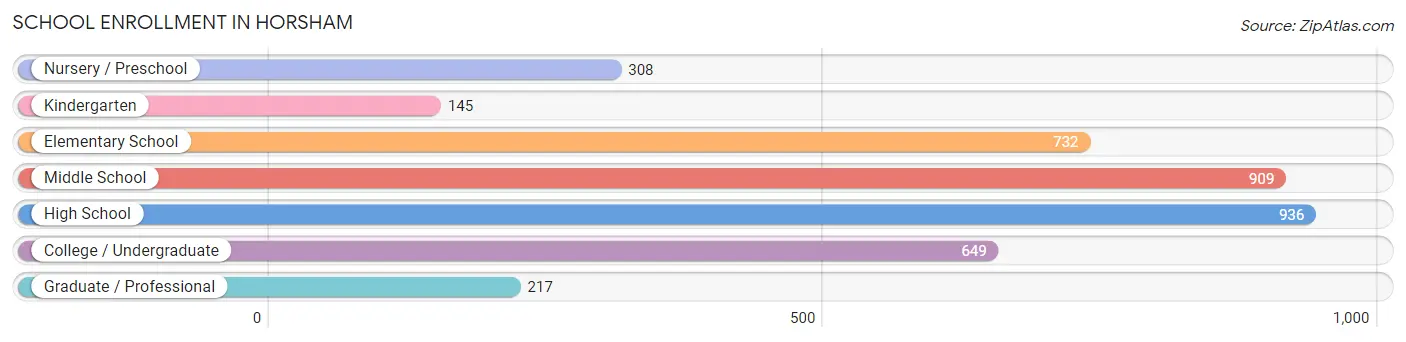
| School Level | # Students | % Students |
| Nursery / Preschool | 308 | 7.9% |
| Kindergarten | 145 | 3.7% |
| Elementary School | 732 | 18.8% |
| Middle School | 909 | 23.3% |
| High School | 936 | 24.0% |
| College / Undergraduate | 649 | 16.7% |
| Graduate / Professional | 217 | 5.6% |
| Total | 3,896 | 100.0% |
School Enrollment by Age by Funding Source in Horsham
Out of a total of 3,896 students who are enrolled in schools in Horsham, 697 (17.9%) attend a private institution, while the remaining 3,199 (82.1%) are enrolled in public schools. The age group of 3 to 4 year olds has the highest likelihood of being enrolled in private schools, with 194 (86.2% in the age bracket) enrolled. Conversely, the age group of 5 to 9 year old has the lowest likelihood of being enrolled in a private school, with 899 (97.3% in the age bracket) attending a public institution.
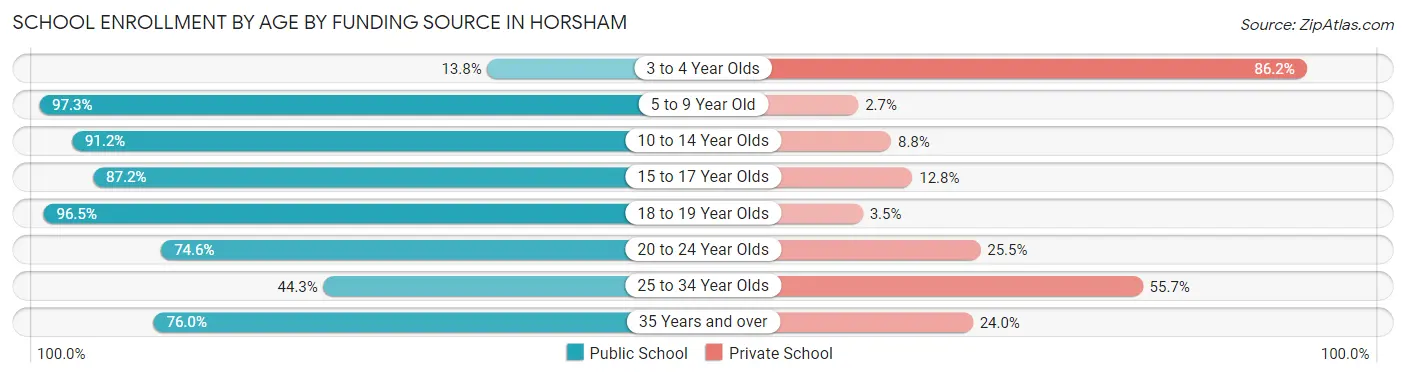
| Age Bracket | Public School | Private School |
| 3 to 4 Year Olds | 31 (13.8%) | 194 (86.2%) |
| 5 to 9 Year Old | 899 (97.3%) | 25 (2.7%) |
| 10 to 14 Year Olds | 972 (91.2%) | 94 (8.8%) |
| 15 to 17 Year Olds | 628 (87.2%) | 92 (12.8%) |
| 18 to 19 Year Olds | 109 (96.5%) | 4 (3.5%) |
| 20 to 24 Year Olds | 334 (74.6%) | 114 (25.5%) |
| 25 to 34 Year Olds | 109 (44.3%) | 137 (55.7%) |
| 35 Years and over | 117 (76.0%) | 37 (24.0%) |
| Total | 3,199 (82.1%) | 697 (17.9%) |
Educational Attainment by Field of Study in Horsham
Business (1,246 | 26.4%), education (506 | 10.7%), science & technology (422 | 8.9%), engineering (312 | 6.6%), and bio, nature & agricultural (293 | 6.2%) are the most common fields of study among 4,713 individuals in Horsham who have obtained a bachelor's degree or higher.
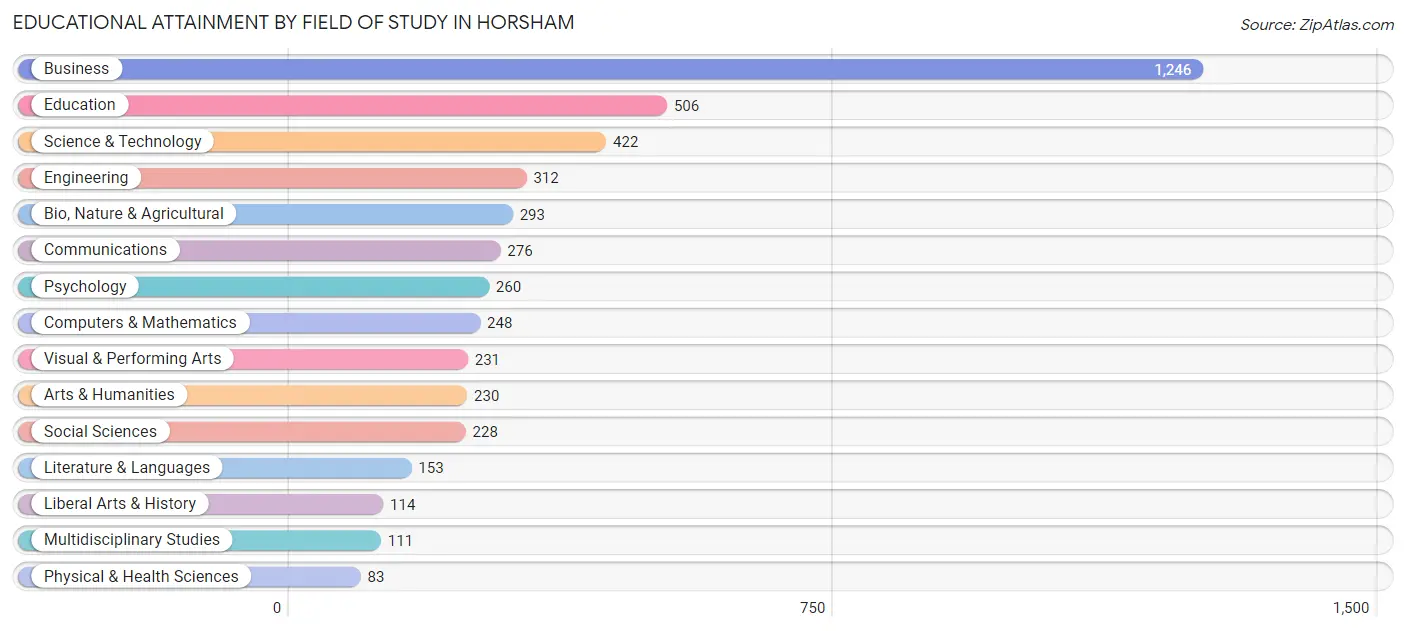
| Field of Study | # Graduates | % Graduates |
| Computers & Mathematics | 248 | 5.3% |
| Bio, Nature & Agricultural | 293 | 6.2% |
| Physical & Health Sciences | 83 | 1.8% |
| Psychology | 260 | 5.5% |
| Social Sciences | 228 | 4.8% |
| Engineering | 312 | 6.6% |
| Multidisciplinary Studies | 111 | 2.4% |
| Science & Technology | 422 | 8.9% |
| Business | 1,246 | 26.4% |
| Education | 506 | 10.7% |
| Literature & Languages | 153 | 3.3% |
| Liberal Arts & History | 114 | 2.4% |
| Visual & Performing Arts | 231 | 4.9% |
| Communications | 276 | 5.9% |
| Arts & Humanities | 230 | 4.9% |
| Total | 4,713 | 100.0% |
Transportation & Commute in Horsham
Vehicle Availability by Sex in Horsham
The most prevalent vehicle ownership categories in Horsham are males with 2 vehicles (1,915, accounting for 42.6%) and females with 2 vehicles (1,683, making up 44.2%).
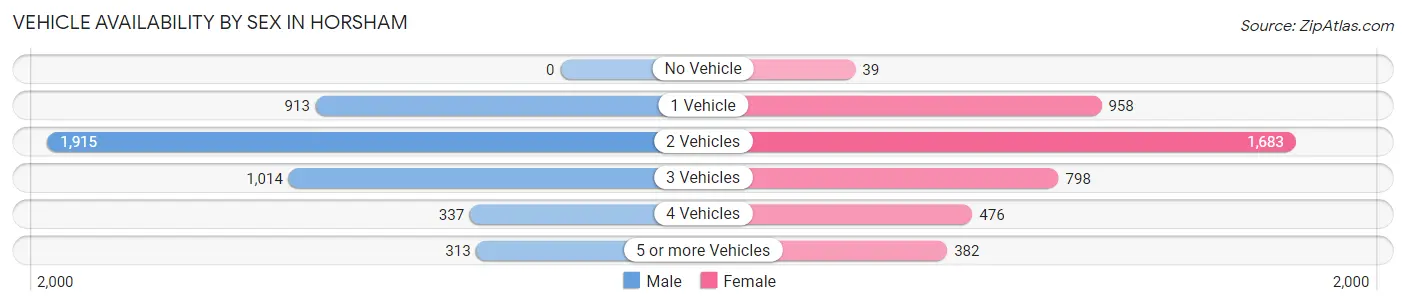
| Vehicles Available | Male | Female |
| No Vehicle | 0 (0.0%) | 39 (0.9%) |
| 1 Vehicle | 913 (20.3%) | 958 (22.1%) |
| 2 Vehicles | 1,915 (42.6%) | 1,683 (38.8%) |
| 3 Vehicles | 1,014 (22.6%) | 798 (18.4%) |
| 4 Vehicles | 337 (7.5%) | 476 (11.0%) |
| 5 or more Vehicles | 313 (7.0%) | 382 (8.8%) |
| Total | 4,492 (100.0%) | 4,336 (100.0%) |
Commute Time in Horsham
The most frequently occuring commute durations in Horsham are 20 to 24 minutes (1,310 commuters, 17.6%), 10 to 14 minutes (1,049 commuters, 14.1%), and 15 to 19 minutes (1,025 commuters, 13.8%).
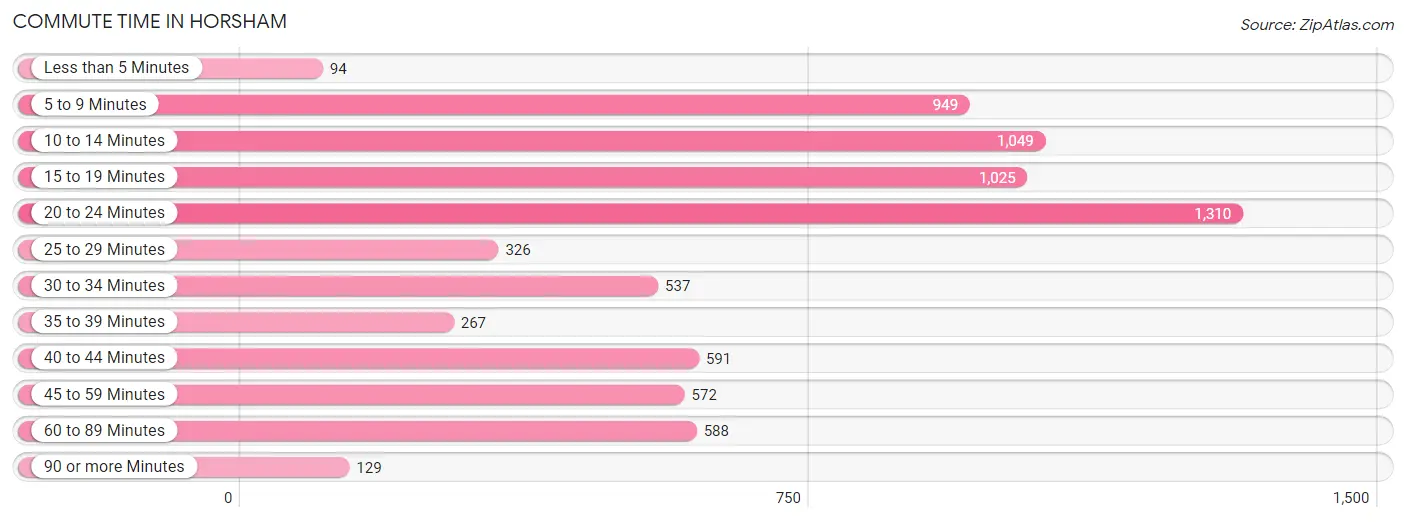
| Commute Time | # Commuters | % Commuters |
| Less than 5 Minutes | 94 | 1.3% |
| 5 to 9 Minutes | 949 | 12.8% |
| 10 to 14 Minutes | 1,049 | 14.1% |
| 15 to 19 Minutes | 1,025 | 13.8% |
| 20 to 24 Minutes | 1,310 | 17.6% |
| 25 to 29 Minutes | 326 | 4.4% |
| 30 to 34 Minutes | 537 | 7.2% |
| 35 to 39 Minutes | 267 | 3.6% |
| 40 to 44 Minutes | 591 | 8.0% |
| 45 to 59 Minutes | 572 | 7.7% |
| 60 to 89 Minutes | 588 | 7.9% |
| 90 or more Minutes | 129 | 1.7% |
Commute Time by Sex in Horsham
The most common commute times in Horsham are 20 to 24 minutes (855 commuters, 22.5%) for males and 10 to 14 minutes (649 commuters, 17.9%) for females.
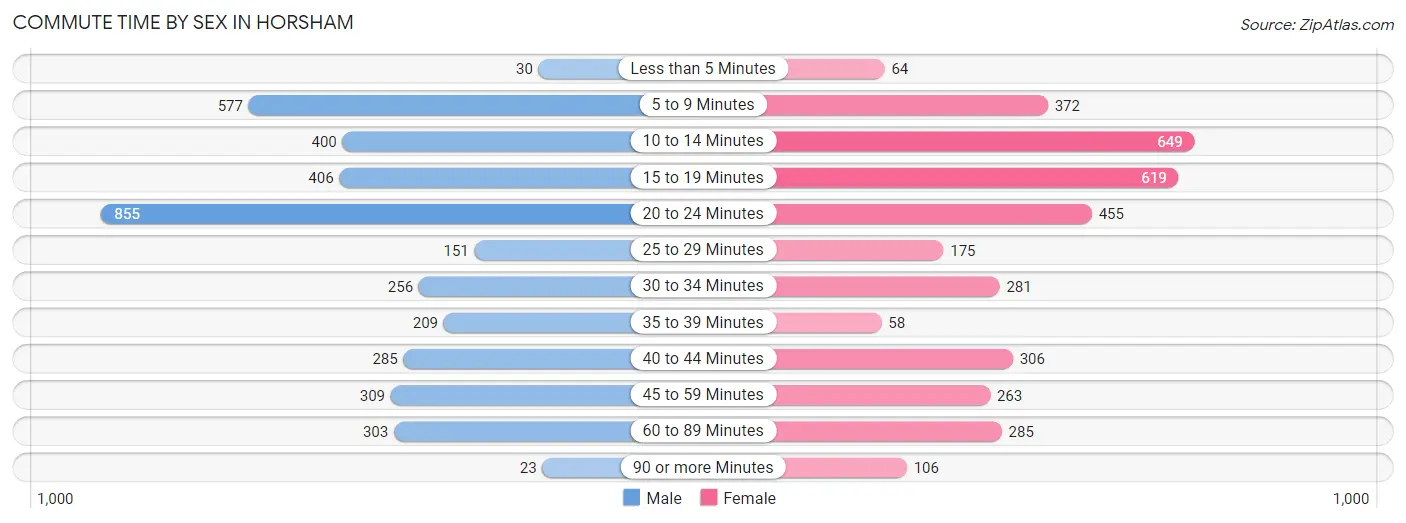
| Commute Time | Male | Female |
| Less than 5 Minutes | 30 (0.8%) | 64 (1.8%) |
| 5 to 9 Minutes | 577 (15.2%) | 372 (10.2%) |
| 10 to 14 Minutes | 400 (10.5%) | 649 (17.9%) |
| 15 to 19 Minutes | 406 (10.7%) | 619 (17.0%) |
| 20 to 24 Minutes | 855 (22.5%) | 455 (12.5%) |
| 25 to 29 Minutes | 151 (4.0%) | 175 (4.8%) |
| 30 to 34 Minutes | 256 (6.7%) | 281 (7.7%) |
| 35 to 39 Minutes | 209 (5.5%) | 58 (1.6%) |
| 40 to 44 Minutes | 285 (7.5%) | 306 (8.4%) |
| 45 to 59 Minutes | 309 (8.1%) | 263 (7.2%) |
| 60 to 89 Minutes | 303 (8.0%) | 285 (7.8%) |
| 90 or more Minutes | 23 (0.6%) | 106 (2.9%) |
Time of Departure to Work by Sex in Horsham
The most frequent times of departure to work in Horsham are 7:00 AM to 7:29 AM (579, 15.2%) for males and 7:00 AM to 7:29 AM (620, 17.1%) for females.
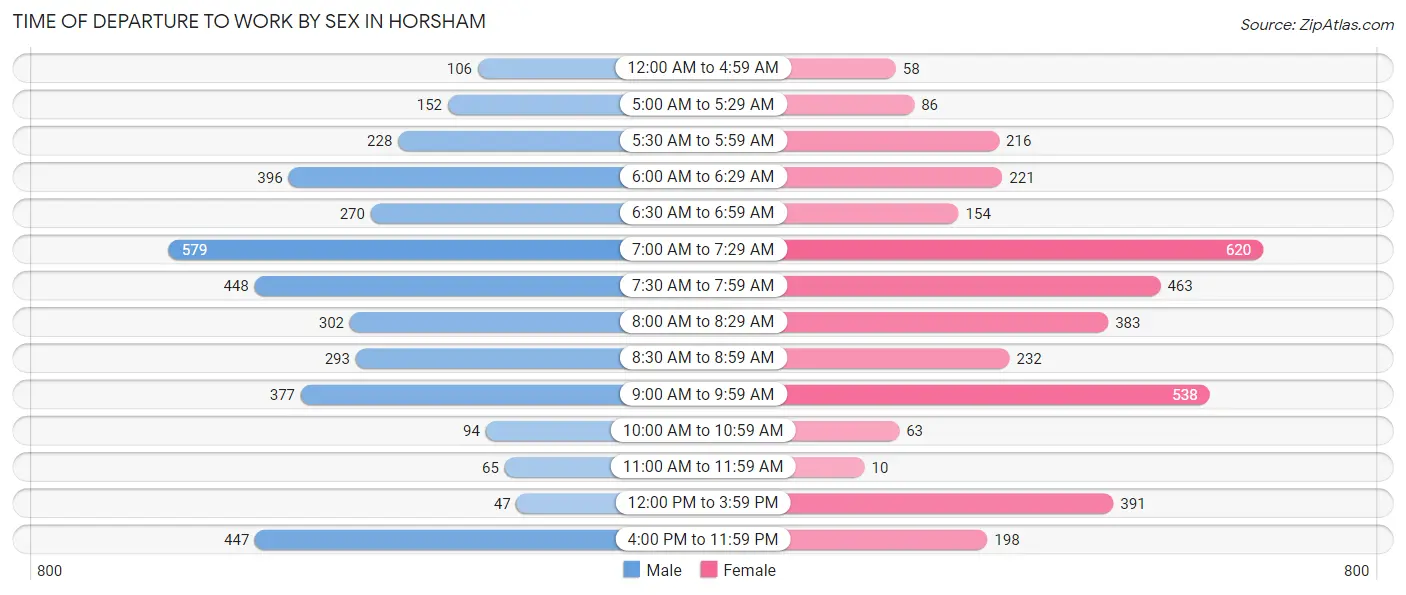
| Time of Departure | Male | Female |
| 12:00 AM to 4:59 AM | 106 (2.8%) | 58 (1.6%) |
| 5:00 AM to 5:29 AM | 152 (4.0%) | 86 (2.4%) |
| 5:30 AM to 5:59 AM | 228 (6.0%) | 216 (5.9%) |
| 6:00 AM to 6:29 AM | 396 (10.4%) | 221 (6.1%) |
| 6:30 AM to 6:59 AM | 270 (7.1%) | 154 (4.2%) |
| 7:00 AM to 7:29 AM | 579 (15.2%) | 620 (17.1%) |
| 7:30 AM to 7:59 AM | 448 (11.8%) | 463 (12.7%) |
| 8:00 AM to 8:29 AM | 302 (7.9%) | 383 (10.5%) |
| 8:30 AM to 8:59 AM | 293 (7.7%) | 232 (6.4%) |
| 9:00 AM to 9:59 AM | 377 (9.9%) | 538 (14.8%) |
| 10:00 AM to 10:59 AM | 94 (2.5%) | 63 (1.7%) |
| 11:00 AM to 11:59 AM | 65 (1.7%) | 10 (0.3%) |
| 12:00 PM to 3:59 PM | 47 (1.2%) | 391 (10.8%) |
| 4:00 PM to 11:59 PM | 447 (11.7%) | 198 (5.4%) |
| Total | 3,804 (100.0%) | 3,633 (100.0%) |
Housing Occupancy in Horsham
Occupancy by Ownership in Horsham
Of the total 5,674 dwellings in Horsham, owner-occupied units account for 3,929 (69.3%), while renter-occupied units make up 1,745 (30.7%).
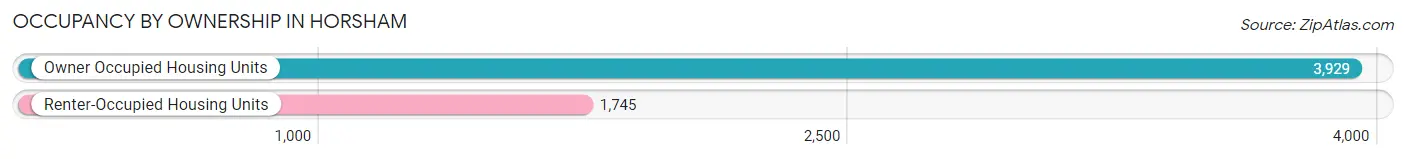
| Occupancy | # Housing Units | % Housing Units |
| Owner Occupied Housing Units | 3,929 | 69.3% |
| Renter-Occupied Housing Units | 1,745 | 30.7% |
| Total Occupied Housing Units | 5,674 | 100.0% |
Occupancy by Household Size in Horsham
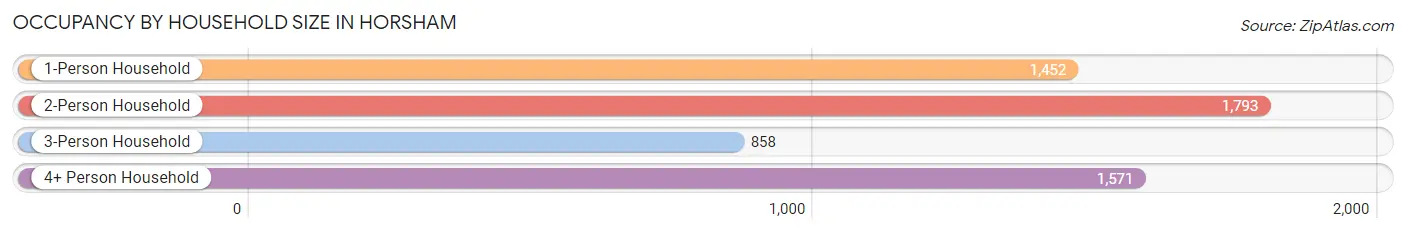
| Household Size | # Housing Units | % Housing Units |
| 1-Person Household | 1,452 | 25.6% |
| 2-Person Household | 1,793 | 31.6% |
| 3-Person Household | 858 | 15.1% |
| 4+ Person Household | 1,571 | 27.7% |
| Total Housing Units | 5,674 | 100.0% |
Occupancy by Ownership by Household Size in Horsham
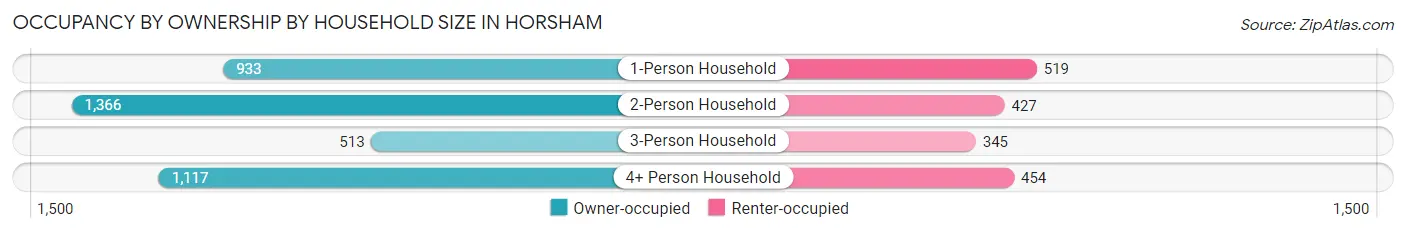
| Household Size | Owner-occupied | Renter-occupied |
| 1-Person Household | 933 (64.3%) | 519 (35.7%) |
| 2-Person Household | 1,366 (76.2%) | 427 (23.8%) |
| 3-Person Household | 513 (59.8%) | 345 (40.2%) |
| 4+ Person Household | 1,117 (71.1%) | 454 (28.9%) |
| Total Housing Units | 3,929 (69.3%) | 1,745 (30.7%) |
Occupancy by Educational Attainment in Horsham
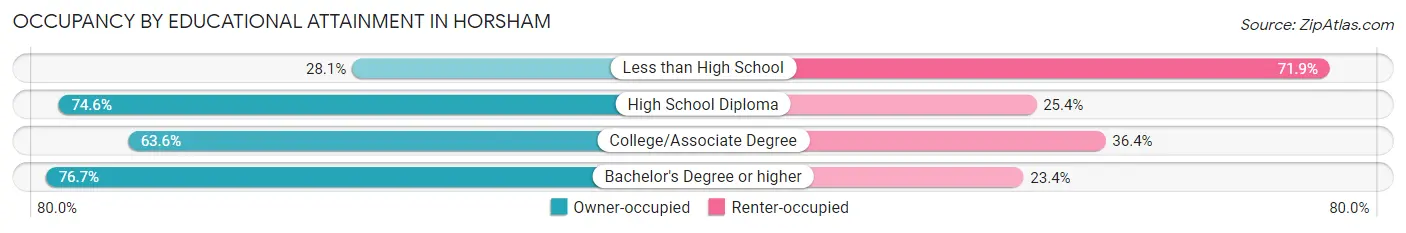
| Household Size | Owner-occupied | Renter-occupied |
| Less than High School | 133 (28.1%) | 341 (71.9%) |
| High School Diploma | 1,141 (74.6%) | 388 (25.4%) |
| College/Associate Degree | 777 (63.6%) | 444 (36.4%) |
| Bachelor's Degree or higher | 1,878 (76.6%) | 572 (23.4%) |
Occupancy by Age of Householder in Horsham
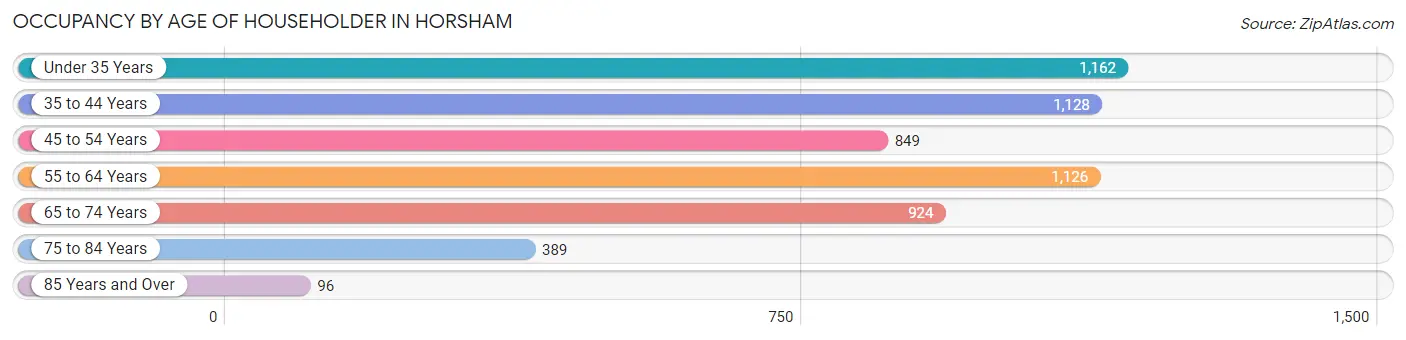
| Age Bracket | # Households | % Households |
| Under 35 Years | 1,162 | 20.5% |
| 35 to 44 Years | 1,128 | 19.9% |
| 45 to 54 Years | 849 | 15.0% |
| 55 to 64 Years | 1,126 | 19.8% |
| 65 to 74 Years | 924 | 16.3% |
| 75 to 84 Years | 389 | 6.9% |
| 85 Years and Over | 96 | 1.7% |
| Total | 5,674 | 100.0% |
Housing Finances in Horsham
Median Income by Occupancy in Horsham
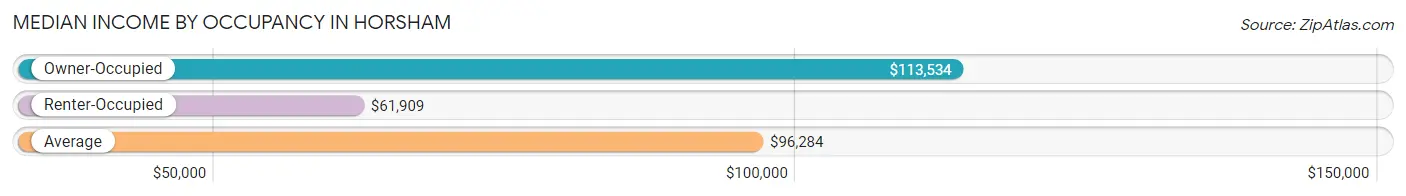
| Occupancy Type | # Households | Median Income |
| Owner-Occupied | 3,929 (69.3%) | $113,534 |
| Renter-Occupied | 1,745 (30.7%) | $61,909 |
| Average | 5,674 (100.0%) | $96,284 |
Occupancy by Householder Income Bracket in Horsham
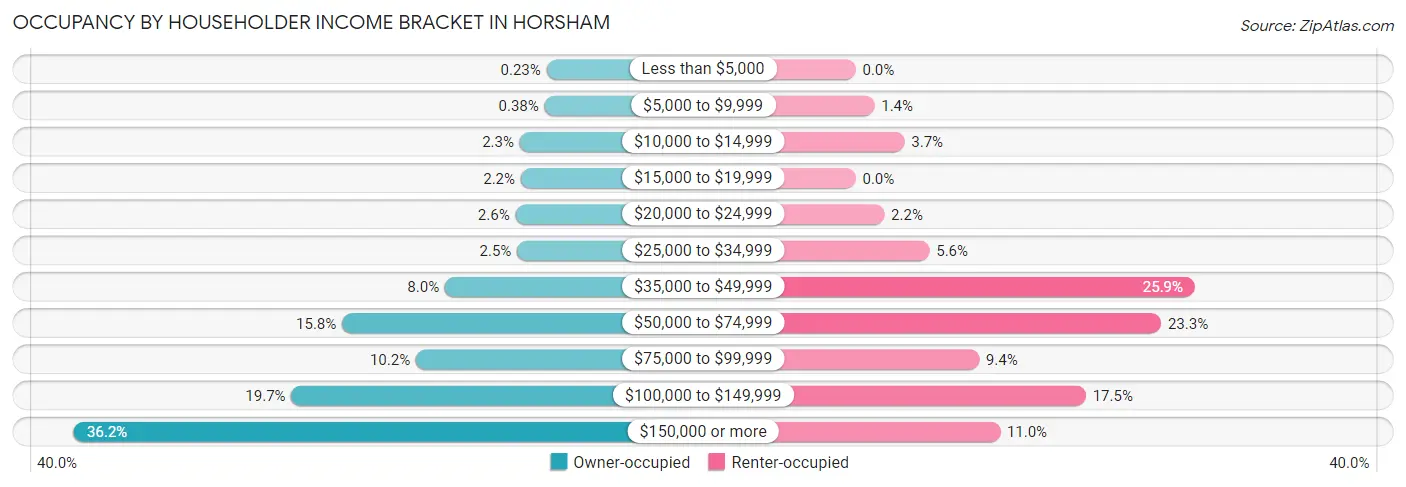
| Income Bracket | Owner-occupied | Renter-occupied |
| Less than $5,000 | 9 (0.2%) | 0 (0.0%) |
| $5,000 to $9,999 | 15 (0.4%) | 25 (1.4%) |
| $10,000 to $14,999 | 89 (2.3%) | 65 (3.7%) |
| $15,000 to $19,999 | 86 (2.2%) | 0 (0.0%) |
| $20,000 to $24,999 | 102 (2.6%) | 38 (2.2%) |
| $25,000 to $34,999 | 97 (2.5%) | 98 (5.6%) |
| $35,000 to $49,999 | 313 (8.0%) | 451 (25.9%) |
| $50,000 to $74,999 | 621 (15.8%) | 406 (23.3%) |
| $75,000 to $99,999 | 400 (10.2%) | 164 (9.4%) |
| $100,000 to $149,999 | 773 (19.7%) | 306 (17.5%) |
| $150,000 or more | 1,424 (36.2%) | 192 (11.0%) |
| Total | 3,929 (100.0%) | 1,745 (100.0%) |
Monthly Housing Cost Tiers in Horsham
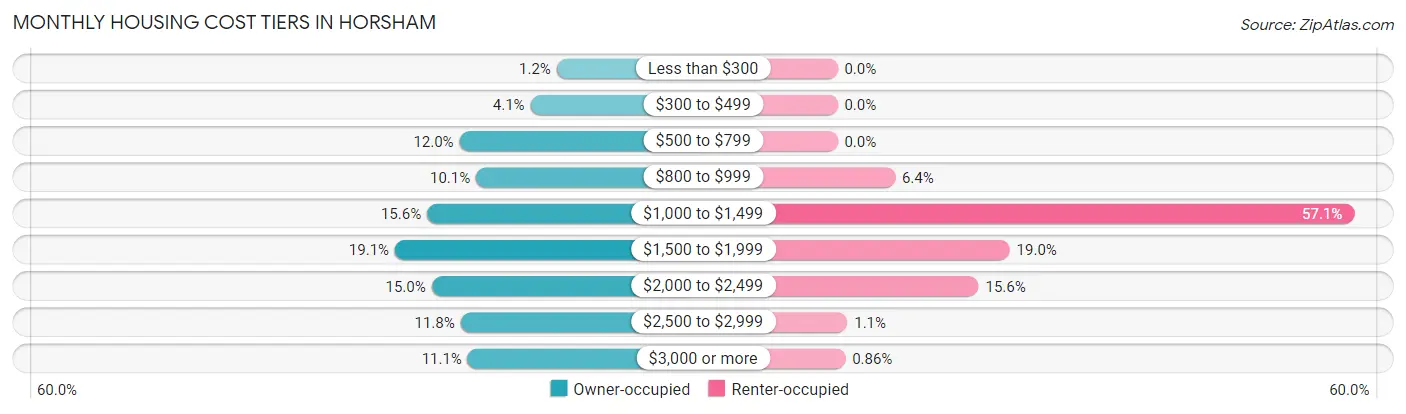
| Monthly Cost | Owner-occupied | Renter-occupied |
| Less than $300 | 48 (1.2%) | 0 (0.0%) |
| $300 to $499 | 162 (4.1%) | 0 (0.0%) |
| $500 to $799 | 470 (12.0%) | 0 (0.0%) |
| $800 to $999 | 398 (10.1%) | 111 (6.4%) |
| $1,000 to $1,499 | 611 (15.5%) | 996 (57.1%) |
| $1,500 to $1,999 | 750 (19.1%) | 332 (19.0%) |
| $2,000 to $2,499 | 591 (15.0%) | 272 (15.6%) |
| $2,500 to $2,999 | 465 (11.8%) | 19 (1.1%) |
| $3,000 or more | 434 (11.1%) | 15 (0.9%) |
| Total | 3,929 (100.0%) | 1,745 (100.0%) |
Physical Housing Characteristics in Horsham
Housing Structures in Horsham
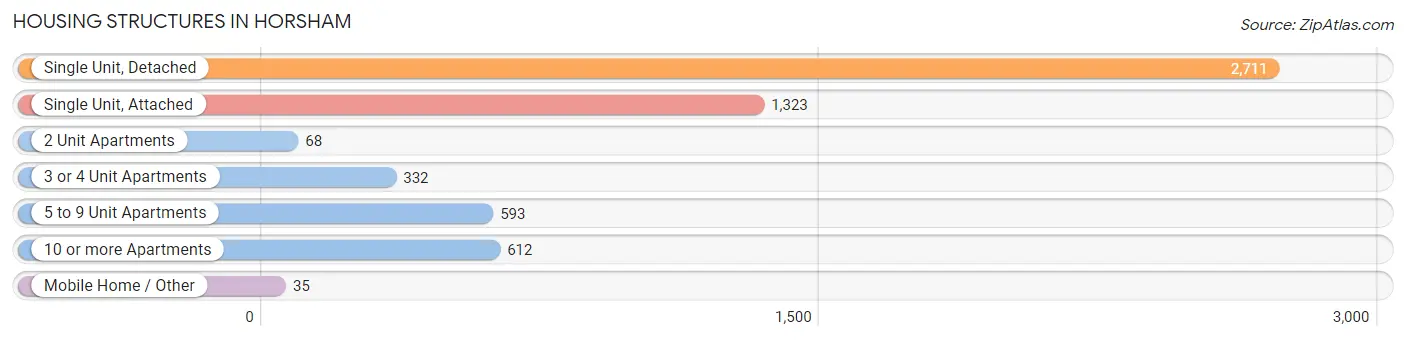
| Structure Type | # Housing Units | % Housing Units |
| Single Unit, Detached | 2,711 | 47.8% |
| Single Unit, Attached | 1,323 | 23.3% |
| 2 Unit Apartments | 68 | 1.2% |
| 3 or 4 Unit Apartments | 332 | 5.9% |
| 5 to 9 Unit Apartments | 593 | 10.4% |
| 10 or more Apartments | 612 | 10.8% |
| Mobile Home / Other | 35 | 0.6% |
| Total | 5,674 | 100.0% |
Housing Structures by Occupancy in Horsham
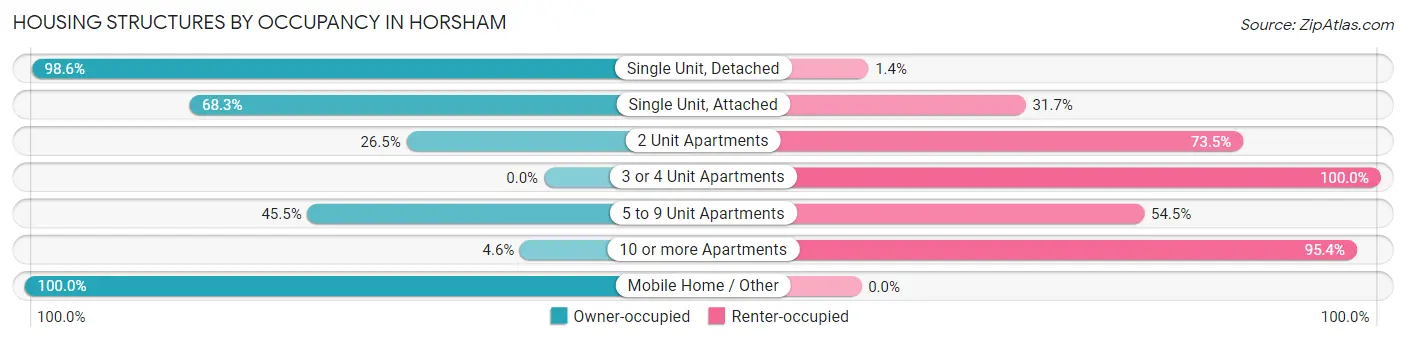
| Structure Type | Owner-occupied | Renter-occupied |
| Single Unit, Detached | 2,674 (98.6%) | 37 (1.4%) |
| Single Unit, Attached | 904 (68.3%) | 419 (31.7%) |
| 2 Unit Apartments | 18 (26.5%) | 50 (73.5%) |
| 3 or 4 Unit Apartments | 0 (0.0%) | 332 (100.0%) |
| 5 to 9 Unit Apartments | 270 (45.5%) | 323 (54.5%) |
| 10 or more Apartments | 28 (4.6%) | 584 (95.4%) |
| Mobile Home / Other | 35 (100.0%) | 0 (0.0%) |
| Total | 3,929 (69.3%) | 1,745 (30.7%) |
Housing Structures by Number of Rooms in Horsham
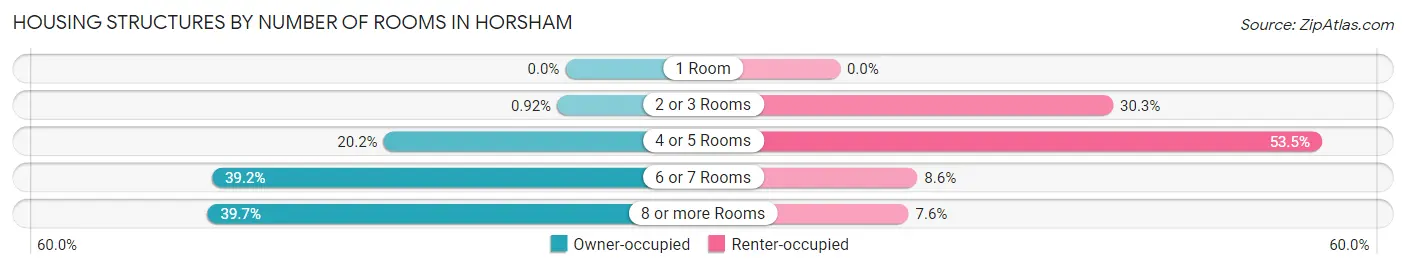
| Number of Rooms | Owner-occupied | Renter-occupied |
| 1 Room | 0 (0.0%) | 0 (0.0%) |
| 2 or 3 Rooms | 36 (0.9%) | 529 (30.3%) |
| 4 or 5 Rooms | 793 (20.2%) | 933 (53.5%) |
| 6 or 7 Rooms | 1,540 (39.2%) | 150 (8.6%) |
| 8 or more Rooms | 1,560 (39.7%) | 133 (7.6%) |
| Total | 3,929 (100.0%) | 1,745 (100.0%) |
Housing Structure by Heating Type in Horsham
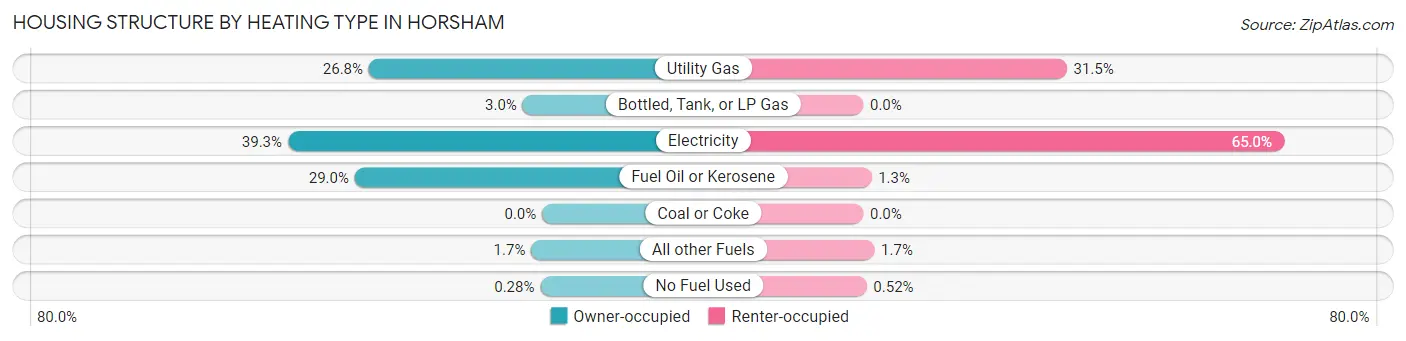
| Heating Type | Owner-occupied | Renter-occupied |
| Utility Gas | 1,052 (26.8%) | 549 (31.5%) |
| Bottled, Tank, or LP Gas | 118 (3.0%) | 0 (0.0%) |
| Electricity | 1,544 (39.3%) | 1,135 (65.0%) |
| Fuel Oil or Kerosene | 1,138 (29.0%) | 22 (1.3%) |
| Coal or Coke | 0 (0.0%) | 0 (0.0%) |
| All other Fuels | 66 (1.7%) | 30 (1.7%) |
| No Fuel Used | 11 (0.3%) | 9 (0.5%) |
| Total | 3,929 (100.0%) | 1,745 (100.0%) |
Household Vehicle Usage in Horsham
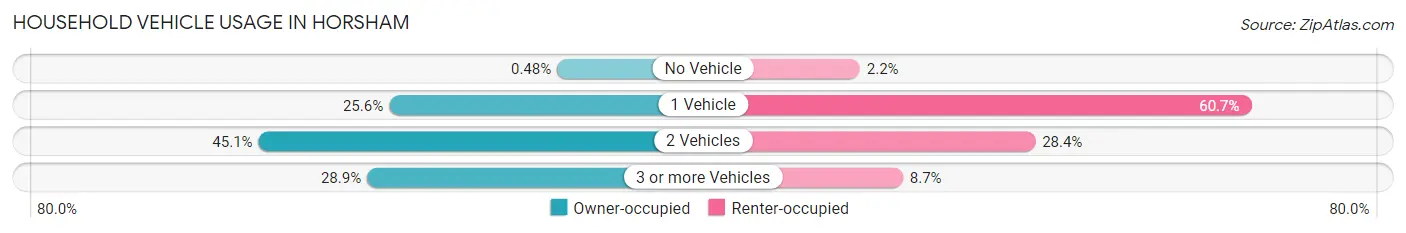
| Vehicles per Household | Owner-occupied | Renter-occupied |
| No Vehicle | 19 (0.5%) | 39 (2.2%) |
| 1 Vehicle | 1,005 (25.6%) | 1,059 (60.7%) |
| 2 Vehicles | 1,771 (45.1%) | 496 (28.4%) |
| 3 or more Vehicles | 1,134 (28.9%) | 151 (8.6%) |
| Total | 3,929 (100.0%) | 1,745 (100.0%) |
Real Estate & Mortgages in Horsham
Real Estate and Mortgage Overview in Horsham
| Characteristic | Without Mortgage | With Mortgage |
| Housing Units | 1,276 | 2,653 |
| Median Property Value | $383,300 | $330,400 |
| Median Household Income | $71,897 | $1,135 |
| Monthly Housing Costs | $826 | $434 |
| Real Estate Taxes | $5,152 | $43 |
Property Value by Mortgage Status in Horsham
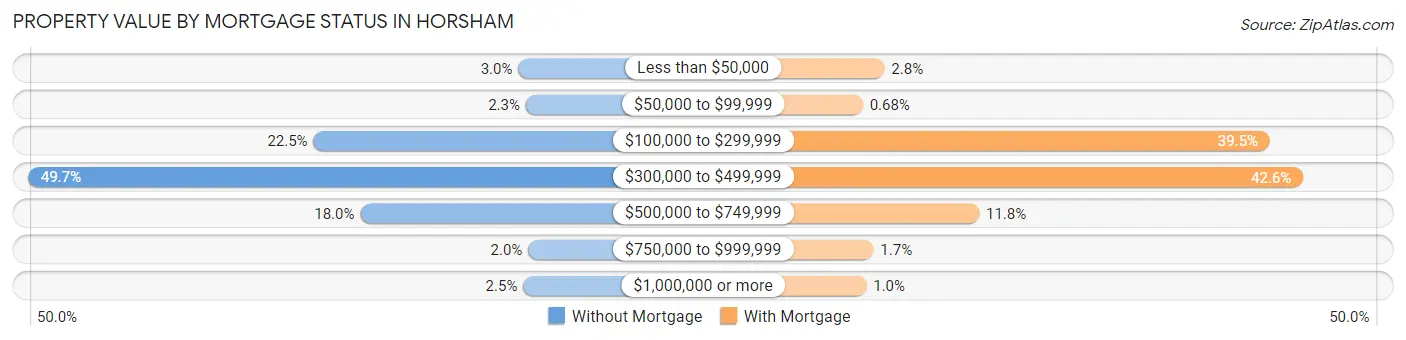
| Property Value | Without Mortgage | With Mortgage |
| Less than $50,000 | 38 (3.0%) | 73 (2.8%) |
| $50,000 to $99,999 | 29 (2.3%) | 18 (0.7%) |
| $100,000 to $299,999 | 287 (22.5%) | 1,047 (39.5%) |
| $300,000 to $499,999 | 634 (49.7%) | 1,131 (42.6%) |
| $500,000 to $749,999 | 230 (18.0%) | 312 (11.8%) |
| $750,000 to $999,999 | 26 (2.0%) | 45 (1.7%) |
| $1,000,000 or more | 32 (2.5%) | 27 (1.0%) |
| Total | 1,276 (100.0%) | 2,653 (100.0%) |
Household Income by Mortgage Status in Horsham
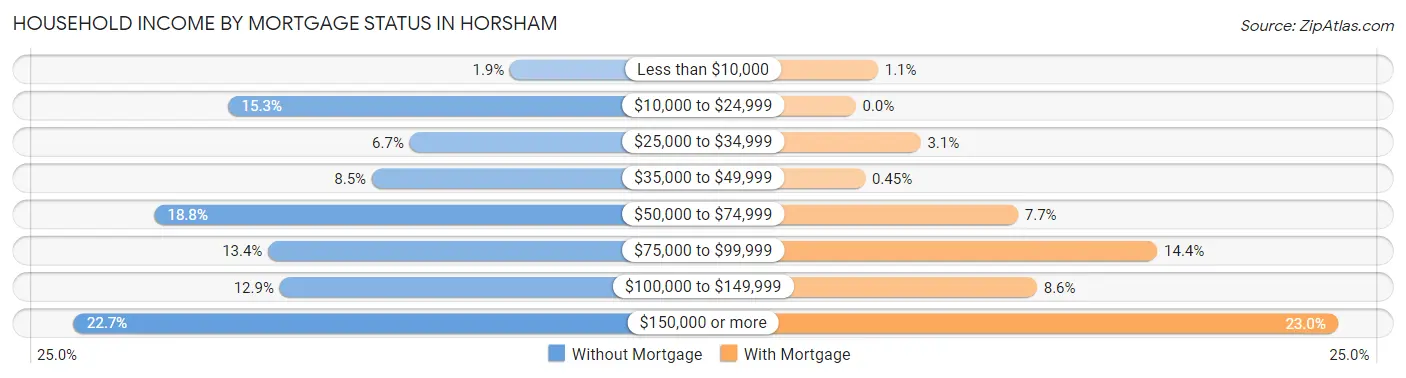
| Household Income | Without Mortgage | With Mortgage |
| Less than $10,000 | 24 (1.9%) | 28 (1.1%) |
| $10,000 to $24,999 | 195 (15.3%) | 0 (0.0%) |
| $25,000 to $34,999 | 85 (6.7%) | 82 (3.1%) |
| $35,000 to $49,999 | 108 (8.5%) | 12 (0.4%) |
| $50,000 to $74,999 | 240 (18.8%) | 205 (7.7%) |
| $75,000 to $99,999 | 171 (13.4%) | 381 (14.4%) |
| $100,000 to $149,999 | 164 (12.9%) | 229 (8.6%) |
| $150,000 or more | 289 (22.7%) | 609 (23.0%) |
| Total | 1,276 (100.0%) | 2,653 (100.0%) |
Property Value to Household Income Ratio in Horsham
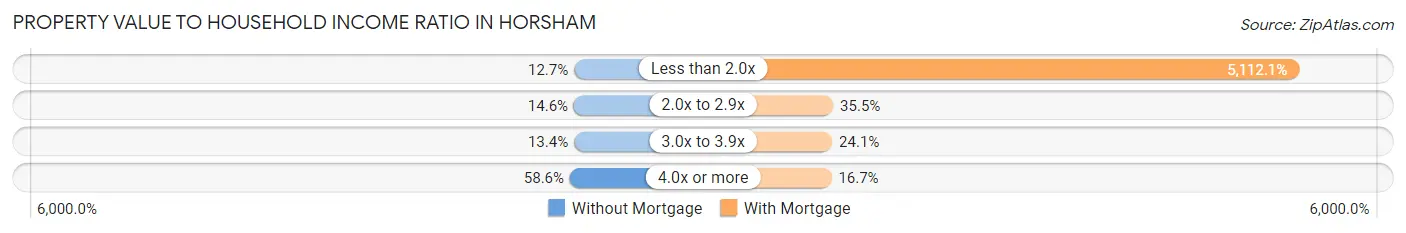
| Value-to-Income Ratio | Without Mortgage | With Mortgage |
| Less than 2.0x | 162 (12.7%) | 135,625 (5,112.1%) |
| 2.0x to 2.9x | 186 (14.6%) | 943 (35.5%) |
| 3.0x to 3.9x | 171 (13.4%) | 639 (24.1%) |
| 4.0x or more | 748 (58.6%) | 443 (16.7%) |
| Total | 1,276 (100.0%) | 2,653 (100.0%) |
Real Estate Taxes by Mortgage Status in Horsham
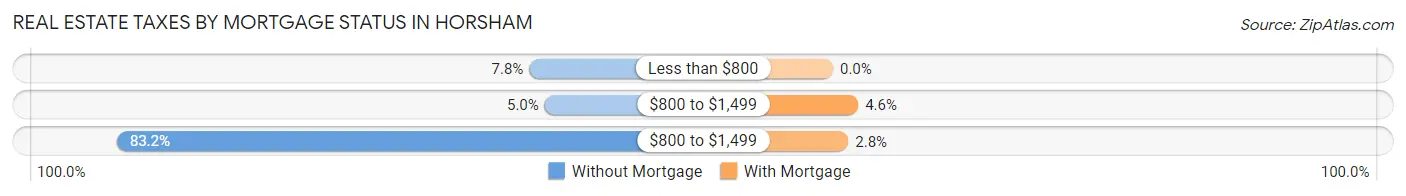
| Property Taxes | Without Mortgage | With Mortgage |
| Less than $800 | 100 (7.8%) | 0 (0.0%) |
| $800 to $1,499 | 64 (5.0%) | 122 (4.6%) |
| $800 to $1,499 | 1,061 (83.2%) | 74 (2.8%) |
| Total | 1,276 (100.0%) | 2,653 (100.0%) |
Health & Disability in Horsham
Health Insurance Coverage by Age in Horsham
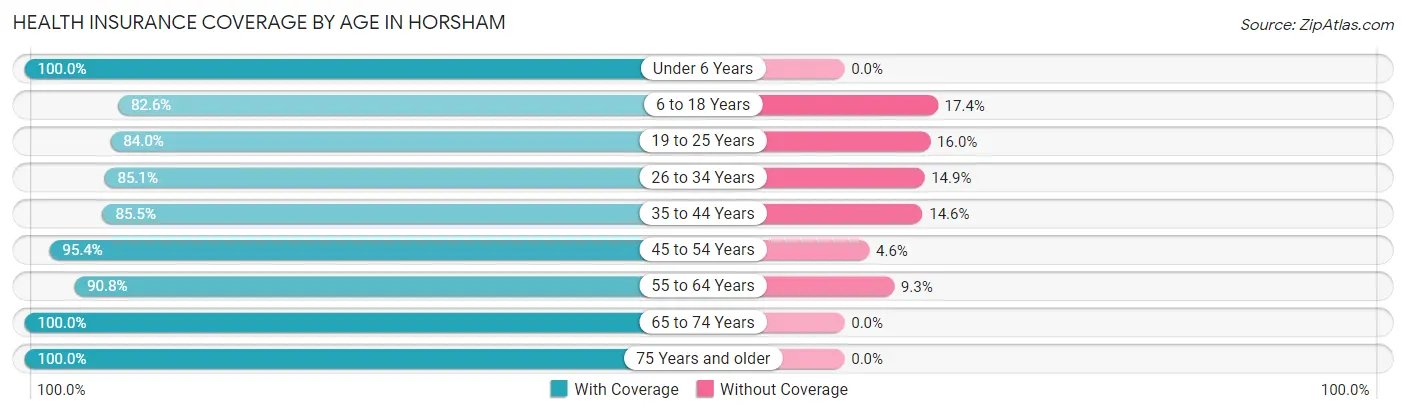
| Age Bracket | With Coverage | Without Coverage |
| Under 6 Years | 896 (100.0%) | 0 (0.0%) |
| 6 to 18 Years | 2,571 (82.6%) | 542 (17.4%) |
| 19 to 25 Years | 1,186 (84.0%) | 226 (16.0%) |
| 26 to 34 Years | 1,935 (85.1%) | 339 (14.9%) |
| 35 to 44 Years | 1,680 (85.5%) | 286 (14.5%) |
| 45 to 54 Years | 1,361 (95.4%) | 66 (4.6%) |
| 55 to 64 Years | 1,874 (90.7%) | 191 (9.2%) |
| 65 to 74 Years | 1,709 (100.0%) | 0 (0.0%) |
| 75 Years and older | 671 (100.0%) | 0 (0.0%) |
| Total | 13,883 (89.4%) | 1,650 (10.6%) |
Health Insurance Coverage by Citizenship Status in Horsham
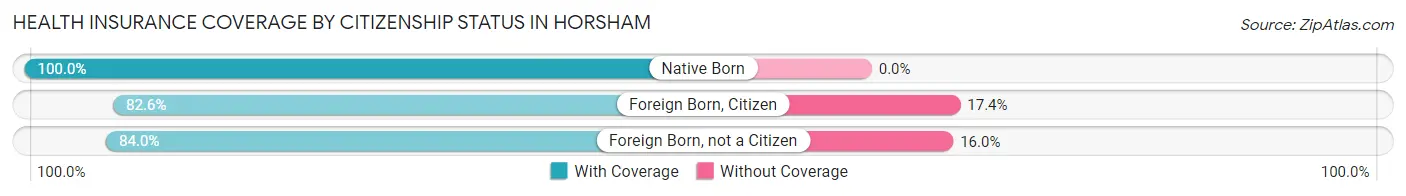
| Citizenship Status | With Coverage | Without Coverage |
| Native Born | 896 (100.0%) | 0 (0.0%) |
| Foreign Born, Citizen | 2,571 (82.6%) | 542 (17.4%) |
| Foreign Born, not a Citizen | 1,186 (84.0%) | 226 (16.0%) |
Health Insurance Coverage by Household Income in Horsham
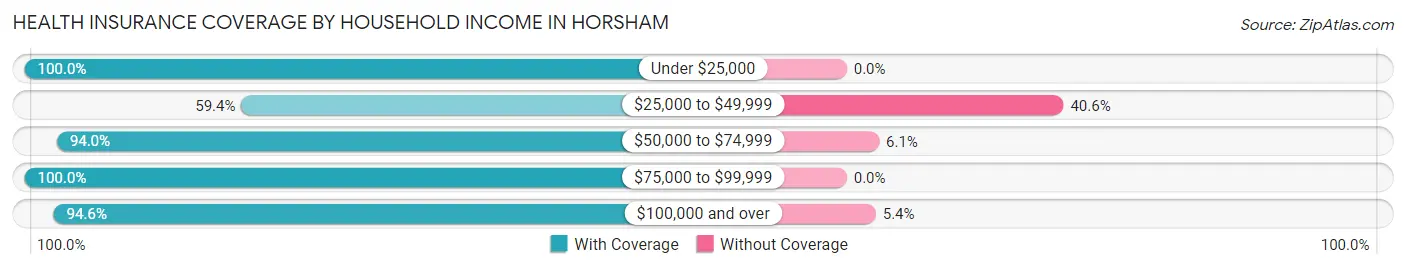
| Household Income | With Coverage | Without Coverage |
| Under $25,000 | 538 (100.0%) | 0 (0.0%) |
| $25,000 to $49,999 | 1,498 (59.4%) | 1,024 (40.6%) |
| $50,000 to $74,999 | 2,440 (94.0%) | 157 (6.0%) |
| $75,000 to $99,999 | 1,209 (100.0%) | 0 (0.0%) |
| $100,000 and over | 8,172 (94.6%) | 469 (5.4%) |
Public vs Private Health Insurance Coverage by Age in Horsham
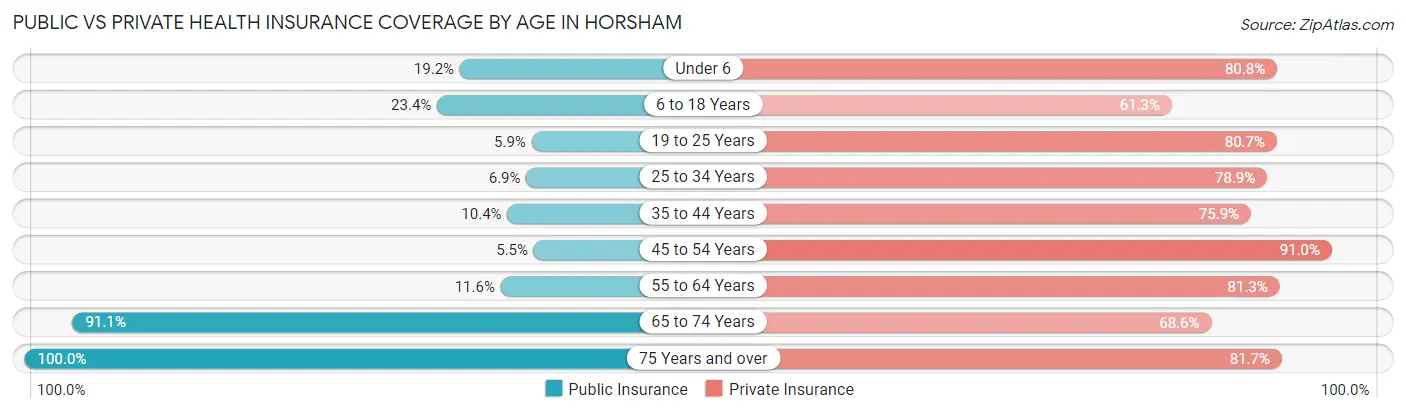
| Age Bracket | Public Insurance | Private Insurance |
| Under 6 | 172 (19.2%) | 724 (80.8%) |
| 6 to 18 Years | 729 (23.4%) | 1,907 (61.3%) |
| 19 to 25 Years | 83 (5.9%) | 1,140 (80.7%) |
| 25 to 34 Years | 156 (6.9%) | 1,795 (78.9%) |
| 35 to 44 Years | 204 (10.4%) | 1,493 (75.9%) |
| 45 to 54 Years | 78 (5.5%) | 1,298 (91.0%) |
| 55 to 64 Years | 240 (11.6%) | 1,678 (81.3%) |
| 65 to 74 Years | 1,557 (91.1%) | 1,172 (68.6%) |
| 75 Years and over | 671 (100.0%) | 548 (81.7%) |
| Total | 3,890 (25.0%) | 11,755 (75.7%) |
Disability Status by Sex by Age in Horsham
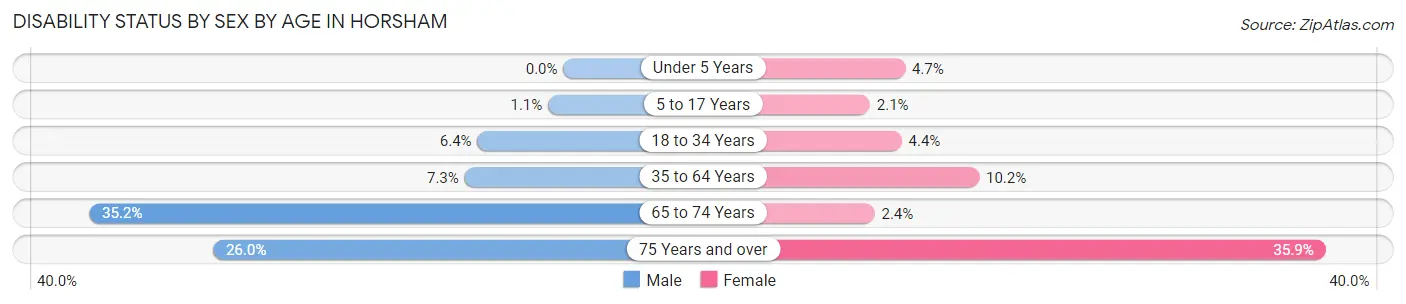
| Age Bracket | Male | Female |
| Under 5 Years | 0 (0.0%) | 15 (4.7%) |
| 5 to 17 Years | 19 (1.1%) | 31 (2.1%) |
| 18 to 34 Years | 107 (6.4%) | 94 (4.4%) |
| 35 to 64 Years | 203 (7.3%) | 274 (10.2%) |
| 65 to 74 Years | 326 (35.2%) | 19 (2.4%) |
| 75 Years and over | 84 (26.0%) | 125 (35.9%) |
Disability Class by Sex by Age in Horsham
Disability Class: Hearing Difficulty
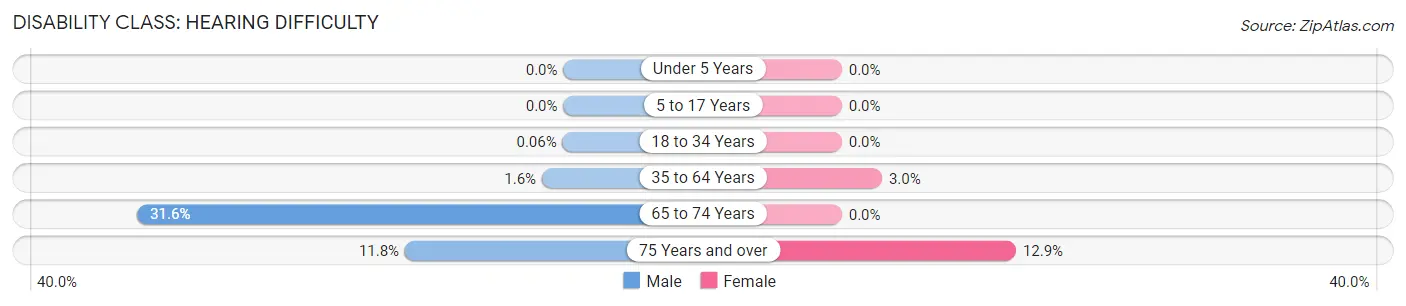
| Age Bracket | Male | Female |
| Under 5 Years | 0 (0.0%) | 0 (0.0%) |
| 5 to 17 Years | 0 (0.0%) | 0 (0.0%) |
| 18 to 34 Years | 1 (0.1%) | 0 (0.0%) |
| 35 to 64 Years | 44 (1.6%) | 80 (3.0%) |
| 65 to 74 Years | 293 (31.6%) | 0 (0.0%) |
| 75 Years and over | 38 (11.8%) | 45 (12.9%) |
Disability Class: Vision Difficulty
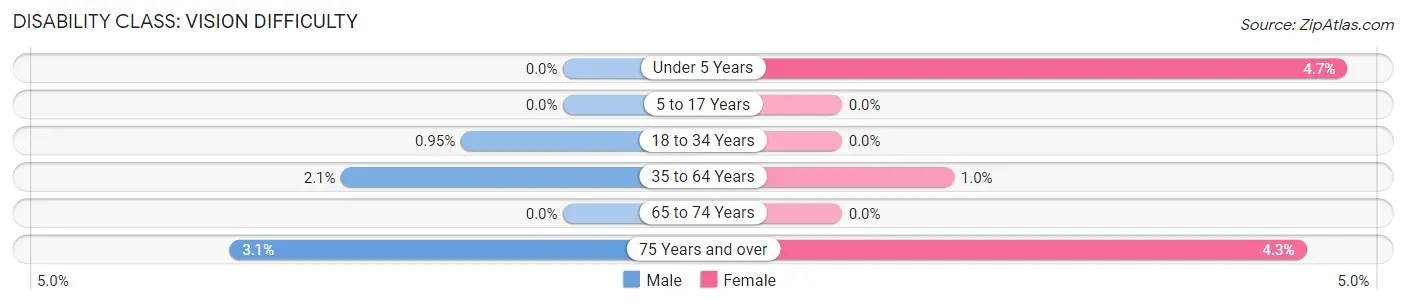
| Age Bracket | Male | Female |
| Under 5 Years | 0 (0.0%) | 15 (4.7%) |
| 5 to 17 Years | 0 (0.0%) | 0 (0.0%) |
| 18 to 34 Years | 16 (0.9%) | 0 (0.0%) |
| 35 to 64 Years | 57 (2.1%) | 28 (1.0%) |
| 65 to 74 Years | 0 (0.0%) | 0 (0.0%) |
| 75 Years and over | 10 (3.1%) | 15 (4.3%) |
Disability Class: Cognitive Difficulty
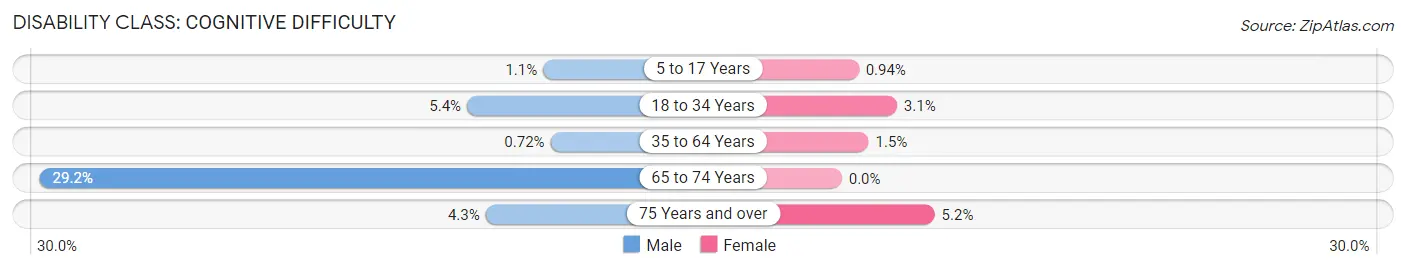
| Age Bracket | Male | Female |
| 5 to 17 Years | 19 (1.1%) | 14 (0.9%) |
| 18 to 34 Years | 90 (5.4%) | 65 (3.1%) |
| 35 to 64 Years | 20 (0.7%) | 40 (1.5%) |
| 65 to 74 Years | 270 (29.2%) | 0 (0.0%) |
| 75 Years and over | 14 (4.3%) | 18 (5.2%) |
Disability Class: Ambulatory Difficulty
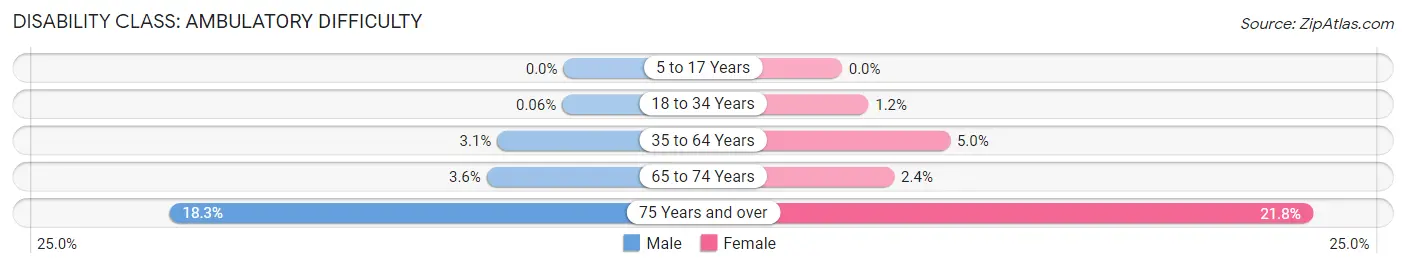
| Age Bracket | Male | Female |
| 5 to 17 Years | 0 (0.0%) | 0 (0.0%) |
| 18 to 34 Years | 1 (0.1%) | 26 (1.2%) |
| 35 to 64 Years | 85 (3.1%) | 135 (5.0%) |
| 65 to 74 Years | 33 (3.6%) | 19 (2.4%) |
| 75 Years and over | 59 (18.3%) | 76 (21.8%) |
Disability Class: Self-Care Difficulty
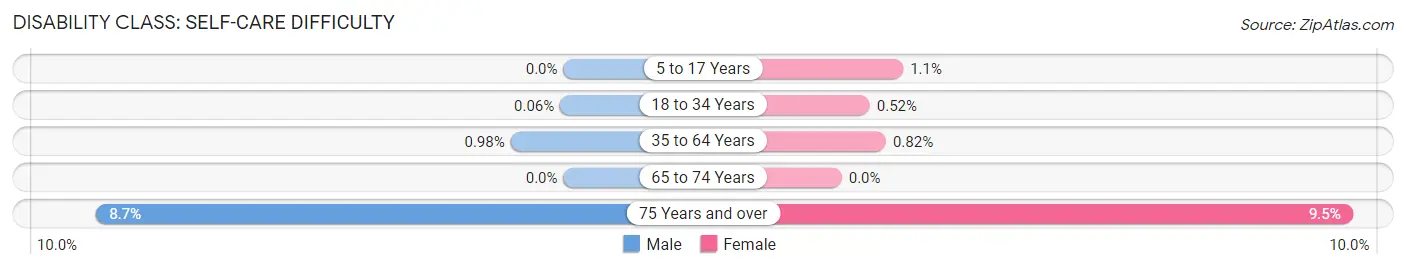
| Age Bracket | Male | Female |
| 5 to 17 Years | 0 (0.0%) | 17 (1.1%) |
| 18 to 34 Years | 1 (0.1%) | 11 (0.5%) |
| 35 to 64 Years | 27 (1.0%) | 22 (0.8%) |
| 65 to 74 Years | 0 (0.0%) | 0 (0.0%) |
| 75 Years and over | 28 (8.7%) | 33 (9.5%) |
Technology Access in Horsham
Computing Device Access in Horsham
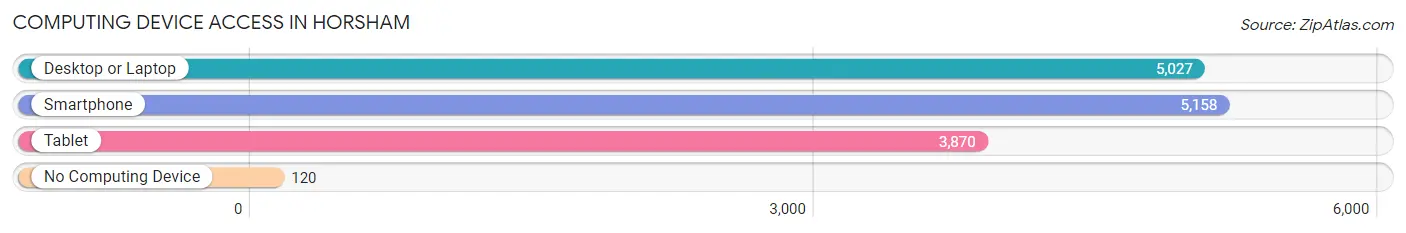
| Device Type | # Households | % Households |
| Desktop or Laptop | 5,027 | 88.6% |
| Smartphone | 5,158 | 90.9% |
| Tablet | 3,870 | 68.2% |
| No Computing Device | 120 | 2.1% |
| Total | 5,674 | 100.0% |
Internet Access in Horsham
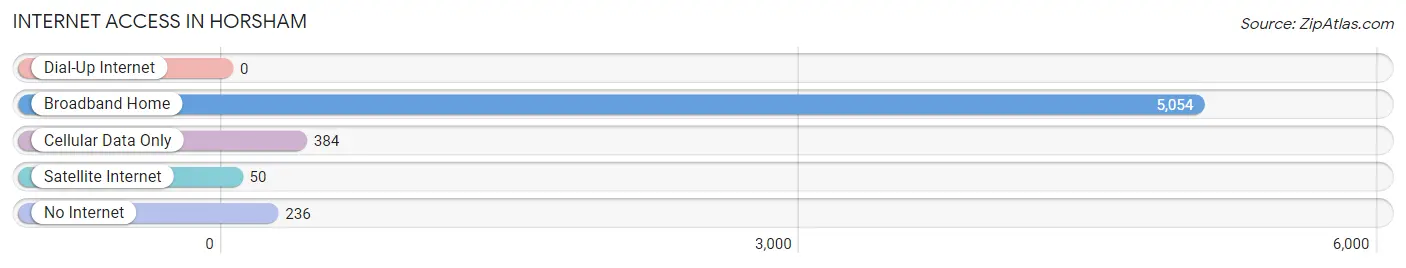
| Internet Type | # Households | % Households |
| Dial-Up Internet | 0 | 0.0% |
| Broadband Home | 5,054 | 89.1% |
| Cellular Data Only | 384 | 6.8% |
| Satellite Internet | 50 | 0.9% |
| No Internet | 236 | 4.2% |
| Total | 5,674 | 100.0% |
Horsham Summary
Horsham is a census-designated place (CDP) located in Montgomery County, Pennsylvania, United States. It is situated approximately 20 miles north of Philadelphia and is part of the North Penn Valley region. The population of Horsham was 15,846 at the 2010 census.
Geography
Horsham is located at 40°13'7" North, 75°7'51" West (40.2187, -75.1309). According to the United States Census Bureau, the CDP has a total area of 8.2 square miles, all of it land.
Horsham is bordered by the townships of Upper Moreland to the north, Warminster to the east, Hatboro to the south, and Montgomery to the west. The CDP is bisected by the Pennsylvania Turnpike (Interstate 276) and is served by the Horsham exit.
Demographics
As of the 2010 census, there were 15,846 people, 5,845 households, and 4,541 families residing in the CDP. The population density was 1,931.2 people per square mile. There were 6,093 housing units at an average density of 743.3 per square mile. The racial makeup of the CDP was 87.2% White, 4.2% African American, 0.2% Native American, 5.7% Asian, 0.1% Pacific Islander, 0.7% from other races, and 1.9% from two or more races. Hispanic or Latino of any race were 2.7% of the population.
There were 5,845 households, out of which 37.2% had children under the age of 18 living with them, 65.2% were married couples living together, 8.2% had a female householder with no husband present, and 23.3% were non-families. 19.2% of all households were made up of individuals, and 8.2% had someone living alone who was 65 years of age or older. The average household size was 2.71 and the average family size was 3.14.
In the CDP, the population was spread out, with 25.9% under the age of 18, 6.2% from 18 to 24, 28.2% from 25 to 44, 27.2% from 45 to 64, and 12.5% who were 65 years of age or older. The median age was 39 years. For every 100 females, there were 94.2 males. For every 100 females age 18 and over, there were 90.7 males.
The median income for a household in the CDP was $76,845, and the median income for a family was $86,945. Males had a median income of $60,945 versus $41,945 for females. The per capita income for the CDP was $32,945. About 1.7% of families and 2.7% of the population were below the poverty line, including 2.7% of those under age 18 and 4.2% of those age 65 or over.
Economy
Horsham is home to several large employers, including the corporate headquarters of Toll Brothers, a Fortune 500 company and one of the nation’s leading builders of luxury homes. Other major employers include the U.S. Army Reserve, Lockheed Martin, and the Pennsylvania Air National Guard.
Horsham is also home to several shopping centers, including the Horsham Town Center, which features a variety of stores and restaurants. The Horsham Power Line Trail, a 3.5-mile walking and biking trail, runs through the town and connects to the larger Pennypack Trail.
Horsham is served by the North Penn School District, which includes several elementary, middle, and high schools. The district also operates the North Penn School of Technology, which offers career and technical education programs.
Conclusion
Horsham is a census-designated place located in Montgomery County, Pennsylvania. It is situated approximately 20 miles north of Philadelphia and is part of the North Penn Valley region. The population of Horsham was 15,846 at the 2010 census. The CDP is bordered by the townships of Upper Moreland to the north, Warminster to the east, Hatboro to the south, and Montgomery to the west. The CDP is bisected by the Pennsylvania Turnpike (Interstate 276) and is served by the Horsham exit. The racial makeup of the CDP was 87.2% White, 4.2% African American, 0.2% Native American, 5.7% Asian, 0.1% Pacific Islander, 0.7% from other races, and 1.9% from two or more races. Hispanic or Latino of any race were 2.7% of the population.
Horsham is home to several large employers, including the corporate headquarters of Toll Brothers, a Fortune 500 company and one of the nation’s leading builders of luxury homes. Other major employers include the U.S. Army Reserve, Lockheed Martin, and the Pennsylvania Air National Guard. Horsham is also home to several shopping centers, including the Horsham Town Center, which features a variety of stores and restaurants. The Horsham Power Line Trail, a 3.5-mile walking and biking trail, runs through the town and connects to the larger Pennypack Trail. Horsham is served by the North Penn School District, which includes several elementary, middle, and high schools. The district also operates the North Penn School of Technology, which offers career and technical education programs.
Common Questions
What is Per Capita Income in Horsham?
Per Capita income in Horsham is $45,576.
What is the Median Family Income in Horsham?
Median Family Income in Horsham is $119,883.
What is the Median Household income in Horsham?
Median Household Income in Horsham is $96,284.
What is Income or Wage Gap in Horsham?
Income or Wage Gap in Horsham is 19.8%.
Women in Horsham earn 80.2 cents for every dollar earned by a man.
What is Inequality or Gini Index in Horsham?
Inequality or Gini Index in Horsham is 0.43.
What is the Total Population of Horsham?
Total Population of Horsham is 15,683.
What is the Total Male Population of Horsham?
Total Male Population of Horsham is 7,825.
What is the Total Female Population of Horsham?
Total Female Population of Horsham is 7,858.
What is the Ratio of Males per 100 Females in Horsham?
There are 99.58 Males per 100 Females in Horsham.
What is the Ratio of Females per 100 Males in Horsham?
There are 100.42 Females per 100 Males in Horsham.
What is the Median Population Age in Horsham?
Median Population Age in Horsham is 35.7 Years.
What is the Average Family Size in Horsham
Average Family Size in Horsham is 3.4 People.
What is the Average Household Size in Horsham
Average Household Size in Horsham is 2.7 People.
How Large is the Labor Force in Horsham?
There are 9,152 People in the Labor Forcein in Horsham.
What is the Percentage of People in the Labor Force in Horsham?
74.7% of People are in the Labor Force in Horsham.
What is the Unemployment Rate in Horsham?
Unemployment Rate in Horsham is 2.9%.