Port Austin, MI Map & Demographics
Port Austin Map
Port Austin Overview
$34,540
PER CAPITA INCOME
$60,750
AVG FAMILY INCOME
$53,125
AVG HOUSEHOLD INCOME
9.5%
WAGE / INCOME GAP [ % ]
90.5¢/ $1
WAGE / INCOME GAP [ $ ]
0.43
INEQUALITY / GINI INDEX
667
TOTAL POPULATION
347
MALE POPULATION
320
FEMALE POPULATION
108.44
MALES / 100 FEMALES
92.22
FEMALES / 100 MALES
55.3
MEDIAN AGE
2.7
AVG FAMILY SIZE
1.9
AVG HOUSEHOLD SIZE
338
LABOR FORCE [ PEOPLE ]
53.3%
PERCENT IN LABOR FORCE
8.2%
UNEMPLOYMENT RATE
Port Austin Zip Codes
Port Austin Area Codes
Income in Port Austin
Income Overview in Port Austin
Per Capita Income in Port Austin is $34,540, while median incomes of families and households are $60,750 and $53,125 respectively.
| Characteristic | Number | Measure |
| Per Capita Income | 667 | $34,540 |
| Median Family Income | 141 | $60,750 |
| Mean Family Income | 141 | $71,426 |
| Median Household Income | 328 | $53,125 |
| Mean Household Income | 328 | $63,198 |
| Income Deficit | 141 | $0 |
| Wage / Income Gap (%) | 667 | 9.55% |
| Wage / Income Gap ($) | 667 | 90.45¢ per $1 |
| Gini / Inequality Index | 667 | 0.43 |
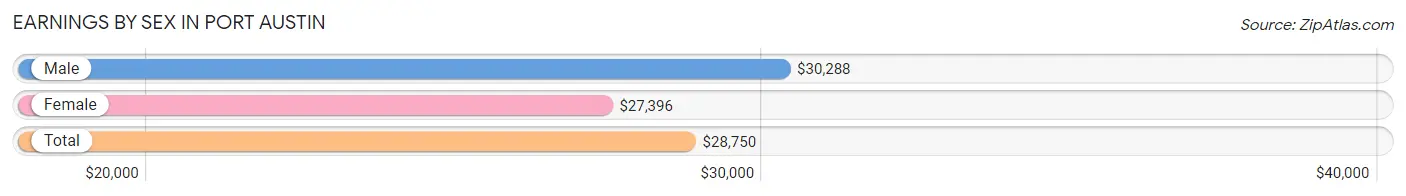
Earnings by Sex in Port Austin
Average Earnings in Port Austin are $28,750, $30,288 for men and $27,396 for women, a difference of 9.6%.
| Sex | Number | Average Earnings |
| Male | 187 (54.4%) | $30,288 |
| Female | 157 (45.6%) | $27,396 |
| Total | 344 (100.0%) | $28,750 |
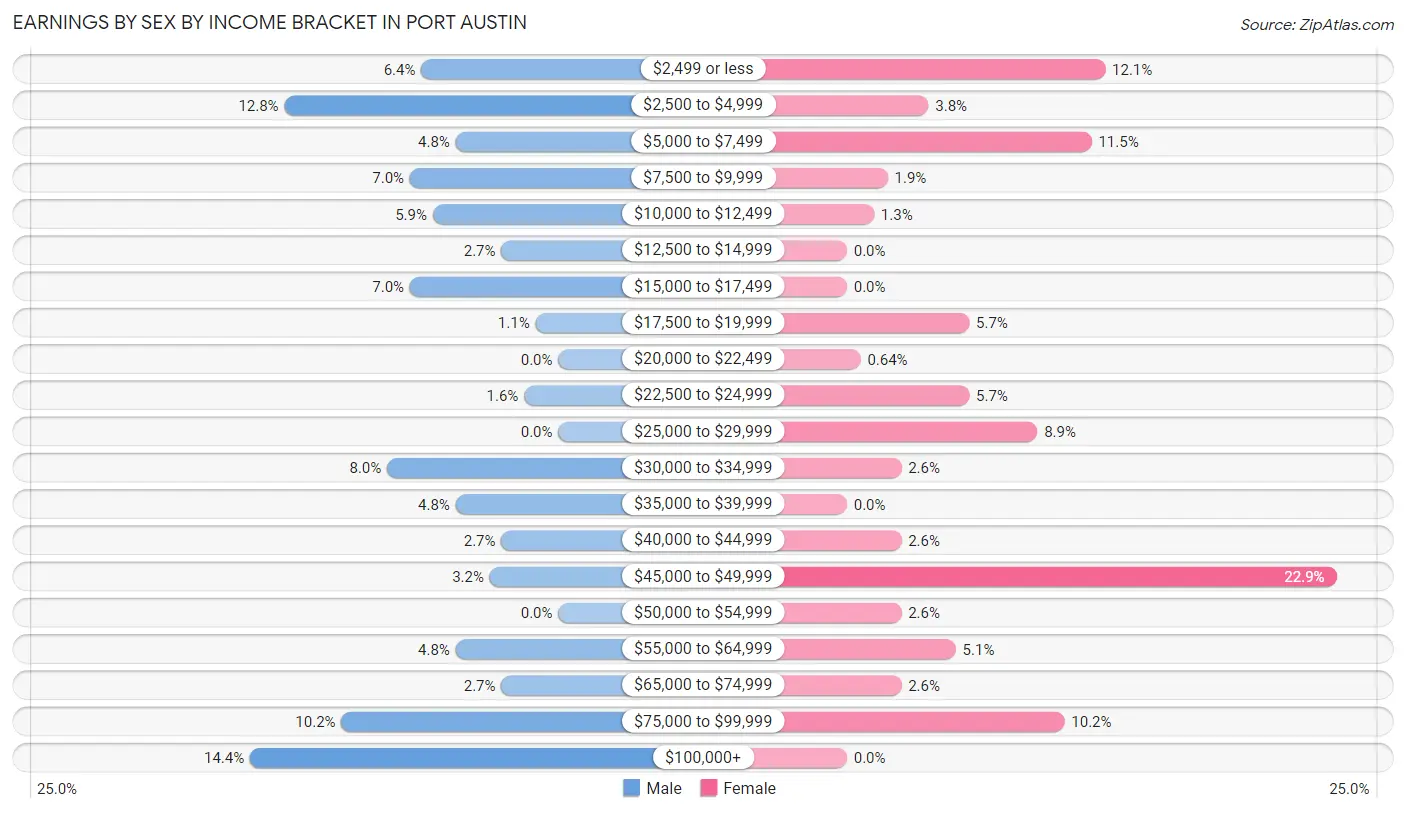
Earnings by Sex by Income Bracket in Port Austin
The most common earnings brackets in Port Austin are $100,000+ for men (27 | 14.4%) and $45,000 to $49,999 for women (36 | 22.9%).
| Income | Male | Female |
| $2,499 or less | 12 (6.4%) | 19 (12.1%) |
| $2,500 to $4,999 | 24 (12.8%) | 6 (3.8%) |
| $5,000 to $7,499 | 9 (4.8%) | 18 (11.5%) |
| $7,500 to $9,999 | 13 (7.0%) | 3 (1.9%) |
| $10,000 to $12,499 | 11 (5.9%) | 2 (1.3%) |
| $12,500 to $14,999 | 5 (2.7%) | 0 (0.0%) |
| $15,000 to $17,499 | 13 (7.0%) | 0 (0.0%) |
| $17,500 to $19,999 | 2 (1.1%) | 9 (5.7%) |
| $20,000 to $22,499 | 0 (0.0%) | 1 (0.6%) |
| $22,500 to $24,999 | 3 (1.6%) | 9 (5.7%) |
| $25,000 to $29,999 | 0 (0.0%) | 14 (8.9%) |
| $30,000 to $34,999 | 15 (8.0%) | 4 (2.5%) |
| $35,000 to $39,999 | 9 (4.8%) | 0 (0.0%) |
| $40,000 to $44,999 | 5 (2.7%) | 4 (2.5%) |
| $45,000 to $49,999 | 6 (3.2%) | 36 (22.9%) |
| $50,000 to $54,999 | 0 (0.0%) | 4 (2.5%) |
| $55,000 to $64,999 | 9 (4.8%) | 8 (5.1%) |
| $65,000 to $74,999 | 5 (2.7%) | 4 (2.5%) |
| $75,000 to $99,999 | 19 (10.2%) | 16 (10.2%) |
| $100,000+ | 27 (14.4%) | 0 (0.0%) |
| Total | 187 (100.0%) | 157 (100.0%) |
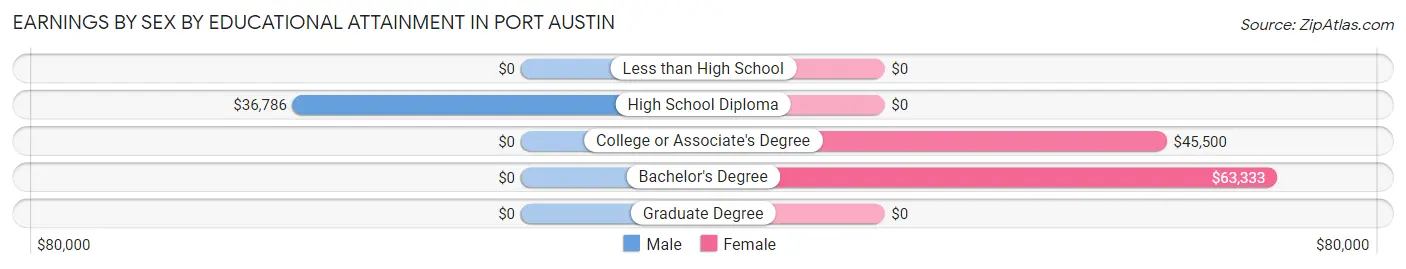
Earnings by Sex by Educational Attainment in Port Austin
Average earnings in Port Austin are $41,750 for men and $45,391 for women, a difference of 8.0%. Men with an educational attainment of high school diploma enjoy the highest average annual earnings of $36,786, while those with high school diploma education earn the least with $36,786. Women with an educational attainment of bachelor's degree earn the most with the average annual earnings of $63,333, while those with college or associate's degree education have the smallest earnings of $45,500.
| Educational Attainment | Male Income | Female Income |
| Less than High School | - | - |
| High School Diploma | $36,786 | $0 |
| College or Associate's Degree | - | - |
| Bachelor's Degree | - | - |
| Graduate Degree | - | - |
| Total | $41,750 | $45,391 |
Family Income in Port Austin
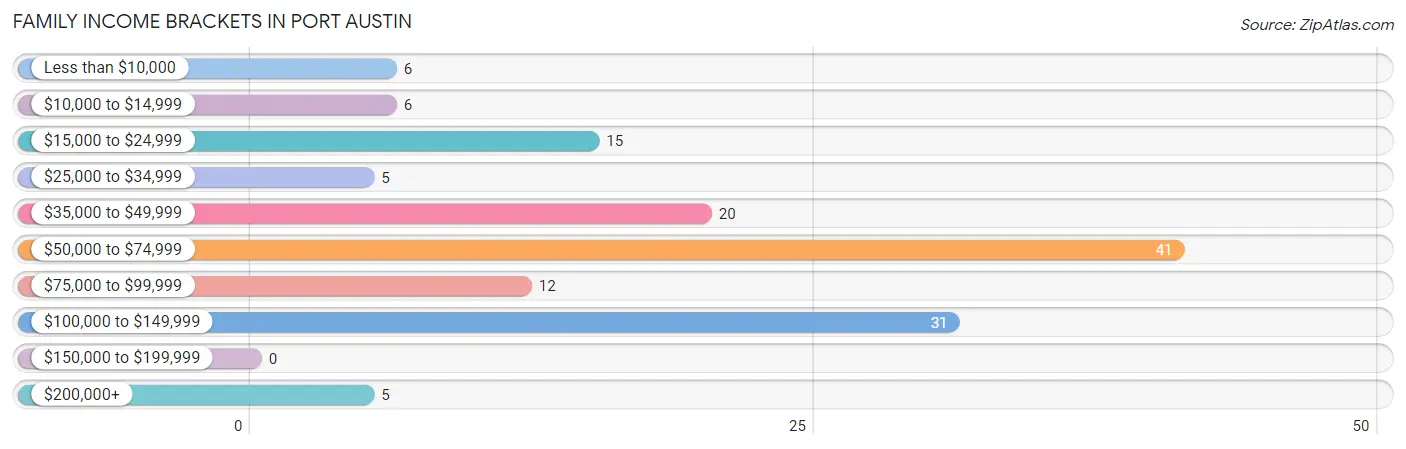
Family Income Brackets in Port Austin
According to the Port Austin family income data, there are 41 families falling into the $50,000 to $74,999 income range, which is the most common income bracket and makes up 29.1% of all families.
| Income Bracket | # Families | % Families |
| Less than $10,000 | 6 | 4.3% |
| $10,000 to $14,999 | 6 | 4.3% |
| $15,000 to $24,999 | 15 | 10.6% |
| $25,000 to $34,999 | 5 | 3.5% |
| $35,000 to $49,999 | 20 | 14.2% |
| $50,000 to $74,999 | 41 | 29.1% |
| $75,000 to $99,999 | 12 | 8.5% |
| $100,000 to $149,999 | 31 | 22.0% |
| $150,000 to $199,999 | 0 | 0.0% |
| $200,000+ | 5 | 3.5% |
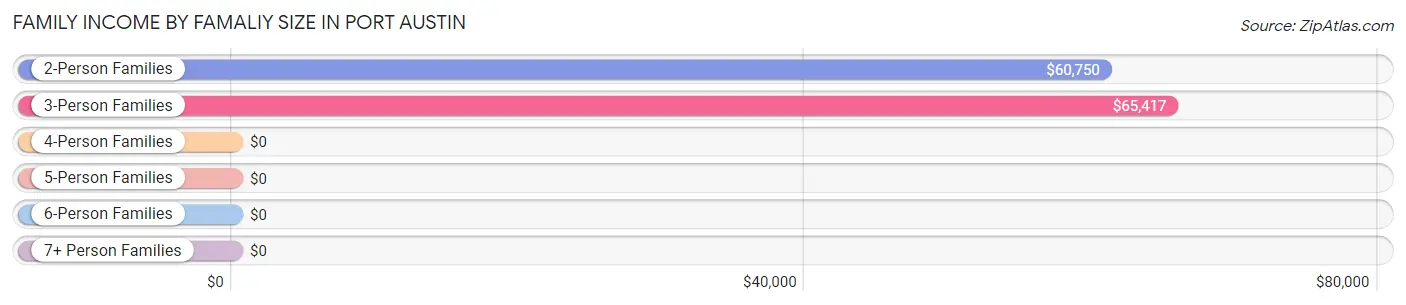
Family Income by Famaliy Size in Port Austin
3-person families (47 | 33.3%) account for the highest median family income in Port Austin with $65,417 per family, while 2-person families (93 | 66.0%) have the highest median income of $30,375 per family member.
| Income Bracket | # Families | Median Income |
| 2-Person Families | 93 (66.0%) | $60,750 |
| 3-Person Families | 47 (33.3%) | $65,417 |
| 4-Person Families | 1 (0.7%) | $0 |
| 5-Person Families | 0 (0.0%) | $0 |
| 6-Person Families | 0 (0.0%) | $0 |
| 7+ Person Families | 0 (0.0%) | $0 |
| Total | 141 (100.0%) | $60,750 |
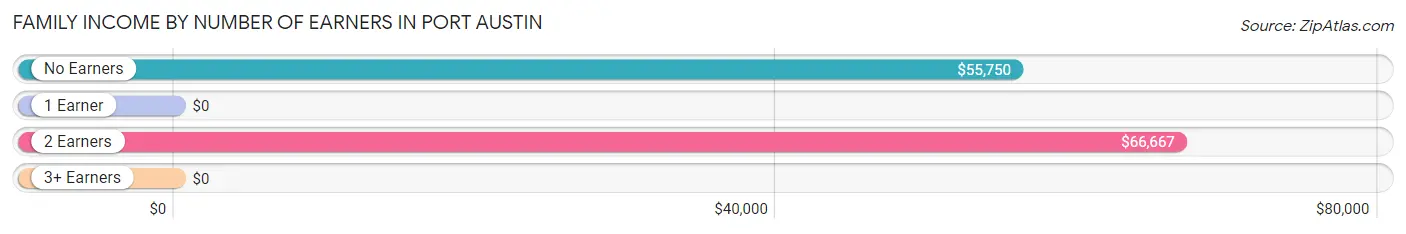
Family Income by Number of Earners in Port Austin
| Number of Earners | # Families | Median Income |
| No Earners | 51 (36.2%) | $55,750 |
| 1 Earner | 52 (36.9%) | $0 |
| 2 Earners | 20 (14.2%) | $66,667 |
| 3+ Earners | 18 (12.8%) | $0 |
| Total | 141 (100.0%) | $60,750 |
Household Income in Port Austin
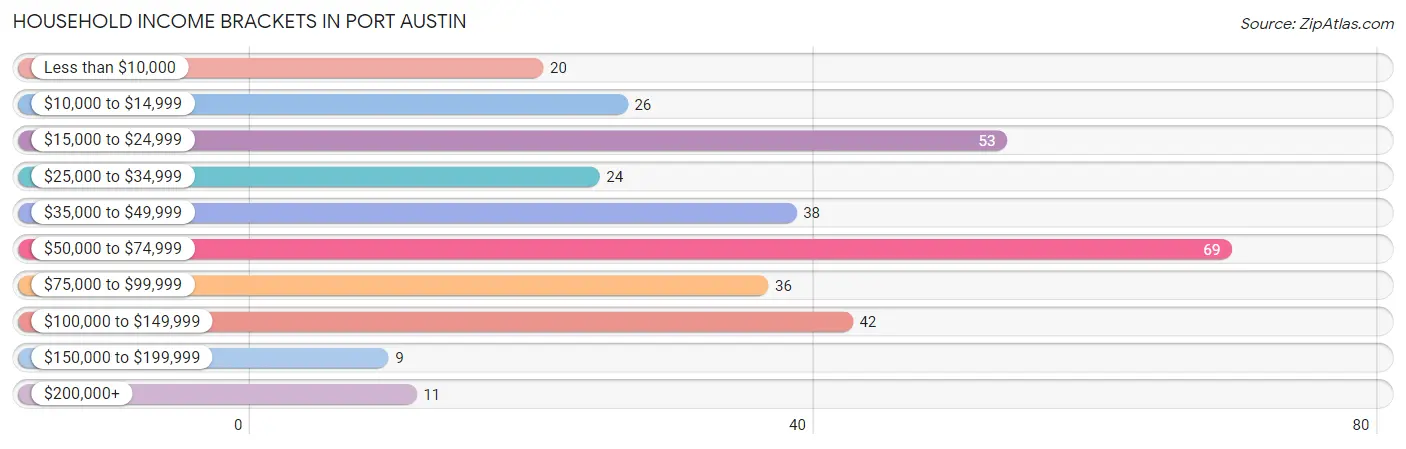
Household Income Brackets in Port Austin
With 69 households falling in the category, the $50,000 to $74,999 income range is the most frequent in Port Austin, accounting for 21.0% of all households. In contrast, only 9 households (2.7%) fall into the $150,000 to $199,999 income bracket, making it the least populous group.
| Income Bracket | # Households | % Households |
| Less than $10,000 | 20 | 6.1% |
| $10,000 to $14,999 | 26 | 7.9% |
| $15,000 to $24,999 | 53 | 16.2% |
| $25,000 to $34,999 | 24 | 7.3% |
| $35,000 to $49,999 | 38 | 11.6% |
| $50,000 to $74,999 | 69 | 21.0% |
| $75,000 to $99,999 | 36 | 11.0% |
| $100,000 to $149,999 | 42 | 12.8% |
| $150,000 to $199,999 | 9 | 2.7% |
| $200,000+ | 11 | 3.4% |
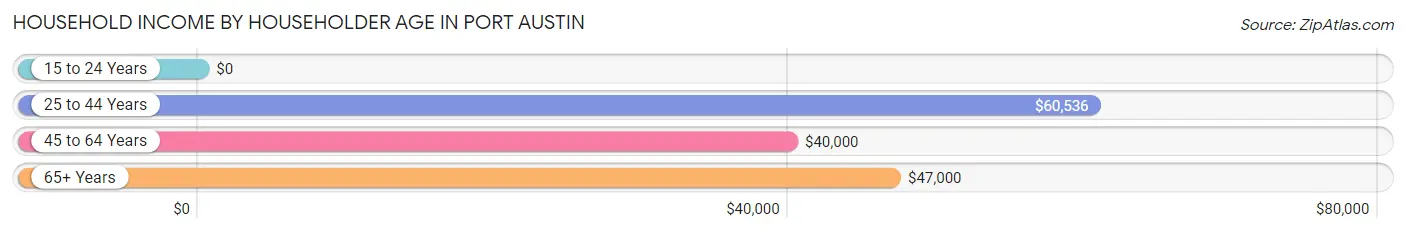
Household Income by Householder Age in Port Austin
The median household income in Port Austin is $53,125, with the highest median household income of $60,536 found in the 25 to 44 years age bracket for the primary householder. A total of 67 households (20.4%) fall into this category. Meanwhile, the 15 to 24 years age bracket for the primary householder has the lowest median household income of $0, with 9 households (2.7%) in this group.
| Income Bracket | # Households | Median Income |
| 15 to 24 Years | 9 (2.7%) | $0 |
| 25 to 44 Years | 67 (20.4%) | $60,536 |
| 45 to 64 Years | 112 (34.2%) | $40,000 |
| 65+ Years | 140 (42.7%) | $47,000 |
| Total | 328 (100.0%) | $53,125 |
Poverty in Port Austin
Income Below Poverty by Sex and Age in Port Austin
With 25.7% poverty level for males and 9.7% for females among the residents of Port Austin, 5 year old males and 6 to 11 year old females are the most vulnerable to poverty, with 2 males (100.0%) and 5 females (100.0%) in their respective age groups living below the poverty level.
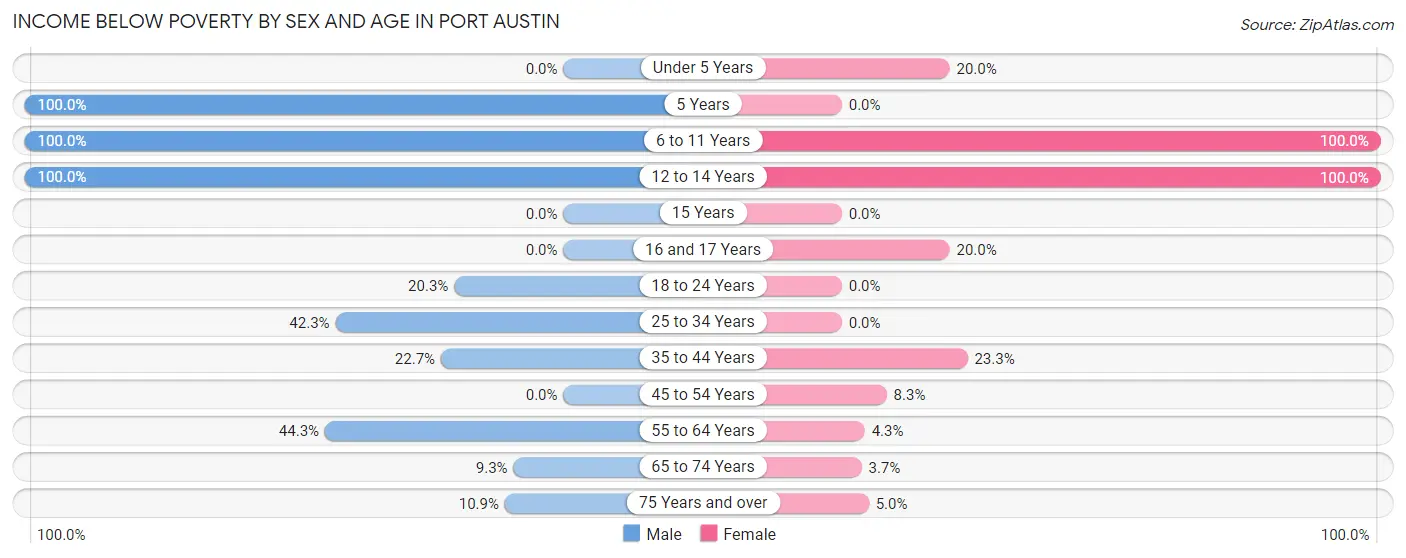
| Age Bracket | Male | Female |
| Under 5 Years | 0 (0.0%) | 2 (20.0%) |
| 5 Years | 2 (100.0%) | 0 (0.0%) |
| 6 to 11 Years | 4 (100.0%) | 5 (100.0%) |
| 12 to 14 Years | 3 (100.0%) | 4 (100.0%) |
| 15 Years | 0 (0.0%) | 0 (0.0%) |
| 16 and 17 Years | 0 (0.0%) | 3 (20.0%) |
| 18 to 24 Years | 15 (20.3%) | 0 (0.0%) |
| 25 to 34 Years | 22 (42.3%) | 0 (0.0%) |
| 35 to 44 Years | 5 (22.7%) | 7 (23.3%) |
| 45 to 54 Years | 0 (0.0%) | 3 (8.3%) |
| 55 to 64 Years | 27 (44.3%) | 2 (4.3%) |
| 65 to 74 Years | 5 (9.3%) | 3 (3.7%) |
| 75 Years and over | 5 (10.9%) | 2 (5.0%) |
| Total | 88 (25.7%) | 31 (9.7%) |
Income Above Poverty by Sex and Age in Port Austin
According to the poverty statistics in Port Austin, males aged under 5 years and females aged 18 to 24 years are the age groups that are most secure financially, with 100.0% of males and 100.0% of females in these age groups living above the poverty line.
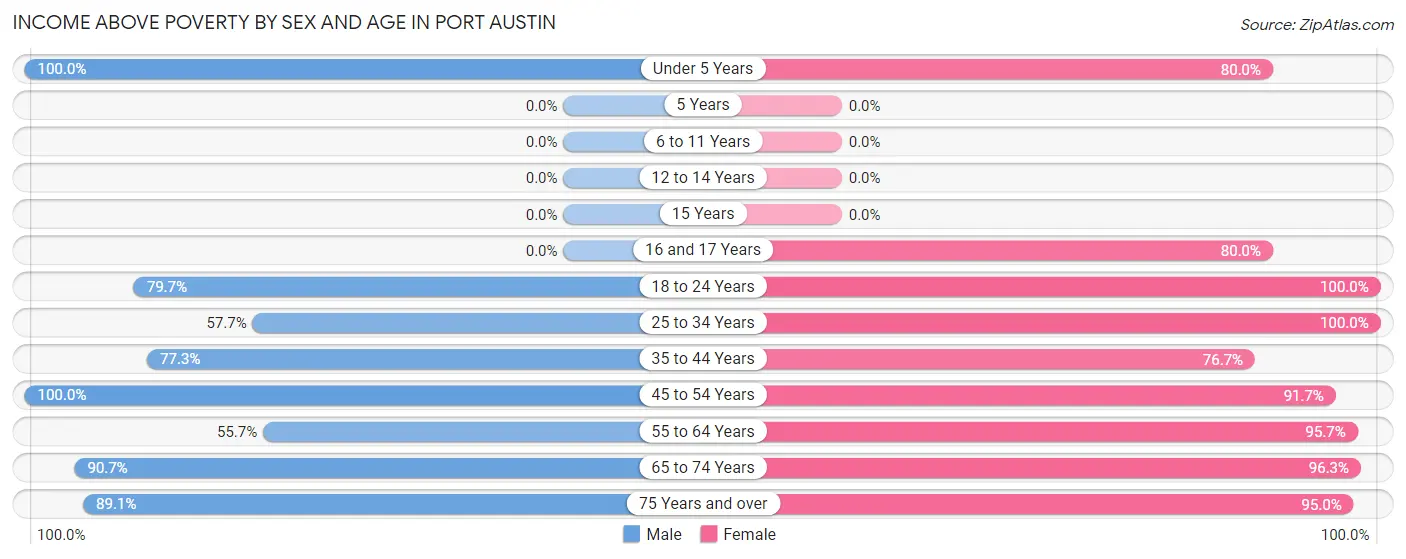
| Age Bracket | Male | Female |
| Under 5 Years | 5 (100.0%) | 8 (80.0%) |
| 5 Years | 0 (0.0%) | 0 (0.0%) |
| 6 to 11 Years | 0 (0.0%) | 0 (0.0%) |
| 12 to 14 Years | 0 (0.0%) | 0 (0.0%) |
| 15 Years | 0 (0.0%) | 0 (0.0%) |
| 16 and 17 Years | 0 (0.0%) | 12 (80.0%) |
| 18 to 24 Years | 59 (79.7%) | 46 (100.0%) |
| 25 to 34 Years | 30 (57.7%) | 5 (100.0%) |
| 35 to 44 Years | 17 (77.3%) | 23 (76.7%) |
| 45 to 54 Years | 19 (100.0%) | 33 (91.7%) |
| 55 to 64 Years | 34 (55.7%) | 45 (95.7%) |
| 65 to 74 Years | 49 (90.7%) | 79 (96.3%) |
| 75 Years and over | 41 (89.1%) | 38 (95.0%) |
| Total | 254 (74.3%) | 289 (90.3%) |
Income Below Poverty Among Married-Couple Families in Port Austin
The poverty statistics for married-couple families in Port Austin show that 5.8% or 6 of the total 103 families live below the poverty line. Families with no children have the highest poverty rate of 6.1%, comprising of 6 families. On the other hand, families with 1 or 2 children have the lowest poverty rate of 0.0%, which includes 0 families.
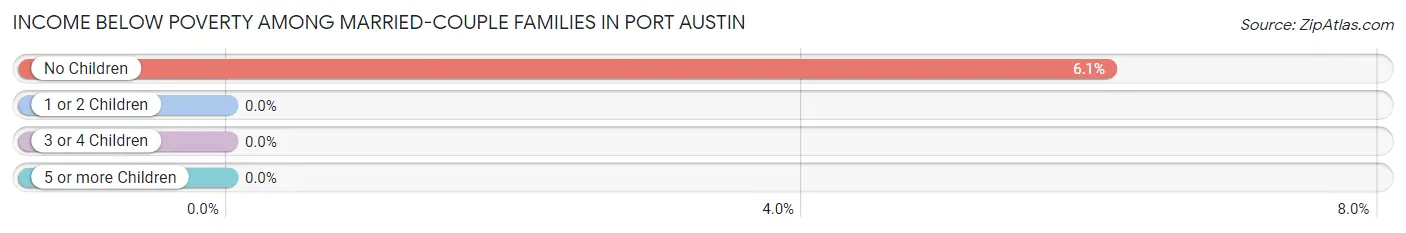
| Children | Above Poverty | Below Poverty |
| No Children | 92 (93.9%) | 6 (6.1%) |
| 1 or 2 Children | 5 (100.0%) | 0 (0.0%) |
| 3 or 4 Children | 0 (0.0%) | 0 (0.0%) |
| 5 or more Children | 0 (0.0%) | 0 (0.0%) |
| Total | 97 (94.2%) | 6 (5.8%) |
Income Below Poverty Among Single-Parent Households in Port Austin
According to the poverty data in Port Austin, 36.4% or 4 single-father households and 25.9% or 7 single-mother households are living below the poverty line. Among single-father households, those with 1 or 2 children have the highest poverty rate, with 4 households (36.4%) experiencing poverty. Likewise, among single-mother households, those with 3 or 4 children have the highest poverty rate, with 1 households (100.0%) falling below the poverty line.
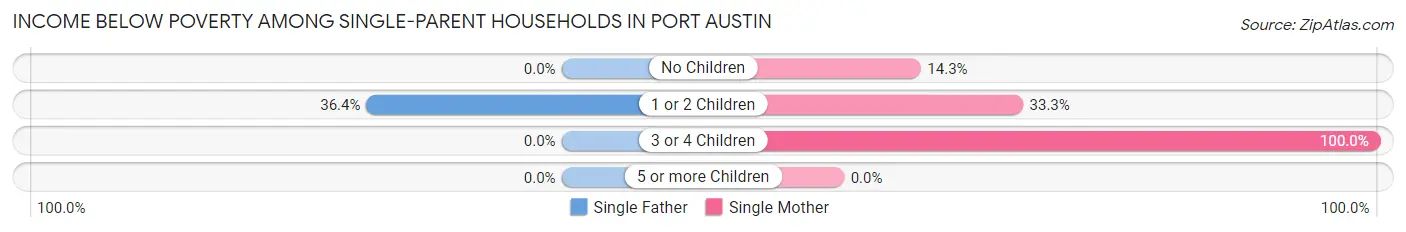
| Children | Single Father | Single Mother |
| No Children | 0 (0.0%) | 2 (14.3%) |
| 1 or 2 Children | 4 (36.4%) | 4 (33.3%) |
| 3 or 4 Children | 0 (0.0%) | 1 (100.0%) |
| 5 or more Children | 0 (0.0%) | 0 (0.0%) |
| Total | 4 (36.4%) | 7 (25.9%) |
Income Below Poverty Among Married-Couple vs Single-Parent Households in Port Austin
The poverty data for Port Austin shows that 6 of the married-couple family households (5.8%) and 11 of the single-parent households (28.9%) are living below the poverty level. Within the married-couple family households, those with no children have the highest poverty rate, with 6 households (6.1%) falling below the poverty line. Among the single-parent households, those with 3 or 4 children have the highest poverty rate, with 1 household (100.0%) living below poverty.
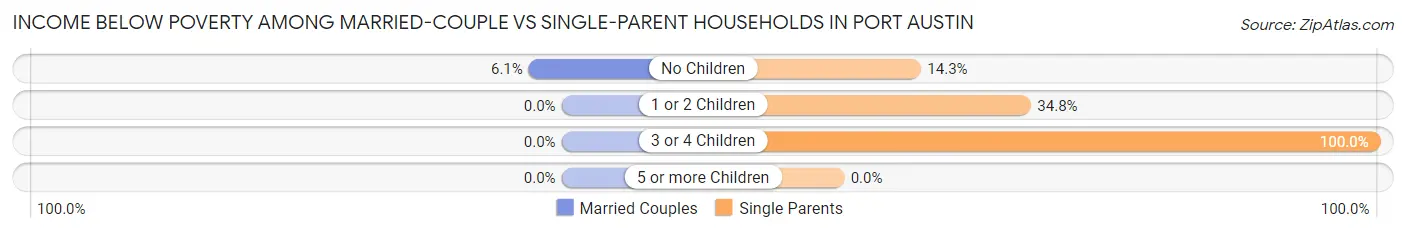
| Children | Married-Couple Families | Single-Parent Households |
| No Children | 6 (6.1%) | 2 (14.3%) |
| 1 or 2 Children | 0 (0.0%) | 8 (34.8%) |
| 3 or 4 Children | 0 (0.0%) | 1 (100.0%) |
| 5 or more Children | 0 (0.0%) | 0 (0.0%) |
| Total | 6 (5.8%) | 11 (28.9%) |
Race in Port Austin
The most populous races in Port Austin are White / Caucasian (565 | 84.7%), Hispanic or Latino (99 | 14.8%), and Two or more Races (51 | 7.6%).
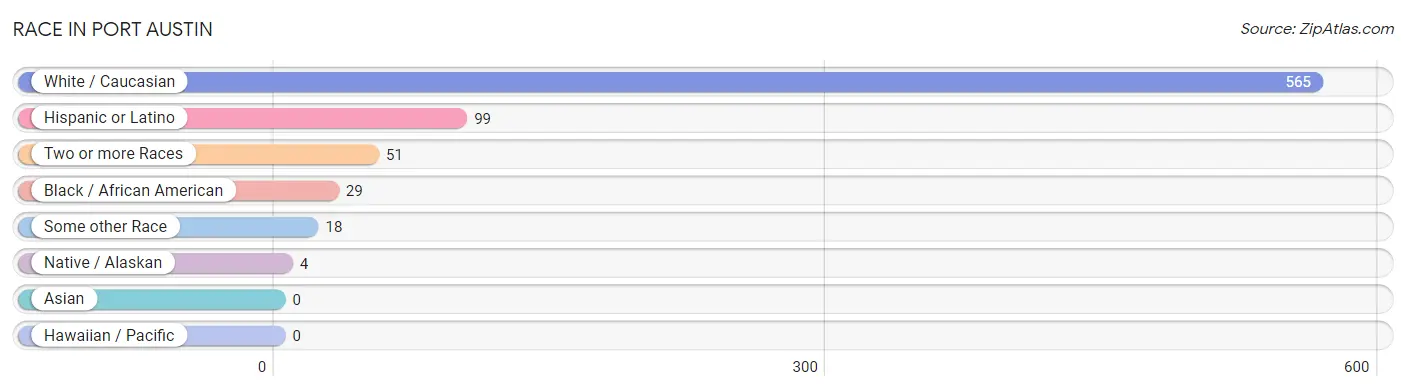
| Race | # Population | % Population |
| Asian | 0 | 0.0% |
| Black / African American | 29 | 4.3% |
| Hawaiian / Pacific | 0 | 0.0% |
| Hispanic or Latino | 99 | 14.8% |
| Native / Alaskan | 4 | 0.6% |
| White / Caucasian | 565 | 84.7% |
| Two or more Races | 51 | 7.6% |
| Some other Race | 18 | 2.7% |
| Total | 667 | 100.0% |
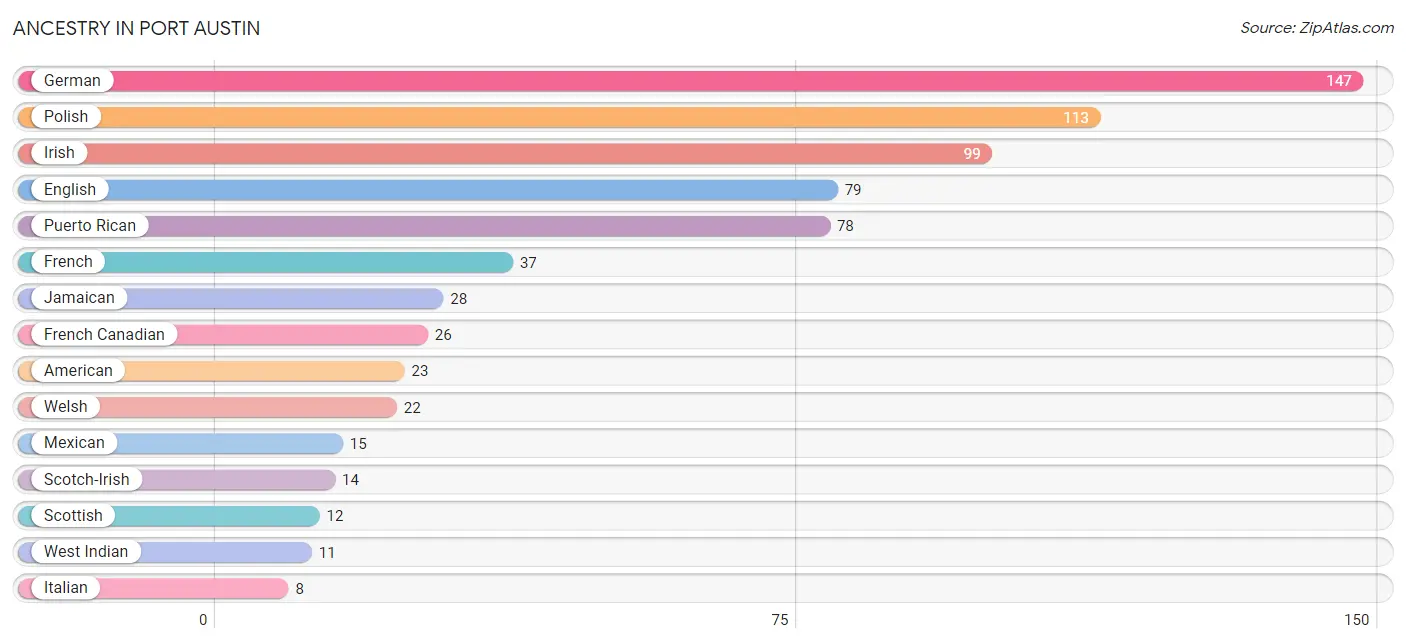
Ancestry in Port Austin
The most populous ancestries reported in Port Austin are German (147 | 22.0%), Polish (113 | 16.9%), Irish (99 | 14.8%), English (79 | 11.8%), and Puerto Rican (78 | 11.7%), together accounting for 77.4% of all Port Austin residents.
| Ancestry | # Population | % Population |
| American | 23 | 3.5% |
| British | 3 | 0.4% |
| Canadian | 2 | 0.3% |
| Central American | 6 | 0.9% |
| Croatian | 2 | 0.3% |
| Czechoslovakian | 2 | 0.3% |
| Dutch | 3 | 0.4% |
| English | 79 | 11.8% |
| European | 2 | 0.3% |
| French | 37 | 5.6% |
| French American Indian | 2 | 0.3% |
| French Canadian | 26 | 3.9% |
| German | 147 | 22.0% |
| Hungarian | 3 | 0.4% |
| Irish | 99 | 14.8% |
| Iroquois | 2 | 0.3% |
| Italian | 8 | 1.2% |
| Jamaican | 28 | 4.2% |
| Mexican | 15 | 2.2% |
| Panamanian | 6 | 0.9% |
| Pennsylvania German | 2 | 0.3% |
| Polish | 113 | 16.9% |
| Potawatomi | 2 | 0.3% |
| Puerto Rican | 78 | 11.7% |
| Romanian | 5 | 0.7% |
| Scandinavian | 2 | 0.3% |
| Scotch-Irish | 14 | 2.1% |
| Scottish | 12 | 1.8% |
| Slovak | 2 | 0.3% |
| Swedish | 1 | 0.2% |
| Ukrainian | 4 | 0.6% |
| Welsh | 22 | 3.3% |
| West Indian | 11 | 1.7% | View All 33 Rows |
Immigrants in Port Austin
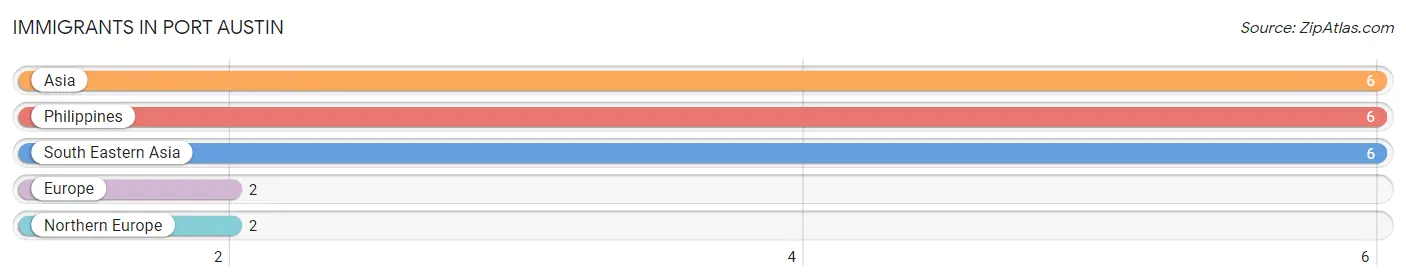
The most numerous immigrant groups reported in Port Austin came from Asia (6 | 0.9%), Philippines (6 | 0.9%), South Eastern Asia (6 | 0.9%), Europe (2 | 0.3%), and Northern Europe (2 | 0.3%), together accounting for 3.3% of all Port Austin residents.
| Immigration Origin | # Population | % Population |
| Asia | 6 | 0.9% |
| Europe | 2 | 0.3% |
| Northern Europe | 2 | 0.3% |
| Philippines | 6 | 0.9% |
| South Eastern Asia | 6 | 0.9% | View All 5 Rows |
Sex and Age in Port Austin
Sex and Age in Port Austin
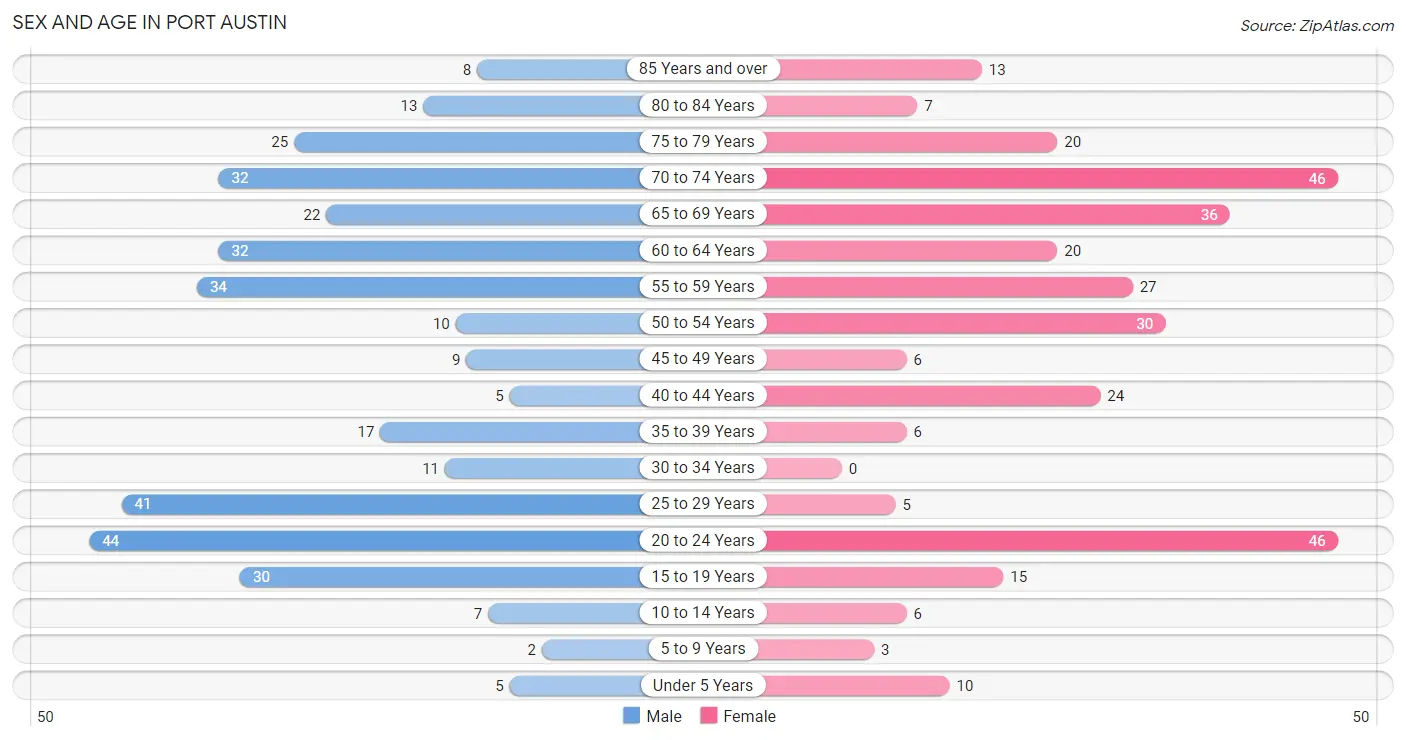
The most populous age groups in Port Austin are 20 to 24 Years (44 | 12.7%) for men and 20 to 24 Years (46 | 14.4%) for women.
| Age Bracket | Male | Female |
| Under 5 Years | 5 (1.4%) | 10 (3.1%) |
| 5 to 9 Years | 2 (0.6%) | 3 (0.9%) |
| 10 to 14 Years | 7 (2.0%) | 6 (1.9%) |
| 15 to 19 Years | 30 (8.6%) | 15 (4.7%) |
| 20 to 24 Years | 44 (12.7%) | 46 (14.4%) |
| 25 to 29 Years | 41 (11.8%) | 5 (1.6%) |
| 30 to 34 Years | 11 (3.2%) | 0 (0.0%) |
| 35 to 39 Years | 17 (4.9%) | 6 (1.9%) |
| 40 to 44 Years | 5 (1.4%) | 24 (7.5%) |
| 45 to 49 Years | 9 (2.6%) | 6 (1.9%) |
| 50 to 54 Years | 10 (2.9%) | 30 (9.4%) |
| 55 to 59 Years | 34 (9.8%) | 27 (8.4%) |
| 60 to 64 Years | 32 (9.2%) | 20 (6.2%) |
| 65 to 69 Years | 22 (6.3%) | 36 (11.3%) |
| 70 to 74 Years | 32 (9.2%) | 46 (14.4%) |
| 75 to 79 Years | 25 (7.2%) | 20 (6.2%) |
| 80 to 84 Years | 13 (3.7%) | 7 (2.2%) |
| 85 Years and over | 8 (2.3%) | 13 (4.1%) |
| Total | 347 (100.0%) | 320 (100.0%) |
Families and Households in Port Austin
Median Family Size in Port Austin
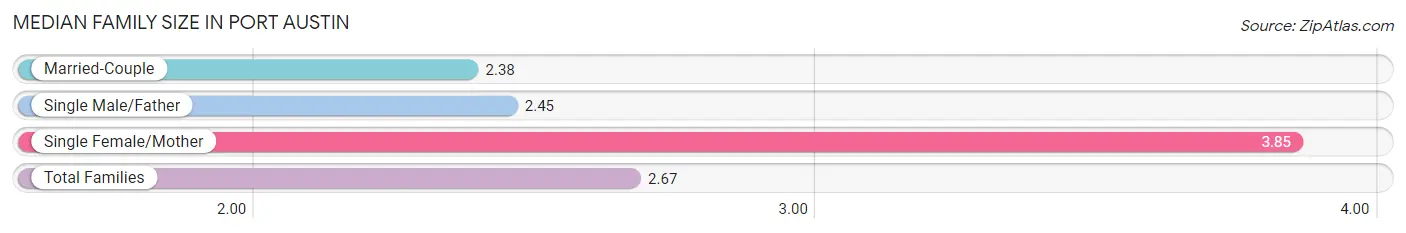
The median family size in Port Austin is 2.67 persons per family, with single female/mother families (27 | 19.2%) accounting for the largest median family size of 3.85 persons per family. On the other hand, married-couple families (103 | 73.1%) represent the smallest median family size with 2.38 persons per family.
| Family Type | # Families | Family Size |
| Married-Couple | 103 (73.1%) | 2.38 |
| Single Male/Father | 11 (7.8%) | 2.45 |
| Single Female/Mother | 27 (19.2%) | 3.85 |
| Total Families | 141 (100.0%) | 2.67 |
Median Household Size in Port Austin
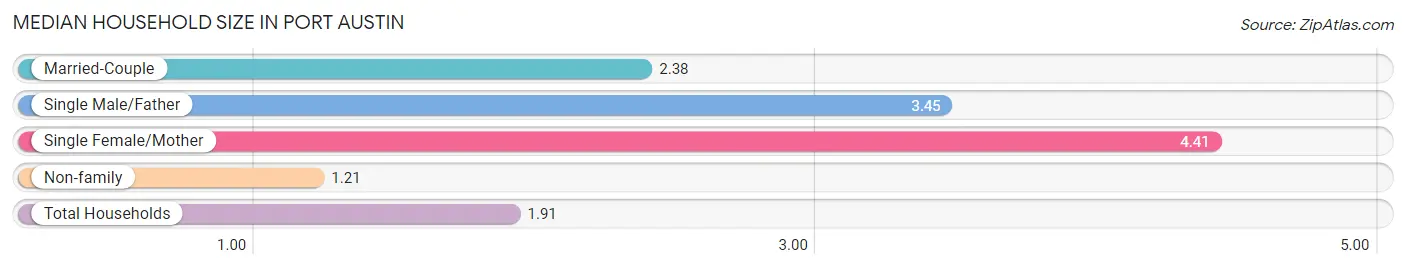
The median household size in Port Austin is 1.91 persons per household, with single female/mother households (27 | 8.2%) accounting for the largest median household size of 4.41 persons per household. non-family households (187 | 57.0%) represent the smallest median household size with 1.21 persons per household.
| Household Type | # Households | Household Size |
| Married-Couple | 103 (31.4%) | 2.38 |
| Single Male/Father | 11 (3.4%) | 3.45 |
| Single Female/Mother | 27 (8.2%) | 4.41 |
| Non-family | 187 (57.0%) | 1.21 |
| Total Households | 328 (100.0%) | 1.91 |
Household Size by Marriage Status in Port Austin
Out of a total of 328 households in Port Austin, 141 (43.0%) are family households, while 187 (57.0%) are nonfamily households. The most numerous type of family households are 2-person households, comprising 86, and the most common type of nonfamily households are 1-person households, comprising 165.
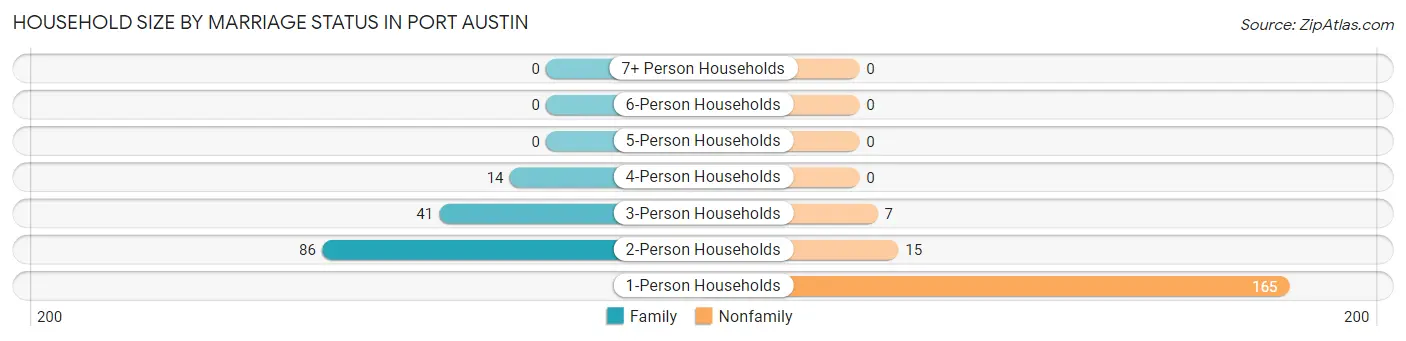
| Household Size | Family Households | Nonfamily Households |
| 1-Person Households | - | 165 (50.3%) |
| 2-Person Households | 86 (26.2%) | 15 (4.6%) |
| 3-Person Households | 41 (12.5%) | 7 (2.1%) |
| 4-Person Households | 14 (4.3%) | 0 (0.0%) |
| 5-Person Households | 0 (0.0%) | 0 (0.0%) |
| 6-Person Households | 0 (0.0%) | 0 (0.0%) |
| 7+ Person Households | 0 (0.0%) | 0 (0.0%) |
| Total | 141 (43.0%) | 187 (57.0%) |
Female Fertility in Port Austin
Fertility by Age in Port Austin
| Age Bracket | Women with Births | Births / 1,000 Women |
| 15 to 19 years | 0 (0.0%) | 0.0 |
| 20 to 34 years | 0 (0.0%) | 0.0 |
| 35 to 50 years | 0 (0.0%) | 0.0 |
| Total | 0 (0.0%) | 0.0 |
Fertility by Age by Marriage Status in Port Austin
| Age Bracket | Married | Unmarried |
| 15 to 19 years | 0 (0.0%) | 0 (0.0%) |
| 20 to 34 years | 0 (0.0%) | 0 (0.0%) |
| 35 to 50 years | 0 (0.0%) | 0 (0.0%) |
| Total | 0 (0.0%) | 0 (0.0%) |
Fertility by Education in Port Austin
| Educational Attainment | Women with Births | Births / 1,000 Women |
| Less than High School | 0 (0.0%) | 0.0 |
| High School Diploma | 0 (0.0%) | 0.0 |
| College or Associate's Degree | 0 (0.0%) | 0.0 |
| Bachelor's Degree | 0 (0.0%) | 0.0 |
| Graduate Degree | 0 (0.0%) | 0.0 |
| Total | 0 (0.0%) | 0.0 |
Fertility by Education by Marriage Status in Port Austin
| Educational Attainment | Married | Unmarried |
| Less than High School | 0 (0.0%) | 0 (0.0%) |
| High School Diploma | 0 (0.0%) | 0 (0.0%) |
| College or Associate's Degree | 0 (0.0%) | 0 (0.0%) |
| Bachelor's Degree | 0 (0.0%) | 0 (0.0%) |
| Graduate Degree | 0 (0.0%) | 0 (0.0%) |
| Total | 0 (0.0%) | 0 (0.0%) |
Employment Characteristics in Port Austin
Employment by Class of Employer in Port Austin
Among the 309 employed individuals in Port Austin, private company employees (235 | 76.0%), local government employees (25 | 8.1%), and self-employed (incorporated) (20 | 6.5%) make up the most common classes of employment.
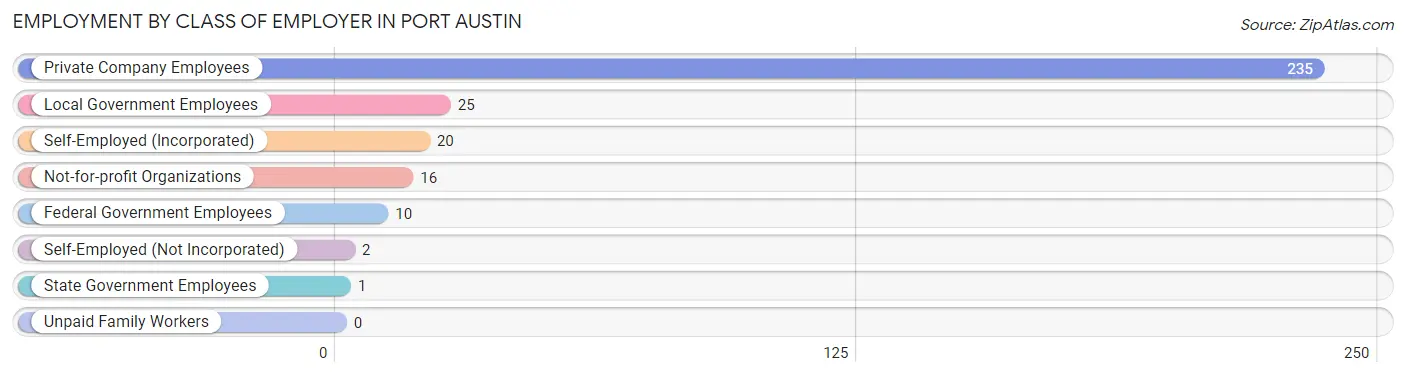
| Employer Class | # Employees | % Employees |
| Private Company Employees | 235 | 76.0% |
| Self-Employed (Incorporated) | 20 | 6.5% |
| Self-Employed (Not Incorporated) | 2 | 0.6% |
| Not-for-profit Organizations | 16 | 5.2% |
| Local Government Employees | 25 | 8.1% |
| State Government Employees | 1 | 0.3% |
| Federal Government Employees | 10 | 3.2% |
| Unpaid Family Workers | 0 | 0.0% |
| Total | 309 | 100.0% |
Employment Status by Age in Port Austin
According to the labor force statistics for Port Austin, out of the total population over 16 years of age (634), 53.3% or 338 individuals are in the labor force, with 8.2% or 28 of them unemployed. The age group with the highest labor force participation rate is 25 to 29 years, with 100.0% or 46 individuals in the labor force. Within the labor force, the 45 to 54 years age range has the highest percentage of unemployed individuals, with 19.0% or 8 of them being unemployed.
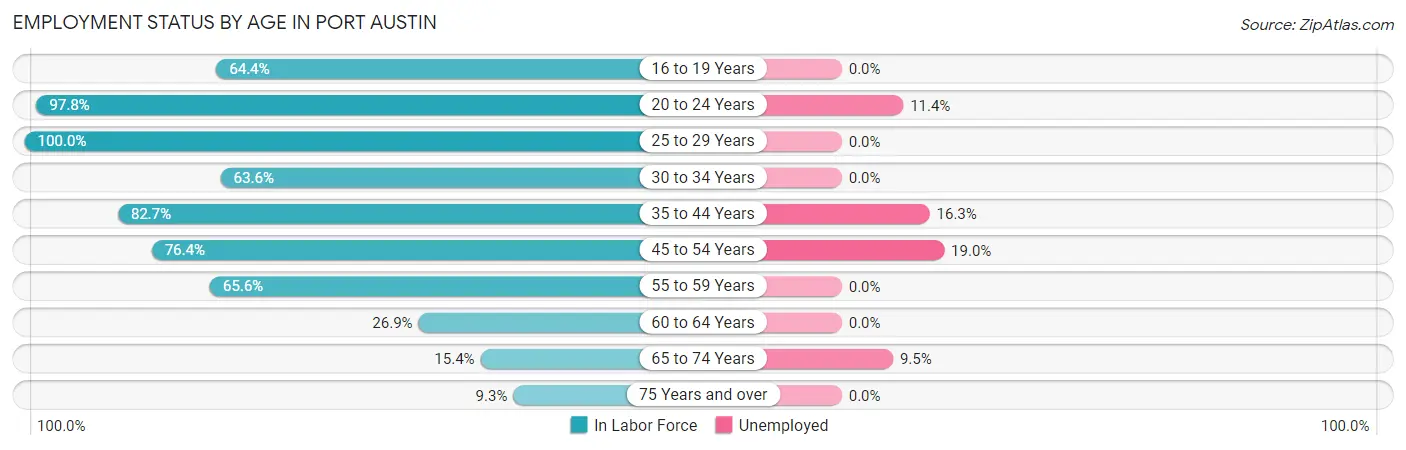
| Age Bracket | In Labor Force | Unemployed |
| 16 to 19 Years | 29 (64.4%) | 0 (0.0%) |
| 20 to 24 Years | 88 (97.8%) | 10 (11.4%) |
| 25 to 29 Years | 46 (100.0%) | 0 (0.0%) |
| 30 to 34 Years | 7 (63.6%) | 0 (0.0%) |
| 35 to 44 Years | 43 (82.7%) | 7 (16.3%) |
| 45 to 54 Years | 42 (76.4%) | 8 (19.0%) |
| 55 to 59 Years | 40 (65.6%) | 0 (0.0%) |
| 60 to 64 Years | 14 (26.9%) | 0 (0.0%) |
| 65 to 74 Years | 21 (15.4%) | 2 (9.5%) |
| 75 Years and over | 8 (9.3%) | 0 (0.0%) |
| Total | 338 (53.3%) | 28 (8.2%) |
Employment Status by Educational Attainment in Port Austin
According to labor force statistics for Port Austin, 69.3% of individuals (192) out of the total population between 25 and 64 years of age (277) are in the labor force, with 7.8% or 15 of them being unemployed. The group with the highest labor force participation rate are those with the educational attainment of bachelor's degree or higher, with 76.0% or 57 individuals in the labor force. Within the labor force, individuals with college / associate degree education have the highest percentage of unemployment, with 13.5% or 13 of them being unemployed.
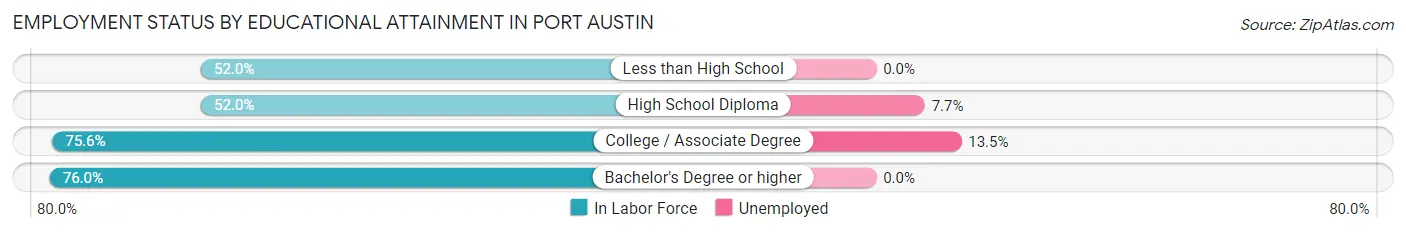
| Educational Attainment | In Labor Force | Unemployed |
| Less than High School | 13 (52.0%) | 0 (0.0%) |
| High School Diploma | 26 (52.0%) | 4 (7.7%) |
| College / Associate Degree | 96 (75.6%) | 17 (13.5%) |
| Bachelor's Degree or higher | 57 (76.0%) | 0 (0.0%) |
| Total | 192 (69.3%) | 22 (7.8%) |
Employment Occupations by Sex in Port Austin
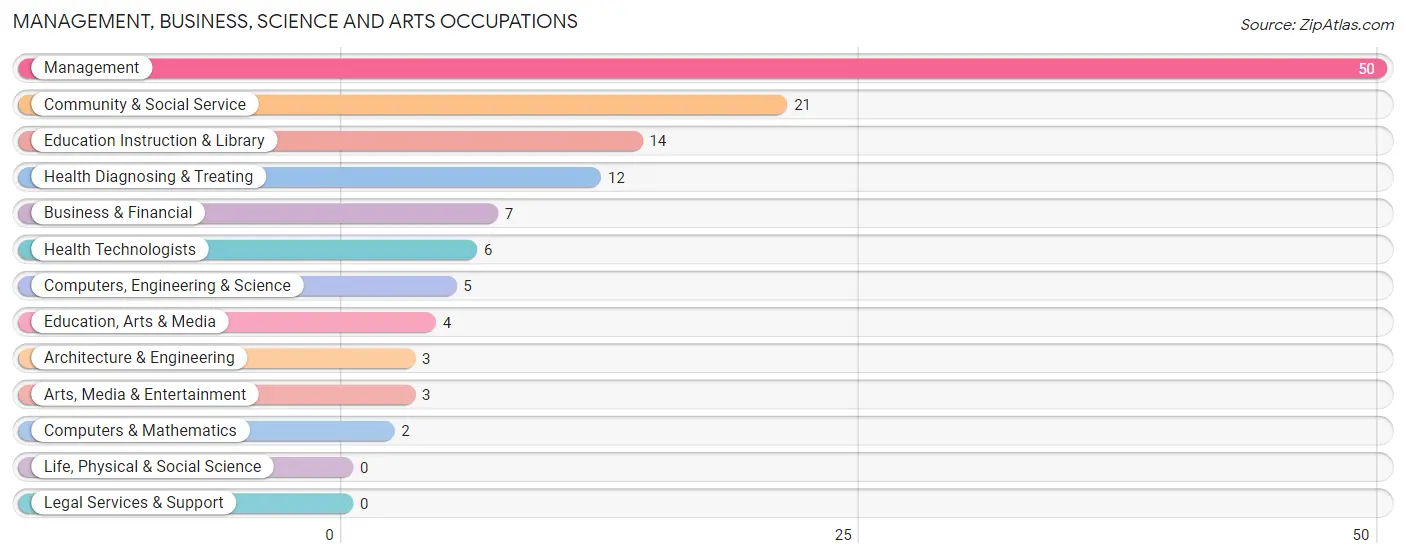
Management, Business, Science and Arts Occupations
The most common Management, Business, Science and Arts occupations in Port Austin are Management (50 | 16.6%), Community & Social Service (21 | 7.0%), Education Instruction & Library (14 | 4.6%), Health Diagnosing & Treating (12 | 4.0%), and Business & Financial (7 | 2.3%).
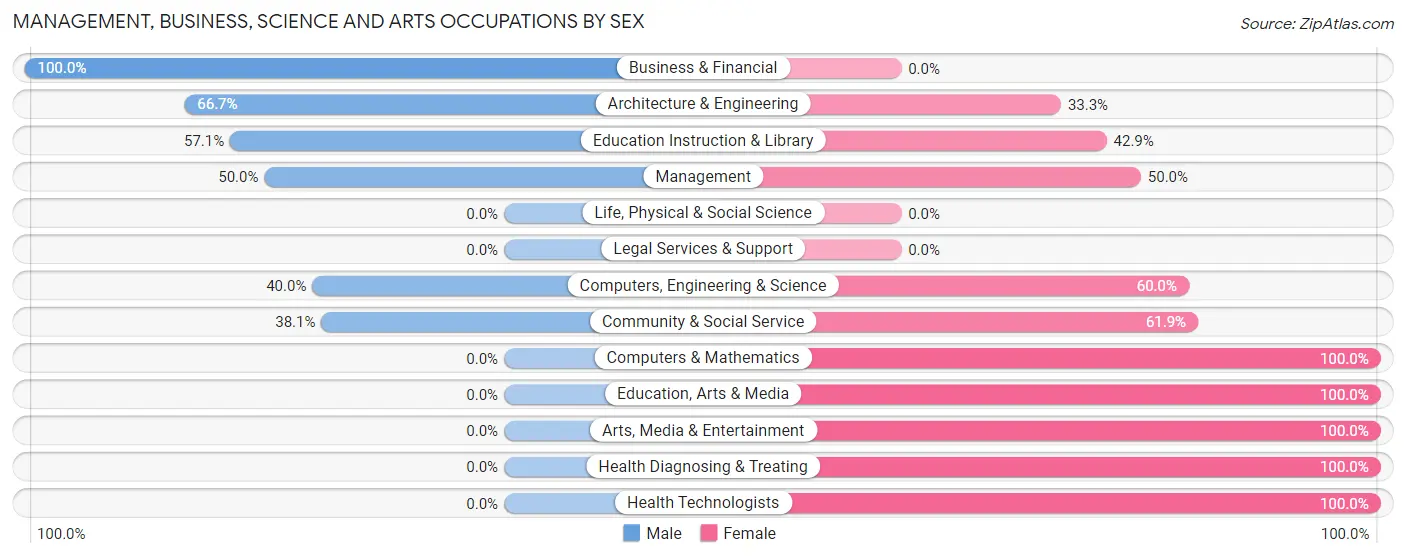
Management, Business, Science and Arts Occupations by Sex
Within the Management, Business, Science and Arts occupations in Port Austin, the most male-oriented occupations are Business & Financial (100.0%), Architecture & Engineering (66.7%), and Education Instruction & Library (57.1%), while the most female-oriented occupations are Computers & Mathematics (100.0%), Education, Arts & Media (100.0%), and Arts, Media & Entertainment (100.0%).
| Occupation | Male | Female |
| Management | 25 (50.0%) | 25 (50.0%) |
| Business & Financial | 7 (100.0%) | 0 (0.0%) |
| Computers, Engineering & Science | 2 (40.0%) | 3 (60.0%) |
| Computers & Mathematics | 0 (0.0%) | 2 (100.0%) |
| Architecture & Engineering | 2 (66.7%) | 1 (33.3%) |
| Life, Physical & Social Science | 0 (0.0%) | 0 (0.0%) |
| Community & Social Service | 8 (38.1%) | 13 (61.9%) |
| Education, Arts & Media | 0 (0.0%) | 4 (100.0%) |
| Legal Services & Support | 0 (0.0%) | 0 (0.0%) |
| Education Instruction & Library | 8 (57.1%) | 6 (42.9%) |
| Arts, Media & Entertainment | 0 (0.0%) | 3 (100.0%) |
| Health Diagnosing & Treating | 0 (0.0%) | 12 (100.0%) |
| Health Technologists | 0 (0.0%) | 6 (100.0%) |
| Total (Category) | 42 (44.2%) | 53 (55.8%) |
| Total (Overall) | 162 (53.8%) | 139 (46.2%) |
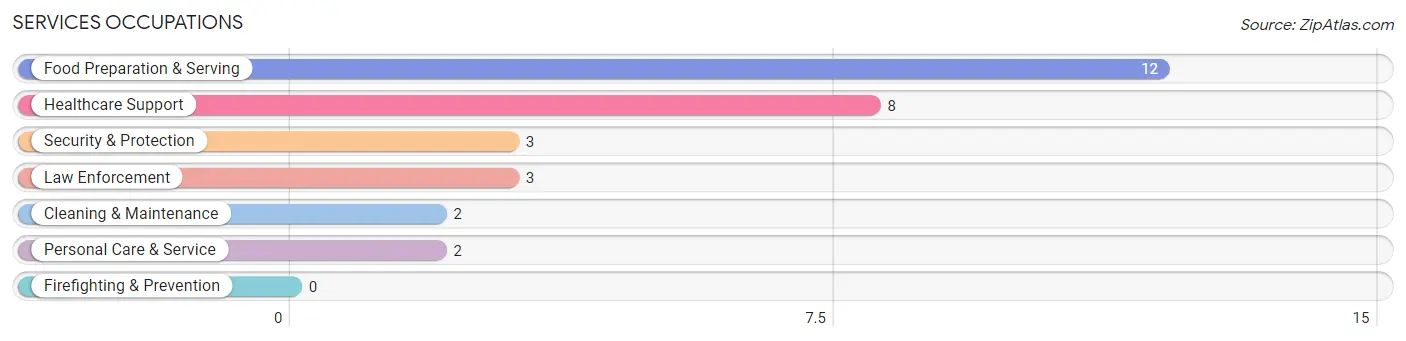
Services Occupations
The most common Services occupations in Port Austin are Food Preparation & Serving (12 | 4.0%), Healthcare Support (8 | 2.7%), Security & Protection (3 | 1.0%), Law Enforcement (3 | 1.0%), and Cleaning & Maintenance (2 | 0.7%).
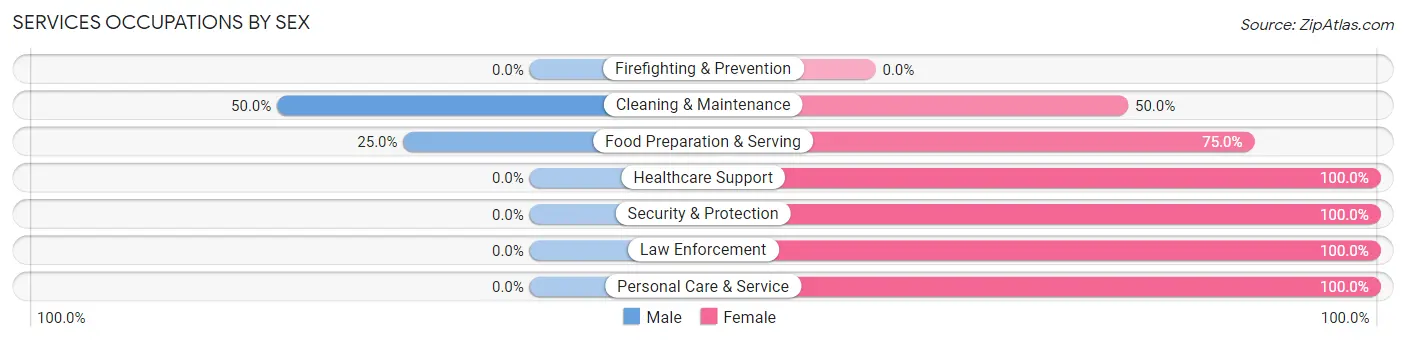
Services Occupations by Sex
Within the Services occupations in Port Austin, the most male-oriented occupations are Cleaning & Maintenance (50.0%), and Food Preparation & Serving (25.0%), while the most female-oriented occupations are Healthcare Support (100.0%), Security & Protection (100.0%), and Law Enforcement (100.0%).
| Occupation | Male | Female |
| Healthcare Support | 0 (0.0%) | 8 (100.0%) |
| Security & Protection | 0 (0.0%) | 3 (100.0%) |
| Firefighting & Prevention | 0 (0.0%) | 0 (0.0%) |
| Law Enforcement | 0 (0.0%) | 3 (100.0%) |
| Food Preparation & Serving | 3 (25.0%) | 9 (75.0%) |
| Cleaning & Maintenance | 1 (50.0%) | 1 (50.0%) |
| Personal Care & Service | 0 (0.0%) | 2 (100.0%) |
| Total (Category) | 4 (14.8%) | 23 (85.2%) |
| Total (Overall) | 162 (53.8%) | 139 (46.2%) |
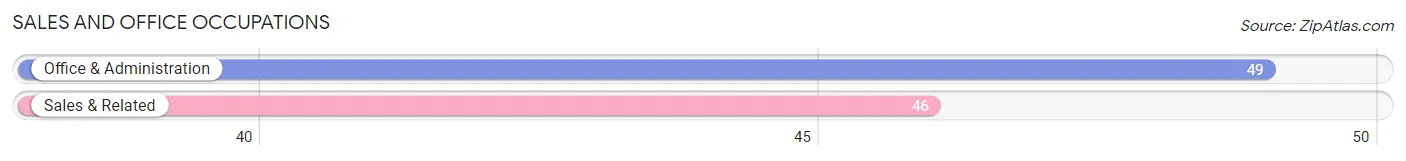
Sales and Office Occupations
The most common Sales and Office occupations in Port Austin are Office & Administration (49 | 16.3%), and Sales & Related (46 | 15.3%).
Sales and Office Occupations by Sex
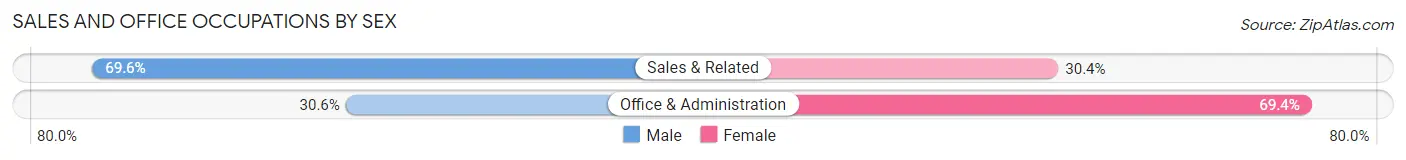
| Occupation | Male | Female |
| Sales & Related | 32 (69.6%) | 14 (30.4%) |
| Office & Administration | 15 (30.6%) | 34 (69.4%) |
| Total (Category) | 47 (49.5%) | 48 (50.5%) |
| Total (Overall) | 162 (53.8%) | 139 (46.2%) |
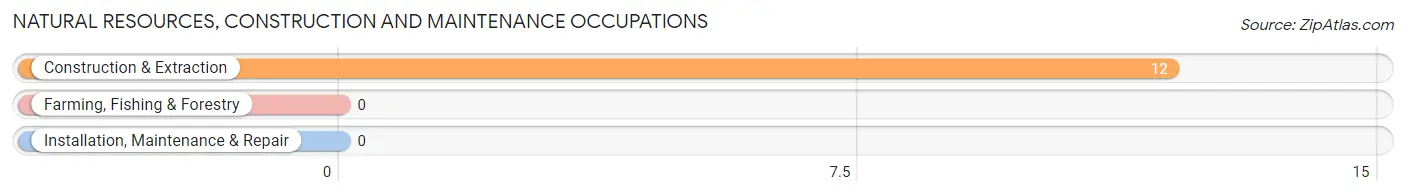
Natural Resources, Construction and Maintenance Occupations
The most common Natural Resources, Construction and Maintenance occupations in Port Austin are , and Construction & Extraction (12 | 4.0%).
Natural Resources, Construction and Maintenance Occupations by Sex
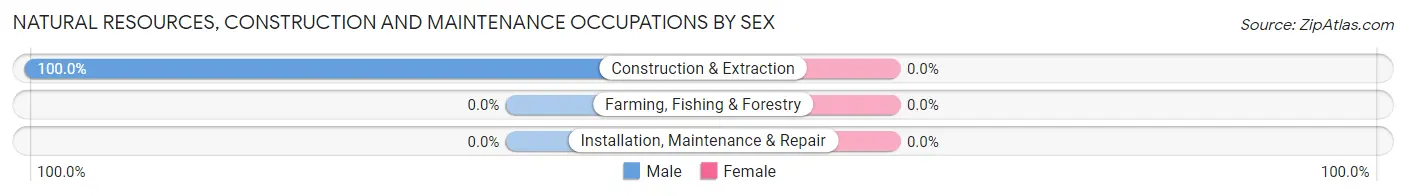
| Occupation | Male | Female |
| Farming, Fishing & Forestry | 0 (0.0%) | 0 (0.0%) |
| Construction & Extraction | 12 (100.0%) | 0 (0.0%) |
| Installation, Maintenance & Repair | 0 (0.0%) | 0 (0.0%) |
| Total (Category) | 12 (100.0%) | 0 (0.0%) |
| Total (Overall) | 162 (53.8%) | 139 (46.2%) |
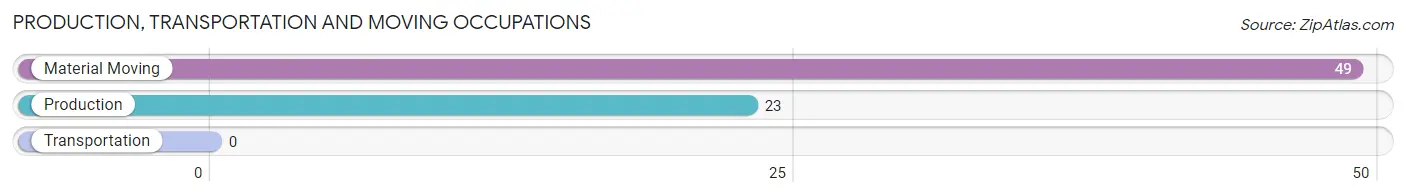
Production, Transportation and Moving Occupations
The most common Production, Transportation and Moving occupations in Port Austin are Material Moving (49 | 16.3%), and Production (23 | 7.6%).
Production, Transportation and Moving Occupations by Sex
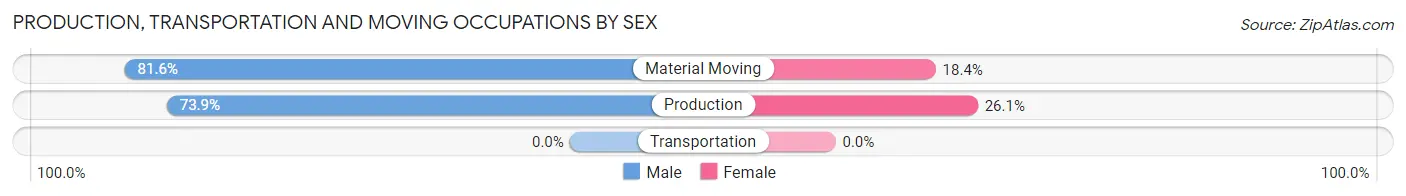
| Occupation | Male | Female |
| Production | 17 (73.9%) | 6 (26.1%) |
| Transportation | 0 (0.0%) | 0 (0.0%) |
| Material Moving | 40 (81.6%) | 9 (18.4%) |
| Total (Category) | 57 (79.2%) | 15 (20.8%) |
| Total (Overall) | 162 (53.8%) | 139 (46.2%) |
Employment Industries by Sex in Port Austin
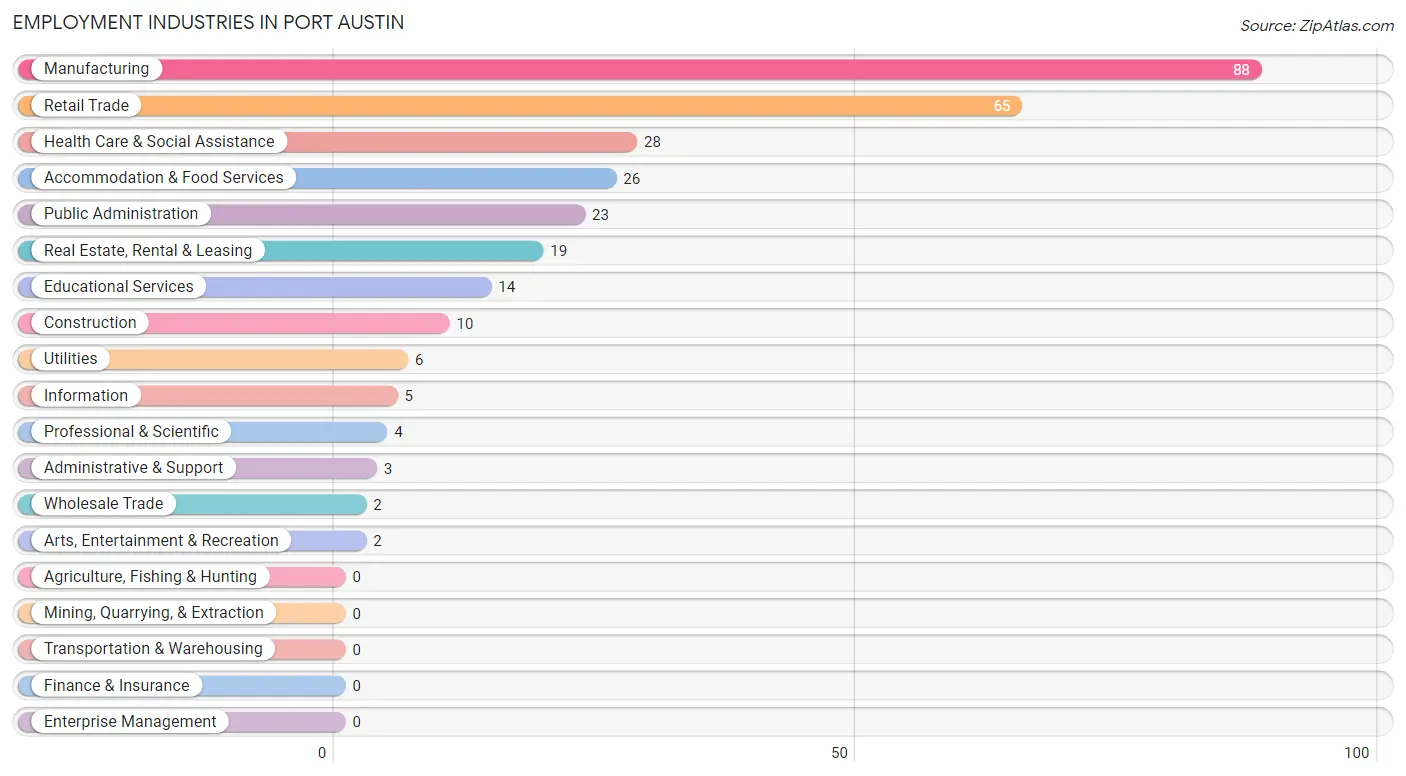
Employment Industries in Port Austin
The major employment industries in Port Austin include Manufacturing (88 | 29.2%), Retail Trade (65 | 21.6%), Health Care & Social Assistance (28 | 9.3%), Accommodation & Food Services (26 | 8.6%), and Public Administration (23 | 7.6%).
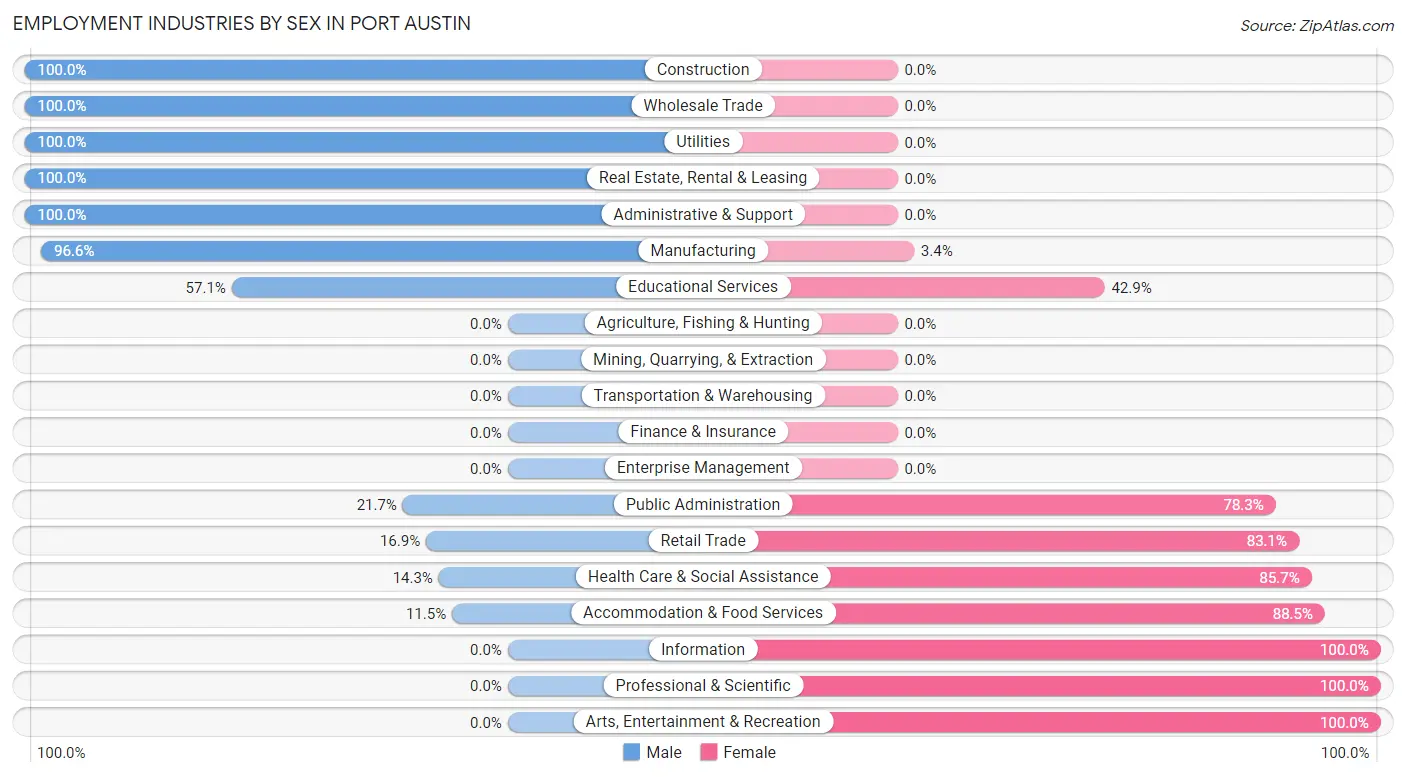
Employment Industries by Sex in Port Austin
The Port Austin industries that see more men than women are Construction (100.0%), Wholesale Trade (100.0%), and Utilities (100.0%), whereas the industries that tend to have a higher number of women are Information (100.0%), Professional & Scientific (100.0%), and Arts, Entertainment & Recreation (100.0%).
| Industry | Male | Female |
| Agriculture, Fishing & Hunting | 0 (0.0%) | 0 (0.0%) |
| Mining, Quarrying, & Extraction | 0 (0.0%) | 0 (0.0%) |
| Construction | 10 (100.0%) | 0 (0.0%) |
| Manufacturing | 85 (96.6%) | 3 (3.4%) |
| Wholesale Trade | 2 (100.0%) | 0 (0.0%) |
| Retail Trade | 11 (16.9%) | 54 (83.1%) |
| Transportation & Warehousing | 0 (0.0%) | 0 (0.0%) |
| Utilities | 6 (100.0%) | 0 (0.0%) |
| Information | 0 (0.0%) | 5 (100.0%) |
| Finance & Insurance | 0 (0.0%) | 0 (0.0%) |
| Real Estate, Rental & Leasing | 19 (100.0%) | 0 (0.0%) |
| Professional & Scientific | 0 (0.0%) | 4 (100.0%) |
| Enterprise Management | 0 (0.0%) | 0 (0.0%) |
| Administrative & Support | 3 (100.0%) | 0 (0.0%) |
| Educational Services | 8 (57.1%) | 6 (42.9%) |
| Health Care & Social Assistance | 4 (14.3%) | 24 (85.7%) |
| Arts, Entertainment & Recreation | 0 (0.0%) | 2 (100.0%) |
| Accommodation & Food Services | 3 (11.5%) | 23 (88.5%) |
| Public Administration | 5 (21.7%) | 18 (78.3%) |
| Total | 162 (53.8%) | 139 (46.2%) |
Education in Port Austin
School Enrollment in Port Austin
The most common levels of schooling among the 40 students in Port Austin are high school (15 | 37.5%), middle school (9 | 22.5%), and nursery / preschool (8 | 20.0%).
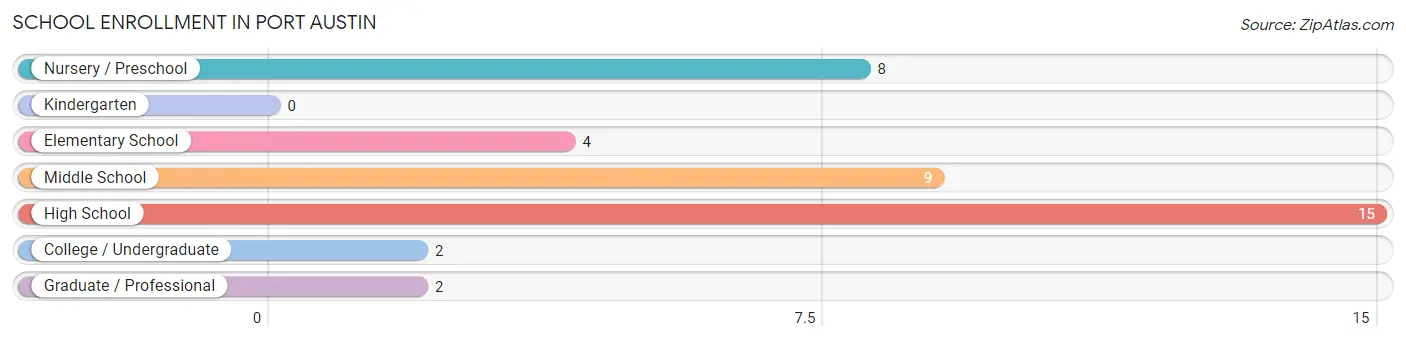
| School Level | # Students | % Students |
| Nursery / Preschool | 8 | 20.0% |
| Kindergarten | 0 | 0.0% |
| Elementary School | 4 | 10.0% |
| Middle School | 9 | 22.5% |
| High School | 15 | 37.5% |
| College / Undergraduate | 2 | 5.0% |
| Graduate / Professional | 2 | 5.0% |
| Total | 40 | 100.0% |
School Enrollment by Age by Funding Source in Port Austin
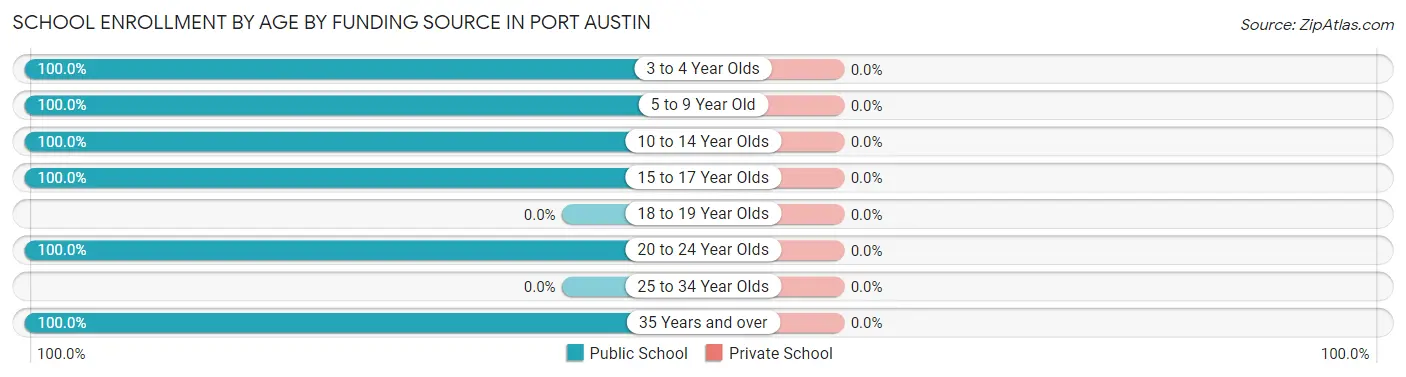
| Age Bracket | Public School | Private School |
| 3 to 4 Year Olds | 5 (100.0%) | 0 (0.0%) |
| 5 to 9 Year Old | 3 (100.0%) | 0 (0.0%) |
| 10 to 14 Year Olds | 13 (100.0%) | 0 (0.0%) |
| 15 to 17 Year Olds | 15 (100.0%) | 0 (0.0%) |
| 18 to 19 Year Olds | 0 (0.0%) | 0 (0.0%) |
| 20 to 24 Year Olds | 2 (100.0%) | 0 (0.0%) |
| 25 to 34 Year Olds | 0 (0.0%) | 0 (0.0%) |
| 35 Years and over | 2 (100.0%) | 0 (0.0%) |
| Total | 40 (100.0%) | 0 (0.0%) |
Educational Attainment by Field of Study in Port Austin
Education (32 | 22.7%), science & technology (28 | 19.9%), business (24 | 17.0%), social sciences (15 | 10.6%), and literature & languages (8 | 5.7%) are the most common fields of study among 141 individuals in Port Austin who have obtained a bachelor's degree or higher.
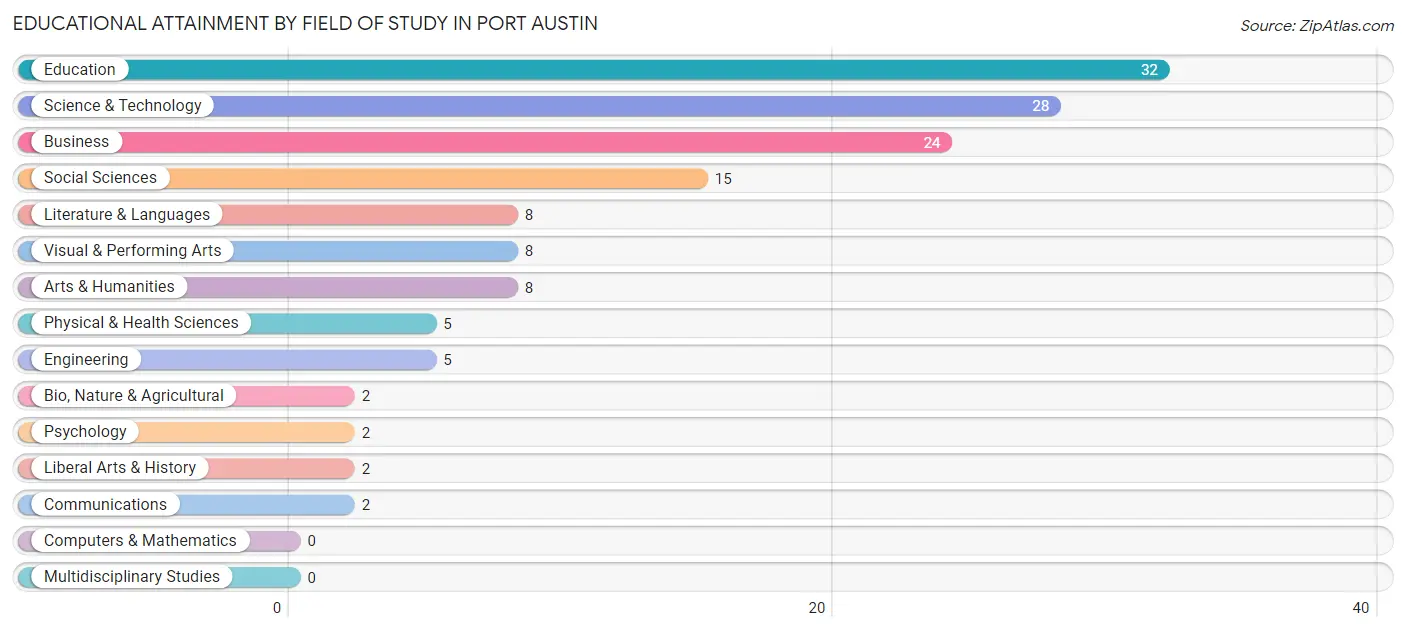
| Field of Study | # Graduates | % Graduates |
| Computers & Mathematics | 0 | 0.0% |
| Bio, Nature & Agricultural | 2 | 1.4% |
| Physical & Health Sciences | 5 | 3.5% |
| Psychology | 2 | 1.4% |
| Social Sciences | 15 | 10.6% |
| Engineering | 5 | 3.5% |
| Multidisciplinary Studies | 0 | 0.0% |
| Science & Technology | 28 | 19.9% |
| Business | 24 | 17.0% |
| Education | 32 | 22.7% |
| Literature & Languages | 8 | 5.7% |
| Liberal Arts & History | 2 | 1.4% |
| Visual & Performing Arts | 8 | 5.7% |
| Communications | 2 | 1.4% |
| Arts & Humanities | 8 | 5.7% |
| Total | 141 | 100.0% |
Transportation & Commute in Port Austin
Vehicle Availability by Sex in Port Austin
The most prevalent vehicle ownership categories in Port Austin are males with no vehicle (54, accounting for 34.2%) and females with no vehicle (14, making up 43.9%).
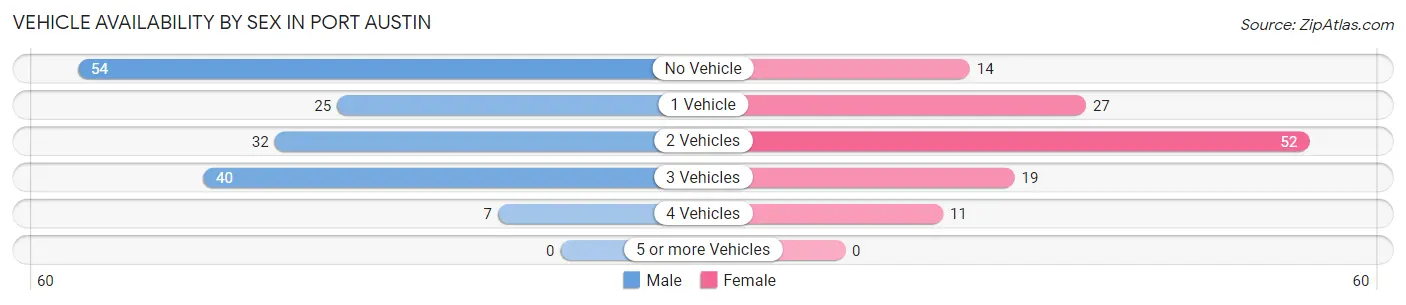
| Vehicles Available | Male | Female |
| No Vehicle | 54 (34.2%) | 14 (11.4%) |
| 1 Vehicle | 25 (15.8%) | 27 (22.0%) |
| 2 Vehicles | 32 (20.3%) | 52 (42.3%) |
| 3 Vehicles | 40 (25.3%) | 19 (15.4%) |
| 4 Vehicles | 7 (4.4%) | 11 (8.9%) |
| 5 or more Vehicles | 0 (0.0%) | 0 (0.0%) |
| Total | 158 (100.0%) | 123 (100.0%) |
Commute Time in Port Austin
The most frequently occuring commute durations in Port Austin are 10 to 14 minutes (48 commuters, 16.6%), 5 to 9 minutes (36 commuters, 12.4%), and 45 to 59 minutes (36 commuters, 12.4%).
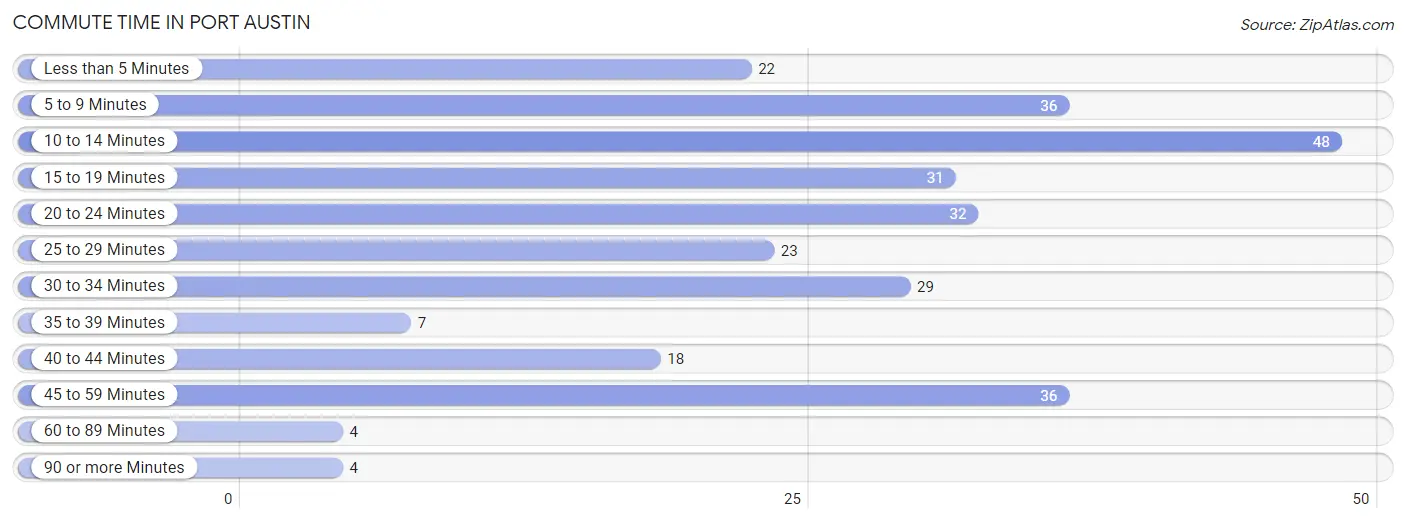
| Commute Time | # Commuters | % Commuters |
| Less than 5 Minutes | 22 | 7.6% |
| 5 to 9 Minutes | 36 | 12.4% |
| 10 to 14 Minutes | 48 | 16.6% |
| 15 to 19 Minutes | 31 | 10.7% |
| 20 to 24 Minutes | 32 | 11.0% |
| 25 to 29 Minutes | 23 | 7.9% |
| 30 to 34 Minutes | 29 | 10.0% |
| 35 to 39 Minutes | 7 | 2.4% |
| 40 to 44 Minutes | 18 | 6.2% |
| 45 to 59 Minutes | 36 | 12.4% |
| 60 to 89 Minutes | 4 | 1.4% |
| 90 or more Minutes | 4 | 1.4% |
Commute Time by Sex in Port Austin
The most common commute times in Port Austin are 45 to 59 minutes (36 commuters, 21.3%) for males and 20 to 24 minutes (25 commuters, 20.7%) for females.
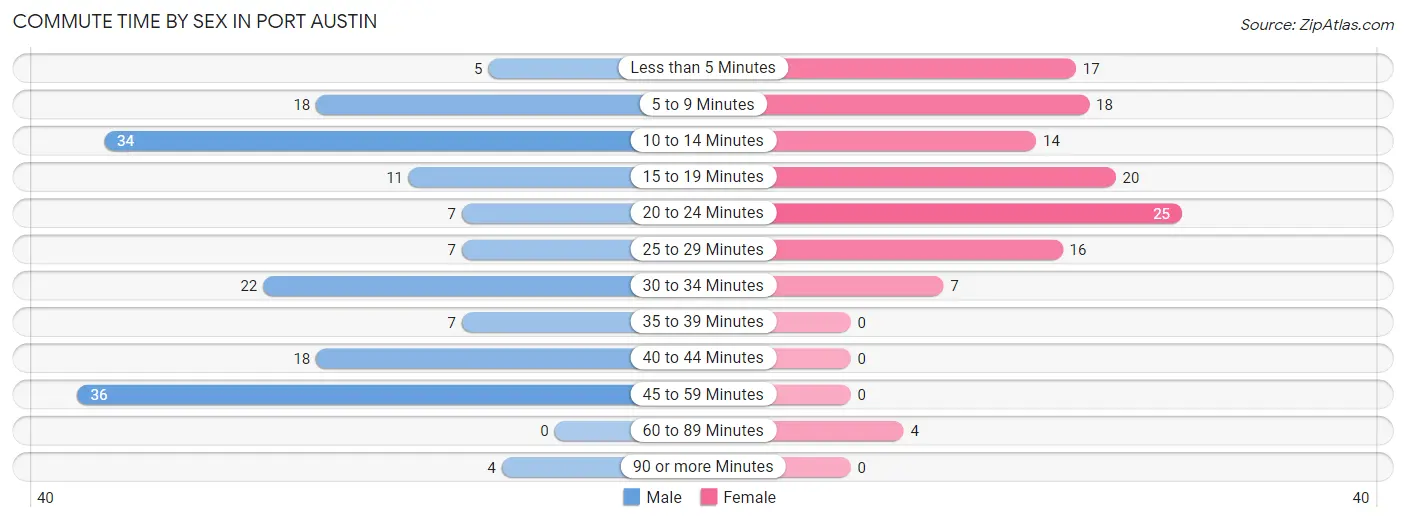
| Commute Time | Male | Female |
| Less than 5 Minutes | 5 (3.0%) | 17 (14.1%) |
| 5 to 9 Minutes | 18 (10.6%) | 18 (14.9%) |
| 10 to 14 Minutes | 34 (20.1%) | 14 (11.6%) |
| 15 to 19 Minutes | 11 (6.5%) | 20 (16.5%) |
| 20 to 24 Minutes | 7 (4.1%) | 25 (20.7%) |
| 25 to 29 Minutes | 7 (4.1%) | 16 (13.2%) |
| 30 to 34 Minutes | 22 (13.0%) | 7 (5.8%) |
| 35 to 39 Minutes | 7 (4.1%) | 0 (0.0%) |
| 40 to 44 Minutes | 18 (10.6%) | 0 (0.0%) |
| 45 to 59 Minutes | 36 (21.3%) | 0 (0.0%) |
| 60 to 89 Minutes | 0 (0.0%) | 4 (3.3%) |
| 90 or more Minutes | 4 (2.4%) | 0 (0.0%) |
Time of Departure to Work by Sex in Port Austin
The most frequent times of departure to work in Port Austin are 4:00 PM to 11:59 PM (38, 22.5%) for males and 10:00 AM to 10:59 AM (25, 20.7%) for females.
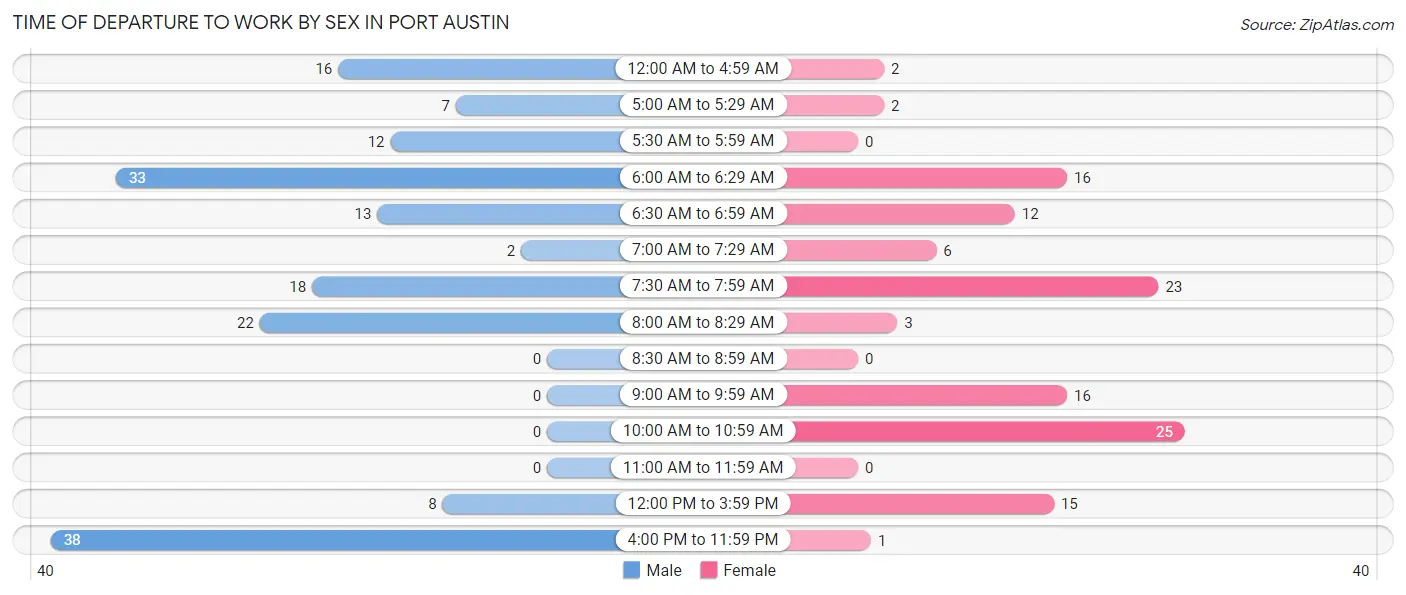
| Time of Departure | Male | Female |
| 12:00 AM to 4:59 AM | 16 (9.5%) | 2 (1.7%) |
| 5:00 AM to 5:29 AM | 7 (4.1%) | 2 (1.7%) |
| 5:30 AM to 5:59 AM | 12 (7.1%) | 0 (0.0%) |
| 6:00 AM to 6:29 AM | 33 (19.5%) | 16 (13.2%) |
| 6:30 AM to 6:59 AM | 13 (7.7%) | 12 (9.9%) |
| 7:00 AM to 7:29 AM | 2 (1.2%) | 6 (5.0%) |
| 7:30 AM to 7:59 AM | 18 (10.6%) | 23 (19.0%) |
| 8:00 AM to 8:29 AM | 22 (13.0%) | 3 (2.5%) |
| 8:30 AM to 8:59 AM | 0 (0.0%) | 0 (0.0%) |
| 9:00 AM to 9:59 AM | 0 (0.0%) | 16 (13.2%) |
| 10:00 AM to 10:59 AM | 0 (0.0%) | 25 (20.7%) |
| 11:00 AM to 11:59 AM | 0 (0.0%) | 0 (0.0%) |
| 12:00 PM to 3:59 PM | 8 (4.7%) | 15 (12.4%) |
| 4:00 PM to 11:59 PM | 38 (22.5%) | 1 (0.8%) |
| Total | 169 (100.0%) | 121 (100.0%) |
Housing Occupancy in Port Austin
Occupancy by Ownership in Port Austin
Of the total 328 dwellings in Port Austin, owner-occupied units account for 231 (70.4%), while renter-occupied units make up 97 (29.6%).
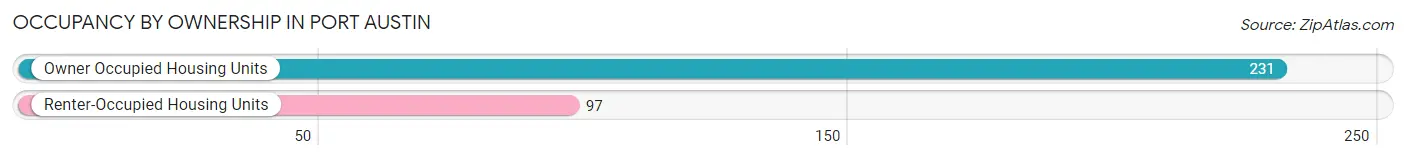
| Occupancy | # Housing Units | % Housing Units |
| Owner Occupied Housing Units | 231 | 70.4% |
| Renter-Occupied Housing Units | 97 | 29.6% |
| Total Occupied Housing Units | 328 | 100.0% |
Occupancy by Household Size in Port Austin
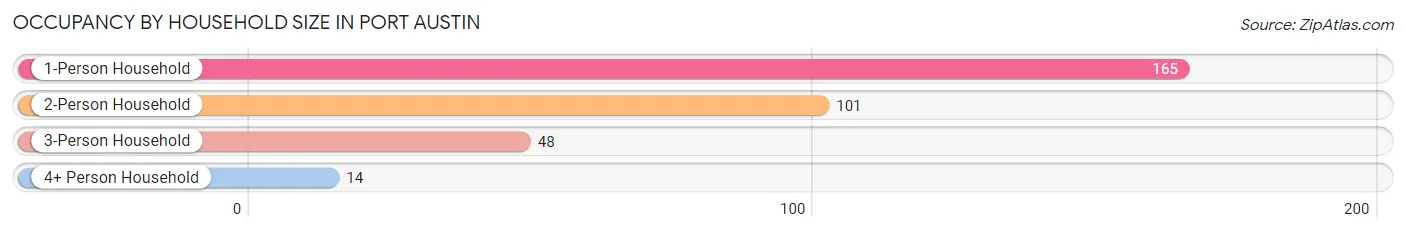
| Household Size | # Housing Units | % Housing Units |
| 1-Person Household | 165 | 50.3% |
| 2-Person Household | 101 | 30.8% |
| 3-Person Household | 48 | 14.6% |
| 4+ Person Household | 14 | 4.3% |
| Total Housing Units | 328 | 100.0% |
Occupancy by Ownership by Household Size in Port Austin
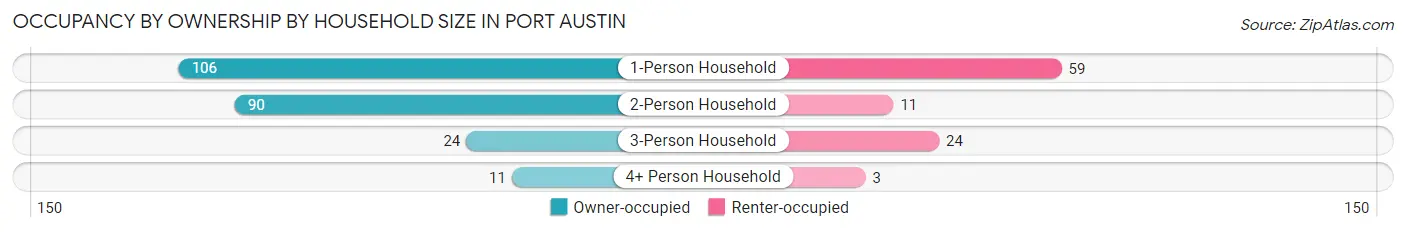
| Household Size | Owner-occupied | Renter-occupied |
| 1-Person Household | 106 (64.2%) | 59 (35.8%) |
| 2-Person Household | 90 (89.1%) | 11 (10.9%) |
| 3-Person Household | 24 (50.0%) | 24 (50.0%) |
| 4+ Person Household | 11 (78.6%) | 3 (21.4%) |
| Total Housing Units | 231 (70.4%) | 97 (29.6%) |
Occupancy by Educational Attainment in Port Austin
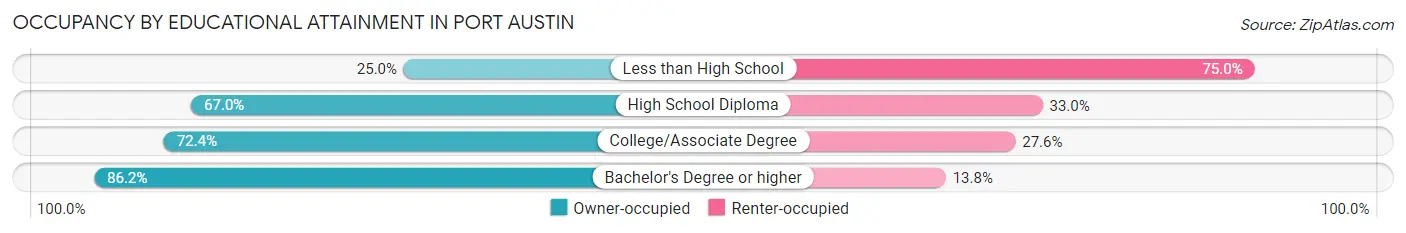
| Household Size | Owner-occupied | Renter-occupied |
| Less than High School | 7 (25.0%) | 21 (75.0%) |
| High School Diploma | 65 (67.0%) | 32 (33.0%) |
| College/Associate Degree | 84 (72.4%) | 32 (27.6%) |
| Bachelor's Degree or higher | 75 (86.2%) | 12 (13.8%) |
Occupancy by Age of Householder in Port Austin
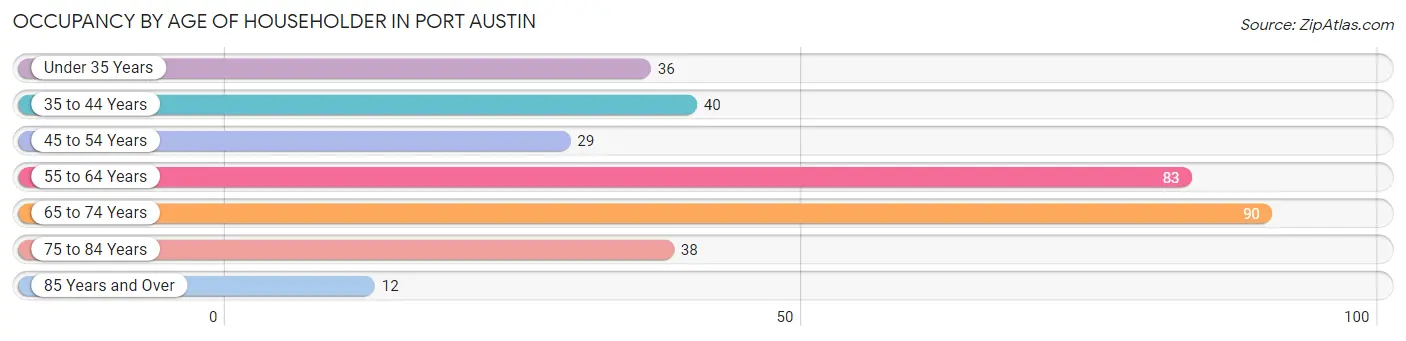
| Age Bracket | # Households | % Households |
| Under 35 Years | 36 | 11.0% |
| 35 to 44 Years | 40 | 12.2% |
| 45 to 54 Years | 29 | 8.8% |
| 55 to 64 Years | 83 | 25.3% |
| 65 to 74 Years | 90 | 27.4% |
| 75 to 84 Years | 38 | 11.6% |
| 85 Years and Over | 12 | 3.7% |
| Total | 328 | 100.0% |
Housing Finances in Port Austin
Median Income by Occupancy in Port Austin
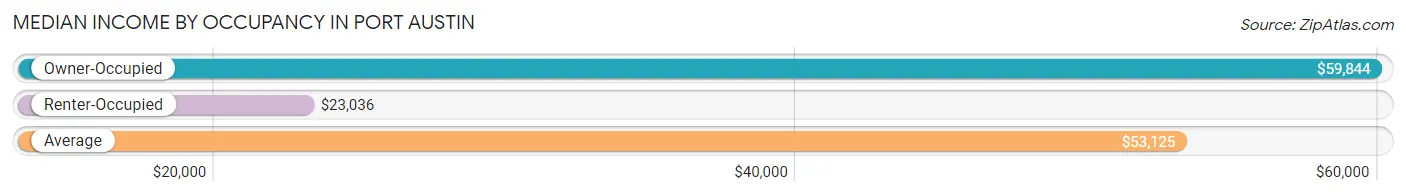
| Occupancy Type | # Households | Median Income |
| Owner-Occupied | 231 (70.4%) | $59,844 |
| Renter-Occupied | 97 (29.6%) | $23,036 |
| Average | 328 (100.0%) | $53,125 |
Occupancy by Householder Income Bracket in Port Austin
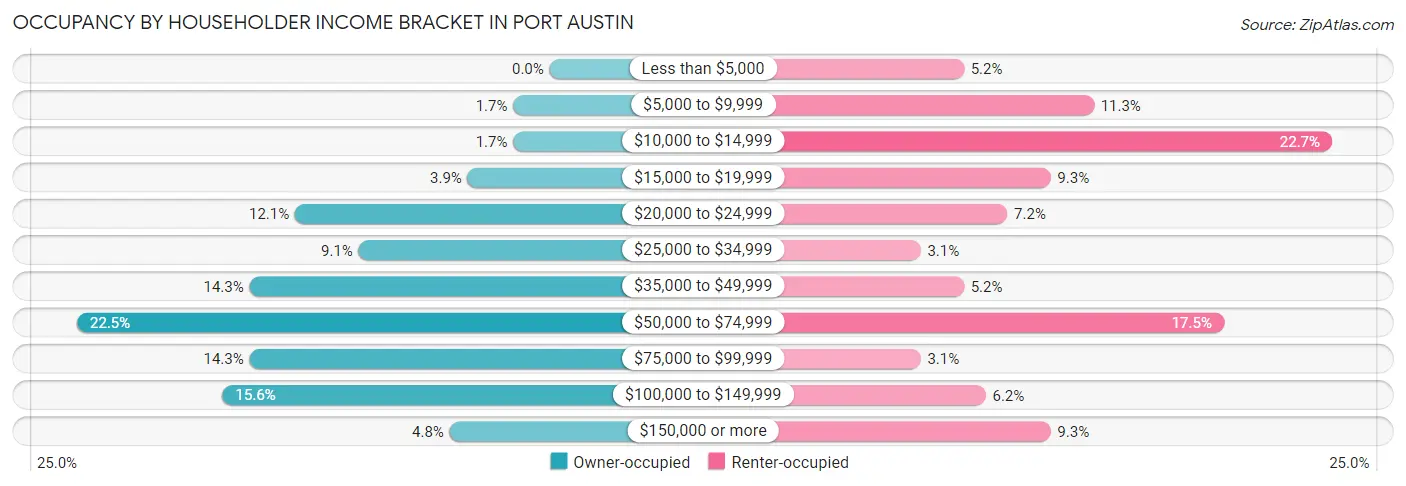
| Income Bracket | Owner-occupied | Renter-occupied |
| Less than $5,000 | 0 (0.0%) | 5 (5.1%) |
| $5,000 to $9,999 | 4 (1.7%) | 11 (11.3%) |
| $10,000 to $14,999 | 4 (1.7%) | 22 (22.7%) |
| $15,000 to $19,999 | 9 (3.9%) | 9 (9.3%) |
| $20,000 to $24,999 | 28 (12.1%) | 7 (7.2%) |
| $25,000 to $34,999 | 21 (9.1%) | 3 (3.1%) |
| $35,000 to $49,999 | 33 (14.3%) | 5 (5.1%) |
| $50,000 to $74,999 | 52 (22.5%) | 17 (17.5%) |
| $75,000 to $99,999 | 33 (14.3%) | 3 (3.1%) |
| $100,000 to $149,999 | 36 (15.6%) | 6 (6.2%) |
| $150,000 or more | 11 (4.8%) | 9 (9.3%) |
| Total | 231 (100.0%) | 97 (100.0%) |
Monthly Housing Cost Tiers in Port Austin
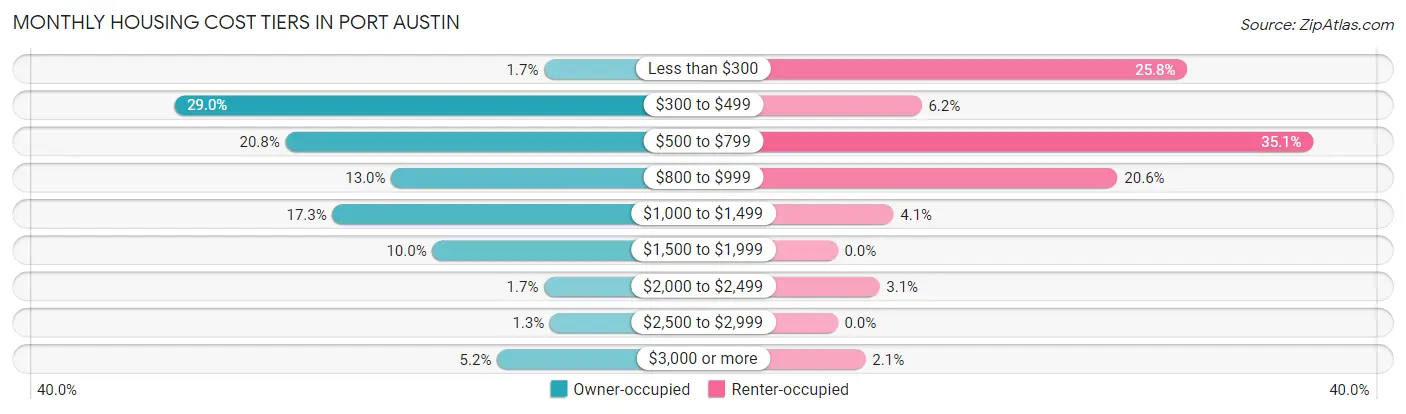
| Monthly Cost | Owner-occupied | Renter-occupied |
| Less than $300 | 4 (1.7%) | 25 (25.8%) |
| $300 to $499 | 67 (29.0%) | 6 (6.2%) |
| $500 to $799 | 48 (20.8%) | 34 (35.0%) |
| $800 to $999 | 30 (13.0%) | 20 (20.6%) |
| $1,000 to $1,499 | 40 (17.3%) | 4 (4.1%) |
| $1,500 to $1,999 | 23 (10.0%) | 0 (0.0%) |
| $2,000 to $2,499 | 4 (1.7%) | 3 (3.1%) |
| $2,500 to $2,999 | 3 (1.3%) | 0 (0.0%) |
| $3,000 or more | 12 (5.2%) | 2 (2.1%) |
| Total | 231 (100.0%) | 97 (100.0%) |
Physical Housing Characteristics in Port Austin
Housing Structures in Port Austin
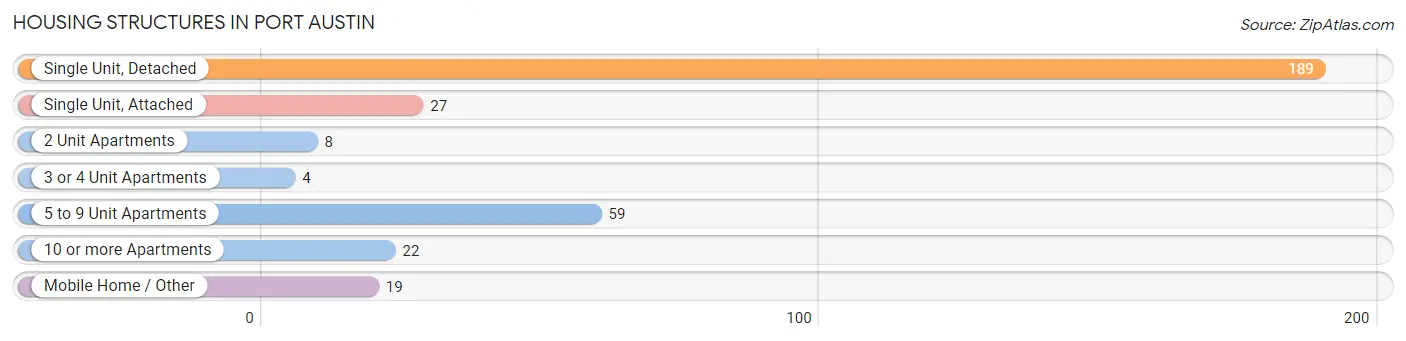
| Structure Type | # Housing Units | % Housing Units |
| Single Unit, Detached | 189 | 57.6% |
| Single Unit, Attached | 27 | 8.2% |
| 2 Unit Apartments | 8 | 2.4% |
| 3 or 4 Unit Apartments | 4 | 1.2% |
| 5 to 9 Unit Apartments | 59 | 18.0% |
| 10 or more Apartments | 22 | 6.7% |
| Mobile Home / Other | 19 | 5.8% |
| Total | 328 | 100.0% |
Housing Structures by Occupancy in Port Austin
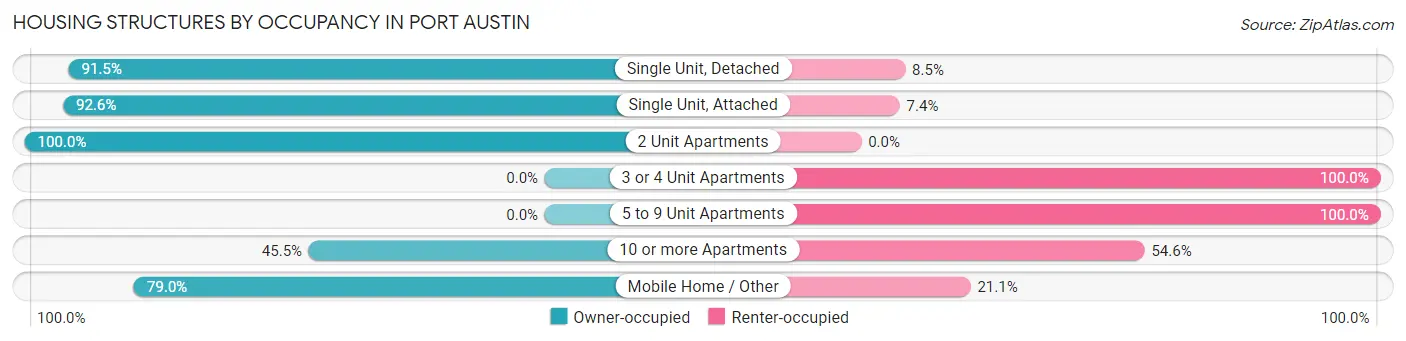
| Structure Type | Owner-occupied | Renter-occupied |
| Single Unit, Detached | 173 (91.5%) | 16 (8.5%) |
| Single Unit, Attached | 25 (92.6%) | 2 (7.4%) |
| 2 Unit Apartments | 8 (100.0%) | 0 (0.0%) |
| 3 or 4 Unit Apartments | 0 (0.0%) | 4 (100.0%) |
| 5 to 9 Unit Apartments | 0 (0.0%) | 59 (100.0%) |
| 10 or more Apartments | 10 (45.5%) | 12 (54.5%) |
| Mobile Home / Other | 15 (78.9%) | 4 (21.0%) |
| Total | 231 (70.4%) | 97 (29.6%) |
Housing Structures by Number of Rooms in Port Austin
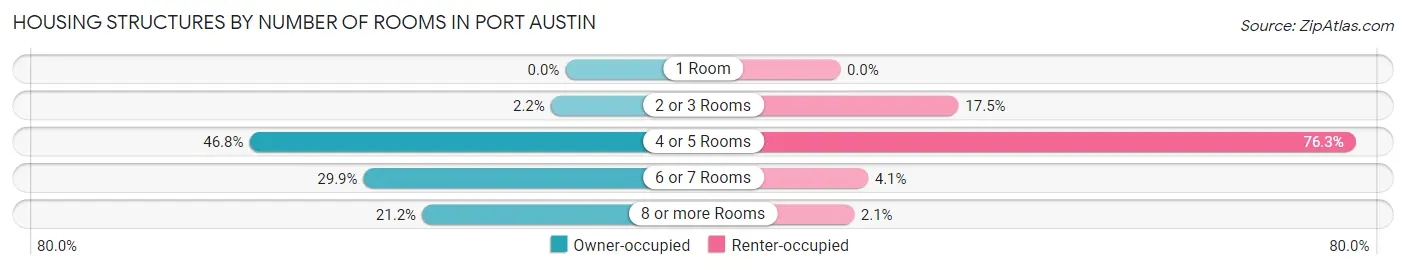
| Number of Rooms | Owner-occupied | Renter-occupied |
| 1 Room | 0 (0.0%) | 0 (0.0%) |
| 2 or 3 Rooms | 5 (2.2%) | 17 (17.5%) |
| 4 or 5 Rooms | 108 (46.8%) | 74 (76.3%) |
| 6 or 7 Rooms | 69 (29.9%) | 4 (4.1%) |
| 8 or more Rooms | 49 (21.2%) | 2 (2.1%) |
| Total | 231 (100.0%) | 97 (100.0%) |
Housing Structure by Heating Type in Port Austin
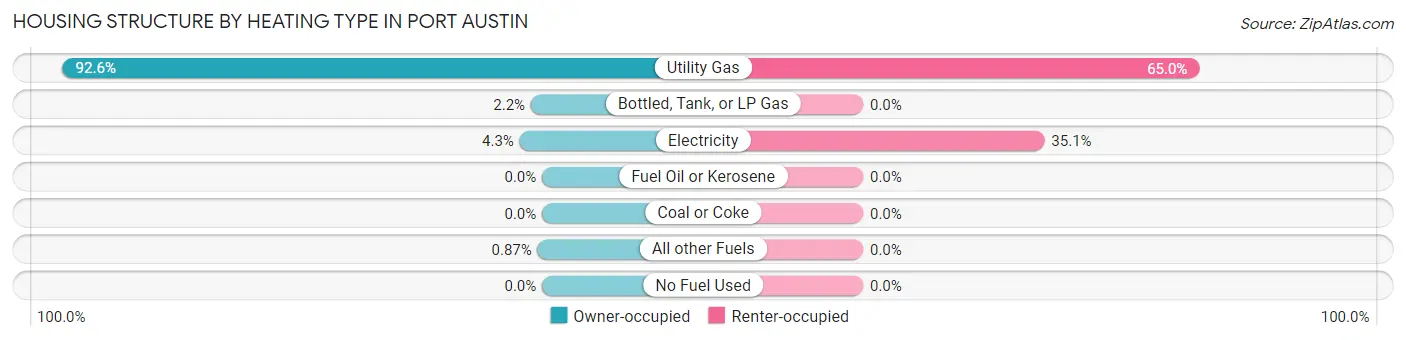
| Heating Type | Owner-occupied | Renter-occupied |
| Utility Gas | 214 (92.6%) | 63 (64.9%) |
| Bottled, Tank, or LP Gas | 5 (2.2%) | 0 (0.0%) |
| Electricity | 10 (4.3%) | 34 (35.0%) |
| Fuel Oil or Kerosene | 0 (0.0%) | 0 (0.0%) |
| Coal or Coke | 0 (0.0%) | 0 (0.0%) |
| All other Fuels | 2 (0.9%) | 0 (0.0%) |
| No Fuel Used | 0 (0.0%) | 0 (0.0%) |
| Total | 231 (100.0%) | 97 (100.0%) |
Household Vehicle Usage in Port Austin
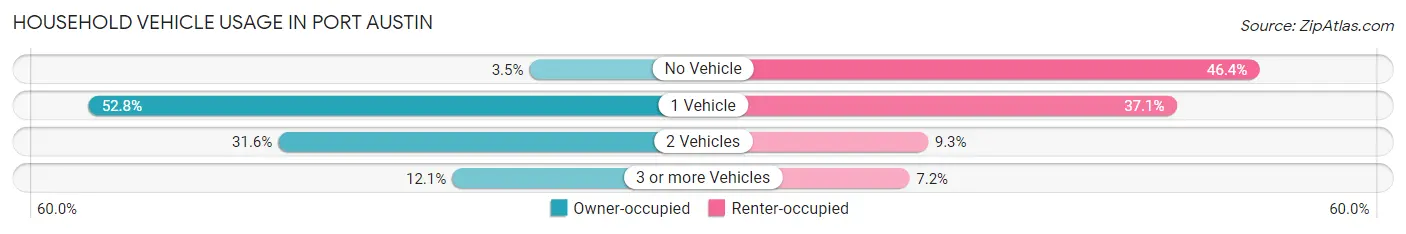
| Vehicles per Household | Owner-occupied | Renter-occupied |
| No Vehicle | 8 (3.5%) | 45 (46.4%) |
| 1 Vehicle | 122 (52.8%) | 36 (37.1%) |
| 2 Vehicles | 73 (31.6%) | 9 (9.3%) |
| 3 or more Vehicles | 28 (12.1%) | 7 (7.2%) |
| Total | 231 (100.0%) | 97 (100.0%) |
Real Estate & Mortgages in Port Austin
Real Estate and Mortgage Overview in Port Austin
| Characteristic | Without Mortgage | With Mortgage |
| Housing Units | 121 | 110 |
| Median Property Value | $131,700 | $160,000 |
| Median Household Income | $41,406 | $7 |
| Monthly Housing Costs | $479 | $12 |
| Real Estate Taxes | $2,000 | $8 |
Property Value by Mortgage Status in Port Austin
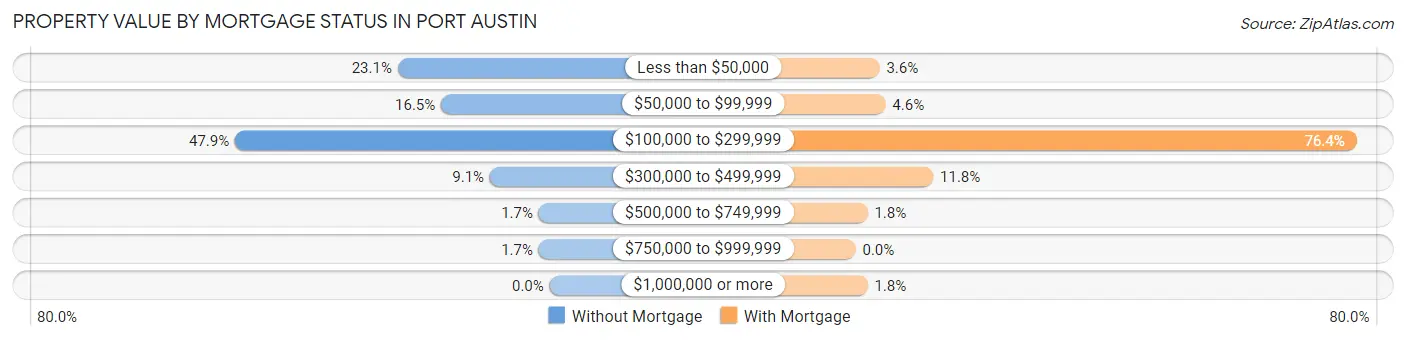
| Property Value | Without Mortgage | With Mortgage |
| Less than $50,000 | 28 (23.1%) | 4 (3.6%) |
| $50,000 to $99,999 | 20 (16.5%) | 5 (4.5%) |
| $100,000 to $299,999 | 58 (47.9%) | 84 (76.4%) |
| $300,000 to $499,999 | 11 (9.1%) | 13 (11.8%) |
| $500,000 to $749,999 | 2 (1.7%) | 2 (1.8%) |
| $750,000 to $999,999 | 2 (1.7%) | 0 (0.0%) |
| $1,000,000 or more | 0 (0.0%) | 2 (1.8%) |
| Total | 121 (100.0%) | 110 (100.0%) |
Household Income by Mortgage Status in Port Austin
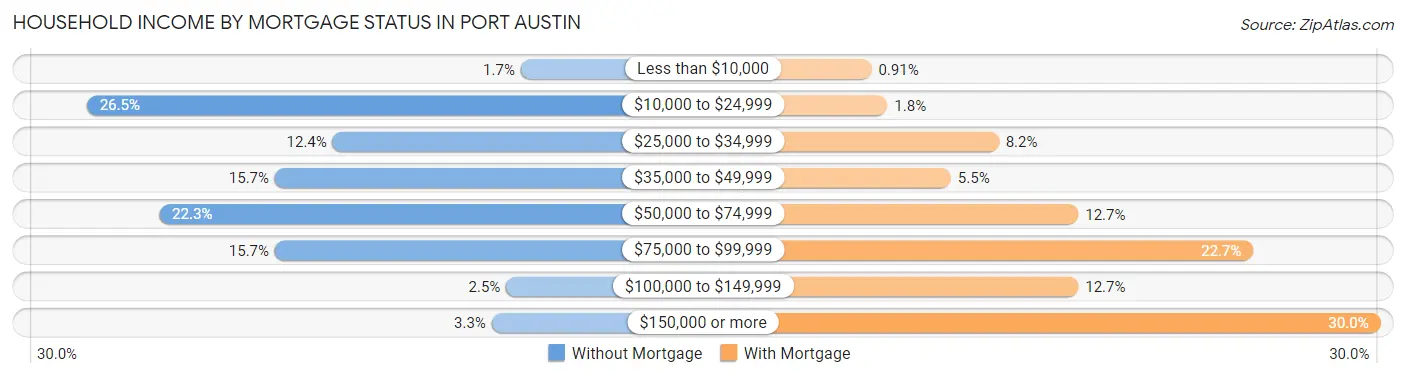
| Household Income | Without Mortgage | With Mortgage |
| Less than $10,000 | 2 (1.7%) | 1 (0.9%) |
| $10,000 to $24,999 | 32 (26.5%) | 2 (1.8%) |
| $25,000 to $34,999 | 15 (12.4%) | 9 (8.2%) |
| $35,000 to $49,999 | 19 (15.7%) | 6 (5.4%) |
| $50,000 to $74,999 | 27 (22.3%) | 14 (12.7%) |
| $75,000 to $99,999 | 19 (15.7%) | 25 (22.7%) |
| $100,000 to $149,999 | 3 (2.5%) | 14 (12.7%) |
| $150,000 or more | 4 (3.3%) | 33 (30.0%) |
| Total | 121 (100.0%) | 110 (100.0%) |
Property Value to Household Income Ratio in Port Austin
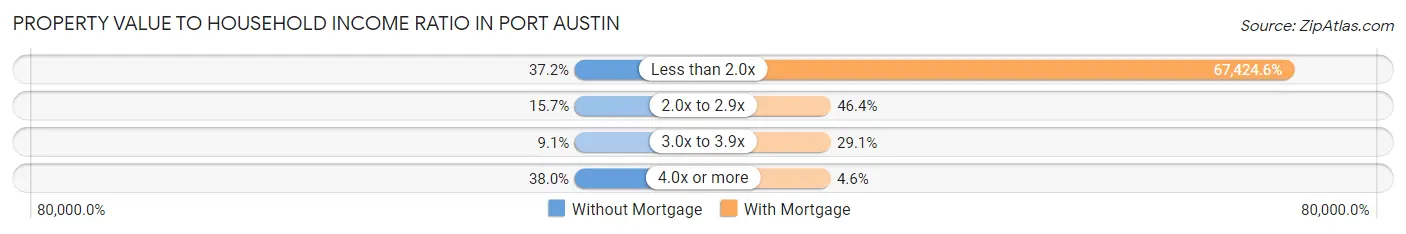
| Value-to-Income Ratio | Without Mortgage | With Mortgage |
| Less than 2.0x | 45 (37.2%) | 74,167 (67,424.5%) |
| 2.0x to 2.9x | 19 (15.7%) | 51 (46.4%) |
| 3.0x to 3.9x | 11 (9.1%) | 32 (29.1%) |
| 4.0x or more | 46 (38.0%) | 5 (4.5%) |
| Total | 121 (100.0%) | 110 (100.0%) |
Real Estate Taxes by Mortgage Status in Port Austin
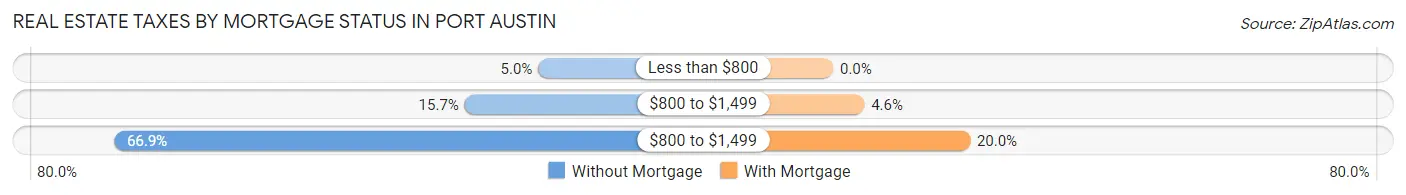
| Property Taxes | Without Mortgage | With Mortgage |
| Less than $800 | 6 (5.0%) | 0 (0.0%) |
| $800 to $1,499 | 19 (15.7%) | 5 (4.5%) |
| $800 to $1,499 | 81 (66.9%) | 22 (20.0%) |
| Total | 121 (100.0%) | 110 (100.0%) |
Health & Disability in Port Austin
Health Insurance Coverage by Age in Port Austin
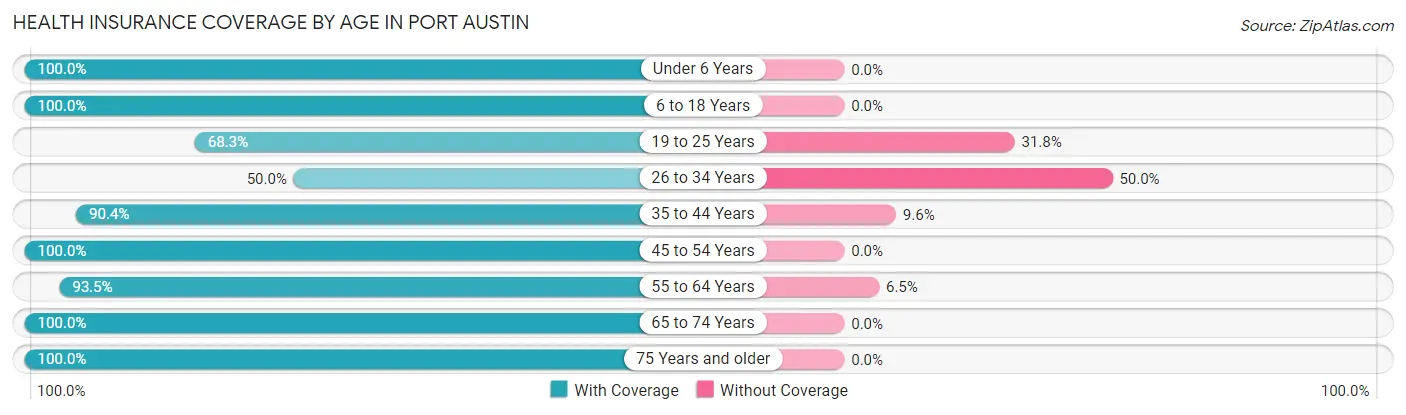
| Age Bracket | With Coverage | Without Coverage |
| Under 6 Years | 17 (100.0%) | 0 (0.0%) |
| 6 to 18 Years | 32 (100.0%) | 0 (0.0%) |
| 19 to 25 Years | 86 (68.2%) | 40 (31.8%) |
| 26 to 34 Years | 20 (50.0%) | 20 (50.0%) |
| 35 to 44 Years | 47 (90.4%) | 5 (9.6%) |
| 45 to 54 Years | 55 (100.0%) | 0 (0.0%) |
| 55 to 64 Years | 101 (93.5%) | 7 (6.5%) |
| 65 to 74 Years | 136 (100.0%) | 0 (0.0%) |
| 75 Years and older | 86 (100.0%) | 0 (0.0%) |
| Total | 580 (89.0%) | 72 (11.0%) |
Health Insurance Coverage by Citizenship Status in Port Austin
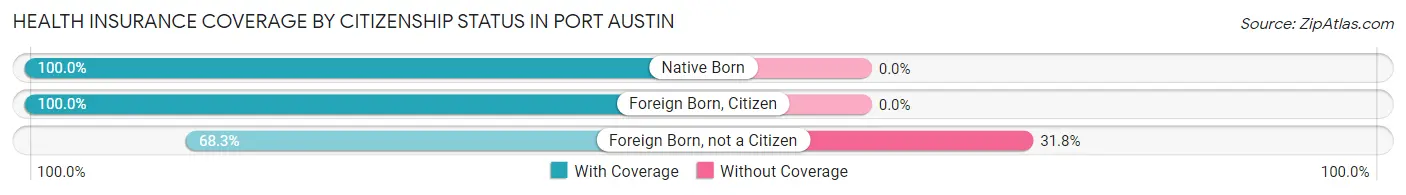
| Citizenship Status | With Coverage | Without Coverage |
| Native Born | 17 (100.0%) | 0 (0.0%) |
| Foreign Born, Citizen | 32 (100.0%) | 0 (0.0%) |
| Foreign Born, not a Citizen | 86 (68.2%) | 40 (31.8%) |
Health Insurance Coverage by Household Income in Port Austin
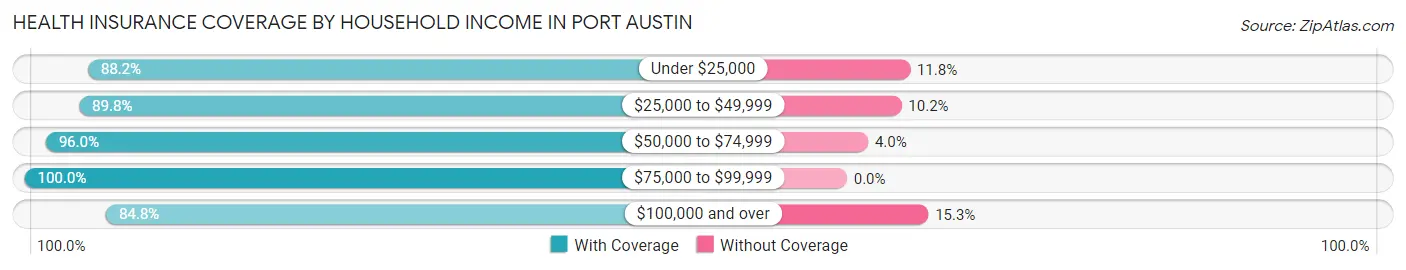
| Household Income | With Coverage | Without Coverage |
| Under $25,000 | 134 (88.2%) | 18 (11.8%) |
| $25,000 to $49,999 | 79 (89.8%) | 9 (10.2%) |
| $50,000 to $74,999 | 121 (96.0%) | 5 (4.0%) |
| $75,000 to $99,999 | 75 (100.0%) | 0 (0.0%) |
| $100,000 and over | 150 (84.8%) | 27 (15.2%) |
Public vs Private Health Insurance Coverage by Age in Port Austin
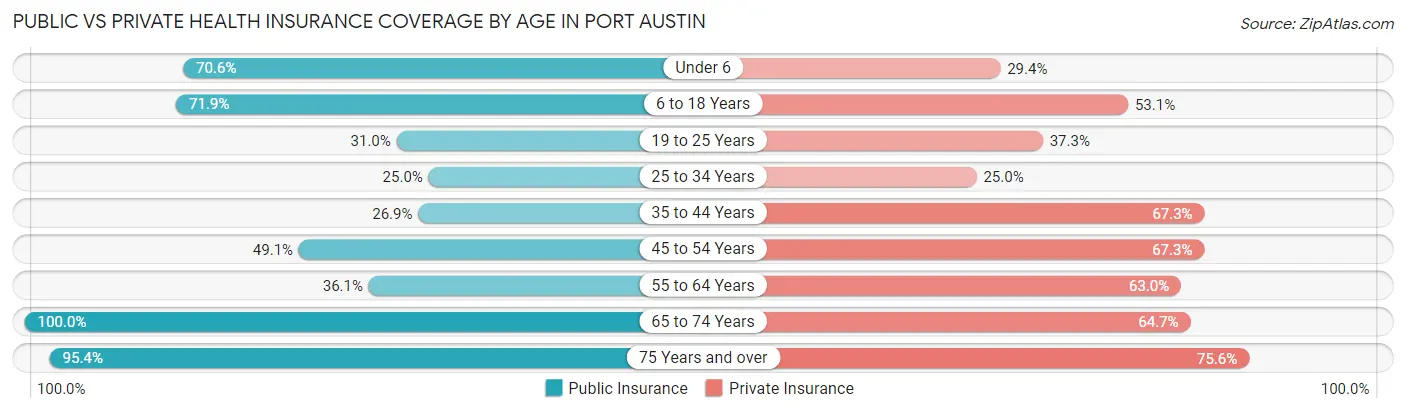
| Age Bracket | Public Insurance | Private Insurance |
| Under 6 | 12 (70.6%) | 5 (29.4%) |
| 6 to 18 Years | 23 (71.9%) | 17 (53.1%) |
| 19 to 25 Years | 39 (30.9%) | 47 (37.3%) |
| 25 to 34 Years | 10 (25.0%) | 10 (25.0%) |
| 35 to 44 Years | 14 (26.9%) | 35 (67.3%) |
| 45 to 54 Years | 27 (49.1%) | 37 (67.3%) |
| 55 to 64 Years | 39 (36.1%) | 68 (63.0%) |
| 65 to 74 Years | 136 (100.0%) | 88 (64.7%) |
| 75 Years and over | 82 (95.4%) | 65 (75.6%) |
| Total | 382 (58.6%) | 372 (57.1%) |
Disability Status by Sex by Age in Port Austin
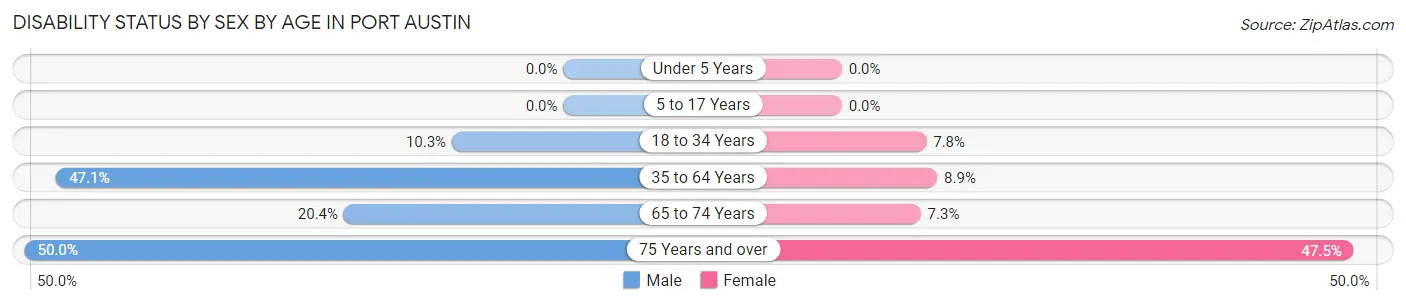
| Age Bracket | Male | Female |
| Under 5 Years | 0 (0.0%) | 0 (0.0%) |
| 5 to 17 Years | 0 (0.0%) | 0 (0.0%) |
| 18 to 34 Years | 12 (10.3%) | 4 (7.8%) |
| 35 to 64 Years | 48 (47.1%) | 10 (8.8%) |
| 65 to 74 Years | 11 (20.4%) | 6 (7.3%) |
| 75 Years and over | 23 (50.0%) | 19 (47.5%) |
Disability Class by Sex by Age in Port Austin
Disability Class: Hearing Difficulty
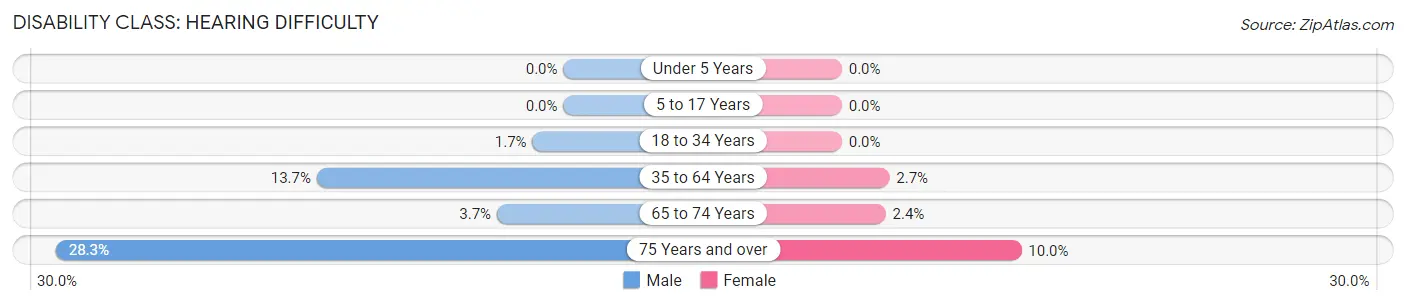
| Age Bracket | Male | Female |
| Under 5 Years | 0 (0.0%) | 0 (0.0%) |
| 5 to 17 Years | 0 (0.0%) | 0 (0.0%) |
| 18 to 34 Years | 2 (1.7%) | 0 (0.0%) |
| 35 to 64 Years | 14 (13.7%) | 3 (2.6%) |
| 65 to 74 Years | 2 (3.7%) | 2 (2.4%) |
| 75 Years and over | 13 (28.3%) | 4 (10.0%) |
Disability Class: Vision Difficulty
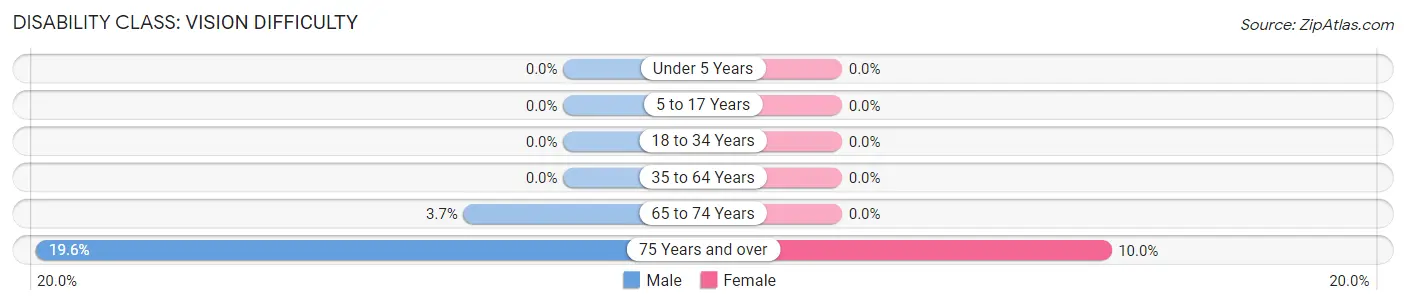
| Age Bracket | Male | Female |
| Under 5 Years | 0 (0.0%) | 0 (0.0%) |
| 5 to 17 Years | 0 (0.0%) | 0 (0.0%) |
| 18 to 34 Years | 0 (0.0%) | 0 (0.0%) |
| 35 to 64 Years | 0 (0.0%) | 0 (0.0%) |
| 65 to 74 Years | 2 (3.7%) | 0 (0.0%) |
| 75 Years and over | 9 (19.6%) | 4 (10.0%) |
Disability Class: Cognitive Difficulty
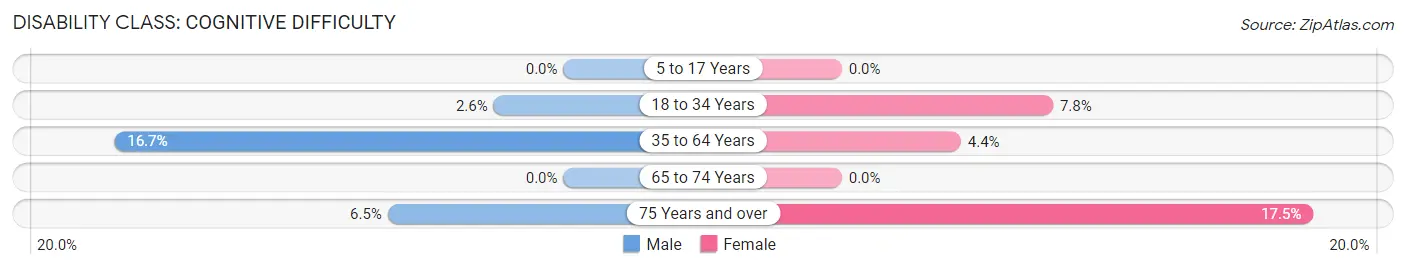
| Age Bracket | Male | Female |
| 5 to 17 Years | 0 (0.0%) | 0 (0.0%) |
| 18 to 34 Years | 3 (2.6%) | 4 (7.8%) |
| 35 to 64 Years | 17 (16.7%) | 5 (4.4%) |
| 65 to 74 Years | 0 (0.0%) | 0 (0.0%) |
| 75 Years and over | 3 (6.5%) | 7 (17.5%) |
Disability Class: Ambulatory Difficulty
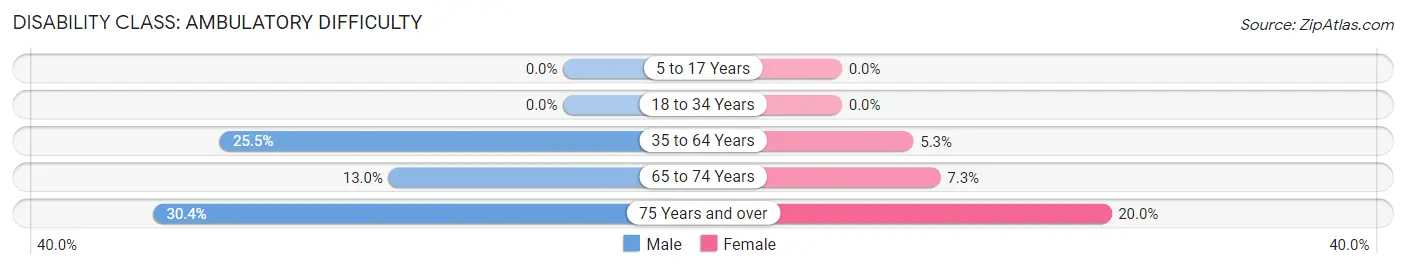
| Age Bracket | Male | Female |
| 5 to 17 Years | 0 (0.0%) | 0 (0.0%) |
| 18 to 34 Years | 0 (0.0%) | 0 (0.0%) |
| 35 to 64 Years | 26 (25.5%) | 6 (5.3%) |
| 65 to 74 Years | 7 (13.0%) | 6 (7.3%) |
| 75 Years and over | 14 (30.4%) | 8 (20.0%) |
Disability Class: Self-Care Difficulty
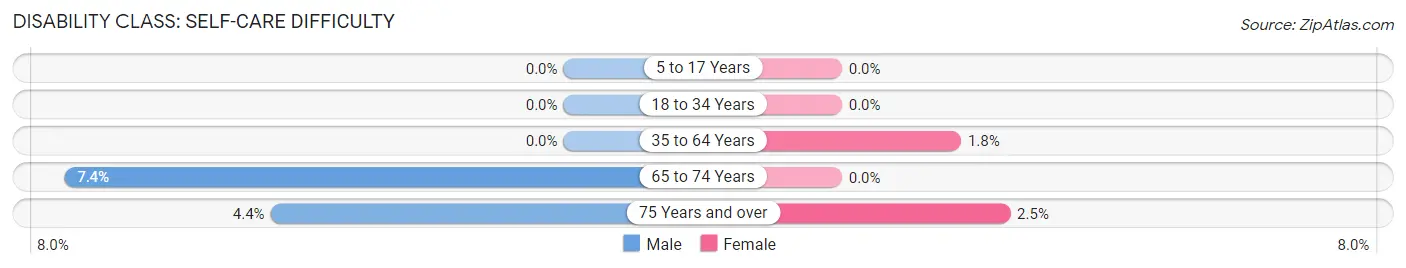
| Age Bracket | Male | Female |
| 5 to 17 Years | 0 (0.0%) | 0 (0.0%) |
| 18 to 34 Years | 0 (0.0%) | 0 (0.0%) |
| 35 to 64 Years | 0 (0.0%) | 2 (1.8%) |
| 65 to 74 Years | 4 (7.4%) | 0 (0.0%) |
| 75 Years and over | 2 (4.3%) | 1 (2.5%) |
Technology Access in Port Austin
Computing Device Access in Port Austin
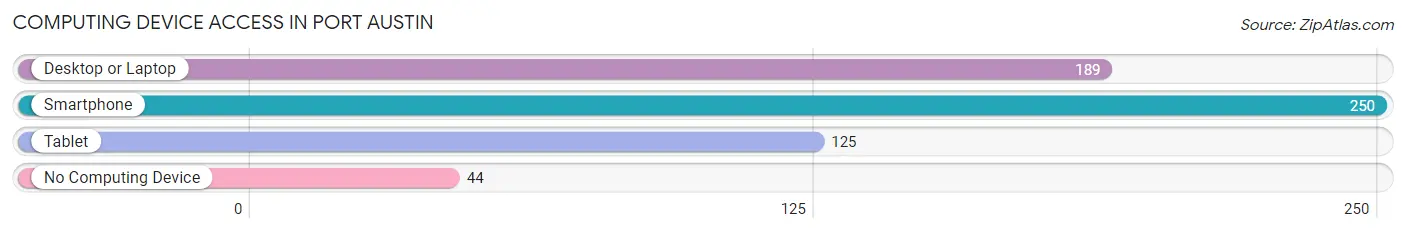
| Device Type | # Households | % Households |
| Desktop or Laptop | 189 | 57.6% |
| Smartphone | 250 | 76.2% |
| Tablet | 125 | 38.1% |
| No Computing Device | 44 | 13.4% |
| Total | 328 | 100.0% |
Internet Access in Port Austin
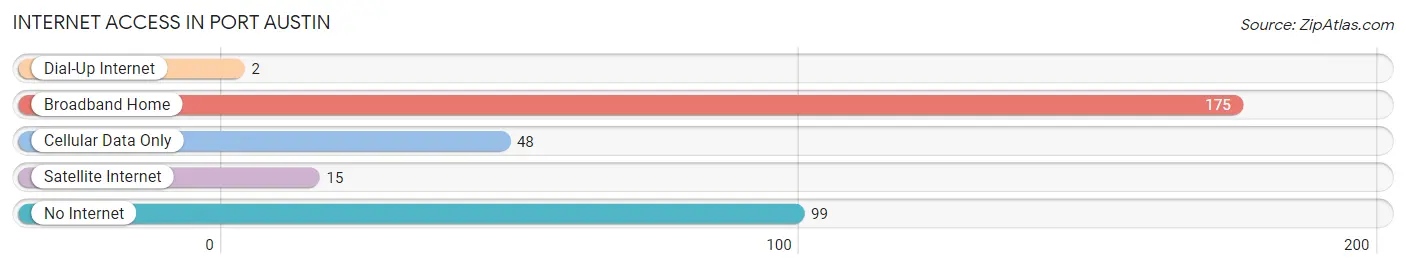
| Internet Type | # Households | % Households |
| Dial-Up Internet | 2 | 0.6% |
| Broadband Home | 175 | 53.3% |
| Cellular Data Only | 48 | 14.6% |
| Satellite Internet | 15 | 4.6% |
| No Internet | 99 | 30.2% |
| Total | 328 | 100.0% |
Port Austin Summary
History
Port Austin is a small village located in the thumb of Michigan, on the shores of Lake Huron. It was first settled in 1837 by a group of settlers from New York, led by William Austin. The village was originally known as Austin’s Port, but was later changed to Port Austin. The village was incorporated in 1867.
The village was a popular destination for vacationers in the late 19th and early 20th centuries. It was known for its beautiful beaches and its many resorts. The village was also home to a number of commercial fishing operations, which provided employment for many of the residents.
In the late 20th century, the village began to decline as the fishing industry declined and the resorts closed. However, the village has seen a resurgence in recent years, as it has become a popular destination for tourists and retirees.
Geography
Port Austin is located in the thumb of Michigan, on the shores of Lake Huron. The village is situated on a small peninsula, surrounded by the lake on three sides. The village is located approximately 50 miles north of Detroit and 30 miles south of Saginaw.
The village is located in Huron County, and is part of the Thumb Area. The village is bordered by the townships of Caseville, Colfax, and Dwight. The village is located in a rural area, and is surrounded by farmland and woodlands.
Economy
The economy of Port Austin is largely based on tourism and retirement. The village is a popular destination for tourists, who come to enjoy the beaches, fishing, and other outdoor activities. The village is also home to a number of resorts and bed and breakfasts, which provide employment for many of the residents.
The village is also home to a number of small businesses, including restaurants, shops, and galleries. The village is also home to a number of marinas, which provide employment for many of the residents.
Demographics
As of the 2010 census, the population of Port Austin was 1,120. The population is largely white (94.3%), with small percentages of African American (2.2%), Native American (0.9%), and Asian (0.7%) residents. The median household income is $37,500, and the median age is 44.
The village is home to a number of churches, including the United Methodist Church, the Catholic Church, and the Church of the Nazarene. The village is also home to a number of schools, including Port Austin High School and Port Austin Elementary School.
Common Questions
What is Per Capita Income in Port Austin?
Per Capita income in Port Austin is $34,540.
What is the Median Family Income in Port Austin?
Median Family Income in Port Austin is $60,750.
What is the Median Household income in Port Austin?
Median Household Income in Port Austin is $53,125.
What is Income or Wage Gap in Port Austin?
Income or Wage Gap in Port Austin is 9.5%.
Women in Port Austin earn 90.5 cents for every dollar earned by a man.
What is Inequality or Gini Index in Port Austin?
Inequality or Gini Index in Port Austin is 0.43.
What is the Total Population of Port Austin?
Total Population of Port Austin is 667.
What is the Total Male Population of Port Austin?
Total Male Population of Port Austin is 347.
What is the Total Female Population of Port Austin?
Total Female Population of Port Austin is 320.
What is the Ratio of Males per 100 Females in Port Austin?
There are 108.44 Males per 100 Females in Port Austin.
What is the Ratio of Females per 100 Males in Port Austin?
There are 92.22 Females per 100 Males in Port Austin.
What is the Median Population Age in Port Austin?
Median Population Age in Port Austin is 55.3 Years.
What is the Average Family Size in Port Austin
Average Family Size in Port Austin is 2.7 People.
What is the Average Household Size in Port Austin
Average Household Size in Port Austin is 1.9 People.
How Large is the Labor Force in Port Austin?
There are 338 People in the Labor Forcein in Port Austin.
What is the Percentage of People in the Labor Force in Port Austin?
53.3% of People are in the Labor Force in Port Austin.
What is the Unemployment Rate in Port Austin?
Unemployment Rate in Port Austin is 8.2%.