Eufaula, AL Map & Demographics
Eufaula Map
Eufaula Overview
$24,994
PER CAPITA INCOME
$57,174
AVG FAMILY INCOME
$39,511
AVG HOUSEHOLD INCOME
25.0%
WAGE / INCOME GAP [ % ]
75.0¢/ $1
WAGE / INCOME GAP [ $ ]
$13,644
FAMILY INCOME DEFICIT
0.51
INEQUALITY / GINI INDEX
12,746
TOTAL POPULATION
5,740
MALE POPULATION
7,006
FEMALE POPULATION
81.93
MALES / 100 FEMALES
122.06
FEMALES / 100 MALES
37.0
MEDIAN AGE
3.2
AVG FAMILY SIZE
2.5
AVG HOUSEHOLD SIZE
4,974
LABOR FORCE [ PEOPLE ]
50.0%
PERCENT IN LABOR FORCE
5.2%
UNEMPLOYMENT RATE
Eufaula Zip Codes
Eufaula Area Codes
Income in Eufaula
Income Overview in Eufaula
Per Capita Income in Eufaula is $24,994, while median incomes of families and households are $57,174 and $39,511 respectively.
| Characteristic | Number | Measure |
| Per Capita Income | 12,746 | $24,994 |
| Median Family Income | 3,286 | $57,174 |
| Mean Family Income | 3,286 | $70,960 |
| Median Household Income | 5,023 | $39,511 |
| Mean Household Income | 5,023 | $60,914 |
| Income Deficit | 3,286 | $13,644 |
| Wage / Income Gap (%) | 12,746 | 24.99% |
| Wage / Income Gap ($) | 12,746 | 75.01¢ per $1 |
| Gini / Inequality Index | 12,746 | 0.51 |
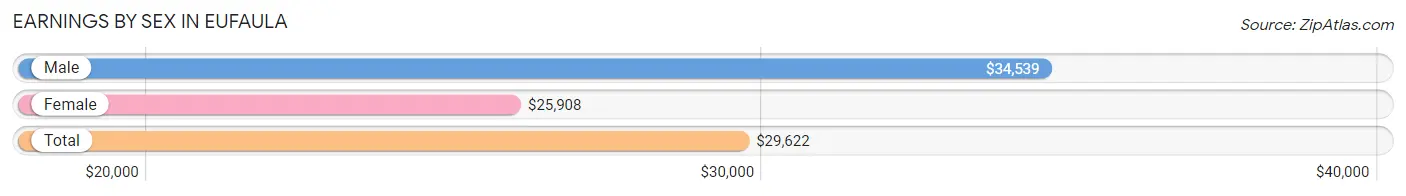
Earnings by Sex in Eufaula
Average Earnings in Eufaula are $29,622, $34,539 for men and $25,908 for women, a difference of 25.0%.
| Sex | Number | Average Earnings |
| Male | 2,414 (46.1%) | $34,539 |
| Female | 2,823 (53.9%) | $25,908 |
| Total | 5,237 (100.0%) | $29,622 |
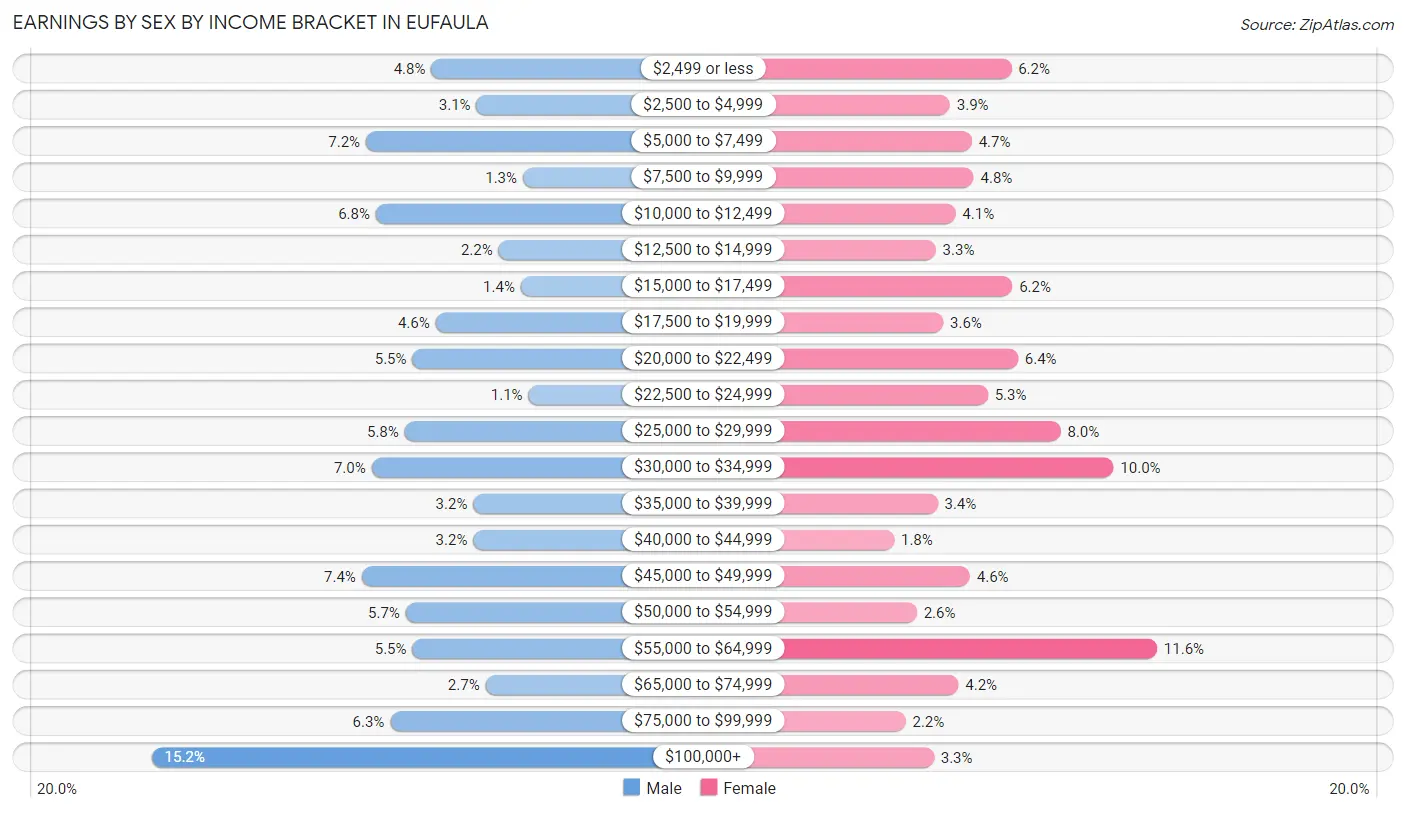
Earnings by Sex by Income Bracket in Eufaula
The most common earnings brackets in Eufaula are $100,000+ for men (368 | 15.2%) and $55,000 to $64,999 for women (328 | 11.6%).
| Income | Male | Female |
| $2,499 or less | 115 (4.8%) | 174 (6.2%) |
| $2,500 to $4,999 | 74 (3.1%) | 109 (3.9%) |
| $5,000 to $7,499 | 174 (7.2%) | 132 (4.7%) |
| $7,500 to $9,999 | 32 (1.3%) | 134 (4.8%) |
| $10,000 to $12,499 | 165 (6.8%) | 115 (4.1%) |
| $12,500 to $14,999 | 54 (2.2%) | 94 (3.3%) |
| $15,000 to $17,499 | 34 (1.4%) | 175 (6.2%) |
| $17,500 to $19,999 | 111 (4.6%) | 102 (3.6%) |
| $20,000 to $22,499 | 132 (5.5%) | 181 (6.4%) |
| $22,500 to $24,999 | 27 (1.1%) | 149 (5.3%) |
| $25,000 to $29,999 | 139 (5.8%) | 226 (8.0%) |
| $30,000 to $34,999 | 169 (7.0%) | 282 (10.0%) |
| $35,000 to $39,999 | 77 (3.2%) | 96 (3.4%) |
| $40,000 to $44,999 | 77 (3.2%) | 50 (1.8%) |
| $45,000 to $49,999 | 178 (7.4%) | 130 (4.6%) |
| $50,000 to $54,999 | 138 (5.7%) | 74 (2.6%) |
| $55,000 to $64,999 | 132 (5.5%) | 328 (11.6%) |
| $65,000 to $74,999 | 66 (2.7%) | 118 (4.2%) |
| $75,000 to $99,999 | 152 (6.3%) | 62 (2.2%) |
| $100,000+ | 368 (15.2%) | 92 (3.3%) |
| Total | 2,414 (100.0%) | 2,823 (100.0%) |
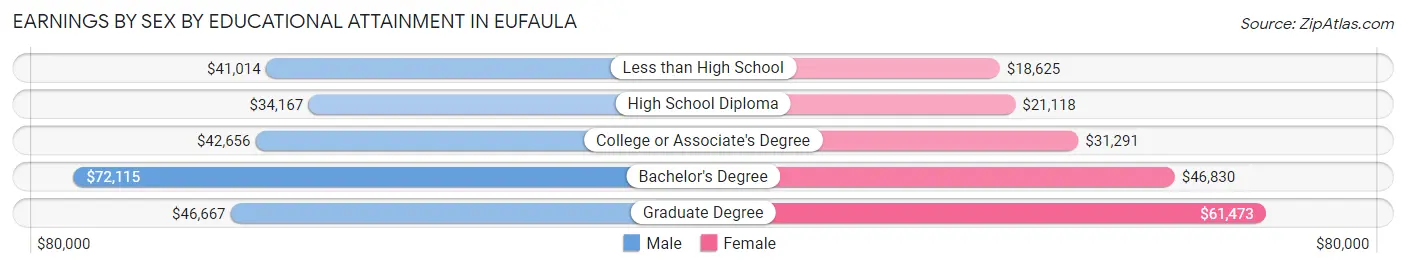
Earnings by Sex by Educational Attainment in Eufaula
Average earnings in Eufaula are $45,356 for men and $30,101 for women, a difference of 33.6%. Men with an educational attainment of bachelor's degree enjoy the highest average annual earnings of $72,115, while those with high school diploma education earn the least with $34,167. Women with an educational attainment of graduate degree earn the most with the average annual earnings of $61,473, while those with less than high school education have the smallest earnings of $18,625.
| Educational Attainment | Male Income | Female Income |
| Less than High School | $41,014 | $18,625 |
| High School Diploma | $34,167 | $21,118 |
| College or Associate's Degree | $42,656 | $31,291 |
| Bachelor's Degree | $72,115 | $46,830 |
| Graduate Degree | $46,667 | $61,473 |
| Total | $45,356 | $30,101 |
Family Income in Eufaula
Family Income Brackets in Eufaula
According to the Eufaula family income data, there are 513 families falling into the $50,000 to $74,999 income range, which is the most common income bracket and makes up 15.6% of all families. Conversely, the $150,000 to $199,999 income bracket is the least frequent group with only 158 families (4.8%) belonging to this category.
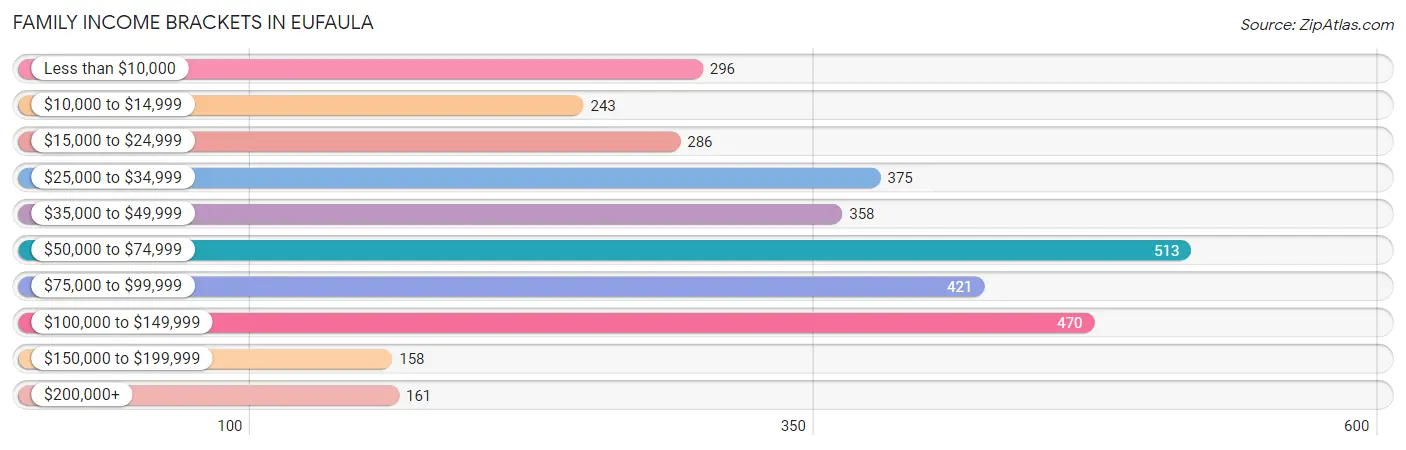
| Income Bracket | # Families | % Families |
| Less than $10,000 | 296 | 9.0% |
| $10,000 to $14,999 | 243 | 7.4% |
| $15,000 to $24,999 | 286 | 8.7% |
| $25,000 to $34,999 | 375 | 11.4% |
| $35,000 to $49,999 | 358 | 10.9% |
| $50,000 to $74,999 | 513 | 15.6% |
| $75,000 to $99,999 | 421 | 12.8% |
| $100,000 to $149,999 | 470 | 14.3% |
| $150,000 to $199,999 | 158 | 4.8% |
| $200,000+ | 161 | 4.9% |
Family Income by Famaliy Size in Eufaula
5-person families (169 | 5.1%) account for the highest median family income in Eufaula with $74,934 per family, while 2-person families (1,542 | 46.9%) have the highest median income of $29,676 per family member.
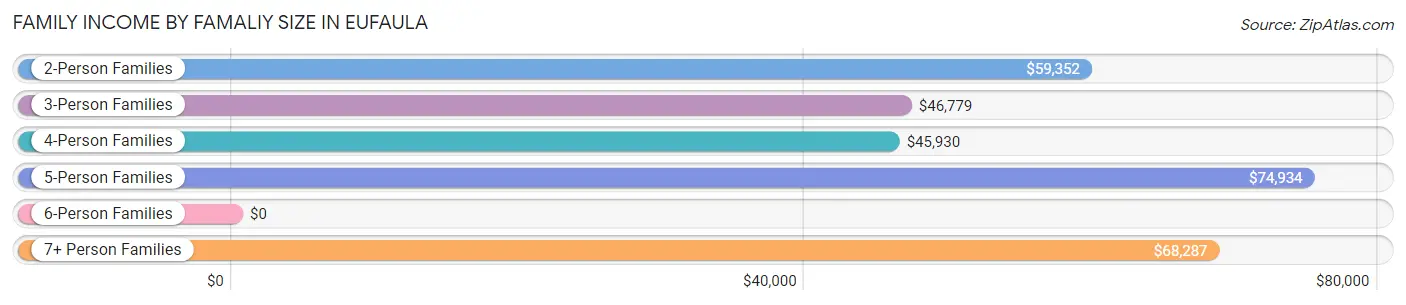
| Income Bracket | # Families | Median Income |
| 2-Person Families | 1,542 (46.9%) | $59,352 |
| 3-Person Families | 935 (28.4%) | $46,779 |
| 4-Person Families | 562 (17.1%) | $45,930 |
| 5-Person Families | 169 (5.1%) | $74,934 |
| 6-Person Families | 23 (0.7%) | $0 |
| 7+ Person Families | 55 (1.7%) | $68,287 |
| Total | 3,286 (100.0%) | $57,174 |
Family Income by Number of Earners in Eufaula
The median family income in Eufaula is $57,174, with families comprising 2 earners (1,045) having the highest median family income of $82,070, while families with no earners (811) have the lowest median family income of $24,923, accounting for 31.8% and 24.7% of families, respectively.
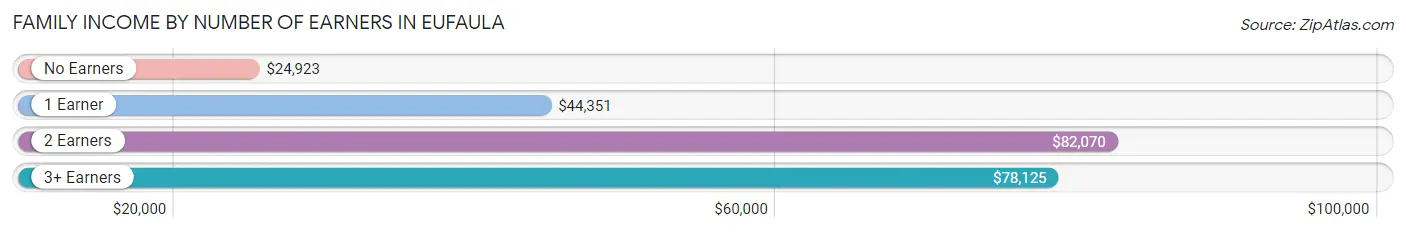
| Number of Earners | # Families | Median Income |
| No Earners | 811 (24.7%) | $24,923 |
| 1 Earner | 1,239 (37.7%) | $44,351 |
| 2 Earners | 1,045 (31.8%) | $82,070 |
| 3+ Earners | 191 (5.8%) | $78,125 |
| Total | 3,286 (100.0%) | $57,174 |
Household Income in Eufaula
Household Income Brackets in Eufaula
With 809 households falling in the category, the $15,000 to $24,999 income range is the most frequent in Eufaula, accounting for 16.1% of all households. In contrast, only 171 households (3.4%) fall into the $150,000 to $199,999 income bracket, making it the least populous group.
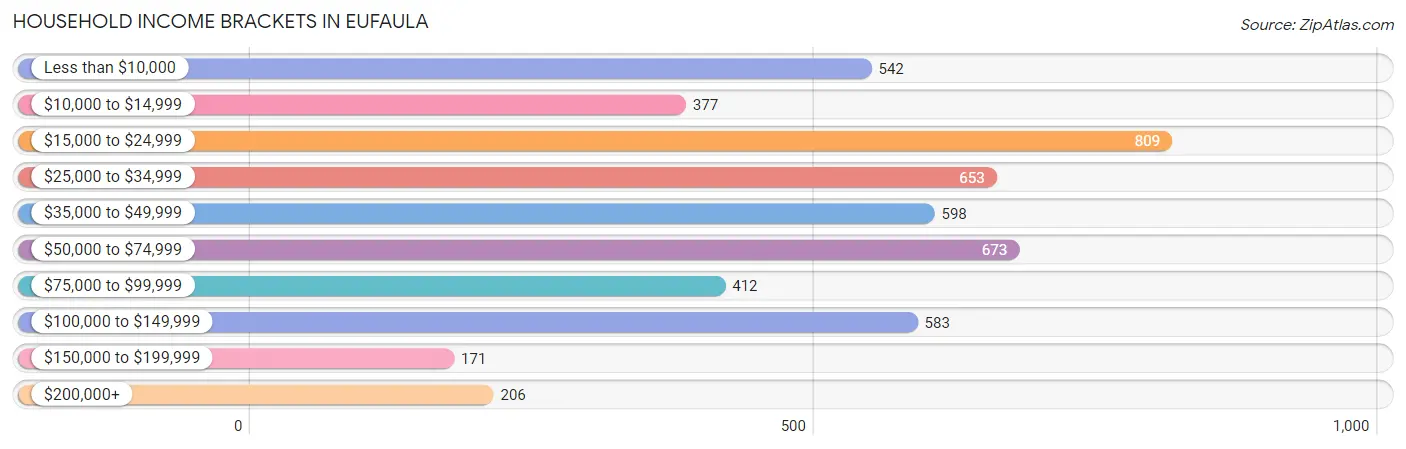
| Income Bracket | # Households | % Households |
| Less than $10,000 | 542 | 10.8% |
| $10,000 to $14,999 | 377 | 7.5% |
| $15,000 to $24,999 | 809 | 16.1% |
| $25,000 to $34,999 | 653 | 13.0% |
| $35,000 to $49,999 | 598 | 11.9% |
| $50,000 to $74,999 | 673 | 13.4% |
| $75,000 to $99,999 | 412 | 8.2% |
| $100,000 to $149,999 | 583 | 11.6% |
| $150,000 to $199,999 | 171 | 3.4% |
| $200,000+ | 206 | 4.1% |
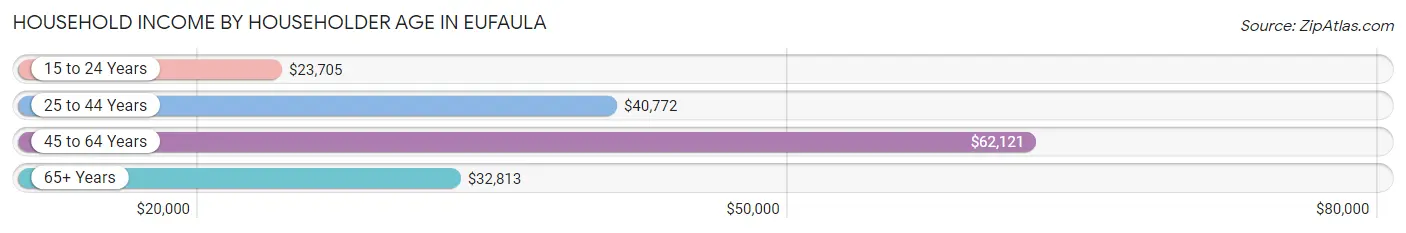
Household Income by Householder Age in Eufaula
The median household income in Eufaula is $39,511, with the highest median household income of $62,121 found in the 45 to 64 years age bracket for the primary householder. A total of 1,506 households (30.0%) fall into this category. Meanwhile, the 15 to 24 years age bracket for the primary householder has the lowest median household income of $23,705, with 310 households (6.2%) in this group.
| Income Bracket | # Households | Median Income |
| 15 to 24 Years | 310 (6.2%) | $23,705 |
| 25 to 44 Years | 1,559 (31.0%) | $40,772 |
| 45 to 64 Years | 1,506 (30.0%) | $62,121 |
| 65+ Years | 1,648 (32.8%) | $32,813 |
| Total | 5,023 (100.0%) | $39,511 |
Poverty in Eufaula
Income Below Poverty by Sex and Age in Eufaula
With 21.8% poverty level for males and 28.2% for females among the residents of Eufaula, under 5 year old males and 6 to 11 year old females are the most vulnerable to poverty, with 280 males (64.4%) and 380 females (67.5%) in their respective age groups living below the poverty level.
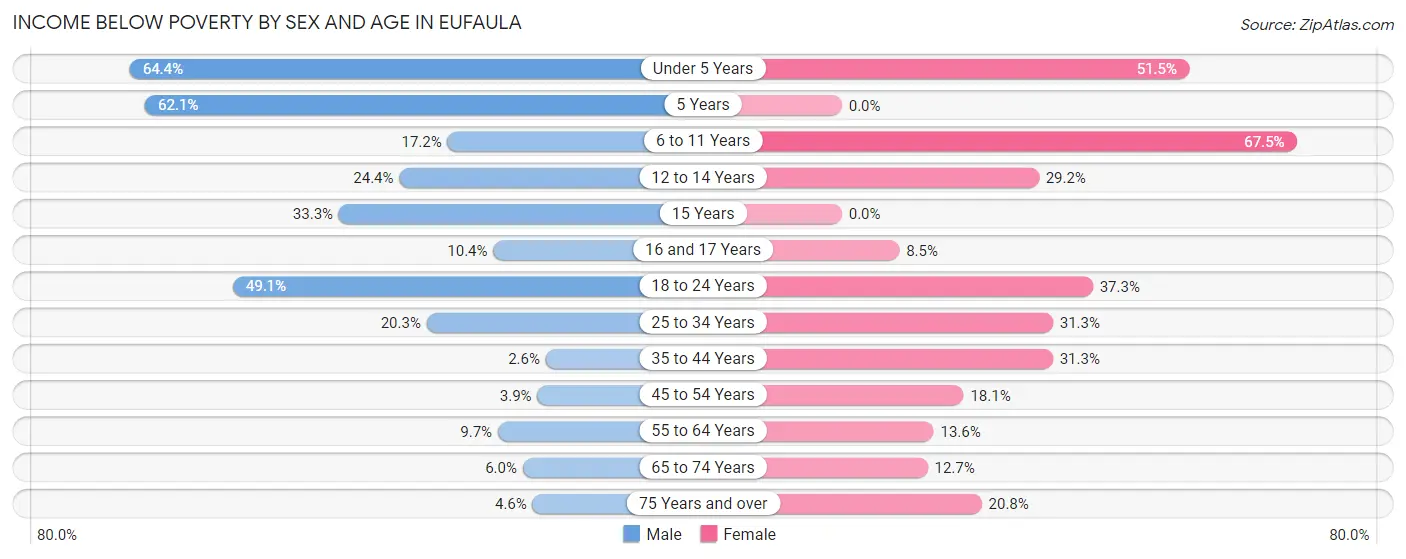
| Age Bracket | Male | Female |
| Under 5 Years | 280 (64.4%) | 255 (51.5%) |
| 5 Years | 59 (62.1%) | 0 (0.0%) |
| 6 to 11 Years | 65 (17.2%) | 380 (67.5%) |
| 12 to 14 Years | 94 (24.3%) | 81 (29.2%) |
| 15 Years | 22 (33.3%) | 0 (0.0%) |
| 16 and 17 Years | 16 (10.4%) | 18 (8.5%) |
| 18 to 24 Years | 423 (49.1%) | 174 (37.3%) |
| 25 to 34 Years | 140 (20.3%) | 292 (31.3%) |
| 35 to 44 Years | 14 (2.6%) | 238 (31.3%) |
| 45 to 54 Years | 19 (3.8%) | 122 (18.1%) |
| 55 to 64 Years | 56 (9.7%) | 122 (13.6%) |
| 65 to 74 Years | 32 (6.0%) | 97 (12.7%) |
| 75 Years and over | 22 (4.6%) | 153 (20.8%) |
| Total | 1,242 (21.8%) | 1,932 (28.2%) |
Income Above Poverty by Sex and Age in Eufaula
According to the poverty statistics in Eufaula, males aged 35 to 44 years and females aged 5 years are the age groups that are most secure financially, with 97.4% of males and 100.0% of females in these age groups living above the poverty line.
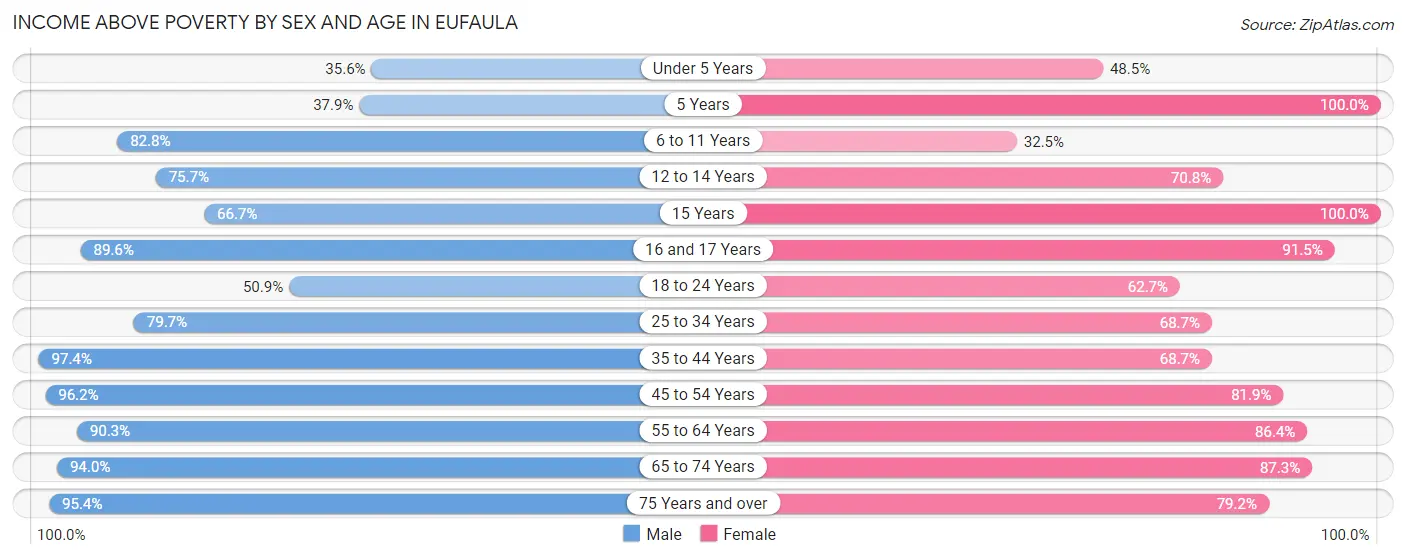
| Age Bracket | Male | Female |
| Under 5 Years | 155 (35.6%) | 240 (48.5%) |
| 5 Years | 36 (37.9%) | 20 (100.0%) |
| 6 to 11 Years | 313 (82.8%) | 183 (32.5%) |
| 12 to 14 Years | 292 (75.6%) | 196 (70.8%) |
| 15 Years | 44 (66.7%) | 50 (100.0%) |
| 16 and 17 Years | 138 (89.6%) | 193 (91.5%) |
| 18 to 24 Years | 439 (50.9%) | 293 (62.7%) |
| 25 to 34 Years | 550 (79.7%) | 640 (68.7%) |
| 35 to 44 Years | 523 (97.4%) | 522 (68.7%) |
| 45 to 54 Years | 475 (96.2%) | 553 (81.9%) |
| 55 to 64 Years | 521 (90.3%) | 773 (86.4%) |
| 65 to 74 Years | 500 (94.0%) | 665 (87.3%) |
| 75 Years and over | 460 (95.4%) | 584 (79.2%) |
| Total | 4,446 (78.2%) | 4,912 (71.8%) |
Income Below Poverty Among Married-Couple Families in Eufaula
The poverty statistics for married-couple families in Eufaula show that 4.0% or 73 of the total 1,828 families live below the poverty line. Families with 3 or 4 children have the highest poverty rate of 10.1%, comprising of 7 families. On the other hand, families with 5 or more children have the lowest poverty rate of 0.0%, which includes 0 families.
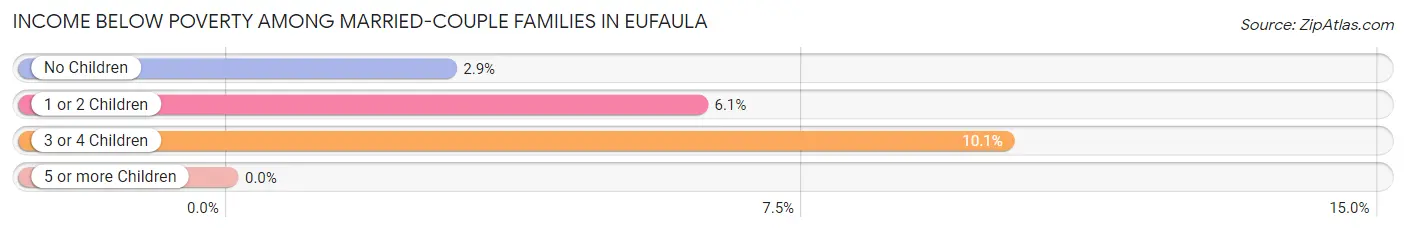
| Children | Above Poverty | Below Poverty |
| No Children | 1,191 (97.2%) | 35 (2.9%) |
| 1 or 2 Children | 475 (93.9%) | 31 (6.1%) |
| 3 or 4 Children | 62 (89.9%) | 7 (10.1%) |
| 5 or more Children | 27 (100.0%) | 0 (0.0%) |
| Total | 1,755 (96.0%) | 73 (4.0%) |
Income Below Poverty Among Single-Parent Households in Eufaula
According to the poverty data in Eufaula, 15.2% or 31 single-father households and 48.6% or 609 single-mother households are living below the poverty line. Among single-father households, those with 1 or 2 children have the highest poverty rate, with 13 households (16.7%) experiencing poverty. Likewise, among single-mother households, those with 3 or 4 children have the highest poverty rate, with 208 households (67.3%) falling below the poverty line.
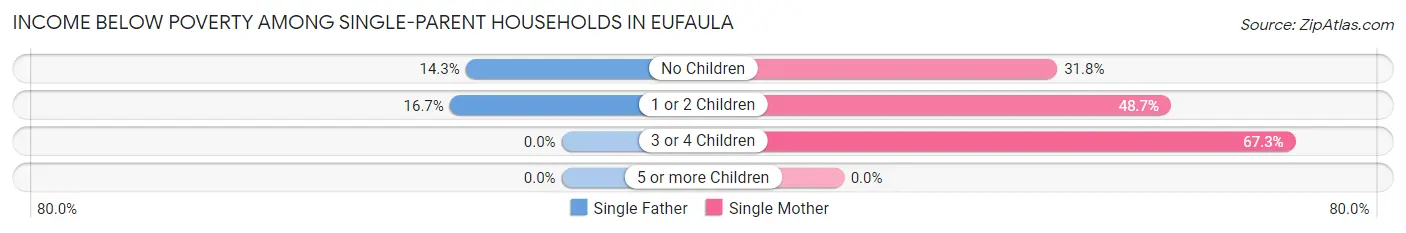
| Children | Single Father | Single Mother |
| No Children | 18 (14.3%) | 112 (31.8%) |
| 1 or 2 Children | 13 (16.7%) | 289 (48.7%) |
| 3 or 4 Children | 0 (0.0%) | 208 (67.3%) |
| 5 or more Children | 0 (0.0%) | 0 (0.0%) |
| Total | 31 (15.2%) | 609 (48.6%) |
Income Below Poverty Among Married-Couple vs Single-Parent Households in Eufaula
The poverty data for Eufaula shows that 73 of the married-couple family households (4.0%) and 640 of the single-parent households (43.9%) are living below the poverty level. Within the married-couple family households, those with 3 or 4 children have the highest poverty rate, with 7 households (10.1%) falling below the poverty line. Among the single-parent households, those with 3 or 4 children have the highest poverty rate, with 208 household (67.3%) living below poverty.
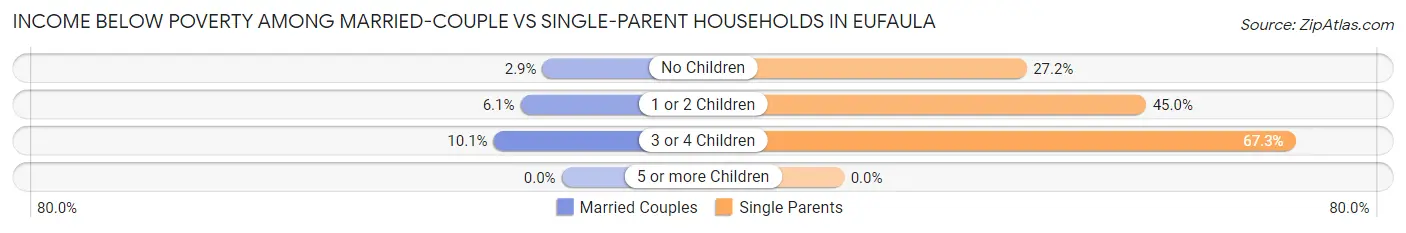
| Children | Married-Couple Families | Single-Parent Households |
| No Children | 35 (2.9%) | 130 (27.2%) |
| 1 or 2 Children | 31 (6.1%) | 302 (45.0%) |
| 3 or 4 Children | 7 (10.1%) | 208 (67.3%) |
| 5 or more Children | 0 (0.0%) | 0 (0.0%) |
| Total | 73 (4.0%) | 640 (43.9%) |
Race in Eufaula
The most populous races in Eufaula are White / Caucasian (5,935 | 46.6%), Black / African American (5,673 | 44.5%), and Some other Race (673 | 5.3%).
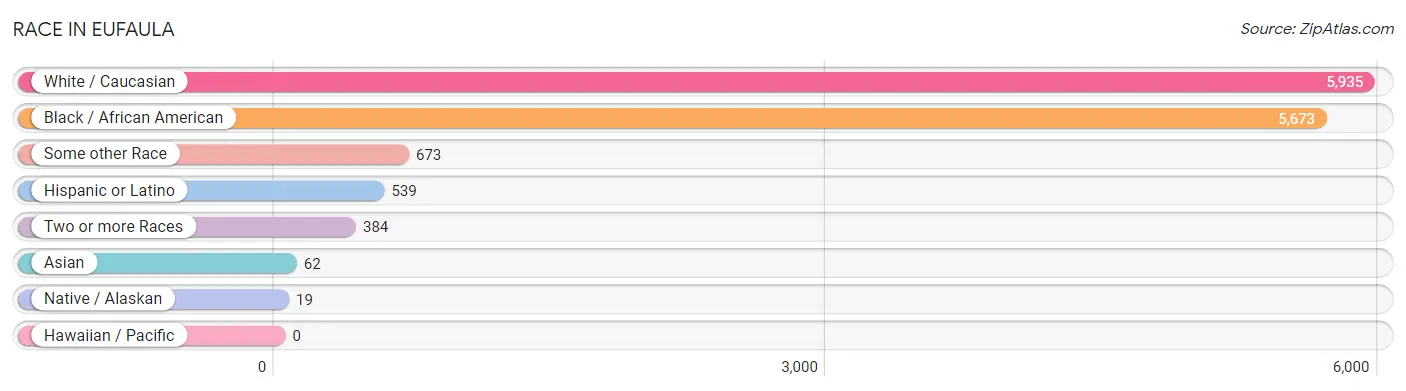
| Race | # Population | % Population |
| Asian | 62 | 0.5% |
| Black / African American | 5,673 | 44.5% |
| Hawaiian / Pacific | 0 | 0.0% |
| Hispanic or Latino | 539 | 4.2% |
| Native / Alaskan | 19 | 0.2% |
| White / Caucasian | 5,935 | 46.6% |
| Two or more Races | 384 | 3.0% |
| Some other Race | 673 | 5.3% |
| Total | 12,746 | 100.0% |
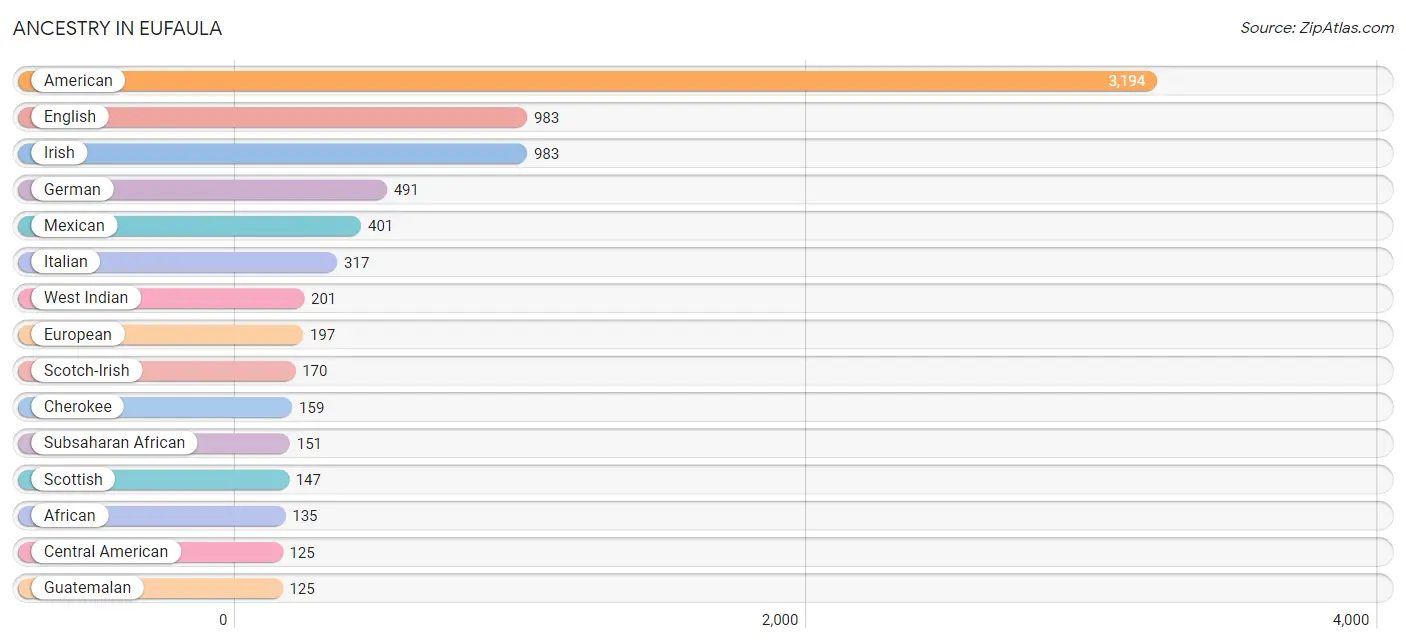
Ancestry in Eufaula
The most populous ancestries reported in Eufaula are American (3,194 | 25.1%), English (983 | 7.7%), Irish (983 | 7.7%), German (491 | 3.8%), and Mexican (401 | 3.2%), together accounting for 47.5% of all Eufaula residents.
| Ancestry | # Population | % Population |
| African | 135 | 1.1% |
| American | 3,194 | 25.1% |
| Arab | 37 | 0.3% |
| Belgian | 17 | 0.1% |
| Bermudan | 13 | 0.1% |
| Bhutanese | 23 | 0.2% |
| British | 36 | 0.3% |
| Burmese | 6 | 0.1% |
| Canadian | 3 | 0.0% |
| Central American | 125 | 1.0% |
| Cherokee | 159 | 1.3% |
| Creek | 9 | 0.1% |
| Czech | 12 | 0.1% |
| Dutch | 20 | 0.2% |
| Eastern European | 26 | 0.2% |
| English | 983 | 7.7% |
| European | 197 | 1.5% |
| French | 46 | 0.4% |
| French Canadian | 11 | 0.1% |
| German | 491 | 3.8% |
| Greek | 11 | 0.1% |
| Guatemalan | 125 | 1.0% |
| Irish | 983 | 7.7% |
| Iroquois | 82 | 0.6% |
| Italian | 317 | 2.5% |
| Mexican | 401 | 3.2% |
| Polish | 24 | 0.2% |
| Potawatomi | 5 | 0.0% |
| Puerto Rican | 6 | 0.1% |
| Scandinavian | 90 | 0.7% |
| Scotch-Irish | 170 | 1.3% |
| Scottish | 147 | 1.1% |
| Spaniard | 7 | 0.1% |
| Sri Lankan | 16 | 0.1% |
| Subsaharan African | 151 | 1.2% |
| Swedish | 47 | 0.4% |
| Swiss | 5 | 0.0% |
| Syrian | 37 | 0.3% |
| Thai | 34 | 0.3% |
| Ukrainian | 9 | 0.1% |
| Welsh | 7 | 0.1% |
| West Indian | 201 | 1.6% |
| Yugoslavian | 9 | 0.1% | View All 43 Rows |
Immigrants in Eufaula
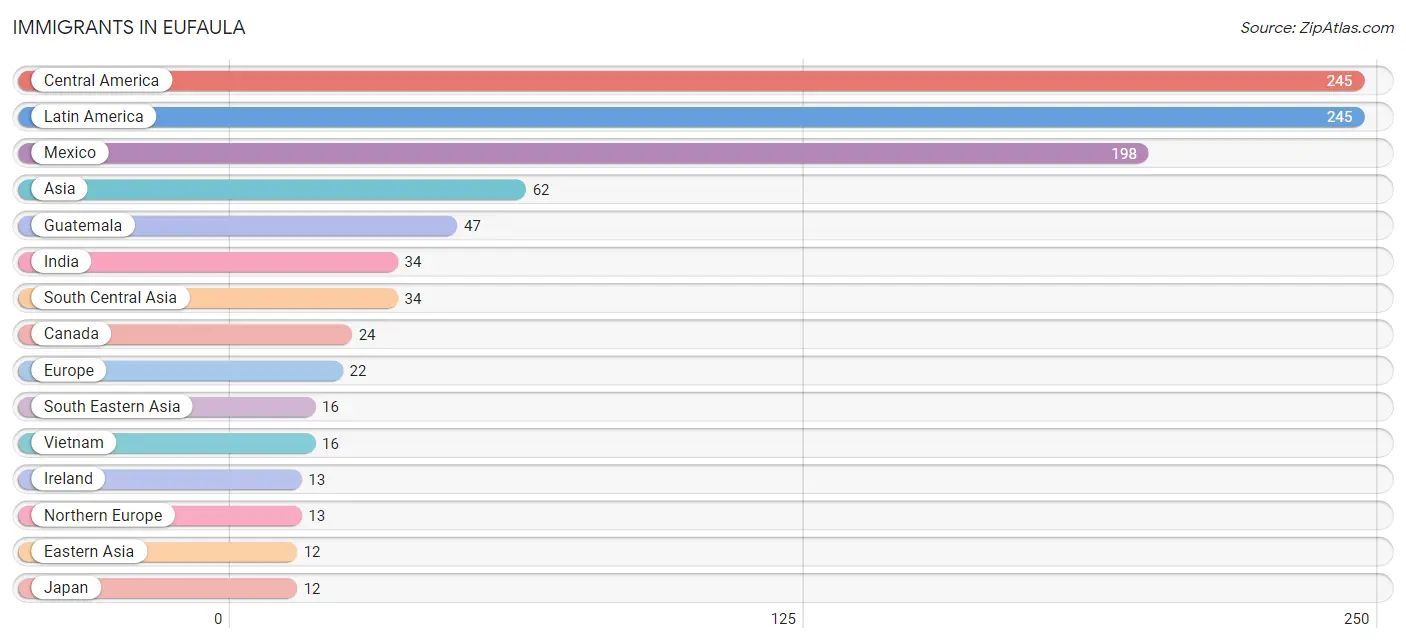
The most numerous immigrant groups reported in Eufaula came from Central America (245 | 1.9%), Latin America (245 | 1.9%), Mexico (198 | 1.5%), Asia (62 | 0.5%), and Guatemala (47 | 0.4%), together accounting for 6.2% of all Eufaula residents.
| Immigration Origin | # Population | % Population |
| Asia | 62 | 0.5% |
| Belgium | 9 | 0.1% |
| Canada | 24 | 0.2% |
| Central America | 245 | 1.9% |
| Eastern Asia | 12 | 0.1% |
| Europe | 22 | 0.2% |
| Guatemala | 47 | 0.4% |
| India | 34 | 0.3% |
| Ireland | 13 | 0.1% |
| Japan | 12 | 0.1% |
| Latin America | 245 | 1.9% |
| Mexico | 198 | 1.5% |
| Northern Europe | 13 | 0.1% |
| South Central Asia | 34 | 0.3% |
| South Eastern Asia | 16 | 0.1% |
| Vietnam | 16 | 0.1% |
| Western Europe | 9 | 0.1% | View All 17 Rows |
Sex and Age in Eufaula
Sex and Age in Eufaula
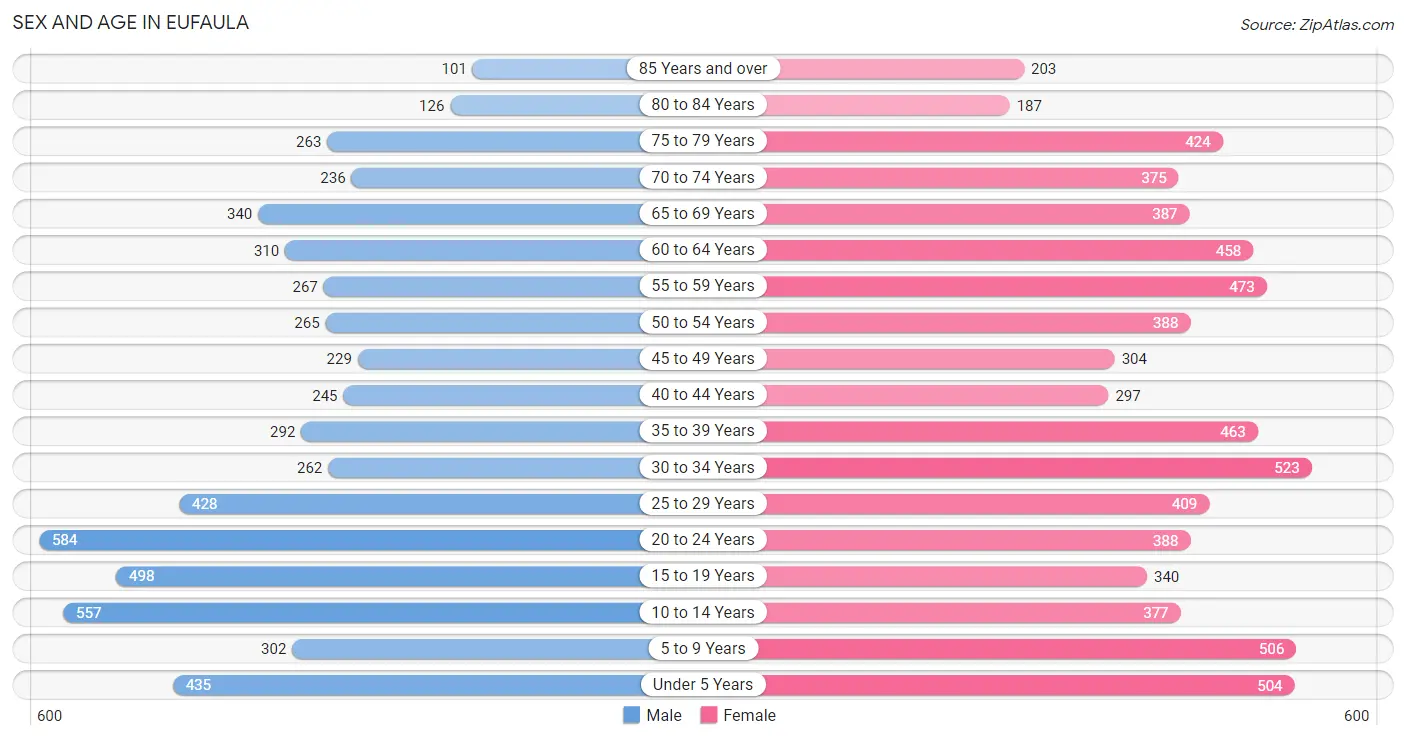
The most populous age groups in Eufaula are 20 to 24 Years (584 | 10.2%) for men and 30 to 34 Years (523 | 7.5%) for women.
| Age Bracket | Male | Female |
| Under 5 Years | 435 (7.6%) | 504 (7.2%) |
| 5 to 9 Years | 302 (5.3%) | 506 (7.2%) |
| 10 to 14 Years | 557 (9.7%) | 377 (5.4%) |
| 15 to 19 Years | 498 (8.7%) | 340 (4.9%) |
| 20 to 24 Years | 584 (10.2%) | 388 (5.5%) |
| 25 to 29 Years | 428 (7.5%) | 409 (5.8%) |
| 30 to 34 Years | 262 (4.6%) | 523 (7.5%) |
| 35 to 39 Years | 292 (5.1%) | 463 (6.6%) |
| 40 to 44 Years | 245 (4.3%) | 297 (4.2%) |
| 45 to 49 Years | 229 (4.0%) | 304 (4.3%) |
| 50 to 54 Years | 265 (4.6%) | 388 (5.5%) |
| 55 to 59 Years | 267 (4.6%) | 473 (6.8%) |
| 60 to 64 Years | 310 (5.4%) | 458 (6.5%) |
| 65 to 69 Years | 340 (5.9%) | 387 (5.5%) |
| 70 to 74 Years | 236 (4.1%) | 375 (5.3%) |
| 75 to 79 Years | 263 (4.6%) | 424 (6.0%) |
| 80 to 84 Years | 126 (2.2%) | 187 (2.7%) |
| 85 Years and over | 101 (1.8%) | 203 (2.9%) |
| Total | 5,740 (100.0%) | 7,006 (100.0%) |
Families and Households in Eufaula
Median Family Size in Eufaula
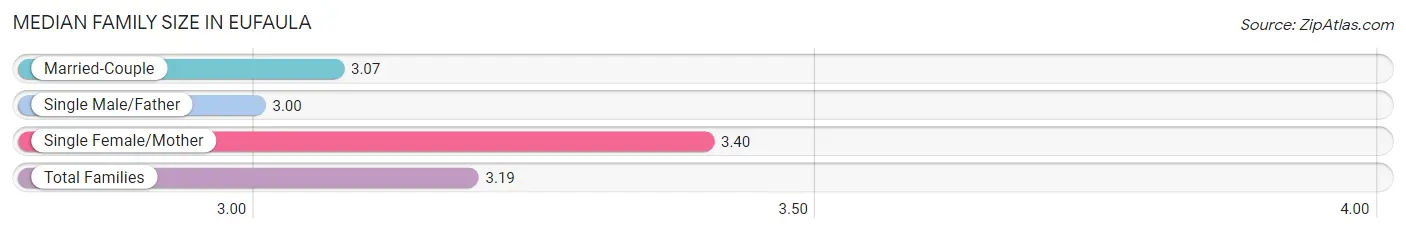
The median family size in Eufaula is 3.19 persons per family, with single female/mother families (1,254 | 38.2%) accounting for the largest median family size of 3.4 persons per family. On the other hand, single male/father families (204 | 6.2%) represent the smallest median family size with 3.00 persons per family.
| Family Type | # Families | Family Size |
| Married-Couple | 1,828 (55.6%) | 3.07 |
| Single Male/Father | 204 (6.2%) | 3.00 |
| Single Female/Mother | 1,254 (38.2%) | 3.40 |
| Total Families | 3,286 (100.0%) | 3.19 |
Median Household Size in Eufaula
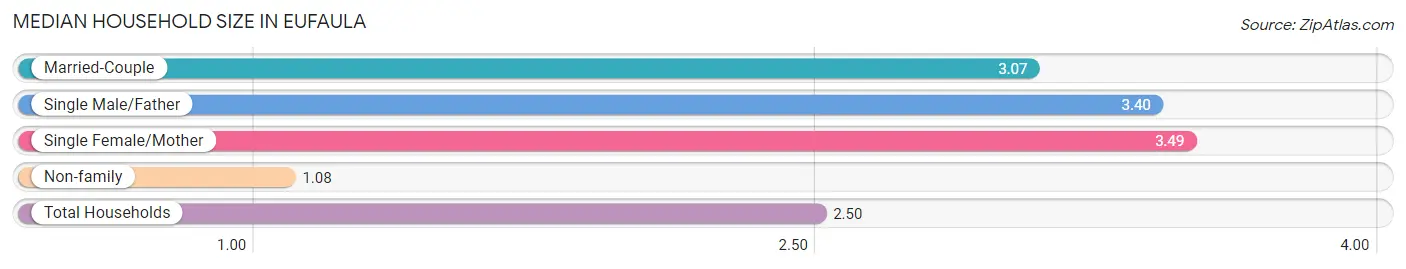
The median household size in Eufaula is 2.50 persons per household, with single female/mother households (1,254 | 25.0%) accounting for the largest median household size of 3.49 persons per household. non-family households (1,737 | 34.6%) represent the smallest median household size with 1.08 persons per household.
| Household Type | # Households | Household Size |
| Married-Couple | 1,828 (36.4%) | 3.07 |
| Single Male/Father | 204 (4.1%) | 3.40 |
| Single Female/Mother | 1,254 (25.0%) | 3.49 |
| Non-family | 1,737 (34.6%) | 1.08 |
| Total Households | 5,023 (100.0%) | 2.50 |
Household Size by Marriage Status in Eufaula
Out of a total of 5,023 households in Eufaula, 3,286 (65.4%) are family households, while 1,737 (34.6%) are nonfamily households. The most numerous type of family households are 2-person households, comprising 1,458, and the most common type of nonfamily households are 1-person households, comprising 1,605.
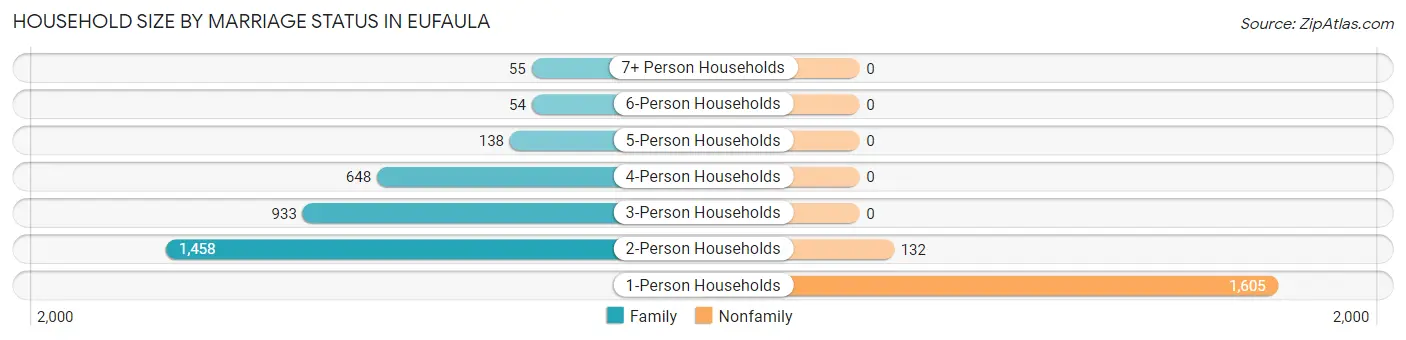
| Household Size | Family Households | Nonfamily Households |
| 1-Person Households | - | 1,605 (32.0%) |
| 2-Person Households | 1,458 (29.0%) | 132 (2.6%) |
| 3-Person Households | 933 (18.6%) | 0 (0.0%) |
| 4-Person Households | 648 (12.9%) | 0 (0.0%) |
| 5-Person Households | 138 (2.8%) | 0 (0.0%) |
| 6-Person Households | 54 (1.1%) | 0 (0.0%) |
| 7+ Person Households | 55 (1.1%) | 0 (0.0%) |
| Total | 3,286 (65.4%) | 1,737 (34.6%) |
Female Fertility in Eufaula
Fertility by Age in Eufaula
Average fertility rate in Eufaula is 57.0 births per 1,000 women. Women in the age bracket of 35 to 50 years have the highest fertility rate with 66.0 births per 1,000 women. Women in the age bracket of 35 to 50 years acount for 48.2% of all women with births.
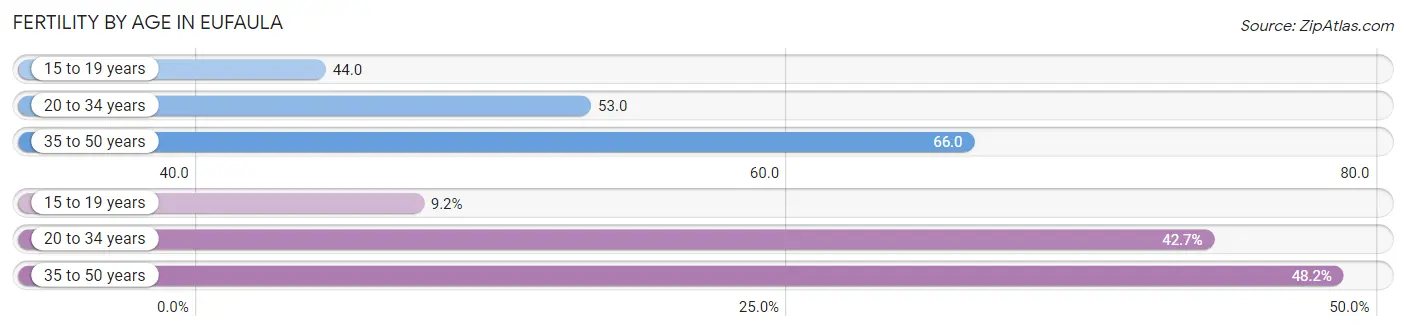
| Age Bracket | Women with Births | Births / 1,000 Women |
| 15 to 19 years | 15 (9.1%) | 44.0 |
| 20 to 34 years | 70 (42.7%) | 53.0 |
| 35 to 50 years | 79 (48.2%) | 66.0 |
| Total | 164 (100.0%) | 57.0 |
Fertility by Age by Marriage Status in Eufaula
19.5% of women with births (164) in Eufaula are married. The highest percentage of unmarried women with births falls into 15 to 19 years age bracket with 100.0% of them unmarried at the time of birth, while the lowest percentage of unmarried women with births belong to 35 to 50 years age bracket with 76.0% of them unmarried.
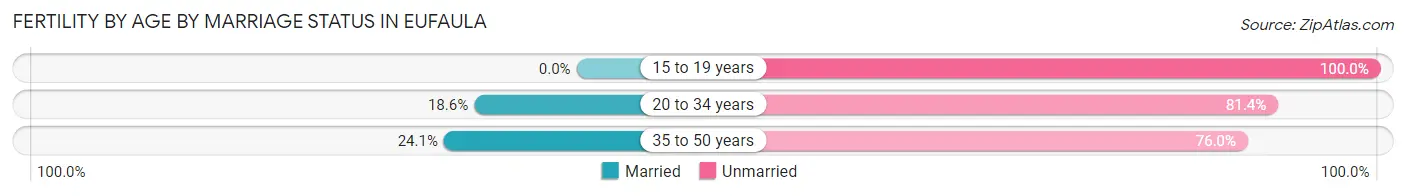
| Age Bracket | Married | Unmarried |
| 15 to 19 years | 0 (0.0%) | 15 (100.0%) |
| 20 to 34 years | 13 (18.6%) | 57 (81.4%) |
| 35 to 50 years | 19 (24.0%) | 60 (75.9%) |
| Total | 32 (19.5%) | 132 (80.5%) |
Fertility by Education in Eufaula
Average fertility rate in Eufaula is 57.0 births per 1,000 women. Women with the education attainment of less than high school have the highest fertility rate of 115.0 births per 1,000 women, while women with the education attainment of high school diploma have the lowest fertility at 10.0 births per 1,000 women. Women with the education attainment of college or associate's degree represent 48.2% of all women with births.
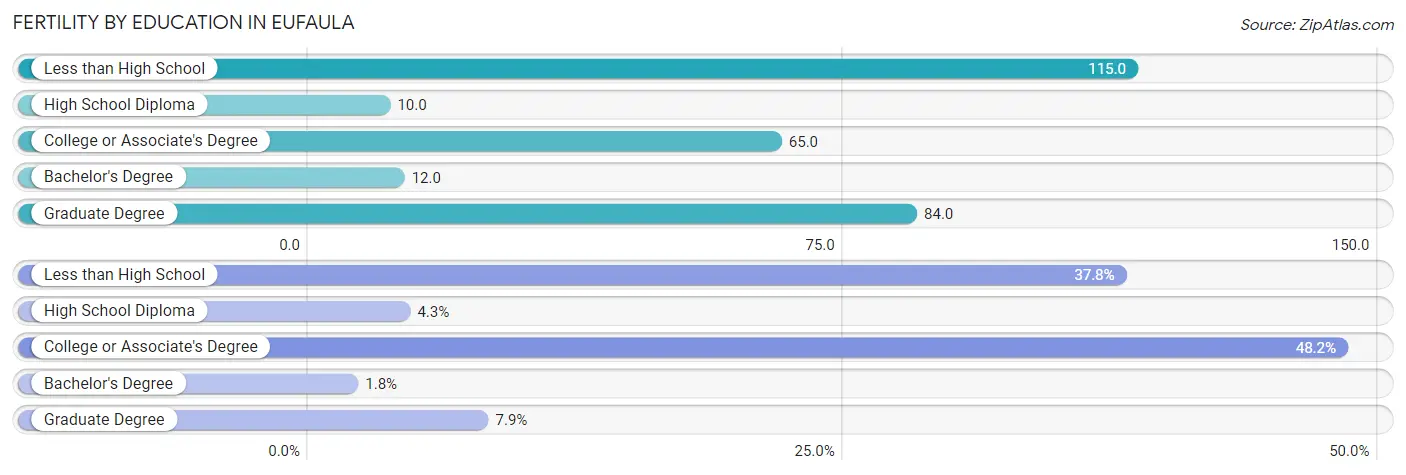
| Educational Attainment | Women with Births | Births / 1,000 Women |
| Less than High School | 62 (37.8%) | 115.0 |
| High School Diploma | 7 (4.3%) | 10.0 |
| College or Associate's Degree | 79 (48.2%) | 65.0 |
| Bachelor's Degree | 3 (1.8%) | 12.0 |
| Graduate Degree | 13 (7.9%) | 84.0 |
| Total | 164 (100.0%) | 57.0 |
Fertility by Education by Marriage Status in Eufaula
80.5% of women with births in Eufaula are unmarried. Women with the educational attainment of graduate degree are most likely to be married with 100.0% of them married at childbirth, while women with the educational attainment of less than high school are least likely to be married with 100.0% of them unmarried at childbirth.
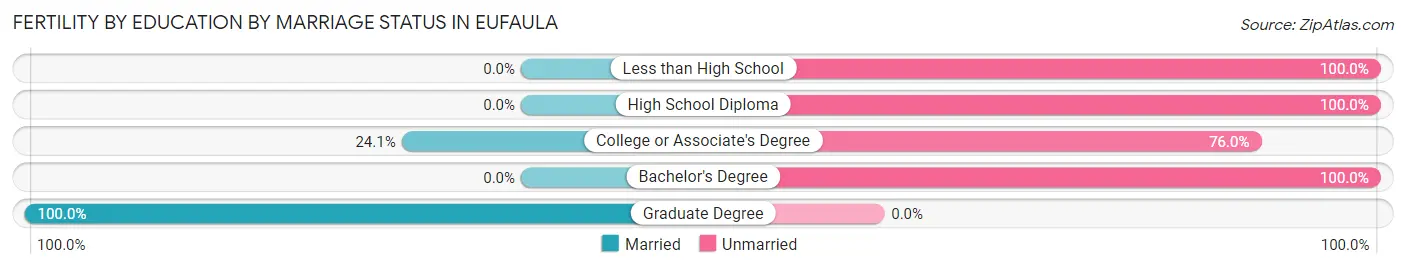
| Educational Attainment | Married | Unmarried |
| Less than High School | 0 (0.0%) | 62 (100.0%) |
| High School Diploma | 0 (0.0%) | 7 (100.0%) |
| College or Associate's Degree | 19 (24.0%) | 60 (75.9%) |
| Bachelor's Degree | 0 (0.0%) | 3 (100.0%) |
| Graduate Degree | 13 (100.0%) | 0 (0.0%) |
| Total | 32 (19.5%) | 132 (80.5%) |
Employment Characteristics in Eufaula
Employment by Class of Employer in Eufaula
Among the 4,630 employed individuals in Eufaula, private company employees (3,041 | 65.7%), local government employees (500 | 10.8%), and state government employees (388 | 8.4%) make up the most common classes of employment.
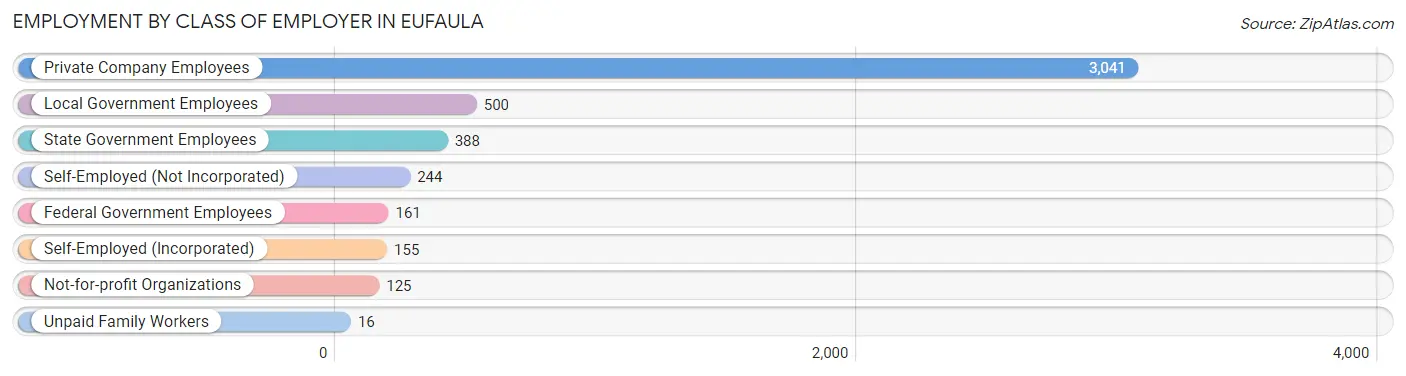
| Employer Class | # Employees | % Employees |
| Private Company Employees | 3,041 | 65.7% |
| Self-Employed (Incorporated) | 155 | 3.4% |
| Self-Employed (Not Incorporated) | 244 | 5.3% |
| Not-for-profit Organizations | 125 | 2.7% |
| Local Government Employees | 500 | 10.8% |
| State Government Employees | 388 | 8.4% |
| Federal Government Employees | 161 | 3.5% |
| Unpaid Family Workers | 16 | 0.4% |
| Total | 4,630 | 100.0% |
Employment Status by Age in Eufaula
According to the labor force statistics for Eufaula, out of the total population over 16 years of age (9,949), 50.0% or 4,974 individuals are in the labor force, with 5.2% or 259 of them unemployed. The age group with the highest labor force participation rate is 35 to 44 years, with 76.0% or 986 individuals in the labor force. Within the labor force, the 20 to 24 years age range has the highest percentage of unemployed individuals, with 15.9% or 99 of them being unemployed.
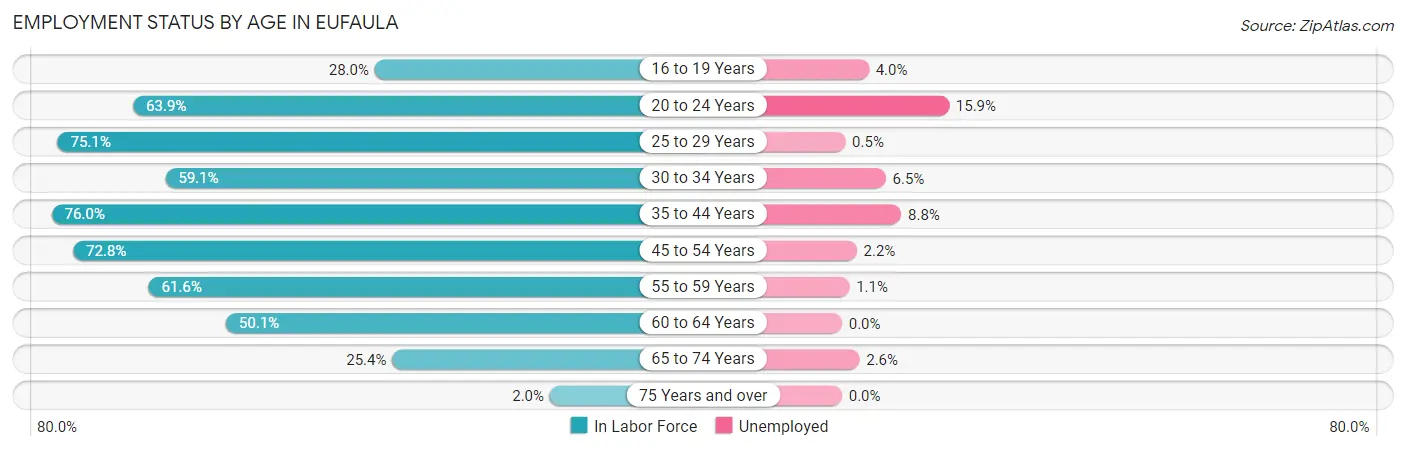
| Age Bracket | In Labor Force | Unemployed |
| 16 to 19 Years | 202 (28.0%) | 8 (4.0%) |
| 20 to 24 Years | 621 (63.9%) | 99 (15.9%) |
| 25 to 29 Years | 629 (75.1%) | 3 (0.5%) |
| 30 to 34 Years | 464 (59.1%) | 30 (6.5%) |
| 35 to 44 Years | 986 (76.0%) | 87 (8.8%) |
| 45 to 54 Years | 863 (72.8%) | 19 (2.2%) |
| 55 to 59 Years | 456 (61.6%) | 5 (1.1%) |
| 60 to 64 Years | 385 (50.1%) | 0 (0.0%) |
| 65 to 74 Years | 340 (25.4%) | 9 (2.6%) |
| 75 Years and over | 26 (2.0%) | 0 (0.0%) |
| Total | 4,974 (50.0%) | 259 (5.2%) |
Employment Status by Educational Attainment in Eufaula
According to labor force statistics for Eufaula, 67.4% of individuals (3,783) out of the total population between 25 and 64 years of age (5,613) are in the labor force, with 3.8% or 144 of them being unemployed. The group with the highest labor force participation rate are those with the educational attainment of bachelor's degree or higher, with 83.3% or 786 individuals in the labor force. Within the labor force, individuals with college / associate degree education have the highest percentage of unemployment, with 7.3% or 109 of them being unemployed.
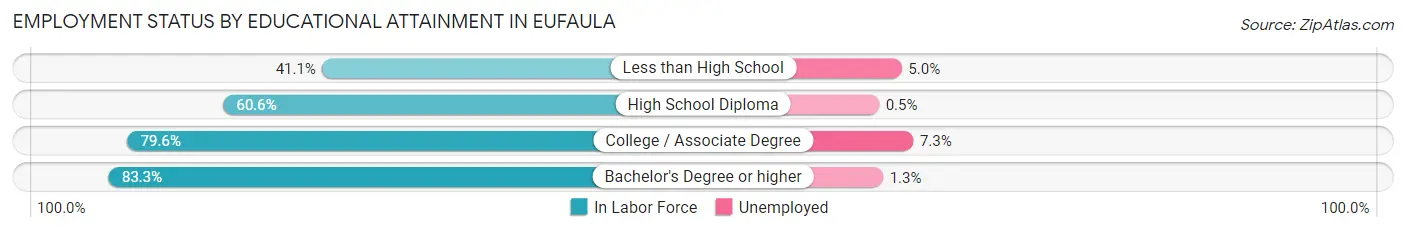
| Educational Attainment | In Labor Force | Unemployed |
| Less than High School | 397 (41.1%) | 48 (5.0%) |
| High School Diploma | 1,110 (60.6%) | 9 (0.5%) |
| College / Associate Degree | 1,491 (79.6%) | 137 (7.3%) |
| Bachelor's Degree or higher | 786 (83.3%) | 12 (1.3%) |
| Total | 3,783 (67.4%) | 213 (3.8%) |
Employment Occupations by Sex in Eufaula
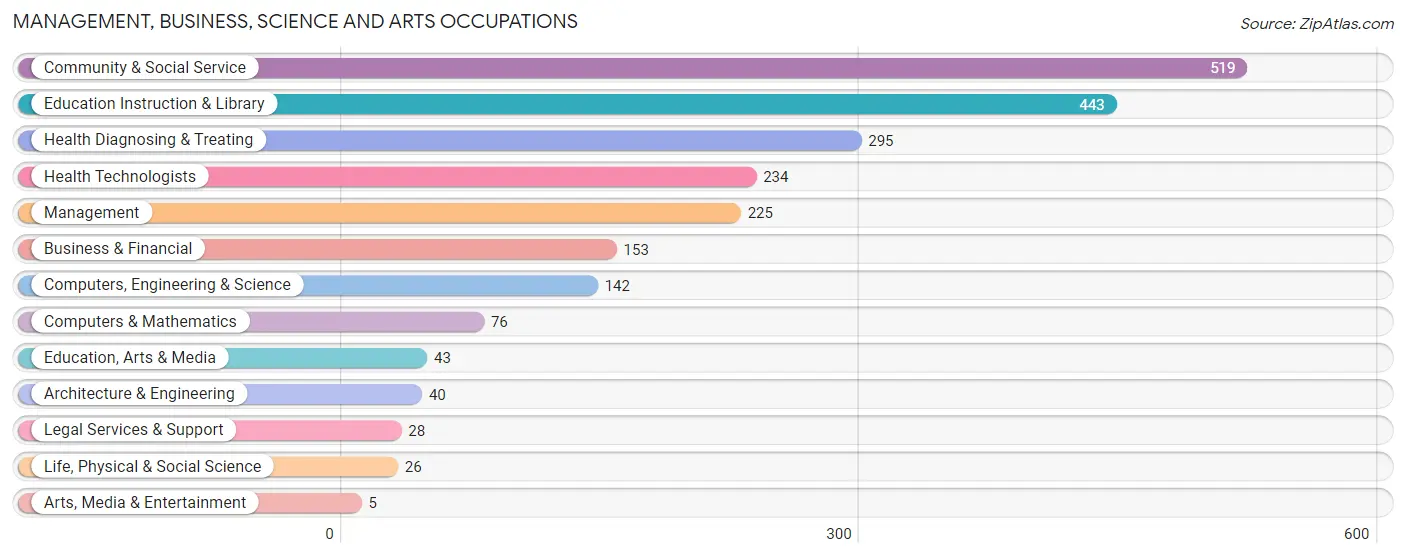
Management, Business, Science and Arts Occupations
The most common Management, Business, Science and Arts occupations in Eufaula are Community & Social Service (519 | 11.0%), Education Instruction & Library (443 | 9.4%), Health Diagnosing & Treating (295 | 6.3%), Health Technologists (234 | 5.0%), and Management (225 | 4.8%).
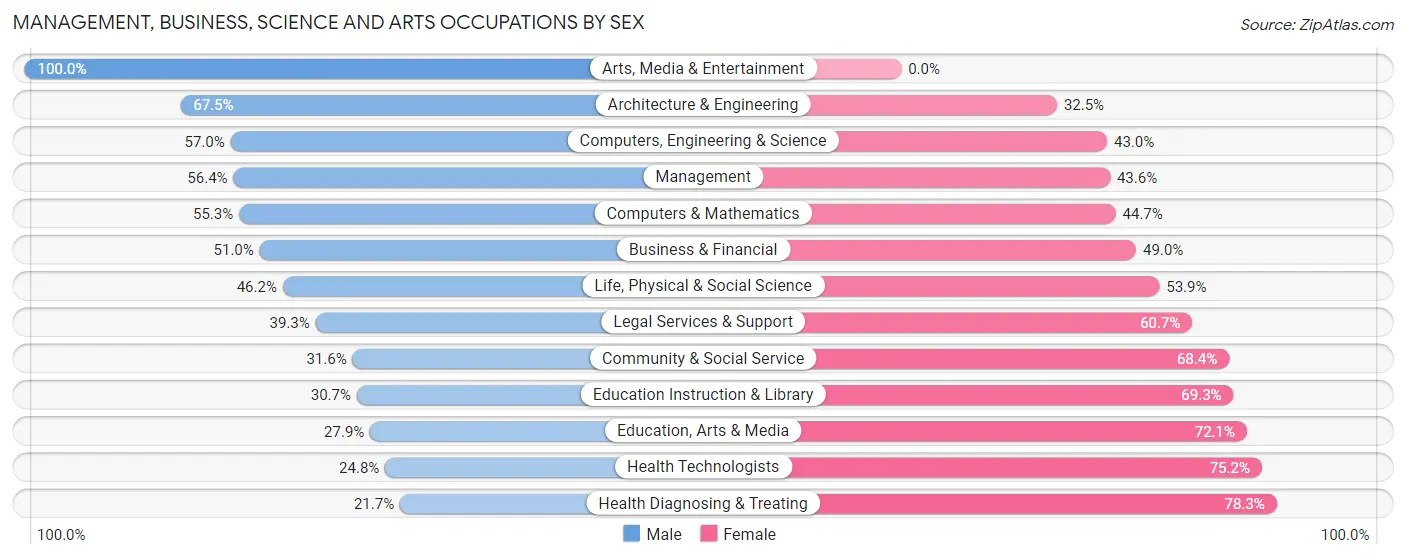
Management, Business, Science and Arts Occupations by Sex
Within the Management, Business, Science and Arts occupations in Eufaula, the most male-oriented occupations are Arts, Media & Entertainment (100.0%), Architecture & Engineering (67.5%), and Computers, Engineering & Science (57.0%), while the most female-oriented occupations are Health Diagnosing & Treating (78.3%), Health Technologists (75.2%), and Education, Arts & Media (72.1%).
| Occupation | Male | Female |
| Management | 127 (56.4%) | 98 (43.6%) |
| Business & Financial | 78 (51.0%) | 75 (49.0%) |
| Computers, Engineering & Science | 81 (57.0%) | 61 (43.0%) |
| Computers & Mathematics | 42 (55.3%) | 34 (44.7%) |
| Architecture & Engineering | 27 (67.5%) | 13 (32.5%) |
| Life, Physical & Social Science | 12 (46.2%) | 14 (53.8%) |
| Community & Social Service | 164 (31.6%) | 355 (68.4%) |
| Education, Arts & Media | 12 (27.9%) | 31 (72.1%) |
| Legal Services & Support | 11 (39.3%) | 17 (60.7%) |
| Education Instruction & Library | 136 (30.7%) | 307 (69.3%) |
| Arts, Media & Entertainment | 5 (100.0%) | 0 (0.0%) |
| Health Diagnosing & Treating | 64 (21.7%) | 231 (78.3%) |
| Health Technologists | 58 (24.8%) | 176 (75.2%) |
| Total (Category) | 514 (38.5%) | 820 (61.5%) |
| Total (Overall) | 2,205 (46.8%) | 2,508 (53.2%) |
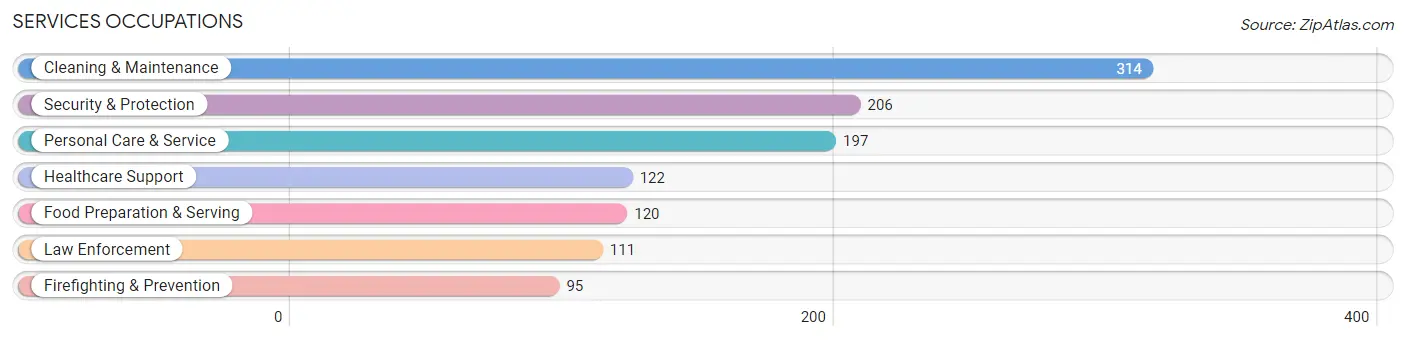
Services Occupations
The most common Services occupations in Eufaula are Cleaning & Maintenance (314 | 6.7%), Security & Protection (206 | 4.4%), Personal Care & Service (197 | 4.2%), Healthcare Support (122 | 2.6%), and Food Preparation & Serving (120 | 2.5%).
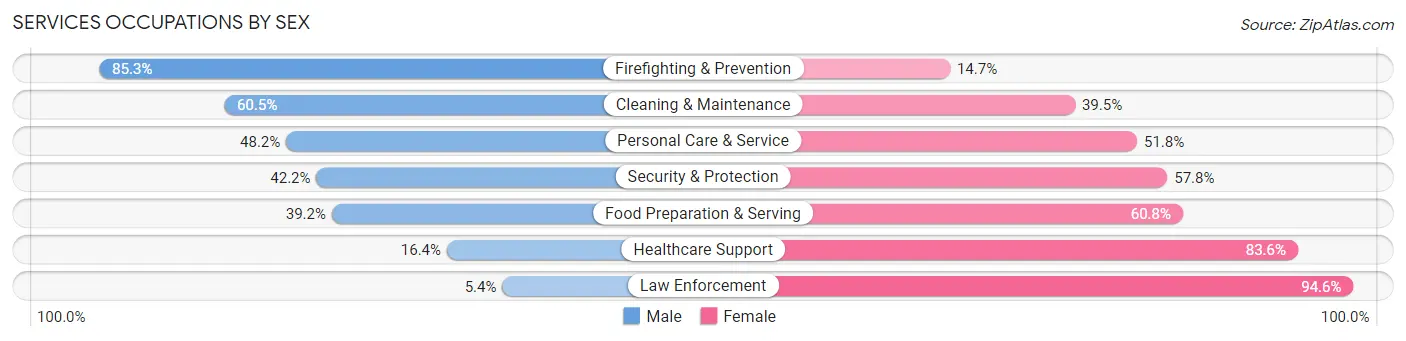
Services Occupations by Sex
Within the Services occupations in Eufaula, the most male-oriented occupations are Firefighting & Prevention (85.3%), Cleaning & Maintenance (60.5%), and Personal Care & Service (48.2%), while the most female-oriented occupations are Law Enforcement (94.6%), Healthcare Support (83.6%), and Food Preparation & Serving (60.8%).
| Occupation | Male | Female |
| Healthcare Support | 20 (16.4%) | 102 (83.6%) |
| Security & Protection | 87 (42.2%) | 119 (57.8%) |
| Firefighting & Prevention | 81 (85.3%) | 14 (14.7%) |
| Law Enforcement | 6 (5.4%) | 105 (94.6%) |
| Food Preparation & Serving | 47 (39.2%) | 73 (60.8%) |
| Cleaning & Maintenance | 190 (60.5%) | 124 (39.5%) |
| Personal Care & Service | 95 (48.2%) | 102 (51.8%) |
| Total (Category) | 439 (45.8%) | 520 (54.2%) |
| Total (Overall) | 2,205 (46.8%) | 2,508 (53.2%) |
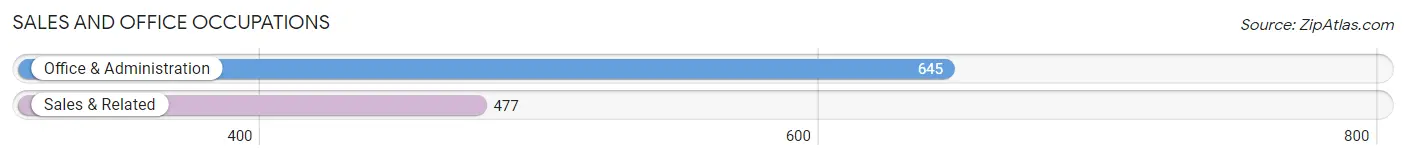
Sales and Office Occupations
The most common Sales and Office occupations in Eufaula are Office & Administration (645 | 13.7%), and Sales & Related (477 | 10.1%).
Sales and Office Occupations by Sex
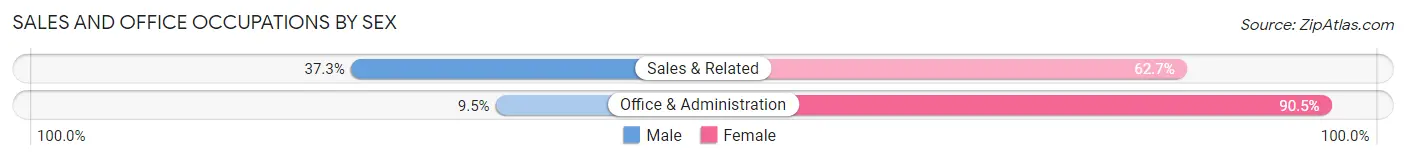
| Occupation | Male | Female |
| Sales & Related | 178 (37.3%) | 299 (62.7%) |
| Office & Administration | 61 (9.5%) | 584 (90.5%) |
| Total (Category) | 239 (21.3%) | 883 (78.7%) |
| Total (Overall) | 2,205 (46.8%) | 2,508 (53.2%) |
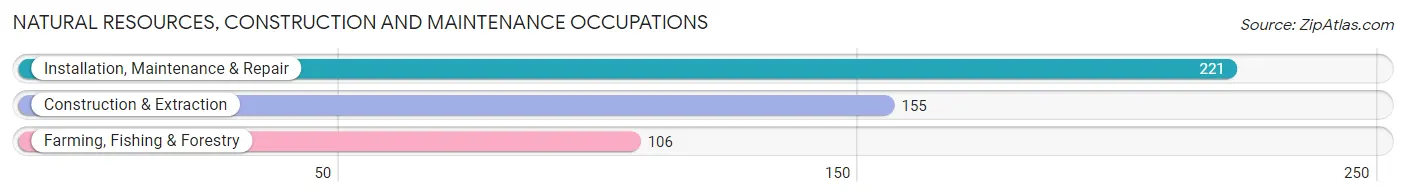
Natural Resources, Construction and Maintenance Occupations
The most common Natural Resources, Construction and Maintenance occupations in Eufaula are Installation, Maintenance & Repair (221 | 4.7%), Construction & Extraction (155 | 3.3%), and Farming, Fishing & Forestry (106 | 2.2%).
Natural Resources, Construction and Maintenance Occupations by Sex
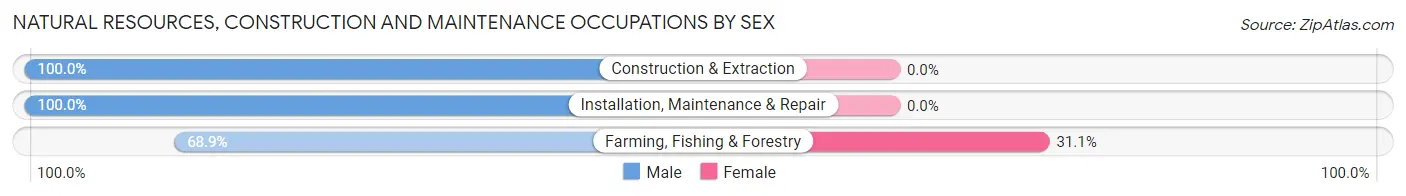
| Occupation | Male | Female |
| Farming, Fishing & Forestry | 73 (68.9%) | 33 (31.1%) |
| Construction & Extraction | 155 (100.0%) | 0 (0.0%) |
| Installation, Maintenance & Repair | 221 (100.0%) | 0 (0.0%) |
| Total (Category) | 449 (93.1%) | 33 (6.9%) |
| Total (Overall) | 2,205 (46.8%) | 2,508 (53.2%) |
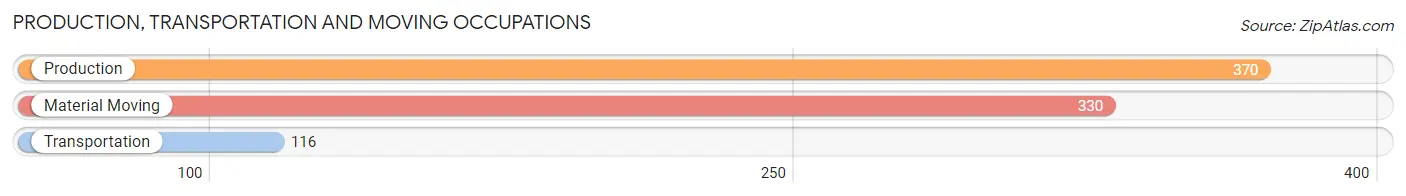
Production, Transportation and Moving Occupations
The most common Production, Transportation and Moving occupations in Eufaula are Production (370 | 7.9%), Material Moving (330 | 7.0%), and Transportation (116 | 2.5%).
Production, Transportation and Moving Occupations by Sex
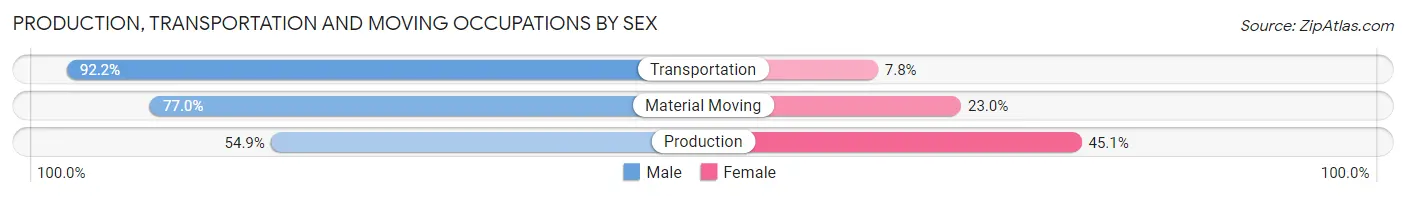
| Occupation | Male | Female |
| Production | 203 (54.9%) | 167 (45.1%) |
| Transportation | 107 (92.2%) | 9 (7.8%) |
| Material Moving | 254 (77.0%) | 76 (23.0%) |
| Total (Category) | 564 (69.1%) | 252 (30.9%) |
| Total (Overall) | 2,205 (46.8%) | 2,508 (53.2%) |
Employment Industries by Sex in Eufaula
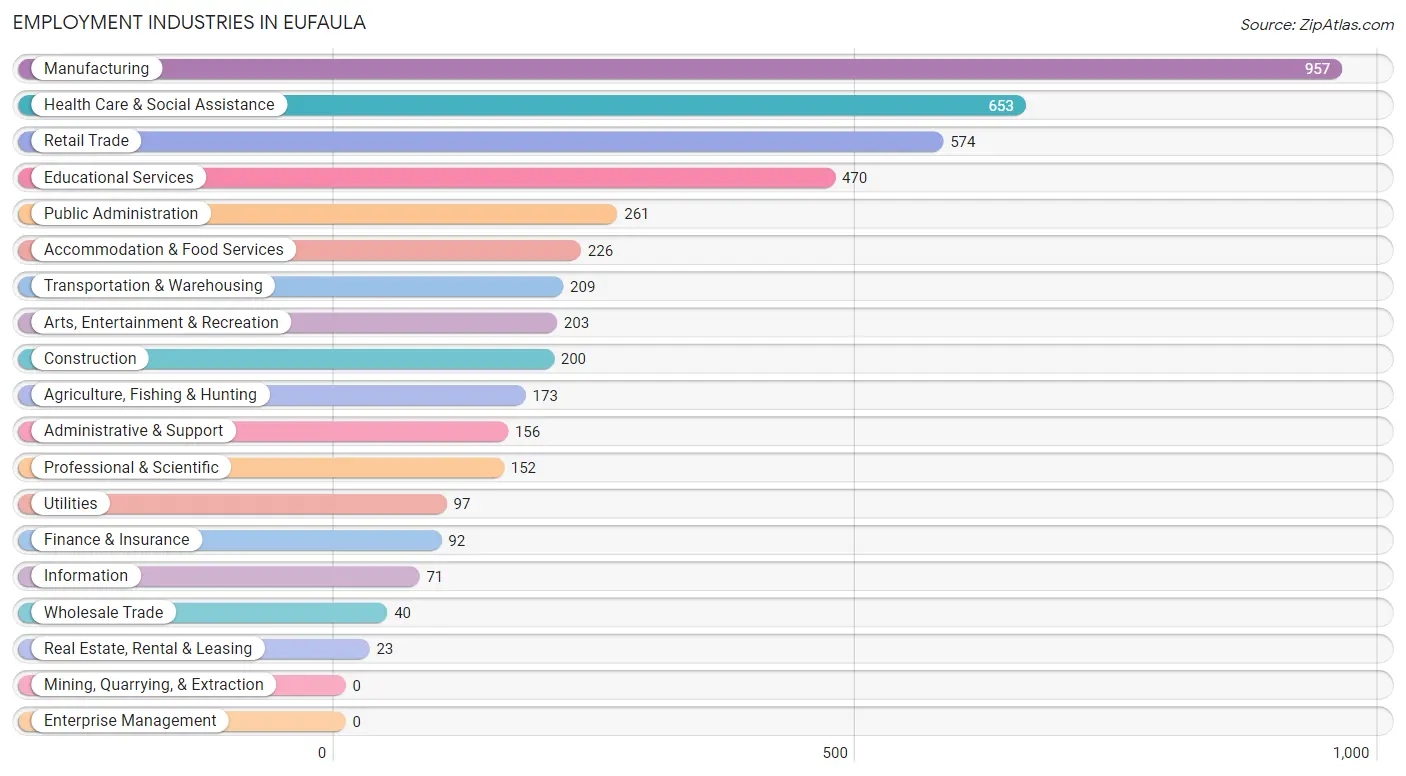
Employment Industries in Eufaula
The major employment industries in Eufaula include Manufacturing (957 | 20.3%), Health Care & Social Assistance (653 | 13.9%), Retail Trade (574 | 12.2%), Educational Services (470 | 10.0%), and Public Administration (261 | 5.5%).
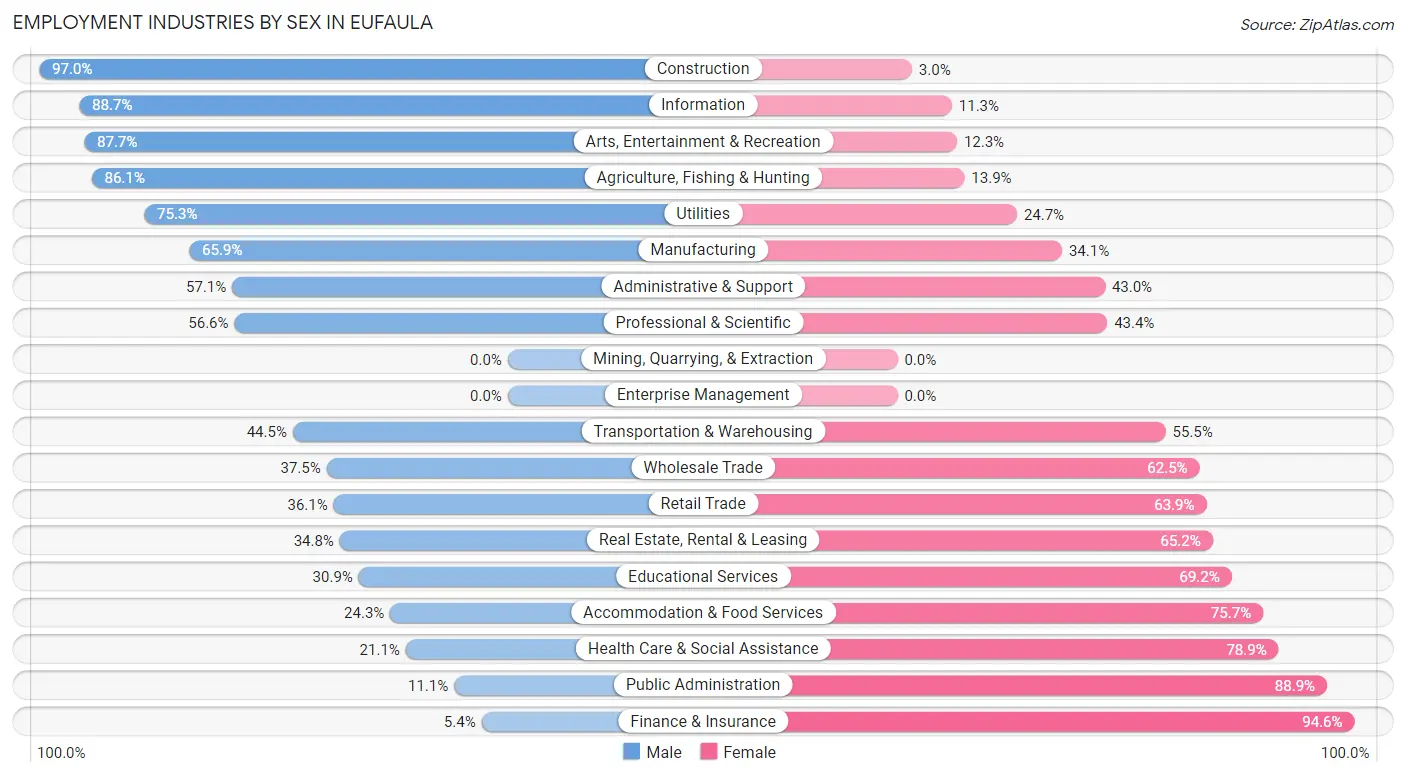
Employment Industries by Sex in Eufaula
The Eufaula industries that see more men than women are Construction (97.0%), Information (88.7%), and Arts, Entertainment & Recreation (87.7%), whereas the industries that tend to have a higher number of women are Finance & Insurance (94.6%), Public Administration (88.9%), and Health Care & Social Assistance (78.9%).
| Industry | Male | Female |
| Agriculture, Fishing & Hunting | 149 (86.1%) | 24 (13.9%) |
| Mining, Quarrying, & Extraction | 0 (0.0%) | 0 (0.0%) |
| Construction | 194 (97.0%) | 6 (3.0%) |
| Manufacturing | 631 (65.9%) | 326 (34.1%) |
| Wholesale Trade | 15 (37.5%) | 25 (62.5%) |
| Retail Trade | 207 (36.1%) | 367 (63.9%) |
| Transportation & Warehousing | 93 (44.5%) | 116 (55.5%) |
| Utilities | 73 (75.3%) | 24 (24.7%) |
| Information | 63 (88.7%) | 8 (11.3%) |
| Finance & Insurance | 5 (5.4%) | 87 (94.6%) |
| Real Estate, Rental & Leasing | 8 (34.8%) | 15 (65.2%) |
| Professional & Scientific | 86 (56.6%) | 66 (43.4%) |
| Enterprise Management | 0 (0.0%) | 0 (0.0%) |
| Administrative & Support | 89 (57.1%) | 67 (42.9%) |
| Educational Services | 145 (30.8%) | 325 (69.2%) |
| Health Care & Social Assistance | 138 (21.1%) | 515 (78.9%) |
| Arts, Entertainment & Recreation | 178 (87.7%) | 25 (12.3%) |
| Accommodation & Food Services | 55 (24.3%) | 171 (75.7%) |
| Public Administration | 29 (11.1%) | 232 (88.9%) |
| Total | 2,205 (46.8%) | 2,508 (53.2%) |
Education in Eufaula
School Enrollment in Eufaula
The most common levels of schooling among the 3,037 students in Eufaula are middle school (733 | 24.1%), high school (703 | 23.2%), and elementary school (665 | 21.9%).
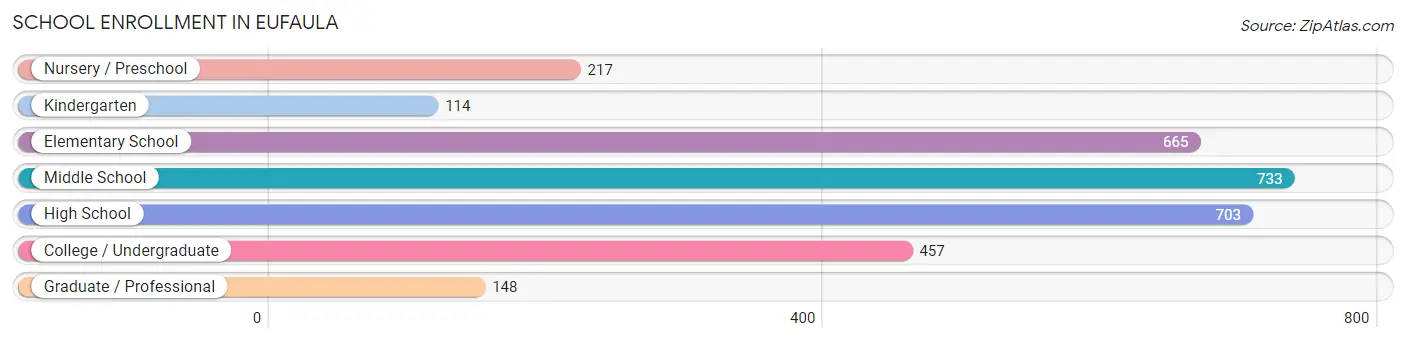
| School Level | # Students | % Students |
| Nursery / Preschool | 217 | 7.1% |
| Kindergarten | 114 | 3.7% |
| Elementary School | 665 | 21.9% |
| Middle School | 733 | 24.1% |
| High School | 703 | 23.2% |
| College / Undergraduate | 457 | 15.0% |
| Graduate / Professional | 148 | 4.9% |
| Total | 3,037 | 100.0% |
School Enrollment by Age by Funding Source in Eufaula
Out of a total of 3,037 students who are enrolled in schools in Eufaula, 468 (15.4%) attend a private institution, while the remaining 2,569 (84.6%) are enrolled in public schools. The age group of 35 years and over has the highest likelihood of being enrolled in private schools, with 106 (52.7% in the age bracket) enrolled. Conversely, the age group of 18 to 19 year olds has the lowest likelihood of being enrolled in a private school, with 205 (100.0% in the age bracket) attending a public institution.
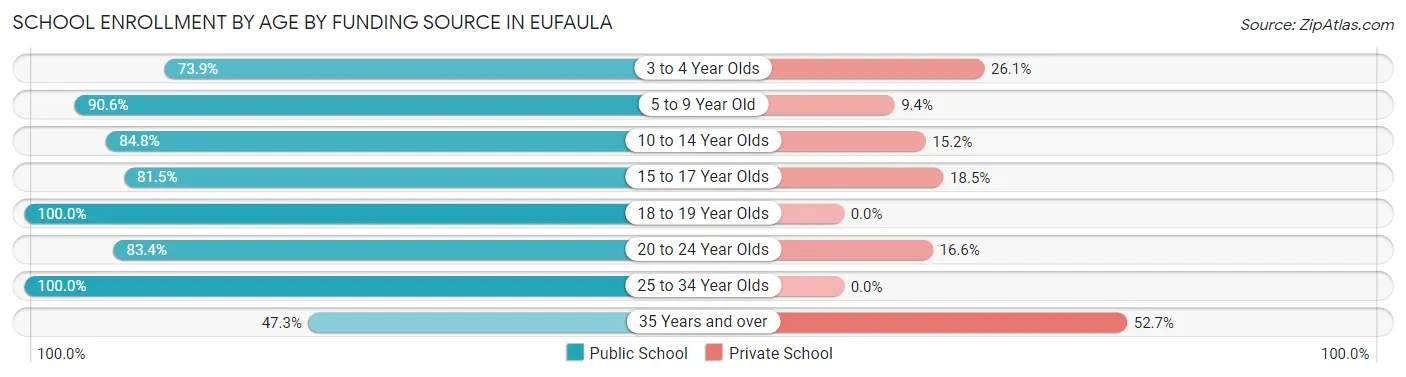
| Age Bracket | Public School | Private School |
| 3 to 4 Year Olds | 113 (73.9%) | 40 (26.1%) |
| 5 to 9 Year Old | 693 (90.6%) | 72 (9.4%) |
| 10 to 14 Year Olds | 763 (84.8%) | 137 (15.2%) |
| 15 to 17 Year Olds | 378 (81.5%) | 86 (18.5%) |
| 18 to 19 Year Olds | 205 (100.0%) | 0 (0.0%) |
| 20 to 24 Year Olds | 141 (83.4%) | 28 (16.6%) |
| 25 to 34 Year Olds | 180 (100.0%) | 0 (0.0%) |
| 35 Years and over | 95 (47.3%) | 106 (52.7%) |
| Total | 2,569 (84.6%) | 468 (15.4%) |
Educational Attainment by Field of Study in Eufaula
Education (479 | 30.7%), business (330 | 21.1%), science & technology (143 | 9.1%), engineering (119 | 7.6%), and arts & humanities (101 | 6.5%) are the most common fields of study among 1,562 individuals in Eufaula who have obtained a bachelor's degree or higher.
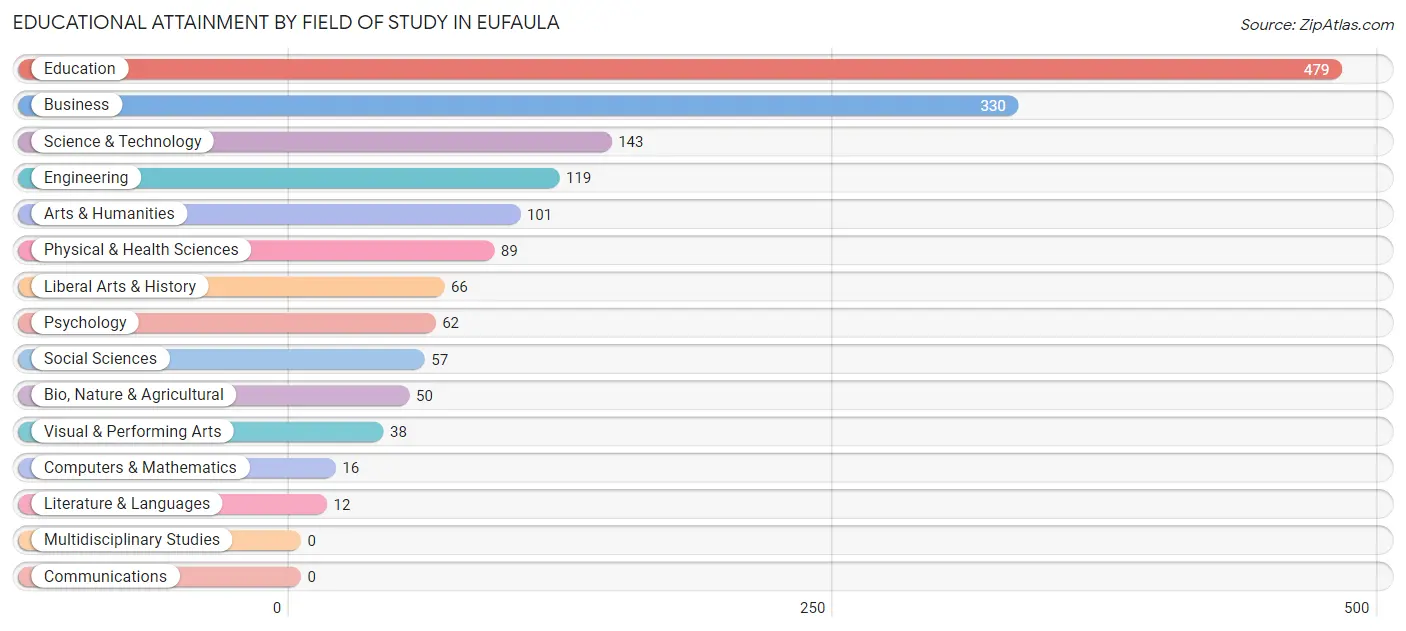
| Field of Study | # Graduates | % Graduates |
| Computers & Mathematics | 16 | 1.0% |
| Bio, Nature & Agricultural | 50 | 3.2% |
| Physical & Health Sciences | 89 | 5.7% |
| Psychology | 62 | 4.0% |
| Social Sciences | 57 | 3.6% |
| Engineering | 119 | 7.6% |
| Multidisciplinary Studies | 0 | 0.0% |
| Science & Technology | 143 | 9.1% |
| Business | 330 | 21.1% |
| Education | 479 | 30.7% |
| Literature & Languages | 12 | 0.8% |
| Liberal Arts & History | 66 | 4.2% |
| Visual & Performing Arts | 38 | 2.4% |
| Communications | 0 | 0.0% |
| Arts & Humanities | 101 | 6.5% |
| Total | 1,562 | 100.0% |
Transportation & Commute in Eufaula
Vehicle Availability by Sex in Eufaula
The most prevalent vehicle ownership categories in Eufaula are males with 2 vehicles (783, accounting for 35.8%) and females with 2 vehicles (756, making up 32.0%).
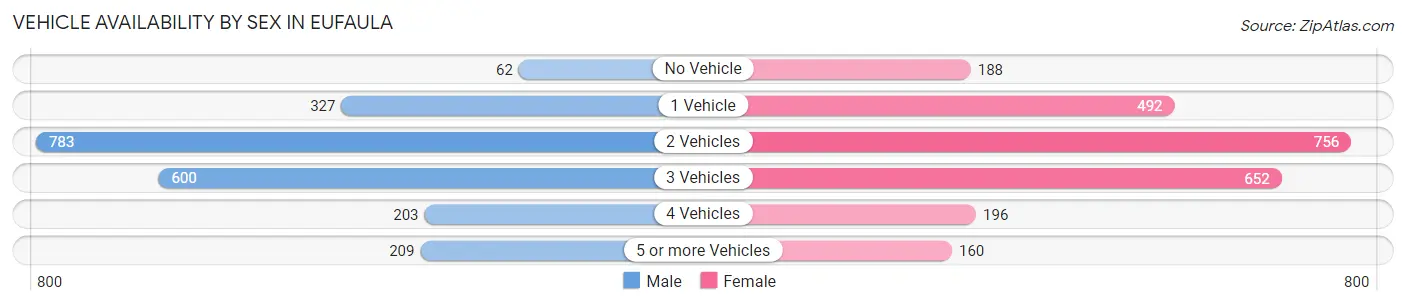
| Vehicles Available | Male | Female |
| No Vehicle | 62 (2.8%) | 188 (7.7%) |
| 1 Vehicle | 327 (15.0%) | 492 (20.1%) |
| 2 Vehicles | 783 (35.8%) | 756 (30.9%) |
| 3 Vehicles | 600 (27.5%) | 652 (26.7%) |
| 4 Vehicles | 203 (9.3%) | 196 (8.0%) |
| 5 or more Vehicles | 209 (9.6%) | 160 (6.6%) |
| Total | 2,184 (100.0%) | 2,444 (100.0%) |
Commute Time in Eufaula
The most frequently occuring commute durations in Eufaula are 10 to 14 minutes (1,177 commuters, 26.7%), 5 to 9 minutes (927 commuters, 21.0%), and 15 to 19 minutes (639 commuters, 14.5%).
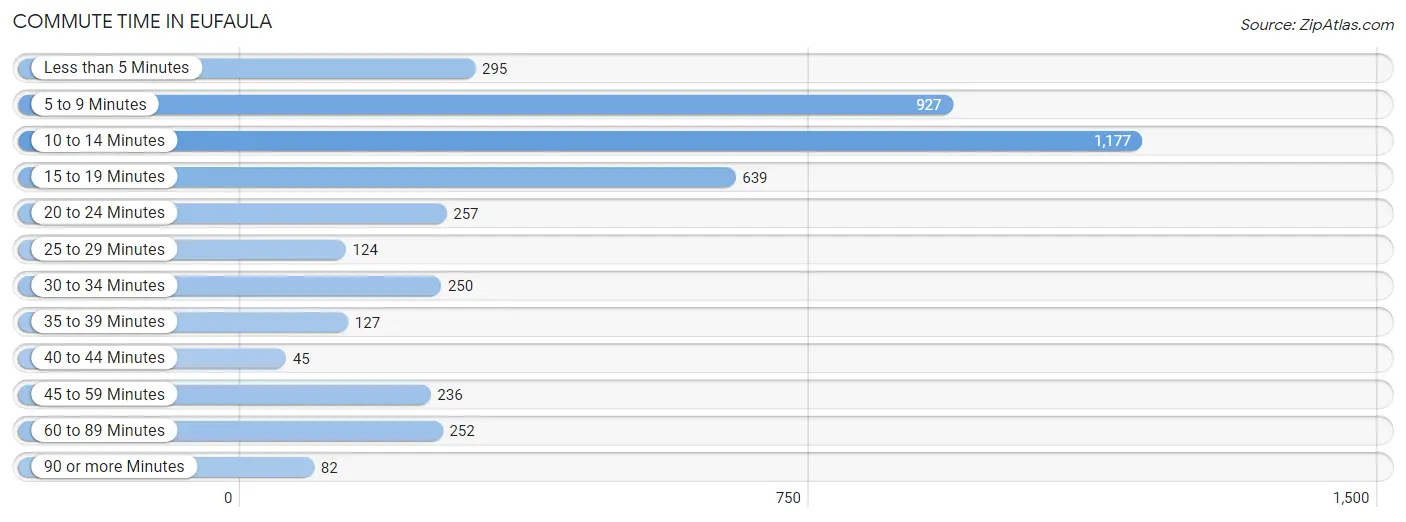
| Commute Time | # Commuters | % Commuters |
| Less than 5 Minutes | 295 | 6.7% |
| 5 to 9 Minutes | 927 | 21.0% |
| 10 to 14 Minutes | 1,177 | 26.7% |
| 15 to 19 Minutes | 639 | 14.5% |
| 20 to 24 Minutes | 257 | 5.8% |
| 25 to 29 Minutes | 124 | 2.8% |
| 30 to 34 Minutes | 250 | 5.7% |
| 35 to 39 Minutes | 127 | 2.9% |
| 40 to 44 Minutes | 45 | 1.0% |
| 45 to 59 Minutes | 236 | 5.3% |
| 60 to 89 Minutes | 252 | 5.7% |
| 90 or more Minutes | 82 | 1.9% |
Commute Time by Sex in Eufaula
The most common commute times in Eufaula are 10 to 14 minutes (592 commuters, 28.0%) for males and 10 to 14 minutes (585 commuters, 25.5%) for females.
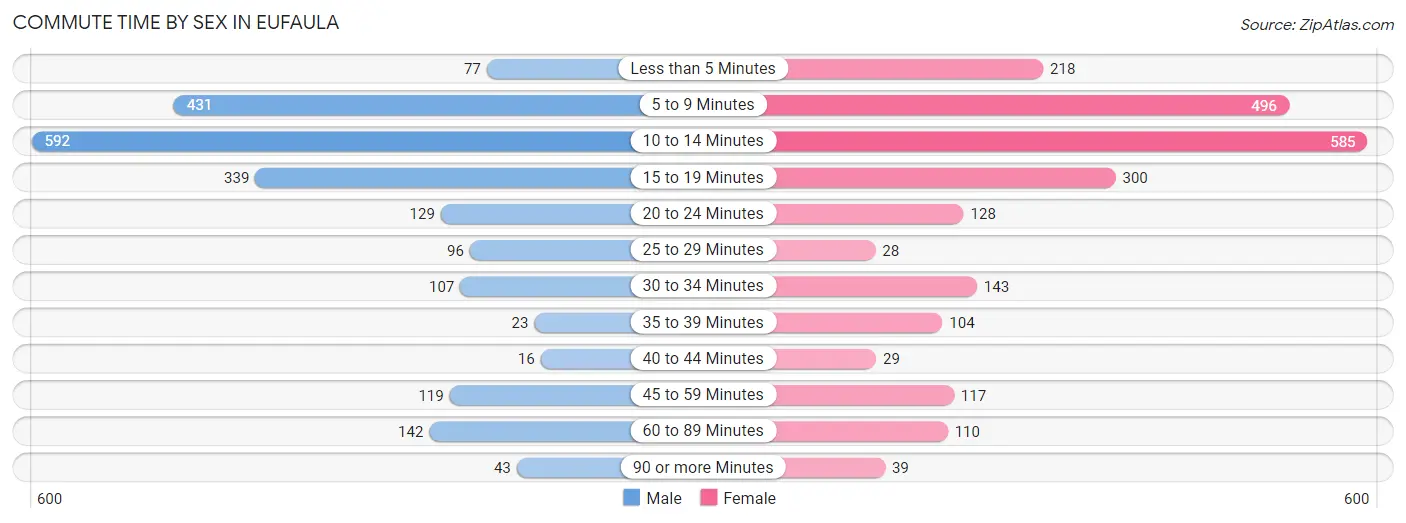
| Commute Time | Male | Female |
| Less than 5 Minutes | 77 (3.6%) | 218 (9.5%) |
| 5 to 9 Minutes | 431 (20.4%) | 496 (21.6%) |
| 10 to 14 Minutes | 592 (28.0%) | 585 (25.5%) |
| 15 to 19 Minutes | 339 (16.0%) | 300 (13.1%) |
| 20 to 24 Minutes | 129 (6.1%) | 128 (5.6%) |
| 25 to 29 Minutes | 96 (4.5%) | 28 (1.2%) |
| 30 to 34 Minutes | 107 (5.1%) | 143 (6.2%) |
| 35 to 39 Minutes | 23 (1.1%) | 104 (4.5%) |
| 40 to 44 Minutes | 16 (0.8%) | 29 (1.3%) |
| 45 to 59 Minutes | 119 (5.6%) | 117 (5.1%) |
| 60 to 89 Minutes | 142 (6.7%) | 110 (4.8%) |
| 90 or more Minutes | 43 (2.0%) | 39 (1.7%) |
Time of Departure to Work by Sex in Eufaula
The most frequent times of departure to work in Eufaula are 4:00 PM to 11:59 PM (313, 14.8%) for males and 7:00 AM to 7:29 AM (434, 18.9%) for females.
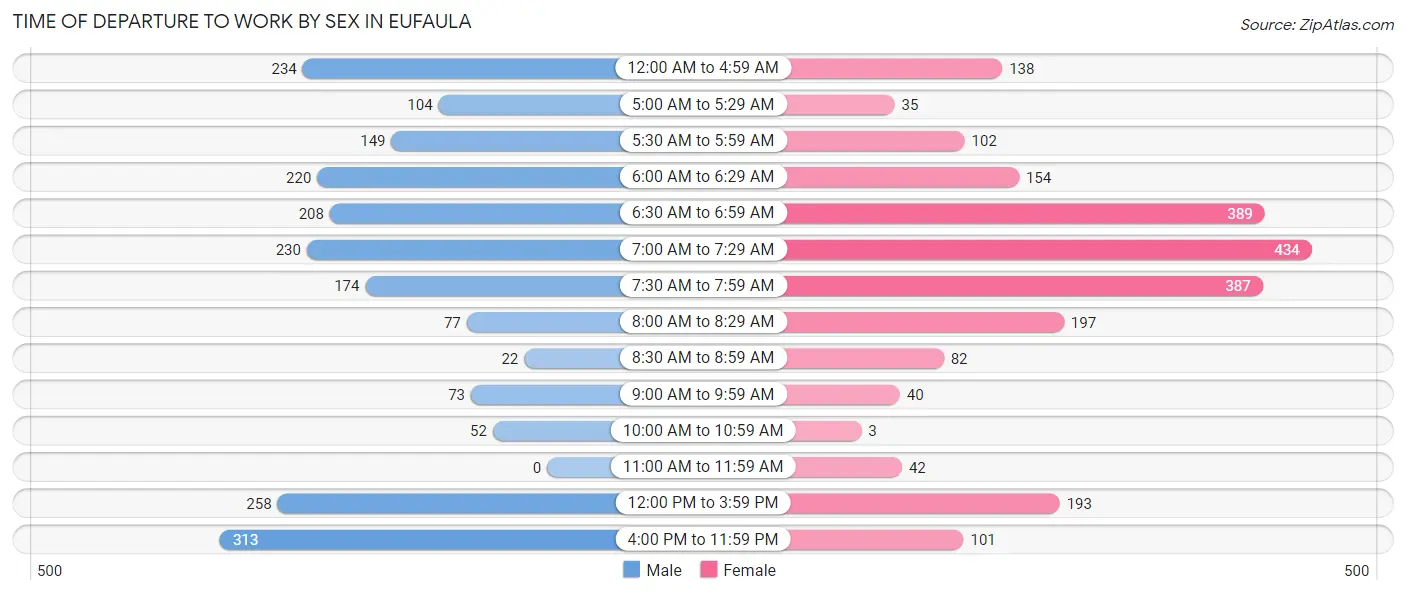
| Time of Departure | Male | Female |
| 12:00 AM to 4:59 AM | 234 (11.1%) | 138 (6.0%) |
| 5:00 AM to 5:29 AM | 104 (4.9%) | 35 (1.5%) |
| 5:30 AM to 5:59 AM | 149 (7.0%) | 102 (4.4%) |
| 6:00 AM to 6:29 AM | 220 (10.4%) | 154 (6.7%) |
| 6:30 AM to 6:59 AM | 208 (9.8%) | 389 (16.9%) |
| 7:00 AM to 7:29 AM | 230 (10.9%) | 434 (18.9%) |
| 7:30 AM to 7:59 AM | 174 (8.2%) | 387 (16.9%) |
| 8:00 AM to 8:29 AM | 77 (3.6%) | 197 (8.6%) |
| 8:30 AM to 8:59 AM | 22 (1.0%) | 82 (3.6%) |
| 9:00 AM to 9:59 AM | 73 (3.5%) | 40 (1.7%) |
| 10:00 AM to 10:59 AM | 52 (2.5%) | 3 (0.1%) |
| 11:00 AM to 11:59 AM | 0 (0.0%) | 42 (1.8%) |
| 12:00 PM to 3:59 PM | 258 (12.2%) | 193 (8.4%) |
| 4:00 PM to 11:59 PM | 313 (14.8%) | 101 (4.4%) |
| Total | 2,114 (100.0%) | 2,297 (100.0%) |
Housing Occupancy in Eufaula
Occupancy by Ownership in Eufaula
Of the total 5,023 dwellings in Eufaula, owner-occupied units account for 2,891 (57.6%), while renter-occupied units make up 2,132 (42.4%).
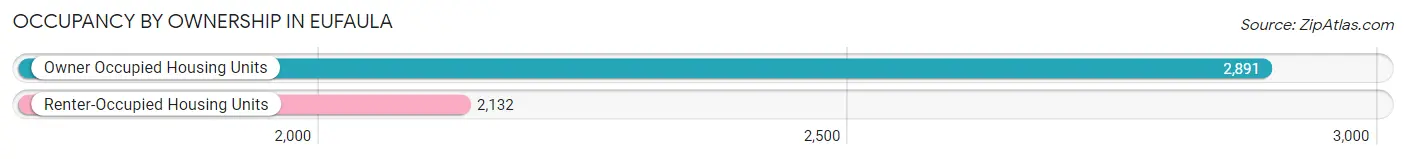
| Occupancy | # Housing Units | % Housing Units |
| Owner Occupied Housing Units | 2,891 | 57.6% |
| Renter-Occupied Housing Units | 2,132 | 42.4% |
| Total Occupied Housing Units | 5,023 | 100.0% |
Occupancy by Household Size in Eufaula
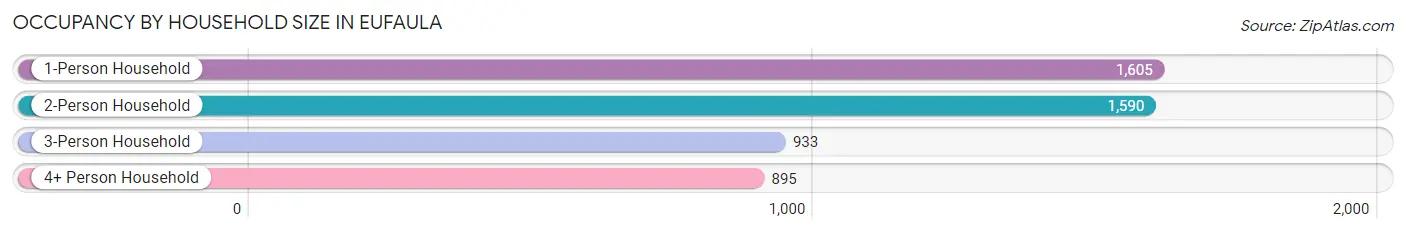
| Household Size | # Housing Units | % Housing Units |
| 1-Person Household | 1,605 | 32.0% |
| 2-Person Household | 1,590 | 31.7% |
| 3-Person Household | 933 | 18.6% |
| 4+ Person Household | 895 | 17.8% |
| Total Housing Units | 5,023 | 100.0% |
Occupancy by Ownership by Household Size in Eufaula
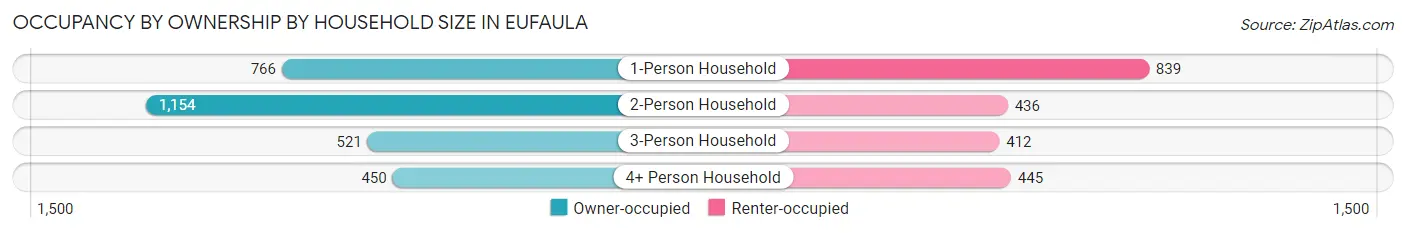
| Household Size | Owner-occupied | Renter-occupied |
| 1-Person Household | 766 (47.7%) | 839 (52.3%) |
| 2-Person Household | 1,154 (72.6%) | 436 (27.4%) |
| 3-Person Household | 521 (55.8%) | 412 (44.2%) |
| 4+ Person Household | 450 (50.3%) | 445 (49.7%) |
| Total Housing Units | 2,891 (57.6%) | 2,132 (42.4%) |
Occupancy by Educational Attainment in Eufaula
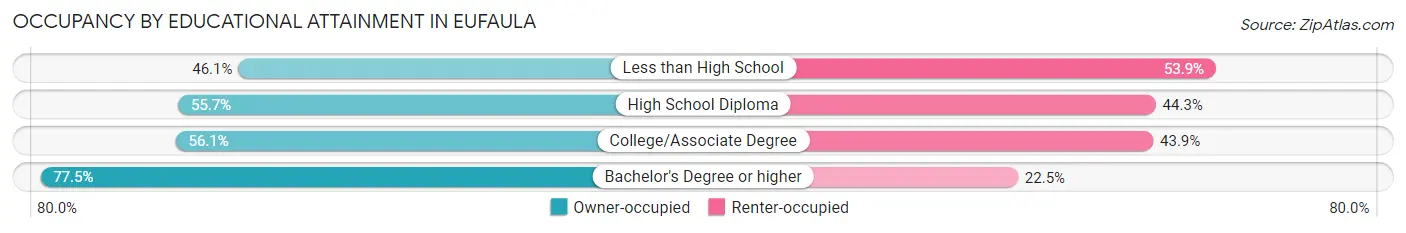
| Household Size | Owner-occupied | Renter-occupied |
| Less than High School | 450 (46.1%) | 526 (53.9%) |
| High School Diploma | 918 (55.7%) | 731 (44.3%) |
| College/Associate Degree | 878 (56.1%) | 688 (43.9%) |
| Bachelor's Degree or higher | 645 (77.5%) | 187 (22.5%) |
Occupancy by Age of Householder in Eufaula
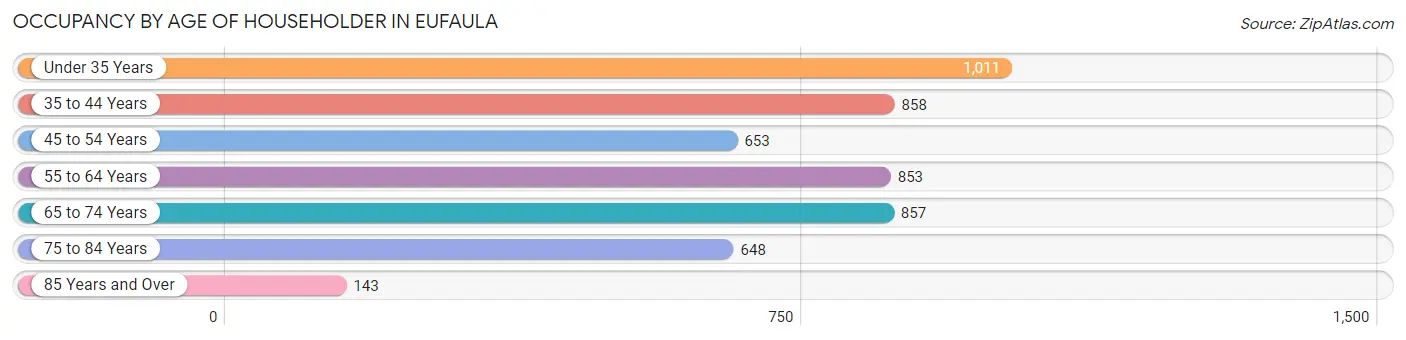
| Age Bracket | # Households | % Households |
| Under 35 Years | 1,011 | 20.1% |
| 35 to 44 Years | 858 | 17.1% |
| 45 to 54 Years | 653 | 13.0% |
| 55 to 64 Years | 853 | 17.0% |
| 65 to 74 Years | 857 | 17.1% |
| 75 to 84 Years | 648 | 12.9% |
| 85 Years and Over | 143 | 2.9% |
| Total | 5,023 | 100.0% |
Housing Finances in Eufaula
Median Income by Occupancy in Eufaula
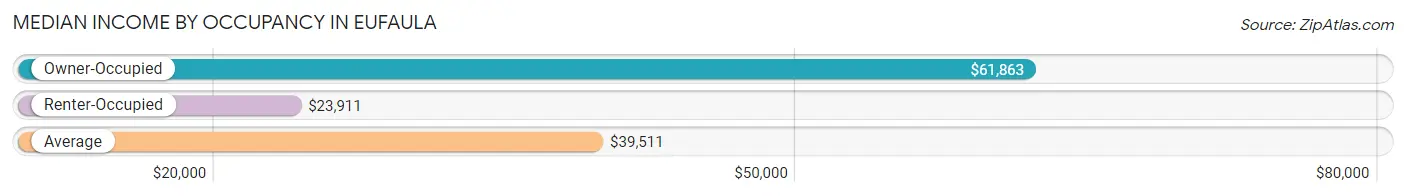
| Occupancy Type | # Households | Median Income |
| Owner-Occupied | 2,891 (57.6%) | $61,863 |
| Renter-Occupied | 2,132 (42.4%) | $23,911 |
| Average | 5,023 (100.0%) | $39,511 |
Occupancy by Householder Income Bracket in Eufaula
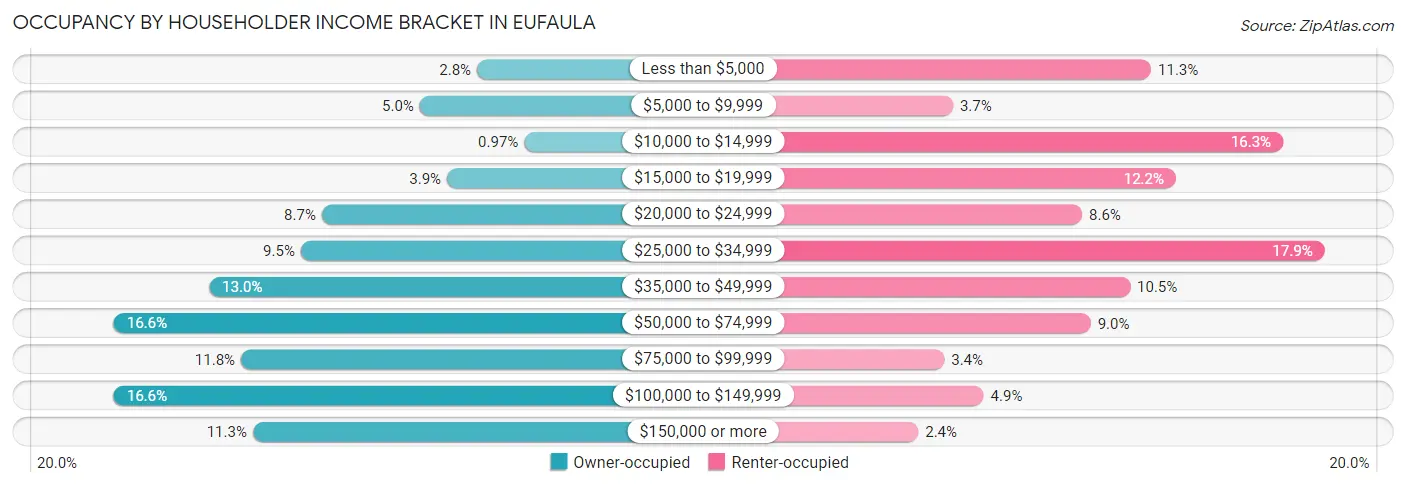
| Income Bracket | Owner-occupied | Renter-occupied |
| Less than $5,000 | 80 (2.8%) | 240 (11.3%) |
| $5,000 to $9,999 | 143 (5.0%) | 79 (3.7%) |
| $10,000 to $14,999 | 28 (1.0%) | 347 (16.3%) |
| $15,000 to $19,999 | 113 (3.9%) | 260 (12.2%) |
| $20,000 to $24,999 | 251 (8.7%) | 184 (8.6%) |
| $25,000 to $34,999 | 274 (9.5%) | 381 (17.9%) |
| $35,000 to $49,999 | 375 (13.0%) | 223 (10.5%) |
| $50,000 to $74,999 | 480 (16.6%) | 191 (9.0%) |
| $75,000 to $99,999 | 340 (11.8%) | 72 (3.4%) |
| $100,000 to $149,999 | 480 (16.6%) | 104 (4.9%) |
| $150,000 or more | 327 (11.3%) | 51 (2.4%) |
| Total | 2,891 (100.0%) | 2,132 (100.0%) |
Monthly Housing Cost Tiers in Eufaula
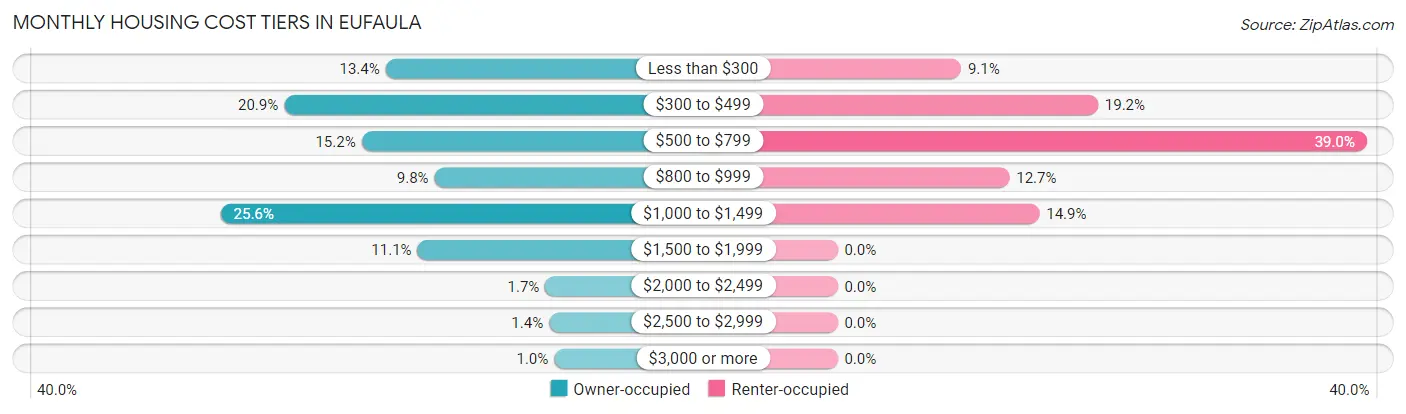
| Monthly Cost | Owner-occupied | Renter-occupied |
| Less than $300 | 388 (13.4%) | 194 (9.1%) |
| $300 to $499 | 604 (20.9%) | 409 (19.2%) |
| $500 to $799 | 439 (15.2%) | 831 (39.0%) |
| $800 to $999 | 284 (9.8%) | 270 (12.7%) |
| $1,000 to $1,499 | 739 (25.6%) | 317 (14.9%) |
| $1,500 to $1,999 | 320 (11.1%) | 0 (0.0%) |
| $2,000 to $2,499 | 48 (1.7%) | 0 (0.0%) |
| $2,500 to $2,999 | 40 (1.4%) | 0 (0.0%) |
| $3,000 or more | 29 (1.0%) | 0 (0.0%) |
| Total | 2,891 (100.0%) | 2,132 (100.0%) |
Physical Housing Characteristics in Eufaula
Housing Structures in Eufaula

| Structure Type | # Housing Units | % Housing Units |
| Single Unit, Detached | 3,088 | 61.5% |
| Single Unit, Attached | 103 | 2.1% |
| 2 Unit Apartments | 530 | 10.5% |
| 3 or 4 Unit Apartments | 247 | 4.9% |
| 5 to 9 Unit Apartments | 289 | 5.8% |
| 10 or more Apartments | 133 | 2.6% |
| Mobile Home / Other | 633 | 12.6% |
| Total | 5,023 | 100.0% |
Housing Structures by Occupancy in Eufaula
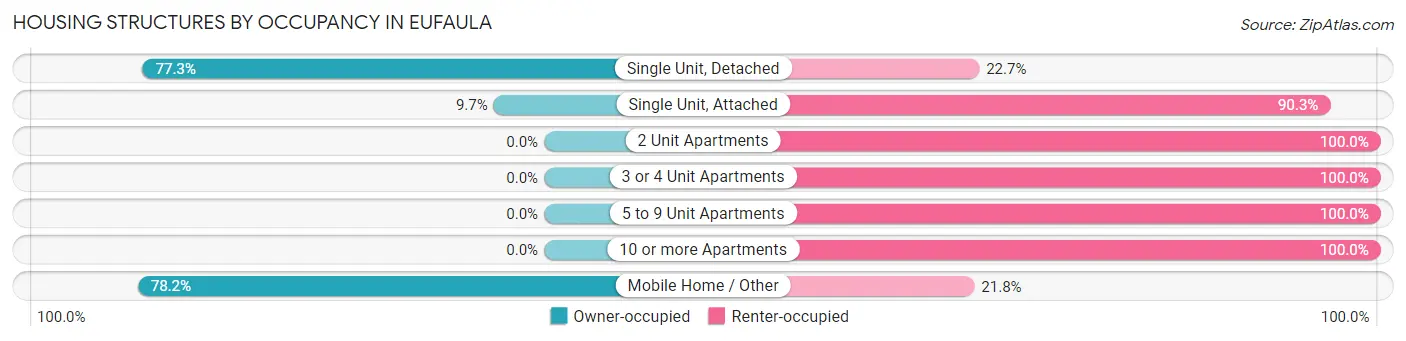
| Structure Type | Owner-occupied | Renter-occupied |
| Single Unit, Detached | 2,386 (77.3%) | 702 (22.7%) |
| Single Unit, Attached | 10 (9.7%) | 93 (90.3%) |
| 2 Unit Apartments | 0 (0.0%) | 530 (100.0%) |
| 3 or 4 Unit Apartments | 0 (0.0%) | 247 (100.0%) |
| 5 to 9 Unit Apartments | 0 (0.0%) | 289 (100.0%) |
| 10 or more Apartments | 0 (0.0%) | 133 (100.0%) |
| Mobile Home / Other | 495 (78.2%) | 138 (21.8%) |
| Total | 2,891 (57.6%) | 2,132 (42.4%) |
Housing Structures by Number of Rooms in Eufaula
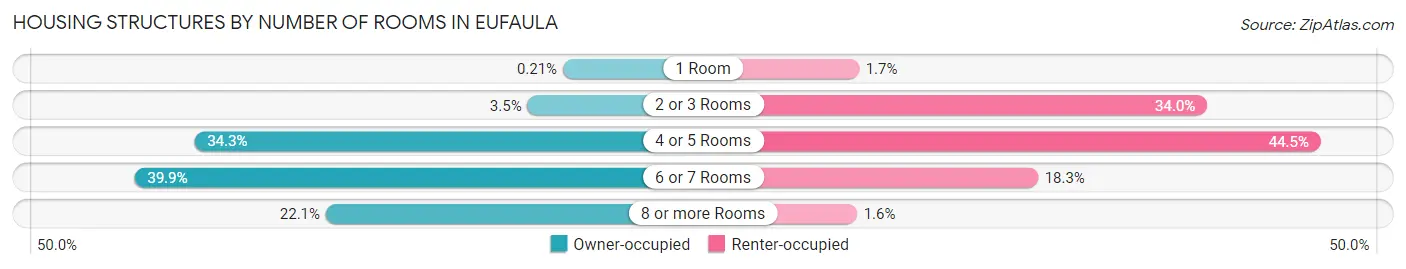
| Number of Rooms | Owner-occupied | Renter-occupied |
| 1 Room | 6 (0.2%) | 37 (1.7%) |
| 2 or 3 Rooms | 101 (3.5%) | 724 (34.0%) |
| 4 or 5 Rooms | 992 (34.3%) | 948 (44.5%) |
| 6 or 7 Rooms | 1,152 (39.9%) | 390 (18.3%) |
| 8 or more Rooms | 640 (22.1%) | 33 (1.5%) |
| Total | 2,891 (100.0%) | 2,132 (100.0%) |
Housing Structure by Heating Type in Eufaula
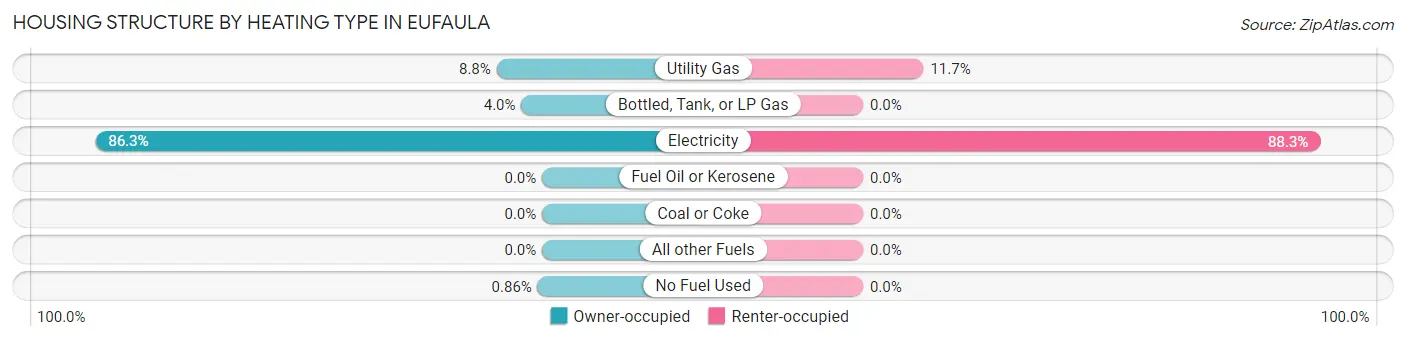
| Heating Type | Owner-occupied | Renter-occupied |
| Utility Gas | 254 (8.8%) | 249 (11.7%) |
| Bottled, Tank, or LP Gas | 116 (4.0%) | 0 (0.0%) |
| Electricity | 2,496 (86.3%) | 1,883 (88.3%) |
| Fuel Oil or Kerosene | 0 (0.0%) | 0 (0.0%) |
| Coal or Coke | 0 (0.0%) | 0 (0.0%) |
| All other Fuels | 0 (0.0%) | 0 (0.0%) |
| No Fuel Used | 25 (0.9%) | 0 (0.0%) |
| Total | 2,891 (100.0%) | 2,132 (100.0%) |
Household Vehicle Usage in Eufaula
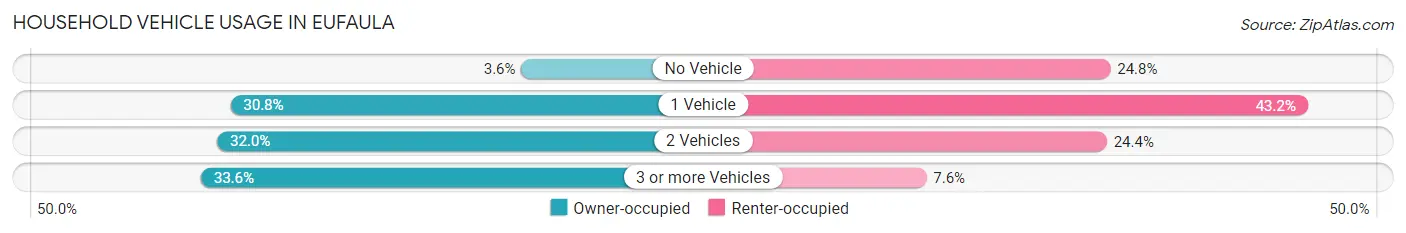
| Vehicles per Household | Owner-occupied | Renter-occupied |
| No Vehicle | 105 (3.6%) | 528 (24.8%) |
| 1 Vehicle | 890 (30.8%) | 921 (43.2%) |
| 2 Vehicles | 926 (32.0%) | 521 (24.4%) |
| 3 or more Vehicles | 970 (33.6%) | 162 (7.6%) |
| Total | 2,891 (100.0%) | 2,132 (100.0%) |
Real Estate & Mortgages in Eufaula
Real Estate and Mortgage Overview in Eufaula
| Characteristic | Without Mortgage | With Mortgage |
| Housing Units | 1,444 | 1,447 |
| Median Property Value | $90,000 | $148,900 |
| Median Household Income | $37,258 | $179 |
| Monthly Housing Costs | $398 | $29 |
| Real Estate Taxes | $374 | $112 |
Property Value by Mortgage Status in Eufaula
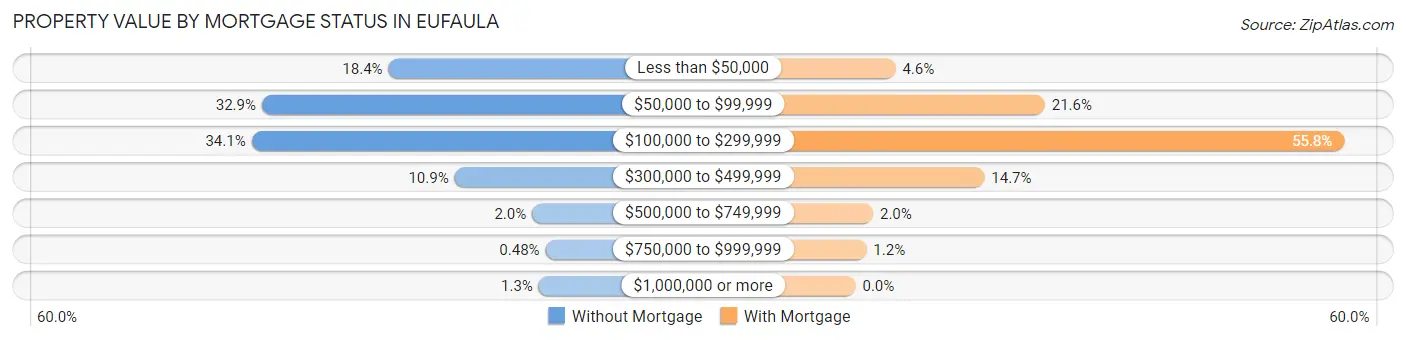
| Property Value | Without Mortgage | With Mortgage |
| Less than $50,000 | 266 (18.4%) | 66 (4.6%) |
| $50,000 to $99,999 | 475 (32.9%) | 313 (21.6%) |
| $100,000 to $299,999 | 492 (34.1%) | 808 (55.8%) |
| $300,000 to $499,999 | 157 (10.9%) | 213 (14.7%) |
| $500,000 to $749,999 | 29 (2.0%) | 29 (2.0%) |
| $750,000 to $999,999 | 7 (0.5%) | 18 (1.2%) |
| $1,000,000 or more | 18 (1.3%) | 0 (0.0%) |
| Total | 1,444 (100.0%) | 1,447 (100.0%) |
Household Income by Mortgage Status in Eufaula
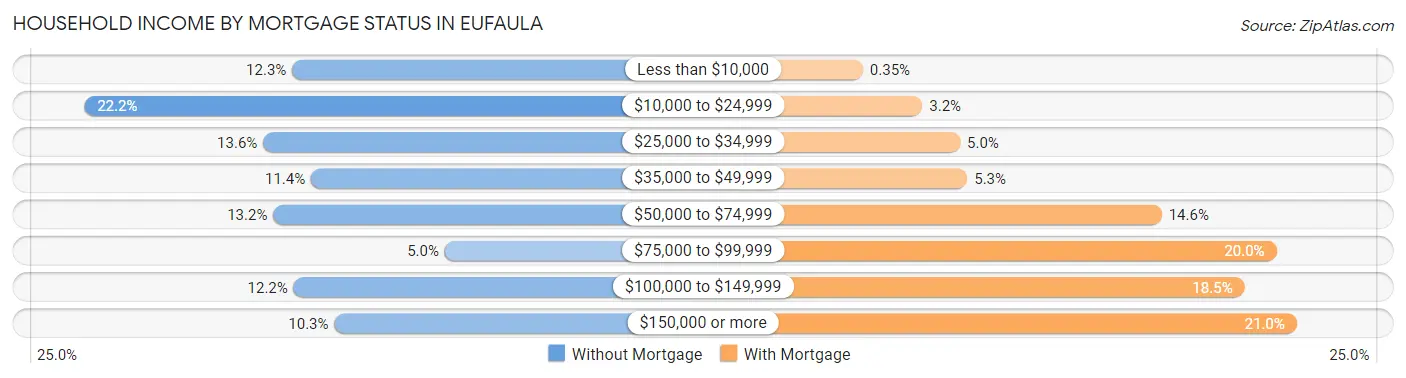
| Household Income | Without Mortgage | With Mortgage |
| Less than $10,000 | 177 (12.3%) | 5 (0.4%) |
| $10,000 to $24,999 | 320 (22.2%) | 46 (3.2%) |
| $25,000 to $34,999 | 197 (13.6%) | 72 (5.0%) |
| $35,000 to $49,999 | 164 (11.4%) | 77 (5.3%) |
| $50,000 to $74,999 | 190 (13.2%) | 211 (14.6%) |
| $75,000 to $99,999 | 72 (5.0%) | 290 (20.0%) |
| $100,000 to $149,999 | 176 (12.2%) | 268 (18.5%) |
| $150,000 or more | 148 (10.2%) | 304 (21.0%) |
| Total | 1,444 (100.0%) | 1,447 (100.0%) |
Property Value to Household Income Ratio in Eufaula
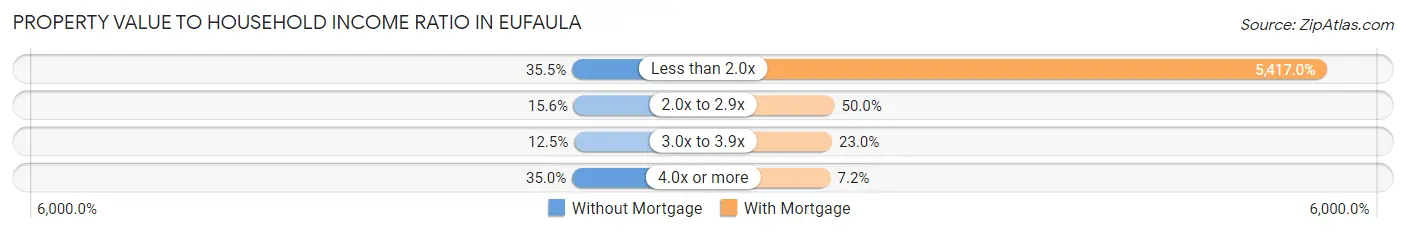
| Value-to-Income Ratio | Without Mortgage | With Mortgage |
| Less than 2.0x | 513 (35.5%) | 78,384 (5,417.0%) |
| 2.0x to 2.9x | 225 (15.6%) | 724 (50.0%) |
| 3.0x to 3.9x | 180 (12.5%) | 333 (23.0%) |
| 4.0x or more | 506 (35.0%) | 104 (7.2%) |
| Total | 1,444 (100.0%) | 1,447 (100.0%) |
Real Estate Taxes by Mortgage Status in Eufaula
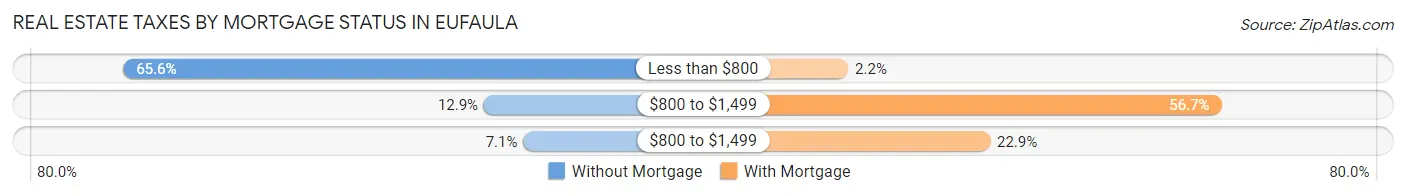
| Property Taxes | Without Mortgage | With Mortgage |
| Less than $800 | 947 (65.6%) | 32 (2.2%) |
| $800 to $1,499 | 186 (12.9%) | 821 (56.7%) |
| $800 to $1,499 | 103 (7.1%) | 332 (22.9%) |
| Total | 1,444 (100.0%) | 1,447 (100.0%) |
Health & Disability in Eufaula
Health Insurance Coverage by Age in Eufaula
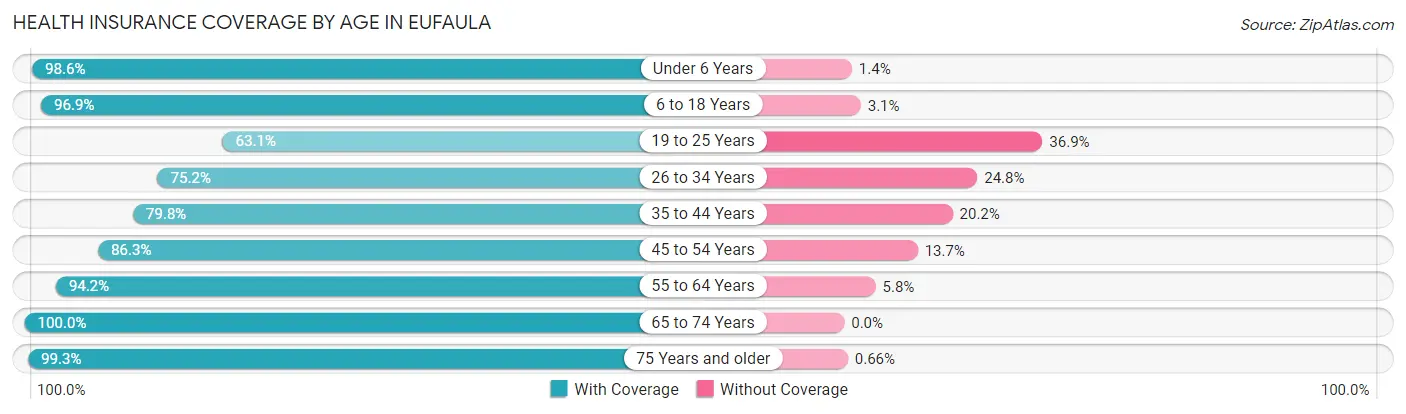
| Age Bracket | With Coverage | Without Coverage |
| Under 6 Years | 1,039 (98.6%) | 15 (1.4%) |
| 6 to 18 Years | 2,263 (96.9%) | 72 (3.1%) |
| 19 to 25 Years | 734 (63.1%) | 430 (36.9%) |
| 26 to 34 Years | 1,173 (75.2%) | 387 (24.8%) |
| 35 to 44 Years | 1,035 (79.8%) | 262 (20.2%) |
| 45 to 54 Years | 1,009 (86.3%) | 160 (13.7%) |
| 55 to 64 Years | 1,386 (94.2%) | 86 (5.8%) |
| 65 to 74 Years | 1,294 (100.0%) | 0 (0.0%) |
| 75 Years and older | 1,211 (99.3%) | 8 (0.7%) |
| Total | 11,144 (88.7%) | 1,420 (11.3%) |
Health Insurance Coverage by Citizenship Status in Eufaula
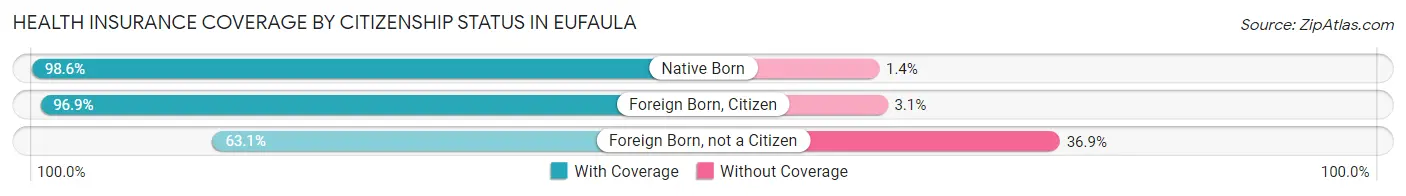
| Citizenship Status | With Coverage | Without Coverage |
| Native Born | 1,039 (98.6%) | 15 (1.4%) |
| Foreign Born, Citizen | 2,263 (96.9%) | 72 (3.1%) |
| Foreign Born, not a Citizen | 734 (63.1%) | 430 (36.9%) |
Health Insurance Coverage by Household Income in Eufaula
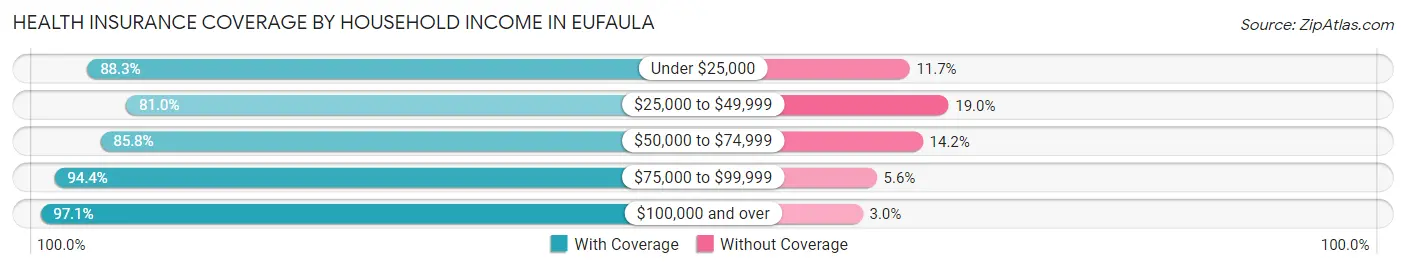
| Household Income | With Coverage | Without Coverage |
| Under $25,000 | 3,159 (88.3%) | 420 (11.7%) |
| $25,000 to $49,999 | 2,261 (81.0%) | 531 (19.0%) |
| $50,000 to $74,999 | 1,910 (85.8%) | 316 (14.2%) |
| $75,000 to $99,999 | 1,215 (94.4%) | 72 (5.6%) |
| $100,000 and over | 2,598 (97.1%) | 79 (2.9%) |
Public vs Private Health Insurance Coverage by Age in Eufaula
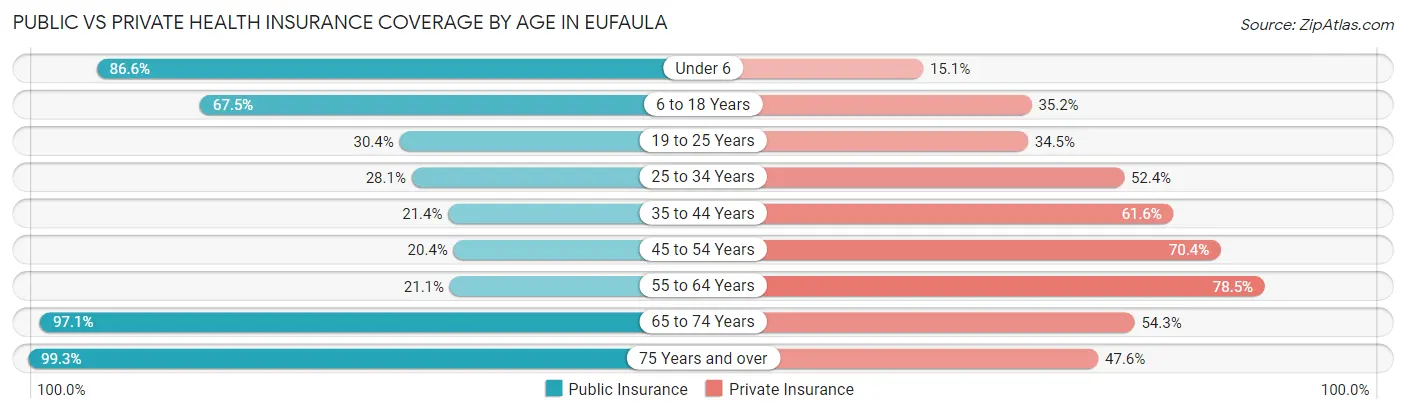
| Age Bracket | Public Insurance | Private Insurance |
| Under 6 | 913 (86.6%) | 159 (15.1%) |
| 6 to 18 Years | 1,575 (67.4%) | 822 (35.2%) |
| 19 to 25 Years | 354 (30.4%) | 402 (34.5%) |
| 25 to 34 Years | 439 (28.1%) | 817 (52.4%) |
| 35 to 44 Years | 277 (21.4%) | 799 (61.6%) |
| 45 to 54 Years | 238 (20.4%) | 823 (70.4%) |
| 55 to 64 Years | 310 (21.1%) | 1,156 (78.5%) |
| 65 to 74 Years | 1,257 (97.1%) | 703 (54.3%) |
| 75 Years and over | 1,211 (99.3%) | 580 (47.6%) |
| Total | 6,574 (52.3%) | 6,261 (49.8%) |
Disability Status by Sex by Age in Eufaula
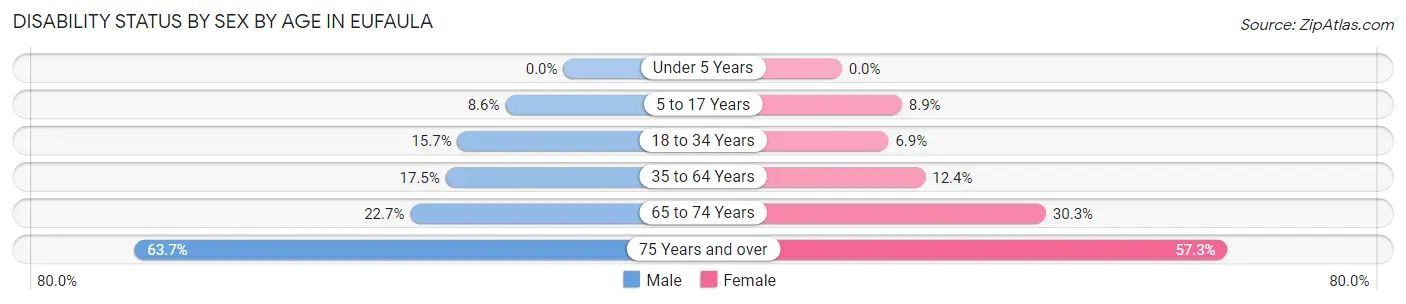
| Age Bracket | Male | Female |
| Under 5 Years | 0 (0.0%) | 0 (0.0%) |
| 5 to 17 Years | 93 (8.6%) | 102 (8.9%) |
| 18 to 34 Years | 244 (15.7%) | 97 (6.9%) |
| 35 to 64 Years | 281 (17.5%) | 289 (12.4%) |
| 65 to 74 Years | 121 (22.7%) | 231 (30.3%) |
| 75 Years and over | 307 (63.7%) | 422 (57.3%) |
Disability Class by Sex by Age in Eufaula
Disability Class: Hearing Difficulty
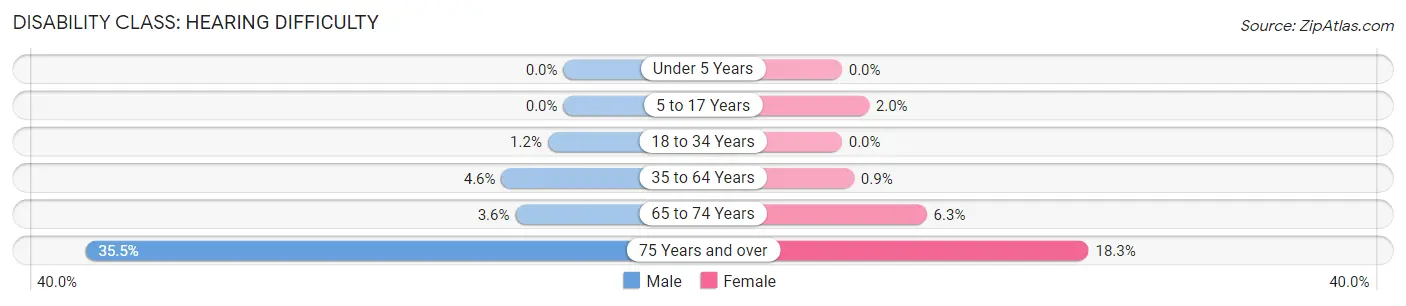
| Age Bracket | Male | Female |
| Under 5 Years | 0 (0.0%) | 0 (0.0%) |
| 5 to 17 Years | 0 (0.0%) | 23 (2.0%) |
| 18 to 34 Years | 18 (1.2%) | 0 (0.0%) |
| 35 to 64 Years | 74 (4.6%) | 21 (0.9%) |
| 65 to 74 Years | 19 (3.6%) | 48 (6.3%) |
| 75 Years and over | 171 (35.5%) | 135 (18.3%) |
Disability Class: Vision Difficulty
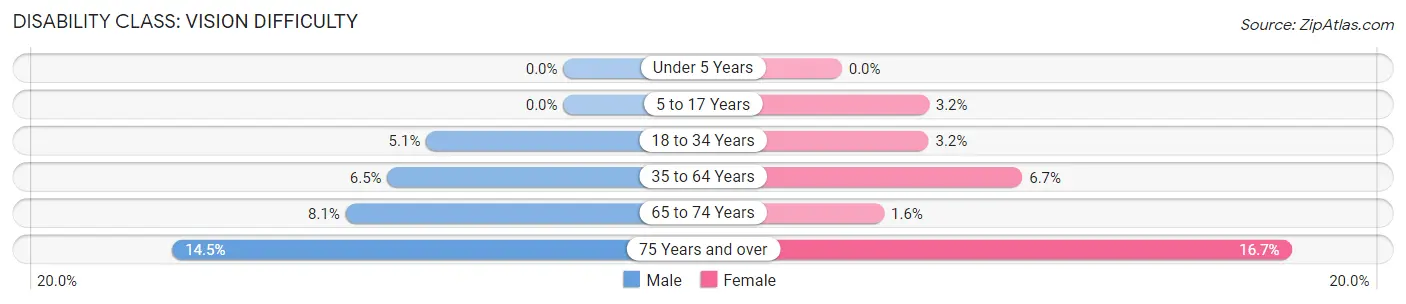
| Age Bracket | Male | Female |
| Under 5 Years | 0 (0.0%) | 0 (0.0%) |
| 5 to 17 Years | 0 (0.0%) | 37 (3.2%) |
| 18 to 34 Years | 79 (5.1%) | 45 (3.2%) |
| 35 to 64 Years | 105 (6.5%) | 156 (6.7%) |
| 65 to 74 Years | 43 (8.1%) | 12 (1.6%) |
| 75 Years and over | 70 (14.5%) | 123 (16.7%) |
Disability Class: Cognitive Difficulty
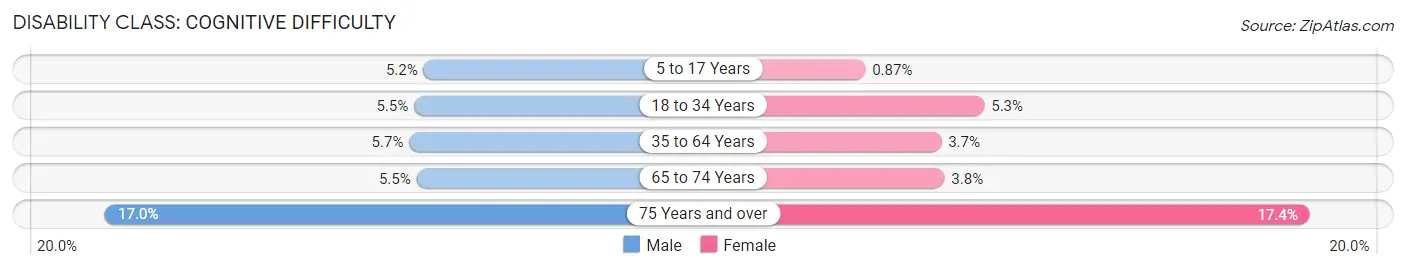
| Age Bracket | Male | Female |
| 5 to 17 Years | 56 (5.2%) | 10 (0.9%) |
| 18 to 34 Years | 86 (5.5%) | 74 (5.3%) |
| 35 to 64 Years | 92 (5.7%) | 86 (3.7%) |
| 65 to 74 Years | 29 (5.4%) | 29 (3.8%) |
| 75 Years and over | 82 (17.0%) | 128 (17.4%) |
Disability Class: Ambulatory Difficulty
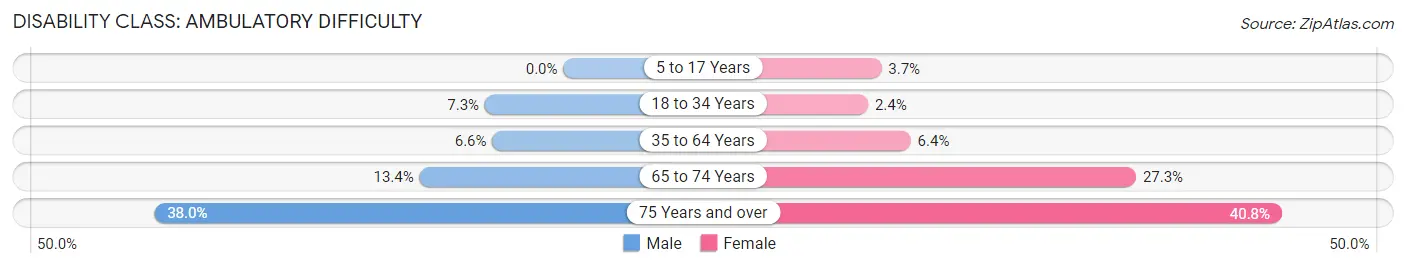
| Age Bracket | Male | Female |
| 5 to 17 Years | 0 (0.0%) | 42 (3.7%) |
| 18 to 34 Years | 113 (7.3%) | 34 (2.4%) |
| 35 to 64 Years | 106 (6.6%) | 149 (6.4%) |
| 65 to 74 Years | 71 (13.4%) | 208 (27.3%) |
| 75 Years and over | 183 (38.0%) | 301 (40.8%) |
Disability Class: Self-Care Difficulty
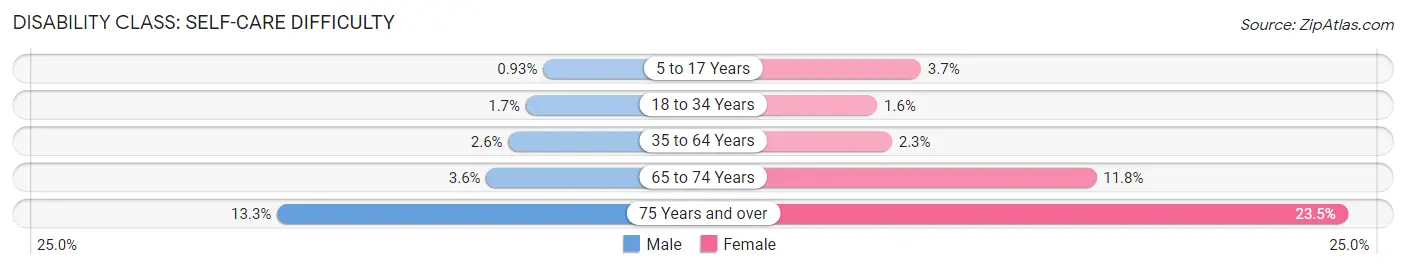
| Age Bracket | Male | Female |
| 5 to 17 Years | 10 (0.9%) | 42 (3.7%) |
| 18 to 34 Years | 27 (1.7%) | 23 (1.6%) |
| 35 to 64 Years | 41 (2.5%) | 54 (2.3%) |
| 65 to 74 Years | 19 (3.6%) | 90 (11.8%) |
| 75 Years and over | 64 (13.3%) | 173 (23.5%) |
Technology Access in Eufaula
Computing Device Access in Eufaula
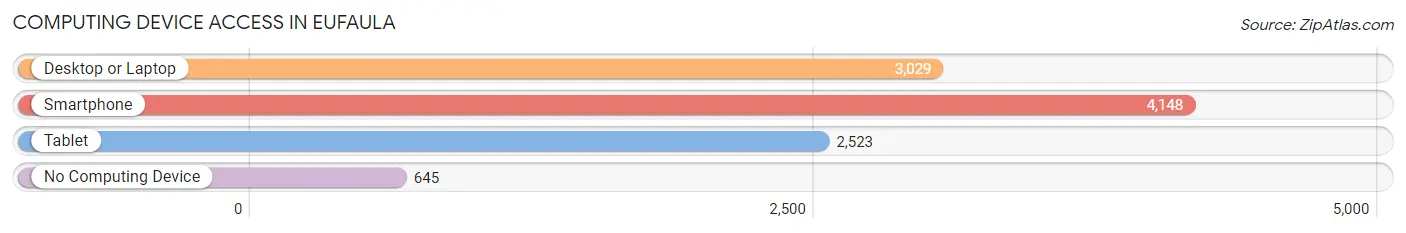
| Device Type | # Households | % Households |
| Desktop or Laptop | 3,029 | 60.3% |
| Smartphone | 4,148 | 82.6% |
| Tablet | 2,523 | 50.2% |
| No Computing Device | 645 | 12.8% |
| Total | 5,023 | 100.0% |
Internet Access in Eufaula
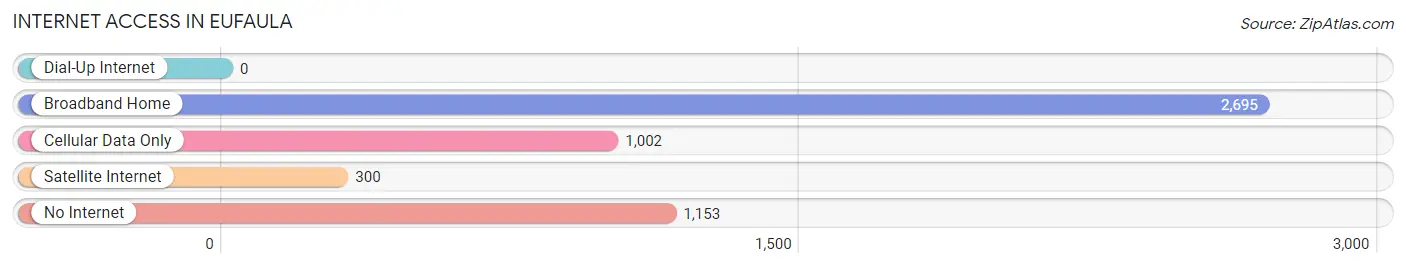
| Internet Type | # Households | % Households |
| Dial-Up Internet | 0 | 0.0% |
| Broadband Home | 2,695 | 53.6% |
| Cellular Data Only | 1,002 | 20.0% |
| Satellite Internet | 300 | 6.0% |
| No Internet | 1,153 | 23.0% |
| Total | 5,023 | 100.0% |
Eufaula Summary
Eufaula, Alabama is a city located in Barbour County, Alabama, United States. It is the county seat of Barbour County and is located along the Chattahoochee River. As of the 2010 census, the population of Eufaula was 13,137.
History
The area that is now Eufaula was originally inhabited by the Creek Indians. The Creek Indians were a Native American tribe that lived in the area for centuries before the arrival of European settlers. The Creek Indians were eventually forced to cede their land to the United States government in the Treaty of Fort Jackson in 1814.
The city of Eufaula was founded in 1819 by General John Coffee, a veteran of the War of 1812. Coffee named the city after a Creek Indian village called Eufaula, which was located nearby. The city was incorporated in 1823 and quickly became a thriving port town due to its location on the Chattahoochee River.
During the Civil War, Eufaula was a major supply center for the Confederate Army. The city was also the site of several battles, including the Battle of Eufaula in 1864. After the war, the city experienced a period of economic growth and development.
Geography
Eufaula is located in southeastern Alabama, approximately 30 miles north of the Florida border. The city is situated on the banks of the Chattahoochee River, which forms the border between Alabama and Georgia. The city covers an area of 16.3 square miles and has an elevation of 200 feet above sea level.
The climate in Eufaula is classified as humid subtropical, with hot, humid summers and mild winters. The average annual temperature is 64°F, with an average high of 90°F in the summer and an average low of 38°F in the winter.
Economy
The economy of Eufaula is largely based on agriculture and manufacturing. The city is home to several large agricultural operations, including poultry farms, cotton farms, and timber operations. The city is also home to several manufacturing companies, including a paper mill, a furniture factory, and a textile mill.
The city is also home to several retail stores, restaurants, and other businesses. The city is served by the Eufaula-Barbour County Airport, which offers daily flights to Birmingham and Montgomery.
Demographics
As of the 2010 census, the population of Eufaula was 13,137. The racial makeup of the city was 57.3% White, 39.2% African American, 0.3% Native American, 0.7% Asian, 0.1% Pacific Islander, 1.2% from other races, and 1.4% from two or more races. Hispanic or Latino of any race were 2.7% of the population.
The median household income in Eufaula was $30,945, and the median family income was $37,917. The per capita income for the city was $17,845. About 22.2% of the population was below the poverty line.
Common Questions
What is Per Capita Income in Eufaula?
Per Capita income in Eufaula is $24,994.
What is the Median Family Income in Eufaula?
Median Family Income in Eufaula is $57,174.
What is the Median Household income in Eufaula?
Median Household Income in Eufaula is $39,511.
What is Income or Wage Gap in Eufaula?
Income or Wage Gap in Eufaula is 25.0%.
Women in Eufaula earn 75.0 cents for every dollar earned by a man.
What is Family Income Deficit in Eufaula?
Family Income Deficit in Eufaula is $13,644.
Families that are below poverty line in Eufaula earn $13,644 less on average than the poverty threshold level.
What is Inequality or Gini Index in Eufaula?
Inequality or Gini Index in Eufaula is 0.51.
What is the Total Population of Eufaula?
Total Population of Eufaula is 12,746.
What is the Total Male Population of Eufaula?
Total Male Population of Eufaula is 5,740.
What is the Total Female Population of Eufaula?
Total Female Population of Eufaula is 7,006.
What is the Ratio of Males per 100 Females in Eufaula?
There are 81.93 Males per 100 Females in Eufaula.
What is the Ratio of Females per 100 Males in Eufaula?
There are 122.06 Females per 100 Males in Eufaula.
What is the Median Population Age in Eufaula?
Median Population Age in Eufaula is 37.0 Years.
What is the Average Family Size in Eufaula
Average Family Size in Eufaula is 3.2 People.
What is the Average Household Size in Eufaula
Average Household Size in Eufaula is 2.5 People.
How Large is the Labor Force in Eufaula?
There are 4,974 People in the Labor Forcein in Eufaula.
What is the Percentage of People in the Labor Force in Eufaula?
50.0% of People are in the Labor Force in Eufaula.
What is the Unemployment Rate in Eufaula?
Unemployment Rate in Eufaula is 5.2%.