Woodfield, SC Map & Demographics
Woodfield Map
Woodfield Overview
$22,963
PER CAPITA INCOME
$47,249
AVG FAMILY INCOME
$39,867
AVG HOUSEHOLD INCOME
3.2%
WAGE / INCOME GAP [ % ]
96.8¢/ $1
WAGE / INCOME GAP [ $ ]
0.40
INEQUALITY / GINI INDEX
9,466
TOTAL POPULATION
4,607
MALE POPULATION
4,859
FEMALE POPULATION
94.81
MALES / 100 FEMALES
105.47
FEMALES / 100 MALES
37.2
MEDIAN AGE
2.7
AVG FAMILY SIZE
2.2
AVG HOUSEHOLD SIZE
4,539
LABOR FORCE [ PEOPLE ]
62.7%
PERCENT IN LABOR FORCE
4.3%
UNEMPLOYMENT RATE
Income in Woodfield
Income Overview in Woodfield
Per Capita Income in Woodfield is $22,963, while median incomes of families and households are $47,249 and $39,867 respectively.
| Characteristic | Number | Measure |
| Per Capita Income | 9,466 | $22,963 |
| Median Family Income | 2,538 | $47,249 |
| Mean Family Income | 2,538 | $62,017 |
| Median Household Income | 4,242 | $39,867 |
| Mean Household Income | 4,242 | $52,457 |
| Income Deficit | 2,538 | $0 |
| Wage / Income Gap (%) | 9,466 | 3.17% |
| Wage / Income Gap ($) | 9,466 | 96.83¢ per $1 |
| Gini / Inequality Index | 9,466 | 0.40 |
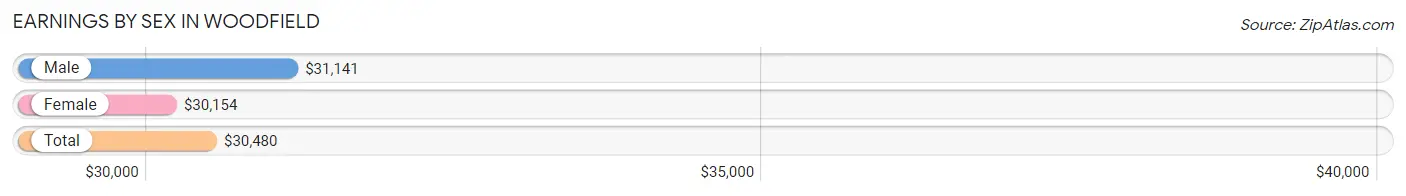
Earnings by Sex in Woodfield
Average Earnings in Woodfield are $30,480, $31,141 for men and $30,154 for women, a difference of 3.2%.
| Sex | Number | Average Earnings |
| Male | 2,373 (48.9%) | $31,141 |
| Female | 2,484 (51.1%) | $30,154 |
| Total | 4,857 (100.0%) | $30,480 |
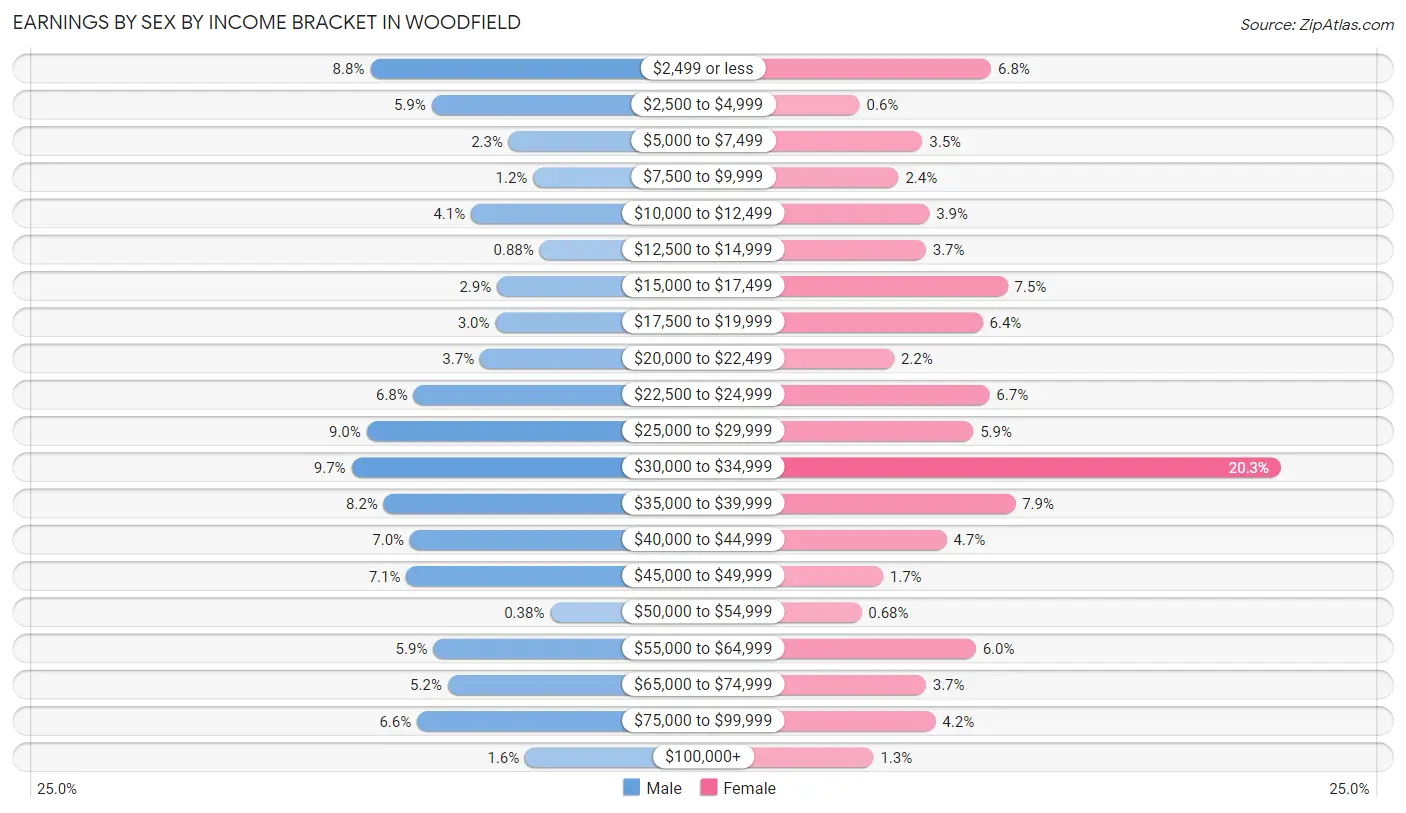
Earnings by Sex by Income Bracket in Woodfield
The most common earnings brackets in Woodfield are $30,000 to $34,999 for men (230 | 9.7%) and $30,000 to $34,999 for women (505 | 20.3%).
| Income | Male | Female |
| $2,499 or less | 209 (8.8%) | 168 (6.8%) |
| $2,500 to $4,999 | 141 (5.9%) | 15 (0.6%) |
| $5,000 to $7,499 | 55 (2.3%) | 88 (3.5%) |
| $7,500 to $9,999 | 28 (1.2%) | 60 (2.4%) |
| $10,000 to $12,499 | 97 (4.1%) | 96 (3.9%) |
| $12,500 to $14,999 | 21 (0.9%) | 92 (3.7%) |
| $15,000 to $17,499 | 68 (2.9%) | 187 (7.5%) |
| $17,500 to $19,999 | 70 (2.9%) | 158 (6.4%) |
| $20,000 to $22,499 | 87 (3.7%) | 55 (2.2%) |
| $22,500 to $24,999 | 161 (6.8%) | 166 (6.7%) |
| $25,000 to $29,999 | 213 (9.0%) | 147 (5.9%) |
| $30,000 to $34,999 | 230 (9.7%) | 505 (20.3%) |
| $35,000 to $39,999 | 194 (8.2%) | 196 (7.9%) |
| $40,000 to $44,999 | 165 (7.0%) | 116 (4.7%) |
| $45,000 to $49,999 | 169 (7.1%) | 42 (1.7%) |
| $50,000 to $54,999 | 9 (0.4%) | 17 (0.7%) |
| $55,000 to $64,999 | 139 (5.9%) | 150 (6.0%) |
| $65,000 to $74,999 | 123 (5.2%) | 92 (3.7%) |
| $75,000 to $99,999 | 157 (6.6%) | 103 (4.2%) |
| $100,000+ | 37 (1.6%) | 31 (1.3%) |
| Total | 2,373 (100.0%) | 2,484 (100.0%) |
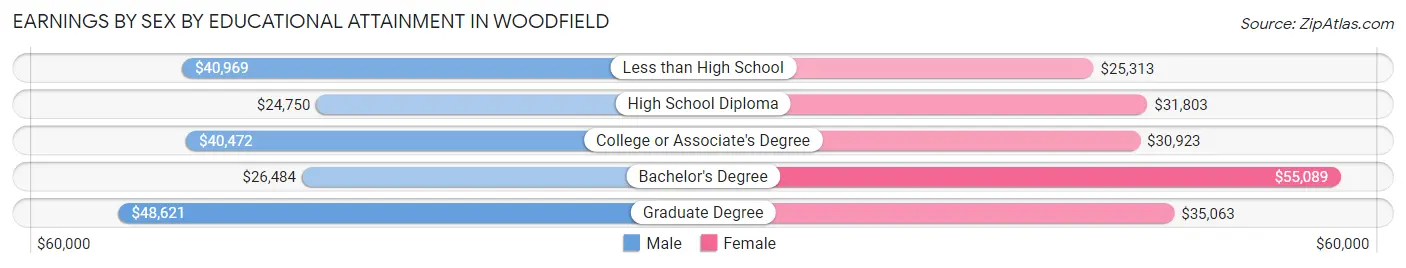
Earnings by Sex by Educational Attainment in Woodfield
Average earnings in Woodfield are $35,184 for men and $32,008 for women, a difference of 9.0%. Men with an educational attainment of graduate degree enjoy the highest average annual earnings of $48,621, while those with high school diploma education earn the least with $24,750. Women with an educational attainment of bachelor's degree earn the most with the average annual earnings of $55,089, while those with less than high school education have the smallest earnings of $25,313.
| Educational Attainment | Male Income | Female Income |
| Less than High School | $40,969 | $25,313 |
| High School Diploma | $24,750 | $31,803 |
| College or Associate's Degree | $40,472 | $30,923 |
| Bachelor's Degree | $26,484 | $55,089 |
| Graduate Degree | $48,621 | $35,063 |
| Total | $35,184 | $32,008 |
Family Income in Woodfield
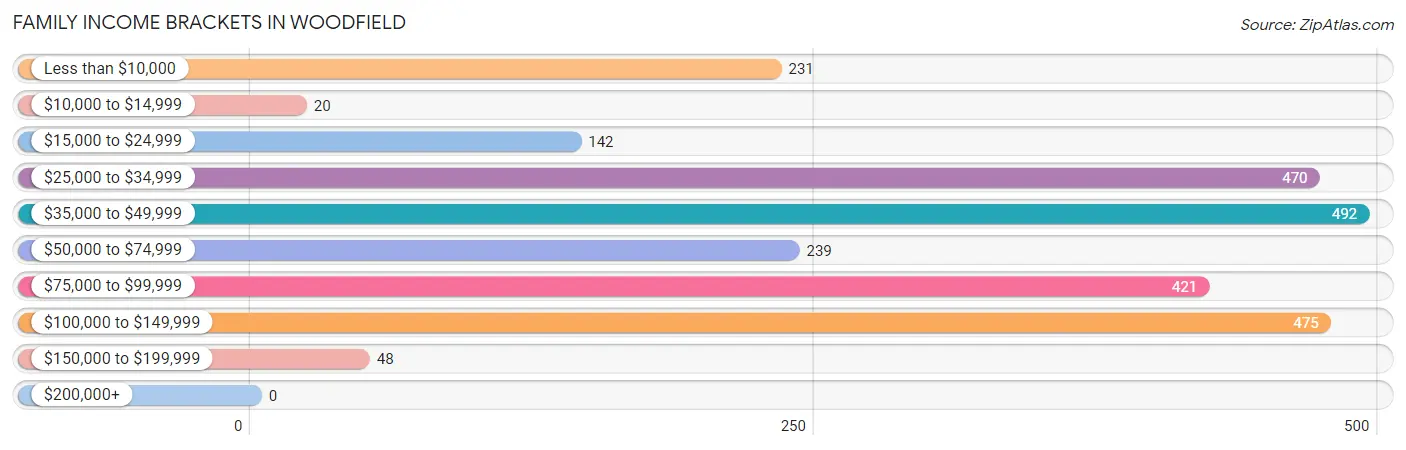
Family Income Brackets in Woodfield
According to the Woodfield family income data, there are 492 families falling into the $35,000 to $49,999 income range, which is the most common income bracket and makes up 19.4% of all families.
| Income Bracket | # Families | % Families |
| Less than $10,000 | 231 | 9.1% |
| $10,000 to $14,999 | 20 | 0.8% |
| $15,000 to $24,999 | 142 | 5.6% |
| $25,000 to $34,999 | 470 | 18.5% |
| $35,000 to $49,999 | 492 | 19.4% |
| $50,000 to $74,999 | 239 | 9.4% |
| $75,000 to $99,999 | 421 | 16.6% |
| $100,000 to $149,999 | 475 | 18.7% |
| $150,000 to $199,999 | 48 | 1.9% |
| $200,000+ | 0 | 0.0% |
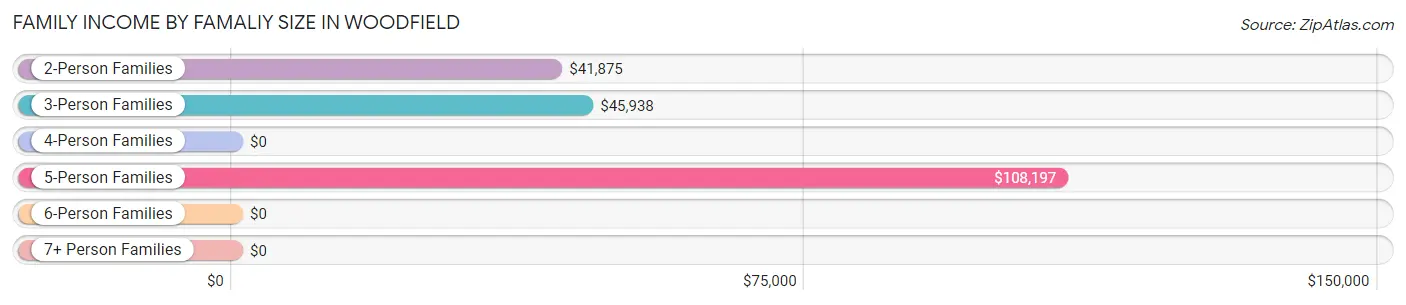
Family Income by Famaliy Size in Woodfield
5-person families (314 | 12.4%) account for the highest median family income in Woodfield with $108,197 per family, while 5-person families (314 | 12.4%) have the highest median income of $21,639 per family member.
| Income Bracket | # Families | Median Income |
| 2-Person Families | 1,476 (58.2%) | $41,875 |
| 3-Person Families | 554 (21.8%) | $45,938 |
| 4-Person Families | 91 (3.6%) | $0 |
| 5-Person Families | 314 (12.4%) | $108,197 |
| 6-Person Families | 67 (2.6%) | $0 |
| 7+ Person Families | 36 (1.4%) | $0 |
| Total | 2,538 (100.0%) | $47,249 |
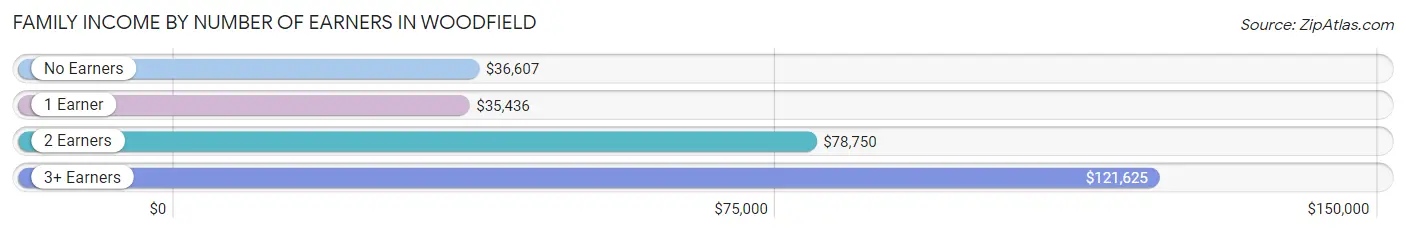
Family Income by Number of Earners in Woodfield
The median family income in Woodfield is $47,249, with families comprising 3+ earners (137) having the highest median family income of $121,625, while families with 1 earner (1,271) have the lowest median family income of $35,436, accounting for 5.4% and 50.1% of families, respectively.
| Number of Earners | # Families | Median Income |
| No Earners | 348 (13.7%) | $36,607 |
| 1 Earner | 1,271 (50.1%) | $35,436 |
| 2 Earners | 782 (30.8%) | $78,750 |
| 3+ Earners | 137 (5.4%) | $121,625 |
| Total | 2,538 (100.0%) | $47,249 |
Household Income in Woodfield
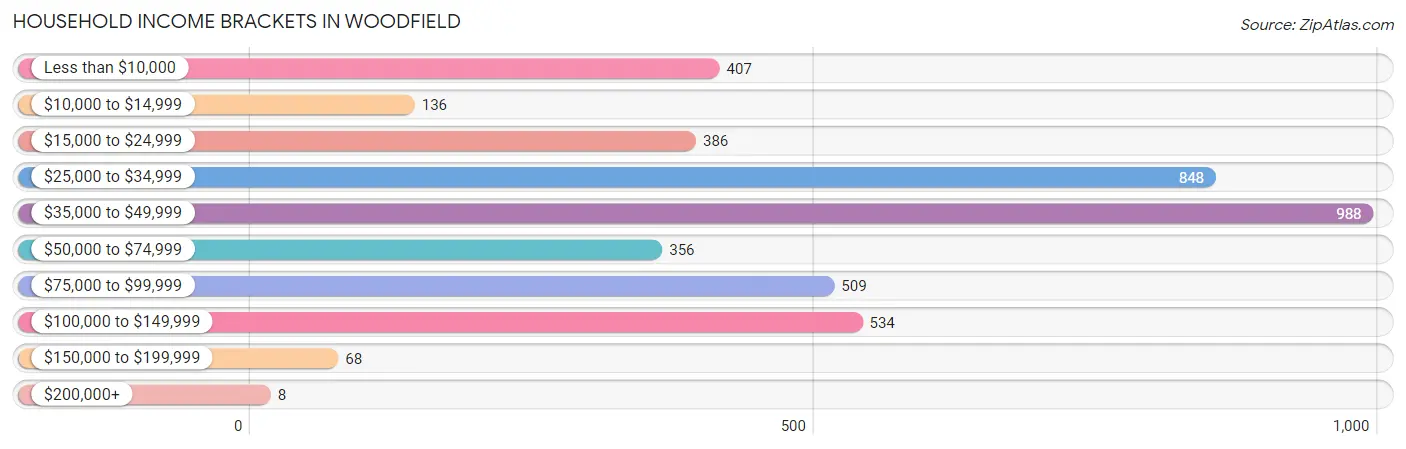
Household Income Brackets in Woodfield
With 988 households falling in the category, the $35,000 to $49,999 income range is the most frequent in Woodfield, accounting for 23.3% of all households. In contrast, only 8 households (0.2%) fall into the $200,000+ income bracket, making it the least populous group.
| Income Bracket | # Households | % Households |
| Less than $10,000 | 407 | 9.6% |
| $10,000 to $14,999 | 136 | 3.2% |
| $15,000 to $24,999 | 386 | 9.1% |
| $25,000 to $34,999 | 848 | 20.0% |
| $35,000 to $49,999 | 988 | 23.3% |
| $50,000 to $74,999 | 356 | 8.4% |
| $75,000 to $99,999 | 509 | 12.0% |
| $100,000 to $149,999 | 534 | 12.6% |
| $150,000 to $199,999 | 68 | 1.6% |
| $200,000+ | 8 | 0.2% |
Household Income by Householder Age in Woodfield
The median household income in Woodfield is $39,867, with the highest median household income of $47,845 found in the 65+ years age bracket for the primary householder. A total of 1,132 households (26.7%) fall into this category. Meanwhile, the 15 to 24 years age bracket for the primary householder has the lowest median household income of $27,284, with 274 households (6.5%) in this group.
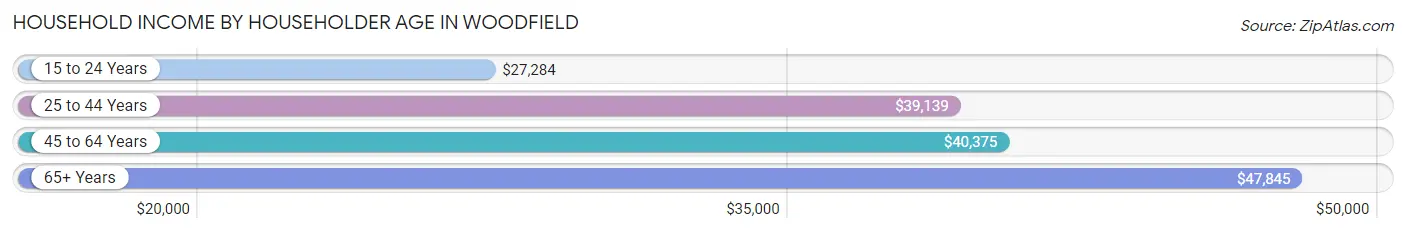
| Income Bracket | # Households | Median Income |
| 15 to 24 Years | 274 (6.5%) | $27,284 |
| 25 to 44 Years | 1,468 (34.6%) | $39,139 |
| 45 to 64 Years | 1,368 (32.3%) | $40,375 |
| 65+ Years | 1,132 (26.7%) | $47,845 |
| Total | 4,242 (100.0%) | $39,867 |
Poverty in Woodfield
Income Below Poverty by Sex and Age in Woodfield
With 24.2% poverty level for males and 19.4% for females among the residents of Woodfield, 5 year old males and 15 year old females are the most vulnerable to poverty, with 68 males (100.0%) and 149 females (74.5%) in their respective age groups living below the poverty level.
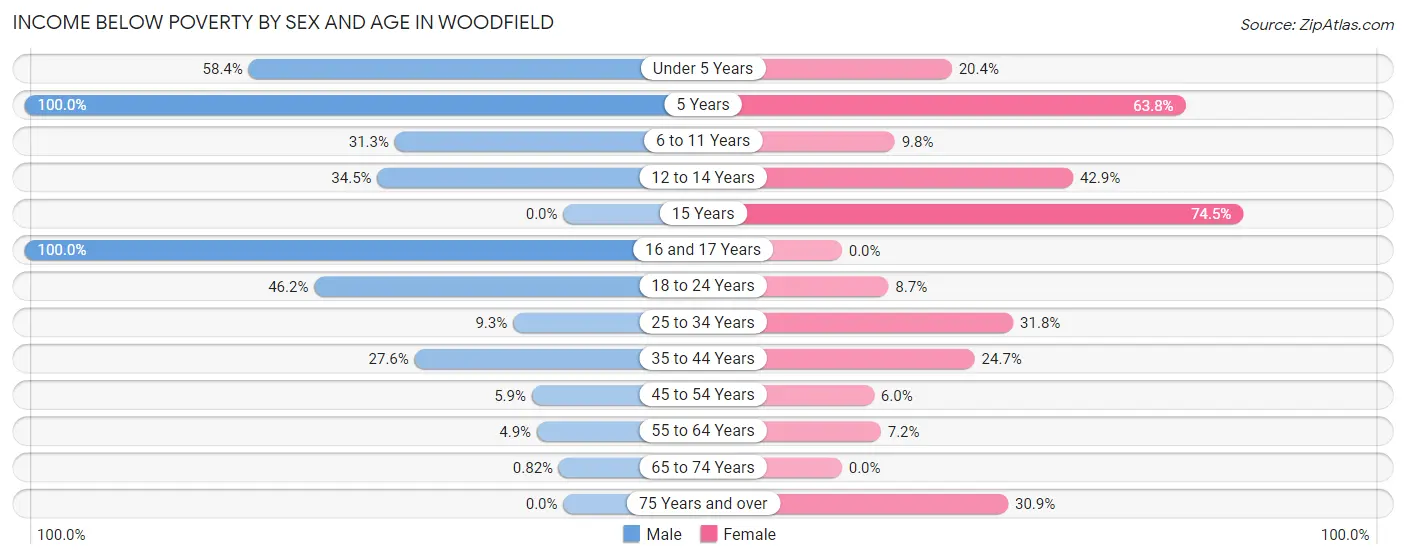
| Age Bracket | Male | Female |
| Under 5 Years | 177 (58.4%) | 40 (20.4%) |
| 5 Years | 68 (100.0%) | 44 (63.8%) |
| 6 to 11 Years | 193 (31.3%) | 34 (9.8%) |
| 12 to 14 Years | 39 (34.5%) | 106 (42.9%) |
| 15 Years | 0 (0.0%) | 149 (74.5%) |
| 16 and 17 Years | 90 (100.0%) | 0 (0.0%) |
| 18 to 24 Years | 252 (46.2%) | 30 (8.6%) |
| 25 to 34 Years | 67 (9.3%) | 167 (31.8%) |
| 35 to 44 Years | 148 (27.6%) | 183 (24.7%) |
| 45 to 54 Years | 28 (5.9%) | 45 (6.0%) |
| 55 to 64 Years | 21 (4.9%) | 32 (7.2%) |
| 65 to 74 Years | 2 (0.8%) | 0 (0.0%) |
| 75 Years and over | 0 (0.0%) | 108 (30.9%) |
| Total | 1,085 (24.2%) | 938 (19.4%) |
Income Above Poverty by Sex and Age in Woodfield
According to the poverty statistics in Woodfield, males aged 15 years and females aged 16 and 17 years are the age groups that are most secure financially, with 100.0% of males and 100.0% of females in these age groups living above the poverty line.
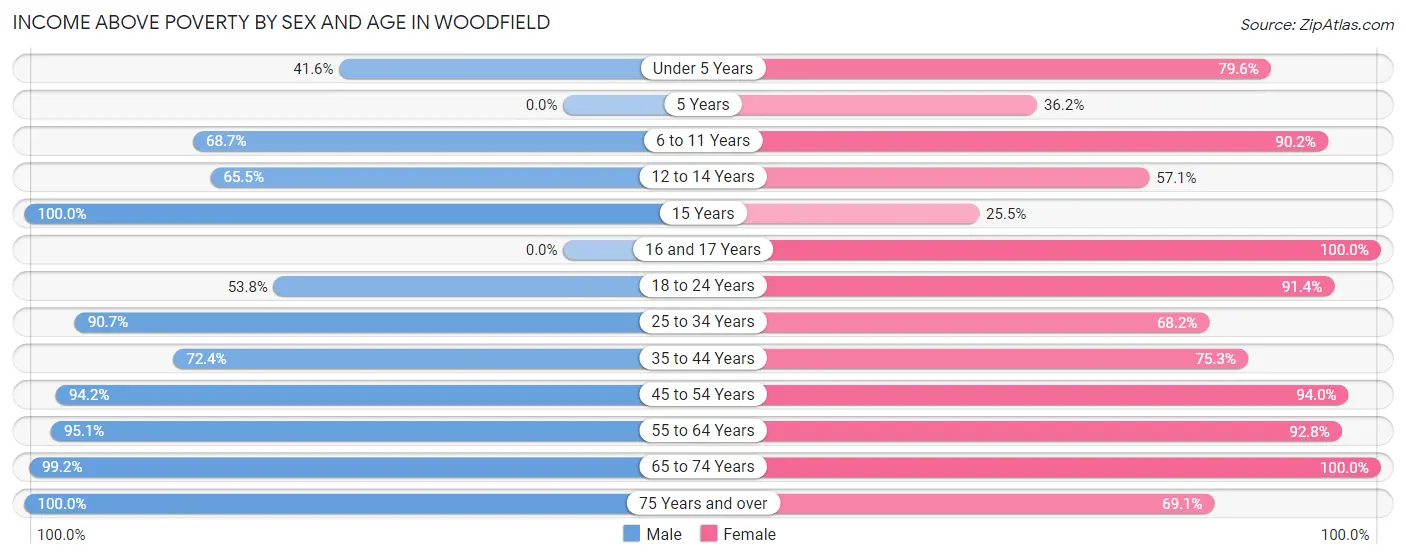
| Age Bracket | Male | Female |
| Under 5 Years | 126 (41.6%) | 156 (79.6%) |
| 5 Years | 0 (0.0%) | 25 (36.2%) |
| 6 to 11 Years | 424 (68.7%) | 312 (90.2%) |
| 12 to 14 Years | 74 (65.5%) | 141 (57.1%) |
| 15 Years | 67 (100.0%) | 51 (25.5%) |
| 16 and 17 Years | 0 (0.0%) | 52 (100.0%) |
| 18 to 24 Years | 293 (53.8%) | 317 (91.3%) |
| 25 to 34 Years | 651 (90.7%) | 358 (68.2%) |
| 35 to 44 Years | 388 (72.4%) | 559 (75.3%) |
| 45 to 54 Years | 451 (94.2%) | 710 (94.0%) |
| 55 to 64 Years | 408 (95.1%) | 410 (92.8%) |
| 65 to 74 Years | 243 (99.2%) | 572 (100.0%) |
| 75 Years and over | 279 (100.0%) | 242 (69.1%) |
| Total | 3,404 (75.8%) | 3,905 (80.6%) |
Income Below Poverty Among Married-Couple Families in Woodfield
The poverty statistics for married-couple families in Woodfield show that 0.8% or 8 of the total 1,056 families live below the poverty line. Families with no children have the highest poverty rate of 1.1%, comprising of 8 families. On the other hand, families with 1 or 2 children have the lowest poverty rate of 0.0%, which includes 0 families.
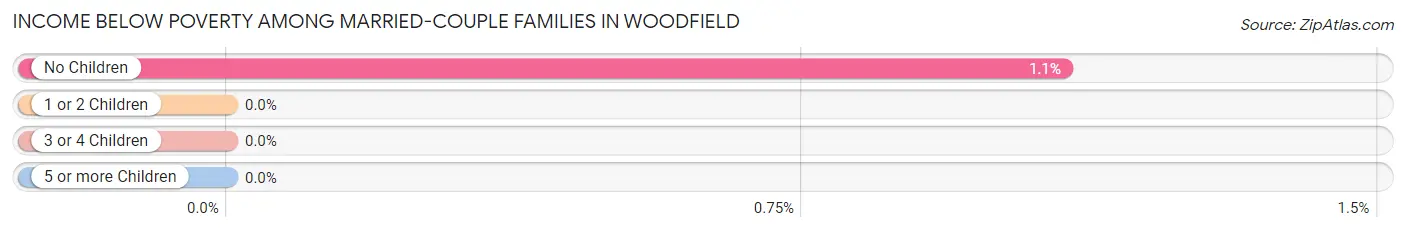
| Children | Above Poverty | Below Poverty |
| No Children | 726 (98.9%) | 8 (1.1%) |
| 1 or 2 Children | 322 (100.0%) | 0 (0.0%) |
| 3 or 4 Children | 0 (0.0%) | 0 (0.0%) |
| 5 or more Children | 0 (0.0%) | 0 (0.0%) |
| Total | 1,048 (99.2%) | 8 (0.8%) |
Income Below Poverty Among Single-Parent Households in Woodfield
According to the poverty data in Woodfield, 30.8% or 128 single-father households and 21.9% or 233 single-mother households are living below the poverty line. Among single-father households, those with 3 or 4 children have the highest poverty rate, with 61 households (56.0%) experiencing poverty. Likewise, among single-mother households, those with 3 or 4 children have the highest poverty rate, with 13 households (46.4%) falling below the poverty line.
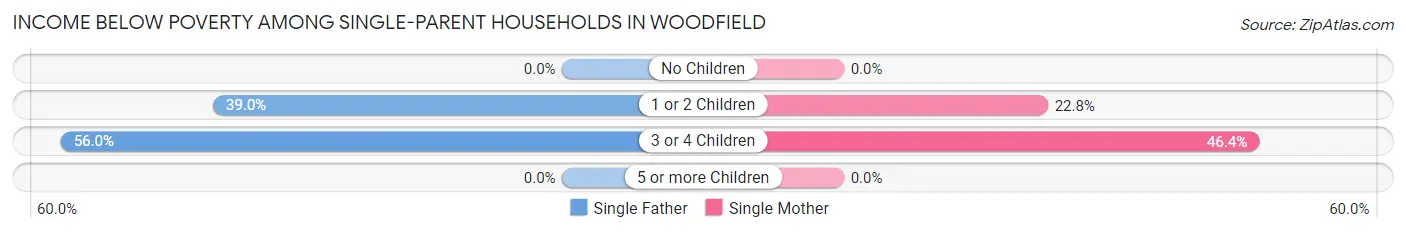
| Children | Single Father | Single Mother |
| No Children | 0 (0.0%) | 0 (0.0%) |
| 1 or 2 Children | 67 (39.0%) | 220 (22.8%) |
| 3 or 4 Children | 61 (56.0%) | 13 (46.4%) |
| 5 or more Children | 0 (0.0%) | 0 (0.0%) |
| Total | 128 (30.8%) | 233 (21.9%) |
Income Below Poverty Among Married-Couple vs Single-Parent Households in Woodfield
The poverty data for Woodfield shows that 8 of the married-couple family households (0.8%) and 361 of the single-parent households (24.4%) are living below the poverty level. Within the married-couple family households, those with no children have the highest poverty rate, with 8 households (1.1%) falling below the poverty line. Among the single-parent households, those with 3 or 4 children have the highest poverty rate, with 74 household (54.0%) living below poverty.
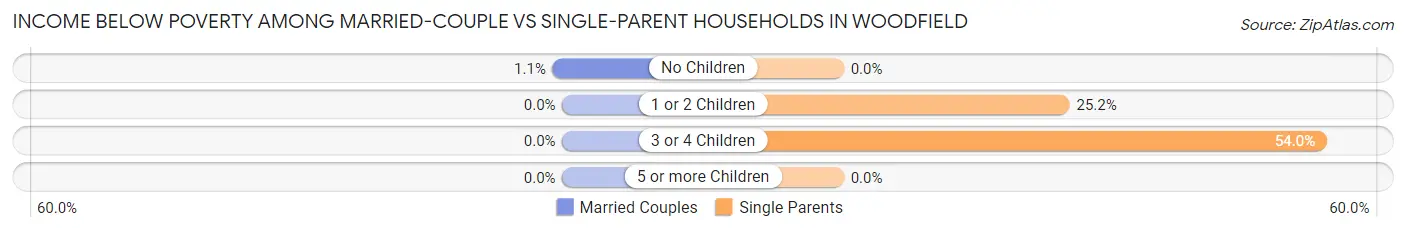
| Children | Married-Couple Families | Single-Parent Households |
| No Children | 8 (1.1%) | 0 (0.0%) |
| 1 or 2 Children | 0 (0.0%) | 287 (25.2%) |
| 3 or 4 Children | 0 (0.0%) | 74 (54.0%) |
| 5 or more Children | 0 (0.0%) | 0 (0.0%) |
| Total | 8 (0.8%) | 361 (24.4%) |
Race in Woodfield
The most populous races in Woodfield are Black / African American (5,685 | 60.1%), Hispanic or Latino (1,933 | 20.4%), and White / Caucasian (1,608 | 17.0%).
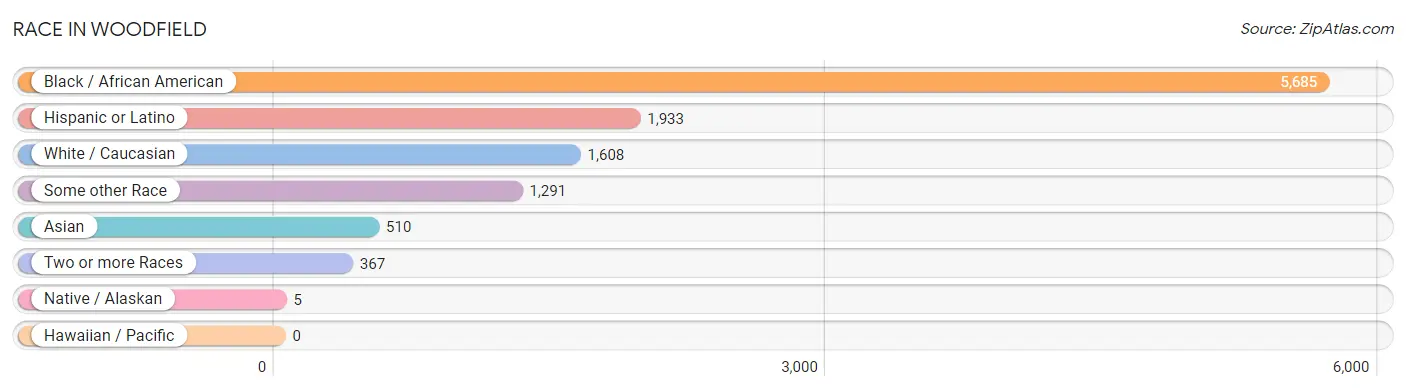
| Race | # Population | % Population |
| Asian | 510 | 5.4% |
| Black / African American | 5,685 | 60.1% |
| Hawaiian / Pacific | 0 | 0.0% |
| Hispanic or Latino | 1,933 | 20.4% |
| Native / Alaskan | 5 | 0.1% |
| White / Caucasian | 1,608 | 17.0% |
| Two or more Races | 367 | 3.9% |
| Some other Race | 1,291 | 13.6% |
| Total | 9,466 | 100.0% |
Ancestry in Woodfield
The most populous ancestries reported in Woodfield are Mexican (1,222 | 12.9%), West Indian (302 | 3.2%), Burmese (283 | 3.0%), English (275 | 2.9%), and Puerto Rican (243 | 2.6%), together accounting for 24.6% of all Woodfield residents.
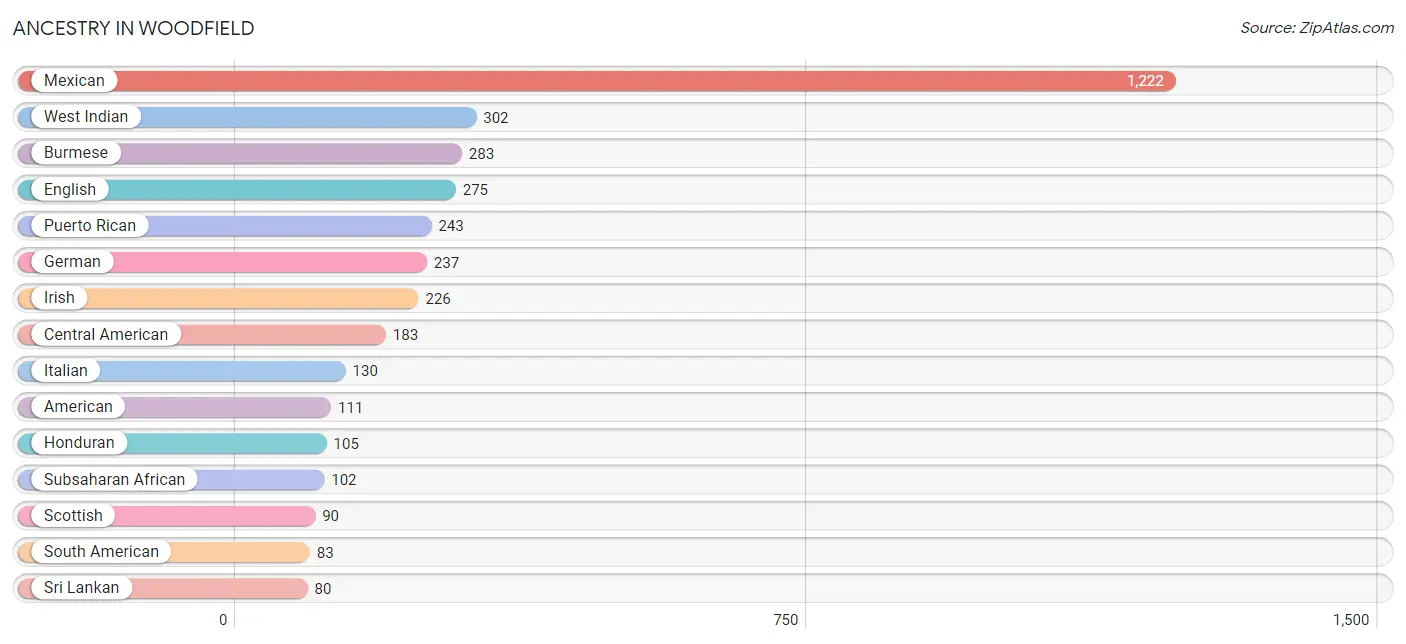
| Ancestry | # Population | % Population |
| African | 75 | 0.8% |
| American | 111 | 1.2% |
| Bahamian | 6 | 0.1% |
| Belizean | 5 | 0.1% |
| Bhutanese | 71 | 0.7% |
| Blackfeet | 4 | 0.0% |
| Burmese | 283 | 3.0% |
| Central American | 183 | 1.9% |
| Central American Indian | 5 | 0.1% |
| Colombian | 32 | 0.3% |
| Czech | 17 | 0.2% |
| English | 275 | 2.9% |
| Ethiopian | 1 | 0.0% |
| European | 57 | 0.6% |
| French | 58 | 0.6% |
| French Canadian | 24 | 0.3% |
| German | 237 | 2.5% |
| Guamanian / Chamorro | 49 | 0.5% |
| Honduran | 105 | 1.1% |
| Hungarian | 17 | 0.2% |
| Irish | 226 | 2.4% |
| Italian | 130 | 1.4% |
| Jamaican | 12 | 0.1% |
| Korean | 53 | 0.6% |
| Mexican | 1,222 | 12.9% |
| Panamanian | 78 | 0.8% |
| Pennsylvania German | 8 | 0.1% |
| Polish | 12 | 0.1% |
| Portuguese | 10 | 0.1% |
| Puerto Rican | 243 | 2.6% |
| Scotch-Irish | 27 | 0.3% |
| Scottish | 90 | 0.9% |
| Seminole | 13 | 0.1% |
| Slavic | 75 | 0.8% |
| South African | 15 | 0.2% |
| South American | 83 | 0.9% |
| Sri Lankan | 80 | 0.9% |
| Subsaharan African | 102 | 1.1% |
| Swiss | 27 | 0.3% |
| Venezuelan | 51 | 0.5% |
| Welsh | 8 | 0.1% |
| West Indian | 302 | 3.2% | View All 42 Rows |
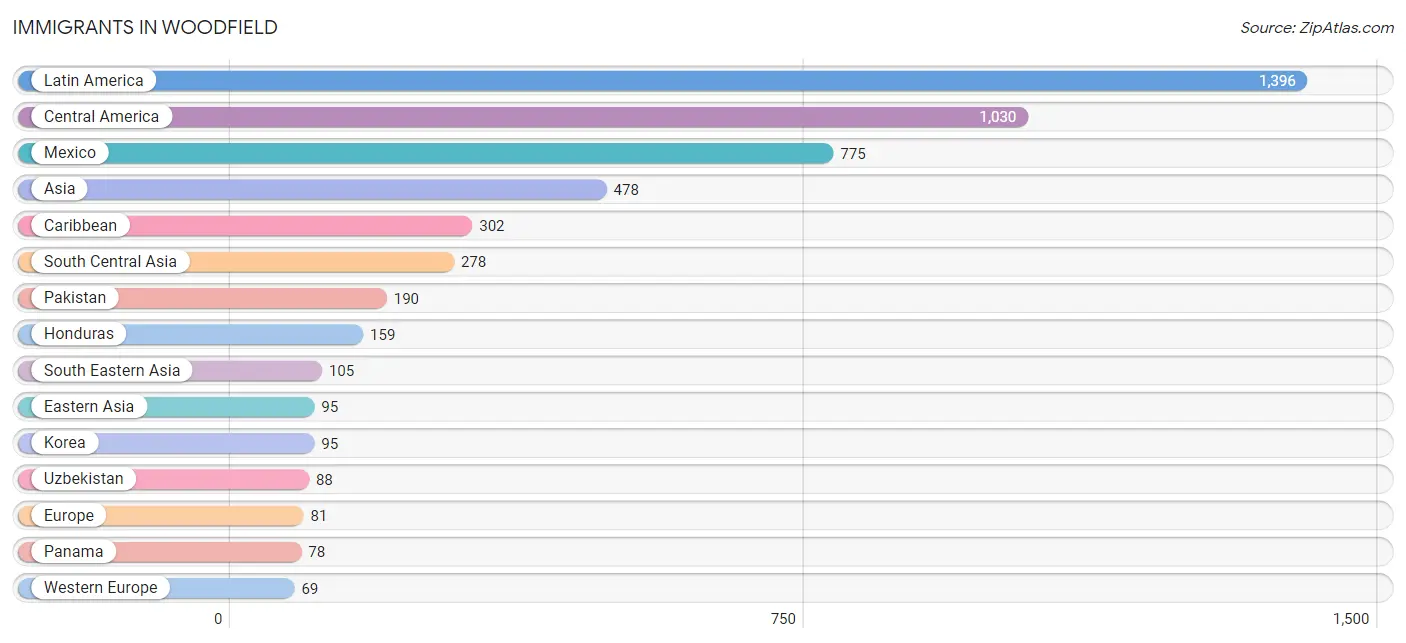
Immigrants in Woodfield
The most numerous immigrant groups reported in Woodfield came from Latin America (1,396 | 14.7%), Central America (1,030 | 10.9%), Mexico (775 | 8.2%), Asia (478 | 5.1%), and Caribbean (302 | 3.2%), together accounting for 42.1% of all Woodfield residents.
| Immigration Origin | # Population | % Population |
| Africa | 1 | 0.0% |
| Asia | 478 | 5.1% |
| Belize | 5 | 0.1% |
| Caribbean | 302 | 3.2% |
| Central America | 1,030 | 10.9% |
| Colombia | 13 | 0.1% |
| Eastern Africa | 1 | 0.0% |
| Eastern Asia | 95 | 1.0% |
| England | 12 | 0.1% |
| Ethiopia | 1 | 0.0% |
| Europe | 81 | 0.9% |
| France | 9 | 0.1% |
| Germany | 60 | 0.6% |
| Guatemala | 13 | 0.1% |
| Honduras | 159 | 1.7% |
| Korea | 95 | 1.0% |
| Latin America | 1,396 | 14.7% |
| Mexico | 775 | 8.2% |
| Northern Europe | 12 | 0.1% |
| Pakistan | 190 | 2.0% |
| Panama | 78 | 0.8% |
| Philippines | 44 | 0.5% |
| Singapore | 7 | 0.1% |
| South America | 64 | 0.7% |
| South Central Asia | 278 | 2.9% |
| South Eastern Asia | 105 | 1.1% |
| Uzbekistan | 88 | 0.9% |
| Venezuela | 51 | 0.5% |
| Vietnam | 54 | 0.6% |
| Western Europe | 69 | 0.7% | View All 30 Rows |
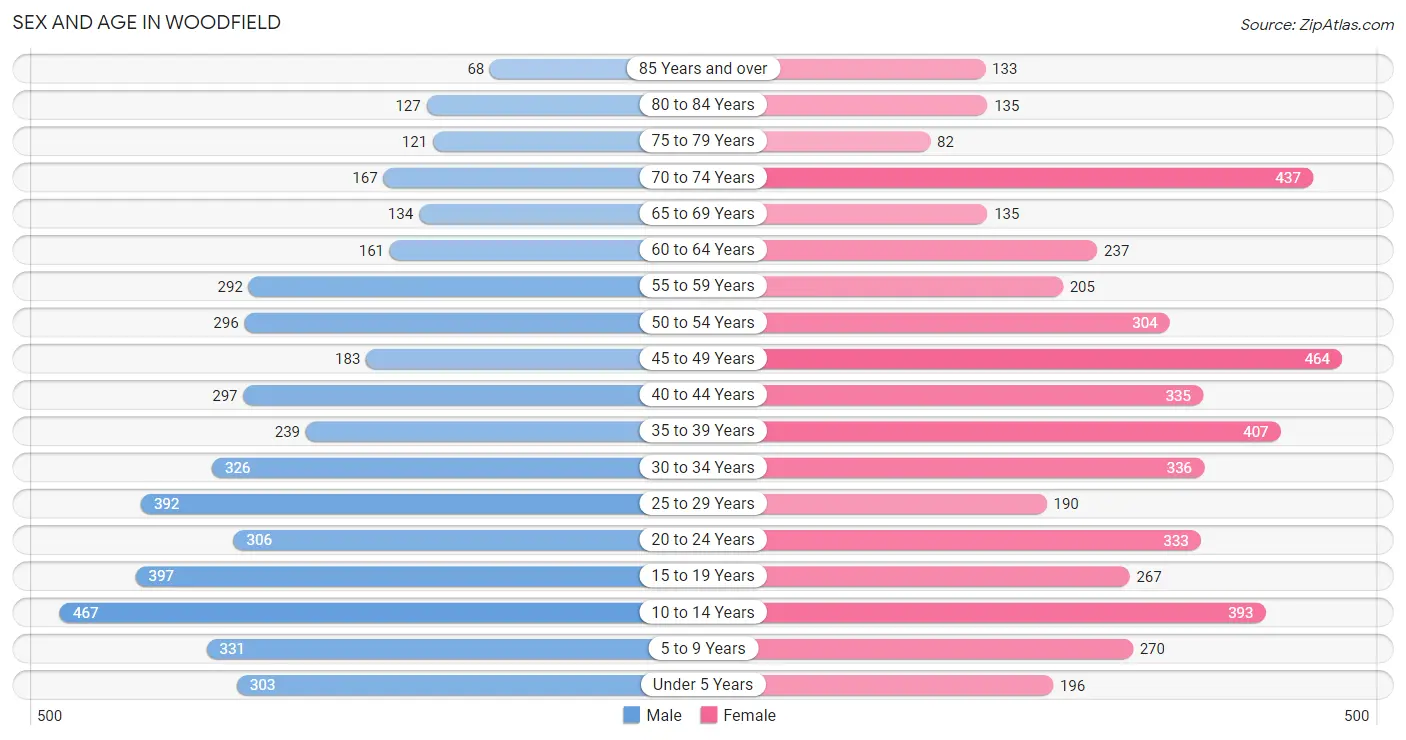
Sex and Age in Woodfield
Sex and Age in Woodfield
The most populous age groups in Woodfield are 10 to 14 Years (467 | 10.1%) for men and 45 to 49 Years (464 | 9.6%) for women.
| Age Bracket | Male | Female |
| Under 5 Years | 303 (6.6%) | 196 (4.0%) |
| 5 to 9 Years | 331 (7.2%) | 270 (5.6%) |
| 10 to 14 Years | 467 (10.1%) | 393 (8.1%) |
| 15 to 19 Years | 397 (8.6%) | 267 (5.5%) |
| 20 to 24 Years | 306 (6.6%) | 333 (6.9%) |
| 25 to 29 Years | 392 (8.5%) | 190 (3.9%) |
| 30 to 34 Years | 326 (7.1%) | 336 (6.9%) |
| 35 to 39 Years | 239 (5.2%) | 407 (8.4%) |
| 40 to 44 Years | 297 (6.5%) | 335 (6.9%) |
| 45 to 49 Years | 183 (4.0%) | 464 (9.6%) |
| 50 to 54 Years | 296 (6.4%) | 304 (6.3%) |
| 55 to 59 Years | 292 (6.3%) | 205 (4.2%) |
| 60 to 64 Years | 161 (3.5%) | 237 (4.9%) |
| 65 to 69 Years | 134 (2.9%) | 135 (2.8%) |
| 70 to 74 Years | 167 (3.6%) | 437 (9.0%) |
| 75 to 79 Years | 121 (2.6%) | 82 (1.7%) |
| 80 to 84 Years | 127 (2.8%) | 135 (2.8%) |
| 85 Years and over | 68 (1.5%) | 133 (2.7%) |
| Total | 4,607 (100.0%) | 4,859 (100.0%) |
Families and Households in Woodfield
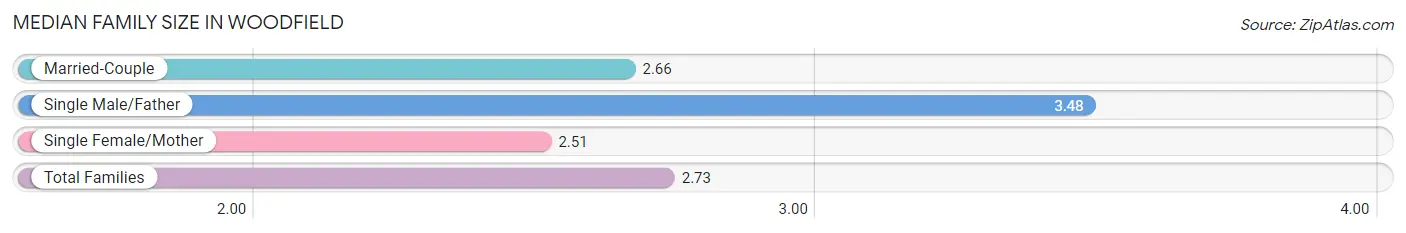
Median Family Size in Woodfield
The median family size in Woodfield is 2.73 persons per family, with single male/father families (416 | 16.4%) accounting for the largest median family size of 3.48 persons per family. On the other hand, single female/mother families (1,066 | 42.0%) represent the smallest median family size with 2.51 persons per family.
| Family Type | # Families | Family Size |
| Married-Couple | 1,056 (41.6%) | 2.66 |
| Single Male/Father | 416 (16.4%) | 3.48 |
| Single Female/Mother | 1,066 (42.0%) | 2.51 |
| Total Families | 2,538 (100.0%) | 2.73 |
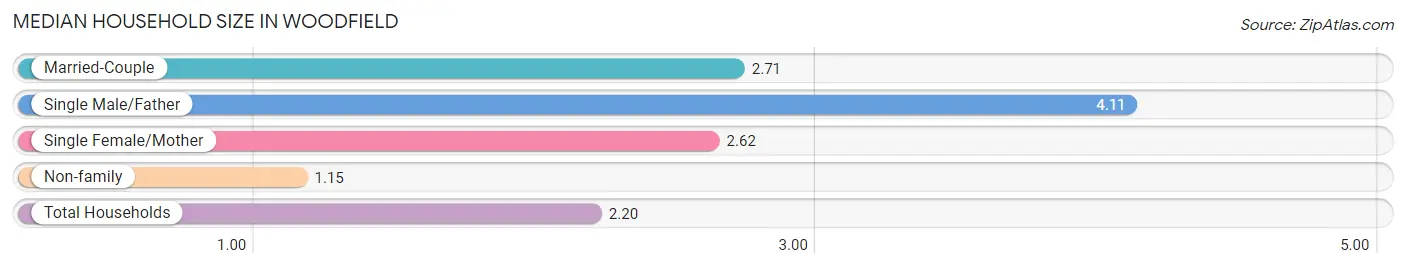
Median Household Size in Woodfield
The median household size in Woodfield is 2.20 persons per household, with single male/father households (416 | 9.8%) accounting for the largest median household size of 4.11 persons per household. non-family households (1,704 | 40.2%) represent the smallest median household size with 1.15 persons per household.
| Household Type | # Households | Household Size |
| Married-Couple | 1,056 (24.9%) | 2.71 |
| Single Male/Father | 416 (9.8%) | 4.11 |
| Single Female/Mother | 1,066 (25.1%) | 2.62 |
| Non-family | 1,704 (40.2%) | 1.15 |
| Total Households | 4,242 (100.0%) | 2.20 |
Household Size by Marriage Status in Woodfield
Out of a total of 4,242 households in Woodfield, 2,538 (59.8%) are family households, while 1,704 (40.2%) are nonfamily households. The most numerous type of family households are 2-person households, comprising 1,346, and the most common type of nonfamily households are 1-person households, comprising 1,498.
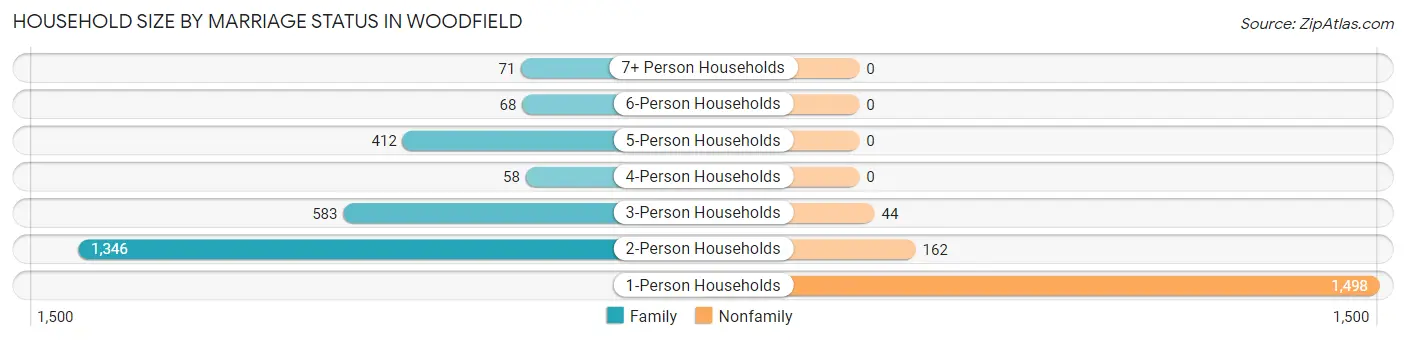
| Household Size | Family Households | Nonfamily Households |
| 1-Person Households | - | 1,498 (35.3%) |
| 2-Person Households | 1,346 (31.7%) | 162 (3.8%) |
| 3-Person Households | 583 (13.7%) | 44 (1.0%) |
| 4-Person Households | 58 (1.4%) | 0 (0.0%) |
| 5-Person Households | 412 (9.7%) | 0 (0.0%) |
| 6-Person Households | 68 (1.6%) | 0 (0.0%) |
| 7+ Person Households | 71 (1.7%) | 0 (0.0%) |
| Total | 2,538 (59.8%) | 1,704 (40.2%) |
Female Fertility in Woodfield
Fertility by Age in Woodfield
Average fertility rate in Woodfield is 11.0 births per 1,000 women. Women in the age bracket of 20 to 34 years have the highest fertility rate with 13.0 births per 1,000 women. Women in the age bracket of 35 to 50 years acount for 56.0% of all women with births.
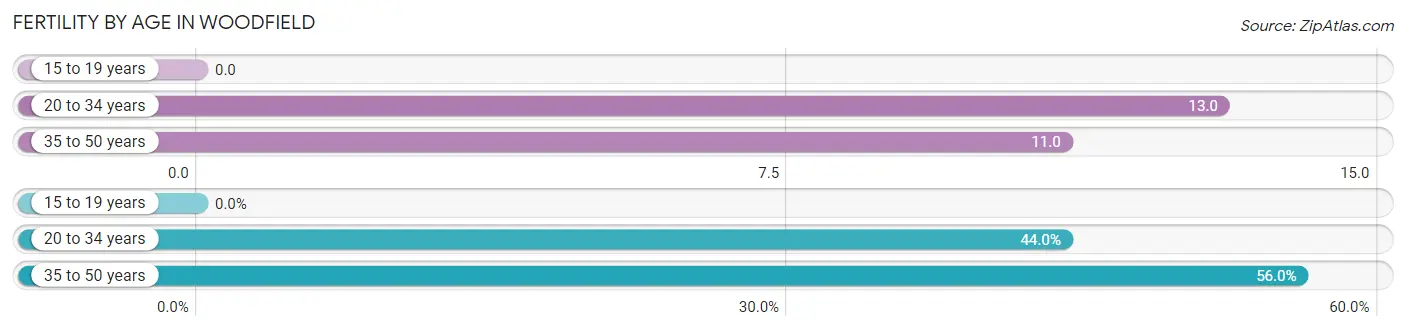
| Age Bracket | Women with Births | Births / 1,000 Women |
| 15 to 19 years | 0 (0.0%) | 0.0 |
| 20 to 34 years | 11 (44.0%) | 13.0 |
| 35 to 50 years | 14 (56.0%) | 11.0 |
| Total | 25 (100.0%) | 11.0 |
Fertility by Age by Marriage Status in Woodfield
56.0% of women with births (25) in Woodfield are married. The highest percentage of unmarried women with births falls into 20 to 34 years age bracket with 100.0% of them unmarried at the time of birth, while the lowest percentage of unmarried women with births belong to 35 to 50 years age bracket with 0.0% of them unmarried.
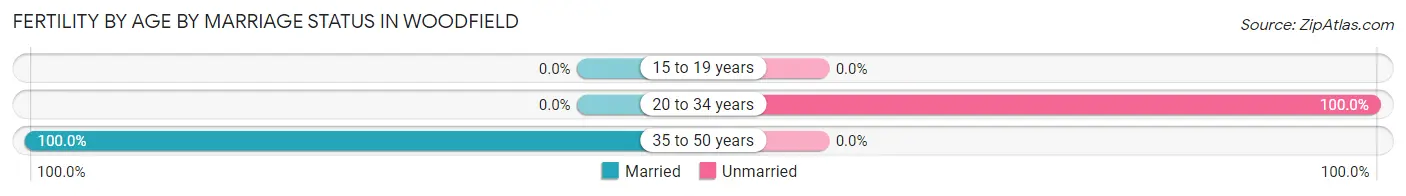
| Age Bracket | Married | Unmarried |
| 15 to 19 years | 0 (0.0%) | 0 (0.0%) |
| 20 to 34 years | 0 (0.0%) | 11 (100.0%) |
| 35 to 50 years | 14 (100.0%) | 0 (0.0%) |
| Total | 14 (56.0%) | 11 (44.0%) |
Fertility by Education in Woodfield
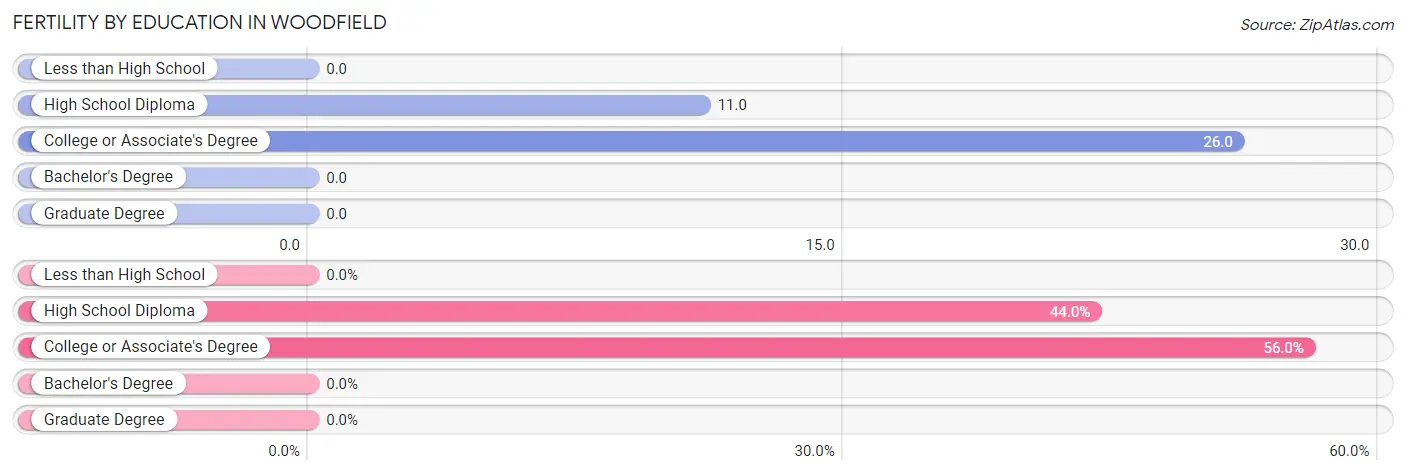
| Educational Attainment | Women with Births | Births / 1,000 Women |
| Less than High School | 0 (0.0%) | 0.0 |
| High School Diploma | 11 (44.0%) | 11.0 |
| College or Associate's Degree | 14 (56.0%) | 26.0 |
| Bachelor's Degree | 0 (0.0%) | 0.0 |
| Graduate Degree | 0 (0.0%) | 0.0 |
| Total | 25 (100.0%) | 11.0 |
Fertility by Education by Marriage Status in Woodfield
44.0% of women with births in Woodfield are unmarried. Women with the educational attainment of college or associate's degree are most likely to be married with 100.0% of them married at childbirth, while women with the educational attainment of high school diploma are least likely to be married with 100.0% of them unmarried at childbirth.
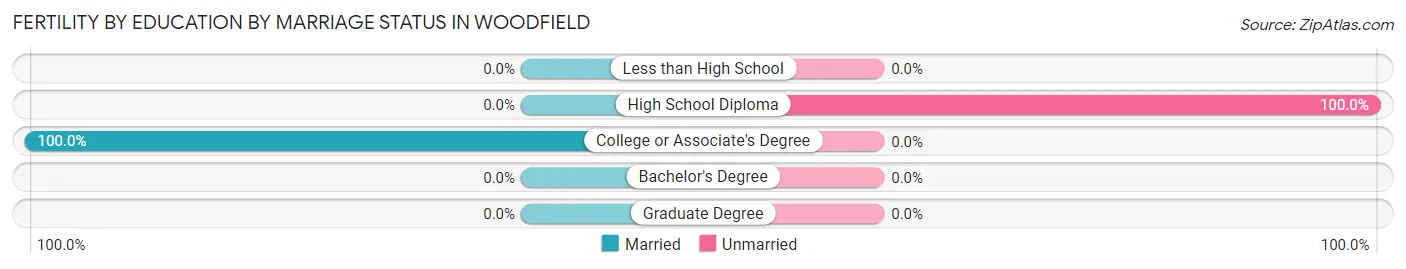
| Educational Attainment | Married | Unmarried |
| Less than High School | 0 (0.0%) | 0 (0.0%) |
| High School Diploma | 0 (0.0%) | 11 (100.0%) |
| College or Associate's Degree | 14 (100.0%) | 0 (0.0%) |
| Bachelor's Degree | 0 (0.0%) | 0 (0.0%) |
| Graduate Degree | 0 (0.0%) | 0 (0.0%) |
| Total | 14 (56.0%) | 11 (44.0%) |
Employment Characteristics in Woodfield
Employment by Class of Employer in Woodfield
Among the 4,345 employed individuals in Woodfield, private company employees (2,755 | 63.4%), not-for-profit organizations (369 | 8.5%), and state government employees (337 | 7.8%) make up the most common classes of employment.
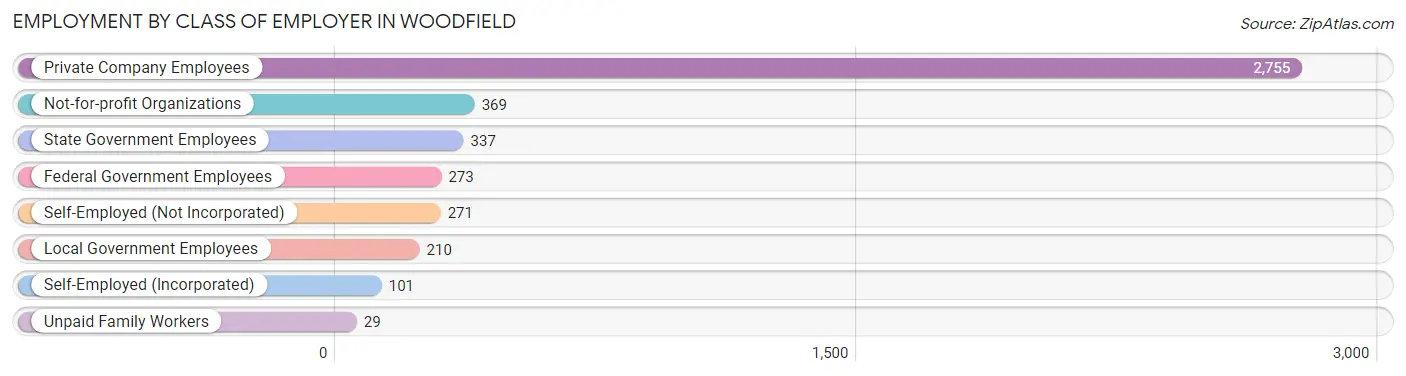
| Employer Class | # Employees | % Employees |
| Private Company Employees | 2,755 | 63.4% |
| Self-Employed (Incorporated) | 101 | 2.3% |
| Self-Employed (Not Incorporated) | 271 | 6.2% |
| Not-for-profit Organizations | 369 | 8.5% |
| Local Government Employees | 210 | 4.8% |
| State Government Employees | 337 | 7.8% |
| Federal Government Employees | 273 | 6.3% |
| Unpaid Family Workers | 29 | 0.7% |
| Total | 4,345 | 100.0% |
Employment Status by Age in Woodfield
According to the labor force statistics for Woodfield, out of the total population over 16 years of age (7,239), 62.7% or 4,539 individuals are in the labor force, with 4.3% or 195 of them unemployed. The age group with the highest labor force participation rate is 20 to 24 years, with 83.4% or 533 individuals in the labor force. Within the labor force, the 20 to 24 years age range has the highest percentage of unemployed individuals, with 21.2% or 113 of them being unemployed.
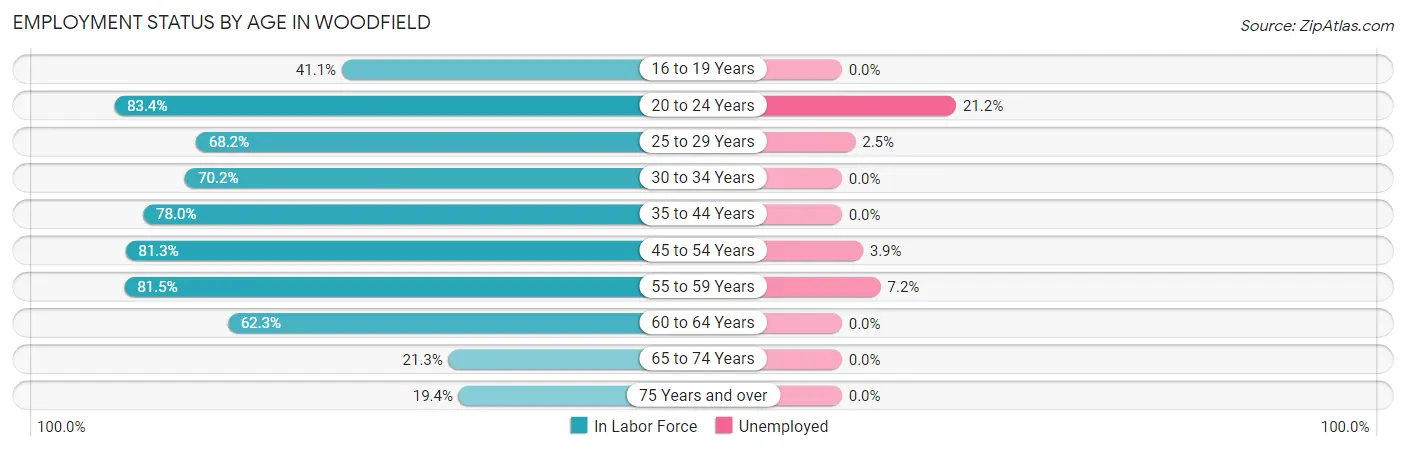
| Age Bracket | In Labor Force | Unemployed |
| 16 to 19 Years | 163 (41.1%) | 0 (0.0%) |
| 20 to 24 Years | 533 (83.4%) | 113 (21.2%) |
| 25 to 29 Years | 397 (68.2%) | 10 (2.5%) |
| 30 to 34 Years | 465 (70.2%) | 0 (0.0%) |
| 35 to 44 Years | 997 (78.0%) | 0 (0.0%) |
| 45 to 54 Years | 1,014 (81.3%) | 40 (3.9%) |
| 55 to 59 Years | 405 (81.5%) | 29 (7.2%) |
| 60 to 64 Years | 248 (62.3%) | 0 (0.0%) |
| 65 to 74 Years | 186 (21.3%) | 0 (0.0%) |
| 75 Years and over | 129 (19.4%) | 0 (0.0%) |
| Total | 4,539 (62.7%) | 195 (4.3%) |
Employment Status by Educational Attainment in Woodfield
According to labor force statistics for Woodfield, 75.6% of individuals (3,526) out of the total population between 25 and 64 years of age (4,664) are in the labor force, with 2.3% or 81 of them being unemployed. The group with the highest labor force participation rate are those with the educational attainment of bachelor's degree or higher, with 94.4% or 836 individuals in the labor force. Within the labor force, individuals with bachelor's degree or higher education have the highest percentage of unemployment, with 4.8% or 40 of them being unemployed.
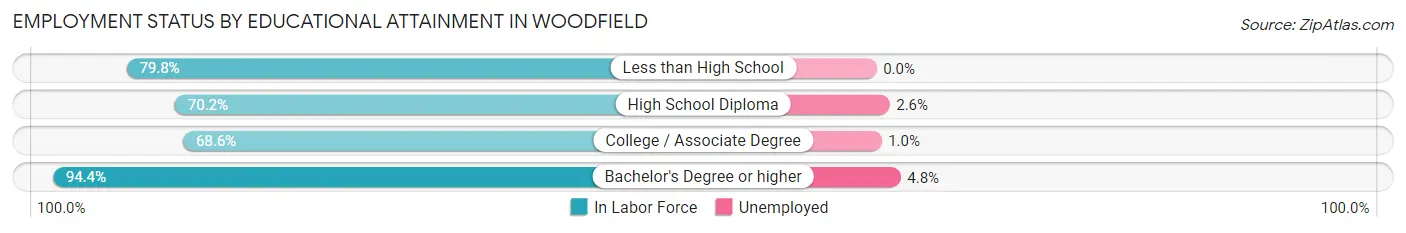
| Educational Attainment | In Labor Force | Unemployed |
| Less than High School | 514 (79.8%) | 0 (0.0%) |
| High School Diploma | 1,132 (70.2%) | 42 (2.6%) |
| College / Associate Degree | 1,043 (68.6%) | 15 (1.0%) |
| Bachelor's Degree or higher | 836 (94.4%) | 43 (4.8%) |
| Total | 3,526 (75.6%) | 107 (2.3%) |
Employment Occupations by Sex in Woodfield
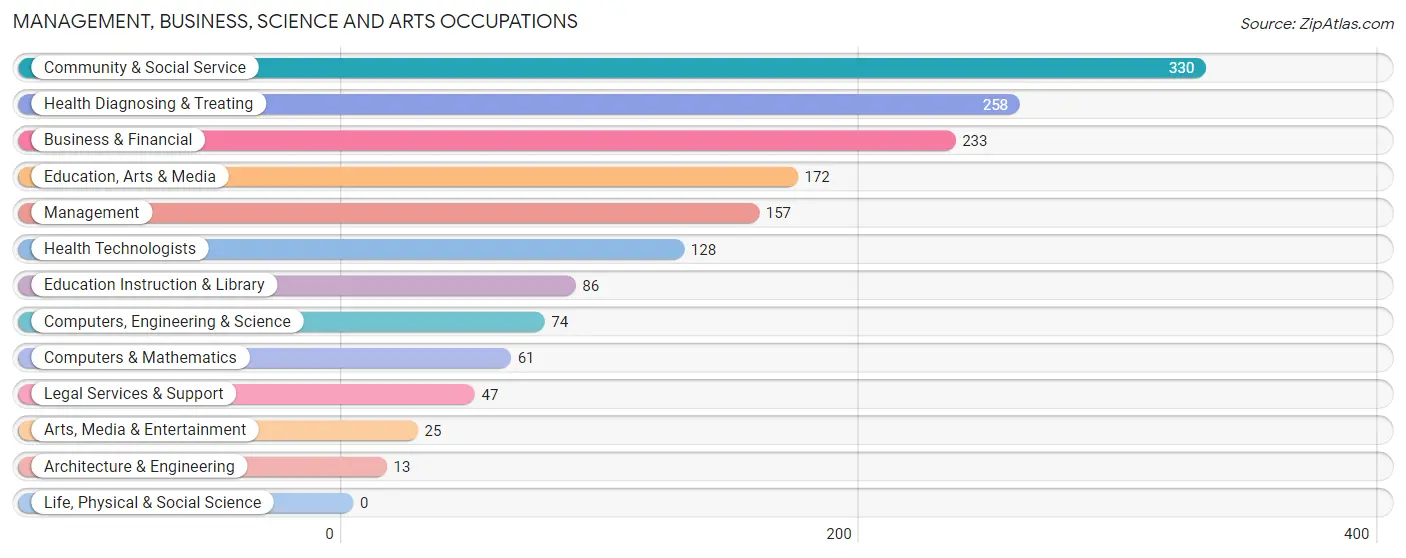
Management, Business, Science and Arts Occupations
The most common Management, Business, Science and Arts occupations in Woodfield are Community & Social Service (330 | 7.6%), Health Diagnosing & Treating (258 | 6.0%), Business & Financial (233 | 5.4%), Education, Arts & Media (172 | 4.0%), and Management (157 | 3.6%).
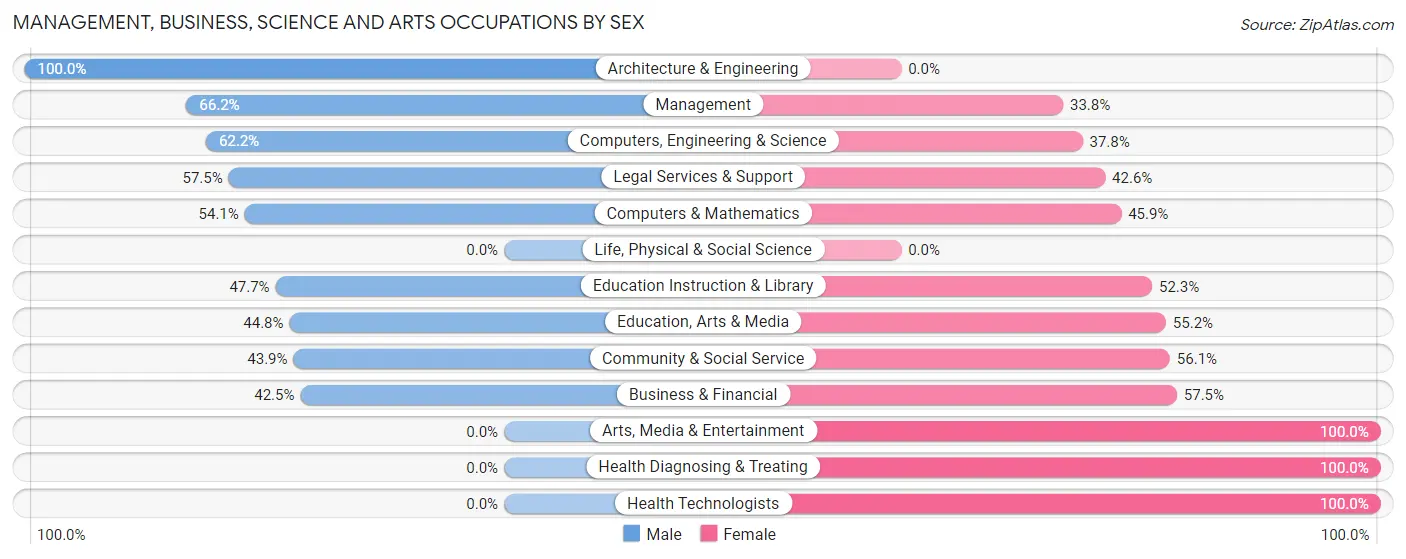
Management, Business, Science and Arts Occupations by Sex
Within the Management, Business, Science and Arts occupations in Woodfield, the most male-oriented occupations are Architecture & Engineering (100.0%), Management (66.2%), and Computers, Engineering & Science (62.2%), while the most female-oriented occupations are Arts, Media & Entertainment (100.0%), Health Diagnosing & Treating (100.0%), and Health Technologists (100.0%).
| Occupation | Male | Female |
| Management | 104 (66.2%) | 53 (33.8%) |
| Business & Financial | 99 (42.5%) | 134 (57.5%) |
| Computers, Engineering & Science | 46 (62.2%) | 28 (37.8%) |
| Computers & Mathematics | 33 (54.1%) | 28 (45.9%) |
| Architecture & Engineering | 13 (100.0%) | 0 (0.0%) |
| Life, Physical & Social Science | 0 (0.0%) | 0 (0.0%) |
| Community & Social Service | 145 (43.9%) | 185 (56.1%) |
| Education, Arts & Media | 77 (44.8%) | 95 (55.2%) |
| Legal Services & Support | 27 (57.5%) | 20 (42.5%) |
| Education Instruction & Library | 41 (47.7%) | 45 (52.3%) |
| Arts, Media & Entertainment | 0 (0.0%) | 25 (100.0%) |
| Health Diagnosing & Treating | 0 (0.0%) | 258 (100.0%) |
| Health Technologists | 0 (0.0%) | 128 (100.0%) |
| Total (Category) | 394 (37.4%) | 658 (62.5%) |
| Total (Overall) | 2,053 (47.5%) | 2,267 (52.5%) |
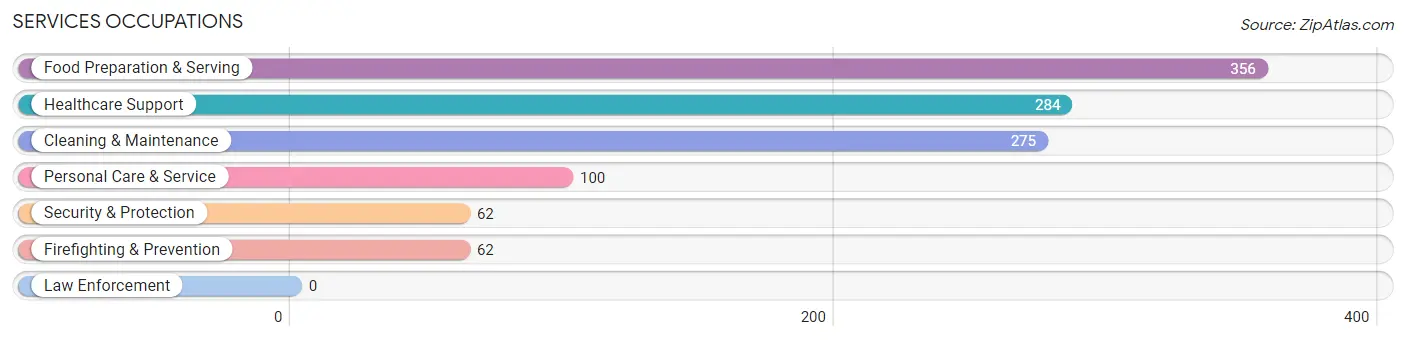
Services Occupations
The most common Services occupations in Woodfield are Food Preparation & Serving (356 | 8.2%), Healthcare Support (284 | 6.6%), Cleaning & Maintenance (275 | 6.4%), Personal Care & Service (100 | 2.3%), and Security & Protection (62 | 1.4%).
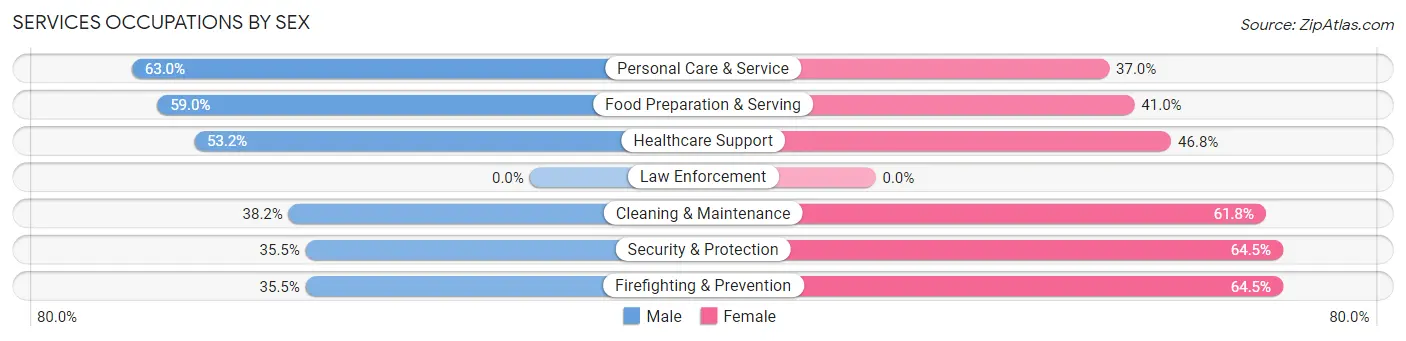
Services Occupations by Sex
Within the Services occupations in Woodfield, the most male-oriented occupations are Personal Care & Service (63.0%), Food Preparation & Serving (59.0%), and Healthcare Support (53.2%), while the most female-oriented occupations are Security & Protection (64.5%), Firefighting & Prevention (64.5%), and Cleaning & Maintenance (61.8%).
| Occupation | Male | Female |
| Healthcare Support | 151 (53.2%) | 133 (46.8%) |
| Security & Protection | 22 (35.5%) | 40 (64.5%) |
| Firefighting & Prevention | 22 (35.5%) | 40 (64.5%) |
| Law Enforcement | 0 (0.0%) | 0 (0.0%) |
| Food Preparation & Serving | 210 (59.0%) | 146 (41.0%) |
| Cleaning & Maintenance | 105 (38.2%) | 170 (61.8%) |
| Personal Care & Service | 63 (63.0%) | 37 (37.0%) |
| Total (Category) | 551 (51.2%) | 526 (48.8%) |
| Total (Overall) | 2,053 (47.5%) | 2,267 (52.5%) |
Sales and Office Occupations
The most common Sales and Office occupations in Woodfield are Office & Administration (820 | 19.0%), and Sales & Related (291 | 6.7%).
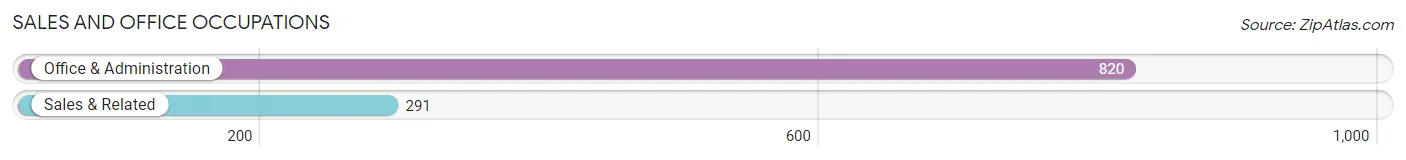
Sales and Office Occupations by Sex
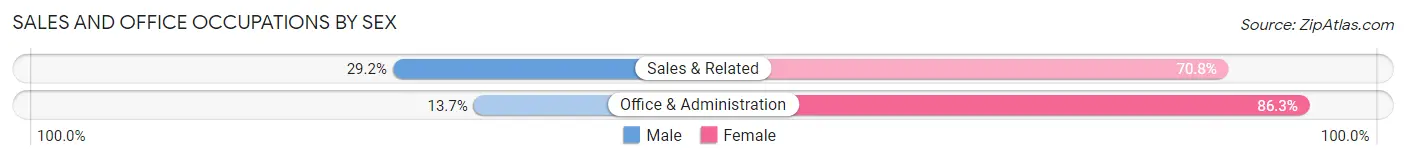
| Occupation | Male | Female |
| Sales & Related | 85 (29.2%) | 206 (70.8%) |
| Office & Administration | 112 (13.7%) | 708 (86.3%) |
| Total (Category) | 197 (17.7%) | 914 (82.3%) |
| Total (Overall) | 2,053 (47.5%) | 2,267 (52.5%) |
Natural Resources, Construction and Maintenance Occupations
The most common Natural Resources, Construction and Maintenance occupations in Woodfield are Construction & Extraction (271 | 6.3%), Installation, Maintenance & Repair (198 | 4.6%), and Farming, Fishing & Forestry (51 | 1.2%).
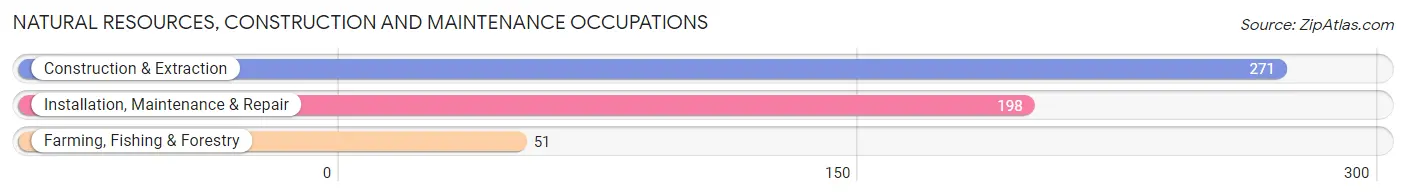
Natural Resources, Construction and Maintenance Occupations by Sex
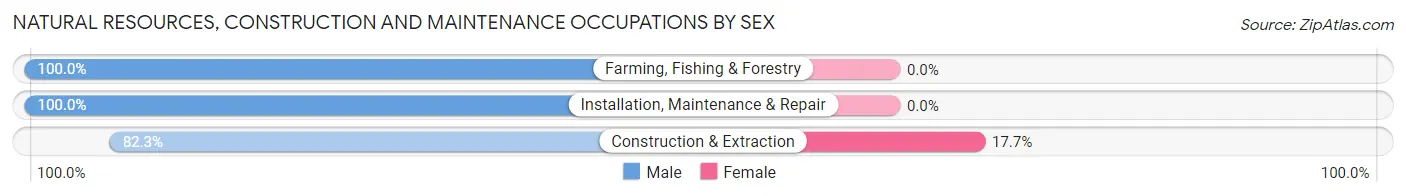
| Occupation | Male | Female |
| Farming, Fishing & Forestry | 51 (100.0%) | 0 (0.0%) |
| Construction & Extraction | 223 (82.3%) | 48 (17.7%) |
| Installation, Maintenance & Repair | 198 (100.0%) | 0 (0.0%) |
| Total (Category) | 472 (90.8%) | 48 (9.2%) |
| Total (Overall) | 2,053 (47.5%) | 2,267 (52.5%) |
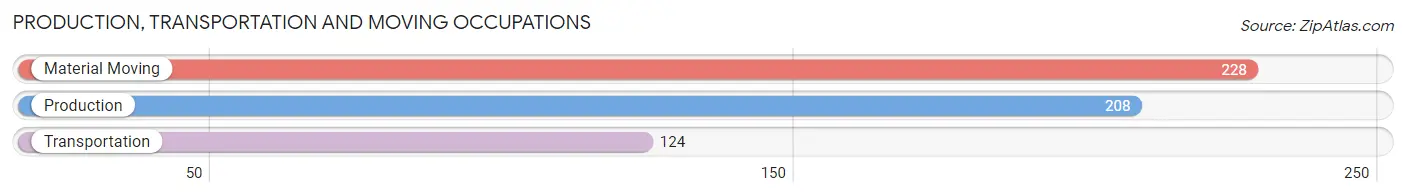
Production, Transportation and Moving Occupations
The most common Production, Transportation and Moving occupations in Woodfield are Material Moving (228 | 5.3%), Production (208 | 4.8%), and Transportation (124 | 2.9%).
Production, Transportation and Moving Occupations by Sex
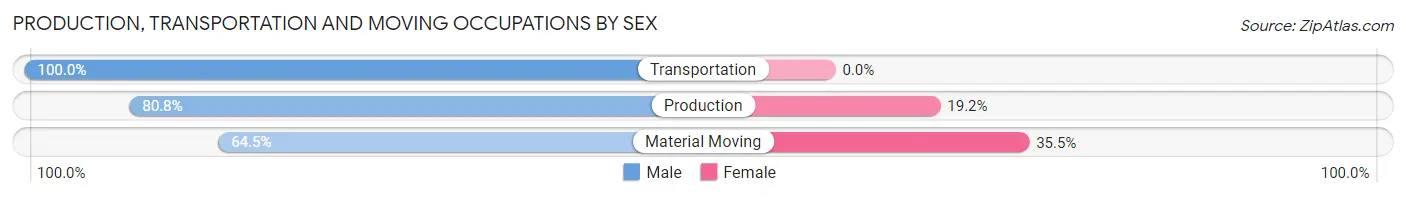
| Occupation | Male | Female |
| Production | 168 (80.8%) | 40 (19.2%) |
| Transportation | 124 (100.0%) | 0 (0.0%) |
| Material Moving | 147 (64.5%) | 81 (35.5%) |
| Total (Category) | 439 (78.4%) | 121 (21.6%) |
| Total (Overall) | 2,053 (47.5%) | 2,267 (52.5%) |
Employment Industries by Sex in Woodfield
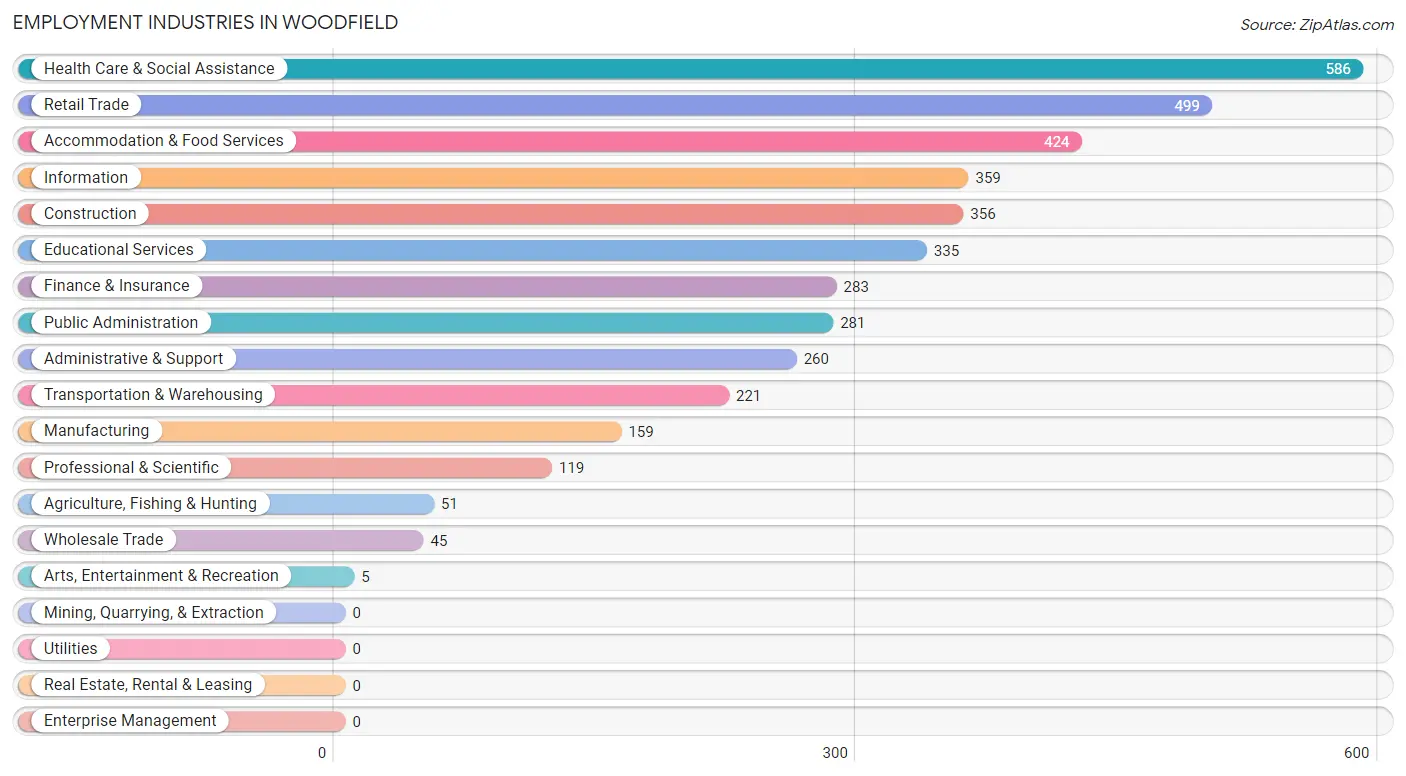
Employment Industries in Woodfield
The major employment industries in Woodfield include Health Care & Social Assistance (586 | 13.6%), Retail Trade (499 | 11.6%), Accommodation & Food Services (424 | 9.8%), Information (359 | 8.3%), and Construction (356 | 8.2%).
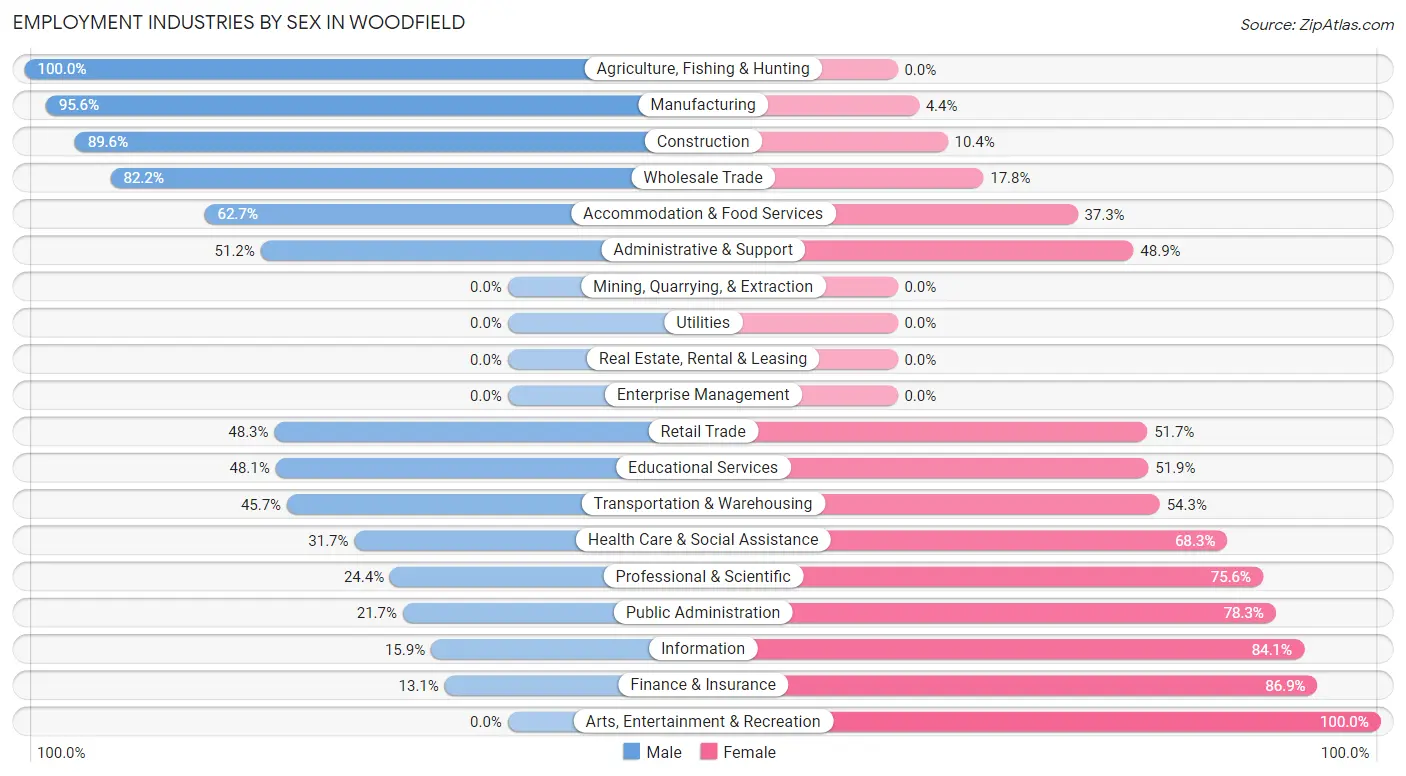
Employment Industries by Sex in Woodfield
The Woodfield industries that see more men than women are Agriculture, Fishing & Hunting (100.0%), Manufacturing (95.6%), and Construction (89.6%), whereas the industries that tend to have a higher number of women are Arts, Entertainment & Recreation (100.0%), Finance & Insurance (86.9%), and Information (84.1%).
| Industry | Male | Female |
| Agriculture, Fishing & Hunting | 51 (100.0%) | 0 (0.0%) |
| Mining, Quarrying, & Extraction | 0 (0.0%) | 0 (0.0%) |
| Construction | 319 (89.6%) | 37 (10.4%) |
| Manufacturing | 152 (95.6%) | 7 (4.4%) |
| Wholesale Trade | 37 (82.2%) | 8 (17.8%) |
| Retail Trade | 241 (48.3%) | 258 (51.7%) |
| Transportation & Warehousing | 101 (45.7%) | 120 (54.3%) |
| Utilities | 0 (0.0%) | 0 (0.0%) |
| Information | 57 (15.9%) | 302 (84.1%) |
| Finance & Insurance | 37 (13.1%) | 246 (86.9%) |
| Real Estate, Rental & Leasing | 0 (0.0%) | 0 (0.0%) |
| Professional & Scientific | 29 (24.4%) | 90 (75.6%) |
| Enterprise Management | 0 (0.0%) | 0 (0.0%) |
| Administrative & Support | 133 (51.1%) | 127 (48.8%) |
| Educational Services | 161 (48.1%) | 174 (51.9%) |
| Health Care & Social Assistance | 186 (31.7%) | 400 (68.3%) |
| Arts, Entertainment & Recreation | 0 (0.0%) | 5 (100.0%) |
| Accommodation & Food Services | 266 (62.7%) | 158 (37.3%) |
| Public Administration | 61 (21.7%) | 220 (78.3%) |
| Total | 2,053 (47.5%) | 2,267 (52.5%) |
Education in Woodfield
School Enrollment in Woodfield
The most common levels of schooling among the 2,802 students in Woodfield are middle school (827 | 29.5%), high school (518 | 18.5%), and elementary school (468 | 16.7%).
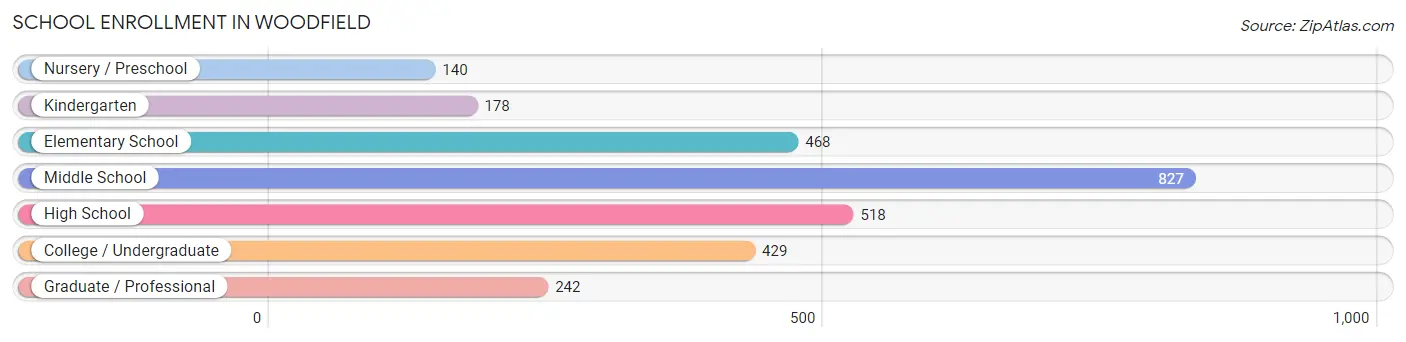
| School Level | # Students | % Students |
| Nursery / Preschool | 140 | 5.0% |
| Kindergarten | 178 | 6.4% |
| Elementary School | 468 | 16.7% |
| Middle School | 827 | 29.5% |
| High School | 518 | 18.5% |
| College / Undergraduate | 429 | 15.3% |
| Graduate / Professional | 242 | 8.6% |
| Total | 2,802 | 100.0% |
School Enrollment by Age by Funding Source in Woodfield
Out of a total of 2,802 students who are enrolled in schools in Woodfield, 238 (8.5%) attend a private institution, while the remaining 2,564 (91.5%) are enrolled in public schools. The age group of 3 to 4 year olds has the highest likelihood of being enrolled in private schools, with 79 (43.6% in the age bracket) enrolled. Conversely, the age group of 5 to 9 year old has the lowest likelihood of being enrolled in a private school, with 576 (100.0% in the age bracket) attending a public institution.
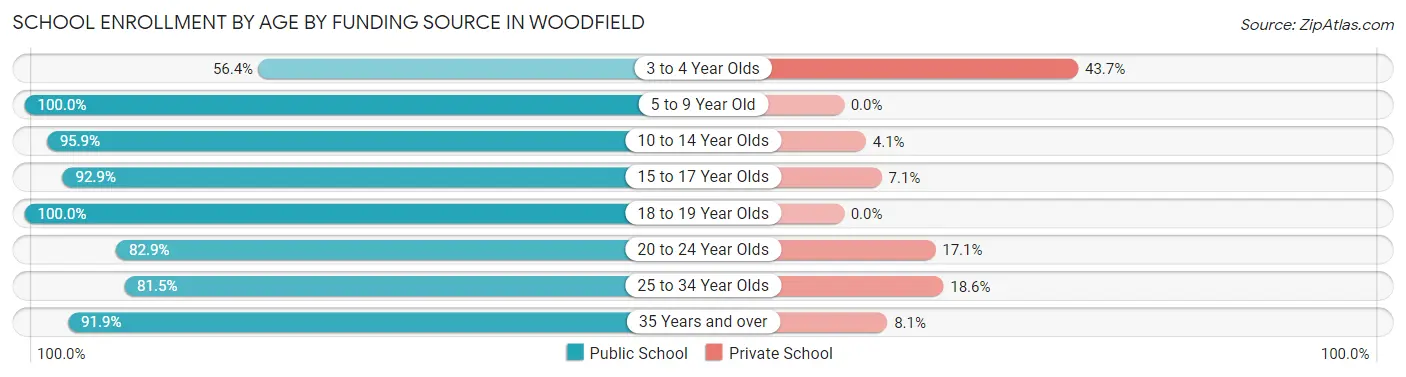
| Age Bracket | Public School | Private School |
| 3 to 4 Year Olds | 102 (56.4%) | 79 (43.6%) |
| 5 to 9 Year Old | 576 (100.0%) | 0 (0.0%) |
| 10 to 14 Year Olds | 789 (95.9%) | 34 (4.1%) |
| 15 to 17 Year Olds | 381 (92.9%) | 29 (7.1%) |
| 18 to 19 Year Olds | 182 (100.0%) | 0 (0.0%) |
| 20 to 24 Year Olds | 141 (82.9%) | 29 (17.1%) |
| 25 to 34 Year Olds | 224 (81.5%) | 51 (18.5%) |
| 35 Years and over | 170 (91.9%) | 15 (8.1%) |
| Total | 2,564 (91.5%) | 238 (8.5%) |
Educational Attainment by Field of Study in Woodfield
Education (189 | 14.8%), business (184 | 14.4%), science & technology (175 | 13.7%), arts & humanities (149 | 11.7%), and engineering (100 | 7.9%) are the most common fields of study among 1,274 individuals in Woodfield who have obtained a bachelor's degree or higher.
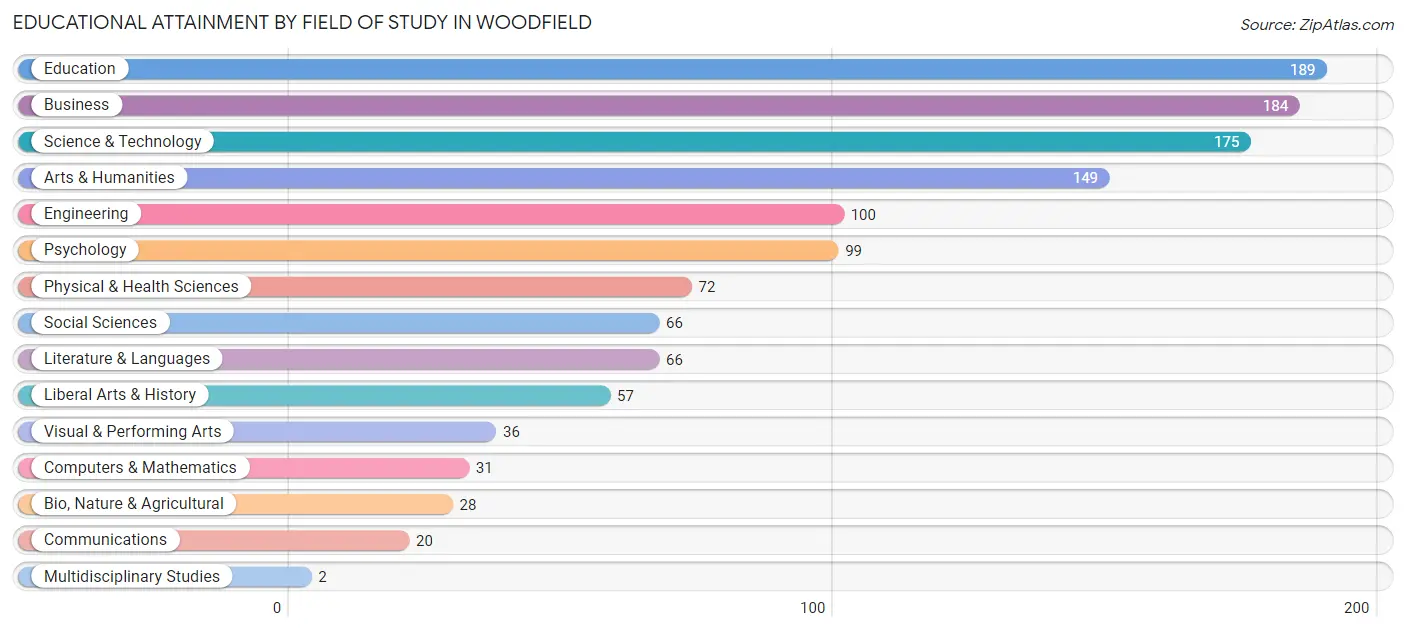
| Field of Study | # Graduates | % Graduates |
| Computers & Mathematics | 31 | 2.4% |
| Bio, Nature & Agricultural | 28 | 2.2% |
| Physical & Health Sciences | 72 | 5.7% |
| Psychology | 99 | 7.8% |
| Social Sciences | 66 | 5.2% |
| Engineering | 100 | 7.9% |
| Multidisciplinary Studies | 2 | 0.2% |
| Science & Technology | 175 | 13.7% |
| Business | 184 | 14.4% |
| Education | 189 | 14.8% |
| Literature & Languages | 66 | 5.2% |
| Liberal Arts & History | 57 | 4.5% |
| Visual & Performing Arts | 36 | 2.8% |
| Communications | 20 | 1.6% |
| Arts & Humanities | 149 | 11.7% |
| Total | 1,274 | 100.0% |
Transportation & Commute in Woodfield
Vehicle Availability by Sex in Woodfield
The most prevalent vehicle ownership categories in Woodfield are males with 1 vehicle (844, accounting for 40.7%) and females with 1 vehicle (1,039, making up 37.2%).
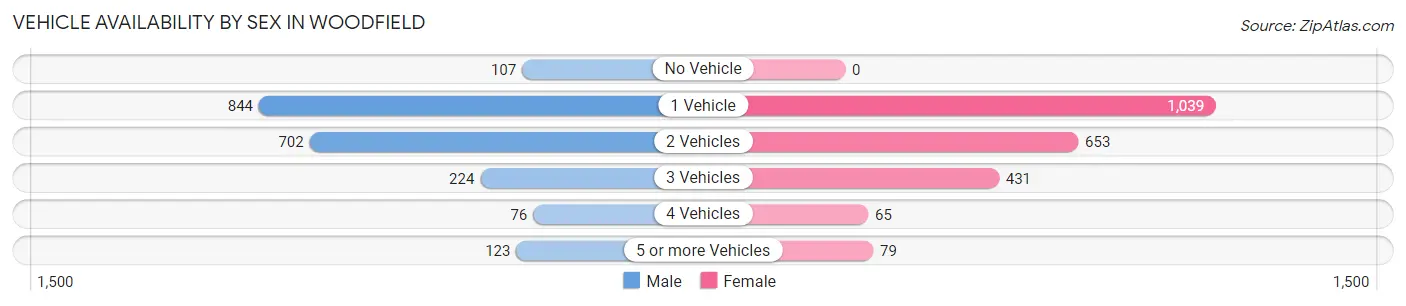
| Vehicles Available | Male | Female |
| No Vehicle | 107 (5.1%) | 0 (0.0%) |
| 1 Vehicle | 844 (40.7%) | 1,039 (45.8%) |
| 2 Vehicles | 702 (33.8%) | 653 (28.8%) |
| 3 Vehicles | 224 (10.8%) | 431 (19.0%) |
| 4 Vehicles | 76 (3.7%) | 65 (2.9%) |
| 5 or more Vehicles | 123 (5.9%) | 79 (3.5%) |
| Total | 2,076 (100.0%) | 2,267 (100.0%) |
Commute Time in Woodfield
The most frequently occuring commute durations in Woodfield are 20 to 24 minutes (1,066 commuters, 25.5%), 15 to 19 minutes (890 commuters, 21.3%), and 5 to 9 minutes (717 commuters, 17.1%).
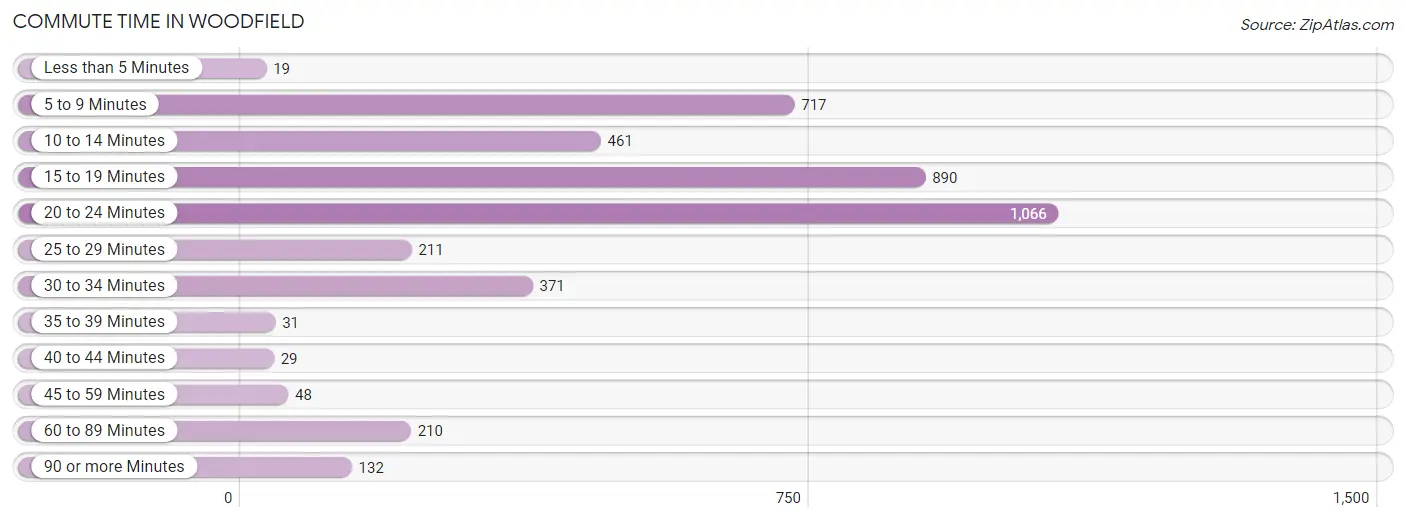
| Commute Time | # Commuters | % Commuters |
| Less than 5 Minutes | 19 | 0.4% |
| 5 to 9 Minutes | 717 | 17.1% |
| 10 to 14 Minutes | 461 | 11.0% |
| 15 to 19 Minutes | 890 | 21.3% |
| 20 to 24 Minutes | 1,066 | 25.5% |
| 25 to 29 Minutes | 211 | 5.0% |
| 30 to 34 Minutes | 371 | 8.9% |
| 35 to 39 Minutes | 31 | 0.7% |
| 40 to 44 Minutes | 29 | 0.7% |
| 45 to 59 Minutes | 48 | 1.1% |
| 60 to 89 Minutes | 210 | 5.0% |
| 90 or more Minutes | 132 | 3.2% |
Commute Time by Sex in Woodfield
The most common commute times in Woodfield are 20 to 24 minutes (625 commuters, 30.6%) for males and 5 to 9 minutes (570 commuters, 26.6%) for females.
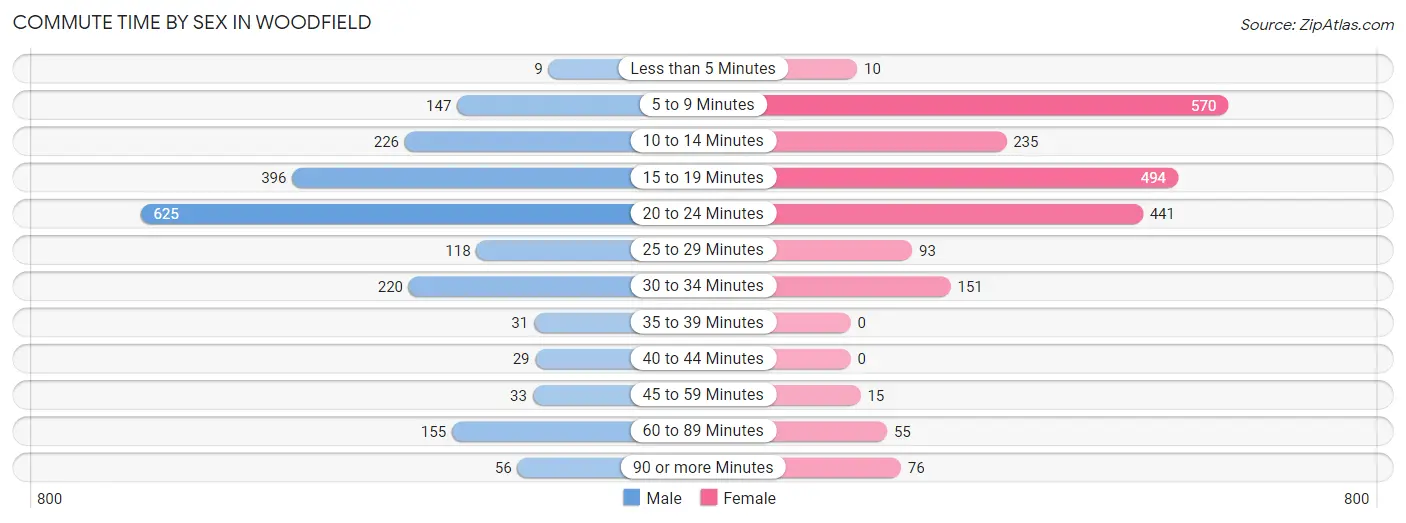
| Commute Time | Male | Female |
| Less than 5 Minutes | 9 (0.4%) | 10 (0.5%) |
| 5 to 9 Minutes | 147 (7.2%) | 570 (26.6%) |
| 10 to 14 Minutes | 226 (11.1%) | 235 (11.0%) |
| 15 to 19 Minutes | 396 (19.4%) | 494 (23.1%) |
| 20 to 24 Minutes | 625 (30.6%) | 441 (20.6%) |
| 25 to 29 Minutes | 118 (5.8%) | 93 (4.3%) |
| 30 to 34 Minutes | 220 (10.8%) | 151 (7.1%) |
| 35 to 39 Minutes | 31 (1.5%) | 0 (0.0%) |
| 40 to 44 Minutes | 29 (1.4%) | 0 (0.0%) |
| 45 to 59 Minutes | 33 (1.6%) | 15 (0.7%) |
| 60 to 89 Minutes | 155 (7.6%) | 55 (2.6%) |
| 90 or more Minutes | 56 (2.7%) | 76 (3.5%) |
Time of Departure to Work by Sex in Woodfield
The most frequent times of departure to work in Woodfield are 8:00 AM to 8:29 AM (390, 19.1%) for males and 11:00 AM to 11:59 AM (336, 15.7%) for females.
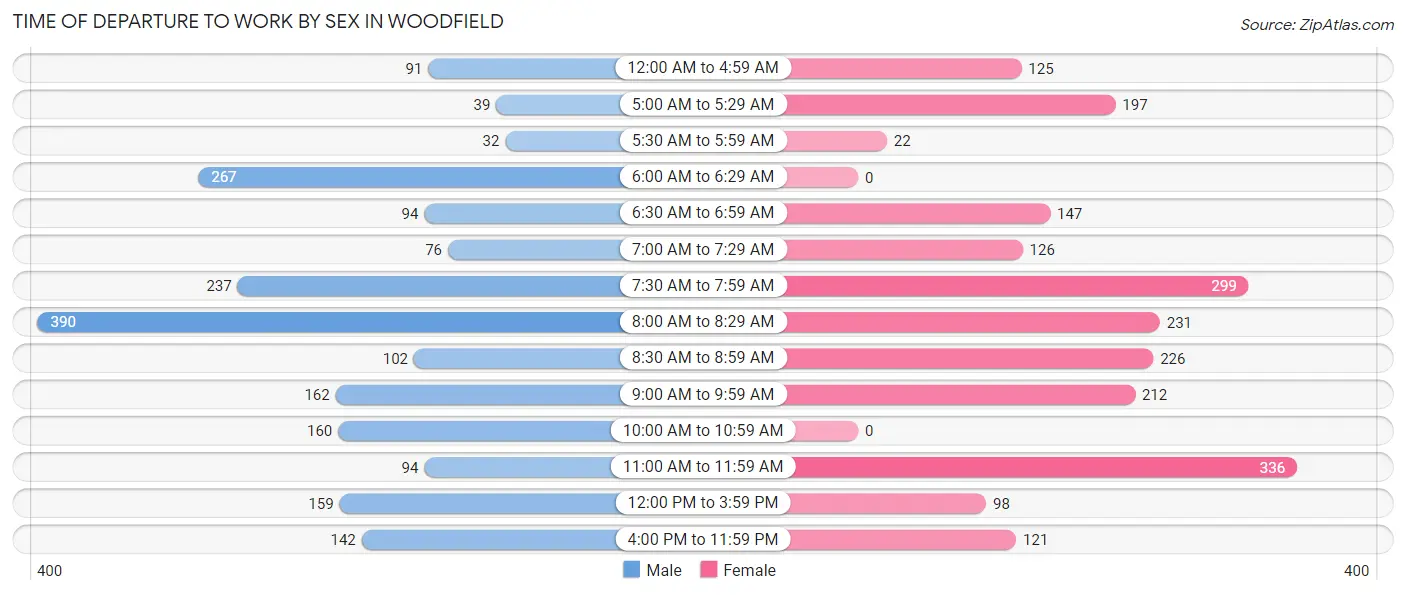
| Time of Departure | Male | Female |
| 12:00 AM to 4:59 AM | 91 (4.4%) | 125 (5.8%) |
| 5:00 AM to 5:29 AM | 39 (1.9%) | 197 (9.2%) |
| 5:30 AM to 5:59 AM | 32 (1.6%) | 22 (1.0%) |
| 6:00 AM to 6:29 AM | 267 (13.1%) | 0 (0.0%) |
| 6:30 AM to 6:59 AM | 94 (4.6%) | 147 (6.9%) |
| 7:00 AM to 7:29 AM | 76 (3.7%) | 126 (5.9%) |
| 7:30 AM to 7:59 AM | 237 (11.6%) | 299 (14.0%) |
| 8:00 AM to 8:29 AM | 390 (19.1%) | 231 (10.8%) |
| 8:30 AM to 8:59 AM | 102 (5.0%) | 226 (10.6%) |
| 9:00 AM to 9:59 AM | 162 (7.9%) | 212 (9.9%) |
| 10:00 AM to 10:59 AM | 160 (7.8%) | 0 (0.0%) |
| 11:00 AM to 11:59 AM | 94 (4.6%) | 336 (15.7%) |
| 12:00 PM to 3:59 PM | 159 (7.8%) | 98 (4.6%) |
| 4:00 PM to 11:59 PM | 142 (6.9%) | 121 (5.7%) |
| Total | 2,045 (100.0%) | 2,140 (100.0%) |
Housing Occupancy in Woodfield
Occupancy by Ownership in Woodfield
Of the total 4,242 dwellings in Woodfield, owner-occupied units account for 1,990 (46.9%), while renter-occupied units make up 2,252 (53.1%).
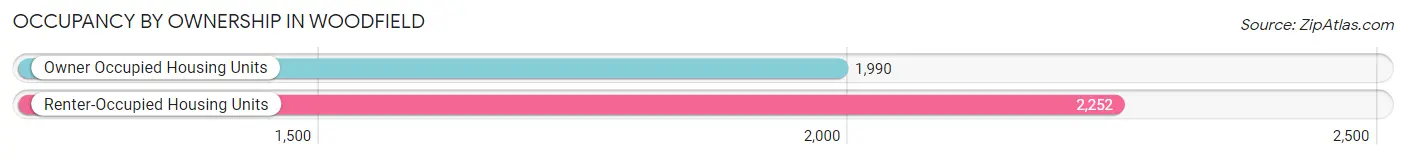
| Occupancy | # Housing Units | % Housing Units |
| Owner Occupied Housing Units | 1,990 | 46.9% |
| Renter-Occupied Housing Units | 2,252 | 53.1% |
| Total Occupied Housing Units | 4,242 | 100.0% |
Occupancy by Household Size in Woodfield
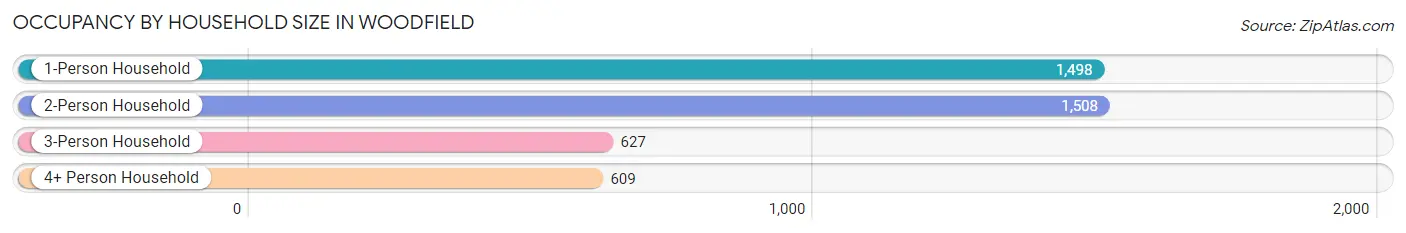
| Household Size | # Housing Units | % Housing Units |
| 1-Person Household | 1,498 | 35.3% |
| 2-Person Household | 1,508 | 35.5% |
| 3-Person Household | 627 | 14.8% |
| 4+ Person Household | 609 | 14.4% |
| Total Housing Units | 4,242 | 100.0% |
Occupancy by Ownership by Household Size in Woodfield
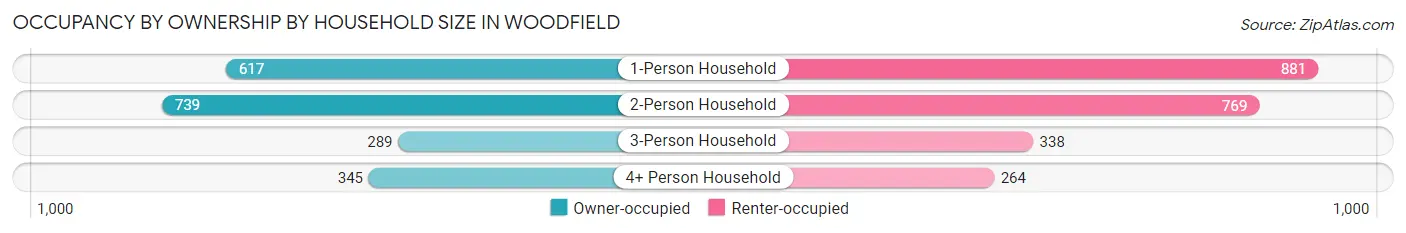
| Household Size | Owner-occupied | Renter-occupied |
| 1-Person Household | 617 (41.2%) | 881 (58.8%) |
| 2-Person Household | 739 (49.0%) | 769 (51.0%) |
| 3-Person Household | 289 (46.1%) | 338 (53.9%) |
| 4+ Person Household | 345 (56.7%) | 264 (43.3%) |
| Total Housing Units | 1,990 (46.9%) | 2,252 (53.1%) |
Occupancy by Educational Attainment in Woodfield
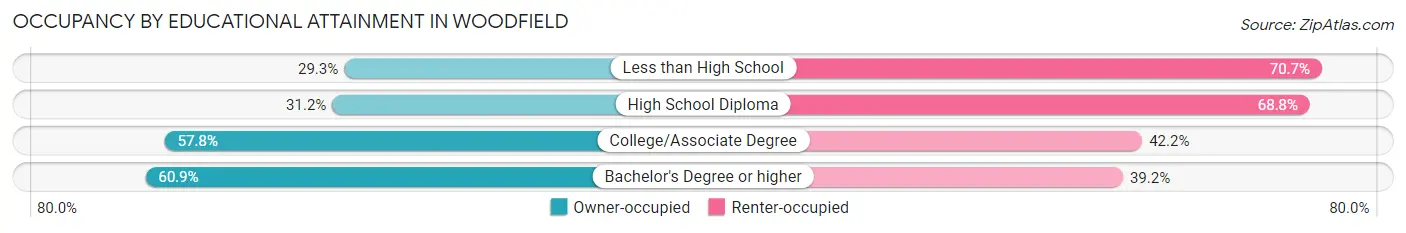
| Household Size | Owner-occupied | Renter-occupied |
| Less than High School | 132 (29.3%) | 318 (70.7%) |
| High School Diploma | 423 (31.2%) | 932 (68.8%) |
| College/Associate Degree | 908 (57.8%) | 663 (42.2%) |
| Bachelor's Degree or higher | 527 (60.9%) | 339 (39.2%) |
Occupancy by Age of Householder in Woodfield
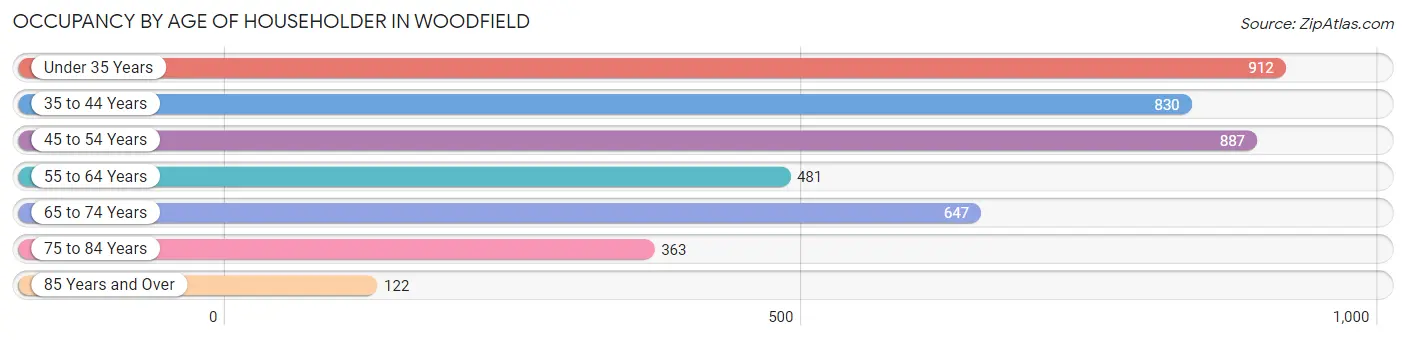
| Age Bracket | # Households | % Households |
| Under 35 Years | 912 | 21.5% |
| 35 to 44 Years | 830 | 19.6% |
| 45 to 54 Years | 887 | 20.9% |
| 55 to 64 Years | 481 | 11.3% |
| 65 to 74 Years | 647 | 15.2% |
| 75 to 84 Years | 363 | 8.6% |
| 85 Years and Over | 122 | 2.9% |
| Total | 4,242 | 100.0% |
Housing Finances in Woodfield
Median Income by Occupancy in Woodfield
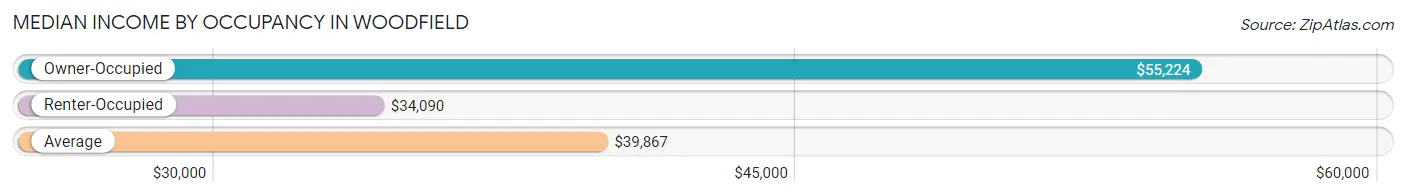
| Occupancy Type | # Households | Median Income |
| Owner-Occupied | 1,990 (46.9%) | $55,224 |
| Renter-Occupied | 2,252 (53.1%) | $34,090 |
| Average | 4,242 (100.0%) | $39,867 |
Occupancy by Householder Income Bracket in Woodfield
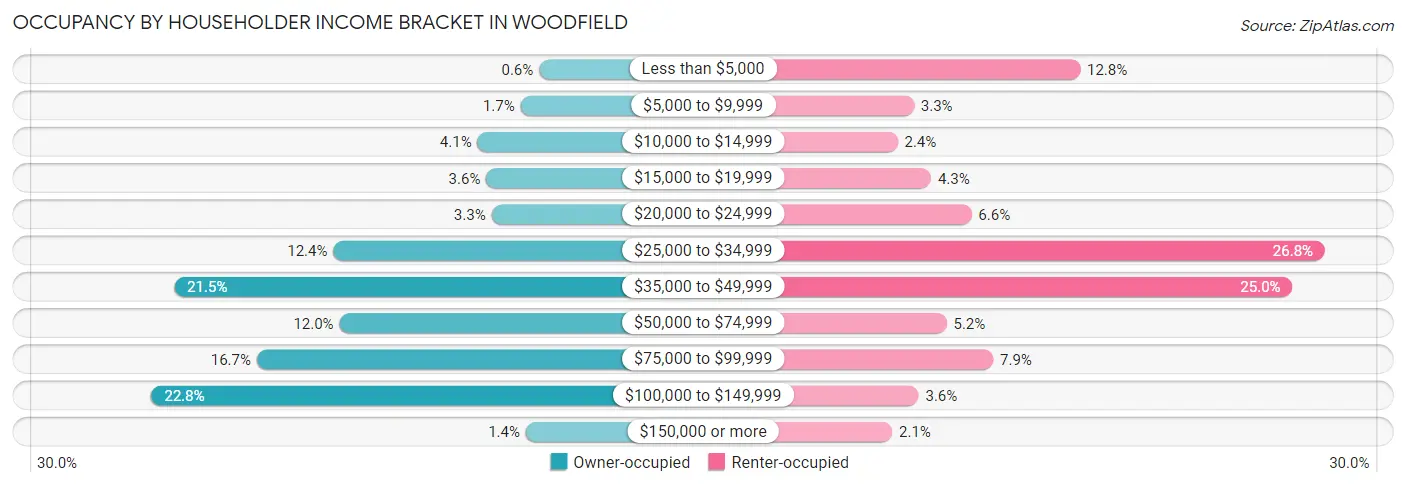
| Income Bracket | Owner-occupied | Renter-occupied |
| Less than $5,000 | 12 (0.6%) | 289 (12.8%) |
| $5,000 to $9,999 | 33 (1.7%) | 75 (3.3%) |
| $10,000 to $14,999 | 82 (4.1%) | 54 (2.4%) |
| $15,000 to $19,999 | 72 (3.6%) | 97 (4.3%) |
| $20,000 to $24,999 | 66 (3.3%) | 149 (6.6%) |
| $25,000 to $34,999 | 246 (12.4%) | 604 (26.8%) |
| $35,000 to $49,999 | 427 (21.5%) | 562 (25.0%) |
| $50,000 to $74,999 | 239 (12.0%) | 117 (5.2%) |
| $75,000 to $99,999 | 333 (16.7%) | 177 (7.9%) |
| $100,000 to $149,999 | 453 (22.8%) | 81 (3.6%) |
| $150,000 or more | 27 (1.4%) | 47 (2.1%) |
| Total | 1,990 (100.0%) | 2,252 (100.0%) |
Monthly Housing Cost Tiers in Woodfield
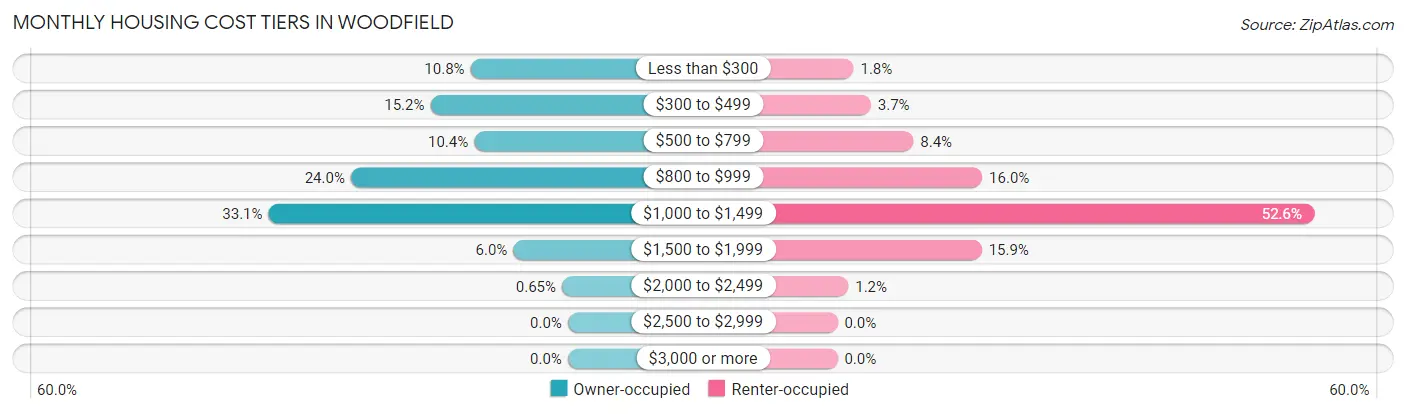
| Monthly Cost | Owner-occupied | Renter-occupied |
| Less than $300 | 214 (10.7%) | 40 (1.8%) |
| $300 to $499 | 302 (15.2%) | 83 (3.7%) |
| $500 to $799 | 206 (10.3%) | 189 (8.4%) |
| $800 to $999 | 477 (24.0%) | 360 (16.0%) |
| $1,000 to $1,499 | 658 (33.1%) | 1,185 (52.6%) |
| $1,500 to $1,999 | 120 (6.0%) | 359 (15.9%) |
| $2,000 to $2,499 | 13 (0.6%) | 27 (1.2%) |
| $2,500 to $2,999 | 0 (0.0%) | 0 (0.0%) |
| $3,000 or more | 0 (0.0%) | 0 (0.0%) |
| Total | 1,990 (100.0%) | 2,252 (100.0%) |
Physical Housing Characteristics in Woodfield
Housing Structures in Woodfield
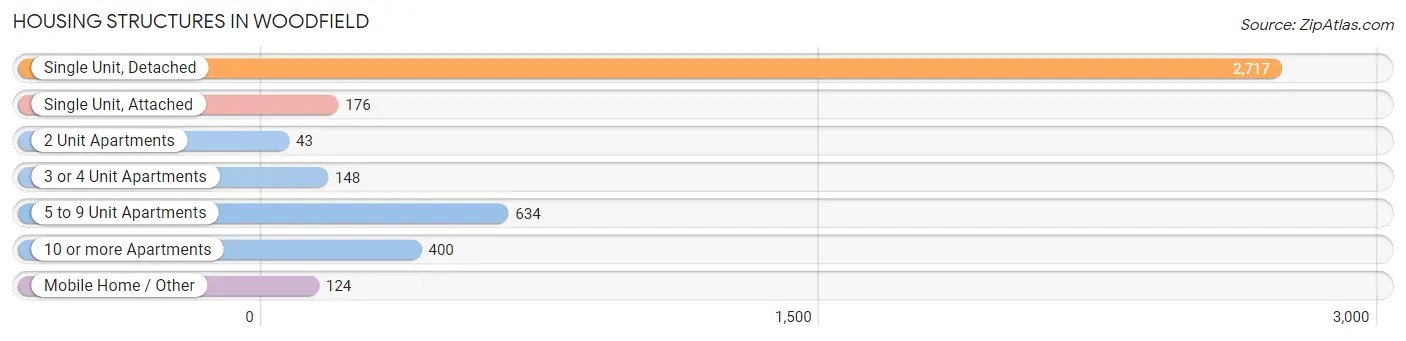
| Structure Type | # Housing Units | % Housing Units |
| Single Unit, Detached | 2,717 | 64.0% |
| Single Unit, Attached | 176 | 4.2% |
| 2 Unit Apartments | 43 | 1.0% |
| 3 or 4 Unit Apartments | 148 | 3.5% |
| 5 to 9 Unit Apartments | 634 | 14.9% |
| 10 or more Apartments | 400 | 9.4% |
| Mobile Home / Other | 124 | 2.9% |
| Total | 4,242 | 100.0% |
Housing Structures by Occupancy in Woodfield
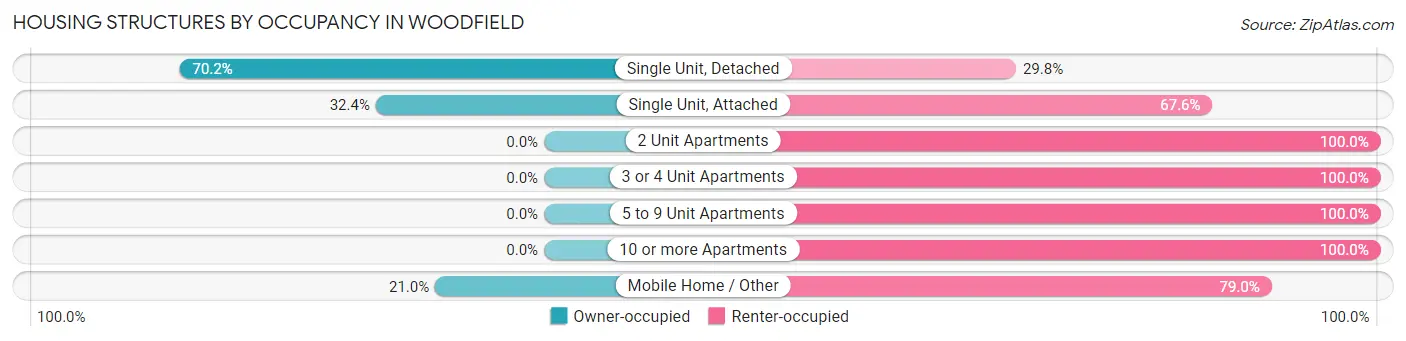
| Structure Type | Owner-occupied | Renter-occupied |
| Single Unit, Detached | 1,907 (70.2%) | 810 (29.8%) |
| Single Unit, Attached | 57 (32.4%) | 119 (67.6%) |
| 2 Unit Apartments | 0 (0.0%) | 43 (100.0%) |
| 3 or 4 Unit Apartments | 0 (0.0%) | 148 (100.0%) |
| 5 to 9 Unit Apartments | 0 (0.0%) | 634 (100.0%) |
| 10 or more Apartments | 0 (0.0%) | 400 (100.0%) |
| Mobile Home / Other | 26 (21.0%) | 98 (79.0%) |
| Total | 1,990 (46.9%) | 2,252 (53.1%) |
Housing Structures by Number of Rooms in Woodfield
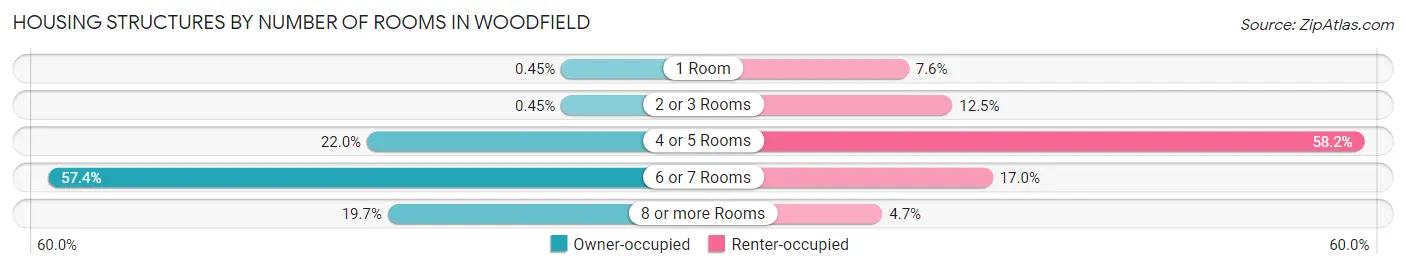
| Number of Rooms | Owner-occupied | Renter-occupied |
| 1 Room | 9 (0.4%) | 172 (7.6%) |
| 2 or 3 Rooms | 9 (0.4%) | 281 (12.5%) |
| 4 or 5 Rooms | 438 (22.0%) | 1,311 (58.2%) |
| 6 or 7 Rooms | 1,142 (57.4%) | 382 (17.0%) |
| 8 or more Rooms | 392 (19.7%) | 106 (4.7%) |
| Total | 1,990 (100.0%) | 2,252 (100.0%) |
Housing Structure by Heating Type in Woodfield
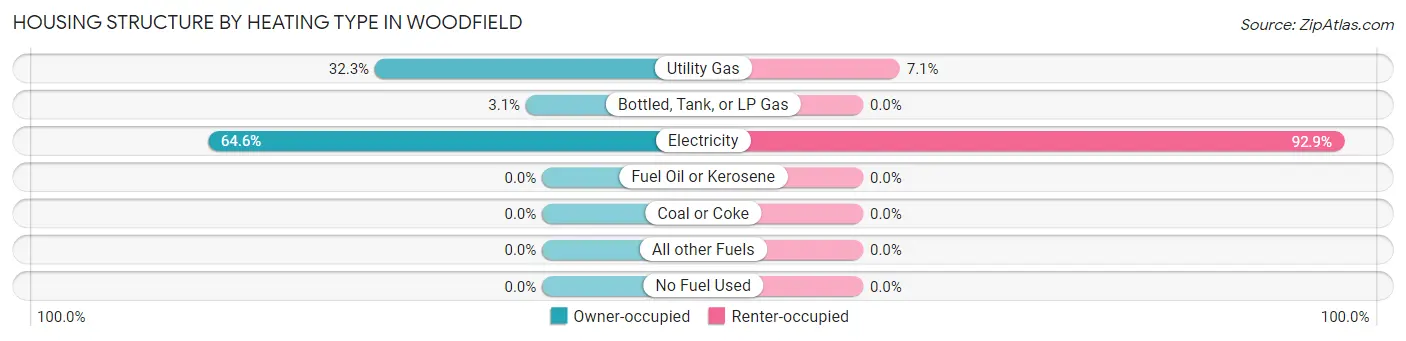
| Heating Type | Owner-occupied | Renter-occupied |
| Utility Gas | 643 (32.3%) | 160 (7.1%) |
| Bottled, Tank, or LP Gas | 62 (3.1%) | 0 (0.0%) |
| Electricity | 1,285 (64.6%) | 2,092 (92.9%) |
| Fuel Oil or Kerosene | 0 (0.0%) | 0 (0.0%) |
| Coal or Coke | 0 (0.0%) | 0 (0.0%) |
| All other Fuels | 0 (0.0%) | 0 (0.0%) |
| No Fuel Used | 0 (0.0%) | 0 (0.0%) |
| Total | 1,990 (100.0%) | 2,252 (100.0%) |
Household Vehicle Usage in Woodfield
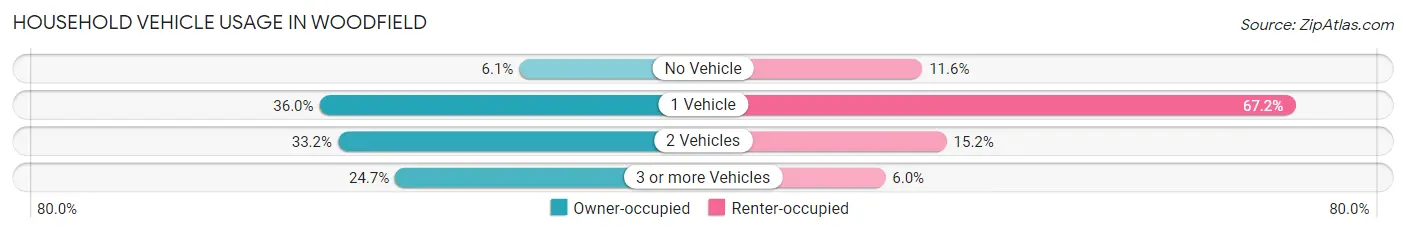
| Vehicles per Household | Owner-occupied | Renter-occupied |
| No Vehicle | 122 (6.1%) | 260 (11.6%) |
| 1 Vehicle | 716 (36.0%) | 1,514 (67.2%) |
| 2 Vehicles | 661 (33.2%) | 342 (15.2%) |
| 3 or more Vehicles | 491 (24.7%) | 136 (6.0%) |
| Total | 1,990 (100.0%) | 2,252 (100.0%) |
Real Estate & Mortgages in Woodfield
Real Estate and Mortgage Overview in Woodfield
| Characteristic | Without Mortgage | With Mortgage |
| Housing Units | 648 | 1,342 |
| Median Property Value | $114,500 | $123,600 |
| Median Household Income | $55,250 | $7 |
| Monthly Housing Costs | $378 | $0 |
| Real Estate Taxes | $740 | $26 |
Property Value by Mortgage Status in Woodfield
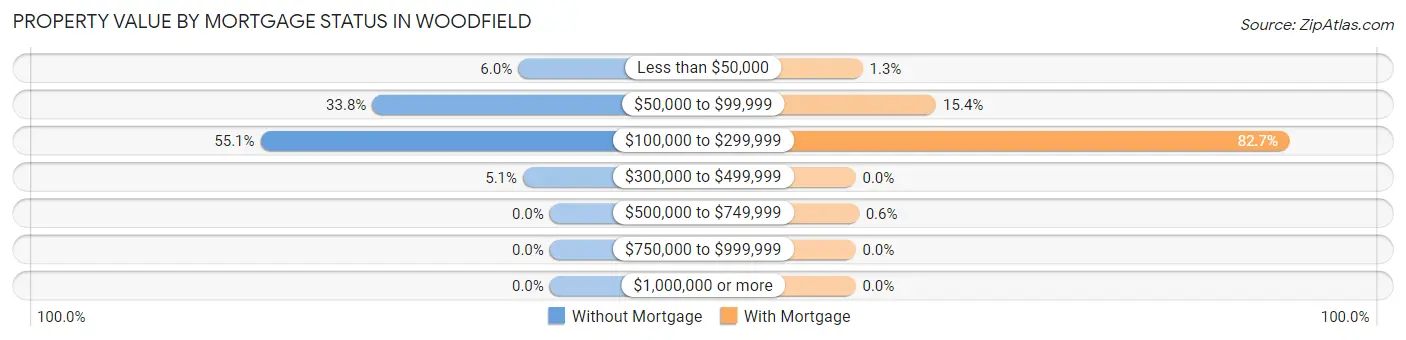
| Property Value | Without Mortgage | With Mortgage |
| Less than $50,000 | 39 (6.0%) | 18 (1.3%) |
| $50,000 to $99,999 | 219 (33.8%) | 206 (15.3%) |
| $100,000 to $299,999 | 357 (55.1%) | 1,110 (82.7%) |
| $300,000 to $499,999 | 33 (5.1%) | 0 (0.0%) |
| $500,000 to $749,999 | 0 (0.0%) | 8 (0.6%) |
| $750,000 to $999,999 | 0 (0.0%) | 0 (0.0%) |
| $1,000,000 or more | 0 (0.0%) | 0 (0.0%) |
| Total | 648 (100.0%) | 1,342 (100.0%) |
Household Income by Mortgage Status in Woodfield
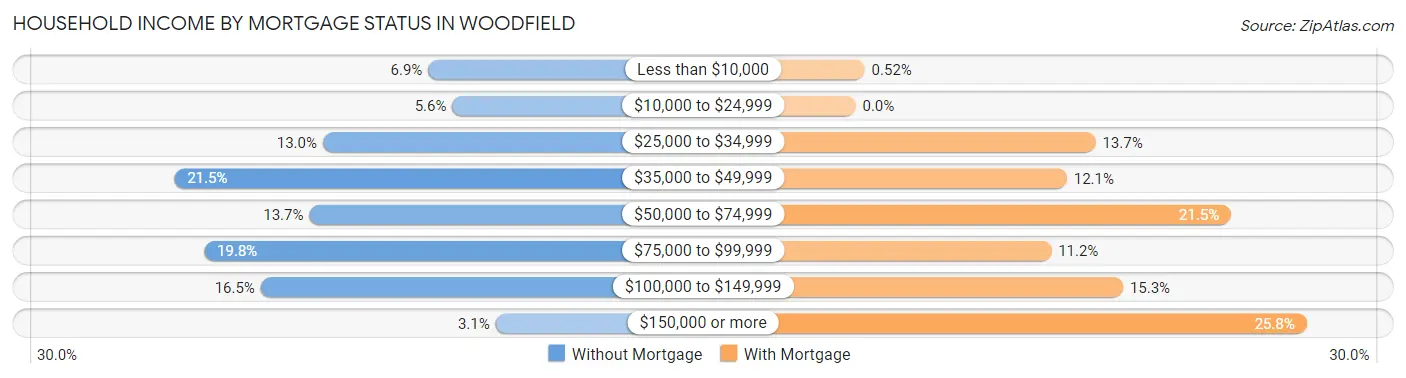
| Household Income | Without Mortgage | With Mortgage |
| Less than $10,000 | 45 (6.9%) | 7 (0.5%) |
| $10,000 to $24,999 | 36 (5.6%) | 0 (0.0%) |
| $25,000 to $34,999 | 84 (13.0%) | 184 (13.7%) |
| $35,000 to $49,999 | 139 (21.4%) | 162 (12.1%) |
| $50,000 to $74,999 | 89 (13.7%) | 288 (21.5%) |
| $75,000 to $99,999 | 128 (19.8%) | 150 (11.2%) |
| $100,000 to $149,999 | 107 (16.5%) | 205 (15.3%) |
| $150,000 or more | 20 (3.1%) | 346 (25.8%) |
| Total | 648 (100.0%) | 1,342 (100.0%) |
Property Value to Household Income Ratio in Woodfield
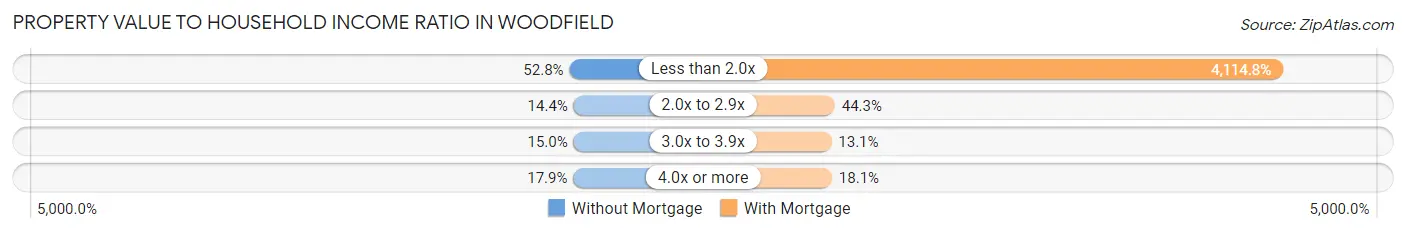
| Value-to-Income Ratio | Without Mortgage | With Mortgage |
| Less than 2.0x | 342 (52.8%) | 55,221 (4,114.8%) |
| 2.0x to 2.9x | 93 (14.3%) | 594 (44.3%) |
| 3.0x to 3.9x | 97 (15.0%) | 176 (13.1%) |
| 4.0x or more | 116 (17.9%) | 243 (18.1%) |
| Total | 648 (100.0%) | 1,342 (100.0%) |
Real Estate Taxes by Mortgage Status in Woodfield
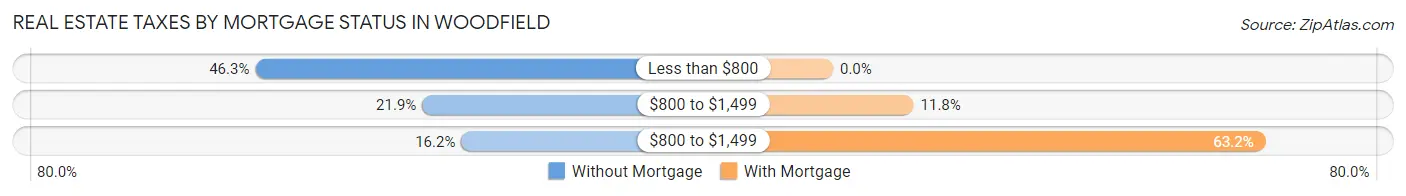
| Property Taxes | Without Mortgage | With Mortgage |
| Less than $800 | 300 (46.3%) | 0 (0.0%) |
| $800 to $1,499 | 142 (21.9%) | 158 (11.8%) |
| $800 to $1,499 | 105 (16.2%) | 848 (63.2%) |
| Total | 648 (100.0%) | 1,342 (100.0%) |
Health & Disability in Woodfield
Health Insurance Coverage by Age in Woodfield
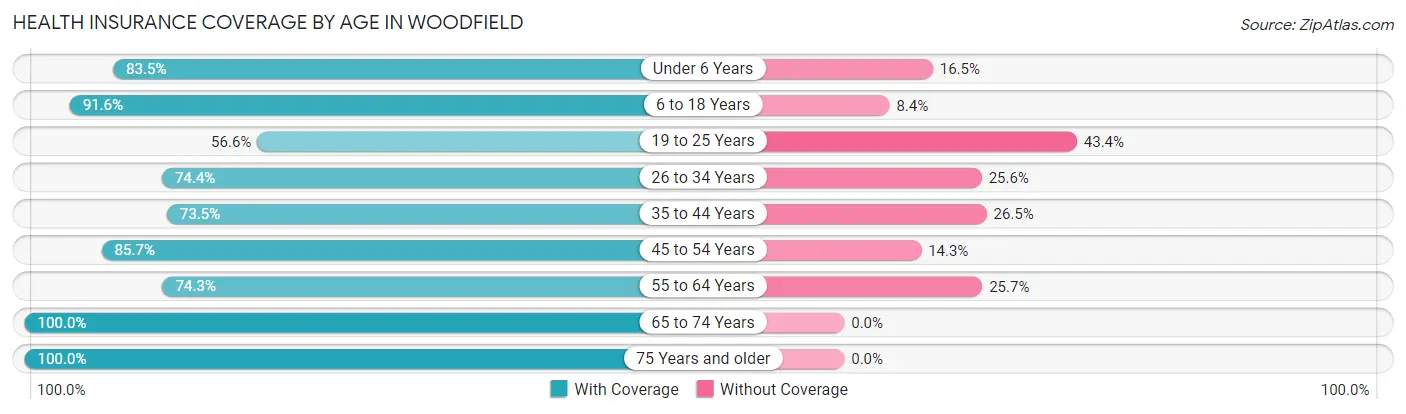
| Age Bracket | With Coverage | Without Coverage |
| Under 6 Years | 531 (83.5%) | 105 (16.5%) |
| 6 to 18 Years | 1,727 (91.6%) | 159 (8.4%) |
| 19 to 25 Years | 491 (56.6%) | 376 (43.4%) |
| 26 to 34 Years | 810 (74.4%) | 279 (25.6%) |
| 35 to 44 Years | 939 (73.5%) | 339 (26.5%) |
| 45 to 54 Years | 1,057 (85.7%) | 177 (14.3%) |
| 55 to 64 Years | 647 (74.3%) | 224 (25.7%) |
| 65 to 74 Years | 817 (100.0%) | 0 (0.0%) |
| 75 Years and older | 629 (100.0%) | 0 (0.0%) |
| Total | 7,648 (82.2%) | 1,659 (17.8%) |
Health Insurance Coverage by Citizenship Status in Woodfield
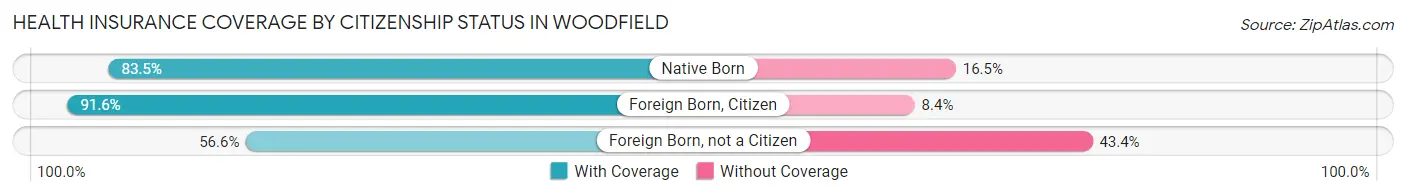
| Citizenship Status | With Coverage | Without Coverage |
| Native Born | 531 (83.5%) | 105 (16.5%) |
| Foreign Born, Citizen | 1,727 (91.6%) | 159 (8.4%) |
| Foreign Born, not a Citizen | 491 (56.6%) | 376 (43.4%) |
Health Insurance Coverage by Household Income in Woodfield
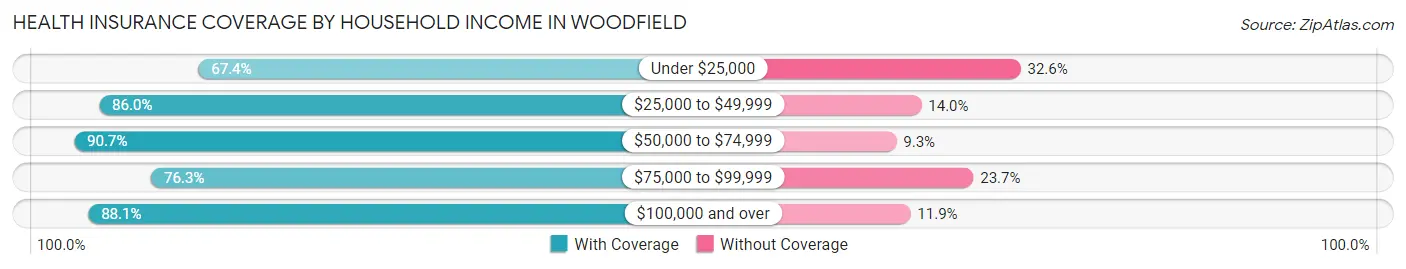
| Household Income | With Coverage | Without Coverage |
| Under $25,000 | 1,129 (67.4%) | 545 (32.6%) |
| $25,000 to $49,999 | 3,209 (86.0%) | 521 (14.0%) |
| $50,000 to $74,999 | 733 (90.7%) | 75 (9.3%) |
| $75,000 to $99,999 | 969 (76.3%) | 301 (23.7%) |
| $100,000 and over | 1,604 (88.1%) | 217 (11.9%) |
Public vs Private Health Insurance Coverage by Age in Woodfield
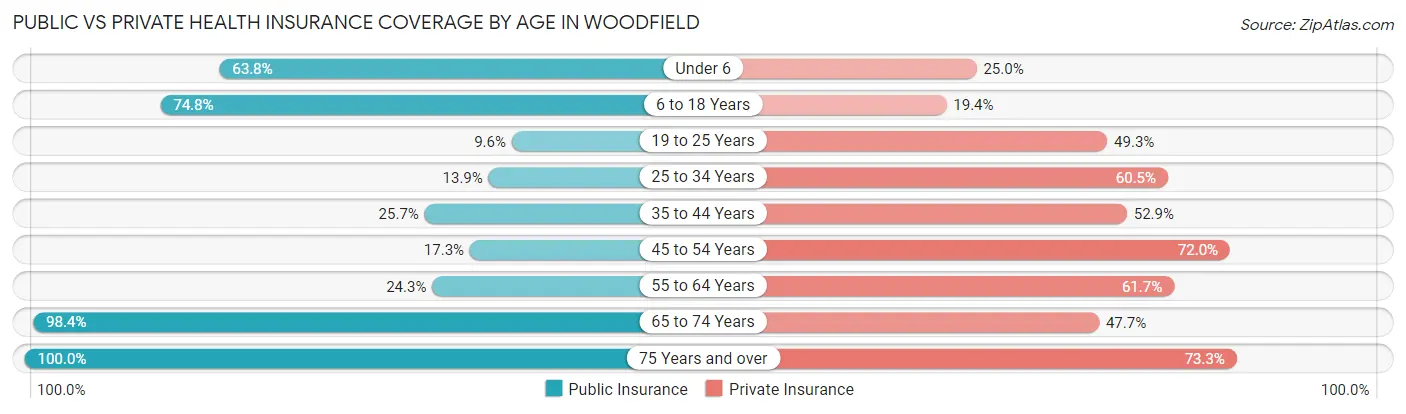
| Age Bracket | Public Insurance | Private Insurance |
| Under 6 | 406 (63.8%) | 159 (25.0%) |
| 6 to 18 Years | 1,411 (74.8%) | 366 (19.4%) |
| 19 to 25 Years | 83 (9.6%) | 427 (49.2%) |
| 25 to 34 Years | 151 (13.9%) | 659 (60.5%) |
| 35 to 44 Years | 329 (25.7%) | 676 (52.9%) |
| 45 to 54 Years | 214 (17.3%) | 889 (72.0%) |
| 55 to 64 Years | 212 (24.3%) | 537 (61.7%) |
| 65 to 74 Years | 804 (98.4%) | 390 (47.7%) |
| 75 Years and over | 629 (100.0%) | 461 (73.3%) |
| Total | 4,239 (45.6%) | 4,564 (49.0%) |
Disability Status by Sex by Age in Woodfield
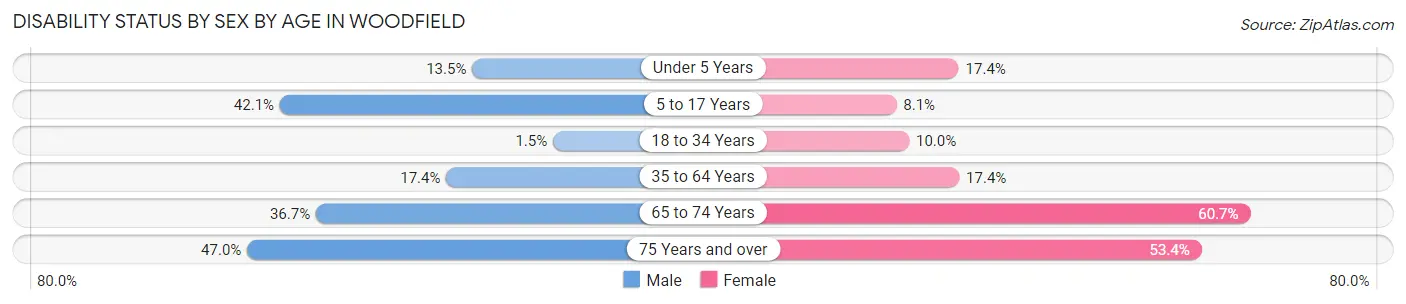
| Age Bracket | Male | Female |
| Under 5 Years | 41 (13.5%) | 34 (17.3%) |
| 5 to 17 Years | 402 (42.1%) | 74 (8.1%) |
| 18 to 34 Years | 19 (1.5%) | 87 (10.0%) |
| 35 to 64 Years | 251 (17.4%) | 338 (17.4%) |
| 65 to 74 Years | 90 (36.7%) | 347 (60.7%) |
| 75 Years and over | 131 (46.9%) | 187 (53.4%) |
Disability Class by Sex by Age in Woodfield
Disability Class: Hearing Difficulty
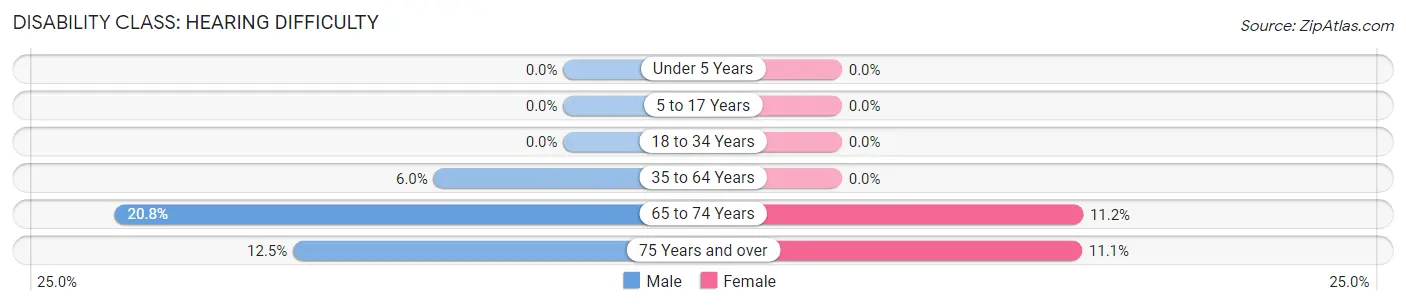
| Age Bracket | Male | Female |
| Under 5 Years | 0 (0.0%) | 0 (0.0%) |
| 5 to 17 Years | 0 (0.0%) | 0 (0.0%) |
| 18 to 34 Years | 0 (0.0%) | 0 (0.0%) |
| 35 to 64 Years | 87 (6.0%) | 0 (0.0%) |
| 65 to 74 Years | 51 (20.8%) | 64 (11.2%) |
| 75 Years and over | 35 (12.5%) | 39 (11.1%) |
Disability Class: Vision Difficulty
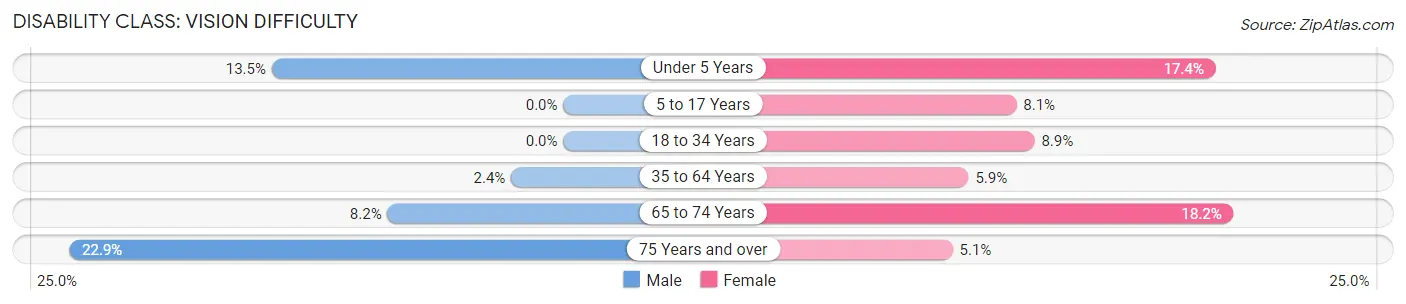
| Age Bracket | Male | Female |
| Under 5 Years | 41 (13.5%) | 34 (17.3%) |
| 5 to 17 Years | 0 (0.0%) | 74 (8.1%) |
| 18 to 34 Years | 0 (0.0%) | 78 (8.9%) |
| 35 to 64 Years | 35 (2.4%) | 114 (5.9%) |
| 65 to 74 Years | 20 (8.2%) | 104 (18.2%) |
| 75 Years and over | 64 (22.9%) | 18 (5.1%) |
Disability Class: Cognitive Difficulty
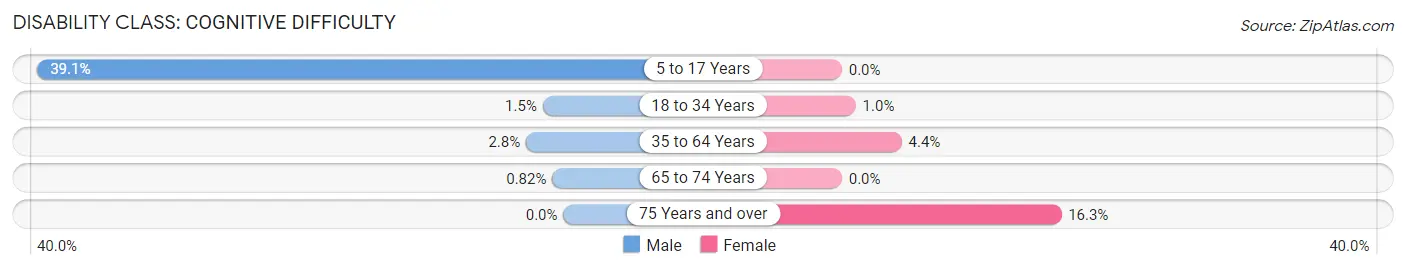
| Age Bracket | Male | Female |
| 5 to 17 Years | 373 (39.1%) | 0 (0.0%) |
| 18 to 34 Years | 19 (1.5%) | 9 (1.0%) |
| 35 to 64 Years | 40 (2.8%) | 86 (4.4%) |
| 65 to 74 Years | 2 (0.8%) | 0 (0.0%) |
| 75 Years and over | 0 (0.0%) | 57 (16.3%) |
Disability Class: Ambulatory Difficulty
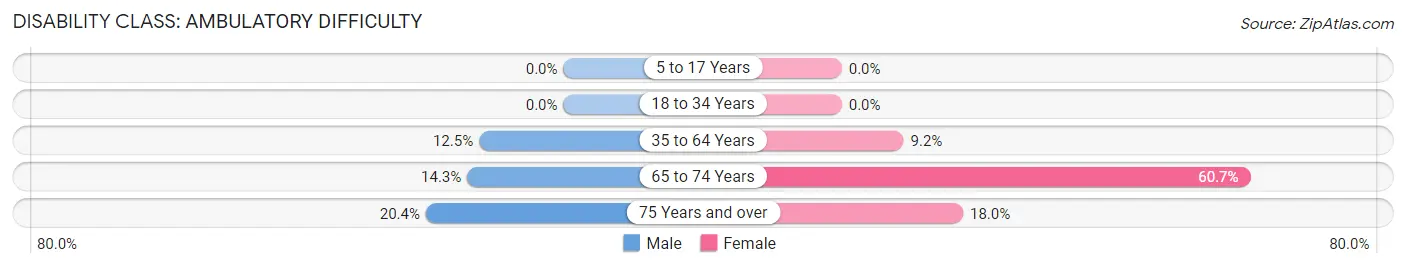
| Age Bracket | Male | Female |
| 5 to 17 Years | 0 (0.0%) | 0 (0.0%) |
| 18 to 34 Years | 0 (0.0%) | 0 (0.0%) |
| 35 to 64 Years | 181 (12.5%) | 178 (9.2%) |
| 65 to 74 Years | 35 (14.3%) | 347 (60.7%) |
| 75 Years and over | 57 (20.4%) | 63 (18.0%) |
Disability Class: Self-Care Difficulty
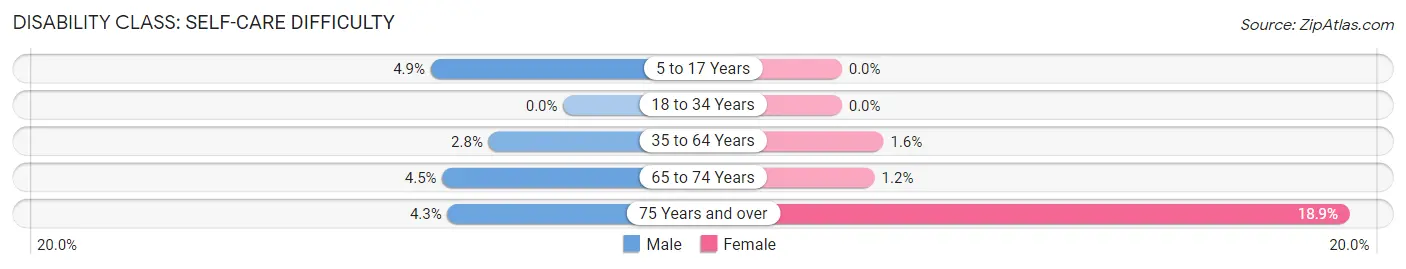
| Age Bracket | Male | Female |
| 5 to 17 Years | 47 (4.9%) | 0 (0.0%) |
| 18 to 34 Years | 0 (0.0%) | 0 (0.0%) |
| 35 to 64 Years | 40 (2.8%) | 30 (1.5%) |
| 65 to 74 Years | 11 (4.5%) | 7 (1.2%) |
| 75 Years and over | 12 (4.3%) | 66 (18.9%) |
Technology Access in Woodfield
Computing Device Access in Woodfield
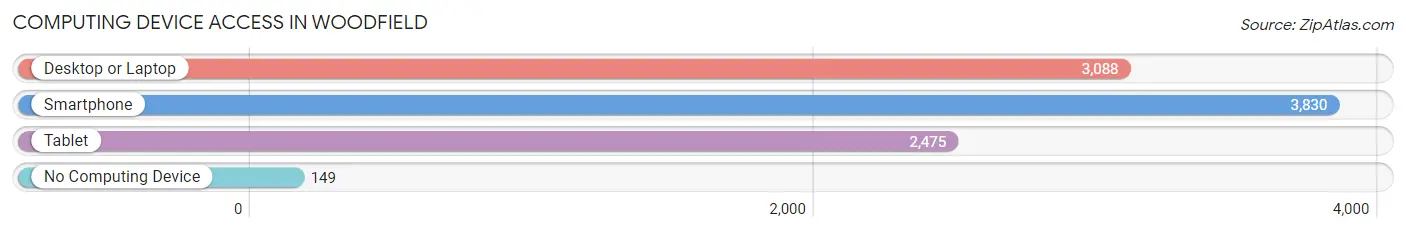
| Device Type | # Households | % Households |
| Desktop or Laptop | 3,088 | 72.8% |
| Smartphone | 3,830 | 90.3% |
| Tablet | 2,475 | 58.4% |
| No Computing Device | 149 | 3.5% |
| Total | 4,242 | 100.0% |
Internet Access in Woodfield
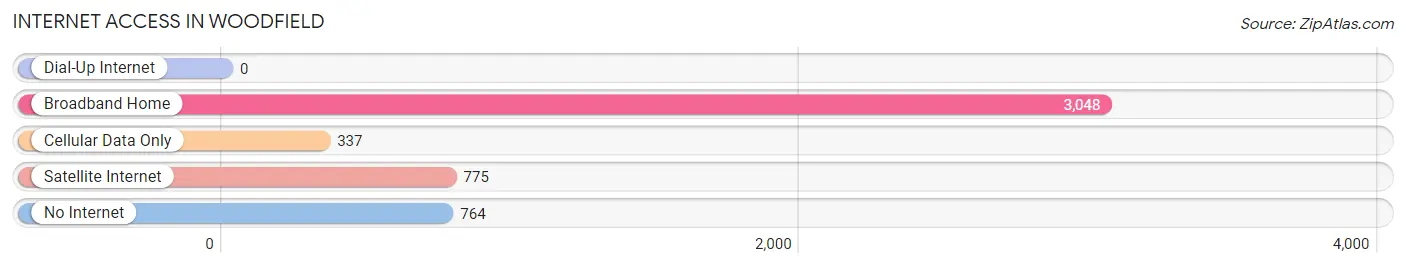
| Internet Type | # Households | % Households |
| Dial-Up Internet | 0 | 0.0% |
| Broadband Home | 3,048 | 71.9% |
| Cellular Data Only | 337 | 7.9% |
| Satellite Internet | 775 | 18.3% |
| No Internet | 764 | 18.0% |
| Total | 4,242 | 100.0% |
Woodfield Summary
Woodfield is a small town located in the state of South Carolina, United States. It is situated in the northern part of the state, in the county of Spartanburg. The town has a population of approximately 1,000 people, and is part of the Spartanburg Metropolitan Statistical Area.
History
Woodfield was founded in 1820 by a group of settlers from North Carolina. The town was named after the nearby Woodfield Plantation, which was owned by the prominent local family of the same name. The plantation was established in the late 1700s and was one of the largest in the area. The town grew slowly over the years, and by the early 1900s it had become a thriving agricultural community.
In the mid-1900s, the town began to experience a period of growth and development. The local economy was bolstered by the construction of a cotton mill in the 1950s, which provided employment for many of the town’s residents. The town also benefited from the construction of a new highway, which connected it to nearby cities and towns.
Geography
Woodfield is located in the northern part of South Carolina, in the county of Spartanburg. The town is situated in the foothills of the Blue Ridge Mountains, and is surrounded by rolling hills and forests. The town is located approximately 25 miles from the city of Spartanburg, and is close to the North Carolina border.
The climate in Woodfield is generally mild, with hot summers and cool winters. The average annual temperature is around 70 degrees Fahrenheit, and the average annual precipitation is around 45 inches.
Economy
The economy of Woodfield is largely based on agriculture. The town is home to several farms, which produce a variety of crops, including corn, soybeans, and cotton. The town also has a number of small businesses, including restaurants, stores, and service providers.
The town is also home to a number of manufacturing companies, which produce a variety of products, including furniture, textiles, and automotive parts. The town is also home to a number of small businesses, which provide services such as accounting, legal services, and real estate.
Demographics
As of the 2010 census, the population of Woodfield was 1,000 people. The racial makeup of the town was 97.2% White, 0.7% African American, 0.3% Native American, 0.2% Asian, and 1.6% from other races. The median household income was $37,500, and the median family income was $45,000.
The town is home to a number of churches, including the Woodfield Baptist Church, the Woodfield Methodist Church, and the Woodfield Presbyterian Church. The town also has a number of schools, including Woodfield Elementary School, Woodfield Middle School, and Woodfield High School.
Woodfield is a small town with a rich history and a vibrant economy. The town is home to a diverse population, and is a great place to live and work. The town is also close to a number of larger cities, making it an ideal location for those looking to explore the area.
Common Questions
What is Per Capita Income in Woodfield?
Per Capita income in Woodfield is $22,963.
What is the Median Family Income in Woodfield?
Median Family Income in Woodfield is $47,249.
What is the Median Household income in Woodfield?
Median Household Income in Woodfield is $39,867.
What is Income or Wage Gap in Woodfield?
Income or Wage Gap in Woodfield is 3.2%.
Women in Woodfield earn 96.8 cents for every dollar earned by a man.
What is Inequality or Gini Index in Woodfield?
Inequality or Gini Index in Woodfield is 0.40.
What is the Total Population of Woodfield?
Total Population of Woodfield is 9,466.
What is the Total Male Population of Woodfield?
Total Male Population of Woodfield is 4,607.
What is the Total Female Population of Woodfield?
Total Female Population of Woodfield is 4,859.
What is the Ratio of Males per 100 Females in Woodfield?
There are 94.81 Males per 100 Females in Woodfield.
What is the Ratio of Females per 100 Males in Woodfield?
There are 105.47 Females per 100 Males in Woodfield.
What is the Median Population Age in Woodfield?
Median Population Age in Woodfield is 37.2 Years.
What is the Average Family Size in Woodfield
Average Family Size in Woodfield is 2.7 People.
What is the Average Household Size in Woodfield
Average Household Size in Woodfield is 2.2 People.
How Large is the Labor Force in Woodfield?
There are 4,539 People in the Labor Forcein in Woodfield.
What is the Percentage of People in the Labor Force in Woodfield?
62.7% of People are in the Labor Force in Woodfield.
What is the Unemployment Rate in Woodfield?
Unemployment Rate in Woodfield is 4.3%.