Arnegard, ND Map & Demographics
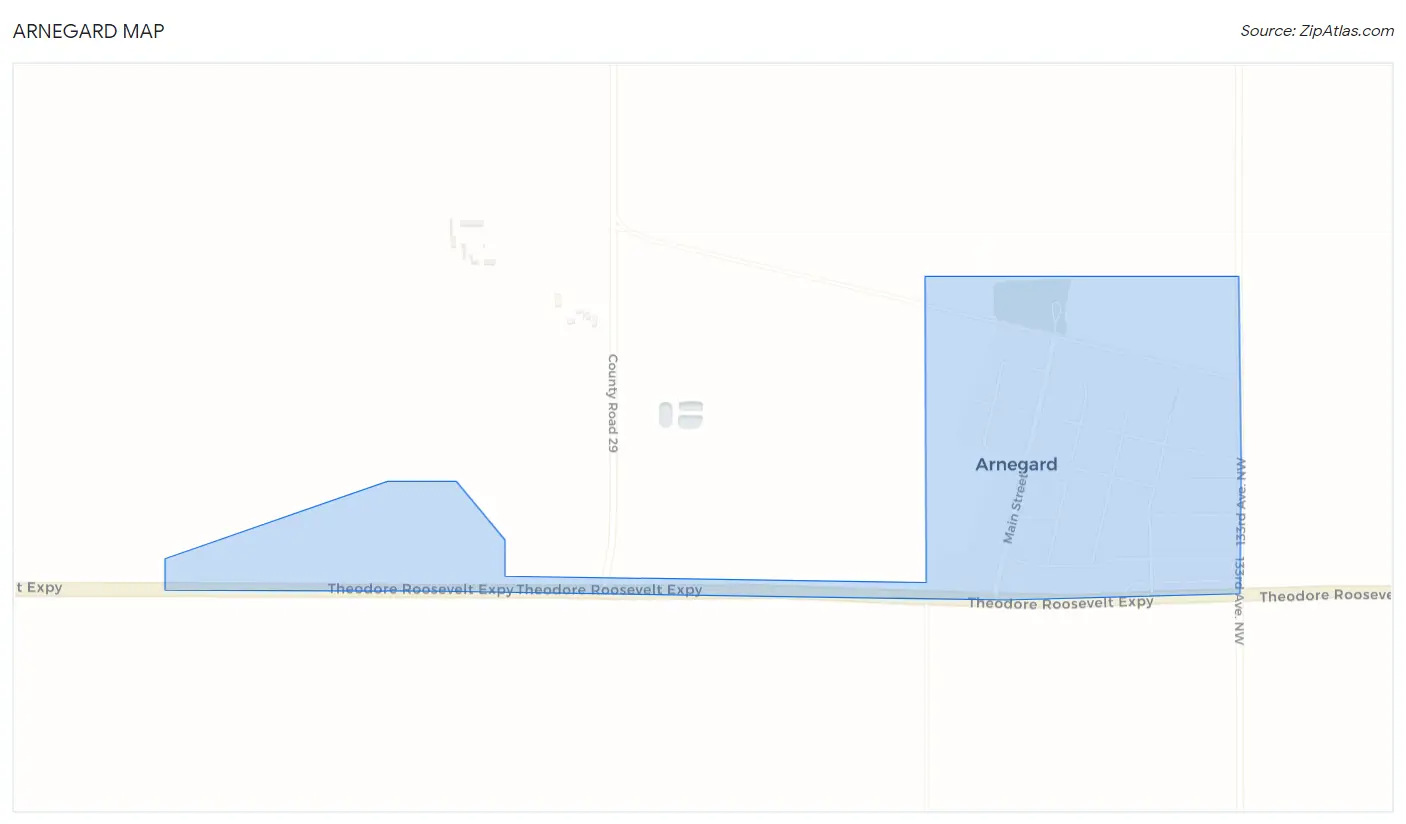
Arnegard Map
Arnegard Overview
$63,177
PER CAPITA INCOME
$110,714
AVG FAMILY INCOME
$111,313
AVG HOUSEHOLD INCOME
0.40
INEQUALITY / GINI INDEX
155
TOTAL POPULATION
59
MALE POPULATION
96
FEMALE POPULATION
61.46
MALES / 100 FEMALES
162.71
FEMALES / 100 MALES
57.7
MEDIAN AGE
2.6
AVG FAMILY SIZE
2.5
AVG HOUSEHOLD SIZE
93
LABOR FORCE [ PEOPLE ]
72.7%
PERCENT IN LABOR FORCE
8.6%
UNEMPLOYMENT RATE
Arnegard Zip Codes
Arnegard Area Codes
Income in Arnegard
Income Overview in Arnegard
Per Capita Income in Arnegard is $63,177, while median incomes of families and households are $110,714 and $111,313 respectively.
| Characteristic | Number | Measure |
| Per Capita Income | 155 | $63,177 |
| Median Family Income | 52 | $110,714 |
| Mean Family Income | 52 | $132,771 |
| Median Household Income | 63 | $111,313 |
| Mean Household Income | 63 | $135,978 |
| Income Deficit | 52 | $0 |
| Wage / Income Gap (%) | 155 | 0.00% |
| Wage / Income Gap ($) | 155 | 100.00¢ per $1 |
| Gini / Inequality Index | 155 | 0.40 |
Earnings by Sex in Arnegard
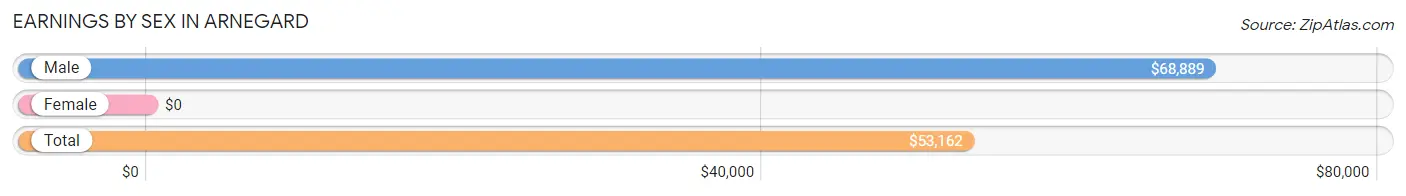
| Sex | Number | Average Earnings |
| Male | 50 (53.8%) | $68,889 |
| Female | 43 (46.2%) | $0 |
| Total | 93 (100.0%) | $53,162 |
Earnings by Sex by Income Bracket in Arnegard
The most common earnings brackets in Arnegard are $65,000 to $74,999 for men (14 | 28.0%) and $25,000 to $29,999 for women (20 | 46.5%).
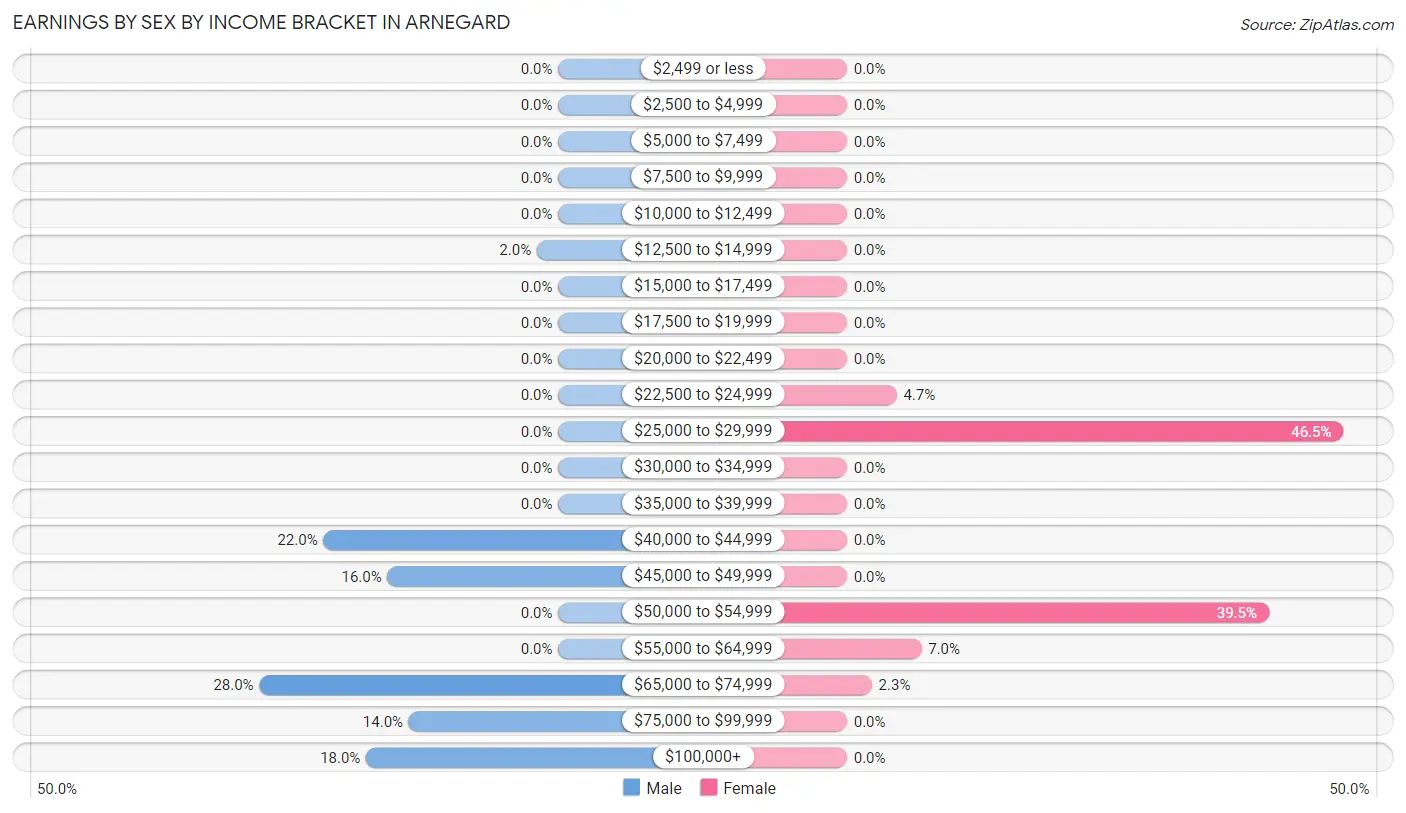
| Income | Male | Female |
| $2,499 or less | 0 (0.0%) | 0 (0.0%) |
| $2,500 to $4,999 | 0 (0.0%) | 0 (0.0%) |
| $5,000 to $7,499 | 0 (0.0%) | 0 (0.0%) |
| $7,500 to $9,999 | 0 (0.0%) | 0 (0.0%) |
| $10,000 to $12,499 | 0 (0.0%) | 0 (0.0%) |
| $12,500 to $14,999 | 1 (2.0%) | 0 (0.0%) |
| $15,000 to $17,499 | 0 (0.0%) | 0 (0.0%) |
| $17,500 to $19,999 | 0 (0.0%) | 0 (0.0%) |
| $20,000 to $22,499 | 0 (0.0%) | 0 (0.0%) |
| $22,500 to $24,999 | 0 (0.0%) | 2 (4.6%) |
| $25,000 to $29,999 | 0 (0.0%) | 20 (46.5%) |
| $30,000 to $34,999 | 0 (0.0%) | 0 (0.0%) |
| $35,000 to $39,999 | 0 (0.0%) | 0 (0.0%) |
| $40,000 to $44,999 | 11 (22.0%) | 0 (0.0%) |
| $45,000 to $49,999 | 8 (16.0%) | 0 (0.0%) |
| $50,000 to $54,999 | 0 (0.0%) | 17 (39.5%) |
| $55,000 to $64,999 | 0 (0.0%) | 3 (7.0%) |
| $65,000 to $74,999 | 14 (28.0%) | 1 (2.3%) |
| $75,000 to $99,999 | 7 (14.0%) | 0 (0.0%) |
| $100,000+ | 9 (18.0%) | 0 (0.0%) |
| Total | 50 (100.0%) | 43 (100.0%) |
Earnings by Sex by Educational Attainment in Arnegard
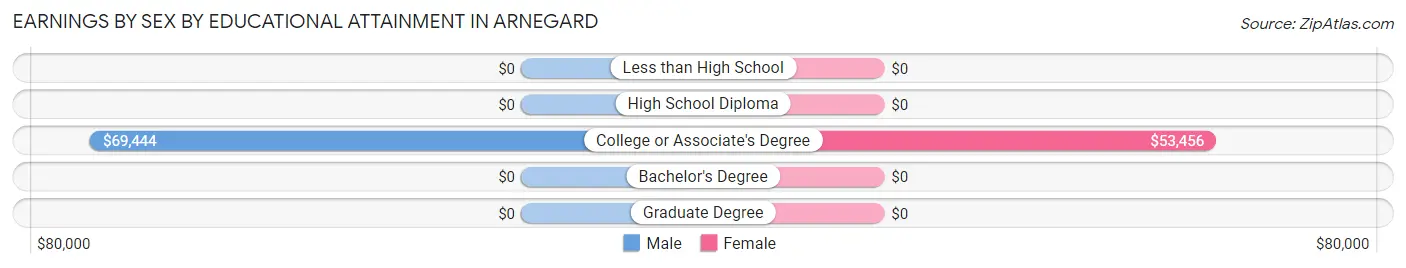
| Educational Attainment | Male Income | Female Income |
| Less than High School | - | - |
| High School Diploma | - | - |
| College or Associate's Degree | $69,444 | $53,456 |
| Bachelor's Degree | - | - |
| Graduate Degree | - | - |
| Total | $68,889 | $0 |
Family Income in Arnegard
Family Income Brackets in Arnegard
According to the Arnegard family income data, there are 26 families falling into the $100,000 to $149,999 income range, which is the most common income bracket and makes up 50.0% of all families.
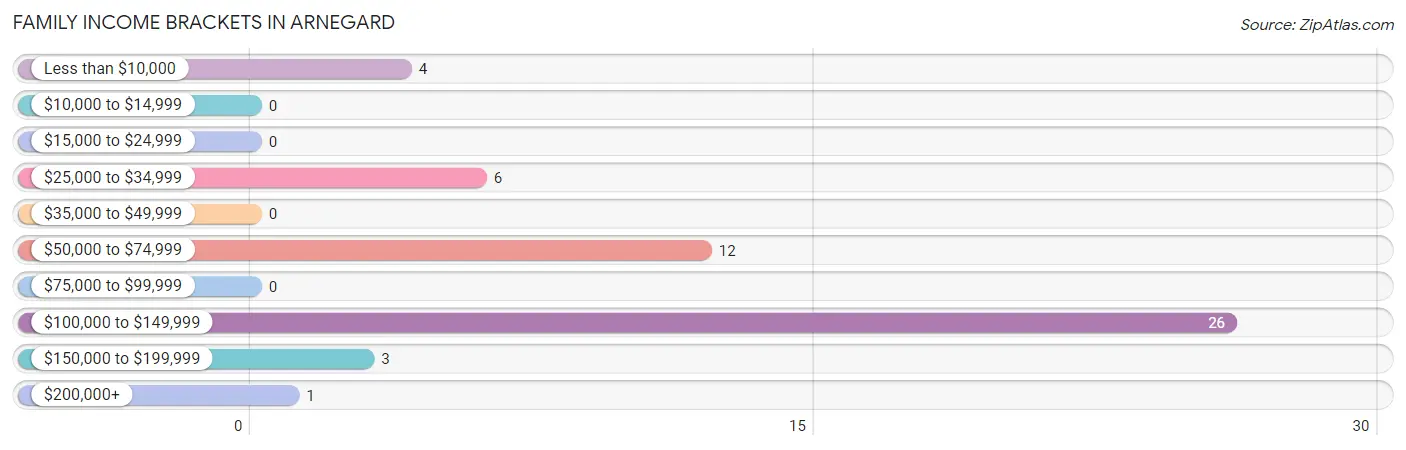
| Income Bracket | # Families | % Families |
| Less than $10,000 | 4 | 7.7% |
| $10,000 to $14,999 | 0 | 0.0% |
| $15,000 to $24,999 | 0 | 0.0% |
| $25,000 to $34,999 | 6 | 11.5% |
| $35,000 to $49,999 | 0 | 0.0% |
| $50,000 to $74,999 | 12 | 23.1% |
| $75,000 to $99,999 | 0 | 0.0% |
| $100,000 to $149,999 | 26 | 50.0% |
| $150,000 to $199,999 | 3 | 5.8% |
| $200,000+ | 1 | 1.9% |
Family Income by Famaliy Size in Arnegard
| Income Bracket | # Families | Median Income |
| 2-Person Families | 41 (78.8%) | $0 |
| 3-Person Families | 9 (17.3%) | $0 |
| 4-Person Families | 2 (3.8%) | $0 |
| 5-Person Families | 0 (0.0%) | $0 |
| 6-Person Families | 0 (0.0%) | $0 |
| 7+ Person Families | 0 (0.0%) | $0 |
| Total | 52 (100.0%) | $110,714 |
Family Income by Number of Earners in Arnegard
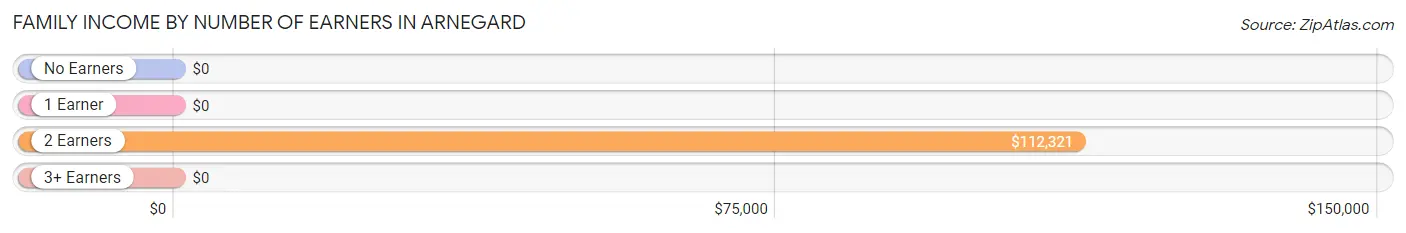
| Number of Earners | # Families | Median Income |
| No Earners | 8 (15.4%) | $0 |
| 1 Earner | 16 (30.8%) | $0 |
| 2 Earners | 26 (50.0%) | $112,321 |
| 3+ Earners | 2 (3.8%) | $0 |
| Total | 52 (100.0%) | $110,714 |
Household Income in Arnegard
Household Income Brackets in Arnegard
With 38 households falling in the category, the $100,000 to $149,999 income range is the most frequent in Arnegard, accounting for 60.3% of all households.
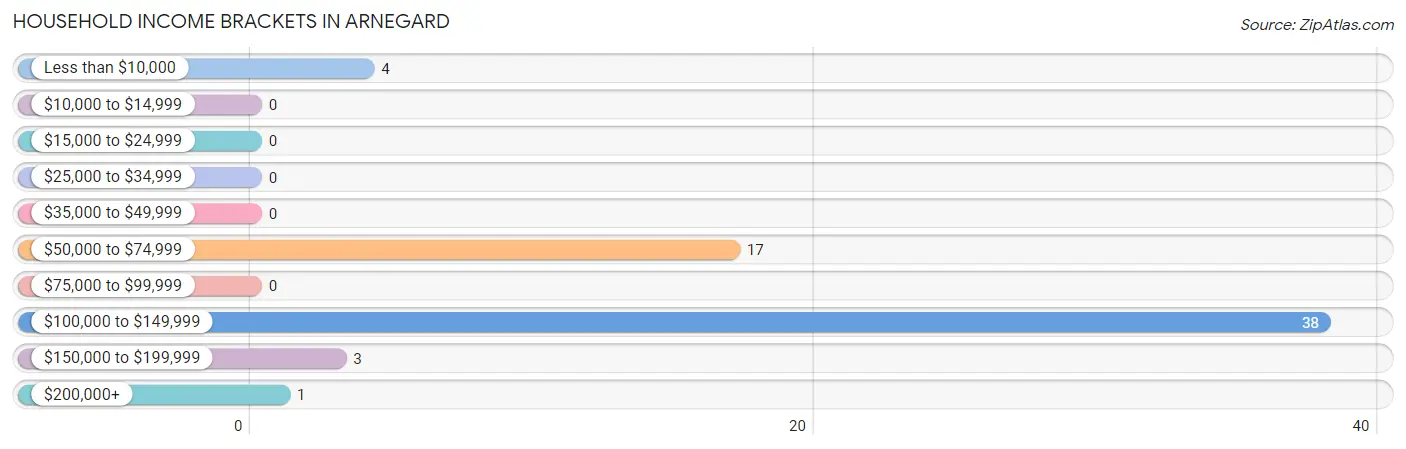
| Income Bracket | # Households | % Households |
| Less than $10,000 | 4 | 6.3% |
| $10,000 to $14,999 | 0 | 0.0% |
| $15,000 to $24,999 | 0 | 0.0% |
| $25,000 to $34,999 | 0 | 0.0% |
| $35,000 to $49,999 | 0 | 0.0% |
| $50,000 to $74,999 | 17 | 27.0% |
| $75,000 to $99,999 | 0 | 0.0% |
| $100,000 to $149,999 | 38 | 60.3% |
| $150,000 to $199,999 | 3 | 4.8% |
| $200,000+ | 1 | 1.6% |
Household Income by Householder Age in Arnegard
The median household income in Arnegard is $111,313, with the highest median household income of $111,188 found in the 45 to 64 years age bracket for the primary householder. A total of 47 households (74.6%) fall into this category.
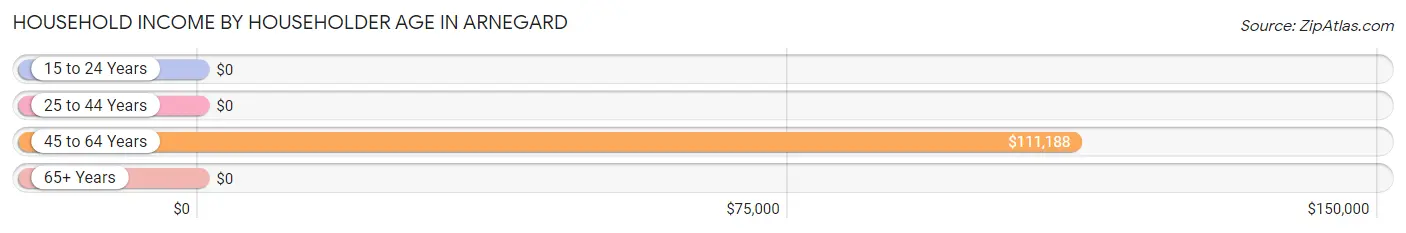
| Income Bracket | # Households | Median Income |
| 15 to 24 Years | 0 (0.0%) | $0 |
| 25 to 44 Years | 6 (9.5%) | $0 |
| 45 to 64 Years | 47 (74.6%) | $111,188 |
| 65+ Years | 10 (15.9%) | $0 |
| Total | 63 (100.0%) | $111,313 |
Poverty in Arnegard
Income Below Poverty by Sex and Age in Arnegard
With 6.8% poverty level for males and 7.3% for females among the residents of Arnegard, 65 to 74 year old males and 75 year old and over females are the most vulnerable to poverty, with 4 males (80.0%) and 7 females (70.0%) in their respective age groups living below the poverty level.
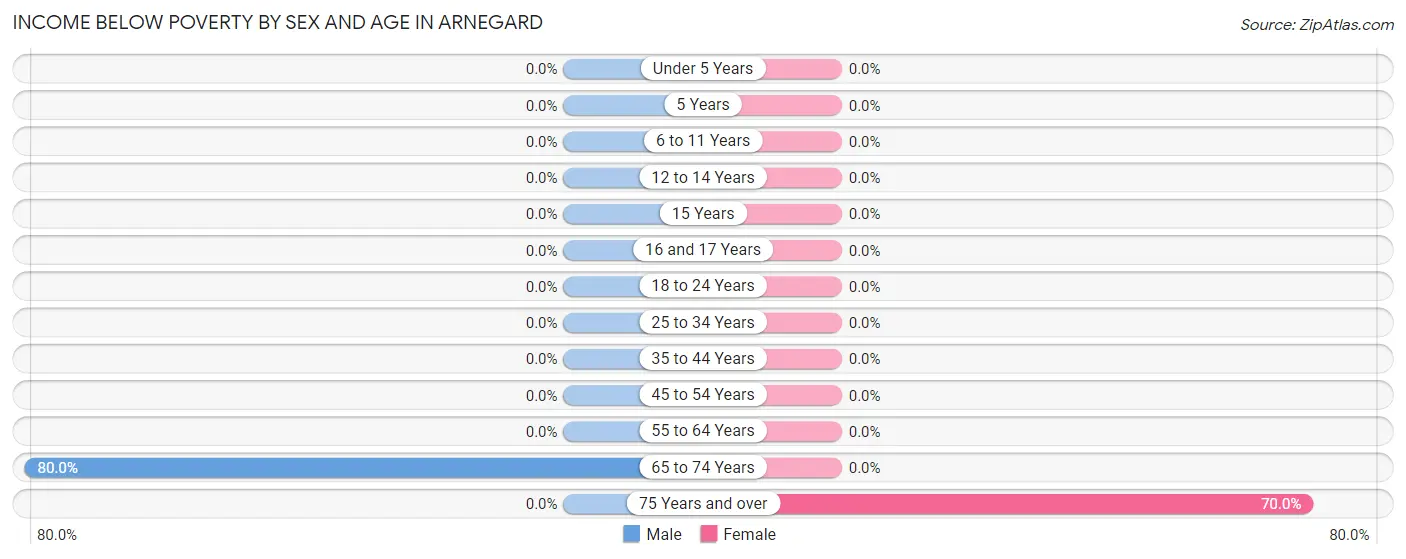
| Age Bracket | Male | Female |
| Under 5 Years | 0 (0.0%) | 0 (0.0%) |
| 5 Years | 0 (0.0%) | 0 (0.0%) |
| 6 to 11 Years | 0 (0.0%) | 0 (0.0%) |
| 12 to 14 Years | 0 (0.0%) | 0 (0.0%) |
| 15 Years | 0 (0.0%) | 0 (0.0%) |
| 16 and 17 Years | 0 (0.0%) | 0 (0.0%) |
| 18 to 24 Years | 0 (0.0%) | 0 (0.0%) |
| 25 to 34 Years | 0 (0.0%) | 0 (0.0%) |
| 35 to 44 Years | 0 (0.0%) | 0 (0.0%) |
| 45 to 54 Years | 0 (0.0%) | 0 (0.0%) |
| 55 to 64 Years | 0 (0.0%) | 0 (0.0%) |
| 65 to 74 Years | 4 (80.0%) | 0 (0.0%) |
| 75 Years and over | 0 (0.0%) | 7 (70.0%) |
| Total | 4 (6.8%) | 7 (7.3%) |
Income Above Poverty by Sex and Age in Arnegard
According to the poverty statistics in Arnegard, males aged 25 to 34 years and females aged under 5 years are the age groups that are most secure financially, with 100.0% of males and 100.0% of females in these age groups living above the poverty line.
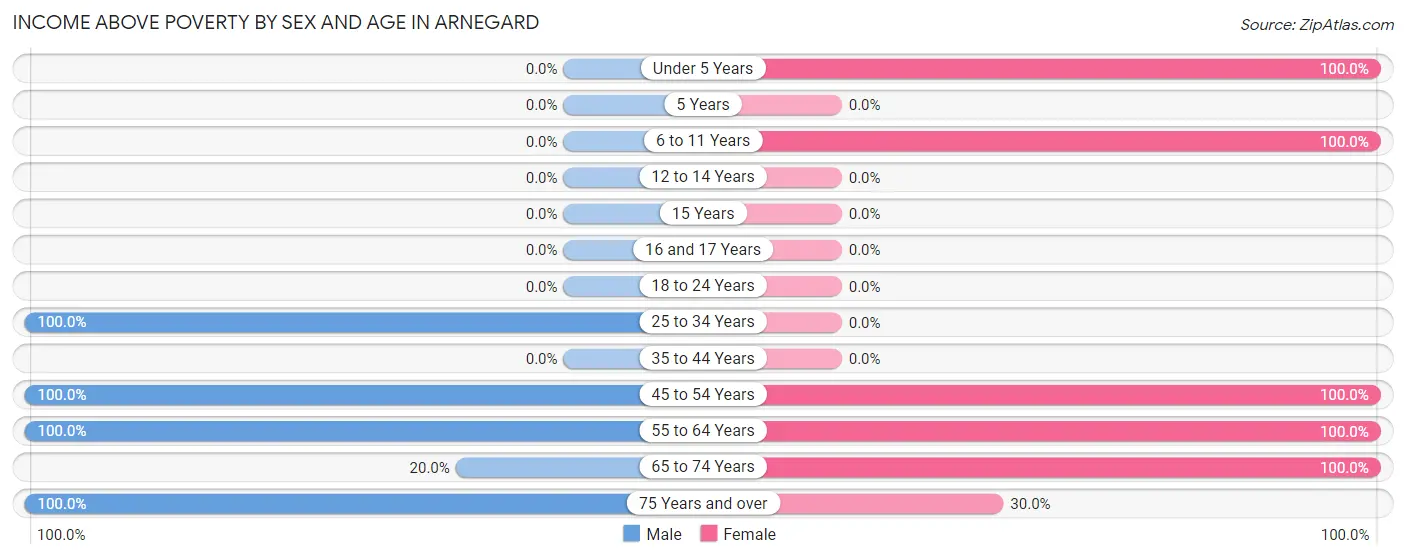
| Age Bracket | Male | Female |
| Under 5 Years | 0 (0.0%) | 20 (100.0%) |
| 5 Years | 0 (0.0%) | 0 (0.0%) |
| 6 to 11 Years | 0 (0.0%) | 7 (100.0%) |
| 12 to 14 Years | 0 (0.0%) | 0 (0.0%) |
| 15 Years | 0 (0.0%) | 0 (0.0%) |
| 16 and 17 Years | 0 (0.0%) | 0 (0.0%) |
| 18 to 24 Years | 0 (0.0%) | 0 (0.0%) |
| 25 to 34 Years | 8 (100.0%) | 0 (0.0%) |
| 35 to 44 Years | 0 (0.0%) | 0 (0.0%) |
| 45 to 54 Years | 10 (100.0%) | 9 (100.0%) |
| 55 to 64 Years | 33 (100.0%) | 48 (100.0%) |
| 65 to 74 Years | 1 (20.0%) | 2 (100.0%) |
| 75 Years and over | 3 (100.0%) | 3 (30.0%) |
| Total | 55 (93.2%) | 89 (92.7%) |
Income Below Poverty Among Married-Couple Families in Arnegard
The poverty statistics for married-couple families in Arnegard show that 8.7% or 4 of the total 46 families live below the poverty line. Families with no children have the highest poverty rate of 10.8%, comprising of 4 families. On the other hand, families with 1 or 2 children have the lowest poverty rate of 0.0%, which includes 0 families.
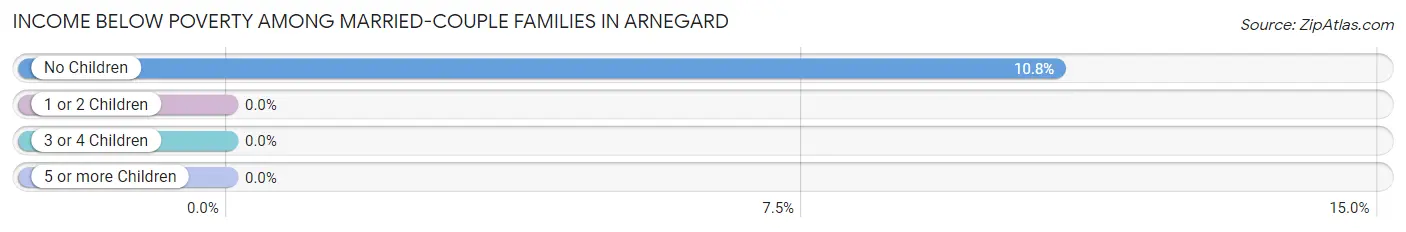
| Children | Above Poverty | Below Poverty |
| No Children | 33 (89.2%) | 4 (10.8%) |
| 1 or 2 Children | 9 (100.0%) | 0 (0.0%) |
| 3 or 4 Children | 0 (0.0%) | 0 (0.0%) |
| 5 or more Children | 0 (0.0%) | 0 (0.0%) |
| Total | 42 (91.3%) | 4 (8.7%) |
Income Below Poverty Among Single-Parent Households in Arnegard
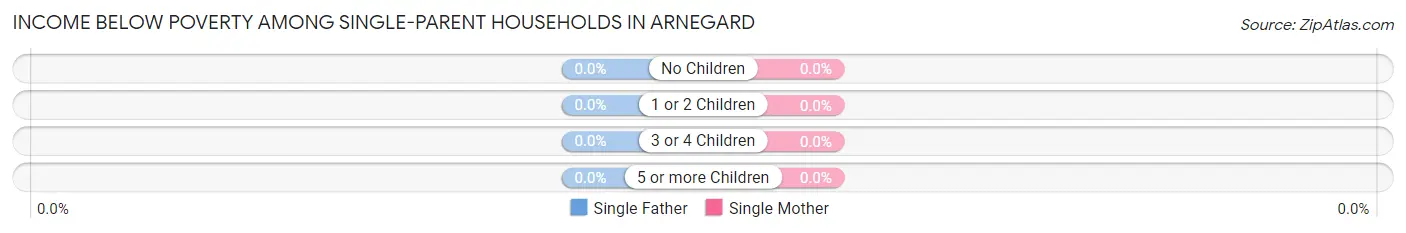
| Children | Single Father | Single Mother |
| No Children | 0 (0.0%) | 0 (0.0%) |
| 1 or 2 Children | 0 (0.0%) | 0 (0.0%) |
| 3 or 4 Children | 0 (0.0%) | 0 (0.0%) |
| 5 or more Children | 0 (0.0%) | 0 (0.0%) |
| Total | 0 (0.0%) | 0 (0.0%) |
Income Below Poverty Among Married-Couple vs Single-Parent Households in Arnegard
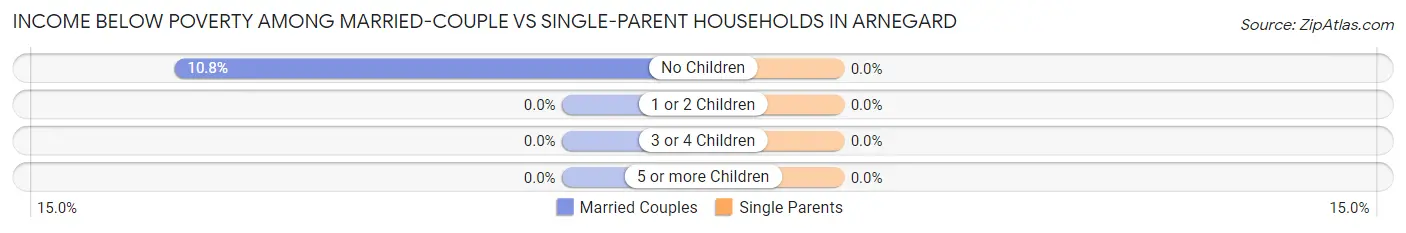
| Children | Married-Couple Families | Single-Parent Households |
| No Children | 4 (10.8%) | 0 (0.0%) |
| 1 or 2 Children | 0 (0.0%) | 0 (0.0%) |
| 3 or 4 Children | 0 (0.0%) | 0 (0.0%) |
| 5 or more Children | 0 (0.0%) | 0 (0.0%) |
| Total | 4 (8.7%) | 0 (0.0%) |
Race in Arnegard
The most populous races in Arnegard are White / Caucasian (137 | 88.4%), Hispanic or Latino (11 | 7.1%), and Native / Alaskan (9 | 5.8%).
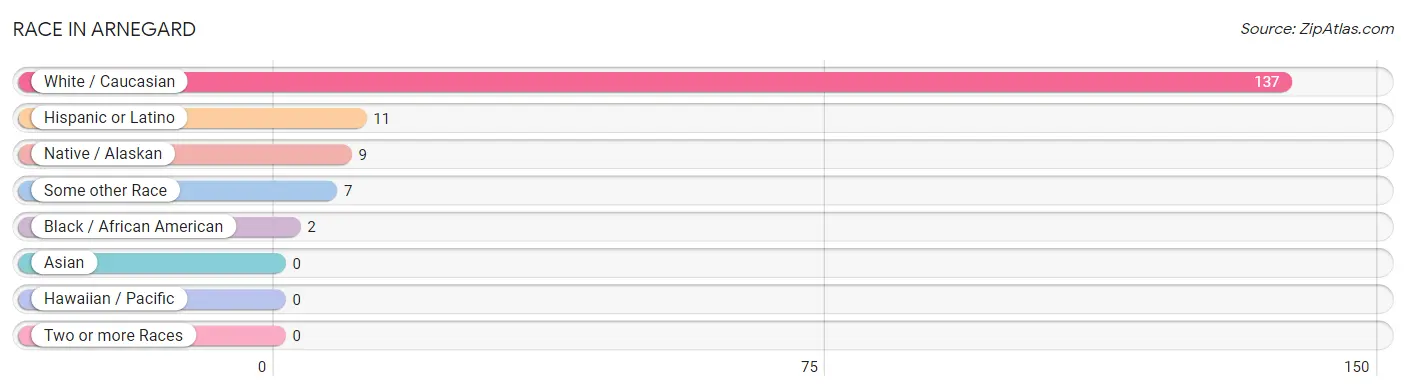
| Race | # Population | % Population |
| Asian | 0 | 0.0% |
| Black / African American | 2 | 1.3% |
| Hawaiian / Pacific | 0 | 0.0% |
| Hispanic or Latino | 11 | 7.1% |
| Native / Alaskan | 9 | 5.8% |
| White / Caucasian | 137 | 88.4% |
| Two or more Races | 0 | 0.0% |
| Some other Race | 7 | 4.5% |
| Total | 155 | 100.0% |
Ancestry in Arnegard
The most populous ancestries reported in Arnegard are Irish (62 | 40.0%), French (37 | 23.9%), German (23 | 14.8%), Norwegian (21 | 13.6%), and English (9 | 5.8%), together accounting for 98.1% of all Arnegard residents.
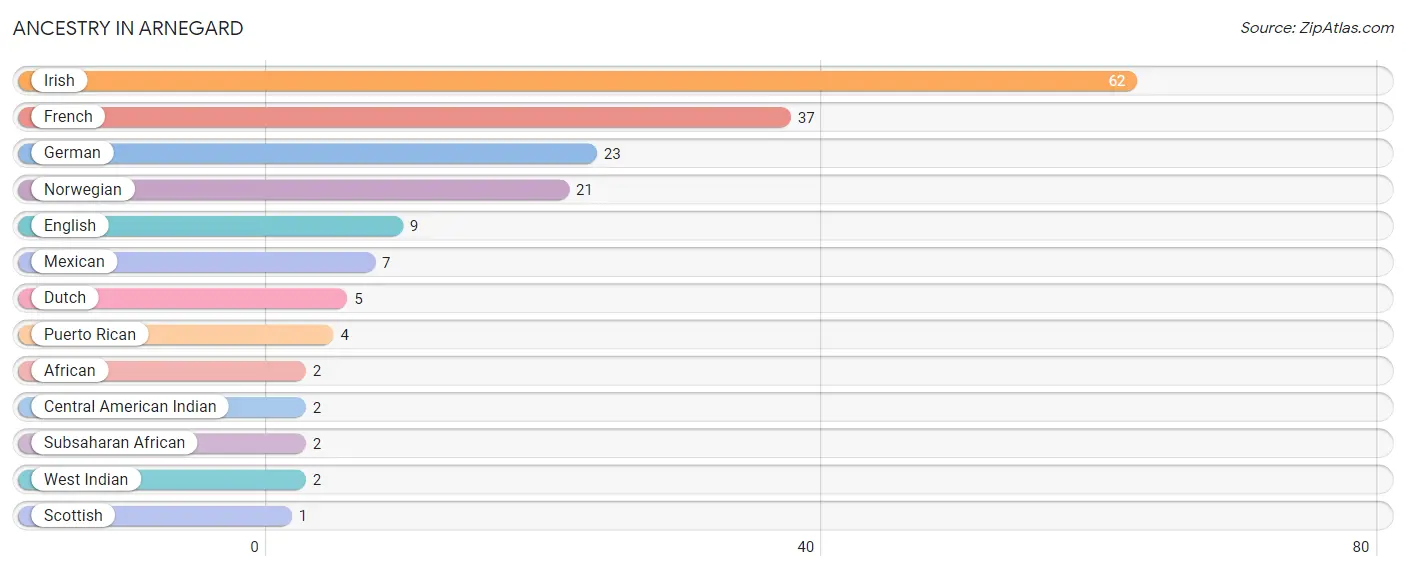
| Ancestry | # Population | % Population |
| African | 2 | 1.3% |
| Central American Indian | 2 | 1.3% |
| Dutch | 5 | 3.2% |
| English | 9 | 5.8% |
| French | 37 | 23.9% |
| German | 23 | 14.8% |
| Irish | 62 | 40.0% |
| Mexican | 7 | 4.5% |
| Norwegian | 21 | 13.6% |
| Puerto Rican | 4 | 2.6% |
| Scottish | 1 | 0.6% |
| Subsaharan African | 2 | 1.3% |
| West Indian | 2 | 1.3% | View All 13 Rows |
Immigrants in Arnegard

| Immigration Origin | # Population | % Population | View All 0 Rows |
Sex and Age in Arnegard
Sex and Age in Arnegard
The most populous age groups in Arnegard are 60 to 64 Years (18 | 30.5%) for men and 55 to 59 Years (31 | 32.3%) for women.
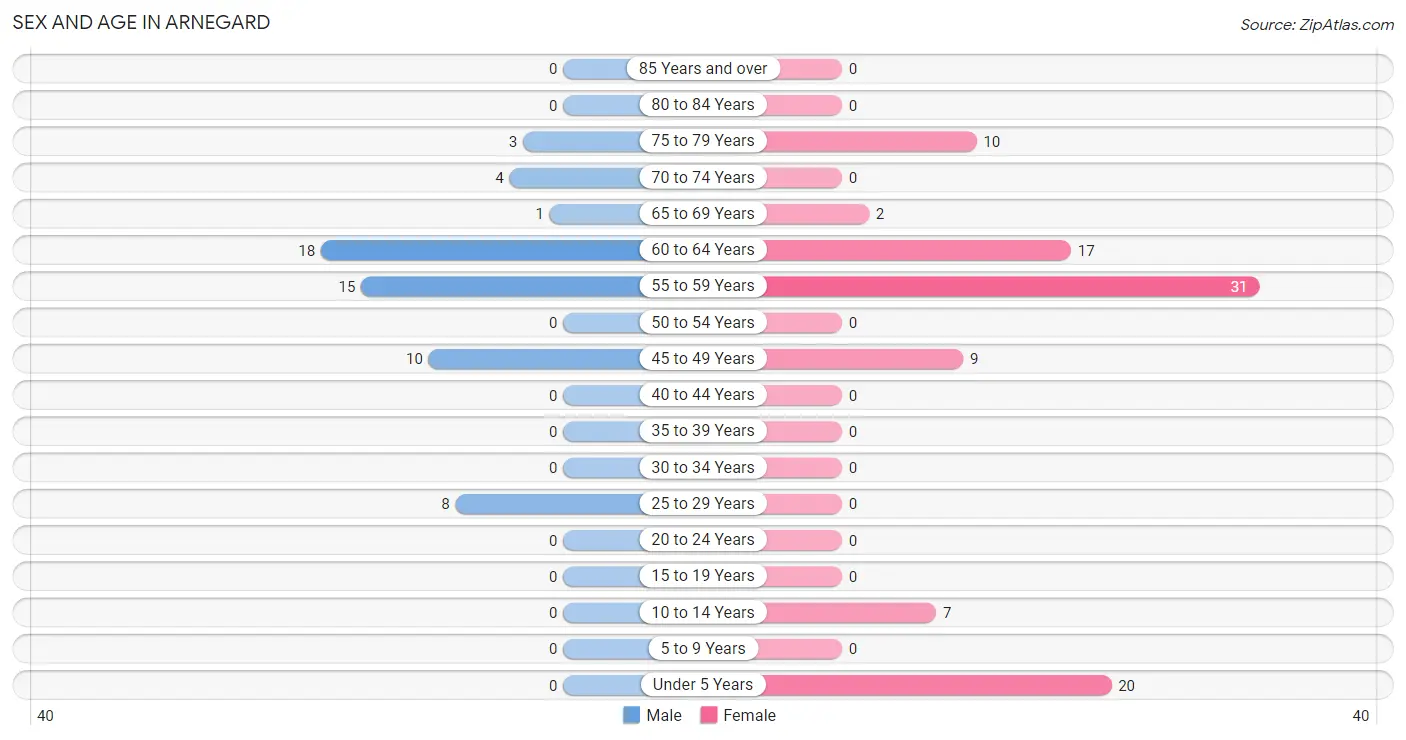
| Age Bracket | Male | Female |
| Under 5 Years | 0 (0.0%) | 20 (20.8%) |
| 5 to 9 Years | 0 (0.0%) | 0 (0.0%) |
| 10 to 14 Years | 0 (0.0%) | 7 (7.3%) |
| 15 to 19 Years | 0 (0.0%) | 0 (0.0%) |
| 20 to 24 Years | 0 (0.0%) | 0 (0.0%) |
| 25 to 29 Years | 8 (13.6%) | 0 (0.0%) |
| 30 to 34 Years | 0 (0.0%) | 0 (0.0%) |
| 35 to 39 Years | 0 (0.0%) | 0 (0.0%) |
| 40 to 44 Years | 0 (0.0%) | 0 (0.0%) |
| 45 to 49 Years | 10 (17.0%) | 9 (9.4%) |
| 50 to 54 Years | 0 (0.0%) | 0 (0.0%) |
| 55 to 59 Years | 15 (25.4%) | 31 (32.3%) |
| 60 to 64 Years | 18 (30.5%) | 17 (17.7%) |
| 65 to 69 Years | 1 (1.7%) | 2 (2.1%) |
| 70 to 74 Years | 4 (6.8%) | 0 (0.0%) |
| 75 to 79 Years | 3 (5.1%) | 10 (10.4%) |
| 80 to 84 Years | 0 (0.0%) | 0 (0.0%) |
| 85 Years and over | 0 (0.0%) | 0 (0.0%) |
| Total | 59 (100.0%) | 96 (100.0%) |
Families and Households in Arnegard
Median Family Size in Arnegard
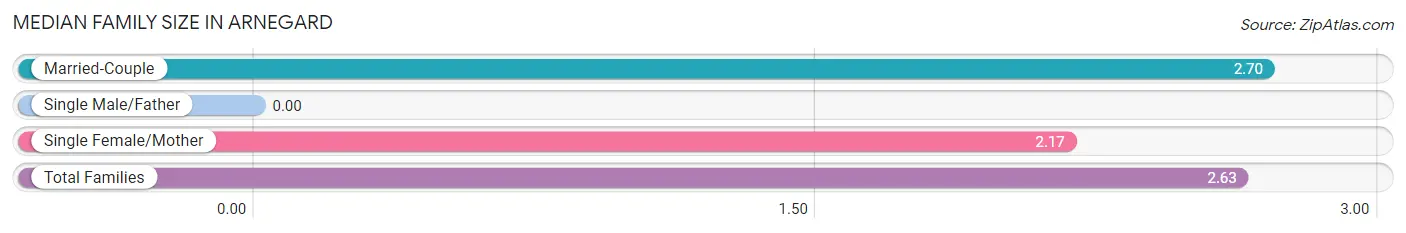
| Family Type | # Families | Family Size |
| Married-Couple | 46 (88.5%) | 2.70 |
| Single Male/Father | 0 (0.0%) | - |
| Single Female/Mother | 6 (11.5%) | 2.17 |
| Total Families | 52 (100.0%) | 2.63 |
Median Household Size in Arnegard
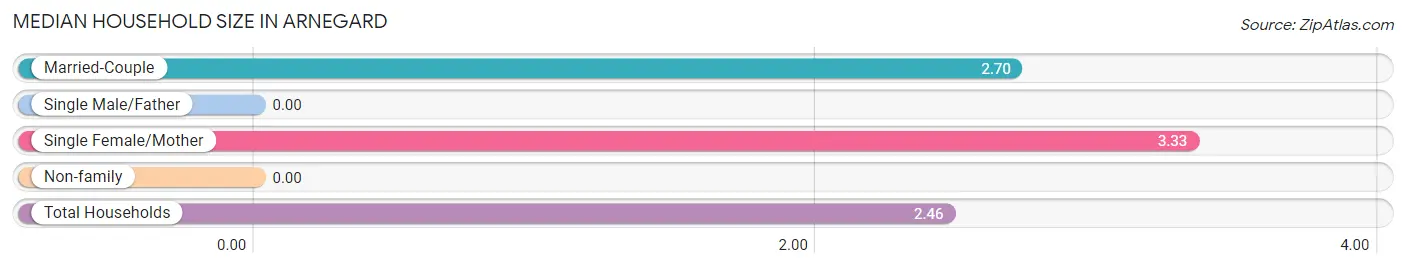
| Household Type | # Households | Household Size |
| Married-Couple | 46 (73.0%) | 2.70 |
| Single Male/Father | 0 (0.0%) | - |
| Single Female/Mother | 6 (9.5%) | 3.33 |
| Non-family | 11 (17.5%) | - |
| Total Households | 63 (100.0%) | 2.46 |
Household Size by Marriage Status in Arnegard
Out of a total of 63 households in Arnegard, 52 (82.5%) are family households, while 11 (17.5%) are nonfamily households. The most numerous type of family households are 2-person households, comprising 35, and the most common type of nonfamily households are 1-person households, comprising 11.
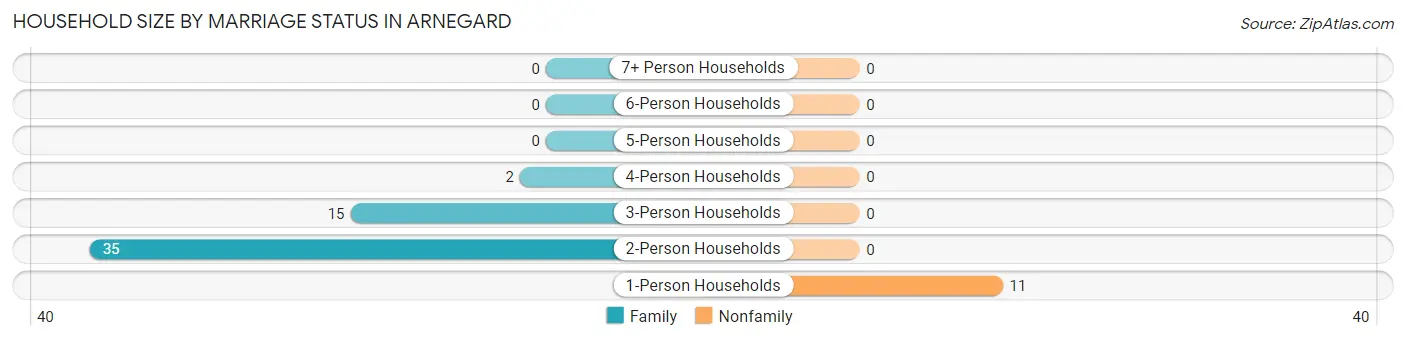
| Household Size | Family Households | Nonfamily Households |
| 1-Person Households | - | 11 (17.5%) |
| 2-Person Households | 35 (55.6%) | 0 (0.0%) |
| 3-Person Households | 15 (23.8%) | 0 (0.0%) |
| 4-Person Households | 2 (3.2%) | 0 (0.0%) |
| 5-Person Households | 0 (0.0%) | 0 (0.0%) |
| 6-Person Households | 0 (0.0%) | 0 (0.0%) |
| 7+ Person Households | 0 (0.0%) | 0 (0.0%) |
| Total | 52 (82.5%) | 11 (17.5%) |
Female Fertility in Arnegard
Fertility by Age in Arnegard
| Age Bracket | Women with Births | Births / 1,000 Women |
| 15 to 19 years | 0 (0.0%) | 0.0 |
| 20 to 34 years | 0 (0.0%) | 0.0 |
| 35 to 50 years | 0 (0.0%) | 0.0 |
| Total | 0 (0.0%) | 0.0 |
Fertility by Age by Marriage Status in Arnegard
| Age Bracket | Married | Unmarried |
| 15 to 19 years | 0 (0.0%) | 0 (0.0%) |
| 20 to 34 years | 0 (0.0%) | 0 (0.0%) |
| 35 to 50 years | 0 (0.0%) | 0 (0.0%) |
| Total | 0 (0.0%) | 0 (0.0%) |
Fertility by Education in Arnegard
| Educational Attainment | Women with Births | Births / 1,000 Women |
| Less than High School | 0 (0.0%) | 0.0 |
| High School Diploma | 0 (0.0%) | 0.0 |
| College or Associate's Degree | 0 (0.0%) | 0.0 |
| Bachelor's Degree | 0 (0.0%) | 0.0 |
| Graduate Degree | 0 (0.0%) | 0.0 |
| Total | 0 (0.0%) | 0.0 |
Fertility by Education by Marriage Status in Arnegard
| Educational Attainment | Married | Unmarried |
| Less than High School | 0 (0.0%) | 0 (0.0%) |
| High School Diploma | 0 (0.0%) | 0 (0.0%) |
| College or Associate's Degree | 0 (0.0%) | 0 (0.0%) |
| Bachelor's Degree | 0 (0.0%) | 0 (0.0%) |
| Graduate Degree | 0 (0.0%) | 0 (0.0%) |
| Total | 0 (0.0%) | 0 (0.0%) |
Employment Characteristics in Arnegard
Employment by Class of Employer in Arnegard
Among the 84 employed individuals in Arnegard, private company employees (61 | 72.6%), not-for-profit organizations (21 | 25.0%), and local government employees (2 | 2.4%) make up the most common classes of employment.
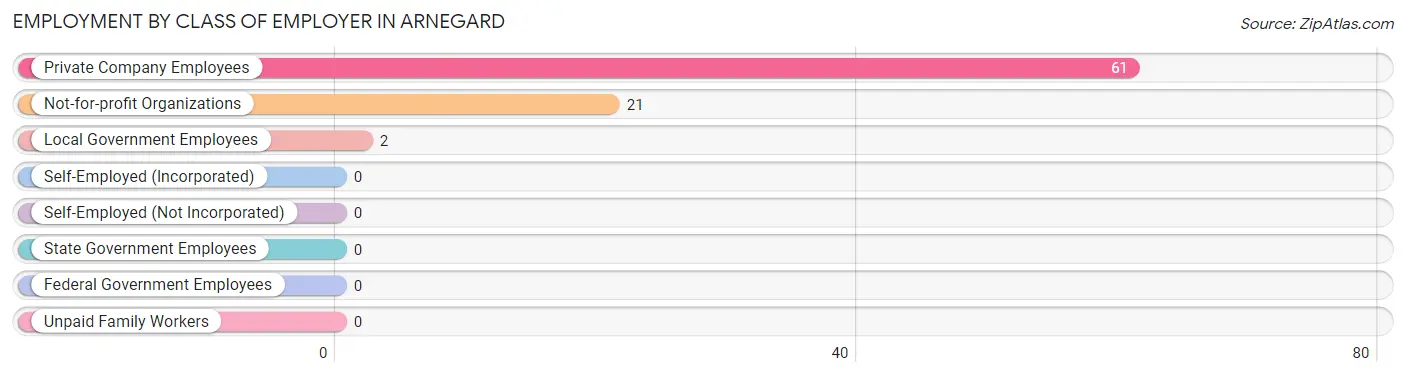
| Employer Class | # Employees | % Employees |
| Private Company Employees | 61 | 72.6% |
| Self-Employed (Incorporated) | 0 | 0.0% |
| Self-Employed (Not Incorporated) | 0 | 0.0% |
| Not-for-profit Organizations | 21 | 25.0% |
| Local Government Employees | 2 | 2.4% |
| State Government Employees | 0 | 0.0% |
| Federal Government Employees | 0 | 0.0% |
| Unpaid Family Workers | 0 | 0.0% |
| Total | 84 | 100.0% |
Employment Status by Age in Arnegard
According to the labor force statistics for Arnegard, out of the total population over 16 years of age (128), 72.7% or 93 individuals are in the labor force, with 8.6% or 8 of them unemployed. The age group with the highest labor force participation rate is 25 to 29 years, with 100.0% or 8 individuals in the labor force. Within the labor force, the 60 to 64 years age range has the highest percentage of unemployed individuals, with 44.4% or 8 of them being unemployed.
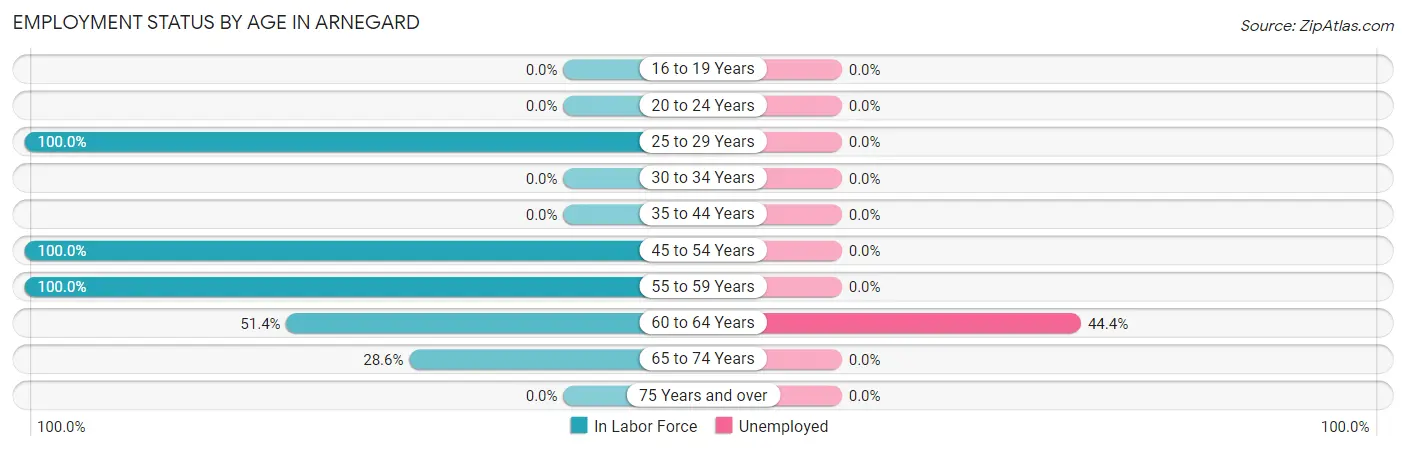
| Age Bracket | In Labor Force | Unemployed |
| 16 to 19 Years | 0 (0.0%) | 0 (0.0%) |
| 20 to 24 Years | 0 (0.0%) | 0 (0.0%) |
| 25 to 29 Years | 8 (100.0%) | 0 (0.0%) |
| 30 to 34 Years | 0 (0.0%) | 0 (0.0%) |
| 35 to 44 Years | 0 (0.0%) | 0 (0.0%) |
| 45 to 54 Years | 19 (100.0%) | 0 (0.0%) |
| 55 to 59 Years | 46 (100.0%) | 0 (0.0%) |
| 60 to 64 Years | 18 (51.4%) | 8 (44.4%) |
| 65 to 74 Years | 2 (28.6%) | 0 (0.0%) |
| 75 Years and over | 0 (0.0%) | 0 (0.0%) |
| Total | 93 (72.7%) | 8 (8.6%) |
Employment Status by Educational Attainment in Arnegard
According to labor force statistics for Arnegard, 84.3% of individuals (91) out of the total population between 25 and 64 years of age (108) are in the labor force, with 8.8% or 8 of them being unemployed. The group with the highest labor force participation rate are those with the educational attainment of college / associate degree, with 95.2% or 59 individuals in the labor force. Within the labor force, individuals with college / associate degree education have the highest percentage of unemployment, with 13.6% or 8 of them being unemployed.
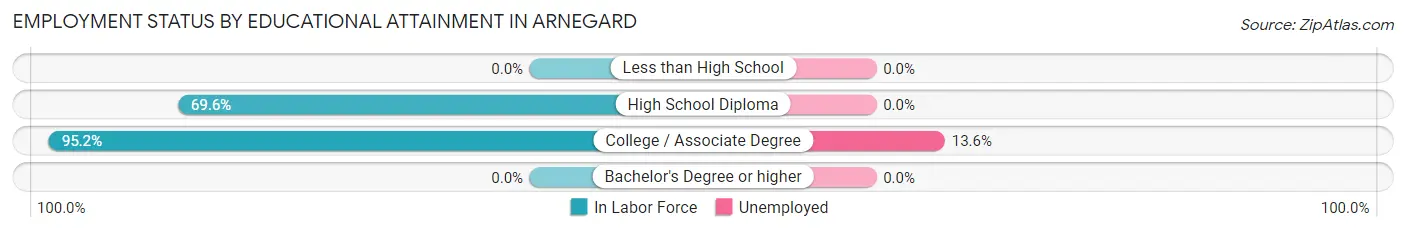
| Educational Attainment | In Labor Force | Unemployed |
| Less than High School | 0 (0.0%) | 0 (0.0%) |
| High School Diploma | 32 (69.6%) | 0 (0.0%) |
| College / Associate Degree | 59 (95.2%) | 8 (13.6%) |
| Bachelor's Degree or higher | 0 (0.0%) | 0 (0.0%) |
| Total | 91 (84.3%) | 10 (8.8%) |
Employment Occupations by Sex in Arnegard
Management, Business, Science and Arts Occupations
The most common Management, Business, Science and Arts occupations in Arnegard are Management (23 | 27.1%), Health Diagnosing & Treating (12 | 14.1%), Health Technologists (10 | 11.8%), Community & Social Service (5 | 5.9%), and Legal Services & Support (3 | 3.5%).
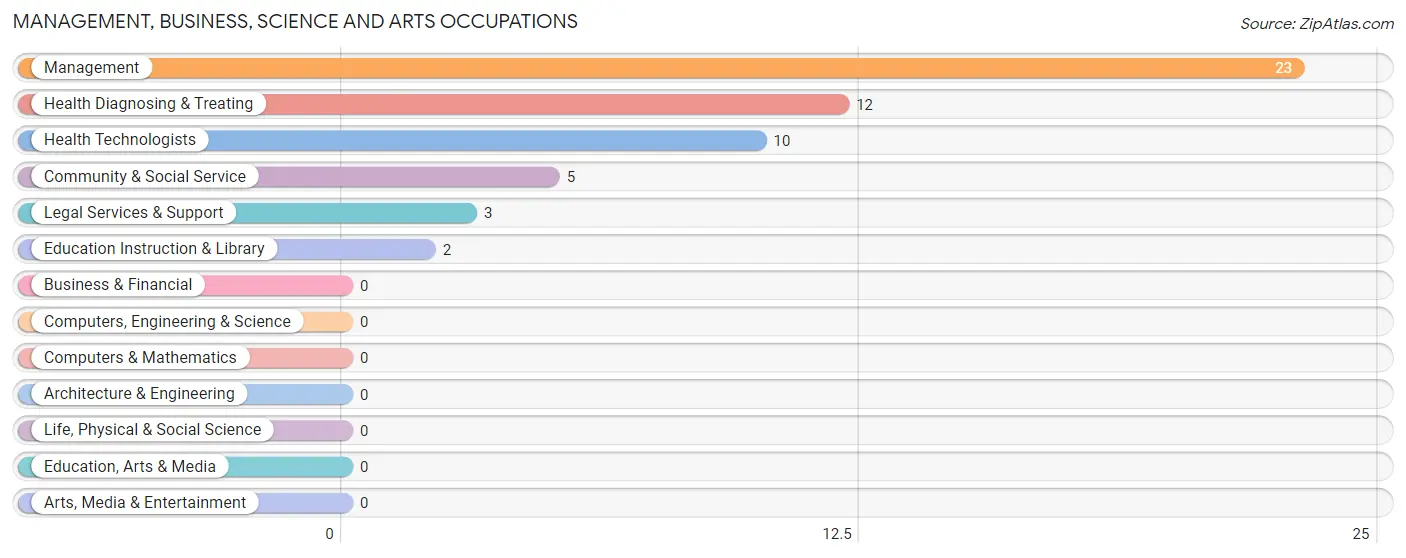
Management, Business, Science and Arts Occupations by Sex
Within the Management, Business, Science and Arts occupations in Arnegard, the most male-oriented occupations are Health Diagnosing & Treating (91.7%), Health Technologists (90.0%), and Management (26.1%), while the most female-oriented occupations are Community & Social Service (100.0%), Legal Services & Support (100.0%), and Education Instruction & Library (100.0%).
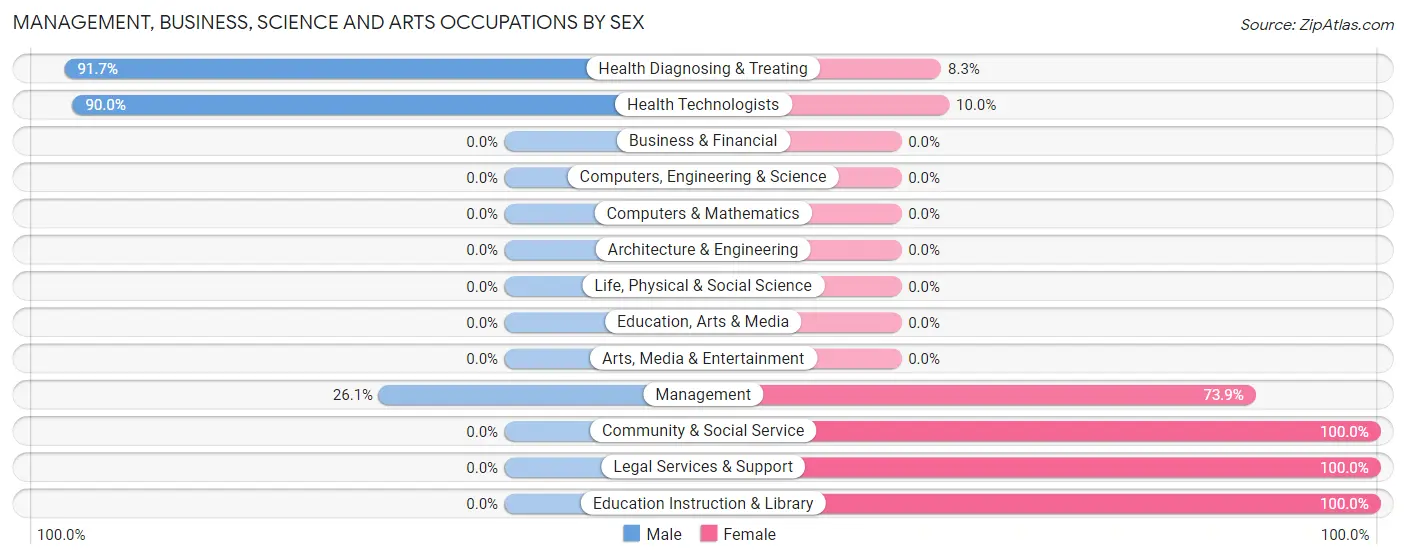
| Occupation | Male | Female |
| Management | 6 (26.1%) | 17 (73.9%) |
| Business & Financial | 0 (0.0%) | 0 (0.0%) |
| Computers, Engineering & Science | 0 (0.0%) | 0 (0.0%) |
| Computers & Mathematics | 0 (0.0%) | 0 (0.0%) |
| Architecture & Engineering | 0 (0.0%) | 0 (0.0%) |
| Life, Physical & Social Science | 0 (0.0%) | 0 (0.0%) |
| Community & Social Service | 0 (0.0%) | 5 (100.0%) |
| Education, Arts & Media | 0 (0.0%) | 0 (0.0%) |
| Legal Services & Support | 0 (0.0%) | 3 (100.0%) |
| Education Instruction & Library | 0 (0.0%) | 2 (100.0%) |
| Arts, Media & Entertainment | 0 (0.0%) | 0 (0.0%) |
| Health Diagnosing & Treating | 11 (91.7%) | 1 (8.3%) |
| Health Technologists | 9 (90.0%) | 1 (10.0%) |
| Total (Category) | 17 (42.5%) | 23 (57.5%) |
| Total (Overall) | 42 (49.4%) | 43 (50.6%) |
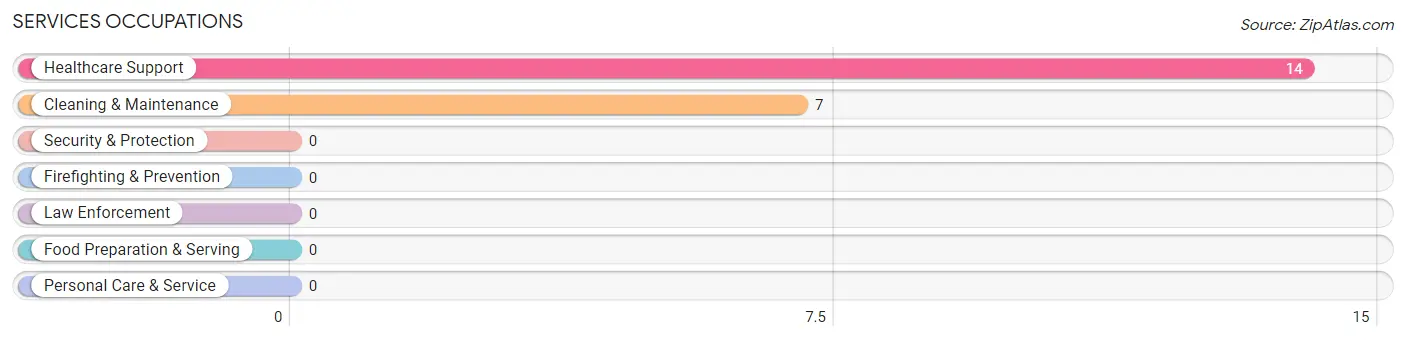
Services Occupations
The most common Services occupations in Arnegard are Healthcare Support (14 | 16.5%), and Cleaning & Maintenance (7 | 8.2%).
Services Occupations by Sex
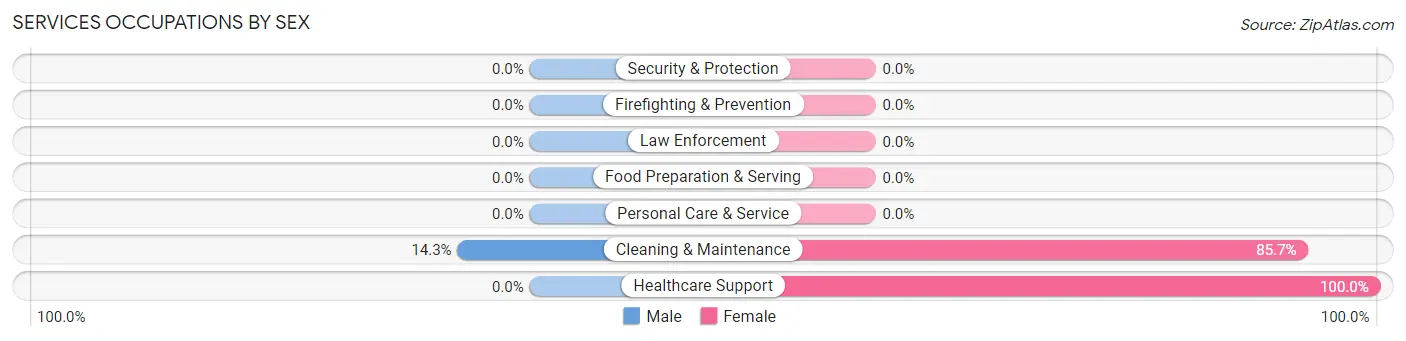
| Occupation | Male | Female |
| Healthcare Support | 0 (0.0%) | 14 (100.0%) |
| Security & Protection | 0 (0.0%) | 0 (0.0%) |
| Firefighting & Prevention | 0 (0.0%) | 0 (0.0%) |
| Law Enforcement | 0 (0.0%) | 0 (0.0%) |
| Food Preparation & Serving | 0 (0.0%) | 0 (0.0%) |
| Cleaning & Maintenance | 1 (14.3%) | 6 (85.7%) |
| Personal Care & Service | 0 (0.0%) | 0 (0.0%) |
| Total (Category) | 1 (4.8%) | 20 (95.2%) |
| Total (Overall) | 42 (49.4%) | 43 (50.6%) |
Sales and Office Occupations
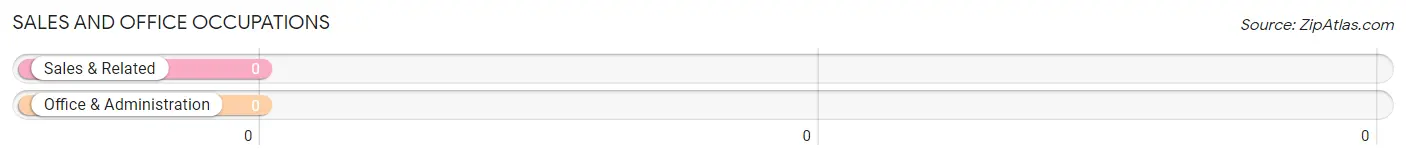
Sales and Office Occupations by Sex
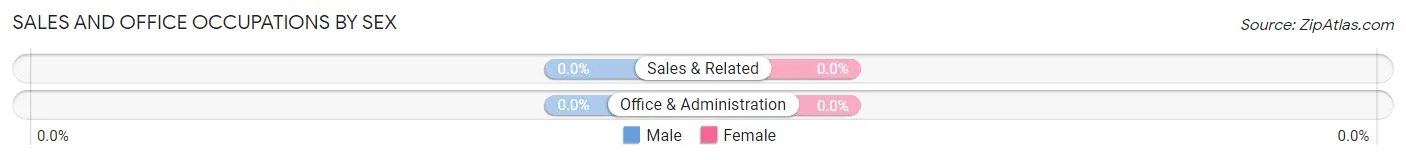
| Occupation | Male | Female |
| Sales & Related | 0 (0.0%) | 0 (0.0%) |
| Office & Administration | 0 (0.0%) | 0 (0.0%) |
| Total (Category) | 0 (0.0%) | 0 (0.0%) |
| Total (Overall) | 42 (49.4%) | 43 (50.6%) |
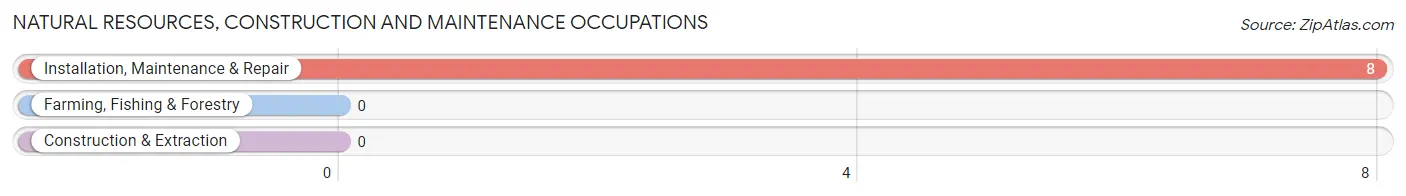
Natural Resources, Construction and Maintenance Occupations
The most common Natural Resources, Construction and Maintenance occupations in Arnegard are , and Installation, Maintenance & Repair (8 | 9.4%).
Natural Resources, Construction and Maintenance Occupations by Sex
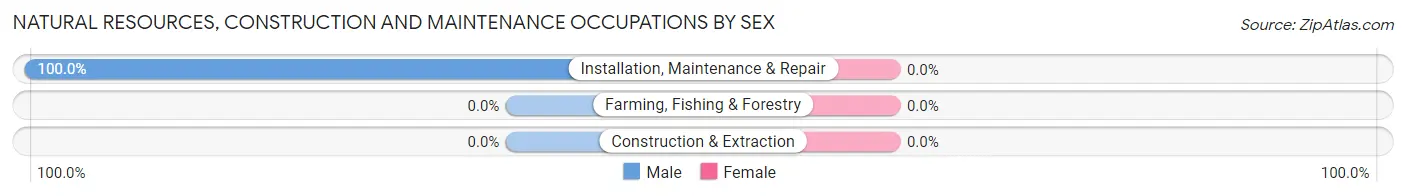
| Occupation | Male | Female |
| Farming, Fishing & Forestry | 0 (0.0%) | 0 (0.0%) |
| Construction & Extraction | 0 (0.0%) | 0 (0.0%) |
| Installation, Maintenance & Repair | 8 (100.0%) | 0 (0.0%) |
| Total (Category) | 8 (100.0%) | 0 (0.0%) |
| Total (Overall) | 42 (49.4%) | 43 (50.6%) |
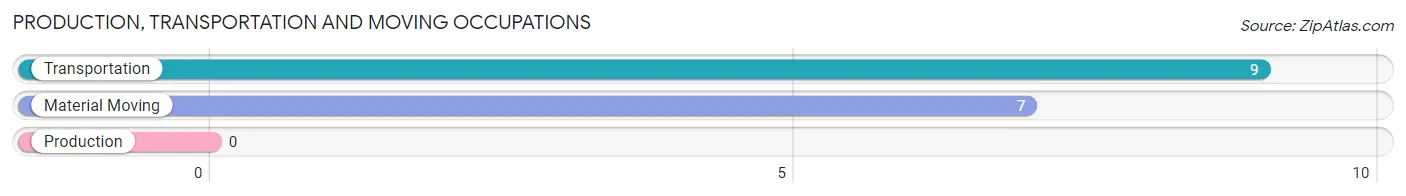
Production, Transportation and Moving Occupations
The most common Production, Transportation and Moving occupations in Arnegard are Transportation (9 | 10.6%), and Material Moving (7 | 8.2%).
Production, Transportation and Moving Occupations by Sex
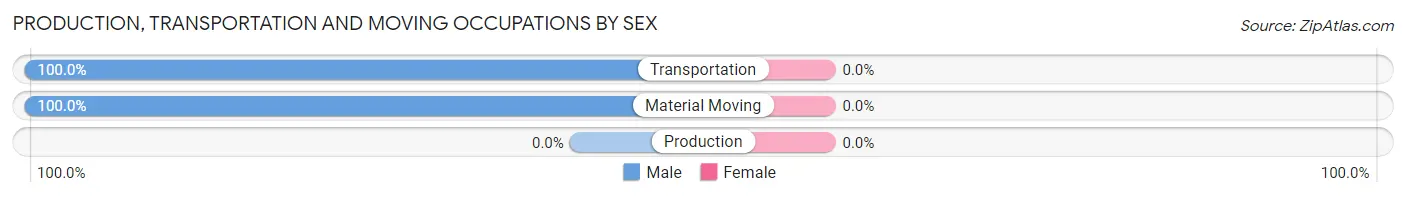
| Occupation | Male | Female |
| Production | 0 (0.0%) | 0 (0.0%) |
| Transportation | 9 (100.0%) | 0 (0.0%) |
| Material Moving | 7 (100.0%) | 0 (0.0%) |
| Total (Category) | 16 (100.0%) | 0 (0.0%) |
| Total (Overall) | 42 (49.4%) | 43 (50.6%) |
Employment Industries by Sex in Arnegard
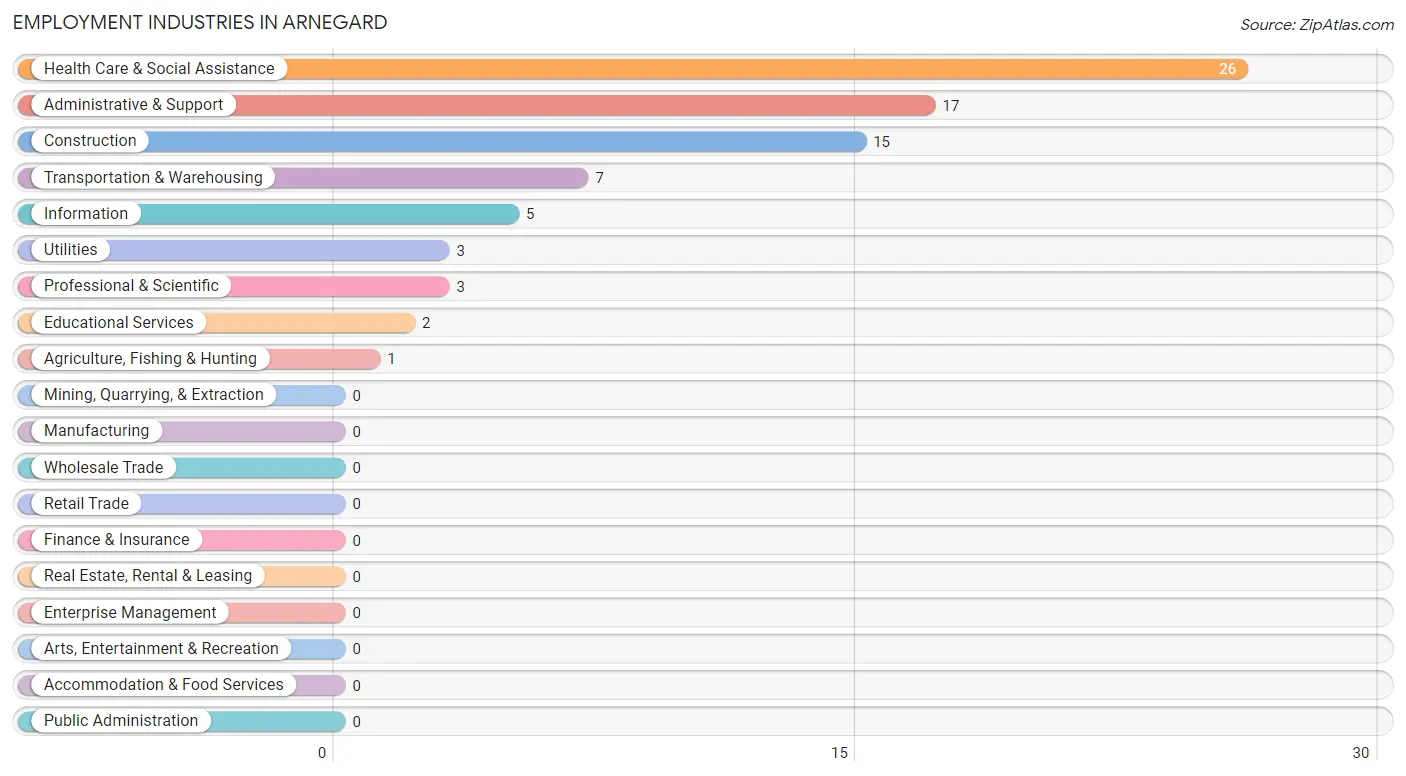
Employment Industries in Arnegard
The major employment industries in Arnegard include Health Care & Social Assistance (26 | 30.6%), Administrative & Support (17 | 20.0%), Construction (15 | 17.6%), Transportation & Warehousing (7 | 8.2%), and Information (5 | 5.9%).
Employment Industries by Sex in Arnegard
The Arnegard industries that see more men than women are Agriculture, Fishing & Hunting (100.0%), Construction (100.0%), and Transportation & Warehousing (100.0%), whereas the industries that tend to have a higher number of women are Professional & Scientific (100.0%), Administrative & Support (100.0%), and Educational Services (100.0%).
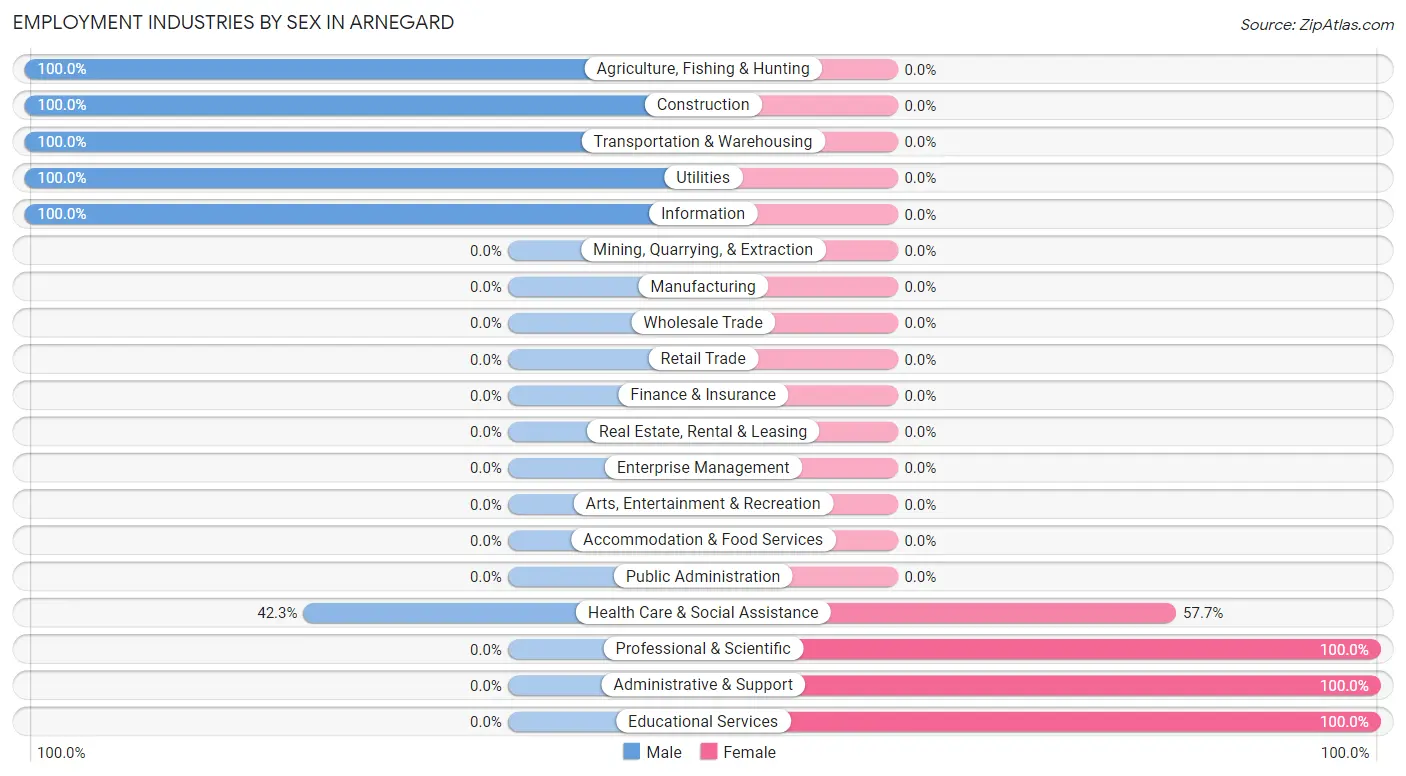
| Industry | Male | Female |
| Agriculture, Fishing & Hunting | 1 (100.0%) | 0 (0.0%) |
| Mining, Quarrying, & Extraction | 0 (0.0%) | 0 (0.0%) |
| Construction | 15 (100.0%) | 0 (0.0%) |
| Manufacturing | 0 (0.0%) | 0 (0.0%) |
| Wholesale Trade | 0 (0.0%) | 0 (0.0%) |
| Retail Trade | 0 (0.0%) | 0 (0.0%) |
| Transportation & Warehousing | 7 (100.0%) | 0 (0.0%) |
| Utilities | 3 (100.0%) | 0 (0.0%) |
| Information | 5 (100.0%) | 0 (0.0%) |
| Finance & Insurance | 0 (0.0%) | 0 (0.0%) |
| Real Estate, Rental & Leasing | 0 (0.0%) | 0 (0.0%) |
| Professional & Scientific | 0 (0.0%) | 3 (100.0%) |
| Enterprise Management | 0 (0.0%) | 0 (0.0%) |
| Administrative & Support | 0 (0.0%) | 17 (100.0%) |
| Educational Services | 0 (0.0%) | 2 (100.0%) |
| Health Care & Social Assistance | 11 (42.3%) | 15 (57.7%) |
| Arts, Entertainment & Recreation | 0 (0.0%) | 0 (0.0%) |
| Accommodation & Food Services | 0 (0.0%) | 0 (0.0%) |
| Public Administration | 0 (0.0%) | 0 (0.0%) |
| Total | 42 (49.4%) | 43 (50.6%) |
Education in Arnegard
School Enrollment in Arnegard
The most common levels of schooling among the 34 students in Arnegard are nursery / preschool (20 | 58.8%), elementary school (7 | 20.6%), and middle school (7 | 20.6%).
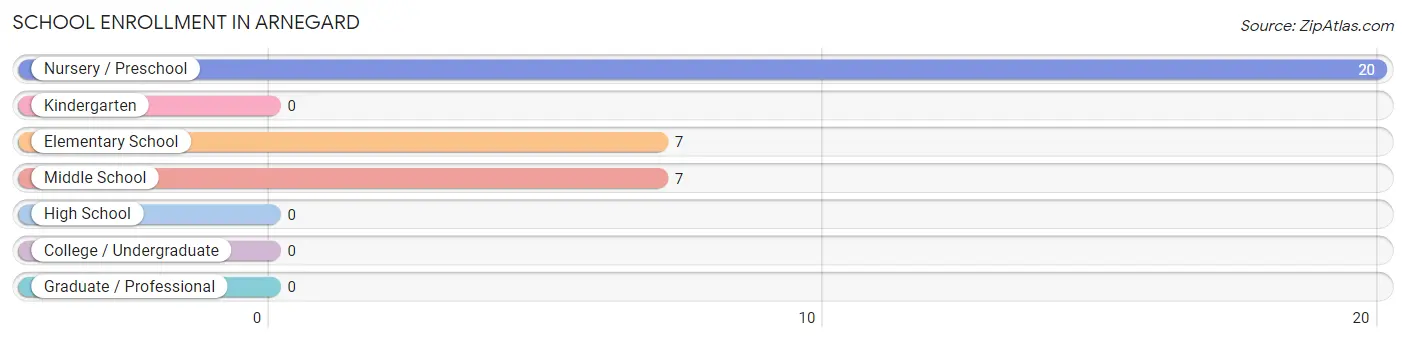
| School Level | # Students | % Students |
| Nursery / Preschool | 20 | 58.8% |
| Kindergarten | 0 | 0.0% |
| Elementary School | 7 | 20.6% |
| Middle School | 7 | 20.6% |
| High School | 0 | 0.0% |
| College / Undergraduate | 0 | 0.0% |
| Graduate / Professional | 0 | 0.0% |
| Total | 34 | 100.0% |
School Enrollment by Age by Funding Source in Arnegard
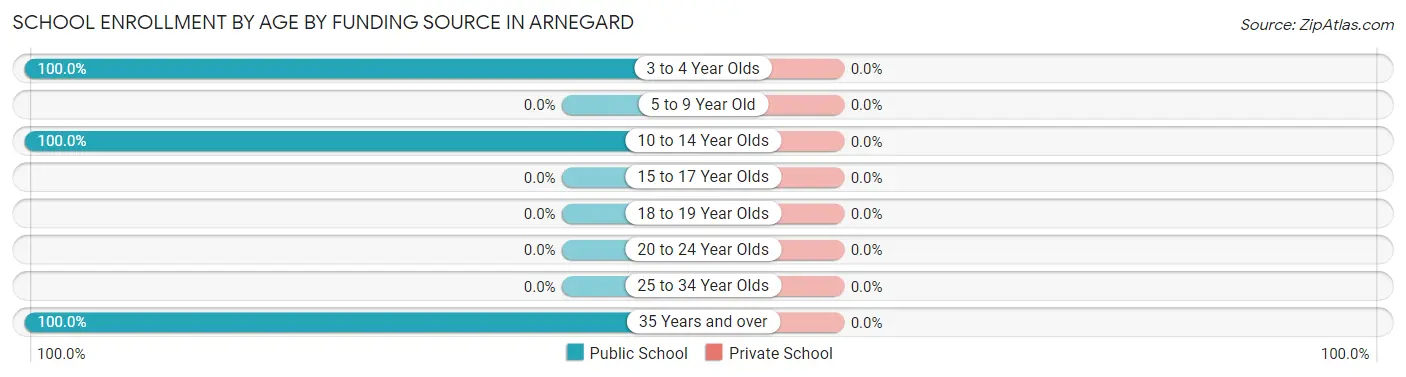
| Age Bracket | Public School | Private School |
| 3 to 4 Year Olds | 20 (100.0%) | 0 (0.0%) |
| 5 to 9 Year Old | 0 (0.0%) | 0 (0.0%) |
| 10 to 14 Year Olds | 7 (100.0%) | 0 (0.0%) |
| 15 to 17 Year Olds | 0 (0.0%) | 0 (0.0%) |
| 18 to 19 Year Olds | 0 (0.0%) | 0 (0.0%) |
| 20 to 24 Year Olds | 0 (0.0%) | 0 (0.0%) |
| 25 to 34 Year Olds | 0 (0.0%) | 0 (0.0%) |
| 35 Years and over | 7 (100.0%) | 0 (0.0%) |
| Total | 34 (100.0%) | 0 (0.0%) |
Educational Attainment by Field of Study in Arnegard
| Field of Study | # Graduates | % Graduates |
| Computers & Mathematics | 0 | 0.0% |
| Bio, Nature & Agricultural | 0 | 0.0% |
| Physical & Health Sciences | 0 | 0.0% |
| Psychology | 0 | 0.0% |
| Social Sciences | 0 | 0.0% |
| Engineering | 0 | 0.0% |
| Multidisciplinary Studies | 0 | 0.0% |
| Science & Technology | 0 | 0.0% |
| Business | 0 | 0.0% |
| Education | 0 | 0.0% |
| Literature & Languages | 0 | 0.0% |
| Liberal Arts & History | 0 | 0.0% |
| Visual & Performing Arts | 0 | 0.0% |
| Communications | 0 | 0.0% |
| Arts & Humanities | 0 | 0.0% |
| Total | 0 | 0.0% |
Transportation & Commute in Arnegard
Vehicle Availability by Sex in Arnegard
The most prevalent vehicle ownership categories in Arnegard are males with 3 vehicles (17, accounting for 41.5%) and females with 3 vehicles (34, making up 39.5%).
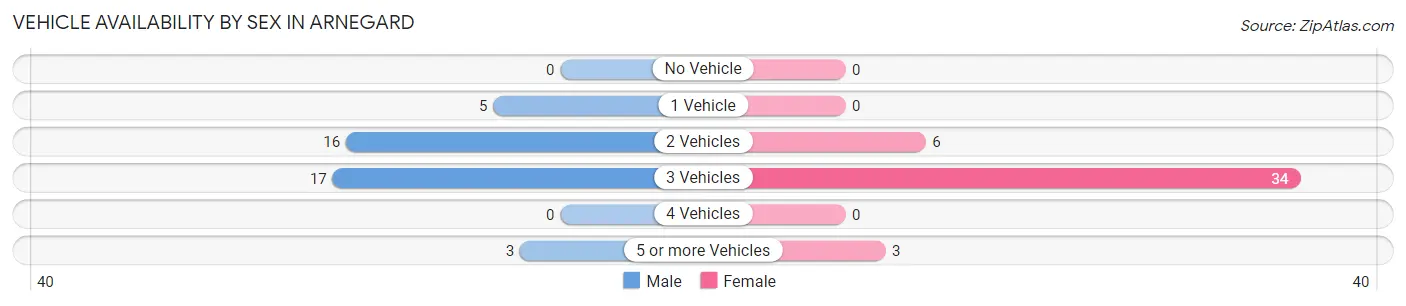
| Vehicles Available | Male | Female |
| No Vehicle | 0 (0.0%) | 0 (0.0%) |
| 1 Vehicle | 5 (12.2%) | 0 (0.0%) |
| 2 Vehicles | 16 (39.0%) | 6 (14.0%) |
| 3 Vehicles | 17 (41.5%) | 34 (79.1%) |
| 4 Vehicles | 0 (0.0%) | 0 (0.0%) |
| 5 or more Vehicles | 3 (7.3%) | 3 (7.0%) |
| Total | 41 (100.0%) | 43 (100.0%) |
Commute Time in Arnegard
The most frequently occuring commute durations in Arnegard are 15 to 19 minutes (37 commuters, 44.1%), less than 5 minutes (27 commuters, 32.1%), and 45 to 59 minutes (9 commuters, 10.7%).
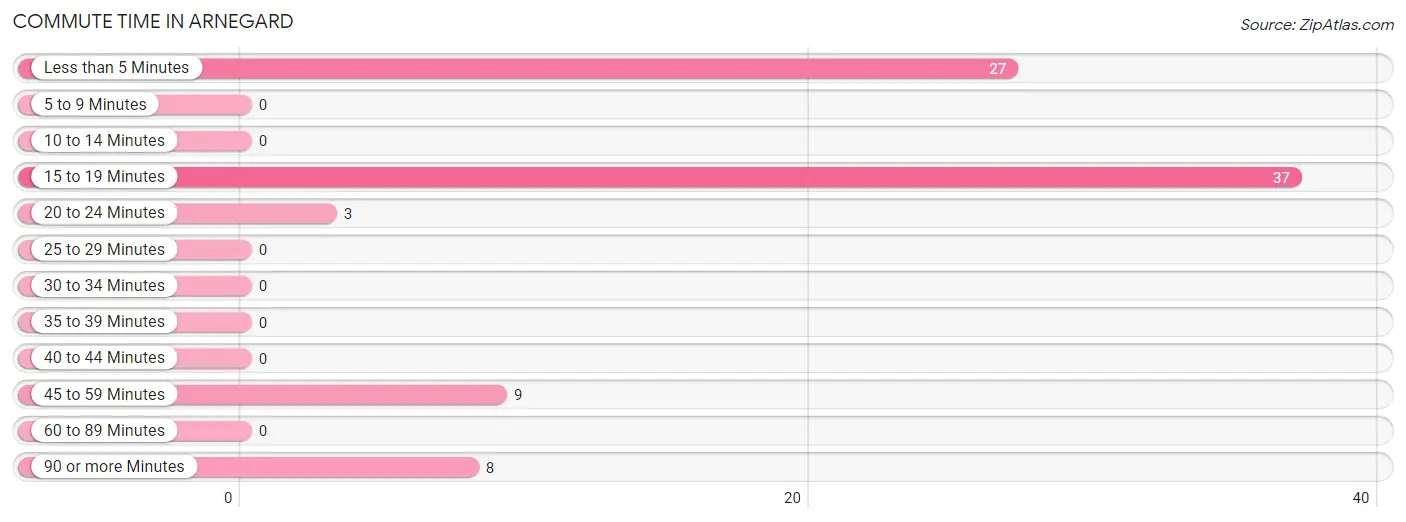
| Commute Time | # Commuters | % Commuters |
| Less than 5 Minutes | 27 | 32.1% |
| 5 to 9 Minutes | 0 | 0.0% |
| 10 to 14 Minutes | 0 | 0.0% |
| 15 to 19 Minutes | 37 | 44.1% |
| 20 to 24 Minutes | 3 | 3.6% |
| 25 to 29 Minutes | 0 | 0.0% |
| 30 to 34 Minutes | 0 | 0.0% |
| 35 to 39 Minutes | 0 | 0.0% |
| 40 to 44 Minutes | 0 | 0.0% |
| 45 to 59 Minutes | 9 | 10.7% |
| 60 to 89 Minutes | 0 | 0.0% |
| 90 or more Minutes | 8 | 9.5% |
Commute Time by Sex in Arnegard
The most common commute times in Arnegard are less than 5 minutes (21 commuters, 51.2%) for males and 15 to 19 minutes (37 commuters, 86.1%) for females.
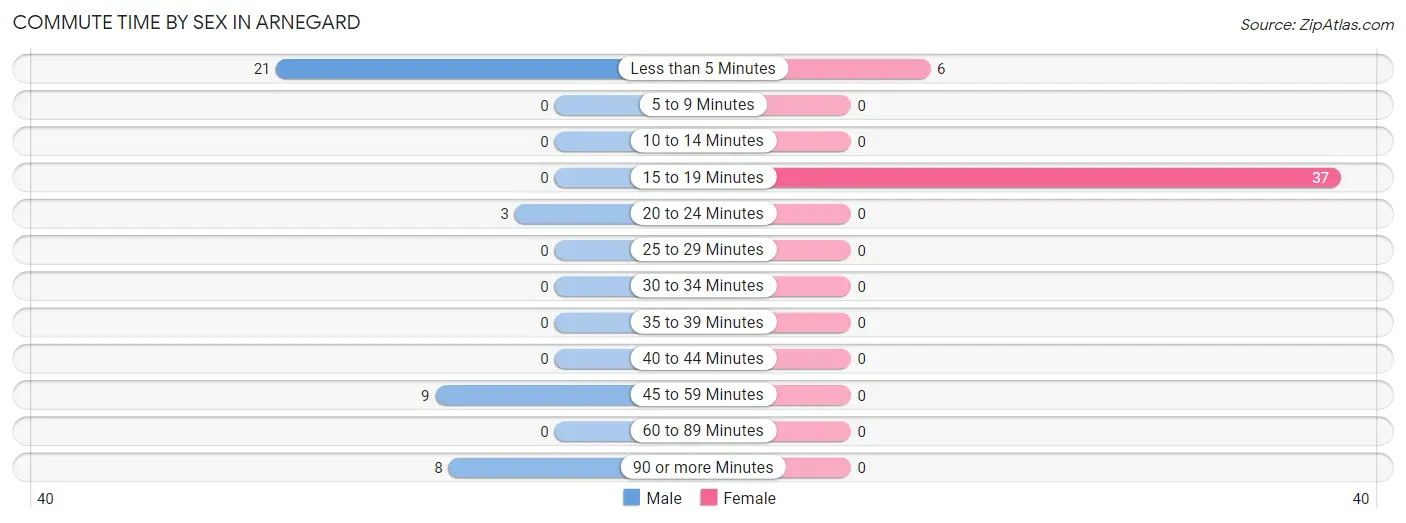
| Commute Time | Male | Female |
| Less than 5 Minutes | 21 (51.2%) | 6 (14.0%) |
| 5 to 9 Minutes | 0 (0.0%) | 0 (0.0%) |
| 10 to 14 Minutes | 0 (0.0%) | 0 (0.0%) |
| 15 to 19 Minutes | 0 (0.0%) | 37 (86.1%) |
| 20 to 24 Minutes | 3 (7.3%) | 0 (0.0%) |
| 25 to 29 Minutes | 0 (0.0%) | 0 (0.0%) |
| 30 to 34 Minutes | 0 (0.0%) | 0 (0.0%) |
| 35 to 39 Minutes | 0 (0.0%) | 0 (0.0%) |
| 40 to 44 Minutes | 0 (0.0%) | 0 (0.0%) |
| 45 to 59 Minutes | 9 (22.0%) | 0 (0.0%) |
| 60 to 89 Minutes | 0 (0.0%) | 0 (0.0%) |
| 90 or more Minutes | 8 (19.5%) | 0 (0.0%) |
Time of Departure to Work by Sex in Arnegard
The most frequent times of departure to work in Arnegard are 7:00 AM to 7:29 AM (12, 29.3%) for males and 5:30 AM to 5:59 AM (17, 39.5%) for females.
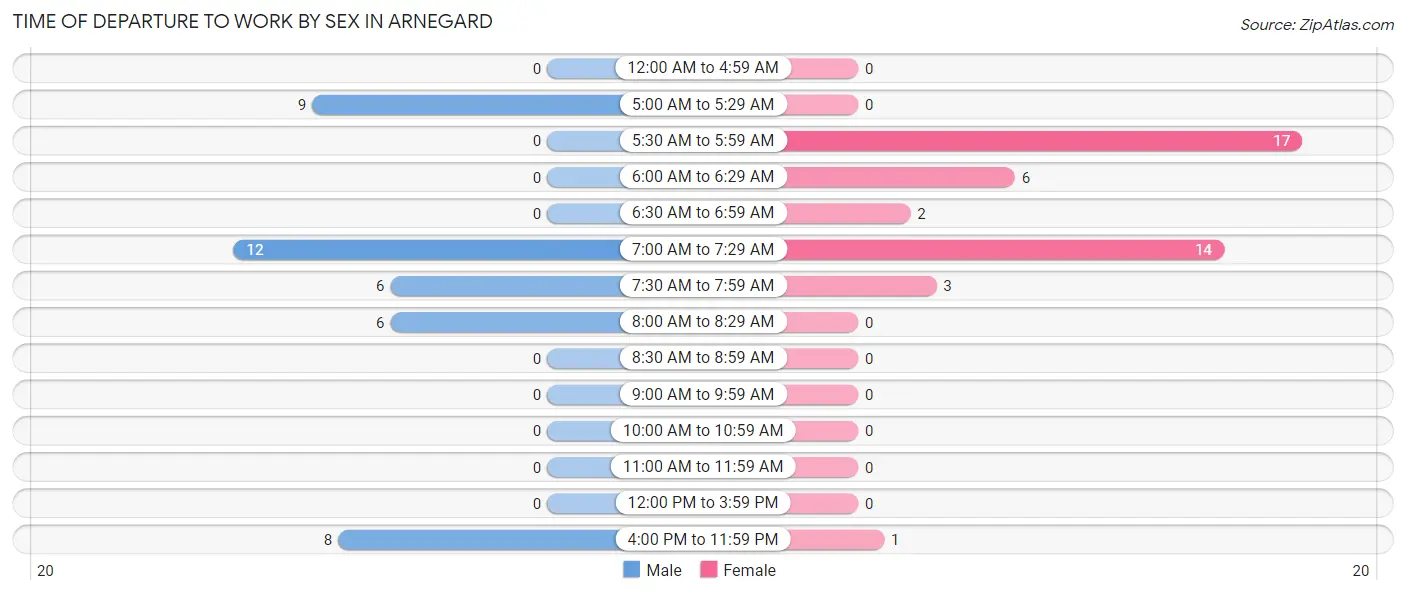
| Time of Departure | Male | Female |
| 12:00 AM to 4:59 AM | 0 (0.0%) | 0 (0.0%) |
| 5:00 AM to 5:29 AM | 9 (22.0%) | 0 (0.0%) |
| 5:30 AM to 5:59 AM | 0 (0.0%) | 17 (39.5%) |
| 6:00 AM to 6:29 AM | 0 (0.0%) | 6 (14.0%) |
| 6:30 AM to 6:59 AM | 0 (0.0%) | 2 (4.6%) |
| 7:00 AM to 7:29 AM | 12 (29.3%) | 14 (32.6%) |
| 7:30 AM to 7:59 AM | 6 (14.6%) | 3 (7.0%) |
| 8:00 AM to 8:29 AM | 6 (14.6%) | 0 (0.0%) |
| 8:30 AM to 8:59 AM | 0 (0.0%) | 0 (0.0%) |
| 9:00 AM to 9:59 AM | 0 (0.0%) | 0 (0.0%) |
| 10:00 AM to 10:59 AM | 0 (0.0%) | 0 (0.0%) |
| 11:00 AM to 11:59 AM | 0 (0.0%) | 0 (0.0%) |
| 12:00 PM to 3:59 PM | 0 (0.0%) | 0 (0.0%) |
| 4:00 PM to 11:59 PM | 8 (19.5%) | 1 (2.3%) |
| Total | 41 (100.0%) | 43 (100.0%) |
Housing Occupancy in Arnegard
Occupancy by Ownership in Arnegard
Of the total 63 dwellings in Arnegard, owner-occupied units account for 63 (100.0%), while renter-occupied units make up 0 (0.0%).
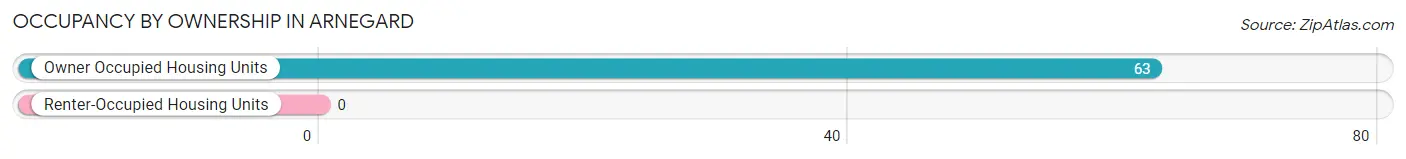
| Occupancy | # Housing Units | % Housing Units |
| Owner Occupied Housing Units | 63 | 100.0% |
| Renter-Occupied Housing Units | 0 | 0.0% |
| Total Occupied Housing Units | 63 | 100.0% |
Occupancy by Household Size in Arnegard
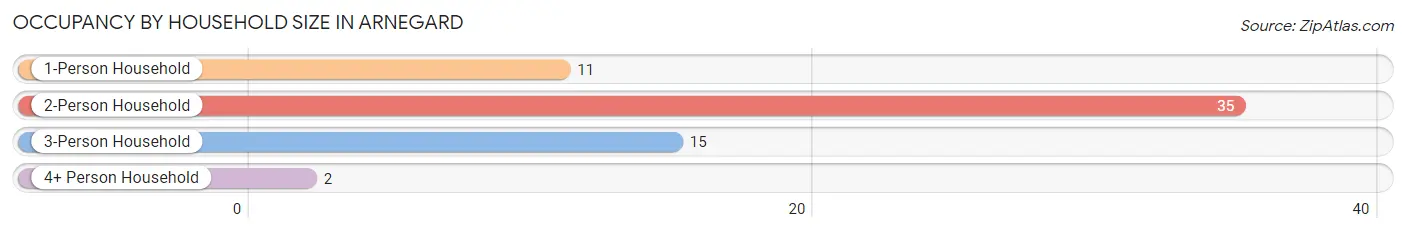
| Household Size | # Housing Units | % Housing Units |
| 1-Person Household | 11 | 17.5% |
| 2-Person Household | 35 | 55.6% |
| 3-Person Household | 15 | 23.8% |
| 4+ Person Household | 2 | 3.2% |
| Total Housing Units | 63 | 100.0% |
Occupancy by Ownership by Household Size in Arnegard
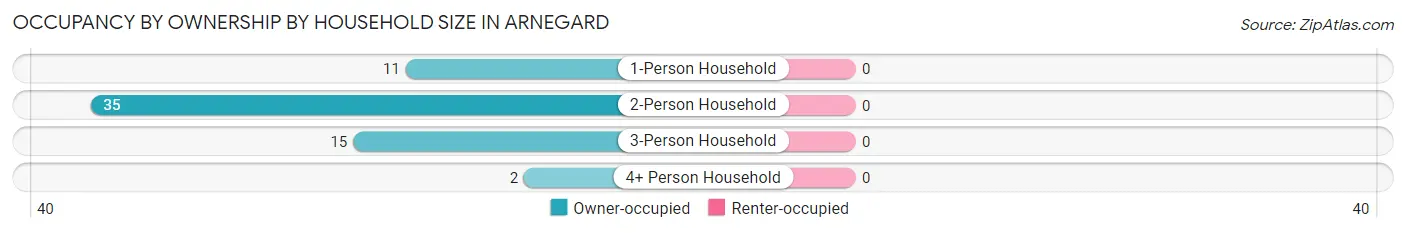
| Household Size | Owner-occupied | Renter-occupied |
| 1-Person Household | 11 (100.0%) | 0 (0.0%) |
| 2-Person Household | 35 (100.0%) | 0 (0.0%) |
| 3-Person Household | 15 (100.0%) | 0 (0.0%) |
| 4+ Person Household | 2 (100.0%) | 0 (0.0%) |
| Total Housing Units | 63 (100.0%) | 0 (0.0%) |
Occupancy by Educational Attainment in Arnegard
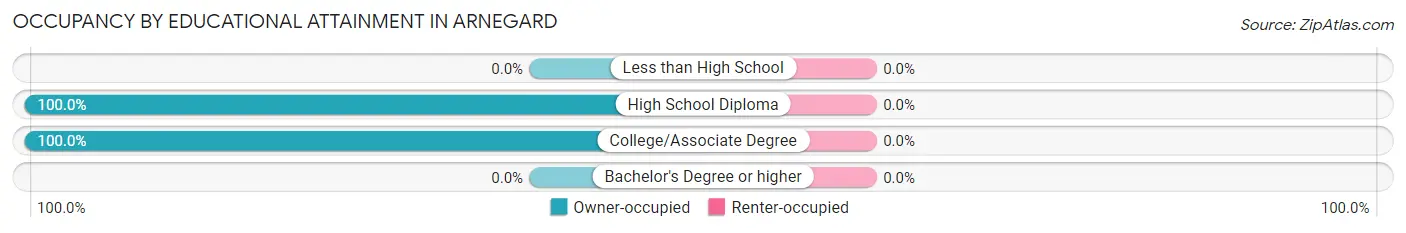
| Household Size | Owner-occupied | Renter-occupied |
| Less than High School | 0 (0.0%) | 0 (0.0%) |
| High School Diploma | 27 (100.0%) | 0 (0.0%) |
| College/Associate Degree | 36 (100.0%) | 0 (0.0%) |
| Bachelor's Degree or higher | 0 (0.0%) | 0 (0.0%) |
Occupancy by Age of Householder in Arnegard
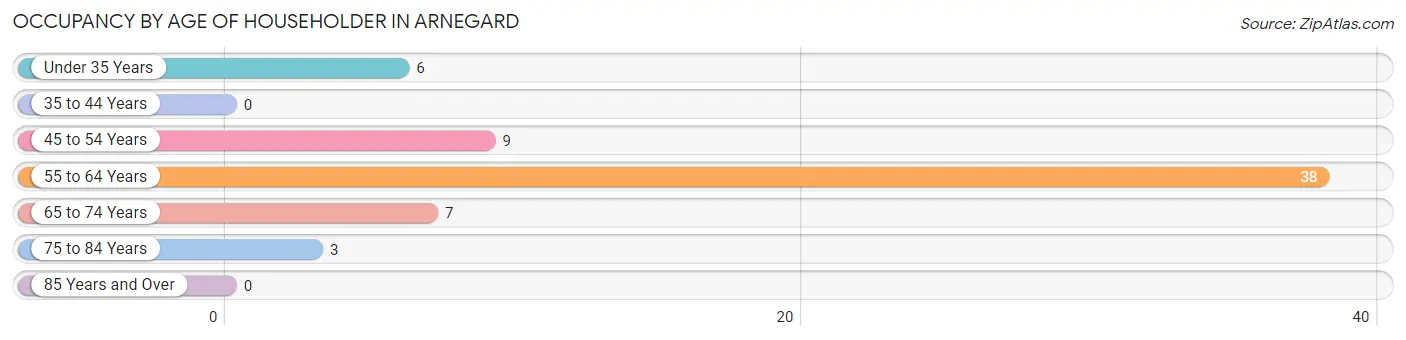
| Age Bracket | # Households | % Households |
| Under 35 Years | 6 | 9.5% |
| 35 to 44 Years | 0 | 0.0% |
| 45 to 54 Years | 9 | 14.3% |
| 55 to 64 Years | 38 | 60.3% |
| 65 to 74 Years | 7 | 11.1% |
| 75 to 84 Years | 3 | 4.8% |
| 85 Years and Over | 0 | 0.0% |
| Total | 63 | 100.0% |
Housing Finances in Arnegard
Median Income by Occupancy in Arnegard
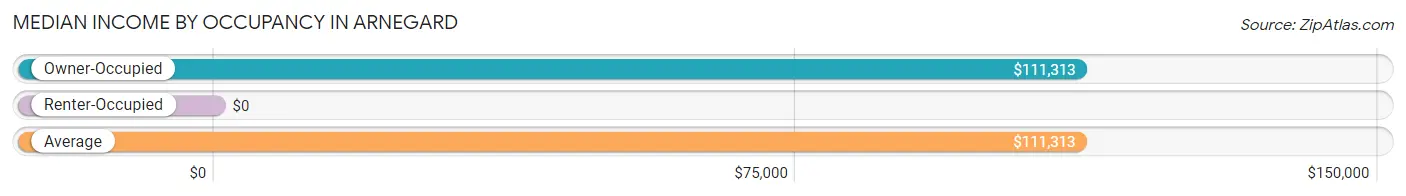
| Occupancy Type | # Households | Median Income |
| Owner-Occupied | 63 (100.0%) | $111,313 |
| Renter-Occupied | 0 (0.0%) | $0 |
| Average | 63 (100.0%) | $111,313 |
Occupancy by Householder Income Bracket in Arnegard
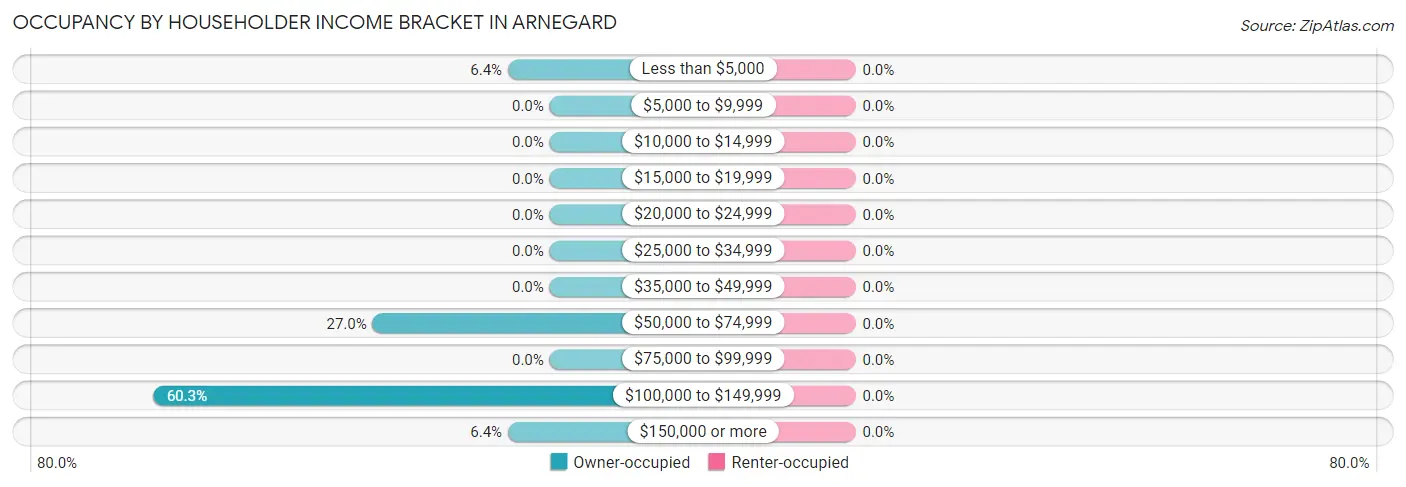
| Income Bracket | Owner-occupied | Renter-occupied |
| Less than $5,000 | 4 (6.4%) | 0 (0.0%) |
| $5,000 to $9,999 | 0 (0.0%) | 0 (0.0%) |
| $10,000 to $14,999 | 0 (0.0%) | 0 (0.0%) |
| $15,000 to $19,999 | 0 (0.0%) | 0 (0.0%) |
| $20,000 to $24,999 | 0 (0.0%) | 0 (0.0%) |
| $25,000 to $34,999 | 0 (0.0%) | 0 (0.0%) |
| $35,000 to $49,999 | 0 (0.0%) | 0 (0.0%) |
| $50,000 to $74,999 | 17 (27.0%) | 0 (0.0%) |
| $75,000 to $99,999 | 0 (0.0%) | 0 (0.0%) |
| $100,000 to $149,999 | 38 (60.3%) | 0 (0.0%) |
| $150,000 or more | 4 (6.4%) | 0 (0.0%) |
| Total | 63 (100.0%) | 0 (0.0%) |
Monthly Housing Cost Tiers in Arnegard
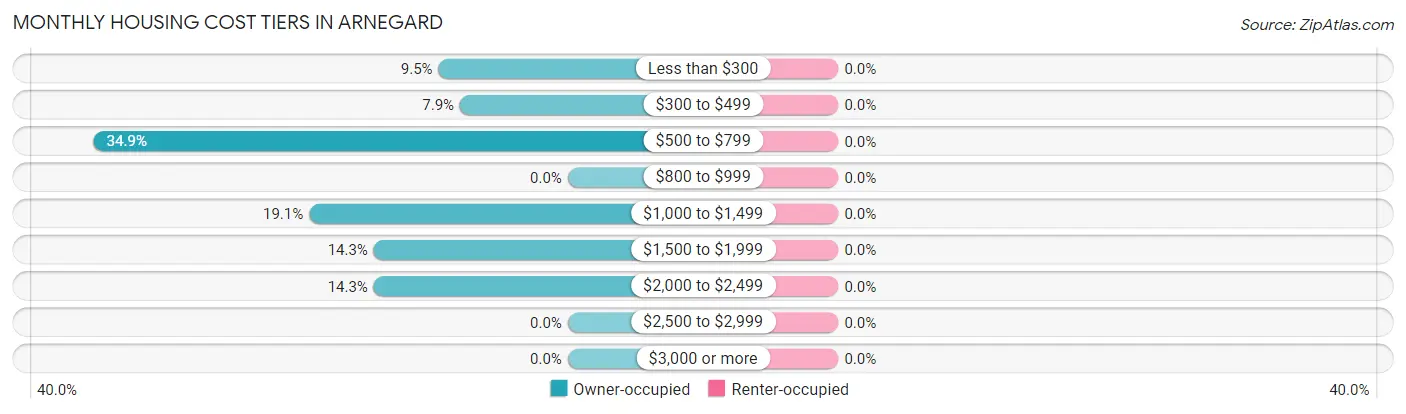
| Monthly Cost | Owner-occupied | Renter-occupied |
| Less than $300 | 6 (9.5%) | 0 (0.0%) |
| $300 to $499 | 5 (7.9%) | 0 (0.0%) |
| $500 to $799 | 22 (34.9%) | 0 (0.0%) |
| $800 to $999 | 0 (0.0%) | 0 (0.0%) |
| $1,000 to $1,499 | 12 (19.1%) | 0 (0.0%) |
| $1,500 to $1,999 | 9 (14.3%) | 0 (0.0%) |
| $2,000 to $2,499 | 9 (14.3%) | 0 (0.0%) |
| $2,500 to $2,999 | 0 (0.0%) | 0 (0.0%) |
| $3,000 or more | 0 (0.0%) | 0 (0.0%) |
| Total | 63 (100.0%) | 0 (0.0%) |
Physical Housing Characteristics in Arnegard
Housing Structures in Arnegard
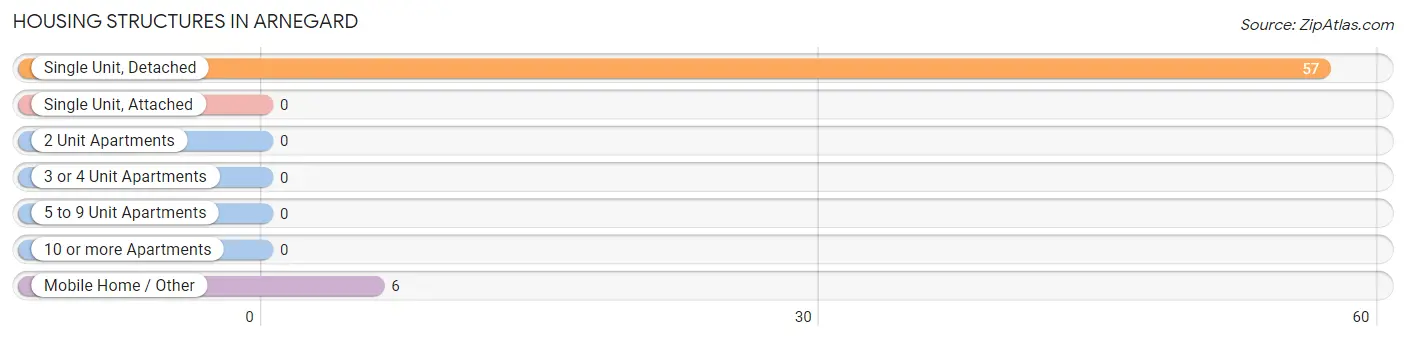
| Structure Type | # Housing Units | % Housing Units |
| Single Unit, Detached | 57 | 90.5% |
| Single Unit, Attached | 0 | 0.0% |
| 2 Unit Apartments | 0 | 0.0% |
| 3 or 4 Unit Apartments | 0 | 0.0% |
| 5 to 9 Unit Apartments | 0 | 0.0% |
| 10 or more Apartments | 0 | 0.0% |
| Mobile Home / Other | 6 | 9.5% |
| Total | 63 | 100.0% |
Housing Structures by Occupancy in Arnegard
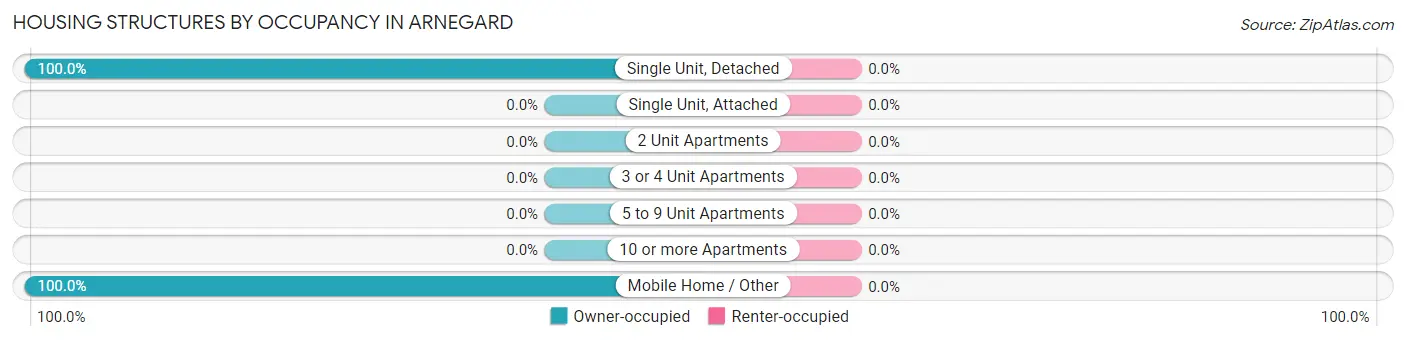
| Structure Type | Owner-occupied | Renter-occupied |
| Single Unit, Detached | 57 (100.0%) | 0 (0.0%) |
| Single Unit, Attached | 0 (0.0%) | 0 (0.0%) |
| 2 Unit Apartments | 0 (0.0%) | 0 (0.0%) |
| 3 or 4 Unit Apartments | 0 (0.0%) | 0 (0.0%) |
| 5 to 9 Unit Apartments | 0 (0.0%) | 0 (0.0%) |
| 10 or more Apartments | 0 (0.0%) | 0 (0.0%) |
| Mobile Home / Other | 6 (100.0%) | 0 (0.0%) |
| Total | 63 (100.0%) | 0 (0.0%) |
Housing Structures by Number of Rooms in Arnegard
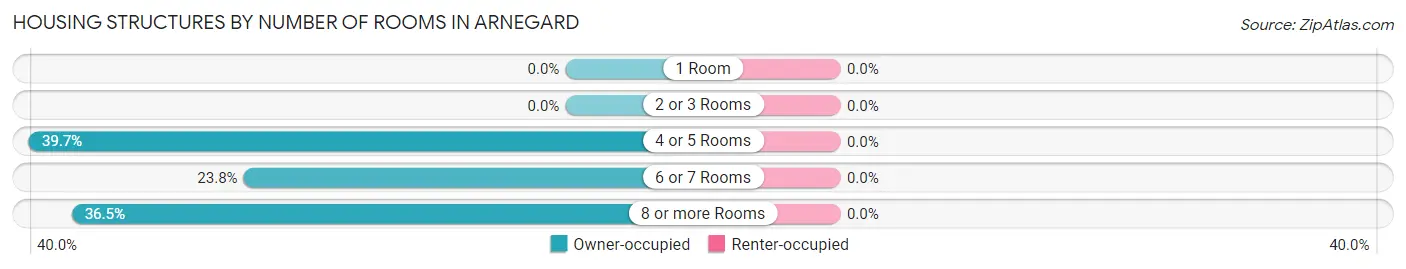
| Number of Rooms | Owner-occupied | Renter-occupied |
| 1 Room | 0 (0.0%) | 0 (0.0%) |
| 2 or 3 Rooms | 0 (0.0%) | 0 (0.0%) |
| 4 or 5 Rooms | 25 (39.7%) | 0 (0.0%) |
| 6 or 7 Rooms | 15 (23.8%) | 0 (0.0%) |
| 8 or more Rooms | 23 (36.5%) | 0 (0.0%) |
| Total | 63 (100.0%) | 0 (0.0%) |
Housing Structure by Heating Type in Arnegard
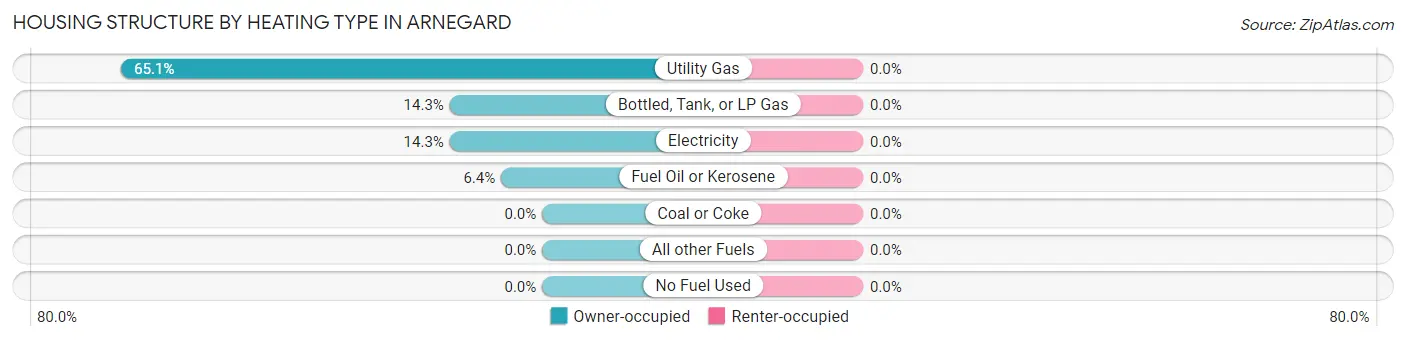
| Heating Type | Owner-occupied | Renter-occupied |
| Utility Gas | 41 (65.1%) | 0 (0.0%) |
| Bottled, Tank, or LP Gas | 9 (14.3%) | 0 (0.0%) |
| Electricity | 9 (14.3%) | 0 (0.0%) |
| Fuel Oil or Kerosene | 4 (6.4%) | 0 (0.0%) |
| Coal or Coke | 0 (0.0%) | 0 (0.0%) |
| All other Fuels | 0 (0.0%) | 0 (0.0%) |
| No Fuel Used | 0 (0.0%) | 0 (0.0%) |
| Total | 63 (100.0%) | 0 (0.0%) |
Household Vehicle Usage in Arnegard
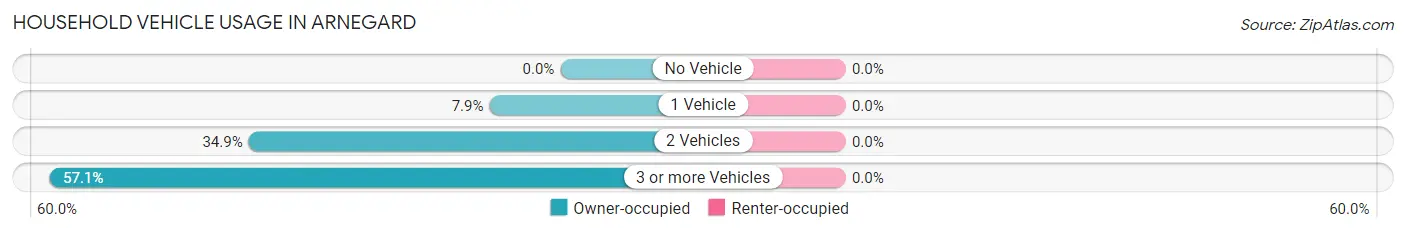
| Vehicles per Household | Owner-occupied | Renter-occupied |
| No Vehicle | 0 (0.0%) | 0 (0.0%) |
| 1 Vehicle | 5 (7.9%) | 0 (0.0%) |
| 2 Vehicles | 22 (34.9%) | 0 (0.0%) |
| 3 or more Vehicles | 36 (57.1%) | 0 (0.0%) |
| Total | 63 (100.0%) | 0 (0.0%) |
Real Estate & Mortgages in Arnegard
Real Estate and Mortgage Overview in Arnegard
| Characteristic | Without Mortgage | With Mortgage |
| Housing Units | 33 | 30 |
| Median Property Value | - | - |
| Median Household Income | $111,339 | $3 |
| Monthly Housing Costs | $621 | $0 |
| Real Estate Taxes | $1,375 | $0 |
Property Value by Mortgage Status in Arnegard
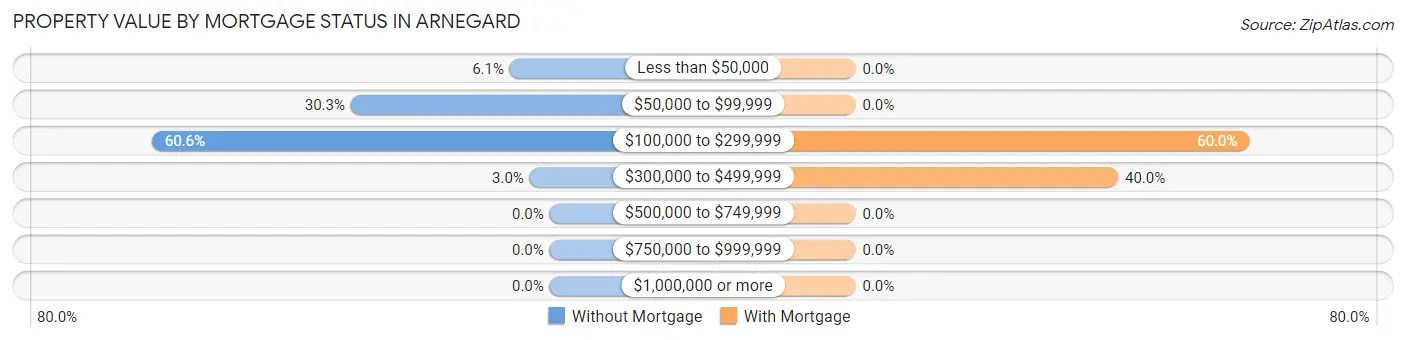
| Property Value | Without Mortgage | With Mortgage |
| Less than $50,000 | 2 (6.1%) | 0 (0.0%) |
| $50,000 to $99,999 | 10 (30.3%) | 0 (0.0%) |
| $100,000 to $299,999 | 20 (60.6%) | 18 (60.0%) |
| $300,000 to $499,999 | 1 (3.0%) | 12 (40.0%) |
| $500,000 to $749,999 | 0 (0.0%) | 0 (0.0%) |
| $750,000 to $999,999 | 0 (0.0%) | 0 (0.0%) |
| $1,000,000 or more | 0 (0.0%) | 0 (0.0%) |
| Total | 33 (100.0%) | 30 (100.0%) |
Household Income by Mortgage Status in Arnegard
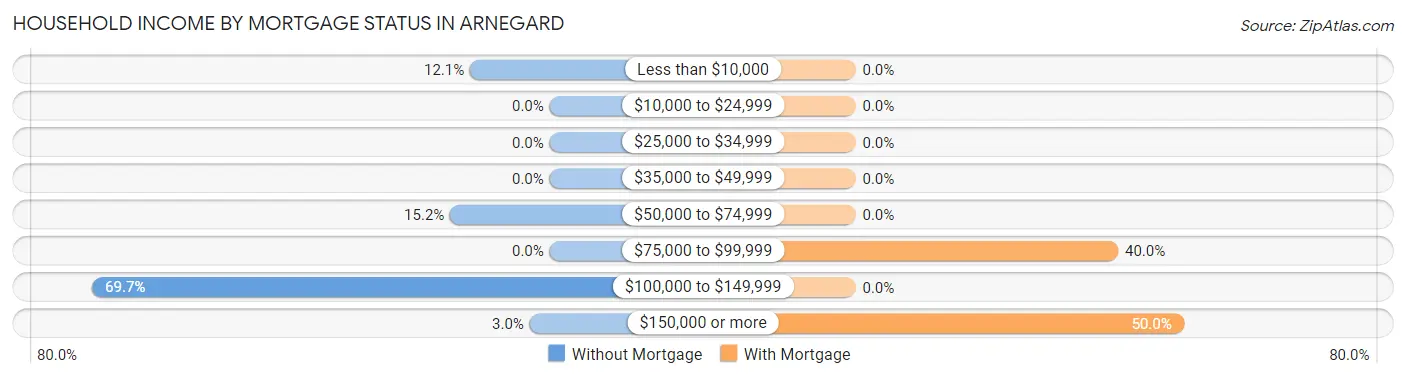
| Household Income | Without Mortgage | With Mortgage |
| Less than $10,000 | 4 (12.1%) | 0 (0.0%) |
| $10,000 to $24,999 | 0 (0.0%) | 0 (0.0%) |
| $25,000 to $34,999 | 0 (0.0%) | 0 (0.0%) |
| $35,000 to $49,999 | 0 (0.0%) | 0 (0.0%) |
| $50,000 to $74,999 | 5 (15.1%) | 0 (0.0%) |
| $75,000 to $99,999 | 0 (0.0%) | 12 (40.0%) |
| $100,000 to $149,999 | 23 (69.7%) | 0 (0.0%) |
| $150,000 or more | 1 (3.0%) | 15 (50.0%) |
| Total | 33 (100.0%) | 30 (100.0%) |
Property Value to Household Income Ratio in Arnegard
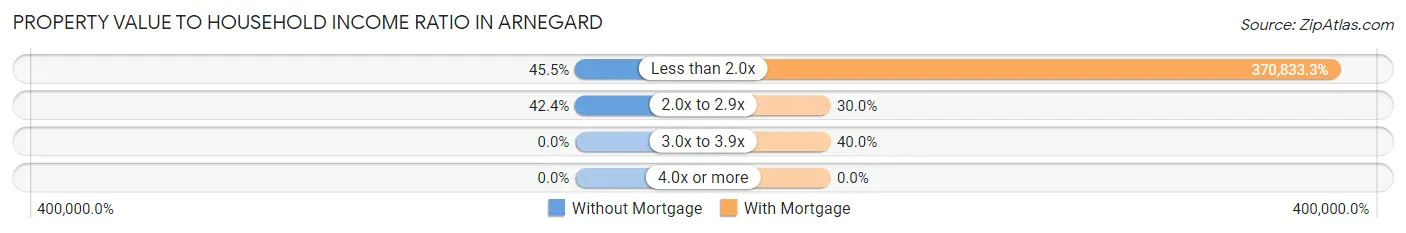
| Value-to-Income Ratio | Without Mortgage | With Mortgage |
| Less than 2.0x | 15 (45.5%) | 111,250 (370,833.3%) |
| 2.0x to 2.9x | 14 (42.4%) | 9 (30.0%) |
| 3.0x to 3.9x | 0 (0.0%) | 12 (40.0%) |
| 4.0x or more | 0 (0.0%) | 0 (0.0%) |
| Total | 33 (100.0%) | 30 (100.0%) |
Real Estate Taxes by Mortgage Status in Arnegard
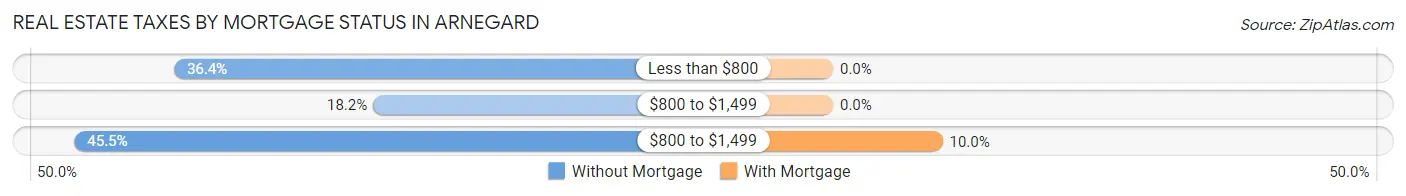
| Property Taxes | Without Mortgage | With Mortgage |
| Less than $800 | 12 (36.4%) | 0 (0.0%) |
| $800 to $1,499 | 6 (18.2%) | 0 (0.0%) |
| $800 to $1,499 | 15 (45.5%) | 3 (10.0%) |
| Total | 33 (100.0%) | 30 (100.0%) |
Health & Disability in Arnegard
Health Insurance Coverage by Age in Arnegard
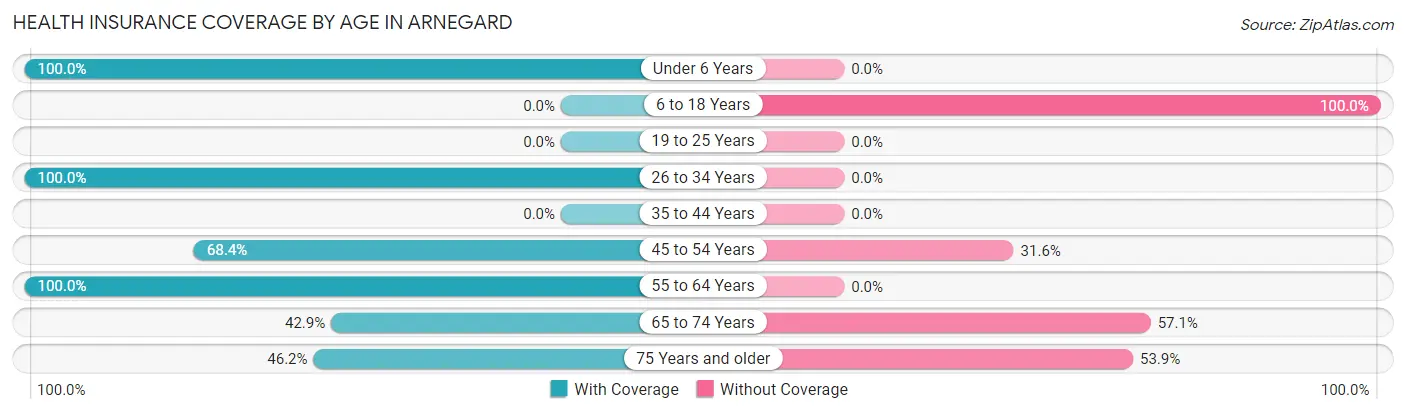
| Age Bracket | With Coverage | Without Coverage |
| Under 6 Years | 20 (100.0%) | 0 (0.0%) |
| 6 to 18 Years | 0 (0.0%) | 7 (100.0%) |
| 19 to 25 Years | 0 (0.0%) | 0 (0.0%) |
| 26 to 34 Years | 8 (100.0%) | 0 (0.0%) |
| 35 to 44 Years | 0 (0.0%) | 0 (0.0%) |
| 45 to 54 Years | 13 (68.4%) | 6 (31.6%) |
| 55 to 64 Years | 81 (100.0%) | 0 (0.0%) |
| 65 to 74 Years | 3 (42.9%) | 4 (57.1%) |
| 75 Years and older | 6 (46.2%) | 7 (53.8%) |
| Total | 131 (84.5%) | 24 (15.5%) |
Health Insurance Coverage by Citizenship Status in Arnegard
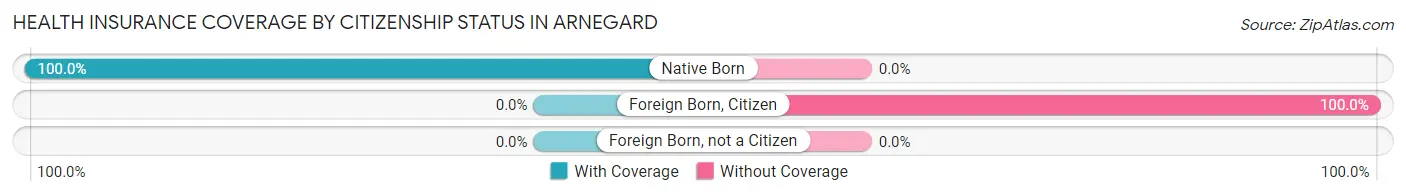
| Citizenship Status | With Coverage | Without Coverage |
| Native Born | 20 (100.0%) | 0 (0.0%) |
| Foreign Born, Citizen | 0 (0.0%) | 7 (100.0%) |
| Foreign Born, not a Citizen | 0 (0.0%) | 0 (0.0%) |
Health Insurance Coverage by Household Income in Arnegard
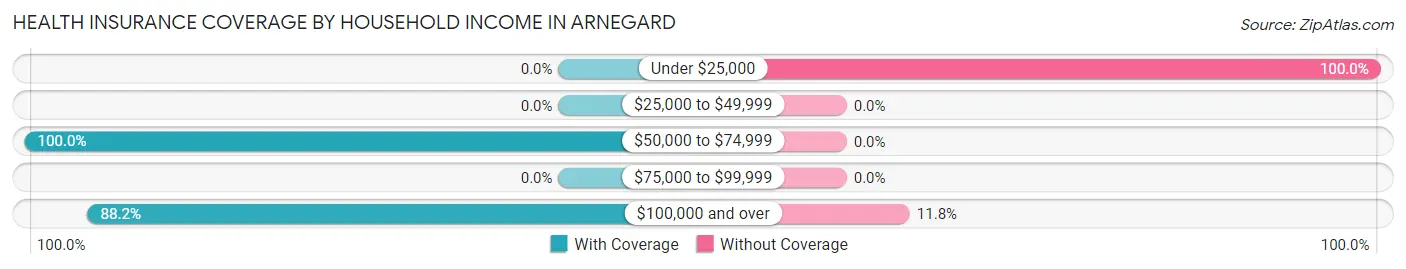
| Household Income | With Coverage | Without Coverage |
| Under $25,000 | 0 (0.0%) | 11 (100.0%) |
| $25,000 to $49,999 | 0 (0.0%) | 0 (0.0%) |
| $50,000 to $74,999 | 34 (100.0%) | 0 (0.0%) |
| $75,000 to $99,999 | 0 (0.0%) | 0 (0.0%) |
| $100,000 and over | 97 (88.2%) | 13 (11.8%) |
Public vs Private Health Insurance Coverage by Age in Arnegard
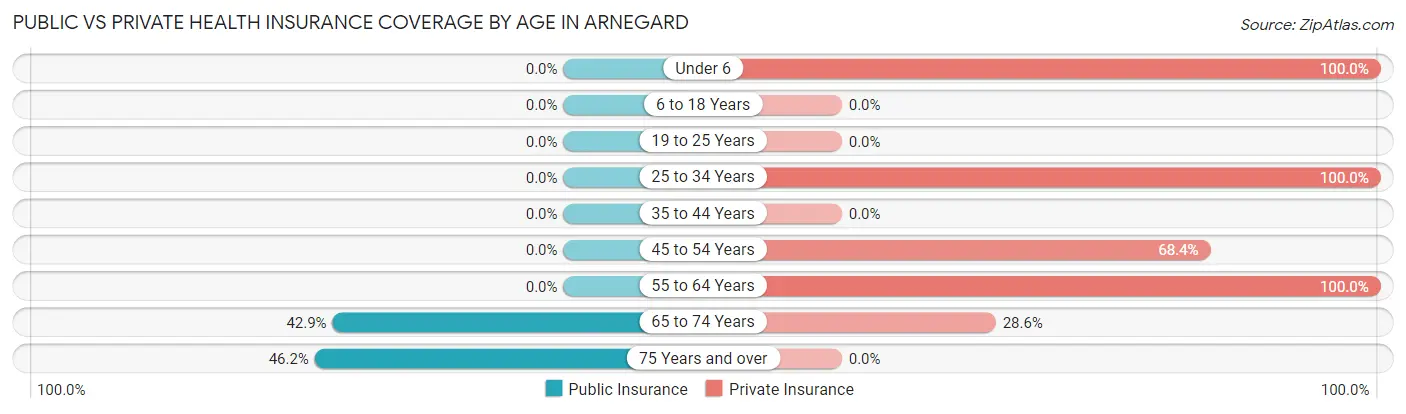
| Age Bracket | Public Insurance | Private Insurance |
| Under 6 | 0 (0.0%) | 20 (100.0%) |
| 6 to 18 Years | 0 (0.0%) | 0 (0.0%) |
| 19 to 25 Years | 0 (0.0%) | 0 (0.0%) |
| 25 to 34 Years | 0 (0.0%) | 8 (100.0%) |
| 35 to 44 Years | 0 (0.0%) | 0 (0.0%) |
| 45 to 54 Years | 0 (0.0%) | 13 (68.4%) |
| 55 to 64 Years | 0 (0.0%) | 81 (100.0%) |
| 65 to 74 Years | 3 (42.9%) | 2 (28.6%) |
| 75 Years and over | 6 (46.2%) | 0 (0.0%) |
| Total | 9 (5.8%) | 124 (80.0%) |
Disability Status by Sex by Age in Arnegard
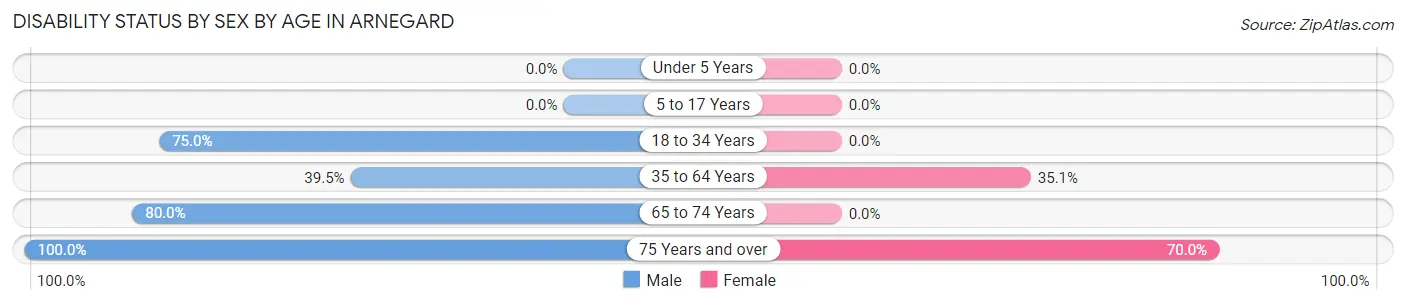
| Age Bracket | Male | Female |
| Under 5 Years | 0 (0.0%) | 0 (0.0%) |
| 5 to 17 Years | 0 (0.0%) | 0 (0.0%) |
| 18 to 34 Years | 6 (75.0%) | 0 (0.0%) |
| 35 to 64 Years | 17 (39.5%) | 20 (35.1%) |
| 65 to 74 Years | 4 (80.0%) | 0 (0.0%) |
| 75 Years and over | 3 (100.0%) | 7 (70.0%) |
Disability Class by Sex by Age in Arnegard
Disability Class: Hearing Difficulty
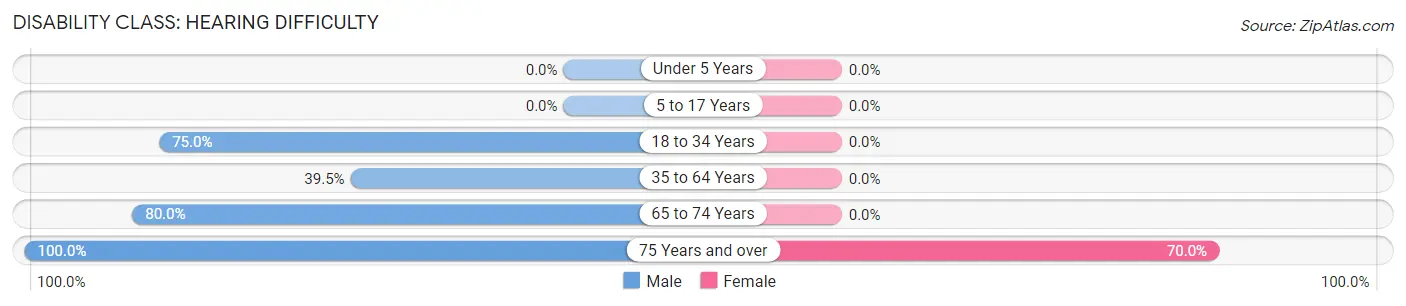
| Age Bracket | Male | Female |
| Under 5 Years | 0 (0.0%) | 0 (0.0%) |
| 5 to 17 Years | 0 (0.0%) | 0 (0.0%) |
| 18 to 34 Years | 6 (75.0%) | 0 (0.0%) |
| 35 to 64 Years | 17 (39.5%) | 0 (0.0%) |
| 65 to 74 Years | 4 (80.0%) | 0 (0.0%) |
| 75 Years and over | 3 (100.0%) | 7 (70.0%) |
Disability Class: Vision Difficulty
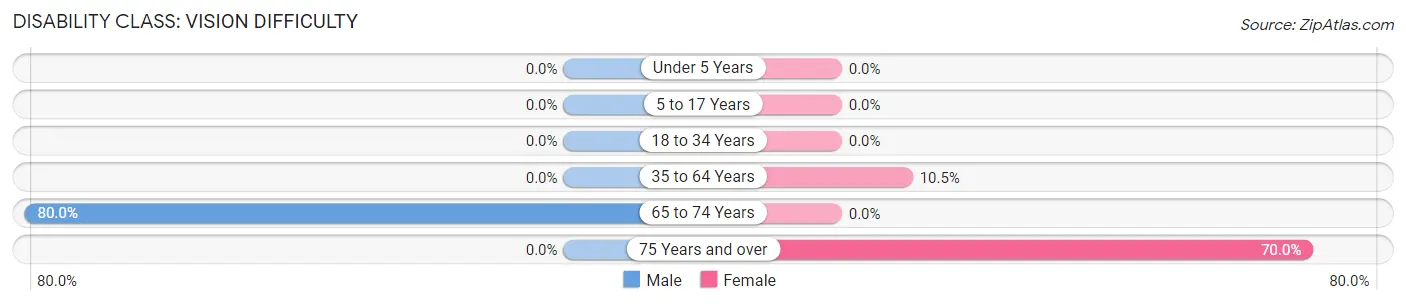
| Age Bracket | Male | Female |
| Under 5 Years | 0 (0.0%) | 0 (0.0%) |
| 5 to 17 Years | 0 (0.0%) | 0 (0.0%) |
| 18 to 34 Years | 0 (0.0%) | 0 (0.0%) |
| 35 to 64 Years | 0 (0.0%) | 6 (10.5%) |
| 65 to 74 Years | 4 (80.0%) | 0 (0.0%) |
| 75 Years and over | 0 (0.0%) | 7 (70.0%) |
Disability Class: Cognitive Difficulty
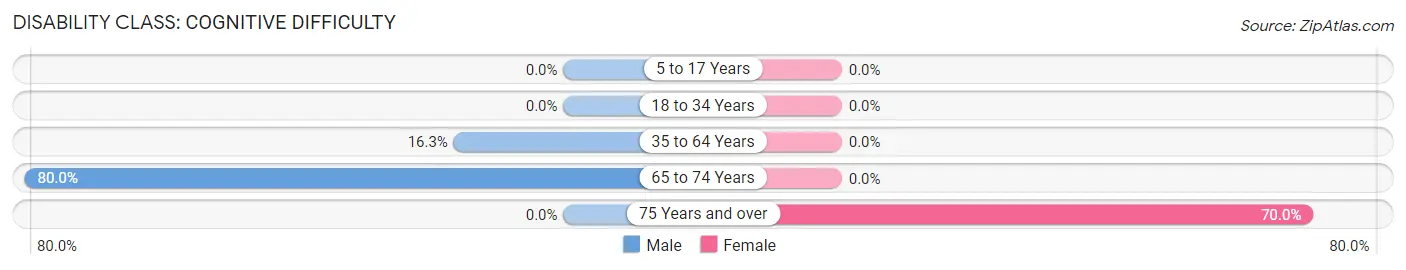
| Age Bracket | Male | Female |
| 5 to 17 Years | 0 (0.0%) | 0 (0.0%) |
| 18 to 34 Years | 0 (0.0%) | 0 (0.0%) |
| 35 to 64 Years | 7 (16.3%) | 0 (0.0%) |
| 65 to 74 Years | 4 (80.0%) | 0 (0.0%) |
| 75 Years and over | 0 (0.0%) | 7 (70.0%) |
Disability Class: Ambulatory Difficulty
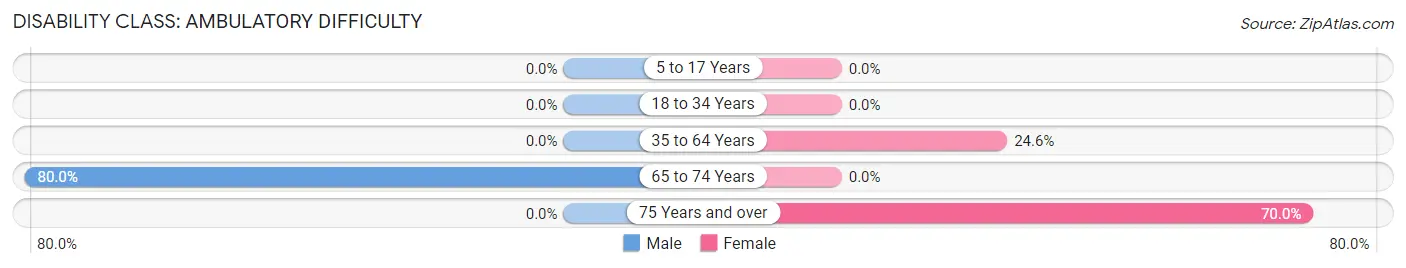
| Age Bracket | Male | Female |
| 5 to 17 Years | 0 (0.0%) | 0 (0.0%) |
| 18 to 34 Years | 0 (0.0%) | 0 (0.0%) |
| 35 to 64 Years | 0 (0.0%) | 14 (24.6%) |
| 65 to 74 Years | 4 (80.0%) | 0 (0.0%) |
| 75 Years and over | 0 (0.0%) | 7 (70.0%) |
Disability Class: Self-Care Difficulty
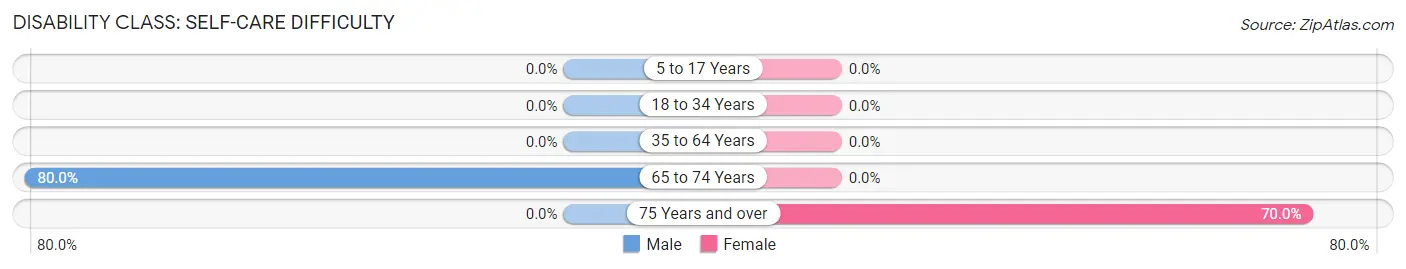
| Age Bracket | Male | Female |
| 5 to 17 Years | 0 (0.0%) | 0 (0.0%) |
| 18 to 34 Years | 0 (0.0%) | 0 (0.0%) |
| 35 to 64 Years | 0 (0.0%) | 0 (0.0%) |
| 65 to 74 Years | 4 (80.0%) | 0 (0.0%) |
| 75 Years and over | 0 (0.0%) | 7 (70.0%) |
Technology Access in Arnegard
Computing Device Access in Arnegard
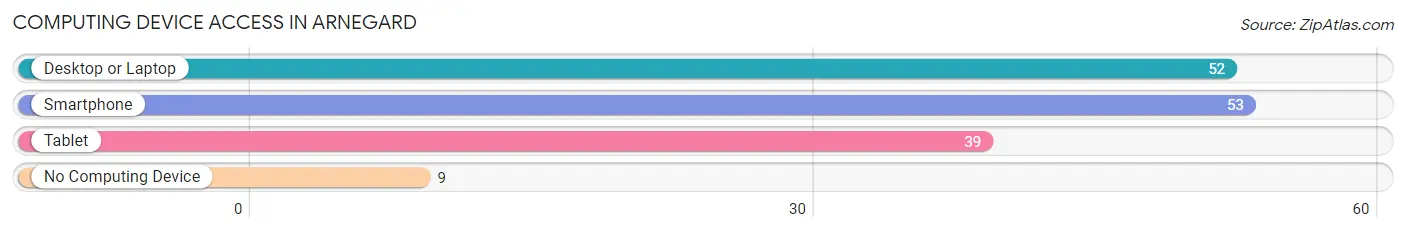
| Device Type | # Households | % Households |
| Desktop or Laptop | 52 | 82.5% |
| Smartphone | 53 | 84.1% |
| Tablet | 39 | 61.9% |
| No Computing Device | 9 | 14.3% |
| Total | 63 | 100.0% |
Internet Access in Arnegard
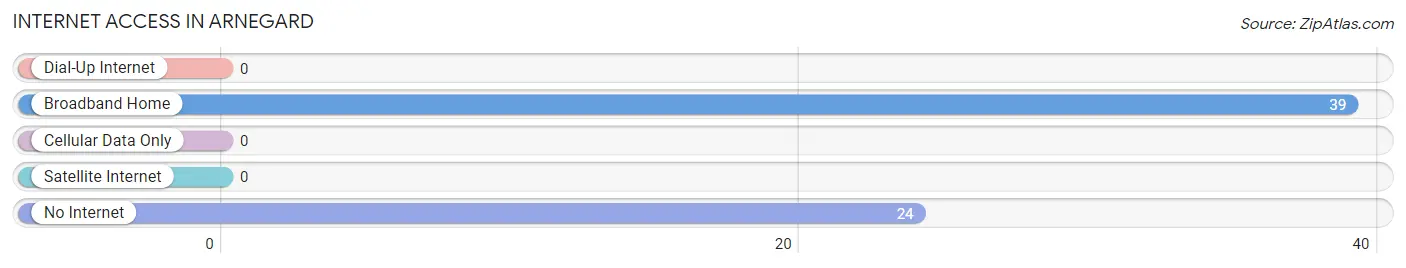
| Internet Type | # Households | % Households |
| Dial-Up Internet | 0 | 0.0% |
| Broadband Home | 39 | 61.9% |
| Cellular Data Only | 0 | 0.0% |
| Satellite Internet | 0 | 0.0% |
| No Internet | 24 | 38.1% |
| Total | 63 | 100.0% |
Arnegard Summary
Arnegard is a small town located in McKenzie County, North Dakota. It is situated on the banks of the Missouri River, approximately 20 miles south of Watford City. The town was founded in 1910 and was named after the Arnegard family, who were among the first settlers in the area.
Geography
Arnegard is located in the northwestern part of North Dakota, in the heart of the Bakken Formation. The town is situated on the banks of the Missouri River, approximately 20 miles south of Watford City. The town is surrounded by rolling hills and prairies, and is home to a variety of wildlife, including deer, antelope, and coyotes. The climate in Arnegard is semi-arid, with hot summers and cold winters.
Economy
The economy of Arnegard is largely based on agriculture and oil production. The town is home to several farms, which produce a variety of crops, including wheat, corn, and soybeans. The town is also home to several oil and gas companies, which are responsible for much of the town’s economic activity. In addition, Arnegard is home to several small businesses, including a grocery store, a hardware store, and a restaurant.
Demographics
As of the 2010 census, the population of Arnegard was 545. The town is predominantly white, with a small minority population. The median household income in Arnegard is $45,000, and the median age is 37. The town has a high rate of homeownership, with nearly 80% of residents owning their own homes.
History
Arnegard was founded in 1910 by the Arnegard family, who were among the first settlers in the area. The town was originally a farming community, and the Arnegard family was responsible for much of the town’s early development. In the 1950s, the town began to experience a population boom due to the discovery of oil in the area. This led to an influx of new residents and businesses, and the town’s population grew rapidly. In the 1970s, the town experienced a decline in population due to the decline of the oil industry. However, in recent years, the town has seen a resurgence in population due to the development of the Bakken Formation.
Conclusion
Arnegard is a small town located in McKenzie County, North Dakota. It is situated on the banks of the Missouri River, approximately 20 miles south of Watford City. The town was founded in 1910 and was named after the Arnegard family, who were among the first settlers in the area. The economy of Arnegard is largely based on agriculture and oil production, and the town is home to a variety of businesses. As of the 2010 census, the population of Arnegard was 545. The town has a high rate of homeownership, and the median household income is $45,000. Arnegard has experienced a resurgence in population in recent years due to the development of the Bakken Formation.
Common Questions
What is Per Capita Income in Arnegard?
Per Capita income in Arnegard is $63,177.
What is the Median Family Income in Arnegard?
Median Family Income in Arnegard is $110,714.
What is the Median Household income in Arnegard?
Median Household Income in Arnegard is $111,313.
What is Inequality or Gini Index in Arnegard?
Inequality or Gini Index in Arnegard is 0.40.
What is the Total Population of Arnegard?
Total Population of Arnegard is 155.
What is the Total Male Population of Arnegard?
Total Male Population of Arnegard is 59.
What is the Total Female Population of Arnegard?
Total Female Population of Arnegard is 96.
What is the Ratio of Males per 100 Females in Arnegard?
There are 61.46 Males per 100 Females in Arnegard.
What is the Ratio of Females per 100 Males in Arnegard?
There are 162.71 Females per 100 Males in Arnegard.
What is the Median Population Age in Arnegard?
Median Population Age in Arnegard is 57.7 Years.
What is the Average Family Size in Arnegard
Average Family Size in Arnegard is 2.6 People.
What is the Average Household Size in Arnegard
Average Household Size in Arnegard is 2.5 People.
How Large is the Labor Force in Arnegard?
There are 93 People in the Labor Forcein in Arnegard.
What is the Percentage of People in the Labor Force in Arnegard?
72.7% of People are in the Labor Force in Arnegard.
What is the Unemployment Rate in Arnegard?
Unemployment Rate in Arnegard is 8.6%.