Glenside, PA Map & Demographics
Glenside Map
Glenside Overview
$46,365
PER CAPITA INCOME
$140,658
AVG FAMILY INCOME
$105,278
AVG HOUSEHOLD INCOME
56.8%
WAGE / INCOME GAP [ % ]
43.2¢/ $1
WAGE / INCOME GAP [ $ ]
0.42
INEQUALITY / GINI INDEX
7,726
TOTAL POPULATION
3,239
MALE POPULATION
4,487
FEMALE POPULATION
72.19
MALES / 100 FEMALES
138.53
FEMALES / 100 MALES
38.6
MEDIAN AGE
3.1
AVG FAMILY SIZE
2.5
AVG HOUSEHOLD SIZE
4,349
LABOR FORCE [ PEOPLE ]
67.8%
PERCENT IN LABOR FORCE
3.5%
UNEMPLOYMENT RATE
Glenside Zip Codes
Income in Glenside
Income Overview in Glenside
Per Capita Income in Glenside is $46,365, while median incomes of families and households are $140,658 and $105,278 respectively.
| Characteristic | Number | Measure |
| Per Capita Income | 7,726 | $46,365 |
| Median Family Income | 1,882 | $140,658 |
| Mean Family Income | 1,882 | $160,671 |
| Median Household Income | 2,792 | $105,278 |
| Mean Household Income | 2,792 | $127,732 |
| Income Deficit | 1,882 | $0 |
| Wage / Income Gap (%) | 7,726 | 56.85% |
| Wage / Income Gap ($) | 7,726 | 43.15¢ per $1 |
| Gini / Inequality Index | 7,726 | 0.42 |
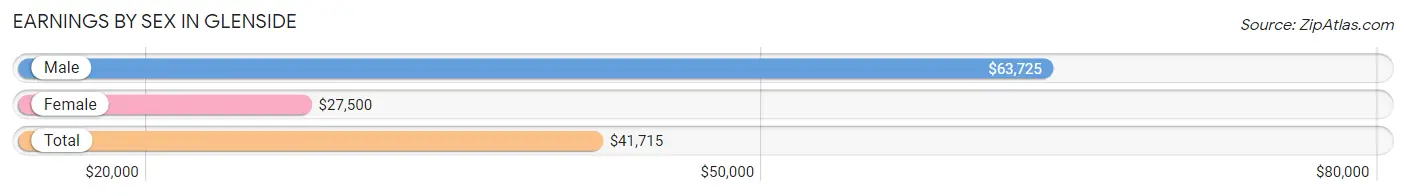
Earnings by Sex in Glenside
Average Earnings in Glenside are $41,715, $63,725 for men and $27,500 for women, a difference of 56.9%.
| Sex | Number | Average Earnings |
| Male | 2,157 (45.8%) | $63,725 |
| Female | 2,548 (54.2%) | $27,500 |
| Total | 4,705 (100.0%) | $41,715 |
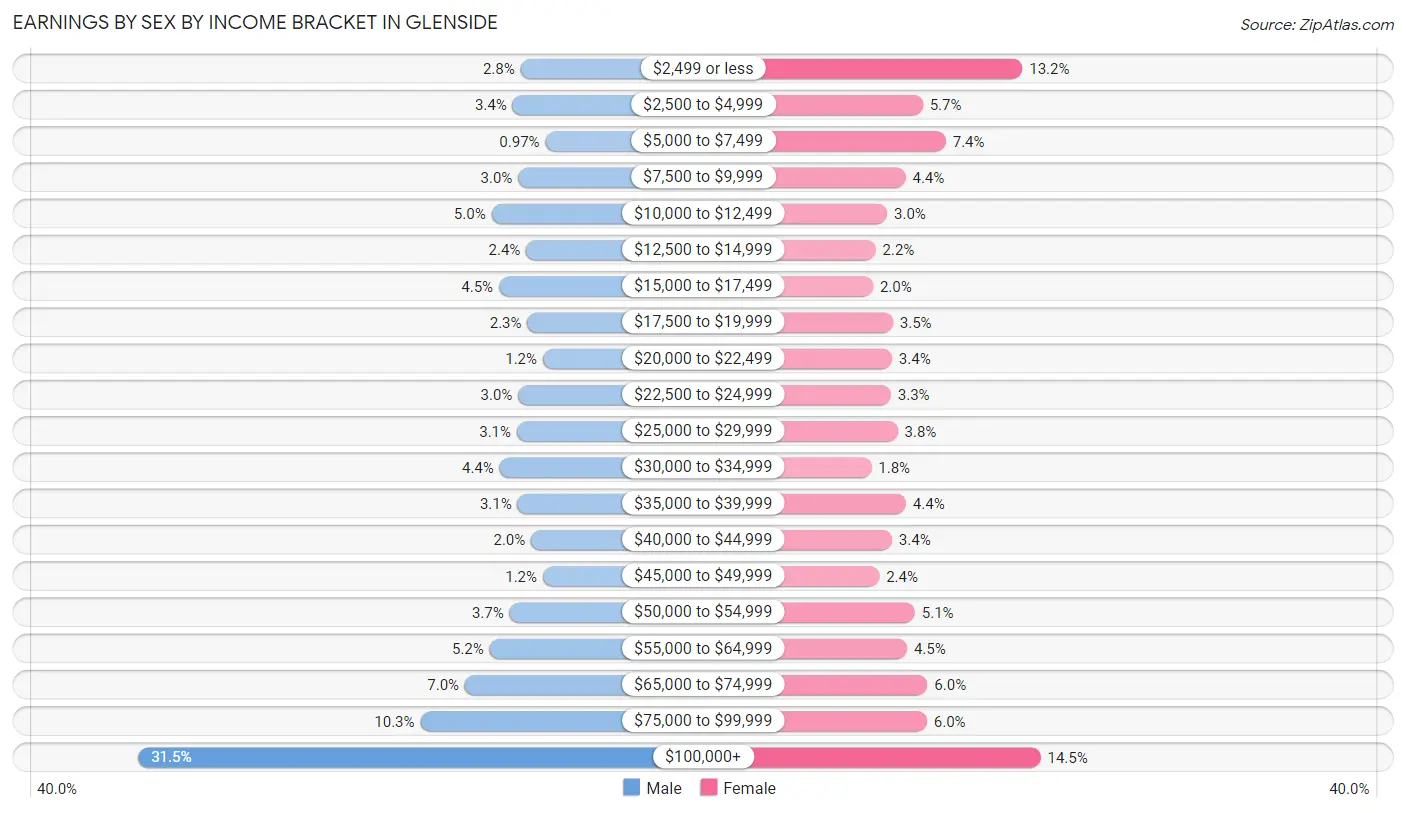
Earnings by Sex by Income Bracket in Glenside
The most common earnings brackets in Glenside are $100,000+ for men (679 | 31.5%) and $100,000+ for women (370 | 14.5%).
| Income | Male | Female |
| $2,499 or less | 61 (2.8%) | 335 (13.2%) |
| $2,500 to $4,999 | 74 (3.4%) | 145 (5.7%) |
| $5,000 to $7,499 | 21 (1.0%) | 189 (7.4%) |
| $7,500 to $9,999 | 65 (3.0%) | 112 (4.4%) |
| $10,000 to $12,499 | 108 (5.0%) | 77 (3.0%) |
| $12,500 to $14,999 | 52 (2.4%) | 55 (2.2%) |
| $15,000 to $17,499 | 96 (4.4%) | 50 (2.0%) |
| $17,500 to $19,999 | 50 (2.3%) | 88 (3.5%) |
| $20,000 to $22,499 | 25 (1.2%) | 86 (3.4%) |
| $22,500 to $24,999 | 65 (3.0%) | 84 (3.3%) |
| $25,000 to $29,999 | 67 (3.1%) | 97 (3.8%) |
| $30,000 to $34,999 | 95 (4.4%) | 47 (1.8%) |
| $35,000 to $39,999 | 66 (3.1%) | 113 (4.4%) |
| $40,000 to $44,999 | 44 (2.0%) | 86 (3.4%) |
| $45,000 to $49,999 | 25 (1.2%) | 62 (2.4%) |
| $50,000 to $54,999 | 79 (3.7%) | 130 (5.1%) |
| $55,000 to $64,999 | 111 (5.1%) | 115 (4.5%) |
| $65,000 to $74,999 | 151 (7.0%) | 154 (6.0%) |
| $75,000 to $99,999 | 223 (10.3%) | 153 (6.0%) |
| $100,000+ | 679 (31.5%) | 370 (14.5%) |
| Total | 2,157 (100.0%) | 2,548 (100.0%) |
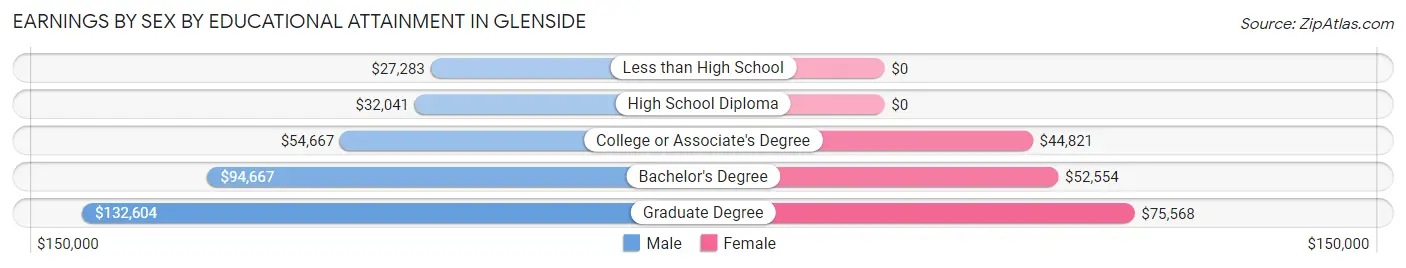
Earnings by Sex by Educational Attainment in Glenside
Average earnings in Glenside are $70,598 for men and $47,167 for women, a difference of 33.2%. Men with an educational attainment of graduate degree enjoy the highest average annual earnings of $132,604, while those with less than high school education earn the least with $27,283. Women with an educational attainment of graduate degree earn the most with the average annual earnings of $75,568, while those with college or associate's degree education have the smallest earnings of $44,821.
| Educational Attainment | Male Income | Female Income |
| Less than High School | $27,283 | $0 |
| High School Diploma | $32,041 | $0 |
| College or Associate's Degree | $54,667 | $44,821 |
| Bachelor's Degree | $94,667 | $52,554 |
| Graduate Degree | $132,604 | $75,568 |
| Total | $70,598 | $47,167 |
Family Income in Glenside
Family Income Brackets in Glenside
According to the Glenside family income data, there are 555 families falling into the $200,000+ income range, which is the most common income bracket and makes up 29.5% of all families. Conversely, the less than $10,000 income bracket is the least frequent group with only 6 families (0.3%) belonging to this category.
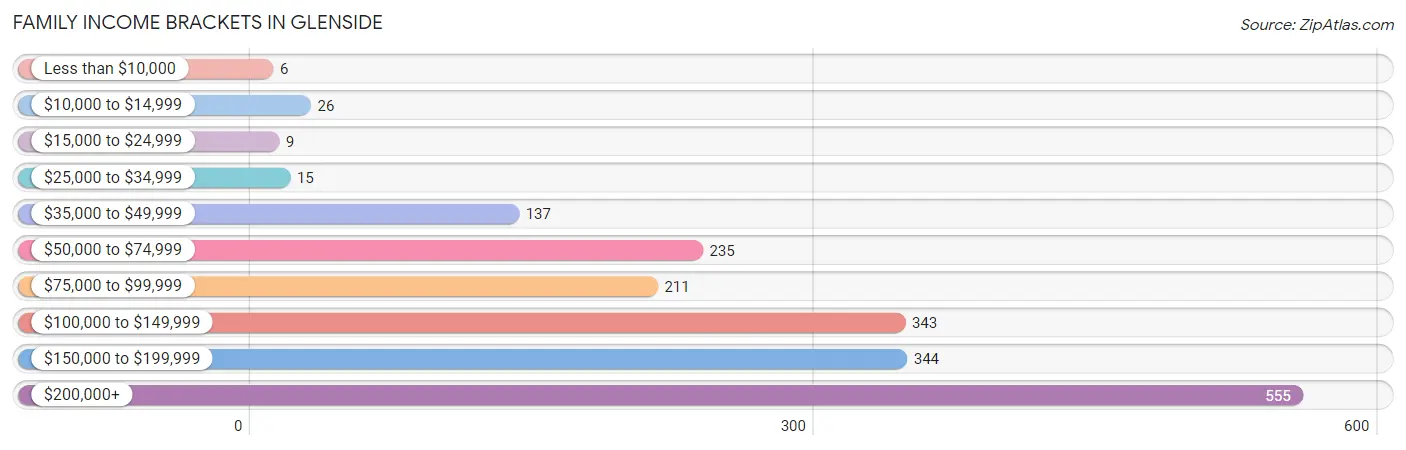
| Income Bracket | # Families | % Families |
| Less than $10,000 | 6 | 0.3% |
| $10,000 to $14,999 | 26 | 1.4% |
| $15,000 to $24,999 | 9 | 0.5% |
| $25,000 to $34,999 | 15 | 0.8% |
| $35,000 to $49,999 | 137 | 7.3% |
| $50,000 to $74,999 | 235 | 12.5% |
| $75,000 to $99,999 | 211 | 11.2% |
| $100,000 to $149,999 | 343 | 18.2% |
| $150,000 to $199,999 | 344 | 18.3% |
| $200,000+ | 555 | 29.5% |
Family Income by Famaliy Size in Glenside
7+ person families (56 | 3.0%) account for the highest median family income in Glenside with $190,000 per family, while 3-person families (471 | 25.0%) have the highest median income of $57,264 per family member.
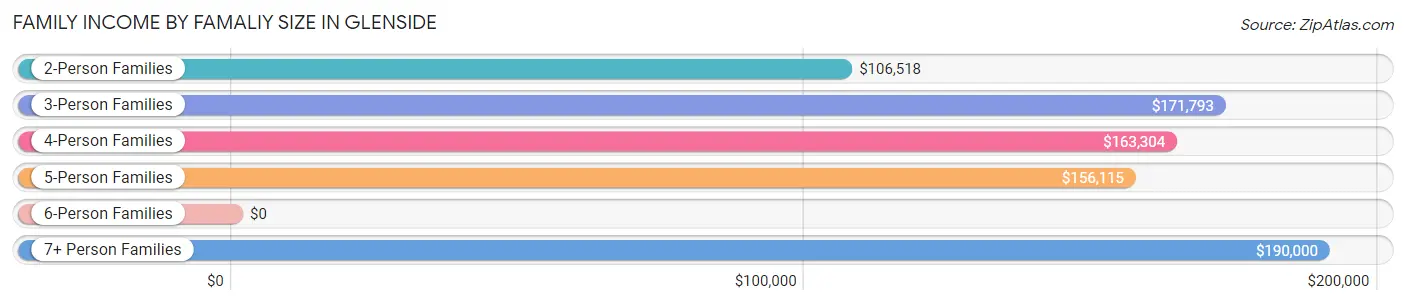
| Income Bracket | # Families | Median Income |
| 2-Person Families | 915 (48.6%) | $106,518 |
| 3-Person Families | 471 (25.0%) | $171,793 |
| 4-Person Families | 235 (12.5%) | $163,304 |
| 5-Person Families | 205 (10.9%) | $156,115 |
| 6-Person Families | 0 (0.0%) | $0 |
| 7+ Person Families | 56 (3.0%) | $190,000 |
| Total | 1,882 (100.0%) | $140,658 |
Family Income by Number of Earners in Glenside
The median family income in Glenside is $140,658, with families comprising 3+ earners (211) having the highest median family income of $165,694, while families with no earners (249) have the lowest median family income of $70,125, accounting for 11.2% and 13.2% of families, respectively.
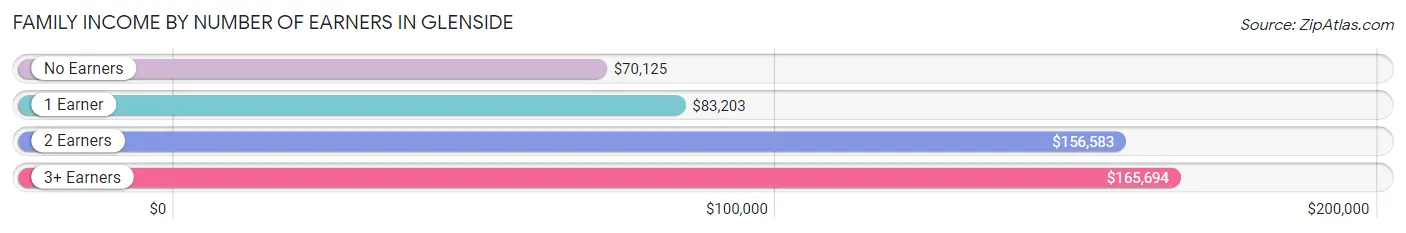
| Number of Earners | # Families | Median Income |
| No Earners | 249 (13.2%) | $70,125 |
| 1 Earner | 387 (20.6%) | $83,203 |
| 2 Earners | 1,035 (55.0%) | $156,583 |
| 3+ Earners | 211 (11.2%) | $165,694 |
| Total | 1,882 (100.0%) | $140,658 |
Household Income in Glenside
Household Income Brackets in Glenside
With 561 households falling in the category, the $200,000+ income range is the most frequent in Glenside, accounting for 20.1% of all households. In contrast, only 59 households (2.1%) fall into the $10,000 to $14,999 income bracket, making it the least populous group.
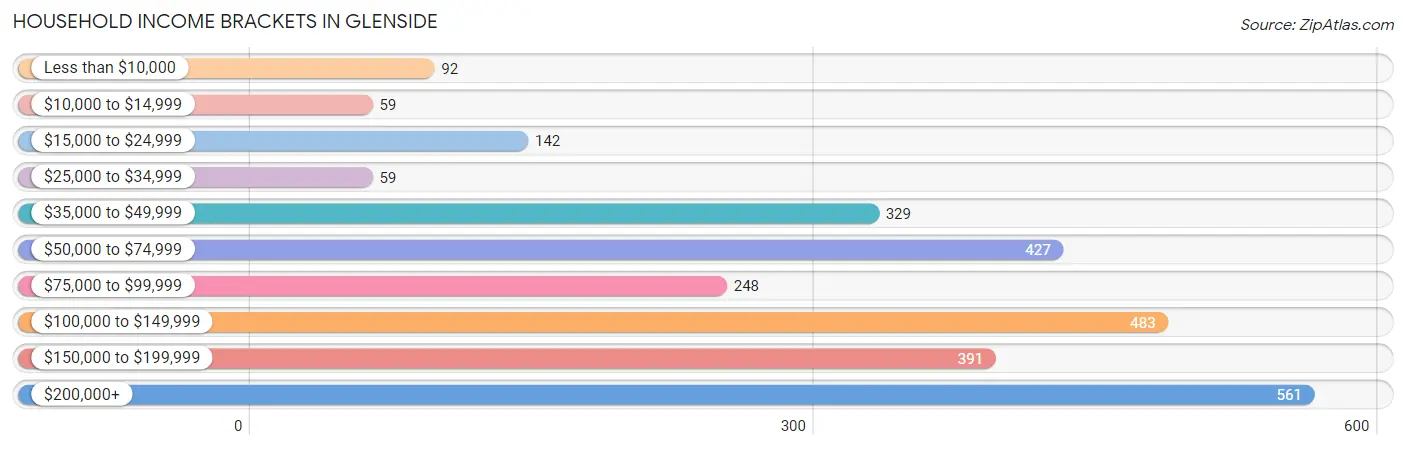
| Income Bracket | # Households | % Households |
| Less than $10,000 | 92 | 3.3% |
| $10,000 to $14,999 | 59 | 2.1% |
| $15,000 to $24,999 | 142 | 5.1% |
| $25,000 to $34,999 | 59 | 2.1% |
| $35,000 to $49,999 | 329 | 11.8% |
| $50,000 to $74,999 | 427 | 15.3% |
| $75,000 to $99,999 | 248 | 8.9% |
| $100,000 to $149,999 | 483 | 17.3% |
| $150,000 to $199,999 | 391 | 14.0% |
| $200,000+ | 561 | 20.1% |
Household Income by Householder Age in Glenside
The median household income in Glenside is $105,278, with the highest median household income of $130,104 found in the 45 to 64 years age bracket for the primary householder. A total of 1,095 households (39.2%) fall into this category. Meanwhile, the 15 to 24 years age bracket for the primary householder has the lowest median household income of $0, with 141 households (5.1%) in this group.
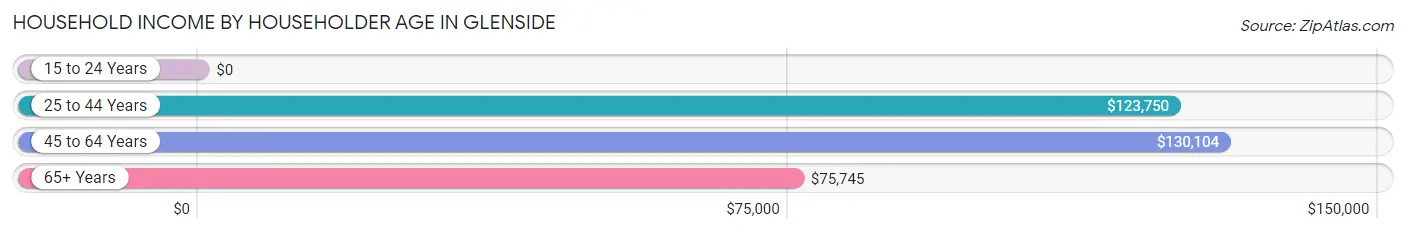
| Income Bracket | # Households | Median Income |
| 15 to 24 Years | 141 (5.1%) | $0 |
| 25 to 44 Years | 804 (28.8%) | $123,750 |
| 45 to 64 Years | 1,095 (39.2%) | $130,104 |
| 65+ Years | 752 (26.9%) | $75,745 |
| Total | 2,792 (100.0%) | $105,278 |
Poverty in Glenside
Income Below Poverty by Sex and Age in Glenside
With 5.0% poverty level for males and 7.4% for females among the residents of Glenside, 18 to 24 year old males and 18 to 24 year old females are the most vulnerable to poverty, with 80 males (34.2%) and 140 females (44.2%) in their respective age groups living below the poverty level.
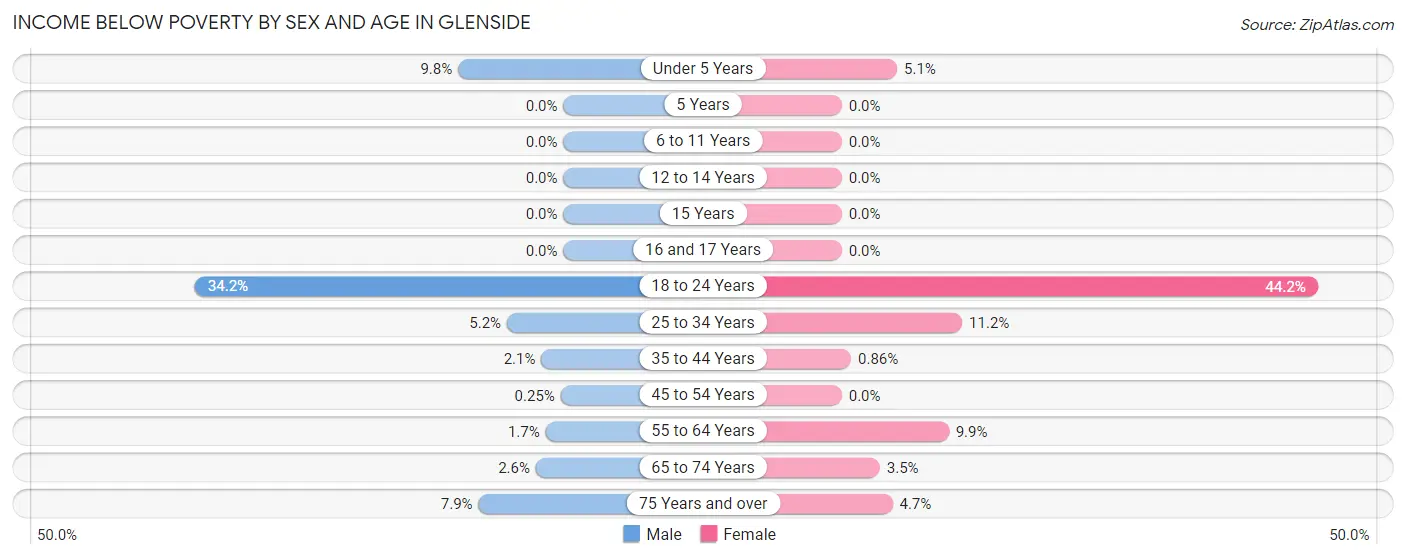
| Age Bracket | Male | Female |
| Under 5 Years | 13 (9.8%) | 12 (5.1%) |
| 5 Years | 0 (0.0%) | 0 (0.0%) |
| 6 to 11 Years | 0 (0.0%) | 0 (0.0%) |
| 12 to 14 Years | 0 (0.0%) | 0 (0.0%) |
| 15 Years | 0 (0.0%) | 0 (0.0%) |
| 16 and 17 Years | 0 (0.0%) | 0 (0.0%) |
| 18 to 24 Years | 80 (34.2%) | 140 (44.2%) |
| 25 to 34 Years | 23 (5.2%) | 42 (11.2%) |
| 35 to 44 Years | 10 (2.1%) | 5 (0.9%) |
| 45 to 54 Years | 1 (0.3%) | 0 (0.0%) |
| 55 to 64 Years | 9 (1.7%) | 65 (9.9%) |
| 65 to 74 Years | 7 (2.6%) | 15 (3.5%) |
| 75 Years and over | 13 (7.9%) | 16 (4.7%) |
| Total | 156 (5.0%) | 295 (7.4%) |
Income Above Poverty by Sex and Age in Glenside
According to the poverty statistics in Glenside, males aged 5 years and females aged 5 years are the age groups that are most secure financially, with 100.0% of males and 100.0% of females in these age groups living above the poverty line.
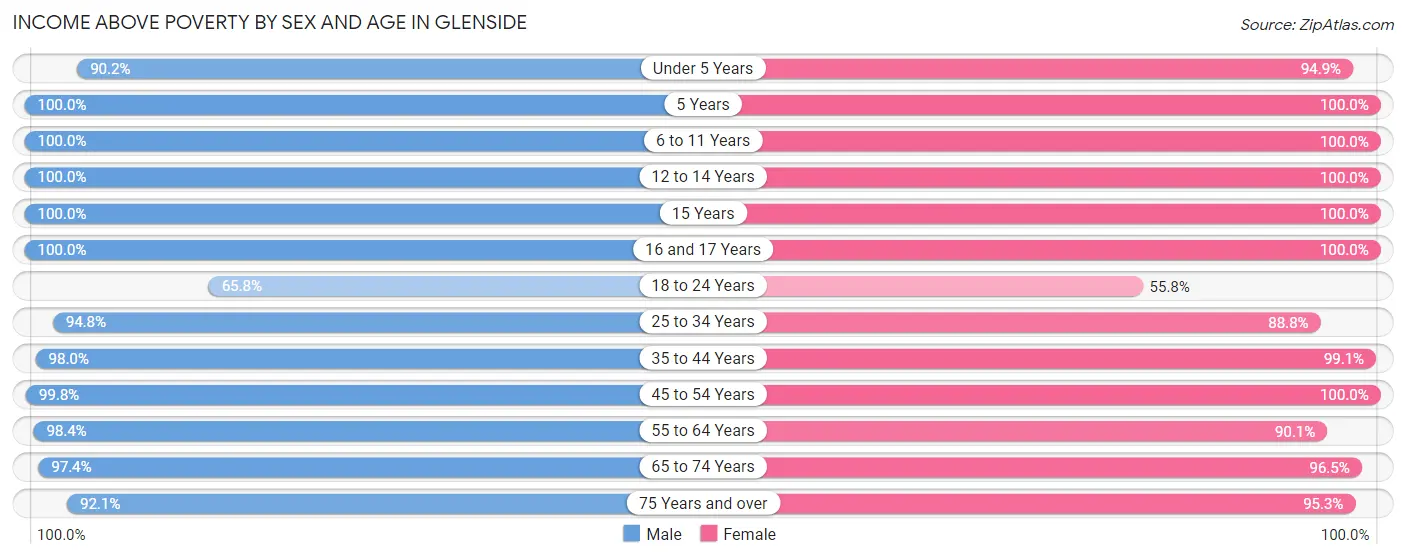
| Age Bracket | Male | Female |
| Under 5 Years | 120 (90.2%) | 222 (94.9%) |
| 5 Years | 72 (100.0%) | 49 (100.0%) |
| 6 to 11 Years | 176 (100.0%) | 288 (100.0%) |
| 12 to 14 Years | 109 (100.0%) | 138 (100.0%) |
| 15 Years | 56 (100.0%) | 56 (100.0%) |
| 16 and 17 Years | 38 (100.0%) | 97 (100.0%) |
| 18 to 24 Years | 154 (65.8%) | 177 (55.8%) |
| 25 to 34 Years | 416 (94.8%) | 334 (88.8%) |
| 35 to 44 Years | 477 (98.0%) | 574 (99.1%) |
| 45 to 54 Years | 407 (99.8%) | 410 (100.0%) |
| 55 to 64 Years | 537 (98.4%) | 590 (90.1%) |
| 65 to 74 Years | 266 (97.4%) | 410 (96.5%) |
| 75 Years and over | 152 (92.1%) | 324 (95.3%) |
| Total | 2,980 (95.0%) | 3,669 (92.6%) |
Income Below Poverty Among Married-Couple Families in Glenside
The poverty statistics for married-couple families in Glenside show that 1.7% or 26 of the total 1,538 families live below the poverty line. Families with 1 or 2 children have the highest poverty rate of 3.6%, comprising of 13 families. On the other hand, families with 3 or 4 children have the lowest poverty rate of 0.0%, which includes 0 families.
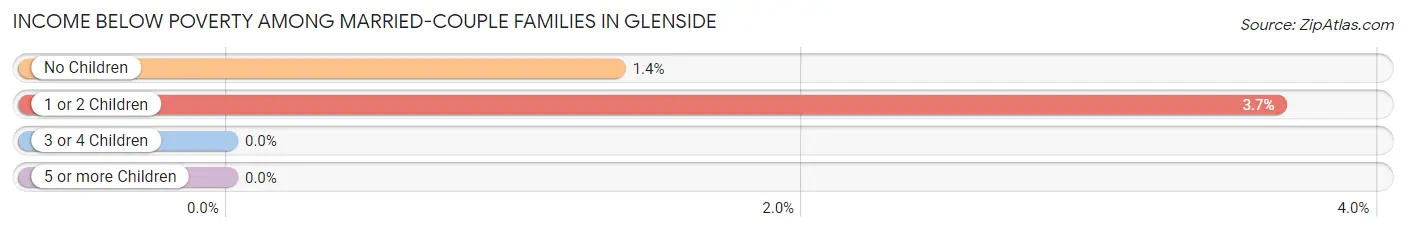
| Children | Above Poverty | Below Poverty |
| No Children | 953 (98.7%) | 13 (1.3%) |
| 1 or 2 Children | 343 (96.4%) | 13 (3.6%) |
| 3 or 4 Children | 202 (100.0%) | 0 (0.0%) |
| 5 or more Children | 14 (100.0%) | 0 (0.0%) |
| Total | 1,512 (98.3%) | 26 (1.7%) |
Income Below Poverty Among Single-Parent Households in Glenside
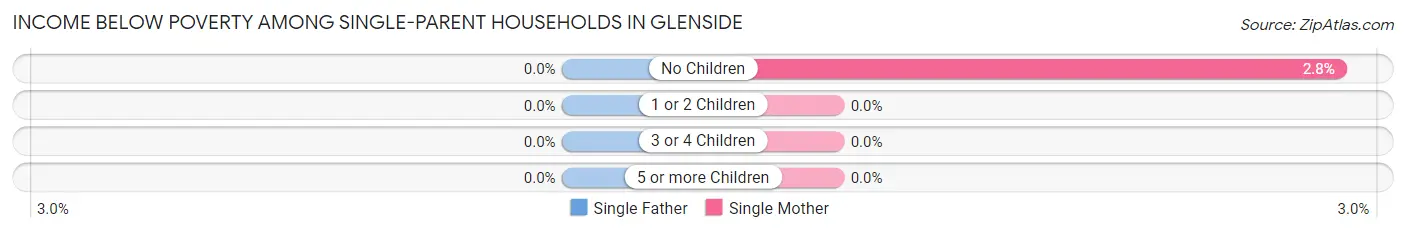
| Children | Single Father | Single Mother |
| No Children | 0 (0.0%) | 5 (2.8%) |
| 1 or 2 Children | 0 (0.0%) | 0 (0.0%) |
| 3 or 4 Children | 0 (0.0%) | 0 (0.0%) |
| 5 or more Children | 0 (0.0%) | 0 (0.0%) |
| Total | 0 (0.0%) | 5 (1.8%) |
Income Below Poverty Among Married-Couple vs Single-Parent Households in Glenside
The poverty data for Glenside shows that 26 of the married-couple family households (1.7%) and 5 of the single-parent households (1.5%) are living below the poverty level. Within the married-couple family households, those with 1 or 2 children have the highest poverty rate, with 13 households (3.6%) falling below the poverty line. Among the single-parent households, those with no children have the highest poverty rate, with 5 household (2.2%) living below poverty.
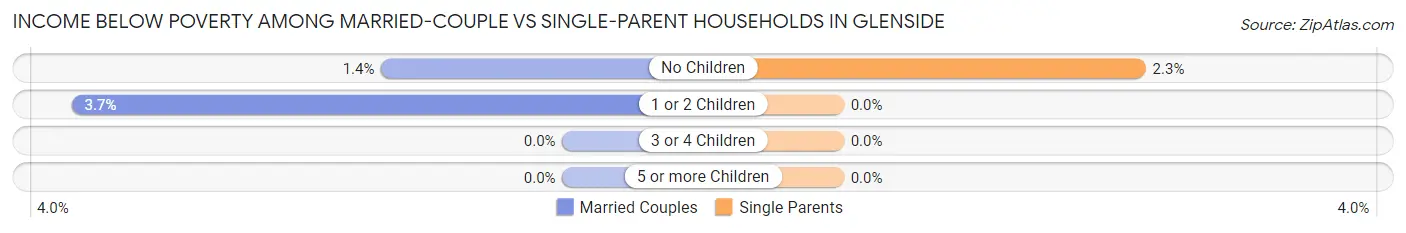
| Children | Married-Couple Families | Single-Parent Households |
| No Children | 13 (1.3%) | 5 (2.2%) |
| 1 or 2 Children | 13 (3.6%) | 0 (0.0%) |
| 3 or 4 Children | 0 (0.0%) | 0 (0.0%) |
| 5 or more Children | 0 (0.0%) | 0 (0.0%) |
| Total | 26 (1.7%) | 5 (1.5%) |
Race in Glenside
The most populous races in Glenside are White / Caucasian (6,666 | 86.3%), Black / African American (568 | 7.3%), and Hispanic or Latino (358 | 4.6%).
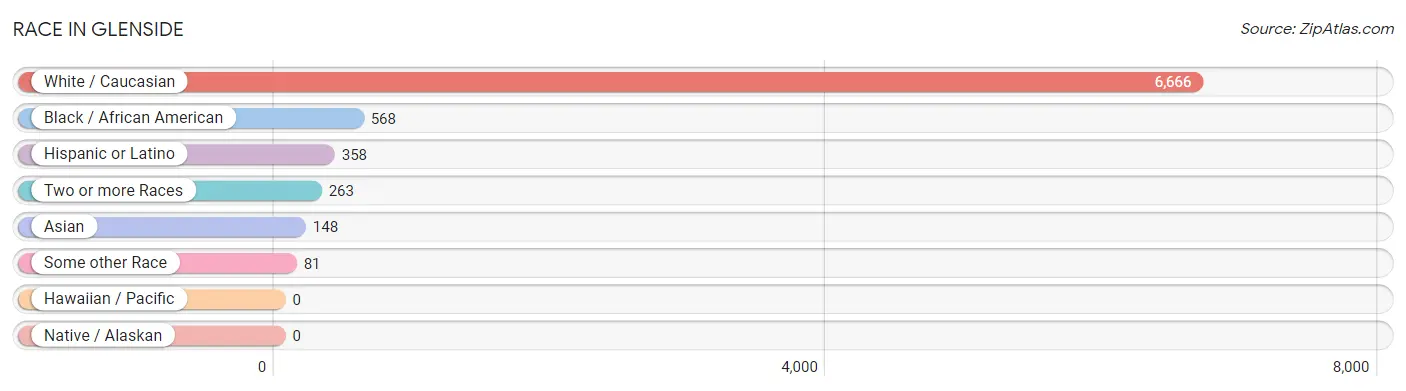
| Race | # Population | % Population |
| Asian | 148 | 1.9% |
| Black / African American | 568 | 7.3% |
| Hawaiian / Pacific | 0 | 0.0% |
| Hispanic or Latino | 358 | 4.6% |
| Native / Alaskan | 0 | 0.0% |
| White / Caucasian | 6,666 | 86.3% |
| Two or more Races | 263 | 3.4% |
| Some other Race | 81 | 1.1% |
| Total | 7,726 | 100.0% |
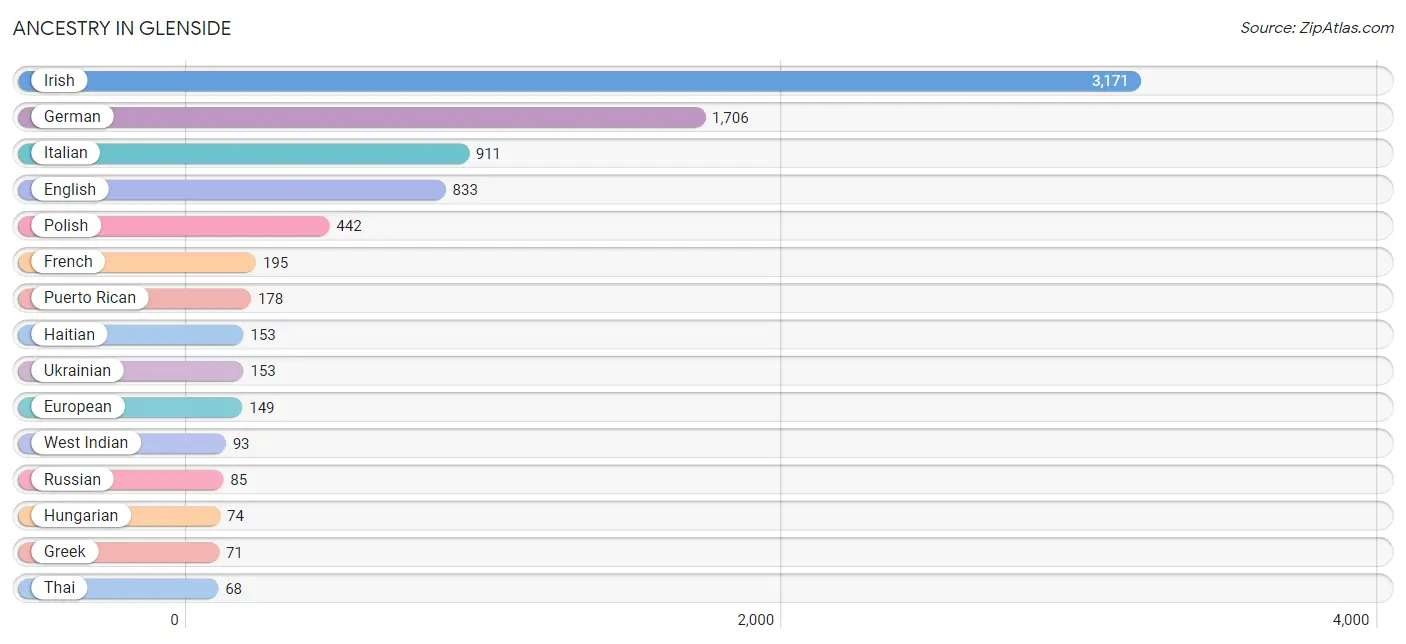
Ancestry in Glenside
The most populous ancestries reported in Glenside are Irish (3,171 | 41.0%), German (1,706 | 22.1%), Italian (911 | 11.8%), English (833 | 10.8%), and Polish (442 | 5.7%), together accounting for 91.4% of all Glenside residents.
| Ancestry | # Population | % Population |
| African | 9 | 0.1% |
| American | 38 | 0.5% |
| Arab | 13 | 0.2% |
| Argentinean | 26 | 0.3% |
| Armenian | 13 | 0.2% |
| Austrian | 51 | 0.7% |
| Belgian | 32 | 0.4% |
| British | 51 | 0.7% |
| Burmese | 13 | 0.2% |
| Canadian | 24 | 0.3% |
| Cape Verdean | 17 | 0.2% |
| Carpatho Rusyn | 5 | 0.1% |
| Central American | 35 | 0.4% |
| Central American Indian | 11 | 0.1% |
| Cherokee | 36 | 0.5% |
| Colombian | 11 | 0.1% |
| Cuban | 6 | 0.1% |
| Danish | 20 | 0.3% |
| Dutch | 57 | 0.7% |
| Eastern European | 51 | 0.7% |
| English | 833 | 10.8% |
| European | 149 | 1.9% |
| French | 195 | 2.5% |
| German | 1,706 | 22.1% |
| Greek | 71 | 0.9% |
| Haitian | 153 | 2.0% |
| Honduran | 14 | 0.2% |
| Hungarian | 74 | 1.0% |
| Indian (Asian) | 41 | 0.5% |
| Irish | 3,171 | 41.0% |
| Italian | 911 | 11.8% |
| Korean | 18 | 0.2% |
| Lithuanian | 41 | 0.5% |
| Mexican | 44 | 0.6% |
| Norwegian | 33 | 0.4% |
| Pakistani | 8 | 0.1% |
| Panamanian | 21 | 0.3% |
| Pennsylvania German | 27 | 0.4% |
| Peruvian | 21 | 0.3% |
| Polish | 442 | 5.7% |
| Puerto Rican | 178 | 2.3% |
| Romanian | 15 | 0.2% |
| Russian | 85 | 1.1% |
| Scotch-Irish | 37 | 0.5% |
| Scottish | 27 | 0.4% |
| Slavic | 13 | 0.2% |
| Slovak | 7 | 0.1% |
| South American | 58 | 0.7% |
| Sri Lankan | 33 | 0.4% |
| Subsaharan African | 26 | 0.3% |
| Syrian | 13 | 0.2% |
| Thai | 68 | 0.9% |
| Ukrainian | 153 | 2.0% |
| Welsh | 53 | 0.7% |
| West Indian | 93 | 1.2% | View All 55 Rows |
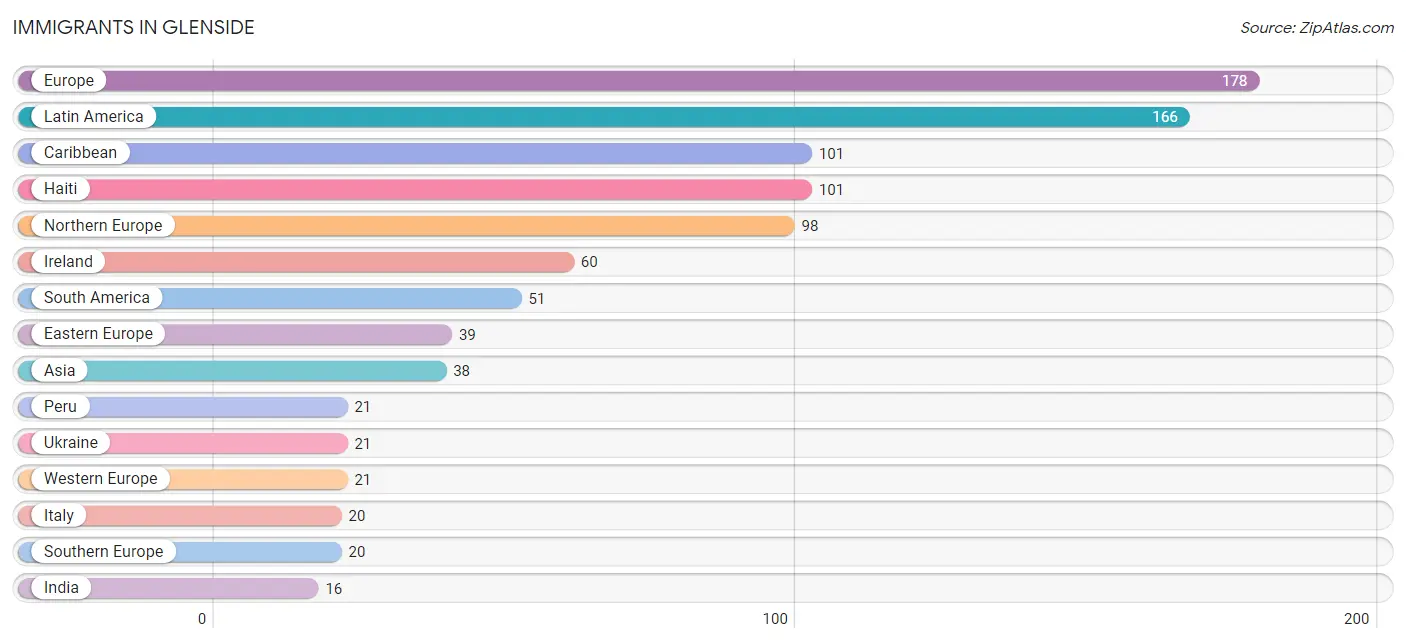
Immigrants in Glenside
The most numerous immigrant groups reported in Glenside came from Europe (178 | 2.3%), Latin America (166 | 2.1%), Caribbean (101 | 1.3%), Haiti (101 | 1.3%), and Northern Europe (98 | 1.3%), together accounting for 8.3% of all Glenside residents.
| Immigration Origin | # Population | % Population |
| Africa | 9 | 0.1% |
| Argentina | 6 | 0.1% |
| Asia | 38 | 0.5% |
| Belgium | 10 | 0.1% |
| Caribbean | 101 | 1.3% |
| Central America | 14 | 0.2% |
| Chile | 13 | 0.2% |
| China | 9 | 0.1% |
| Colombia | 11 | 0.1% |
| Czechoslovakia | 7 | 0.1% |
| Eastern Asia | 9 | 0.1% |
| Eastern Europe | 39 | 0.5% |
| England | 6 | 0.1% |
| Europe | 178 | 2.3% |
| Haiti | 101 | 1.3% |
| Honduras | 14 | 0.2% |
| Hungary | 10 | 0.1% |
| India | 16 | 0.2% |
| Ireland | 60 | 0.8% |
| Italy | 20 | 0.3% |
| Latin America | 166 | 2.1% |
| Netherlands | 11 | 0.1% |
| Northern Europe | 98 | 1.3% |
| Peru | 21 | 0.3% |
| Poland | 1 | 0.0% |
| Sierra Leone | 9 | 0.1% |
| South America | 51 | 0.7% |
| South Central Asia | 16 | 0.2% |
| Southern Europe | 20 | 0.3% |
| Syria | 13 | 0.2% |
| Ukraine | 21 | 0.3% |
| Western Africa | 9 | 0.1% |
| Western Asia | 13 | 0.2% |
| Western Europe | 21 | 0.3% | View All 34 Rows |
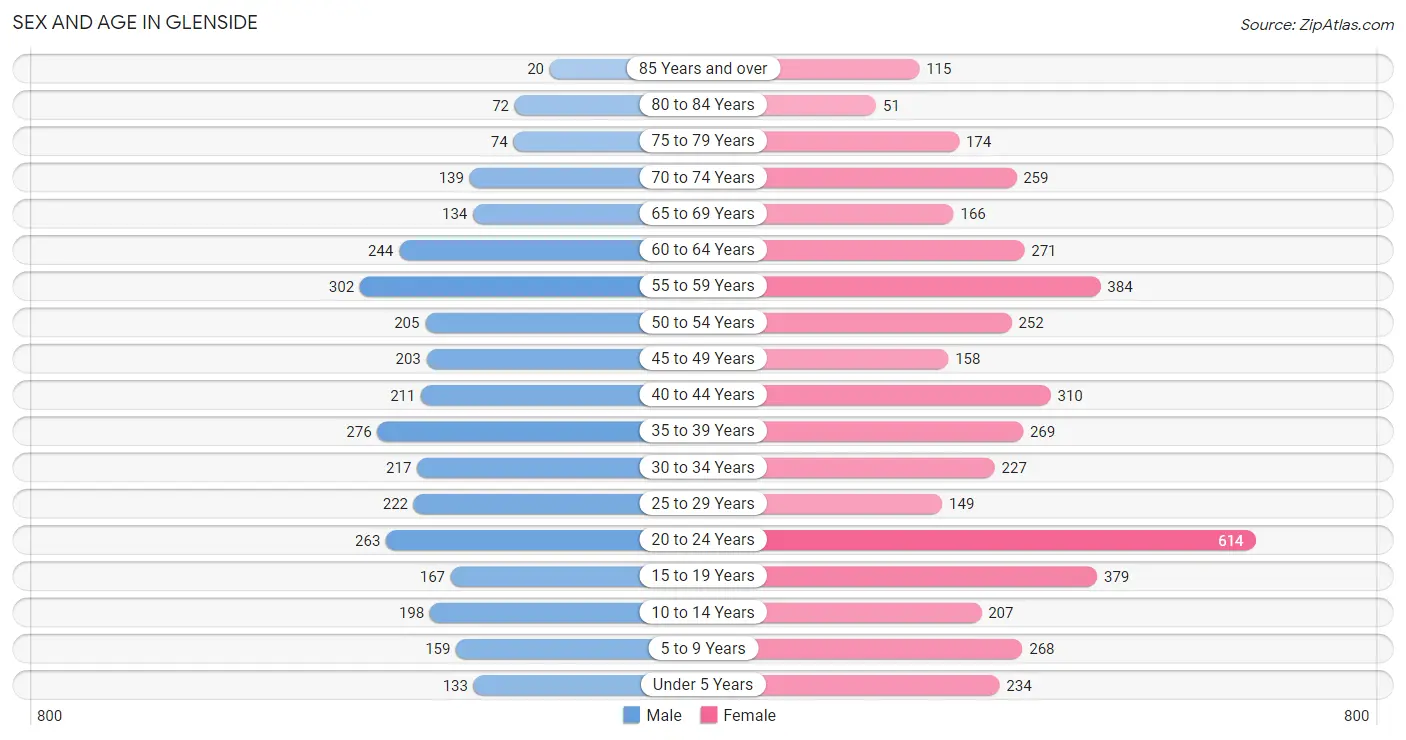
Sex and Age in Glenside
Sex and Age in Glenside
The most populous age groups in Glenside are 55 to 59 Years (302 | 9.3%) for men and 20 to 24 Years (614 | 13.7%) for women.
| Age Bracket | Male | Female |
| Under 5 Years | 133 (4.1%) | 234 (5.2%) |
| 5 to 9 Years | 159 (4.9%) | 268 (6.0%) |
| 10 to 14 Years | 198 (6.1%) | 207 (4.6%) |
| 15 to 19 Years | 167 (5.2%) | 379 (8.5%) |
| 20 to 24 Years | 263 (8.1%) | 614 (13.7%) |
| 25 to 29 Years | 222 (6.9%) | 149 (3.3%) |
| 30 to 34 Years | 217 (6.7%) | 227 (5.1%) |
| 35 to 39 Years | 276 (8.5%) | 269 (6.0%) |
| 40 to 44 Years | 211 (6.5%) | 310 (6.9%) |
| 45 to 49 Years | 203 (6.3%) | 158 (3.5%) |
| 50 to 54 Years | 205 (6.3%) | 252 (5.6%) |
| 55 to 59 Years | 302 (9.3%) | 384 (8.6%) |
| 60 to 64 Years | 244 (7.5%) | 271 (6.0%) |
| 65 to 69 Years | 134 (4.1%) | 166 (3.7%) |
| 70 to 74 Years | 139 (4.3%) | 259 (5.8%) |
| 75 to 79 Years | 74 (2.3%) | 174 (3.9%) |
| 80 to 84 Years | 72 (2.2%) | 51 (1.1%) |
| 85 Years and over | 20 (0.6%) | 115 (2.6%) |
| Total | 3,239 (100.0%) | 4,487 (100.0%) |
Families and Households in Glenside
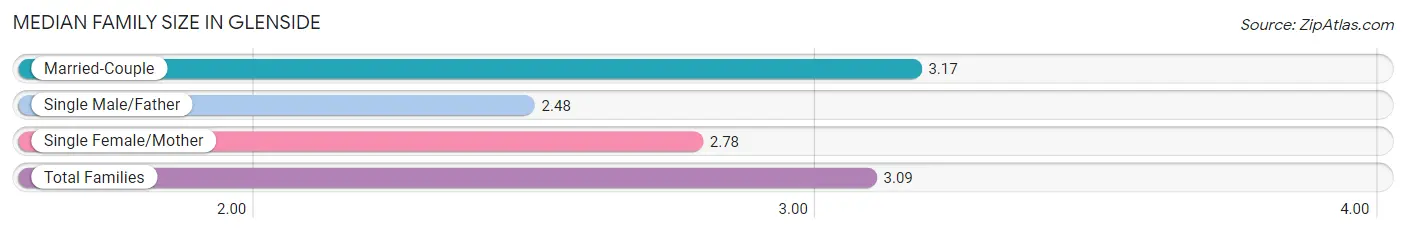
Median Family Size in Glenside
The median family size in Glenside is 3.09 persons per family, with married-couple families (1,538 | 81.7%) accounting for the largest median family size of 3.17 persons per family. On the other hand, single male/father families (61 | 3.2%) represent the smallest median family size with 2.48 persons per family.
| Family Type | # Families | Family Size |
| Married-Couple | 1,538 (81.7%) | 3.17 |
| Single Male/Father | 61 (3.2%) | 2.48 |
| Single Female/Mother | 283 (15.0%) | 2.78 |
| Total Families | 1,882 (100.0%) | 3.09 |
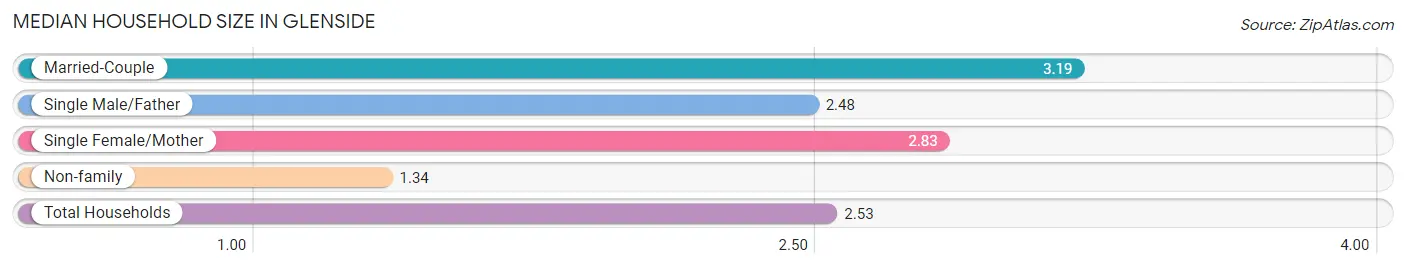
Median Household Size in Glenside
The median household size in Glenside is 2.53 persons per household, with married-couple households (1,538 | 55.1%) accounting for the largest median household size of 3.19 persons per household. non-family households (910 | 32.6%) represent the smallest median household size with 1.34 persons per household.
| Household Type | # Households | Household Size |
| Married-Couple | 1,538 (55.1%) | 3.19 |
| Single Male/Father | 61 (2.2%) | 2.48 |
| Single Female/Mother | 283 (10.1%) | 2.83 |
| Non-family | 910 (32.6%) | 1.34 |
| Total Households | 2,792 (100.0%) | 2.53 |
Household Size by Marriage Status in Glenside
Out of a total of 2,792 households in Glenside, 1,882 (67.4%) are family households, while 910 (32.6%) are nonfamily households. The most numerous type of family households are 2-person households, comprising 907, and the most common type of nonfamily households are 1-person households, comprising 666.
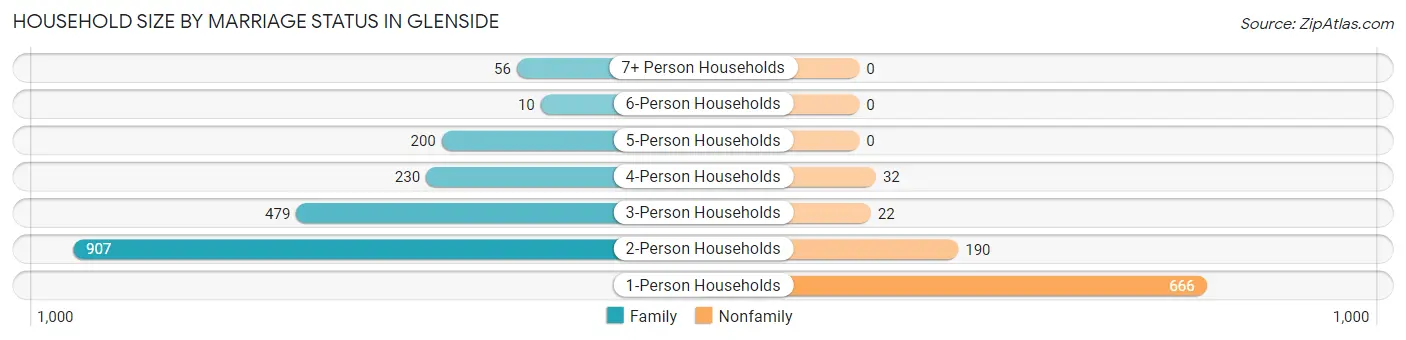
| Household Size | Family Households | Nonfamily Households |
| 1-Person Households | - | 666 (23.8%) |
| 2-Person Households | 907 (32.5%) | 190 (6.8%) |
| 3-Person Households | 479 (17.2%) | 22 (0.8%) |
| 4-Person Households | 230 (8.2%) | 32 (1.1%) |
| 5-Person Households | 200 (7.2%) | 0 (0.0%) |
| 6-Person Households | 10 (0.4%) | 0 (0.0%) |
| 7+ Person Households | 56 (2.0%) | 0 (0.0%) |
| Total | 1,882 (67.4%) | 910 (32.6%) |
Female Fertility in Glenside
Fertility by Age in Glenside
Average fertility rate in Glenside is 40.0 births per 1,000 women. Women in the age bracket of 35 to 50 years have the highest fertility rate with 53.0 births per 1,000 women. Women in the age bracket of 20 to 34 years acount for 53.5% of all women with births.
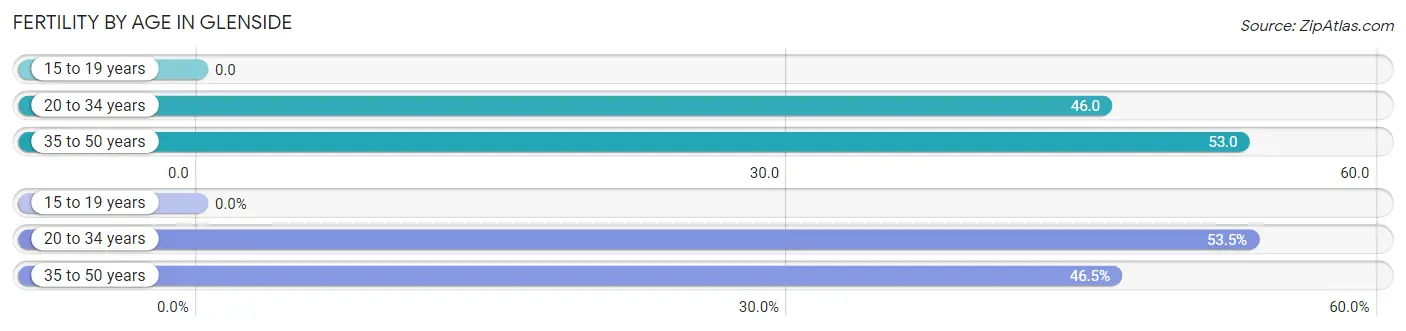
| Age Bracket | Women with Births | Births / 1,000 Women |
| 15 to 19 years | 0 (0.0%) | 0.0 |
| 20 to 34 years | 46 (53.5%) | 46.0 |
| 35 to 50 years | 40 (46.5%) | 53.0 |
| Total | 86 (100.0%) | 40.0 |
Fertility by Age by Marriage Status in Glenside
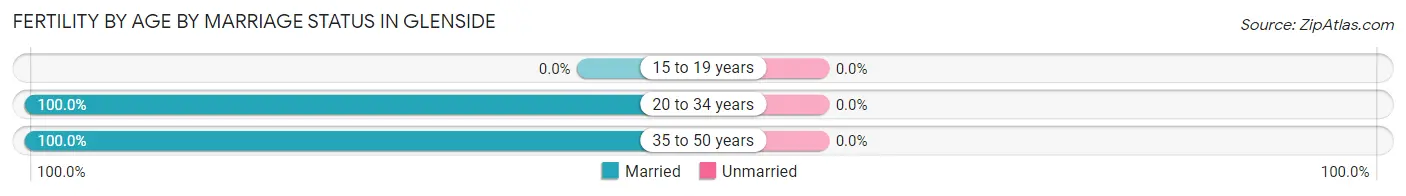
| Age Bracket | Married | Unmarried |
| 15 to 19 years | 0 (0.0%) | 0 (0.0%) |
| 20 to 34 years | 46 (100.0%) | 0 (0.0%) |
| 35 to 50 years | 40 (100.0%) | 0 (0.0%) |
| Total | 86 (100.0%) | 0 (0.0%) |
Fertility by Education in Glenside
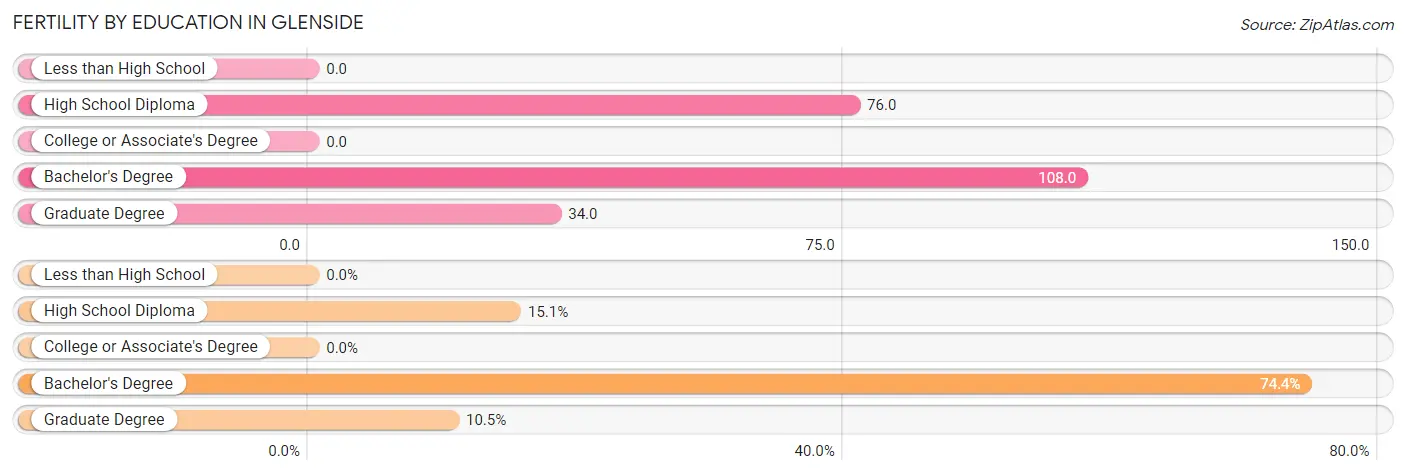
| Educational Attainment | Women with Births | Births / 1,000 Women |
| Less than High School | 0 (0.0%) | 0.0 |
| High School Diploma | 13 (15.1%) | 76.0 |
| College or Associate's Degree | 0 (0.0%) | 0.0 |
| Bachelor's Degree | 64 (74.4%) | 108.0 |
| Graduate Degree | 9 (10.5%) | 34.0 |
| Total | 86 (100.0%) | 40.0 |
Fertility by Education by Marriage Status in Glenside
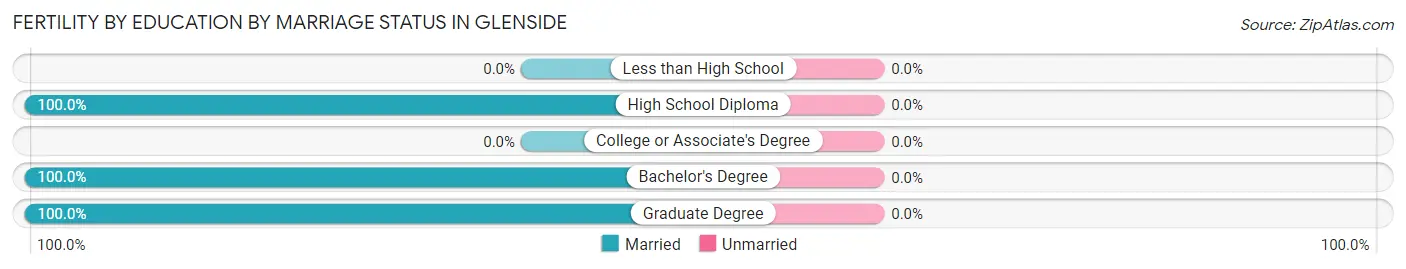
| Educational Attainment | Married | Unmarried |
| Less than High School | 0 (0.0%) | 0 (0.0%) |
| High School Diploma | 13 (100.0%) | 0 (0.0%) |
| College or Associate's Degree | 0 (0.0%) | 0 (0.0%) |
| Bachelor's Degree | 64 (100.0%) | 0 (0.0%) |
| Graduate Degree | 9 (100.0%) | 0 (0.0%) |
| Total | 86 (100.0%) | 0 (0.0%) |
Employment Characteristics in Glenside
Employment by Class of Employer in Glenside
Among the 3,947 employed individuals in Glenside, private company employees (2,258 | 57.2%), not-for-profit organizations (859 | 21.8%), and local government employees (230 | 5.8%) make up the most common classes of employment.
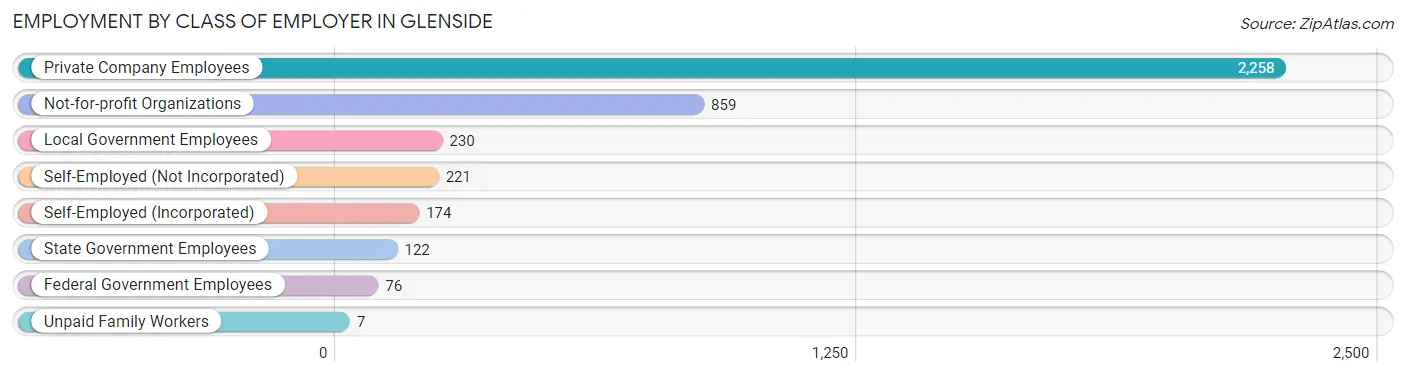
| Employer Class | # Employees | % Employees |
| Private Company Employees | 2,258 | 57.2% |
| Self-Employed (Incorporated) | 174 | 4.4% |
| Self-Employed (Not Incorporated) | 221 | 5.6% |
| Not-for-profit Organizations | 859 | 21.8% |
| Local Government Employees | 230 | 5.8% |
| State Government Employees | 122 | 3.1% |
| Federal Government Employees | 76 | 1.9% |
| Unpaid Family Workers | 7 | 0.2% |
| Total | 3,947 | 100.0% |
Employment Status by Age in Glenside
According to the labor force statistics for Glenside, out of the total population over 16 years of age (6,415), 67.8% or 4,349 individuals are in the labor force, with 3.5% or 152 of them unemployed. The age group with the highest labor force participation rate is 25 to 29 years, with 92.5% or 343 individuals in the labor force. Within the labor force, the 60 to 64 years age range has the highest percentage of unemployed individuals, with 12.9% or 48 of them being unemployed.
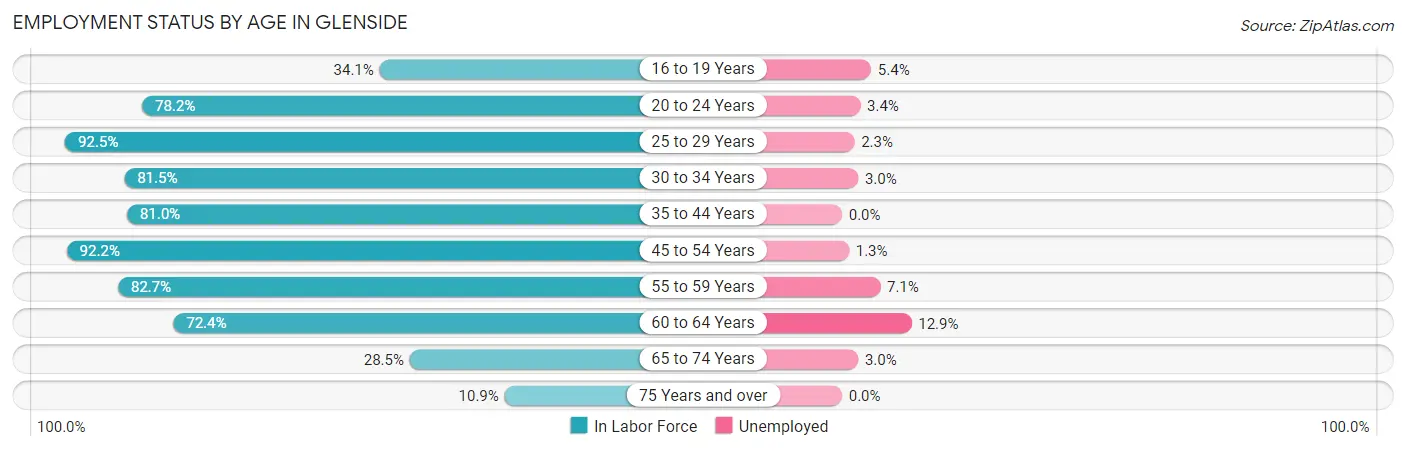
| Age Bracket | In Labor Force | Unemployed |
| 16 to 19 Years | 148 (34.1%) | 8 (5.4%) |
| 20 to 24 Years | 686 (78.2%) | 23 (3.4%) |
| 25 to 29 Years | 343 (92.5%) | 8 (2.3%) |
| 30 to 34 Years | 362 (81.5%) | 11 (3.0%) |
| 35 to 44 Years | 863 (81.0%) | 0 (0.0%) |
| 45 to 54 Years | 754 (92.2%) | 10 (1.3%) |
| 55 to 59 Years | 567 (82.7%) | 40 (7.1%) |
| 60 to 64 Years | 373 (72.4%) | 48 (12.9%) |
| 65 to 74 Years | 199 (28.5%) | 6 (3.0%) |
| 75 Years and over | 55 (10.9%) | 0 (0.0%) |
| Total | 4,349 (67.8%) | 152 (3.5%) |
Employment Status by Educational Attainment in Glenside
According to labor force statistics for Glenside, 83.6% of individuals (3,260) out of the total population between 25 and 64 years of age (3,900) are in the labor force, with 3.6% or 117 of them being unemployed. The group with the highest labor force participation rate are those with the educational attainment of bachelor's degree or higher, with 88.5% or 1,938 individuals in the labor force. Within the labor force, individuals with college / associate degree education have the highest percentage of unemployment, with 7.5% or 56 of them being unemployed.
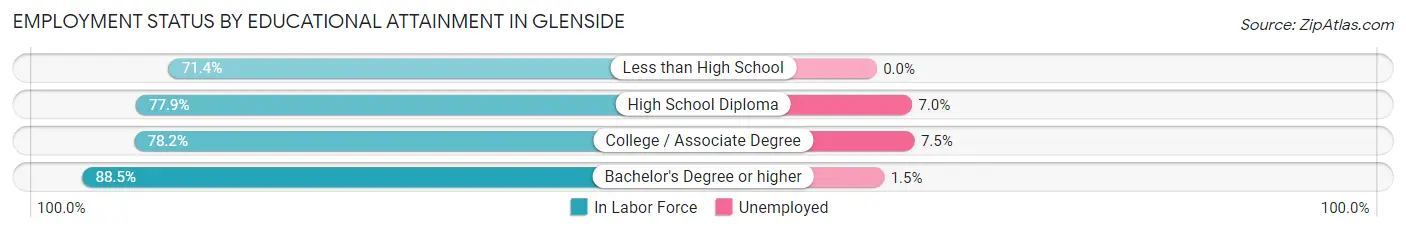
| Educational Attainment | In Labor Force | Unemployed |
| Less than High School | 120 (71.4%) | 0 (0.0%) |
| High School Diploma | 457 (77.9%) | 41 (7.0%) |
| College / Associate Degree | 747 (78.2%) | 72 (7.5%) |
| Bachelor's Degree or higher | 1,938 (88.5%) | 33 (1.5%) |
| Total | 3,260 (83.6%) | 140 (3.6%) |
Employment Occupations by Sex in Glenside
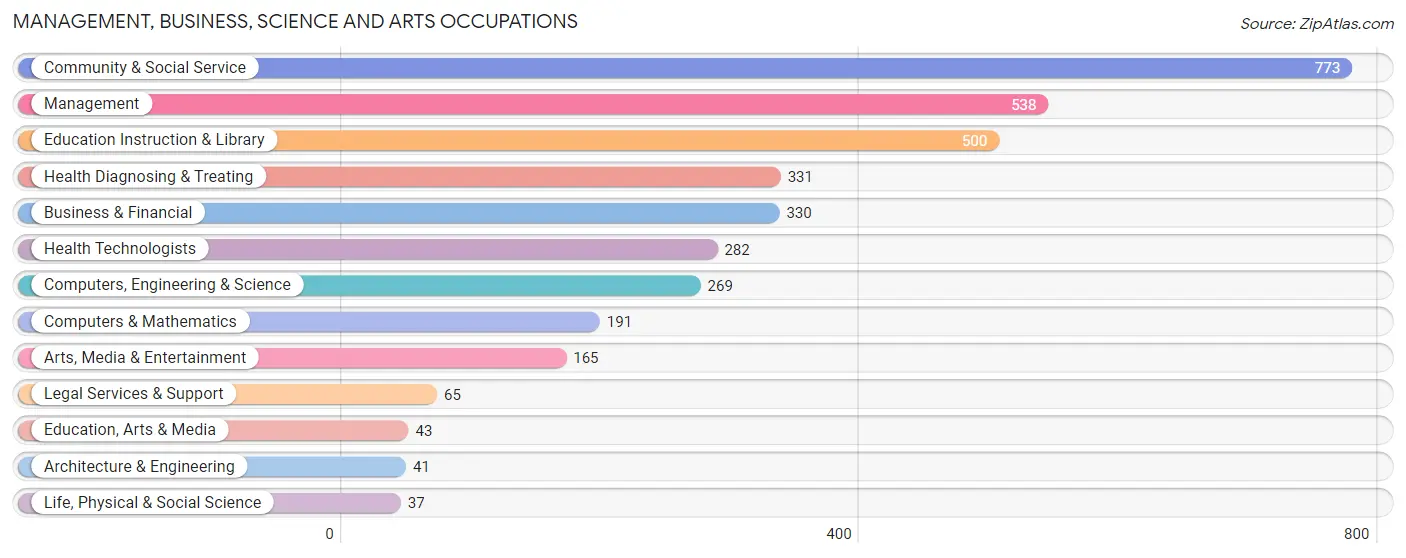
Management, Business, Science and Arts Occupations
The most common Management, Business, Science and Arts occupations in Glenside are Community & Social Service (773 | 18.4%), Management (538 | 12.8%), Education Instruction & Library (500 | 11.9%), Health Diagnosing & Treating (331 | 7.9%), and Business & Financial (330 | 7.9%).
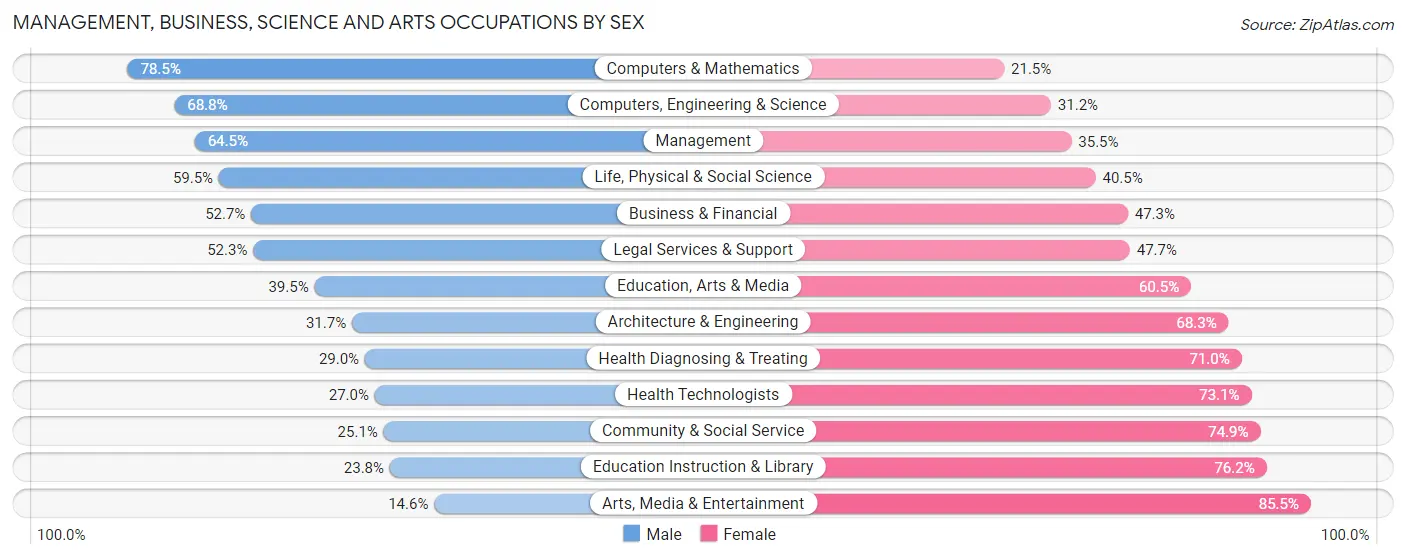
Management, Business, Science and Arts Occupations by Sex
Within the Management, Business, Science and Arts occupations in Glenside, the most male-oriented occupations are Computers & Mathematics (78.5%), Computers, Engineering & Science (68.8%), and Management (64.5%), while the most female-oriented occupations are Arts, Media & Entertainment (85.5%), Education Instruction & Library (76.2%), and Community & Social Service (74.9%).
| Occupation | Male | Female |
| Management | 347 (64.5%) | 191 (35.5%) |
| Business & Financial | 174 (52.7%) | 156 (47.3%) |
| Computers, Engineering & Science | 185 (68.8%) | 84 (31.2%) |
| Computers & Mathematics | 150 (78.5%) | 41 (21.5%) |
| Architecture & Engineering | 13 (31.7%) | 28 (68.3%) |
| Life, Physical & Social Science | 22 (59.5%) | 15 (40.5%) |
| Community & Social Service | 194 (25.1%) | 579 (74.9%) |
| Education, Arts & Media | 17 (39.5%) | 26 (60.5%) |
| Legal Services & Support | 34 (52.3%) | 31 (47.7%) |
| Education Instruction & Library | 119 (23.8%) | 381 (76.2%) |
| Arts, Media & Entertainment | 24 (14.5%) | 141 (85.5%) |
| Health Diagnosing & Treating | 96 (29.0%) | 235 (71.0%) |
| Health Technologists | 76 (27.0%) | 206 (73.1%) |
| Total (Category) | 996 (44.4%) | 1,245 (55.6%) |
| Total (Overall) | 1,994 (47.5%) | 2,202 (52.5%) |
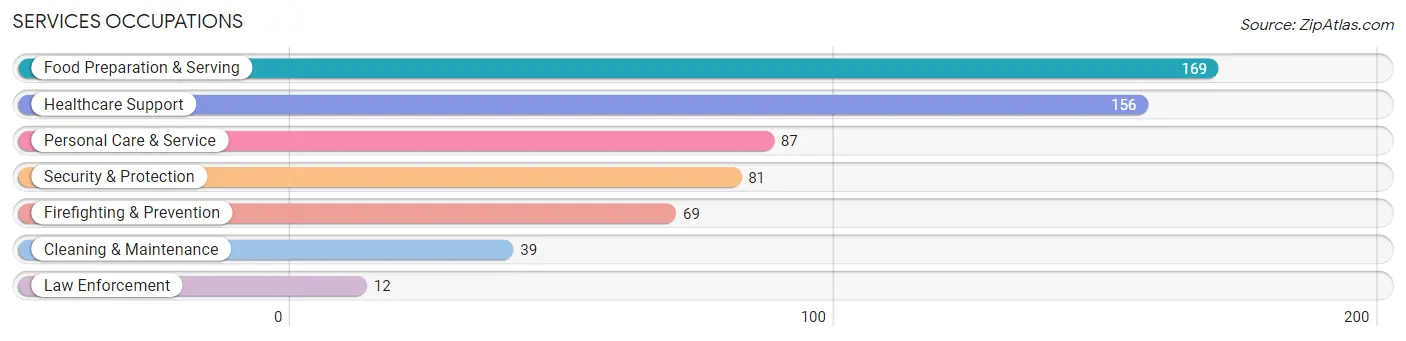
Services Occupations
The most common Services occupations in Glenside are Food Preparation & Serving (169 | 4.0%), Healthcare Support (156 | 3.7%), Personal Care & Service (87 | 2.1%), Security & Protection (81 | 1.9%), and Firefighting & Prevention (69 | 1.6%).
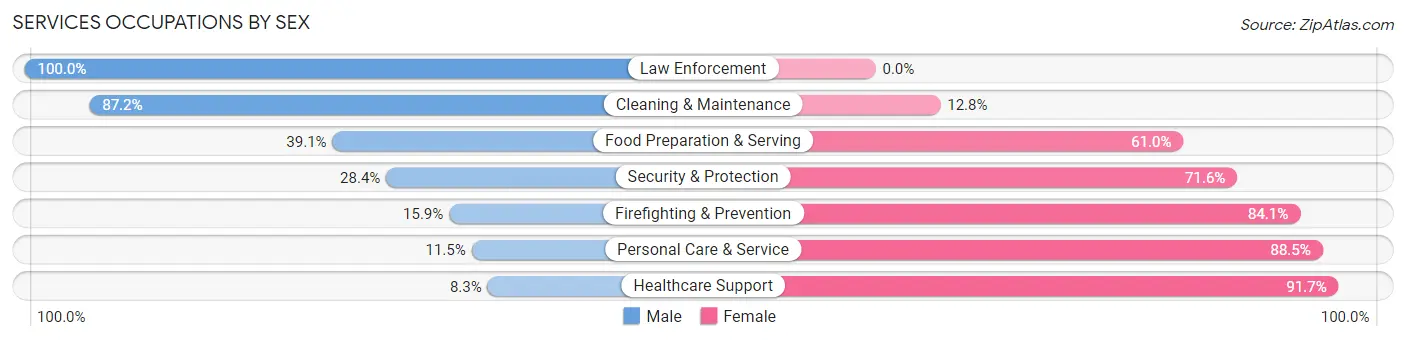
Services Occupations by Sex
Within the Services occupations in Glenside, the most male-oriented occupations are Law Enforcement (100.0%), Cleaning & Maintenance (87.2%), and Food Preparation & Serving (39.1%), while the most female-oriented occupations are Healthcare Support (91.7%), Personal Care & Service (88.5%), and Firefighting & Prevention (84.1%).
| Occupation | Male | Female |
| Healthcare Support | 13 (8.3%) | 143 (91.7%) |
| Security & Protection | 23 (28.4%) | 58 (71.6%) |
| Firefighting & Prevention | 11 (15.9%) | 58 (84.1%) |
| Law Enforcement | 12 (100.0%) | 0 (0.0%) |
| Food Preparation & Serving | 66 (39.1%) | 103 (61.0%) |
| Cleaning & Maintenance | 34 (87.2%) | 5 (12.8%) |
| Personal Care & Service | 10 (11.5%) | 77 (88.5%) |
| Total (Category) | 146 (27.4%) | 386 (72.6%) |
| Total (Overall) | 1,994 (47.5%) | 2,202 (52.5%) |
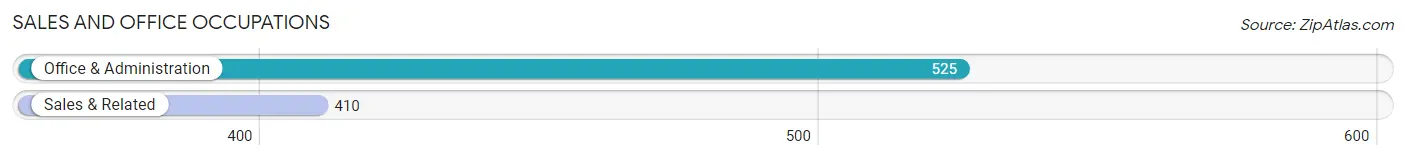
Sales and Office Occupations
The most common Sales and Office occupations in Glenside are Office & Administration (525 | 12.5%), and Sales & Related (410 | 9.8%).
Sales and Office Occupations by Sex
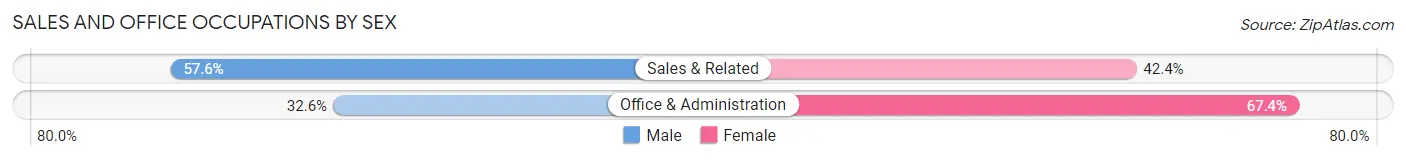
| Occupation | Male | Female |
| Sales & Related | 236 (57.6%) | 174 (42.4%) |
| Office & Administration | 171 (32.6%) | 354 (67.4%) |
| Total (Category) | 407 (43.5%) | 528 (56.5%) |
| Total (Overall) | 1,994 (47.5%) | 2,202 (52.5%) |
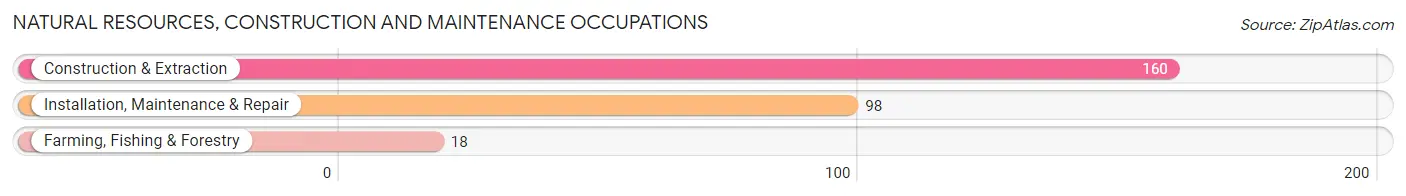
Natural Resources, Construction and Maintenance Occupations
The most common Natural Resources, Construction and Maintenance occupations in Glenside are Construction & Extraction (160 | 3.8%), Installation, Maintenance & Repair (98 | 2.3%), and Farming, Fishing & Forestry (18 | 0.4%).
Natural Resources, Construction and Maintenance Occupations by Sex
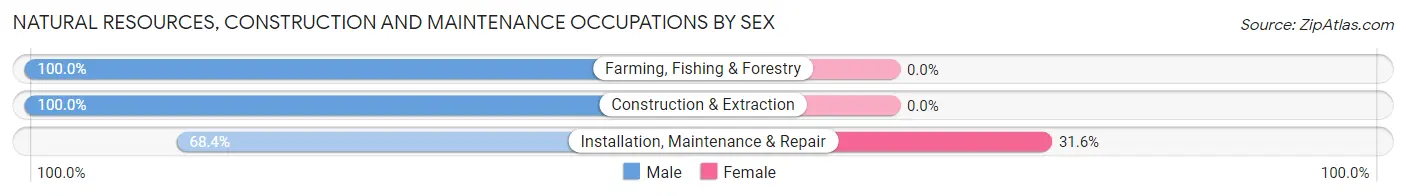
| Occupation | Male | Female |
| Farming, Fishing & Forestry | 18 (100.0%) | 0 (0.0%) |
| Construction & Extraction | 160 (100.0%) | 0 (0.0%) |
| Installation, Maintenance & Repair | 67 (68.4%) | 31 (31.6%) |
| Total (Category) | 245 (88.8%) | 31 (11.2%) |
| Total (Overall) | 1,994 (47.5%) | 2,202 (52.5%) |
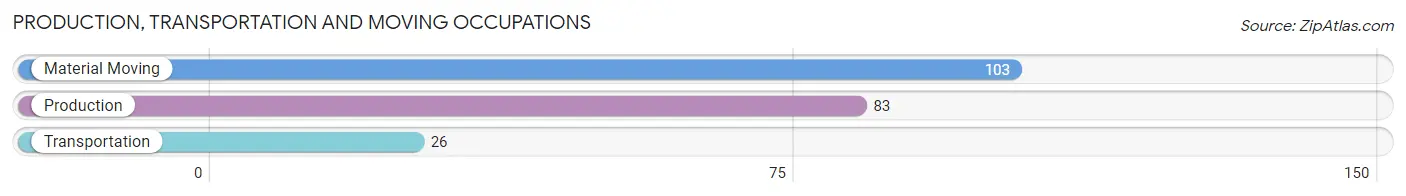
Production, Transportation and Moving Occupations
The most common Production, Transportation and Moving occupations in Glenside are Material Moving (103 | 2.5%), Production (83 | 2.0%), and Transportation (26 | 0.6%).
Production, Transportation and Moving Occupations by Sex
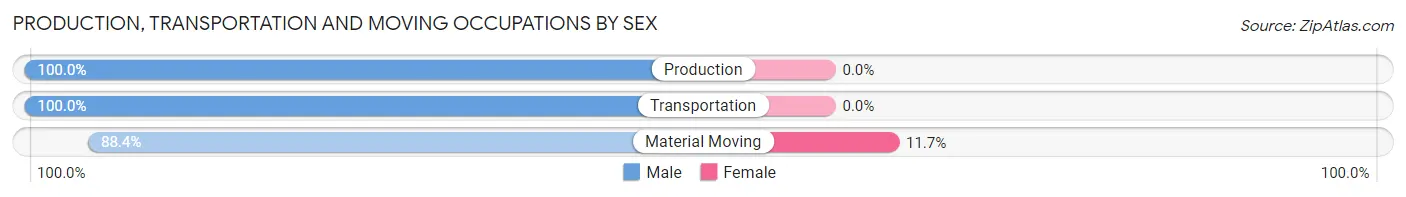
| Occupation | Male | Female |
| Production | 83 (100.0%) | 0 (0.0%) |
| Transportation | 26 (100.0%) | 0 (0.0%) |
| Material Moving | 91 (88.3%) | 12 (11.7%) |
| Total (Category) | 200 (94.3%) | 12 (5.7%) |
| Total (Overall) | 1,994 (47.5%) | 2,202 (52.5%) |
Employment Industries by Sex in Glenside
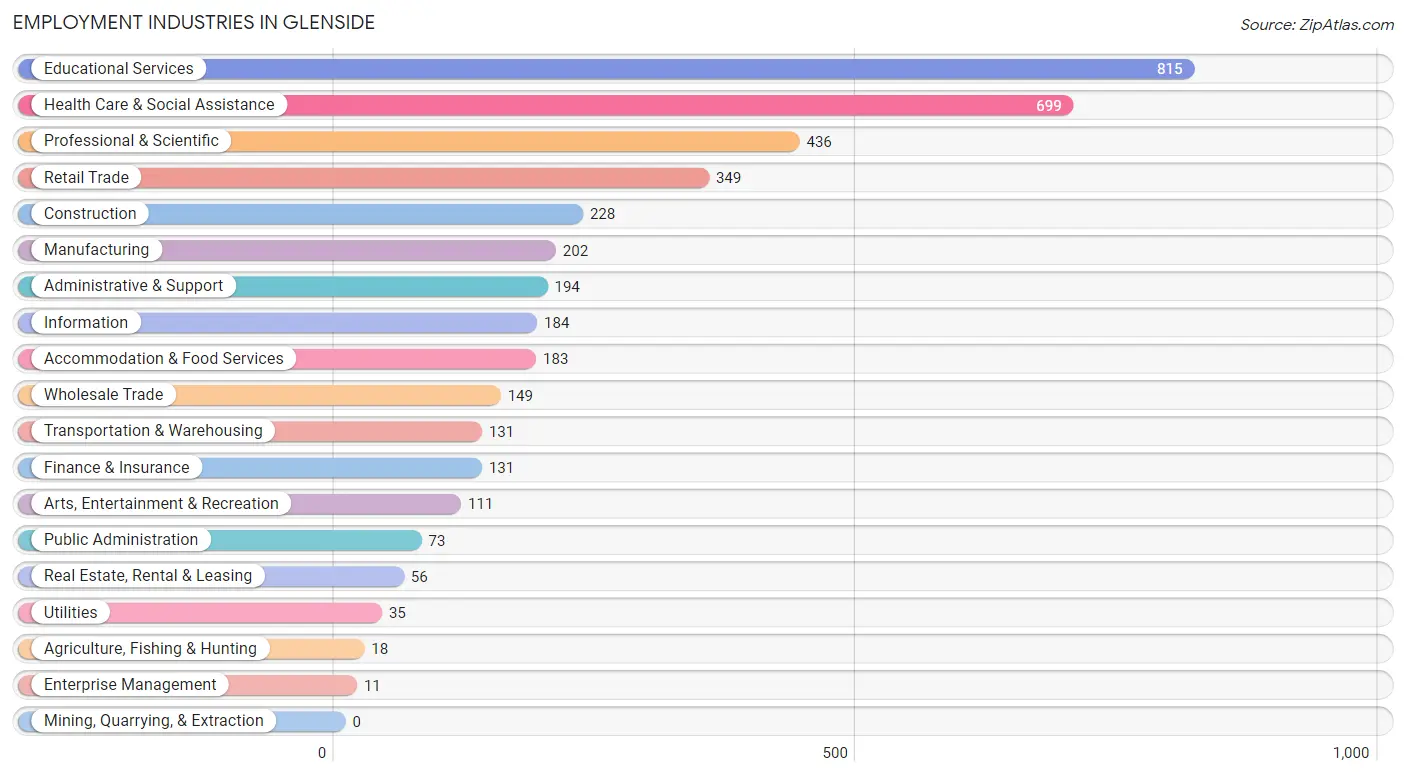
Employment Industries in Glenside
The major employment industries in Glenside include Educational Services (815 | 19.4%), Health Care & Social Assistance (699 | 16.7%), Professional & Scientific (436 | 10.4%), Retail Trade (349 | 8.3%), and Construction (228 | 5.4%).
Employment Industries by Sex in Glenside
The Glenside industries that see more men than women are Agriculture, Fishing & Hunting (100.0%), Utilities (100.0%), and Construction (94.3%), whereas the industries that tend to have a higher number of women are Enterprise Management (100.0%), Arts, Entertainment & Recreation (80.2%), and Health Care & Social Assistance (74.3%).
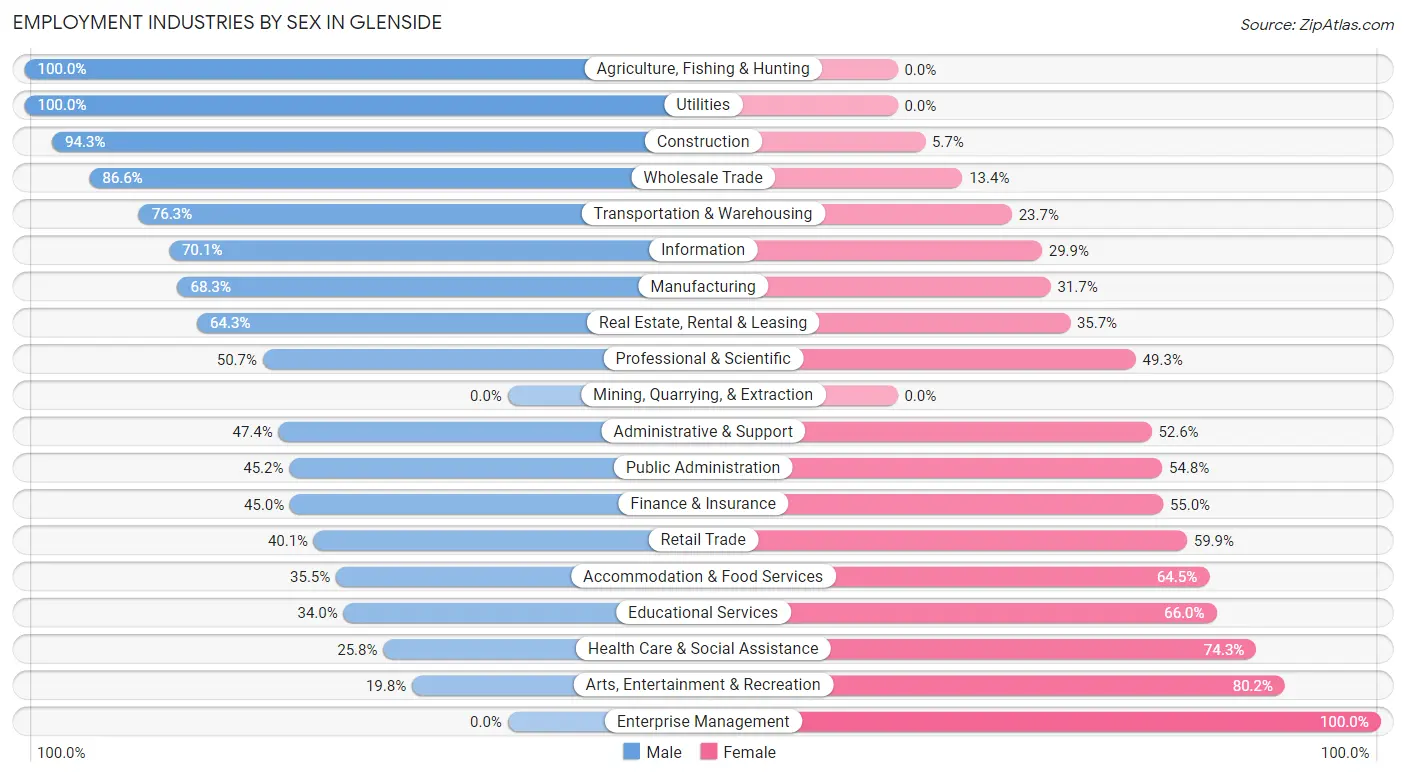
| Industry | Male | Female |
| Agriculture, Fishing & Hunting | 18 (100.0%) | 0 (0.0%) |
| Mining, Quarrying, & Extraction | 0 (0.0%) | 0 (0.0%) |
| Construction | 215 (94.3%) | 13 (5.7%) |
| Manufacturing | 138 (68.3%) | 64 (31.7%) |
| Wholesale Trade | 129 (86.6%) | 20 (13.4%) |
| Retail Trade | 140 (40.1%) | 209 (59.9%) |
| Transportation & Warehousing | 100 (76.3%) | 31 (23.7%) |
| Utilities | 35 (100.0%) | 0 (0.0%) |
| Information | 129 (70.1%) | 55 (29.9%) |
| Finance & Insurance | 59 (45.0%) | 72 (55.0%) |
| Real Estate, Rental & Leasing | 36 (64.3%) | 20 (35.7%) |
| Professional & Scientific | 221 (50.7%) | 215 (49.3%) |
| Enterprise Management | 0 (0.0%) | 11 (100.0%) |
| Administrative & Support | 92 (47.4%) | 102 (52.6%) |
| Educational Services | 277 (34.0%) | 538 (66.0%) |
| Health Care & Social Assistance | 180 (25.8%) | 519 (74.3%) |
| Arts, Entertainment & Recreation | 22 (19.8%) | 89 (80.2%) |
| Accommodation & Food Services | 65 (35.5%) | 118 (64.5%) |
| Public Administration | 33 (45.2%) | 40 (54.8%) |
| Total | 1,994 (47.5%) | 2,202 (52.5%) |
Education in Glenside
School Enrollment in Glenside
The most common levels of schooling among the 2,397 students in Glenside are college / undergraduate (1,134 | 47.3%), elementary school (347 | 14.5%), and high school (336 | 14.0%).
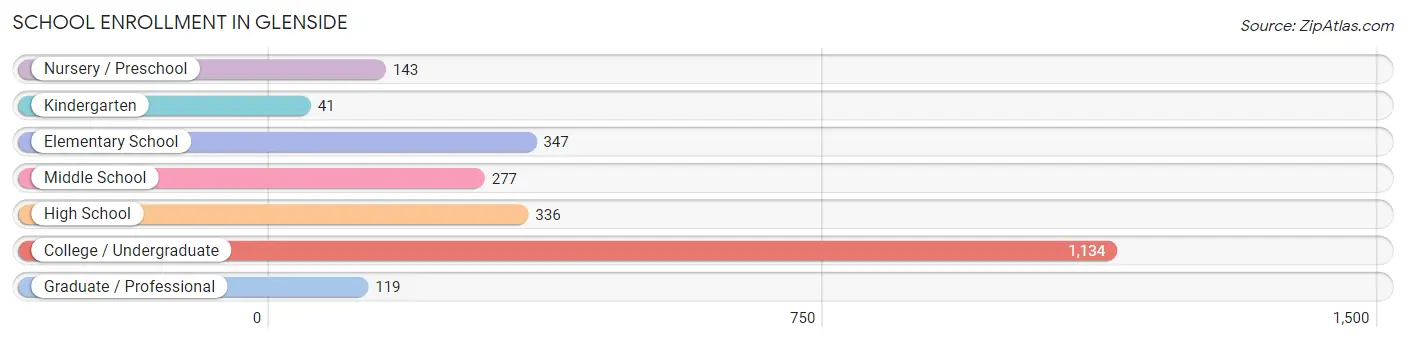
| School Level | # Students | % Students |
| Nursery / Preschool | 143 | 6.0% |
| Kindergarten | 41 | 1.7% |
| Elementary School | 347 | 14.5% |
| Middle School | 277 | 11.6% |
| High School | 336 | 14.0% |
| College / Undergraduate | 1,134 | 47.3% |
| Graduate / Professional | 119 | 5.0% |
| Total | 2,397 | 100.0% |
School Enrollment by Age by Funding Source in Glenside
Out of a total of 2,397 students who are enrolled in schools in Glenside, 1,462 (61.0%) attend a private institution, while the remaining 935 (39.0%) are enrolled in public schools. The age group of 20 to 24 year olds has the highest likelihood of being enrolled in private schools, with 687 (95.6% in the age bracket) enrolled. Conversely, the age group of 35 years and over has the lowest likelihood of being enrolled in a private school, with 84 (71.8% in the age bracket) attending a public institution.
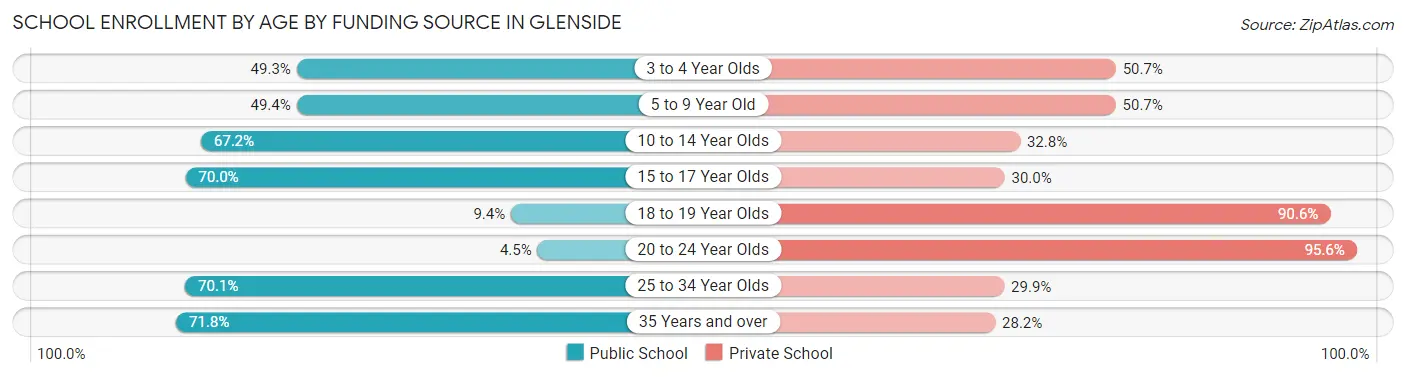
| Age Bracket | Public School | Private School |
| 3 to 4 Year Olds | 37 (49.3%) | 38 (50.7%) |
| 5 to 9 Year Old | 189 (49.3%) | 194 (50.6%) |
| 10 to 14 Year Olds | 272 (67.2%) | 133 (32.8%) |
| 15 to 17 Year Olds | 173 (70.0%) | 74 (30.0%) |
| 18 to 19 Year Olds | 26 (9.4%) | 251 (90.6%) |
| 20 to 24 Year Olds | 32 (4.4%) | 687 (95.6%) |
| 25 to 34 Year Olds | 122 (70.1%) | 52 (29.9%) |
| 35 Years and over | 84 (71.8%) | 33 (28.2%) |
| Total | 935 (39.0%) | 1,462 (61.0%) |
Educational Attainment by Field of Study in Glenside
Business (612 | 20.5%), education (366 | 12.2%), science & technology (320 | 10.7%), literature & languages (272 | 9.1%), and liberal arts & history (250 | 8.4%) are the most common fields of study among 2,991 individuals in Glenside who have obtained a bachelor's degree or higher.
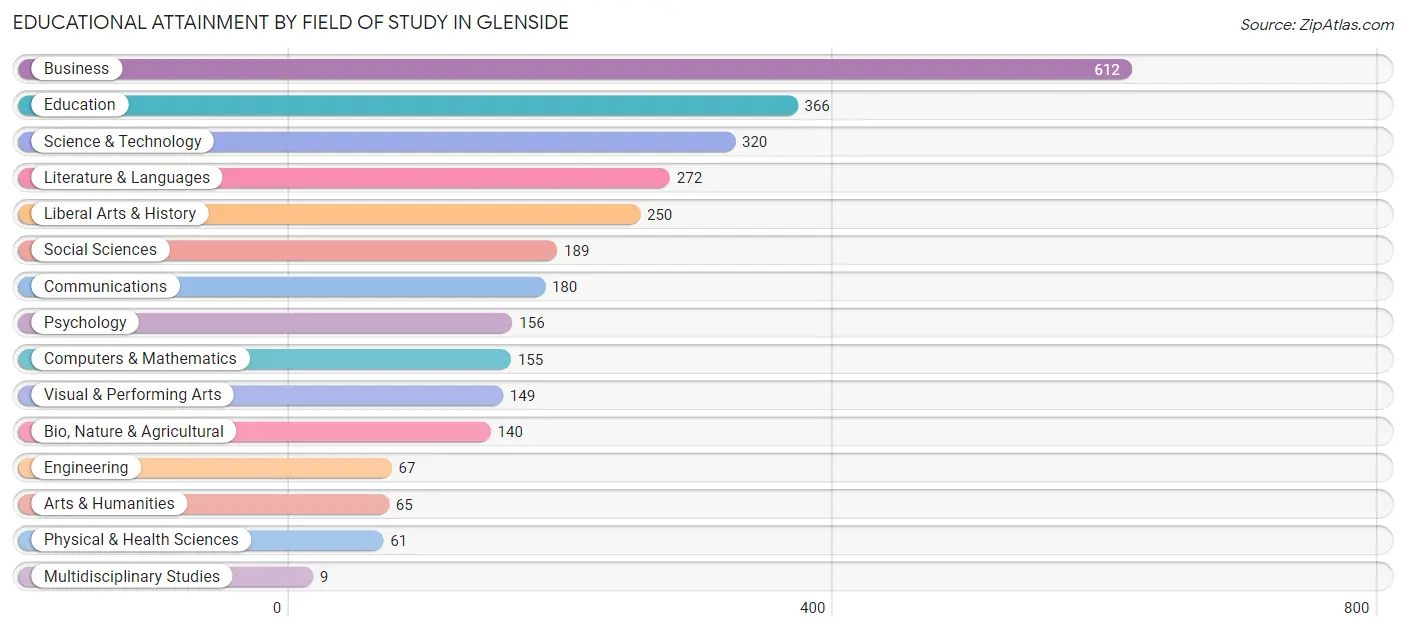
| Field of Study | # Graduates | % Graduates |
| Computers & Mathematics | 155 | 5.2% |
| Bio, Nature & Agricultural | 140 | 4.7% |
| Physical & Health Sciences | 61 | 2.0% |
| Psychology | 156 | 5.2% |
| Social Sciences | 189 | 6.3% |
| Engineering | 67 | 2.2% |
| Multidisciplinary Studies | 9 | 0.3% |
| Science & Technology | 320 | 10.7% |
| Business | 612 | 20.5% |
| Education | 366 | 12.2% |
| Literature & Languages | 272 | 9.1% |
| Liberal Arts & History | 250 | 8.4% |
| Visual & Performing Arts | 149 | 5.0% |
| Communications | 180 | 6.0% |
| Arts & Humanities | 65 | 2.2% |
| Total | 2,991 | 100.0% |
Transportation & Commute in Glenside
Vehicle Availability by Sex in Glenside
The most prevalent vehicle ownership categories in Glenside are males with 2 vehicles (1,053, accounting for 54.3%) and females with 2 vehicles (893, making up 62.2%).
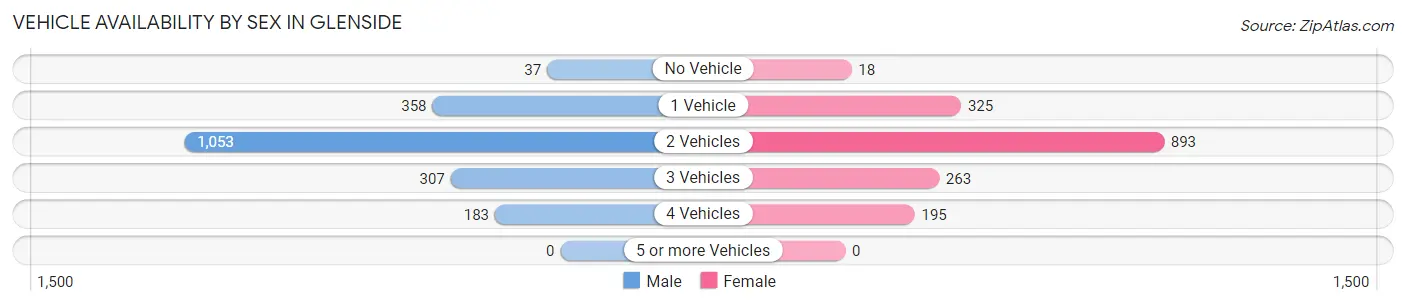
| Vehicles Available | Male | Female |
| No Vehicle | 37 (1.9%) | 18 (1.1%) |
| 1 Vehicle | 358 (18.5%) | 325 (19.2%) |
| 2 Vehicles | 1,053 (54.3%) | 893 (52.7%) |
| 3 Vehicles | 307 (15.8%) | 263 (15.5%) |
| 4 Vehicles | 183 (9.4%) | 195 (11.5%) |
| 5 or more Vehicles | 0 (0.0%) | 0 (0.0%) |
| Total | 1,938 (100.0%) | 1,694 (100.0%) |
Commute Time in Glenside
The most frequently occuring commute durations in Glenside are 30 to 34 minutes (461 commuters, 13.9%), 10 to 14 minutes (430 commuters, 13.0%), and 5 to 9 minutes (408 commuters, 12.3%).
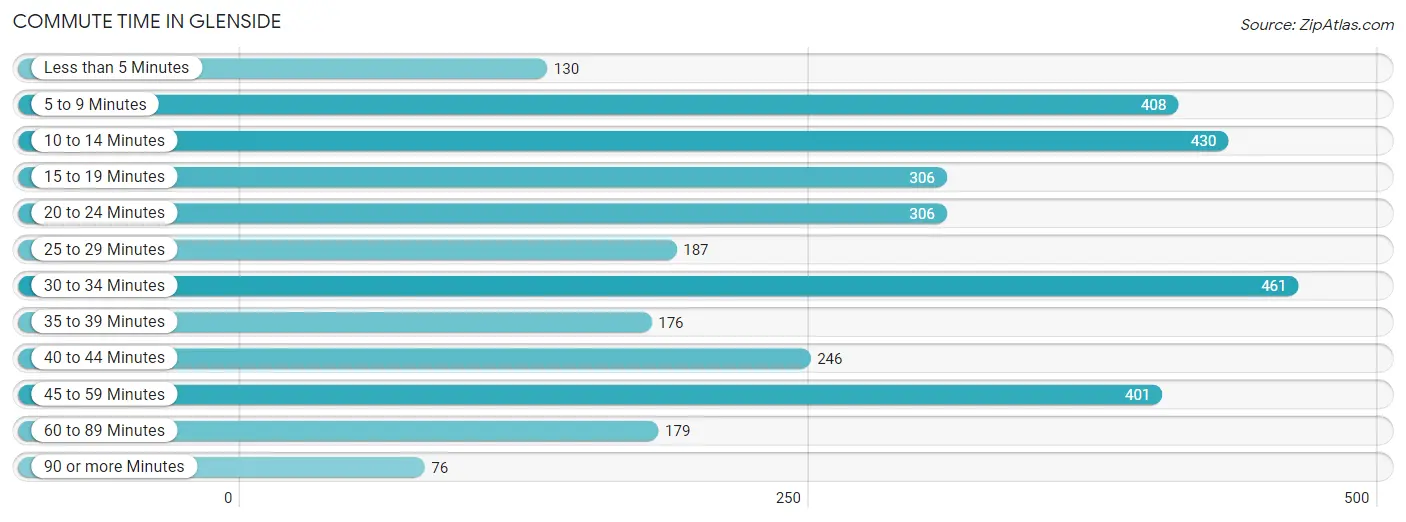
| Commute Time | # Commuters | % Commuters |
| Less than 5 Minutes | 130 | 3.9% |
| 5 to 9 Minutes | 408 | 12.3% |
| 10 to 14 Minutes | 430 | 13.0% |
| 15 to 19 Minutes | 306 | 9.3% |
| 20 to 24 Minutes | 306 | 9.3% |
| 25 to 29 Minutes | 187 | 5.7% |
| 30 to 34 Minutes | 461 | 13.9% |
| 35 to 39 Minutes | 176 | 5.3% |
| 40 to 44 Minutes | 246 | 7.4% |
| 45 to 59 Minutes | 401 | 12.1% |
| 60 to 89 Minutes | 179 | 5.4% |
| 90 or more Minutes | 76 | 2.3% |
Commute Time by Sex in Glenside
The most common commute times in Glenside are 30 to 34 minutes (311 commuters, 18.8%) for males and 10 to 14 minutes (267 commuters, 16.2%) for females.
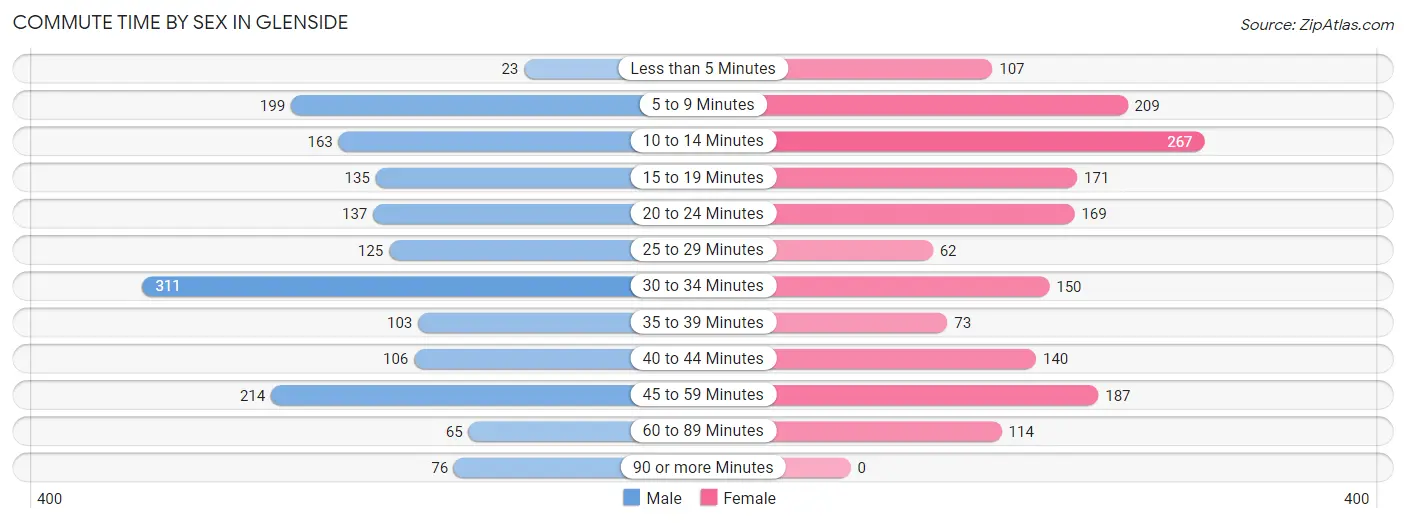
| Commute Time | Male | Female |
| Less than 5 Minutes | 23 (1.4%) | 107 (6.5%) |
| 5 to 9 Minutes | 199 (12.0%) | 209 (12.7%) |
| 10 to 14 Minutes | 163 (9.8%) | 267 (16.2%) |
| 15 to 19 Minutes | 135 (8.2%) | 171 (10.4%) |
| 20 to 24 Minutes | 137 (8.3%) | 169 (10.2%) |
| 25 to 29 Minutes | 125 (7.5%) | 62 (3.8%) |
| 30 to 34 Minutes | 311 (18.8%) | 150 (9.1%) |
| 35 to 39 Minutes | 103 (6.2%) | 73 (4.4%) |
| 40 to 44 Minutes | 106 (6.4%) | 140 (8.5%) |
| 45 to 59 Minutes | 214 (12.9%) | 187 (11.3%) |
| 60 to 89 Minutes | 65 (3.9%) | 114 (6.9%) |
| 90 or more Minutes | 76 (4.6%) | 0 (0.0%) |
Time of Departure to Work by Sex in Glenside
The most frequent times of departure to work in Glenside are 7:00 AM to 7:29 AM (265, 16.0%) for males and 7:30 AM to 7:59 AM (214, 13.0%) for females.
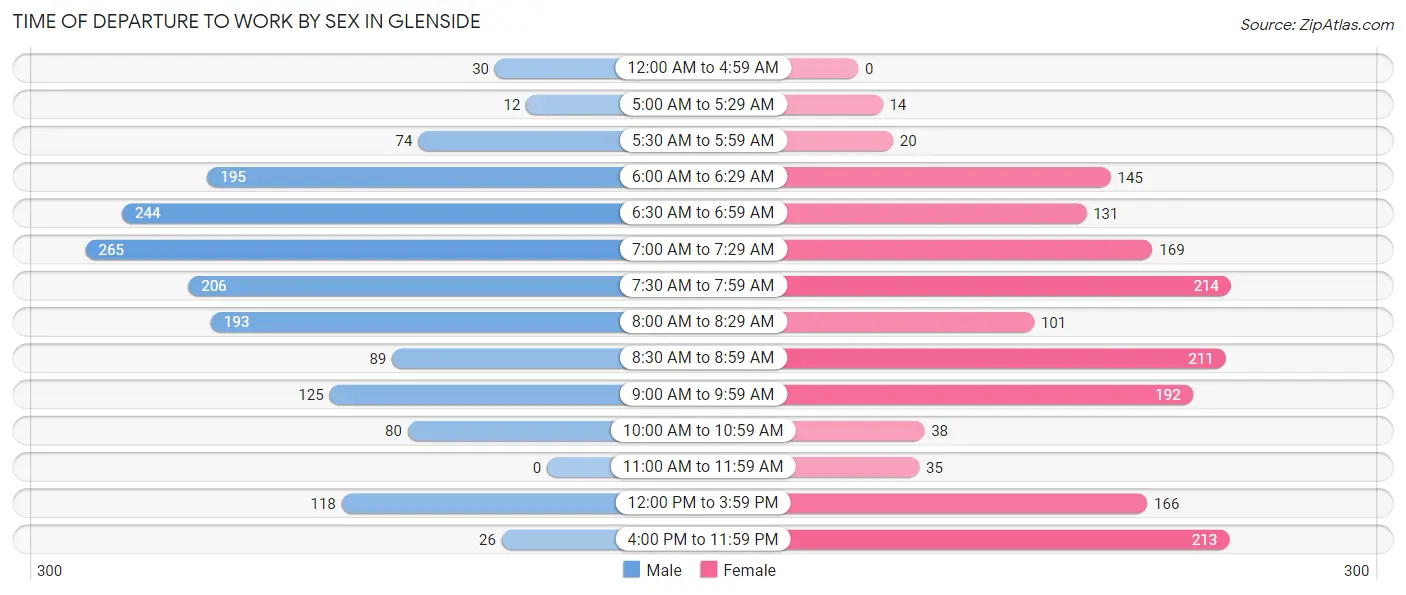
| Time of Departure | Male | Female |
| 12:00 AM to 4:59 AM | 30 (1.8%) | 0 (0.0%) |
| 5:00 AM to 5:29 AM | 12 (0.7%) | 14 (0.9%) |
| 5:30 AM to 5:59 AM | 74 (4.5%) | 20 (1.2%) |
| 6:00 AM to 6:29 AM | 195 (11.8%) | 145 (8.8%) |
| 6:30 AM to 6:59 AM | 244 (14.7%) | 131 (7.9%) |
| 7:00 AM to 7:29 AM | 265 (16.0%) | 169 (10.2%) |
| 7:30 AM to 7:59 AM | 206 (12.4%) | 214 (13.0%) |
| 8:00 AM to 8:29 AM | 193 (11.7%) | 101 (6.1%) |
| 8:30 AM to 8:59 AM | 89 (5.4%) | 211 (12.8%) |
| 9:00 AM to 9:59 AM | 125 (7.5%) | 192 (11.6%) |
| 10:00 AM to 10:59 AM | 80 (4.8%) | 38 (2.3%) |
| 11:00 AM to 11:59 AM | 0 (0.0%) | 35 (2.1%) |
| 12:00 PM to 3:59 PM | 118 (7.1%) | 166 (10.1%) |
| 4:00 PM to 11:59 PM | 26 (1.6%) | 213 (12.9%) |
| Total | 1,657 (100.0%) | 1,649 (100.0%) |
Housing Occupancy in Glenside
Occupancy by Ownership in Glenside
Of the total 2,792 dwellings in Glenside, owner-occupied units account for 2,201 (78.8%), while renter-occupied units make up 591 (21.2%).
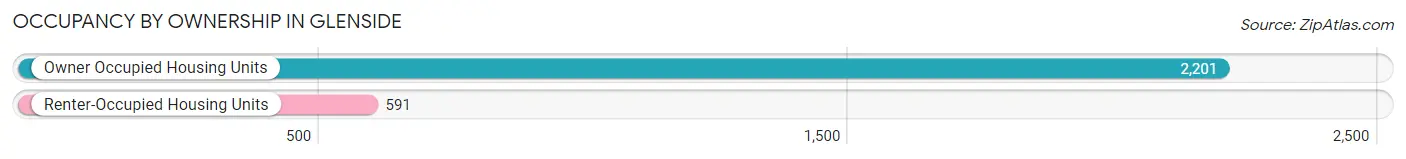
| Occupancy | # Housing Units | % Housing Units |
| Owner Occupied Housing Units | 2,201 | 78.8% |
| Renter-Occupied Housing Units | 591 | 21.2% |
| Total Occupied Housing Units | 2,792 | 100.0% |
Occupancy by Household Size in Glenside
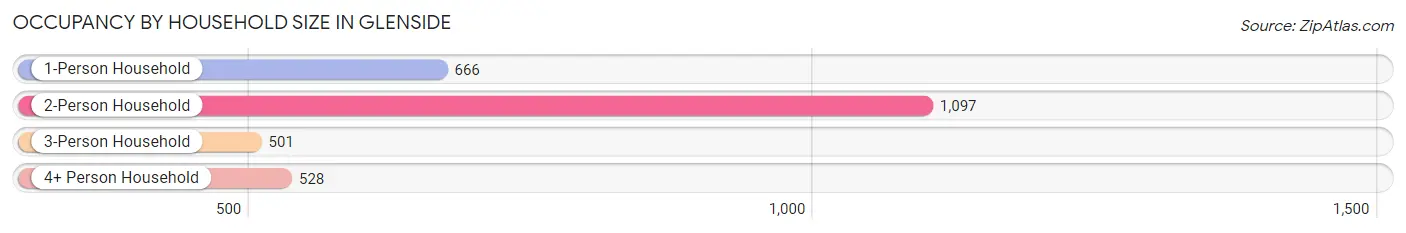
| Household Size | # Housing Units | % Housing Units |
| 1-Person Household | 666 | 23.8% |
| 2-Person Household | 1,097 | 39.3% |
| 3-Person Household | 501 | 17.9% |
| 4+ Person Household | 528 | 18.9% |
| Total Housing Units | 2,792 | 100.0% |
Occupancy by Ownership by Household Size in Glenside
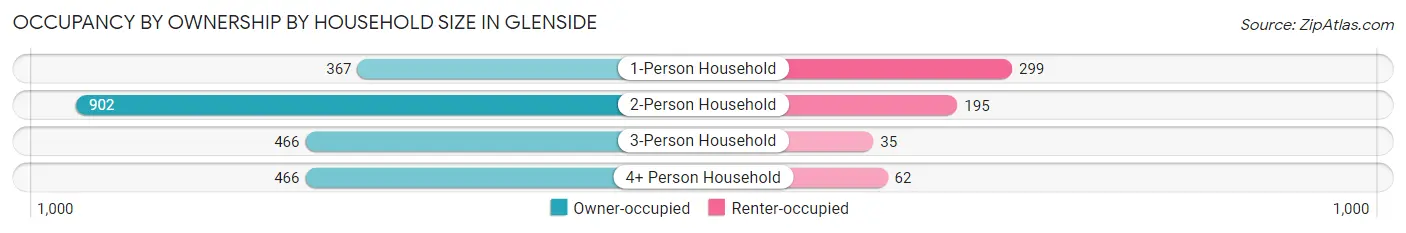
| Household Size | Owner-occupied | Renter-occupied |
| 1-Person Household | 367 (55.1%) | 299 (44.9%) |
| 2-Person Household | 902 (82.2%) | 195 (17.8%) |
| 3-Person Household | 466 (93.0%) | 35 (7.0%) |
| 4+ Person Household | 466 (88.3%) | 62 (11.7%) |
| Total Housing Units | 2,201 (78.8%) | 591 (21.2%) |
Occupancy by Educational Attainment in Glenside
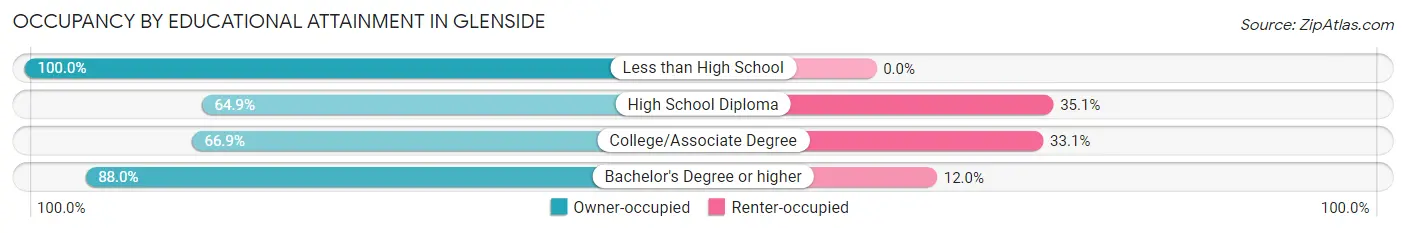
| Household Size | Owner-occupied | Renter-occupied |
| Less than High School | 54 (100.0%) | 0 (0.0%) |
| High School Diploma | 294 (64.9%) | 159 (35.1%) |
| College/Associate Degree | 499 (66.9%) | 247 (33.1%) |
| Bachelor's Degree or higher | 1,354 (88.0%) | 185 (12.0%) |
Occupancy by Age of Householder in Glenside
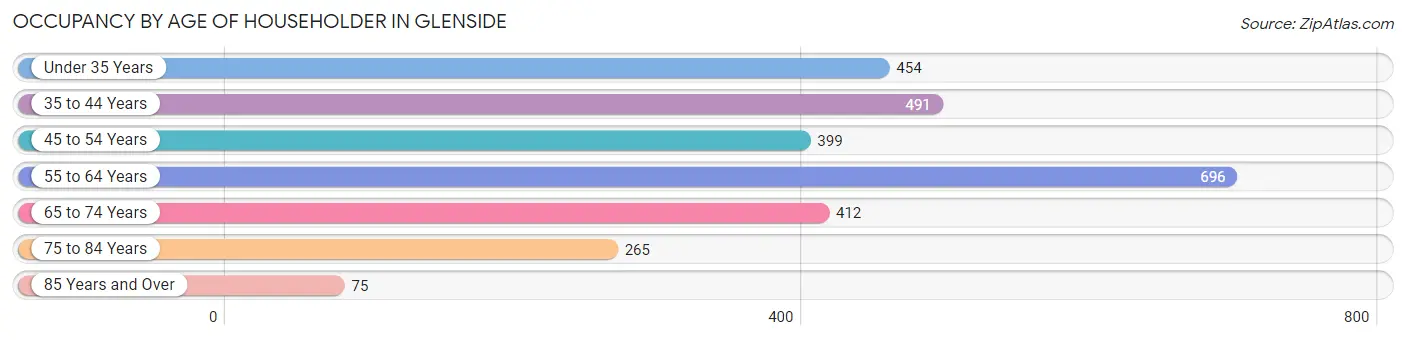
| Age Bracket | # Households | % Households |
| Under 35 Years | 454 | 16.3% |
| 35 to 44 Years | 491 | 17.6% |
| 45 to 54 Years | 399 | 14.3% |
| 55 to 64 Years | 696 | 24.9% |
| 65 to 74 Years | 412 | 14.8% |
| 75 to 84 Years | 265 | 9.5% |
| 85 Years and Over | 75 | 2.7% |
| Total | 2,792 | 100.0% |
Housing Finances in Glenside
Median Income by Occupancy in Glenside
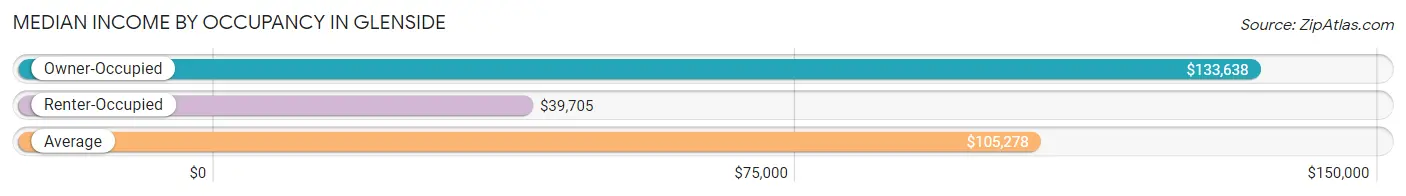
| Occupancy Type | # Households | Median Income |
| Owner-Occupied | 2,201 (78.8%) | $133,638 |
| Renter-Occupied | 591 (21.2%) | $39,705 |
| Average | 2,792 (100.0%) | $105,278 |
Occupancy by Householder Income Bracket in Glenside
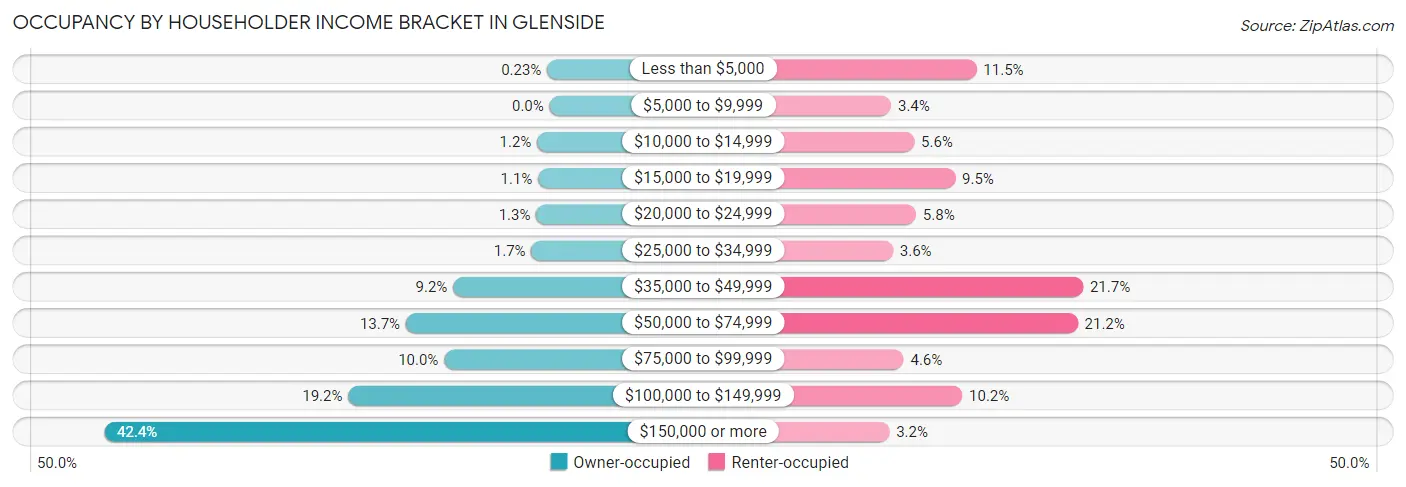
| Income Bracket | Owner-occupied | Renter-occupied |
| Less than $5,000 | 5 (0.2%) | 68 (11.5%) |
| $5,000 to $9,999 | 0 (0.0%) | 20 (3.4%) |
| $10,000 to $14,999 | 26 (1.2%) | 33 (5.6%) |
| $15,000 to $19,999 | 24 (1.1%) | 56 (9.5%) |
| $20,000 to $24,999 | 28 (1.3%) | 34 (5.8%) |
| $25,000 to $34,999 | 38 (1.7%) | 21 (3.5%) |
| $35,000 to $49,999 | 202 (9.2%) | 128 (21.7%) |
| $50,000 to $74,999 | 301 (13.7%) | 125 (21.1%) |
| $75,000 to $99,999 | 221 (10.0%) | 27 (4.6%) |
| $100,000 to $149,999 | 422 (19.2%) | 60 (10.2%) |
| $150,000 or more | 934 (42.4%) | 19 (3.2%) |
| Total | 2,201 (100.0%) | 591 (100.0%) |
Monthly Housing Cost Tiers in Glenside
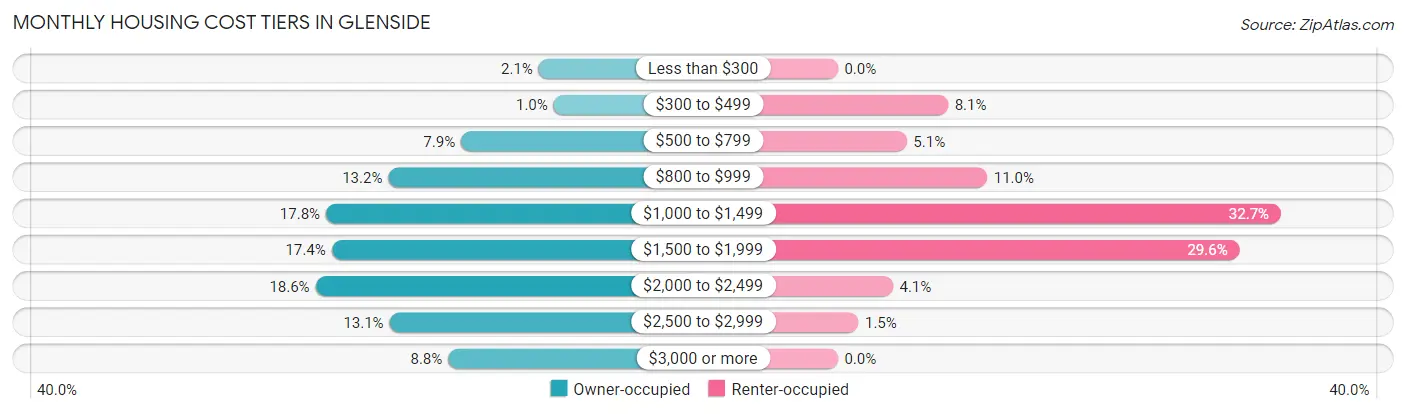
| Monthly Cost | Owner-occupied | Renter-occupied |
| Less than $300 | 47 (2.1%) | 0 (0.0%) |
| $300 to $499 | 23 (1.0%) | 48 (8.1%) |
| $500 to $799 | 173 (7.9%) | 30 (5.1%) |
| $800 to $999 | 291 (13.2%) | 65 (11.0%) |
| $1,000 to $1,499 | 392 (17.8%) | 193 (32.7%) |
| $1,500 to $1,999 | 383 (17.4%) | 175 (29.6%) |
| $2,000 to $2,499 | 409 (18.6%) | 24 (4.1%) |
| $2,500 to $2,999 | 289 (13.1%) | 9 (1.5%) |
| $3,000 or more | 194 (8.8%) | 0 (0.0%) |
| Total | 2,201 (100.0%) | 591 (100.0%) |
Physical Housing Characteristics in Glenside
Housing Structures in Glenside
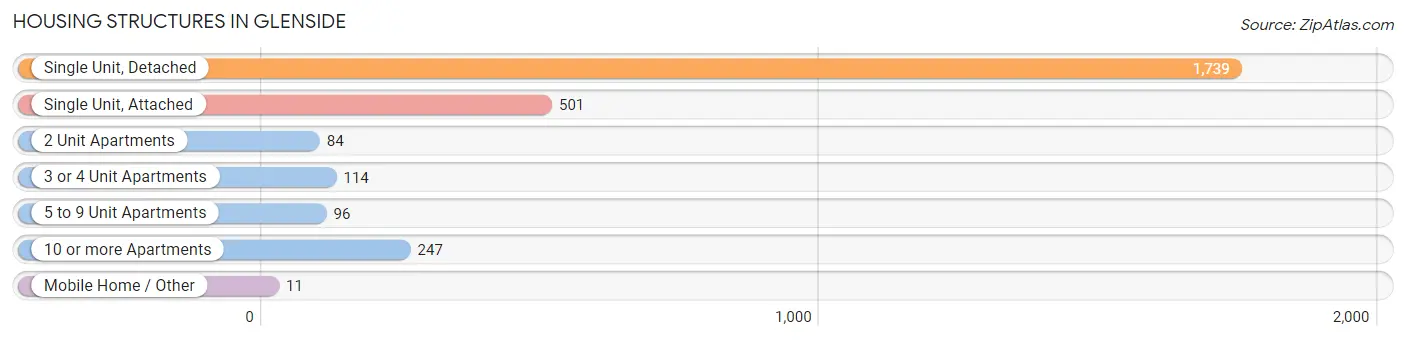
| Structure Type | # Housing Units | % Housing Units |
| Single Unit, Detached | 1,739 | 62.3% |
| Single Unit, Attached | 501 | 17.9% |
| 2 Unit Apartments | 84 | 3.0% |
| 3 or 4 Unit Apartments | 114 | 4.1% |
| 5 to 9 Unit Apartments | 96 | 3.4% |
| 10 or more Apartments | 247 | 8.8% |
| Mobile Home / Other | 11 | 0.4% |
| Total | 2,792 | 100.0% |
Housing Structures by Occupancy in Glenside
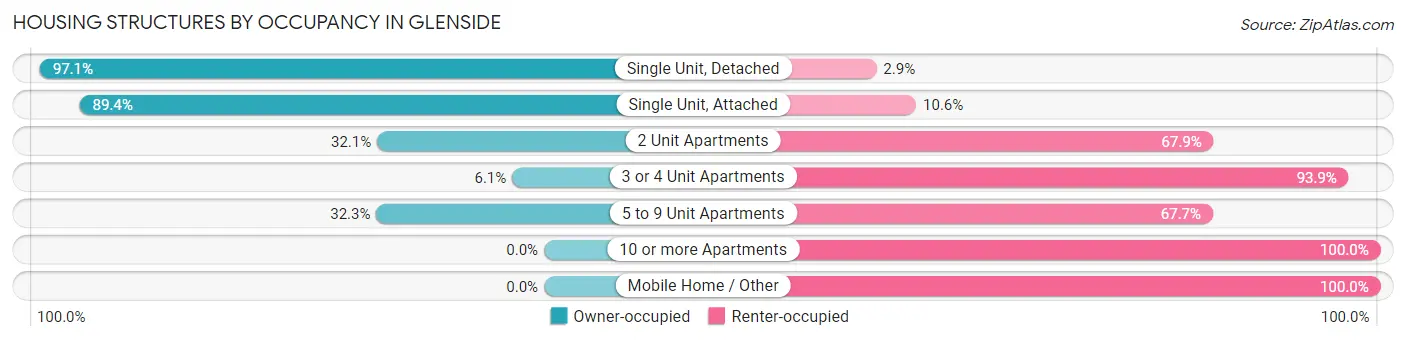
| Structure Type | Owner-occupied | Renter-occupied |
| Single Unit, Detached | 1,688 (97.1%) | 51 (2.9%) |
| Single Unit, Attached | 448 (89.4%) | 53 (10.6%) |
| 2 Unit Apartments | 27 (32.1%) | 57 (67.9%) |
| 3 or 4 Unit Apartments | 7 (6.1%) | 107 (93.9%) |
| 5 to 9 Unit Apartments | 31 (32.3%) | 65 (67.7%) |
| 10 or more Apartments | 0 (0.0%) | 247 (100.0%) |
| Mobile Home / Other | 0 (0.0%) | 11 (100.0%) |
| Total | 2,201 (78.8%) | 591 (21.2%) |
Housing Structures by Number of Rooms in Glenside
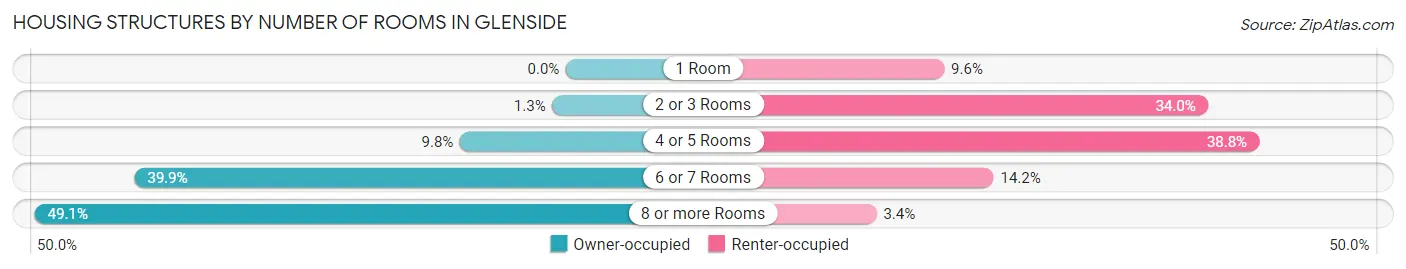
| Number of Rooms | Owner-occupied | Renter-occupied |
| 1 Room | 0 (0.0%) | 57 (9.6%) |
| 2 or 3 Rooms | 28 (1.3%) | 201 (34.0%) |
| 4 or 5 Rooms | 216 (9.8%) | 229 (38.8%) |
| 6 or 7 Rooms | 877 (39.9%) | 84 (14.2%) |
| 8 or more Rooms | 1,080 (49.1%) | 20 (3.4%) |
| Total | 2,201 (100.0%) | 591 (100.0%) |
Housing Structure by Heating Type in Glenside
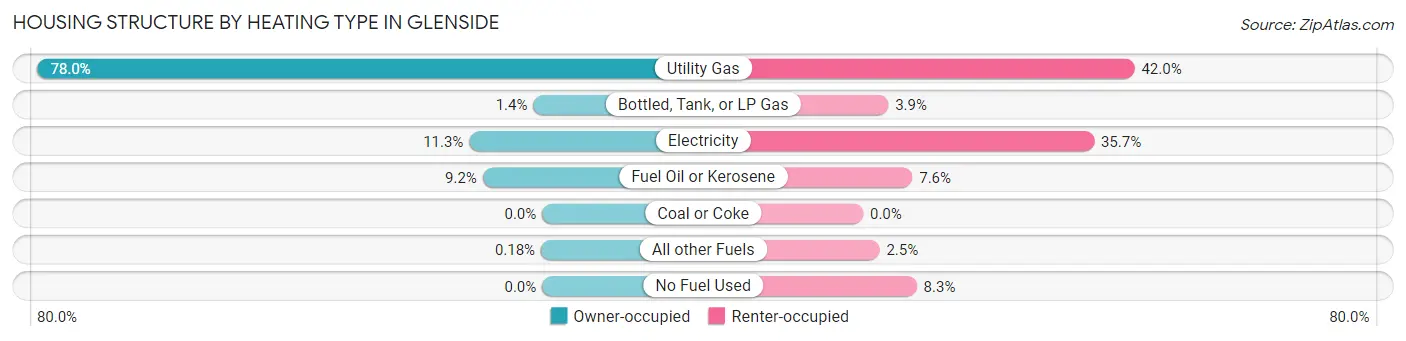
| Heating Type | Owner-occupied | Renter-occupied |
| Utility Gas | 1,717 (78.0%) | 248 (42.0%) |
| Bottled, Tank, or LP Gas | 30 (1.4%) | 23 (3.9%) |
| Electricity | 248 (11.3%) | 211 (35.7%) |
| Fuel Oil or Kerosene | 202 (9.2%) | 45 (7.6%) |
| Coal or Coke | 0 (0.0%) | 0 (0.0%) |
| All other Fuels | 4 (0.2%) | 15 (2.5%) |
| No Fuel Used | 0 (0.0%) | 49 (8.3%) |
| Total | 2,201 (100.0%) | 591 (100.0%) |
Household Vehicle Usage in Glenside
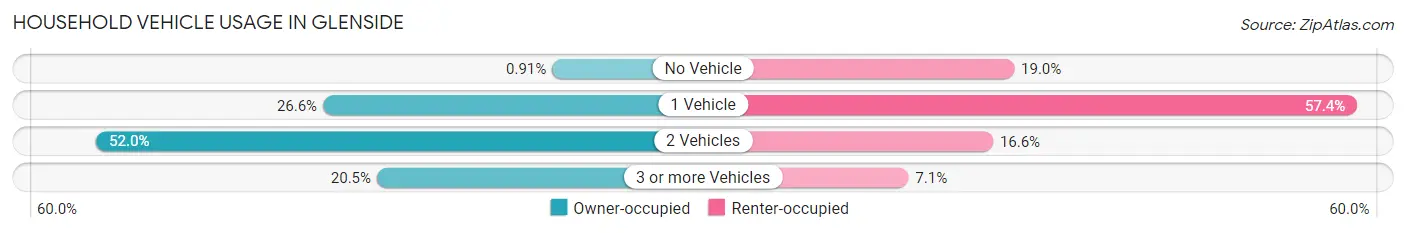
| Vehicles per Household | Owner-occupied | Renter-occupied |
| No Vehicle | 20 (0.9%) | 112 (19.0%) |
| 1 Vehicle | 585 (26.6%) | 339 (57.4%) |
| 2 Vehicles | 1,144 (52.0%) | 98 (16.6%) |
| 3 or more Vehicles | 452 (20.5%) | 42 (7.1%) |
| Total | 2,201 (100.0%) | 591 (100.0%) |
Real Estate & Mortgages in Glenside
Real Estate and Mortgage Overview in Glenside
| Characteristic | Without Mortgage | With Mortgage |
| Housing Units | 751 | 1,450 |
| Median Property Value | $366,600 | $340,800 |
| Median Household Income | $83,393 | $732 |
| Monthly Housing Costs | $898 | $194 |
| Real Estate Taxes | $6,101 | $0 |
Property Value by Mortgage Status in Glenside

| Property Value | Without Mortgage | With Mortgage |
| Less than $50,000 | 5 (0.7%) | 0 (0.0%) |
| $50,000 to $99,999 | 31 (4.1%) | 7 (0.5%) |
| $100,000 to $299,999 | 187 (24.9%) | 504 (34.8%) |
| $300,000 to $499,999 | 467 (62.2%) | 774 (53.4%) |
| $500,000 to $749,999 | 61 (8.1%) | 165 (11.4%) |
| $750,000 to $999,999 | 0 (0.0%) | 0 (0.0%) |
| $1,000,000 or more | 0 (0.0%) | 0 (0.0%) |
| Total | 751 (100.0%) | 1,450 (100.0%) |
Household Income by Mortgage Status in Glenside
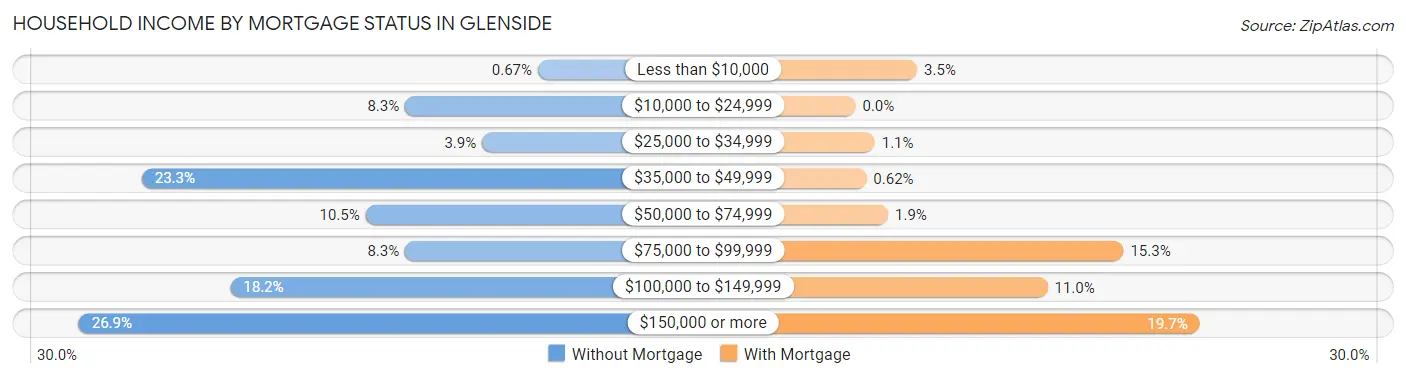
| Household Income | Without Mortgage | With Mortgage |
| Less than $10,000 | 5 (0.7%) | 51 (3.5%) |
| $10,000 to $24,999 | 62 (8.3%) | 0 (0.0%) |
| $25,000 to $34,999 | 29 (3.9%) | 16 (1.1%) |
| $35,000 to $49,999 | 175 (23.3%) | 9 (0.6%) |
| $50,000 to $74,999 | 79 (10.5%) | 27 (1.9%) |
| $75,000 to $99,999 | 62 (8.3%) | 222 (15.3%) |
| $100,000 to $149,999 | 137 (18.2%) | 159 (11.0%) |
| $150,000 or more | 202 (26.9%) | 285 (19.7%) |
| Total | 751 (100.0%) | 1,450 (100.0%) |
Property Value to Household Income Ratio in Glenside
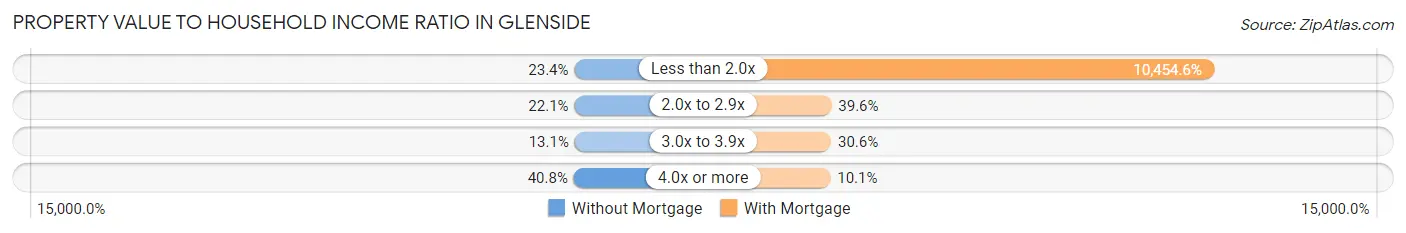
| Value-to-Income Ratio | Without Mortgage | With Mortgage |
| Less than 2.0x | 176 (23.4%) | 151,591 (10,454.6%) |
| 2.0x to 2.9x | 166 (22.1%) | 574 (39.6%) |
| 3.0x to 3.9x | 98 (13.1%) | 444 (30.6%) |
| 4.0x or more | 306 (40.7%) | 146 (10.1%) |
| Total | 751 (100.0%) | 1,450 (100.0%) |
Real Estate Taxes by Mortgage Status in Glenside
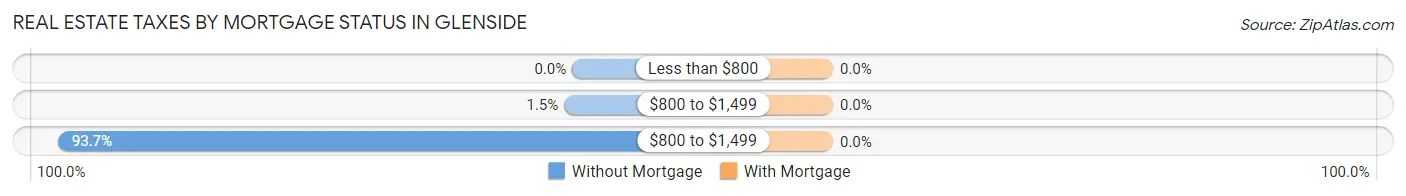
| Property Taxes | Without Mortgage | With Mortgage |
| Less than $800 | 0 (0.0%) | 0 (0.0%) |
| $800 to $1,499 | 11 (1.5%) | 0 (0.0%) |
| $800 to $1,499 | 704 (93.7%) | 0 (0.0%) |
| Total | 751 (100.0%) | 1,450 (100.0%) |
Health & Disability in Glenside
Health Insurance Coverage by Age in Glenside
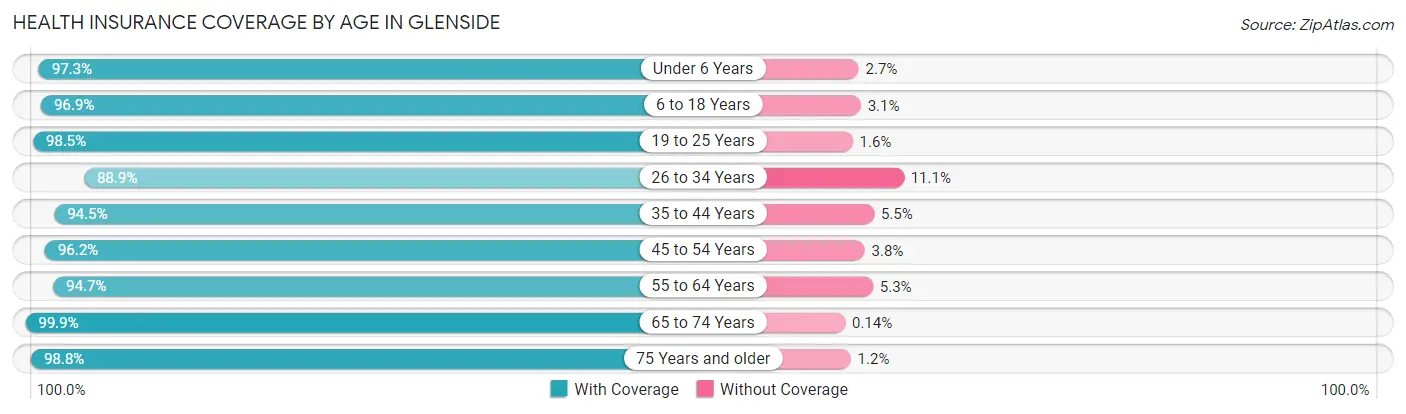
| Age Bracket | With Coverage | Without Coverage |
| Under 6 Years | 475 (97.3%) | 13 (2.7%) |
| 6 to 18 Years | 982 (96.9%) | 31 (3.1%) |
| 19 to 25 Years | 1,204 (98.5%) | 19 (1.5%) |
| 26 to 34 Years | 634 (88.9%) | 79 (11.1%) |
| 35 to 44 Years | 1,007 (94.5%) | 59 (5.5%) |
| 45 to 54 Years | 787 (96.2%) | 31 (3.8%) |
| 55 to 64 Years | 1,137 (94.7%) | 64 (5.3%) |
| 65 to 74 Years | 697 (99.9%) | 1 (0.1%) |
| 75 Years and older | 499 (98.8%) | 6 (1.2%) |
| Total | 7,422 (96.1%) | 303 (3.9%) |
Health Insurance Coverage by Citizenship Status in Glenside
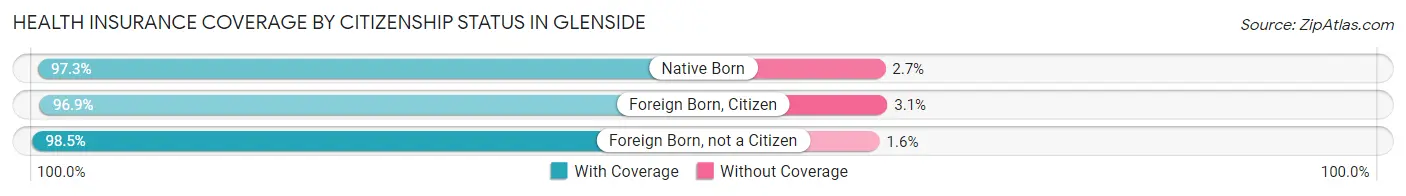
| Citizenship Status | With Coverage | Without Coverage |
| Native Born | 475 (97.3%) | 13 (2.7%) |
| Foreign Born, Citizen | 982 (96.9%) | 31 (3.1%) |
| Foreign Born, not a Citizen | 1,204 (98.5%) | 19 (1.5%) |
Health Insurance Coverage by Household Income in Glenside
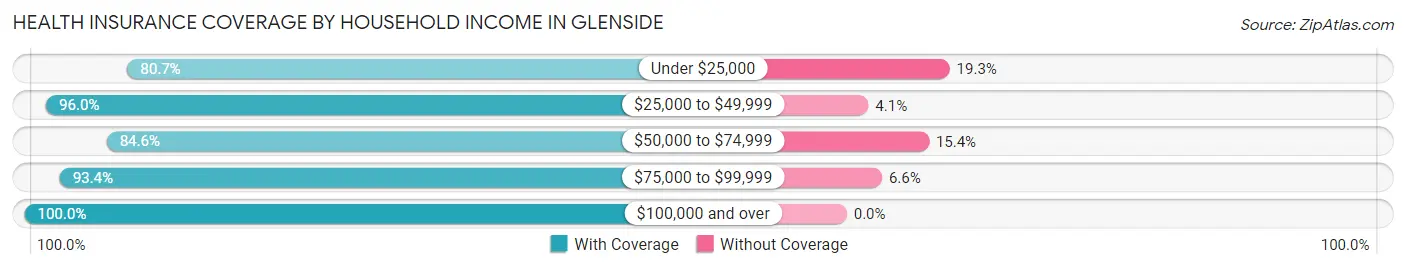
| Household Income | With Coverage | Without Coverage |
| Under $25,000 | 331 (80.7%) | 79 (19.3%) |
| $25,000 to $49,999 | 734 (96.0%) | 31 (4.1%) |
| $50,000 to $74,999 | 720 (84.6%) | 131 (15.4%) |
| $75,000 to $99,999 | 595 (93.4%) | 42 (6.6%) |
| $100,000 and over | 4,413 (100.0%) | 0 (0.0%) |
Public vs Private Health Insurance Coverage by Age in Glenside
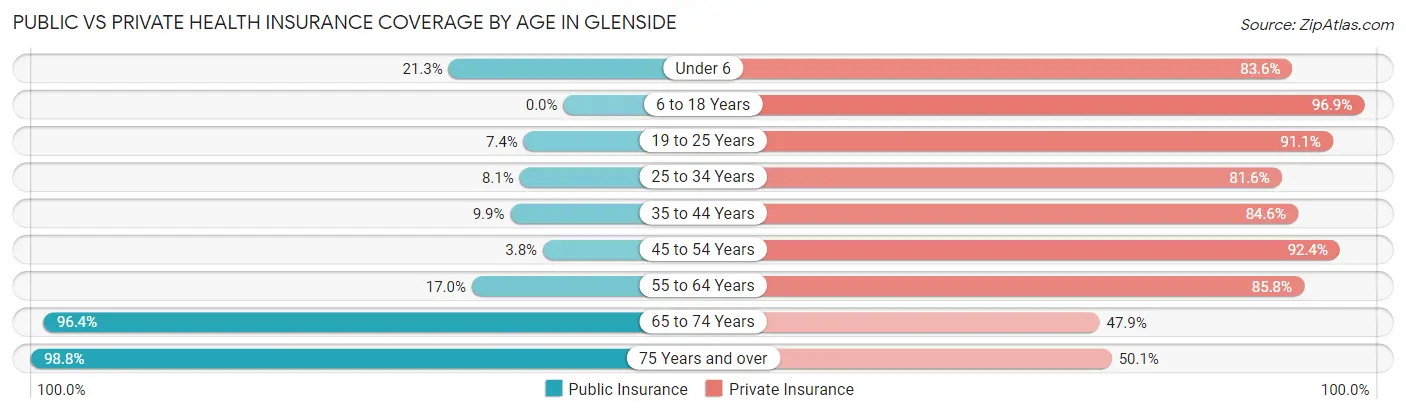
| Age Bracket | Public Insurance | Private Insurance |
| Under 6 | 104 (21.3%) | 408 (83.6%) |
| 6 to 18 Years | 0 (0.0%) | 982 (96.9%) |
| 19 to 25 Years | 90 (7.4%) | 1,114 (91.1%) |
| 25 to 34 Years | 58 (8.1%) | 582 (81.6%) |
| 35 to 44 Years | 105 (9.9%) | 902 (84.6%) |
| 45 to 54 Years | 31 (3.8%) | 756 (92.4%) |
| 55 to 64 Years | 204 (17.0%) | 1,030 (85.8%) |
| 65 to 74 Years | 673 (96.4%) | 334 (47.8%) |
| 75 Years and over | 499 (98.8%) | 253 (50.1%) |
| Total | 1,764 (22.8%) | 6,361 (82.3%) |
Disability Status by Sex by Age in Glenside
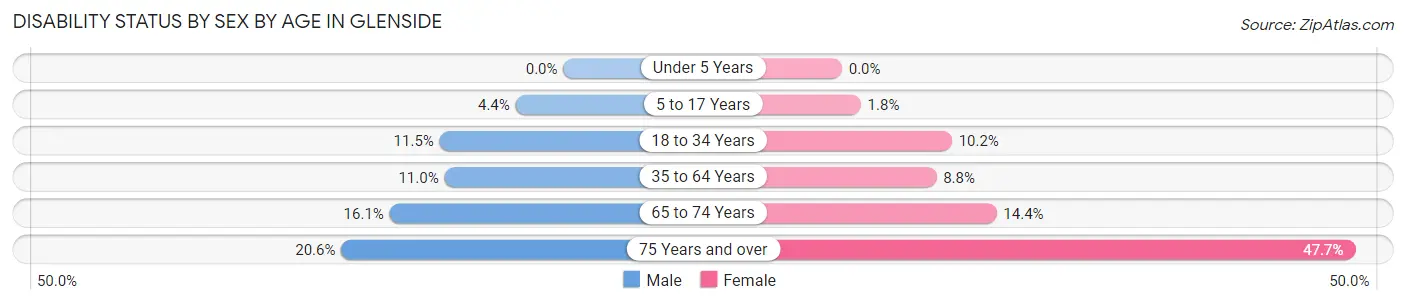
| Age Bracket | Male | Female |
| Under 5 Years | 0 (0.0%) | 0 (0.0%) |
| 5 to 17 Years | 20 (4.4%) | 11 (1.8%) |
| 18 to 34 Years | 89 (11.5%) | 124 (10.2%) |
| 35 to 64 Years | 159 (11.0%) | 144 (8.8%) |
| 65 to 74 Years | 44 (16.1%) | 61 (14.3%) |
| 75 Years and over | 34 (20.6%) | 162 (47.6%) |
Disability Class by Sex by Age in Glenside
Disability Class: Hearing Difficulty
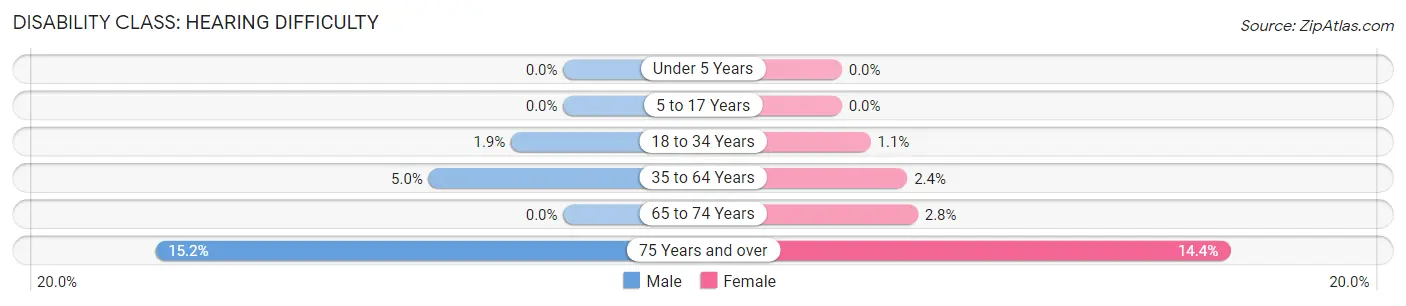
| Age Bracket | Male | Female |
| Under 5 Years | 0 (0.0%) | 0 (0.0%) |
| 5 to 17 Years | 0 (0.0%) | 0 (0.0%) |
| 18 to 34 Years | 15 (1.9%) | 13 (1.1%) |
| 35 to 64 Years | 72 (5.0%) | 40 (2.4%) |
| 65 to 74 Years | 0 (0.0%) | 12 (2.8%) |
| 75 Years and over | 25 (15.1%) | 49 (14.4%) |
Disability Class: Vision Difficulty
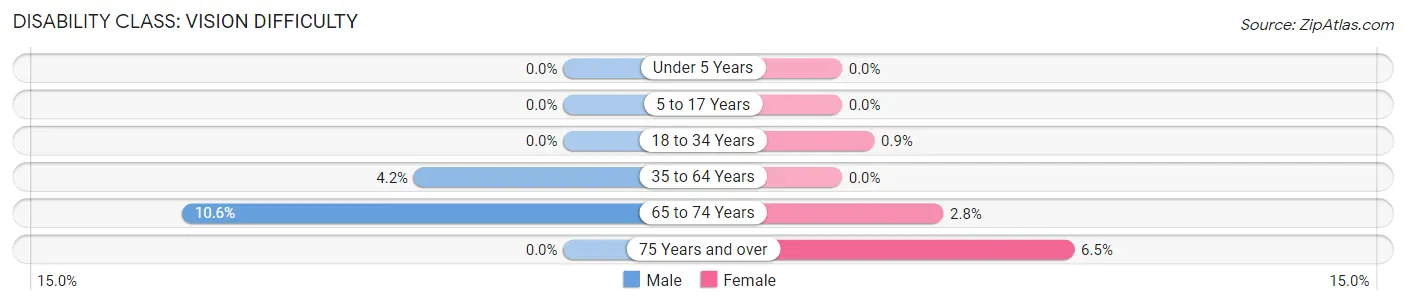
| Age Bracket | Male | Female |
| Under 5 Years | 0 (0.0%) | 0 (0.0%) |
| 5 to 17 Years | 0 (0.0%) | 0 (0.0%) |
| 18 to 34 Years | 0 (0.0%) | 11 (0.9%) |
| 35 to 64 Years | 60 (4.2%) | 0 (0.0%) |
| 65 to 74 Years | 29 (10.6%) | 12 (2.8%) |
| 75 Years and over | 0 (0.0%) | 22 (6.5%) |
Disability Class: Cognitive Difficulty
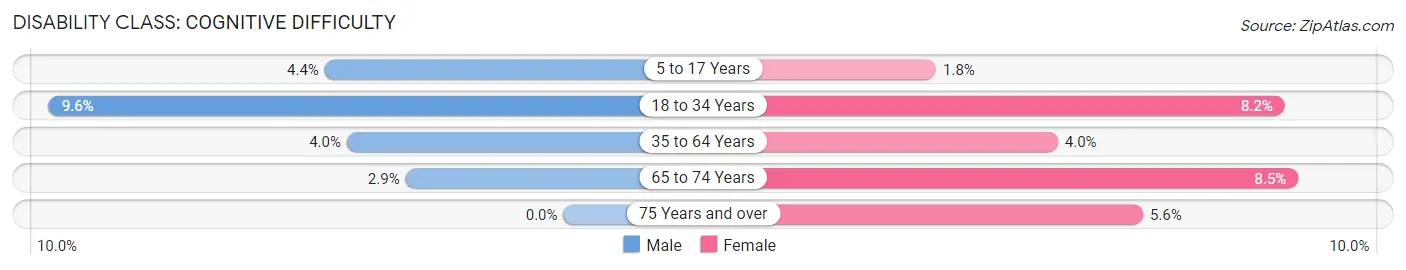
| Age Bracket | Male | Female |
| 5 to 17 Years | 20 (4.4%) | 11 (1.8%) |
| 18 to 34 Years | 74 (9.6%) | 100 (8.2%) |
| 35 to 64 Years | 58 (4.0%) | 66 (4.0%) |
| 65 to 74 Years | 8 (2.9%) | 36 (8.5%) |
| 75 Years and over | 0 (0.0%) | 19 (5.6%) |
Disability Class: Ambulatory Difficulty
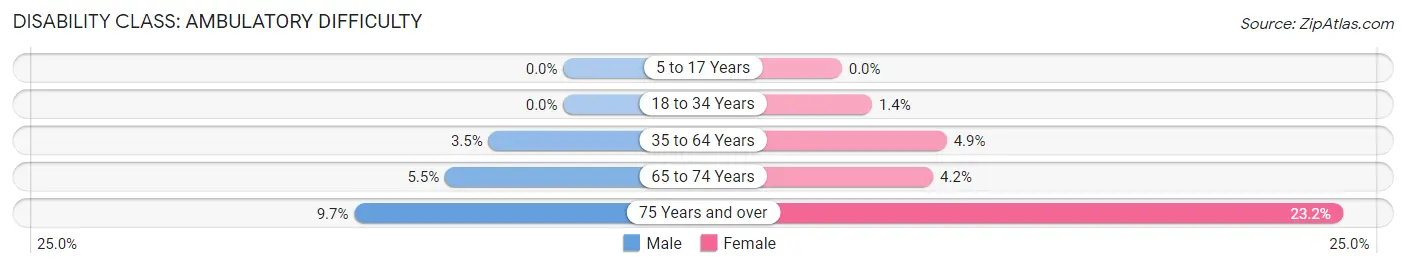
| Age Bracket | Male | Female |
| 5 to 17 Years | 0 (0.0%) | 0 (0.0%) |
| 18 to 34 Years | 0 (0.0%) | 17 (1.4%) |
| 35 to 64 Years | 50 (3.5%) | 80 (4.9%) |
| 65 to 74 Years | 15 (5.5%) | 18 (4.2%) |
| 75 Years and over | 16 (9.7%) | 79 (23.2%) |
Disability Class: Self-Care Difficulty
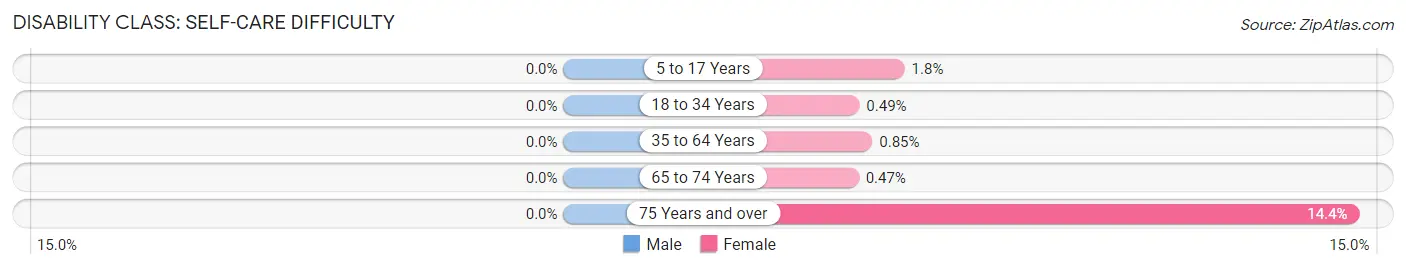
| Age Bracket | Male | Female |
| 5 to 17 Years | 0 (0.0%) | 11 (1.8%) |
| 18 to 34 Years | 0 (0.0%) | 6 (0.5%) |
| 35 to 64 Years | 0 (0.0%) | 14 (0.9%) |
| 65 to 74 Years | 0 (0.0%) | 2 (0.5%) |
| 75 Years and over | 0 (0.0%) | 49 (14.4%) |
Technology Access in Glenside
Computing Device Access in Glenside
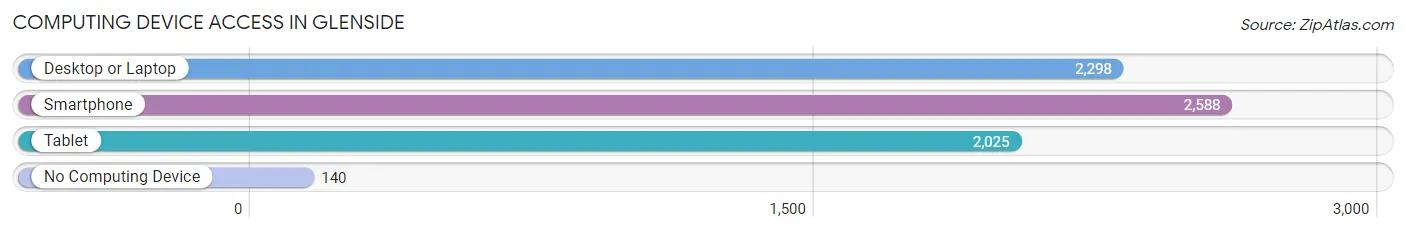
| Device Type | # Households | % Households |
| Desktop or Laptop | 2,298 | 82.3% |
| Smartphone | 2,588 | 92.7% |
| Tablet | 2,025 | 72.5% |
| No Computing Device | 140 | 5.0% |
| Total | 2,792 | 100.0% |
Internet Access in Glenside
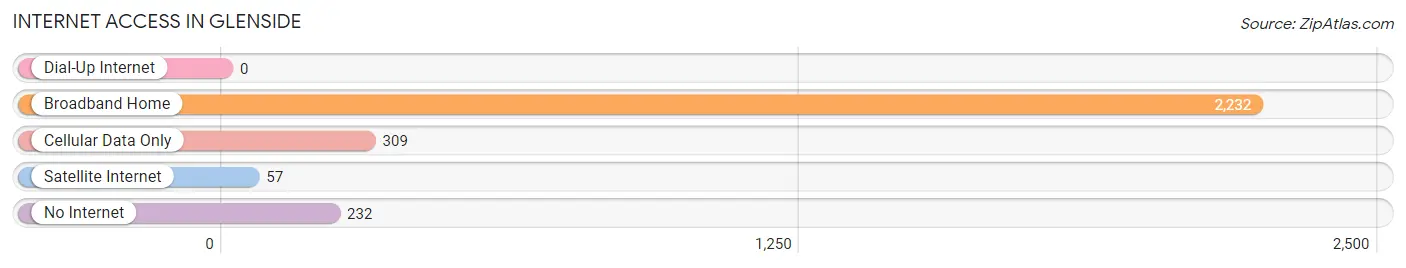
| Internet Type | # Households | % Households |
| Dial-Up Internet | 0 | 0.0% |
| Broadband Home | 2,232 | 79.9% |
| Cellular Data Only | 309 | 11.1% |
| Satellite Internet | 57 | 2.0% |
| No Internet | 232 | 8.3% |
| Total | 2,792 | 100.0% |
Glenside Summary
Glenside is a census-designated place (CDP) located in Montgomery County, Pennsylvania, United States. It is a suburb of Philadelphia, located approximately 6 miles (10 km) from the city center. The population of Glenside was 8,384 at the 2010 census.
History
Glenside was originally known as Edge Hill, and was part of Abington Township. The name was changed to Glenside in 1891, when the Glenside Station of the Reading Railroad was built. The station was named after the nearby Glenside Hotel, which was built in 1854 and was a popular summer resort for Philadelphians.
The Glenside area was home to a number of large estates in the late 19th and early 20th centuries. These included the estates of William H. Kneedler, a Philadelphia banker; William H. Kneedler's son, William H. Kneedler Jr.; and the estate of William H. Kneedler's daughter, Mary Kneedler.
Geography
Glenside is located at 40°06'17" North, 75°09'45" West (40.104722, -75.1625). According to the United States Census Bureau, the CDP has a total area of 2.2 square miles (5.7 km2), all of it land.
Economy
Glenside is home to a variety of businesses, including retail stores, restaurants, and professional services. The Glenside Train Station is a major transportation hub, providing access to Philadelphia and other nearby cities.
Demographics
As of the 2010 census, there were 8,384 people, 3,717 households, and 2,092 families residing in the CDP. The population density was 3,817.2 people per square mile (1,475.2/km2). There were 3,945 housing units at an average density of 1,788.2/sq mi (692.2/km2). The racial makeup of the CDP was 81.2% White, 11.2% African American, 0.2% Native American, 4.2% Asian, 0.1% Pacific Islander, 1.3% from other races, and 1.9% from two or more races. Hispanic or Latino of any race were 3.7% of the population.
There were 3,717 households, out of which 24.2% had children under the age of 18 living with them, 41.2% were married couples living together, 12.3% had a female householder with no husband present, and 42.2% were non-families. 34.2% of all households were made up of individuals, and 11.2% had someone living alone who was 65 years of age or older. The average household size was 2.25 and the average family size was 2.93.
In the CDP, the population was spread out, with 20.2% under the age of 18, 8.2% from 18 to 24, 32.2% from 25 to 44, 24.2% from 45 to 64, and 15.2% who were 65 years of age or older. The median age was 38 years. For every 100 females, there were 90.2 males. For every 100 females age 18 and over, there were 87.2 males.
The median income for a household in the CDP was $50,945, and the median income for a family was $62,917. Males had a median income of $41,964 versus $35,938 for females. The per capita income for the CDP was $27,945. About 4.2% of families and 6.2% of the population were below the poverty line, including 8.2% of those under age 18 and 5.2% of those age 65 or over.
Common Questions
What is Per Capita Income in Glenside?
Per Capita income in Glenside is $46,365.
What is the Median Family Income in Glenside?
Median Family Income in Glenside is $140,658.
What is the Median Household income in Glenside?
Median Household Income in Glenside is $105,278.
What is Income or Wage Gap in Glenside?
Income or Wage Gap in Glenside is 56.8%.
Women in Glenside earn 43.2 cents for every dollar earned by a man.
What is Inequality or Gini Index in Glenside?
Inequality or Gini Index in Glenside is 0.42.
What is the Total Population of Glenside?
Total Population of Glenside is 7,726.
What is the Total Male Population of Glenside?
Total Male Population of Glenside is 3,239.
What is the Total Female Population of Glenside?
Total Female Population of Glenside is 4,487.
What is the Ratio of Males per 100 Females in Glenside?
There are 72.19 Males per 100 Females in Glenside.
What is the Ratio of Females per 100 Males in Glenside?
There are 138.53 Females per 100 Males in Glenside.
What is the Median Population Age in Glenside?
Median Population Age in Glenside is 38.6 Years.
What is the Average Family Size in Glenside
Average Family Size in Glenside is 3.1 People.
What is the Average Household Size in Glenside
Average Household Size in Glenside is 2.5 People.
How Large is the Labor Force in Glenside?
There are 4,349 People in the Labor Forcein in Glenside.
What is the Percentage of People in the Labor Force in Glenside?
67.8% of People are in the Labor Force in Glenside.
What is the Unemployment Rate in Glenside?
Unemployment Rate in Glenside is 3.5%.