Bajadero, PR Map & Demographics
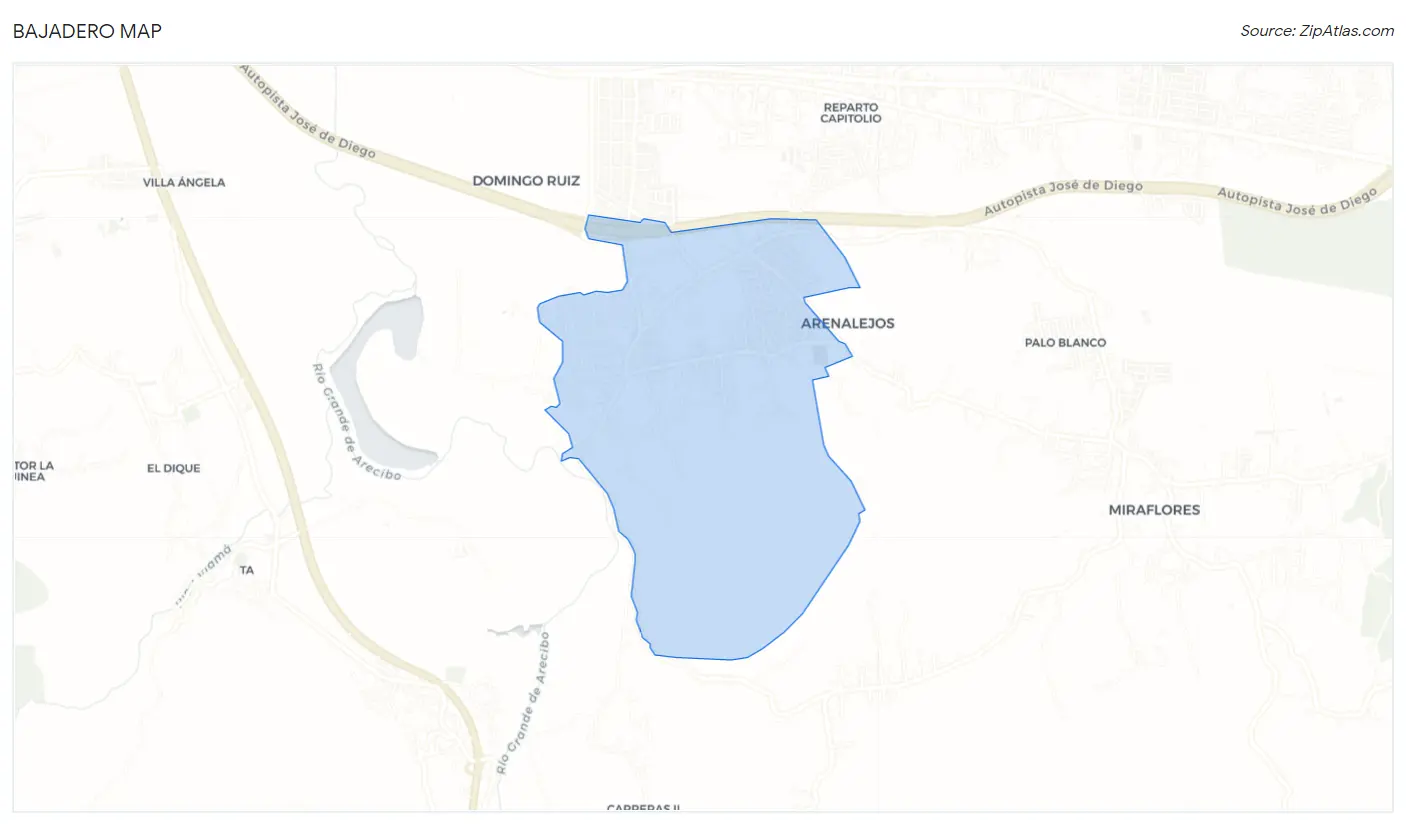
Bajadero Map
Bajadero Overview
$10,504
PER CAPITA INCOME
$25,703
AVG FAMILY INCOME
$19,413
AVG HOUSEHOLD INCOME
18.8%
WAGE / INCOME GAP [ % ]
81.2¢/ $1
WAGE / INCOME GAP [ $ ]
$13,782
FAMILY INCOME DEFICIT
0.53
INEQUALITY / GINI INDEX
3,539
TOTAL POPULATION
1,543
MALE POPULATION
1,996
FEMALE POPULATION
77.30
MALES / 100 FEMALES
129.36
FEMALES / 100 MALES
41.9
MEDIAN AGE
3.7
AVG FAMILY SIZE
3.0
AVG HOUSEHOLD SIZE
1,150
LABOR FORCE [ PEOPLE ]
39.4%
PERCENT IN LABOR FORCE
24.8%
UNEMPLOYMENT RATE
Bajadero Zip Codes
Bajadero Area Codes
Income in Bajadero
Income Overview in Bajadero
Per Capita Income in Bajadero is $10,504, while median incomes of families and households are $25,703 and $19,413 respectively.
| Characteristic | Number | Measure |
| Per Capita Income | 3,539 | $10,504 |
| Median Family Income | 762 | $25,703 |
| Mean Family Income | 762 | $30,751 |
| Median Household Income | 1,191 | $19,413 |
| Mean Household Income | 1,191 | $26,263 |
| Income Deficit | 762 | $13,782 |
| Wage / Income Gap (%) | 3,539 | 18.83% |
| Wage / Income Gap ($) | 3,539 | 81.17¢ per $1 |
| Gini / Inequality Index | 3,539 | 0.53 |
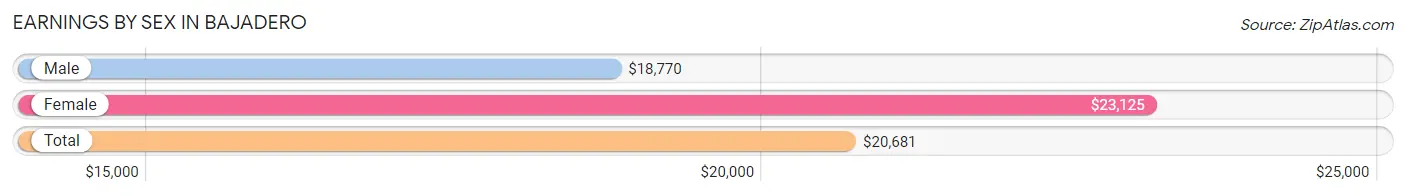
Earnings by Sex in Bajadero
Average Earnings in Bajadero are $20,681, $18,770 for men and $23,125 for women, a difference of 18.8%.
| Sex | Number | Average Earnings |
| Male | 425 (45.9%) | $18,770 |
| Female | 502 (54.1%) | $23,125 |
| Total | 927 (100.0%) | $20,681 |
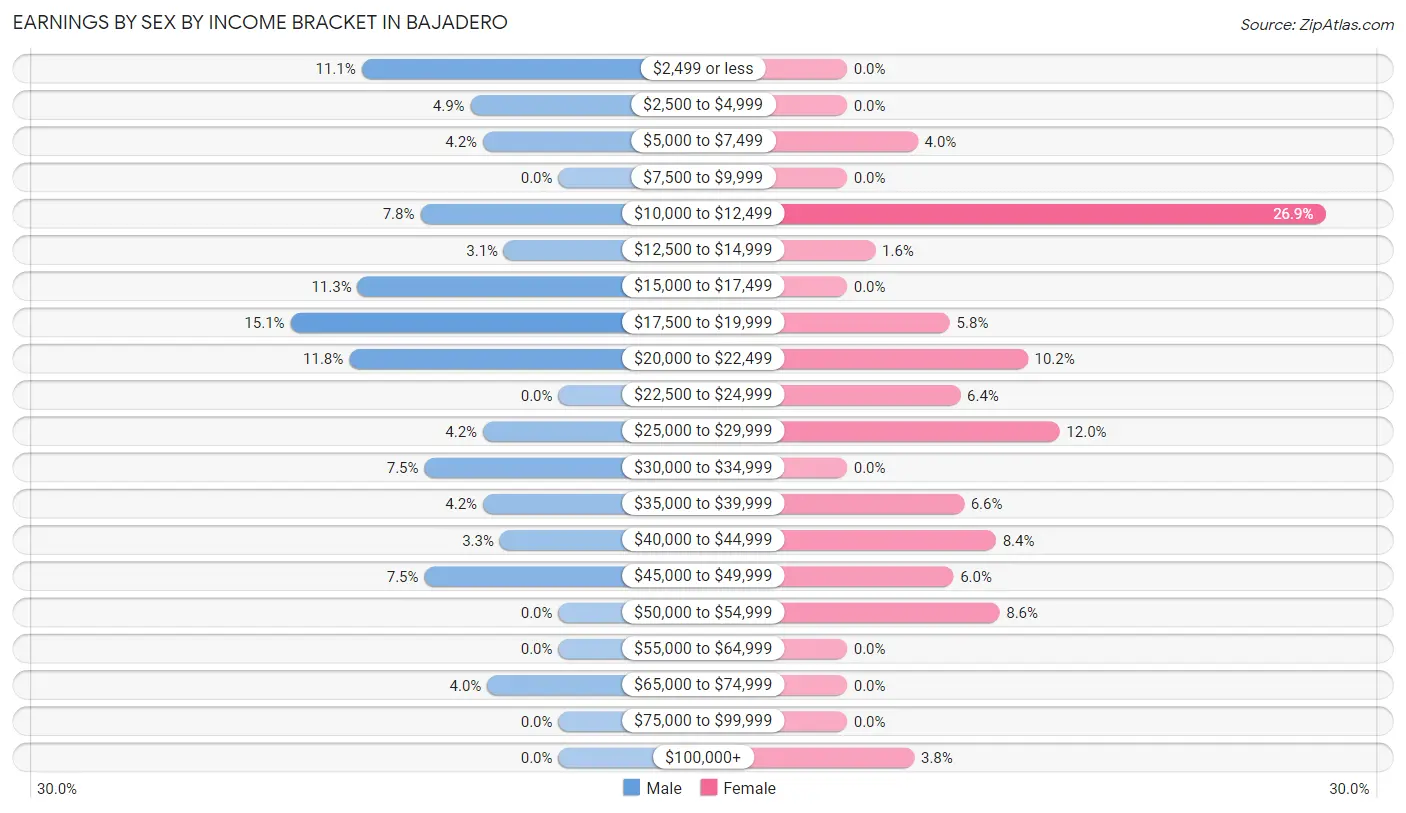
Earnings by Sex by Income Bracket in Bajadero
The most common earnings brackets in Bajadero are $17,500 to $19,999 for men (64 | 15.1%) and $10,000 to $12,499 for women (135 | 26.9%).
| Income | Male | Female |
| $2,499 or less | 47 (11.1%) | 0 (0.0%) |
| $2,500 to $4,999 | 21 (4.9%) | 0 (0.0%) |
| $5,000 to $7,499 | 18 (4.2%) | 20 (4.0%) |
| $7,500 to $9,999 | 0 (0.0%) | 0 (0.0%) |
| $10,000 to $12,499 | 33 (7.8%) | 135 (26.9%) |
| $12,500 to $14,999 | 13 (3.1%) | 8 (1.6%) |
| $15,000 to $17,499 | 48 (11.3%) | 0 (0.0%) |
| $17,500 to $19,999 | 64 (15.1%) | 29 (5.8%) |
| $20,000 to $22,499 | 50 (11.8%) | 51 (10.2%) |
| $22,500 to $24,999 | 0 (0.0%) | 32 (6.4%) |
| $25,000 to $29,999 | 18 (4.2%) | 60 (11.9%) |
| $30,000 to $34,999 | 32 (7.5%) | 0 (0.0%) |
| $35,000 to $39,999 | 18 (4.2%) | 33 (6.6%) |
| $40,000 to $44,999 | 14 (3.3%) | 42 (8.4%) |
| $45,000 to $49,999 | 32 (7.5%) | 30 (6.0%) |
| $50,000 to $54,999 | 0 (0.0%) | 43 (8.6%) |
| $55,000 to $64,999 | 0 (0.0%) | 0 (0.0%) |
| $65,000 to $74,999 | 17 (4.0%) | 0 (0.0%) |
| $75,000 to $99,999 | 0 (0.0%) | 0 (0.0%) |
| $100,000+ | 0 (0.0%) | 19 (3.8%) |
| Total | 425 (100.0%) | 502 (100.0%) |
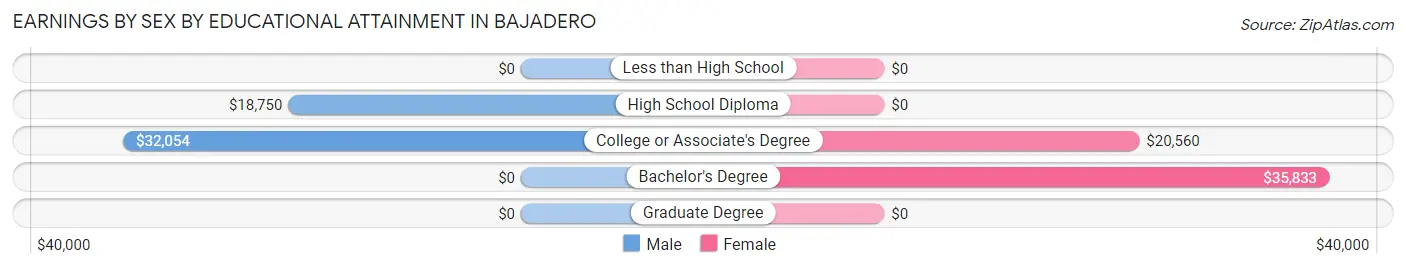
Earnings by Sex by Educational Attainment in Bajadero
Average earnings in Bajadero are $19,902 for men and $23,125 for women, a difference of 13.9%. Men with an educational attainment of college or associate's degree enjoy the highest average annual earnings of $32,054, while those with high school diploma education earn the least with $18,750. Women with an educational attainment of bachelor's degree earn the most with the average annual earnings of $35,833, while those with college or associate's degree education have the smallest earnings of $20,560.
| Educational Attainment | Male Income | Female Income |
| Less than High School | - | - |
| High School Diploma | $18,750 | $0 |
| College or Associate's Degree | $32,054 | $20,560 |
| Bachelor's Degree | - | - |
| Graduate Degree | - | - |
| Total | $19,902 | $23,125 |
Family Income in Bajadero
Family Income Brackets in Bajadero
According to the Bajadero family income data, there are 196 families falling into the less than $10,000 income range, which is the most common income bracket and makes up 25.7% of all families.
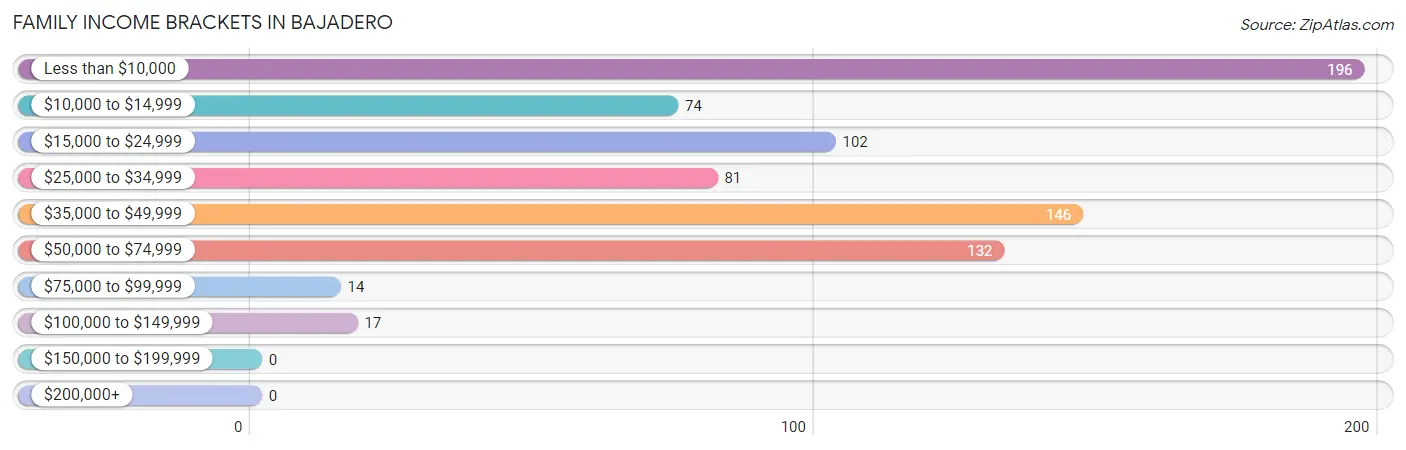
| Income Bracket | # Families | % Families |
| Less than $10,000 | 196 | 25.7% |
| $10,000 to $14,999 | 74 | 9.7% |
| $15,000 to $24,999 | 102 | 13.4% |
| $25,000 to $34,999 | 81 | 10.6% |
| $35,000 to $49,999 | 146 | 19.2% |
| $50,000 to $74,999 | 132 | 17.3% |
| $75,000 to $99,999 | 14 | 1.8% |
| $100,000 to $149,999 | 17 | 2.2% |
| $150,000 to $199,999 | 0 | 0.0% |
| $200,000+ | 0 | 0.0% |
Family Income by Famaliy Size in Bajadero
4-person families (163 | 21.4%) account for the highest median family income in Bajadero with $40,688 per family, while 2-person families (309 | 40.6%) have the highest median income of $12,740 per family member.
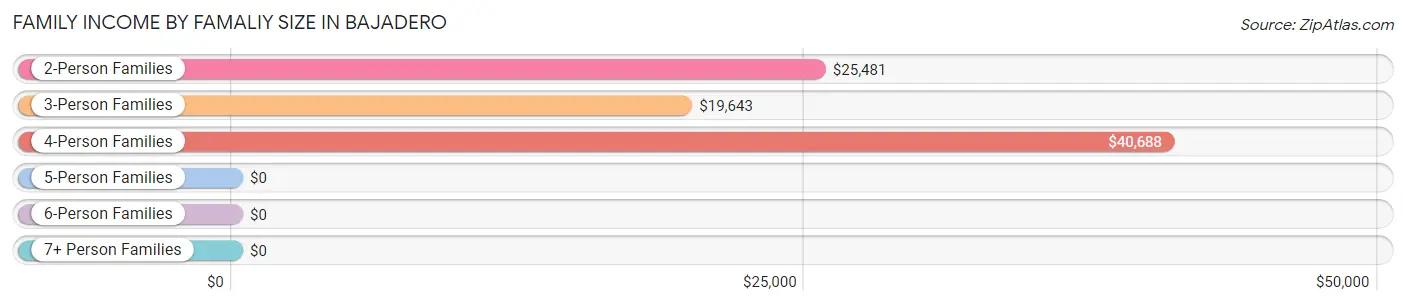
| Income Bracket | # Families | Median Income |
| 2-Person Families | 309 (40.6%) | $25,481 |
| 3-Person Families | 226 (29.7%) | $19,643 |
| 4-Person Families | 163 (21.4%) | $40,688 |
| 5-Person Families | 55 (7.2%) | $0 |
| 6-Person Families | 9 (1.2%) | $0 |
| 7+ Person Families | 0 (0.0%) | $0 |
| Total | 762 (100.0%) | $25,703 |
Family Income by Number of Earners in Bajadero
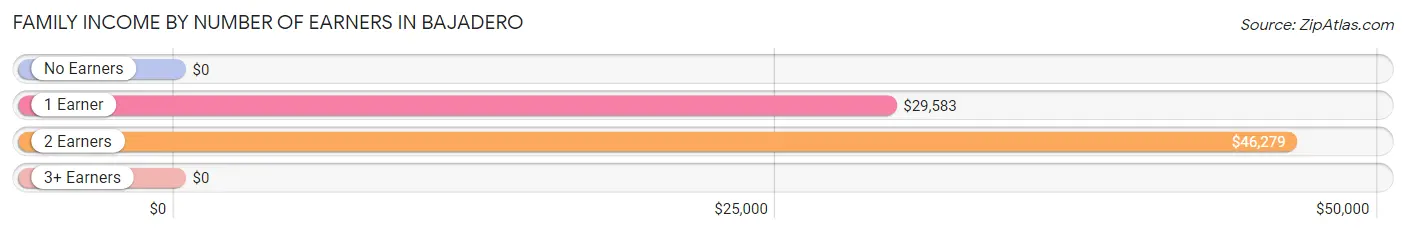
| Number of Earners | # Families | Median Income |
| No Earners | 313 (41.1%) | $0 |
| 1 Earner | 279 (36.6%) | $29,583 |
| 2 Earners | 170 (22.3%) | $46,279 |
| 3+ Earners | 0 (0.0%) | $0 |
| Total | 762 (100.0%) | $25,703 |
Household Income in Bajadero
Household Income Brackets in Bajadero
With 428 households falling in the category, the less than $10,000 income range is the most frequent in Bajadero, accounting for 35.9% of all households.
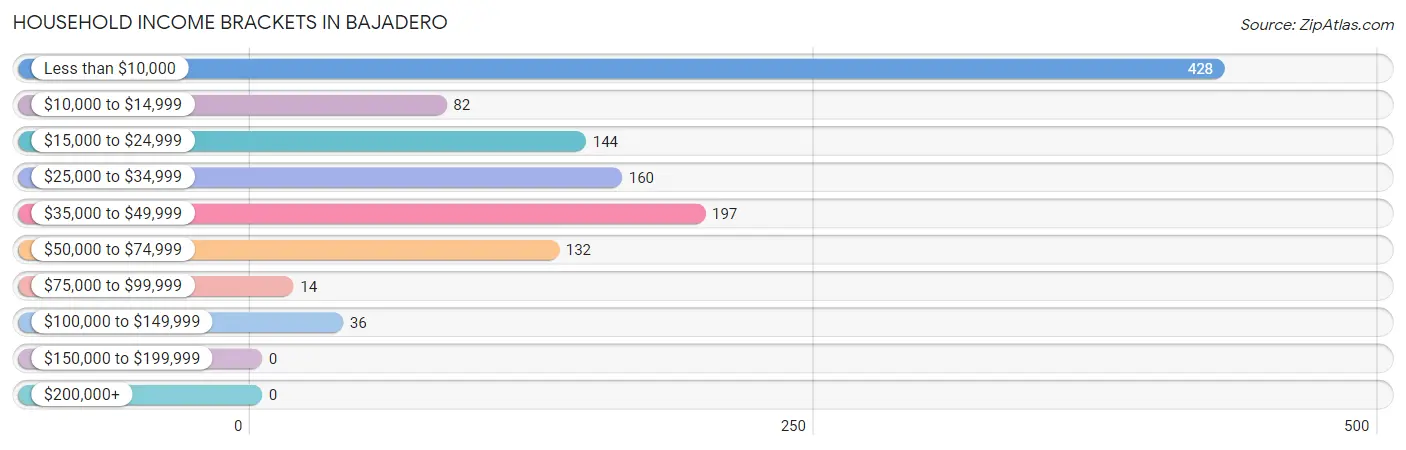
| Income Bracket | # Households | % Households |
| Less than $10,000 | 428 | 35.9% |
| $10,000 to $14,999 | 82 | 6.9% |
| $15,000 to $24,999 | 144 | 12.1% |
| $25,000 to $34,999 | 160 | 13.4% |
| $35,000 to $49,999 | 197 | 16.5% |
| $50,000 to $74,999 | 132 | 11.1% |
| $75,000 to $99,999 | 14 | 1.2% |
| $100,000 to $149,999 | 36 | 3.0% |
| $150,000 to $199,999 | 0 | 0.0% |
| $200,000+ | 0 | 0.0% |
Household Income by Householder Age in Bajadero
The median household income in Bajadero is $19,413, with the highest median household income of $22,798 found in the 65+ years age bracket for the primary householder. A total of 431 households (36.2%) fall into this category.
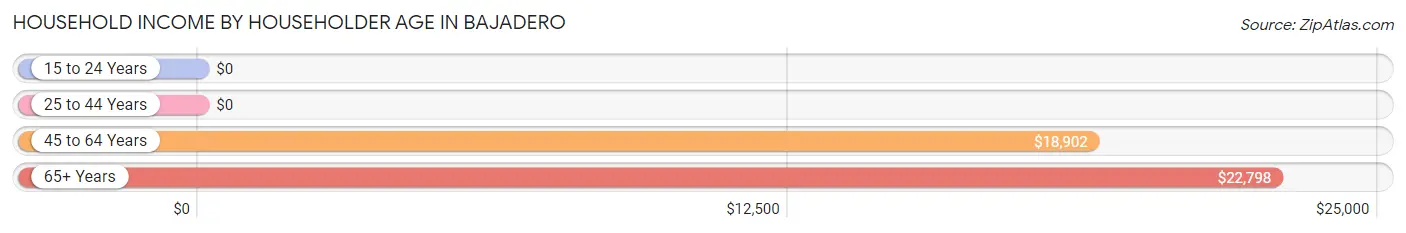
| Income Bracket | # Households | Median Income |
| 15 to 24 Years | 0 (0.0%) | $0 |
| 25 to 44 Years | 344 (28.9%) | $0 |
| 45 to 64 Years | 416 (34.9%) | $18,902 |
| 65+ Years | 431 (36.2%) | $22,798 |
| Total | 1,191 (100.0%) | $19,413 |
Poverty in Bajadero
Income Below Poverty by Sex and Age in Bajadero
With 47.3% poverty level for males and 55.8% for females among the residents of Bajadero, 5 year old males and 12 to 14 year old females are the most vulnerable to poverty, with 17 males (100.0%) and 50 females (100.0%) in their respective age groups living below the poverty level.
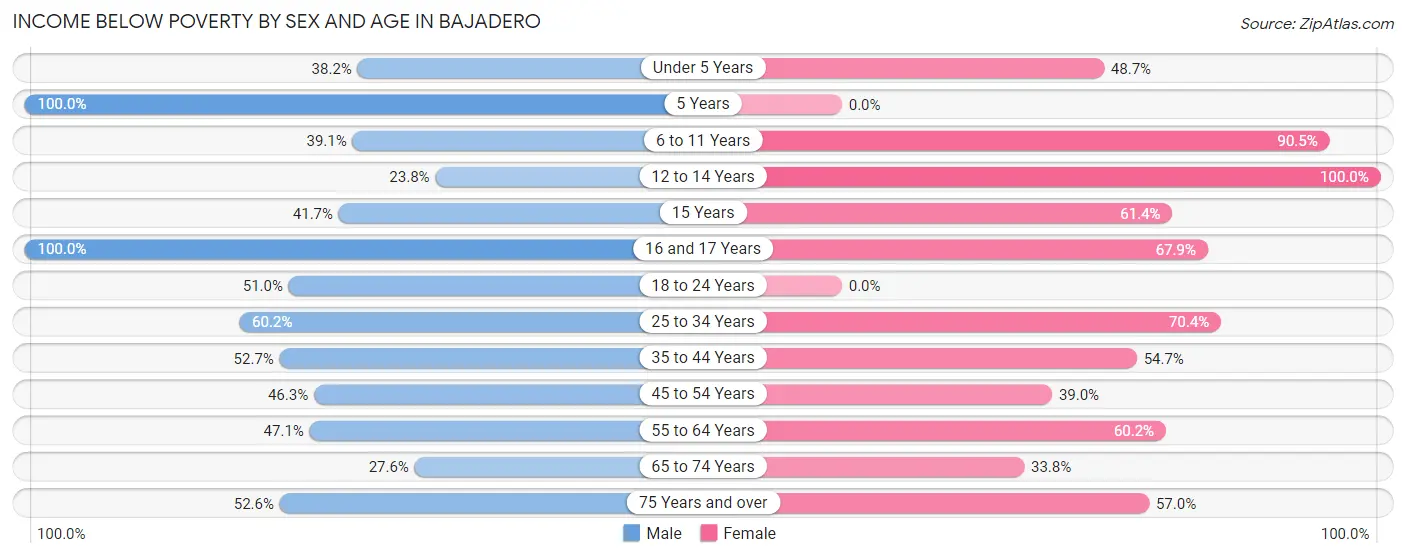
| Age Bracket | Male | Female |
| Under 5 Years | 21 (38.2%) | 18 (48.6%) |
| 5 Years | 17 (100.0%) | 0 (0.0%) |
| 6 to 11 Years | 27 (39.1%) | 210 (90.5%) |
| 12 to 14 Years | 19 (23.7%) | 50 (100.0%) |
| 15 Years | 15 (41.7%) | 27 (61.4%) |
| 16 and 17 Years | 15 (100.0%) | 36 (67.9%) |
| 18 to 24 Years | 106 (51.0%) | 0 (0.0%) |
| 25 to 34 Years | 130 (60.2%) | 138 (70.4%) |
| 35 to 44 Years | 109 (52.7%) | 150 (54.7%) |
| 45 to 54 Years | 81 (46.3%) | 149 (39.0%) |
| 55 to 64 Years | 97 (47.1%) | 154 (60.2%) |
| 65 to 74 Years | 48 (27.6%) | 45 (33.8%) |
| 75 Years and over | 40 (52.6%) | 134 (57.0%) |
| Total | 725 (47.3%) | 1,111 (55.8%) |
Income Above Poverty by Sex and Age in Bajadero
According to the poverty statistics in Bajadero, males aged 12 to 14 years and females aged 18 to 24 years are the age groups that are most secure financially, with 76.2% of males and 100.0% of females in these age groups living above the poverty line.
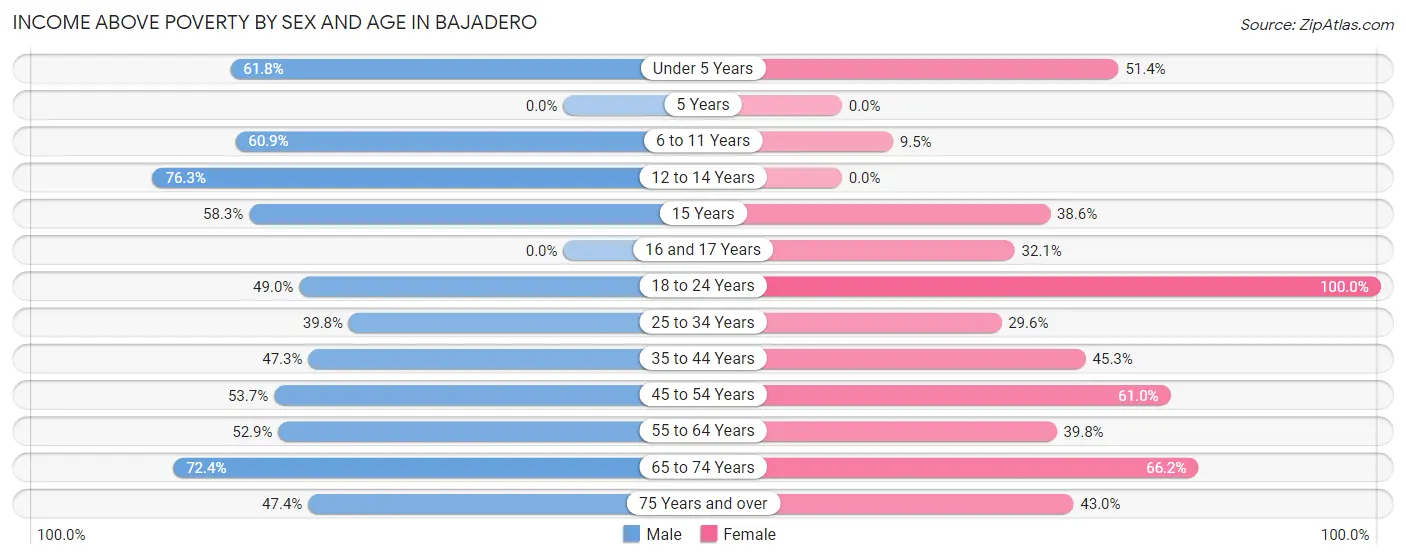
| Age Bracket | Male | Female |
| Under 5 Years | 34 (61.8%) | 19 (51.3%) |
| 5 Years | 0 (0.0%) | 0 (0.0%) |
| 6 to 11 Years | 42 (60.9%) | 22 (9.5%) |
| 12 to 14 Years | 61 (76.2%) | 0 (0.0%) |
| 15 Years | 21 (58.3%) | 17 (38.6%) |
| 16 and 17 Years | 0 (0.0%) | 17 (32.1%) |
| 18 to 24 Years | 102 (49.0%) | 100 (100.0%) |
| 25 to 34 Years | 86 (39.8%) | 58 (29.6%) |
| 35 to 44 Years | 98 (47.3%) | 124 (45.3%) |
| 45 to 54 Years | 94 (53.7%) | 233 (61.0%) |
| 55 to 64 Years | 109 (52.9%) | 102 (39.8%) |
| 65 to 74 Years | 126 (72.4%) | 88 (66.2%) |
| 75 Years and over | 36 (47.4%) | 101 (43.0%) |
| Total | 809 (52.7%) | 881 (44.2%) |
Income Below Poverty Among Married-Couple Families in Bajadero
The poverty statistics for married-couple families in Bajadero show that 32.8% or 129 of the total 393 families live below the poverty line. Families with no children have the highest poverty rate of 34.9%, comprising of 80 families. On the other hand, families with 1 or 2 children have the lowest poverty rate of 29.9%, which includes 49 families.
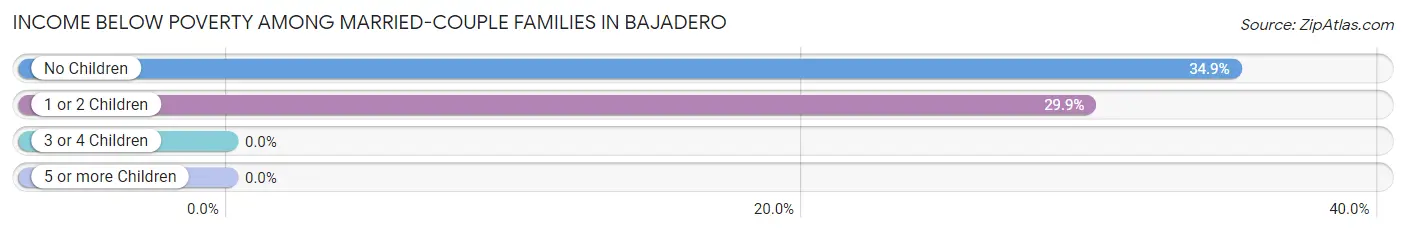
| Children | Above Poverty | Below Poverty |
| No Children | 149 (65.1%) | 80 (34.9%) |
| 1 or 2 Children | 115 (70.1%) | 49 (29.9%) |
| 3 or 4 Children | 0 (0.0%) | 0 (0.0%) |
| 5 or more Children | 0 (0.0%) | 0 (0.0%) |
| Total | 264 (67.2%) | 129 (32.8%) |
Income Below Poverty Among Single-Parent Households in Bajadero
According to the poverty data in Bajadero, 84.7% or 83 single-father households and 55.7% or 151 single-mother households are living below the poverty line. Among single-father households, those with no children have the highest poverty rate, with 15 households (100.0%) experiencing poverty. Likewise, among single-mother households, those with 3 or 4 children have the highest poverty rate, with 17 households (100.0%) falling below the poverty line.
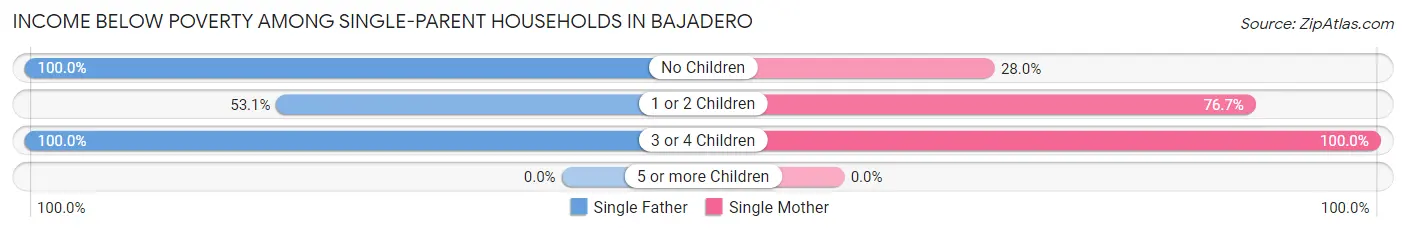
| Children | Single Father | Single Mother |
| No Children | 15 (100.0%) | 35 (28.0%) |
| 1 or 2 Children | 17 (53.1%) | 99 (76.7%) |
| 3 or 4 Children | 51 (100.0%) | 17 (100.0%) |
| 5 or more Children | 0 (0.0%) | 0 (0.0%) |
| Total | 83 (84.7%) | 151 (55.7%) |
Income Below Poverty Among Married-Couple vs Single-Parent Households in Bajadero
The poverty data for Bajadero shows that 129 of the married-couple family households (32.8%) and 234 of the single-parent households (63.4%) are living below the poverty level. Within the married-couple family households, those with no children have the highest poverty rate, with 80 households (34.9%) falling below the poverty line. Among the single-parent households, those with 3 or 4 children have the highest poverty rate, with 68 household (100.0%) living below poverty.
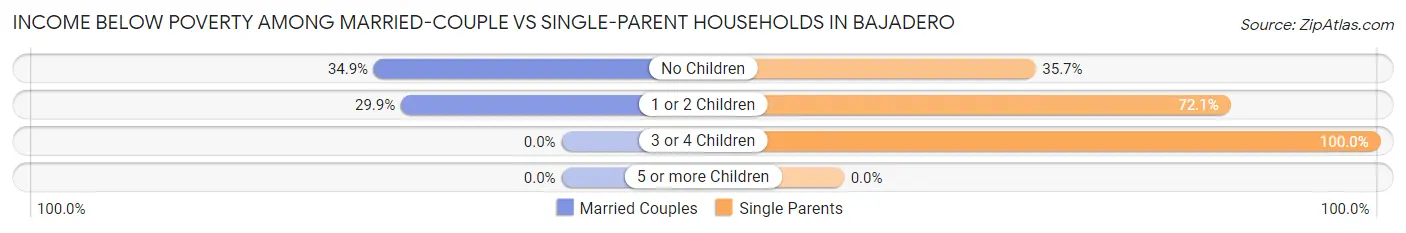
| Children | Married-Couple Families | Single-Parent Households |
| No Children | 80 (34.9%) | 50 (35.7%) |
| 1 or 2 Children | 49 (29.9%) | 116 (72.1%) |
| 3 or 4 Children | 0 (0.0%) | 68 (100.0%) |
| 5 or more Children | 0 (0.0%) | 0 (0.0%) |
| Total | 129 (32.8%) | 234 (63.4%) |
Race in Bajadero
The most populous races in Bajadero are Hispanic or Latino (3,539 | 100.0%), White / Caucasian (1,152 | 32.6%), and Some other Race (1,046 | 29.6%).
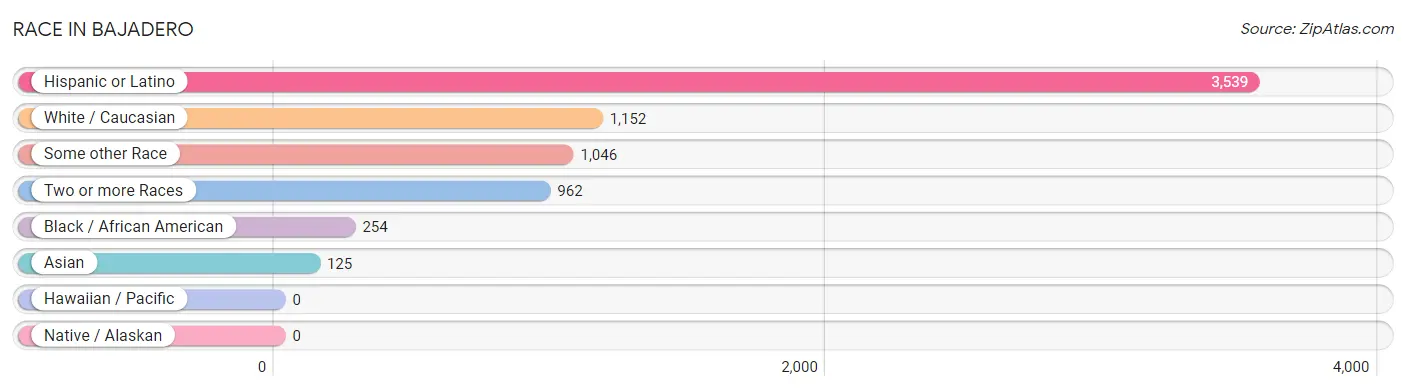
| Race | # Population | % Population |
| Asian | 125 | 3.5% |
| Black / African American | 254 | 7.2% |
| Hawaiian / Pacific | 0 | 0.0% |
| Hispanic or Latino | 3,539 | 100.0% |
| Native / Alaskan | 0 | 0.0% |
| White / Caucasian | 1,152 | 32.6% |
| Two or more Races | 962 | 27.2% |
| Some other Race | 1,046 | 29.6% |
| Total | 3,539 | 100.0% |
Ancestry in Bajadero
The most populous ancestries reported in Bajadero are Puerto Rican (3,539 | 100.0%), Thai (180 | 5.1%), African (70 | 2.0%), Central American Indian (70 | 2.0%), and Subsaharan African (70 | 2.0%), together accounting for 111.0% of all Bajadero residents.
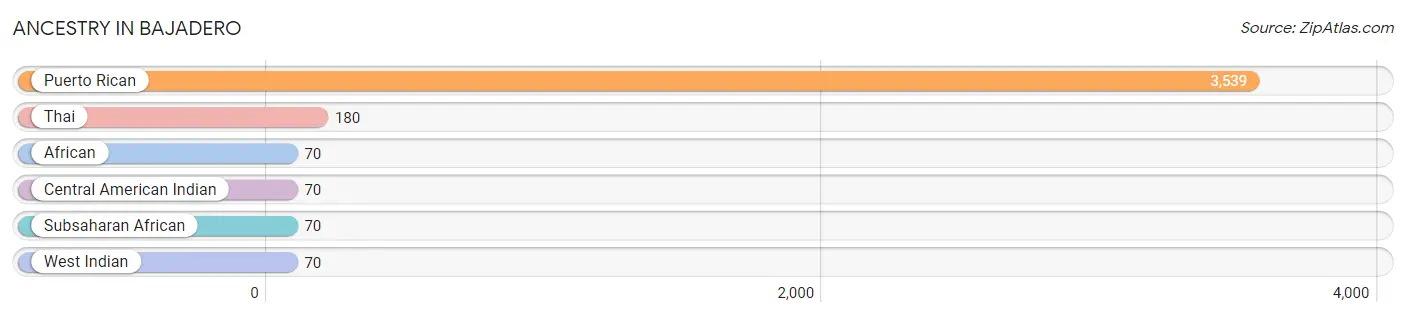
| Ancestry | # Population | % Population |
| African | 70 | 2.0% |
| Central American Indian | 70 | 2.0% |
| Puerto Rican | 3,539 | 100.0% |
| Subsaharan African | 70 | 2.0% |
| Thai | 180 | 5.1% |
| West Indian | 70 | 2.0% | View All 6 Rows |
Immigrants in Bajadero

| Immigration Origin | # Population | % Population | View All 0 Rows |
Sex and Age in Bajadero
Sex and Age in Bajadero
The most populous age groups in Bajadero are 25 to 29 Years (148 | 9.6%) for men and 50 to 54 Years (245 | 12.3%) for women.
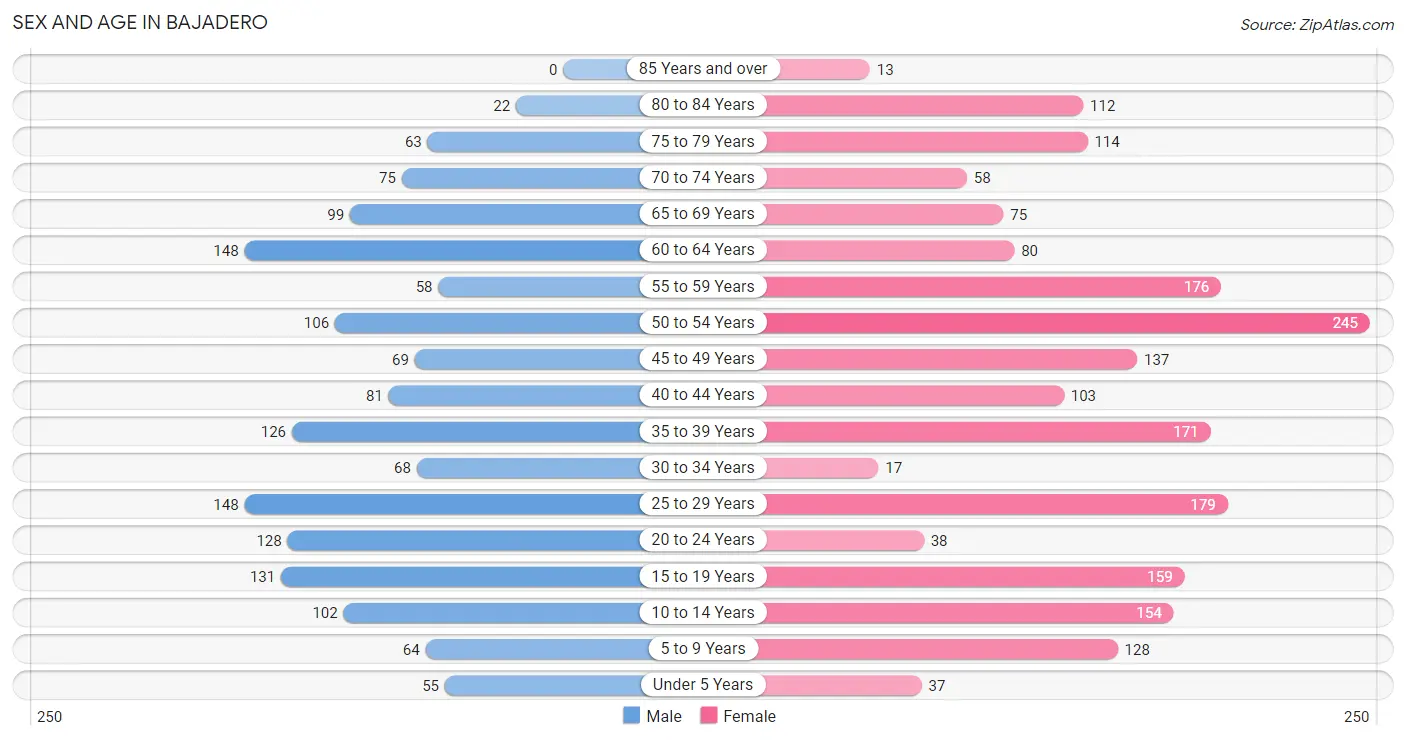
| Age Bracket | Male | Female |
| Under 5 Years | 55 (3.6%) | 37 (1.8%) |
| 5 to 9 Years | 64 (4.2%) | 128 (6.4%) |
| 10 to 14 Years | 102 (6.6%) | 154 (7.7%) |
| 15 to 19 Years | 131 (8.5%) | 159 (8.0%) |
| 20 to 24 Years | 128 (8.3%) | 38 (1.9%) |
| 25 to 29 Years | 148 (9.6%) | 179 (9.0%) |
| 30 to 34 Years | 68 (4.4%) | 17 (0.9%) |
| 35 to 39 Years | 126 (8.2%) | 171 (8.6%) |
| 40 to 44 Years | 81 (5.2%) | 103 (5.2%) |
| 45 to 49 Years | 69 (4.5%) | 137 (6.9%) |
| 50 to 54 Years | 106 (6.9%) | 245 (12.3%) |
| 55 to 59 Years | 58 (3.8%) | 176 (8.8%) |
| 60 to 64 Years | 148 (9.6%) | 80 (4.0%) |
| 65 to 69 Years | 99 (6.4%) | 75 (3.8%) |
| 70 to 74 Years | 75 (4.9%) | 58 (2.9%) |
| 75 to 79 Years | 63 (4.1%) | 114 (5.7%) |
| 80 to 84 Years | 22 (1.4%) | 112 (5.6%) |
| 85 Years and over | 0 (0.0%) | 13 (0.6%) |
| Total | 1,543 (100.0%) | 1,996 (100.0%) |
Families and Households in Bajadero
Median Family Size in Bajadero
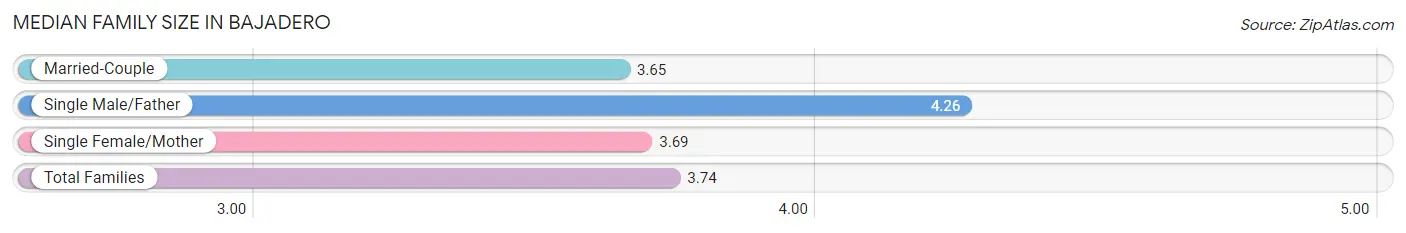
The median family size in Bajadero is 3.74 persons per family, with single male/father families (98 | 12.9%) accounting for the largest median family size of 4.26 persons per family. On the other hand, married-couple families (393 | 51.6%) represent the smallest median family size with 3.65 persons per family.
| Family Type | # Families | Family Size |
| Married-Couple | 393 (51.6%) | 3.65 |
| Single Male/Father | 98 (12.9%) | 4.26 |
| Single Female/Mother | 271 (35.6%) | 3.69 |
| Total Families | 762 (100.0%) | 3.74 |
Median Household Size in Bajadero
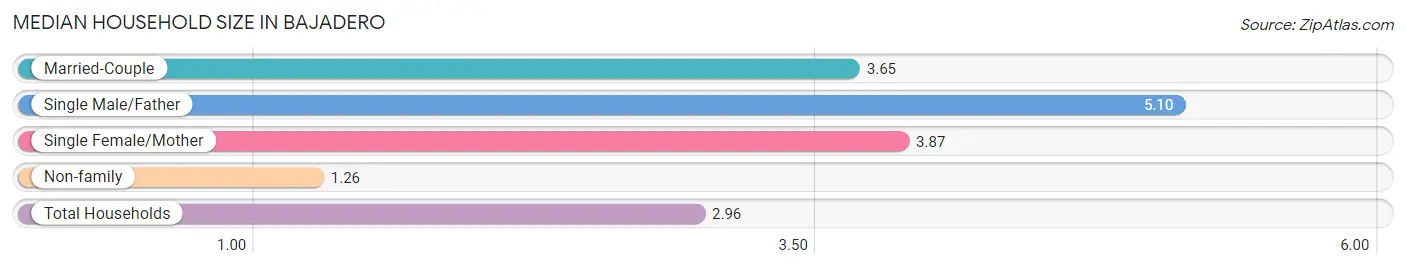
The median household size in Bajadero is 2.96 persons per household, with single male/father households (98 | 8.2%) accounting for the largest median household size of 5.1 persons per household. non-family households (429 | 36.0%) represent the smallest median household size with 1.26 persons per household.
| Household Type | # Households | Household Size |
| Married-Couple | 393 (33.0%) | 3.65 |
| Single Male/Father | 98 (8.2%) | 5.10 |
| Single Female/Mother | 271 (22.8%) | 3.87 |
| Non-family | 429 (36.0%) | 1.26 |
| Total Households | 1,191 (100.0%) | 2.96 |
Household Size by Marriage Status in Bajadero
Out of a total of 1,191 households in Bajadero, 762 (64.0%) are family households, while 429 (36.0%) are nonfamily households. The most numerous type of family households are 2-person households, comprising 268, and the most common type of nonfamily households are 1-person households, comprising 365.
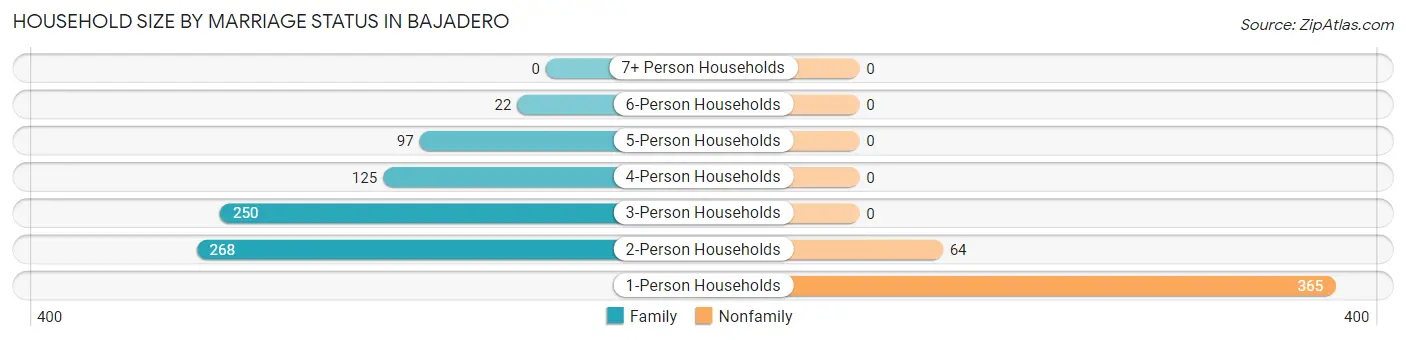
| Household Size | Family Households | Nonfamily Households |
| 1-Person Households | - | 365 (30.6%) |
| 2-Person Households | 268 (22.5%) | 64 (5.4%) |
| 3-Person Households | 250 (21.0%) | 0 (0.0%) |
| 4-Person Households | 125 (10.5%) | 0 (0.0%) |
| 5-Person Households | 97 (8.1%) | 0 (0.0%) |
| 6-Person Households | 22 (1.8%) | 0 (0.0%) |
| 7+ Person Households | 0 (0.0%) | 0 (0.0%) |
| Total | 762 (64.0%) | 429 (36.0%) |
Female Fertility in Bajadero
Fertility by Age in Bajadero
Average fertility rate in Bajadero is 70.0 births per 1,000 women. Women in the age bracket of 20 to 34 years have the highest fertility rate with 269.0 births per 1,000 women. Women in the age bracket of 20 to 34 years acount for 100.0% of all women with births.
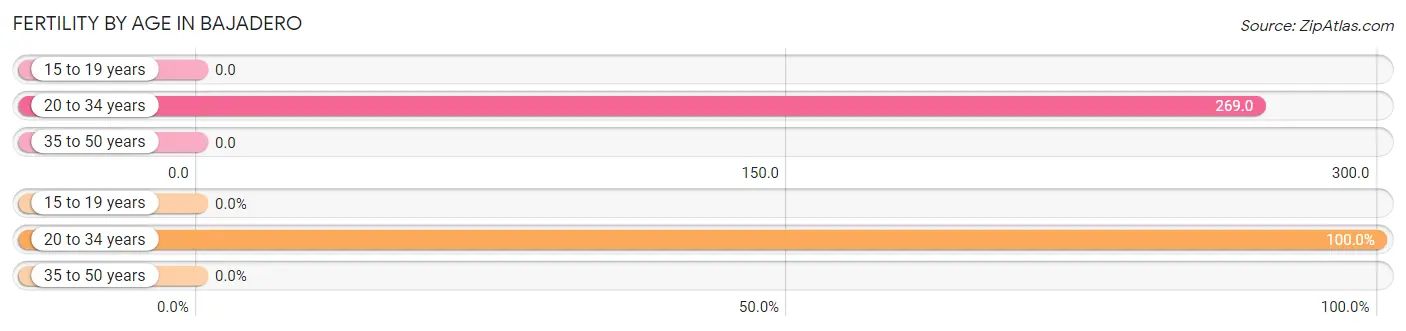
| Age Bracket | Women with Births | Births / 1,000 Women |
| 15 to 19 years | 0 (0.0%) | 0.0 |
| 20 to 34 years | 63 (100.0%) | 269.0 |
| 35 to 50 years | 0 (0.0%) | 0.0 |
| Total | 63 (100.0%) | 70.0 |
Fertility by Age by Marriage Status in Bajadero
39.7% of women with births (63) in Bajadero are married. The highest percentage of unmarried women with births falls into 20 to 34 years age bracket with 60.3% of them unmarried at the time of birth, while the lowest percentage of unmarried women with births belong to 20 to 34 years age bracket with 60.3% of them unmarried.
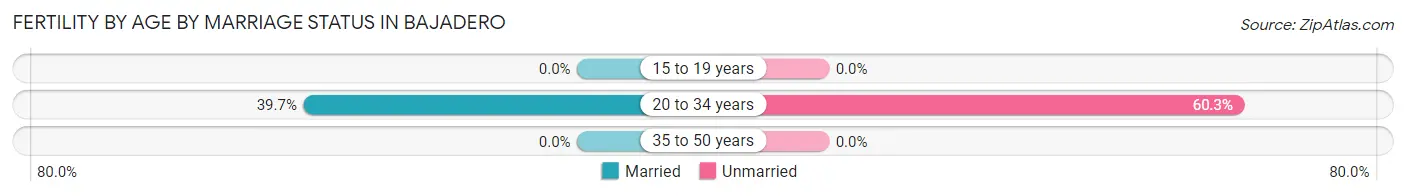
| Age Bracket | Married | Unmarried |
| 15 to 19 years | 0 (0.0%) | 0 (0.0%) |
| 20 to 34 years | 25 (39.7%) | 38 (60.3%) |
| 35 to 50 years | 0 (0.0%) | 0 (0.0%) |
| Total | 25 (39.7%) | 38 (60.3%) |
Fertility by Education in Bajadero
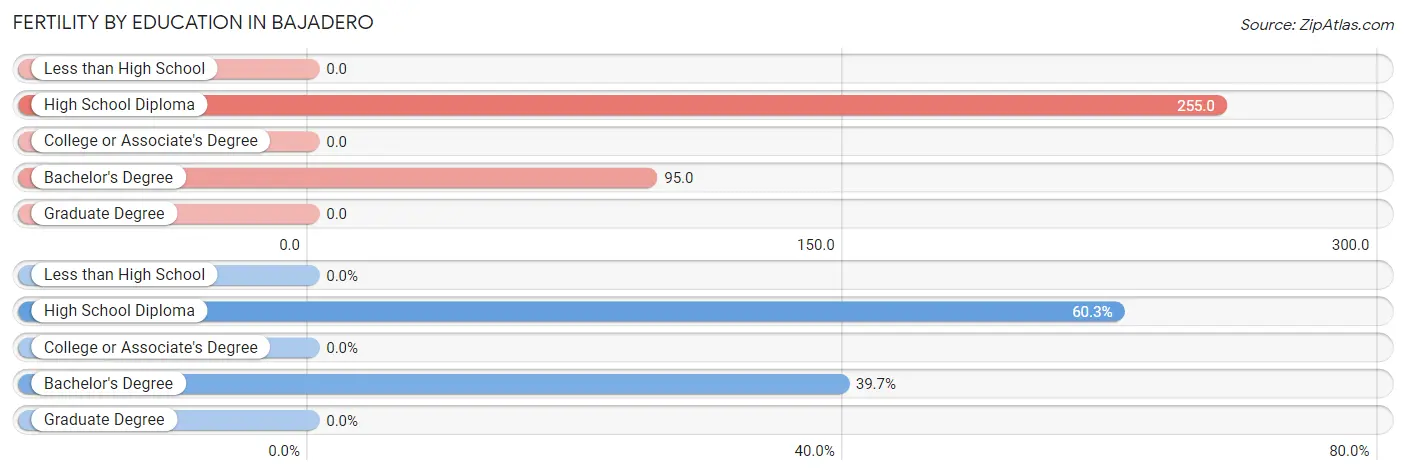
| Educational Attainment | Women with Births | Births / 1,000 Women |
| Less than High School | 0 (0.0%) | 0.0 |
| High School Diploma | 38 (60.3%) | 255.0 |
| College or Associate's Degree | 0 (0.0%) | 0.0 |
| Bachelor's Degree | 25 (39.7%) | 95.0 |
| Graduate Degree | 0 (0.0%) | 0.0 |
| Total | 63 (100.0%) | 70.0 |
Fertility by Education by Marriage Status in Bajadero
60.3% of women with births in Bajadero are unmarried. Women with the educational attainment of bachelor's degree are most likely to be married with 100.0% of them married at childbirth, while women with the educational attainment of high school diploma are least likely to be married with 100.0% of them unmarried at childbirth.
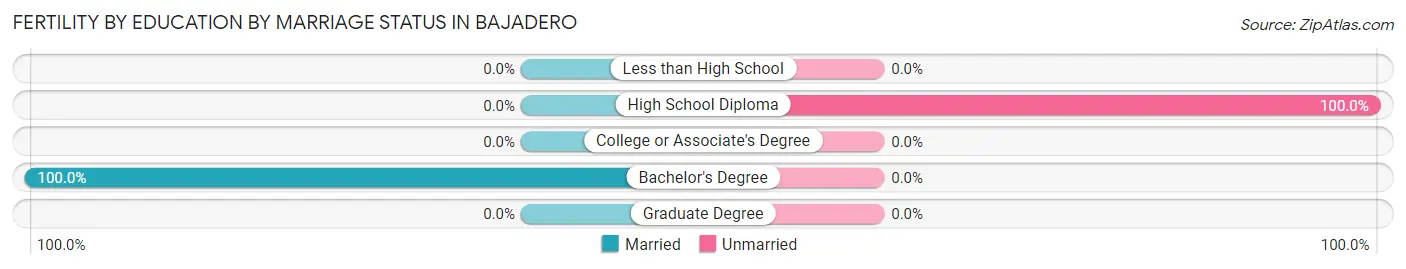
| Educational Attainment | Married | Unmarried |
| Less than High School | 0 (0.0%) | 0 (0.0%) |
| High School Diploma | 0 (0.0%) | 38 (100.0%) |
| College or Associate's Degree | 0 (0.0%) | 0 (0.0%) |
| Bachelor's Degree | 25 (100.0%) | 0 (0.0%) |
| Graduate Degree | 0 (0.0%) | 0 (0.0%) |
| Total | 25 (39.7%) | 38 (60.3%) |
Employment Characteristics in Bajadero
Employment by Class of Employer in Bajadero
Among the 800 employed individuals in Bajadero, private company employees (478 | 59.8%), state government employees (262 | 32.8%), and self-employed (not incorporated) (27 | 3.4%) make up the most common classes of employment.
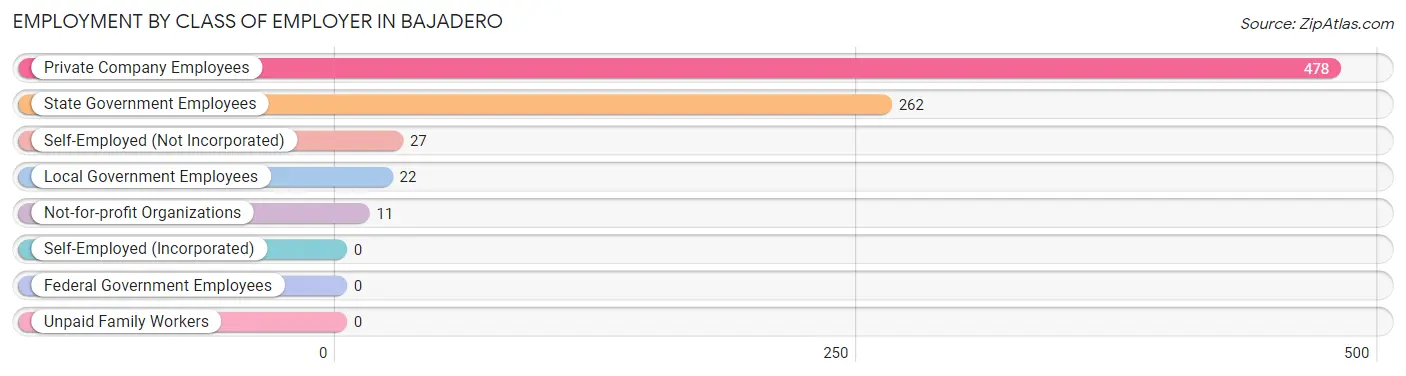
| Employer Class | # Employees | % Employees |
| Private Company Employees | 478 | 59.8% |
| Self-Employed (Incorporated) | 0 | 0.0% |
| Self-Employed (Not Incorporated) | 27 | 3.4% |
| Not-for-profit Organizations | 11 | 1.4% |
| Local Government Employees | 22 | 2.8% |
| State Government Employees | 262 | 32.8% |
| Federal Government Employees | 0 | 0.0% |
| Unpaid Family Workers | 0 | 0.0% |
| Total | 800 | 100.0% |
Employment Status by Age in Bajadero
According to the labor force statistics for Bajadero, out of the total population over 16 years of age (2,919), 39.4% or 1,150 individuals are in the labor force, with 24.8% or 285 of them unemployed. The age group with the highest labor force participation rate is 25 to 29 years, with 70.9% or 232 individuals in the labor force. Within the labor force, the 30 to 34 years age range has the highest percentage of unemployed individuals, with 100.0% or 55 of them being unemployed.
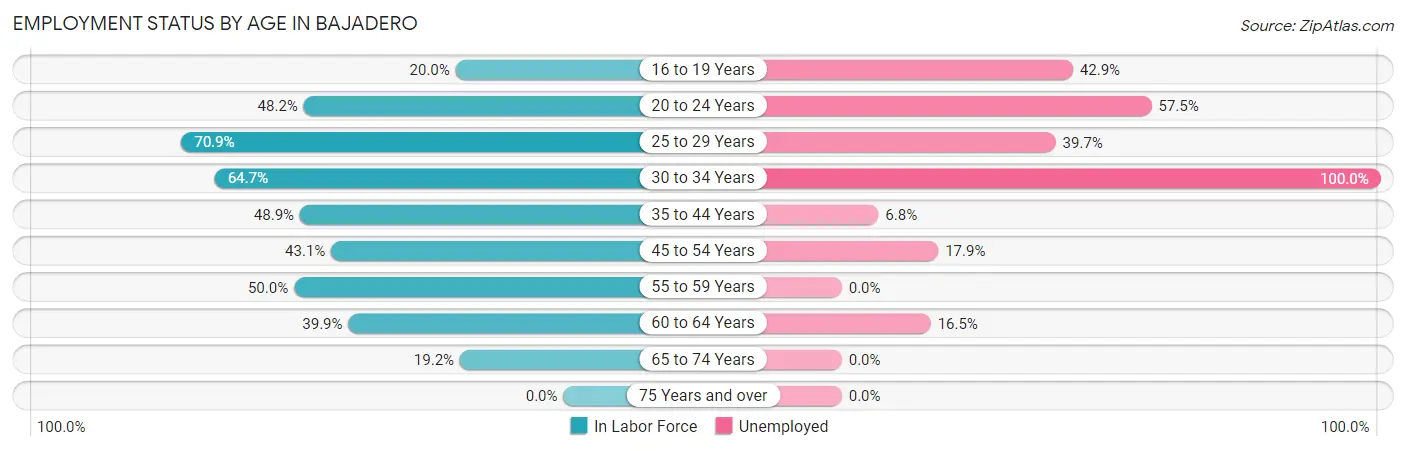
| Age Bracket | In Labor Force | Unemployed |
| 16 to 19 Years | 42 (20.0%) | 18 (42.9%) |
| 20 to 24 Years | 80 (48.2%) | 46 (57.5%) |
| 25 to 29 Years | 232 (70.9%) | 92 (39.7%) |
| 30 to 34 Years | 55 (64.7%) | 55 (100.0%) |
| 35 to 44 Years | 235 (48.9%) | 16 (6.8%) |
| 45 to 54 Years | 240 (43.1%) | 43 (17.9%) |
| 55 to 59 Years | 117 (50.0%) | 0 (0.0%) |
| 60 to 64 Years | 91 (39.9%) | 15 (16.5%) |
| 65 to 74 Years | 59 (19.2%) | 0 (0.0%) |
| 75 Years and over | 0 (0.0%) | 0 (0.0%) |
| Total | 1,150 (39.4%) | 285 (24.8%) |
Employment Status by Educational Attainment in Bajadero
According to labor force statistics for Bajadero, 50.7% of individuals (969) out of the total population between 25 and 64 years of age (1,912) are in the labor force, with 22.8% or 221 of them being unemployed. The group with the highest labor force participation rate are those with the educational attainment of bachelor's degree or higher, with 62.4% or 272 individuals in the labor force. Within the labor force, individuals with college / associate degree education have the highest percentage of unemployment, with 35.4% or 104 of them being unemployed.
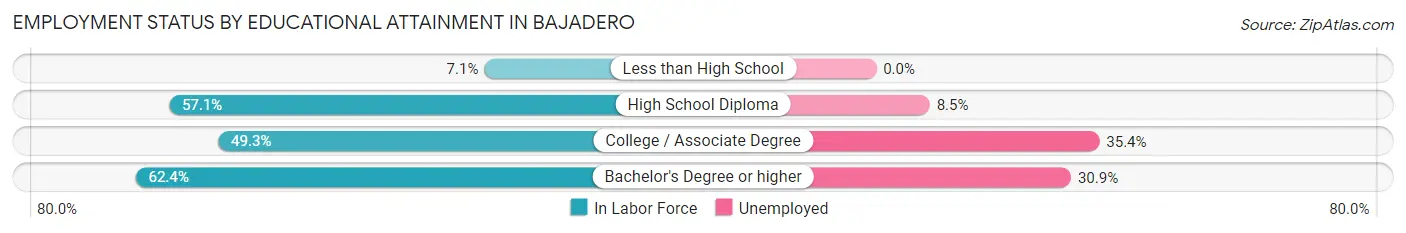
| Educational Attainment | In Labor Force | Unemployed |
| Less than High School | 14 (7.1%) | 0 (0.0%) |
| High School Diploma | 390 (57.1%) | 58 (8.5%) |
| College / Associate Degree | 294 (49.3%) | 211 (35.4%) |
| Bachelor's Degree or higher | 272 (62.4%) | 135 (30.9%) |
| Total | 969 (50.7%) | 436 (22.8%) |
Employment Occupations by Sex in Bajadero
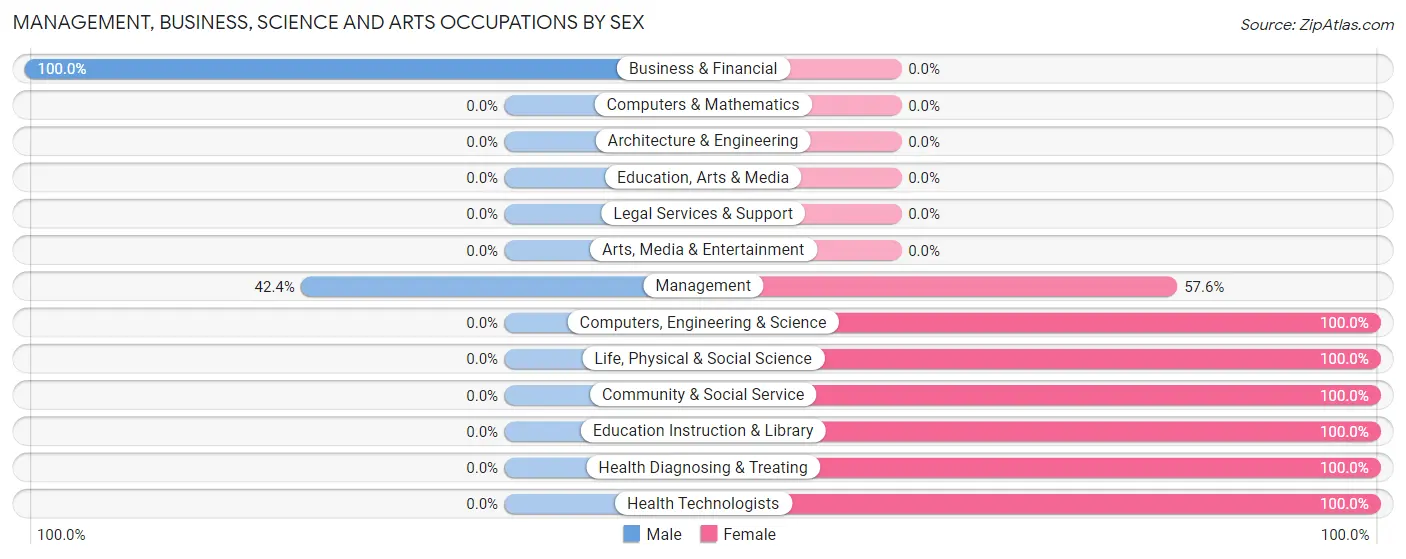
Management, Business, Science and Arts Occupations
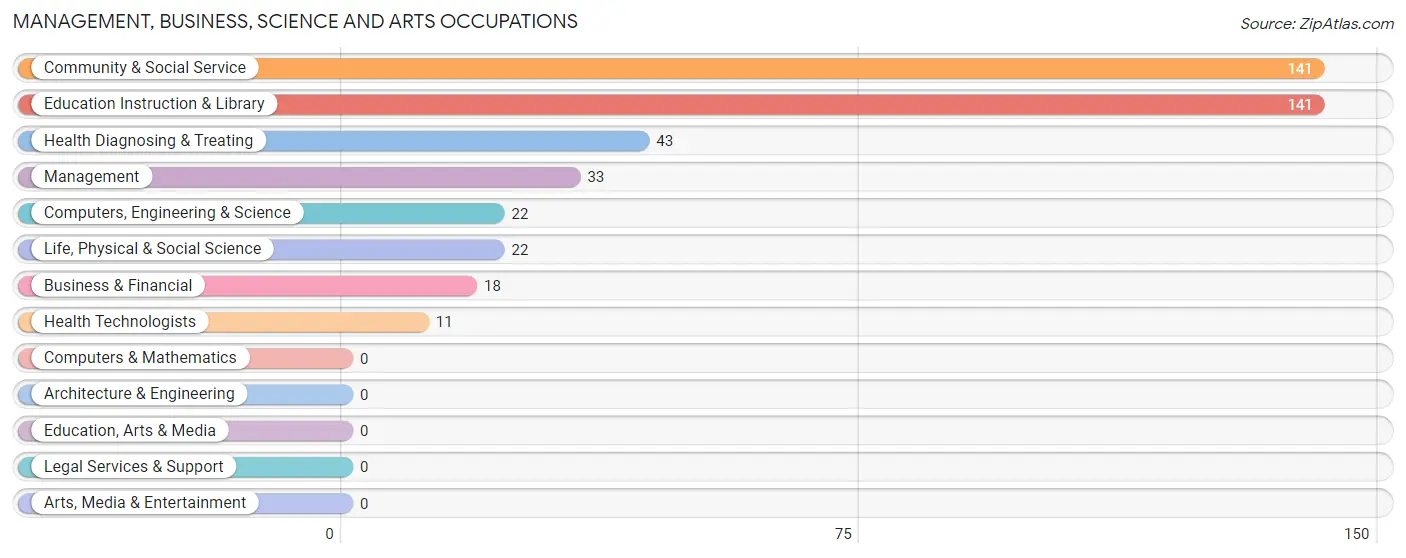
The most common Management, Business, Science and Arts occupations in Bajadero are Community & Social Service (141 | 16.3%), Education Instruction & Library (141 | 16.3%), Health Diagnosing & Treating (43 | 5.0%), Management (33 | 3.8%), and Computers, Engineering & Science (22 | 2.5%).
Management, Business, Science and Arts Occupations by Sex
Within the Management, Business, Science and Arts occupations in Bajadero, the most male-oriented occupations are Business & Financial (100.0%), and Management (42.4%), while the most female-oriented occupations are Computers, Engineering & Science (100.0%), Life, Physical & Social Science (100.0%), and Community & Social Service (100.0%).
| Occupation | Male | Female |
| Management | 14 (42.4%) | 19 (57.6%) |
| Business & Financial | 18 (100.0%) | 0 (0.0%) |
| Computers, Engineering & Science | 0 (0.0%) | 22 (100.0%) |
| Computers & Mathematics | 0 (0.0%) | 0 (0.0%) |
| Architecture & Engineering | 0 (0.0%) | 0 (0.0%) |
| Life, Physical & Social Science | 0 (0.0%) | 22 (100.0%) |
| Community & Social Service | 0 (0.0%) | 141 (100.0%) |
| Education, Arts & Media | 0 (0.0%) | 0 (0.0%) |
| Legal Services & Support | 0 (0.0%) | 0 (0.0%) |
| Education Instruction & Library | 0 (0.0%) | 141 (100.0%) |
| Arts, Media & Entertainment | 0 (0.0%) | 0 (0.0%) |
| Health Diagnosing & Treating | 0 (0.0%) | 43 (100.0%) |
| Health Technologists | 0 (0.0%) | 11 (100.0%) |
| Total (Category) | 32 (12.4%) | 225 (87.5%) |
| Total (Overall) | 425 (49.1%) | 441 (50.9%) |
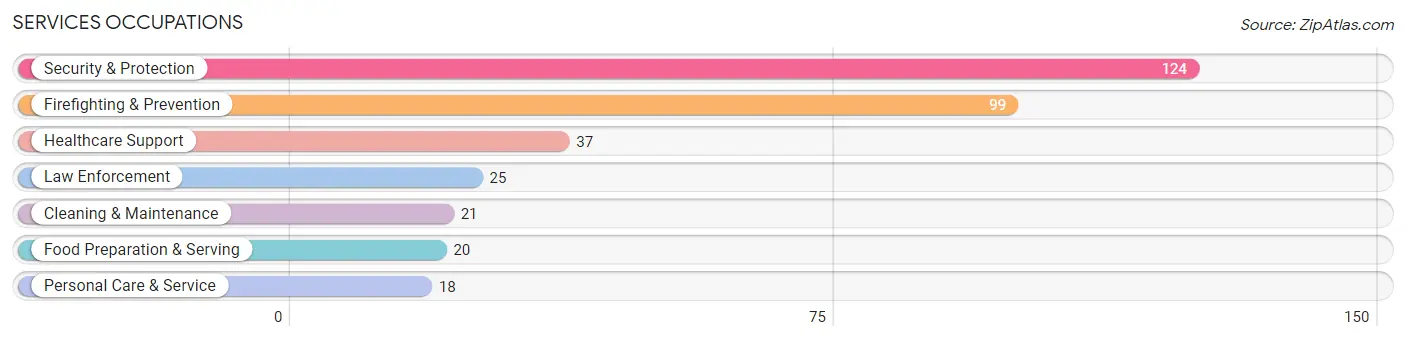
Services Occupations
The most common Services occupations in Bajadero are Security & Protection (124 | 14.3%), Firefighting & Prevention (99 | 11.4%), Healthcare Support (37 | 4.3%), Law Enforcement (25 | 2.9%), and Cleaning & Maintenance (21 | 2.4%).
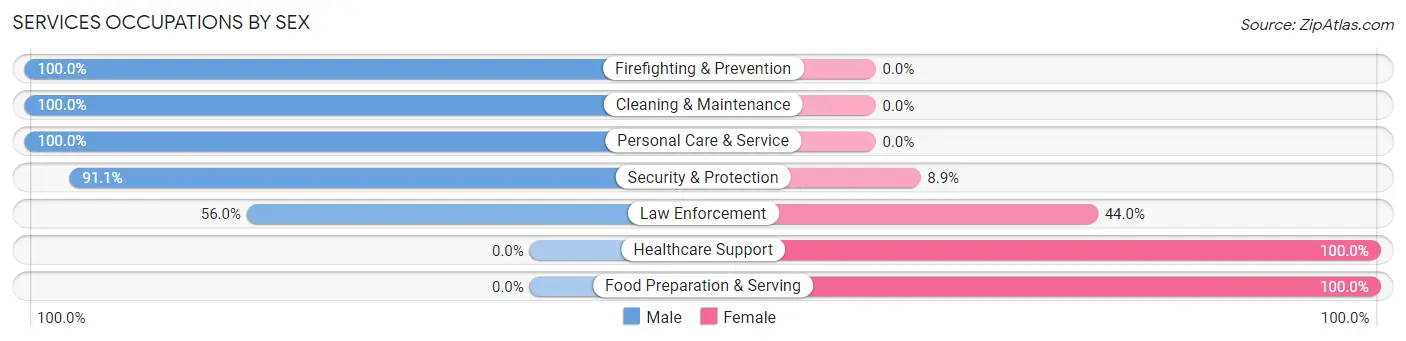
Services Occupations by Sex
Within the Services occupations in Bajadero, the most male-oriented occupations are Firefighting & Prevention (100.0%), Cleaning & Maintenance (100.0%), and Personal Care & Service (100.0%), while the most female-oriented occupations are Healthcare Support (100.0%), Food Preparation & Serving (100.0%), and Law Enforcement (44.0%).
| Occupation | Male | Female |
| Healthcare Support | 0 (0.0%) | 37 (100.0%) |
| Security & Protection | 113 (91.1%) | 11 (8.9%) |
| Firefighting & Prevention | 99 (100.0%) | 0 (0.0%) |
| Law Enforcement | 14 (56.0%) | 11 (44.0%) |
| Food Preparation & Serving | 0 (0.0%) | 20 (100.0%) |
| Cleaning & Maintenance | 21 (100.0%) | 0 (0.0%) |
| Personal Care & Service | 18 (100.0%) | 0 (0.0%) |
| Total (Category) | 152 (69.1%) | 68 (30.9%) |
| Total (Overall) | 425 (49.1%) | 441 (50.9%) |
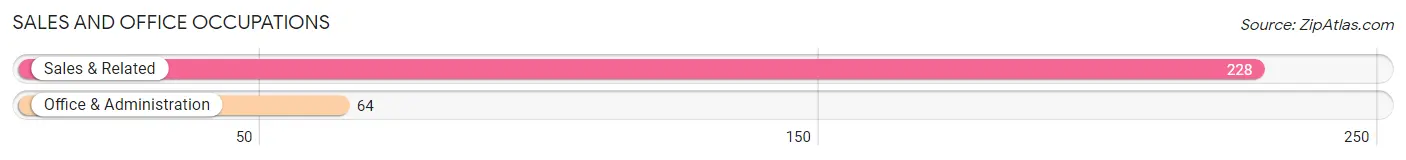
Sales and Office Occupations
The most common Sales and Office occupations in Bajadero are Sales & Related (228 | 26.3%), and Office & Administration (64 | 7.4%).
Sales and Office Occupations by Sex
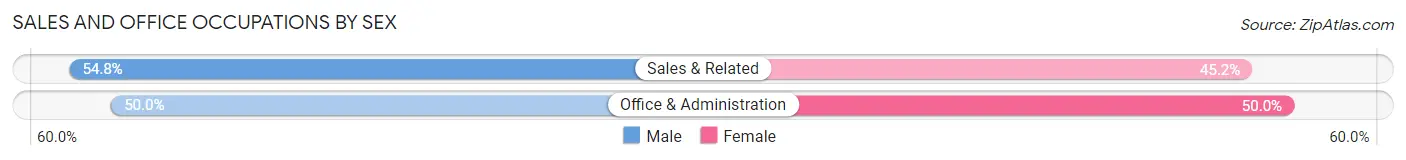
| Occupation | Male | Female |
| Sales & Related | 125 (54.8%) | 103 (45.2%) |
| Office & Administration | 32 (50.0%) | 32 (50.0%) |
| Total (Category) | 157 (53.8%) | 135 (46.2%) |
| Total (Overall) | 425 (49.1%) | 441 (50.9%) |
Natural Resources, Construction and Maintenance Occupations
The most common Natural Resources, Construction and Maintenance occupations in Bajadero are , and Installation, Maintenance & Repair (17 | 2.0%).
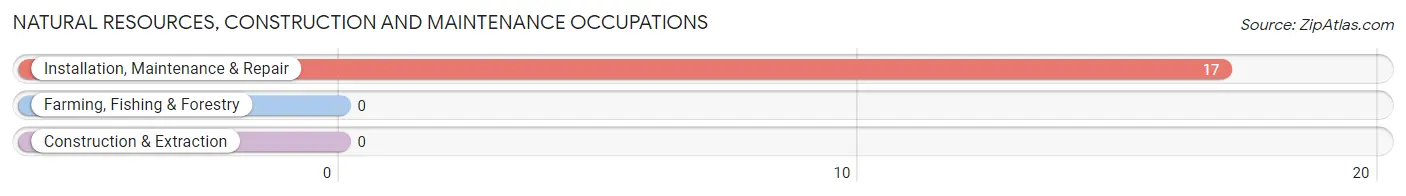
Natural Resources, Construction and Maintenance Occupations by Sex
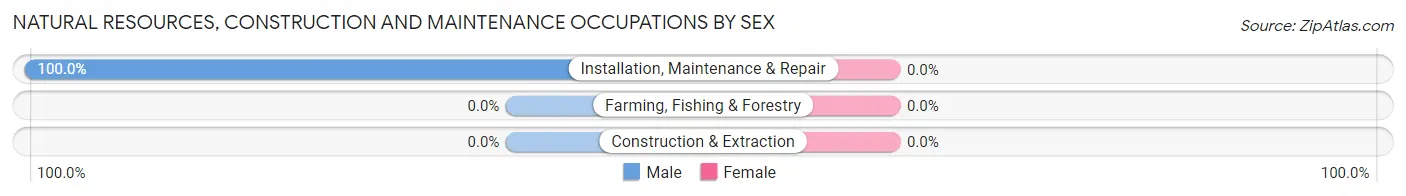
| Occupation | Male | Female |
| Farming, Fishing & Forestry | 0 (0.0%) | 0 (0.0%) |
| Construction & Extraction | 0 (0.0%) | 0 (0.0%) |
| Installation, Maintenance & Repair | 17 (100.0%) | 0 (0.0%) |
| Total (Category) | 17 (100.0%) | 0 (0.0%) |
| Total (Overall) | 425 (49.1%) | 441 (50.9%) |
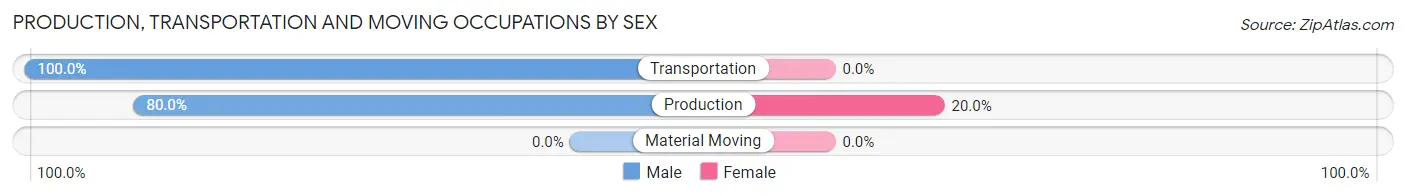
Production, Transportation and Moving Occupations
The most common Production, Transportation and Moving occupations in Bajadero are Production (65 | 7.5%), and Transportation (15 | 1.7%).
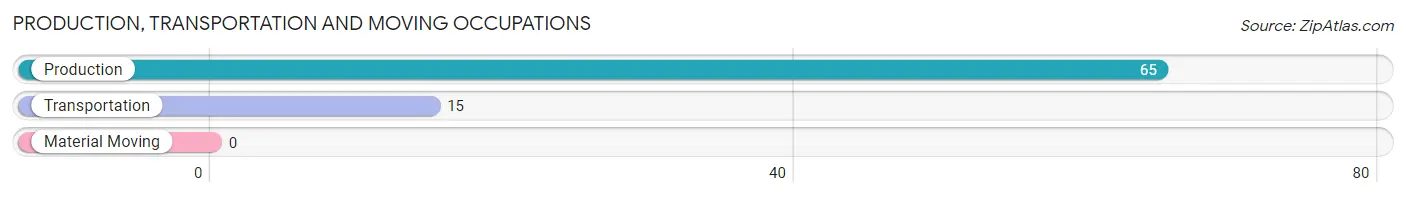
Production, Transportation and Moving Occupations by Sex
| Occupation | Male | Female |
| Production | 52 (80.0%) | 13 (20.0%) |
| Transportation | 15 (100.0%) | 0 (0.0%) |
| Material Moving | 0 (0.0%) | 0 (0.0%) |
| Total (Category) | 67 (83.8%) | 13 (16.3%) |
| Total (Overall) | 425 (49.1%) | 441 (50.9%) |
Employment Industries by Sex in Bajadero
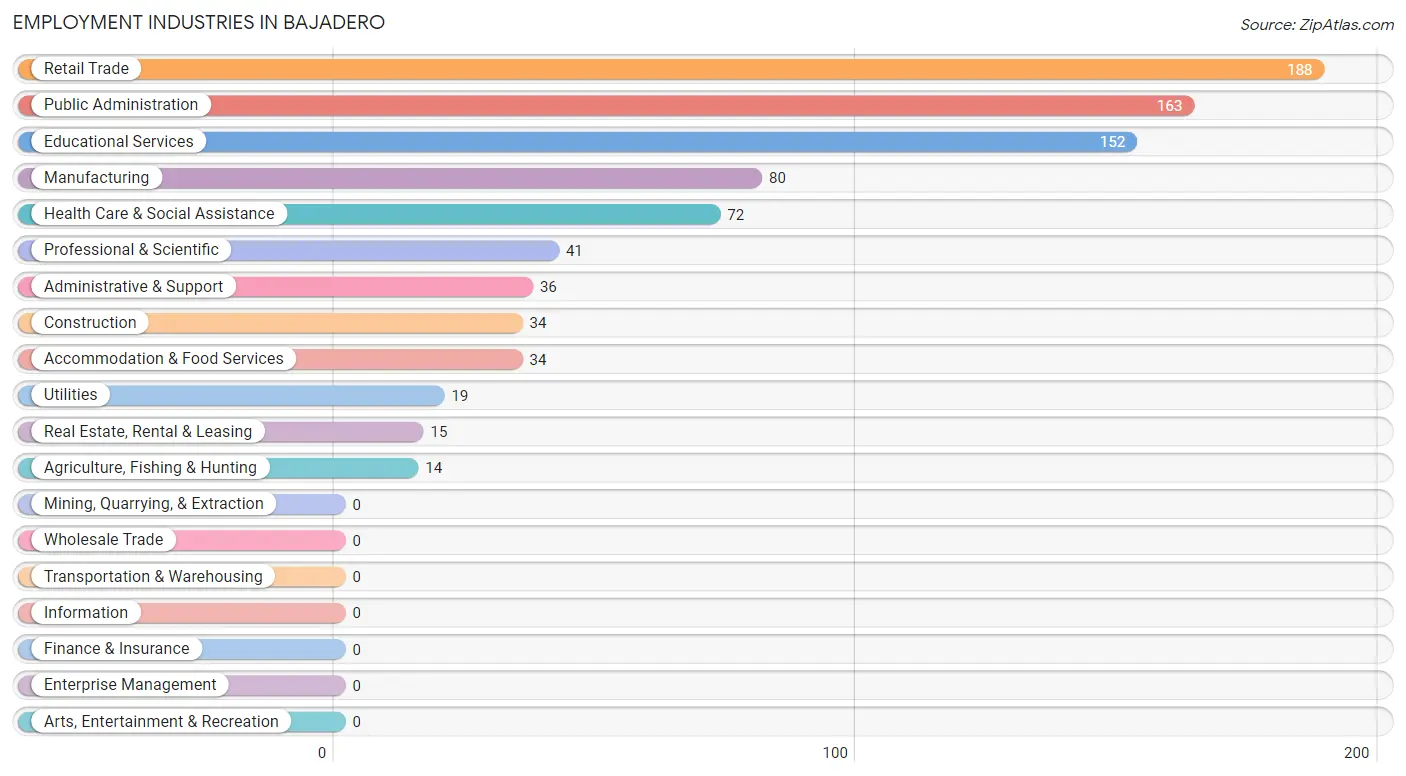
Employment Industries in Bajadero
The major employment industries in Bajadero include Retail Trade (188 | 21.7%), Public Administration (163 | 18.8%), Educational Services (152 | 17.5%), Manufacturing (80 | 9.2%), and Health Care & Social Assistance (72 | 8.3%).
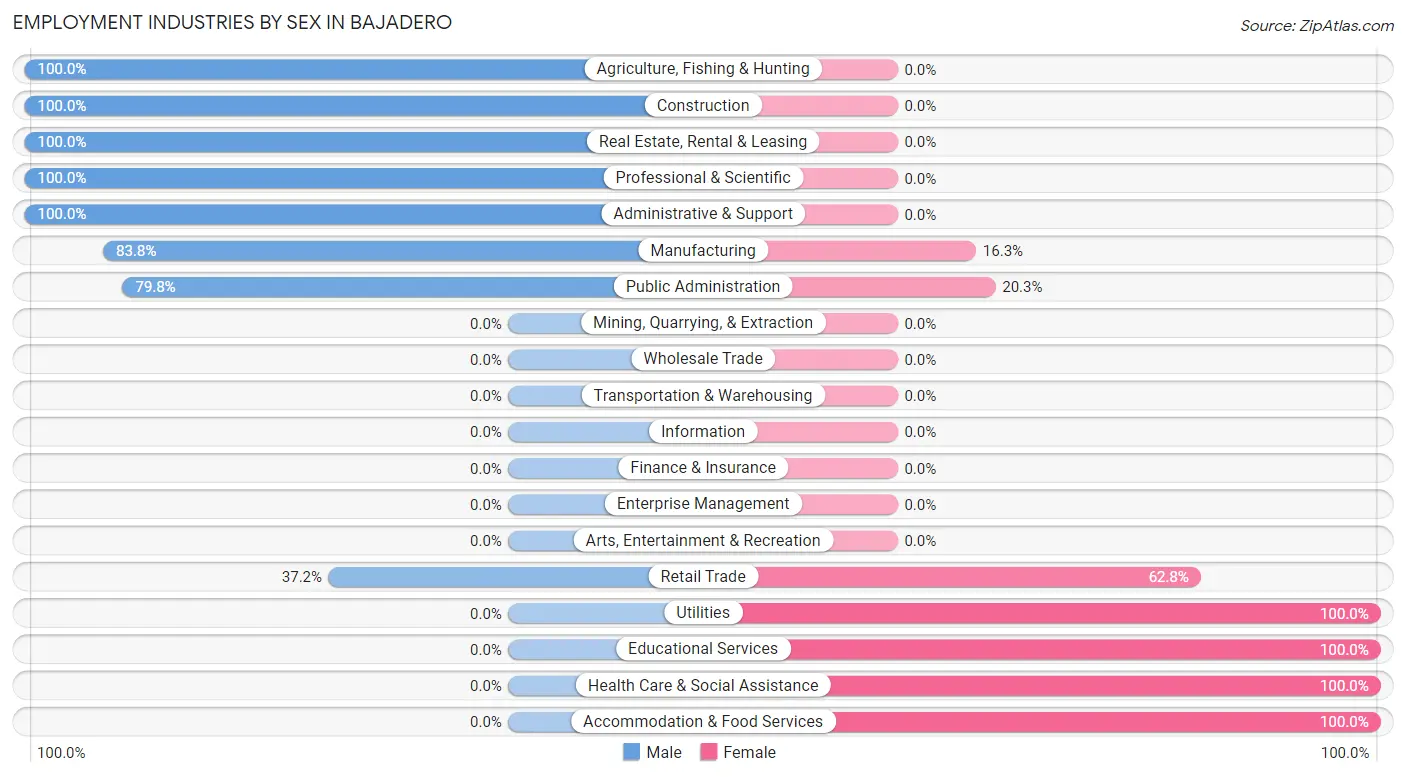
Employment Industries by Sex in Bajadero
The Bajadero industries that see more men than women are Agriculture, Fishing & Hunting (100.0%), Construction (100.0%), and Real Estate, Rental & Leasing (100.0%), whereas the industries that tend to have a higher number of women are Utilities (100.0%), Educational Services (100.0%), and Health Care & Social Assistance (100.0%).
| Industry | Male | Female |
| Agriculture, Fishing & Hunting | 14 (100.0%) | 0 (0.0%) |
| Mining, Quarrying, & Extraction | 0 (0.0%) | 0 (0.0%) |
| Construction | 34 (100.0%) | 0 (0.0%) |
| Manufacturing | 67 (83.8%) | 13 (16.3%) |
| Wholesale Trade | 0 (0.0%) | 0 (0.0%) |
| Retail Trade | 70 (37.2%) | 118 (62.8%) |
| Transportation & Warehousing | 0 (0.0%) | 0 (0.0%) |
| Utilities | 0 (0.0%) | 19 (100.0%) |
| Information | 0 (0.0%) | 0 (0.0%) |
| Finance & Insurance | 0 (0.0%) | 0 (0.0%) |
| Real Estate, Rental & Leasing | 15 (100.0%) | 0 (0.0%) |
| Professional & Scientific | 41 (100.0%) | 0 (0.0%) |
| Enterprise Management | 0 (0.0%) | 0 (0.0%) |
| Administrative & Support | 36 (100.0%) | 0 (0.0%) |
| Educational Services | 0 (0.0%) | 152 (100.0%) |
| Health Care & Social Assistance | 0 (0.0%) | 72 (100.0%) |
| Arts, Entertainment & Recreation | 0 (0.0%) | 0 (0.0%) |
| Accommodation & Food Services | 0 (0.0%) | 34 (100.0%) |
| Public Administration | 130 (79.7%) | 33 (20.3%) |
| Total | 425 (49.1%) | 441 (50.9%) |
Education in Bajadero
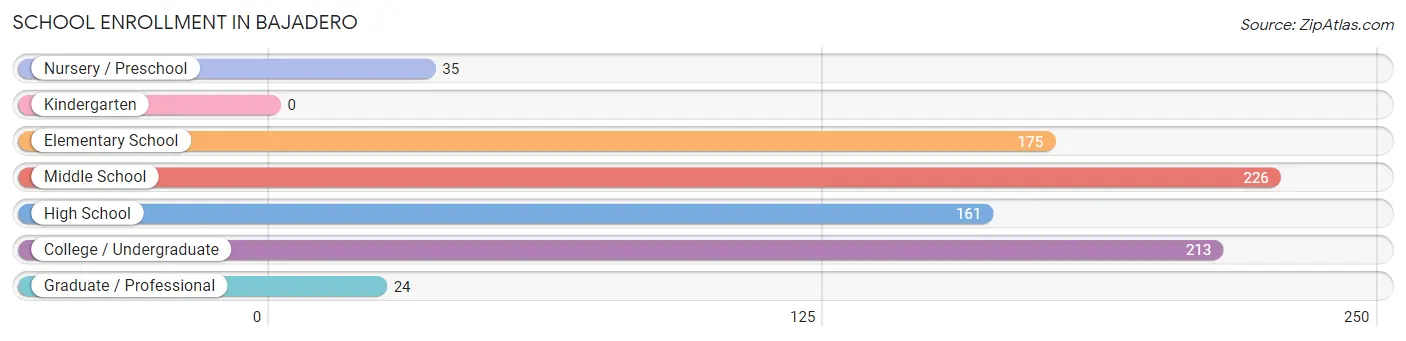
School Enrollment in Bajadero
The most common levels of schooling among the 834 students in Bajadero are middle school (226 | 27.1%), college / undergraduate (213 | 25.5%), and elementary school (175 | 21.0%).
| School Level | # Students | % Students |
| Nursery / Preschool | 35 | 4.2% |
| Kindergarten | 0 | 0.0% |
| Elementary School | 175 | 21.0% |
| Middle School | 226 | 27.1% |
| High School | 161 | 19.3% |
| College / Undergraduate | 213 | 25.5% |
| Graduate / Professional | 24 | 2.9% |
| Total | 834 | 100.0% |
School Enrollment by Age by Funding Source in Bajadero
Out of a total of 834 students who are enrolled in schools in Bajadero, 284 (34.1%) attend a private institution, while the remaining 550 (65.9%) are enrolled in public schools. The age group of 18 to 19 year olds has the highest likelihood of being enrolled in private schools, with 124 (100.0% in the age bracket) enrolled. Conversely, the age group of 3 to 4 year olds has the lowest likelihood of being enrolled in a private school, with 18 (100.0% in the age bracket) attending a public institution.
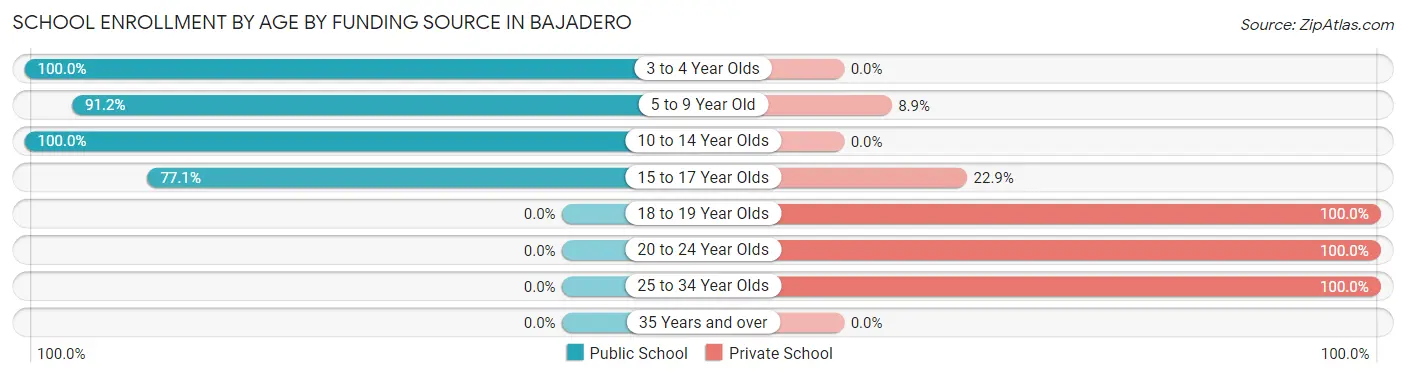
| Age Bracket | Public School | Private School |
| 3 to 4 Year Olds | 18 (100.0%) | 0 (0.0%) |
| 5 to 9 Year Old | 175 (91.1%) | 17 (8.8%) |
| 10 to 14 Year Olds | 256 (100.0%) | 0 (0.0%) |
| 15 to 17 Year Olds | 101 (77.1%) | 30 (22.9%) |
| 18 to 19 Year Olds | 0 (0.0%) | 124 (100.0%) |
| 20 to 24 Year Olds | 0 (0.0%) | 60 (100.0%) |
| 25 to 34 Year Olds | 0 (0.0%) | 53 (100.0%) |
| 35 Years and over | 0 (0.0%) | 0 (0.0%) |
| Total | 550 (65.9%) | 284 (34.1%) |
Educational Attainment by Field of Study in Bajadero
Education (275 | 48.3%), business (135 | 23.7%), social sciences (55 | 9.7%), psychology (35 | 6.1%), and bio, nature & agricultural (33 | 5.8%) are the most common fields of study among 569 individuals in Bajadero who have obtained a bachelor's degree or higher.
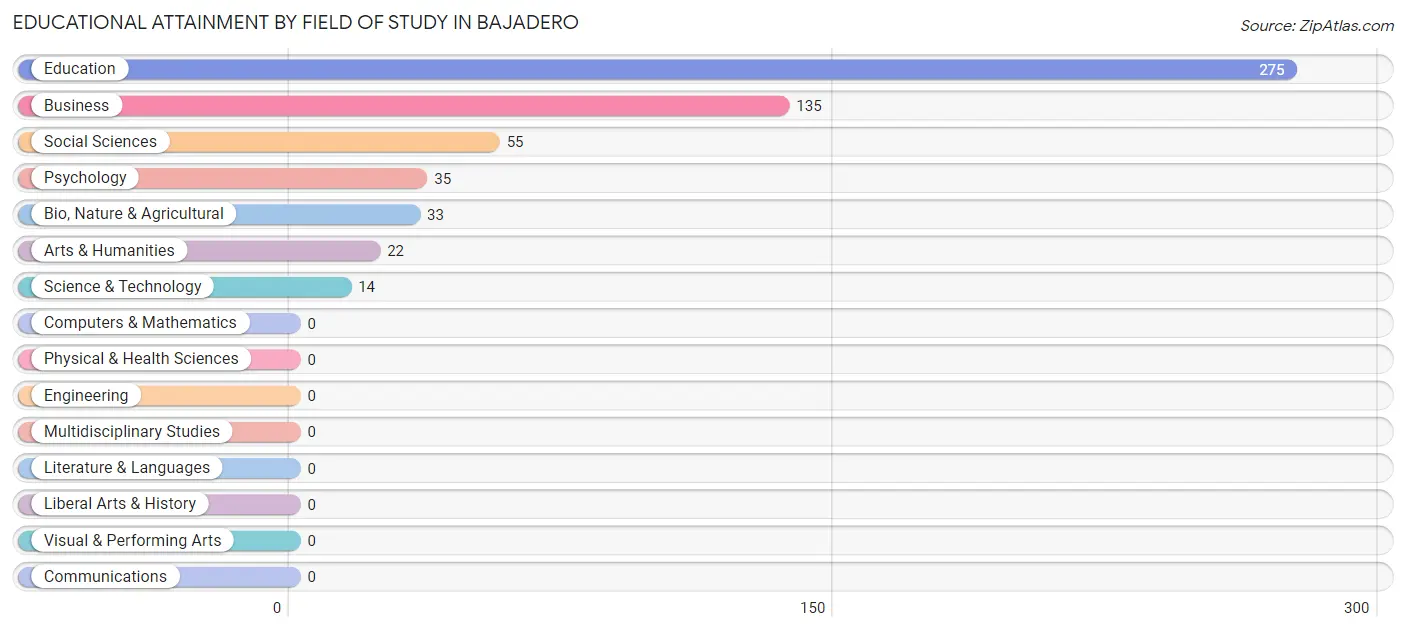
| Field of Study | # Graduates | % Graduates |
| Computers & Mathematics | 0 | 0.0% |
| Bio, Nature & Agricultural | 33 | 5.8% |
| Physical & Health Sciences | 0 | 0.0% |
| Psychology | 35 | 6.1% |
| Social Sciences | 55 | 9.7% |
| Engineering | 0 | 0.0% |
| Multidisciplinary Studies | 0 | 0.0% |
| Science & Technology | 14 | 2.5% |
| Business | 135 | 23.7% |
| Education | 275 | 48.3% |
| Literature & Languages | 0 | 0.0% |
| Liberal Arts & History | 0 | 0.0% |
| Visual & Performing Arts | 0 | 0.0% |
| Communications | 0 | 0.0% |
| Arts & Humanities | 22 | 3.9% |
| Total | 569 | 100.0% |
Transportation & Commute in Bajadero
Vehicle Availability by Sex in Bajadero
The most prevalent vehicle ownership categories in Bajadero are males with 2 vehicles (215, accounting for 52.7%) and females with 2 vehicles (234, making up 54.8%).
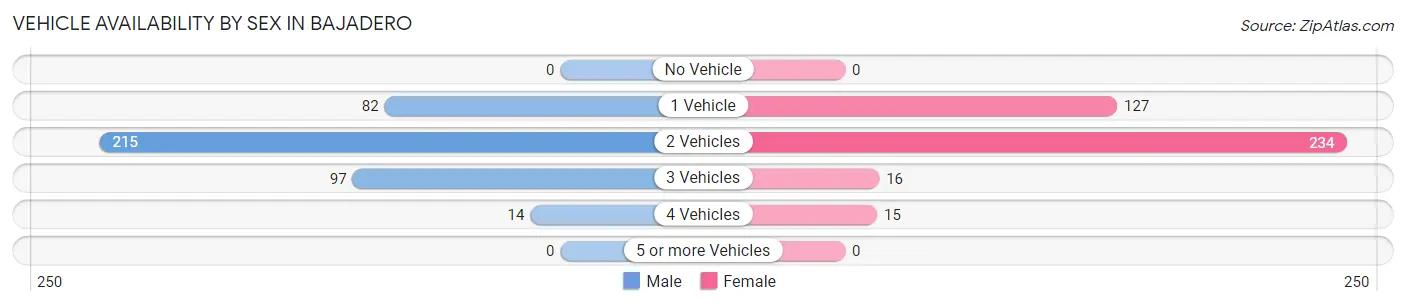
| Vehicles Available | Male | Female |
| No Vehicle | 0 (0.0%) | 0 (0.0%) |
| 1 Vehicle | 82 (20.1%) | 127 (32.4%) |
| 2 Vehicles | 215 (52.7%) | 234 (59.7%) |
| 3 Vehicles | 97 (23.8%) | 16 (4.1%) |
| 4 Vehicles | 14 (3.4%) | 15 (3.8%) |
| 5 or more Vehicles | 0 (0.0%) | 0 (0.0%) |
| Total | 408 (100.0%) | 392 (100.0%) |
Commute Time in Bajadero
The most frequently occuring commute durations in Bajadero are 15 to 19 minutes (218 commuters, 27.8%), 20 to 24 minutes (202 commuters, 25.8%), and 10 to 14 minutes (97 commuters, 12.4%).
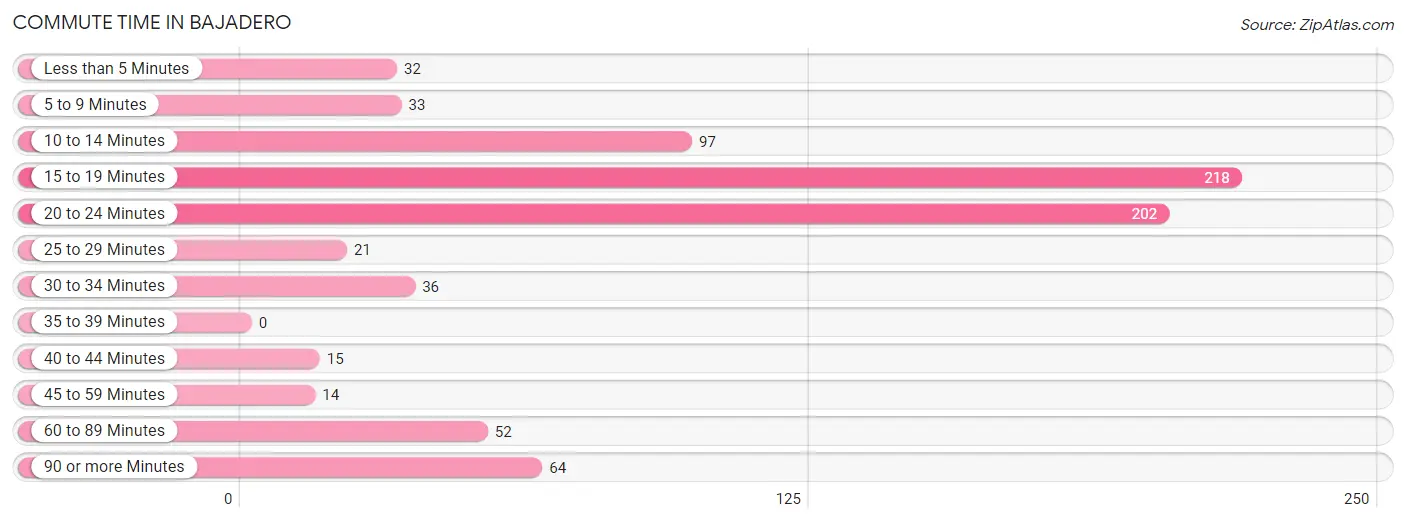
| Commute Time | # Commuters | % Commuters |
| Less than 5 Minutes | 32 | 4.1% |
| 5 to 9 Minutes | 33 | 4.2% |
| 10 to 14 Minutes | 97 | 12.4% |
| 15 to 19 Minutes | 218 | 27.8% |
| 20 to 24 Minutes | 202 | 25.8% |
| 25 to 29 Minutes | 21 | 2.7% |
| 30 to 34 Minutes | 36 | 4.6% |
| 35 to 39 Minutes | 0 | 0.0% |
| 40 to 44 Minutes | 15 | 1.9% |
| 45 to 59 Minutes | 14 | 1.8% |
| 60 to 89 Minutes | 52 | 6.6% |
| 90 or more Minutes | 64 | 8.2% |
Commute Time by Sex in Bajadero
The most common commute times in Bajadero are 20 to 24 minutes (103 commuters, 25.3%) for males and 15 to 19 minutes (134 commuters, 35.6%) for females.
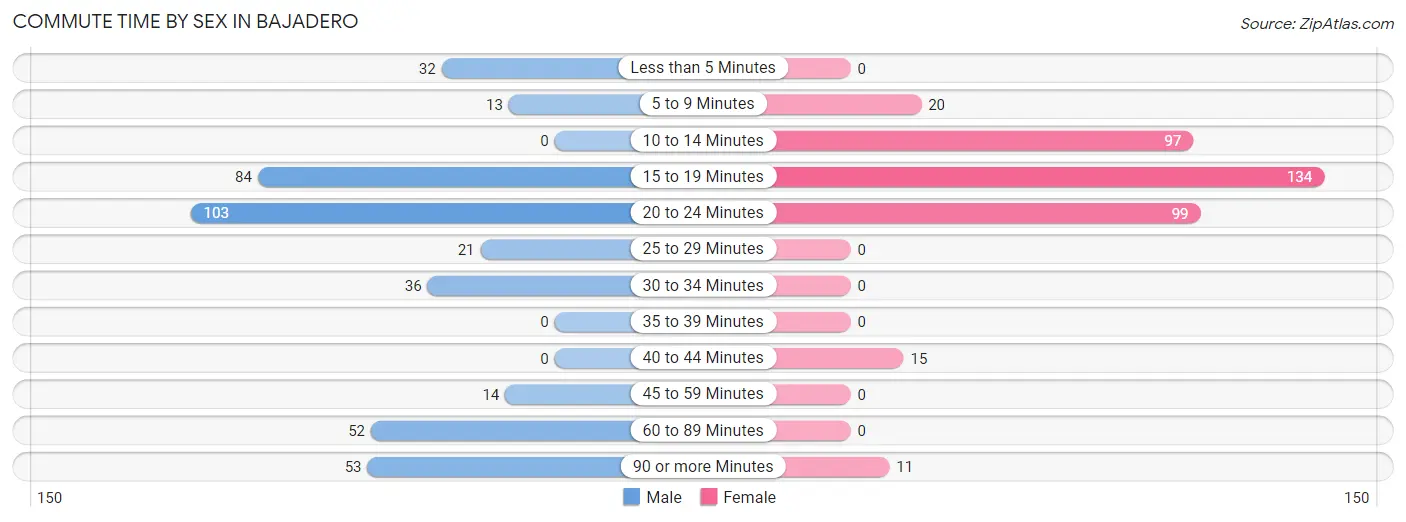
| Commute Time | Male | Female |
| Less than 5 Minutes | 32 (7.8%) | 0 (0.0%) |
| 5 to 9 Minutes | 13 (3.2%) | 20 (5.3%) |
| 10 to 14 Minutes | 0 (0.0%) | 97 (25.8%) |
| 15 to 19 Minutes | 84 (20.6%) | 134 (35.6%) |
| 20 to 24 Minutes | 103 (25.3%) | 99 (26.3%) |
| 25 to 29 Minutes | 21 (5.1%) | 0 (0.0%) |
| 30 to 34 Minutes | 36 (8.8%) | 0 (0.0%) |
| 35 to 39 Minutes | 0 (0.0%) | 0 (0.0%) |
| 40 to 44 Minutes | 0 (0.0%) | 15 (4.0%) |
| 45 to 59 Minutes | 14 (3.4%) | 0 (0.0%) |
| 60 to 89 Minutes | 52 (12.8%) | 0 (0.0%) |
| 90 or more Minutes | 53 (13.0%) | 11 (2.9%) |
Time of Departure to Work by Sex in Bajadero
The most frequent times of departure to work in Bajadero are 7:30 AM to 7:59 AM (78, 19.1%) for males and 7:00 AM to 7:29 AM (117, 31.1%) for females.
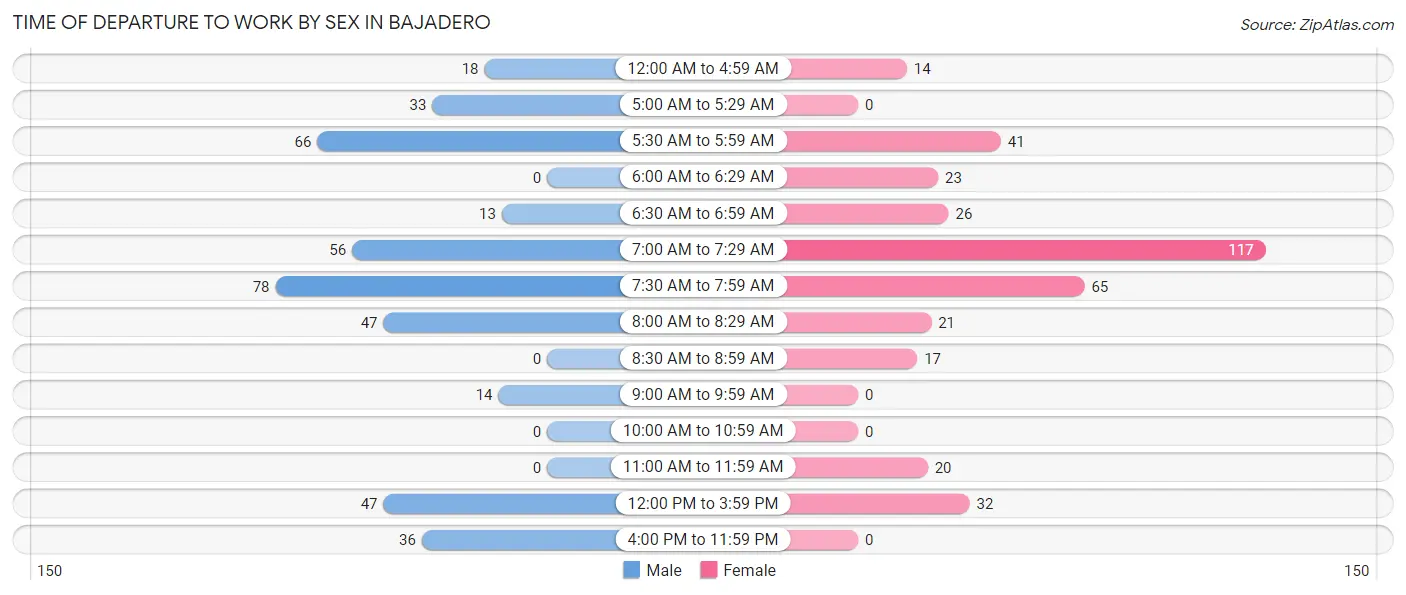
| Time of Departure | Male | Female |
| 12:00 AM to 4:59 AM | 18 (4.4%) | 14 (3.7%) |
| 5:00 AM to 5:29 AM | 33 (8.1%) | 0 (0.0%) |
| 5:30 AM to 5:59 AM | 66 (16.2%) | 41 (10.9%) |
| 6:00 AM to 6:29 AM | 0 (0.0%) | 23 (6.1%) |
| 6:30 AM to 6:59 AM | 13 (3.2%) | 26 (6.9%) |
| 7:00 AM to 7:29 AM | 56 (13.7%) | 117 (31.1%) |
| 7:30 AM to 7:59 AM | 78 (19.1%) | 65 (17.3%) |
| 8:00 AM to 8:29 AM | 47 (11.5%) | 21 (5.6%) |
| 8:30 AM to 8:59 AM | 0 (0.0%) | 17 (4.5%) |
| 9:00 AM to 9:59 AM | 14 (3.4%) | 0 (0.0%) |
| 10:00 AM to 10:59 AM | 0 (0.0%) | 0 (0.0%) |
| 11:00 AM to 11:59 AM | 0 (0.0%) | 20 (5.3%) |
| 12:00 PM to 3:59 PM | 47 (11.5%) | 32 (8.5%) |
| 4:00 PM to 11:59 PM | 36 (8.8%) | 0 (0.0%) |
| Total | 408 (100.0%) | 376 (100.0%) |
Housing Occupancy in Bajadero
Occupancy by Ownership in Bajadero
Of the total 1,191 dwellings in Bajadero, owner-occupied units account for 752 (63.1%), while renter-occupied units make up 439 (36.9%).
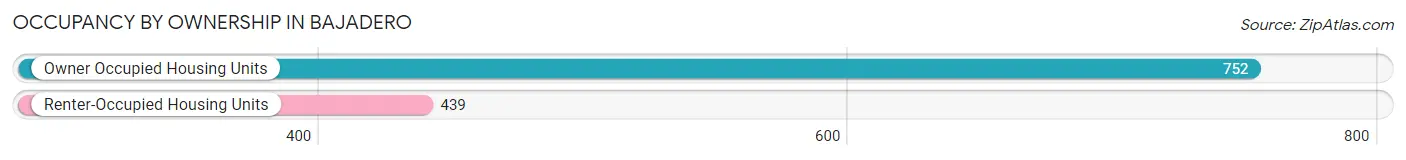
| Occupancy | # Housing Units | % Housing Units |
| Owner Occupied Housing Units | 752 | 63.1% |
| Renter-Occupied Housing Units | 439 | 36.9% |
| Total Occupied Housing Units | 1,191 | 100.0% |
Occupancy by Household Size in Bajadero
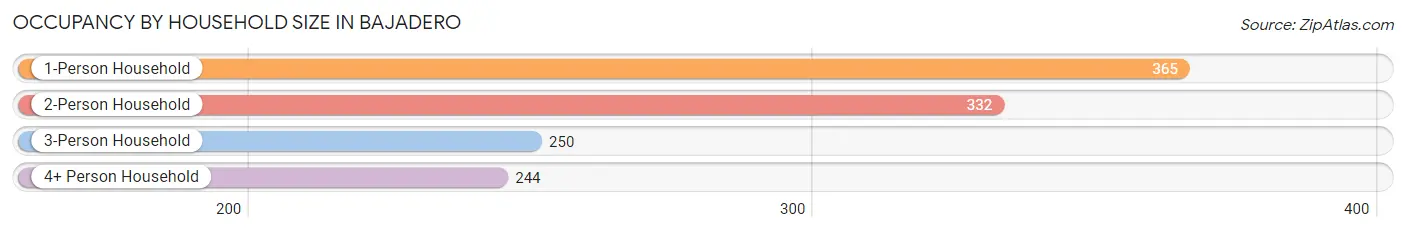
| Household Size | # Housing Units | % Housing Units |
| 1-Person Household | 365 | 30.6% |
| 2-Person Household | 332 | 27.9% |
| 3-Person Household | 250 | 21.0% |
| 4+ Person Household | 244 | 20.5% |
| Total Housing Units | 1,191 | 100.0% |
Occupancy by Ownership by Household Size in Bajadero
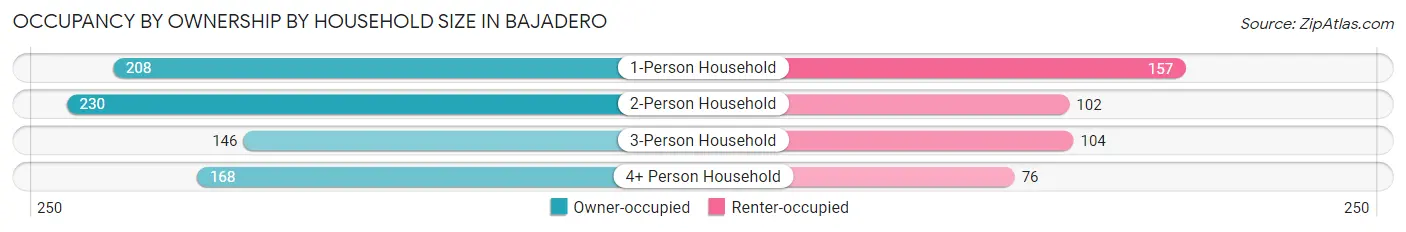
| Household Size | Owner-occupied | Renter-occupied |
| 1-Person Household | 208 (57.0%) | 157 (43.0%) |
| 2-Person Household | 230 (69.3%) | 102 (30.7%) |
| 3-Person Household | 146 (58.4%) | 104 (41.6%) |
| 4+ Person Household | 168 (68.9%) | 76 (31.1%) |
| Total Housing Units | 752 (63.1%) | 439 (36.9%) |
Occupancy by Educational Attainment in Bajadero
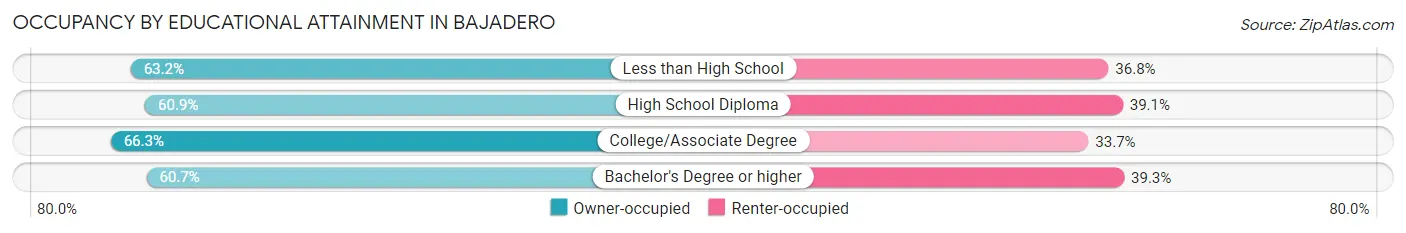
| Household Size | Owner-occupied | Renter-occupied |
| Less than High School | 144 (63.2%) | 84 (36.8%) |
| High School Diploma | 193 (60.9%) | 124 (39.1%) |
| College/Associate Degree | 270 (66.3%) | 137 (33.7%) |
| Bachelor's Degree or higher | 145 (60.7%) | 94 (39.3%) |
Occupancy by Age of Householder in Bajadero
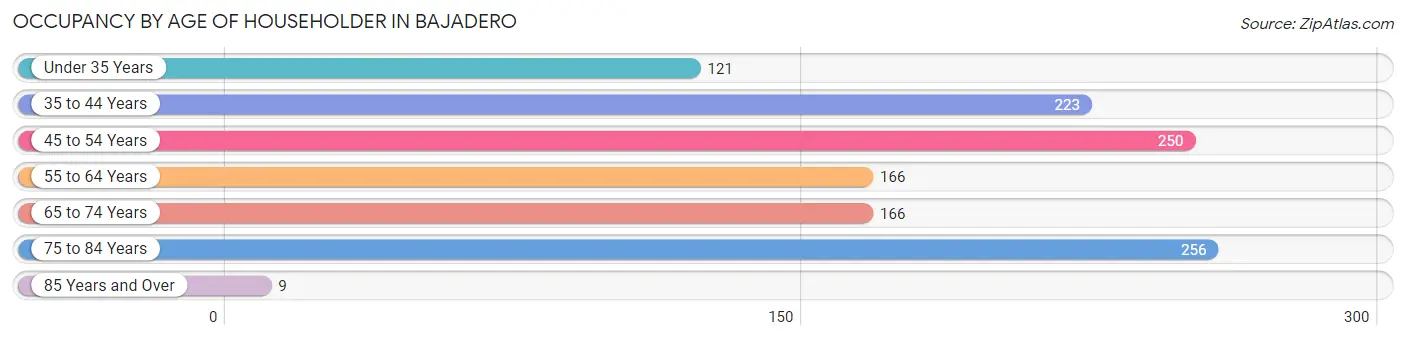
| Age Bracket | # Households | % Households |
| Under 35 Years | 121 | 10.2% |
| 35 to 44 Years | 223 | 18.7% |
| 45 to 54 Years | 250 | 21.0% |
| 55 to 64 Years | 166 | 13.9% |
| 65 to 74 Years | 166 | 13.9% |
| 75 to 84 Years | 256 | 21.5% |
| 85 Years and Over | 9 | 0.8% |
| Total | 1,191 | 100.0% |
Housing Finances in Bajadero
Median Income by Occupancy in Bajadero
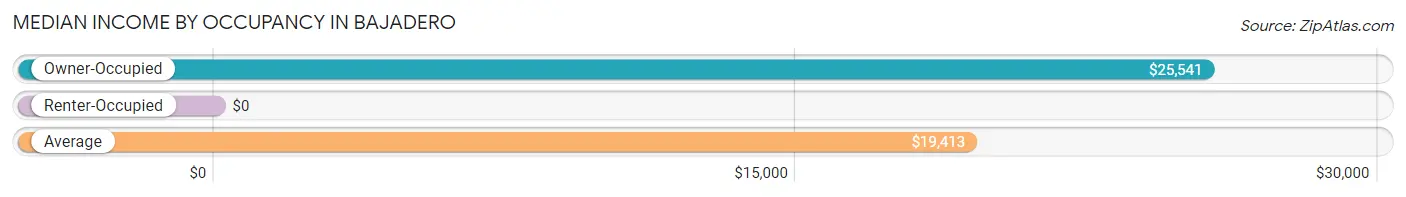
| Occupancy Type | # Households | Median Income |
| Owner-Occupied | 752 (63.1%) | $25,541 |
| Renter-Occupied | 439 (36.9%) | $0 |
| Average | 1,191 (100.0%) | $19,413 |
Occupancy by Householder Income Bracket in Bajadero
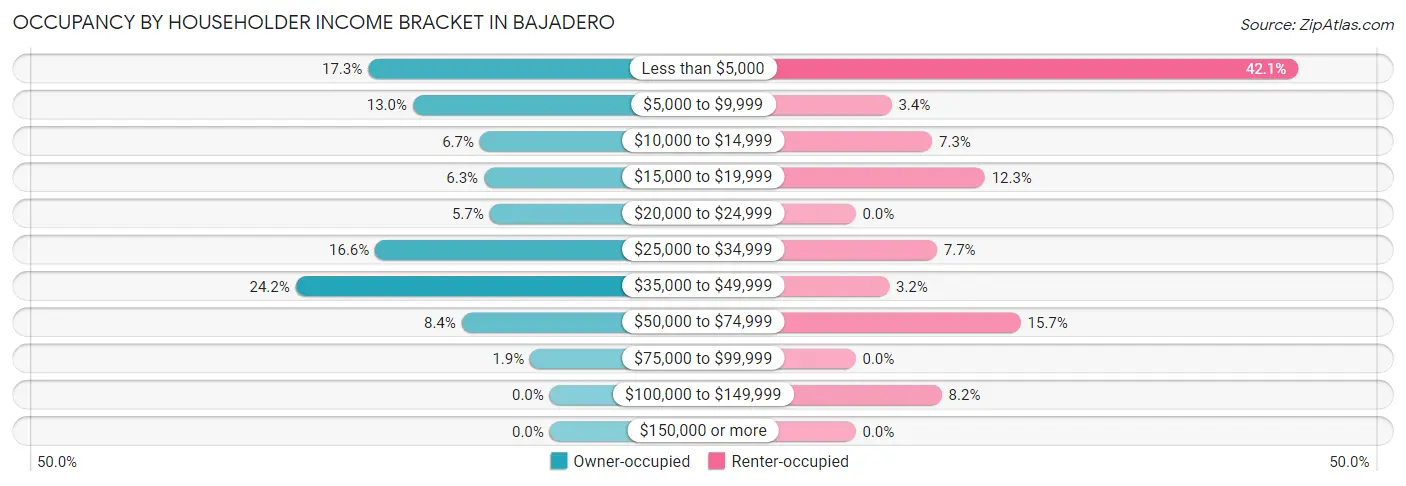
| Income Bracket | Owner-occupied | Renter-occupied |
| Less than $5,000 | 130 (17.3%) | 185 (42.1%) |
| $5,000 to $9,999 | 98 (13.0%) | 15 (3.4%) |
| $10,000 to $14,999 | 50 (6.7%) | 32 (7.3%) |
| $15,000 to $19,999 | 47 (6.2%) | 54 (12.3%) |
| $20,000 to $24,999 | 43 (5.7%) | 0 (0.0%) |
| $25,000 to $34,999 | 125 (16.6%) | 34 (7.7%) |
| $35,000 to $49,999 | 182 (24.2%) | 14 (3.2%) |
| $50,000 to $74,999 | 63 (8.4%) | 69 (15.7%) |
| $75,000 to $99,999 | 14 (1.9%) | 0 (0.0%) |
| $100,000 to $149,999 | 0 (0.0%) | 36 (8.2%) |
| $150,000 or more | 0 (0.0%) | 0 (0.0%) |
| Total | 752 (100.0%) | 439 (100.0%) |
Monthly Housing Cost Tiers in Bajadero
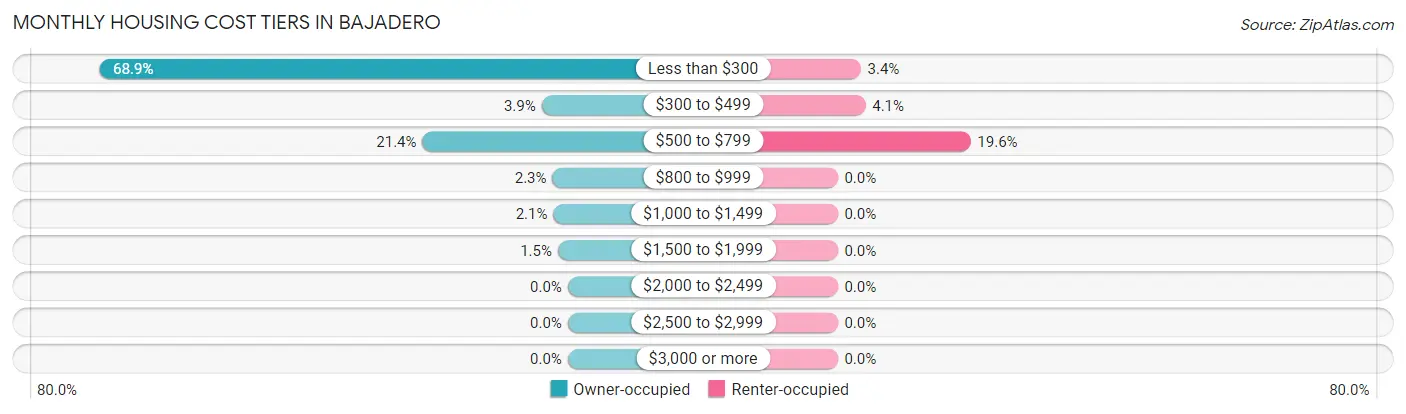
| Monthly Cost | Owner-occupied | Renter-occupied |
| Less than $300 | 518 (68.9%) | 15 (3.4%) |
| $300 to $499 | 29 (3.9%) | 18 (4.1%) |
| $500 to $799 | 161 (21.4%) | 86 (19.6%) |
| $800 to $999 | 17 (2.3%) | 0 (0.0%) |
| $1,000 to $1,499 | 16 (2.1%) | 0 (0.0%) |
| $1,500 to $1,999 | 11 (1.5%) | 0 (0.0%) |
| $2,000 to $2,499 | 0 (0.0%) | 0 (0.0%) |
| $2,500 to $2,999 | 0 (0.0%) | 0 (0.0%) |
| $3,000 or more | 0 (0.0%) | 0 (0.0%) |
| Total | 752 (100.0%) | 439 (100.0%) |
Physical Housing Characteristics in Bajadero
Housing Structures in Bajadero
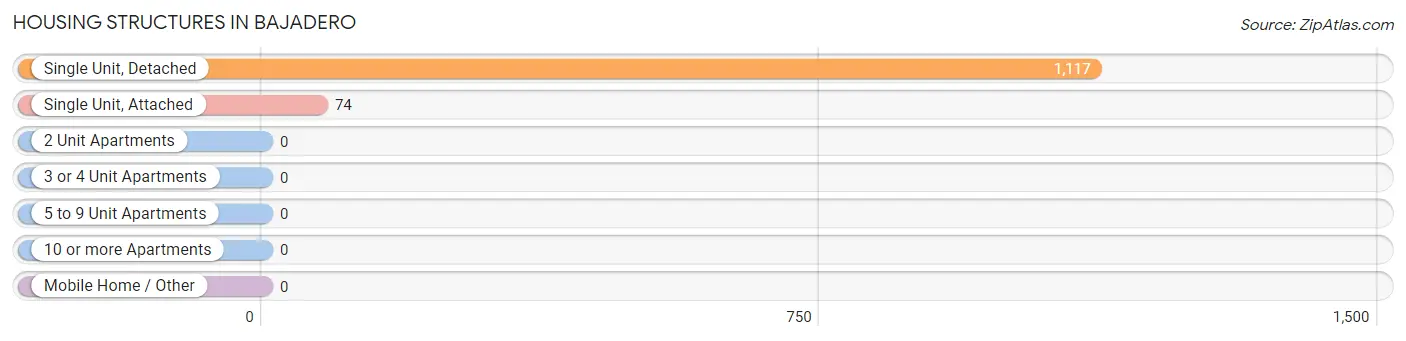
| Structure Type | # Housing Units | % Housing Units |
| Single Unit, Detached | 1,117 | 93.8% |
| Single Unit, Attached | 74 | 6.2% |
| 2 Unit Apartments | 0 | 0.0% |
| 3 or 4 Unit Apartments | 0 | 0.0% |
| 5 to 9 Unit Apartments | 0 | 0.0% |
| 10 or more Apartments | 0 | 0.0% |
| Mobile Home / Other | 0 | 0.0% |
| Total | 1,191 | 100.0% |
Housing Structures by Occupancy in Bajadero
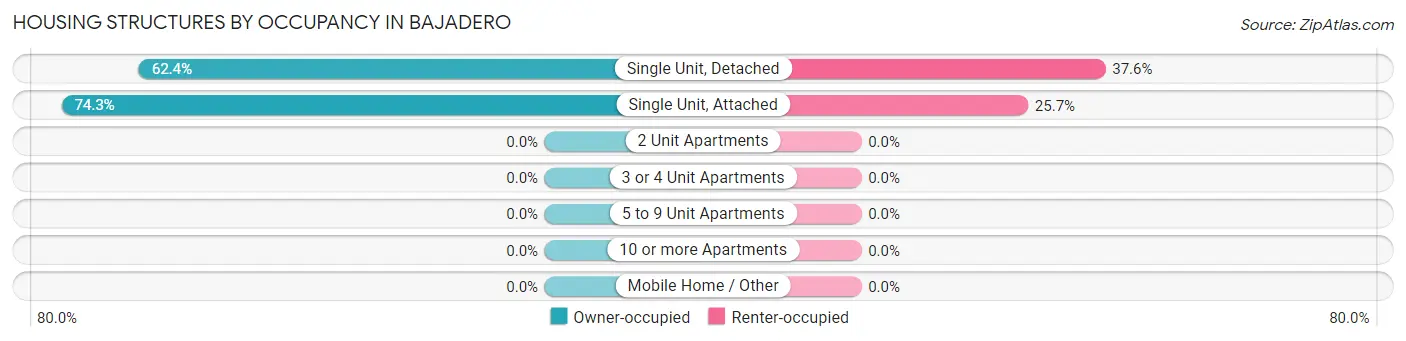
| Structure Type | Owner-occupied | Renter-occupied |
| Single Unit, Detached | 697 (62.4%) | 420 (37.6%) |
| Single Unit, Attached | 55 (74.3%) | 19 (25.7%) |
| 2 Unit Apartments | 0 (0.0%) | 0 (0.0%) |
| 3 or 4 Unit Apartments | 0 (0.0%) | 0 (0.0%) |
| 5 to 9 Unit Apartments | 0 (0.0%) | 0 (0.0%) |
| 10 or more Apartments | 0 (0.0%) | 0 (0.0%) |
| Mobile Home / Other | 0 (0.0%) | 0 (0.0%) |
| Total | 752 (63.1%) | 439 (36.9%) |
Housing Structures by Number of Rooms in Bajadero
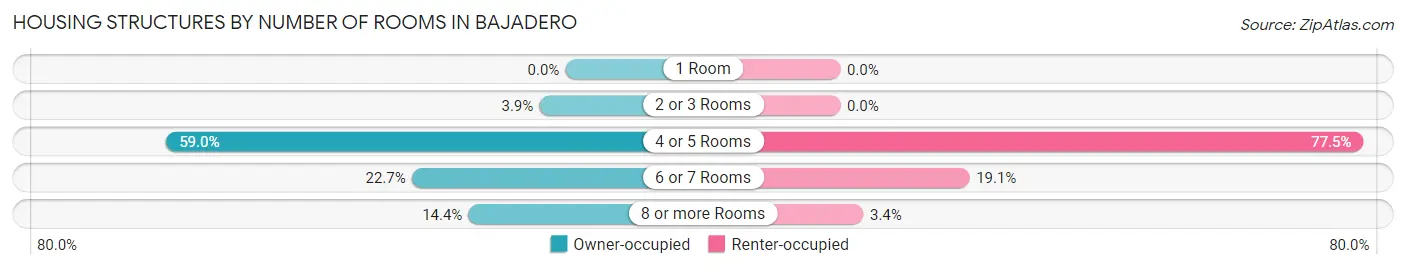
| Number of Rooms | Owner-occupied | Renter-occupied |
| 1 Room | 0 (0.0%) | 0 (0.0%) |
| 2 or 3 Rooms | 29 (3.9%) | 0 (0.0%) |
| 4 or 5 Rooms | 444 (59.0%) | 340 (77.4%) |
| 6 or 7 Rooms | 171 (22.7%) | 84 (19.1%) |
| 8 or more Rooms | 108 (14.4%) | 15 (3.4%) |
| Total | 752 (100.0%) | 439 (100.0%) |
Housing Structure by Heating Type in Bajadero
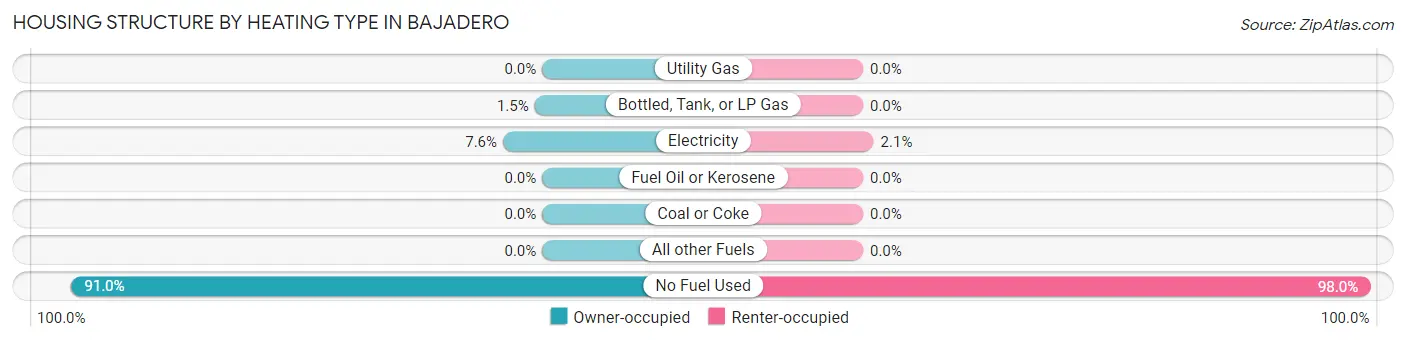
| Heating Type | Owner-occupied | Renter-occupied |
| Utility Gas | 0 (0.0%) | 0 (0.0%) |
| Bottled, Tank, or LP Gas | 11 (1.5%) | 0 (0.0%) |
| Electricity | 57 (7.6%) | 9 (2.1%) |
| Fuel Oil or Kerosene | 0 (0.0%) | 0 (0.0%) |
| Coal or Coke | 0 (0.0%) | 0 (0.0%) |
| All other Fuels | 0 (0.0%) | 0 (0.0%) |
| No Fuel Used | 684 (91.0%) | 430 (98.0%) |
| Total | 752 (100.0%) | 439 (100.0%) |
Household Vehicle Usage in Bajadero
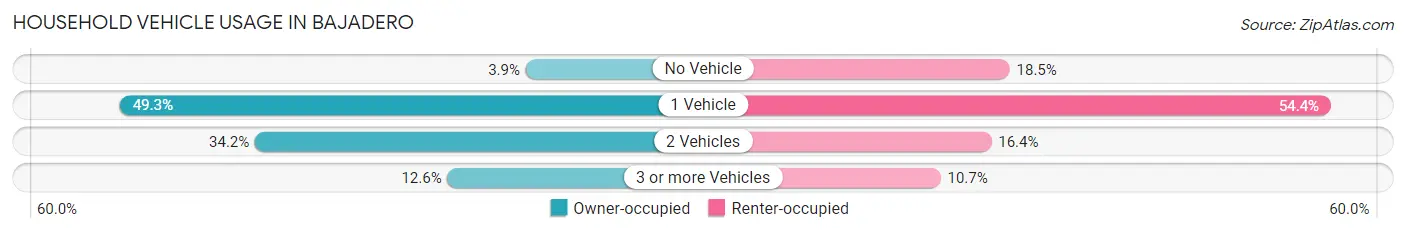
| Vehicles per Household | Owner-occupied | Renter-occupied |
| No Vehicle | 29 (3.9%) | 81 (18.4%) |
| 1 Vehicle | 371 (49.3%) | 239 (54.4%) |
| 2 Vehicles | 257 (34.2%) | 72 (16.4%) |
| 3 or more Vehicles | 95 (12.6%) | 47 (10.7%) |
| Total | 752 (100.0%) | 439 (100.0%) |
Real Estate & Mortgages in Bajadero
Real Estate and Mortgage Overview in Bajadero
| Characteristic | Without Mortgage | With Mortgage |
| Housing Units | 569 | 183 |
| Median Property Value | $102,300 | $85,800 |
| Median Household Income | $22,443 | $0 |
| Monthly Housing Costs | $182 | $0 |
| Real Estate Taxes | - | - |
Property Value by Mortgage Status in Bajadero
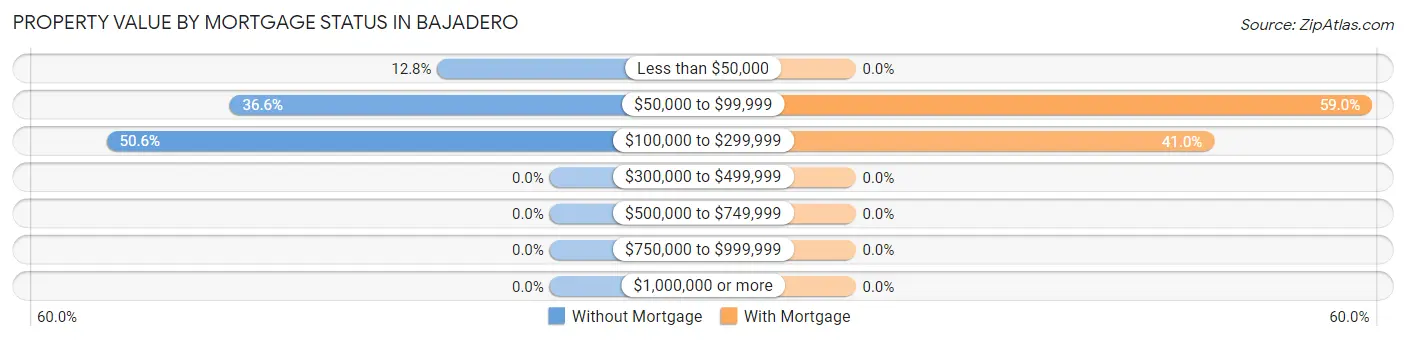
| Property Value | Without Mortgage | With Mortgage |
| Less than $50,000 | 73 (12.8%) | 0 (0.0%) |
| $50,000 to $99,999 | 208 (36.6%) | 108 (59.0%) |
| $100,000 to $299,999 | 288 (50.6%) | 75 (41.0%) |
| $300,000 to $499,999 | 0 (0.0%) | 0 (0.0%) |
| $500,000 to $749,999 | 0 (0.0%) | 0 (0.0%) |
| $750,000 to $999,999 | 0 (0.0%) | 0 (0.0%) |
| $1,000,000 or more | 0 (0.0%) | 0 (0.0%) |
| Total | 569 (100.0%) | 183 (100.0%) |
Household Income by Mortgage Status in Bajadero
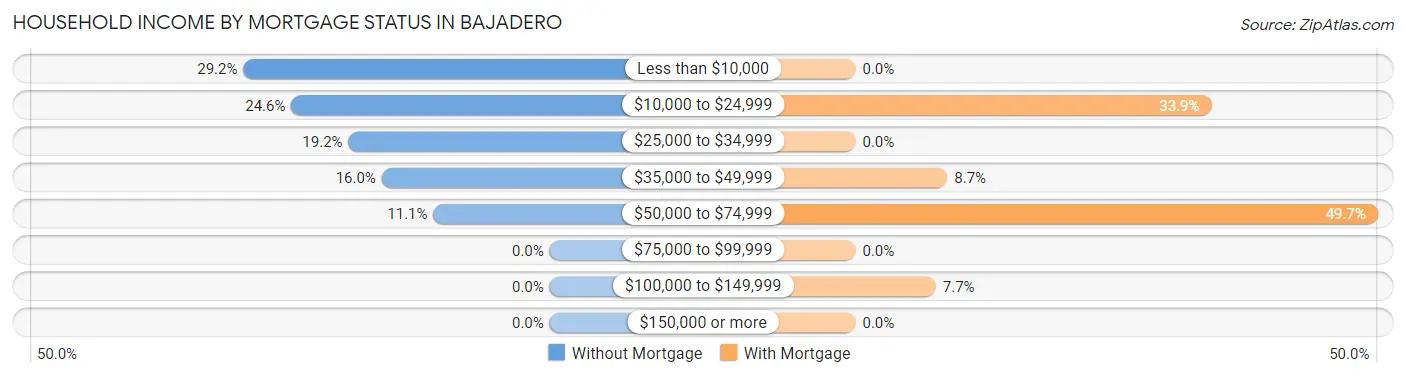
| Household Income | Without Mortgage | With Mortgage |
| Less than $10,000 | 166 (29.2%) | 0 (0.0%) |
| $10,000 to $24,999 | 140 (24.6%) | 62 (33.9%) |
| $25,000 to $34,999 | 109 (19.2%) | 0 (0.0%) |
| $35,000 to $49,999 | 91 (16.0%) | 16 (8.7%) |
| $50,000 to $74,999 | 63 (11.1%) | 91 (49.7%) |
| $75,000 to $99,999 | 0 (0.0%) | 0 (0.0%) |
| $100,000 to $149,999 | 0 (0.0%) | 14 (7.6%) |
| $150,000 or more | 0 (0.0%) | 0 (0.0%) |
| Total | 569 (100.0%) | 183 (100.0%) |
Property Value to Household Income Ratio in Bajadero
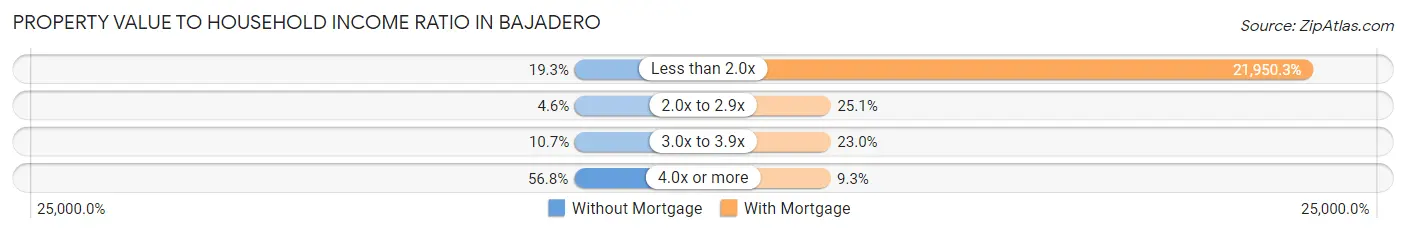
| Value-to-Income Ratio | Without Mortgage | With Mortgage |
| Less than 2.0x | 110 (19.3%) | 40,169 (21,950.3%) |
| 2.0x to 2.9x | 26 (4.6%) | 46 (25.1%) |
| 3.0x to 3.9x | 61 (10.7%) | 42 (23.0%) |
| 4.0x or more | 323 (56.8%) | 17 (9.3%) |
| Total | 569 (100.0%) | 183 (100.0%) |
Real Estate Taxes by Mortgage Status in Bajadero
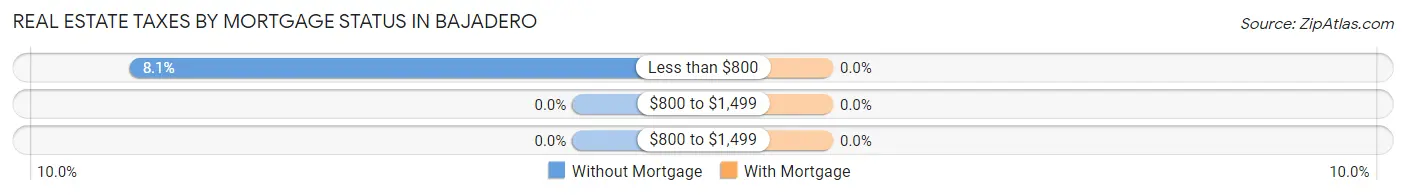
| Property Taxes | Without Mortgage | With Mortgage |
| Less than $800 | 46 (8.1%) | 0 (0.0%) |
| $800 to $1,499 | 0 (0.0%) | 0 (0.0%) |
| $800 to $1,499 | 0 (0.0%) | 0 (0.0%) |
| Total | 569 (100.0%) | 183 (100.0%) |
Health & Disability in Bajadero
Health Insurance Coverage by Age in Bajadero
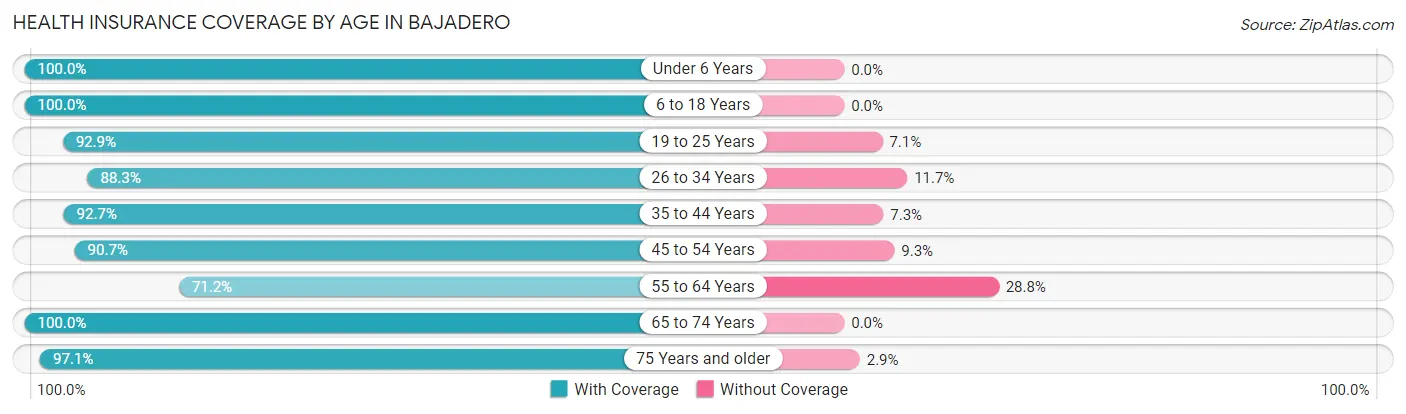
| Age Bracket | With Coverage | Without Coverage |
| Under 6 Years | 109 (100.0%) | 0 (0.0%) |
| 6 to 18 Years | 666 (100.0%) | 0 (0.0%) |
| 19 to 25 Years | 287 (92.9%) | 22 (7.1%) |
| 26 to 34 Years | 286 (88.3%) | 38 (11.7%) |
| 35 to 44 Years | 446 (92.7%) | 35 (7.3%) |
| 45 to 54 Years | 505 (90.7%) | 52 (9.3%) |
| 55 to 64 Years | 329 (71.2%) | 133 (28.8%) |
| 65 to 74 Years | 307 (100.0%) | 0 (0.0%) |
| 75 Years and older | 302 (97.1%) | 9 (2.9%) |
| Total | 3,237 (91.8%) | 289 (8.2%) |
Health Insurance Coverage by Citizenship Status in Bajadero
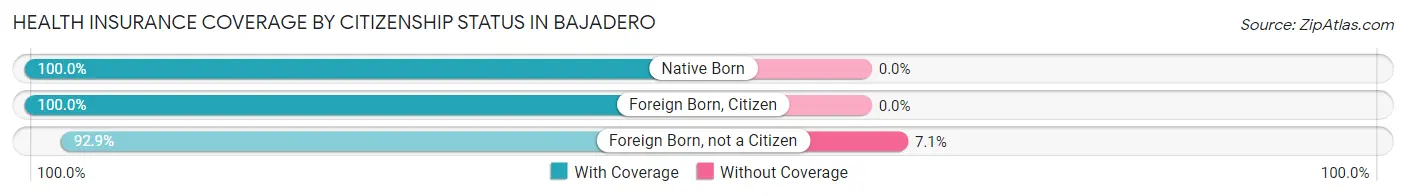
| Citizenship Status | With Coverage | Without Coverage |
| Native Born | 109 (100.0%) | 0 (0.0%) |
| Foreign Born, Citizen | 666 (100.0%) | 0 (0.0%) |
| Foreign Born, not a Citizen | 287 (92.9%) | 22 (7.1%) |
Health Insurance Coverage by Household Income in Bajadero
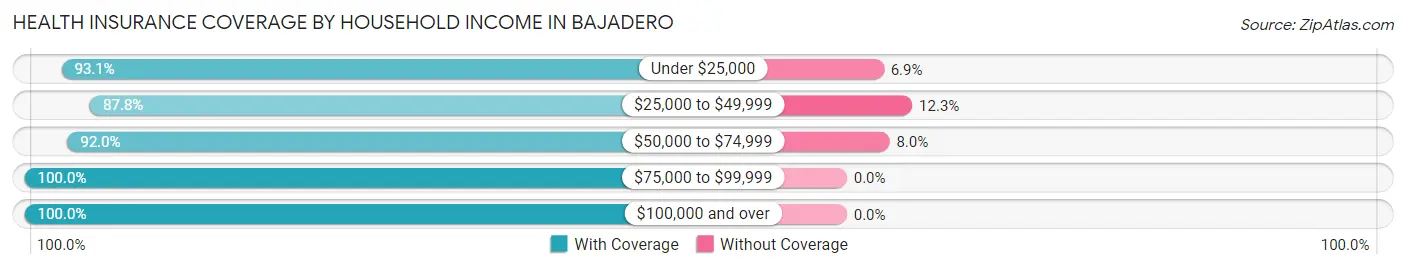
| Household Income | With Coverage | Without Coverage |
| Under $25,000 | 1,604 (93.1%) | 119 (6.9%) |
| $25,000 to $49,999 | 917 (87.7%) | 128 (12.2%) |
| $50,000 to $74,999 | 483 (92.0%) | 42 (8.0%) |
| $75,000 to $99,999 | 117 (100.0%) | 0 (0.0%) |
| $100,000 and over | 113 (100.0%) | 0 (0.0%) |
Public vs Private Health Insurance Coverage by Age in Bajadero
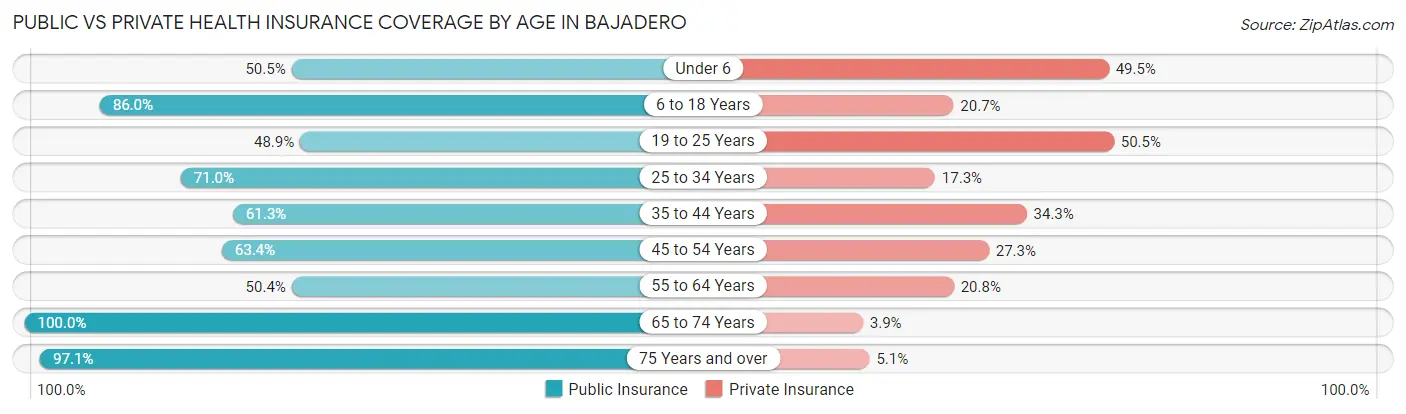
| Age Bracket | Public Insurance | Private Insurance |
| Under 6 | 55 (50.5%) | 54 (49.5%) |
| 6 to 18 Years | 573 (86.0%) | 138 (20.7%) |
| 19 to 25 Years | 151 (48.9%) | 156 (50.5%) |
| 25 to 34 Years | 230 (71.0%) | 56 (17.3%) |
| 35 to 44 Years | 295 (61.3%) | 165 (34.3%) |
| 45 to 54 Years | 353 (63.4%) | 152 (27.3%) |
| 55 to 64 Years | 233 (50.4%) | 96 (20.8%) |
| 65 to 74 Years | 307 (100.0%) | 12 (3.9%) |
| 75 Years and over | 302 (97.1%) | 16 (5.1%) |
| Total | 2,499 (70.9%) | 845 (24.0%) |
Disability Status by Sex by Age in Bajadero
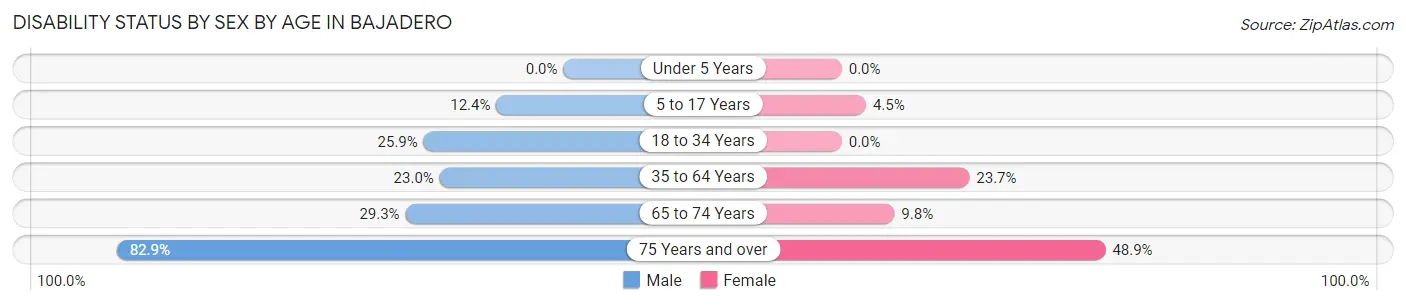
| Age Bracket | Male | Female |
| Under 5 Years | 0 (0.0%) | 0 (0.0%) |
| 5 to 17 Years | 27 (12.4%) | 17 (4.5%) |
| 18 to 34 Years | 110 (25.9%) | 0 (0.0%) |
| 35 to 64 Years | 135 (23.0%) | 216 (23.7%) |
| 65 to 74 Years | 51 (29.3%) | 13 (9.8%) |
| 75 Years and over | 63 (82.9%) | 115 (48.9%) |
Disability Class by Sex by Age in Bajadero
Disability Class: Hearing Difficulty
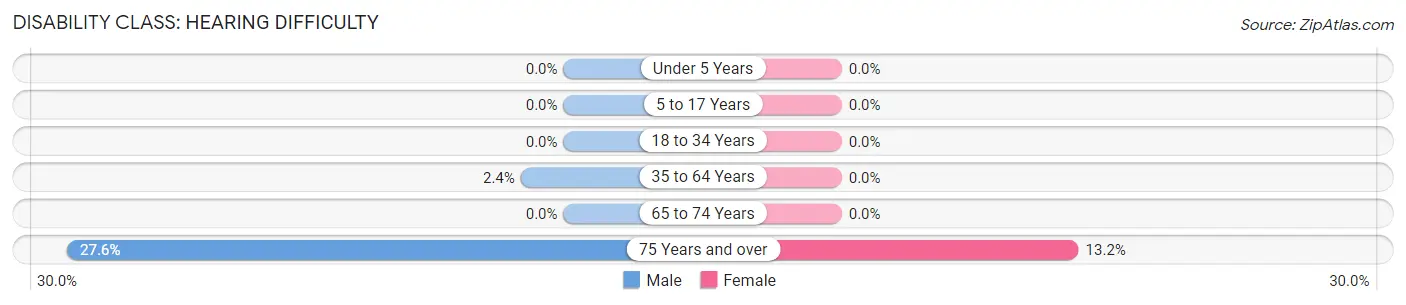
| Age Bracket | Male | Female |
| Under 5 Years | 0 (0.0%) | 0 (0.0%) |
| 5 to 17 Years | 0 (0.0%) | 0 (0.0%) |
| 18 to 34 Years | 0 (0.0%) | 0 (0.0%) |
| 35 to 64 Years | 14 (2.4%) | 0 (0.0%) |
| 65 to 74 Years | 0 (0.0%) | 0 (0.0%) |
| 75 Years and over | 21 (27.6%) | 31 (13.2%) |
Disability Class: Vision Difficulty
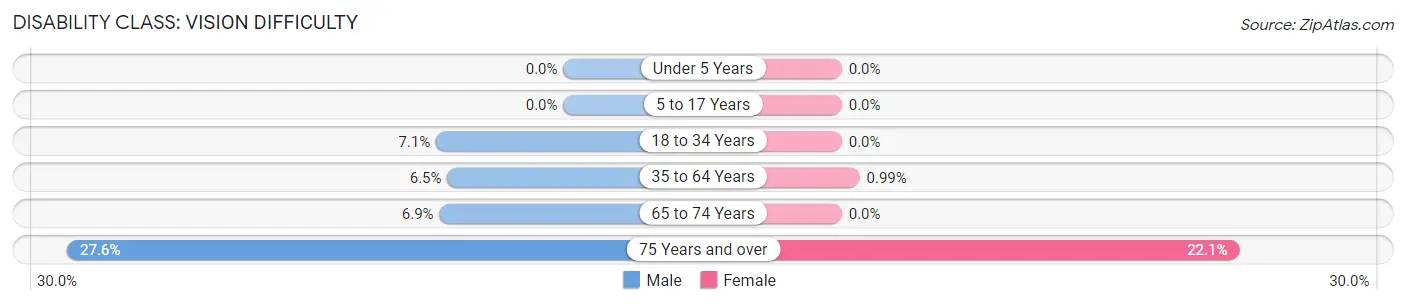
| Age Bracket | Male | Female |
| Under 5 Years | 0 (0.0%) | 0 (0.0%) |
| 5 to 17 Years | 0 (0.0%) | 0 (0.0%) |
| 18 to 34 Years | 30 (7.1%) | 0 (0.0%) |
| 35 to 64 Years | 38 (6.5%) | 9 (1.0%) |
| 65 to 74 Years | 12 (6.9%) | 0 (0.0%) |
| 75 Years and over | 21 (27.6%) | 52 (22.1%) |
Disability Class: Cognitive Difficulty
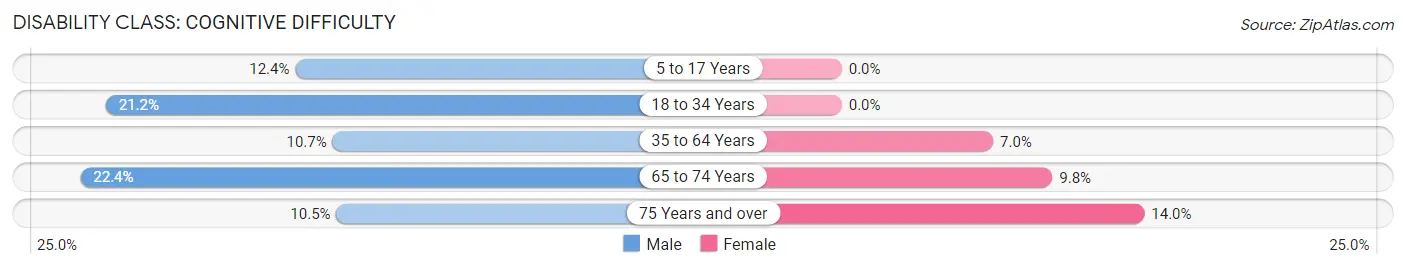
| Age Bracket | Male | Female |
| 5 to 17 Years | 27 (12.4%) | 0 (0.0%) |
| 18 to 34 Years | 90 (21.2%) | 0 (0.0%) |
| 35 to 64 Years | 63 (10.7%) | 64 (7.0%) |
| 65 to 74 Years | 39 (22.4%) | 13 (9.8%) |
| 75 Years and over | 8 (10.5%) | 33 (14.0%) |
Disability Class: Ambulatory Difficulty
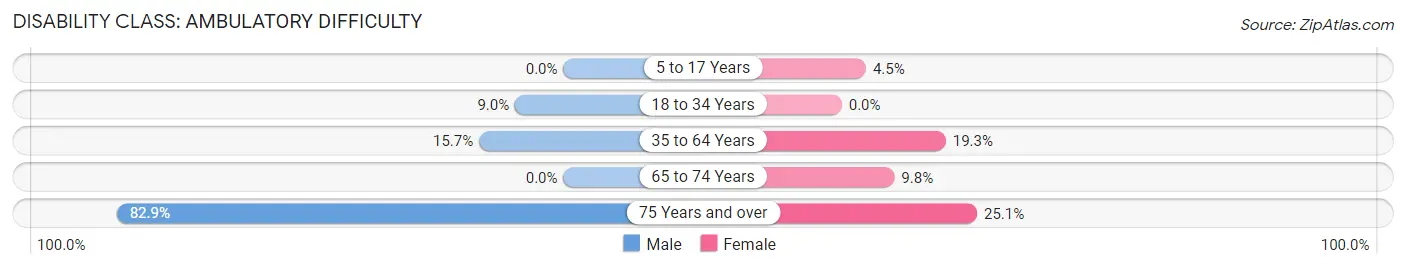
| Age Bracket | Male | Female |
| 5 to 17 Years | 0 (0.0%) | 17 (4.5%) |
| 18 to 34 Years | 38 (9.0%) | 0 (0.0%) |
| 35 to 64 Years | 92 (15.7%) | 176 (19.3%) |
| 65 to 74 Years | 0 (0.0%) | 13 (9.8%) |
| 75 Years and over | 63 (82.9%) | 59 (25.1%) |
Disability Class: Self-Care Difficulty
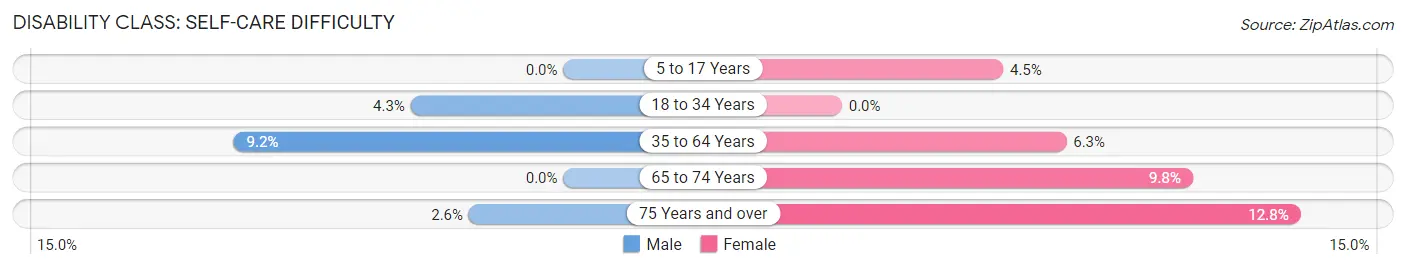
| Age Bracket | Male | Female |
| 5 to 17 Years | 0 (0.0%) | 17 (4.5%) |
| 18 to 34 Years | 18 (4.3%) | 0 (0.0%) |
| 35 to 64 Years | 54 (9.2%) | 57 (6.2%) |
| 65 to 74 Years | 0 (0.0%) | 13 (9.8%) |
| 75 Years and over | 2 (2.6%) | 30 (12.8%) |
Technology Access in Bajadero
Computing Device Access in Bajadero
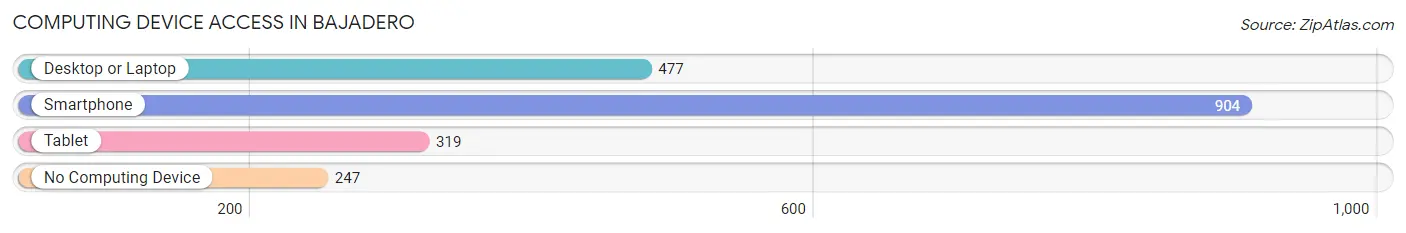
| Device Type | # Households | % Households |
| Desktop or Laptop | 477 | 40.1% |
| Smartphone | 904 | 75.9% |
| Tablet | 319 | 26.8% |
| No Computing Device | 247 | 20.7% |
| Total | 1,191 | 100.0% |
Internet Access in Bajadero
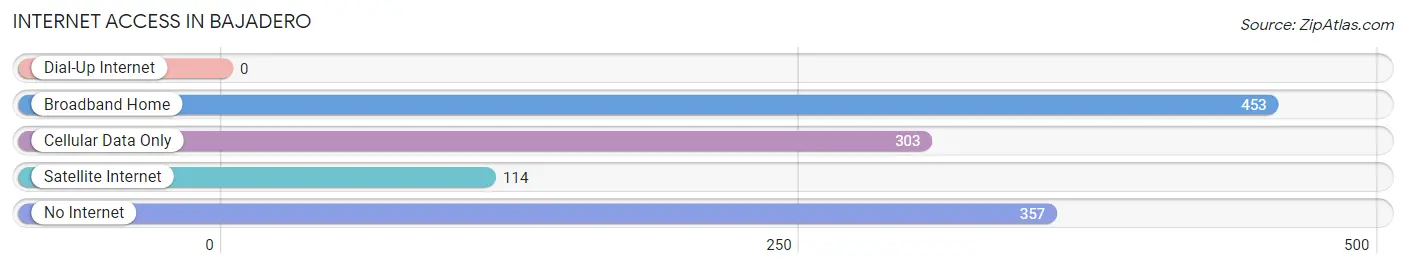
| Internet Type | # Households | % Households |
| Dial-Up Internet | 0 | 0.0% |
| Broadband Home | 453 | 38.0% |
| Cellular Data Only | 303 | 25.4% |
| Satellite Internet | 114 | 9.6% |
| No Internet | 357 | 30.0% |
| Total | 1,191 | 100.0% |
Bajadero Summary
Bajadero is a small municipality located in the northern coast of Puerto Rico, in the region known as the Cordillera Central. It is part of the San Juan-Caguas-Guaynabo Metropolitan Statistical Area. The municipality is bordered by the municipalities of Camuy, Hatillo, Quebradillas, and San Sebastián. As of the 2010 census, the population of Bajadero was 8,845.
History
The area of Bajadero was originally inhabited by the Taíno Indians. The first Spanish settlers arrived in the area in the early 16th century. The area was part of the municipality of San Sebastián until 1824, when it was established as an independent municipality. The name of the municipality is derived from the Taíno word “bajadero”, which means “place of descent”.
Geography
Bajadero is located in the northern coast of Puerto Rico, in the region known as the Cordillera Central. It is bordered by the municipalities of Camuy, Hatillo, Quebradillas, and San Sebastián. The municipality has a total area of 11.9 square miles, of which 11.7 square miles is land and 0.2 square miles is water. The terrain is mostly mountainous, with some flat areas in the coastal region. The highest point in the municipality is Cerro La Punta, which has an elevation of 1,890 feet.
Climate
Bajadero has a tropical climate, with an average temperature of 79°F. The average annual precipitation is around 64 inches.
Economy
The economy of Bajadero is largely based on agriculture and tourism. The main agricultural products are coffee, bananas, and plantains. The municipality is also home to several small businesses, including restaurants, hotels, and souvenir shops.
Demographics
As of the 2010 census, the population of Bajadero was 8,845. The population is mostly of mixed European and African descent. The majority of the population (90.3%) is Hispanic or Latino. The median household income is $17,845, and the poverty rate is 44.3%. The unemployment rate is 11.3%.
Education
Bajadero is served by the Puerto Rico Department of Education. There are two public schools in the municipality: Escuela Básica Bajadero and Escuela Intermedia Bajadero. There are also several private schools in the area.
Conclusion
Bajadero is a small municipality located in the northern coast of Puerto Rico. It has a population of 8,845 and is mostly of mixed European and African descent. The economy of Bajadero is largely based on agriculture and tourism. The municipality is served by the Puerto Rico Department of Education, with two public schools and several private schools in the area.
Common Questions
What is Per Capita Income in Bajadero?
Per Capita income in Bajadero is $10,504.
What is the Median Family Income in Bajadero?
Median Family Income in Bajadero is $25,703.
What is the Median Household income in Bajadero?
Median Household Income in Bajadero is $19,413.
What is Income or Wage Gap in Bajadero?
Income or Wage Gap in Bajadero is 18.8%.
Women in Bajadero earn 81.2 cents for every dollar earned by a man.
What is Family Income Deficit in Bajadero?
Family Income Deficit in Bajadero is $13,782.
Families that are below poverty line in Bajadero earn $13,782 less on average than the poverty threshold level.
What is Inequality or Gini Index in Bajadero?
Inequality or Gini Index in Bajadero is 0.53.
What is the Total Population of Bajadero?
Total Population of Bajadero is 3,539.
What is the Total Male Population of Bajadero?
Total Male Population of Bajadero is 1,543.
What is the Total Female Population of Bajadero?
Total Female Population of Bajadero is 1,996.
What is the Ratio of Males per 100 Females in Bajadero?
There are 77.30 Males per 100 Females in Bajadero.
What is the Ratio of Females per 100 Males in Bajadero?
There are 129.36 Females per 100 Males in Bajadero.
What is the Median Population Age in Bajadero?
Median Population Age in Bajadero is 41.9 Years.
What is the Average Family Size in Bajadero
Average Family Size in Bajadero is 3.7 People.
What is the Average Household Size in Bajadero
Average Household Size in Bajadero is 3.0 People.
How Large is the Labor Force in Bajadero?
There are 1,150 People in the Labor Forcein in Bajadero.
What is the Percentage of People in the Labor Force in Bajadero?
39.4% of People are in the Labor Force in Bajadero.
What is the Unemployment Rate in Bajadero?
Unemployment Rate in Bajadero is 24.8%.