Aberdeen Proving Ground, MD Map & Demographics
Aberdeen Proving Ground Map
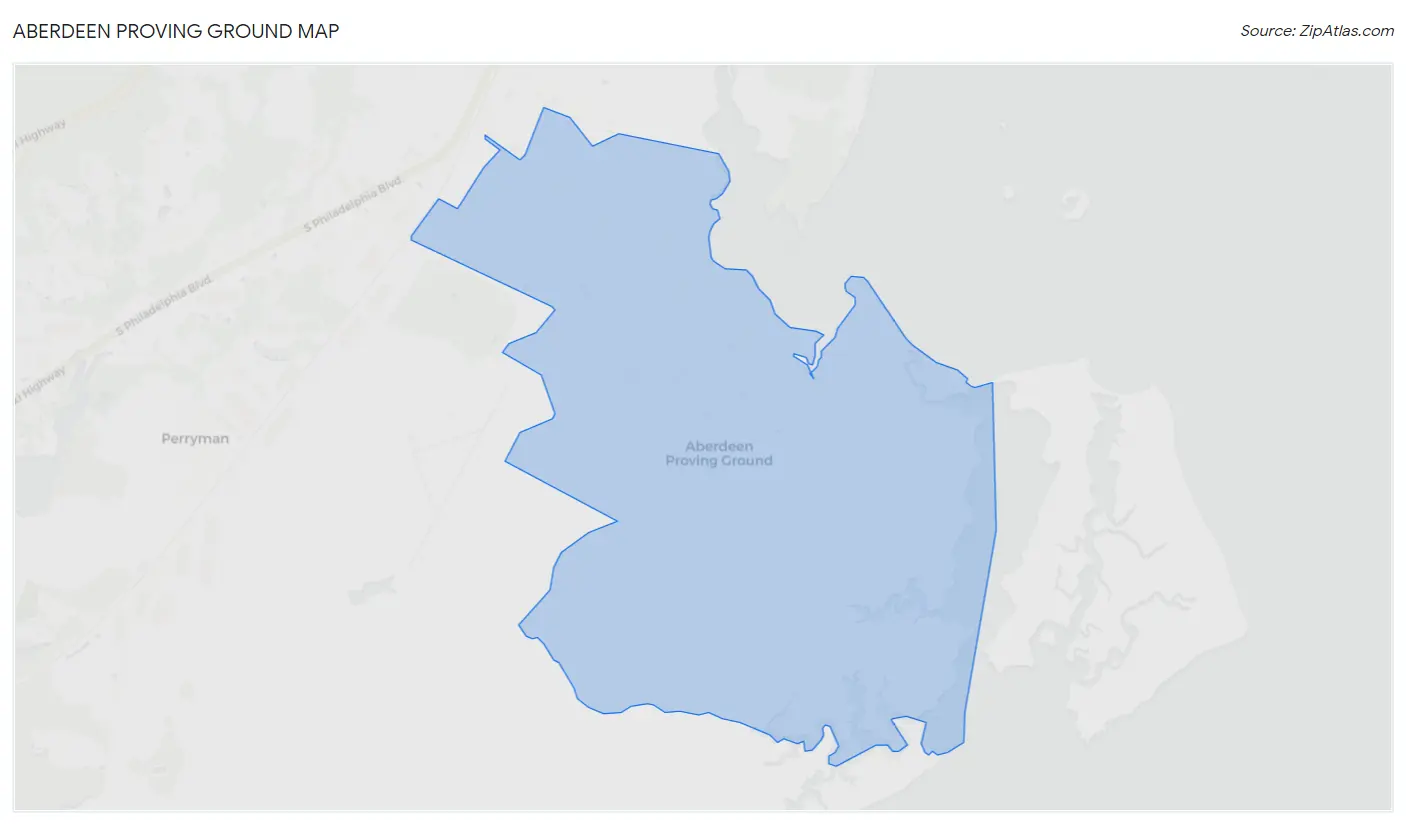
Aberdeen Proving Ground Overview
$41,243
PER CAPITA INCOME
$138,920
AVG FAMILY INCOME
$118,750
AVG HOUSEHOLD INCOME
48.4%
WAGE / INCOME GAP [ % ]
51.6¢/ $1
WAGE / INCOME GAP [ $ ]
0.32
INEQUALITY / GINI INDEX
2,703
TOTAL POPULATION
1,340
MALE POPULATION
1,363
FEMALE POPULATION
98.31
MALES / 100 FEMALES
101.72
FEMALES / 100 MALES
30.0
MEDIAN AGE
4.3
AVG FAMILY SIZE
3.1
AVG HOUSEHOLD SIZE
1,521
LABOR FORCE [ PEOPLE ]
77.5%
PERCENT IN LABOR FORCE
6.3%
UNEMPLOYMENT RATE
Aberdeen Proving Ground Zip Codes
Income in Aberdeen Proving Ground
Income Overview in Aberdeen Proving Ground
Per Capita Income in Aberdeen Proving Ground is $41,243, while median incomes of families and households are $138,920 and $118,750 respectively.
| Characteristic | Number | Measure |
| Per Capita Income | 2,703 | $41,243 |
| Median Family Income | 517 | $138,920 |
| Mean Family Income | 517 | $145,364 |
| Median Household Income | 834 | $118,750 |
| Mean Household Income | 834 | $124,343 |
| Income Deficit | 517 | $0 |
| Wage / Income Gap (%) | 2,703 | 48.45% |
| Wage / Income Gap ($) | 2,703 | 51.55¢ per $1 |
| Gini / Inequality Index | 2,703 | 0.32 |
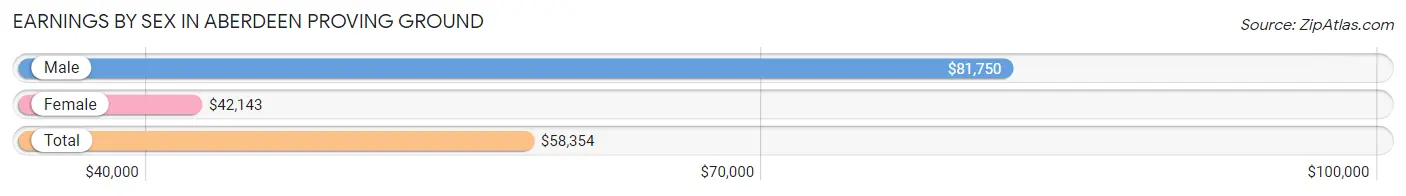
Earnings by Sex in Aberdeen Proving Ground
Average Earnings in Aberdeen Proving Ground are $58,354, $81,750 for men and $42,143 for women, a difference of 48.4%.
| Sex | Number | Average Earnings |
| Male | 848 (56.6%) | $81,750 |
| Female | 650 (43.4%) | $42,143 |
| Total | 1,498 (100.0%) | $58,354 |
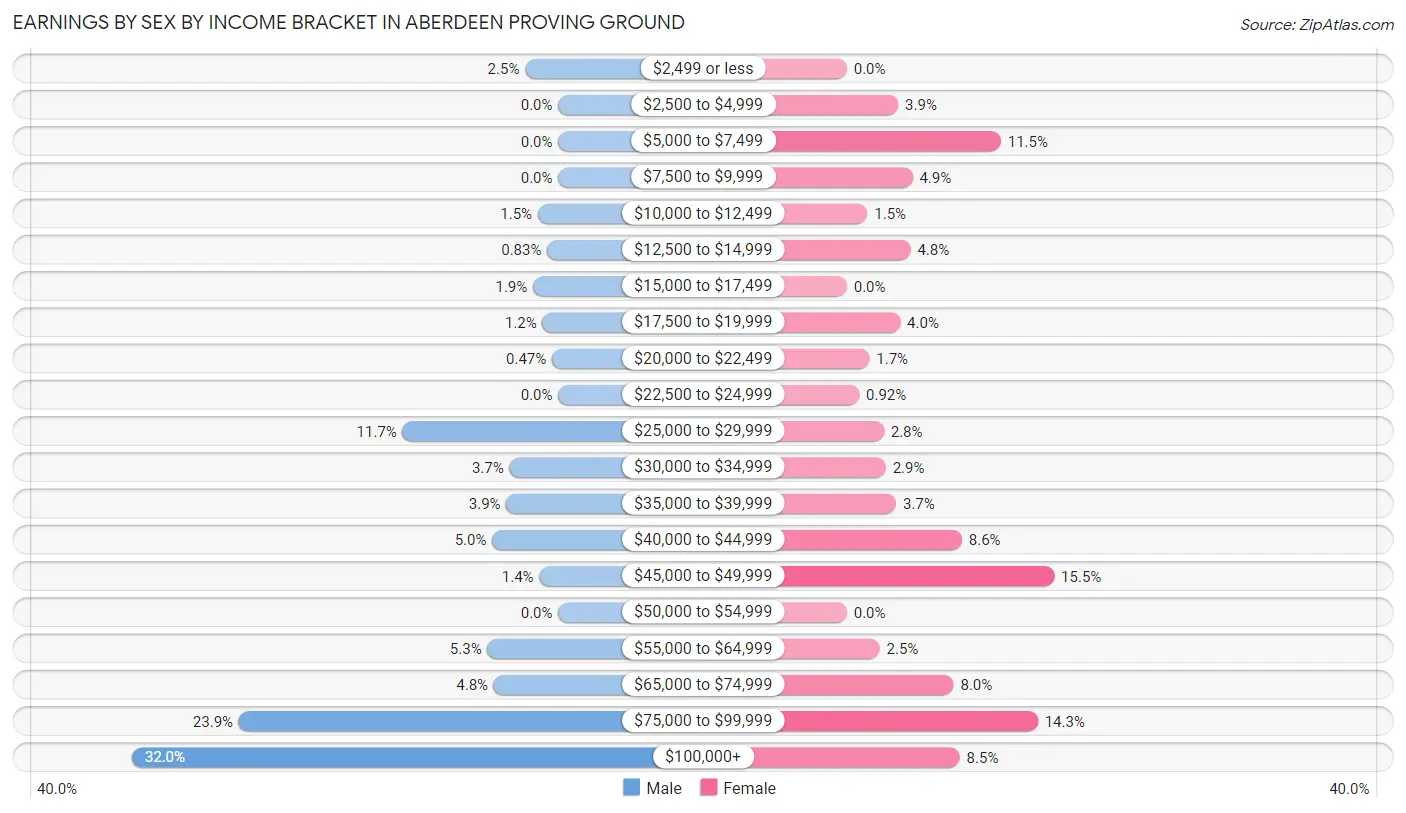
Earnings by Sex by Income Bracket in Aberdeen Proving Ground
The most common earnings brackets in Aberdeen Proving Ground are $100,000+ for men (271 | 32.0%) and $45,000 to $49,999 for women (101 | 15.5%).
| Income | Male | Female |
| $2,499 or less | 21 (2.5%) | 0 (0.0%) |
| $2,500 to $4,999 | 0 (0.0%) | 25 (3.8%) |
| $5,000 to $7,499 | 0 (0.0%) | 75 (11.5%) |
| $7,500 to $9,999 | 0 (0.0%) | 32 (4.9%) |
| $10,000 to $12,499 | 13 (1.5%) | 10 (1.5%) |
| $12,500 to $14,999 | 7 (0.8%) | 31 (4.8%) |
| $15,000 to $17,499 | 16 (1.9%) | 0 (0.0%) |
| $17,500 to $19,999 | 10 (1.2%) | 26 (4.0%) |
| $20,000 to $22,499 | 4 (0.5%) | 11 (1.7%) |
| $22,500 to $24,999 | 0 (0.0%) | 6 (0.9%) |
| $25,000 to $29,999 | 99 (11.7%) | 18 (2.8%) |
| $30,000 to $34,999 | 31 (3.7%) | 19 (2.9%) |
| $35,000 to $39,999 | 33 (3.9%) | 24 (3.7%) |
| $40,000 to $44,999 | 42 (5.0%) | 56 (8.6%) |
| $45,000 to $49,999 | 12 (1.4%) | 101 (15.5%) |
| $50,000 to $54,999 | 0 (0.0%) | 0 (0.0%) |
| $55,000 to $64,999 | 45 (5.3%) | 16 (2.5%) |
| $65,000 to $74,999 | 41 (4.8%) | 52 (8.0%) |
| $75,000 to $99,999 | 203 (23.9%) | 93 (14.3%) |
| $100,000+ | 271 (32.0%) | 55 (8.5%) |
| Total | 848 (100.0%) | 650 (100.0%) |
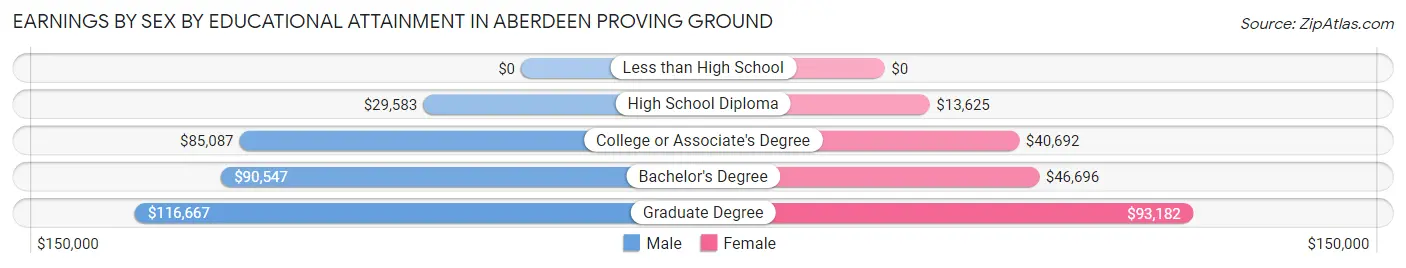
Earnings by Sex by Educational Attainment in Aberdeen Proving Ground
Average earnings in Aberdeen Proving Ground are $86,429 for men and $46,015 for women, a difference of 46.8%. Men with an educational attainment of graduate degree enjoy the highest average annual earnings of $116,667, while those with high school diploma education earn the least with $29,583. Women with an educational attainment of graduate degree earn the most with the average annual earnings of $93,182, while those with high school diploma education have the smallest earnings of $13,625.
| Educational Attainment | Male Income | Female Income |
| Less than High School | - | - |
| High School Diploma | $29,583 | $13,625 |
| College or Associate's Degree | $85,087 | $40,692 |
| Bachelor's Degree | $90,547 | $46,696 |
| Graduate Degree | $116,667 | $93,182 |
| Total | $86,429 | $46,015 |
Family Income in Aberdeen Proving Ground
Family Income Brackets in Aberdeen Proving Ground
According to the Aberdeen Proving Ground family income data, there are 199 families falling into the $100,000 to $149,999 income range, which is the most common income bracket and makes up 38.5% of all families.
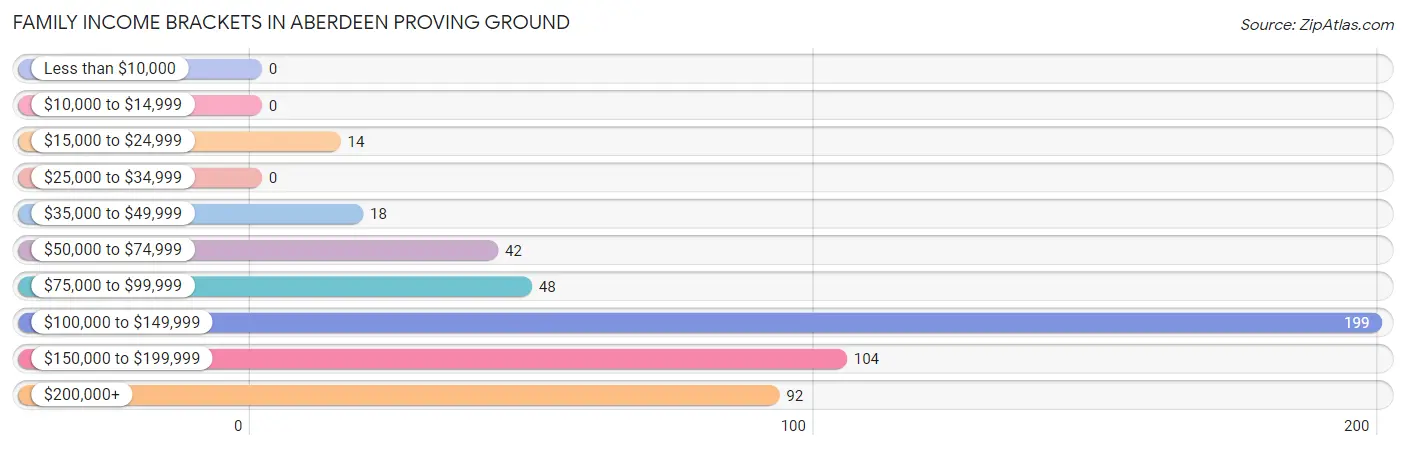
| Income Bracket | # Families | % Families |
| Less than $10,000 | 0 | 0.0% |
| $10,000 to $14,999 | 0 | 0.0% |
| $15,000 to $24,999 | 14 | 2.7% |
| $25,000 to $34,999 | 0 | 0.0% |
| $35,000 to $49,999 | 18 | 3.5% |
| $50,000 to $74,999 | 42 | 8.1% |
| $75,000 to $99,999 | 48 | 9.3% |
| $100,000 to $149,999 | 199 | 38.5% |
| $150,000 to $199,999 | 104 | 20.1% |
| $200,000+ | 92 | 17.8% |
Family Income by Famaliy Size in Aberdeen Proving Ground
3-person families (63 | 12.2%) account for the highest median family income in Aberdeen Proving Ground with $193,125 per family, while 2-person families (144 | 27.9%) have the highest median income of $71,094 per family member.
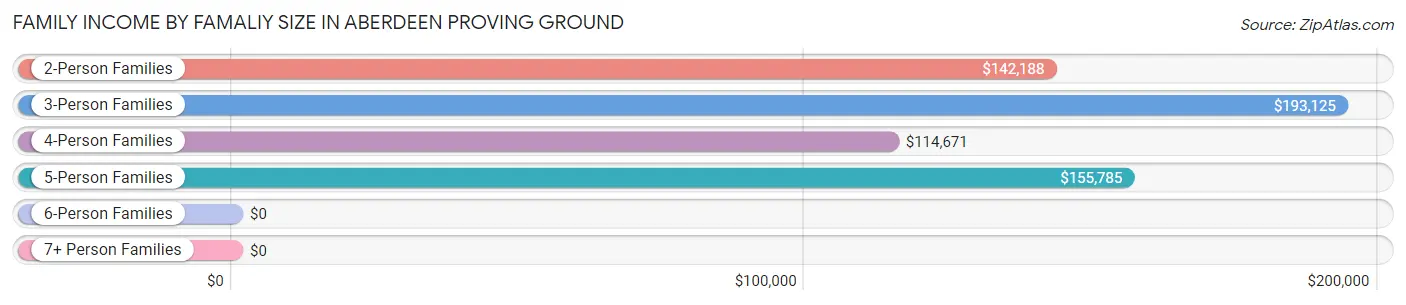
| Income Bracket | # Families | Median Income |
| 2-Person Families | 144 (27.9%) | $142,188 |
| 3-Person Families | 63 (12.2%) | $193,125 |
| 4-Person Families | 169 (32.7%) | $114,671 |
| 5-Person Families | 59 (11.4%) | $155,785 |
| 6-Person Families | 6 (1.2%) | $0 |
| 7+ Person Families | 76 (14.7%) | $0 |
| Total | 517 (100.0%) | $138,920 |
Family Income by Number of Earners in Aberdeen Proving Ground
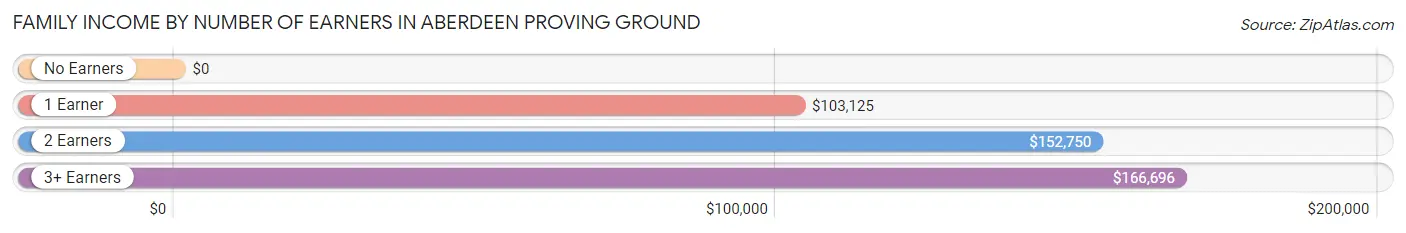
| Number of Earners | # Families | Median Income |
| No Earners | 0 (0.0%) | $0 |
| 1 Earner | 177 (34.2%) | $103,125 |
| 2 Earners | 239 (46.2%) | $152,750 |
| 3+ Earners | 101 (19.5%) | $166,696 |
| Total | 517 (100.0%) | $138,920 |
Household Income in Aberdeen Proving Ground
Household Income Brackets in Aberdeen Proving Ground
With 264 households falling in the category, the $100,000 to $149,999 income range is the most frequent in Aberdeen Proving Ground, accounting for 31.7% of all households.
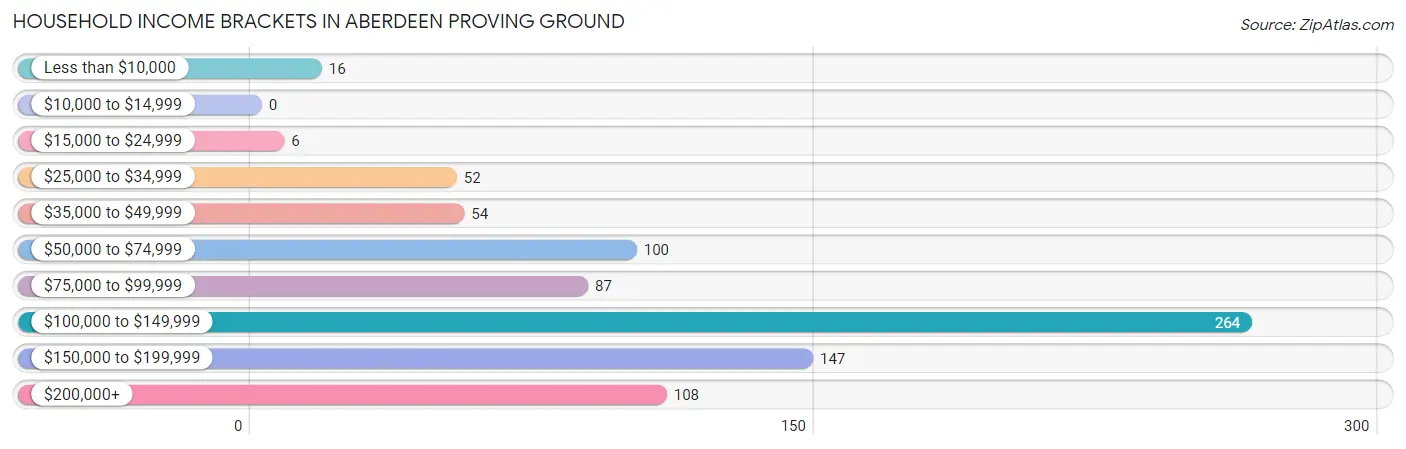
| Income Bracket | # Households | % Households |
| Less than $10,000 | 16 | 1.9% |
| $10,000 to $14,999 | 0 | 0.0% |
| $15,000 to $24,999 | 6 | 0.7% |
| $25,000 to $34,999 | 52 | 6.2% |
| $35,000 to $49,999 | 54 | 6.5% |
| $50,000 to $74,999 | 100 | 12.0% |
| $75,000 to $99,999 | 87 | 10.4% |
| $100,000 to $149,999 | 264 | 31.7% |
| $150,000 to $199,999 | 147 | 17.6% |
| $200,000+ | 108 | 12.9% |
Household Income by Householder Age in Aberdeen Proving Ground
The median household income in Aberdeen Proving Ground is $118,750, with the highest median household income of $146,838 found in the 45 to 64 years age bracket for the primary householder. A total of 312 households (37.4%) fall into this category. Meanwhile, the 15 to 24 years age bracket for the primary householder has the lowest median household income of $0, with 57 households (6.8%) in this group.
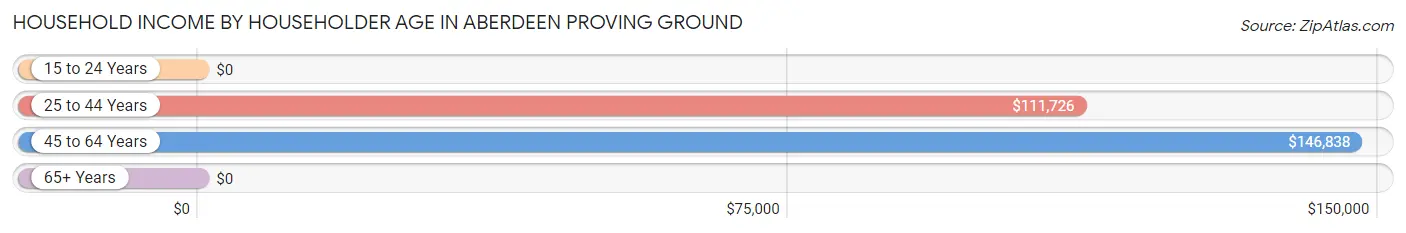
| Income Bracket | # Households | Median Income |
| 15 to 24 Years | 57 (6.8%) | $0 |
| 25 to 44 Years | 392 (47.0%) | $111,726 |
| 45 to 64 Years | 312 (37.4%) | $146,838 |
| 65+ Years | 73 (8.7%) | $0 |
| Total | 834 (100.0%) | $118,750 |
Poverty in Aberdeen Proving Ground
Income Below Poverty by Sex and Age in Aberdeen Proving Ground
With 2.3% poverty level for males and 1.5% for females among the residents of Aberdeen Proving Ground, 16 and 17 year old males and 45 to 54 year old females are the most vulnerable to poverty, with 13 males (18.3%) and 14 females (9.7%) in their respective age groups living below the poverty level.
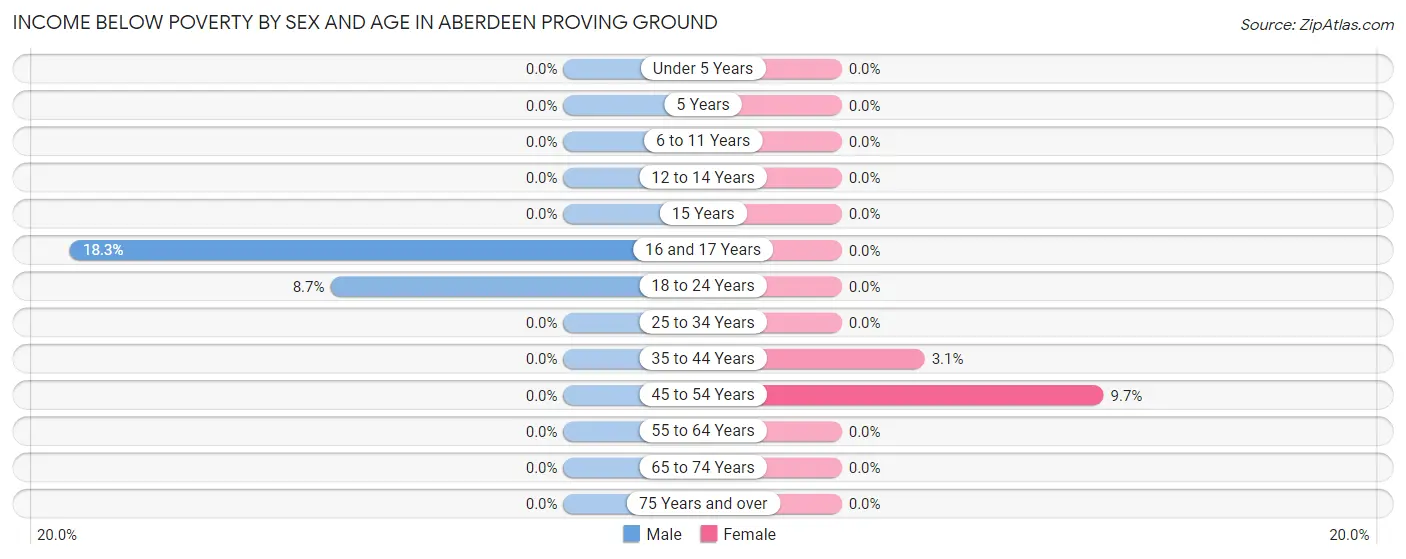
| Age Bracket | Male | Female |
| Under 5 Years | 0 (0.0%) | 0 (0.0%) |
| 5 Years | 0 (0.0%) | 0 (0.0%) |
| 6 to 11 Years | 0 (0.0%) | 0 (0.0%) |
| 12 to 14 Years | 0 (0.0%) | 0 (0.0%) |
| 15 Years | 0 (0.0%) | 0 (0.0%) |
| 16 and 17 Years | 13 (18.3%) | 0 (0.0%) |
| 18 to 24 Years | 16 (8.6%) | 0 (0.0%) |
| 25 to 34 Years | 0 (0.0%) | 0 (0.0%) |
| 35 to 44 Years | 0 (0.0%) | 6 (3.1%) |
| 45 to 54 Years | 0 (0.0%) | 14 (9.7%) |
| 55 to 64 Years | 0 (0.0%) | 0 (0.0%) |
| 65 to 74 Years | 0 (0.0%) | 0 (0.0%) |
| 75 Years and over | 0 (0.0%) | 0 (0.0%) |
| Total | 29 (2.3%) | 20 (1.5%) |
Income Above Poverty by Sex and Age in Aberdeen Proving Ground
According to the poverty statistics in Aberdeen Proving Ground, males aged under 5 years and females aged under 5 years are the age groups that are most secure financially, with 100.0% of males and 100.0% of females in these age groups living above the poverty line.
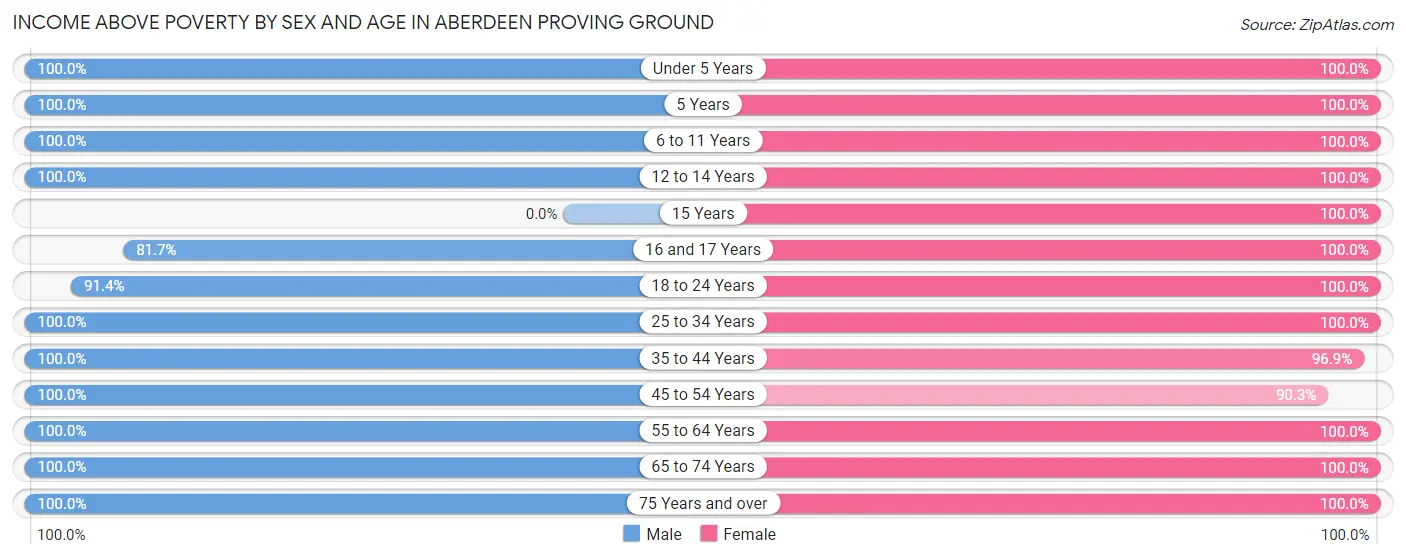
| Age Bracket | Male | Female |
| Under 5 Years | 95 (100.0%) | 118 (100.0%) |
| 5 Years | 26 (100.0%) | 22 (100.0%) |
| 6 to 11 Years | 118 (100.0%) | 188 (100.0%) |
| 12 to 14 Years | 31 (100.0%) | 76 (100.0%) |
| 15 Years | 0 (0.0%) | 67 (100.0%) |
| 16 and 17 Years | 58 (81.7%) | 51 (100.0%) |
| 18 to 24 Years | 169 (91.3%) | 86 (100.0%) |
| 25 to 34 Years | 164 (100.0%) | 248 (100.0%) |
| 35 to 44 Years | 215 (100.0%) | 189 (96.9%) |
| 45 to 54 Years | 119 (100.0%) | 130 (90.3%) |
| 55 to 64 Years | 210 (100.0%) | 74 (100.0%) |
| 65 to 74 Years | 8 (100.0%) | 46 (100.0%) |
| 75 Years and over | 26 (100.0%) | 21 (100.0%) |
| Total | 1,239 (97.7%) | 1,316 (98.5%) |
Income Below Poverty Among Married-Couple Families in Aberdeen Proving Ground
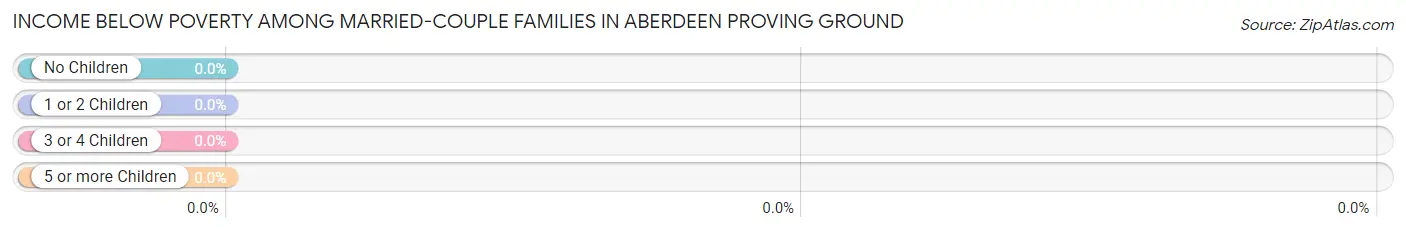
| Children | Above Poverty | Below Poverty |
| No Children | 111 (100.0%) | 0 (0.0%) |
| 1 or 2 Children | 236 (100.0%) | 0 (0.0%) |
| 3 or 4 Children | 29 (100.0%) | 0 (0.0%) |
| 5 or more Children | 49 (100.0%) | 0 (0.0%) |
| Total | 425 (100.0%) | 0 (0.0%) |
Income Below Poverty Among Single-Parent Households in Aberdeen Proving Ground
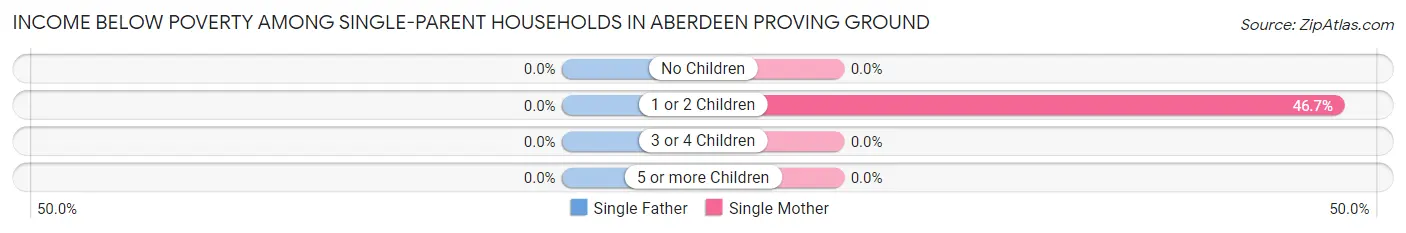
| Children | Single Father | Single Mother |
| No Children | 0 (0.0%) | 0 (0.0%) |
| 1 or 2 Children | 0 (0.0%) | 14 (46.7%) |
| 3 or 4 Children | 0 (0.0%) | 0 (0.0%) |
| 5 or more Children | 0 (0.0%) | 0 (0.0%) |
| Total | 0 (0.0%) | 14 (26.9%) |
Income Below Poverty Among Married-Couple vs Single-Parent Households in Aberdeen Proving Ground
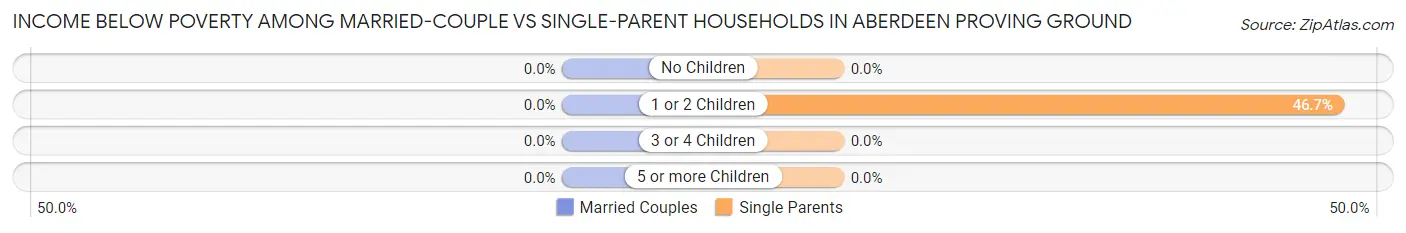
| Children | Married-Couple Families | Single-Parent Households |
| No Children | 0 (0.0%) | 0 (0.0%) |
| 1 or 2 Children | 0 (0.0%) | 14 (46.7%) |
| 3 or 4 Children | 0 (0.0%) | 0 (0.0%) |
| 5 or more Children | 0 (0.0%) | 0 (0.0%) |
| Total | 0 (0.0%) | 14 (15.2%) |
Race in Aberdeen Proving Ground
The most populous races in Aberdeen Proving Ground are White / Caucasian (1,251 | 46.3%), Black / African American (1,111 | 41.1%), and Hispanic or Latino (302 | 11.2%).
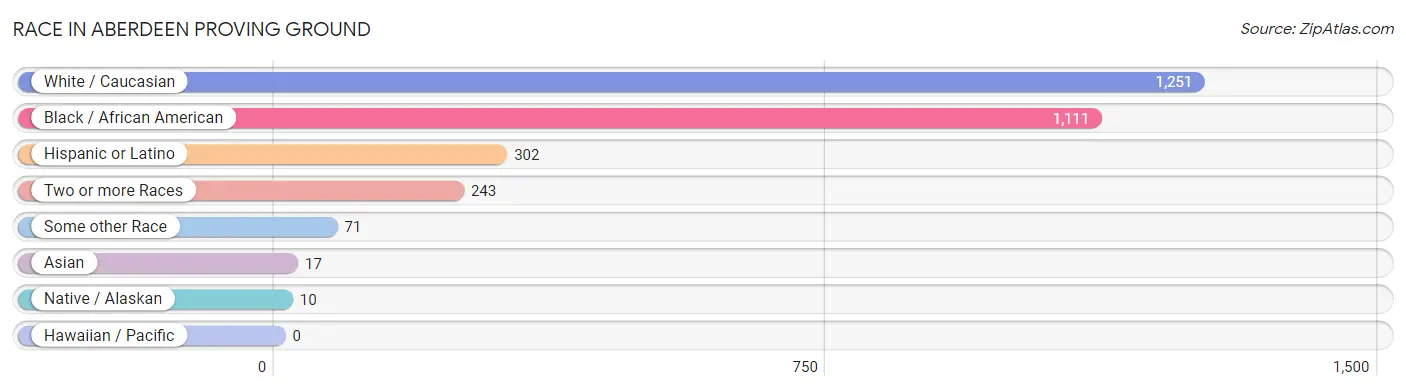
| Race | # Population | % Population |
| Asian | 17 | 0.6% |
| Black / African American | 1,111 | 41.1% |
| Hawaiian / Pacific | 0 | 0.0% |
| Hispanic or Latino | 302 | 11.2% |
| Native / Alaskan | 10 | 0.4% |
| White / Caucasian | 1,251 | 46.3% |
| Two or more Races | 243 | 9.0% |
| Some other Race | 71 | 2.6% |
| Total | 2,703 | 100.0% |
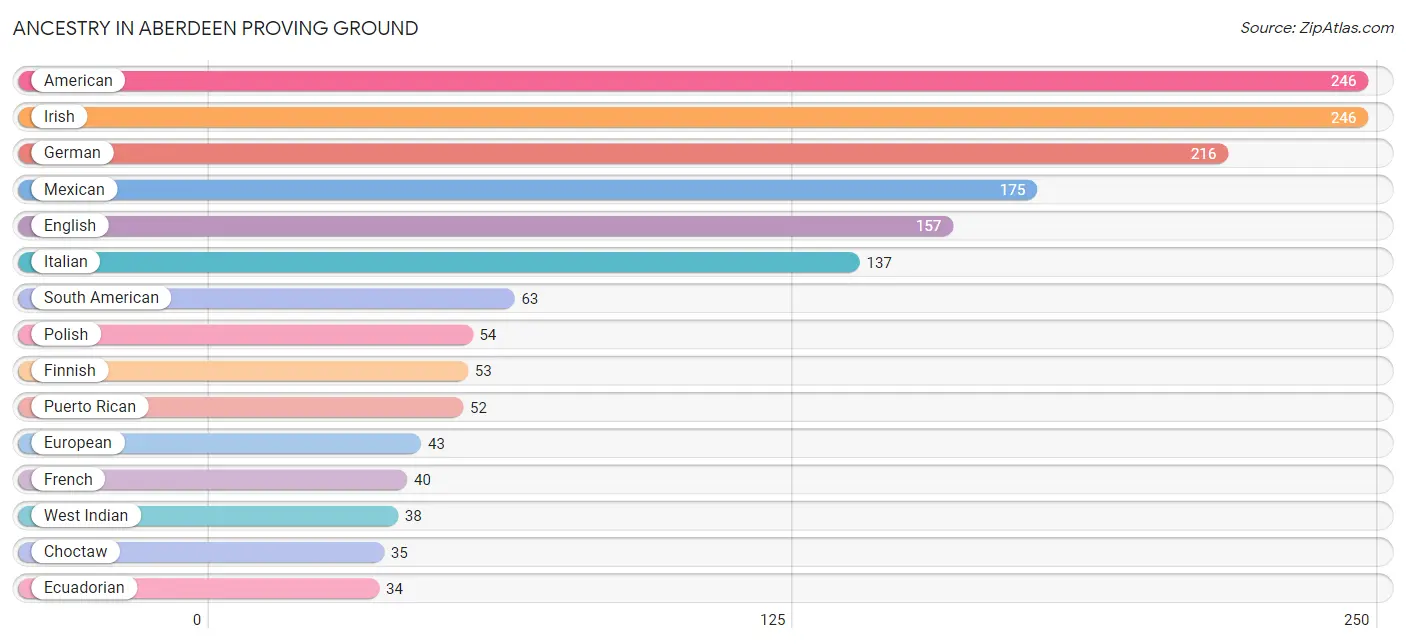
Ancestry in Aberdeen Proving Ground
The most populous ancestries reported in Aberdeen Proving Ground are American (246 | 9.1%), Irish (246 | 9.1%), German (216 | 8.0%), Mexican (175 | 6.5%), and English (157 | 5.8%), together accounting for 38.5% of all Aberdeen Proving Ground residents.
| Ancestry | # Population | % Population |
| American | 246 | 9.1% |
| Austrian | 7 | 0.3% |
| Bhutanese | 3 | 0.1% |
| Blackfeet | 17 | 0.6% |
| British | 11 | 0.4% |
| Burmese | 22 | 0.8% |
| Central American | 12 | 0.4% |
| Cherokee | 6 | 0.2% |
| Choctaw | 35 | 1.3% |
| Czechoslovakian | 11 | 0.4% |
| Danish | 11 | 0.4% |
| Dutch | 21 | 0.8% |
| Ecuadorian | 34 | 1.3% |
| English | 157 | 5.8% |
| European | 43 | 1.6% |
| Finnish | 53 | 2.0% |
| French | 40 | 1.5% |
| French Canadian | 7 | 0.3% |
| German | 216 | 8.0% |
| Greek | 6 | 0.2% |
| Indian (Asian) | 7 | 0.3% |
| Irish | 246 | 9.1% |
| Italian | 137 | 5.1% |
| Jamaican | 1 | 0.0% |
| Korean | 2 | 0.1% |
| Lithuanian | 6 | 0.2% |
| Mexican | 175 | 6.5% |
| Mexican American Indian | 7 | 0.3% |
| Nigerian | 24 | 0.9% |
| Panamanian | 2 | 0.1% |
| Peruvian | 29 | 1.1% |
| Pima | 10 | 0.4% |
| Polish | 54 | 2.0% |
| Puerto Rican | 52 | 1.9% |
| Salvadoran | 10 | 0.4% |
| Scandinavian | 9 | 0.3% |
| Scotch-Irish | 17 | 0.6% |
| Scottish | 19 | 0.7% |
| South American | 63 | 2.3% |
| Subsaharan African | 24 | 0.9% |
| Swedish | 8 | 0.3% |
| Ukrainian | 12 | 0.4% |
| Welsh | 8 | 0.3% |
| West Indian | 38 | 1.4% |
| Yaqui | 9 | 0.3% | View All 45 Rows |
Immigrants in Aberdeen Proving Ground
The most numerous immigrant groups reported in Aberdeen Proving Ground came from Latin America (68 | 2.5%), Central America (31 | 1.1%), Mexico (31 | 1.1%), Europe (22 | 0.8%), and Ecuador (19 | 0.7%), together accounting for 6.3% of all Aberdeen Proving Ground residents.
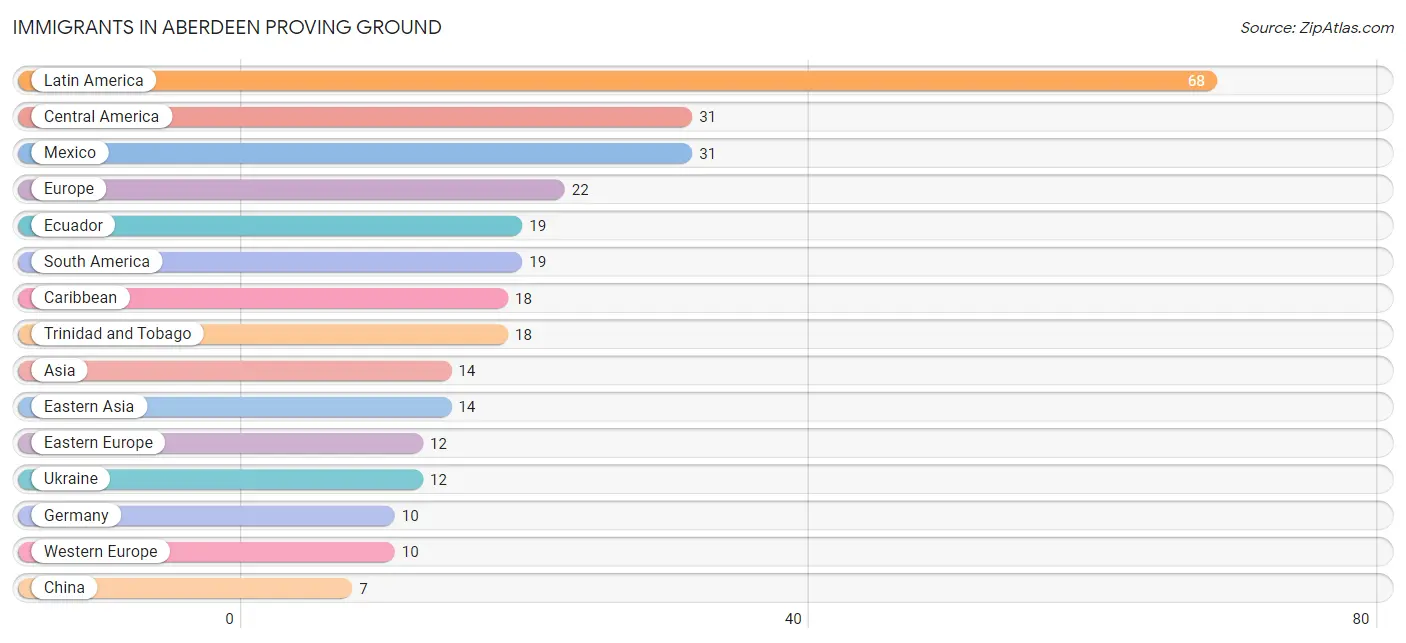
| Immigration Origin | # Population | % Population |
| Asia | 14 | 0.5% |
| Caribbean | 18 | 0.7% |
| Central America | 31 | 1.1% |
| China | 7 | 0.3% |
| Eastern Asia | 14 | 0.5% |
| Eastern Europe | 12 | 0.4% |
| Ecuador | 19 | 0.7% |
| Europe | 22 | 0.8% |
| Germany | 10 | 0.4% |
| Korea | 7 | 0.3% |
| Latin America | 68 | 2.5% |
| Mexico | 31 | 1.1% |
| South America | 19 | 0.7% |
| Trinidad and Tobago | 18 | 0.7% |
| Ukraine | 12 | 0.4% |
| Western Europe | 10 | 0.4% | View All 16 Rows |
Sex and Age in Aberdeen Proving Ground
Sex and Age in Aberdeen Proving Ground
The most populous age groups in Aberdeen Proving Ground are 15 to 19 Years (178 | 13.3%) for men and 30 to 34 Years (189 | 13.9%) for women.
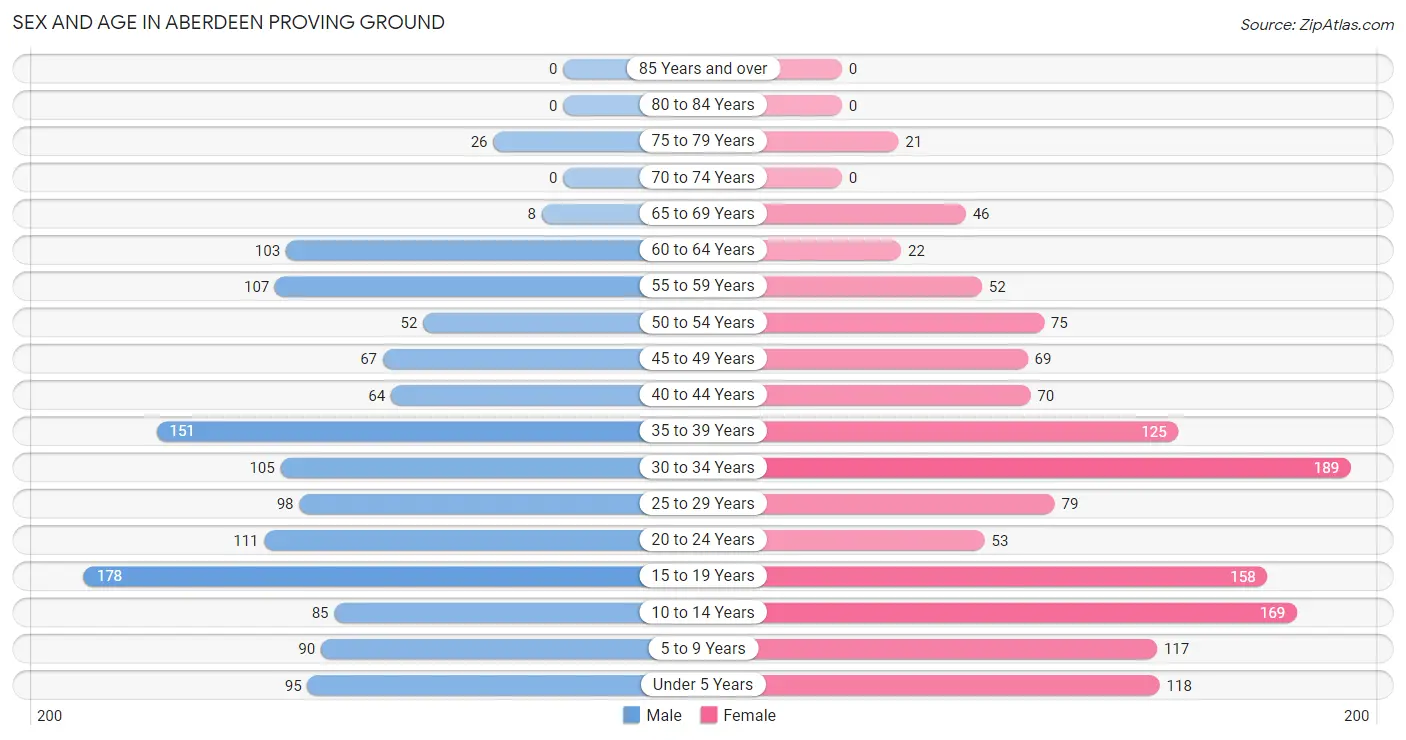
| Age Bracket | Male | Female |
| Under 5 Years | 95 (7.1%) | 118 (8.7%) |
| 5 to 9 Years | 90 (6.7%) | 117 (8.6%) |
| 10 to 14 Years | 85 (6.3%) | 169 (12.4%) |
| 15 to 19 Years | 178 (13.3%) | 158 (11.6%) |
| 20 to 24 Years | 111 (8.3%) | 53 (3.9%) |
| 25 to 29 Years | 98 (7.3%) | 79 (5.8%) |
| 30 to 34 Years | 105 (7.8%) | 189 (13.9%) |
| 35 to 39 Years | 151 (11.3%) | 125 (9.2%) |
| 40 to 44 Years | 64 (4.8%) | 70 (5.1%) |
| 45 to 49 Years | 67 (5.0%) | 69 (5.1%) |
| 50 to 54 Years | 52 (3.9%) | 75 (5.5%) |
| 55 to 59 Years | 107 (8.0%) | 52 (3.8%) |
| 60 to 64 Years | 103 (7.7%) | 22 (1.6%) |
| 65 to 69 Years | 8 (0.6%) | 46 (3.4%) |
| 70 to 74 Years | 0 (0.0%) | 0 (0.0%) |
| 75 to 79 Years | 26 (1.9%) | 21 (1.5%) |
| 80 to 84 Years | 0 (0.0%) | 0 (0.0%) |
| 85 Years and over | 0 (0.0%) | 0 (0.0%) |
| Total | 1,340 (100.0%) | 1,363 (100.0%) |
Families and Households in Aberdeen Proving Ground
Median Family Size in Aberdeen Proving Ground
The median family size in Aberdeen Proving Ground is 4.34 persons per family, with married-couple families (425 | 82.2%) accounting for the largest median family size of 4.7 persons per family. On the other hand, single female/mother families (52 | 10.1%) represent the smallest median family size with 2.35 persons per family.
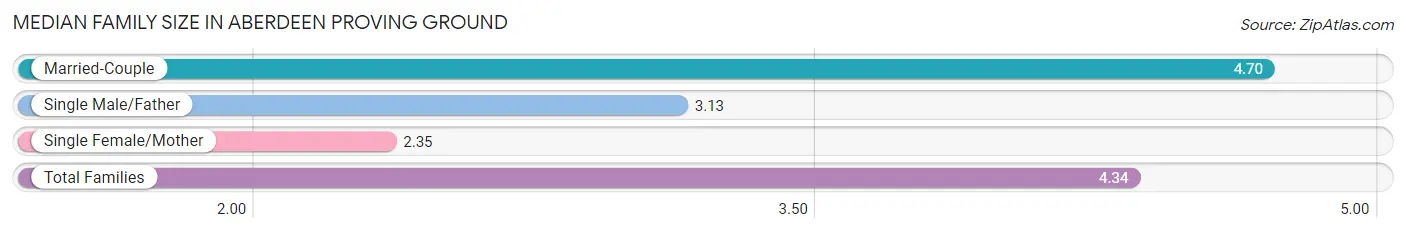
| Family Type | # Families | Family Size |
| Married-Couple | 425 (82.2%) | 4.70 |
| Single Male/Father | 40 (7.7%) | 3.13 |
| Single Female/Mother | 52 (10.1%) | 2.35 |
| Total Families | 517 (100.0%) | 4.34 |
Median Household Size in Aberdeen Proving Ground
The median household size in Aberdeen Proving Ground is 3.12 persons per household, with married-couple households (425 | 51.0%) accounting for the largest median household size of 4.7 persons per household. non-family households (317 | 38.0%) represent the smallest median household size with 1.04 persons per household.
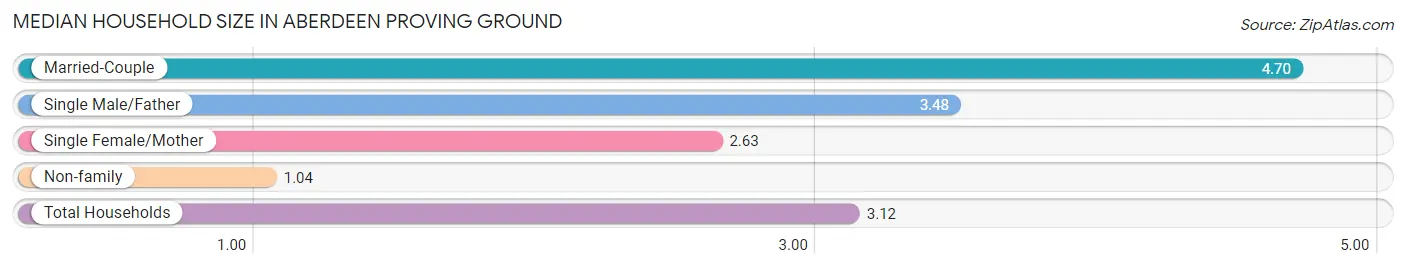
| Household Type | # Households | Household Size |
| Married-Couple | 425 (51.0%) | 4.70 |
| Single Male/Father | 40 (4.8%) | 3.48 |
| Single Female/Mother | 52 (6.2%) | 2.63 |
| Non-family | 317 (38.0%) | 1.04 |
| Total Households | 834 (100.0%) | 3.12 |
Household Size by Marriage Status in Aberdeen Proving Ground
Out of a total of 834 households in Aberdeen Proving Ground, 517 (62.0%) are family households, while 317 (38.0%) are nonfamily households. The most numerous type of family households are 4-person households, comprising 170, and the most common type of nonfamily households are 1-person households, comprising 295.
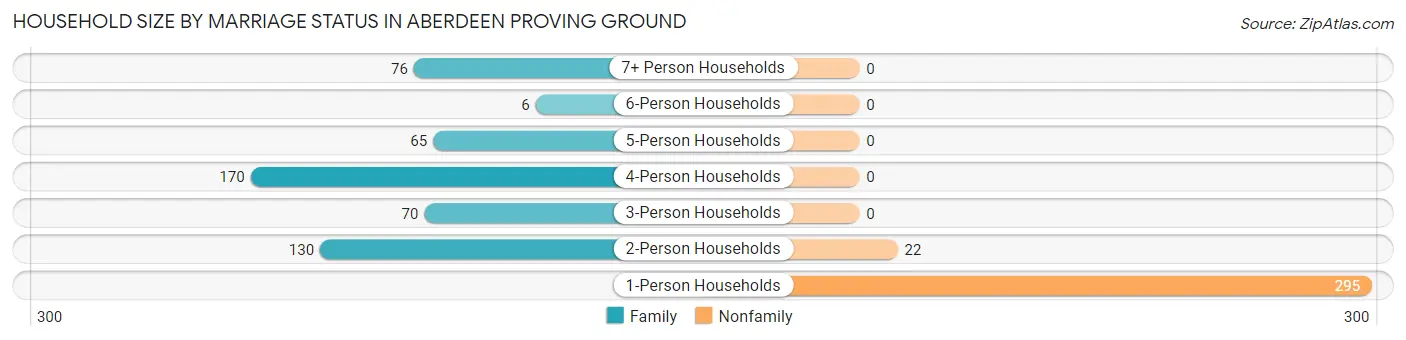
| Household Size | Family Households | Nonfamily Households |
| 1-Person Households | - | 295 (35.4%) |
| 2-Person Households | 130 (15.6%) | 22 (2.6%) |
| 3-Person Households | 70 (8.4%) | 0 (0.0%) |
| 4-Person Households | 170 (20.4%) | 0 (0.0%) |
| 5-Person Households | 65 (7.8%) | 0 (0.0%) |
| 6-Person Households | 6 (0.7%) | 0 (0.0%) |
| 7+ Person Households | 76 (9.1%) | 0 (0.0%) |
| Total | 517 (62.0%) | 317 (38.0%) |
Female Fertility in Aberdeen Proving Ground
Fertility by Age in Aberdeen Proving Ground
Average fertility rate in Aberdeen Proving Ground is 15.0 births per 1,000 women. Women in the age bracket of 20 to 34 years have the highest fertility rate with 37.0 births per 1,000 women. Women in the age bracket of 20 to 34 years acount for 100.0% of all women with births.
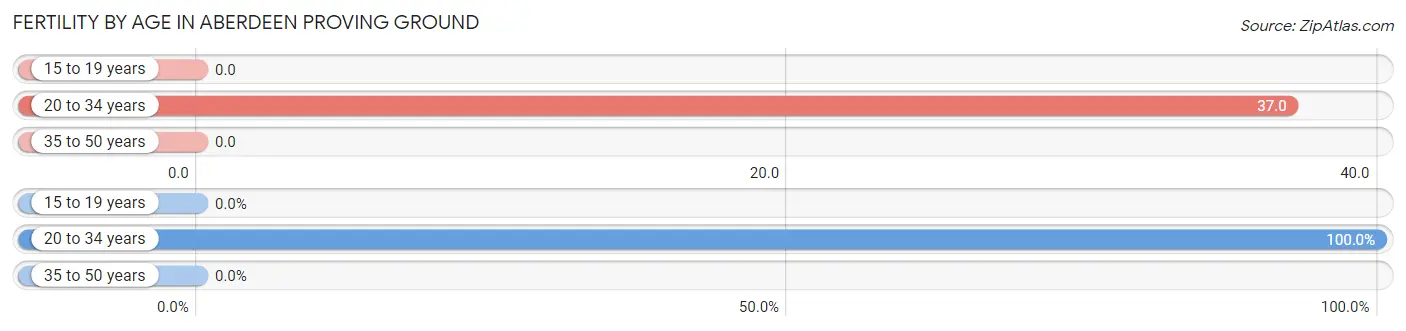
| Age Bracket | Women with Births | Births / 1,000 Women |
| 15 to 19 years | 0 (0.0%) | 0.0 |
| 20 to 34 years | 12 (100.0%) | 37.0 |
| 35 to 50 years | 0 (0.0%) | 0.0 |
| Total | 12 (100.0%) | 15.0 |
Fertility by Age by Marriage Status in Aberdeen Proving Ground
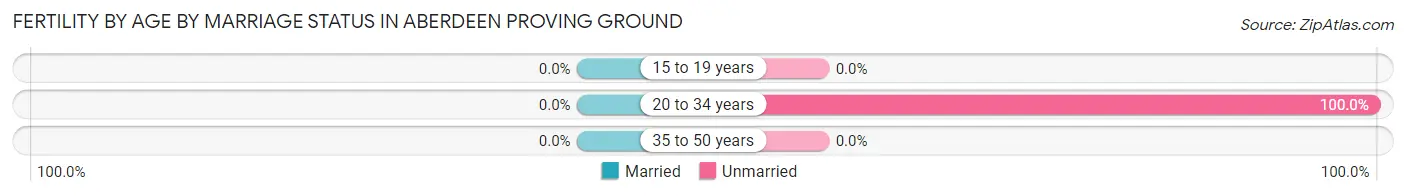
| Age Bracket | Married | Unmarried |
| 15 to 19 years | 0 (0.0%) | 0 (0.0%) |
| 20 to 34 years | 0 (0.0%) | 12 (100.0%) |
| 35 to 50 years | 0 (0.0%) | 0 (0.0%) |
| Total | 0 (0.0%) | 12 (100.0%) |
Fertility by Education in Aberdeen Proving Ground
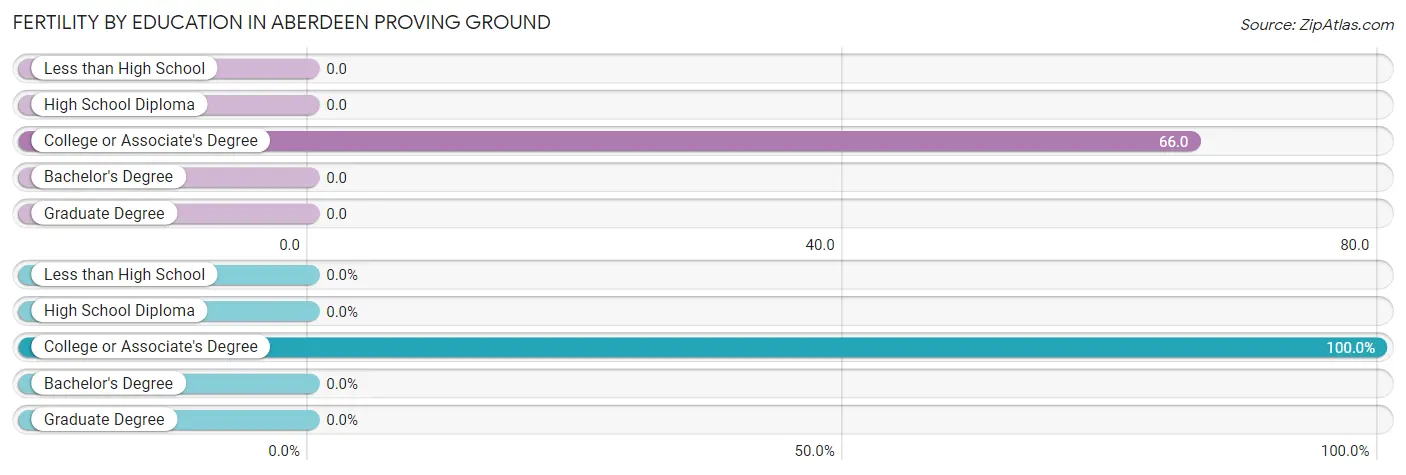
| Educational Attainment | Women with Births | Births / 1,000 Women |
| Less than High School | 0 (0.0%) | 0.0 |
| High School Diploma | 0 (0.0%) | 0.0 |
| College or Associate's Degree | 12 (100.0%) | 66.0 |
| Bachelor's Degree | 0 (0.0%) | 0.0 |
| Graduate Degree | 0 (0.0%) | 0.0 |
| Total | 12 (100.0%) | 15.0 |
Fertility by Education by Marriage Status in Aberdeen Proving Ground
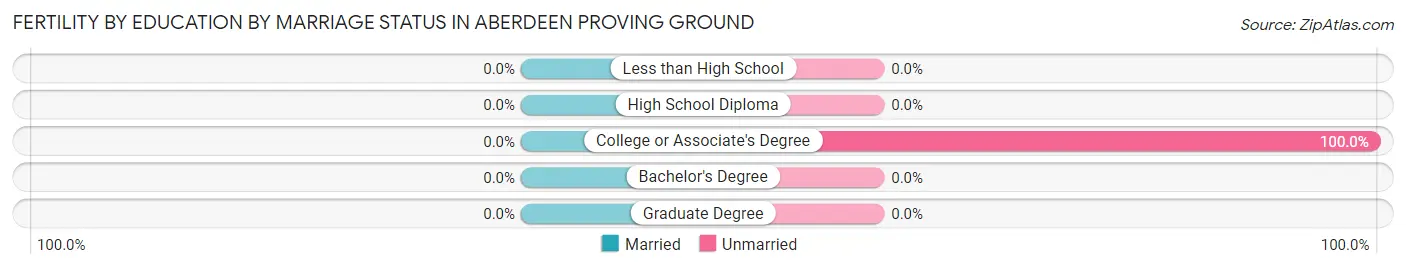
| Educational Attainment | Married | Unmarried |
| Less than High School | 0 (0.0%) | 0 (0.0%) |
| High School Diploma | 0 (0.0%) | 0 (0.0%) |
| College or Associate's Degree | 0 (0.0%) | 12 (100.0%) |
| Bachelor's Degree | 0 (0.0%) | 0 (0.0%) |
| Graduate Degree | 0 (0.0%) | 0 (0.0%) |
| Total | 0 (0.0%) | 12 (100.0%) |
Employment Characteristics in Aberdeen Proving Ground
Employment by Class of Employer in Aberdeen Proving Ground
Among the 1,430 employed individuals in Aberdeen Proving Ground, federal government employees (695 | 48.6%), private company employees (577 | 40.4%), and not-for-profit organizations (55 | 3.8%) make up the most common classes of employment.
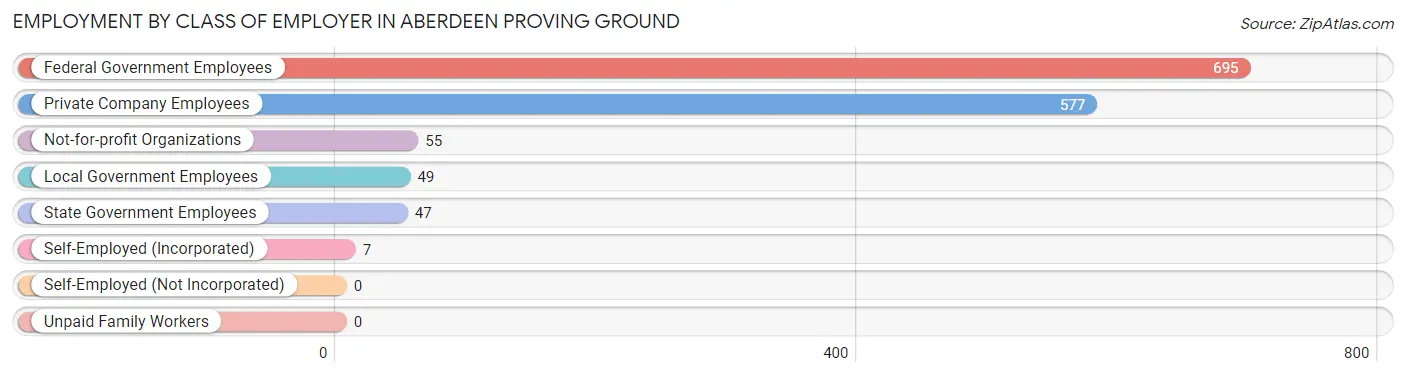
| Employer Class | # Employees | % Employees |
| Private Company Employees | 577 | 40.4% |
| Self-Employed (Incorporated) | 7 | 0.5% |
| Self-Employed (Not Incorporated) | 0 | 0.0% |
| Not-for-profit Organizations | 55 | 3.8% |
| Local Government Employees | 49 | 3.4% |
| State Government Employees | 47 | 3.3% |
| Federal Government Employees | 695 | 48.6% |
| Unpaid Family Workers | 0 | 0.0% |
| Total | 1,430 | 100.0% |
Employment Status by Age in Aberdeen Proving Ground
According to the labor force statistics for Aberdeen Proving Ground, out of the total population over 16 years of age (1,962), 77.5% or 1,521 individuals are in the labor force, with 6.3% or 96 of them unemployed. The age group with the highest labor force participation rate is 30 to 34 years, with 97.3% or 286 individuals in the labor force. Within the labor force, the 16 to 19 years age range has the highest percentage of unemployed individuals, with 53.0% or 43 of them being unemployed.
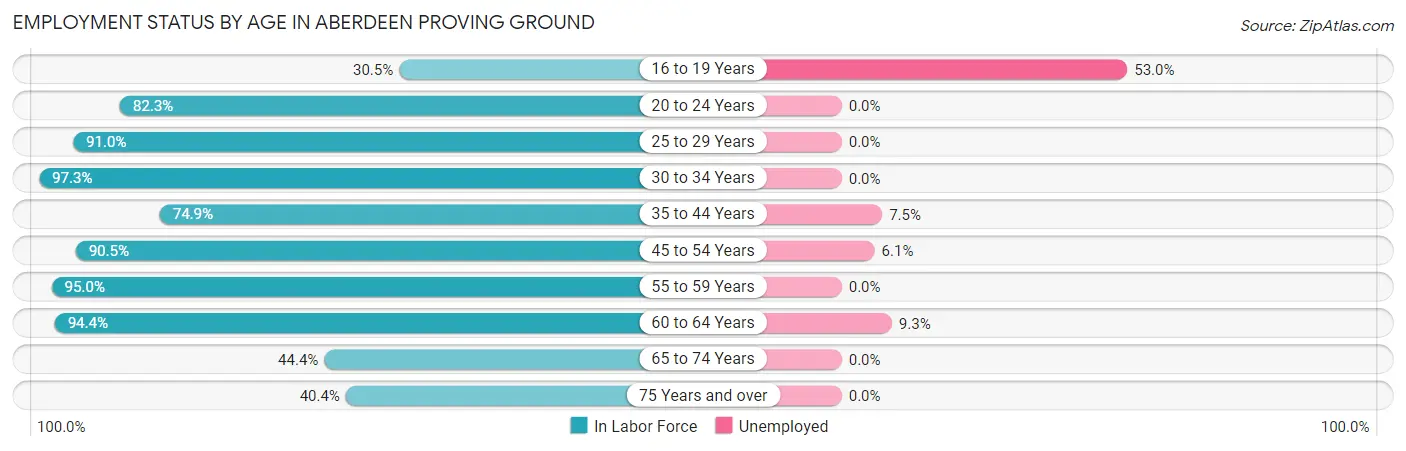
| Age Bracket | In Labor Force | Unemployed |
| 16 to 19 Years | 82 (30.5%) | 43 (53.0%) |
| 20 to 24 Years | 135 (82.3%) | 0 (0.0%) |
| 25 to 29 Years | 161 (91.0%) | 0 (0.0%) |
| 30 to 34 Years | 286 (97.3%) | 0 (0.0%) |
| 35 to 44 Years | 307 (74.9%) | 23 (7.5%) |
| 45 to 54 Years | 238 (90.5%) | 15 (6.1%) |
| 55 to 59 Years | 151 (95.0%) | 0 (0.0%) |
| 60 to 64 Years | 118 (94.4%) | 11 (9.3%) |
| 65 to 74 Years | 24 (44.4%) | 0 (0.0%) |
| 75 Years and over | 19 (40.4%) | 0 (0.0%) |
| Total | 1,521 (77.5%) | 96 (6.3%) |
Employment Status by Educational Attainment in Aberdeen Proving Ground
According to labor force statistics for Aberdeen Proving Ground, 88.3% of individuals (1,261) out of the total population between 25 and 64 years of age (1,428) are in the labor force, with 4.2% or 53 of them being unemployed. The group with the highest labor force participation rate are those with the educational attainment of college / associate degree, with 92.8% or 414 individuals in the labor force. Within the labor force, individuals with less than high school education have the highest percentage of unemployment, with 35.0% or 14 of them being unemployed.
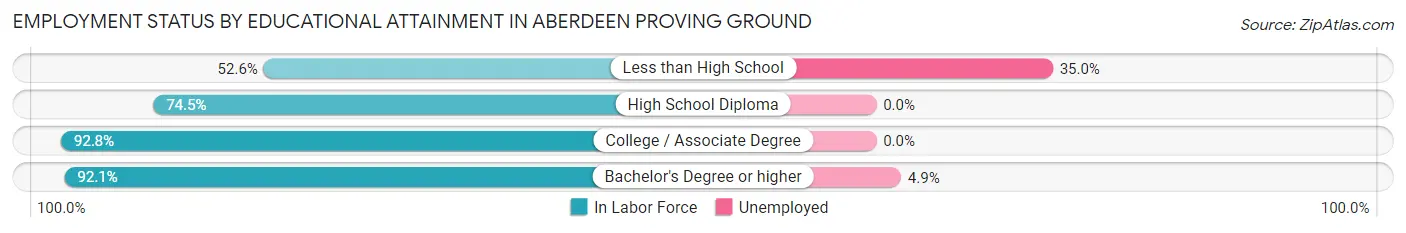
| Educational Attainment | In Labor Force | Unemployed |
| Less than High School | 40 (52.6%) | 27 (35.0%) |
| High School Diploma | 117 (74.5%) | 0 (0.0%) |
| College / Associate Degree | 414 (92.8%) | 0 (0.0%) |
| Bachelor's Degree or higher | 690 (92.1%) | 37 (4.9%) |
| Total | 1,261 (88.3%) | 60 (4.2%) |
Employment Occupations by Sex in Aberdeen Proving Ground
Management, Business, Science and Arts Occupations
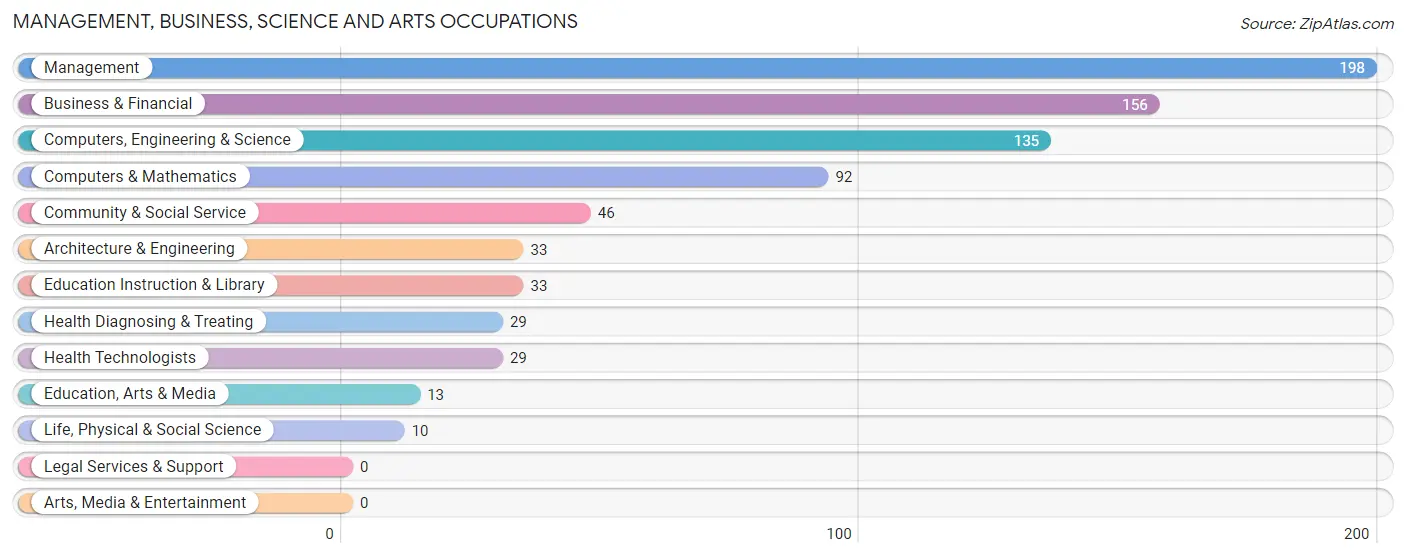
The most common Management, Business, Science and Arts occupations in Aberdeen Proving Ground are Management (198 | 16.8%), Business & Financial (156 | 13.2%), Computers, Engineering & Science (135 | 11.4%), Computers & Mathematics (92 | 7.8%), and Community & Social Service (46 | 3.9%).
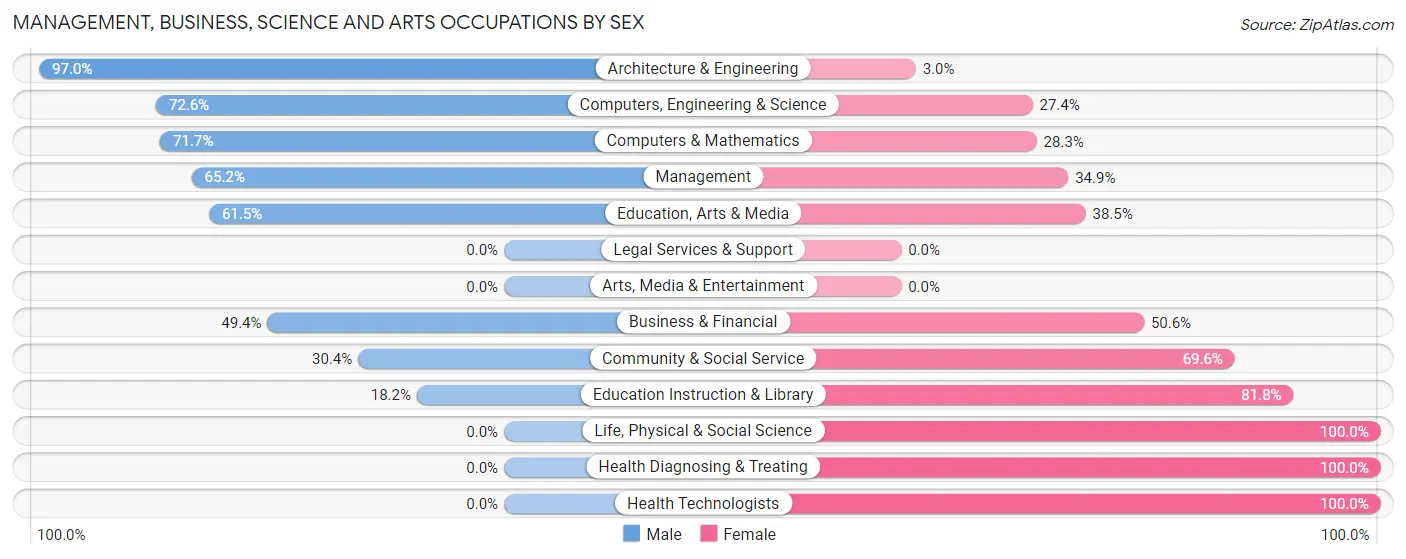
Management, Business, Science and Arts Occupations by Sex
Within the Management, Business, Science and Arts occupations in Aberdeen Proving Ground, the most male-oriented occupations are Architecture & Engineering (97.0%), Computers, Engineering & Science (72.6%), and Computers & Mathematics (71.7%), while the most female-oriented occupations are Life, Physical & Social Science (100.0%), Health Diagnosing & Treating (100.0%), and Health Technologists (100.0%).
| Occupation | Male | Female |
| Management | 129 (65.1%) | 69 (34.8%) |
| Business & Financial | 77 (49.4%) | 79 (50.6%) |
| Computers, Engineering & Science | 98 (72.6%) | 37 (27.4%) |
| Computers & Mathematics | 66 (71.7%) | 26 (28.3%) |
| Architecture & Engineering | 32 (97.0%) | 1 (3.0%) |
| Life, Physical & Social Science | 0 (0.0%) | 10 (100.0%) |
| Community & Social Service | 14 (30.4%) | 32 (69.6%) |
| Education, Arts & Media | 8 (61.5%) | 5 (38.5%) |
| Legal Services & Support | 0 (0.0%) | 0 (0.0%) |
| Education Instruction & Library | 6 (18.2%) | 27 (81.8%) |
| Arts, Media & Entertainment | 0 (0.0%) | 0 (0.0%) |
| Health Diagnosing & Treating | 0 (0.0%) | 29 (100.0%) |
| Health Technologists | 0 (0.0%) | 29 (100.0%) |
| Total (Category) | 318 (56.4%) | 246 (43.6%) |
| Total (Overall) | 634 (53.7%) | 546 (46.3%) |
Services Occupations
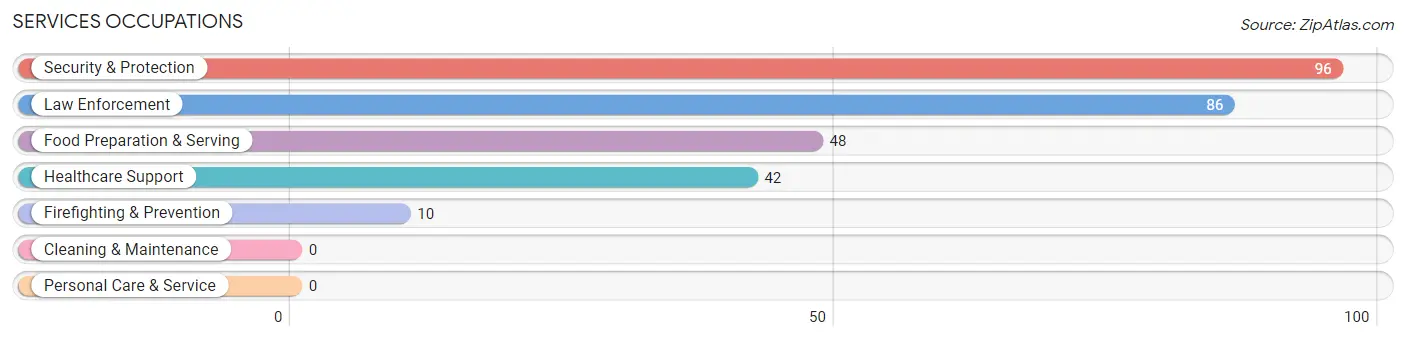
The most common Services occupations in Aberdeen Proving Ground are Security & Protection (96 | 8.1%), Law Enforcement (86 | 7.3%), Food Preparation & Serving (48 | 4.1%), Healthcare Support (42 | 3.6%), and Firefighting & Prevention (10 | 0.9%).
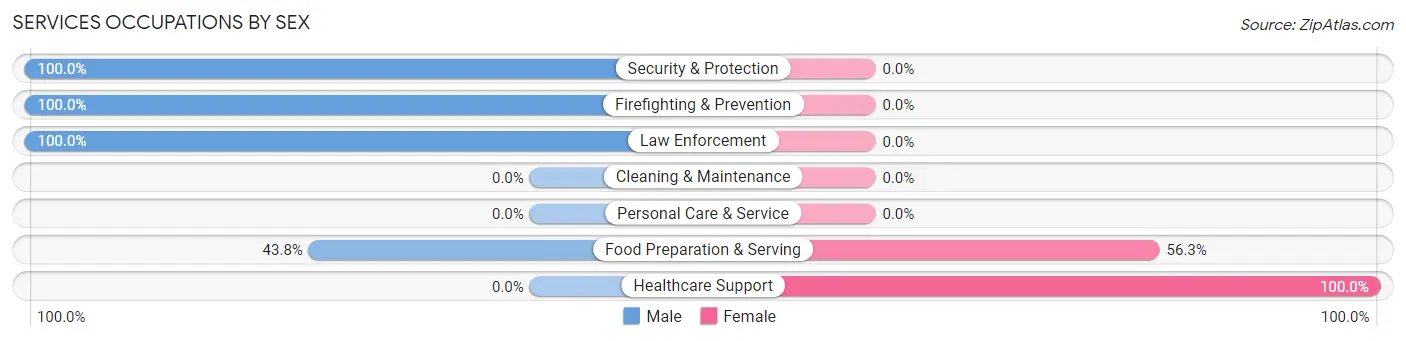
Services Occupations by Sex
Within the Services occupations in Aberdeen Proving Ground, the most male-oriented occupations are Security & Protection (100.0%), Firefighting & Prevention (100.0%), and Law Enforcement (100.0%), while the most female-oriented occupations are Healthcare Support (100.0%), and Food Preparation & Serving (56.2%).
| Occupation | Male | Female |
| Healthcare Support | 0 (0.0%) | 42 (100.0%) |
| Security & Protection | 96 (100.0%) | 0 (0.0%) |
| Firefighting & Prevention | 10 (100.0%) | 0 (0.0%) |
| Law Enforcement | 86 (100.0%) | 0 (0.0%) |
| Food Preparation & Serving | 21 (43.8%) | 27 (56.2%) |
| Cleaning & Maintenance | 0 (0.0%) | 0 (0.0%) |
| Personal Care & Service | 0 (0.0%) | 0 (0.0%) |
| Total (Category) | 117 (62.9%) | 69 (37.1%) |
| Total (Overall) | 634 (53.7%) | 546 (46.3%) |
Sales and Office Occupations
The most common Sales and Office occupations in Aberdeen Proving Ground are Office & Administration (203 | 17.2%), and Sales & Related (57 | 4.8%).

Sales and Office Occupations by Sex
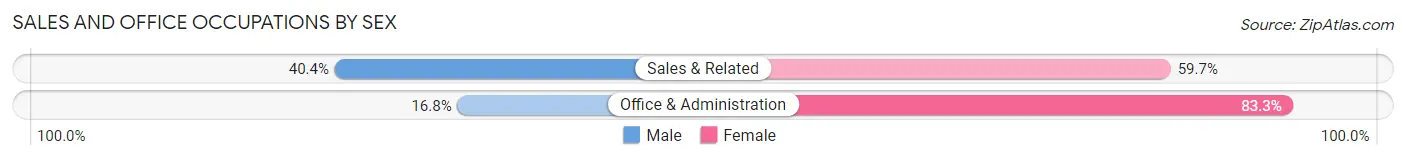
| Occupation | Male | Female |
| Sales & Related | 23 (40.4%) | 34 (59.7%) |
| Office & Administration | 34 (16.8%) | 169 (83.3%) |
| Total (Category) | 57 (21.9%) | 203 (78.1%) |
| Total (Overall) | 634 (53.7%) | 546 (46.3%) |
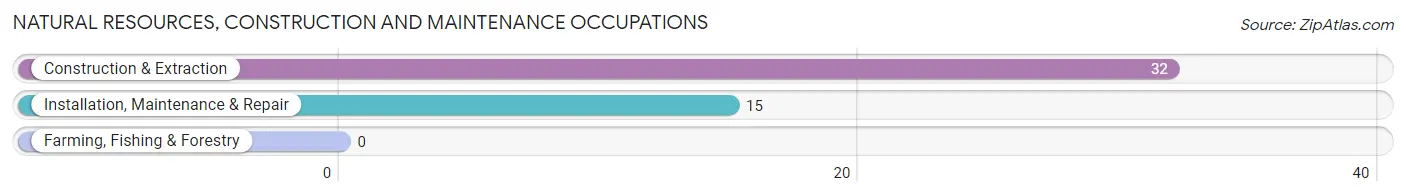
Natural Resources, Construction and Maintenance Occupations
The most common Natural Resources, Construction and Maintenance occupations in Aberdeen Proving Ground are Construction & Extraction (32 | 2.7%), and Installation, Maintenance & Repair (15 | 1.3%).
Natural Resources, Construction and Maintenance Occupations by Sex
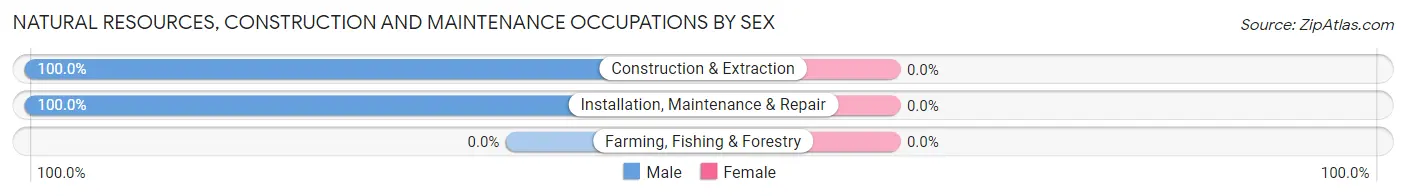
| Occupation | Male | Female |
| Farming, Fishing & Forestry | 0 (0.0%) | 0 (0.0%) |
| Construction & Extraction | 32 (100.0%) | 0 (0.0%) |
| Installation, Maintenance & Repair | 15 (100.0%) | 0 (0.0%) |
| Total (Category) | 47 (100.0%) | 0 (0.0%) |
| Total (Overall) | 634 (53.7%) | 546 (46.3%) |
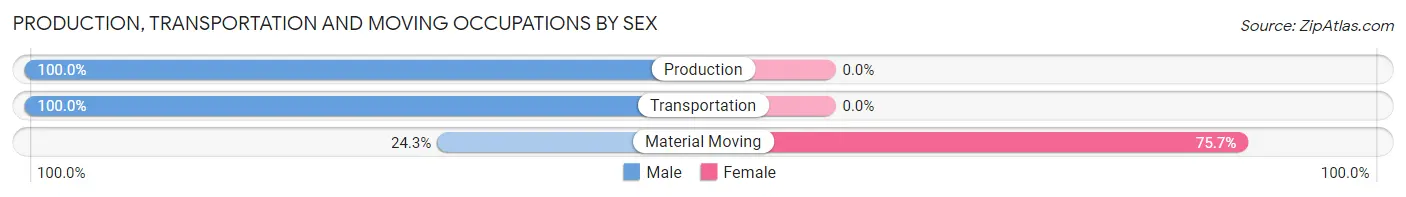
Production, Transportation and Moving Occupations
The most common Production, Transportation and Moving occupations in Aberdeen Proving Ground are Transportation (67 | 5.7%), Material Moving (37 | 3.1%), and Production (19 | 1.6%).
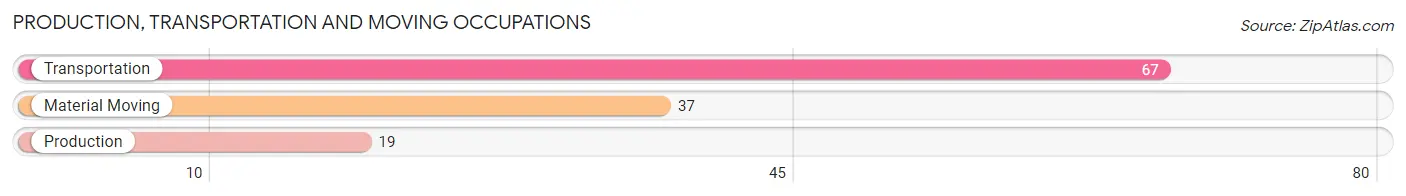
Production, Transportation and Moving Occupations by Sex
| Occupation | Male | Female |
| Production | 19 (100.0%) | 0 (0.0%) |
| Transportation | 67 (100.0%) | 0 (0.0%) |
| Material Moving | 9 (24.3%) | 28 (75.7%) |
| Total (Category) | 95 (77.2%) | 28 (22.8%) |
| Total (Overall) | 634 (53.7%) | 546 (46.3%) |
Employment Industries by Sex in Aberdeen Proving Ground
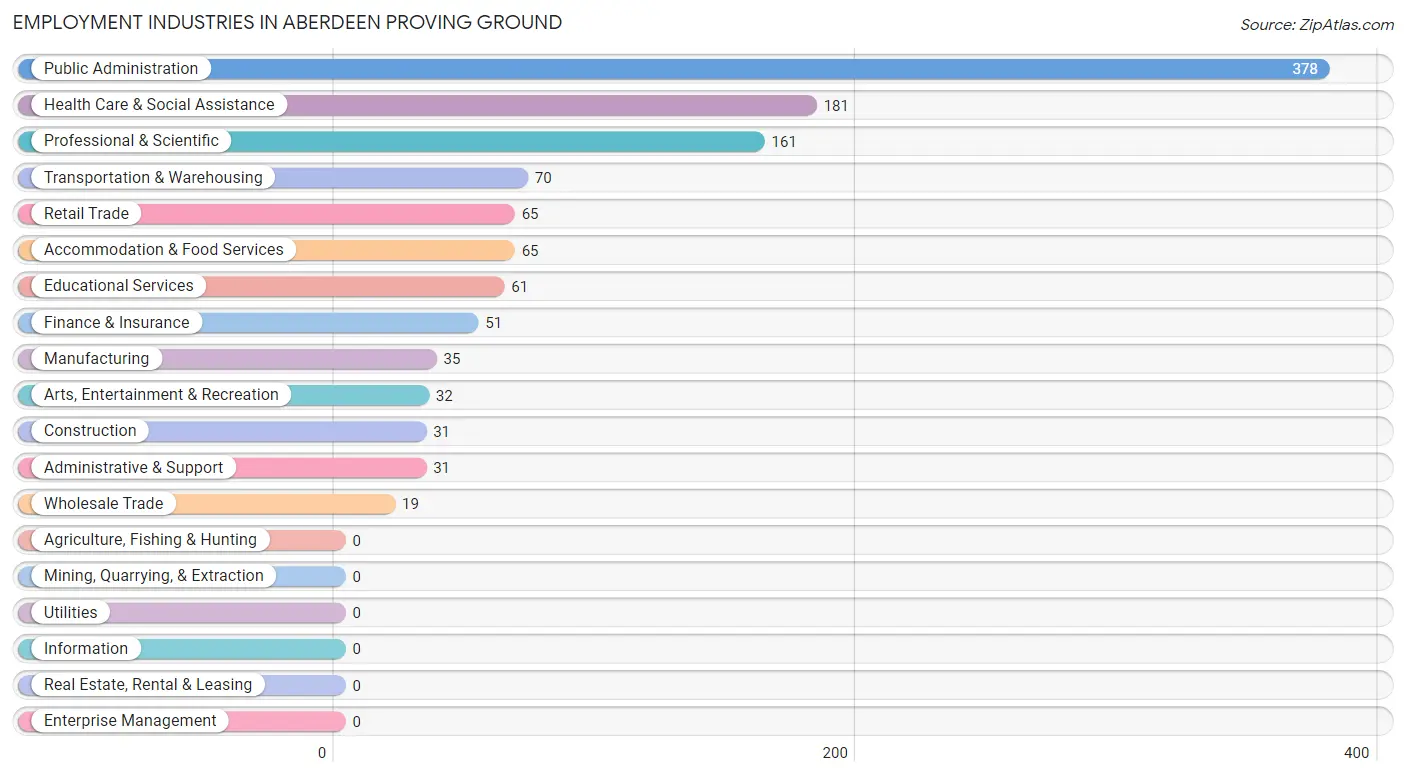
Employment Industries in Aberdeen Proving Ground
The major employment industries in Aberdeen Proving Ground include Public Administration (378 | 32.0%), Health Care & Social Assistance (181 | 15.3%), Professional & Scientific (161 | 13.6%), Transportation & Warehousing (70 | 5.9%), and Retail Trade (65 | 5.5%).
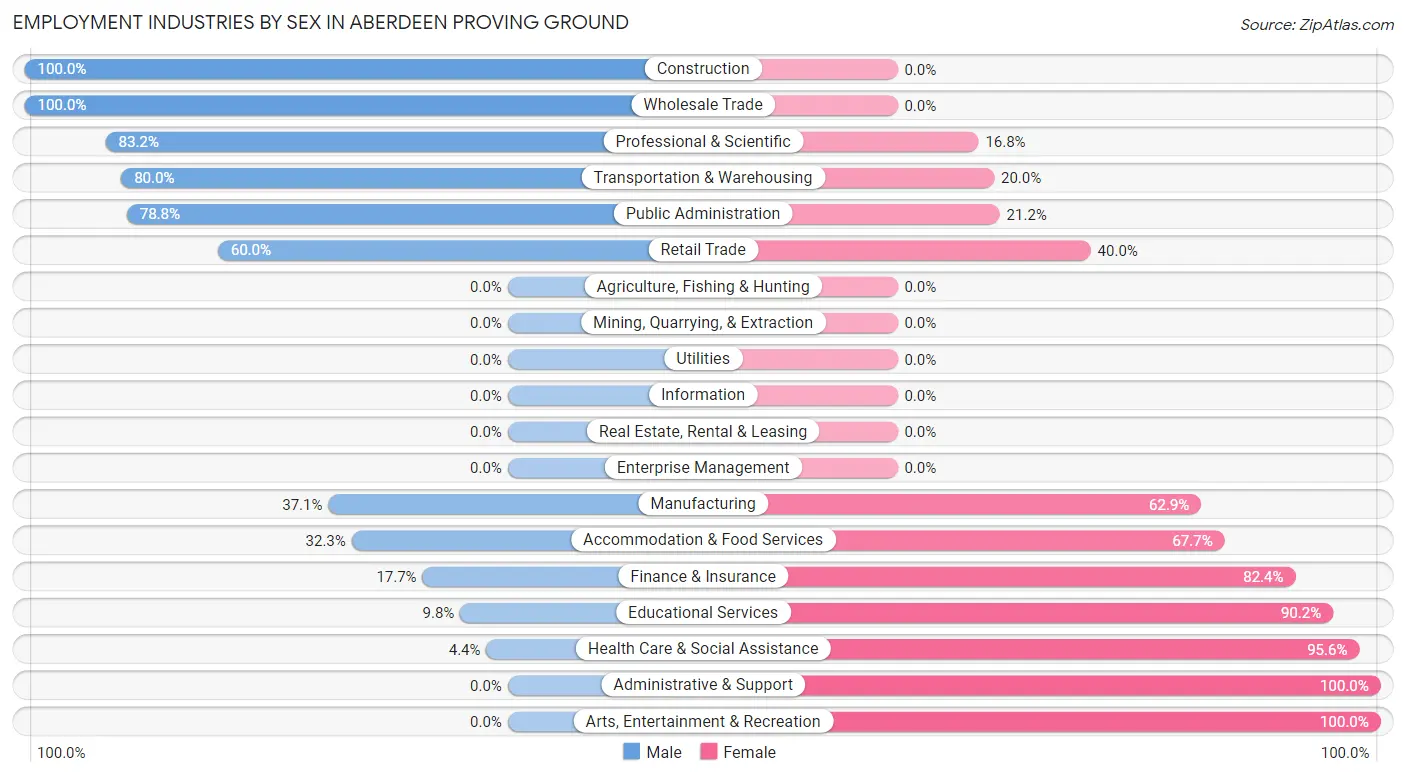
Employment Industries by Sex in Aberdeen Proving Ground
The Aberdeen Proving Ground industries that see more men than women are Construction (100.0%), Wholesale Trade (100.0%), and Professional & Scientific (83.2%), whereas the industries that tend to have a higher number of women are Administrative & Support (100.0%), Arts, Entertainment & Recreation (100.0%), and Health Care & Social Assistance (95.6%).
| Industry | Male | Female |
| Agriculture, Fishing & Hunting | 0 (0.0%) | 0 (0.0%) |
| Mining, Quarrying, & Extraction | 0 (0.0%) | 0 (0.0%) |
| Construction | 31 (100.0%) | 0 (0.0%) |
| Manufacturing | 13 (37.1%) | 22 (62.9%) |
| Wholesale Trade | 19 (100.0%) | 0 (0.0%) |
| Retail Trade | 39 (60.0%) | 26 (40.0%) |
| Transportation & Warehousing | 56 (80.0%) | 14 (20.0%) |
| Utilities | 0 (0.0%) | 0 (0.0%) |
| Information | 0 (0.0%) | 0 (0.0%) |
| Finance & Insurance | 9 (17.6%) | 42 (82.4%) |
| Real Estate, Rental & Leasing | 0 (0.0%) | 0 (0.0%) |
| Professional & Scientific | 134 (83.2%) | 27 (16.8%) |
| Enterprise Management | 0 (0.0%) | 0 (0.0%) |
| Administrative & Support | 0 (0.0%) | 31 (100.0%) |
| Educational Services | 6 (9.8%) | 55 (90.2%) |
| Health Care & Social Assistance | 8 (4.4%) | 173 (95.6%) |
| Arts, Entertainment & Recreation | 0 (0.0%) | 32 (100.0%) |
| Accommodation & Food Services | 21 (32.3%) | 44 (67.7%) |
| Public Administration | 298 (78.8%) | 80 (21.2%) |
| Total | 634 (53.7%) | 546 (46.3%) |
Education in Aberdeen Proving Ground
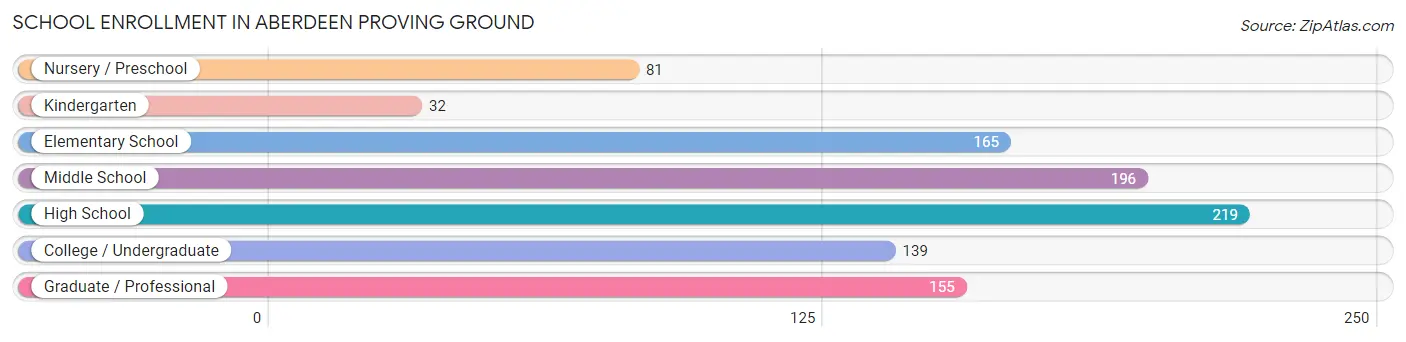
School Enrollment in Aberdeen Proving Ground
The most common levels of schooling among the 987 students in Aberdeen Proving Ground are high school (219 | 22.2%), middle school (196 | 19.9%), and elementary school (165 | 16.7%).
| School Level | # Students | % Students |
| Nursery / Preschool | 81 | 8.2% |
| Kindergarten | 32 | 3.2% |
| Elementary School | 165 | 16.7% |
| Middle School | 196 | 19.9% |
| High School | 219 | 22.2% |
| College / Undergraduate | 139 | 14.1% |
| Graduate / Professional | 155 | 15.7% |
| Total | 987 | 100.0% |
School Enrollment by Age by Funding Source in Aberdeen Proving Ground
Out of a total of 987 students who are enrolled in schools in Aberdeen Proving Ground, 122 (12.4%) attend a private institution, while the remaining 865 (87.6%) are enrolled in public schools. The age group of 18 to 19 year olds has the highest likelihood of being enrolled in private schools, with 7 (58.3% in the age bracket) enrolled. Conversely, the age group of 15 to 17 year olds has the lowest likelihood of being enrolled in a private school, with 183 (100.0% in the age bracket) attending a public institution.
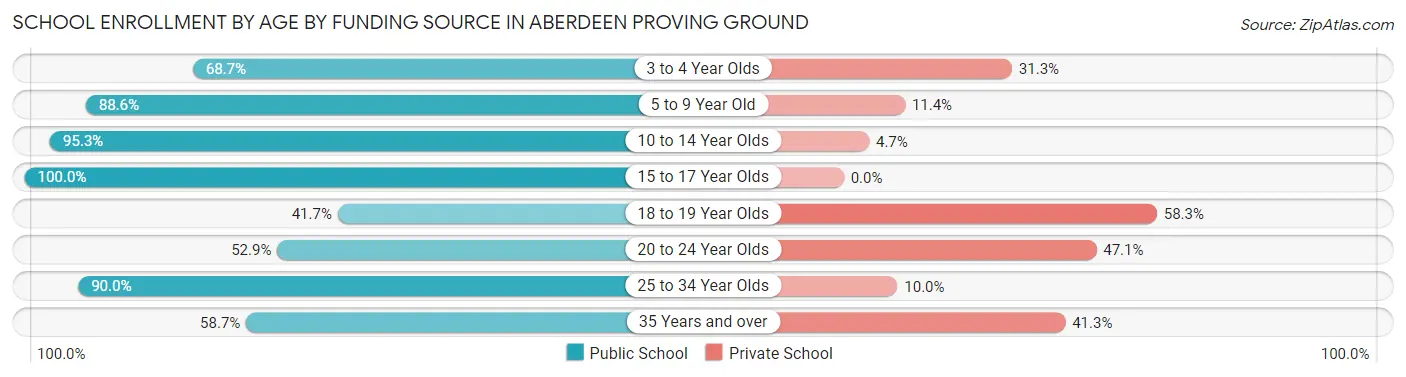
| Age Bracket | Public School | Private School |
| 3 to 4 Year Olds | 46 (68.7%) | 21 (31.3%) |
| 5 to 9 Year Old | 163 (88.6%) | 21 (11.4%) |
| 10 to 14 Year Olds | 242 (95.3%) | 12 (4.7%) |
| 15 to 17 Year Olds | 183 (100.0%) | 0 (0.0%) |
| 18 to 19 Year Olds | 5 (41.7%) | 7 (58.3%) |
| 20 to 24 Year Olds | 18 (52.9%) | 16 (47.1%) |
| 25 to 34 Year Olds | 171 (90.0%) | 19 (10.0%) |
| 35 Years and over | 37 (58.7%) | 26 (41.3%) |
| Total | 865 (87.6%) | 122 (12.4%) |
Educational Attainment by Field of Study in Aberdeen Proving Ground
Arts & humanities (170 | 20.4%), business (139 | 16.7%), engineering (76 | 9.1%), education (71 | 8.5%), and visual & performing arts (69 | 8.3%) are the most common fields of study among 835 individuals in Aberdeen Proving Ground who have obtained a bachelor's degree or higher.
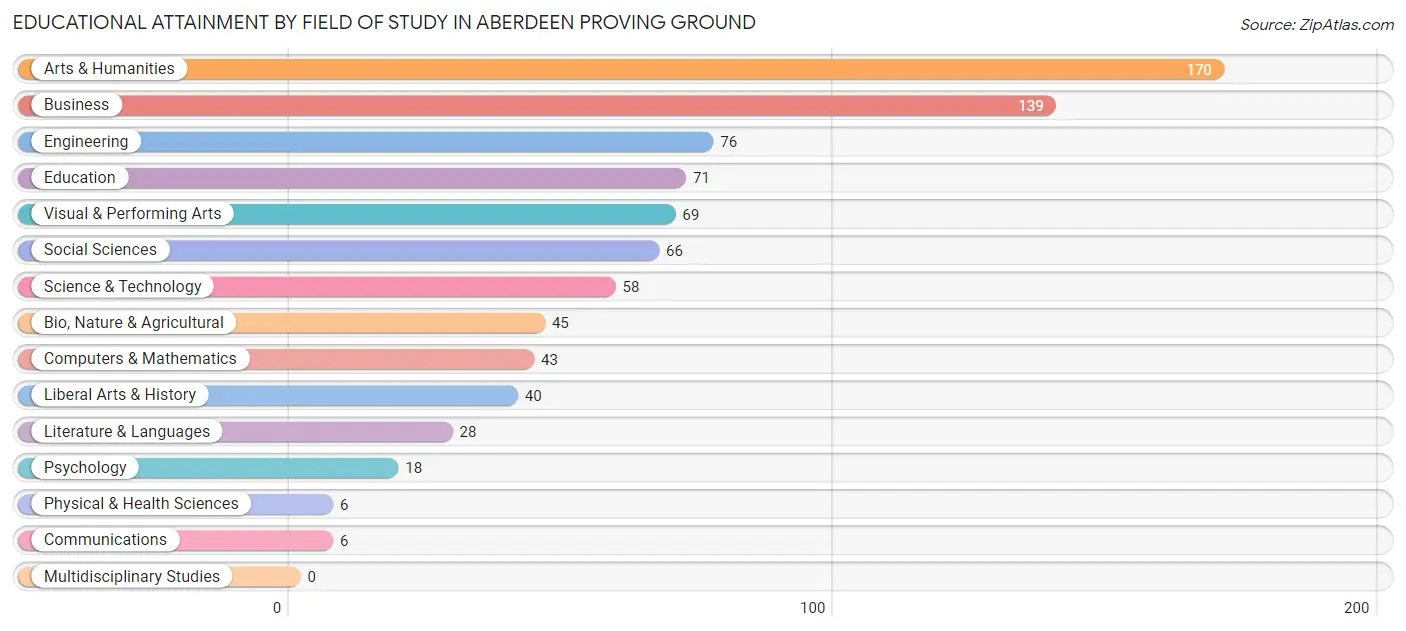
| Field of Study | # Graduates | % Graduates |
| Computers & Mathematics | 43 | 5.1% |
| Bio, Nature & Agricultural | 45 | 5.4% |
| Physical & Health Sciences | 6 | 0.7% |
| Psychology | 18 | 2.2% |
| Social Sciences | 66 | 7.9% |
| Engineering | 76 | 9.1% |
| Multidisciplinary Studies | 0 | 0.0% |
| Science & Technology | 58 | 7.0% |
| Business | 139 | 16.7% |
| Education | 71 | 8.5% |
| Literature & Languages | 28 | 3.4% |
| Liberal Arts & History | 40 | 4.8% |
| Visual & Performing Arts | 69 | 8.3% |
| Communications | 6 | 0.7% |
| Arts & Humanities | 170 | 20.4% |
| Total | 835 | 100.0% |
Transportation & Commute in Aberdeen Proving Ground
Vehicle Availability by Sex in Aberdeen Proving Ground
The most prevalent vehicle ownership categories in Aberdeen Proving Ground are males with 2 vehicles (315, accounting for 40.3%) and females with 2 vehicles (284, making up 56.8%).
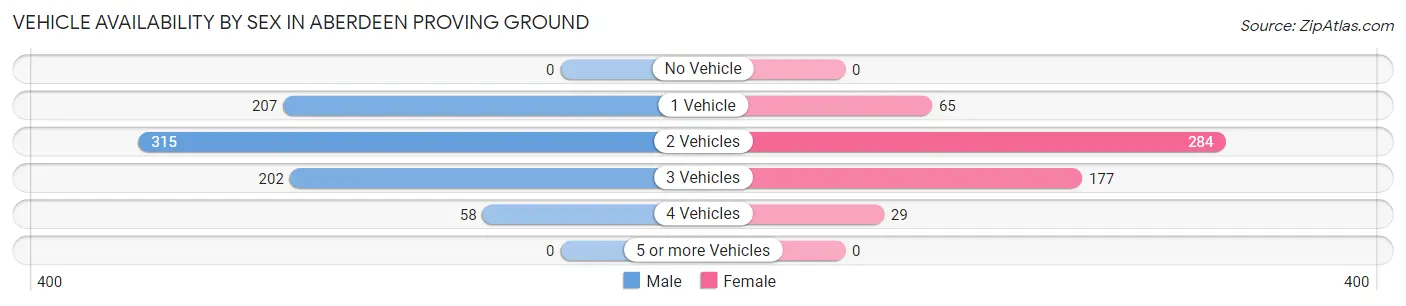
| Vehicles Available | Male | Female |
| No Vehicle | 0 (0.0%) | 0 (0.0%) |
| 1 Vehicle | 207 (26.5%) | 65 (11.7%) |
| 2 Vehicles | 315 (40.3%) | 284 (51.2%) |
| 3 Vehicles | 202 (25.8%) | 177 (31.9%) |
| 4 Vehicles | 58 (7.4%) | 29 (5.2%) |
| 5 or more Vehicles | 0 (0.0%) | 0 (0.0%) |
| Total | 782 (100.0%) | 555 (100.0%) |
Commute Time in Aberdeen Proving Ground
The most frequently occuring commute durations in Aberdeen Proving Ground are 10 to 14 minutes (347 commuters, 28.5%), 5 to 9 minutes (296 commuters, 24.3%), and 20 to 24 minutes (151 commuters, 12.4%).
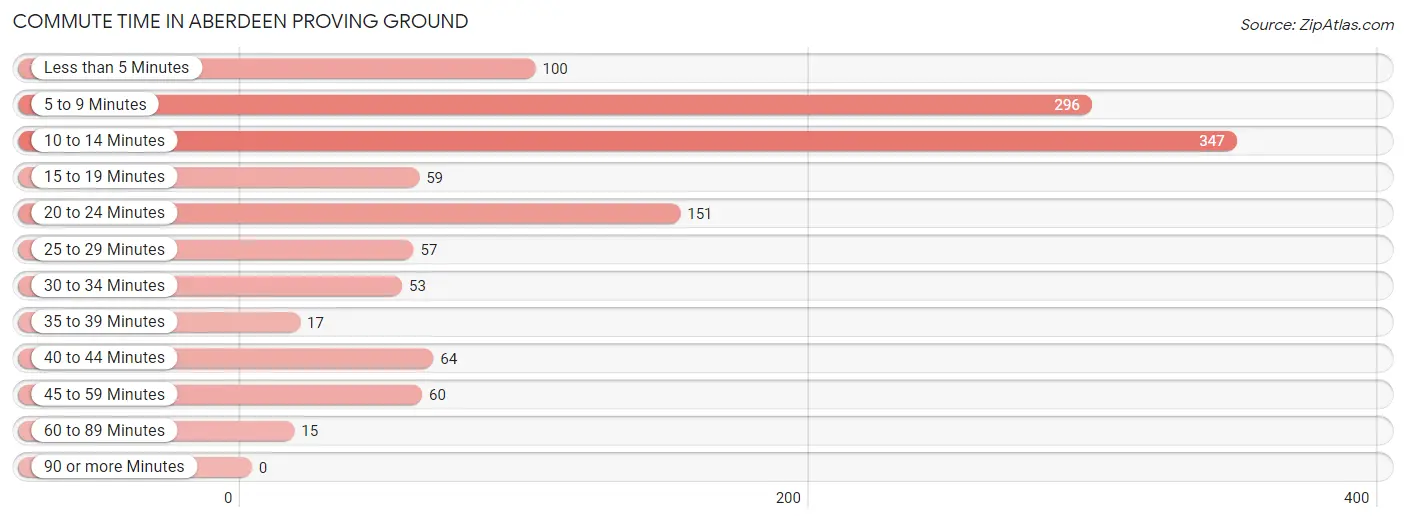
| Commute Time | # Commuters | % Commuters |
| Less than 5 Minutes | 100 | 8.2% |
| 5 to 9 Minutes | 296 | 24.3% |
| 10 to 14 Minutes | 347 | 28.5% |
| 15 to 19 Minutes | 59 | 4.8% |
| 20 to 24 Minutes | 151 | 12.4% |
| 25 to 29 Minutes | 57 | 4.7% |
| 30 to 34 Minutes | 53 | 4.3% |
| 35 to 39 Minutes | 17 | 1.4% |
| 40 to 44 Minutes | 64 | 5.2% |
| 45 to 59 Minutes | 60 | 4.9% |
| 60 to 89 Minutes | 15 | 1.2% |
| 90 or more Minutes | 0 | 0.0% |
Commute Time by Sex in Aberdeen Proving Ground
The most common commute times in Aberdeen Proving Ground are 10 to 14 minutes (219 commuters, 32.1%) for males and 20 to 24 minutes (138 commuters, 25.7%) for females.
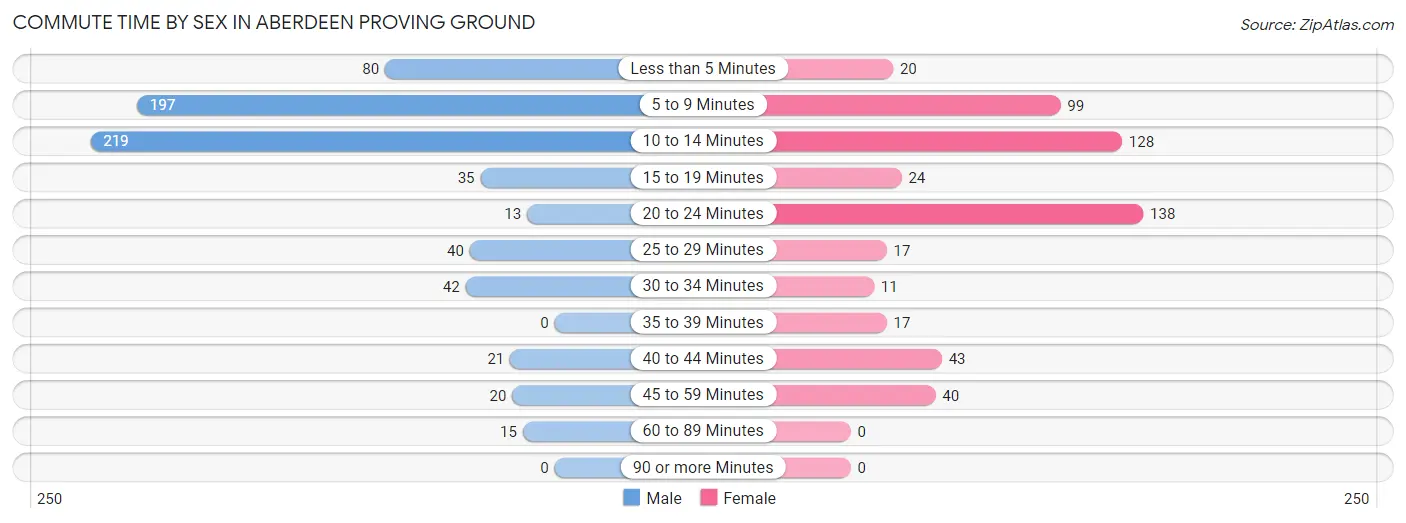
| Commute Time | Male | Female |
| Less than 5 Minutes | 80 (11.7%) | 20 (3.7%) |
| 5 to 9 Minutes | 197 (28.9%) | 99 (18.4%) |
| 10 to 14 Minutes | 219 (32.1%) | 128 (23.8%) |
| 15 to 19 Minutes | 35 (5.1%) | 24 (4.5%) |
| 20 to 24 Minutes | 13 (1.9%) | 138 (25.7%) |
| 25 to 29 Minutes | 40 (5.9%) | 17 (3.2%) |
| 30 to 34 Minutes | 42 (6.2%) | 11 (2.1%) |
| 35 to 39 Minutes | 0 (0.0%) | 17 (3.2%) |
| 40 to 44 Minutes | 21 (3.1%) | 43 (8.0%) |
| 45 to 59 Minutes | 20 (2.9%) | 40 (7.4%) |
| 60 to 89 Minutes | 15 (2.2%) | 0 (0.0%) |
| 90 or more Minutes | 0 (0.0%) | 0 (0.0%) |
Time of Departure to Work by Sex in Aberdeen Proving Ground
The most frequent times of departure to work in Aberdeen Proving Ground are 6:00 AM to 6:29 AM (123, 18.0%) for males and 7:00 AM to 7:29 AM (130, 24.2%) for females.
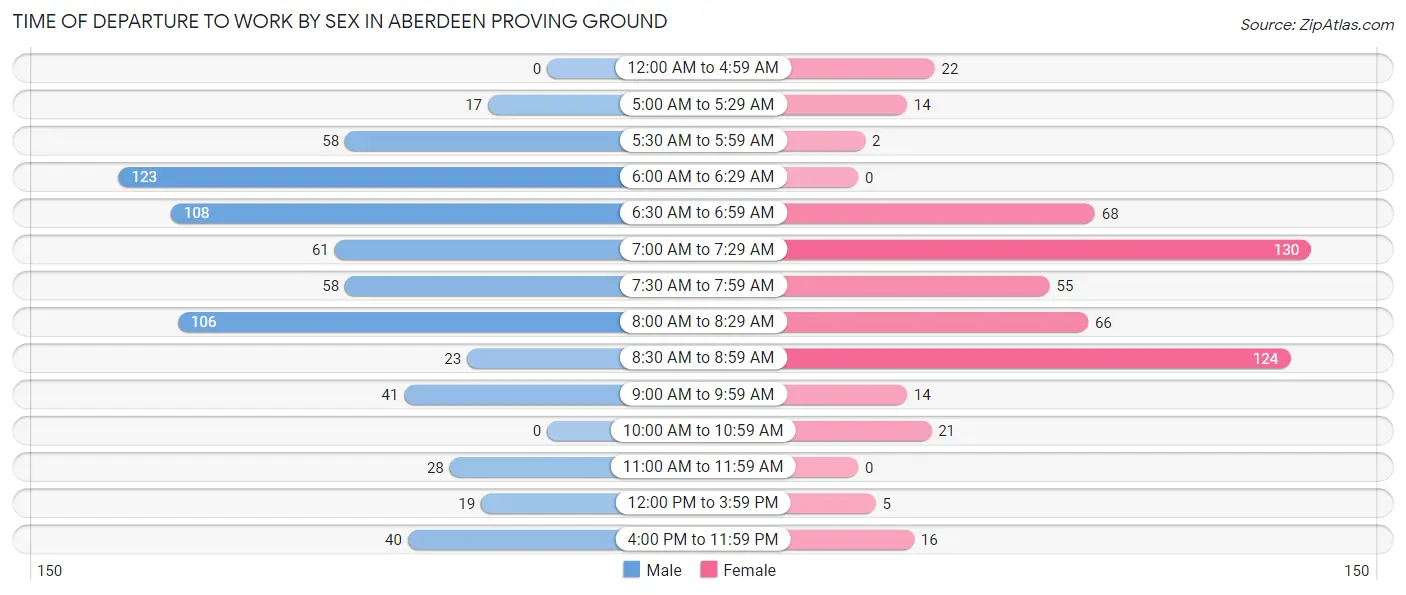
| Time of Departure | Male | Female |
| 12:00 AM to 4:59 AM | 0 (0.0%) | 22 (4.1%) |
| 5:00 AM to 5:29 AM | 17 (2.5%) | 14 (2.6%) |
| 5:30 AM to 5:59 AM | 58 (8.5%) | 2 (0.4%) |
| 6:00 AM to 6:29 AM | 123 (18.0%) | 0 (0.0%) |
| 6:30 AM to 6:59 AM | 108 (15.8%) | 68 (12.7%) |
| 7:00 AM to 7:29 AM | 61 (8.9%) | 130 (24.2%) |
| 7:30 AM to 7:59 AM | 58 (8.5%) | 55 (10.2%) |
| 8:00 AM to 8:29 AM | 106 (15.5%) | 66 (12.3%) |
| 8:30 AM to 8:59 AM | 23 (3.4%) | 124 (23.1%) |
| 9:00 AM to 9:59 AM | 41 (6.0%) | 14 (2.6%) |
| 10:00 AM to 10:59 AM | 0 (0.0%) | 21 (3.9%) |
| 11:00 AM to 11:59 AM | 28 (4.1%) | 0 (0.0%) |
| 12:00 PM to 3:59 PM | 19 (2.8%) | 5 (0.9%) |
| 4:00 PM to 11:59 PM | 40 (5.9%) | 16 (3.0%) |
| Total | 682 (100.0%) | 537 (100.0%) |
Housing Occupancy in Aberdeen Proving Ground
Occupancy by Ownership in Aberdeen Proving Ground
Of the total 834 dwellings in Aberdeen Proving Ground, owner-occupied units account for 11 (1.3%), while renter-occupied units make up 823 (98.7%).
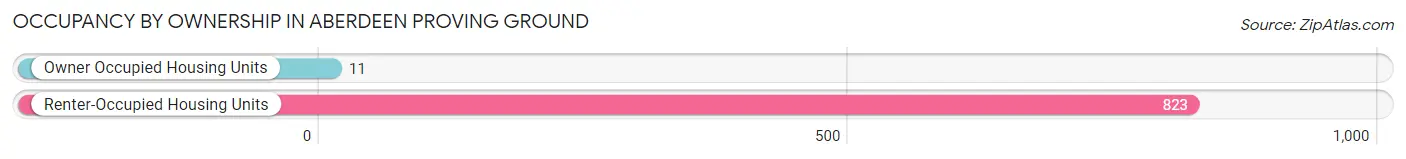
| Occupancy | # Housing Units | % Housing Units |
| Owner Occupied Housing Units | 11 | 1.3% |
| Renter-Occupied Housing Units | 823 | 98.7% |
| Total Occupied Housing Units | 834 | 100.0% |
Occupancy by Household Size in Aberdeen Proving Ground
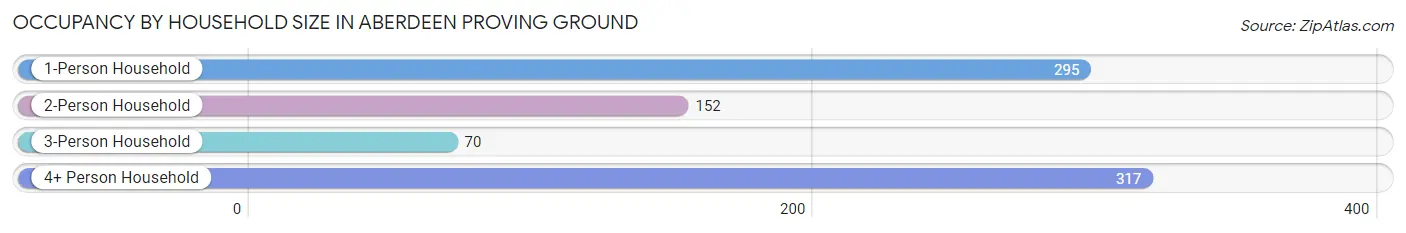
| Household Size | # Housing Units | % Housing Units |
| 1-Person Household | 295 | 35.4% |
| 2-Person Household | 152 | 18.2% |
| 3-Person Household | 70 | 8.4% |
| 4+ Person Household | 317 | 38.0% |
| Total Housing Units | 834 | 100.0% |
Occupancy by Ownership by Household Size in Aberdeen Proving Ground
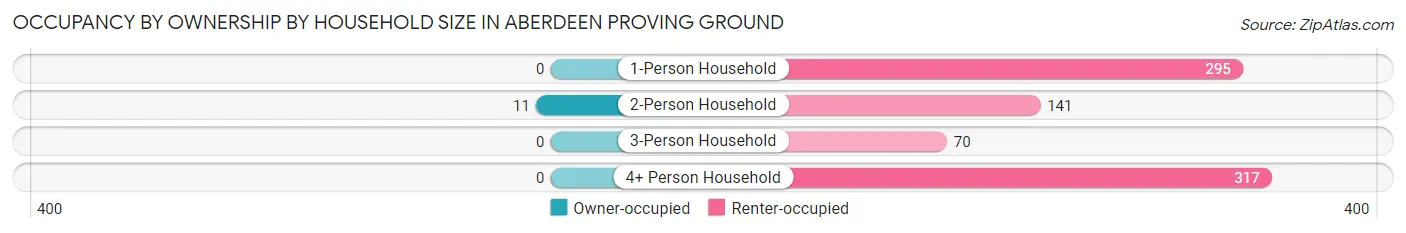
| Household Size | Owner-occupied | Renter-occupied |
| 1-Person Household | 0 (0.0%) | 295 (100.0%) |
| 2-Person Household | 11 (7.2%) | 141 (92.8%) |
| 3-Person Household | 0 (0.0%) | 70 (100.0%) |
| 4+ Person Household | 0 (0.0%) | 317 (100.0%) |
| Total Housing Units | 11 (1.3%) | 823 (98.7%) |
Occupancy by Educational Attainment in Aberdeen Proving Ground
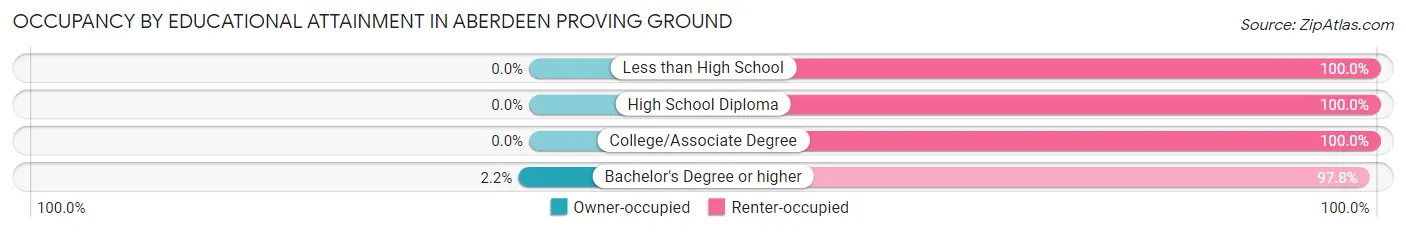
| Household Size | Owner-occupied | Renter-occupied |
| Less than High School | 0 (0.0%) | 14 (100.0%) |
| High School Diploma | 0 (0.0%) | 36 (100.0%) |
| College/Associate Degree | 0 (0.0%) | 276 (100.0%) |
| Bachelor's Degree or higher | 11 (2.2%) | 497 (97.8%) |
Occupancy by Age of Householder in Aberdeen Proving Ground
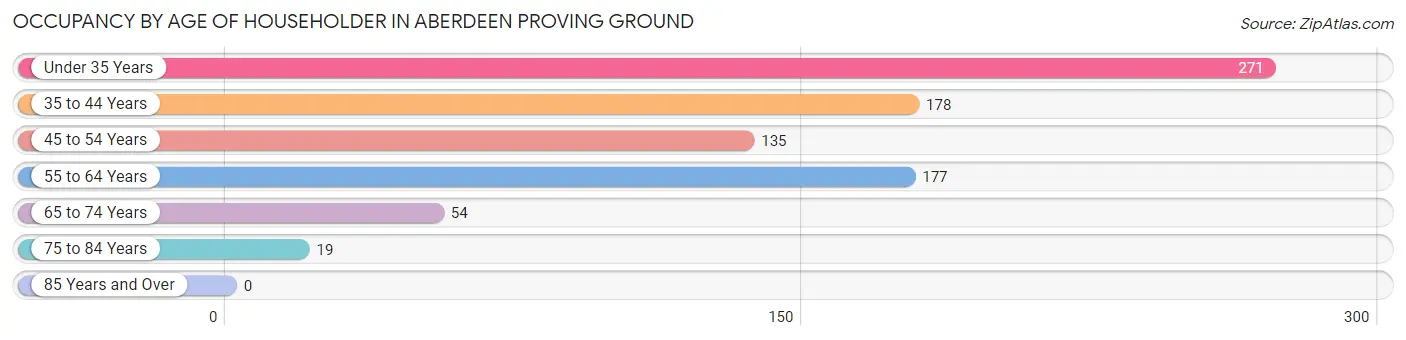
| Age Bracket | # Households | % Households |
| Under 35 Years | 271 | 32.5% |
| 35 to 44 Years | 178 | 21.3% |
| 45 to 54 Years | 135 | 16.2% |
| 55 to 64 Years | 177 | 21.2% |
| 65 to 74 Years | 54 | 6.5% |
| 75 to 84 Years | 19 | 2.3% |
| 85 Years and Over | 0 | 0.0% |
| Total | 834 | 100.0% |
Housing Finances in Aberdeen Proving Ground
Median Income by Occupancy in Aberdeen Proving Ground
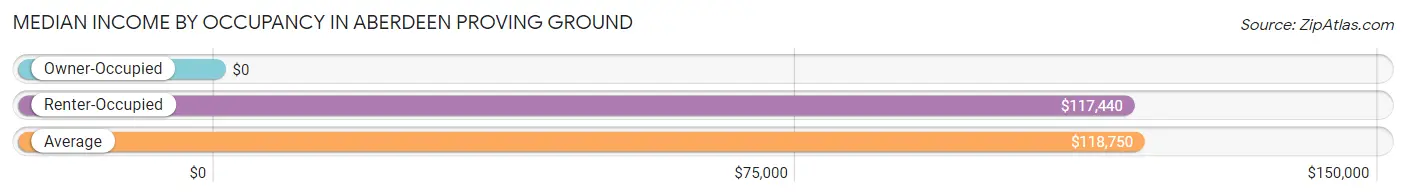
| Occupancy Type | # Households | Median Income |
| Owner-Occupied | 11 (1.3%) | $0 |
| Renter-Occupied | 823 (98.7%) | $117,440 |
| Average | 834 (100.0%) | $118,750 |
Occupancy by Householder Income Bracket in Aberdeen Proving Ground
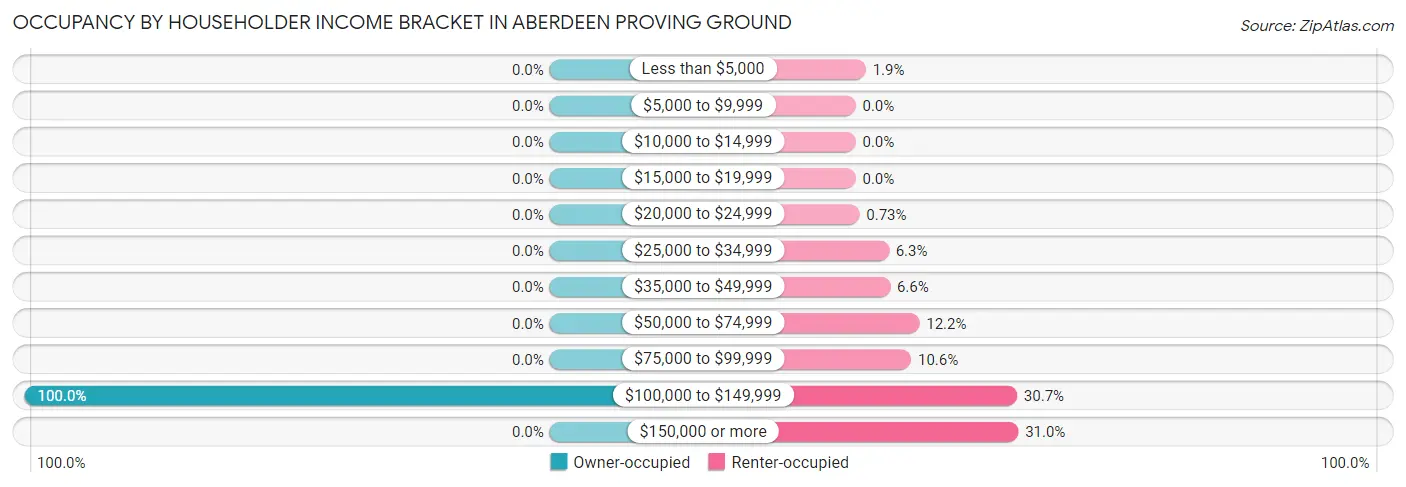
| Income Bracket | Owner-occupied | Renter-occupied |
| Less than $5,000 | 0 (0.0%) | 16 (1.9%) |
| $5,000 to $9,999 | 0 (0.0%) | 0 (0.0%) |
| $10,000 to $14,999 | 0 (0.0%) | 0 (0.0%) |
| $15,000 to $19,999 | 0 (0.0%) | 0 (0.0%) |
| $20,000 to $24,999 | 0 (0.0%) | 6 (0.7%) |
| $25,000 to $34,999 | 0 (0.0%) | 52 (6.3%) |
| $35,000 to $49,999 | 0 (0.0%) | 54 (6.6%) |
| $50,000 to $74,999 | 0 (0.0%) | 100 (12.1%) |
| $75,000 to $99,999 | 0 (0.0%) | 87 (10.6%) |
| $100,000 to $149,999 | 11 (100.0%) | 253 (30.7%) |
| $150,000 or more | 0 (0.0%) | 255 (31.0%) |
| Total | 11 (100.0%) | 823 (100.0%) |
Monthly Housing Cost Tiers in Aberdeen Proving Ground
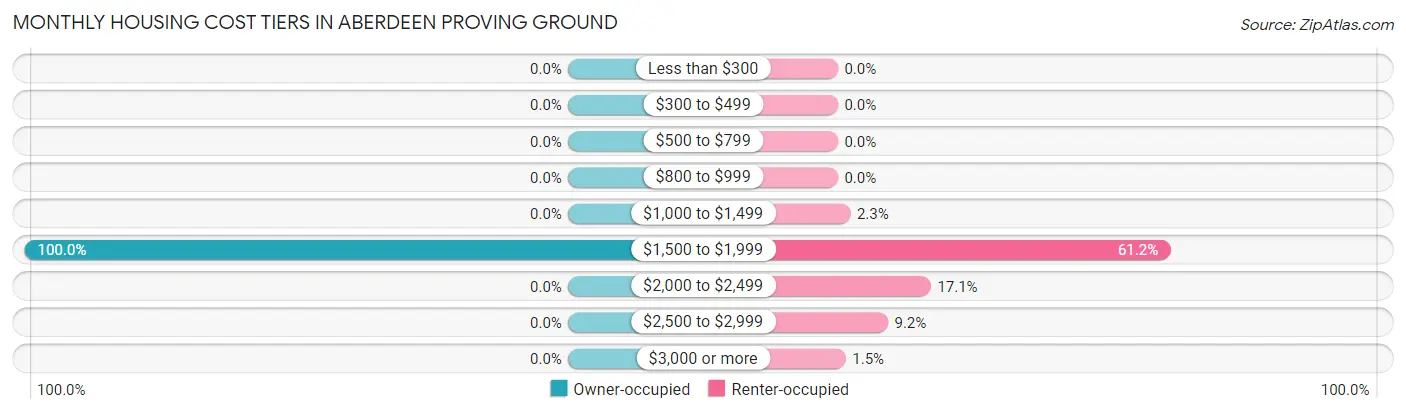
| Monthly Cost | Owner-occupied | Renter-occupied |
| Less than $300 | 0 (0.0%) | 0 (0.0%) |
| $300 to $499 | 0 (0.0%) | 0 (0.0%) |
| $500 to $799 | 0 (0.0%) | 0 (0.0%) |
| $800 to $999 | 0 (0.0%) | 0 (0.0%) |
| $1,000 to $1,499 | 0 (0.0%) | 19 (2.3%) |
| $1,500 to $1,999 | 11 (100.0%) | 504 (61.2%) |
| $2,000 to $2,499 | 0 (0.0%) | 141 (17.1%) |
| $2,500 to $2,999 | 0 (0.0%) | 76 (9.2%) |
| $3,000 or more | 0 (0.0%) | 12 (1.5%) |
| Total | 11 (100.0%) | 823 (100.0%) |
Physical Housing Characteristics in Aberdeen Proving Ground
Housing Structures in Aberdeen Proving Ground
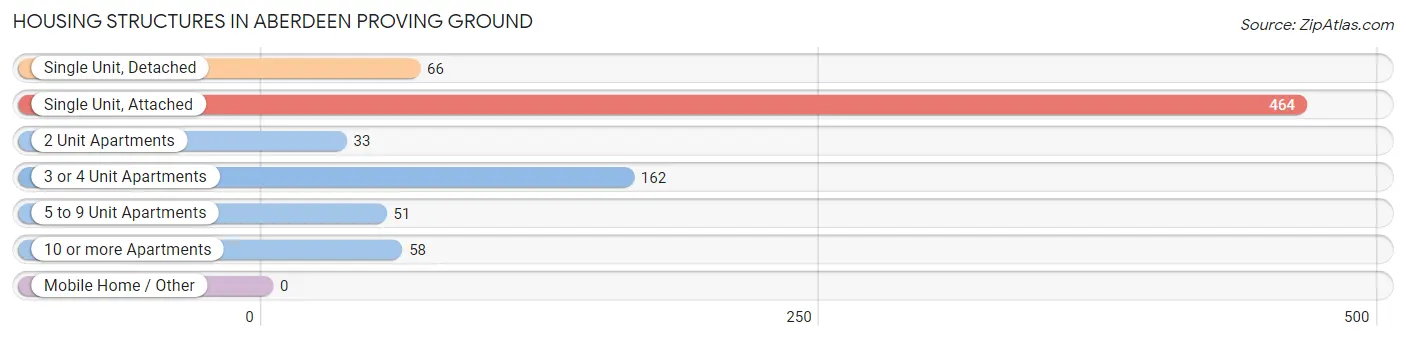
| Structure Type | # Housing Units | % Housing Units |
| Single Unit, Detached | 66 | 7.9% |
| Single Unit, Attached | 464 | 55.6% |
| 2 Unit Apartments | 33 | 4.0% |
| 3 or 4 Unit Apartments | 162 | 19.4% |
| 5 to 9 Unit Apartments | 51 | 6.1% |
| 10 or more Apartments | 58 | 7.0% |
| Mobile Home / Other | 0 | 0.0% |
| Total | 834 | 100.0% |
Housing Structures by Occupancy in Aberdeen Proving Ground
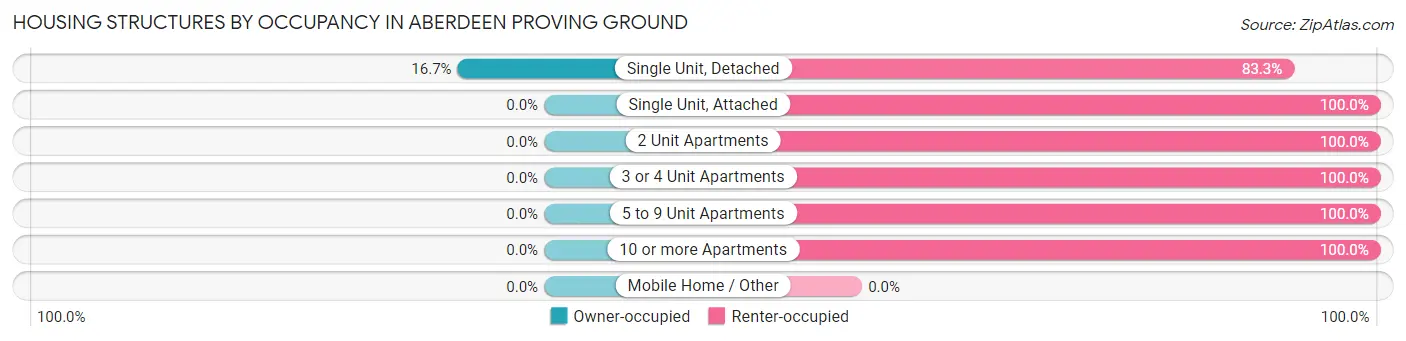
| Structure Type | Owner-occupied | Renter-occupied |
| Single Unit, Detached | 11 (16.7%) | 55 (83.3%) |
| Single Unit, Attached | 0 (0.0%) | 464 (100.0%) |
| 2 Unit Apartments | 0 (0.0%) | 33 (100.0%) |
| 3 or 4 Unit Apartments | 0 (0.0%) | 162 (100.0%) |
| 5 to 9 Unit Apartments | 0 (0.0%) | 51 (100.0%) |
| 10 or more Apartments | 0 (0.0%) | 58 (100.0%) |
| Mobile Home / Other | 0 (0.0%) | 0 (0.0%) |
| Total | 11 (1.3%) | 823 (98.7%) |
Housing Structures by Number of Rooms in Aberdeen Proving Ground
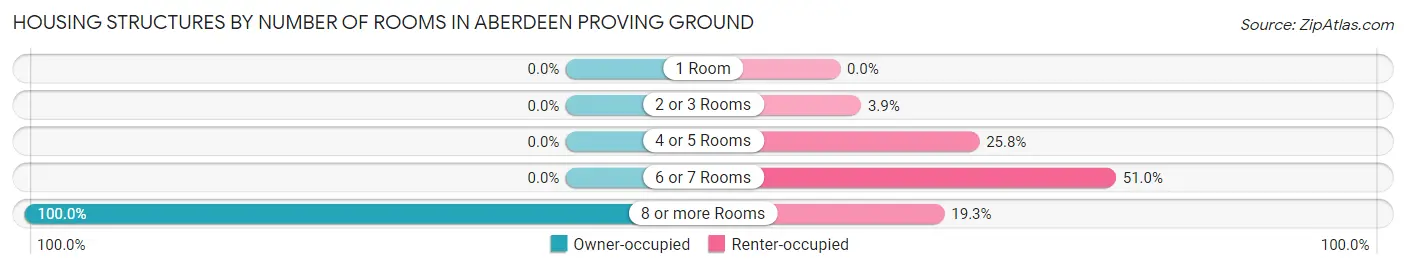
| Number of Rooms | Owner-occupied | Renter-occupied |
| 1 Room | 0 (0.0%) | 0 (0.0%) |
| 2 or 3 Rooms | 0 (0.0%) | 32 (3.9%) |
| 4 or 5 Rooms | 0 (0.0%) | 212 (25.8%) |
| 6 or 7 Rooms | 0 (0.0%) | 420 (51.0%) |
| 8 or more Rooms | 11 (100.0%) | 159 (19.3%) |
| Total | 11 (100.0%) | 823 (100.0%) |
Housing Structure by Heating Type in Aberdeen Proving Ground
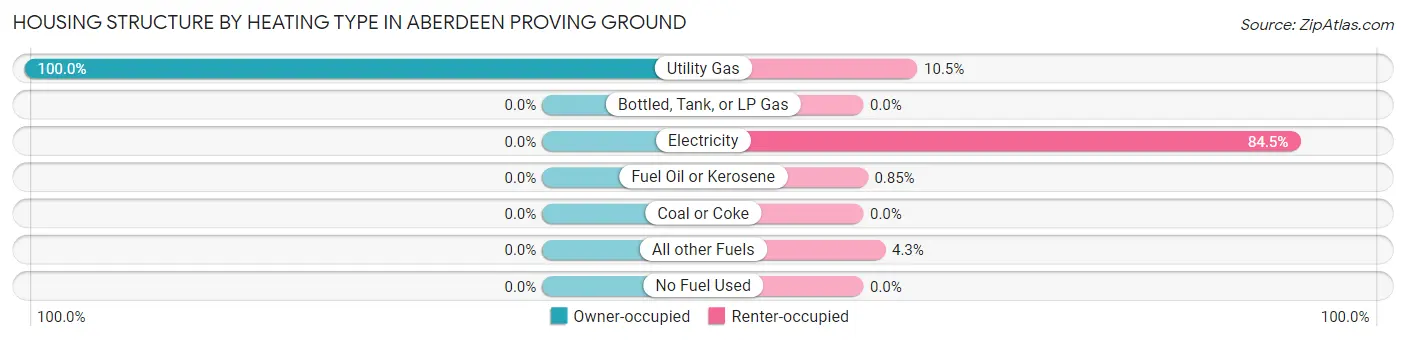
| Heating Type | Owner-occupied | Renter-occupied |
| Utility Gas | 11 (100.0%) | 86 (10.4%) |
| Bottled, Tank, or LP Gas | 0 (0.0%) | 0 (0.0%) |
| Electricity | 0 (0.0%) | 695 (84.5%) |
| Fuel Oil or Kerosene | 0 (0.0%) | 7 (0.9%) |
| Coal or Coke | 0 (0.0%) | 0 (0.0%) |
| All other Fuels | 0 (0.0%) | 35 (4.3%) |
| No Fuel Used | 0 (0.0%) | 0 (0.0%) |
| Total | 11 (100.0%) | 823 (100.0%) |
Household Vehicle Usage in Aberdeen Proving Ground
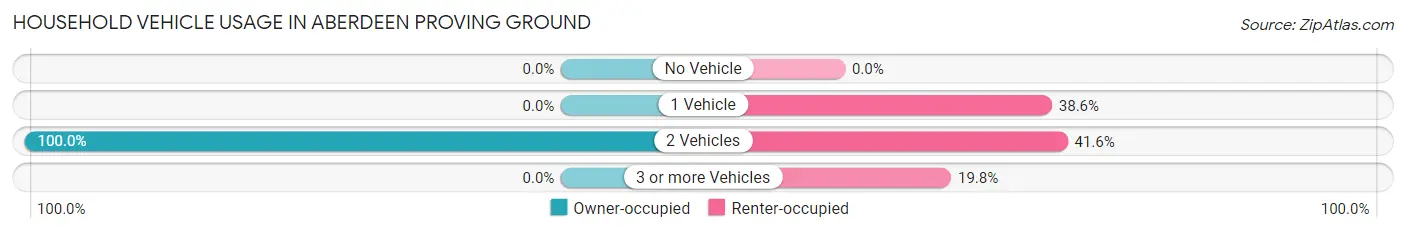
| Vehicles per Household | Owner-occupied | Renter-occupied |
| No Vehicle | 0 (0.0%) | 0 (0.0%) |
| 1 Vehicle | 0 (0.0%) | 318 (38.6%) |
| 2 Vehicles | 11 (100.0%) | 342 (41.6%) |
| 3 or more Vehicles | 0 (0.0%) | 163 (19.8%) |
| Total | 11 (100.0%) | 823 (100.0%) |
Real Estate & Mortgages in Aberdeen Proving Ground
Real Estate and Mortgage Overview in Aberdeen Proving Ground
| Characteristic | Without Mortgage | With Mortgage |
| Housing Units | 0 | 11 |
| Median Property Value | - | - |
| Median Household Income | - | - |
| Monthly Housing Costs | - | - |
| Real Estate Taxes | - | - |
Property Value by Mortgage Status in Aberdeen Proving Ground
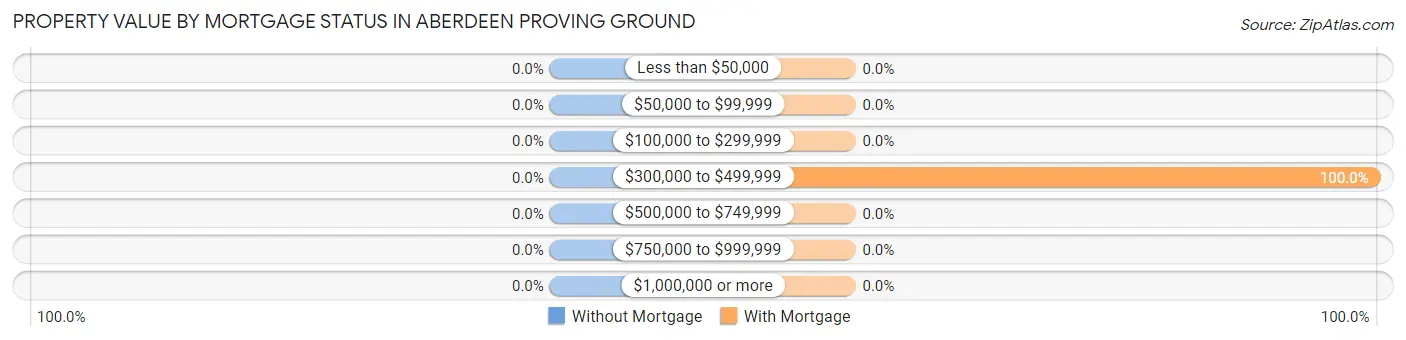
| Property Value | Without Mortgage | With Mortgage |
| Less than $50,000 | 0 (0.0%) | 0 (0.0%) |
| $50,000 to $99,999 | 0 (0.0%) | 0 (0.0%) |
| $100,000 to $299,999 | 0 (0.0%) | 0 (0.0%) |
| $300,000 to $499,999 | 0 (0.0%) | 11 (100.0%) |
| $500,000 to $749,999 | 0 (0.0%) | 0 (0.0%) |
| $750,000 to $999,999 | 0 (0.0%) | 0 (0.0%) |
| $1,000,000 or more | 0 (0.0%) | 0 (0.0%) |
| Total | 0 (0.0%) | 11 (100.0%) |
Household Income by Mortgage Status in Aberdeen Proving Ground
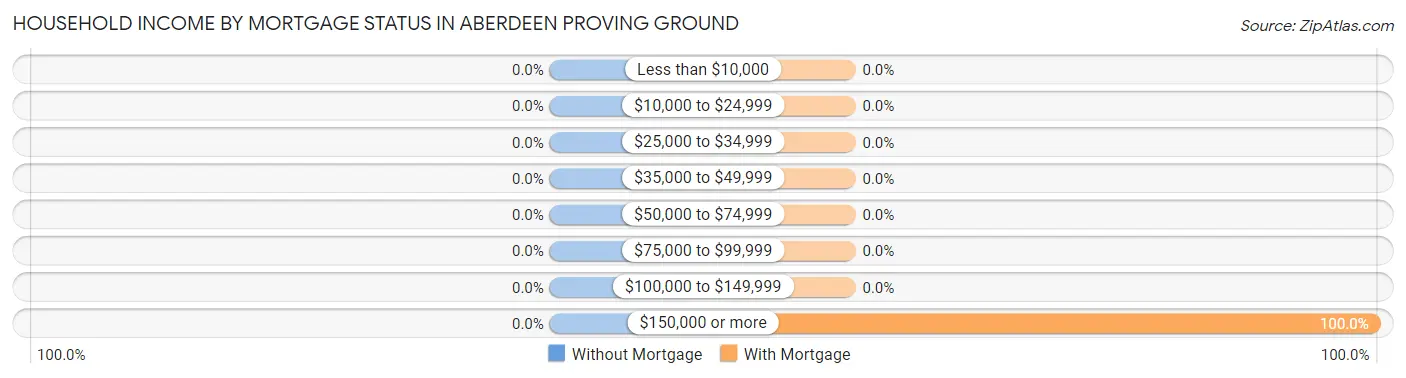
| Household Income | Without Mortgage | With Mortgage |
| Less than $10,000 | 0 (0.0%) | 0 (0.0%) |
| $10,000 to $24,999 | 0 (0.0%) | 0 (0.0%) |
| $25,000 to $34,999 | 0 (0.0%) | 0 (0.0%) |
| $35,000 to $49,999 | 0 (0.0%) | 0 (0.0%) |
| $50,000 to $74,999 | 0 (0.0%) | 0 (0.0%) |
| $75,000 to $99,999 | 0 (0.0%) | 0 (0.0%) |
| $100,000 to $149,999 | 0 (0.0%) | 0 (0.0%) |
| $150,000 or more | 0 (0.0%) | 11 (100.0%) |
| Total | 0 (0.0%) | 11 (100.0%) |
Property Value to Household Income Ratio in Aberdeen Proving Ground
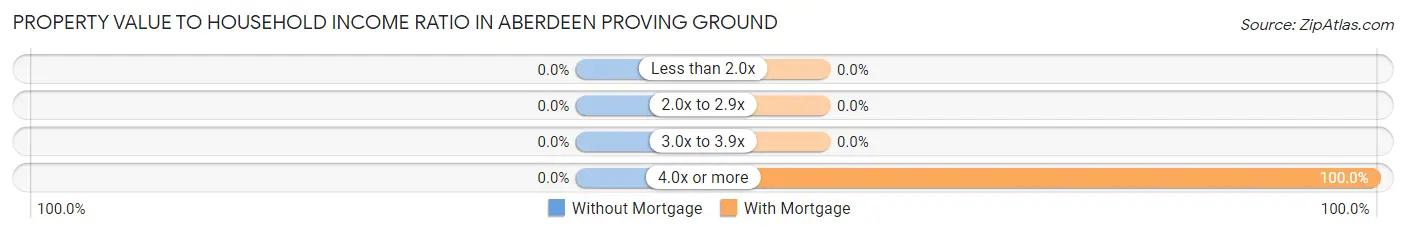
| Value-to-Income Ratio | Without Mortgage | With Mortgage |
| Less than 2.0x | 0 (0.0%) | 0 (0.0%) |
| 2.0x to 2.9x | 0 (0.0%) | 0 (0.0%) |
| 3.0x to 3.9x | 0 (0.0%) | 0 (0.0%) |
| 4.0x or more | 0 (0.0%) | 11 (100.0%) |
| Total | 0 (0.0%) | 11 (100.0%) |
Real Estate Taxes by Mortgage Status in Aberdeen Proving Ground
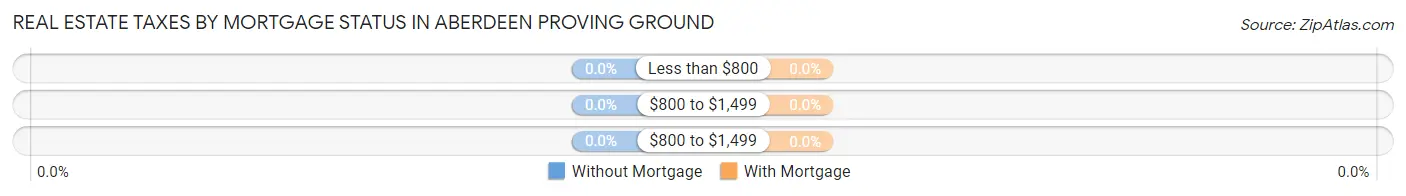
| Property Taxes | Without Mortgage | With Mortgage |
| Less than $800 | 0 (0.0%) | 0 (0.0%) |
| $800 to $1,499 | 0 (0.0%) | 0 (0.0%) |
| $800 to $1,499 | 0 (0.0%) | 0 (0.0%) |
| Total | 0 (0.0%) | 11 (100.0%) |
Health & Disability in Aberdeen Proving Ground
Health Insurance Coverage by Age in Aberdeen Proving Ground
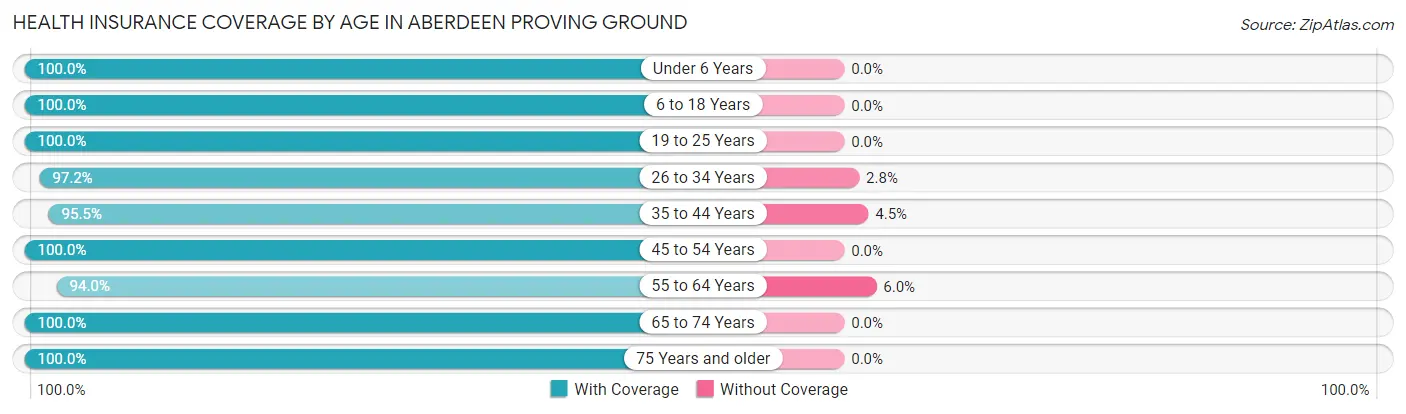
| Age Bracket | With Coverage | Without Coverage |
| Under 6 Years | 261 (100.0%) | 0 (0.0%) |
| 6 to 18 Years | 626 (100.0%) | 0 (0.0%) |
| 19 to 25 Years | 255 (100.0%) | 0 (0.0%) |
| 26 to 34 Years | 316 (97.2%) | 9 (2.8%) |
| 35 to 44 Years | 341 (95.5%) | 16 (4.5%) |
| 45 to 54 Years | 254 (100.0%) | 0 (0.0%) |
| 55 to 64 Years | 236 (94.0%) | 15 (6.0%) |
| 65 to 74 Years | 54 (100.0%) | 0 (0.0%) |
| 75 Years and older | 47 (100.0%) | 0 (0.0%) |
| Total | 2,390 (98.4%) | 40 (1.7%) |
Health Insurance Coverage by Citizenship Status in Aberdeen Proving Ground
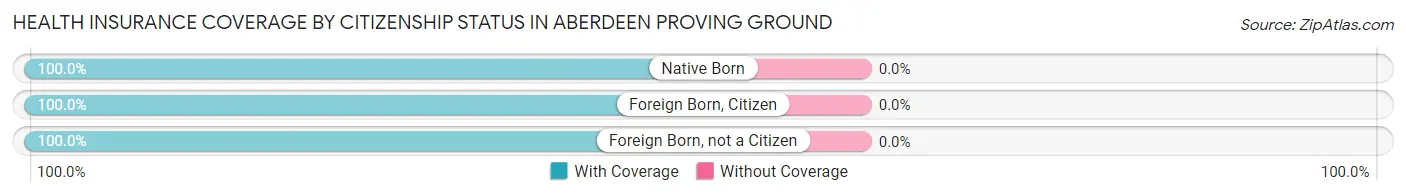
| Citizenship Status | With Coverage | Without Coverage |
| Native Born | 261 (100.0%) | 0 (0.0%) |
| Foreign Born, Citizen | 626 (100.0%) | 0 (0.0%) |
| Foreign Born, not a Citizen | 255 (100.0%) | 0 (0.0%) |
Health Insurance Coverage by Household Income in Aberdeen Proving Ground
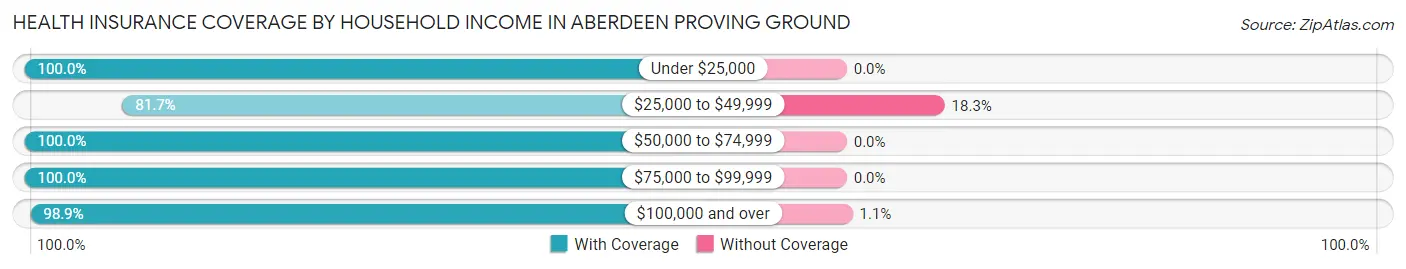
| Household Income | With Coverage | Without Coverage |
| Under $25,000 | 22 (100.0%) | 0 (0.0%) |
| $25,000 to $49,999 | 98 (81.7%) | 22 (18.3%) |
| $50,000 to $74,999 | 282 (100.0%) | 0 (0.0%) |
| $75,000 to $99,999 | 347 (100.0%) | 0 (0.0%) |
| $100,000 and over | 1,641 (98.9%) | 18 (1.1%) |
Public vs Private Health Insurance Coverage by Age in Aberdeen Proving Ground
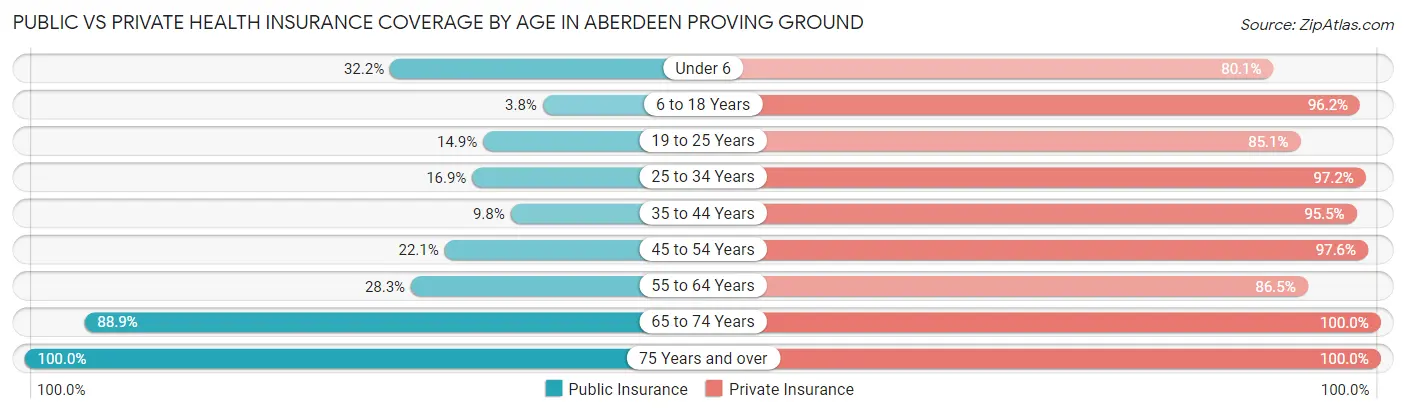
| Age Bracket | Public Insurance | Private Insurance |
| Under 6 | 84 (32.2%) | 209 (80.1%) |
| 6 to 18 Years | 24 (3.8%) | 602 (96.2%) |
| 19 to 25 Years | 38 (14.9%) | 217 (85.1%) |
| 25 to 34 Years | 55 (16.9%) | 316 (97.2%) |
| 35 to 44 Years | 35 (9.8%) | 341 (95.5%) |
| 45 to 54 Years | 56 (22.1%) | 248 (97.6%) |
| 55 to 64 Years | 71 (28.3%) | 217 (86.5%) |
| 65 to 74 Years | 48 (88.9%) | 54 (100.0%) |
| 75 Years and over | 47 (100.0%) | 47 (100.0%) |
| Total | 458 (18.9%) | 2,251 (92.6%) |
Disability Status by Sex by Age in Aberdeen Proving Ground
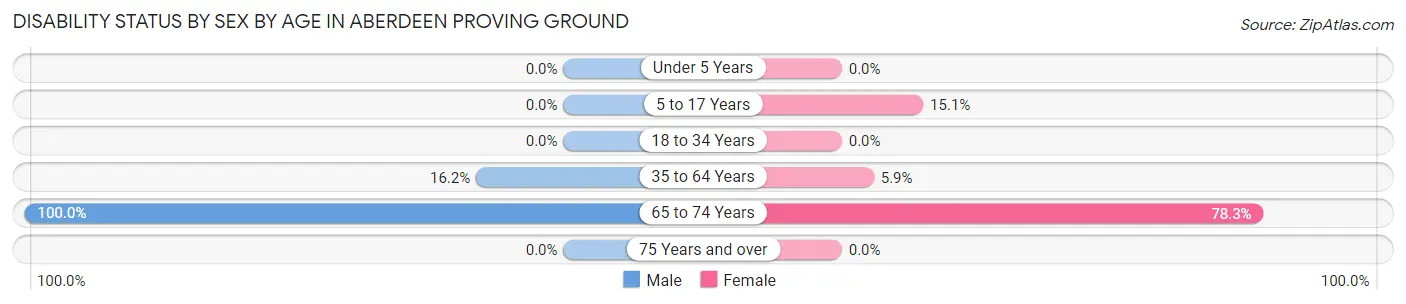
| Age Bracket | Male | Female |
| Under 5 Years | 0 (0.0%) | 0 (0.0%) |
| 5 to 17 Years | 0 (0.0%) | 61 (15.1%) |
| 18 to 34 Years | 0 (0.0%) | 0 (0.0%) |
| 35 to 64 Years | 77 (16.2%) | 23 (5.9%) |
| 65 to 74 Years | 8 (100.0%) | 36 (78.3%) |
| 75 Years and over | 0 (0.0%) | 0 (0.0%) |
Disability Class by Sex by Age in Aberdeen Proving Ground
Disability Class: Hearing Difficulty
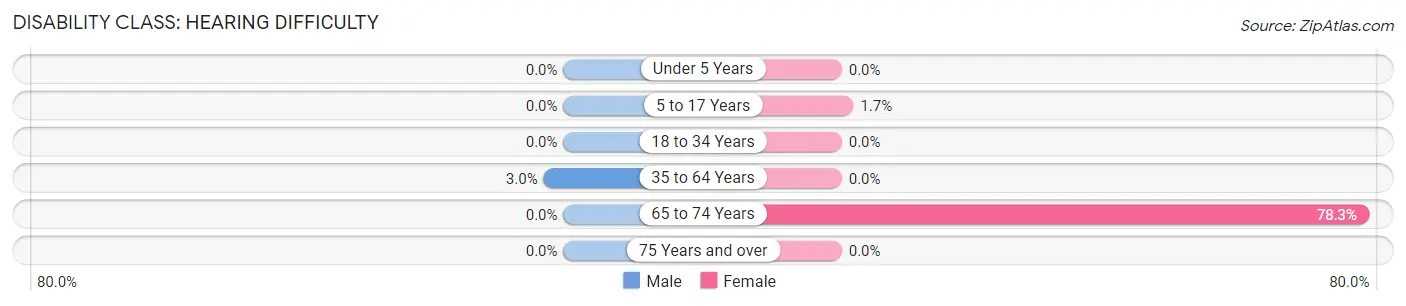
| Age Bracket | Male | Female |
| Under 5 Years | 0 (0.0%) | 0 (0.0%) |
| 5 to 17 Years | 0 (0.0%) | 7 (1.7%) |
| 18 to 34 Years | 0 (0.0%) | 0 (0.0%) |
| 35 to 64 Years | 14 (2.9%) | 0 (0.0%) |
| 65 to 74 Years | 0 (0.0%) | 36 (78.3%) |
| 75 Years and over | 0 (0.0%) | 0 (0.0%) |
Disability Class: Vision Difficulty
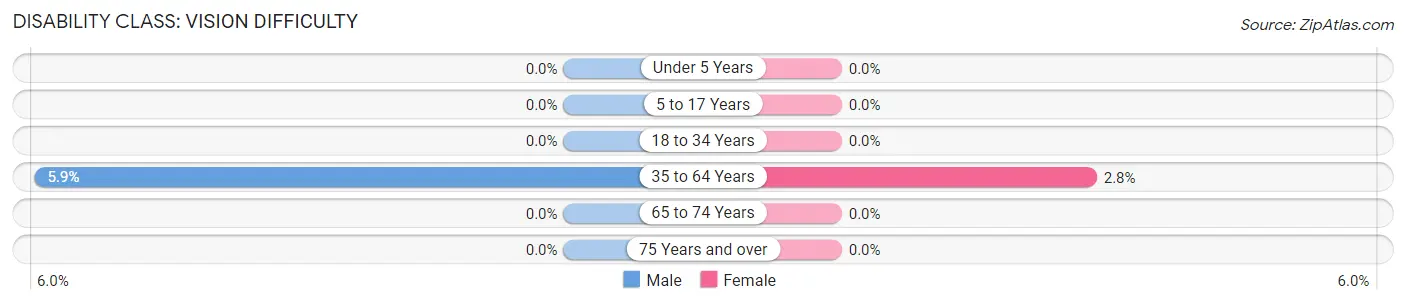
| Age Bracket | Male | Female |
| Under 5 Years | 0 (0.0%) | 0 (0.0%) |
| 5 to 17 Years | 0 (0.0%) | 0 (0.0%) |
| 18 to 34 Years | 0 (0.0%) | 0 (0.0%) |
| 35 to 64 Years | 28 (5.9%) | 11 (2.8%) |
| 65 to 74 Years | 0 (0.0%) | 0 (0.0%) |
| 75 Years and over | 0 (0.0%) | 0 (0.0%) |
Disability Class: Cognitive Difficulty
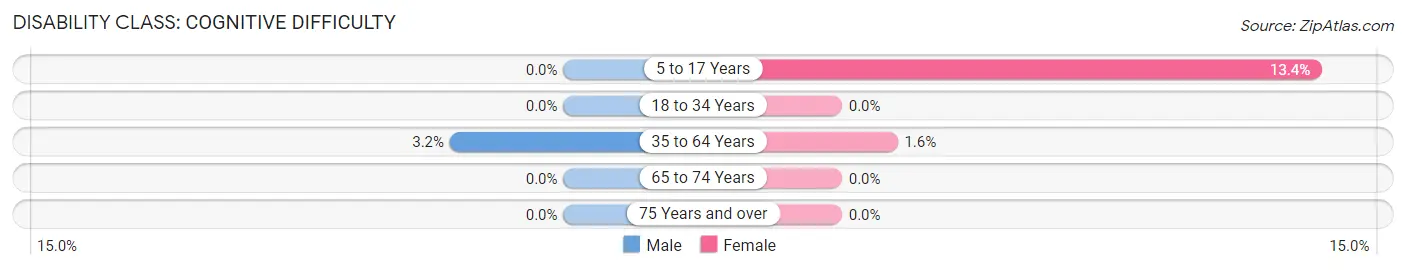
| Age Bracket | Male | Female |
| 5 to 17 Years | 0 (0.0%) | 54 (13.4%) |
| 18 to 34 Years | 0 (0.0%) | 0 (0.0%) |
| 35 to 64 Years | 15 (3.2%) | 6 (1.5%) |
| 65 to 74 Years | 0 (0.0%) | 0 (0.0%) |
| 75 Years and over | 0 (0.0%) | 0 (0.0%) |
Disability Class: Ambulatory Difficulty
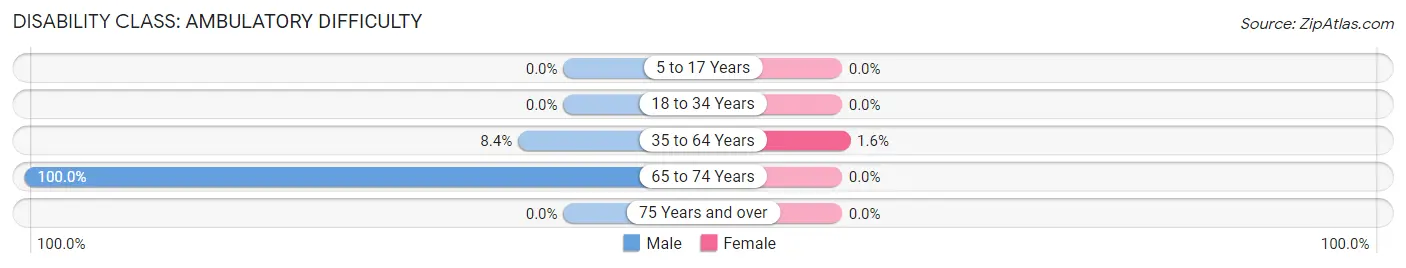
| Age Bracket | Male | Female |
| 5 to 17 Years | 0 (0.0%) | 0 (0.0%) |
| 18 to 34 Years | 0 (0.0%) | 0 (0.0%) |
| 35 to 64 Years | 40 (8.4%) | 6 (1.5%) |
| 65 to 74 Years | 8 (100.0%) | 0 (0.0%) |
| 75 Years and over | 0 (0.0%) | 0 (0.0%) |
Disability Class: Self-Care Difficulty
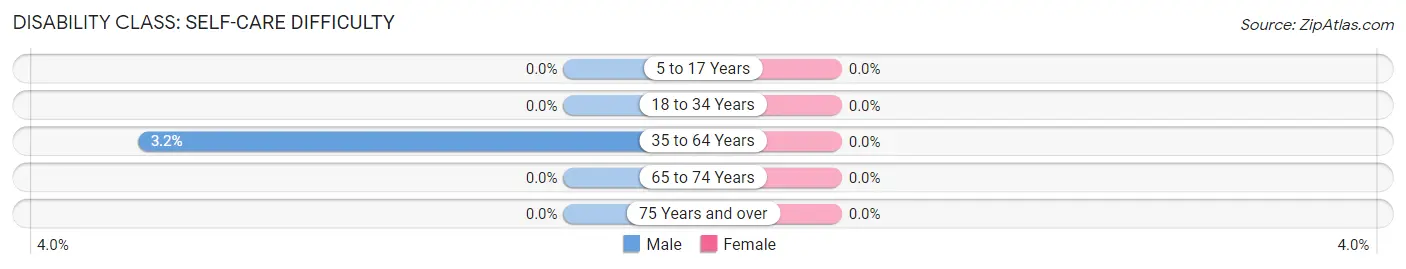
| Age Bracket | Male | Female |
| 5 to 17 Years | 0 (0.0%) | 0 (0.0%) |
| 18 to 34 Years | 0 (0.0%) | 0 (0.0%) |
| 35 to 64 Years | 15 (3.2%) | 0 (0.0%) |
| 65 to 74 Years | 0 (0.0%) | 0 (0.0%) |
| 75 Years and over | 0 (0.0%) | 0 (0.0%) |
Technology Access in Aberdeen Proving Ground
Computing Device Access in Aberdeen Proving Ground
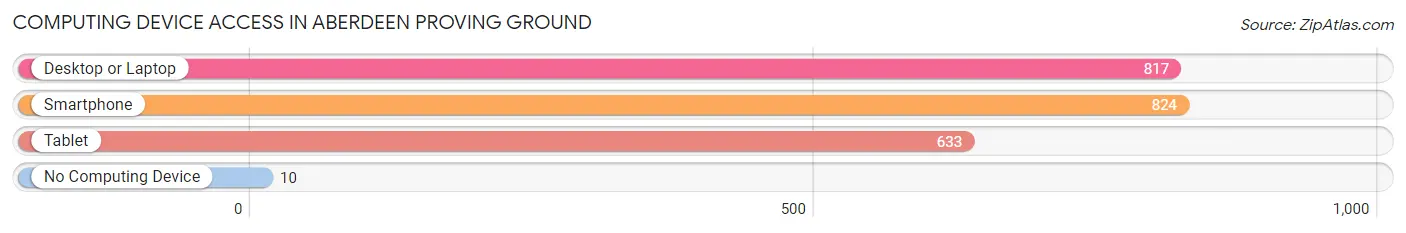
| Device Type | # Households | % Households |
| Desktop or Laptop | 817 | 98.0% |
| Smartphone | 824 | 98.8% |
| Tablet | 633 | 75.9% |
| No Computing Device | 10 | 1.2% |
| Total | 834 | 100.0% |
Internet Access in Aberdeen Proving Ground
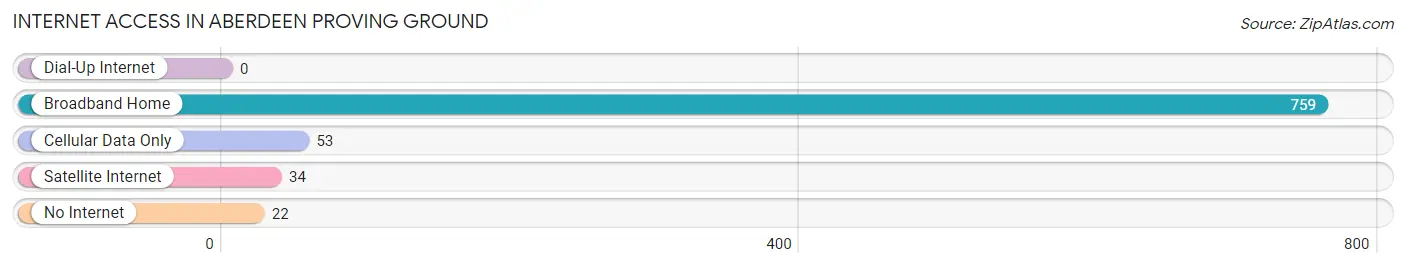
| Internet Type | # Households | % Households |
| Dial-Up Internet | 0 | 0.0% |
| Broadband Home | 759 | 91.0% |
| Cellular Data Only | 53 | 6.4% |
| Satellite Internet | 34 | 4.1% |
| No Internet | 22 | 2.6% |
| Total | 834 | 100.0% |
Aberdeen Proving Ground Summary
Aberdeen Proving Ground (APG) is a United States Army installation located in Harford County, Maryland. It is the oldest active proving ground in the United States, having been established in 1917. APG is home to the U.S. Army Test and Evaluation Command (ATEC), the U.S. Army Research, Development and Engineering Command (RDECOM), and the U.S. Army Communications-Electronics Command (CECOM).
History
Aberdeen Proving Ground was established in 1917 as a response to the need for a testing facility for the U.S. Army’s new weapons and equipment. The site was chosen due to its proximity to the Chesapeake Bay and its access to railroads and highways. The first test was conducted in 1918 and the facility has been in continuous use ever since.
During World War II, APG was used to test and develop new weapons and equipment for the war effort. It was also used as a training facility for troops. After the war, APG continued to be used for testing and development of new weapons and equipment.
In the 1950s, APG was used to test nuclear weapons and other nuclear-related materials. In the 1960s, APG was used to test chemical and biological weapons. In the 1970s, APG was used to test and develop new electronic warfare systems.
In the 1980s, APG was used to test and develop new communications systems. In the 1990s, APG was used to test and develop new weapons and equipment for the Gulf War.
Geography
Aberdeen Proving Ground is located in Harford County, Maryland. It is situated on the western shore of the Chesapeake Bay, approximately 25 miles northeast of Baltimore. The installation covers approximately 72,000 acres and is bordered by the Susquehanna River to the north and the Bush River to the south.
The terrain of APG is mostly flat with some rolling hills. The climate is temperate with hot summers and cold winters. The average annual precipitation is approximately 40 inches.
Economy
Aberdeen Proving Ground is a major economic driver for the region. The installation is home to over 20,000 military and civilian personnel, making it one of the largest employers in the area. In addition, APG is home to numerous defense contractors and other businesses that support the installation.
The installation also contributes to the local economy through its purchases of goods and services. In addition, APG is home to numerous recreational facilities, including a golf course, a bowling alley, and a movie theater.
Demographics
As of the 2010 census, the population of APG was 8,845. The racial makeup of the installation was 79.3% White, 11.2% African American, 4.2% Asian, and 5.3% other. The median household income was $64,845.
Conclusion
Aberdeen Proving Ground is a major U.S. Army installation located in Harford County, Maryland. It is the oldest active proving ground in the United States, having been established in 1917. APG is home to the U.S. Army Test and Evaluation Command, the U.S. Army Research, Development and Engineering Command, and the U.S. Army Communications-Electronics Command. The installation covers approximately 72,000 acres and is bordered by the Susquehanna River to the north and the Bush River to the south. APG is a major economic driver for the region, employing over 20,000 military and civilian personnel. The population of APG was 8,845 as of the 2010 census.
Common Questions
What is Per Capita Income in Aberdeen Proving Ground?
Per Capita income in Aberdeen Proving Ground is $41,243.
What is the Median Family Income in Aberdeen Proving Ground?
Median Family Income in Aberdeen Proving Ground is $138,920.
What is the Median Household income in Aberdeen Proving Ground?
Median Household Income in Aberdeen Proving Ground is $118,750.
What is Income or Wage Gap in Aberdeen Proving Ground?
Income or Wage Gap in Aberdeen Proving Ground is 48.4%.
Women in Aberdeen Proving Ground earn 51.6 cents for every dollar earned by a man.
What is Inequality or Gini Index in Aberdeen Proving Ground?
Inequality or Gini Index in Aberdeen Proving Ground is 0.32.
What is the Total Population of Aberdeen Proving Ground?
Total Population of Aberdeen Proving Ground is 2,703.
What is the Total Male Population of Aberdeen Proving Ground?
Total Male Population of Aberdeen Proving Ground is 1,340.
What is the Total Female Population of Aberdeen Proving Ground?
Total Female Population of Aberdeen Proving Ground is 1,363.
What is the Ratio of Males per 100 Females in Aberdeen Proving Ground?
There are 98.31 Males per 100 Females in Aberdeen Proving Ground.
What is the Ratio of Females per 100 Males in Aberdeen Proving Ground?
There are 101.72 Females per 100 Males in Aberdeen Proving Ground.
What is the Median Population Age in Aberdeen Proving Ground?
Median Population Age in Aberdeen Proving Ground is 30.0 Years.
What is the Average Family Size in Aberdeen Proving Ground
Average Family Size in Aberdeen Proving Ground is 4.3 People.
What is the Average Household Size in Aberdeen Proving Ground
Average Household Size in Aberdeen Proving Ground is 3.1 People.
How Large is the Labor Force in Aberdeen Proving Ground?
There are 1,521 People in the Labor Forcein in Aberdeen Proving Ground.
What is the Percentage of People in the Labor Force in Aberdeen Proving Ground?
77.5% of People are in the Labor Force in Aberdeen Proving Ground.
What is the Unemployment Rate in Aberdeen Proving Ground?
Unemployment Rate in Aberdeen Proving Ground is 6.3%.