Hershey, PA Map & Demographics
Hershey Map
Hershey Overview
$53,028
PER CAPITA INCOME
$118,750
AVG FAMILY INCOME
$77,480
AVG HOUSEHOLD INCOME
6.9%
WAGE / INCOME GAP [ % ]
93.1¢/ $1
WAGE / INCOME GAP [ $ ]
0.51
INEQUALITY / GINI INDEX
14,682
TOTAL POPULATION
6,999
MALE POPULATION
7,683
FEMALE POPULATION
91.10
MALES / 100 FEMALES
109.77
FEMALES / 100 MALES
46.0
MEDIAN AGE
2.9
AVG FAMILY SIZE
2.3
AVG HOUSEHOLD SIZE
8,233
LABOR FORCE [ PEOPLE ]
66.0%
PERCENT IN LABOR FORCE
3.3%
UNEMPLOYMENT RATE
Hershey Zip Codes
Hershey Area Codes
Income in Hershey
Income Overview in Hershey
Per Capita Income in Hershey is $53,028, while median incomes of families and households are $118,750 and $77,480 respectively.
| Characteristic | Number | Measure |
| Per Capita Income | 14,682 | $53,028 |
| Median Family Income | 3,423 | $118,750 |
| Mean Family Income | 3,423 | $163,414 |
| Median Household Income | 5,633 | $77,480 |
| Mean Household Income | 5,633 | $124,757 |
| Income Deficit | 3,423 | $0 |
| Wage / Income Gap (%) | 14,682 | 6.95% |
| Wage / Income Gap ($) | 14,682 | 93.05¢ per $1 |
| Gini / Inequality Index | 14,682 | 0.51 |
Earnings by Sex in Hershey
Average Earnings in Hershey are $47,976, $49,556 for men and $46,112 for women, a difference of 7.0%.
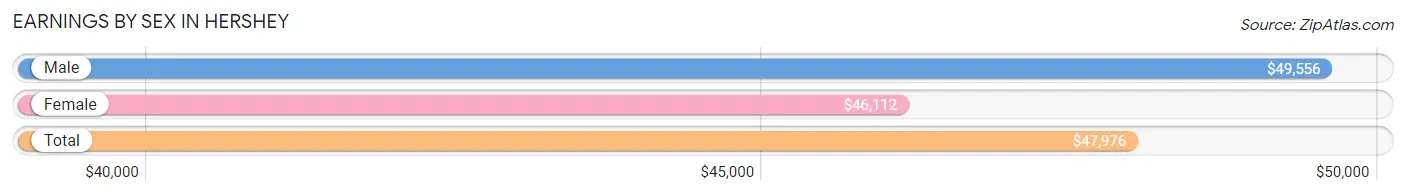
| Sex | Number | Average Earnings |
| Male | 4,303 (49.6%) | $49,556 |
| Female | 4,380 (50.4%) | $46,112 |
| Total | 8,683 (100.0%) | $47,976 |
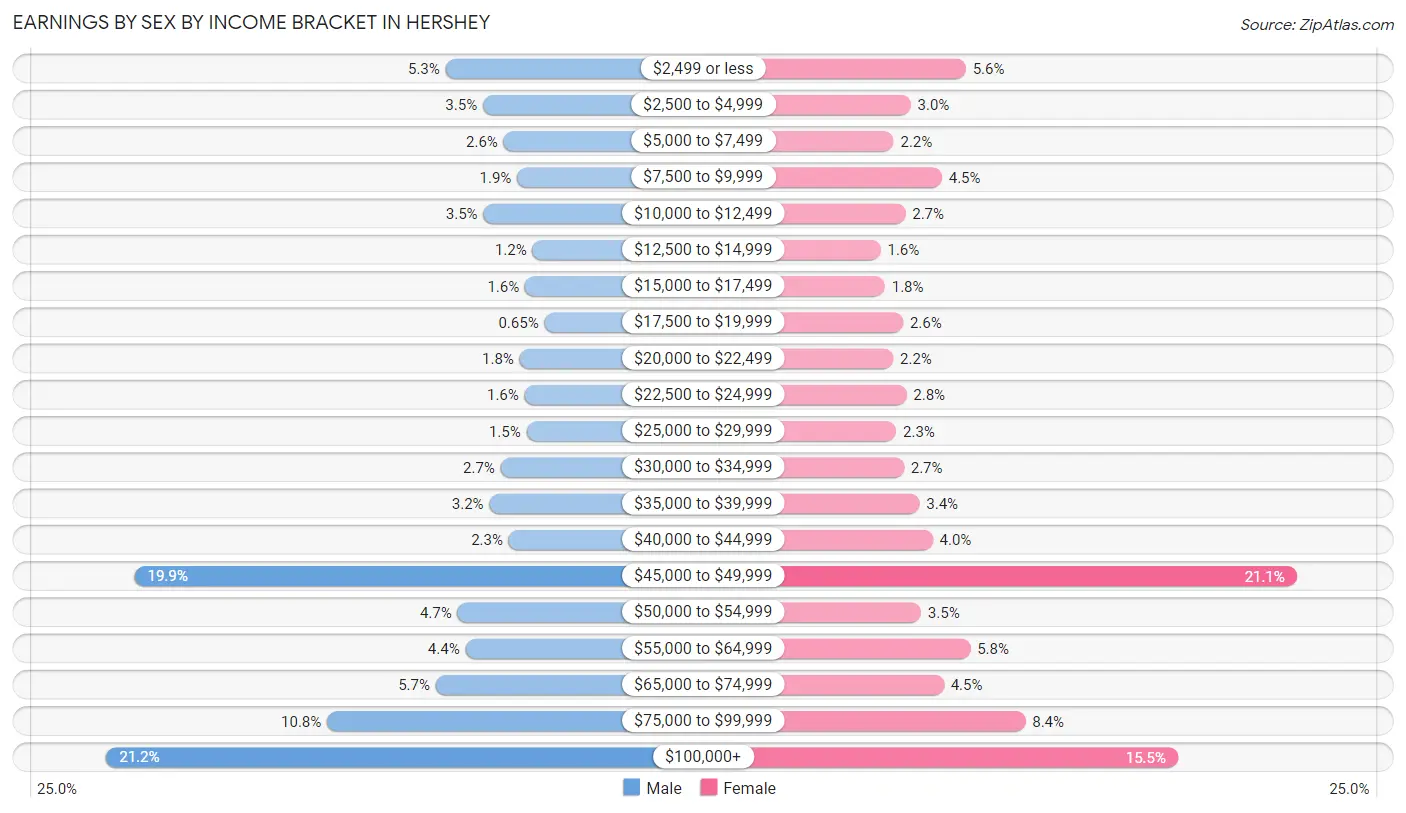
Earnings by Sex by Income Bracket in Hershey
The most common earnings brackets in Hershey are $100,000+ for men (911 | 21.2%) and $45,000 to $49,999 for women (923 | 21.1%).
| Income | Male | Female |
| $2,499 or less | 227 (5.3%) | 244 (5.6%) |
| $2,500 to $4,999 | 152 (3.5%) | 131 (3.0%) |
| $5,000 to $7,499 | 110 (2.6%) | 96 (2.2%) |
| $7,500 to $9,999 | 83 (1.9%) | 195 (4.4%) |
| $10,000 to $12,499 | 151 (3.5%) | 120 (2.7%) |
| $12,500 to $14,999 | 52 (1.2%) | 69 (1.6%) |
| $15,000 to $17,499 | 67 (1.6%) | 78 (1.8%) |
| $17,500 to $19,999 | 28 (0.6%) | 115 (2.6%) |
| $20,000 to $22,499 | 78 (1.8%) | 95 (2.2%) |
| $22,500 to $24,999 | 68 (1.6%) | 122 (2.8%) |
| $25,000 to $29,999 | 64 (1.5%) | 101 (2.3%) |
| $30,000 to $34,999 | 116 (2.7%) | 117 (2.7%) |
| $35,000 to $39,999 | 139 (3.2%) | 149 (3.4%) |
| $40,000 to $44,999 | 100 (2.3%) | 176 (4.0%) |
| $45,000 to $49,999 | 854 (19.9%) | 923 (21.1%) |
| $50,000 to $54,999 | 203 (4.7%) | 152 (3.5%) |
| $55,000 to $64,999 | 187 (4.3%) | 253 (5.8%) |
| $65,000 to $74,999 | 247 (5.7%) | 199 (4.5%) |
| $75,000 to $99,999 | 466 (10.8%) | 366 (8.4%) |
| $100,000+ | 911 (21.2%) | 679 (15.5%) |
| Total | 4,303 (100.0%) | 4,380 (100.0%) |
Earnings by Sex by Educational Attainment in Hershey
Average earnings in Hershey are $53,045 for men and $46,851 for women, a difference of 11.7%. Men with an educational attainment of bachelor's degree enjoy the highest average annual earnings of $96,875, while those with college or associate's degree education earn the least with $38,980. Women with an educational attainment of less than high school earn the most with the average annual earnings of $170,948, while those with high school diploma education have the smallest earnings of $25,769.
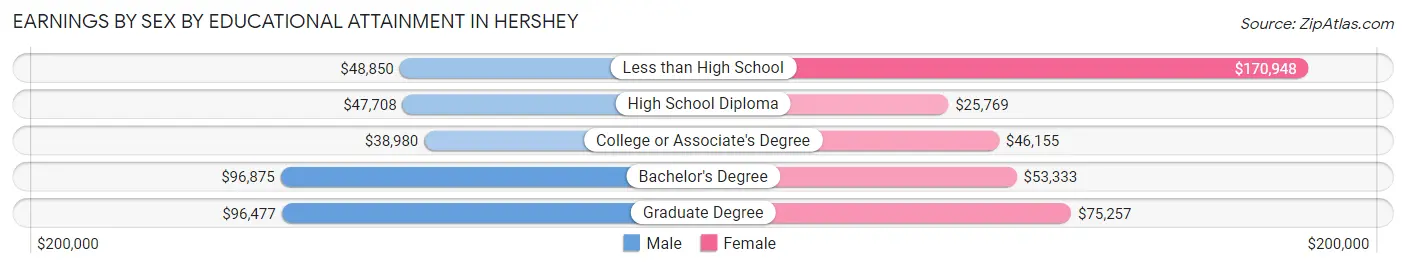
| Educational Attainment | Male Income | Female Income |
| Less than High School | $48,850 | $170,948 |
| High School Diploma | $47,708 | $25,769 |
| College or Associate's Degree | $38,980 | $46,155 |
| Bachelor's Degree | $96,875 | $53,333 |
| Graduate Degree | $96,477 | $75,257 |
| Total | $53,045 | $46,851 |
Family Income in Hershey
Family Income Brackets in Hershey
According to the Hershey family income data, there are 798 families falling into the $200,000+ income range, which is the most common income bracket and makes up 23.3% of all families. Conversely, the $10,000 to $14,999 income bracket is the least frequent group with only 31 families (0.9%) belonging to this category.
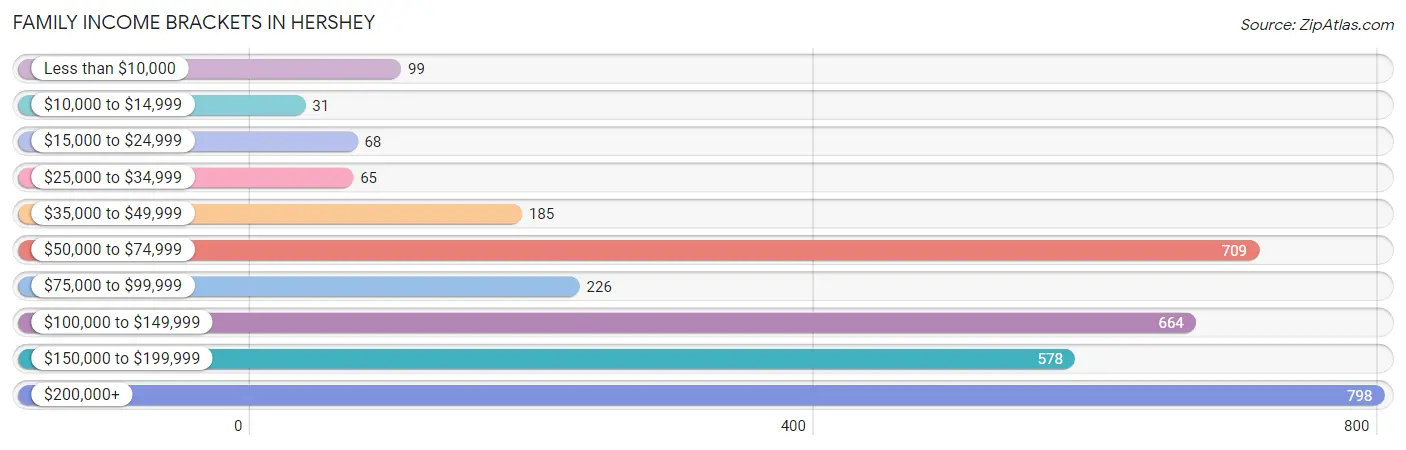
| Income Bracket | # Families | % Families |
| Less than $10,000 | 99 | 2.9% |
| $10,000 to $14,999 | 31 | 0.9% |
| $15,000 to $24,999 | 68 | 2.0% |
| $25,000 to $34,999 | 65 | 1.9% |
| $35,000 to $49,999 | 185 | 5.4% |
| $50,000 to $74,999 | 709 | 20.7% |
| $75,000 to $99,999 | 226 | 6.6% |
| $100,000 to $149,999 | 664 | 19.4% |
| $150,000 to $199,999 | 578 | 16.9% |
| $200,000+ | 798 | 23.3% |
Family Income by Famaliy Size in Hershey
6-person families (28 | 0.8%) account for the highest median family income in Hershey with $182,813 per family, while 3-person families (550 | 16.1%) have the highest median income of $52,917 per family member.
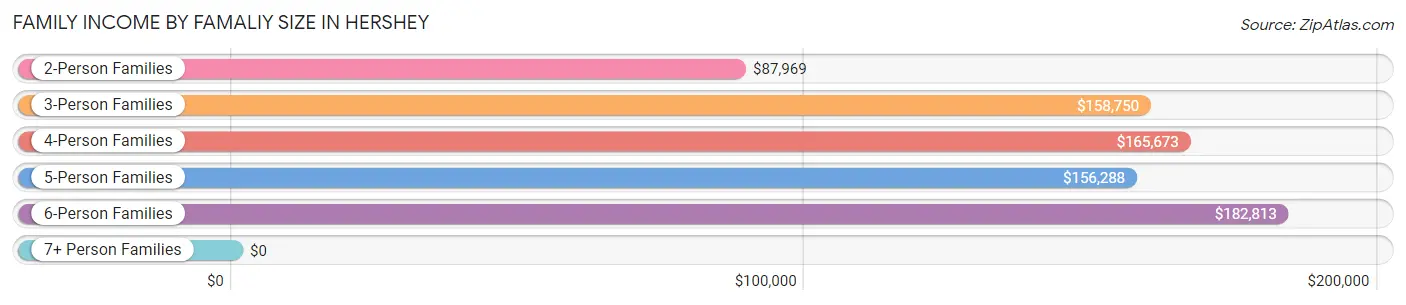
| Income Bracket | # Families | Median Income |
| 2-Person Families | 1,823 (53.3%) | $87,969 |
| 3-Person Families | 550 (16.1%) | $158,750 |
| 4-Person Families | 649 (19.0%) | $165,673 |
| 5-Person Families | 304 (8.9%) | $156,288 |
| 6-Person Families | 28 (0.8%) | $182,813 |
| 7+ Person Families | 69 (2.0%) | $0 |
| Total | 3,423 (100.0%) | $118,750 |
Family Income by Number of Earners in Hershey
The median family income in Hershey is $118,750, with families comprising 3+ earners (399) having the highest median family income of $188,854, while families with no earners (751) have the lowest median family income of $56,844, accounting for 11.7% and 21.9% of families, respectively.
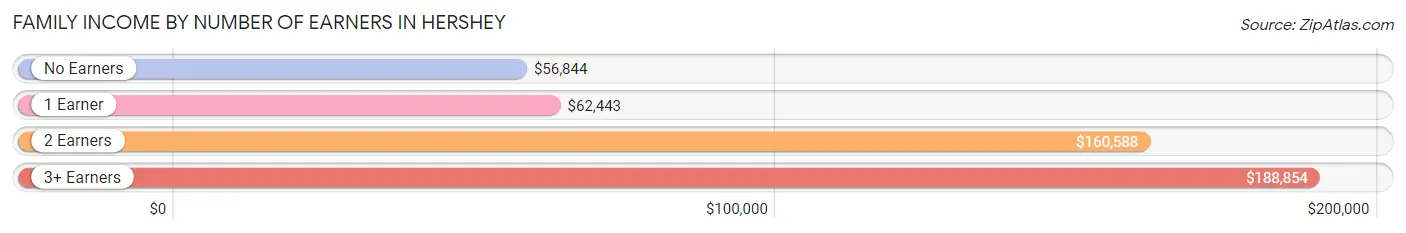
| Number of Earners | # Families | Median Income |
| No Earners | 751 (21.9%) | $56,844 |
| 1 Earner | 663 (19.4%) | $62,443 |
| 2 Earners | 1,610 (47.0%) | $160,588 |
| 3+ Earners | 399 (11.7%) | $188,854 |
| Total | 3,423 (100.0%) | $118,750 |
Household Income in Hershey
Household Income Brackets in Hershey
With 1,200 households falling in the category, the $50,000 to $74,999 income range is the most frequent in Hershey, accounting for 21.3% of all households. In contrast, only 163 households (2.9%) fall into the $10,000 to $14,999 income bracket, making it the least populous group.
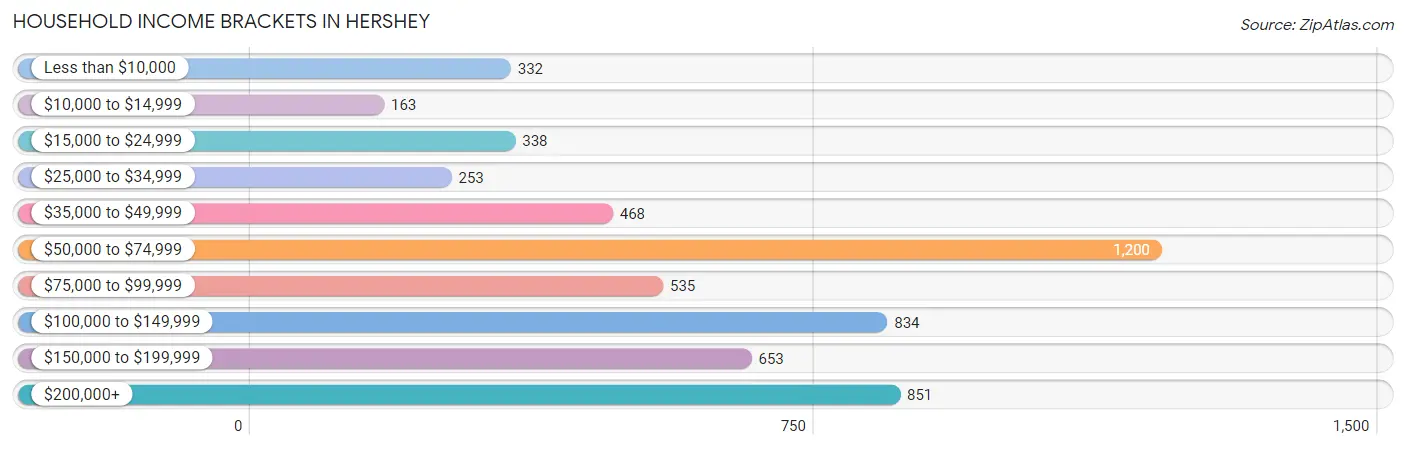
| Income Bracket | # Households | % Households |
| Less than $10,000 | 332 | 5.9% |
| $10,000 to $14,999 | 163 | 2.9% |
| $15,000 to $24,999 | 338 | 6.0% |
| $25,000 to $34,999 | 253 | 4.5% |
| $35,000 to $49,999 | 468 | 8.3% |
| $50,000 to $74,999 | 1,200 | 21.3% |
| $75,000 to $99,999 | 535 | 9.5% |
| $100,000 to $149,999 | 834 | 14.8% |
| $150,000 to $199,999 | 653 | 11.6% |
| $200,000+ | 851 | 15.1% |
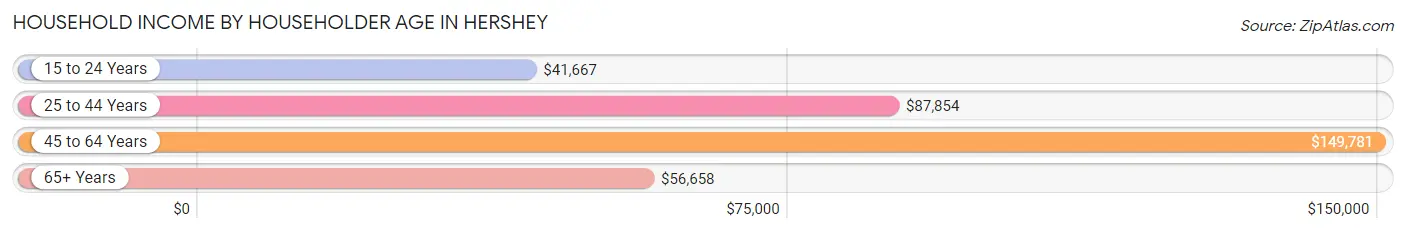
Household Income by Householder Age in Hershey
The median household income in Hershey is $77,480, with the highest median household income of $149,781 found in the 45 to 64 years age bracket for the primary householder. A total of 1,916 households (34.0%) fall into this category. Meanwhile, the 15 to 24 years age bracket for the primary householder has the lowest median household income of $41,667, with 272 households (4.8%) in this group.
| Income Bracket | # Households | Median Income |
| 15 to 24 Years | 272 (4.8%) | $41,667 |
| 25 to 44 Years | 1,683 (29.9%) | $87,854 |
| 45 to 64 Years | 1,916 (34.0%) | $149,781 |
| 65+ Years | 1,762 (31.3%) | $56,658 |
| Total | 5,633 (100.0%) | $77,480 |
Poverty in Hershey
Income Below Poverty by Sex and Age in Hershey
With 6.3% poverty level for males and 10.6% for females among the residents of Hershey, 6 to 11 year old males and 18 to 24 year old females are the most vulnerable to poverty, with 50 males (12.5%) and 227 females (40.9%) in their respective age groups living below the poverty level.
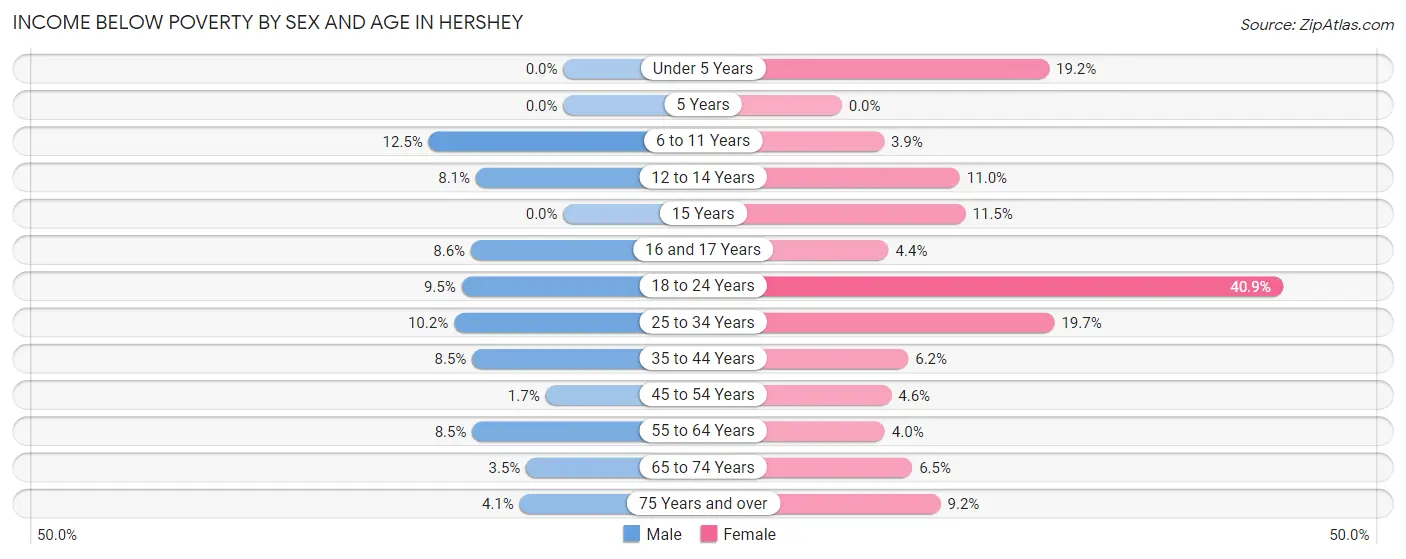
| Age Bracket | Male | Female |
| Under 5 Years | 0 (0.0%) | 56 (19.2%) |
| 5 Years | 0 (0.0%) | 0 (0.0%) |
| 6 to 11 Years | 50 (12.5%) | 14 (3.9%) |
| 12 to 14 Years | 28 (8.1%) | 25 (11.0%) |
| 15 Years | 0 (0.0%) | 17 (11.5%) |
| 16 and 17 Years | 26 (8.6%) | 11 (4.3%) |
| 18 to 24 Years | 58 (9.5%) | 227 (40.9%) |
| 25 to 34 Years | 89 (10.2%) | 181 (19.7%) |
| 35 to 44 Years | 56 (8.5%) | 40 (6.2%) |
| 45 to 54 Years | 24 (1.7%) | 49 (4.6%) |
| 55 to 64 Years | 64 (8.5%) | 61 (4.0%) |
| 65 to 74 Years | 20 (3.5%) | 53 (6.5%) |
| 75 Years and over | 22 (4.1%) | 71 (9.2%) |
| Total | 437 (6.3%) | 805 (10.6%) |
Income Above Poverty by Sex and Age in Hershey
According to the poverty statistics in Hershey, males aged under 5 years and females aged 6 to 11 years are the age groups that are most secure financially, with 100.0% of males and 96.1% of females in these age groups living above the poverty line.
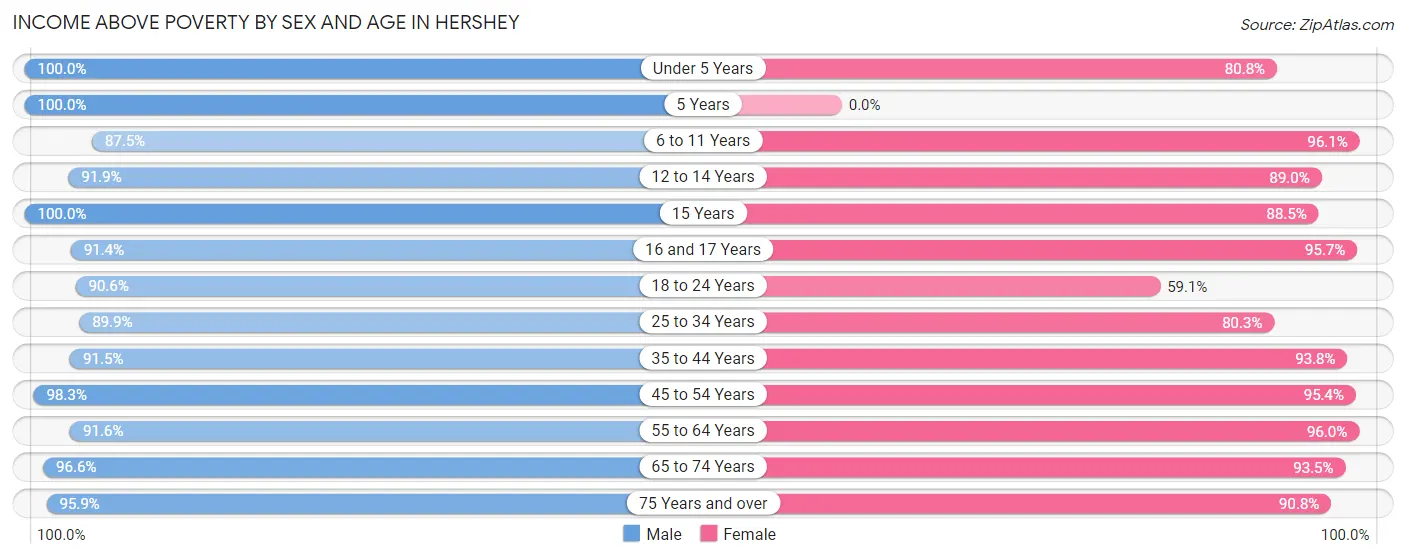
| Age Bracket | Male | Female |
| Under 5 Years | 264 (100.0%) | 235 (80.8%) |
| 5 Years | 48 (100.0%) | 0 (0.0%) |
| 6 to 11 Years | 350 (87.5%) | 344 (96.1%) |
| 12 to 14 Years | 317 (91.9%) | 203 (89.0%) |
| 15 Years | 100 (100.0%) | 131 (88.5%) |
| 16 and 17 Years | 277 (91.4%) | 242 (95.7%) |
| 18 to 24 Years | 556 (90.5%) | 328 (59.1%) |
| 25 to 34 Years | 788 (89.8%) | 736 (80.3%) |
| 35 to 44 Years | 606 (91.5%) | 608 (93.8%) |
| 45 to 54 Years | 1,422 (98.3%) | 1,016 (95.4%) |
| 55 to 64 Years | 693 (91.5%) | 1,463 (96.0%) |
| 65 to 74 Years | 560 (96.6%) | 757 (93.5%) |
| 75 Years and over | 520 (95.9%) | 703 (90.8%) |
| Total | 6,501 (93.7%) | 6,766 (89.4%) |
Income Below Poverty Among Married-Couple Families in Hershey
The poverty statistics for married-couple families in Hershey show that 2.3% or 65 of the total 2,804 families live below the poverty line. Families with no children have the highest poverty rate of 3.2%, comprising of 56 families. On the other hand, families with 3 or 4 children have the lowest poverty rate of 0.0%, which includes 0 families.
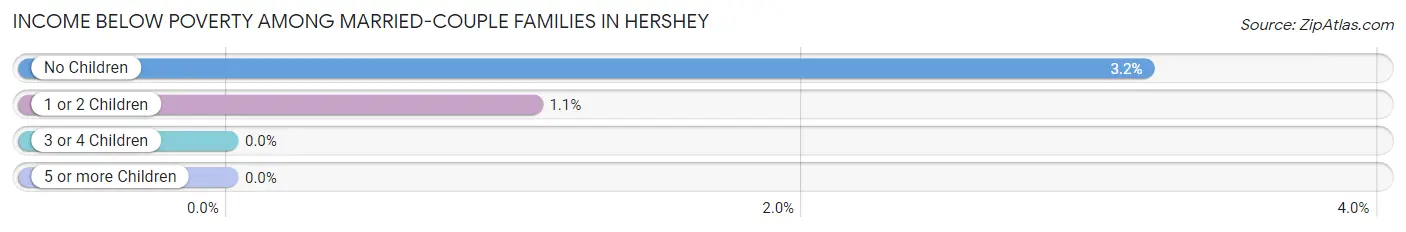
| Children | Above Poverty | Below Poverty |
| No Children | 1,699 (96.8%) | 56 (3.2%) |
| 1 or 2 Children | 839 (98.9%) | 9 (1.1%) |
| 3 or 4 Children | 201 (100.0%) | 0 (0.0%) |
| 5 or more Children | 0 (0.0%) | 0 (0.0%) |
| Total | 2,739 (97.7%) | 65 (2.3%) |
Income Below Poverty Among Single-Parent Households in Hershey
According to the poverty data in Hershey, 7.5% or 10 single-father households and 18.5% or 90 single-mother households are living below the poverty line. Among single-father households, those with no children have the highest poverty rate, with 10 households (19.6%) experiencing poverty. Likewise, among single-mother households, those with 3 or 4 children have the highest poverty rate, with 39 households (86.7%) falling below the poverty line.
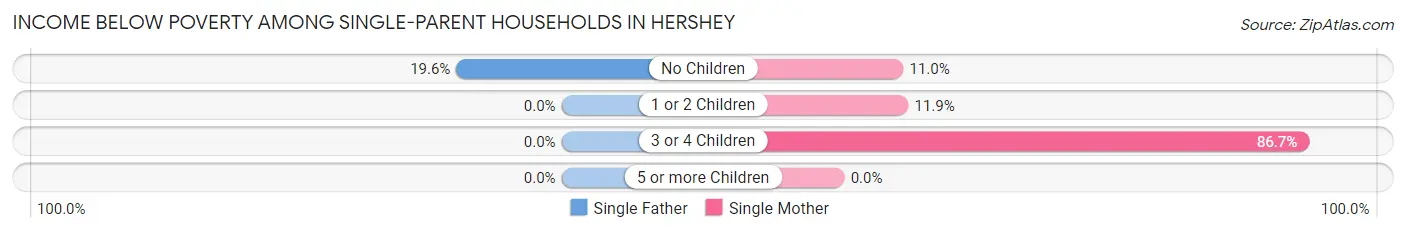
| Children | Single Father | Single Mother |
| No Children | 10 (19.6%) | 17 (11.0%) |
| 1 or 2 Children | 0 (0.0%) | 34 (11.9%) |
| 3 or 4 Children | 0 (0.0%) | 39 (86.7%) |
| 5 or more Children | 0 (0.0%) | 0 (0.0%) |
| Total | 10 (7.5%) | 90 (18.5%) |
Income Below Poverty Among Married-Couple vs Single-Parent Households in Hershey
The poverty data for Hershey shows that 65 of the married-couple family households (2.3%) and 100 of the single-parent households (16.2%) are living below the poverty level. Within the married-couple family households, those with no children have the highest poverty rate, with 56 households (3.2%) falling below the poverty line. Among the single-parent households, those with 3 or 4 children have the highest poverty rate, with 39 household (60.9%) living below poverty.
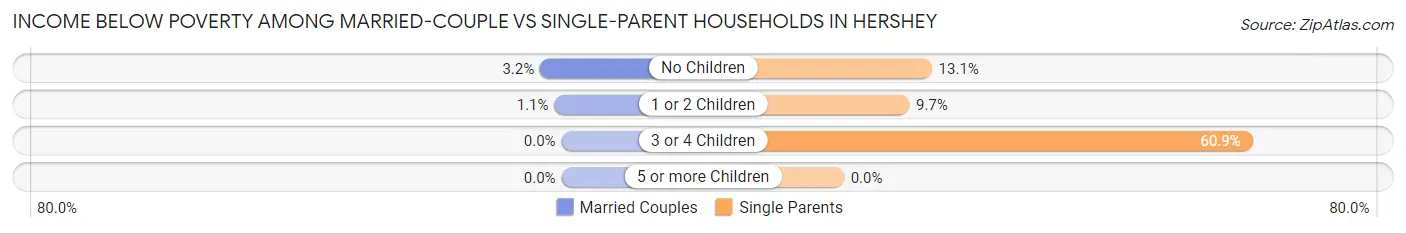
| Children | Married-Couple Families | Single-Parent Households |
| No Children | 56 (3.2%) | 27 (13.1%) |
| 1 or 2 Children | 9 (1.1%) | 34 (9.7%) |
| 3 or 4 Children | 0 (0.0%) | 39 (60.9%) |
| 5 or more Children | 0 (0.0%) | 0 (0.0%) |
| Total | 65 (2.3%) | 100 (16.2%) |
Race in Hershey
The most populous races in Hershey are White / Caucasian (11,162 | 76.0%), Hispanic or Latino (1,764 | 12.0%), and Some other Race (1,474 | 10.0%).
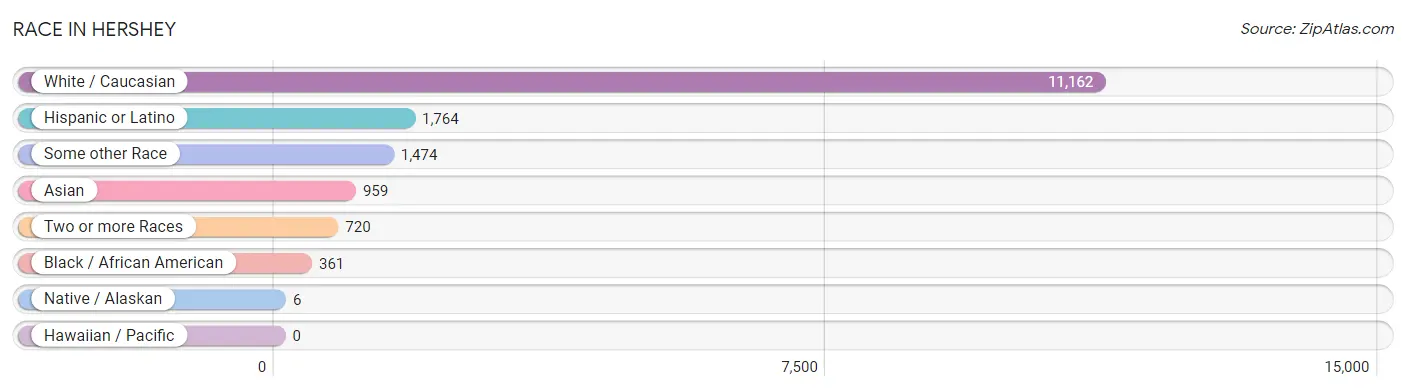
| Race | # Population | % Population |
| Asian | 959 | 6.5% |
| Black / African American | 361 | 2.5% |
| Hawaiian / Pacific | 0 | 0.0% |
| Hispanic or Latino | 1,764 | 12.0% |
| Native / Alaskan | 6 | 0.0% |
| White / Caucasian | 11,162 | 76.0% |
| Two or more Races | 720 | 4.9% |
| Some other Race | 1,474 | 10.0% |
| Total | 14,682 | 100.0% |
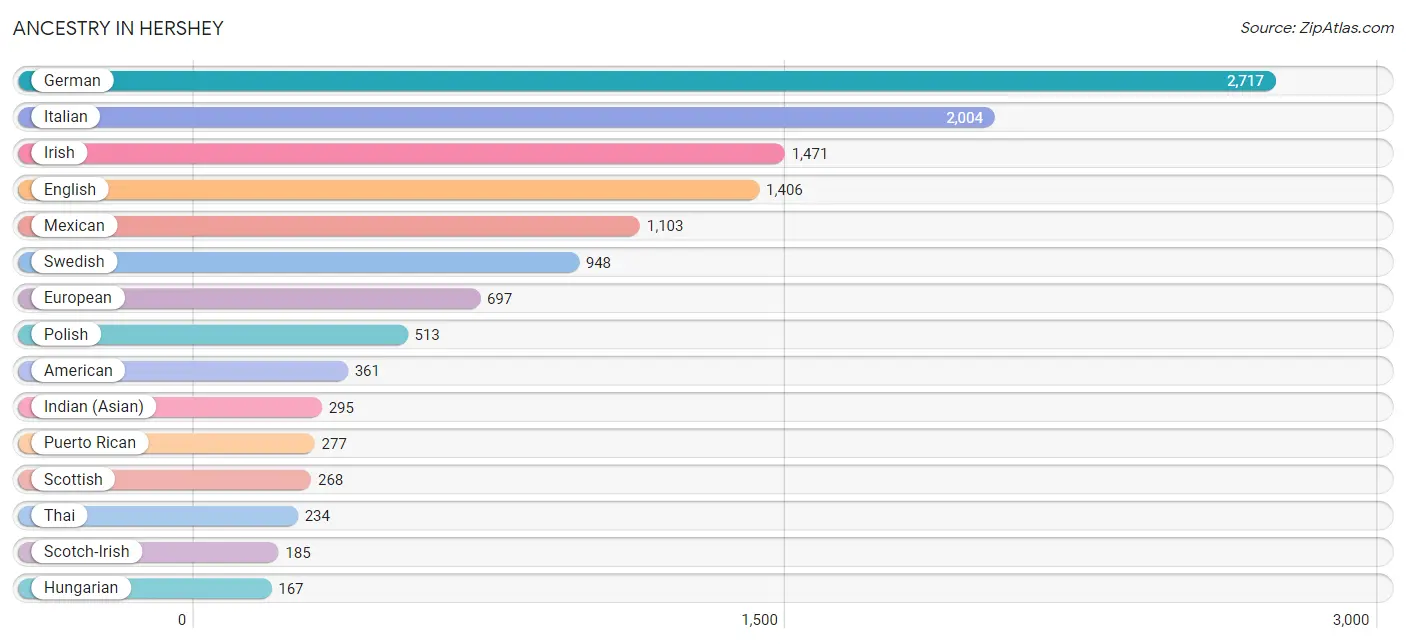
Ancestry in Hershey
The most populous ancestries reported in Hershey are German (2,717 | 18.5%), Italian (2,004 | 13.7%), Irish (1,471 | 10.0%), English (1,406 | 9.6%), and Mexican (1,103 | 7.5%), together accounting for 59.3% of all Hershey residents.
| Ancestry | # Population | % Population |
| African | 39 | 0.3% |
| Albanian | 39 | 0.3% |
| American | 361 | 2.5% |
| Arab | 95 | 0.6% |
| Argentinean | 96 | 0.6% |
| Armenian | 13 | 0.1% |
| Australian | 14 | 0.1% |
| Austrian | 109 | 0.7% |
| Belgian | 7 | 0.1% |
| Bhutanese | 63 | 0.4% |
| Brazilian | 8 | 0.1% |
| British | 14 | 0.1% |
| Burmese | 9 | 0.1% |
| Celtic | 7 | 0.1% |
| Central American | 60 | 0.4% |
| Cherokee | 80 | 0.5% |
| Colombian | 20 | 0.1% |
| Croatian | 36 | 0.3% |
| Czech | 29 | 0.2% |
| Czechoslovakian | 9 | 0.1% |
| Dominican | 30 | 0.2% |
| Dutch | 105 | 0.7% |
| Eastern European | 153 | 1.0% |
| Egyptian | 20 | 0.1% |
| English | 1,406 | 9.6% |
| European | 697 | 4.8% |
| Filipino | 13 | 0.1% |
| French | 109 | 0.7% |
| French Canadian | 55 | 0.4% |
| German | 2,717 | 18.5% |
| Greek | 160 | 1.1% |
| Guatemalan | 53 | 0.4% |
| Haitian | 27 | 0.2% |
| Hungarian | 167 | 1.1% |
| Indian (Asian) | 295 | 2.0% |
| Iranian | 57 | 0.4% |
| Irish | 1,471 | 10.0% |
| Italian | 2,004 | 13.7% |
| Japanese | 37 | 0.3% |
| Korean | 88 | 0.6% |
| Lebanese | 75 | 0.5% |
| Lithuanian | 97 | 0.7% |
| Mexican | 1,103 | 7.5% |
| Mongolian | 71 | 0.5% |
| New Zealander | 6 | 0.0% |
| Norwegian | 74 | 0.5% |
| Okinawan | 8 | 0.1% |
| Panamanian | 7 | 0.1% |
| Pennsylvania German | 129 | 0.9% |
| Polish | 513 | 3.5% |
| Portuguese | 55 | 0.4% |
| Puerto Rican | 277 | 1.9% |
| Russian | 122 | 0.8% |
| Scotch-Irish | 185 | 1.3% |
| Scottish | 268 | 1.8% |
| Serbian | 22 | 0.2% |
| Slavic | 44 | 0.3% |
| Slovak | 98 | 0.7% |
| Slovene | 7 | 0.1% |
| South American | 116 | 0.8% |
| Spaniard | 134 | 0.9% |
| Sri Lankan | 91 | 0.6% |
| Subsaharan African | 84 | 0.6% |
| Swedish | 948 | 6.5% |
| Swiss | 70 | 0.5% |
| Thai | 234 | 1.6% |
| Ukrainian | 114 | 0.8% |
| Welsh | 121 | 0.8% | View All 68 Rows |
Immigrants in Hershey
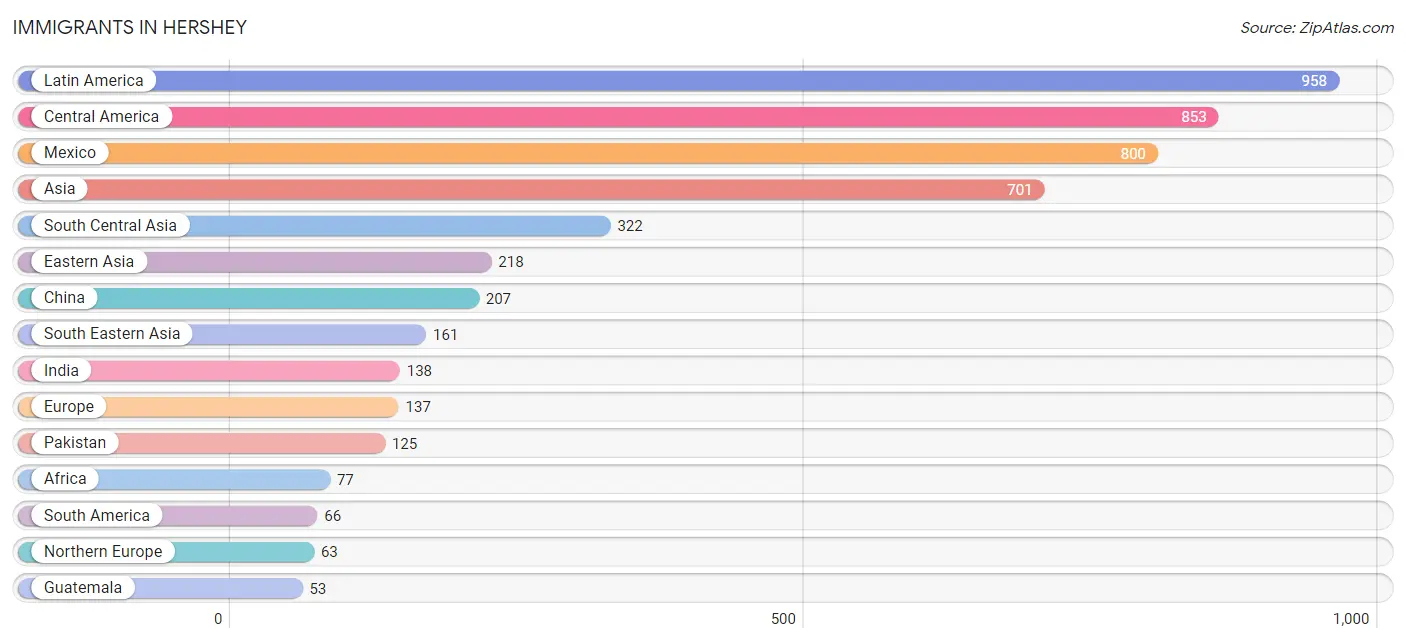
The most numerous immigrant groups reported in Hershey came from Latin America (958 | 6.5%), Central America (853 | 5.8%), Mexico (800 | 5.4%), Asia (701 | 4.8%), and South Central Asia (322 | 2.2%), together accounting for 24.7% of all Hershey residents.
| Immigration Origin | # Population | % Population |
| Africa | 77 | 0.5% |
| Albania | 14 | 0.1% |
| Argentina | 23 | 0.2% |
| Asia | 701 | 4.8% |
| Australia | 5 | 0.0% |
| Brazil | 36 | 0.3% |
| Cambodia | 37 | 0.3% |
| Caribbean | 39 | 0.3% |
| Central America | 853 | 5.8% |
| China | 207 | 1.4% |
| Colombia | 7 | 0.1% |
| Eastern Africa | 22 | 0.2% |
| Eastern Asia | 218 | 1.5% |
| Eastern Europe | 46 | 0.3% |
| Egypt | 10 | 0.1% |
| England | 24 | 0.2% |
| Europe | 137 | 0.9% |
| Germany | 6 | 0.0% |
| Greece | 5 | 0.0% |
| Guatemala | 53 | 0.4% |
| Haiti | 39 | 0.3% |
| Hong Kong | 11 | 0.1% |
| India | 138 | 0.9% |
| Iran | 28 | 0.2% |
| Japan | 6 | 0.0% |
| Kenya | 4 | 0.0% |
| Korea | 5 | 0.0% |
| Latin America | 958 | 6.5% |
| Malaysia | 31 | 0.2% |
| Mexico | 800 | 5.4% |
| Moldova | 10 | 0.1% |
| Northern Africa | 10 | 0.1% |
| Northern Europe | 63 | 0.4% |
| Oceania | 11 | 0.1% |
| Pakistan | 125 | 0.9% |
| Philippines | 45 | 0.3% |
| Poland | 15 | 0.1% |
| Russia | 1 | 0.0% |
| Singapore | 8 | 0.1% |
| South America | 66 | 0.4% |
| South Central Asia | 322 | 2.2% |
| South Eastern Asia | 161 | 1.1% |
| Southern Europe | 13 | 0.1% |
| Spain | 8 | 0.1% |
| Sri Lanka | 2 | 0.0% |
| Sweden | 5 | 0.0% |
| Switzerland | 9 | 0.1% |
| Taiwan | 33 | 0.2% |
| Uganda | 6 | 0.0% |
| Vietnam | 40 | 0.3% |
| Western Africa | 34 | 0.2% |
| Western Europe | 15 | 0.1% | View All 52 Rows |
Sex and Age in Hershey
Sex and Age in Hershey
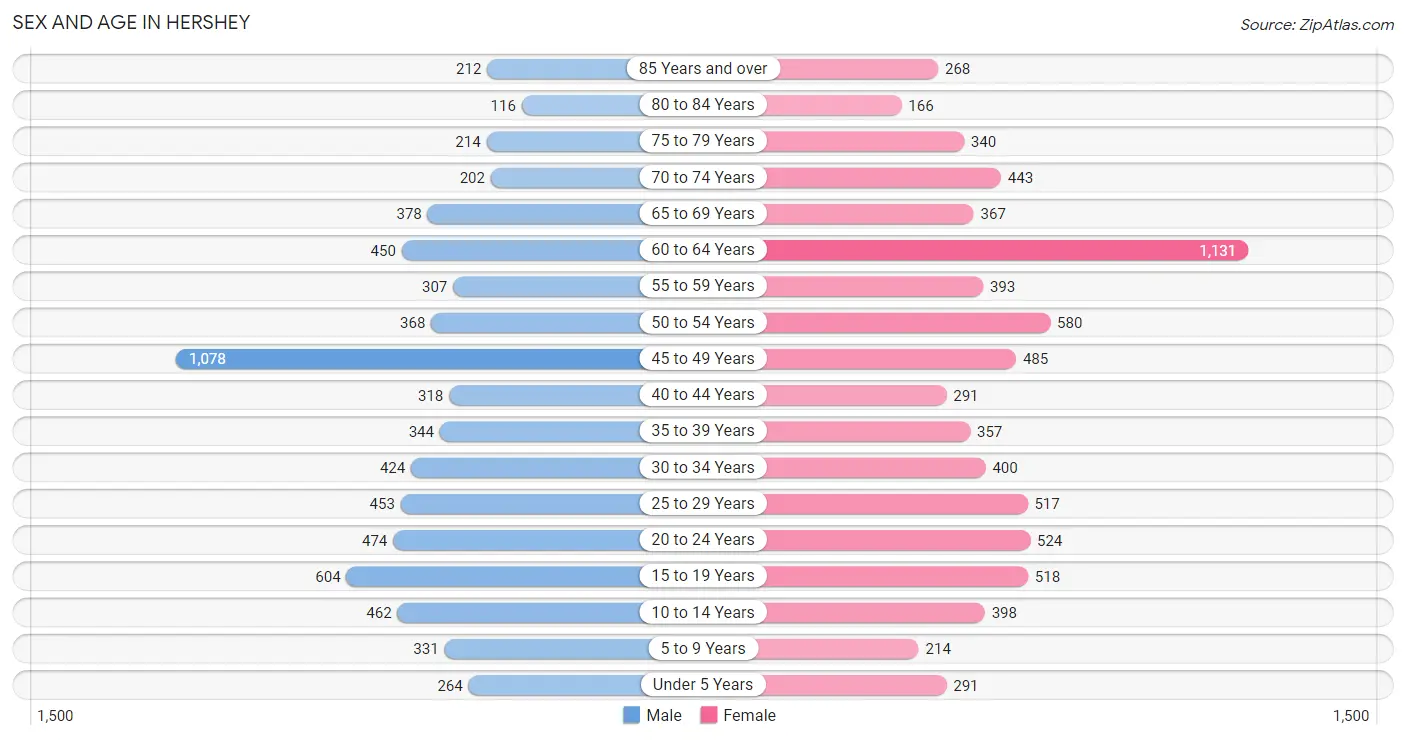
The most populous age groups in Hershey are 45 to 49 Years (1,078 | 15.4%) for men and 60 to 64 Years (1,131 | 14.7%) for women.
| Age Bracket | Male | Female |
| Under 5 Years | 264 (3.8%) | 291 (3.8%) |
| 5 to 9 Years | 331 (4.7%) | 214 (2.8%) |
| 10 to 14 Years | 462 (6.6%) | 398 (5.2%) |
| 15 to 19 Years | 604 (8.6%) | 518 (6.7%) |
| 20 to 24 Years | 474 (6.8%) | 524 (6.8%) |
| 25 to 29 Years | 453 (6.5%) | 517 (6.7%) |
| 30 to 34 Years | 424 (6.1%) | 400 (5.2%) |
| 35 to 39 Years | 344 (4.9%) | 357 (4.6%) |
| 40 to 44 Years | 318 (4.5%) | 291 (3.8%) |
| 45 to 49 Years | 1,078 (15.4%) | 485 (6.3%) |
| 50 to 54 Years | 368 (5.3%) | 580 (7.5%) |
| 55 to 59 Years | 307 (4.4%) | 393 (5.1%) |
| 60 to 64 Years | 450 (6.4%) | 1,131 (14.7%) |
| 65 to 69 Years | 378 (5.4%) | 367 (4.8%) |
| 70 to 74 Years | 202 (2.9%) | 443 (5.8%) |
| 75 to 79 Years | 214 (3.1%) | 340 (4.4%) |
| 80 to 84 Years | 116 (1.7%) | 166 (2.2%) |
| 85 Years and over | 212 (3.0%) | 268 (3.5%) |
| Total | 6,999 (100.0%) | 7,683 (100.0%) |
Families and Households in Hershey
Median Family Size in Hershey
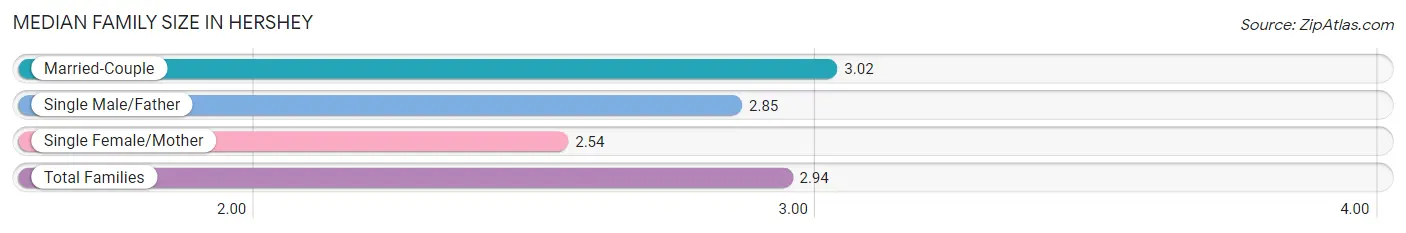
The median family size in Hershey is 2.94 persons per family, with married-couple families (2,804 | 81.9%) accounting for the largest median family size of 3.02 persons per family. On the other hand, single female/mother families (486 | 14.2%) represent the smallest median family size with 2.54 persons per family.
| Family Type | # Families | Family Size |
| Married-Couple | 2,804 (81.9%) | 3.02 |
| Single Male/Father | 133 (3.9%) | 2.85 |
| Single Female/Mother | 486 (14.2%) | 2.54 |
| Total Families | 3,423 (100.0%) | 2.94 |
Median Household Size in Hershey
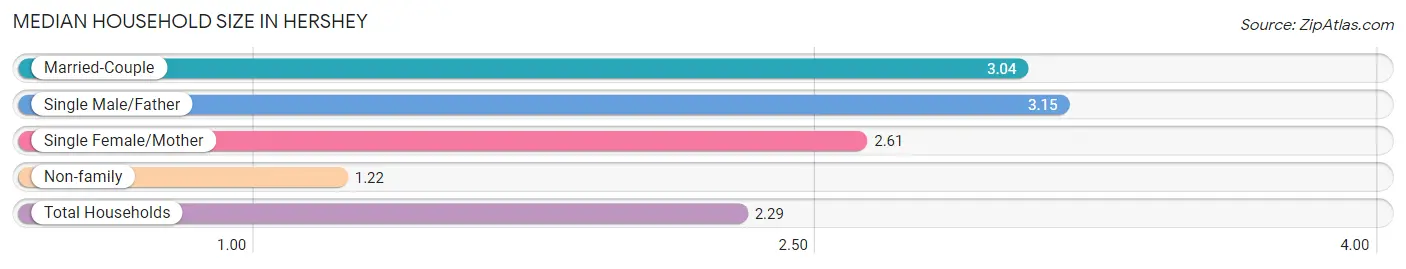
The median household size in Hershey is 2.29 persons per household, with single male/father households (133 | 2.4%) accounting for the largest median household size of 3.15 persons per household. non-family households (2,210 | 39.2%) represent the smallest median household size with 1.22 persons per household.
| Household Type | # Households | Household Size |
| Married-Couple | 2,804 (49.8%) | 3.04 |
| Single Male/Father | 133 (2.4%) | 3.15 |
| Single Female/Mother | 486 (8.6%) | 2.61 |
| Non-family | 2,210 (39.2%) | 1.22 |
| Total Households | 5,633 (100.0%) | 2.29 |
Household Size by Marriage Status in Hershey
Out of a total of 5,633 households in Hershey, 3,423 (60.8%) are family households, while 2,210 (39.2%) are nonfamily households. The most numerous type of family households are 2-person households, comprising 1,793, and the most common type of nonfamily households are 1-person households, comprising 1,789.
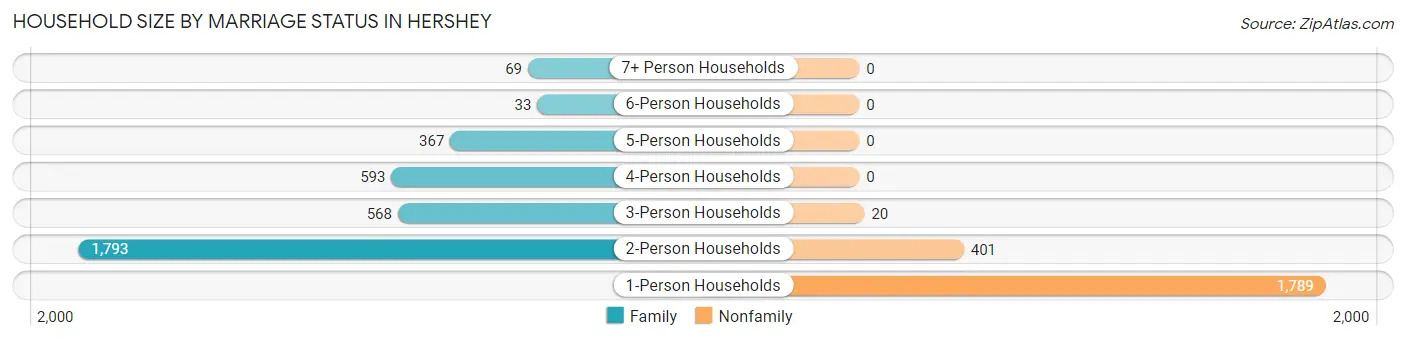
| Household Size | Family Households | Nonfamily Households |
| 1-Person Households | - | 1,789 (31.8%) |
| 2-Person Households | 1,793 (31.8%) | 401 (7.1%) |
| 3-Person Households | 568 (10.1%) | 20 (0.4%) |
| 4-Person Households | 593 (10.5%) | 0 (0.0%) |
| 5-Person Households | 367 (6.5%) | 0 (0.0%) |
| 6-Person Households | 33 (0.6%) | 0 (0.0%) |
| 7+ Person Households | 69 (1.2%) | 0 (0.0%) |
| Total | 3,423 (60.8%) | 2,210 (39.2%) |
Female Fertility in Hershey
Fertility by Age in Hershey
Average fertility rate in Hershey is 39.0 births per 1,000 women. Women in the age bracket of 20 to 34 years have the highest fertility rate with 75.0 births per 1,000 women. Women in the age bracket of 20 to 34 years acount for 86.4% of all women with births.
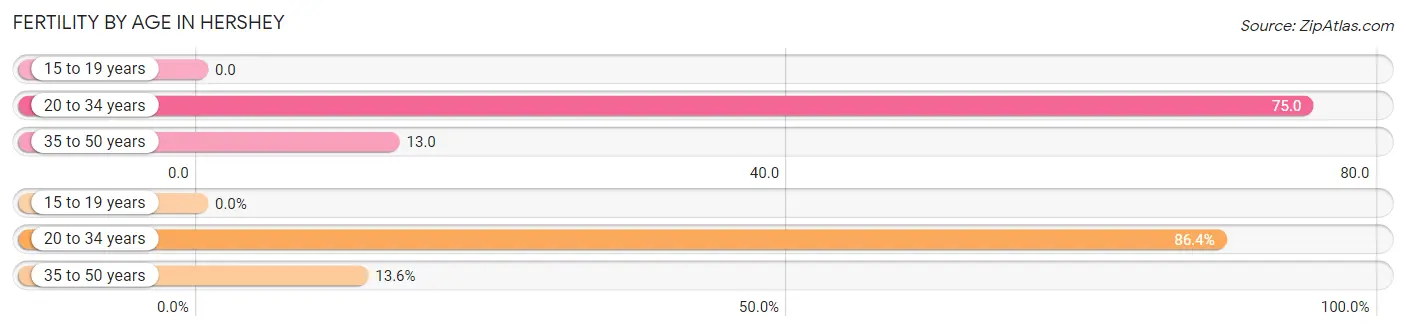
| Age Bracket | Women with Births | Births / 1,000 Women |
| 15 to 19 years | 0 (0.0%) | 0.0 |
| 20 to 34 years | 108 (86.4%) | 75.0 |
| 35 to 50 years | 17 (13.6%) | 13.0 |
| Total | 125 (100.0%) | 39.0 |
Fertility by Age by Marriage Status in Hershey
59.2% of women with births (125) in Hershey are married. The highest percentage of unmarried women with births falls into 35 to 50 years age bracket with 41.2% of them unmarried at the time of birth, while the lowest percentage of unmarried women with births belong to 20 to 34 years age bracket with 40.7% of them unmarried.
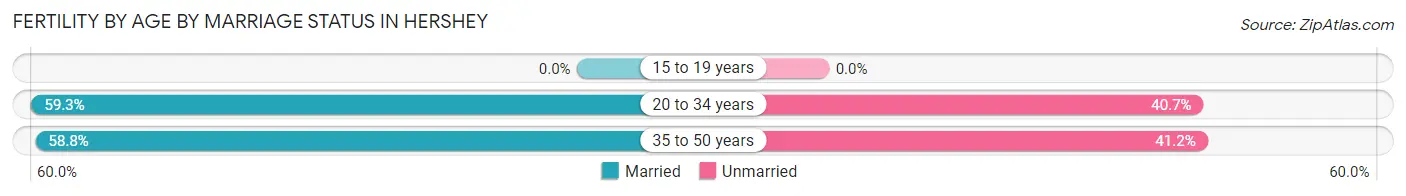
| Age Bracket | Married | Unmarried |
| 15 to 19 years | 0 (0.0%) | 0 (0.0%) |
| 20 to 34 years | 64 (59.3%) | 44 (40.7%) |
| 35 to 50 years | 10 (58.8%) | 7 (41.2%) |
| Total | 74 (59.2%) | 51 (40.8%) |
Fertility by Education in Hershey
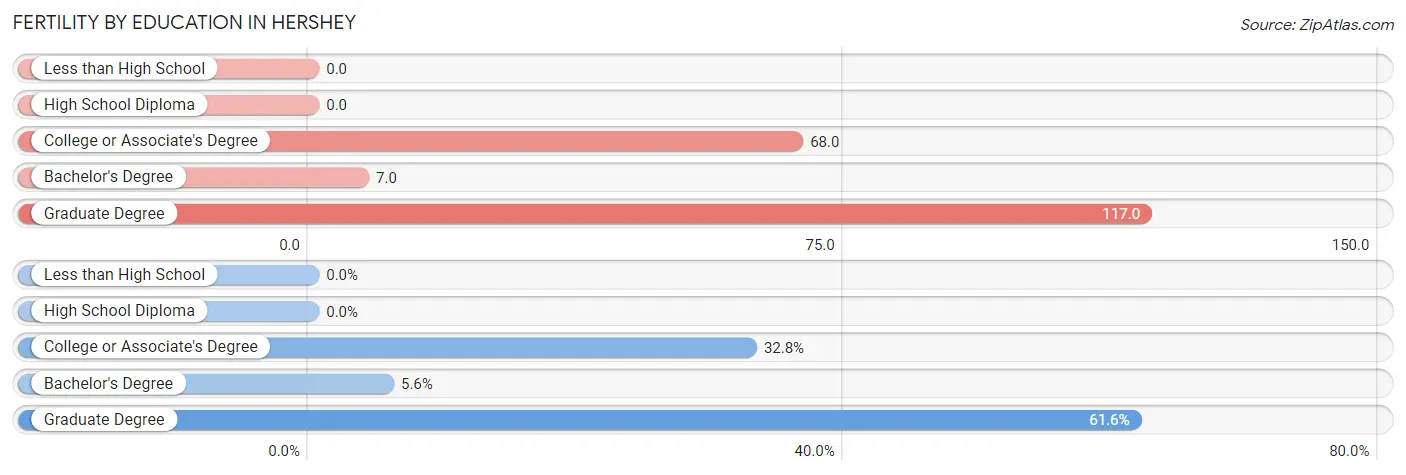
| Educational Attainment | Women with Births | Births / 1,000 Women |
| Less than High School | 0 (0.0%) | 0.0 |
| High School Diploma | 0 (0.0%) | 0.0 |
| College or Associate's Degree | 41 (32.8%) | 68.0 |
| Bachelor's Degree | 7 (5.6%) | 7.0 |
| Graduate Degree | 77 (61.6%) | 117.0 |
| Total | 125 (100.0%) | 39.0 |
Fertility by Education by Marriage Status in Hershey
40.8% of women with births in Hershey are unmarried. Women with the educational attainment of college or associate's degree are most likely to be married with 68.3% of them married at childbirth, while women with the educational attainment of bachelor's degree are least likely to be married with 100.0% of them unmarried at childbirth.
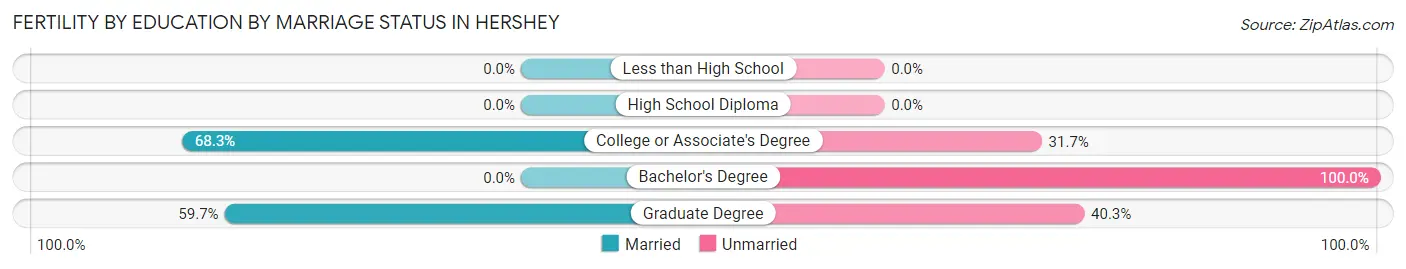
| Educational Attainment | Married | Unmarried |
| Less than High School | 0 (0.0%) | 0 (0.0%) |
| High School Diploma | 0 (0.0%) | 0 (0.0%) |
| College or Associate's Degree | 28 (68.3%) | 13 (31.7%) |
| Bachelor's Degree | 0 (0.0%) | 7 (100.0%) |
| Graduate Degree | 46 (59.7%) | 31 (40.3%) |
| Total | 74 (59.2%) | 51 (40.8%) |
Employment Characteristics in Hershey
Employment by Class of Employer in Hershey
Among the 7,866 employed individuals in Hershey, private company employees (4,605 | 58.5%), not-for-profit organizations (2,041 | 26.0%), and state government employees (404 | 5.1%) make up the most common classes of employment.
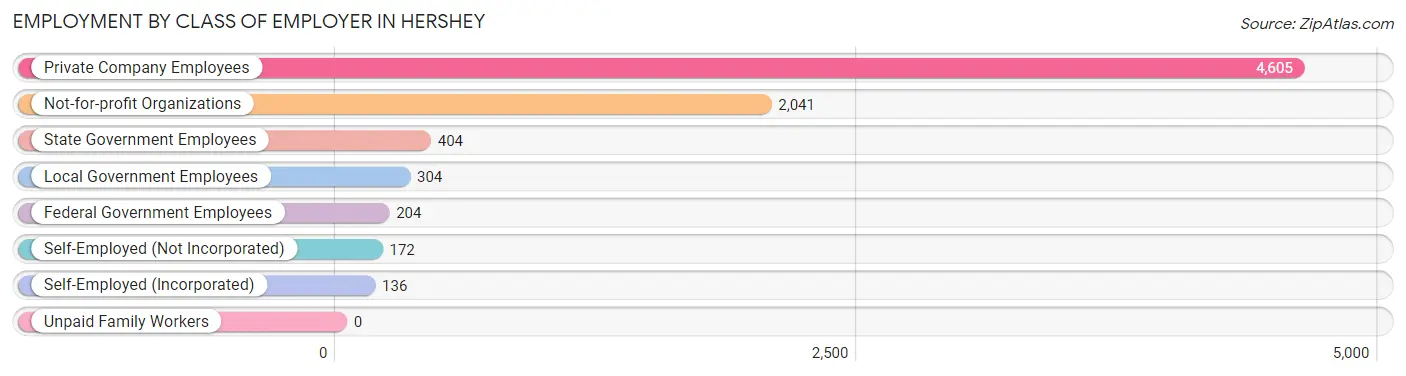
| Employer Class | # Employees | % Employees |
| Private Company Employees | 4,605 | 58.5% |
| Self-Employed (Incorporated) | 136 | 1.7% |
| Self-Employed (Not Incorporated) | 172 | 2.2% |
| Not-for-profit Organizations | 2,041 | 26.0% |
| Local Government Employees | 304 | 3.9% |
| State Government Employees | 404 | 5.1% |
| Federal Government Employees | 204 | 2.6% |
| Unpaid Family Workers | 0 | 0.0% |
| Total | 7,866 | 100.0% |
Employment Status by Age in Hershey
According to the labor force statistics for Hershey, out of the total population over 16 years of age (12,474), 66.0% or 8,233 individuals are in the labor force, with 3.3% or 272 of them unemployed. The age group with the highest labor force participation rate is 30 to 34 years, with 92.1% or 759 individuals in the labor force. Within the labor force, the 16 to 19 years age range has the highest percentage of unemployed individuals, with 7.4% or 18 of them being unemployed.
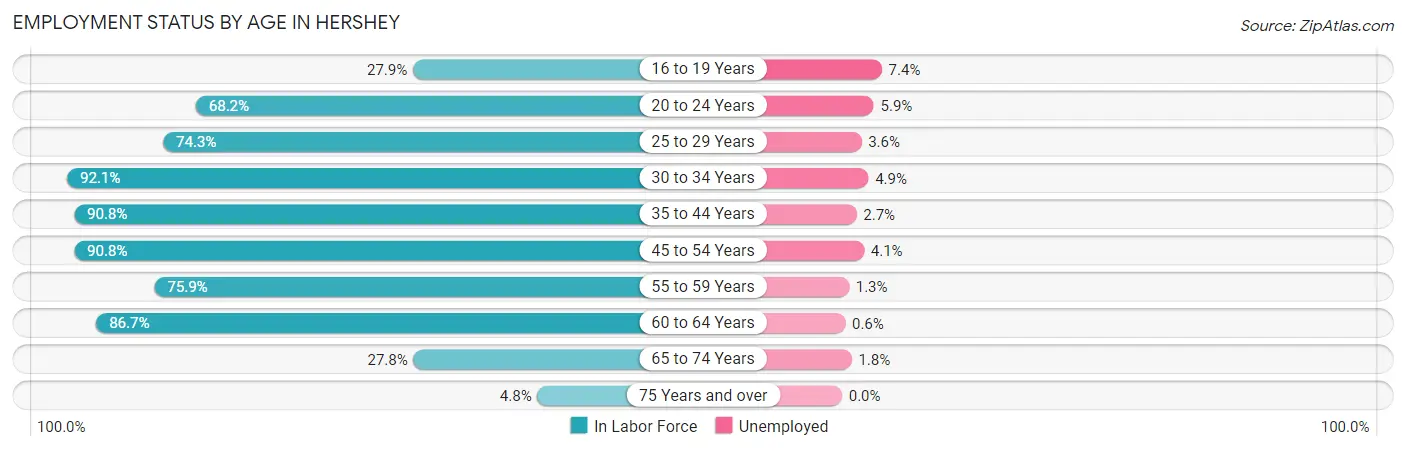
| Age Bracket | In Labor Force | Unemployed |
| 16 to 19 Years | 244 (27.9%) | 18 (7.4%) |
| 20 to 24 Years | 681 (68.2%) | 40 (5.9%) |
| 25 to 29 Years | 721 (74.3%) | 26 (3.6%) |
| 30 to 34 Years | 759 (92.1%) | 37 (4.9%) |
| 35 to 44 Years | 1,189 (90.8%) | 32 (2.7%) |
| 45 to 54 Years | 2,280 (90.8%) | 93 (4.1%) |
| 55 to 59 Years | 531 (75.9%) | 7 (1.3%) |
| 60 to 64 Years | 1,371 (86.7%) | 8 (0.6%) |
| 65 to 74 Years | 386 (27.8%) | 7 (1.8%) |
| 75 Years and over | 63 (4.8%) | 0 (0.0%) |
| Total | 8,233 (66.0%) | 272 (3.3%) |
Employment Status by Educational Attainment in Hershey
According to labor force statistics for Hershey, 86.8% of individuals (6,854) out of the total population between 25 and 64 years of age (7,896) are in the labor force, with 3.0% or 206 of them being unemployed. The group with the highest labor force participation rate are those with the educational attainment of college / associate degree, with 89.8% or 1,811 individuals in the labor force. Within the labor force, individuals with high school diploma education have the highest percentage of unemployment, with 6.5% or 48 of them being unemployed.
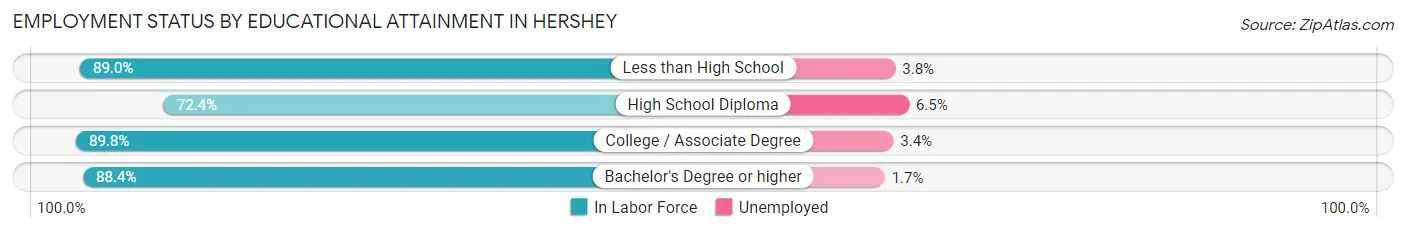
| Educational Attainment | In Labor Force | Unemployed |
| Less than High School | 865 (89.0%) | 37 (3.8%) |
| High School Diploma | 736 (72.4%) | 66 (6.5%) |
| College / Associate Degree | 1,811 (89.8%) | 69 (3.4%) |
| Bachelor's Degree or higher | 3,439 (88.4%) | 66 (1.7%) |
| Total | 6,854 (86.8%) | 237 (3.0%) |
Employment Occupations by Sex in Hershey
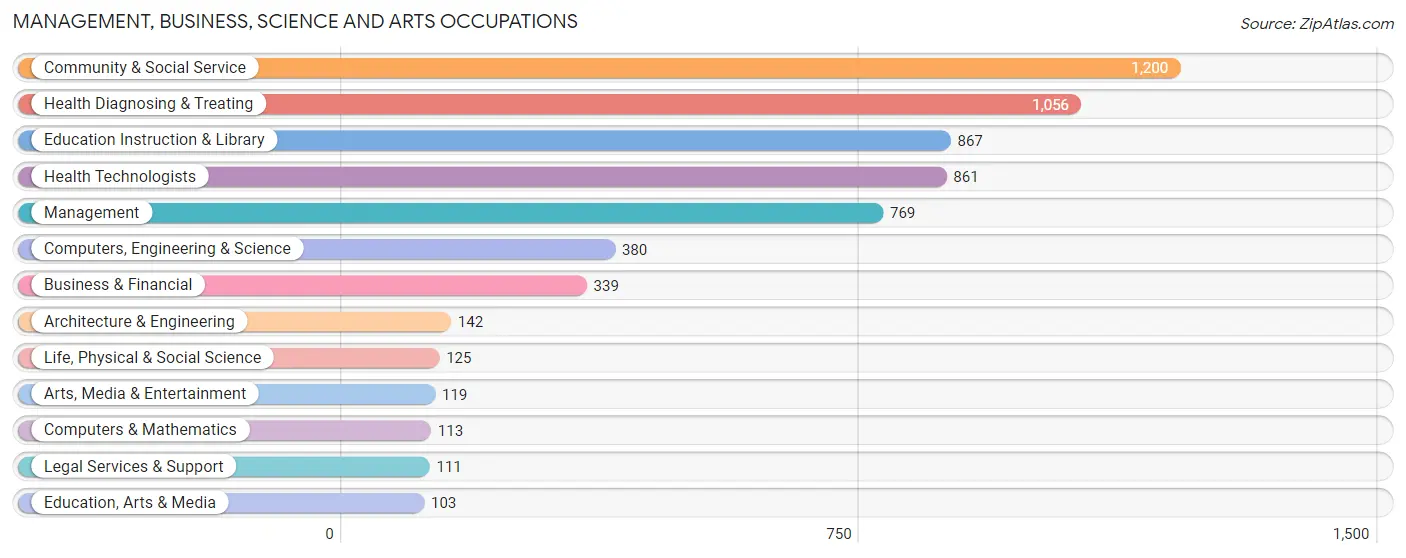
Management, Business, Science and Arts Occupations
The most common Management, Business, Science and Arts occupations in Hershey are Community & Social Service (1,200 | 15.2%), Health Diagnosing & Treating (1,056 | 13.4%), Education Instruction & Library (867 | 11.0%), Health Technologists (861 | 10.9%), and Management (769 | 9.7%).
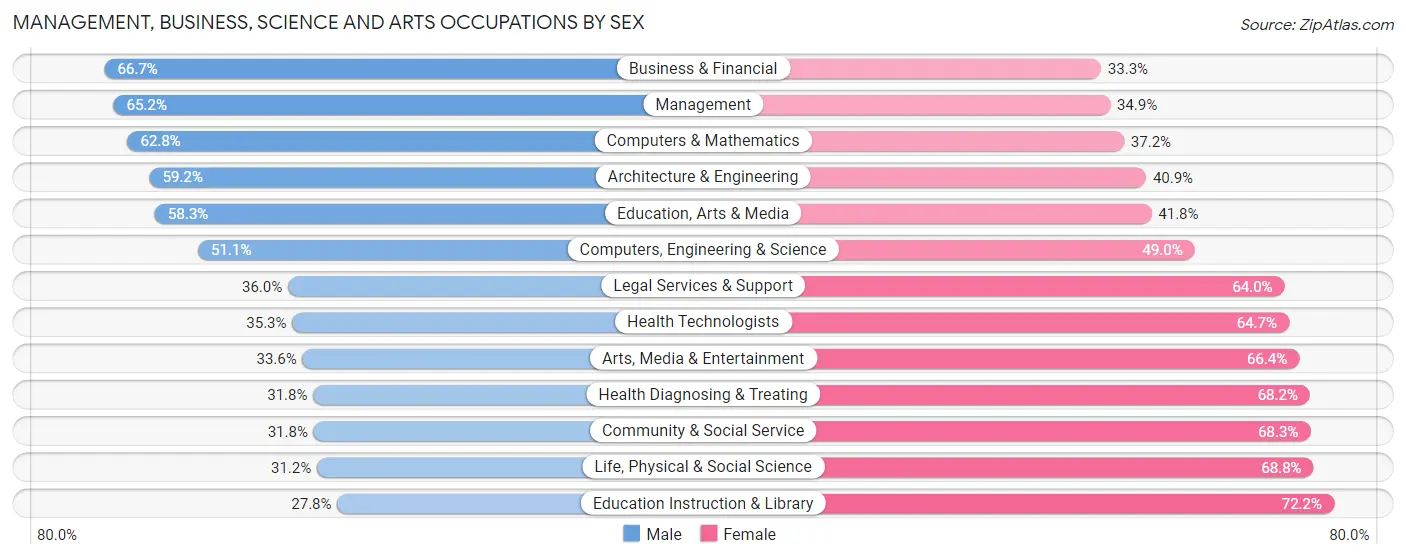
Management, Business, Science and Arts Occupations by Sex
Within the Management, Business, Science and Arts occupations in Hershey, the most male-oriented occupations are Business & Financial (66.7%), Management (65.1%), and Computers & Mathematics (62.8%), while the most female-oriented occupations are Education Instruction & Library (72.2%), Life, Physical & Social Science (68.8%), and Community & Social Service (68.2%).
| Occupation | Male | Female |
| Management | 501 (65.1%) | 268 (34.8%) |
| Business & Financial | 226 (66.7%) | 113 (33.3%) |
| Computers, Engineering & Science | 194 (51.0%) | 186 (48.9%) |
| Computers & Mathematics | 71 (62.8%) | 42 (37.2%) |
| Architecture & Engineering | 84 (59.2%) | 58 (40.8%) |
| Life, Physical & Social Science | 39 (31.2%) | 86 (68.8%) |
| Community & Social Service | 381 (31.8%) | 819 (68.2%) |
| Education, Arts & Media | 60 (58.3%) | 43 (41.7%) |
| Legal Services & Support | 40 (36.0%) | 71 (64.0%) |
| Education Instruction & Library | 241 (27.8%) | 626 (72.2%) |
| Arts, Media & Entertainment | 40 (33.6%) | 79 (66.4%) |
| Health Diagnosing & Treating | 336 (31.8%) | 720 (68.2%) |
| Health Technologists | 304 (35.3%) | 557 (64.7%) |
| Total (Category) | 1,638 (43.8%) | 2,106 (56.2%) |
| Total (Overall) | 3,887 (49.1%) | 4,024 (50.9%) |
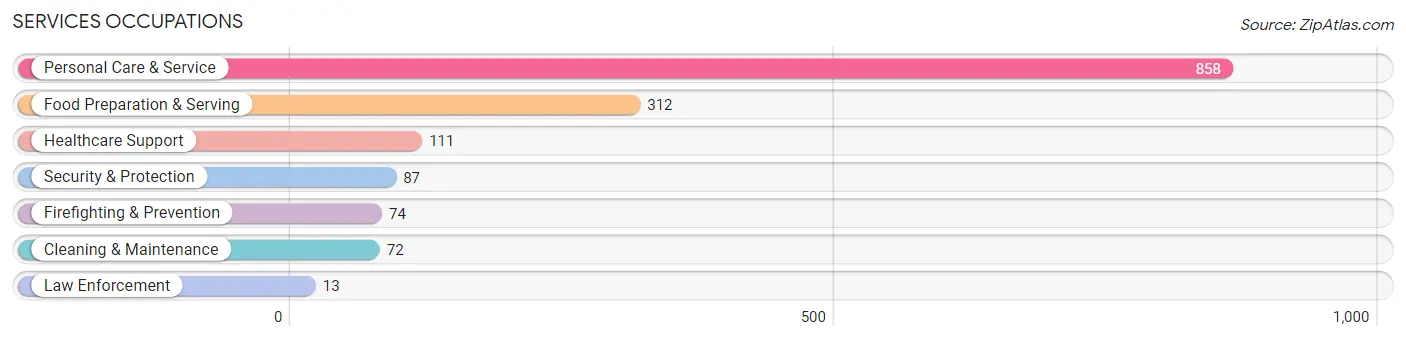
Services Occupations
The most common Services occupations in Hershey are Personal Care & Service (858 | 10.8%), Food Preparation & Serving (312 | 3.9%), Healthcare Support (111 | 1.4%), Security & Protection (87 | 1.1%), and Firefighting & Prevention (74 | 0.9%).
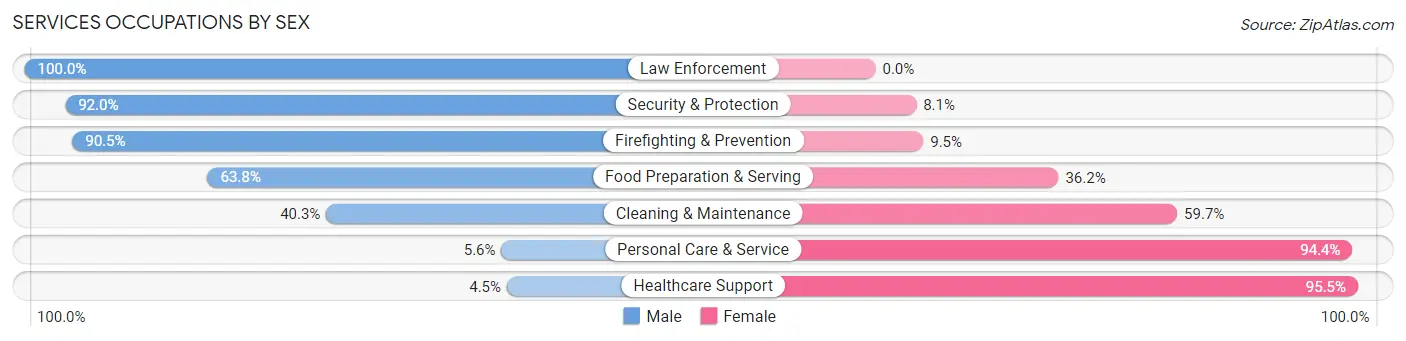
Services Occupations by Sex
Within the Services occupations in Hershey, the most male-oriented occupations are Law Enforcement (100.0%), Security & Protection (91.9%), and Firefighting & Prevention (90.5%), while the most female-oriented occupations are Healthcare Support (95.5%), Personal Care & Service (94.4%), and Cleaning & Maintenance (59.7%).
| Occupation | Male | Female |
| Healthcare Support | 5 (4.5%) | 106 (95.5%) |
| Security & Protection | 80 (91.9%) | 7 (8.1%) |
| Firefighting & Prevention | 67 (90.5%) | 7 (9.5%) |
| Law Enforcement | 13 (100.0%) | 0 (0.0%) |
| Food Preparation & Serving | 199 (63.8%) | 113 (36.2%) |
| Cleaning & Maintenance | 29 (40.3%) | 43 (59.7%) |
| Personal Care & Service | 48 (5.6%) | 810 (94.4%) |
| Total (Category) | 361 (25.1%) | 1,079 (74.9%) |
| Total (Overall) | 3,887 (49.1%) | 4,024 (50.9%) |
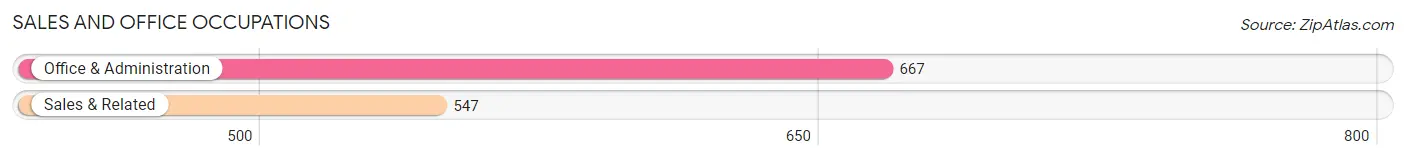
Sales and Office Occupations
The most common Sales and Office occupations in Hershey are Office & Administration (667 | 8.4%), and Sales & Related (547 | 6.9%).
Sales and Office Occupations by Sex
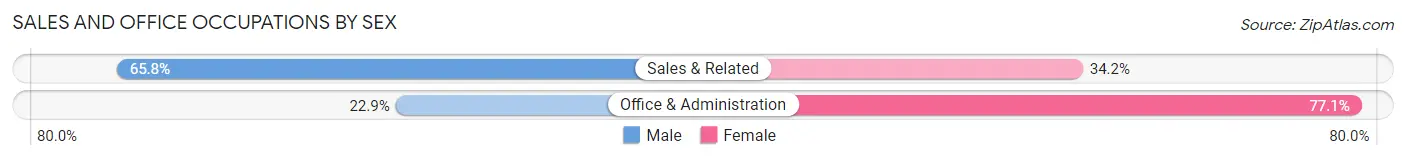
| Occupation | Male | Female |
| Sales & Related | 360 (65.8%) | 187 (34.2%) |
| Office & Administration | 153 (22.9%) | 514 (77.1%) |
| Total (Category) | 513 (42.3%) | 701 (57.7%) |
| Total (Overall) | 3,887 (49.1%) | 4,024 (50.9%) |
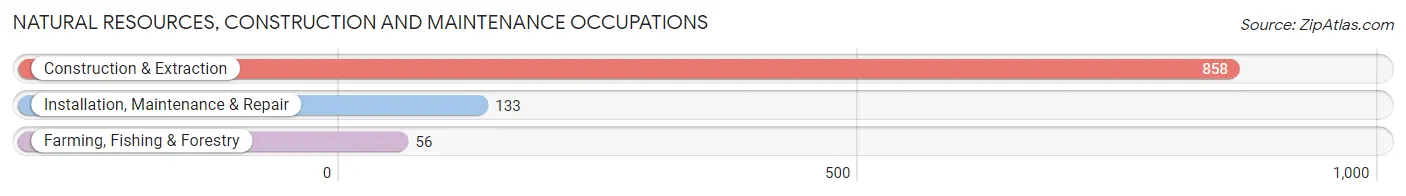
Natural Resources, Construction and Maintenance Occupations
The most common Natural Resources, Construction and Maintenance occupations in Hershey are Construction & Extraction (858 | 10.8%), Installation, Maintenance & Repair (133 | 1.7%), and Farming, Fishing & Forestry (56 | 0.7%).
Natural Resources, Construction and Maintenance Occupations by Sex
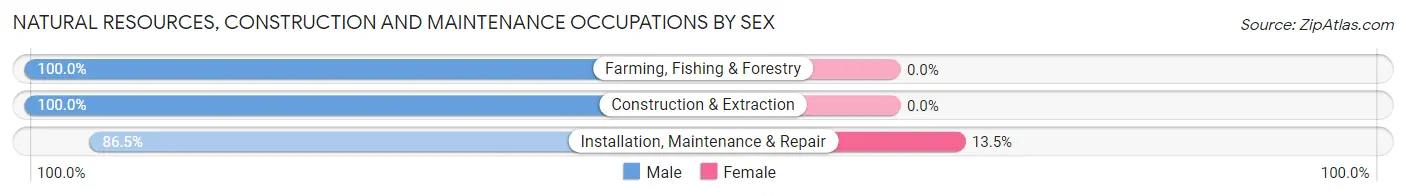
| Occupation | Male | Female |
| Farming, Fishing & Forestry | 56 (100.0%) | 0 (0.0%) |
| Construction & Extraction | 858 (100.0%) | 0 (0.0%) |
| Installation, Maintenance & Repair | 115 (86.5%) | 18 (13.5%) |
| Total (Category) | 1,029 (98.3%) | 18 (1.7%) |
| Total (Overall) | 3,887 (49.1%) | 4,024 (50.9%) |
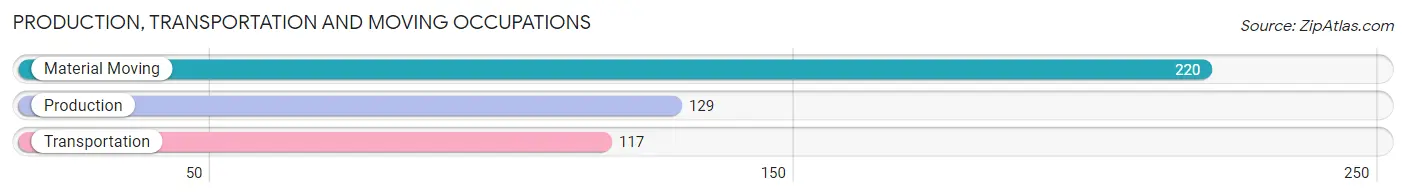
Production, Transportation and Moving Occupations
The most common Production, Transportation and Moving occupations in Hershey are Material Moving (220 | 2.8%), Production (129 | 1.6%), and Transportation (117 | 1.5%).
Production, Transportation and Moving Occupations by Sex
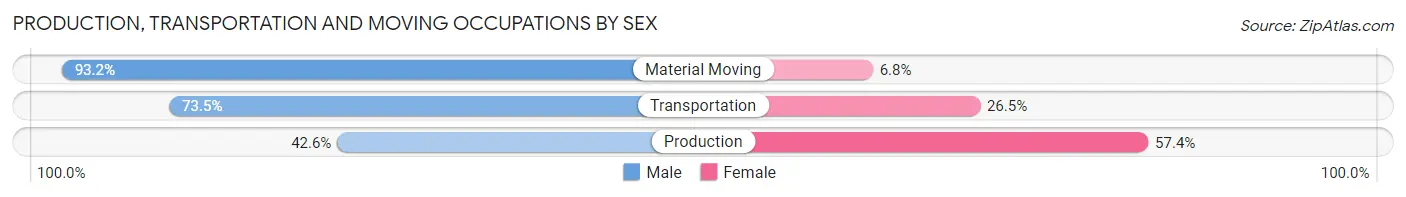
| Occupation | Male | Female |
| Production | 55 (42.6%) | 74 (57.4%) |
| Transportation | 86 (73.5%) | 31 (26.5%) |
| Material Moving | 205 (93.2%) | 15 (6.8%) |
| Total (Category) | 346 (74.3%) | 120 (25.8%) |
| Total (Overall) | 3,887 (49.1%) | 4,024 (50.9%) |
Employment Industries by Sex in Hershey
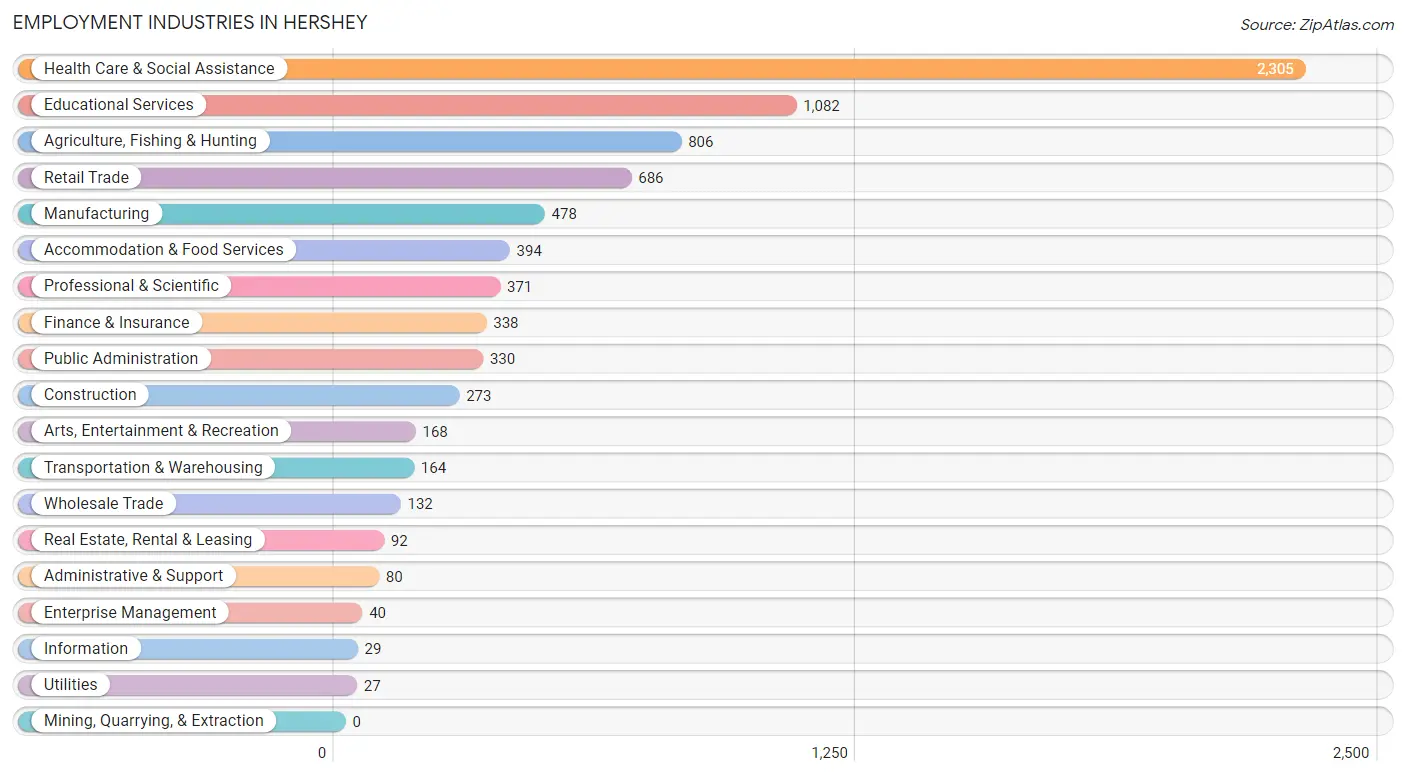
Employment Industries in Hershey
The major employment industries in Hershey include Health Care & Social Assistance (2,305 | 29.1%), Educational Services (1,082 | 13.7%), Agriculture, Fishing & Hunting (806 | 10.2%), Retail Trade (686 | 8.7%), and Manufacturing (478 | 6.0%).
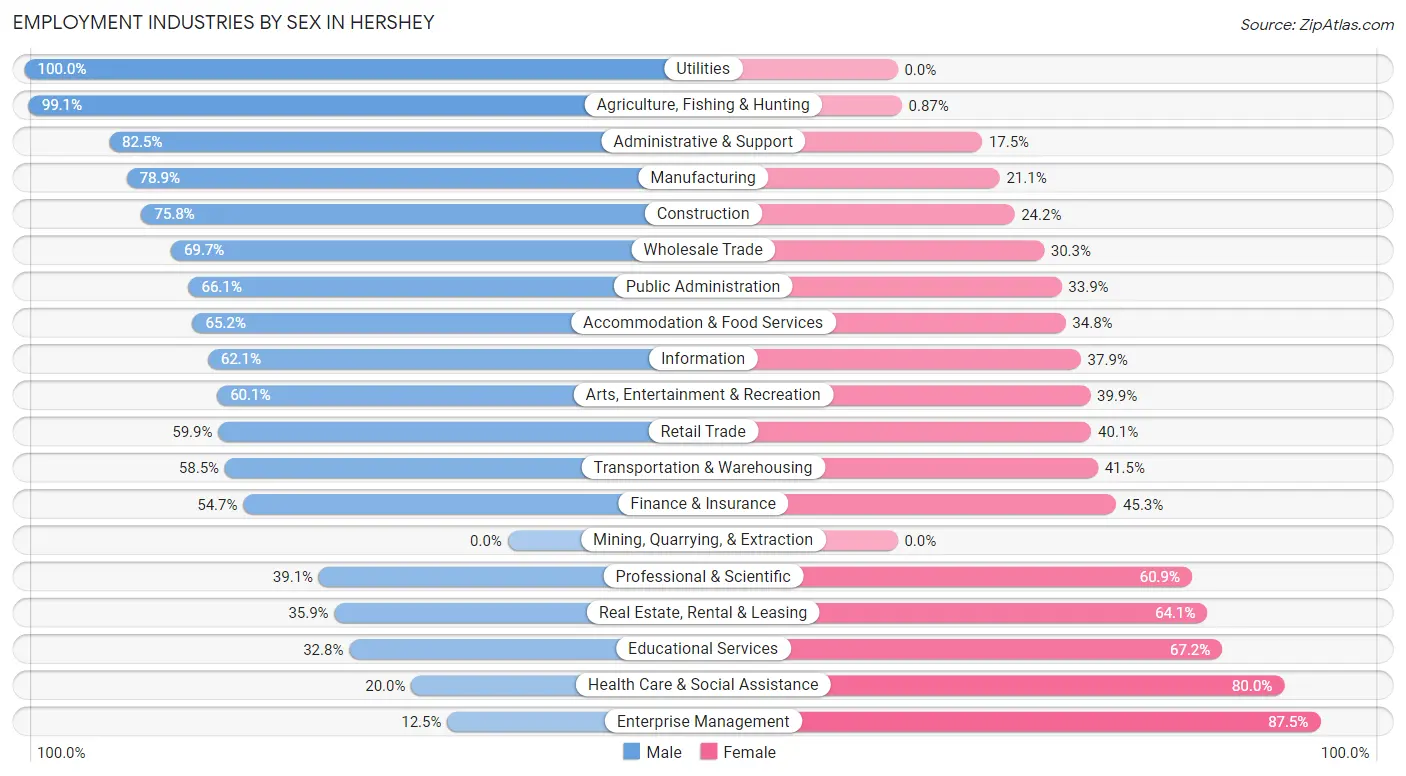
Employment Industries by Sex in Hershey
The Hershey industries that see more men than women are Utilities (100.0%), Agriculture, Fishing & Hunting (99.1%), and Administrative & Support (82.5%), whereas the industries that tend to have a higher number of women are Enterprise Management (87.5%), Health Care & Social Assistance (80.0%), and Educational Services (67.2%).
| Industry | Male | Female |
| Agriculture, Fishing & Hunting | 799 (99.1%) | 7 (0.9%) |
| Mining, Quarrying, & Extraction | 0 (0.0%) | 0 (0.0%) |
| Construction | 207 (75.8%) | 66 (24.2%) |
| Manufacturing | 377 (78.9%) | 101 (21.1%) |
| Wholesale Trade | 92 (69.7%) | 40 (30.3%) |
| Retail Trade | 411 (59.9%) | 275 (40.1%) |
| Transportation & Warehousing | 96 (58.5%) | 68 (41.5%) |
| Utilities | 27 (100.0%) | 0 (0.0%) |
| Information | 18 (62.1%) | 11 (37.9%) |
| Finance & Insurance | 185 (54.7%) | 153 (45.3%) |
| Real Estate, Rental & Leasing | 33 (35.9%) | 59 (64.1%) |
| Professional & Scientific | 145 (39.1%) | 226 (60.9%) |
| Enterprise Management | 5 (12.5%) | 35 (87.5%) |
| Administrative & Support | 66 (82.5%) | 14 (17.5%) |
| Educational Services | 355 (32.8%) | 727 (67.2%) |
| Health Care & Social Assistance | 460 (20.0%) | 1,845 (80.0%) |
| Arts, Entertainment & Recreation | 101 (60.1%) | 67 (39.9%) |
| Accommodation & Food Services | 257 (65.2%) | 137 (34.8%) |
| Public Administration | 218 (66.1%) | 112 (33.9%) |
| Total | 3,887 (49.1%) | 4,024 (50.9%) |
Education in Hershey
School Enrollment in Hershey
The most common levels of schooling among the 3,636 students in Hershey are high school (980 | 27.0%), middle school (693 | 19.1%), and college / undergraduate (649 | 17.8%).
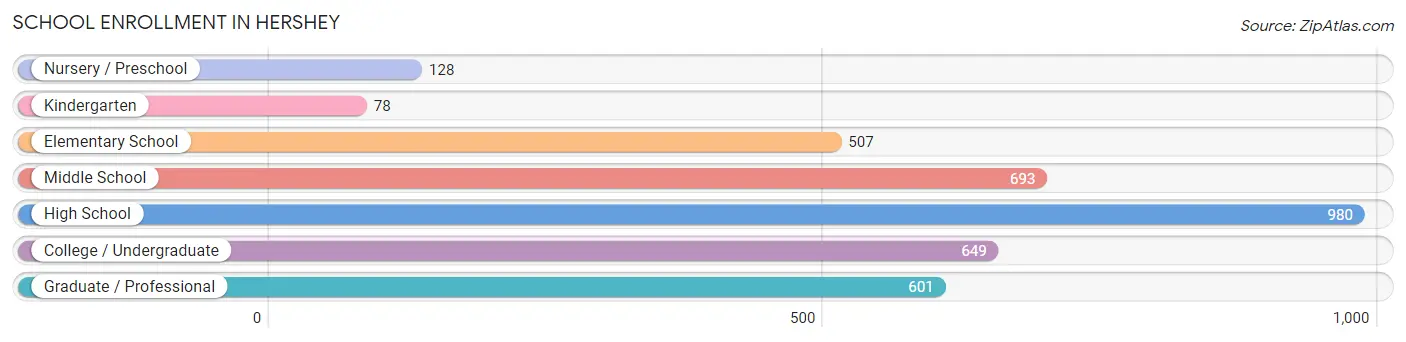
| School Level | # Students | % Students |
| Nursery / Preschool | 128 | 3.5% |
| Kindergarten | 78 | 2.1% |
| Elementary School | 507 | 13.9% |
| Middle School | 693 | 19.1% |
| High School | 980 | 27.0% |
| College / Undergraduate | 649 | 17.8% |
| Graduate / Professional | 601 | 16.5% |
| Total | 3,636 | 100.0% |
School Enrollment by Age by Funding Source in Hershey
Out of a total of 3,636 students who are enrolled in schools in Hershey, 760 (20.9%) attend a private institution, while the remaining 2,876 (79.1%) are enrolled in public schools. The age group of 3 to 4 year olds has the highest likelihood of being enrolled in private schools, with 79 (79.8% in the age bracket) enrolled. Conversely, the age group of 15 to 17 year olds has the lowest likelihood of being enrolled in a private school, with 718 (89.3% in the age bracket) attending a public institution.
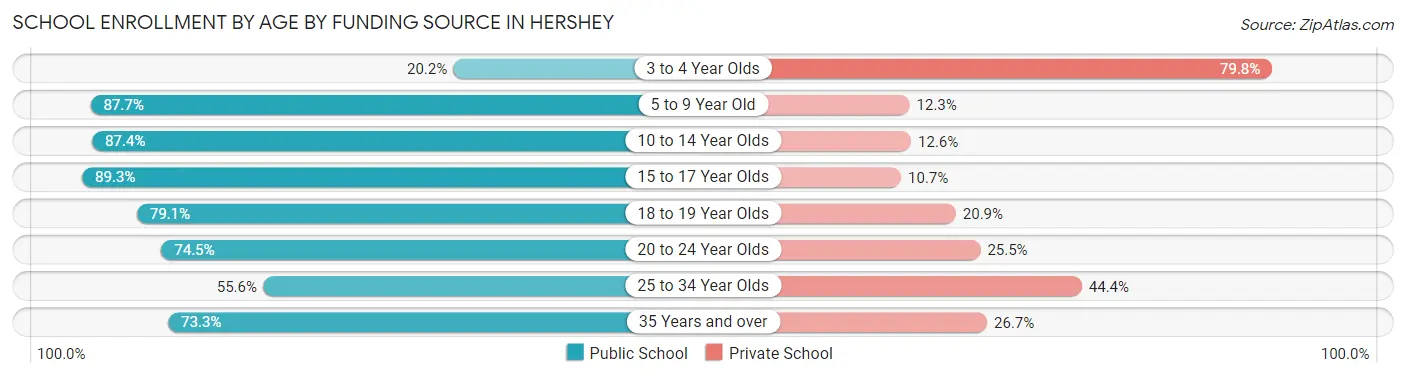
| Age Bracket | Public School | Private School |
| 3 to 4 Year Olds | 20 (20.2%) | 79 (79.8%) |
| 5 to 9 Year Old | 443 (87.7%) | 62 (12.3%) |
| 10 to 14 Year Olds | 752 (87.4%) | 108 (12.6%) |
| 15 to 17 Year Olds | 718 (89.3%) | 86 (10.7%) |
| 18 to 19 Year Olds | 212 (79.1%) | 56 (20.9%) |
| 20 to 24 Year Olds | 389 (74.5%) | 133 (25.5%) |
| 25 to 34 Year Olds | 257 (55.6%) | 205 (44.4%) |
| 35 Years and over | 85 (73.3%) | 31 (26.7%) |
| Total | 2,876 (79.1%) | 760 (20.9%) |
Educational Attainment by Field of Study in Hershey
Education (888 | 15.1%), science & technology (810 | 13.8%), business (798 | 13.6%), bio, nature & agricultural (703 | 12.0%), and physical & health sciences (405 | 6.9%) are the most common fields of study among 5,873 individuals in Hershey who have obtained a bachelor's degree or higher.
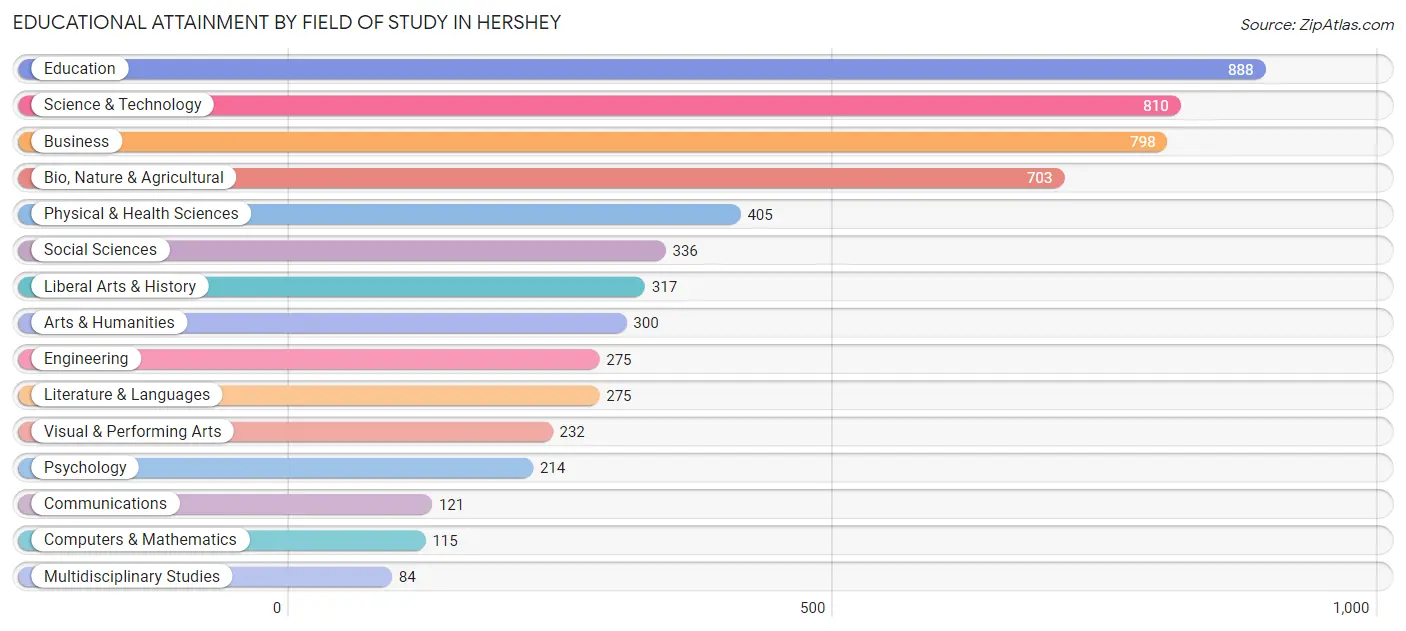
| Field of Study | # Graduates | % Graduates |
| Computers & Mathematics | 115 | 2.0% |
| Bio, Nature & Agricultural | 703 | 12.0% |
| Physical & Health Sciences | 405 | 6.9% |
| Psychology | 214 | 3.6% |
| Social Sciences | 336 | 5.7% |
| Engineering | 275 | 4.7% |
| Multidisciplinary Studies | 84 | 1.4% |
| Science & Technology | 810 | 13.8% |
| Business | 798 | 13.6% |
| Education | 888 | 15.1% |
| Literature & Languages | 275 | 4.7% |
| Liberal Arts & History | 317 | 5.4% |
| Visual & Performing Arts | 232 | 4.0% |
| Communications | 121 | 2.1% |
| Arts & Humanities | 300 | 5.1% |
| Total | 5,873 | 100.0% |
Transportation & Commute in Hershey
Vehicle Availability by Sex in Hershey
The most prevalent vehicle ownership categories in Hershey are males with 2 vehicles (1,570, accounting for 51.4%) and females with 2 vehicles (1,328, making up 48.8%).
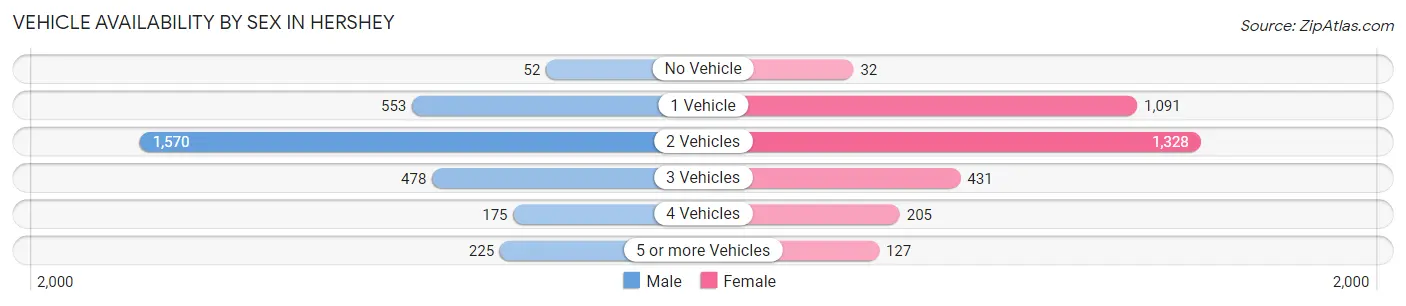
| Vehicles Available | Male | Female |
| No Vehicle | 52 (1.7%) | 32 (1.0%) |
| 1 Vehicle | 553 (18.1%) | 1,091 (34.0%) |
| 2 Vehicles | 1,570 (51.4%) | 1,328 (41.3%) |
| 3 Vehicles | 478 (15.7%) | 431 (13.4%) |
| 4 Vehicles | 175 (5.7%) | 205 (6.4%) |
| 5 or more Vehicles | 225 (7.4%) | 127 (4.0%) |
| Total | 3,053 (100.0%) | 3,214 (100.0%) |
Commute Time in Hershey
The most frequently occuring commute durations in Hershey are 5 to 9 minutes (1,213 commuters, 19.2%), less than 5 minutes (1,147 commuters, 18.2%), and 10 to 14 minutes (944 commuters, 15.0%).
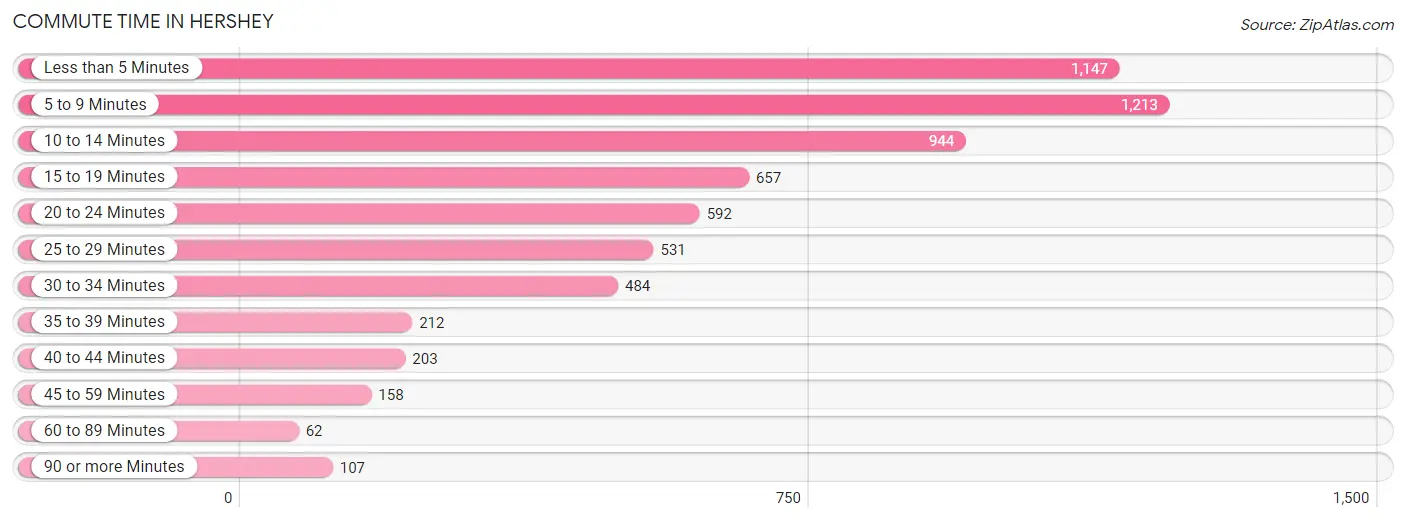
| Commute Time | # Commuters | % Commuters |
| Less than 5 Minutes | 1,147 | 18.2% |
| 5 to 9 Minutes | 1,213 | 19.2% |
| 10 to 14 Minutes | 944 | 15.0% |
| 15 to 19 Minutes | 657 | 10.4% |
| 20 to 24 Minutes | 592 | 9.4% |
| 25 to 29 Minutes | 531 | 8.4% |
| 30 to 34 Minutes | 484 | 7.7% |
| 35 to 39 Minutes | 212 | 3.4% |
| 40 to 44 Minutes | 203 | 3.2% |
| 45 to 59 Minutes | 158 | 2.5% |
| 60 to 89 Minutes | 62 | 1.0% |
| 90 or more Minutes | 107 | 1.7% |
Commute Time by Sex in Hershey
The most common commute times in Hershey are 5 to 9 minutes (528 commuters, 18.1%) for males and less than 5 minutes (900 commuters, 26.5%) for females.
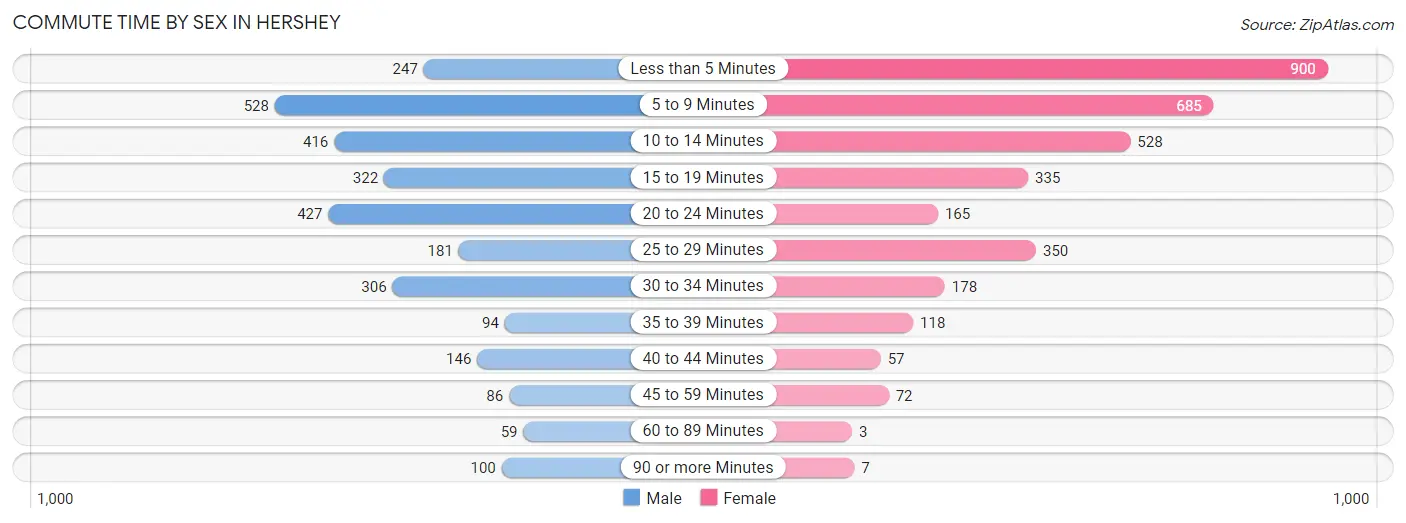
| Commute Time | Male | Female |
| Less than 5 Minutes | 247 (8.5%) | 900 (26.5%) |
| 5 to 9 Minutes | 528 (18.1%) | 685 (20.2%) |
| 10 to 14 Minutes | 416 (14.3%) | 528 (15.5%) |
| 15 to 19 Minutes | 322 (11.1%) | 335 (9.9%) |
| 20 to 24 Minutes | 427 (14.7%) | 165 (4.9%) |
| 25 to 29 Minutes | 181 (6.2%) | 350 (10.3%) |
| 30 to 34 Minutes | 306 (10.5%) | 178 (5.2%) |
| 35 to 39 Minutes | 94 (3.2%) | 118 (3.5%) |
| 40 to 44 Minutes | 146 (5.0%) | 57 (1.7%) |
| 45 to 59 Minutes | 86 (2.9%) | 72 (2.1%) |
| 60 to 89 Minutes | 59 (2.0%) | 3 (0.1%) |
| 90 or more Minutes | 100 (3.4%) | 7 (0.2%) |
Time of Departure to Work by Sex in Hershey
The most frequent times of departure to work in Hershey are 8:00 AM to 8:29 AM (468, 16.1%) for males and 8:00 AM to 8:29 AM (1,052, 31.0%) for females.
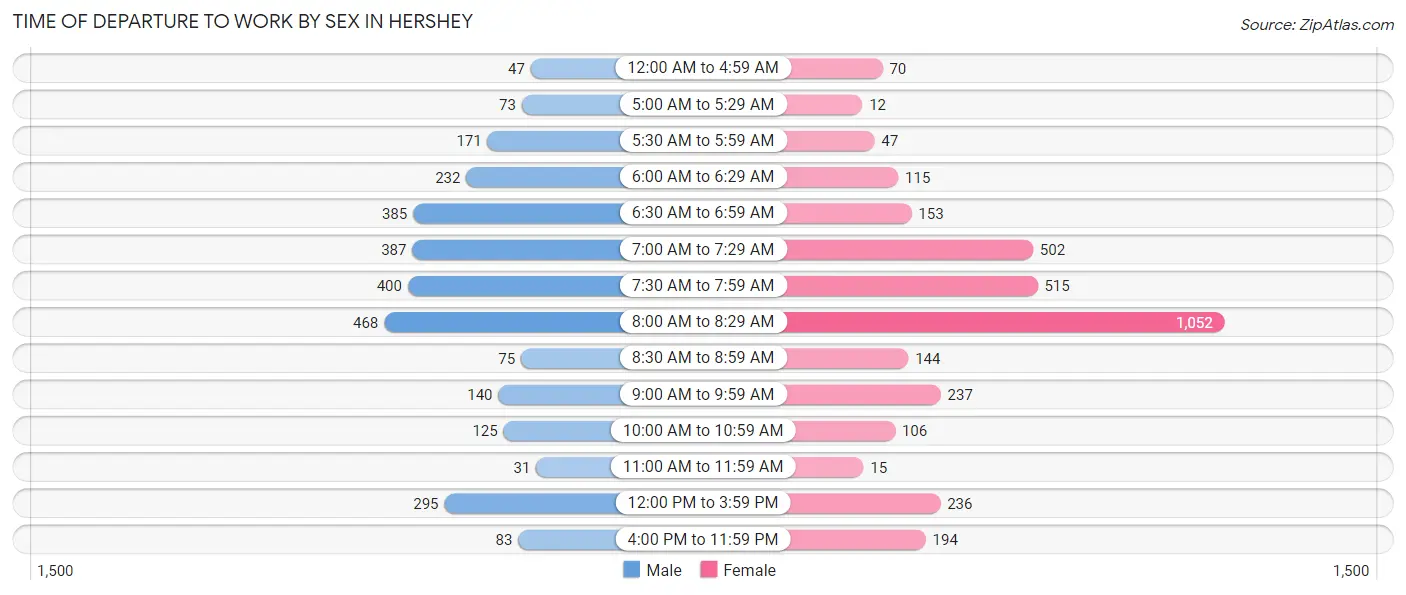
| Time of Departure | Male | Female |
| 12:00 AM to 4:59 AM | 47 (1.6%) | 70 (2.1%) |
| 5:00 AM to 5:29 AM | 73 (2.5%) | 12 (0.4%) |
| 5:30 AM to 5:59 AM | 171 (5.9%) | 47 (1.4%) |
| 6:00 AM to 6:29 AM | 232 (8.0%) | 115 (3.4%) |
| 6:30 AM to 6:59 AM | 385 (13.2%) | 153 (4.5%) |
| 7:00 AM to 7:29 AM | 387 (13.3%) | 502 (14.8%) |
| 7:30 AM to 7:59 AM | 400 (13.7%) | 515 (15.2%) |
| 8:00 AM to 8:29 AM | 468 (16.1%) | 1,052 (31.0%) |
| 8:30 AM to 8:59 AM | 75 (2.6%) | 144 (4.2%) |
| 9:00 AM to 9:59 AM | 140 (4.8%) | 237 (7.0%) |
| 10:00 AM to 10:59 AM | 125 (4.3%) | 106 (3.1%) |
| 11:00 AM to 11:59 AM | 31 (1.1%) | 15 (0.4%) |
| 12:00 PM to 3:59 PM | 295 (10.1%) | 236 (7.0%) |
| 4:00 PM to 11:59 PM | 83 (2.9%) | 194 (5.7%) |
| Total | 2,912 (100.0%) | 3,398 (100.0%) |
Housing Occupancy in Hershey
Occupancy by Ownership in Hershey
Of the total 5,633 dwellings in Hershey, owner-occupied units account for 3,168 (56.2%), while renter-occupied units make up 2,465 (43.8%).
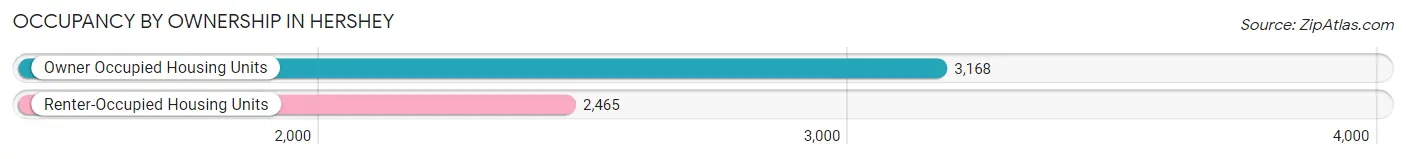
| Occupancy | # Housing Units | % Housing Units |
| Owner Occupied Housing Units | 3,168 | 56.2% |
| Renter-Occupied Housing Units | 2,465 | 43.8% |
| Total Occupied Housing Units | 5,633 | 100.0% |
Occupancy by Household Size in Hershey
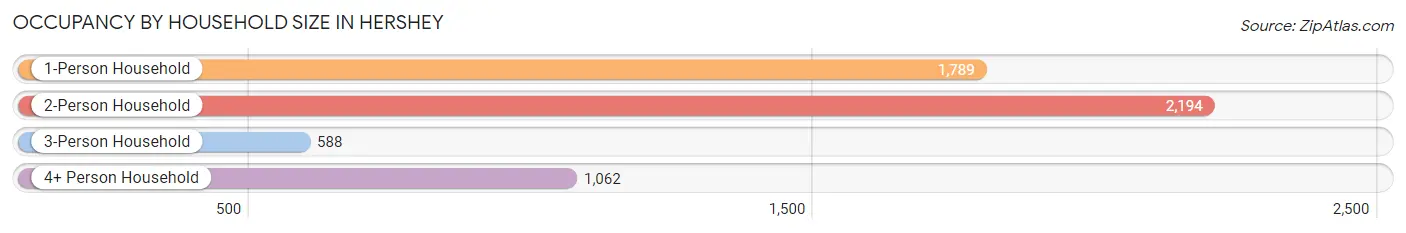
| Household Size | # Housing Units | % Housing Units |
| 1-Person Household | 1,789 | 31.8% |
| 2-Person Household | 2,194 | 39.0% |
| 3-Person Household | 588 | 10.4% |
| 4+ Person Household | 1,062 | 18.9% |
| Total Housing Units | 5,633 | 100.0% |
Occupancy by Ownership by Household Size in Hershey
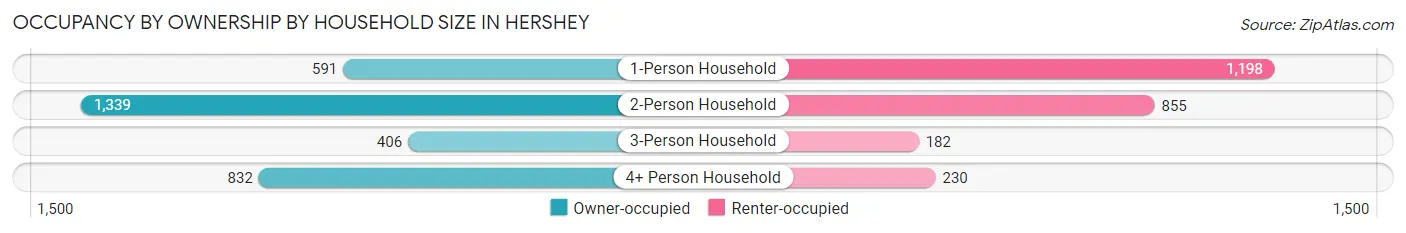
| Household Size | Owner-occupied | Renter-occupied |
| 1-Person Household | 591 (33.0%) | 1,198 (67.0%) |
| 2-Person Household | 1,339 (61.0%) | 855 (39.0%) |
| 3-Person Household | 406 (69.1%) | 182 (30.9%) |
| 4+ Person Household | 832 (78.3%) | 230 (21.7%) |
| Total Housing Units | 3,168 (56.2%) | 2,465 (43.8%) |
Occupancy by Educational Attainment in Hershey
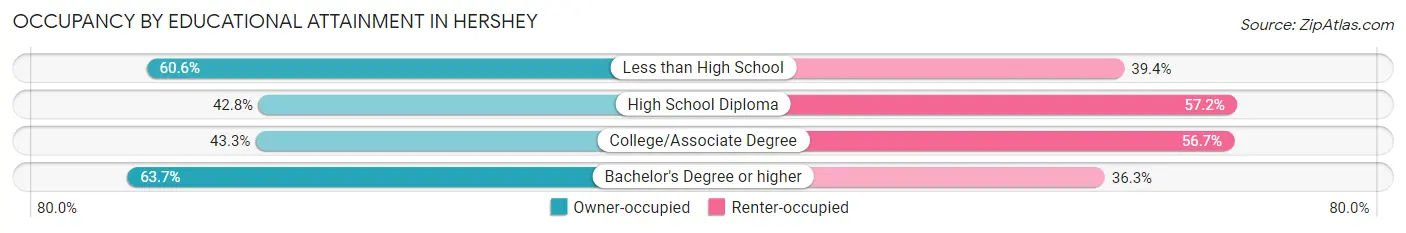
| Household Size | Owner-occupied | Renter-occupied |
| Less than High School | 114 (60.6%) | 74 (39.4%) |
| High School Diploma | 385 (42.8%) | 514 (57.2%) |
| College/Associate Degree | 482 (43.3%) | 632 (56.7%) |
| Bachelor's Degree or higher | 2,187 (63.7%) | 1,245 (36.3%) |
Occupancy by Age of Householder in Hershey
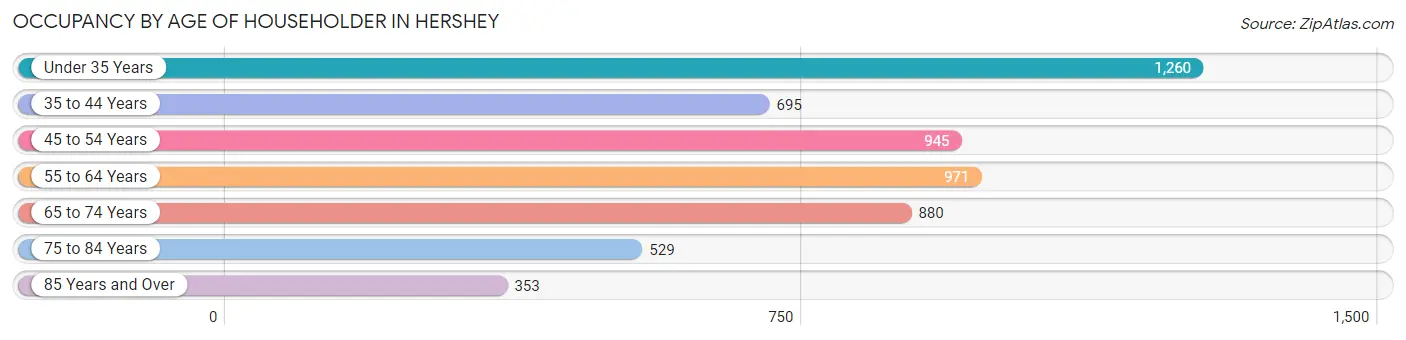
| Age Bracket | # Households | % Households |
| Under 35 Years | 1,260 | 22.4% |
| 35 to 44 Years | 695 | 12.3% |
| 45 to 54 Years | 945 | 16.8% |
| 55 to 64 Years | 971 | 17.2% |
| 65 to 74 Years | 880 | 15.6% |
| 75 to 84 Years | 529 | 9.4% |
| 85 Years and Over | 353 | 6.3% |
| Total | 5,633 | 100.0% |
Housing Finances in Hershey
Median Income by Occupancy in Hershey
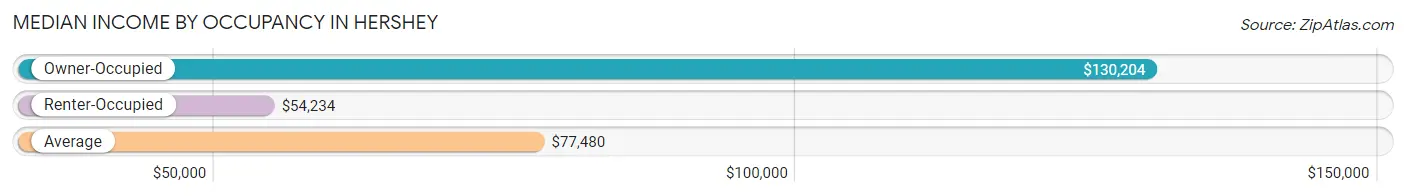
| Occupancy Type | # Households | Median Income |
| Owner-Occupied | 3,168 (56.2%) | $130,204 |
| Renter-Occupied | 2,465 (43.8%) | $54,234 |
| Average | 5,633 (100.0%) | $77,480 |
Occupancy by Householder Income Bracket in Hershey
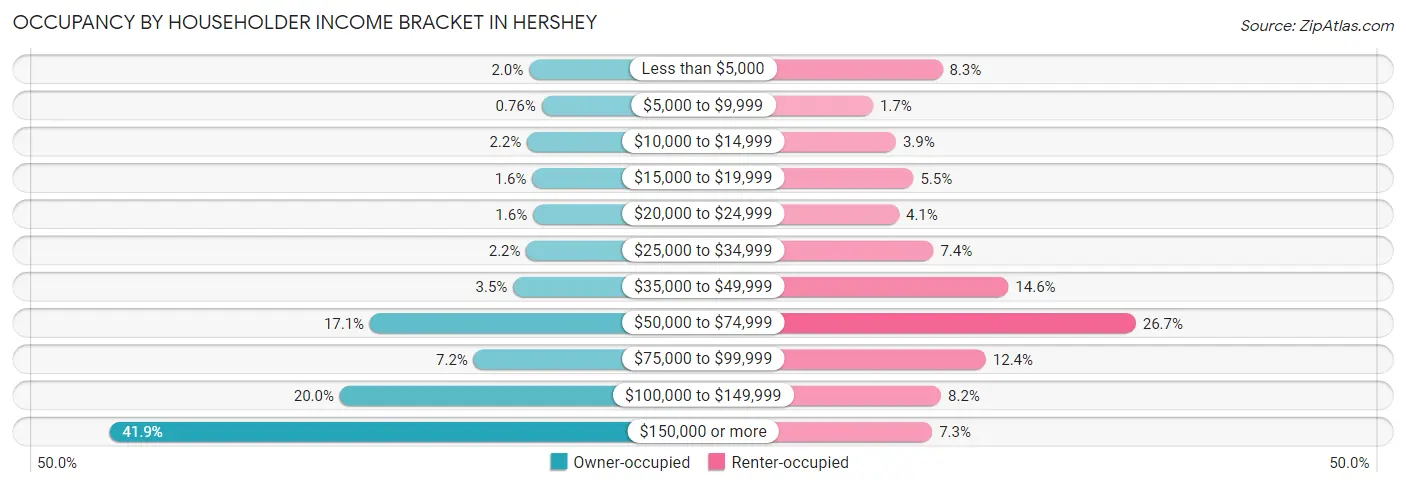
| Income Bracket | Owner-occupied | Renter-occupied |
| Less than $5,000 | 62 (2.0%) | 204 (8.3%) |
| $5,000 to $9,999 | 24 (0.8%) | 41 (1.7%) |
| $10,000 to $14,999 | 68 (2.1%) | 95 (3.8%) |
| $15,000 to $19,999 | 52 (1.6%) | 136 (5.5%) |
| $20,000 to $24,999 | 50 (1.6%) | 102 (4.1%) |
| $25,000 to $34,999 | 70 (2.2%) | 183 (7.4%) |
| $35,000 to $49,999 | 110 (3.5%) | 359 (14.6%) |
| $50,000 to $74,999 | 542 (17.1%) | 658 (26.7%) |
| $75,000 to $99,999 | 229 (7.2%) | 306 (12.4%) |
| $100,000 to $149,999 | 633 (20.0%) | 201 (8.2%) |
| $150,000 or more | 1,328 (41.9%) | 180 (7.3%) |
| Total | 3,168 (100.0%) | 2,465 (100.0%) |
Monthly Housing Cost Tiers in Hershey
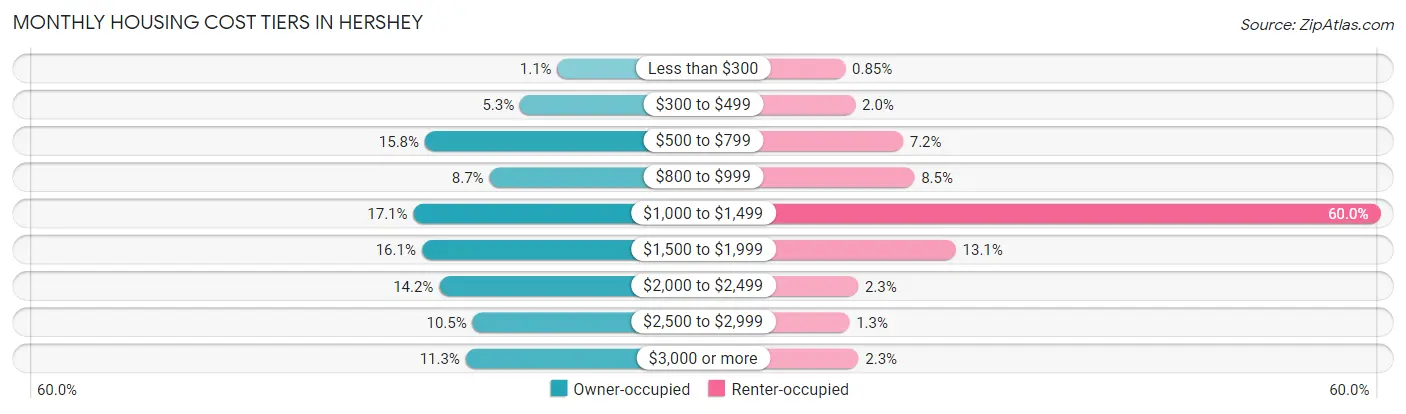
| Monthly Cost | Owner-occupied | Renter-occupied |
| Less than $300 | 36 (1.1%) | 21 (0.9%) |
| $300 to $499 | 167 (5.3%) | 48 (1.9%) |
| $500 to $799 | 500 (15.8%) | 178 (7.2%) |
| $800 to $999 | 274 (8.6%) | 209 (8.5%) |
| $1,000 to $1,499 | 540 (17.1%) | 1,478 (60.0%) |
| $1,500 to $1,999 | 511 (16.1%) | 322 (13.1%) |
| $2,000 to $2,499 | 450 (14.2%) | 56 (2.3%) |
| $2,500 to $2,999 | 333 (10.5%) | 32 (1.3%) |
| $3,000 or more | 357 (11.3%) | 57 (2.3%) |
| Total | 3,168 (100.0%) | 2,465 (100.0%) |
Physical Housing Characteristics in Hershey
Housing Structures in Hershey
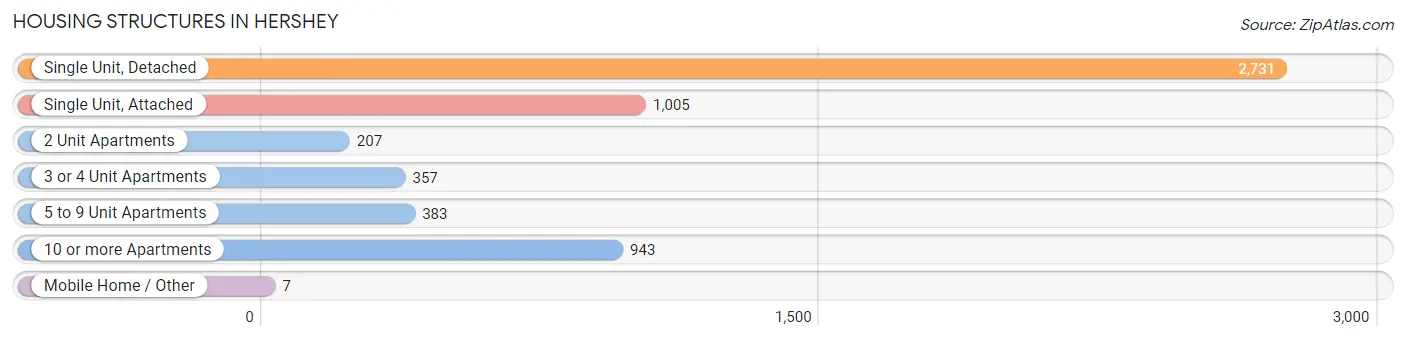
| Structure Type | # Housing Units | % Housing Units |
| Single Unit, Detached | 2,731 | 48.5% |
| Single Unit, Attached | 1,005 | 17.8% |
| 2 Unit Apartments | 207 | 3.7% |
| 3 or 4 Unit Apartments | 357 | 6.3% |
| 5 to 9 Unit Apartments | 383 | 6.8% |
| 10 or more Apartments | 943 | 16.7% |
| Mobile Home / Other | 7 | 0.1% |
| Total | 5,633 | 100.0% |
Housing Structures by Occupancy in Hershey
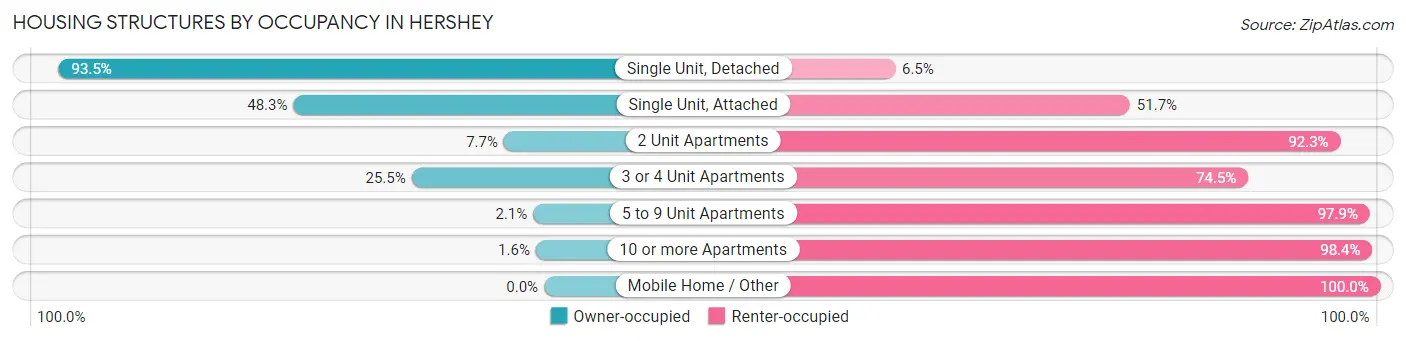
| Structure Type | Owner-occupied | Renter-occupied |
| Single Unit, Detached | 2,553 (93.5%) | 178 (6.5%) |
| Single Unit, Attached | 485 (48.3%) | 520 (51.7%) |
| 2 Unit Apartments | 16 (7.7%) | 191 (92.3%) |
| 3 or 4 Unit Apartments | 91 (25.5%) | 266 (74.5%) |
| 5 to 9 Unit Apartments | 8 (2.1%) | 375 (97.9%) |
| 10 or more Apartments | 15 (1.6%) | 928 (98.4%) |
| Mobile Home / Other | 0 (0.0%) | 7 (100.0%) |
| Total | 3,168 (56.2%) | 2,465 (43.8%) |
Housing Structures by Number of Rooms in Hershey
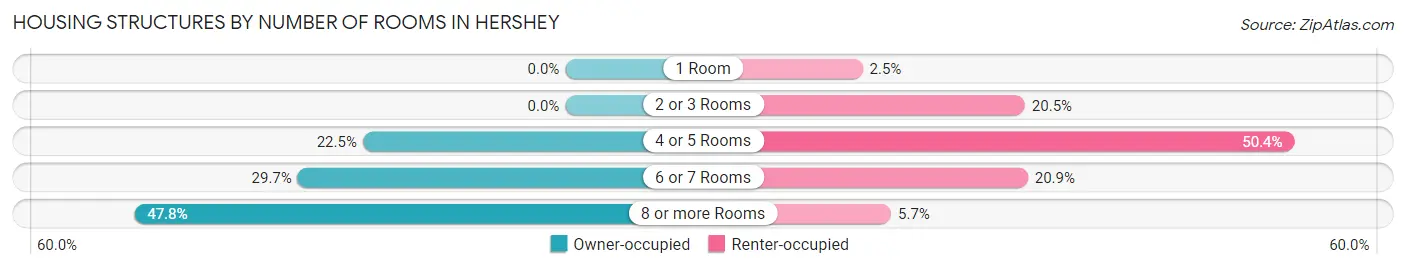
| Number of Rooms | Owner-occupied | Renter-occupied |
| 1 Room | 0 (0.0%) | 62 (2.5%) |
| 2 or 3 Rooms | 0 (0.0%) | 506 (20.5%) |
| 4 or 5 Rooms | 712 (22.5%) | 1,243 (50.4%) |
| 6 or 7 Rooms | 941 (29.7%) | 514 (20.8%) |
| 8 or more Rooms | 1,515 (47.8%) | 140 (5.7%) |
| Total | 3,168 (100.0%) | 2,465 (100.0%) |
Housing Structure by Heating Type in Hershey
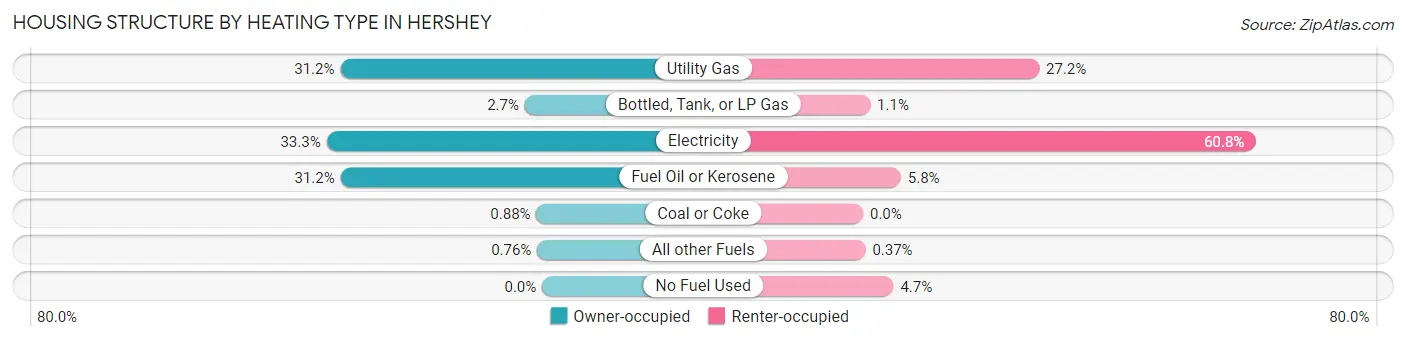
| Heating Type | Owner-occupied | Renter-occupied |
| Utility Gas | 988 (31.2%) | 671 (27.2%) |
| Bottled, Tank, or LP Gas | 85 (2.7%) | 27 (1.1%) |
| Electricity | 1,056 (33.3%) | 1,498 (60.8%) |
| Fuel Oil or Kerosene | 987 (31.2%) | 144 (5.8%) |
| Coal or Coke | 28 (0.9%) | 0 (0.0%) |
| All other Fuels | 24 (0.8%) | 9 (0.4%) |
| No Fuel Used | 0 (0.0%) | 116 (4.7%) |
| Total | 3,168 (100.0%) | 2,465 (100.0%) |
Household Vehicle Usage in Hershey
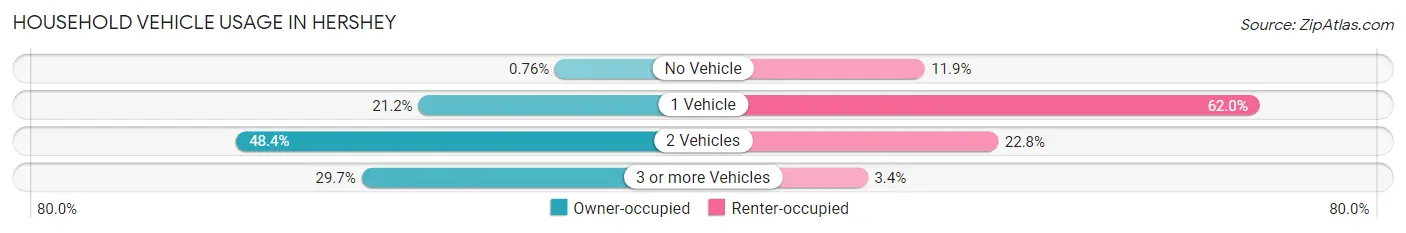
| Vehicles per Household | Owner-occupied | Renter-occupied |
| No Vehicle | 24 (0.8%) | 292 (11.8%) |
| 1 Vehicle | 671 (21.2%) | 1,527 (62.0%) |
| 2 Vehicles | 1,533 (48.4%) | 563 (22.8%) |
| 3 or more Vehicles | 940 (29.7%) | 83 (3.4%) |
| Total | 3,168 (100.0%) | 2,465 (100.0%) |
Real Estate & Mortgages in Hershey
Real Estate and Mortgage Overview in Hershey
| Characteristic | Without Mortgage | With Mortgage |
| Housing Units | 1,119 | 2,049 |
| Median Property Value | $352,300 | $297,700 |
| Median Household Income | $122,321 | $898 |
| Monthly Housing Costs | $748 | $357 |
| Real Estate Taxes | $4,014 | $15 |
Property Value by Mortgage Status in Hershey
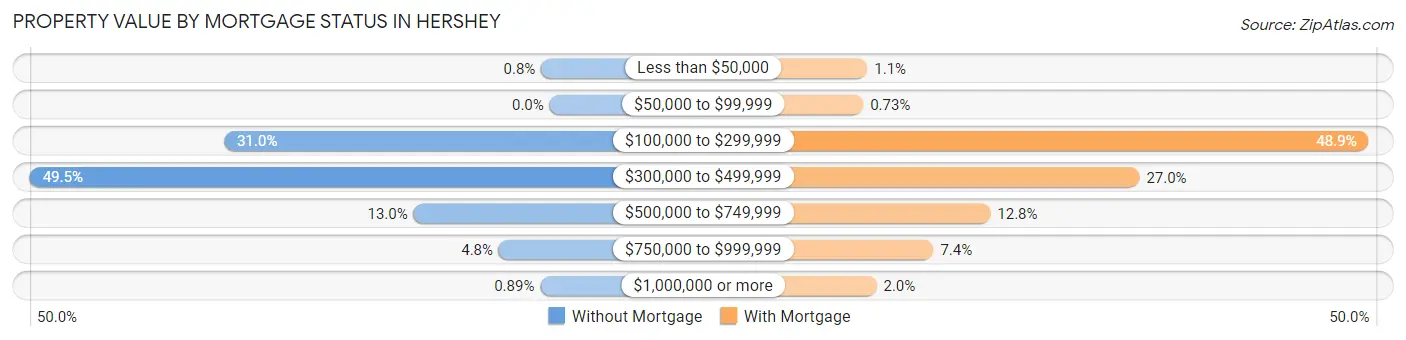
| Property Value | Without Mortgage | With Mortgage |
| Less than $50,000 | 9 (0.8%) | 23 (1.1%) |
| $50,000 to $99,999 | 0 (0.0%) | 15 (0.7%) |
| $100,000 to $299,999 | 347 (31.0%) | 1,001 (48.8%) |
| $300,000 to $499,999 | 554 (49.5%) | 554 (27.0%) |
| $500,000 to $749,999 | 145 (13.0%) | 263 (12.8%) |
| $750,000 to $999,999 | 54 (4.8%) | 152 (7.4%) |
| $1,000,000 or more | 10 (0.9%) | 41 (2.0%) |
| Total | 1,119 (100.0%) | 2,049 (100.0%) |
Household Income by Mortgage Status in Hershey
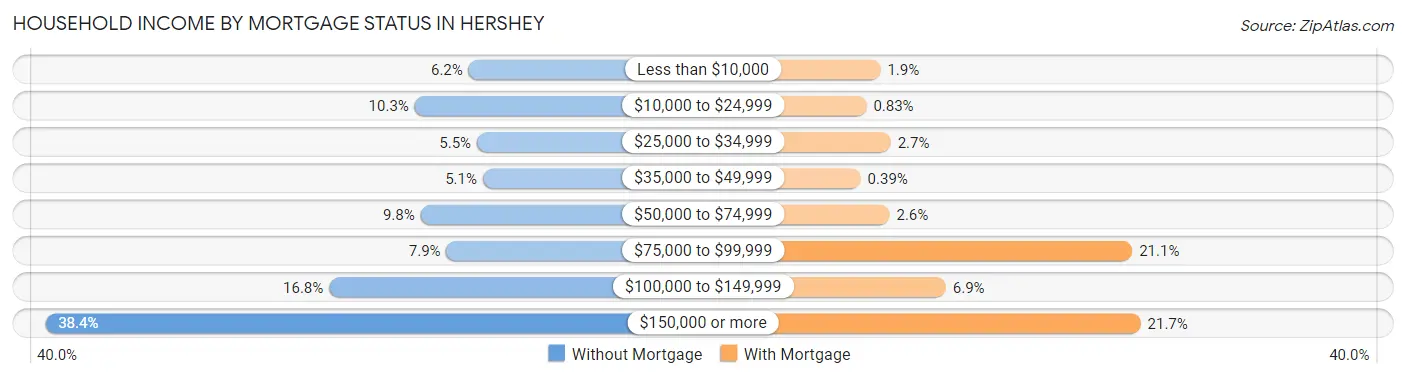
| Household Income | Without Mortgage | With Mortgage |
| Less than $10,000 | 69 (6.2%) | 39 (1.9%) |
| $10,000 to $24,999 | 115 (10.3%) | 17 (0.8%) |
| $25,000 to $34,999 | 62 (5.5%) | 55 (2.7%) |
| $35,000 to $49,999 | 57 (5.1%) | 8 (0.4%) |
| $50,000 to $74,999 | 110 (9.8%) | 53 (2.6%) |
| $75,000 to $99,999 | 88 (7.9%) | 432 (21.1%) |
| $100,000 to $149,999 | 188 (16.8%) | 141 (6.9%) |
| $150,000 or more | 430 (38.4%) | 445 (21.7%) |
| Total | 1,119 (100.0%) | 2,049 (100.0%) |
Property Value to Household Income Ratio in Hershey
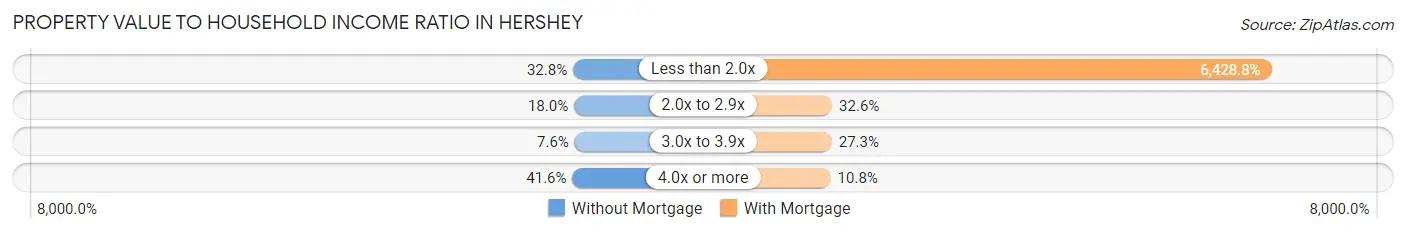
| Value-to-Income Ratio | Without Mortgage | With Mortgage |
| Less than 2.0x | 367 (32.8%) | 131,726 (6,428.8%) |
| 2.0x to 2.9x | 201 (18.0%) | 667 (32.6%) |
| 3.0x to 3.9x | 85 (7.6%) | 560 (27.3%) |
| 4.0x or more | 466 (41.6%) | 222 (10.8%) |
| Total | 1,119 (100.0%) | 2,049 (100.0%) |
Real Estate Taxes by Mortgage Status in Hershey
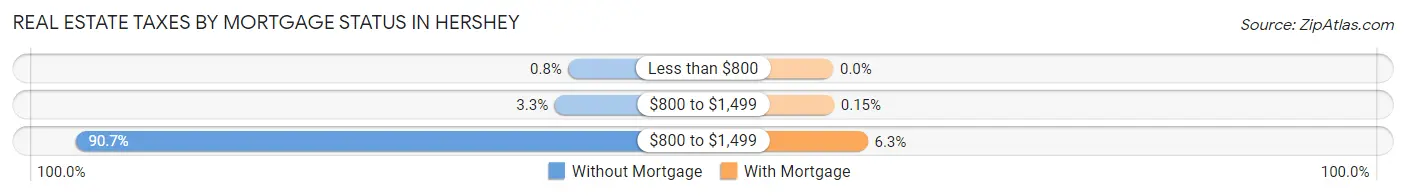
| Property Taxes | Without Mortgage | With Mortgage |
| Less than $800 | 9 (0.8%) | 0 (0.0%) |
| $800 to $1,499 | 37 (3.3%) | 3 (0.2%) |
| $800 to $1,499 | 1,015 (90.7%) | 129 (6.3%) |
| Total | 1,119 (100.0%) | 2,049 (100.0%) |
Health & Disability in Hershey
Health Insurance Coverage by Age in Hershey
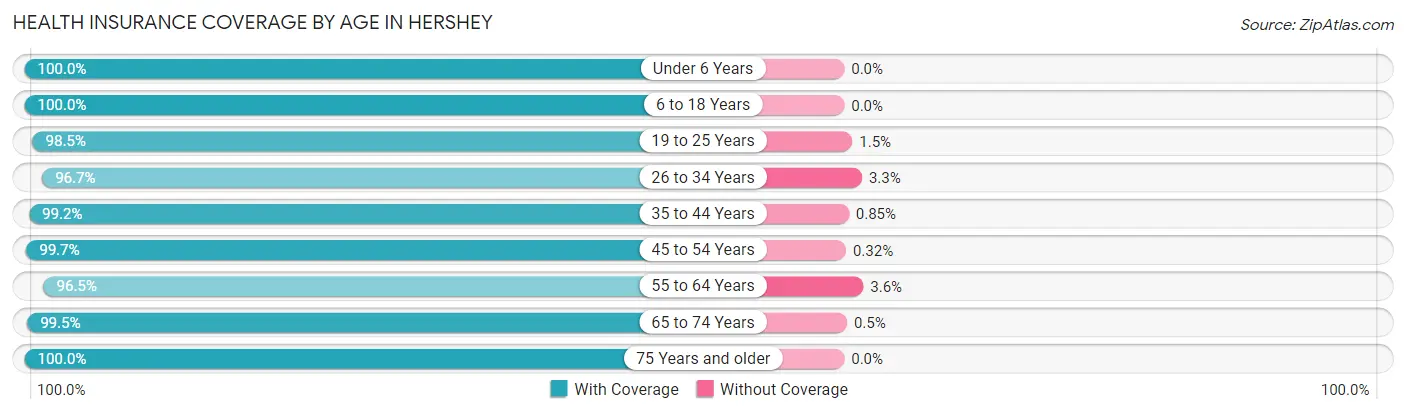
| Age Bracket | With Coverage | Without Coverage |
| Under 6 Years | 603 (100.0%) | 0 (0.0%) |
| 6 to 18 Years | 2,339 (100.0%) | 0 (0.0%) |
| 19 to 25 Years | 1,311 (98.5%) | 20 (1.5%) |
| 26 to 34 Years | 1,527 (96.7%) | 52 (3.3%) |
| 35 to 44 Years | 1,287 (99.2%) | 11 (0.9%) |
| 45 to 54 Years | 2,487 (99.7%) | 8 (0.3%) |
| 55 to 64 Years | 2,200 (96.5%) | 81 (3.5%) |
| 65 to 74 Years | 1,383 (99.5%) | 7 (0.5%) |
| 75 Years and older | 1,316 (100.0%) | 0 (0.0%) |
| Total | 14,453 (98.8%) | 179 (1.2%) |
Health Insurance Coverage by Citizenship Status in Hershey
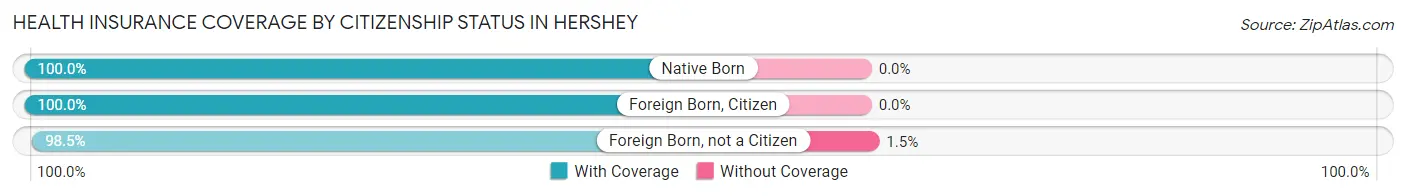
| Citizenship Status | With Coverage | Without Coverage |
| Native Born | 603 (100.0%) | 0 (0.0%) |
| Foreign Born, Citizen | 2,339 (100.0%) | 0 (0.0%) |
| Foreign Born, not a Citizen | 1,311 (98.5%) | 20 (1.5%) |
Health Insurance Coverage by Household Income in Hershey
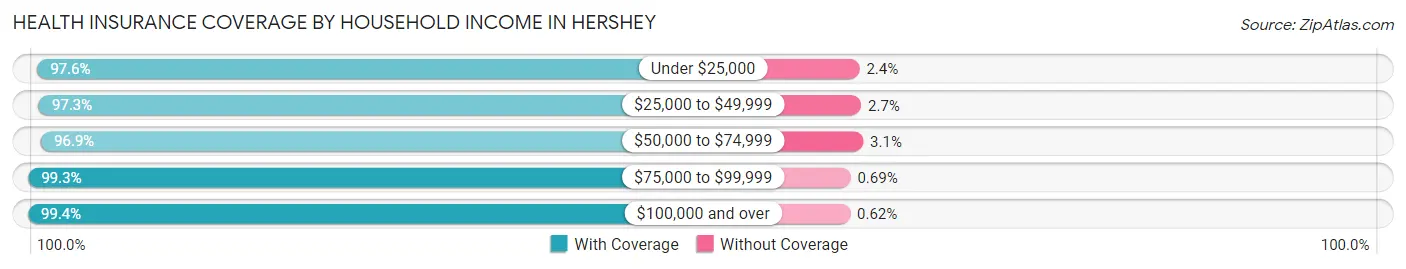
| Household Income | With Coverage | Without Coverage |
| Under $25,000 | 1,276 (97.6%) | 31 (2.4%) |
| $25,000 to $49,999 | 1,088 (97.3%) | 30 (2.7%) |
| $50,000 to $74,999 | 2,085 (96.9%) | 66 (3.1%) |
| $75,000 to $99,999 | 1,145 (99.3%) | 8 (0.7%) |
| $100,000 and over | 7,071 (99.4%) | 44 (0.6%) |
Public vs Private Health Insurance Coverage by Age in Hershey

| Age Bracket | Public Insurance | Private Insurance |
| Under 6 | 88 (14.6%) | 545 (90.4%) |
| 6 to 18 Years | 415 (17.7%) | 2,124 (90.8%) |
| 19 to 25 Years | 127 (9.5%) | 1,212 (91.1%) |
| 25 to 34 Years | 140 (8.9%) | 1,456 (92.2%) |
| 35 to 44 Years | 197 (15.2%) | 1,140 (87.8%) |
| 45 to 54 Years | 127 (5.1%) | 2,377 (95.3%) |
| 55 to 64 Years | 227 (10.0%) | 2,012 (88.2%) |
| 65 to 74 Years | 1,357 (97.6%) | 778 (56.0%) |
| 75 Years and over | 1,309 (99.5%) | 1,104 (83.9%) |
| Total | 3,987 (27.3%) | 12,748 (87.1%) |
Disability Status by Sex by Age in Hershey
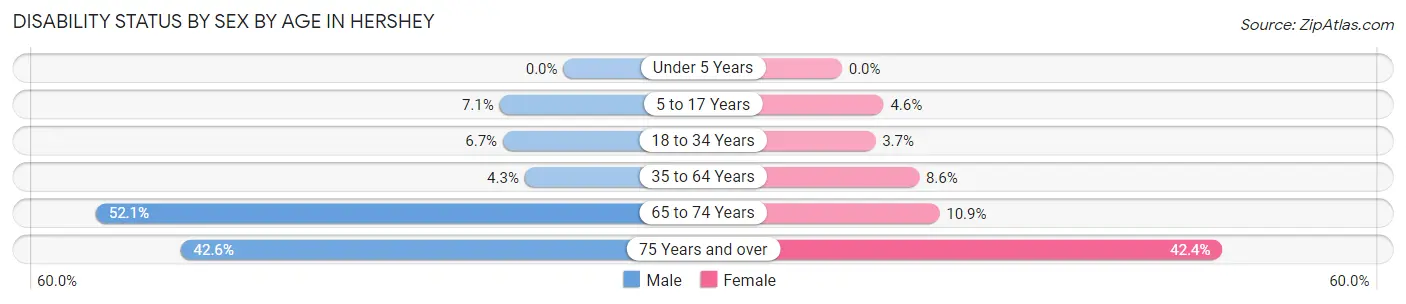
| Age Bracket | Male | Female |
| Under 5 Years | 0 (0.0%) | 0 (0.0%) |
| 5 to 17 Years | 85 (7.1%) | 47 (4.6%) |
| 18 to 34 Years | 103 (6.7%) | 58 (3.7%) |
| 35 to 64 Years | 122 (4.3%) | 278 (8.6%) |
| 65 to 74 Years | 302 (52.1%) | 88 (10.9%) |
| 75 Years and over | 231 (42.6%) | 328 (42.4%) |
Disability Class by Sex by Age in Hershey
Disability Class: Hearing Difficulty
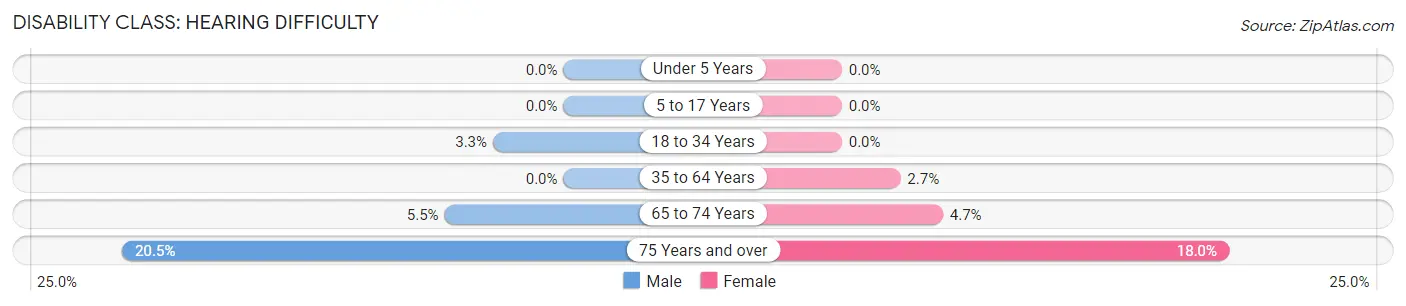
| Age Bracket | Male | Female |
| Under 5 Years | 0 (0.0%) | 0 (0.0%) |
| 5 to 17 Years | 0 (0.0%) | 0 (0.0%) |
| 18 to 34 Years | 50 (3.3%) | 0 (0.0%) |
| 35 to 64 Years | 0 (0.0%) | 88 (2.7%) |
| 65 to 74 Years | 32 (5.5%) | 38 (4.7%) |
| 75 Years and over | 111 (20.5%) | 139 (18.0%) |
Disability Class: Vision Difficulty
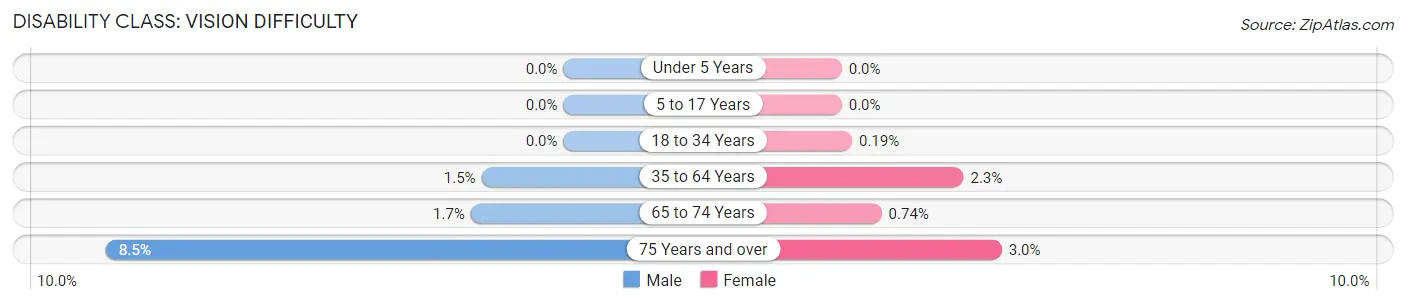
| Age Bracket | Male | Female |
| Under 5 Years | 0 (0.0%) | 0 (0.0%) |
| 5 to 17 Years | 0 (0.0%) | 0 (0.0%) |
| 18 to 34 Years | 0 (0.0%) | 3 (0.2%) |
| 35 to 64 Years | 43 (1.5%) | 73 (2.3%) |
| 65 to 74 Years | 10 (1.7%) | 6 (0.7%) |
| 75 Years and over | 46 (8.5%) | 23 (3.0%) |
Disability Class: Cognitive Difficulty
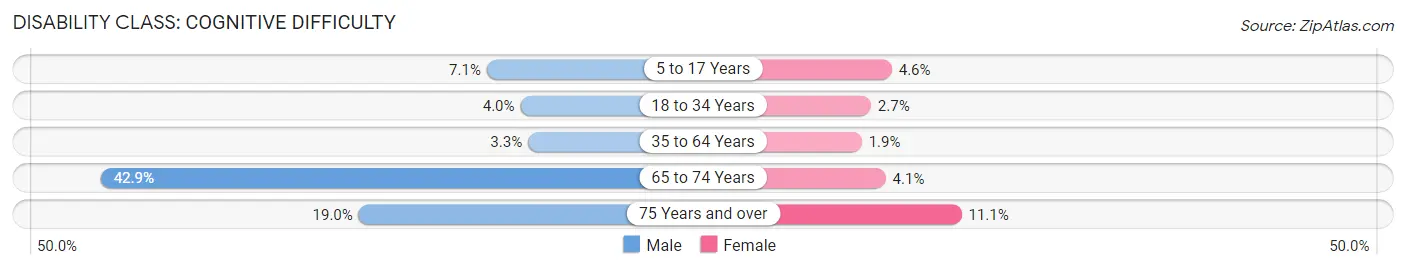
| Age Bracket | Male | Female |
| 5 to 17 Years | 85 (7.1%) | 47 (4.6%) |
| 18 to 34 Years | 61 (4.0%) | 42 (2.7%) |
| 35 to 64 Years | 93 (3.3%) | 60 (1.8%) |
| 65 to 74 Years | 249 (42.9%) | 33 (4.1%) |
| 75 Years and over | 103 (19.0%) | 86 (11.1%) |
Disability Class: Ambulatory Difficulty
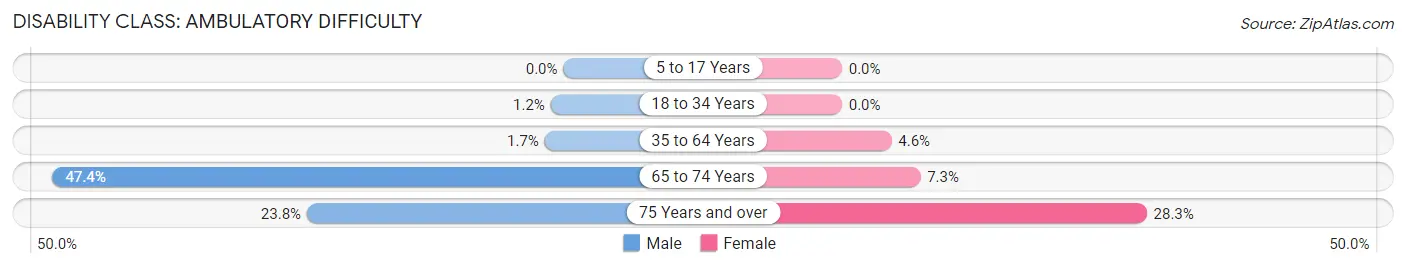
| Age Bracket | Male | Female |
| 5 to 17 Years | 0 (0.0%) | 0 (0.0%) |
| 18 to 34 Years | 18 (1.2%) | 0 (0.0%) |
| 35 to 64 Years | 49 (1.7%) | 149 (4.6%) |
| 65 to 74 Years | 275 (47.4%) | 59 (7.3%) |
| 75 Years and over | 129 (23.8%) | 219 (28.3%) |
Disability Class: Self-Care Difficulty
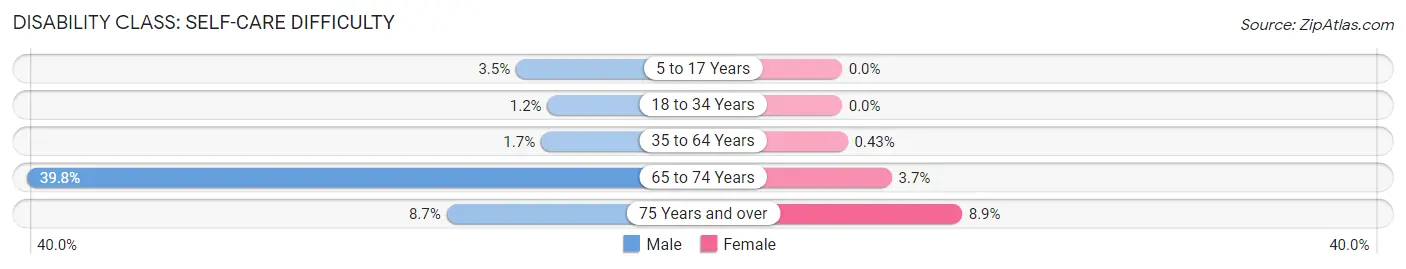
| Age Bracket | Male | Female |
| 5 to 17 Years | 42 (3.5%) | 0 (0.0%) |
| 18 to 34 Years | 18 (1.2%) | 0 (0.0%) |
| 35 to 64 Years | 47 (1.7%) | 14 (0.4%) |
| 65 to 74 Years | 231 (39.8%) | 30 (3.7%) |
| 75 Years and over | 47 (8.7%) | 69 (8.9%) |
Technology Access in Hershey
Computing Device Access in Hershey
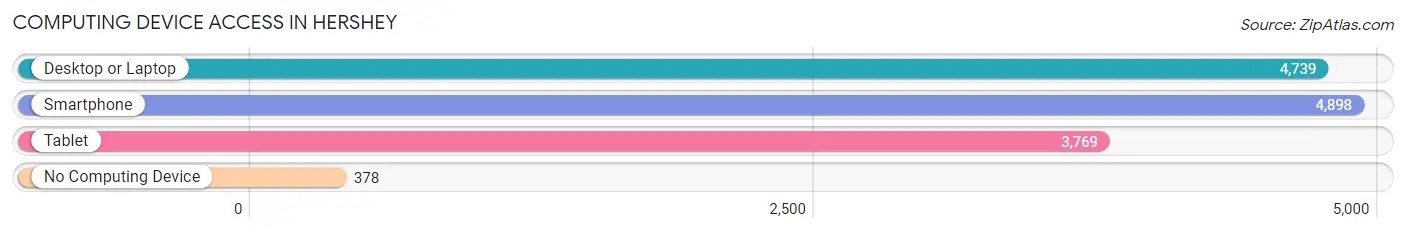
| Device Type | # Households | % Households |
| Desktop or Laptop | 4,739 | 84.1% |
| Smartphone | 4,898 | 87.0% |
| Tablet | 3,769 | 66.9% |
| No Computing Device | 378 | 6.7% |
| Total | 5,633 | 100.0% |
Internet Access in Hershey
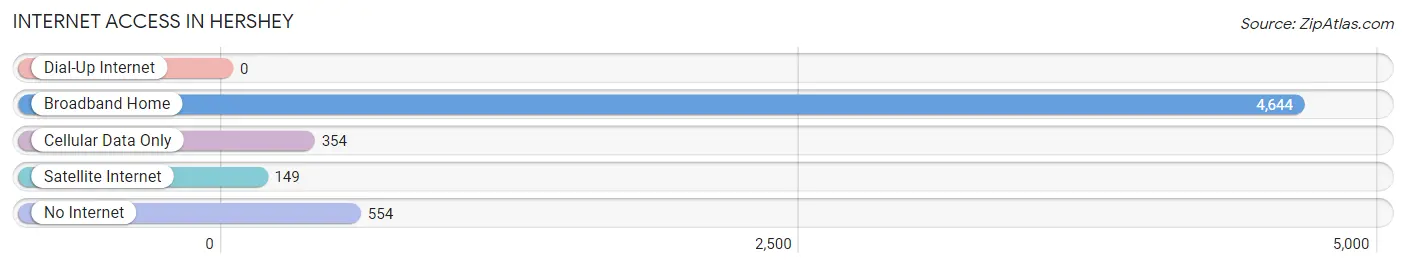
| Internet Type | # Households | % Households |
| Dial-Up Internet | 0 | 0.0% |
| Broadband Home | 4,644 | 82.4% |
| Cellular Data Only | 354 | 6.3% |
| Satellite Internet | 149 | 2.6% |
| No Internet | 554 | 9.8% |
| Total | 5,633 | 100.0% |
Hershey Summary
Hershey, Pennsylvania is a small town located in Dauphin County, Pennsylvania, United States. It is located about 15 miles east of Harrisburg, the state capital. The town was founded in 1894 by Milton S. Hershey, the founder of the Hershey Chocolate Company. The town is known for its chocolate-related attractions, such as Hersheypark, Hershey's Chocolate World, and the Hershey Story Museum.
Geography
Hershey is located in the Susquehanna Valley, a region of rolling hills and valleys in central Pennsylvania. The town is situated in the northern part of Dauphin County, about 15 miles east of Harrisburg. The town is bordered by Derry Township to the north, South Hanover Township to the east, and Derry Township to the south. The town is located in the humid continental climate zone, with hot, humid summers and cold, snowy winters.
Economy
Hershey is best known for its chocolate-related attractions, such as Hersheypark, Hershey's Chocolate World, and the Hershey Story Museum. The town is also home to the Hershey Company, the world's largest chocolate manufacturer. The company is the largest employer in the town, with over 12,000 employees. Other major employers in the town include Penn State Milton S. Hershey Medical Center, Hershey Entertainment and Resorts, and Hershey Foods Corporation.
Demographics
As of the 2010 census, the population of Hershey was 14,257. The racial makeup of the town was 92.3% White, 4.2% African American, 0.3% Native American, 1.2% Asian, 0.1% Pacific Islander, 0.7% from other races, and 1.2% from two or more races. Hispanic or Latino of any race were 2.2% of the population.
The median household income in Hershey was $63,945, and the median family income was $76,945. The per capita income for the town was $31,945. About 4.2% of families and 5.7% of the population were below the poverty line, including 6.3% of those under age 18 and 4.2% of those age 65 or over.
Conclusion
Hershey, Pennsylvania is a small town located in Dauphin County, Pennsylvania, United States. It is best known for its chocolate-related attractions, such as Hersheypark, Hershey's Chocolate World, and the Hershey Story Museum. The town is also home to the Hershey Company, the world's largest chocolate manufacturer. As of the 2010 census, the population of Hershey was 14,257, with a median household income of $63,945. The town is located in the humid continental climate zone, with hot, humid summers and cold, snowy winters.
Common Questions
What is Per Capita Income in Hershey?
Per Capita income in Hershey is $53,028.
What is the Median Family Income in Hershey?
Median Family Income in Hershey is $118,750.
What is the Median Household income in Hershey?
Median Household Income in Hershey is $77,480.
What is Income or Wage Gap in Hershey?
Income or Wage Gap in Hershey is 6.9%.
Women in Hershey earn 93.1 cents for every dollar earned by a man.
What is Inequality or Gini Index in Hershey?
Inequality or Gini Index in Hershey is 0.51.
What is the Total Population of Hershey?
Total Population of Hershey is 14,682.
What is the Total Male Population of Hershey?
Total Male Population of Hershey is 6,999.
What is the Total Female Population of Hershey?
Total Female Population of Hershey is 7,683.
What is the Ratio of Males per 100 Females in Hershey?
There are 91.10 Males per 100 Females in Hershey.
What is the Ratio of Females per 100 Males in Hershey?
There are 109.77 Females per 100 Males in Hershey.
What is the Median Population Age in Hershey?
Median Population Age in Hershey is 46.0 Years.
What is the Average Family Size in Hershey
Average Family Size in Hershey is 2.9 People.
What is the Average Household Size in Hershey
Average Household Size in Hershey is 2.3 People.
How Large is the Labor Force in Hershey?
There are 8,233 People in the Labor Forcein in Hershey.
What is the Percentage of People in the Labor Force in Hershey?
66.0% of People are in the Labor Force in Hershey.
What is the Unemployment Rate in Hershey?
Unemployment Rate in Hershey is 3.3%.