Leawood, KS Map & Demographics
Leawood Map
Leawood Overview
$106,882
PER CAPITA INCOME
$202,255
AVG FAMILY INCOME
$174,779
AVG HOUSEHOLD INCOME
60.4%
WAGE / INCOME GAP [ % ]
39.6¢/ $1
WAGE / INCOME GAP [ $ ]
0.46
INEQUALITY / GINI INDEX
33,784
TOTAL POPULATION
16,618
MALE POPULATION
17,166
FEMALE POPULATION
96.81
MALES / 100 FEMALES
103.30
FEMALES / 100 MALES
48.8
MEDIAN AGE
2.9
AVG FAMILY SIZE
2.5
AVG HOUSEHOLD SIZE
17,064
LABOR FORCE [ PEOPLE ]
62.8%
PERCENT IN LABOR FORCE
1.5%
UNEMPLOYMENT RATE
Leawood Area Codes
Income in Leawood
Income Overview in Leawood
Per Capita Income in Leawood is $106,882, while median incomes of families and households are $202,255 and $174,779 respectively.
| Characteristic | Number | Measure |
| Per Capita Income | 33,784 | $106,882 |
| Median Family Income | 10,669 | $202,255 |
| Mean Family Income | 10,669 | $274,364 |
| Median Household Income | 13,304 | $174,779 |
| Mean Household Income | 13,304 | $250,171 |
| Income Deficit | 10,669 | $0 |
| Wage / Income Gap (%) | 33,784 | 60.42% |
| Wage / Income Gap ($) | 33,784 | 39.58¢ per $1 |
| Gini / Inequality Index | 33,784 | 0.46 |
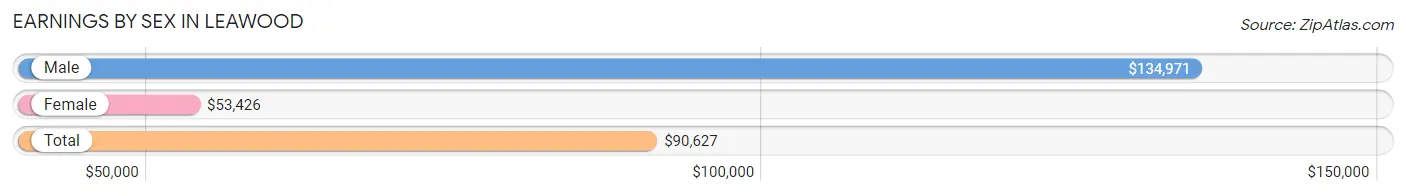
Earnings by Sex in Leawood
Average Earnings in Leawood are $90,627, $134,971 for men and $53,426 for women, a difference of 60.4%.
| Sex | Number | Average Earnings |
| Male | 10,246 (55.9%) | $134,971 |
| Female | 8,094 (44.1%) | $53,426 |
| Total | 18,340 (100.0%) | $90,627 |
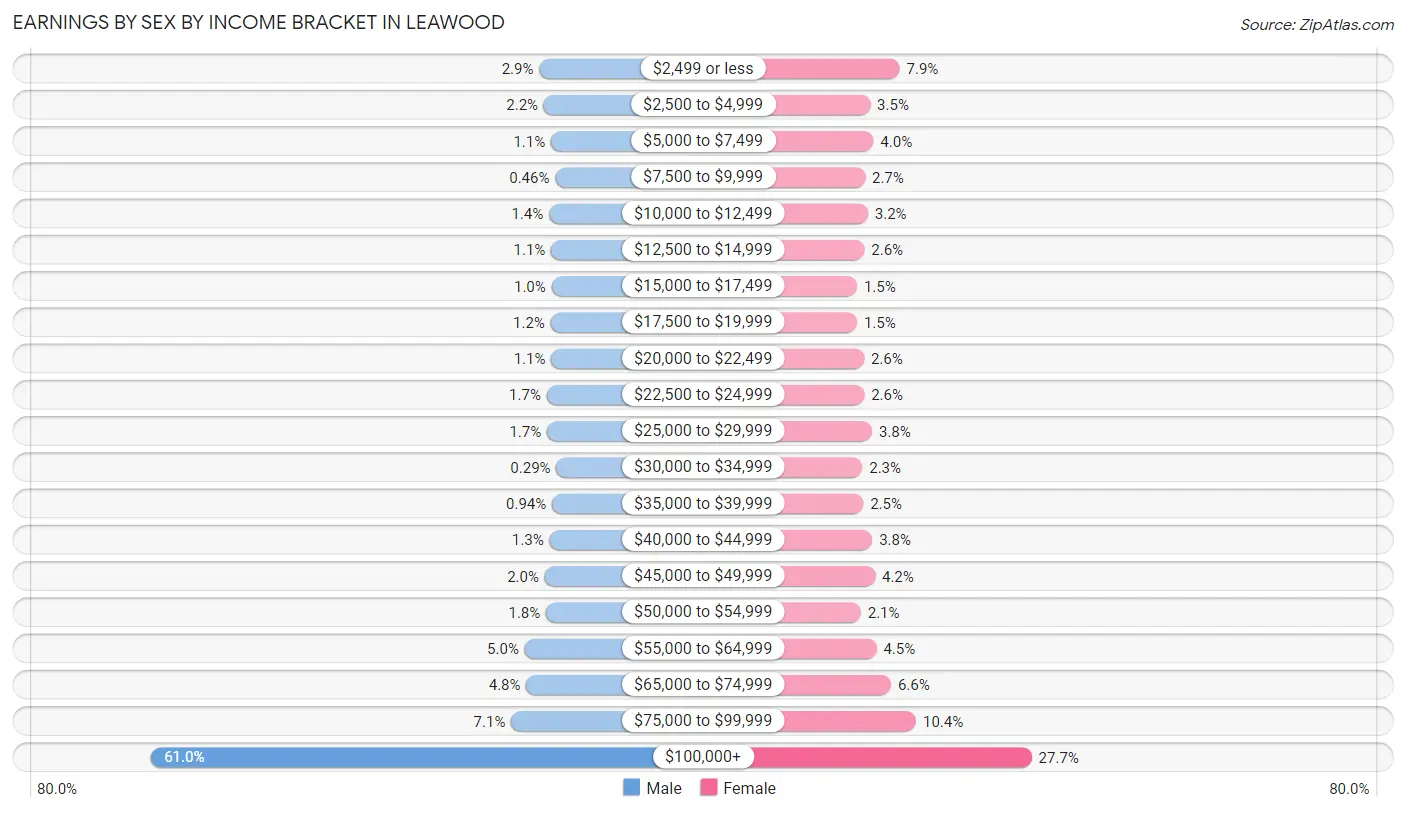
Earnings by Sex by Income Bracket in Leawood
The most common earnings brackets in Leawood are $100,000+ for men (6,251 | 61.0%) and $100,000+ for women (2,243 | 27.7%).
| Income | Male | Female |
| $2,499 or less | 293 (2.9%) | 640 (7.9%) |
| $2,500 to $4,999 | 221 (2.2%) | 283 (3.5%) |
| $5,000 to $7,499 | 112 (1.1%) | 323 (4.0%) |
| $7,500 to $9,999 | 47 (0.5%) | 221 (2.7%) |
| $10,000 to $12,499 | 142 (1.4%) | 255 (3.2%) |
| $12,500 to $14,999 | 111 (1.1%) | 213 (2.6%) |
| $15,000 to $17,499 | 103 (1.0%) | 124 (1.5%) |
| $17,500 to $19,999 | 118 (1.1%) | 124 (1.5%) |
| $20,000 to $22,499 | 109 (1.1%) | 208 (2.6%) |
| $22,500 to $24,999 | 178 (1.7%) | 211 (2.6%) |
| $25,000 to $29,999 | 174 (1.7%) | 306 (3.8%) |
| $30,000 to $34,999 | 30 (0.3%) | 188 (2.3%) |
| $35,000 to $39,999 | 96 (0.9%) | 199 (2.5%) |
| $40,000 to $44,999 | 136 (1.3%) | 308 (3.8%) |
| $45,000 to $49,999 | 208 (2.0%) | 342 (4.2%) |
| $50,000 to $54,999 | 187 (1.8%) | 170 (2.1%) |
| $55,000 to $64,999 | 516 (5.0%) | 360 (4.4%) |
| $65,000 to $74,999 | 491 (4.8%) | 536 (6.6%) |
| $75,000 to $99,999 | 723 (7.1%) | 840 (10.4%) |
| $100,000+ | 6,251 (61.0%) | 2,243 (27.7%) |
| Total | 10,246 (100.0%) | 8,094 (100.0%) |
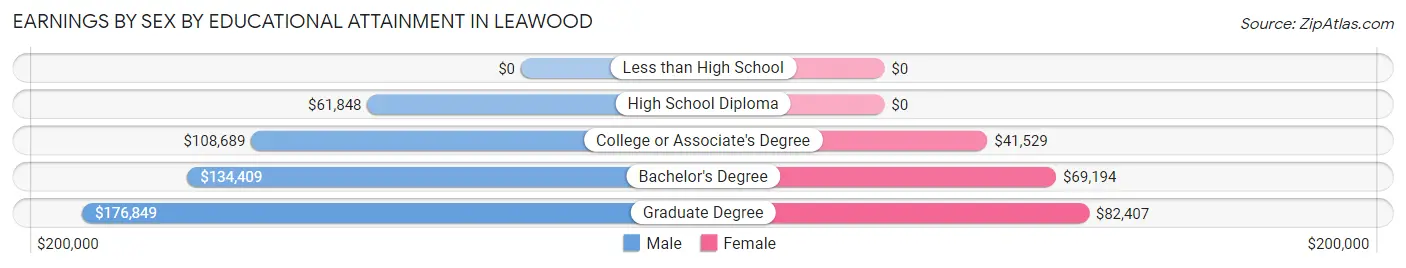
Earnings by Sex by Educational Attainment in Leawood
Average earnings in Leawood are $143,729 for men and $63,092 for women, a difference of 56.1%. Men with an educational attainment of graduate degree enjoy the highest average annual earnings of $176,849, while those with high school diploma education earn the least with $61,848. Women with an educational attainment of graduate degree earn the most with the average annual earnings of $82,407, while those with college or associate's degree education have the smallest earnings of $41,529.
| Educational Attainment | Male Income | Female Income |
| Less than High School | - | - |
| High School Diploma | $61,848 | $0 |
| College or Associate's Degree | $108,689 | $41,529 |
| Bachelor's Degree | $134,409 | $69,194 |
| Graduate Degree | $176,849 | $82,407 |
| Total | $143,729 | $63,092 |
Family Income in Leawood
Family Income Brackets in Leawood
According to the Leawood family income data, there are 5,505 families falling into the $200,000+ income range, which is the most common income bracket and makes up 51.6% of all families. Conversely, the $25,000 to $34,999 income bracket is the least frequent group with only 32 families (0.3%) belonging to this category.
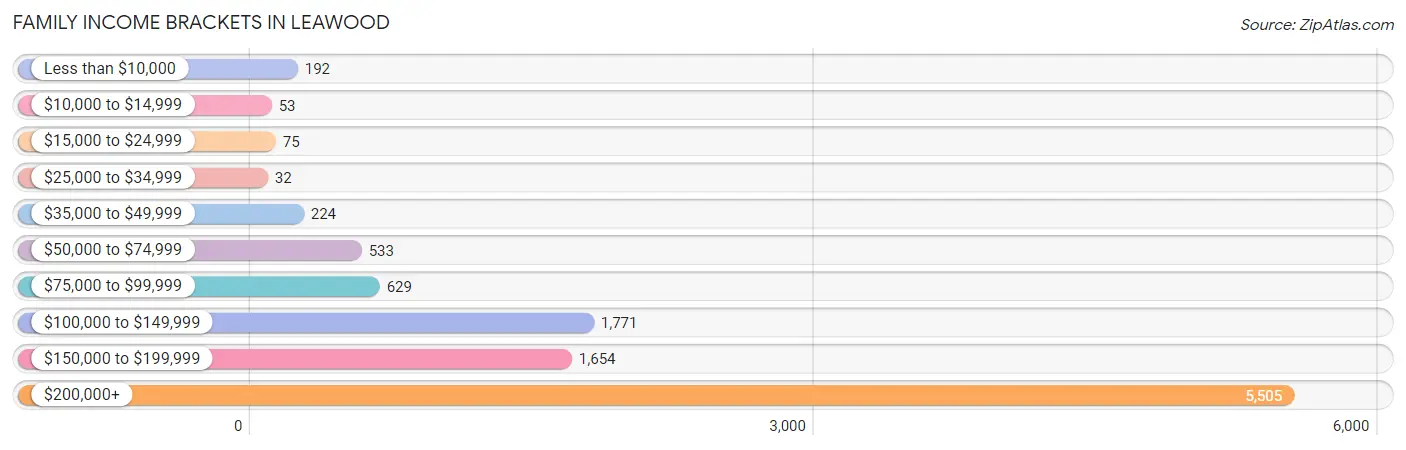
| Income Bracket | # Families | % Families |
| Less than $10,000 | 192 | 1.8% |
| $10,000 to $14,999 | 53 | 0.5% |
| $15,000 to $24,999 | 75 | 0.7% |
| $25,000 to $34,999 | 32 | 0.3% |
| $35,000 to $49,999 | 224 | 2.1% |
| $50,000 to $74,999 | 533 | 5.0% |
| $75,000 to $99,999 | 629 | 5.9% |
| $100,000 to $149,999 | 1,771 | 16.6% |
| $150,000 to $199,999 | 1,654 | 15.5% |
| $200,000+ | 5,505 | 51.6% |
Family Income by Famaliy Size in Leawood
4-person families (1,706 | 16.0%) account for the highest median family income in Leawood with $250,001 per family, while 2-person families (5,673 | 53.2%) have the highest median income of $83,214 per family member.
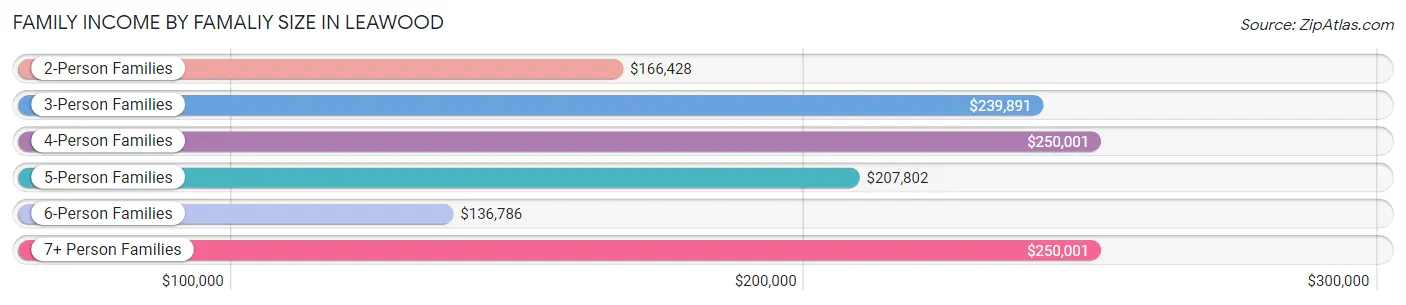
| Income Bracket | # Families | Median Income |
| 2-Person Families | 5,673 (53.2%) | $166,428 |
| 3-Person Families | 2,080 (19.5%) | $239,891 |
| 4-Person Families | 1,706 (16.0%) | $250,001 |
| 5-Person Families | 911 (8.5%) | $207,802 |
| 6-Person Families | 230 (2.2%) | $136,786 |
| 7+ Person Families | 69 (0.6%) | $250,001 |
| Total | 10,669 (100.0%) | $202,255 |
Family Income by Number of Earners in Leawood
The median family income in Leawood is $202,255, with families comprising 3+ earners (1,004) having the highest median family income of $250,001, while families with no earners (2,012) have the lowest median family income of $118,506, accounting for 9.4% and 18.9% of families, respectively.
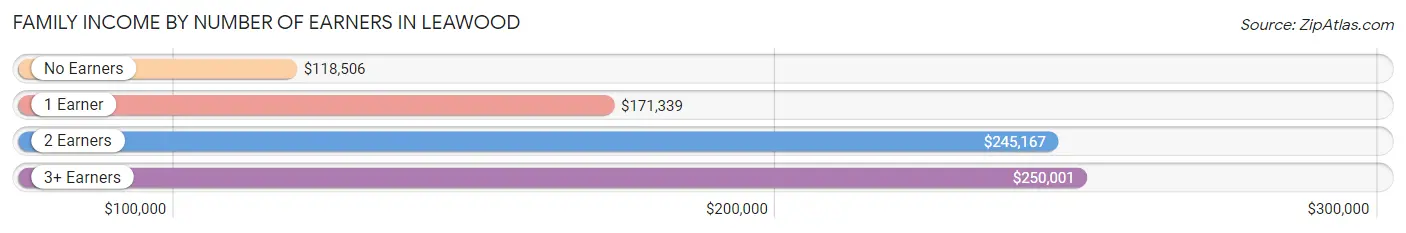
| Number of Earners | # Families | Median Income |
| No Earners | 2,012 (18.9%) | $118,506 |
| 1 Earner | 2,651 (24.8%) | $171,339 |
| 2 Earners | 5,002 (46.9%) | $245,167 |
| 3+ Earners | 1,004 (9.4%) | $250,001 |
| Total | 10,669 (100.0%) | $202,255 |
Household Income in Leawood
Household Income Brackets in Leawood
With 5,947 households falling in the category, the $200,000+ income range is the most frequent in Leawood, accounting for 44.7% of all households. In contrast, only 67 households (0.5%) fall into the $10,000 to $14,999 income bracket, making it the least populous group.
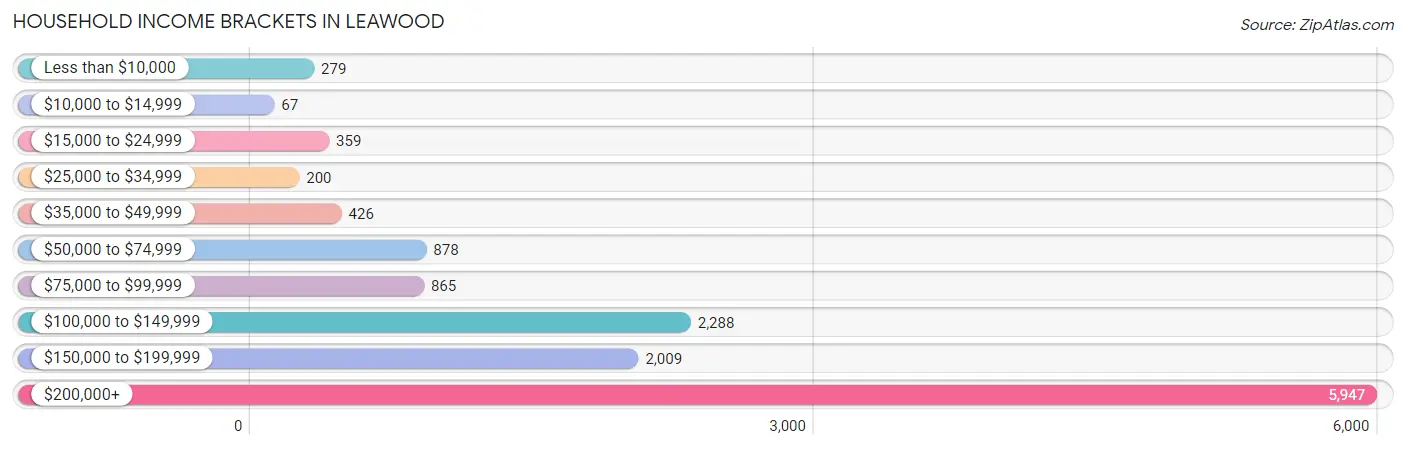
| Income Bracket | # Households | % Households |
| Less than $10,000 | 279 | 2.1% |
| $10,000 to $14,999 | 67 | 0.5% |
| $15,000 to $24,999 | 359 | 2.7% |
| $25,000 to $34,999 | 200 | 1.5% |
| $35,000 to $49,999 | 426 | 3.2% |
| $50,000 to $74,999 | 878 | 6.6% |
| $75,000 to $99,999 | 865 | 6.5% |
| $100,000 to $149,999 | 2,288 | 17.2% |
| $150,000 to $199,999 | 2,009 | 15.1% |
| $200,000+ | 5,947 | 44.7% |
Household Income by Householder Age in Leawood
The median household income in Leawood is $174,779, with the highest median household income of $214,457 found in the 25 to 44 years age bracket for the primary householder. A total of 2,726 households (20.5%) fall into this category. Meanwhile, the 15 to 24 years age bracket for the primary householder has the lowest median household income of $0, with 104 households (0.8%) in this group.
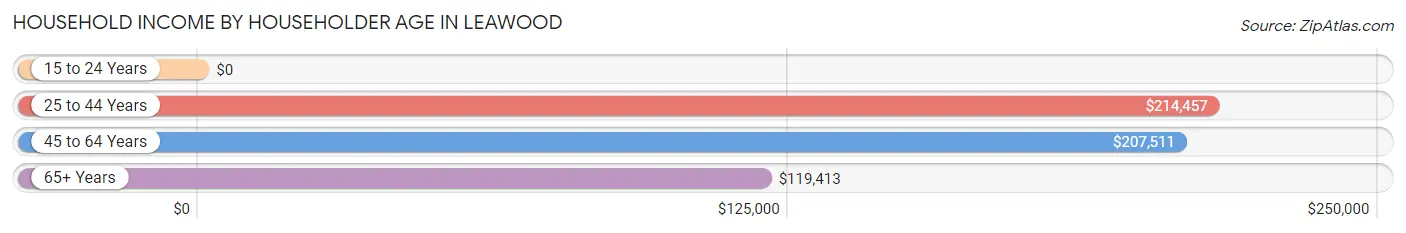
| Income Bracket | # Households | Median Income |
| 15 to 24 Years | 104 (0.8%) | $0 |
| 25 to 44 Years | 2,726 (20.5%) | $214,457 |
| 45 to 64 Years | 6,027 (45.3%) | $207,511 |
| 65+ Years | 4,447 (33.4%) | $119,413 |
| Total | 13,304 (100.0%) | $174,779 |
Poverty in Leawood
Income Below Poverty by Sex and Age in Leawood
With 2.1% poverty level for males and 2.6% for females among the residents of Leawood, 55 to 64 year old males and 75 year old and over females are the most vulnerable to poverty, with 143 males (4.6%) and 64 females (5.6%) in their respective age groups living below the poverty level.
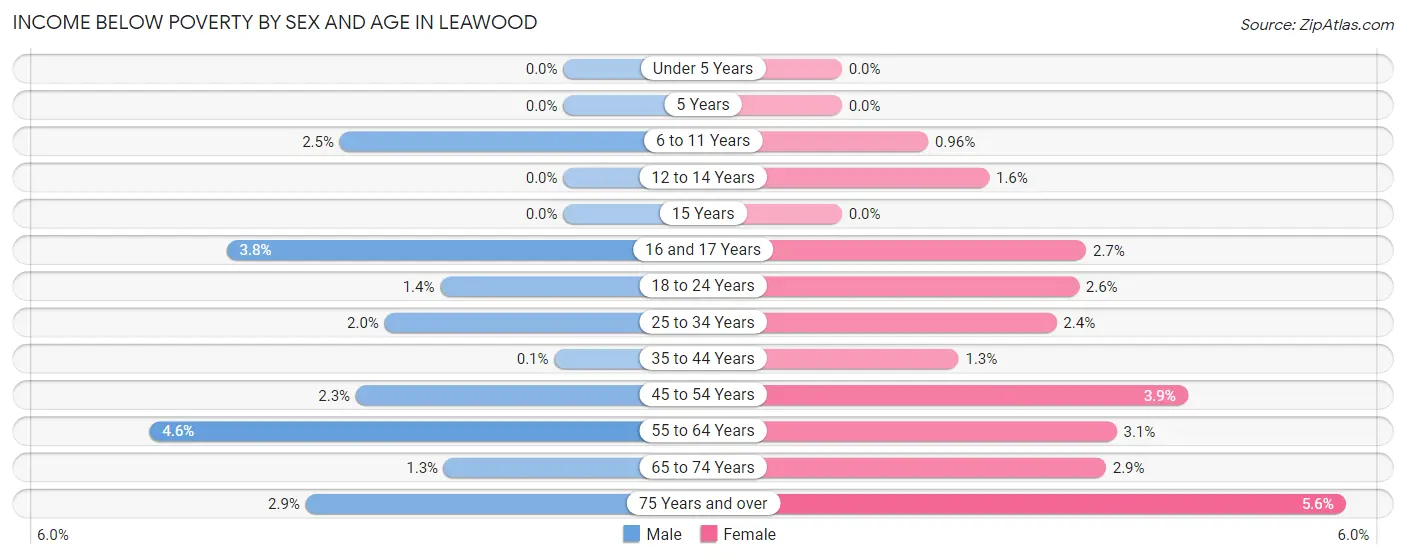
| Age Bracket | Male | Female |
| Under 5 Years | 0 (0.0%) | 0 (0.0%) |
| 5 Years | 0 (0.0%) | 0 (0.0%) |
| 6 to 11 Years | 28 (2.5%) | 14 (1.0%) |
| 12 to 14 Years | 0 (0.0%) | 14 (1.6%) |
| 15 Years | 0 (0.0%) | 0 (0.0%) |
| 16 and 17 Years | 16 (3.7%) | 11 (2.7%) |
| 18 to 24 Years | 12 (1.4%) | 18 (2.6%) |
| 25 to 34 Years | 24 (2.0%) | 27 (2.4%) |
| 35 to 44 Years | 2 (0.1%) | 25 (1.3%) |
| 45 to 54 Years | 57 (2.3%) | 86 (3.8%) |
| 55 to 64 Years | 143 (4.6%) | 106 (3.1%) |
| 65 to 74 Years | 27 (1.3%) | 77 (2.9%) |
| 75 Years and over | 41 (2.9%) | 64 (5.6%) |
| Total | 350 (2.1%) | 442 (2.6%) |
Income Above Poverty by Sex and Age in Leawood
According to the poverty statistics in Leawood, males aged under 5 years and females aged under 5 years are the age groups that are most secure financially, with 100.0% of males and 100.0% of females in these age groups living above the poverty line.
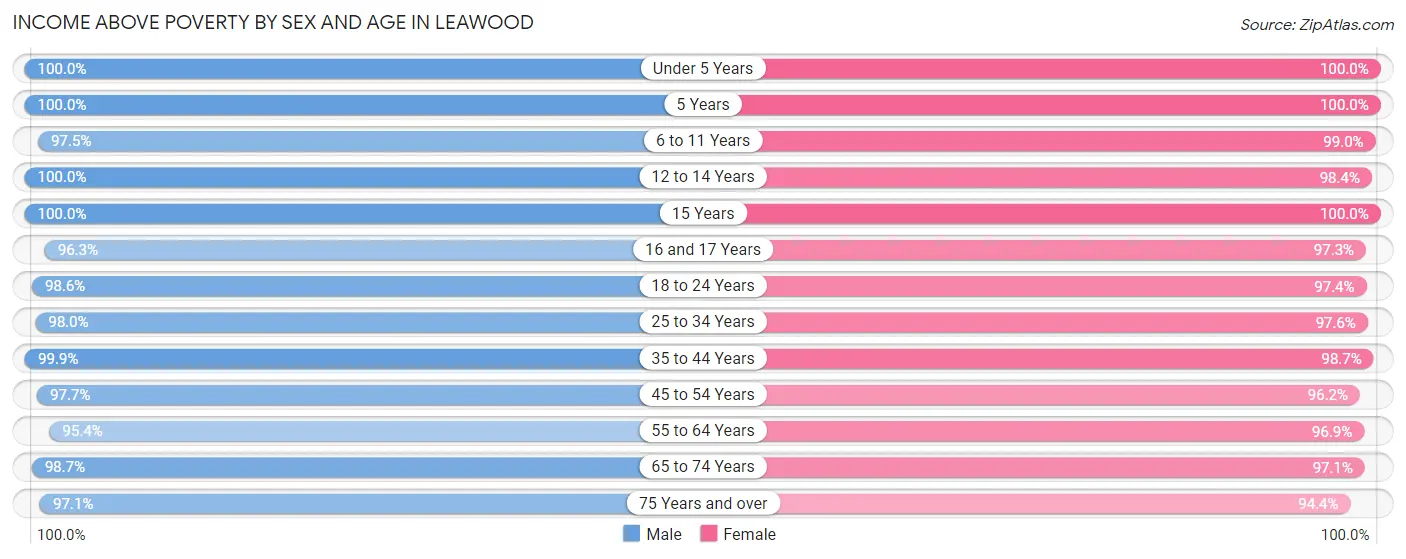
| Age Bracket | Male | Female |
| Under 5 Years | 864 (100.0%) | 837 (100.0%) |
| 5 Years | 177 (100.0%) | 170 (100.0%) |
| 6 to 11 Years | 1,097 (97.5%) | 1,439 (99.0%) |
| 12 to 14 Years | 737 (100.0%) | 840 (98.4%) |
| 15 Years | 120 (100.0%) | 246 (100.0%) |
| 16 and 17 Years | 411 (96.3%) | 393 (97.3%) |
| 18 to 24 Years | 861 (98.6%) | 664 (97.4%) |
| 25 to 34 Years | 1,183 (98.0%) | 1,105 (97.6%) |
| 35 to 44 Years | 2,017 (99.9%) | 1,897 (98.7%) |
| 45 to 54 Years | 2,410 (97.7%) | 2,147 (96.2%) |
| 55 to 64 Years | 2,959 (95.4%) | 3,353 (96.9%) |
| 65 to 74 Years | 1,996 (98.7%) | 2,539 (97.1%) |
| 75 Years and over | 1,386 (97.1%) | 1,077 (94.4%) |
| Total | 16,218 (97.9%) | 16,707 (97.4%) |
Income Below Poverty Among Married-Couple Families in Leawood
The poverty statistics for married-couple families in Leawood show that 1.7% or 170 of the total 9,983 families live below the poverty line. Families with 1 or 2 children have the highest poverty rate of 2.3%, comprising of 62 families. On the other hand, families with 3 or 4 children have the lowest poverty rate of 0.0%, which includes 0 families.
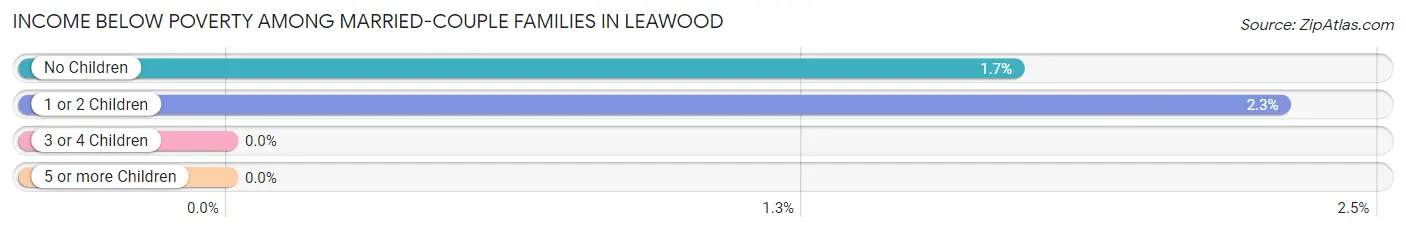
| Children | Above Poverty | Below Poverty |
| No Children | 6,221 (98.3%) | 108 (1.7%) |
| 1 or 2 Children | 2,646 (97.7%) | 62 (2.3%) |
| 3 or 4 Children | 894 (100.0%) | 0 (0.0%) |
| 5 or more Children | 52 (100.0%) | 0 (0.0%) |
| Total | 9,813 (98.3%) | 170 (1.7%) |
Income Below Poverty Among Single-Parent Households in Leawood
According to the poverty data in Leawood, 8.0% or 21 single-father households and 14.2% or 60 single-mother households are living below the poverty line. Among single-father households, those with no children have the highest poverty rate, with 21 households (50.0%) experiencing poverty. Likewise, among single-mother households, those with 1 or 2 children have the highest poverty rate, with 42 households (36.5%) falling below the poverty line.
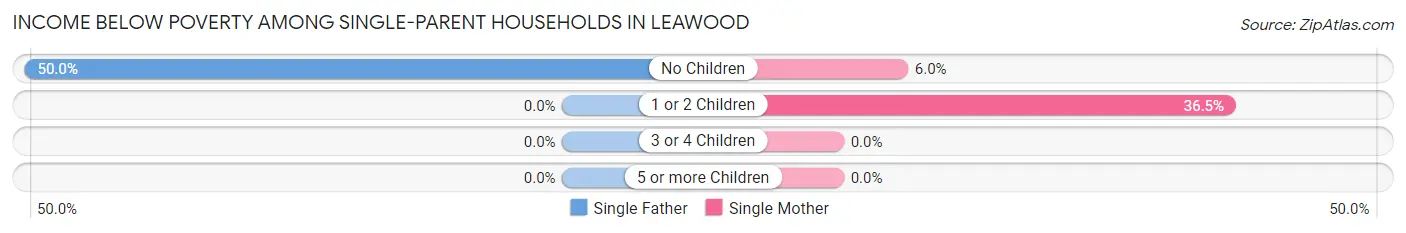
| Children | Single Father | Single Mother |
| No Children | 21 (50.0%) | 18 (6.0%) |
| 1 or 2 Children | 0 (0.0%) | 42 (36.5%) |
| 3 or 4 Children | 0 (0.0%) | 0 (0.0%) |
| 5 or more Children | 0 (0.0%) | 0 (0.0%) |
| Total | 21 (8.0%) | 60 (14.2%) |
Income Below Poverty Among Married-Couple vs Single-Parent Households in Leawood
The poverty data for Leawood shows that 170 of the married-couple family households (1.7%) and 81 of the single-parent households (11.8%) are living below the poverty level. Within the married-couple family households, those with 1 or 2 children have the highest poverty rate, with 62 households (2.3%) falling below the poverty line. Among the single-parent households, those with 1 or 2 children have the highest poverty rate, with 42 household (13.0%) living below poverty.
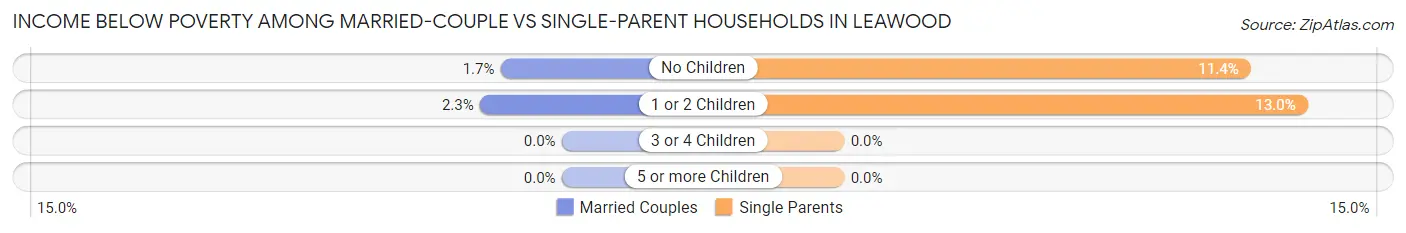
| Children | Married-Couple Families | Single-Parent Households |
| No Children | 108 (1.7%) | 39 (11.4%) |
| 1 or 2 Children | 62 (2.3%) | 42 (13.0%) |
| 3 or 4 Children | 0 (0.0%) | 0 (0.0%) |
| 5 or more Children | 0 (0.0%) | 0 (0.0%) |
| Total | 170 (1.7%) | 81 (11.8%) |
Race in Leawood
The most populous races in Leawood are White / Caucasian (30,356 | 89.8%), Asian (2,021 | 6.0%), and Hispanic or Latino (1,084 | 3.2%).
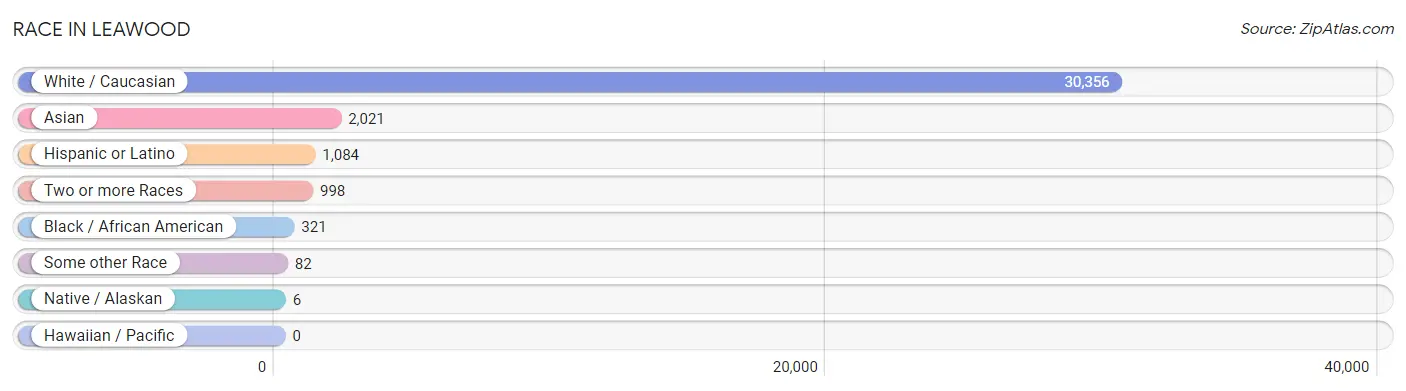
| Race | # Population | % Population |
| Asian | 2,021 | 6.0% |
| Black / African American | 321 | 0.9% |
| Hawaiian / Pacific | 0 | 0.0% |
| Hispanic or Latino | 1,084 | 3.2% |
| Native / Alaskan | 6 | 0.0% |
| White / Caucasian | 30,356 | 89.8% |
| Two or more Races | 998 | 2.9% |
| Some other Race | 82 | 0.2% |
| Total | 33,784 | 100.0% |
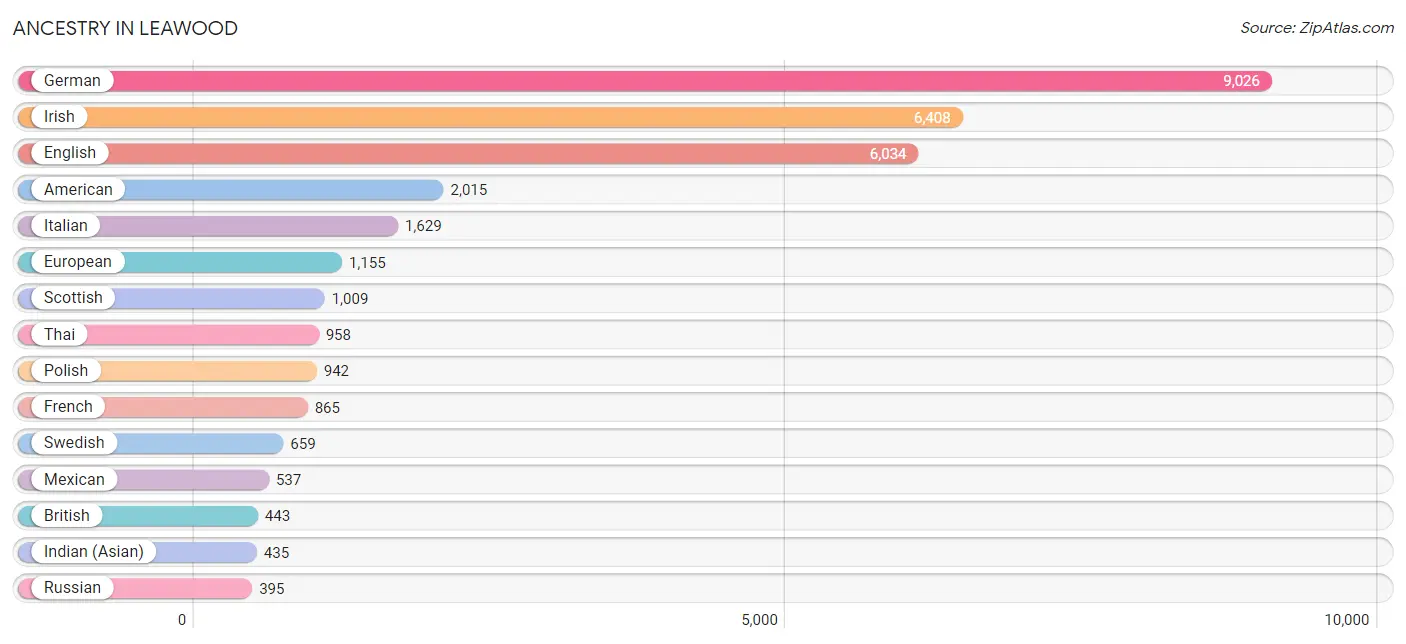
Ancestry in Leawood
The most populous ancestries reported in Leawood are German (9,026 | 26.7%), Irish (6,408 | 19.0%), English (6,034 | 17.9%), American (2,015 | 6.0%), and Italian (1,629 | 4.8%), together accounting for 74.3% of all Leawood residents.
| Ancestry | # Population | % Population |
| American | 2,015 | 6.0% |
| Arab | 268 | 0.8% |
| Argentinean | 29 | 0.1% |
| Austrian | 205 | 0.6% |
| Belgian | 112 | 0.3% |
| Bhutanese | 150 | 0.4% |
| Blackfeet | 13 | 0.0% |
| Brazilian | 10 | 0.0% |
| British | 443 | 1.3% |
| Bulgarian | 7 | 0.0% |
| Burmese | 19 | 0.1% |
| Central American | 24 | 0.1% |
| Central American Indian | 3 | 0.0% |
| Cherokee | 28 | 0.1% |
| Colombian | 21 | 0.1% |
| Costa Rican | 8 | 0.0% |
| Croatian | 85 | 0.3% |
| Cuban | 53 | 0.2% |
| Czech | 132 | 0.4% |
| Czechoslovakian | 13 | 0.0% |
| Danish | 197 | 0.6% |
| Dutch | 357 | 1.1% |
| Eastern European | 64 | 0.2% |
| English | 6,034 | 17.9% |
| Estonian | 13 | 0.0% |
| European | 1,155 | 3.4% |
| Filipino | 15 | 0.0% |
| Finnish | 77 | 0.2% |
| French | 865 | 2.6% |
| French Canadian | 75 | 0.2% |
| German | 9,026 | 26.7% |
| Greek | 115 | 0.3% |
| Guamanian / Chamorro | 13 | 0.0% |
| Guyanese | 34 | 0.1% |
| Hungarian | 294 | 0.9% |
| Indian (Asian) | 435 | 1.3% |
| Iranian | 111 | 0.3% |
| Iraqi | 55 | 0.2% |
| Irish | 6,408 | 19.0% |
| Israeli | 12 | 0.0% |
| Italian | 1,629 | 4.8% |
| Korean | 146 | 0.4% |
| Latvian | 30 | 0.1% |
| Lebanese | 201 | 0.6% |
| Lithuanian | 36 | 0.1% |
| Luxembourger | 50 | 0.2% |
| Mexican | 537 | 1.6% |
| Mongolian | 131 | 0.4% |
| Native Hawaiian | 9 | 0.0% |
| Nigerian | 3 | 0.0% |
| Northern European | 131 | 0.4% |
| Norwegian | 381 | 1.1% |
| Panamanian | 16 | 0.1% |
| Peruvian | 75 | 0.2% |
| Polish | 942 | 2.8% |
| Portuguese | 6 | 0.0% |
| Puerto Rican | 194 | 0.6% |
| Romanian | 206 | 0.6% |
| Russian | 395 | 1.2% |
| Scandinavian | 37 | 0.1% |
| Scotch-Irish | 321 | 0.9% |
| Scottish | 1,009 | 3.0% |
| Serbian | 82 | 0.2% |
| Sioux | 3 | 0.0% |
| Slovak | 67 | 0.2% |
| Slovene | 52 | 0.2% |
| South American | 270 | 0.8% |
| Spanish | 6 | 0.0% |
| Sri Lankan | 119 | 0.4% |
| Subsaharan African | 3 | 0.0% |
| Swedish | 659 | 1.9% |
| Swiss | 276 | 0.8% |
| Syrian | 5 | 0.0% |
| Thai | 958 | 2.8% |
| Turkish | 30 | 0.1% |
| Ukrainian | 176 | 0.5% |
| Venezuelan | 75 | 0.2% |
| Vietnamese | 119 | 0.4% |
| Welsh | 309 | 0.9% |
| West Indian | 6 | 0.0% |
| Yugoslavian | 31 | 0.1% | View All 81 Rows |
Immigrants in Leawood
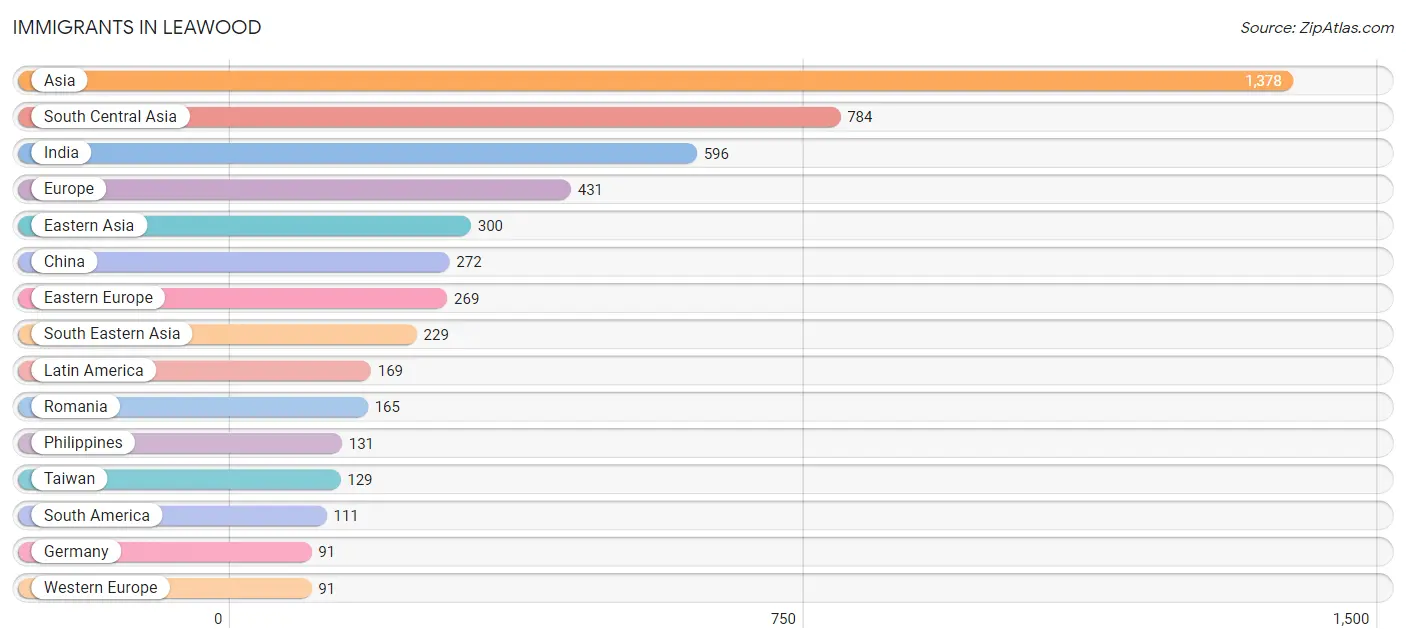
The most numerous immigrant groups reported in Leawood came from Asia (1,378 | 4.1%), South Central Asia (784 | 2.3%), India (596 | 1.8%), Europe (431 | 1.3%), and Eastern Asia (300 | 0.9%), together accounting for 10.3% of all Leawood residents.
| Immigration Origin | # Population | % Population |
| Africa | 3 | 0.0% |
| Asia | 1,378 | 4.1% |
| Bahamas | 1 | 0.0% |
| Bangladesh | 62 | 0.2% |
| Bulgaria | 22 | 0.1% |
| Canada | 8 | 0.0% |
| Caribbean | 6 | 0.0% |
| Central America | 52 | 0.2% |
| China | 272 | 0.8% |
| Colombia | 21 | 0.1% |
| Costa Rica | 14 | 0.0% |
| Cuba | 5 | 0.0% |
| Czechoslovakia | 28 | 0.1% |
| Denmark | 1 | 0.0% |
| Eastern Africa | 3 | 0.0% |
| Eastern Asia | 300 | 0.9% |
| Eastern Europe | 269 | 0.8% |
| Ethiopia | 3 | 0.0% |
| Europe | 431 | 1.3% |
| Germany | 91 | 0.3% |
| Hong Kong | 7 | 0.0% |
| India | 596 | 1.8% |
| Iran | 49 | 0.2% |
| Ireland | 27 | 0.1% |
| Israel | 6 | 0.0% |
| Italy | 26 | 0.1% |
| Japan | 26 | 0.1% |
| Korea | 2 | 0.0% |
| Latin America | 169 | 0.5% |
| Malaysia | 48 | 0.1% |
| Mexico | 37 | 0.1% |
| Moldova | 21 | 0.1% |
| Northern Europe | 45 | 0.1% |
| Pakistan | 77 | 0.2% |
| Panama | 1 | 0.0% |
| Peru | 69 | 0.2% |
| Philippines | 131 | 0.4% |
| Romania | 165 | 0.5% |
| Serbia | 16 | 0.1% |
| South America | 111 | 0.3% |
| South Central Asia | 784 | 2.3% |
| South Eastern Asia | 229 | 0.7% |
| Southern Europe | 26 | 0.1% |
| Syria | 29 | 0.1% |
| Taiwan | 129 | 0.4% |
| Venezuela | 21 | 0.1% |
| Vietnam | 50 | 0.2% |
| Western Asia | 65 | 0.2% |
| Western Europe | 91 | 0.3% | View All 49 Rows |
Sex and Age in Leawood
Sex and Age in Leawood
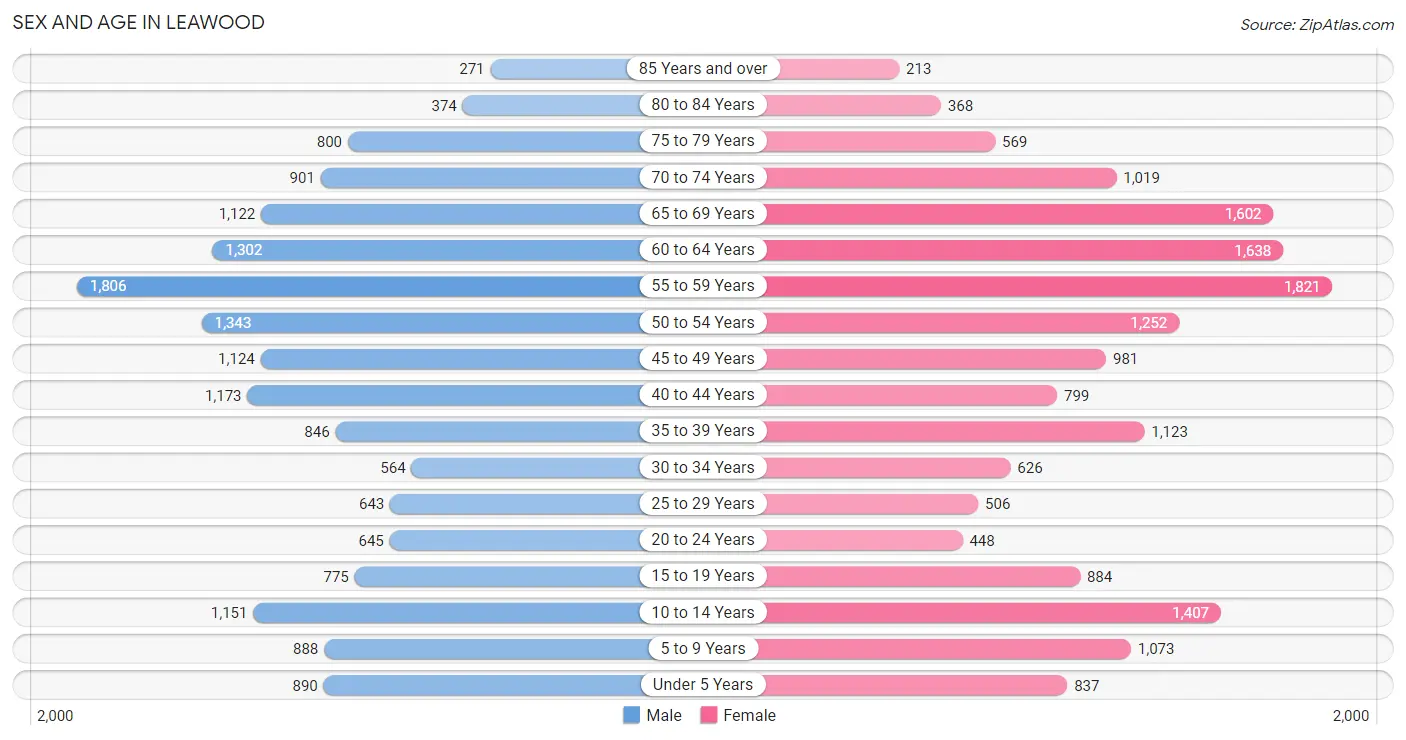
The most populous age groups in Leawood are 55 to 59 Years (1,806 | 10.9%) for men and 55 to 59 Years (1,821 | 10.6%) for women.
| Age Bracket | Male | Female |
| Under 5 Years | 890 (5.4%) | 837 (4.9%) |
| 5 to 9 Years | 888 (5.3%) | 1,073 (6.2%) |
| 10 to 14 Years | 1,151 (6.9%) | 1,407 (8.2%) |
| 15 to 19 Years | 775 (4.7%) | 884 (5.1%) |
| 20 to 24 Years | 645 (3.9%) | 448 (2.6%) |
| 25 to 29 Years | 643 (3.9%) | 506 (2.9%) |
| 30 to 34 Years | 564 (3.4%) | 626 (3.6%) |
| 35 to 39 Years | 846 (5.1%) | 1,123 (6.5%) |
| 40 to 44 Years | 1,173 (7.1%) | 799 (4.6%) |
| 45 to 49 Years | 1,124 (6.8%) | 981 (5.7%) |
| 50 to 54 Years | 1,343 (8.1%) | 1,252 (7.3%) |
| 55 to 59 Years | 1,806 (10.9%) | 1,821 (10.6%) |
| 60 to 64 Years | 1,302 (7.8%) | 1,638 (9.5%) |
| 65 to 69 Years | 1,122 (6.8%) | 1,602 (9.3%) |
| 70 to 74 Years | 901 (5.4%) | 1,019 (5.9%) |
| 75 to 79 Years | 800 (4.8%) | 569 (3.3%) |
| 80 to 84 Years | 374 (2.2%) | 368 (2.1%) |
| 85 Years and over | 271 (1.6%) | 213 (1.2%) |
| Total | 16,618 (100.0%) | 17,166 (100.0%) |
Families and Households in Leawood
Median Family Size in Leawood
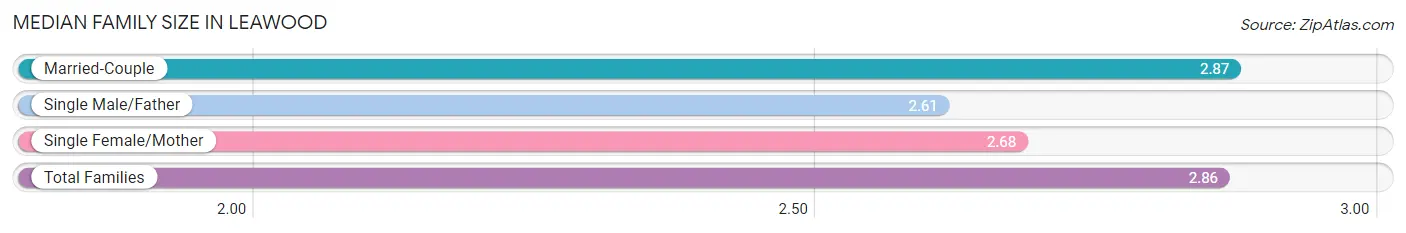
The median family size in Leawood is 2.86 persons per family, with married-couple families (9,983 | 93.6%) accounting for the largest median family size of 2.87 persons per family. On the other hand, single male/father families (264 | 2.5%) represent the smallest median family size with 2.61 persons per family.
| Family Type | # Families | Family Size |
| Married-Couple | 9,983 (93.6%) | 2.87 |
| Single Male/Father | 264 (2.5%) | 2.61 |
| Single Female/Mother | 422 (4.0%) | 2.68 |
| Total Families | 10,669 (100.0%) | 2.86 |
Median Household Size in Leawood
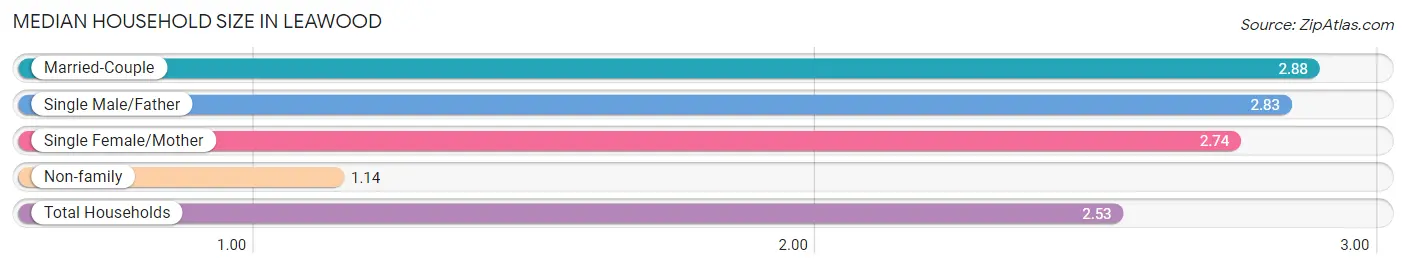
The median household size in Leawood is 2.53 persons per household, with married-couple households (9,983 | 75.0%) accounting for the largest median household size of 2.88 persons per household. non-family households (2,635 | 19.8%) represent the smallest median household size with 1.14 persons per household.
| Household Type | # Households | Household Size |
| Married-Couple | 9,983 (75.0%) | 2.88 |
| Single Male/Father | 264 (2.0%) | 2.83 |
| Single Female/Mother | 422 (3.2%) | 2.74 |
| Non-family | 2,635 (19.8%) | 1.14 |
| Total Households | 13,304 (100.0%) | 2.53 |
Household Size by Marriage Status in Leawood
Out of a total of 13,304 households in Leawood, 10,669 (80.2%) are family households, while 2,635 (19.8%) are nonfamily households. The most numerous type of family households are 2-person households, comprising 5,622, and the most common type of nonfamily households are 1-person households, comprising 2,313.
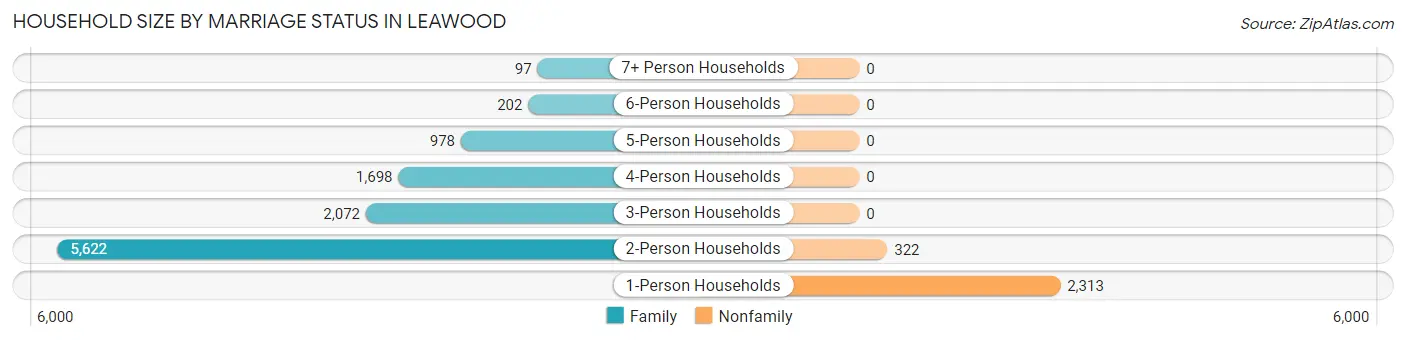
| Household Size | Family Households | Nonfamily Households |
| 1-Person Households | - | 2,313 (17.4%) |
| 2-Person Households | 5,622 (42.3%) | 322 (2.4%) |
| 3-Person Households | 2,072 (15.6%) | 0 (0.0%) |
| 4-Person Households | 1,698 (12.8%) | 0 (0.0%) |
| 5-Person Households | 978 (7.3%) | 0 (0.0%) |
| 6-Person Households | 202 (1.5%) | 0 (0.0%) |
| 7+ Person Households | 97 (0.7%) | 0 (0.0%) |
| Total | 10,669 (80.2%) | 2,635 (19.8%) |
Female Fertility in Leawood
Fertility by Age in Leawood
Average fertility rate in Leawood is 64.0 births per 1,000 women. Women in the age bracket of 20 to 34 years have the highest fertility rate with 89.0 births per 1,000 women. Women in the age bracket of 35 to 50 years acount for 60.9% of all women with births.
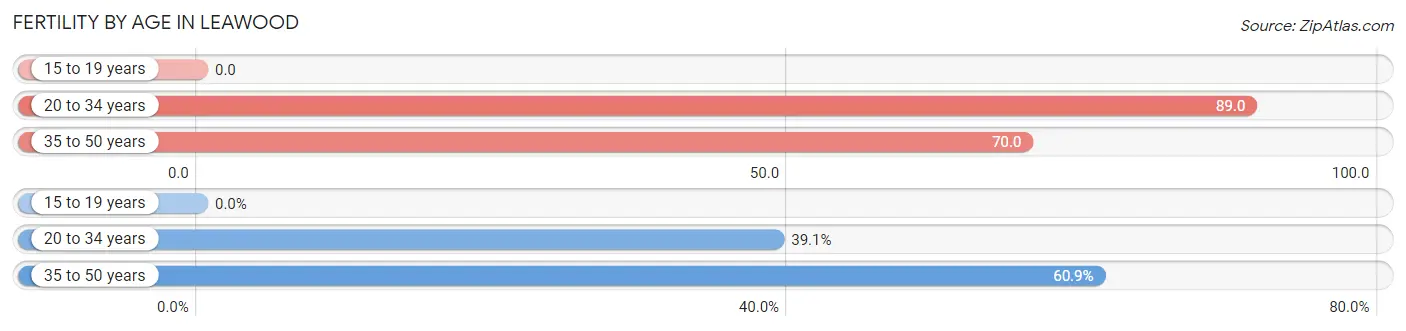
| Age Bracket | Women with Births | Births / 1,000 Women |
| 15 to 19 years | 0 (0.0%) | 0.0 |
| 20 to 34 years | 140 (39.1%) | 89.0 |
| 35 to 50 years | 218 (60.9%) | 70.0 |
| Total | 358 (100.0%) | 64.0 |
Fertility by Age by Marriage Status in Leawood
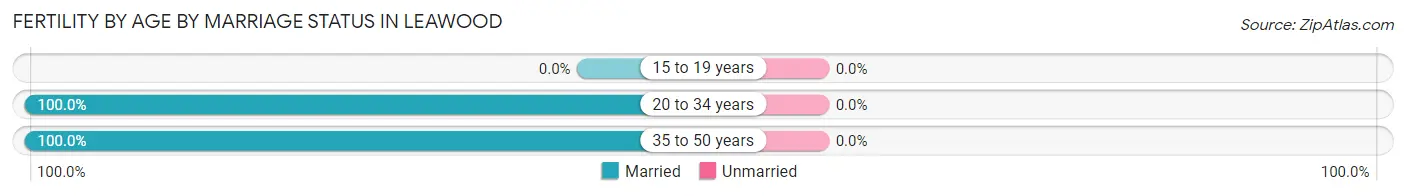
| Age Bracket | Married | Unmarried |
| 15 to 19 years | 0 (0.0%) | 0 (0.0%) |
| 20 to 34 years | 140 (100.0%) | 0 (0.0%) |
| 35 to 50 years | 218 (100.0%) | 0 (0.0%) |
| Total | 358 (100.0%) | 0 (0.0%) |
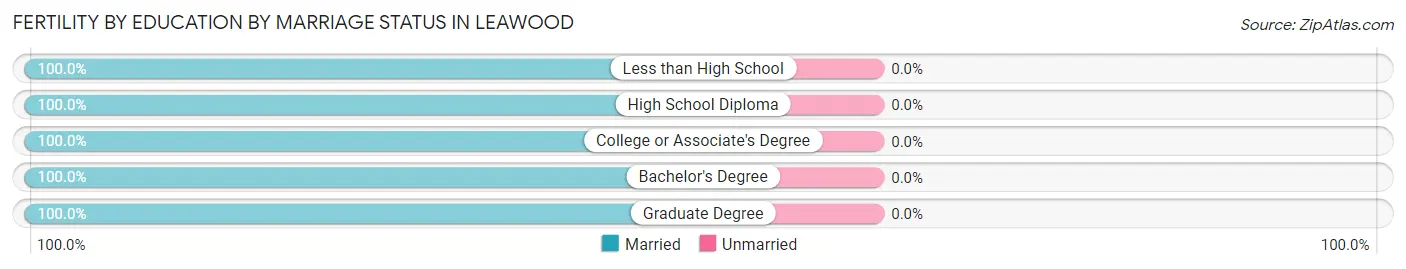
Fertility by Education in Leawood
Average fertility rate in Leawood is 64.0 births per 1,000 women. Women with the education attainment of graduate degree have the highest fertility rate of 83.0 births per 1,000 women, while women with the education attainment of less than high school have the lowest fertility at 7.0 births per 1,000 women. Women with the education attainment of bachelor's degree represent 46.9% of all women with births.
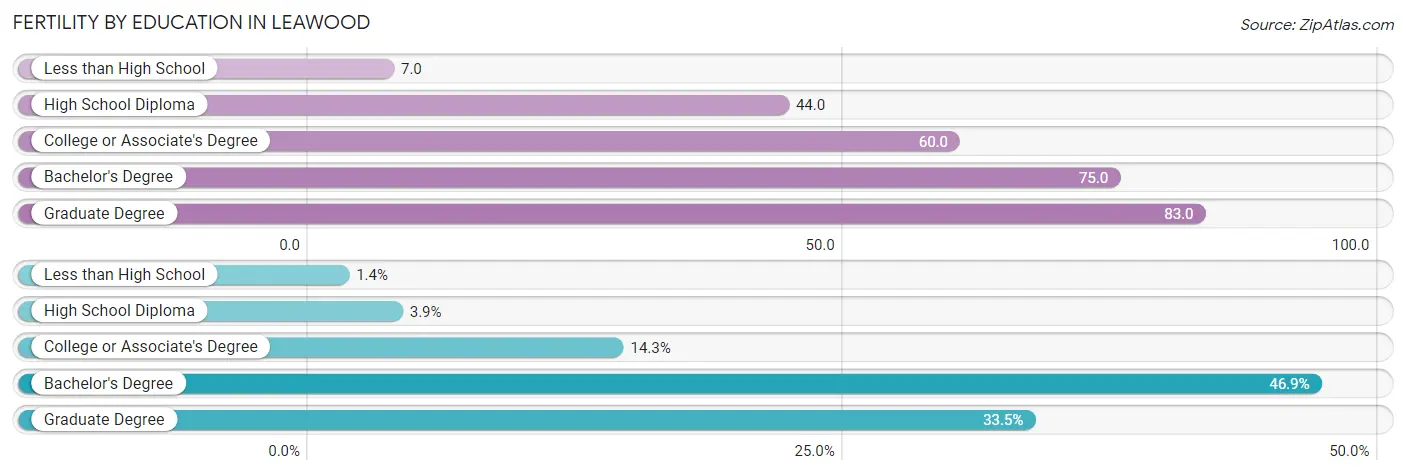
| Educational Attainment | Women with Births | Births / 1,000 Women |
| Less than High School | 5 (1.4%) | 7.0 |
| High School Diploma | 14 (3.9%) | 44.0 |
| College or Associate's Degree | 51 (14.2%) | 60.0 |
| Bachelor's Degree | 168 (46.9%) | 75.0 |
| Graduate Degree | 120 (33.5%) | 83.0 |
| Total | 358 (100.0%) | 64.0 |
Fertility by Education by Marriage Status in Leawood
| Educational Attainment | Married | Unmarried |
| Less than High School | 5 (100.0%) | 0 (0.0%) |
| High School Diploma | 14 (100.0%) | 0 (0.0%) |
| College or Associate's Degree | 51 (100.0%) | 0 (0.0%) |
| Bachelor's Degree | 168 (100.0%) | 0 (0.0%) |
| Graduate Degree | 120 (100.0%) | 0 (0.0%) |
| Total | 358 (100.0%) | 0 (0.0%) |
Employment Characteristics in Leawood
Employment by Class of Employer in Leawood
Among the 16,328 employed individuals in Leawood, private company employees (10,317 | 63.2%), self-employed (incorporated) (2,166 | 13.3%), and not-for-profit organizations (1,711 | 10.5%) make up the most common classes of employment.
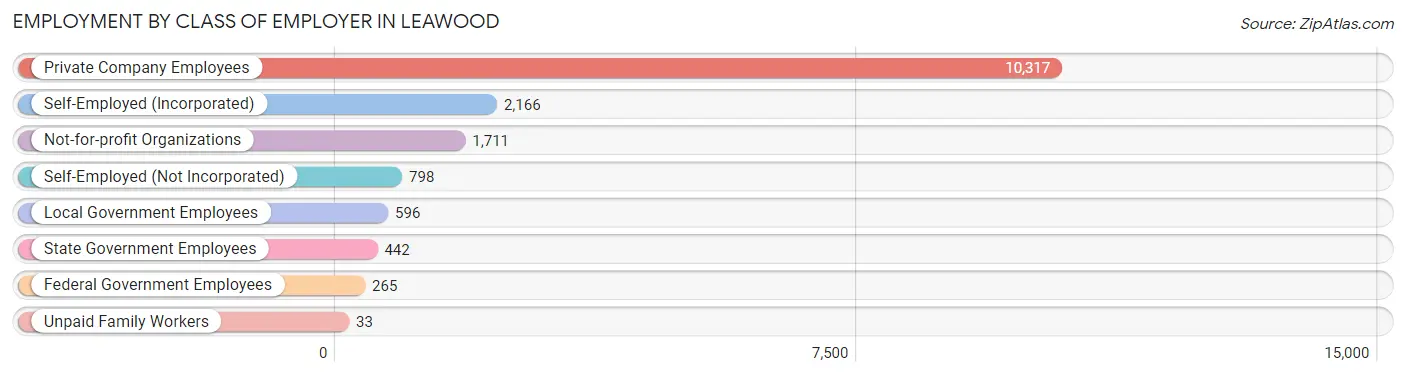
| Employer Class | # Employees | % Employees |
| Private Company Employees | 10,317 | 63.2% |
| Self-Employed (Incorporated) | 2,166 | 13.3% |
| Self-Employed (Not Incorporated) | 798 | 4.9% |
| Not-for-profit Organizations | 1,711 | 10.5% |
| Local Government Employees | 596 | 3.6% |
| State Government Employees | 442 | 2.7% |
| Federal Government Employees | 265 | 1.6% |
| Unpaid Family Workers | 33 | 0.2% |
| Total | 16,328 | 100.0% |
Employment Status by Age in Leawood
According to the labor force statistics for Leawood, out of the total population over 16 years of age (27,172), 62.8% or 17,064 individuals are in the labor force, with 1.5% or 256 of them unemployed. The age group with the highest labor force participation rate is 30 to 34 years, with 88.7% or 1,056 individuals in the labor force. Within the labor force, the 16 to 19 years age range has the highest percentage of unemployed individuals, with 6.4% or 30 of them being unemployed.
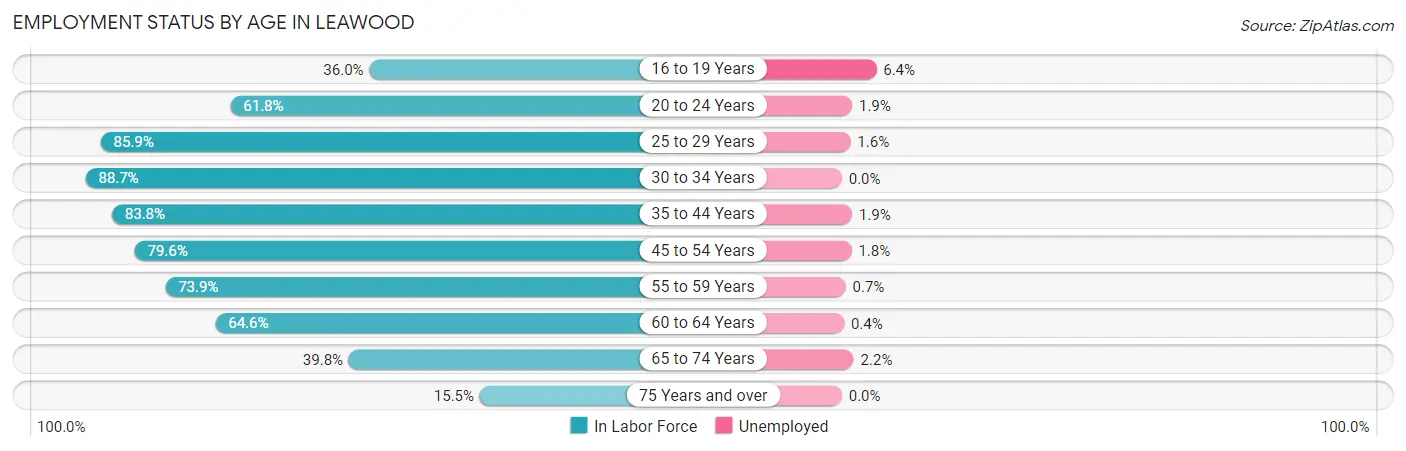
| Age Bracket | In Labor Force | Unemployed |
| 16 to 19 Years | 465 (36.0%) | 30 (6.4%) |
| 20 to 24 Years | 675 (61.8%) | 13 (1.9%) |
| 25 to 29 Years | 987 (85.9%) | 16 (1.6%) |
| 30 to 34 Years | 1,056 (88.7%) | 0 (0.0%) |
| 35 to 44 Years | 3,303 (83.8%) | 63 (1.9%) |
| 45 to 54 Years | 3,741 (79.6%) | 67 (1.8%) |
| 55 to 59 Years | 2,680 (73.9%) | 19 (0.7%) |
| 60 to 64 Years | 1,899 (64.6%) | 8 (0.4%) |
| 65 to 74 Years | 1,848 (39.8%) | 41 (2.2%) |
| 75 Years and over | 402 (15.5%) | 0 (0.0%) |
| Total | 17,064 (62.8%) | 256 (1.5%) |
Employment Status by Educational Attainment in Leawood
According to labor force statistics for Leawood, 77.9% of individuals (13,669) out of the total population between 25 and 64 years of age (17,547) are in the labor force, with 1.3% or 178 of them being unemployed. The group with the highest labor force participation rate are those with the educational attainment of bachelor's degree or higher, with 81.3% or 11,201 individuals in the labor force. Within the labor force, individuals with bachelor's degree or higher education have the highest percentage of unemployment, with 1.3% or 146 of them being unemployed.
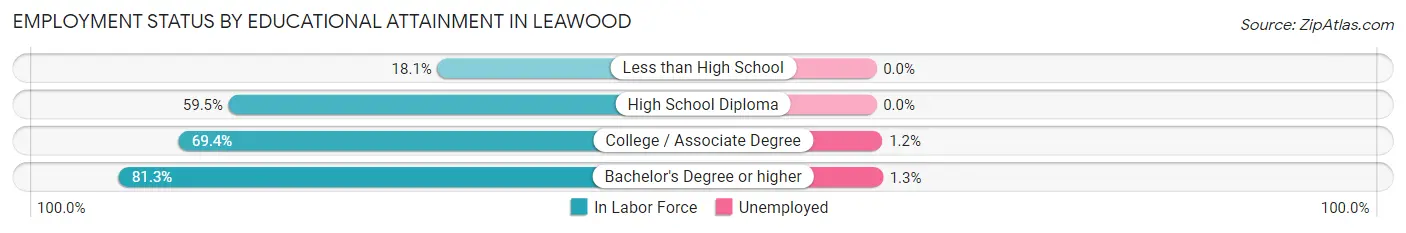
| Educational Attainment | In Labor Force | Unemployed |
| Less than High School | 25 (18.1%) | 0 (0.0%) |
| High School Diploma | 440 (59.5%) | 0 (0.0%) |
| College / Associate Degree | 2,008 (69.4%) | 35 (1.2%) |
| Bachelor's Degree or higher | 11,201 (81.3%) | 179 (1.3%) |
| Total | 13,669 (77.9%) | 228 (1.3%) |
Employment Occupations by Sex in Leawood
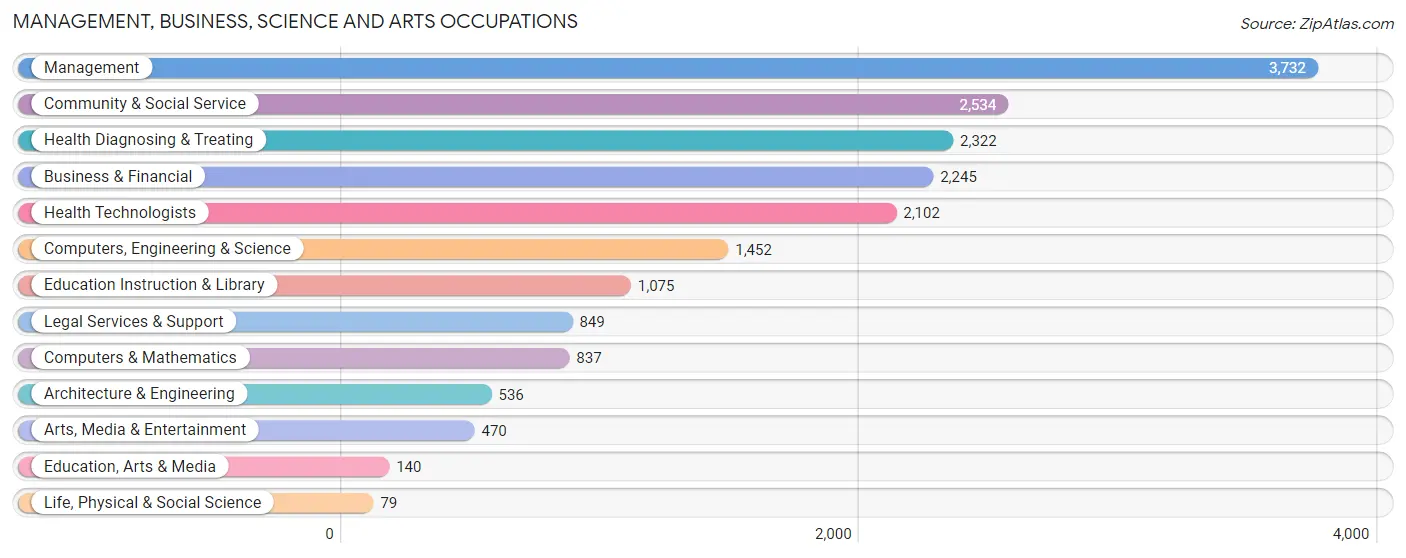
Management, Business, Science and Arts Occupations
The most common Management, Business, Science and Arts occupations in Leawood are Management (3,732 | 22.2%), Community & Social Service (2,534 | 15.1%), Health Diagnosing & Treating (2,322 | 13.8%), Business & Financial (2,245 | 13.4%), and Health Technologists (2,102 | 12.5%).
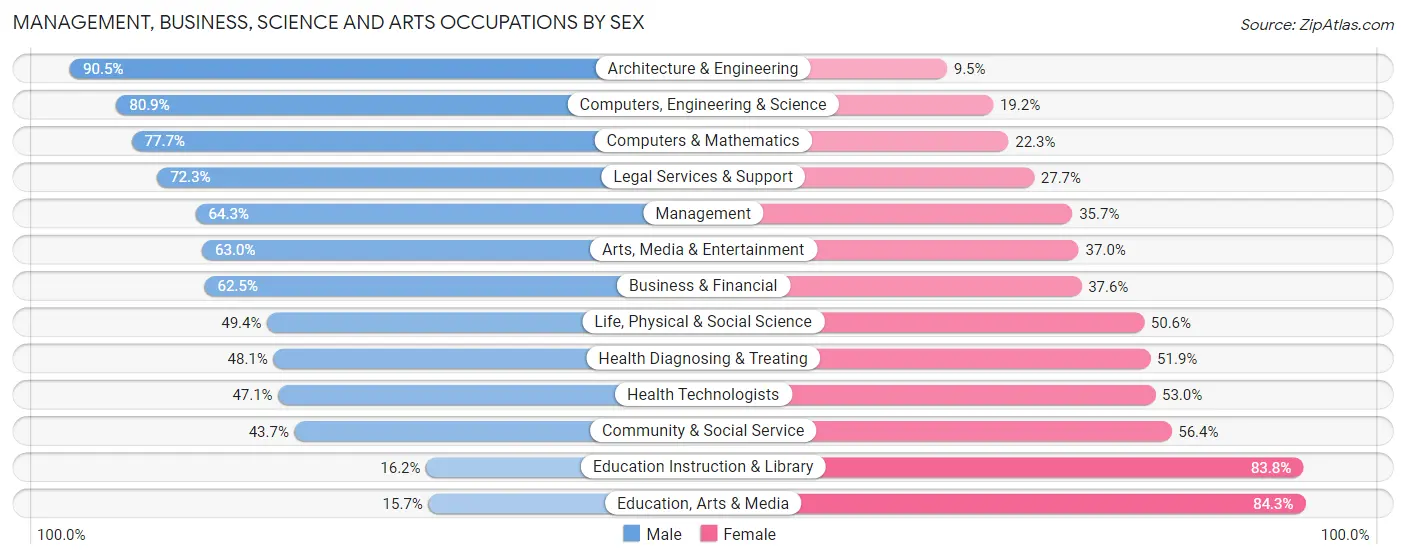
Management, Business, Science and Arts Occupations by Sex
Within the Management, Business, Science and Arts occupations in Leawood, the most male-oriented occupations are Architecture & Engineering (90.5%), Computers, Engineering & Science (80.8%), and Computers & Mathematics (77.7%), while the most female-oriented occupations are Education, Arts & Media (84.3%), Education Instruction & Library (83.8%), and Community & Social Service (56.4%).
| Occupation | Male | Female |
| Management | 2,400 (64.3%) | 1,332 (35.7%) |
| Business & Financial | 1,402 (62.5%) | 843 (37.6%) |
| Computers, Engineering & Science | 1,174 (80.8%) | 278 (19.2%) |
| Computers & Mathematics | 650 (77.7%) | 187 (22.3%) |
| Architecture & Engineering | 485 (90.5%) | 51 (9.5%) |
| Life, Physical & Social Science | 39 (49.4%) | 40 (50.6%) |
| Community & Social Service | 1,106 (43.6%) | 1,428 (56.4%) |
| Education, Arts & Media | 22 (15.7%) | 118 (84.3%) |
| Legal Services & Support | 614 (72.3%) | 235 (27.7%) |
| Education Instruction & Library | 174 (16.2%) | 901 (83.8%) |
| Arts, Media & Entertainment | 296 (63.0%) | 174 (37.0%) |
| Health Diagnosing & Treating | 1,116 (48.1%) | 1,206 (51.9%) |
| Health Technologists | 989 (47.0%) | 1,113 (52.9%) |
| Total (Category) | 7,198 (58.6%) | 5,087 (41.4%) |
| Total (Overall) | 9,835 (58.5%) | 6,968 (41.5%) |
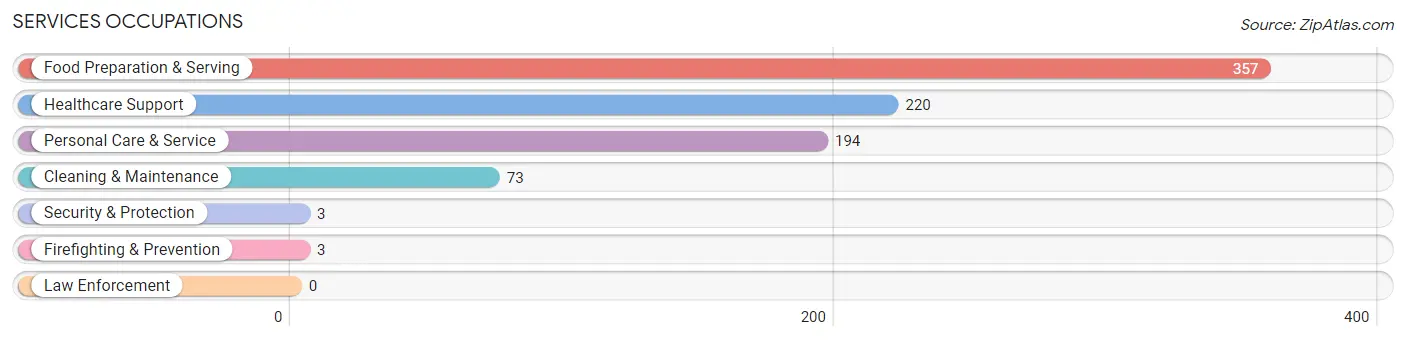
Services Occupations
The most common Services occupations in Leawood are Food Preparation & Serving (357 | 2.1%), Healthcare Support (220 | 1.3%), Personal Care & Service (194 | 1.1%), Cleaning & Maintenance (73 | 0.4%), and Security & Protection (3 | 0.0%).
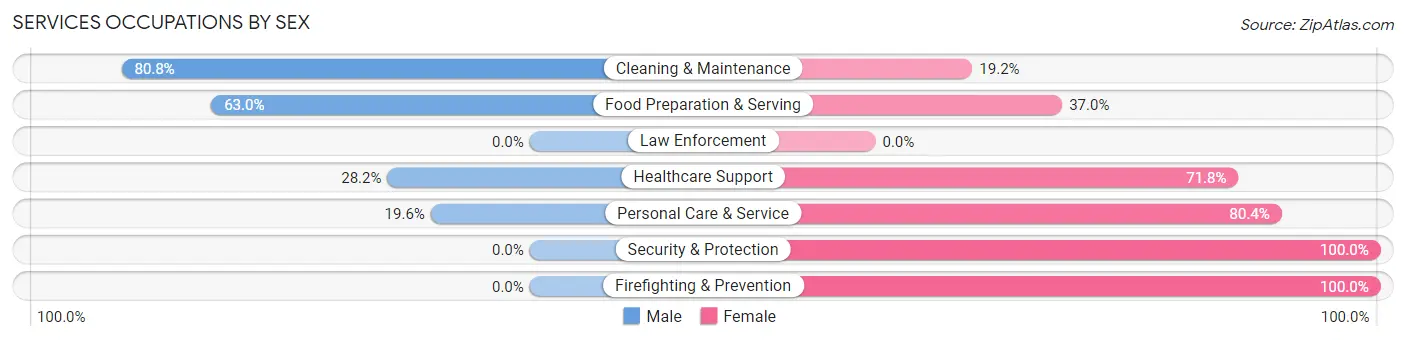
Services Occupations by Sex
Within the Services occupations in Leawood, the most male-oriented occupations are Cleaning & Maintenance (80.8%), Food Preparation & Serving (63.0%), and Healthcare Support (28.2%), while the most female-oriented occupations are Security & Protection (100.0%), Firefighting & Prevention (100.0%), and Personal Care & Service (80.4%).
| Occupation | Male | Female |
| Healthcare Support | 62 (28.2%) | 158 (71.8%) |
| Security & Protection | 0 (0.0%) | 3 (100.0%) |
| Firefighting & Prevention | 0 (0.0%) | 3 (100.0%) |
| Law Enforcement | 0 (0.0%) | 0 (0.0%) |
| Food Preparation & Serving | 225 (63.0%) | 132 (37.0%) |
| Cleaning & Maintenance | 59 (80.8%) | 14 (19.2%) |
| Personal Care & Service | 38 (19.6%) | 156 (80.4%) |
| Total (Category) | 384 (45.3%) | 463 (54.7%) |
| Total (Overall) | 9,835 (58.5%) | 6,968 (41.5%) |
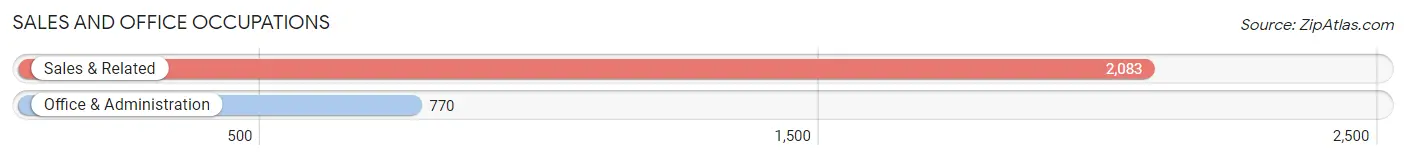
Sales and Office Occupations
The most common Sales and Office occupations in Leawood are Sales & Related (2,083 | 12.4%), and Office & Administration (770 | 4.6%).
Sales and Office Occupations by Sex
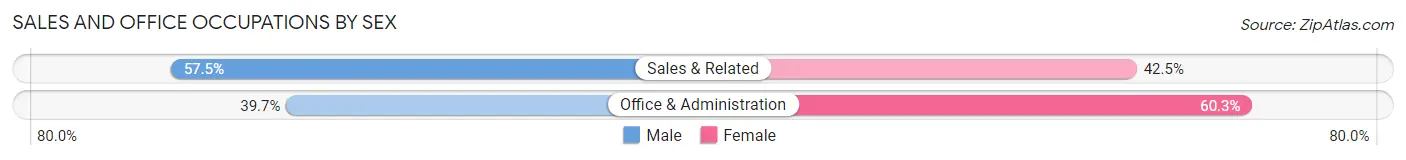
| Occupation | Male | Female |
| Sales & Related | 1,198 (57.5%) | 885 (42.5%) |
| Office & Administration | 306 (39.7%) | 464 (60.3%) |
| Total (Category) | 1,504 (52.7%) | 1,349 (47.3%) |
| Total (Overall) | 9,835 (58.5%) | 6,968 (41.5%) |
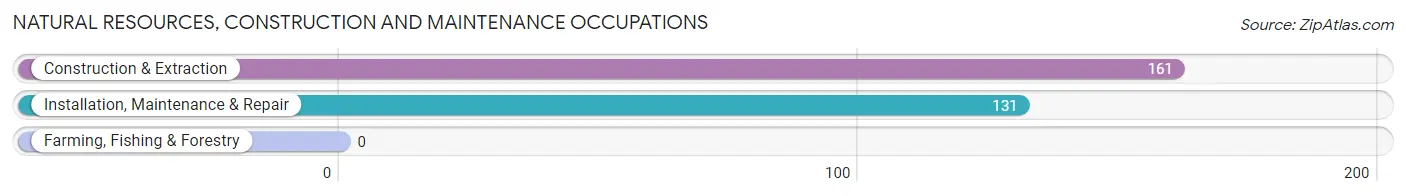
Natural Resources, Construction and Maintenance Occupations
The most common Natural Resources, Construction and Maintenance occupations in Leawood are Construction & Extraction (161 | 1.0%), and Installation, Maintenance & Repair (131 | 0.8%).
Natural Resources, Construction and Maintenance Occupations by Sex

| Occupation | Male | Female |
| Farming, Fishing & Forestry | 0 (0.0%) | 0 (0.0%) |
| Construction & Extraction | 161 (100.0%) | 0 (0.0%) |
| Installation, Maintenance & Repair | 131 (100.0%) | 0 (0.0%) |
| Total (Category) | 292 (100.0%) | 0 (0.0%) |
| Total (Overall) | 9,835 (58.5%) | 6,968 (41.5%) |
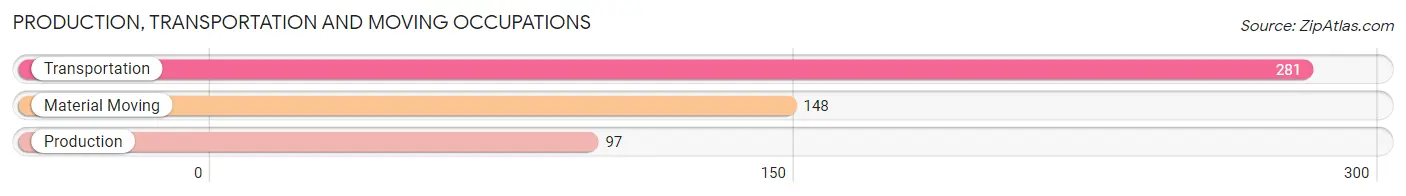
Production, Transportation and Moving Occupations
The most common Production, Transportation and Moving occupations in Leawood are Transportation (281 | 1.7%), Material Moving (148 | 0.9%), and Production (97 | 0.6%).
Production, Transportation and Moving Occupations by Sex
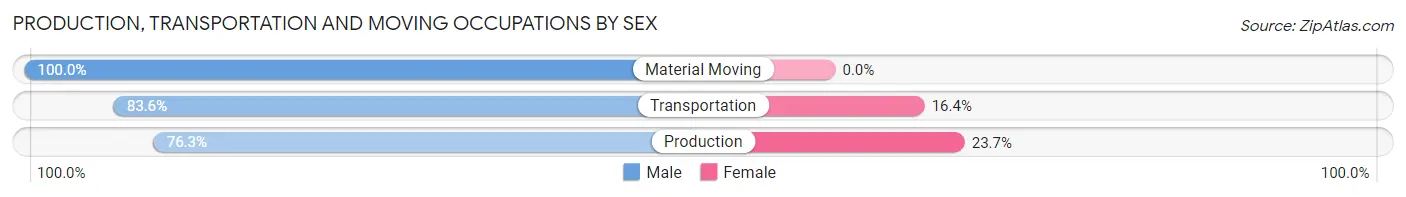
| Occupation | Male | Female |
| Production | 74 (76.3%) | 23 (23.7%) |
| Transportation | 235 (83.6%) | 46 (16.4%) |
| Material Moving | 148 (100.0%) | 0 (0.0%) |
| Total (Category) | 457 (86.9%) | 69 (13.1%) |
| Total (Overall) | 9,835 (58.5%) | 6,968 (41.5%) |
Employment Industries by Sex in Leawood
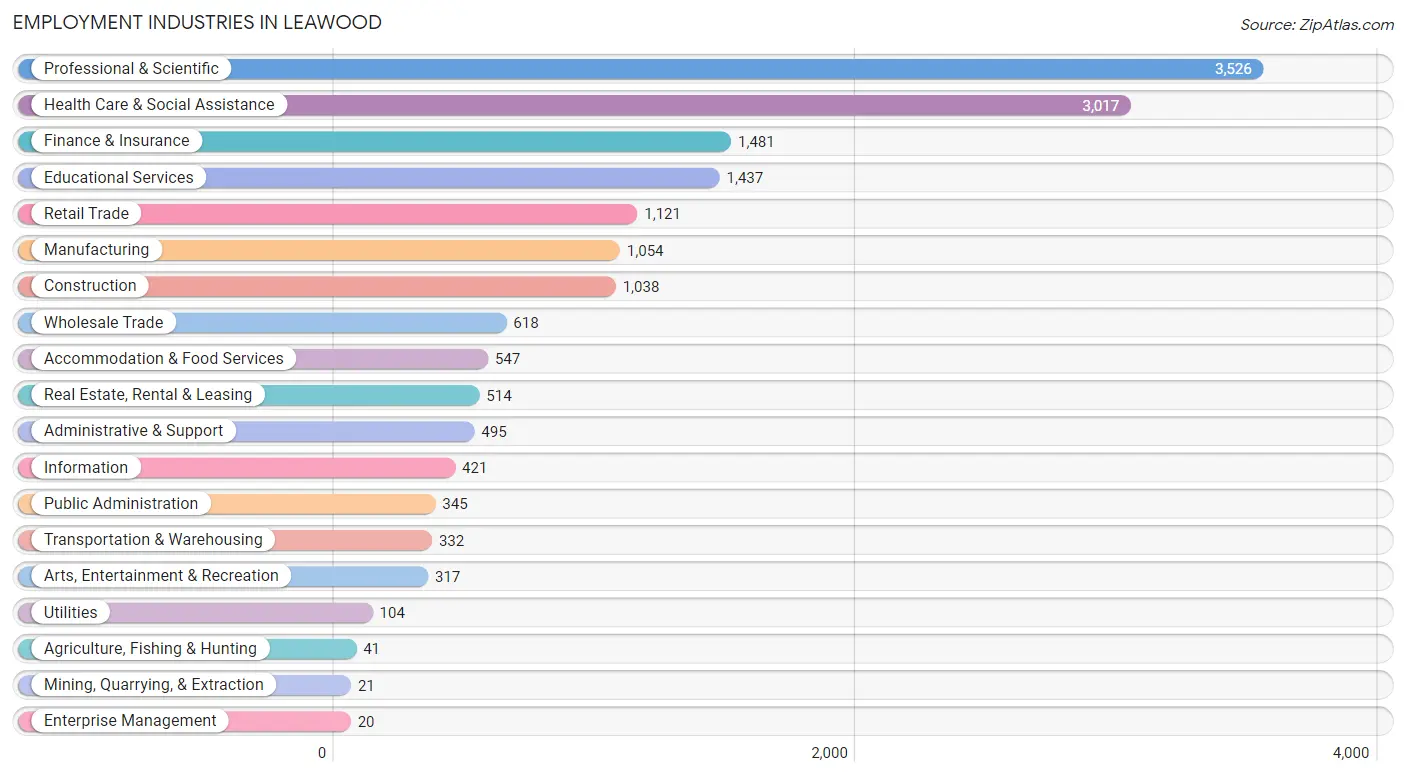
Employment Industries in Leawood
The major employment industries in Leawood include Professional & Scientific (3,526 | 21.0%), Health Care & Social Assistance (3,017 | 18.0%), Finance & Insurance (1,481 | 8.8%), Educational Services (1,437 | 8.6%), and Retail Trade (1,121 | 6.7%).
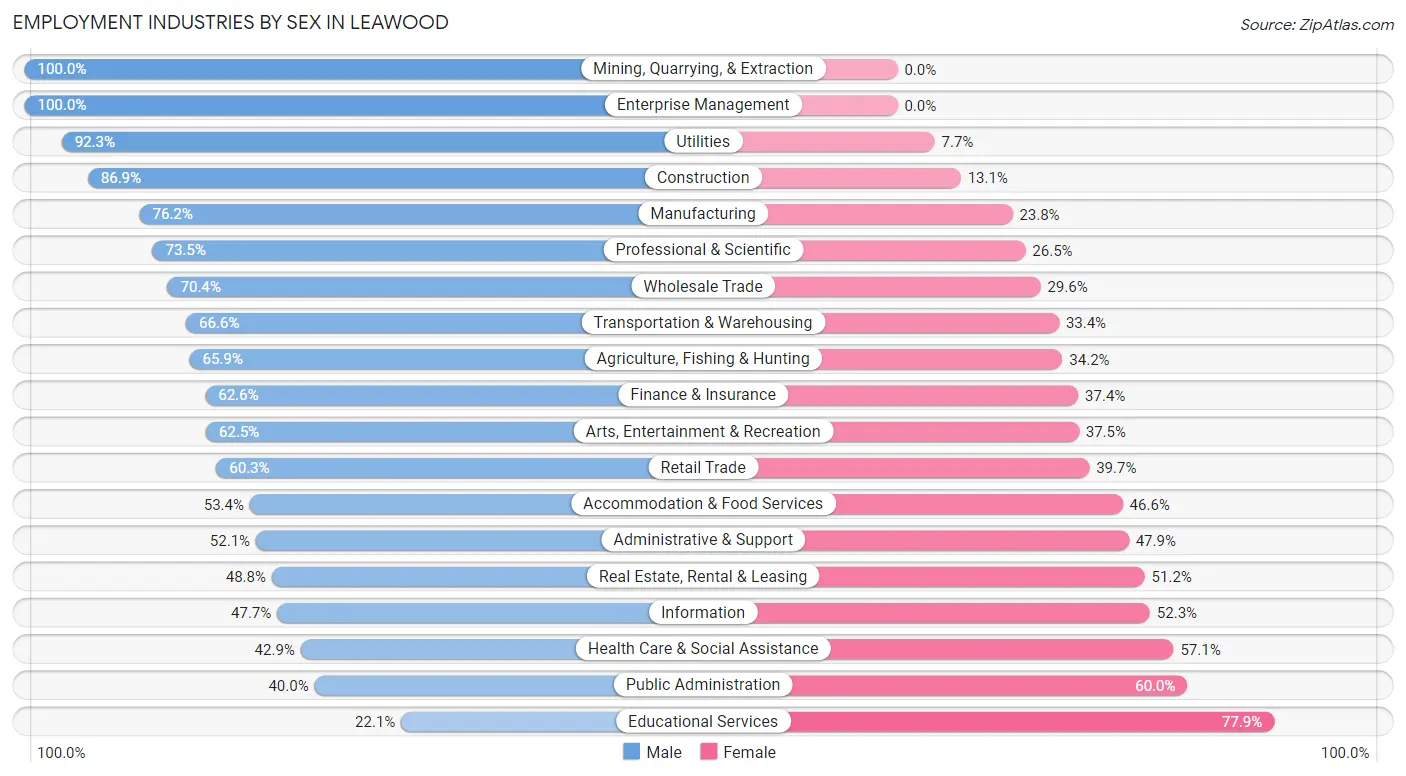
Employment Industries by Sex in Leawood
The Leawood industries that see more men than women are Mining, Quarrying, & Extraction (100.0%), Enterprise Management (100.0%), and Utilities (92.3%), whereas the industries that tend to have a higher number of women are Educational Services (77.9%), Public Administration (60.0%), and Health Care & Social Assistance (57.1%).
| Industry | Male | Female |
| Agriculture, Fishing & Hunting | 27 (65.8%) | 14 (34.2%) |
| Mining, Quarrying, & Extraction | 21 (100.0%) | 0 (0.0%) |
| Construction | 902 (86.9%) | 136 (13.1%) |
| Manufacturing | 803 (76.2%) | 251 (23.8%) |
| Wholesale Trade | 435 (70.4%) | 183 (29.6%) |
| Retail Trade | 676 (60.3%) | 445 (39.7%) |
| Transportation & Warehousing | 221 (66.6%) | 111 (33.4%) |
| Utilities | 96 (92.3%) | 8 (7.7%) |
| Information | 201 (47.7%) | 220 (52.3%) |
| Finance & Insurance | 927 (62.6%) | 554 (37.4%) |
| Real Estate, Rental & Leasing | 251 (48.8%) | 263 (51.2%) |
| Professional & Scientific | 2,592 (73.5%) | 934 (26.5%) |
| Enterprise Management | 20 (100.0%) | 0 (0.0%) |
| Administrative & Support | 258 (52.1%) | 237 (47.9%) |
| Educational Services | 317 (22.1%) | 1,120 (77.9%) |
| Health Care & Social Assistance | 1,293 (42.9%) | 1,724 (57.1%) |
| Arts, Entertainment & Recreation | 198 (62.5%) | 119 (37.5%) |
| Accommodation & Food Services | 292 (53.4%) | 255 (46.6%) |
| Public Administration | 138 (40.0%) | 207 (60.0%) |
| Total | 9,835 (58.5%) | 6,968 (41.5%) |
Education in Leawood
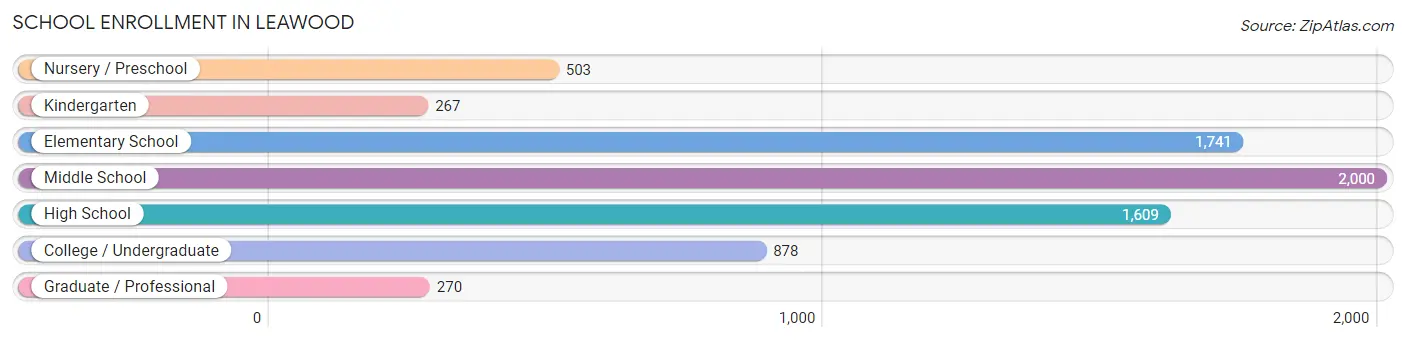
School Enrollment in Leawood
The most common levels of schooling among the 7,268 students in Leawood are middle school (2,000 | 27.5%), elementary school (1,741 | 23.9%), and high school (1,609 | 22.1%).
| School Level | # Students | % Students |
| Nursery / Preschool | 503 | 6.9% |
| Kindergarten | 267 | 3.7% |
| Elementary School | 1,741 | 23.9% |
| Middle School | 2,000 | 27.5% |
| High School | 1,609 | 22.1% |
| College / Undergraduate | 878 | 12.1% |
| Graduate / Professional | 270 | 3.7% |
| Total | 7,268 | 100.0% |
School Enrollment by Age by Funding Source in Leawood
Out of a total of 7,268 students who are enrolled in schools in Leawood, 1,970 (27.1%) attend a private institution, while the remaining 5,298 (72.9%) are enrolled in public schools. The age group of 3 to 4 year olds has the highest likelihood of being enrolled in private schools, with 209 (59.4% in the age bracket) enrolled. Conversely, the age group of 25 to 34 year olds has the lowest likelihood of being enrolled in a private school, with 313 (93.4% in the age bracket) attending a public institution.
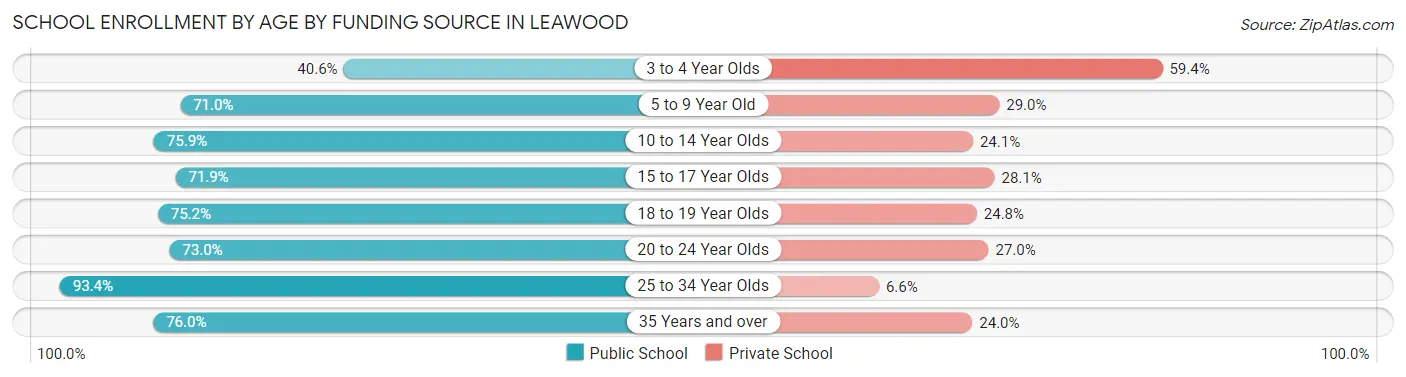
| Age Bracket | Public School | Private School |
| 3 to 4 Year Olds | 143 (40.6%) | 209 (59.4%) |
| 5 to 9 Year Old | 1,303 (71.0%) | 532 (29.0%) |
| 10 to 14 Year Olds | 1,922 (75.9%) | 610 (24.1%) |
| 15 to 17 Year Olds | 847 (71.9%) | 331 (28.1%) |
| 18 to 19 Year Olds | 294 (75.2%) | 97 (24.8%) |
| 20 to 24 Year Olds | 276 (73.0%) | 102 (27.0%) |
| 25 to 34 Year Olds | 313 (93.4%) | 22 (6.6%) |
| 35 Years and over | 203 (76.0%) | 64 (24.0%) |
| Total | 5,298 (72.9%) | 1,970 (27.1%) |
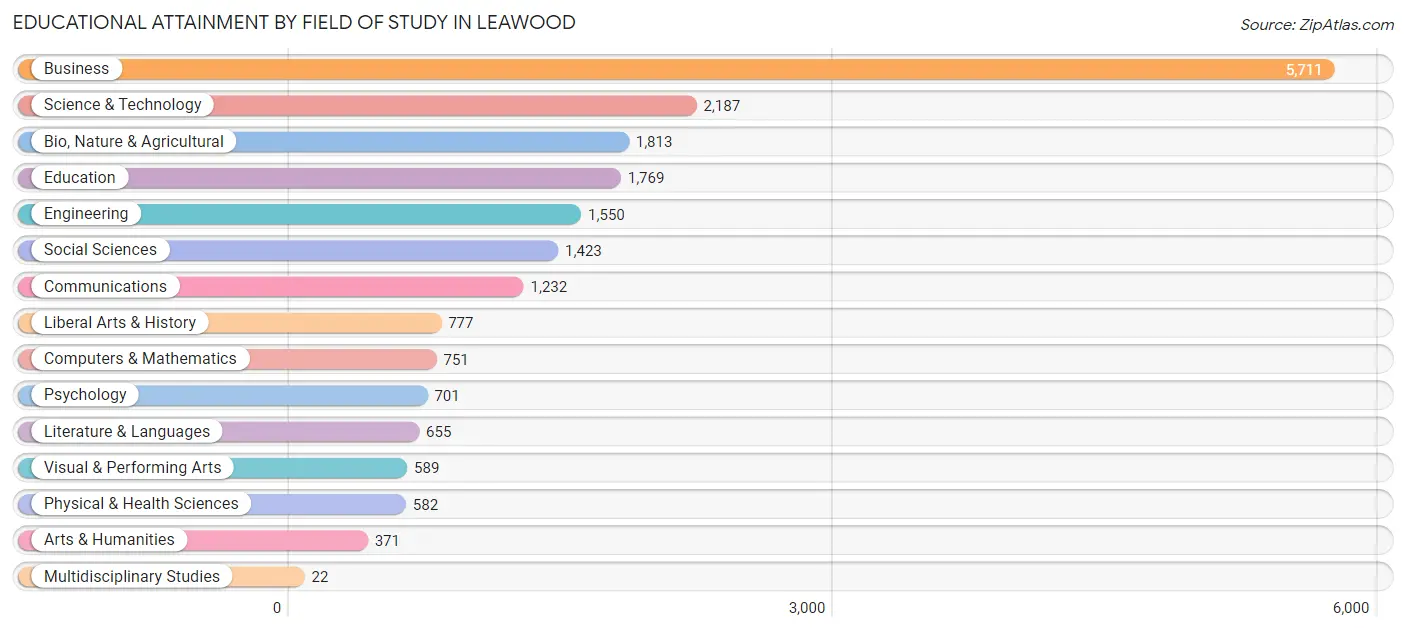
Educational Attainment by Field of Study in Leawood
Business (5,711 | 28.4%), science & technology (2,187 | 10.9%), bio, nature & agricultural (1,813 | 9.0%), education (1,769 | 8.8%), and engineering (1,550 | 7.7%) are the most common fields of study among 20,133 individuals in Leawood who have obtained a bachelor's degree or higher.
| Field of Study | # Graduates | % Graduates |
| Computers & Mathematics | 751 | 3.7% |
| Bio, Nature & Agricultural | 1,813 | 9.0% |
| Physical & Health Sciences | 582 | 2.9% |
| Psychology | 701 | 3.5% |
| Social Sciences | 1,423 | 7.1% |
| Engineering | 1,550 | 7.7% |
| Multidisciplinary Studies | 22 | 0.1% |
| Science & Technology | 2,187 | 10.9% |
| Business | 5,711 | 28.4% |
| Education | 1,769 | 8.8% |
| Literature & Languages | 655 | 3.3% |
| Liberal Arts & History | 777 | 3.9% |
| Visual & Performing Arts | 589 | 2.9% |
| Communications | 1,232 | 6.1% |
| Arts & Humanities | 371 | 1.8% |
| Total | 20,133 | 100.0% |
Transportation & Commute in Leawood
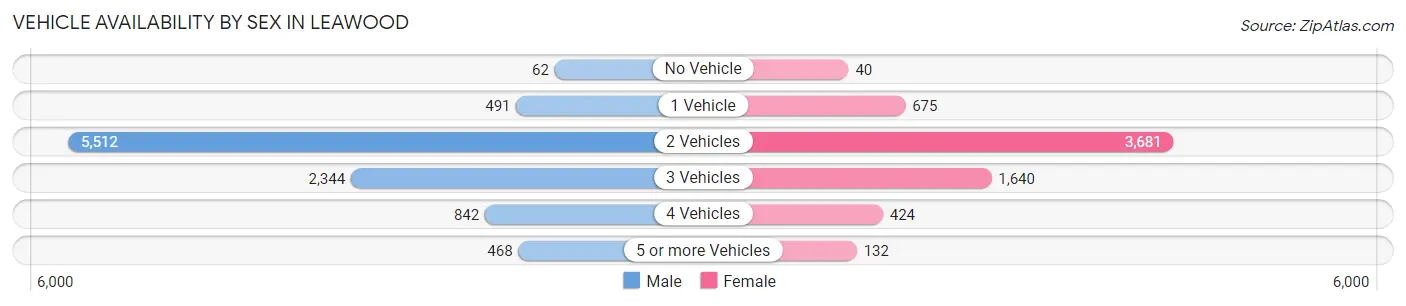
Vehicle Availability by Sex in Leawood
The most prevalent vehicle ownership categories in Leawood are males with 2 vehicles (5,512, accounting for 56.7%) and females with 2 vehicles (3,681, making up 83.6%).
| Vehicles Available | Male | Female |
| No Vehicle | 62 (0.6%) | 40 (0.6%) |
| 1 Vehicle | 491 (5.1%) | 675 (10.2%) |
| 2 Vehicles | 5,512 (56.7%) | 3,681 (55.8%) |
| 3 Vehicles | 2,344 (24.1%) | 1,640 (24.9%) |
| 4 Vehicles | 842 (8.7%) | 424 (6.4%) |
| 5 or more Vehicles | 468 (4.8%) | 132 (2.0%) |
| Total | 9,719 (100.0%) | 6,592 (100.0%) |
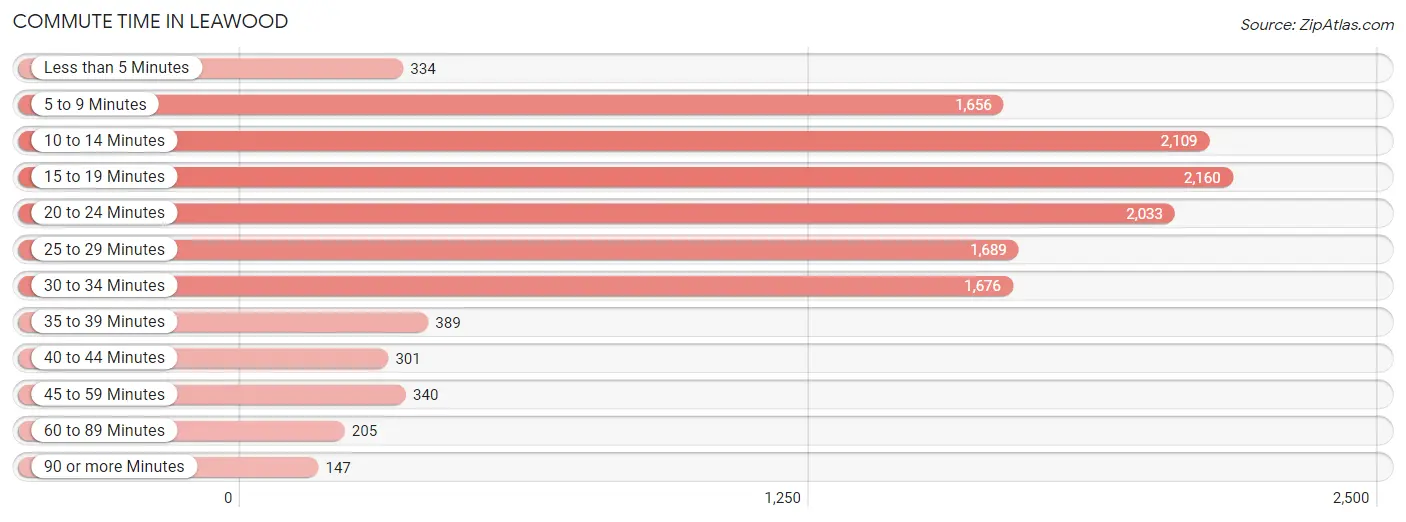
Commute Time in Leawood
The most frequently occuring commute durations in Leawood are 15 to 19 minutes (2,160 commuters, 16.6%), 10 to 14 minutes (2,109 commuters, 16.2%), and 20 to 24 minutes (2,033 commuters, 15.6%).
| Commute Time | # Commuters | % Commuters |
| Less than 5 Minutes | 334 | 2.6% |
| 5 to 9 Minutes | 1,656 | 12.7% |
| 10 to 14 Minutes | 2,109 | 16.2% |
| 15 to 19 Minutes | 2,160 | 16.6% |
| 20 to 24 Minutes | 2,033 | 15.6% |
| 25 to 29 Minutes | 1,689 | 13.0% |
| 30 to 34 Minutes | 1,676 | 12.9% |
| 35 to 39 Minutes | 389 | 3.0% |
| 40 to 44 Minutes | 301 | 2.3% |
| 45 to 59 Minutes | 340 | 2.6% |
| 60 to 89 Minutes | 205 | 1.6% |
| 90 or more Minutes | 147 | 1.1% |
Commute Time by Sex in Leawood
The most common commute times in Leawood are 20 to 24 minutes (1,354 commuters, 17.5%) for males and 10 to 14 minutes (1,079 commuters, 20.3%) for females.
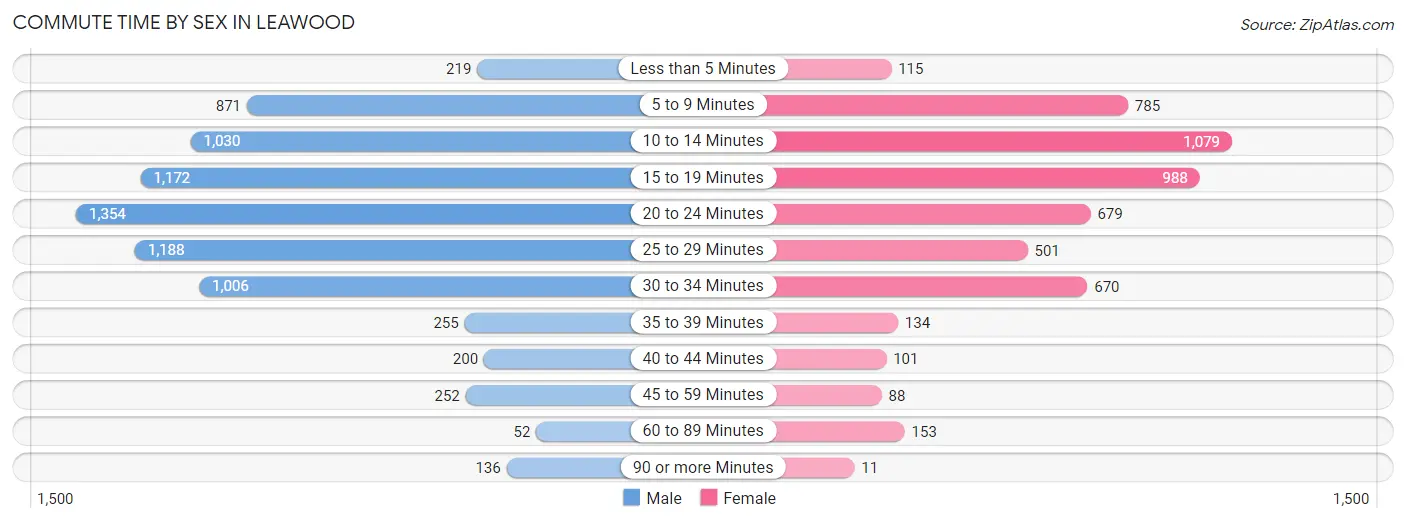
| Commute Time | Male | Female |
| Less than 5 Minutes | 219 (2.8%) | 115 (2.2%) |
| 5 to 9 Minutes | 871 (11.3%) | 785 (14.8%) |
| 10 to 14 Minutes | 1,030 (13.3%) | 1,079 (20.3%) |
| 15 to 19 Minutes | 1,172 (15.1%) | 988 (18.6%) |
| 20 to 24 Minutes | 1,354 (17.5%) | 679 (12.8%) |
| 25 to 29 Minutes | 1,188 (15.4%) | 501 (9.5%) |
| 30 to 34 Minutes | 1,006 (13.0%) | 670 (12.6%) |
| 35 to 39 Minutes | 255 (3.3%) | 134 (2.5%) |
| 40 to 44 Minutes | 200 (2.6%) | 101 (1.9%) |
| 45 to 59 Minutes | 252 (3.3%) | 88 (1.7%) |
| 60 to 89 Minutes | 52 (0.7%) | 153 (2.9%) |
| 90 or more Minutes | 136 (1.8%) | 11 (0.2%) |
Time of Departure to Work by Sex in Leawood
The most frequent times of departure to work in Leawood are 7:30 AM to 7:59 AM (1,665, 21.5%) for males and 7:30 AM to 7:59 AM (1,151, 21.7%) for females.
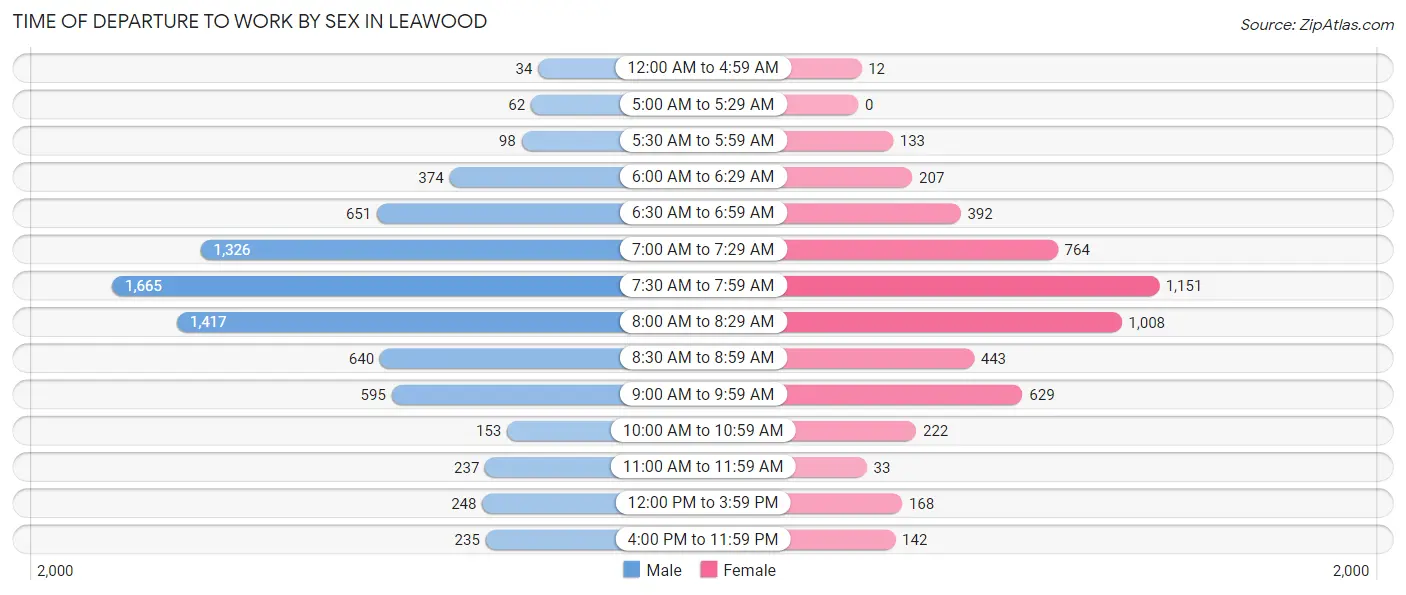
| Time of Departure | Male | Female |
| 12:00 AM to 4:59 AM | 34 (0.4%) | 12 (0.2%) |
| 5:00 AM to 5:29 AM | 62 (0.8%) | 0 (0.0%) |
| 5:30 AM to 5:59 AM | 98 (1.3%) | 133 (2.5%) |
| 6:00 AM to 6:29 AM | 374 (4.8%) | 207 (3.9%) |
| 6:30 AM to 6:59 AM | 651 (8.4%) | 392 (7.4%) |
| 7:00 AM to 7:29 AM | 1,326 (17.1%) | 764 (14.4%) |
| 7:30 AM to 7:59 AM | 1,665 (21.5%) | 1,151 (21.7%) |
| 8:00 AM to 8:29 AM | 1,417 (18.3%) | 1,008 (19.0%) |
| 8:30 AM to 8:59 AM | 640 (8.3%) | 443 (8.4%) |
| 9:00 AM to 9:59 AM | 595 (7.7%) | 629 (11.9%) |
| 10:00 AM to 10:59 AM | 153 (2.0%) | 222 (4.2%) |
| 11:00 AM to 11:59 AM | 237 (3.1%) | 33 (0.6%) |
| 12:00 PM to 3:59 PM | 248 (3.2%) | 168 (3.2%) |
| 4:00 PM to 11:59 PM | 235 (3.0%) | 142 (2.7%) |
| Total | 7,735 (100.0%) | 5,304 (100.0%) |
Housing Occupancy in Leawood
Occupancy by Ownership in Leawood
Of the total 13,304 dwellings in Leawood, owner-occupied units account for 12,105 (91.0%), while renter-occupied units make up 1,199 (9.0%).
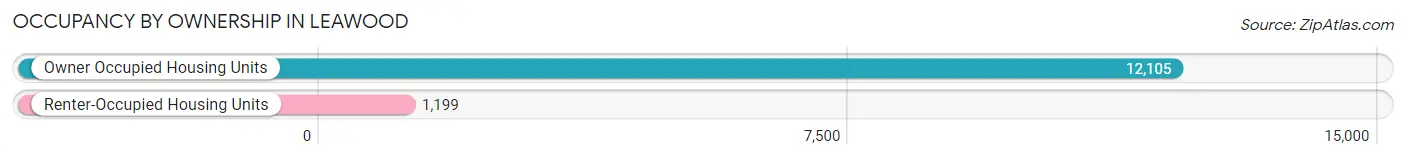
| Occupancy | # Housing Units | % Housing Units |
| Owner Occupied Housing Units | 12,105 | 91.0% |
| Renter-Occupied Housing Units | 1,199 | 9.0% |
| Total Occupied Housing Units | 13,304 | 100.0% |
Occupancy by Household Size in Leawood
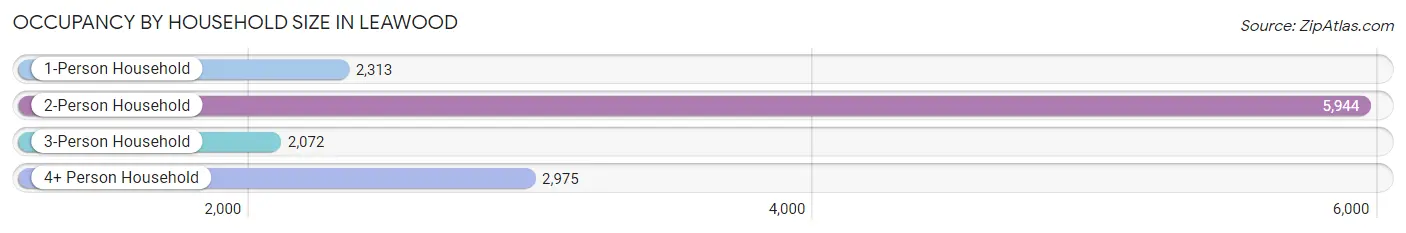
| Household Size | # Housing Units | % Housing Units |
| 1-Person Household | 2,313 | 17.4% |
| 2-Person Household | 5,944 | 44.7% |
| 3-Person Household | 2,072 | 15.6% |
| 4+ Person Household | 2,975 | 22.4% |
| Total Housing Units | 13,304 | 100.0% |
Occupancy by Ownership by Household Size in Leawood
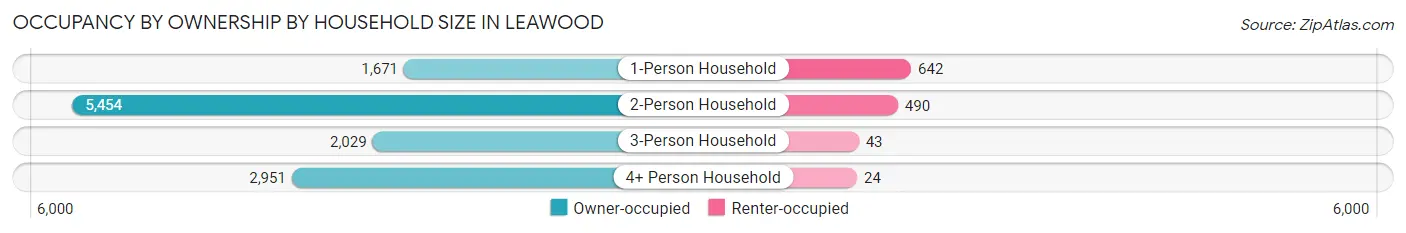
| Household Size | Owner-occupied | Renter-occupied |
| 1-Person Household | 1,671 (72.2%) | 642 (27.8%) |
| 2-Person Household | 5,454 (91.8%) | 490 (8.2%) |
| 3-Person Household | 2,029 (97.9%) | 43 (2.1%) |
| 4+ Person Household | 2,951 (99.2%) | 24 (0.8%) |
| Total Housing Units | 12,105 (91.0%) | 1,199 (9.0%) |
Occupancy by Educational Attainment in Leawood
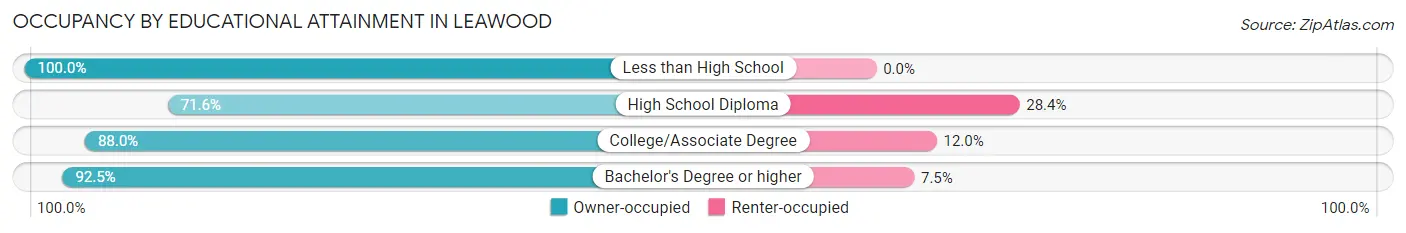
| Household Size | Owner-occupied | Renter-occupied |
| Less than High School | 66 (100.0%) | 0 (0.0%) |
| High School Diploma | 366 (71.6%) | 145 (28.4%) |
| College/Associate Degree | 1,941 (88.0%) | 264 (12.0%) |
| Bachelor's Degree or higher | 9,732 (92.5%) | 790 (7.5%) |
Occupancy by Age of Householder in Leawood
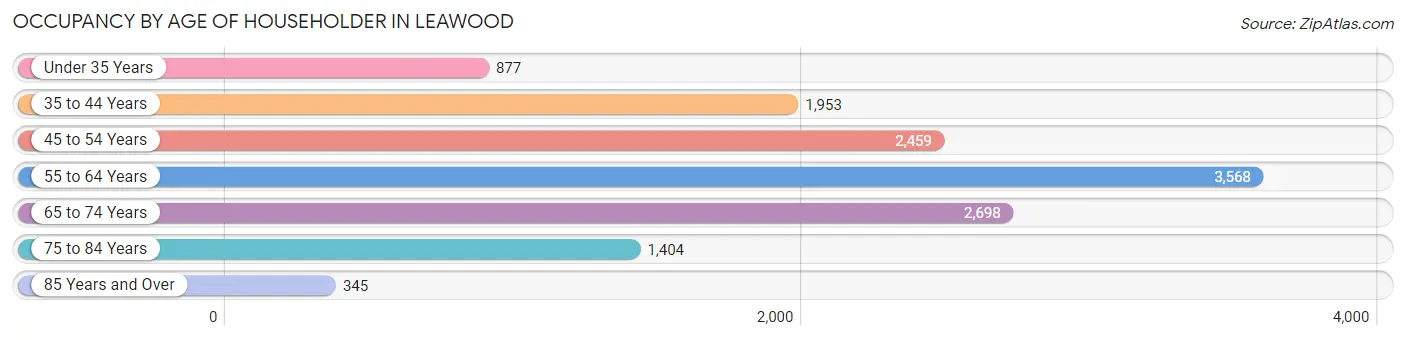
| Age Bracket | # Households | % Households |
| Under 35 Years | 877 | 6.6% |
| 35 to 44 Years | 1,953 | 14.7% |
| 45 to 54 Years | 2,459 | 18.5% |
| 55 to 64 Years | 3,568 | 26.8% |
| 65 to 74 Years | 2,698 | 20.3% |
| 75 to 84 Years | 1,404 | 10.5% |
| 85 Years and Over | 345 | 2.6% |
| Total | 13,304 | 100.0% |
Housing Finances in Leawood
Median Income by Occupancy in Leawood
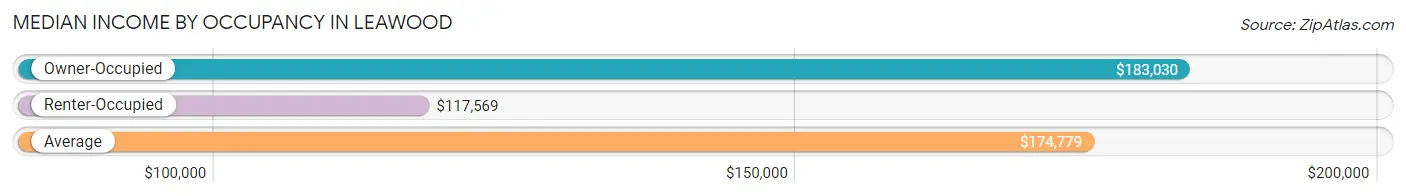
| Occupancy Type | # Households | Median Income |
| Owner-Occupied | 12,105 (91.0%) | $183,030 |
| Renter-Occupied | 1,199 (9.0%) | $117,569 |
| Average | 13,304 (100.0%) | $174,779 |
Occupancy by Householder Income Bracket in Leawood
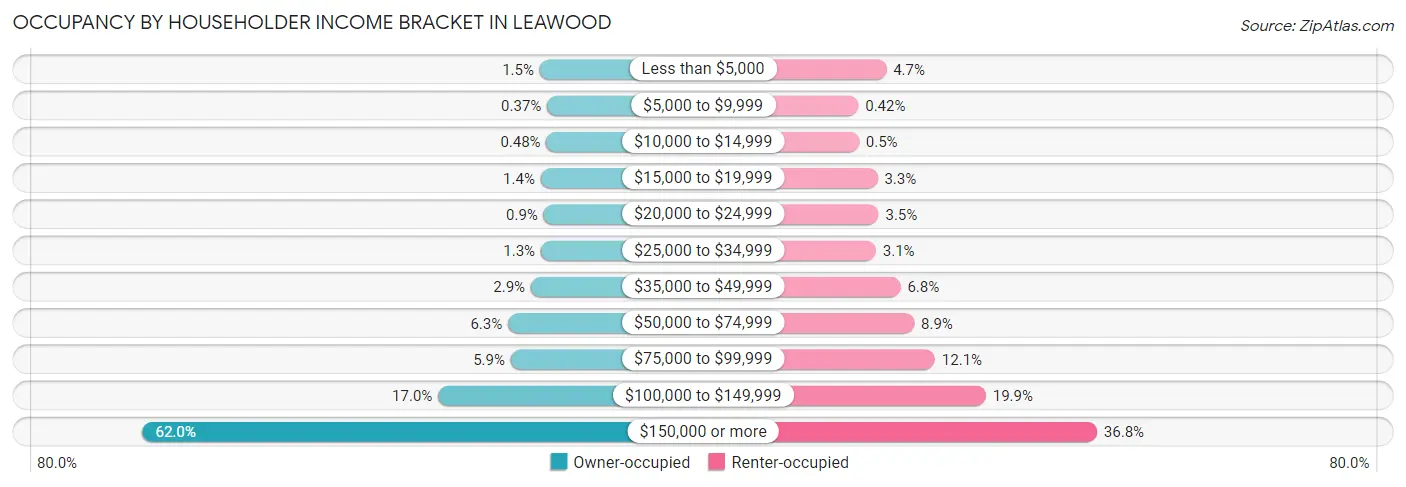
| Income Bracket | Owner-occupied | Renter-occupied |
| Less than $5,000 | 180 (1.5%) | 56 (4.7%) |
| $5,000 to $9,999 | 45 (0.4%) | 5 (0.4%) |
| $10,000 to $14,999 | 58 (0.5%) | 6 (0.5%) |
| $15,000 to $19,999 | 163 (1.3%) | 40 (3.3%) |
| $20,000 to $24,999 | 109 (0.9%) | 42 (3.5%) |
| $25,000 to $34,999 | 160 (1.3%) | 37 (3.1%) |
| $35,000 to $49,999 | 345 (2.9%) | 82 (6.8%) |
| $50,000 to $74,999 | 766 (6.3%) | 107 (8.9%) |
| $75,000 to $99,999 | 716 (5.9%) | 145 (12.1%) |
| $100,000 to $149,999 | 2,055 (17.0%) | 238 (19.9%) |
| $150,000 or more | 7,508 (62.0%) | 441 (36.8%) |
| Total | 12,105 (100.0%) | 1,199 (100.0%) |
Monthly Housing Cost Tiers in Leawood
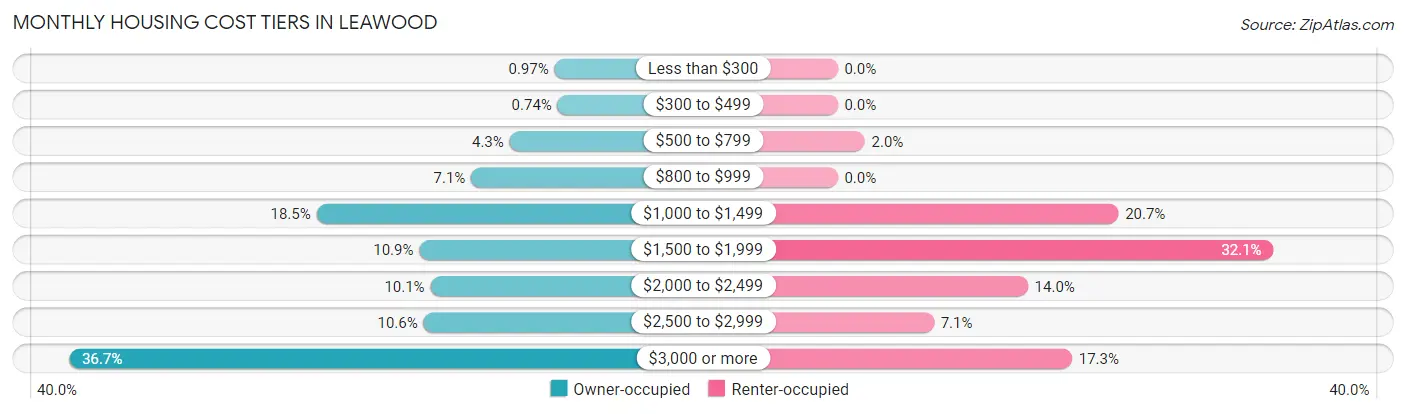
| Monthly Cost | Owner-occupied | Renter-occupied |
| Less than $300 | 118 (1.0%) | 0 (0.0%) |
| $300 to $499 | 89 (0.7%) | 0 (0.0%) |
| $500 to $799 | 518 (4.3%) | 24 (2.0%) |
| $800 to $999 | 861 (7.1%) | 0 (0.0%) |
| $1,000 to $1,499 | 2,240 (18.5%) | 248 (20.7%) |
| $1,500 to $1,999 | 1,323 (10.9%) | 385 (32.1%) |
| $2,000 to $2,499 | 1,224 (10.1%) | 168 (14.0%) |
| $2,500 to $2,999 | 1,286 (10.6%) | 85 (7.1%) |
| $3,000 or more | 4,446 (36.7%) | 207 (17.3%) |
| Total | 12,105 (100.0%) | 1,199 (100.0%) |
Physical Housing Characteristics in Leawood
Housing Structures in Leawood
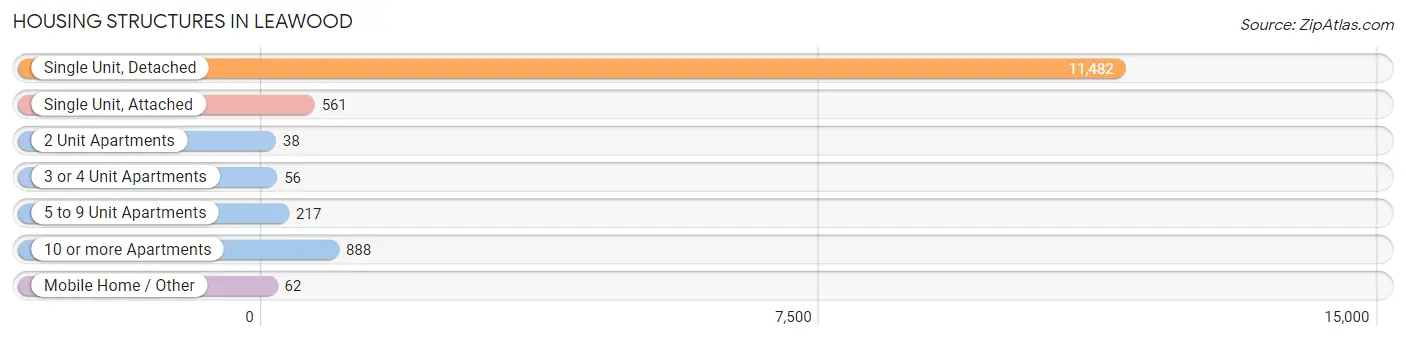
| Structure Type | # Housing Units | % Housing Units |
| Single Unit, Detached | 11,482 | 86.3% |
| Single Unit, Attached | 561 | 4.2% |
| 2 Unit Apartments | 38 | 0.3% |
| 3 or 4 Unit Apartments | 56 | 0.4% |
| 5 to 9 Unit Apartments | 217 | 1.6% |
| 10 or more Apartments | 888 | 6.7% |
| Mobile Home / Other | 62 | 0.5% |
| Total | 13,304 | 100.0% |
Housing Structures by Occupancy in Leawood
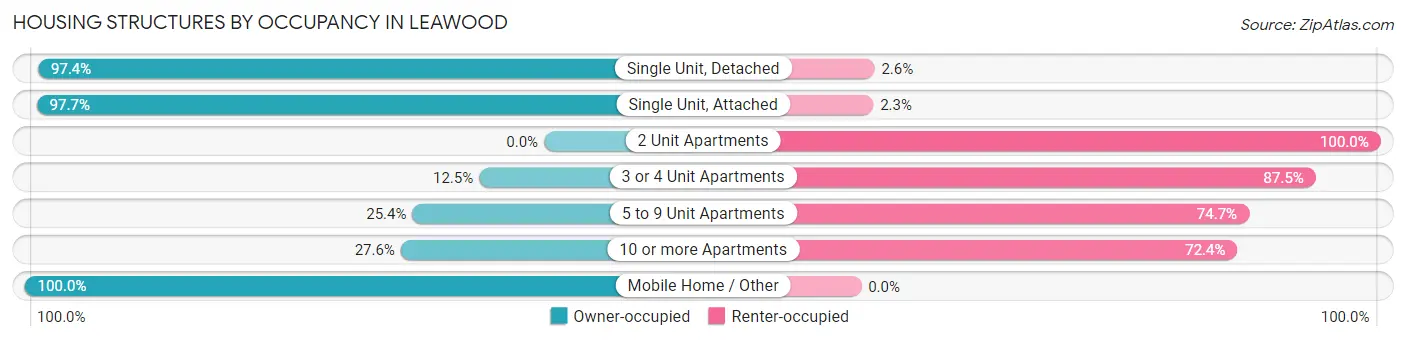
| Structure Type | Owner-occupied | Renter-occupied |
| Single Unit, Detached | 11,188 (97.4%) | 294 (2.6%) |
| Single Unit, Attached | 548 (97.7%) | 13 (2.3%) |
| 2 Unit Apartments | 0 (0.0%) | 38 (100.0%) |
| 3 or 4 Unit Apartments | 7 (12.5%) | 49 (87.5%) |
| 5 to 9 Unit Apartments | 55 (25.4%) | 162 (74.7%) |
| 10 or more Apartments | 245 (27.6%) | 643 (72.4%) |
| Mobile Home / Other | 62 (100.0%) | 0 (0.0%) |
| Total | 12,105 (91.0%) | 1,199 (9.0%) |
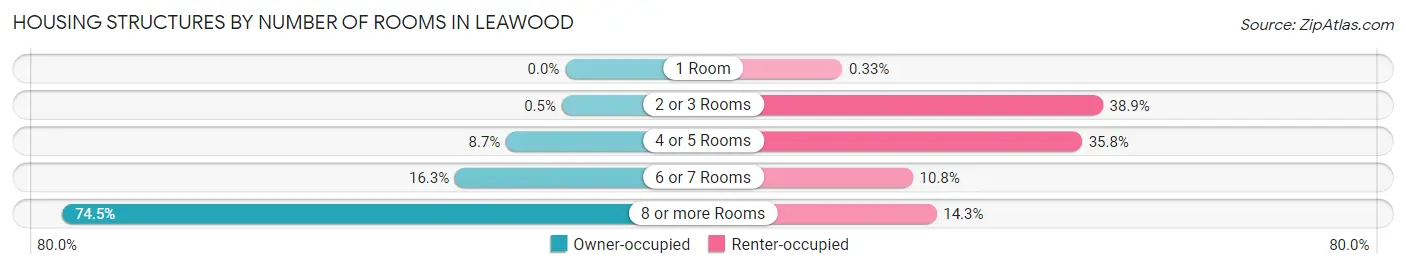
Housing Structures by Number of Rooms in Leawood
| Number of Rooms | Owner-occupied | Renter-occupied |
| 1 Room | 0 (0.0%) | 4 (0.3%) |
| 2 or 3 Rooms | 60 (0.5%) | 466 (38.9%) |
| 4 or 5 Rooms | 1,058 (8.7%) | 429 (35.8%) |
| 6 or 7 Rooms | 1,973 (16.3%) | 129 (10.8%) |
| 8 or more Rooms | 9,014 (74.5%) | 171 (14.3%) |
| Total | 12,105 (100.0%) | 1,199 (100.0%) |
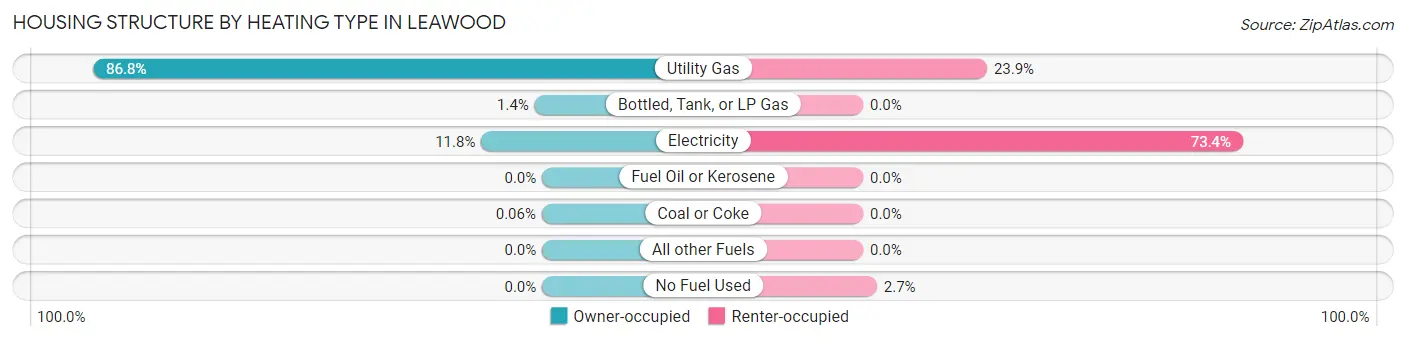
Housing Structure by Heating Type in Leawood
| Heating Type | Owner-occupied | Renter-occupied |
| Utility Gas | 10,502 (86.8%) | 287 (23.9%) |
| Bottled, Tank, or LP Gas | 173 (1.4%) | 0 (0.0%) |
| Electricity | 1,423 (11.8%) | 880 (73.4%) |
| Fuel Oil or Kerosene | 0 (0.0%) | 0 (0.0%) |
| Coal or Coke | 7 (0.1%) | 0 (0.0%) |
| All other Fuels | 0 (0.0%) | 0 (0.0%) |
| No Fuel Used | 0 (0.0%) | 32 (2.7%) |
| Total | 12,105 (100.0%) | 1,199 (100.0%) |
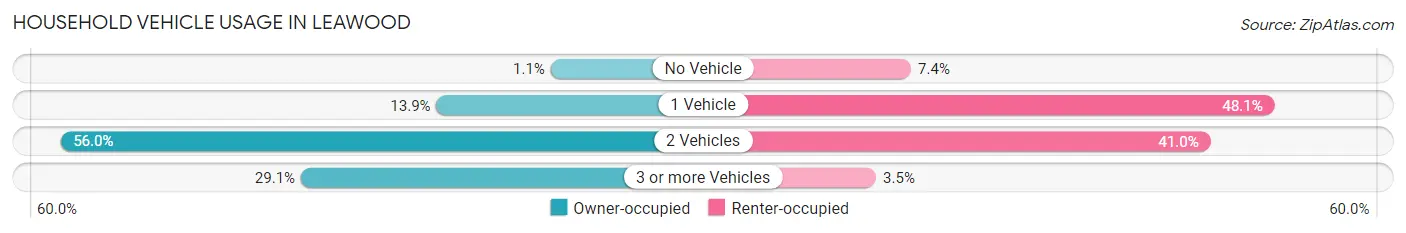
Household Vehicle Usage in Leawood
| Vehicles per Household | Owner-occupied | Renter-occupied |
| No Vehicle | 130 (1.1%) | 89 (7.4%) |
| 1 Vehicle | 1,679 (13.9%) | 577 (48.1%) |
| 2 Vehicles | 6,780 (56.0%) | 491 (40.9%) |
| 3 or more Vehicles | 3,516 (29.0%) | 42 (3.5%) |
| Total | 12,105 (100.0%) | 1,199 (100.0%) |
Real Estate & Mortgages in Leawood
Real Estate and Mortgage Overview in Leawood
| Characteristic | Without Mortgage | With Mortgage |
| Housing Units | 4,320 | 7,785 |
| Median Property Value | $568,200 | $606,800 |
| Median Household Income | $138,289 | $5,482 |
| Monthly Housing Costs | $1,132 | $4,368 |
| Real Estate Taxes | $6,519 | $38 |
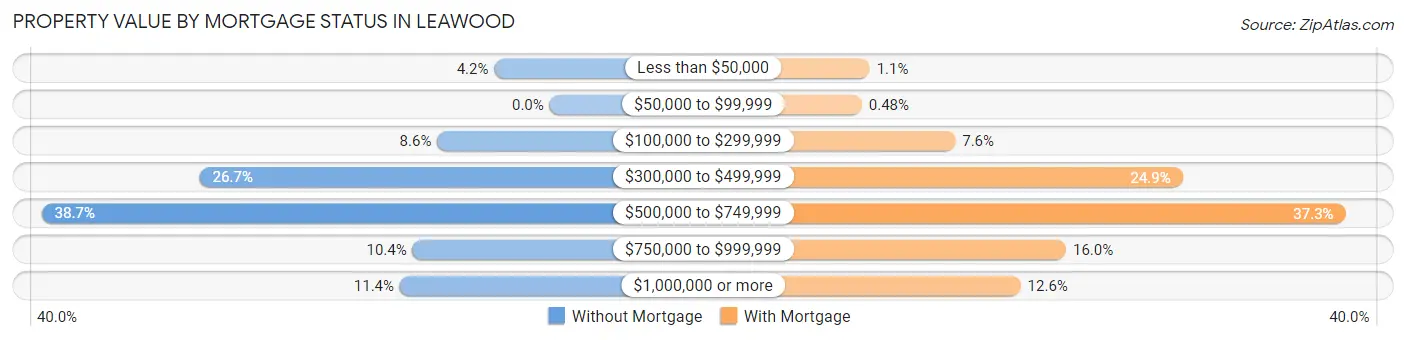
Property Value by Mortgage Status in Leawood
| Property Value | Without Mortgage | With Mortgage |
| Less than $50,000 | 182 (4.2%) | 84 (1.1%) |
| $50,000 to $99,999 | 0 (0.0%) | 37 (0.5%) |
| $100,000 to $299,999 | 370 (8.6%) | 592 (7.6%) |
| $300,000 to $499,999 | 1,152 (26.7%) | 1,939 (24.9%) |
| $500,000 to $749,999 | 1,672 (38.7%) | 2,905 (37.3%) |
| $750,000 to $999,999 | 451 (10.4%) | 1,249 (16.0%) |
| $1,000,000 or more | 493 (11.4%) | 979 (12.6%) |
| Total | 4,320 (100.0%) | 7,785 (100.0%) |
Household Income by Mortgage Status in Leawood
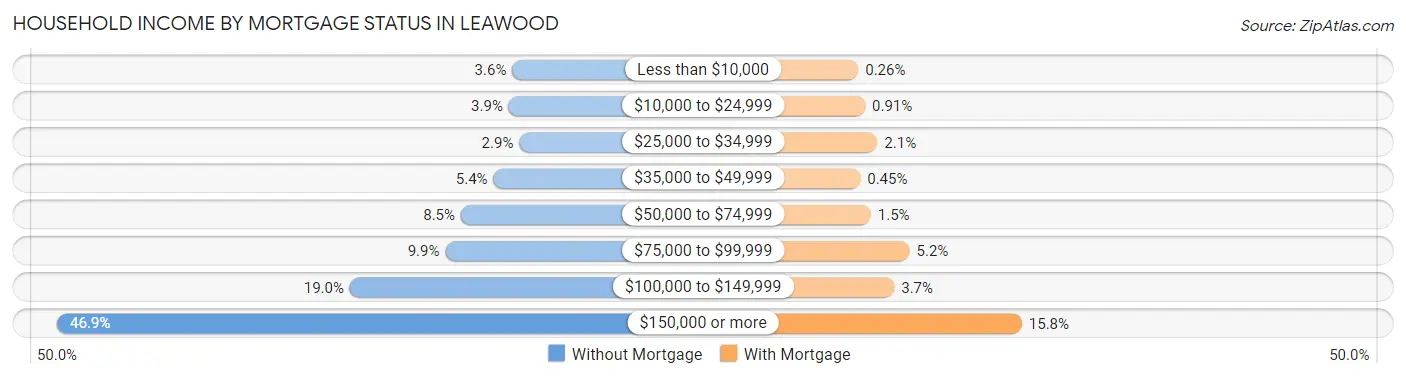
| Household Income | Without Mortgage | With Mortgage |
| Less than $10,000 | 154 (3.6%) | 20 (0.3%) |
| $10,000 to $24,999 | 168 (3.9%) | 71 (0.9%) |
| $25,000 to $34,999 | 125 (2.9%) | 162 (2.1%) |
| $35,000 to $49,999 | 231 (5.3%) | 35 (0.4%) |
| $50,000 to $74,999 | 365 (8.5%) | 114 (1.5%) |
| $75,000 to $99,999 | 429 (9.9%) | 401 (5.1%) |
| $100,000 to $149,999 | 822 (19.0%) | 287 (3.7%) |
| $150,000 or more | 2,026 (46.9%) | 1,233 (15.8%) |
| Total | 4,320 (100.0%) | 7,785 (100.0%) |
Property Value to Household Income Ratio in Leawood
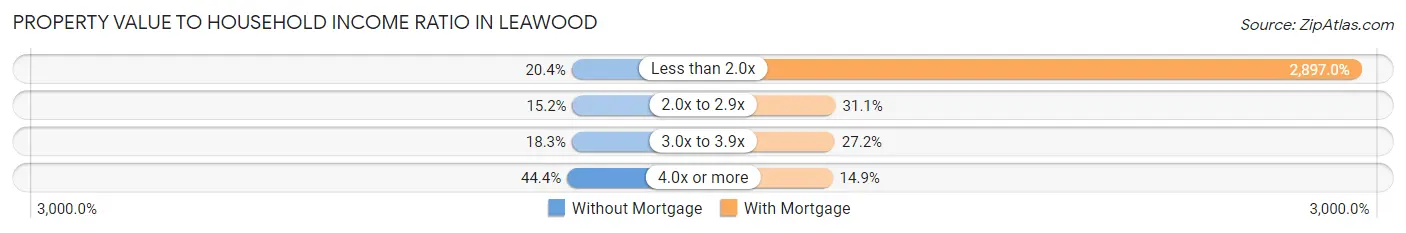
| Value-to-Income Ratio | Without Mortgage | With Mortgage |
| Less than 2.0x | 879 (20.3%) | 225,532 (2,897.0%) |
| 2.0x to 2.9x | 655 (15.2%) | 2,419 (31.1%) |
| 3.0x to 3.9x | 790 (18.3%) | 2,116 (27.2%) |
| 4.0x or more | 1,920 (44.4%) | 1,161 (14.9%) |
| Total | 4,320 (100.0%) | 7,785 (100.0%) |
Real Estate Taxes by Mortgage Status in Leawood
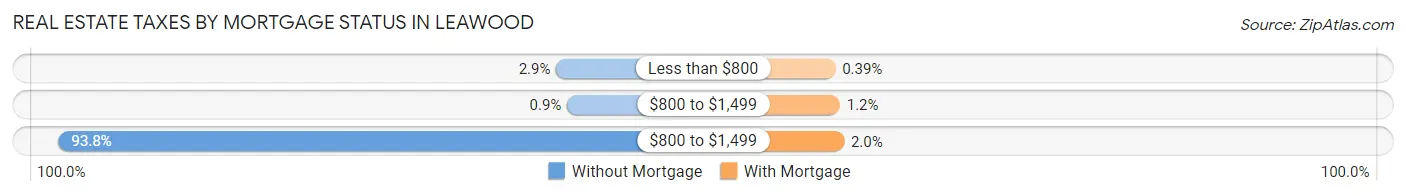
| Property Taxes | Without Mortgage | With Mortgage |
| Less than $800 | 125 (2.9%) | 30 (0.4%) |
| $800 to $1,499 | 39 (0.9%) | 96 (1.2%) |
| $800 to $1,499 | 4,053 (93.8%) | 155 (2.0%) |
| Total | 4,320 (100.0%) | 7,785 (100.0%) |
Health & Disability in Leawood
Health Insurance Coverage by Age in Leawood
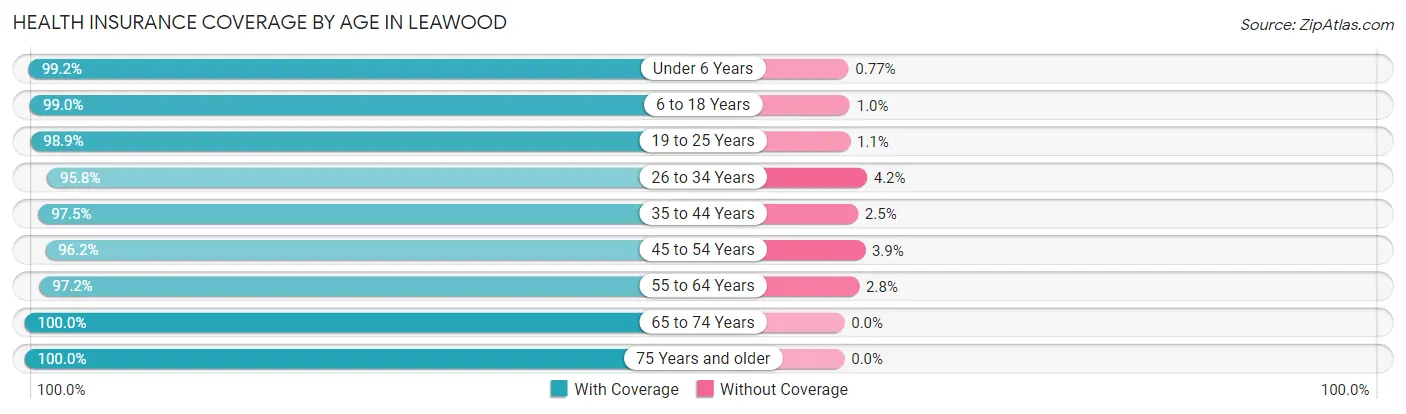
| Age Bracket | With Coverage | Without Coverage |
| Under 6 Years | 2,058 (99.2%) | 16 (0.8%) |
| 6 to 18 Years | 5,614 (99.0%) | 58 (1.0%) |
| 19 to 25 Years | 1,476 (98.9%) | 16 (1.1%) |
| 26 to 34 Years | 2,011 (95.8%) | 88 (4.2%) |
| 35 to 44 Years | 3,841 (97.5%) | 100 (2.5%) |
| 45 to 54 Years | 4,519 (96.2%) | 181 (3.8%) |
| 55 to 64 Years | 6,379 (97.2%) | 182 (2.8%) |
| 65 to 74 Years | 4,639 (100.0%) | 0 (0.0%) |
| 75 Years and older | 2,568 (100.0%) | 0 (0.0%) |
| Total | 33,105 (98.1%) | 641 (1.9%) |
Health Insurance Coverage by Citizenship Status in Leawood
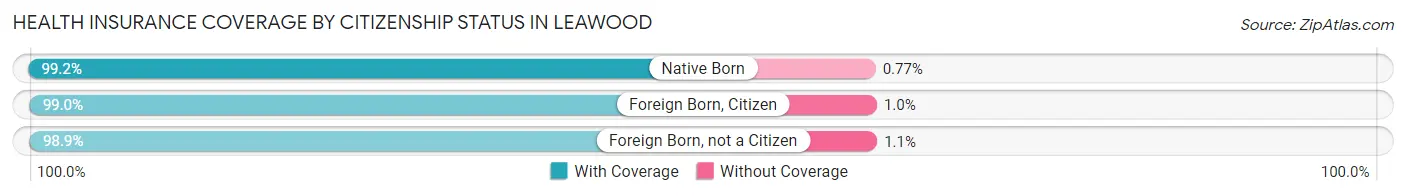
| Citizenship Status | With Coverage | Without Coverage |
| Native Born | 2,058 (99.2%) | 16 (0.8%) |
| Foreign Born, Citizen | 5,614 (99.0%) | 58 (1.0%) |
| Foreign Born, not a Citizen | 1,476 (98.9%) | 16 (1.1%) |
Health Insurance Coverage by Household Income in Leawood
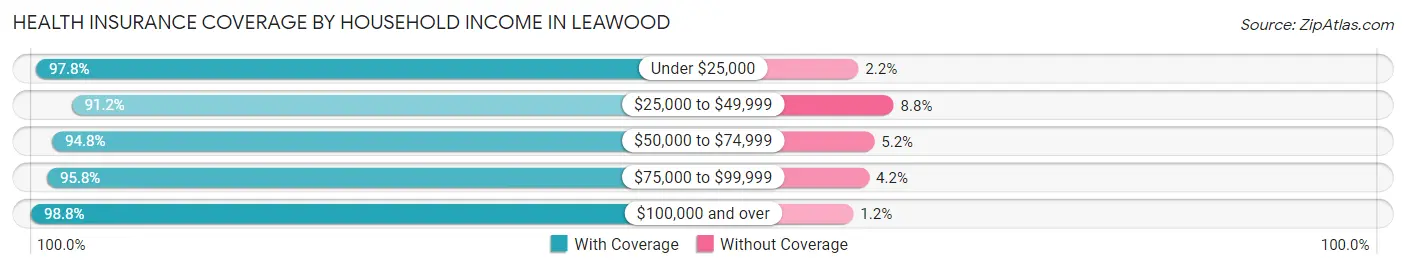
| Household Income | With Coverage | Without Coverage |
| Under $25,000 | 991 (97.8%) | 22 (2.2%) |
| $25,000 to $49,999 | 904 (91.2%) | 87 (8.8%) |
| $50,000 to $74,999 | 1,486 (94.8%) | 81 (5.2%) |
| $75,000 to $99,999 | 2,219 (95.8%) | 97 (4.2%) |
| $100,000 and over | 27,453 (98.8%) | 345 (1.2%) |
Public vs Private Health Insurance Coverage by Age in Leawood
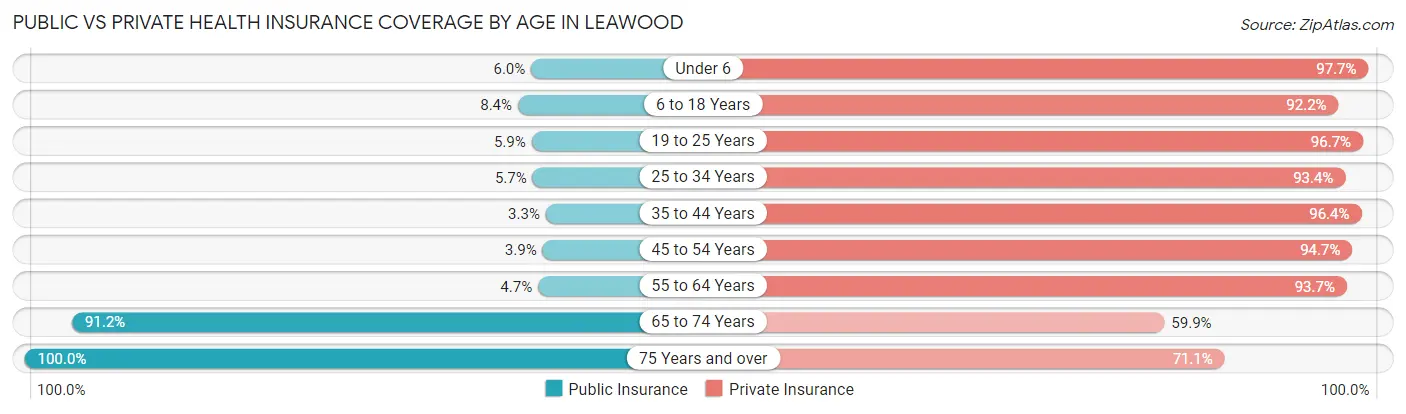
| Age Bracket | Public Insurance | Private Insurance |
| Under 6 | 124 (6.0%) | 2,027 (97.7%) |
| 6 to 18 Years | 479 (8.4%) | 5,228 (92.2%) |
| 19 to 25 Years | 88 (5.9%) | 1,443 (96.7%) |
| 25 to 34 Years | 120 (5.7%) | 1,961 (93.4%) |
| 35 to 44 Years | 129 (3.3%) | 3,800 (96.4%) |
| 45 to 54 Years | 182 (3.9%) | 4,453 (94.7%) |
| 55 to 64 Years | 309 (4.7%) | 6,149 (93.7%) |
| 65 to 74 Years | 4,231 (91.2%) | 2,778 (59.9%) |
| 75 Years and over | 2,568 (100.0%) | 1,825 (71.1%) |
| Total | 8,230 (24.4%) | 29,664 (87.9%) |
Disability Status by Sex by Age in Leawood
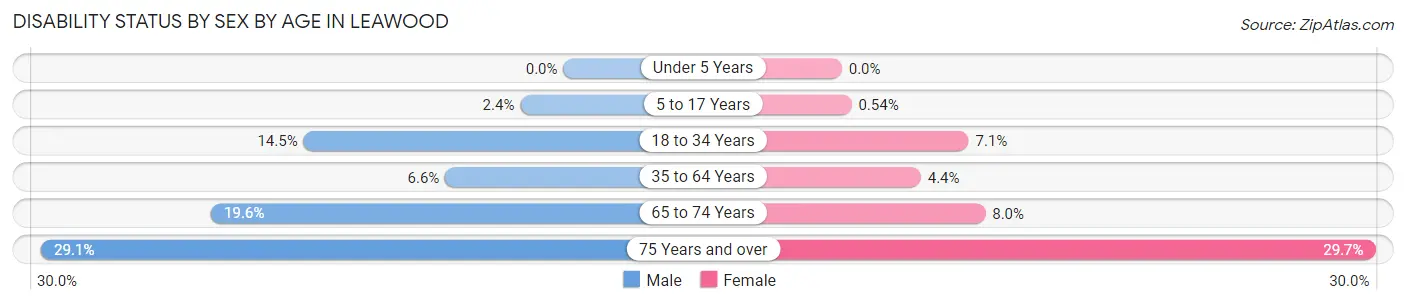
| Age Bracket | Male | Female |
| Under 5 Years | 0 (0.0%) | 0 (0.0%) |
| 5 to 17 Years | 62 (2.4%) | 17 (0.5%) |
| 18 to 34 Years | 301 (14.5%) | 128 (7.1%) |
| 35 to 64 Years | 499 (6.6%) | 335 (4.4%) |
| 65 to 74 Years | 397 (19.6%) | 209 (8.0%) |
| 75 Years and over | 415 (29.1%) | 339 (29.7%) |
Disability Class by Sex by Age in Leawood
Disability Class: Hearing Difficulty
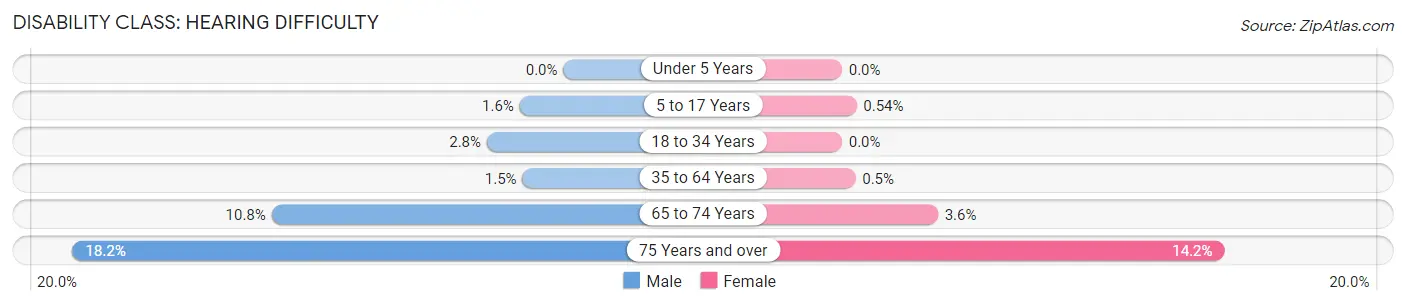
| Age Bracket | Male | Female |
| Under 5 Years | 0 (0.0%) | 0 (0.0%) |
| 5 to 17 Years | 42 (1.6%) | 17 (0.5%) |
| 18 to 34 Years | 59 (2.8%) | 0 (0.0%) |
| 35 to 64 Years | 115 (1.5%) | 38 (0.5%) |
| 65 to 74 Years | 219 (10.8%) | 93 (3.6%) |
| 75 Years and over | 260 (18.2%) | 162 (14.2%) |
Disability Class: Vision Difficulty
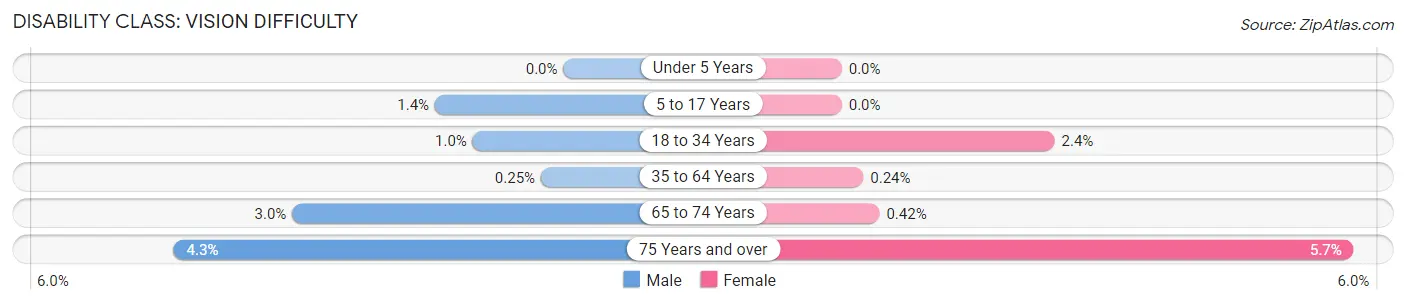
| Age Bracket | Male | Female |
| Under 5 Years | 0 (0.0%) | 0 (0.0%) |
| 5 to 17 Years | 37 (1.4%) | 0 (0.0%) |
| 18 to 34 Years | 21 (1.0%) | 43 (2.4%) |
| 35 to 64 Years | 19 (0.3%) | 18 (0.2%) |
| 65 to 74 Years | 61 (3.0%) | 11 (0.4%) |
| 75 Years and over | 62 (4.3%) | 65 (5.7%) |
Disability Class: Cognitive Difficulty
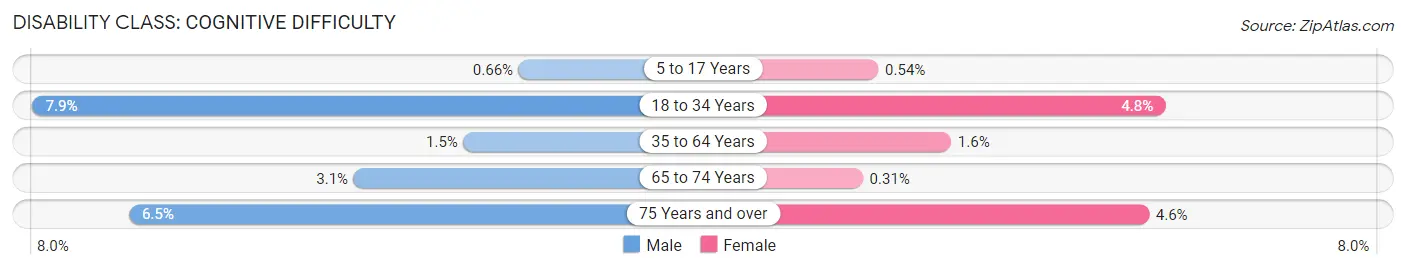
| Age Bracket | Male | Female |
| 5 to 17 Years | 17 (0.7%) | 17 (0.5%) |
| 18 to 34 Years | 164 (7.9%) | 87 (4.8%) |
| 35 to 64 Years | 112 (1.5%) | 123 (1.6%) |
| 65 to 74 Years | 63 (3.1%) | 8 (0.3%) |
| 75 Years and over | 92 (6.5%) | 52 (4.6%) |
Disability Class: Ambulatory Difficulty
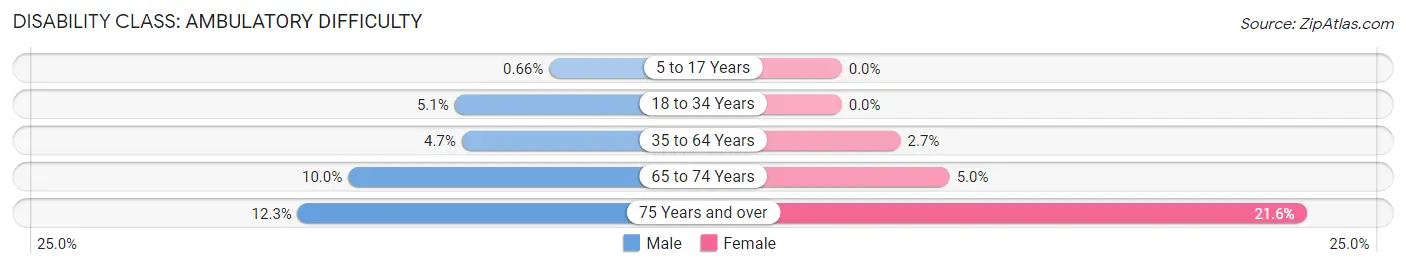
| Age Bracket | Male | Female |
| 5 to 17 Years | 17 (0.7%) | 0 (0.0%) |
| 18 to 34 Years | 105 (5.1%) | 0 (0.0%) |
| 35 to 64 Years | 358 (4.7%) | 208 (2.7%) |
| 65 to 74 Years | 202 (10.0%) | 131 (5.0%) |
| 75 Years and over | 176 (12.3%) | 246 (21.6%) |
Disability Class: Self-Care Difficulty
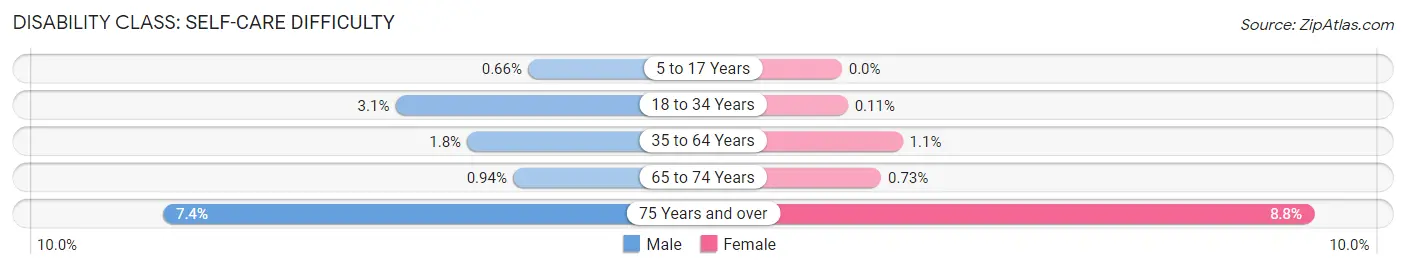
| Age Bracket | Male | Female |
| 5 to 17 Years | 17 (0.7%) | 0 (0.0%) |
| 18 to 34 Years | 65 (3.1%) | 2 (0.1%) |
| 35 to 64 Years | 136 (1.8%) | 86 (1.1%) |
| 65 to 74 Years | 19 (0.9%) | 19 (0.7%) |
| 75 Years and over | 106 (7.4%) | 100 (8.8%) |
Technology Access in Leawood
Computing Device Access in Leawood
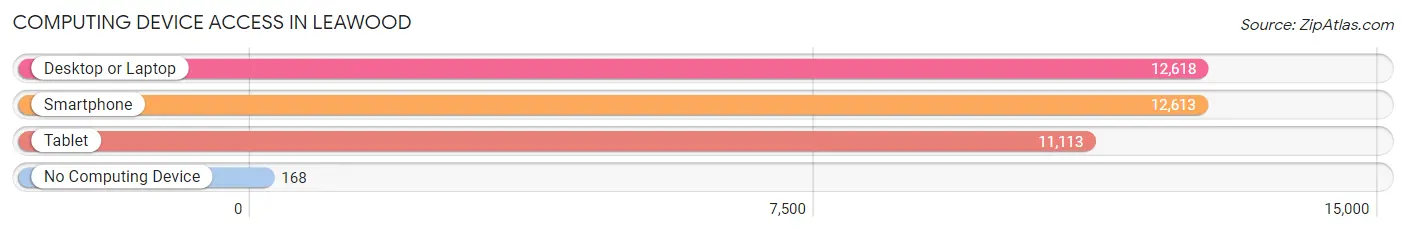
| Device Type | # Households | % Households |
| Desktop or Laptop | 12,618 | 94.8% |
| Smartphone | 12,613 | 94.8% |
| Tablet | 11,113 | 83.5% |
| No Computing Device | 168 | 1.3% |
| Total | 13,304 | 100.0% |
Internet Access in Leawood
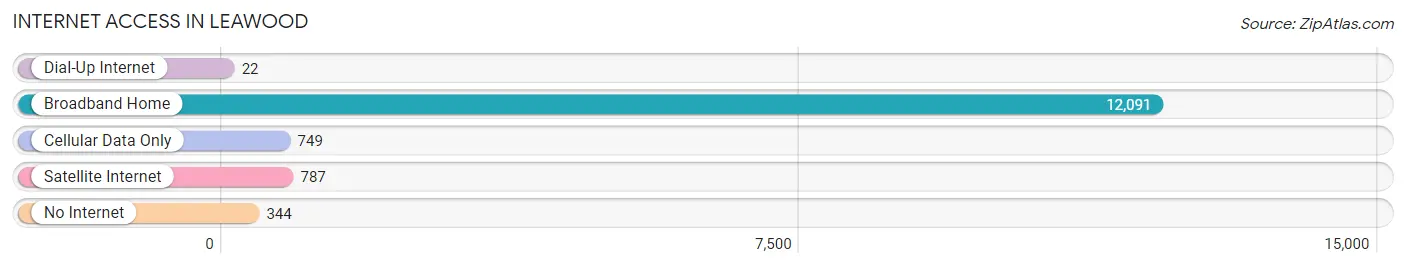
| Internet Type | # Households | % Households |
| Dial-Up Internet | 22 | 0.2% |
| Broadband Home | 12,091 | 90.9% |
| Cellular Data Only | 749 | 5.6% |
| Satellite Internet | 787 | 5.9% |
| No Internet | 344 | 2.6% |
| Total | 13,304 | 100.0% |
Leawood Summary
Leawood, Kansas is a city located in Johnson County, Kansas, United States. It is a suburb of Kansas City, Missouri, and is part of the Kansas City metropolitan area. As of the 2010 census, the city had a population of 32,337.
History
Leawood was founded in 1949 by the late William B. Strang, Jr., who was a prominent Kansas City businessman. Strang purchased the land that would become Leawood from the estate of the late William B. Strang, Sr., who had owned a large tract of land in the area. Strang envisioned a planned community that would be a haven for families and businesses. He named the city after his father, who had been a prominent lawyer in Kansas City.
The first homes in Leawood were built in 1950, and the city was officially incorporated in 1954. Since then, the city has grown steadily, and today it is home to more than 32,000 people.
Geography
Leawood is located in Johnson County, Kansas, at the intersection of Interstate 435 and US Highway 69. It is bordered by the cities of Overland Park to the north, Mission to the east, and Prairie Village to the south. The city covers an area of approximately 11.5 square miles, and is located about 15 miles south of downtown Kansas City, Missouri.
The terrain of Leawood is mostly flat, with some rolling hills in the northern part of the city. The city is located in the Osage Plains region of Kansas, and is part of the larger Kansas City metropolitan area.
Economy
Leawood is a prosperous city, with a strong economy and a low unemployment rate. The city is home to a number of large corporations, including Sprint, Hallmark Cards, and AMC Theatres. The city also has a thriving retail sector, with a number of shopping centers and malls.
The city is also home to a number of small businesses, including restaurants, boutiques, and professional services. The city is also home to a number of medical facilities, including the Leawood Medical Center and the Leawood Surgery Center.
Demographics
As of the 2010 census, the population of Leawood was 32,337. The racial makeup of the city was 87.3% White, 5.2% African American, 0.3% Native American, 4.2% Asian, 0.1% Pacific Islander, 1.2% from other races, and 1.9% from two or more races. Hispanic or Latino of any race were 3.7% of the population.
The median household income in Leawood was $97,845, and the median family income was $112,917. The per capita income for the city was $50,945. About 2.7% of families and 3.7% of the population were below the poverty line, including 4.2% of those under age 18 and 2.2% of those age 65 or over.
Common Questions
What is Per Capita Income in Leawood?
Per Capita income in Leawood is $106,882.
What is the Median Family Income in Leawood?
Median Family Income in Leawood is $202,255.
What is the Median Household income in Leawood?
Median Household Income in Leawood is $174,779.
What is Income or Wage Gap in Leawood?
Income or Wage Gap in Leawood is 60.4%.
Women in Leawood earn 39.6 cents for every dollar earned by a man.
What is Inequality or Gini Index in Leawood?
Inequality or Gini Index in Leawood is 0.46.
What is the Total Population of Leawood?
Total Population of Leawood is 33,784.
What is the Total Male Population of Leawood?
Total Male Population of Leawood is 16,618.
What is the Total Female Population of Leawood?
Total Female Population of Leawood is 17,166.
What is the Ratio of Males per 100 Females in Leawood?
There are 96.81 Males per 100 Females in Leawood.
What is the Ratio of Females per 100 Males in Leawood?
There are 103.30 Females per 100 Males in Leawood.
What is the Median Population Age in Leawood?
Median Population Age in Leawood is 48.8 Years.
What is the Average Family Size in Leawood
Average Family Size in Leawood is 2.9 People.
What is the Average Household Size in Leawood
Average Household Size in Leawood is 2.5 People.
How Large is the Labor Force in Leawood?
There are 17,064 People in the Labor Forcein in Leawood.
What is the Percentage of People in the Labor Force in Leawood?
62.8% of People are in the Labor Force in Leawood.
What is the Unemployment Rate in Leawood?
Unemployment Rate in Leawood is 1.5%.