Lake Helen, FL Map & Demographics
Lake Helen Map
Lake Helen Overview
$31,377
PER CAPITA INCOME
$94,208
AVG FAMILY INCOME
$91,861
AVG HOUSEHOLD INCOME
44.2%
WAGE / INCOME GAP [ % ]
55.8¢/ $1
WAGE / INCOME GAP [ $ ]
0.34
INEQUALITY / GINI INDEX
2,836
TOTAL POPULATION
1,471
MALE POPULATION
1,365
FEMALE POPULATION
107.77
MALES / 100 FEMALES
92.79
FEMALES / 100 MALES
41.1
MEDIAN AGE
3.4
AVG FAMILY SIZE
3.0
AVG HOUSEHOLD SIZE
1,230
LABOR FORCE [ PEOPLE ]
55.9%
PERCENT IN LABOR FORCE
3.9%
UNEMPLOYMENT RATE
Lake Helen Zip Codes
Lake Helen Area Codes
Income in Lake Helen
Income Overview in Lake Helen
Per Capita Income in Lake Helen is $31,377, while median incomes of families and households are $94,208 and $91,861 respectively.
| Characteristic | Number | Measure |
| Per Capita Income | 2,836 | $31,377 |
| Median Family Income | 703 | $94,208 |
| Mean Family Income | 703 | $94,896 |
| Median Household Income | 939 | $91,861 |
| Mean Household Income | 939 | $89,738 |
| Income Deficit | 703 | $0 |
| Wage / Income Gap (%) | 2,836 | 44.24% |
| Wage / Income Gap ($) | 2,836 | 55.76¢ per $1 |
| Gini / Inequality Index | 2,836 | 0.34 |
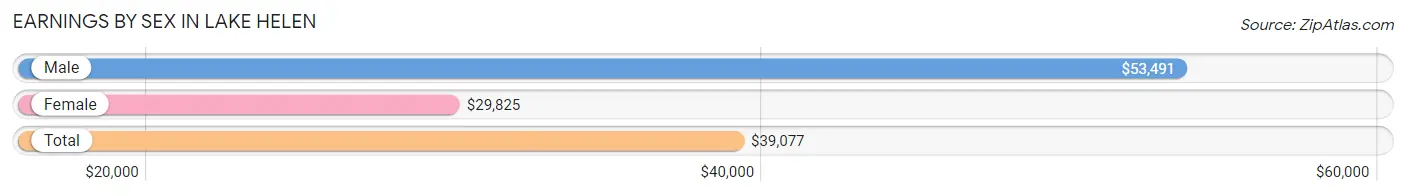
Earnings by Sex in Lake Helen
Average Earnings in Lake Helen are $39,077, $53,491 for men and $29,825 for women, a difference of 44.2%.
| Sex | Number | Average Earnings |
| Male | 773 (59.0%) | $53,491 |
| Female | 537 (41.0%) | $29,825 |
| Total | 1,310 (100.0%) | $39,077 |
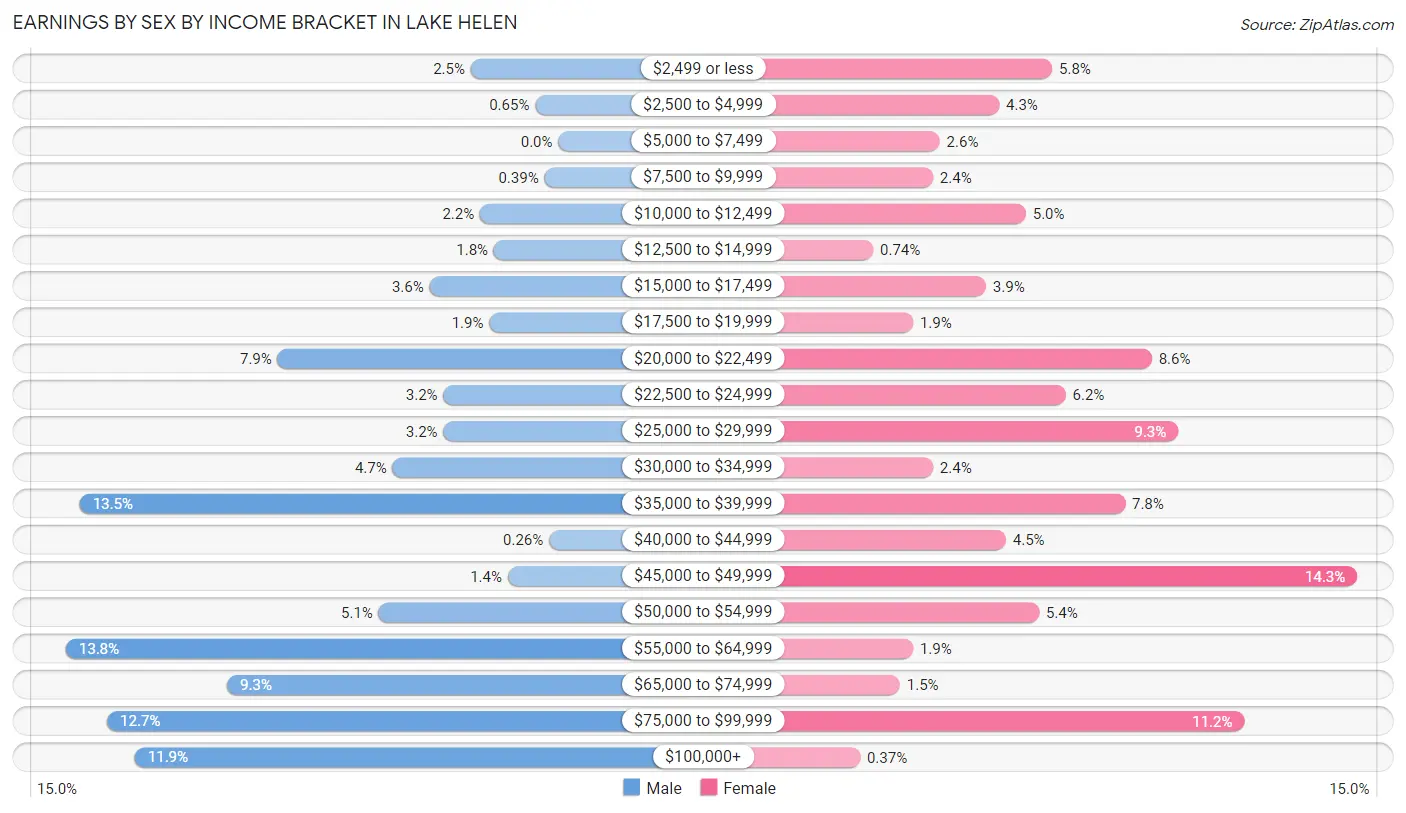
Earnings by Sex by Income Bracket in Lake Helen
The most common earnings brackets in Lake Helen are $55,000 to $64,999 for men (107 | 13.8%) and $45,000 to $49,999 for women (77 | 14.3%).
| Income | Male | Female |
| $2,499 or less | 19 (2.5%) | 31 (5.8%) |
| $2,500 to $4,999 | 5 (0.6%) | 23 (4.3%) |
| $5,000 to $7,499 | 0 (0.0%) | 14 (2.6%) |
| $7,500 to $9,999 | 3 (0.4%) | 13 (2.4%) |
| $10,000 to $12,499 | 17 (2.2%) | 27 (5.0%) |
| $12,500 to $14,999 | 14 (1.8%) | 4 (0.7%) |
| $15,000 to $17,499 | 28 (3.6%) | 21 (3.9%) |
| $17,500 to $19,999 | 15 (1.9%) | 10 (1.9%) |
| $20,000 to $22,499 | 61 (7.9%) | 46 (8.6%) |
| $22,500 to $24,999 | 25 (3.2%) | 33 (6.1%) |
| $25,000 to $29,999 | 25 (3.2%) | 50 (9.3%) |
| $30,000 to $34,999 | 36 (4.7%) | 13 (2.4%) |
| $35,000 to $39,999 | 104 (13.5%) | 42 (7.8%) |
| $40,000 to $44,999 | 2 (0.3%) | 24 (4.5%) |
| $45,000 to $49,999 | 11 (1.4%) | 77 (14.3%) |
| $50,000 to $54,999 | 39 (5.1%) | 29 (5.4%) |
| $55,000 to $64,999 | 107 (13.8%) | 10 (1.9%) |
| $65,000 to $74,999 | 72 (9.3%) | 8 (1.5%) |
| $75,000 to $99,999 | 98 (12.7%) | 60 (11.2%) |
| $100,000+ | 92 (11.9%) | 2 (0.4%) |
| Total | 773 (100.0%) | 537 (100.0%) |
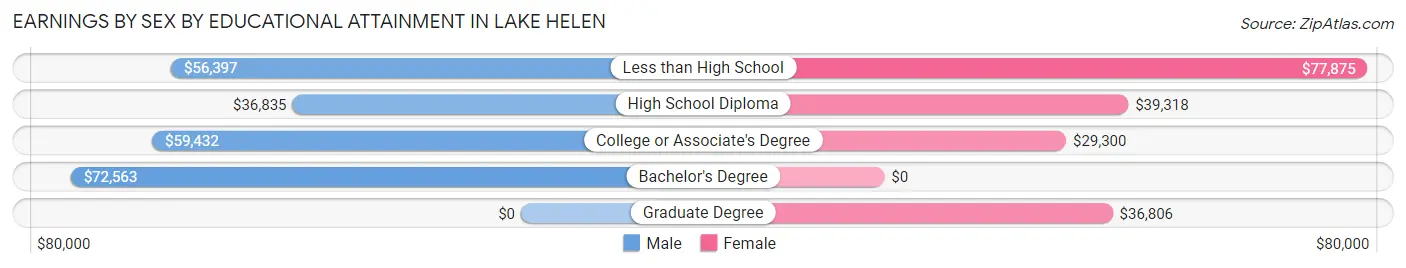
Earnings by Sex by Educational Attainment in Lake Helen
Average earnings in Lake Helen are $56,005 for men and $38,864 for women, a difference of 30.6%. Men with an educational attainment of bachelor's degree enjoy the highest average annual earnings of $72,563, while those with high school diploma education earn the least with $36,835. Women with an educational attainment of less than high school earn the most with the average annual earnings of $77,875, while those with college or associate's degree education have the smallest earnings of $29,300.
| Educational Attainment | Male Income | Female Income |
| Less than High School | $56,397 | $77,875 |
| High School Diploma | $36,835 | $39,318 |
| College or Associate's Degree | $59,432 | $29,300 |
| Bachelor's Degree | $72,563 | $0 |
| Graduate Degree | - | - |
| Total | $56,005 | $38,864 |
Family Income in Lake Helen
Family Income Brackets in Lake Helen
According to the Lake Helen family income data, there are 262 families falling into the $100,000 to $149,999 income range, which is the most common income bracket and makes up 37.3% of all families.
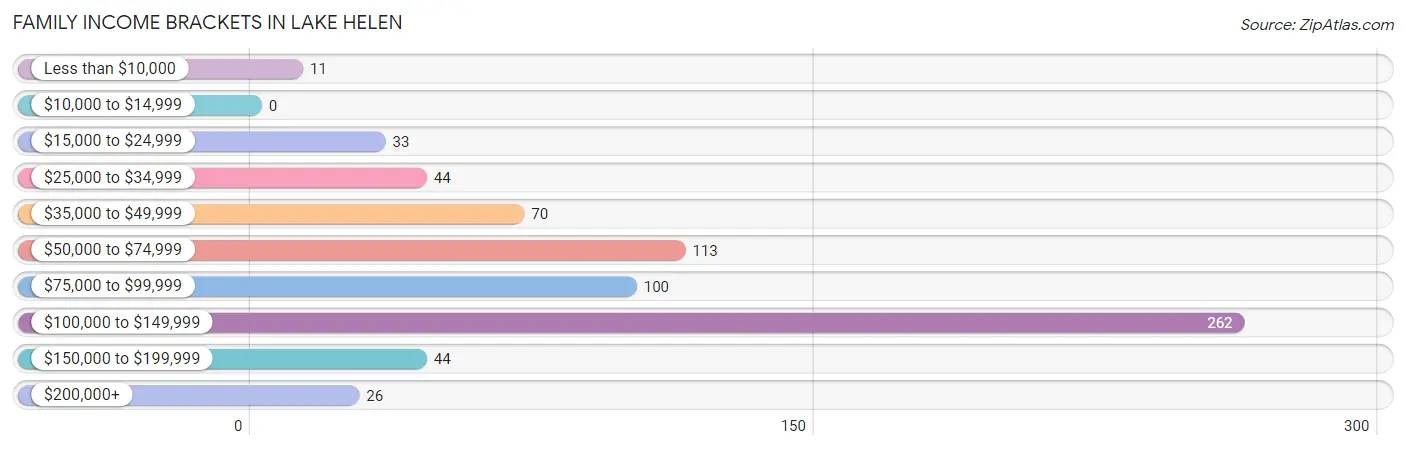
| Income Bracket | # Families | % Families |
| Less than $10,000 | 11 | 1.6% |
| $10,000 to $14,999 | 0 | 0.0% |
| $15,000 to $24,999 | 33 | 4.7% |
| $25,000 to $34,999 | 44 | 6.3% |
| $35,000 to $49,999 | 70 | 10.0% |
| $50,000 to $74,999 | 113 | 16.1% |
| $75,000 to $99,999 | 100 | 14.2% |
| $100,000 to $149,999 | 262 | 37.3% |
| $150,000 to $199,999 | 44 | 6.3% |
| $200,000+ | 26 | 3.7% |
Family Income by Famaliy Size in Lake Helen
4-person families (152 | 21.6%) account for the highest median family income in Lake Helen with $113,750 per family, while 3-person families (117 | 16.6%) have the highest median income of $30,160 per family member.
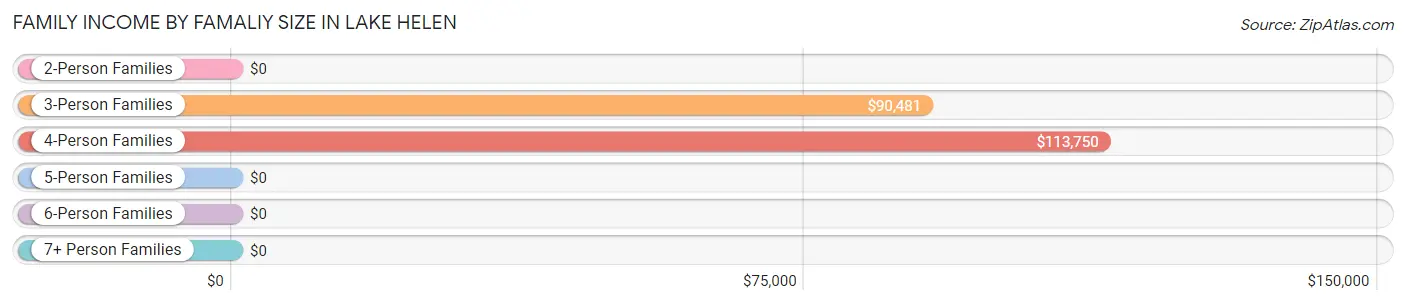
| Income Bracket | # Families | Median Income |
| 2-Person Families | 367 (52.2%) | $0 |
| 3-Person Families | 117 (16.6%) | $90,481 |
| 4-Person Families | 152 (21.6%) | $113,750 |
| 5-Person Families | 13 (1.8%) | $0 |
| 6-Person Families | 0 (0.0%) | $0 |
| 7+ Person Families | 54 (7.7%) | $0 |
| Total | 703 (100.0%) | $94,208 |
Family Income by Number of Earners in Lake Helen
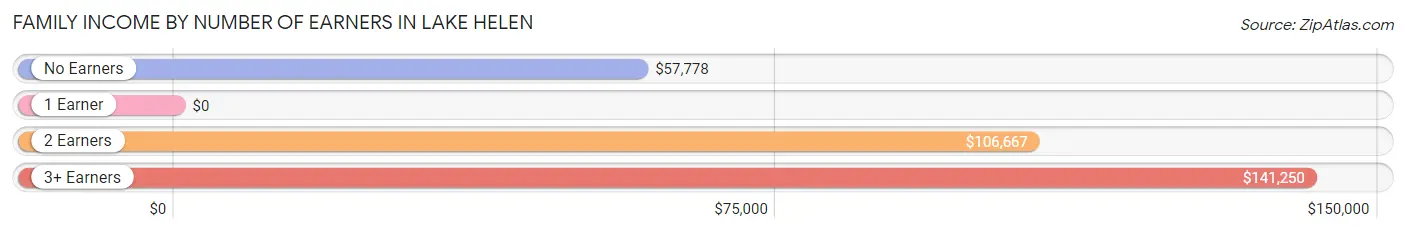
| Number of Earners | # Families | Median Income |
| No Earners | 194 (27.6%) | $57,778 |
| 1 Earner | 205 (29.2%) | $0 |
| 2 Earners | 188 (26.7%) | $106,667 |
| 3+ Earners | 116 (16.5%) | $141,250 |
| Total | 703 (100.0%) | $94,208 |
Household Income in Lake Helen
Household Income Brackets in Lake Helen
With 310 households falling in the category, the $100,000 to $149,999 income range is the most frequent in Lake Helen, accounting for 33.0% of all households. In contrast, only 24 households (2.6%) fall into the less than $10,000 income bracket, making it the least populous group.
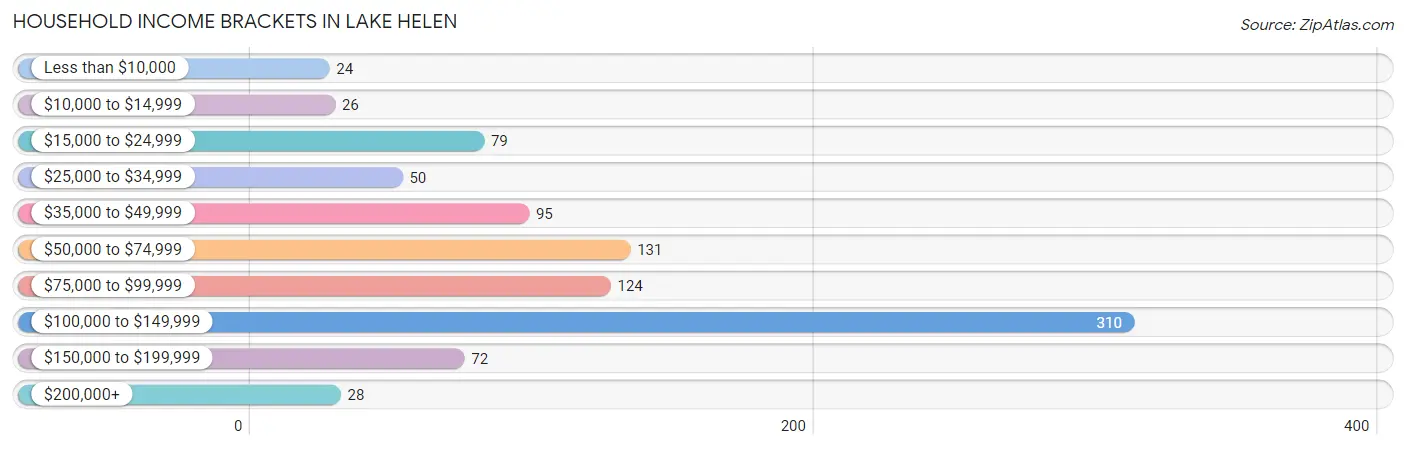
| Income Bracket | # Households | % Households |
| Less than $10,000 | 24 | 2.6% |
| $10,000 to $14,999 | 26 | 2.8% |
| $15,000 to $24,999 | 79 | 8.4% |
| $25,000 to $34,999 | 50 | 5.3% |
| $35,000 to $49,999 | 95 | 10.1% |
| $50,000 to $74,999 | 131 | 14.0% |
| $75,000 to $99,999 | 124 | 13.2% |
| $100,000 to $149,999 | 310 | 33.0% |
| $150,000 to $199,999 | 72 | 7.7% |
| $200,000+ | 28 | 3.0% |
Household Income by Householder Age in Lake Helen
The median household income in Lake Helen is $91,861, with the highest median household income of $108,478 found in the 45 to 64 years age bracket for the primary householder. A total of 308 households (32.8%) fall into this category. Meanwhile, the 15 to 24 years age bracket for the primary householder has the lowest median household income of $0, with 3 households (0.3%) in this group.
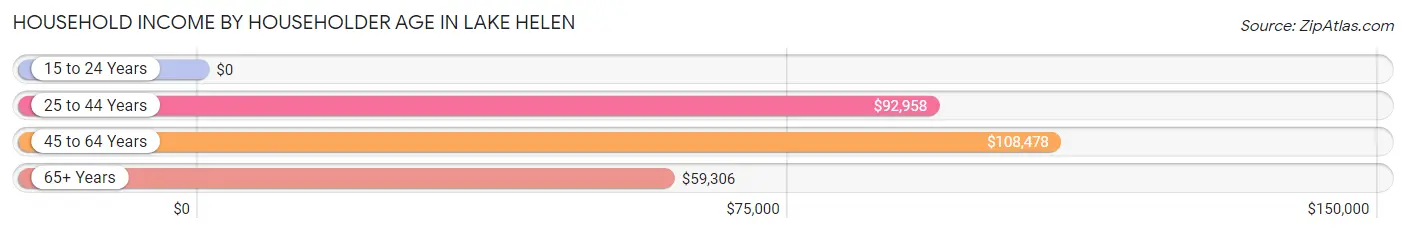
| Income Bracket | # Households | Median Income |
| 15 to 24 Years | 3 (0.3%) | $0 |
| 25 to 44 Years | 243 (25.9%) | $92,958 |
| 45 to 64 Years | 308 (32.8%) | $108,478 |
| 65+ Years | 385 (41.0%) | $59,306 |
| Total | 939 (100.0%) | $91,861 |
Poverty in Lake Helen
Income Below Poverty by Sex and Age in Lake Helen
With 3.7% poverty level for males and 10.8% for females among the residents of Lake Helen, 15 year old males and 16 and 17 year old females are the most vulnerable to poverty, with 3 males (100.0%) and 7 females (41.2%) in their respective age groups living below the poverty level.
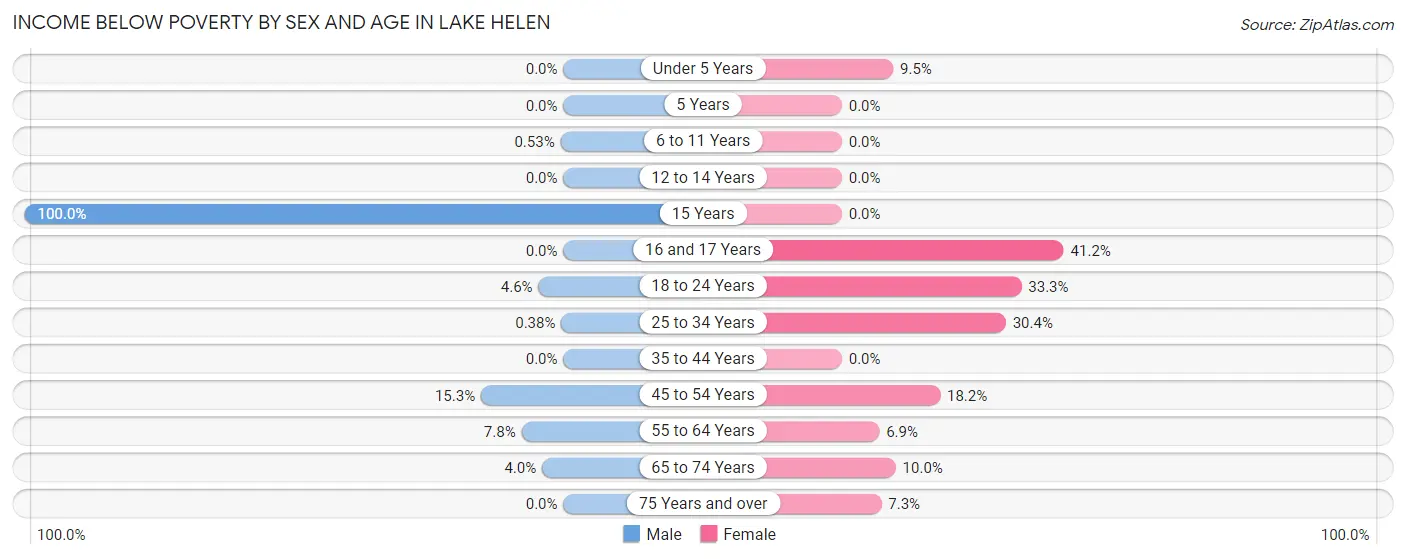
| Age Bracket | Male | Female |
| Under 5 Years | 0 (0.0%) | 6 (9.5%) |
| 5 Years | 0 (0.0%) | 0 (0.0%) |
| 6 to 11 Years | 1 (0.5%) | 0 (0.0%) |
| 12 to 14 Years | 0 (0.0%) | 0 (0.0%) |
| 15 Years | 3 (100.0%) | 0 (0.0%) |
| 16 and 17 Years | 0 (0.0%) | 7 (41.2%) |
| 18 to 24 Years | 3 (4.6%) | 31 (33.3%) |
| 25 to 34 Years | 1 (0.4%) | 35 (30.4%) |
| 35 to 44 Years | 0 (0.0%) | 0 (0.0%) |
| 45 to 54 Years | 24 (15.3%) | 27 (18.2%) |
| 55 to 64 Years | 16 (7.8%) | 10 (6.9%) |
| 65 to 74 Years | 7 (4.0%) | 23 (10.0%) |
| 75 Years and over | 0 (0.0%) | 8 (7.3%) |
| Total | 55 (3.7%) | 147 (10.8%) |
Income Above Poverty by Sex and Age in Lake Helen
According to the poverty statistics in Lake Helen, males aged under 5 years and females aged 5 years are the age groups that are most secure financially, with 100.0% of males and 100.0% of females in these age groups living above the poverty line.
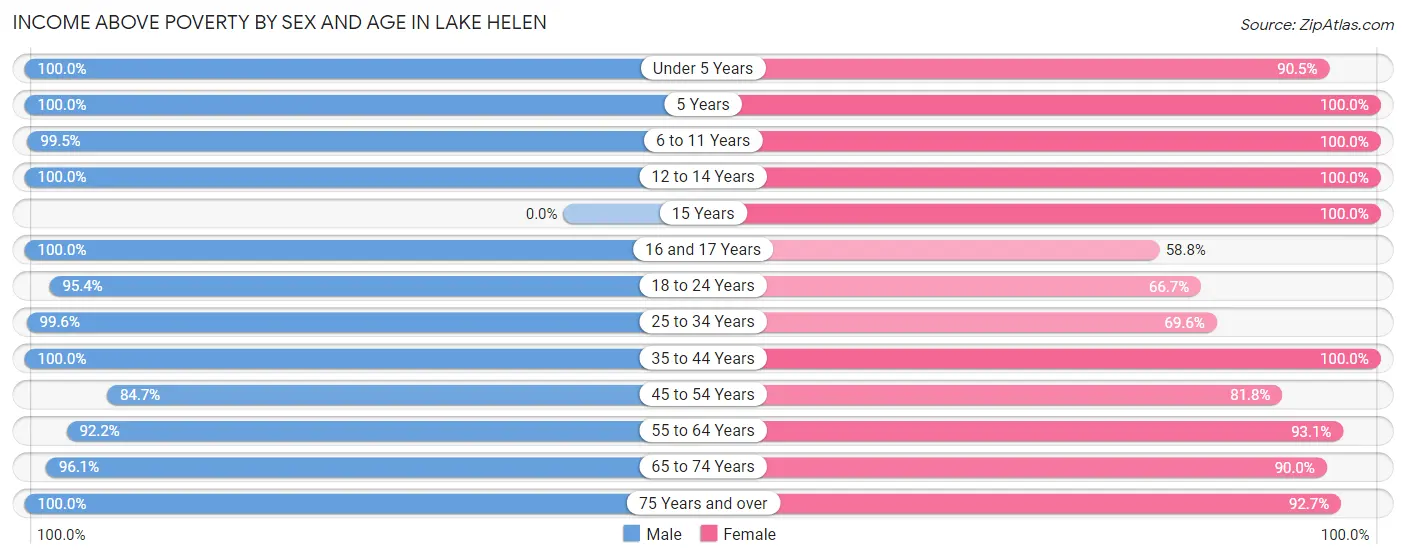
| Age Bracket | Male | Female |
| Under 5 Years | 75 (100.0%) | 57 (90.5%) |
| 5 Years | 32 (100.0%) | 14 (100.0%) |
| 6 to 11 Years | 188 (99.5%) | 126 (100.0%) |
| 12 to 14 Years | 39 (100.0%) | 81 (100.0%) |
| 15 Years | 0 (0.0%) | 7 (100.0%) |
| 16 and 17 Years | 21 (100.0%) | 10 (58.8%) |
| 18 to 24 Years | 62 (95.4%) | 62 (66.7%) |
| 25 to 34 Years | 259 (99.6%) | 80 (69.6%) |
| 35 to 44 Years | 106 (100.0%) | 211 (100.0%) |
| 45 to 54 Years | 133 (84.7%) | 121 (81.8%) |
| 55 to 64 Years | 190 (92.2%) | 134 (93.1%) |
| 65 to 74 Years | 170 (96.1%) | 207 (90.0%) |
| 75 Years and over | 141 (100.0%) | 101 (92.7%) |
| Total | 1,416 (96.3%) | 1,211 (89.2%) |
Income Below Poverty Among Married-Couple Families in Lake Helen
The poverty statistics for married-couple families in Lake Helen show that 3.3% or 20 of the total 611 families live below the poverty line. Families with no children have the highest poverty rate of 4.0%, comprising of 16 families. On the other hand, families with 3 or 4 children have the lowest poverty rate of 0.0%, which includes 0 families.
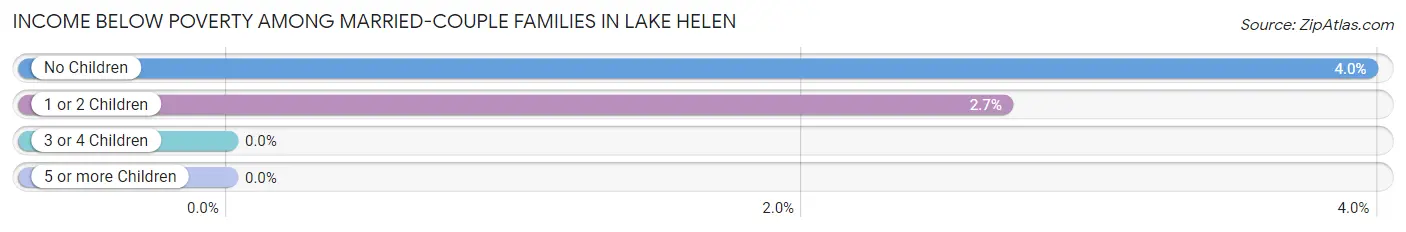
| Children | Above Poverty | Below Poverty |
| No Children | 387 (96.0%) | 16 (4.0%) |
| 1 or 2 Children | 144 (97.3%) | 4 (2.7%) |
| 3 or 4 Children | 13 (100.0%) | 0 (0.0%) |
| 5 or more Children | 47 (100.0%) | 0 (0.0%) |
| Total | 591 (96.7%) | 20 (3.3%) |
Income Below Poverty Among Single-Parent Households in Lake Helen
According to the poverty data in Lake Helen, 15.8% or 3 single-father households and 6.9% or 5 single-mother households are living below the poverty line. Among single-father households, those with no children have the highest poverty rate, with 3 households (21.4%) experiencing poverty. Likewise, among single-mother households, those with 1 or 2 children have the highest poverty rate, with 5 households (26.3%) falling below the poverty line.
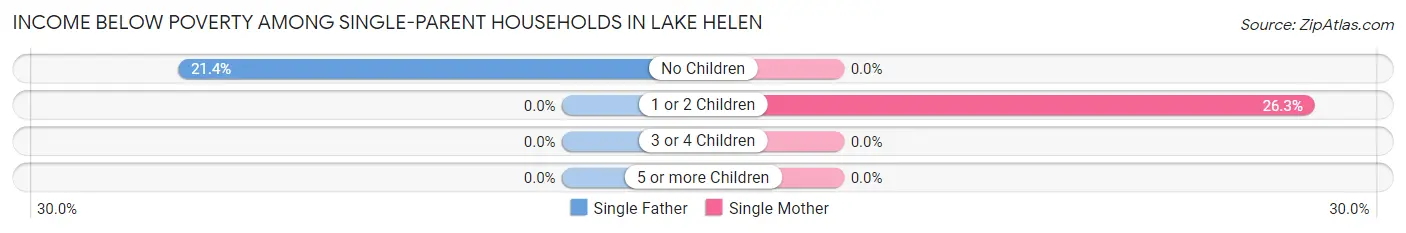
| Children | Single Father | Single Mother |
| No Children | 3 (21.4%) | 0 (0.0%) |
| 1 or 2 Children | 0 (0.0%) | 5 (26.3%) |
| 3 or 4 Children | 0 (0.0%) | 0 (0.0%) |
| 5 or more Children | 0 (0.0%) | 0 (0.0%) |
| Total | 3 (15.8%) | 5 (6.9%) |
Income Below Poverty Among Married-Couple vs Single-Parent Households in Lake Helen
The poverty data for Lake Helen shows that 20 of the married-couple family households (3.3%) and 8 of the single-parent households (8.7%) are living below the poverty level. Within the married-couple family households, those with no children have the highest poverty rate, with 16 households (4.0%) falling below the poverty line. Among the single-parent households, those with 1 or 2 children have the highest poverty rate, with 5 household (20.8%) living below poverty.
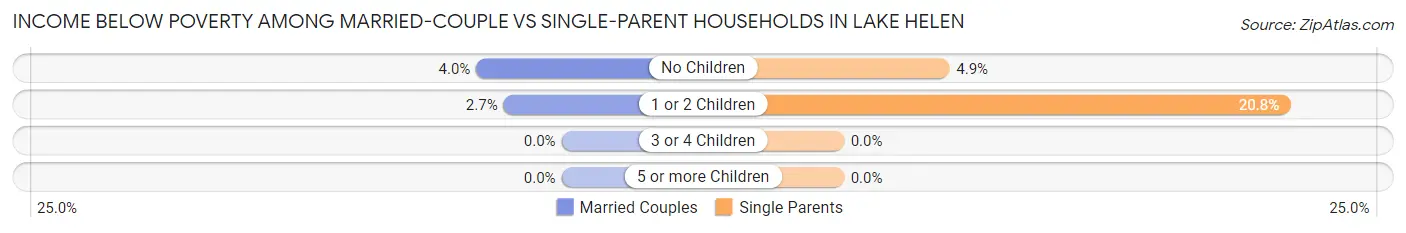
| Children | Married-Couple Families | Single-Parent Households |
| No Children | 16 (4.0%) | 3 (4.9%) |
| 1 or 2 Children | 4 (2.7%) | 5 (20.8%) |
| 3 or 4 Children | 0 (0.0%) | 0 (0.0%) |
| 5 or more Children | 0 (0.0%) | 0 (0.0%) |
| Total | 20 (3.3%) | 8 (8.7%) |
Race in Lake Helen
The most populous races in Lake Helen are White / Caucasian (2,635 | 92.9%), Hispanic or Latino (113 | 4.0%), and Black / African American (106 | 3.7%).
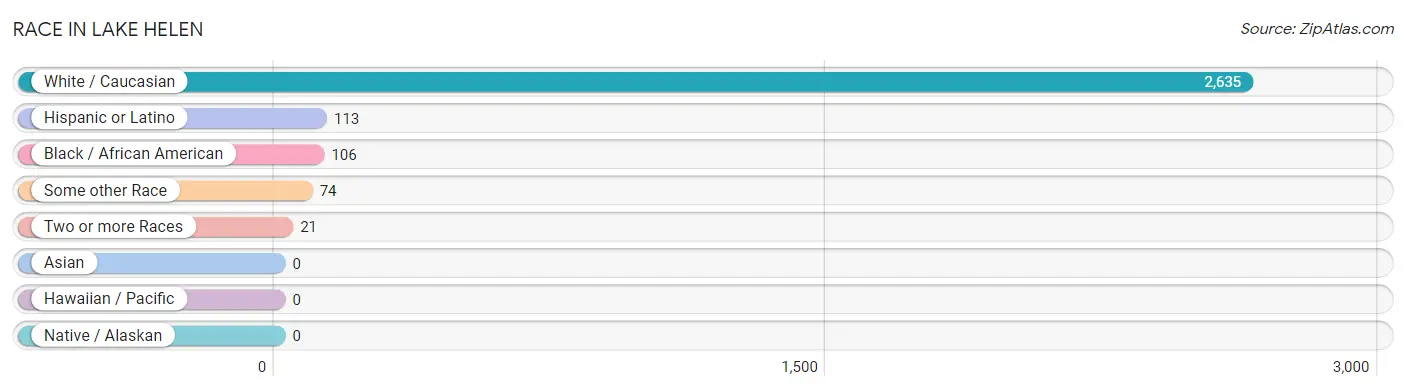
| Race | # Population | % Population |
| Asian | 0 | 0.0% |
| Black / African American | 106 | 3.7% |
| Hawaiian / Pacific | 0 | 0.0% |
| Hispanic or Latino | 113 | 4.0% |
| Native / Alaskan | 0 | 0.0% |
| White / Caucasian | 2,635 | 92.9% |
| Two or more Races | 21 | 0.7% |
| Some other Race | 74 | 2.6% |
| Total | 2,836 | 100.0% |
Ancestry in Lake Helen
The most populous ancestries reported in Lake Helen are English (306 | 10.8%), German (252 | 8.9%), Irish (153 | 5.4%), American (121 | 4.3%), and Scotch-Irish (112 | 4.0%), together accounting for 33.3% of all Lake Helen residents.
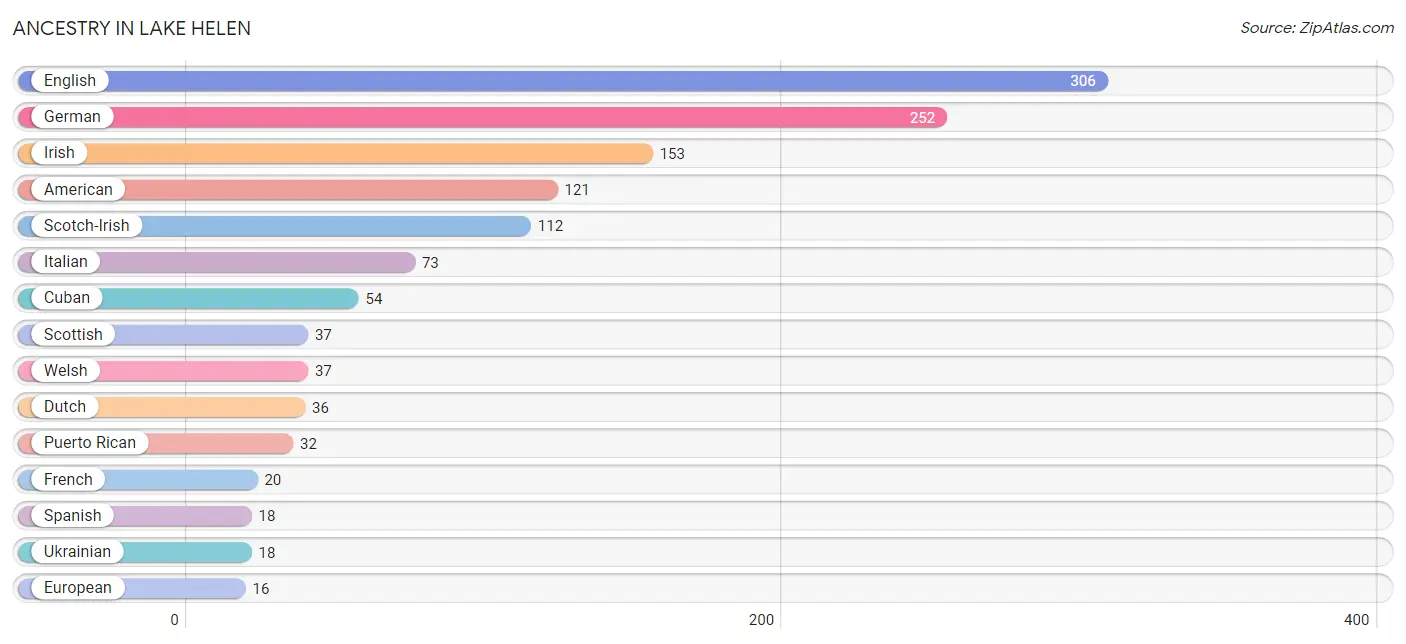
| Ancestry | # Population | % Population |
| American | 121 | 4.3% |
| Arab | 7 | 0.3% |
| British | 15 | 0.5% |
| Bulgarian | 4 | 0.1% |
| Canadian | 2 | 0.1% |
| Cuban | 54 | 1.9% |
| Czech | 2 | 0.1% |
| Dutch | 36 | 1.3% |
| English | 306 | 10.8% |
| European | 16 | 0.6% |
| French | 20 | 0.7% |
| French Canadian | 16 | 0.6% |
| German | 252 | 8.9% |
| Hungarian | 5 | 0.2% |
| Irish | 153 | 5.4% |
| Italian | 73 | 2.6% |
| Lebanese | 3 | 0.1% |
| Mongolian | 13 | 0.5% |
| Norwegian | 14 | 0.5% |
| Polish | 12 | 0.4% |
| Puerto Rican | 32 | 1.1% |
| Russian | 2 | 0.1% |
| Scandinavian | 8 | 0.3% |
| Scotch-Irish | 112 | 4.0% |
| Scottish | 37 | 1.3% |
| Serbian | 3 | 0.1% |
| Slovak | 3 | 0.1% |
| South American | 9 | 0.3% |
| Spanish | 18 | 0.6% |
| Swedish | 12 | 0.4% |
| Syrian | 4 | 0.1% |
| Ukrainian | 18 | 0.6% |
| Venezuelan | 9 | 0.3% |
| Welsh | 37 | 1.3% | View All 34 Rows |
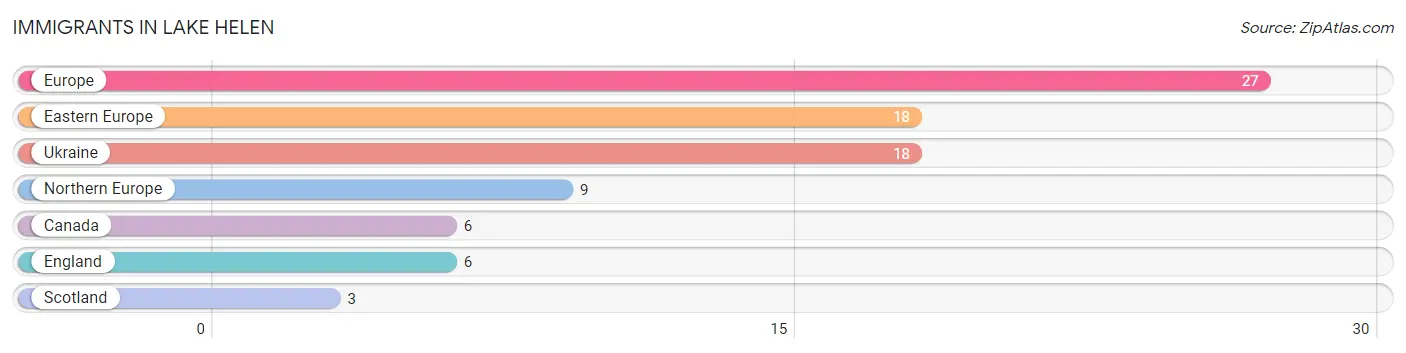
Immigrants in Lake Helen
The most numerous immigrant groups reported in Lake Helen came from Europe (27 | 0.9%), Eastern Europe (18 | 0.6%), Ukraine (18 | 0.6%), Northern Europe (9 | 0.3%), and Canada (6 | 0.2%), together accounting for 2.7% of all Lake Helen residents.
| Immigration Origin | # Population | % Population |
| Canada | 6 | 0.2% |
| Eastern Europe | 18 | 0.6% |
| England | 6 | 0.2% |
| Europe | 27 | 0.9% |
| Northern Europe | 9 | 0.3% |
| Scotland | 3 | 0.1% |
| Ukraine | 18 | 0.6% | View All 7 Rows |
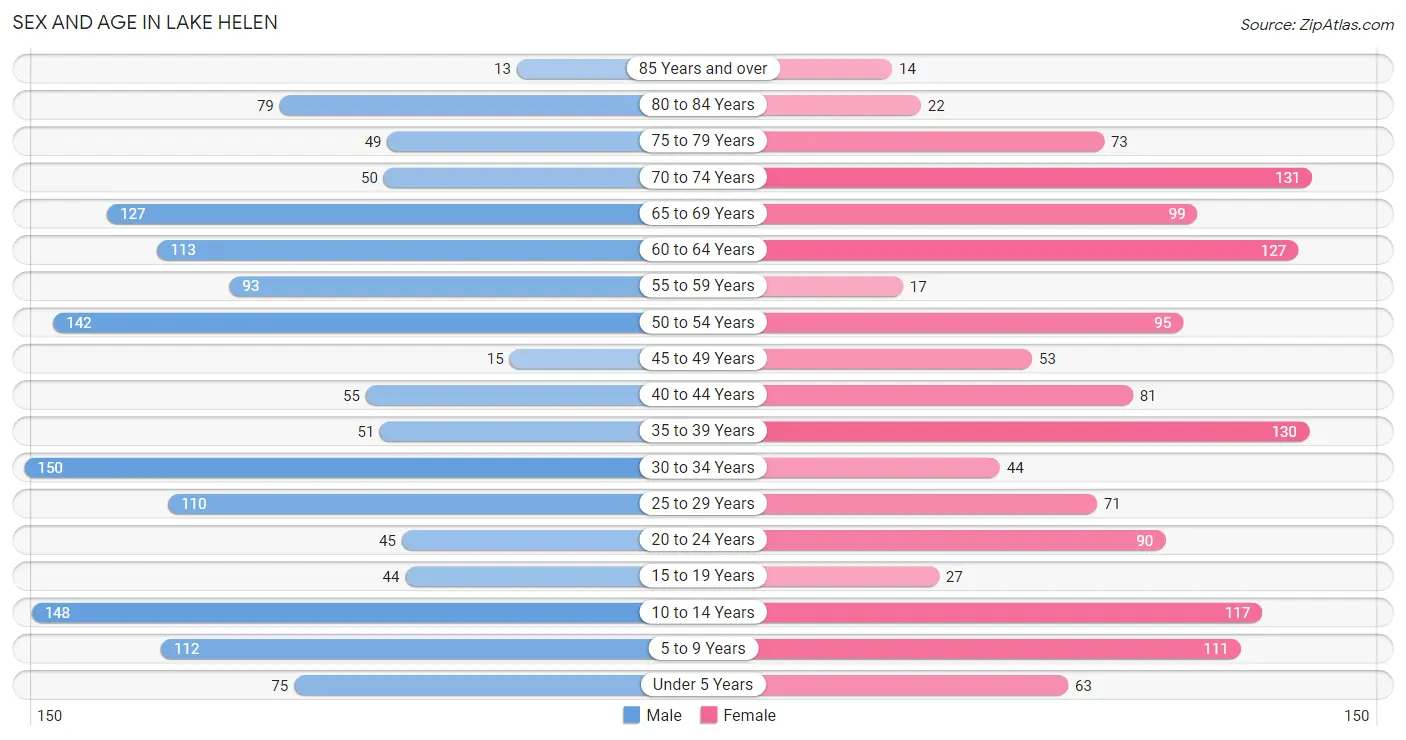
Sex and Age in Lake Helen
Sex and Age in Lake Helen
The most populous age groups in Lake Helen are 30 to 34 Years (150 | 10.2%) for men and 70 to 74 Years (131 | 9.6%) for women.
| Age Bracket | Male | Female |
| Under 5 Years | 75 (5.1%) | 63 (4.6%) |
| 5 to 9 Years | 112 (7.6%) | 111 (8.1%) |
| 10 to 14 Years | 148 (10.1%) | 117 (8.6%) |
| 15 to 19 Years | 44 (3.0%) | 27 (2.0%) |
| 20 to 24 Years | 45 (3.1%) | 90 (6.6%) |
| 25 to 29 Years | 110 (7.5%) | 71 (5.2%) |
| 30 to 34 Years | 150 (10.2%) | 44 (3.2%) |
| 35 to 39 Years | 51 (3.5%) | 130 (9.5%) |
| 40 to 44 Years | 55 (3.7%) | 81 (5.9%) |
| 45 to 49 Years | 15 (1.0%) | 53 (3.9%) |
| 50 to 54 Years | 142 (9.7%) | 95 (7.0%) |
| 55 to 59 Years | 93 (6.3%) | 17 (1.3%) |
| 60 to 64 Years | 113 (7.7%) | 127 (9.3%) |
| 65 to 69 Years | 127 (8.6%) | 99 (7.2%) |
| 70 to 74 Years | 50 (3.4%) | 131 (9.6%) |
| 75 to 79 Years | 49 (3.3%) | 73 (5.3%) |
| 80 to 84 Years | 79 (5.4%) | 22 (1.6%) |
| 85 Years and over | 13 (0.9%) | 14 (1.0%) |
| Total | 1,471 (100.0%) | 1,365 (100.0%) |
Families and Households in Lake Helen
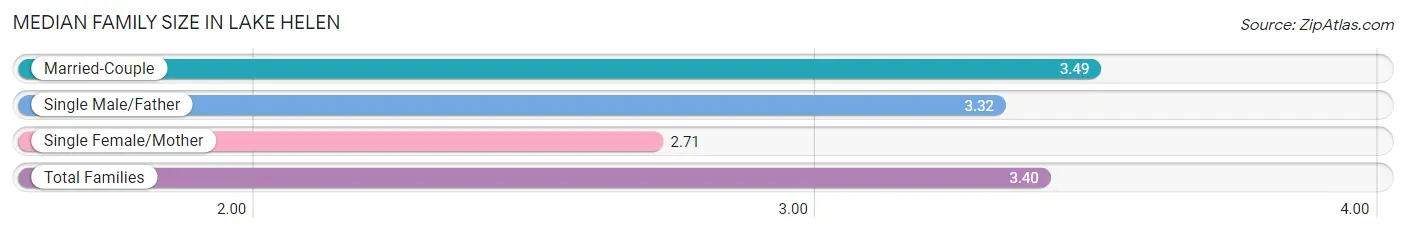
Median Family Size in Lake Helen
The median family size in Lake Helen is 3.40 persons per family, with married-couple families (611 | 86.9%) accounting for the largest median family size of 3.49 persons per family. On the other hand, single female/mother families (73 | 10.4%) represent the smallest median family size with 2.71 persons per family.
| Family Type | # Families | Family Size |
| Married-Couple | 611 (86.9%) | 3.49 |
| Single Male/Father | 19 (2.7%) | 3.32 |
| Single Female/Mother | 73 (10.4%) | 2.71 |
| Total Families | 703 (100.0%) | 3.40 |
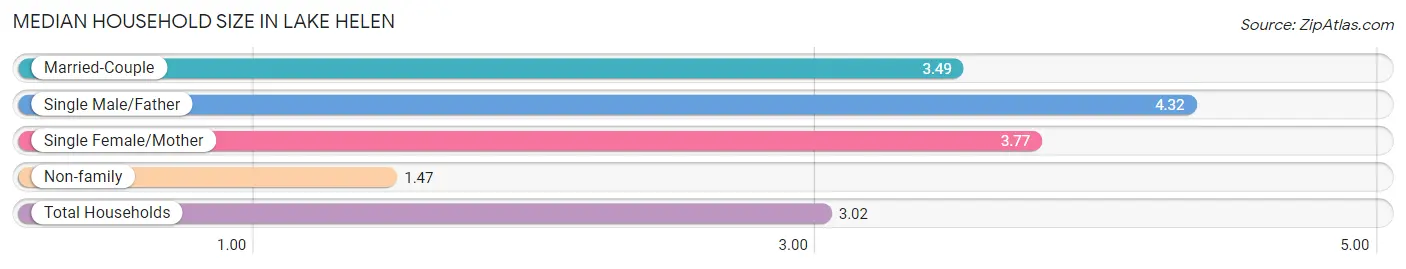
Median Household Size in Lake Helen
The median household size in Lake Helen is 3.02 persons per household, with single male/father households (19 | 2.0%) accounting for the largest median household size of 4.32 persons per household. non-family households (236 | 25.1%) represent the smallest median household size with 1.47 persons per household.
| Household Type | # Households | Household Size |
| Married-Couple | 611 (65.1%) | 3.49 |
| Single Male/Father | 19 (2.0%) | 4.32 |
| Single Female/Mother | 73 (7.8%) | 3.77 |
| Non-family | 236 (25.1%) | 1.47 |
| Total Households | 939 (100.0%) | 3.02 |
Household Size by Marriage Status in Lake Helen
Out of a total of 939 households in Lake Helen, 703 (74.9%) are family households, while 236 (25.1%) are nonfamily households. The most numerous type of family households are 2-person households, comprising 329, and the most common type of nonfamily households are 1-person households, comprising 151.
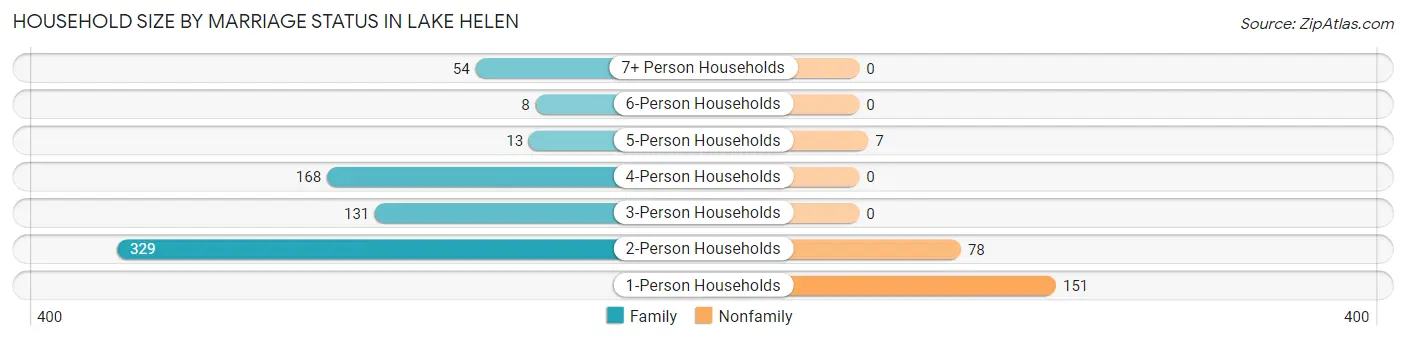
| Household Size | Family Households | Nonfamily Households |
| 1-Person Households | - | 151 (16.1%) |
| 2-Person Households | 329 (35.0%) | 78 (8.3%) |
| 3-Person Households | 131 (14.0%) | 0 (0.0%) |
| 4-Person Households | 168 (17.9%) | 0 (0.0%) |
| 5-Person Households | 13 (1.4%) | 7 (0.7%) |
| 6-Person Households | 8 (0.9%) | 0 (0.0%) |
| 7+ Person Households | 54 (5.8%) | 0 (0.0%) |
| Total | 703 (74.9%) | 236 (25.1%) |
Female Fertility in Lake Helen
Fertility by Age in Lake Helen
Average fertility rate in Lake Helen is 30.0 births per 1,000 women. Women in the age bracket of 35 to 50 years have the highest fertility rate with 38.0 births per 1,000 women. Women in the age bracket of 35 to 50 years acount for 66.7% of all women with births.
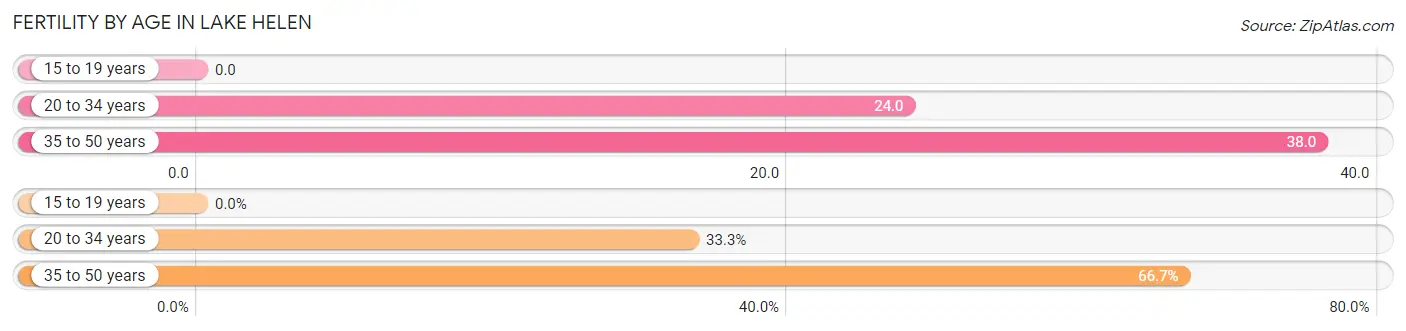
| Age Bracket | Women with Births | Births / 1,000 Women |
| 15 to 19 years | 0 (0.0%) | 0.0 |
| 20 to 34 years | 5 (33.3%) | 24.0 |
| 35 to 50 years | 10 (66.7%) | 38.0 |
| Total | 15 (100.0%) | 30.0 |
Fertility by Age by Marriage Status in Lake Helen
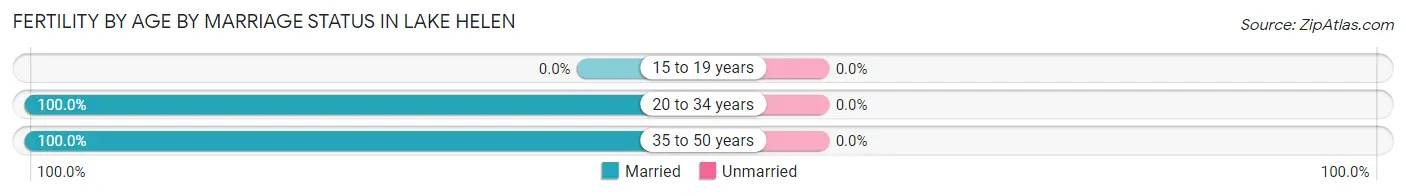
| Age Bracket | Married | Unmarried |
| 15 to 19 years | 0 (0.0%) | 0 (0.0%) |
| 20 to 34 years | 5 (100.0%) | 0 (0.0%) |
| 35 to 50 years | 10 (100.0%) | 0 (0.0%) |
| Total | 15 (100.0%) | 0 (0.0%) |
Fertility by Education in Lake Helen
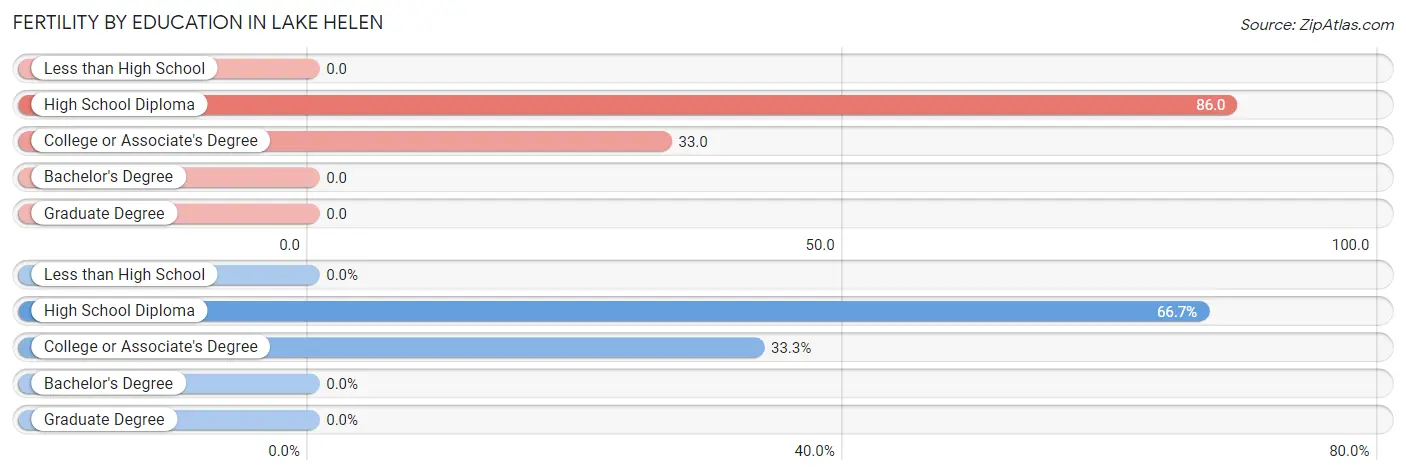
| Educational Attainment | Women with Births | Births / 1,000 Women |
| Less than High School | 0 (0.0%) | 0.0 |
| High School Diploma | 10 (66.7%) | 86.0 |
| College or Associate's Degree | 5 (33.3%) | 33.0 |
| Bachelor's Degree | 0 (0.0%) | 0.0 |
| Graduate Degree | 0 (0.0%) | 0.0 |
| Total | 15 (100.0%) | 30.0 |
Fertility by Education by Marriage Status in Lake Helen
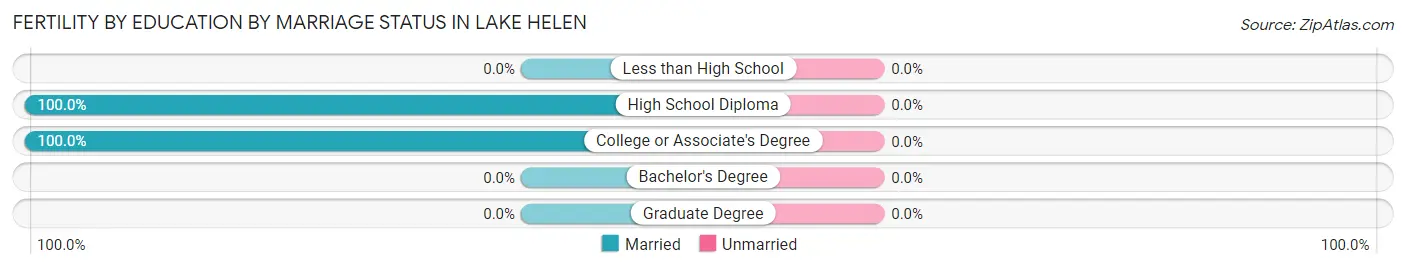
| Educational Attainment | Married | Unmarried |
| Less than High School | 0 (0.0%) | 0 (0.0%) |
| High School Diploma | 10 (100.0%) | 0 (0.0%) |
| College or Associate's Degree | 5 (100.0%) | 0 (0.0%) |
| Bachelor's Degree | 0 (0.0%) | 0 (0.0%) |
| Graduate Degree | 0 (0.0%) | 0 (0.0%) |
| Total | 15 (100.0%) | 0 (0.0%) |
Employment Characteristics in Lake Helen
Employment by Class of Employer in Lake Helen
Among the 1,181 employed individuals in Lake Helen, private company employees (870 | 73.7%), self-employed (incorporated) (125 | 10.6%), and self-employed (not incorporated) (57 | 4.8%) make up the most common classes of employment.
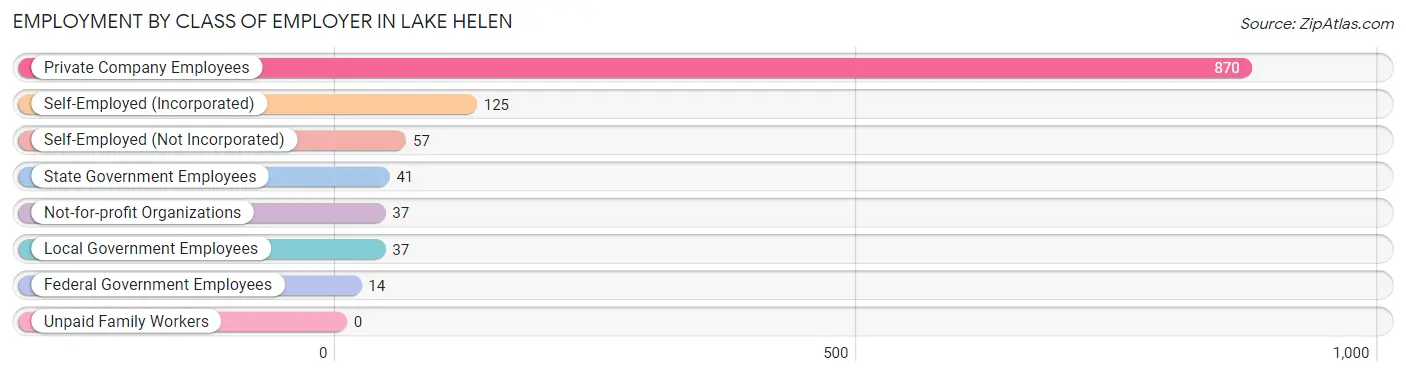
| Employer Class | # Employees | % Employees |
| Private Company Employees | 870 | 73.7% |
| Self-Employed (Incorporated) | 125 | 10.6% |
| Self-Employed (Not Incorporated) | 57 | 4.8% |
| Not-for-profit Organizations | 37 | 3.1% |
| Local Government Employees | 37 | 3.1% |
| State Government Employees | 41 | 3.5% |
| Federal Government Employees | 14 | 1.2% |
| Unpaid Family Workers | 0 | 0.0% |
| Total | 1,181 | 100.0% |
Employment Status by Age in Lake Helen
According to the labor force statistics for Lake Helen, out of the total population over 16 years of age (2,200), 55.9% or 1,230 individuals are in the labor force, with 3.9% or 48 of them unemployed. The age group with the highest labor force participation rate is 30 to 34 years, with 94.3% or 183 individuals in the labor force. Within the labor force, the 20 to 24 years age range has the highest percentage of unemployed individuals, with 18.2% or 22 of them being unemployed.
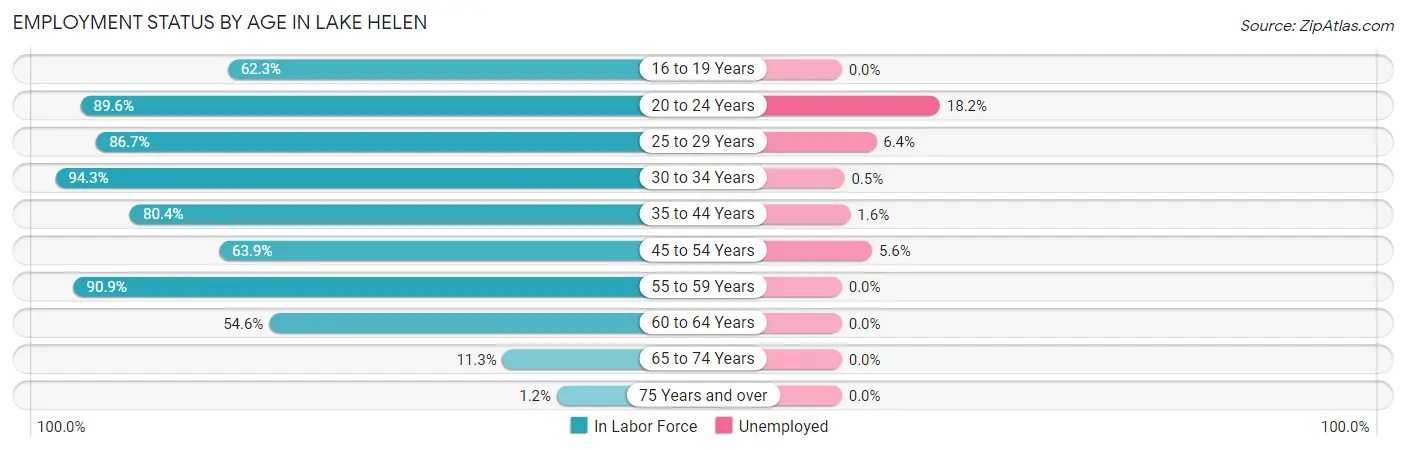
| Age Bracket | In Labor Force | Unemployed |
| 16 to 19 Years | 38 (62.3%) | 0 (0.0%) |
| 20 to 24 Years | 121 (89.6%) | 22 (18.2%) |
| 25 to 29 Years | 157 (86.7%) | 10 (6.4%) |
| 30 to 34 Years | 183 (94.3%) | 1 (0.5%) |
| 35 to 44 Years | 255 (80.4%) | 4 (1.6%) |
| 45 to 54 Years | 195 (63.9%) | 11 (5.6%) |
| 55 to 59 Years | 100 (90.9%) | 0 (0.0%) |
| 60 to 64 Years | 131 (54.6%) | 0 (0.0%) |
| 65 to 74 Years | 46 (11.3%) | 0 (0.0%) |
| 75 Years and over | 3 (1.2%) | 0 (0.0%) |
| Total | 1,230 (55.9%) | 48 (3.9%) |
Employment Status by Educational Attainment in Lake Helen
According to labor force statistics for Lake Helen, 75.8% of individuals (1,021) out of the total population between 25 and 64 years of age (1,347) are in the labor force, with 2.5% or 26 of them being unemployed. The group with the highest labor force participation rate are those with the educational attainment of bachelor's degree or higher, with 78.1% or 285 individuals in the labor force. Within the labor force, individuals with high school diploma education have the highest percentage of unemployment, with 4.0% or 11 of them being unemployed.
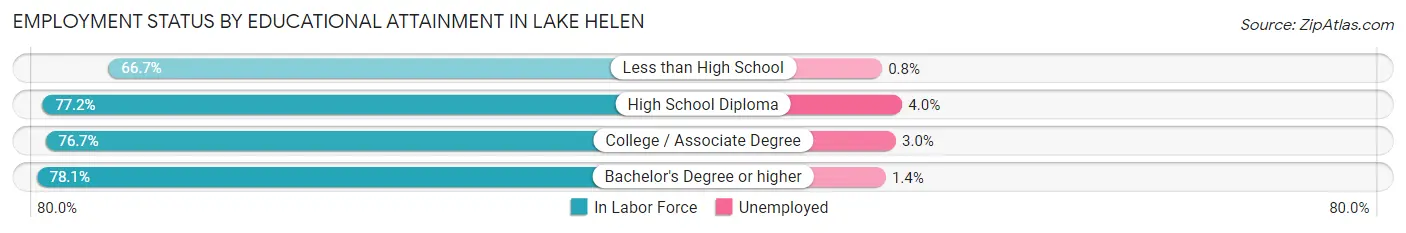
| Educational Attainment | In Labor Force | Unemployed |
| Less than High School | 128 (66.7%) | 2 (0.8%) |
| High School Diploma | 275 (77.2%) | 14 (4.0%) |
| College / Associate Degree | 333 (76.7%) | 13 (3.0%) |
| Bachelor's Degree or higher | 285 (78.1%) | 5 (1.4%) |
| Total | 1,021 (75.8%) | 34 (2.5%) |
Employment Occupations by Sex in Lake Helen
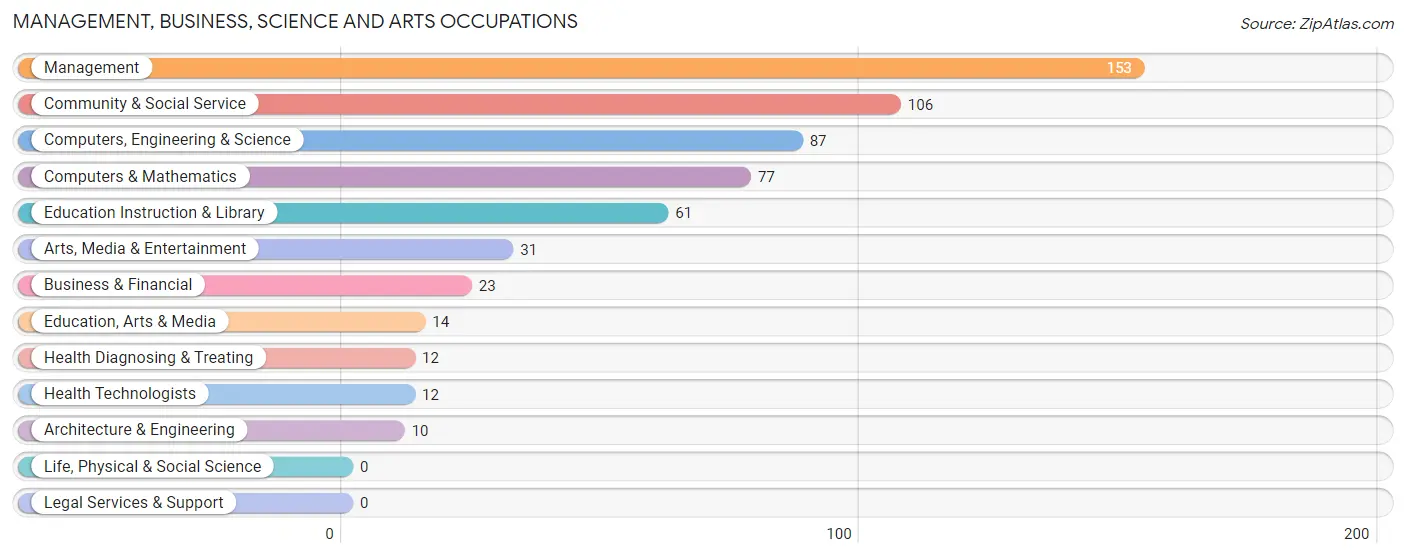
Management, Business, Science and Arts Occupations
The most common Management, Business, Science and Arts occupations in Lake Helen are Management (153 | 13.0%), Community & Social Service (106 | 9.0%), Computers, Engineering & Science (87 | 7.4%), Computers & Mathematics (77 | 6.5%), and Education Instruction & Library (61 | 5.2%).
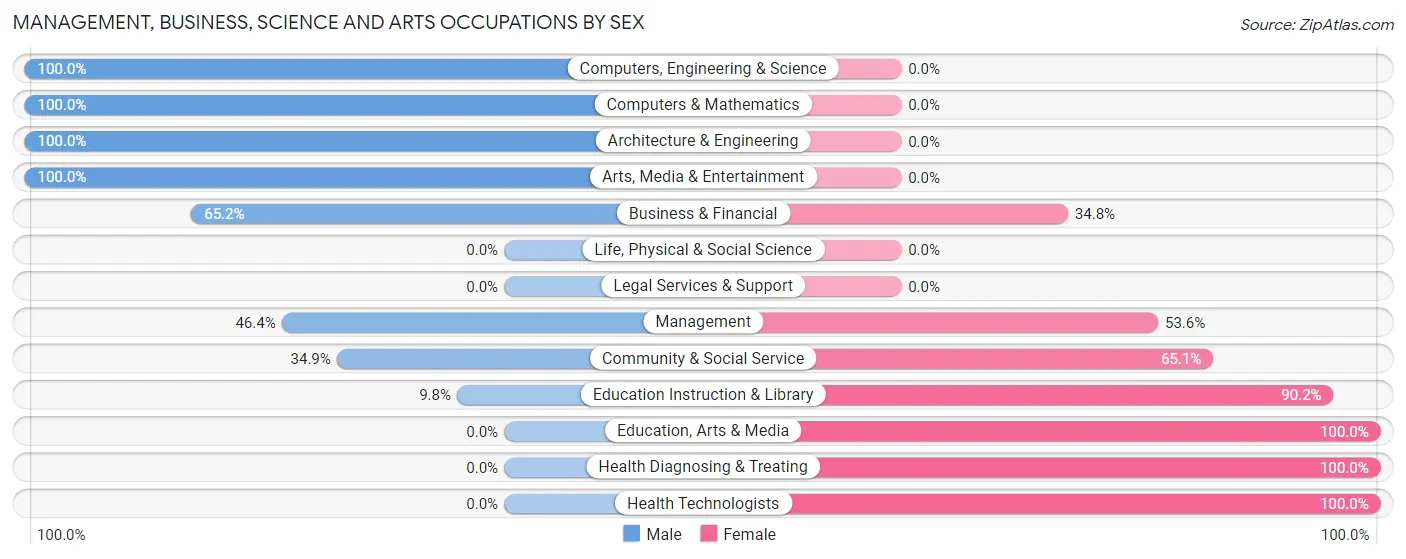
Management, Business, Science and Arts Occupations by Sex
Within the Management, Business, Science and Arts occupations in Lake Helen, the most male-oriented occupations are Computers, Engineering & Science (100.0%), Computers & Mathematics (100.0%), and Architecture & Engineering (100.0%), while the most female-oriented occupations are Education, Arts & Media (100.0%), Health Diagnosing & Treating (100.0%), and Health Technologists (100.0%).
| Occupation | Male | Female |
| Management | 71 (46.4%) | 82 (53.6%) |
| Business & Financial | 15 (65.2%) | 8 (34.8%) |
| Computers, Engineering & Science | 87 (100.0%) | 0 (0.0%) |
| Computers & Mathematics | 77 (100.0%) | 0 (0.0%) |
| Architecture & Engineering | 10 (100.0%) | 0 (0.0%) |
| Life, Physical & Social Science | 0 (0.0%) | 0 (0.0%) |
| Community & Social Service | 37 (34.9%) | 69 (65.1%) |
| Education, Arts & Media | 0 (0.0%) | 14 (100.0%) |
| Legal Services & Support | 0 (0.0%) | 0 (0.0%) |
| Education Instruction & Library | 6 (9.8%) | 55 (90.2%) |
| Arts, Media & Entertainment | 31 (100.0%) | 0 (0.0%) |
| Health Diagnosing & Treating | 0 (0.0%) | 12 (100.0%) |
| Health Technologists | 0 (0.0%) | 12 (100.0%) |
| Total (Category) | 210 (55.1%) | 171 (44.9%) |
| Total (Overall) | 719 (60.9%) | 462 (39.1%) |
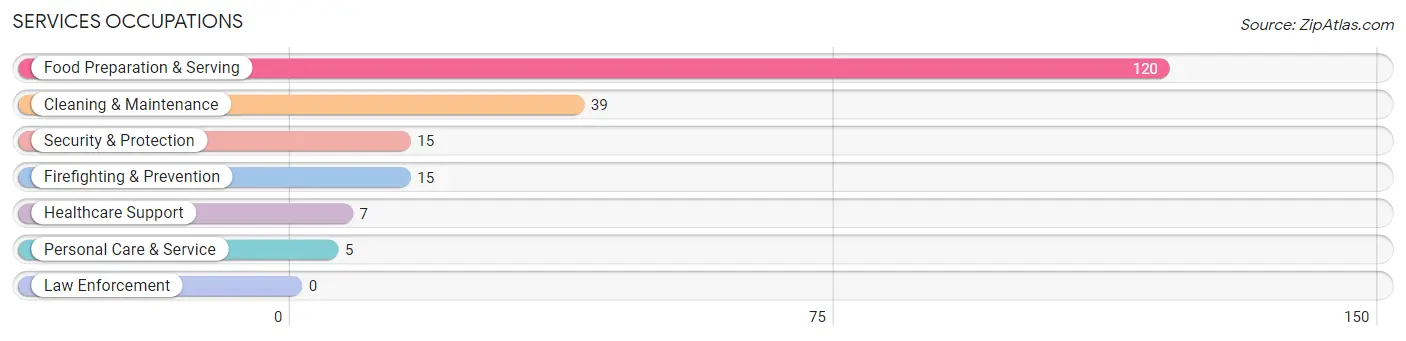
Services Occupations
The most common Services occupations in Lake Helen are Food Preparation & Serving (120 | 10.2%), Cleaning & Maintenance (39 | 3.3%), Security & Protection (15 | 1.3%), Firefighting & Prevention (15 | 1.3%), and Healthcare Support (7 | 0.6%).
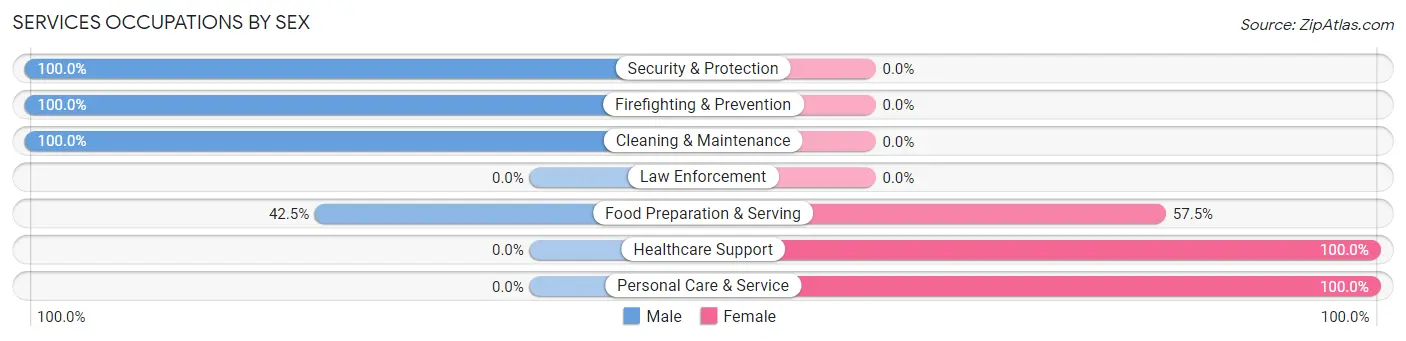
Services Occupations by Sex
Within the Services occupations in Lake Helen, the most male-oriented occupations are Security & Protection (100.0%), Firefighting & Prevention (100.0%), and Cleaning & Maintenance (100.0%), while the most female-oriented occupations are Healthcare Support (100.0%), Personal Care & Service (100.0%), and Food Preparation & Serving (57.5%).
| Occupation | Male | Female |
| Healthcare Support | 0 (0.0%) | 7 (100.0%) |
| Security & Protection | 15 (100.0%) | 0 (0.0%) |
| Firefighting & Prevention | 15 (100.0%) | 0 (0.0%) |
| Law Enforcement | 0 (0.0%) | 0 (0.0%) |
| Food Preparation & Serving | 51 (42.5%) | 69 (57.5%) |
| Cleaning & Maintenance | 39 (100.0%) | 0 (0.0%) |
| Personal Care & Service | 0 (0.0%) | 5 (100.0%) |
| Total (Category) | 105 (56.5%) | 81 (43.5%) |
| Total (Overall) | 719 (60.9%) | 462 (39.1%) |
Sales and Office Occupations
The most common Sales and Office occupations in Lake Helen are Office & Administration (268 | 22.7%), and Sales & Related (47 | 4.0%).
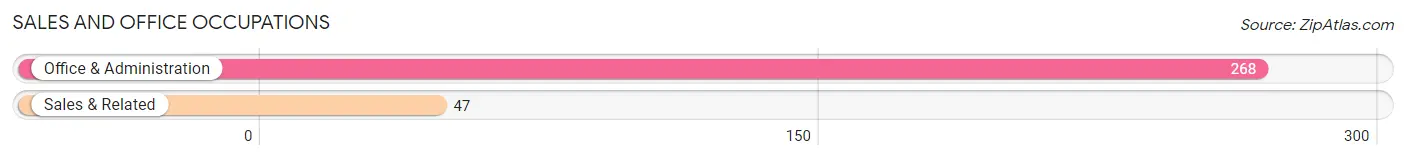
Sales and Office Occupations by Sex
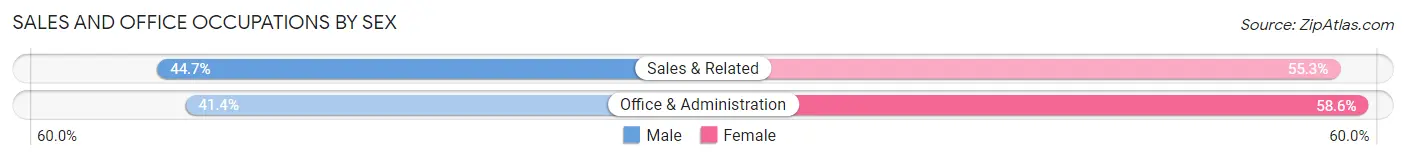
| Occupation | Male | Female |
| Sales & Related | 21 (44.7%) | 26 (55.3%) |
| Office & Administration | 111 (41.4%) | 157 (58.6%) |
| Total (Category) | 132 (41.9%) | 183 (58.1%) |
| Total (Overall) | 719 (60.9%) | 462 (39.1%) |
Natural Resources, Construction and Maintenance Occupations
The most common Natural Resources, Construction and Maintenance occupations in Lake Helen are Construction & Extraction (116 | 9.8%), and Installation, Maintenance & Repair (39 | 3.3%).
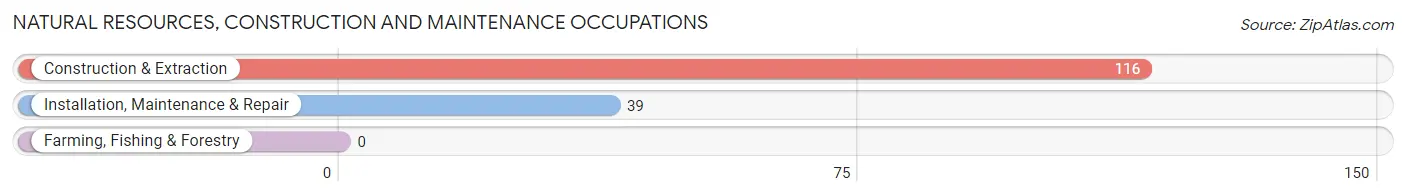
Natural Resources, Construction and Maintenance Occupations by Sex
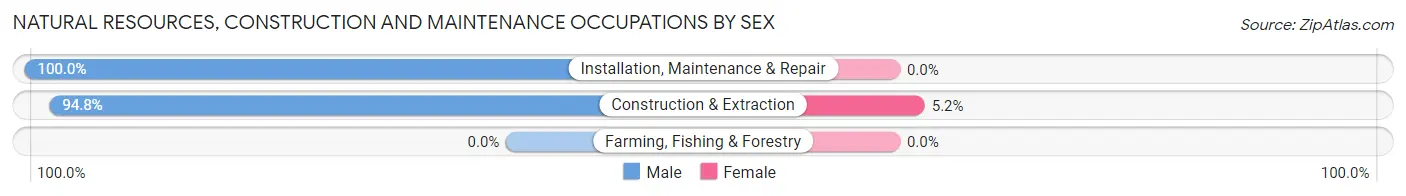
| Occupation | Male | Female |
| Farming, Fishing & Forestry | 0 (0.0%) | 0 (0.0%) |
| Construction & Extraction | 110 (94.8%) | 6 (5.2%) |
| Installation, Maintenance & Repair | 39 (100.0%) | 0 (0.0%) |
| Total (Category) | 149 (96.1%) | 6 (3.9%) |
| Total (Overall) | 719 (60.9%) | 462 (39.1%) |
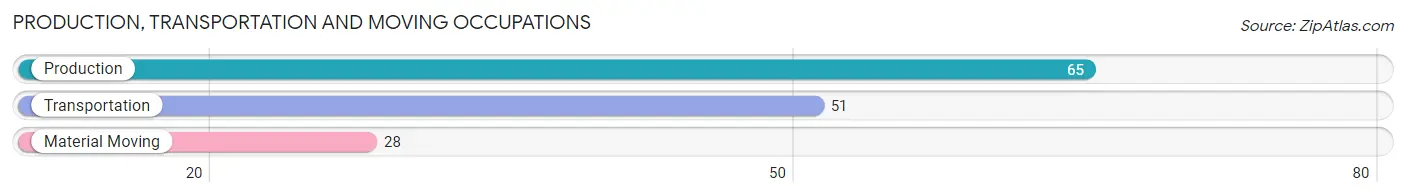
Production, Transportation and Moving Occupations
The most common Production, Transportation and Moving occupations in Lake Helen are Production (65 | 5.5%), Transportation (51 | 4.3%), and Material Moving (28 | 2.4%).
Production, Transportation and Moving Occupations by Sex
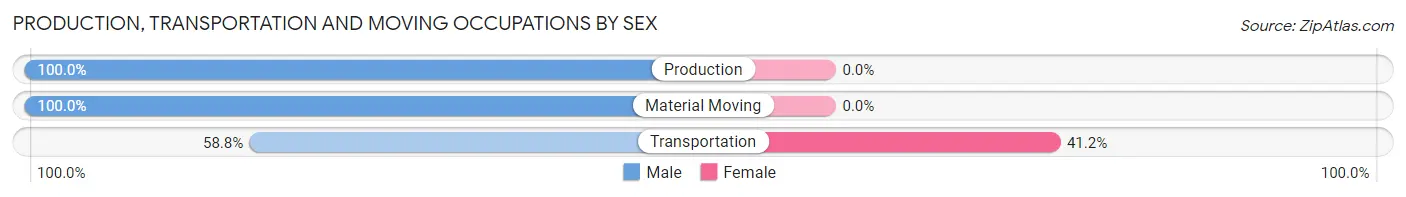
| Occupation | Male | Female |
| Production | 65 (100.0%) | 0 (0.0%) |
| Transportation | 30 (58.8%) | 21 (41.2%) |
| Material Moving | 28 (100.0%) | 0 (0.0%) |
| Total (Category) | 123 (85.4%) | 21 (14.6%) |
| Total (Overall) | 719 (60.9%) | 462 (39.1%) |
Employment Industries by Sex in Lake Helen
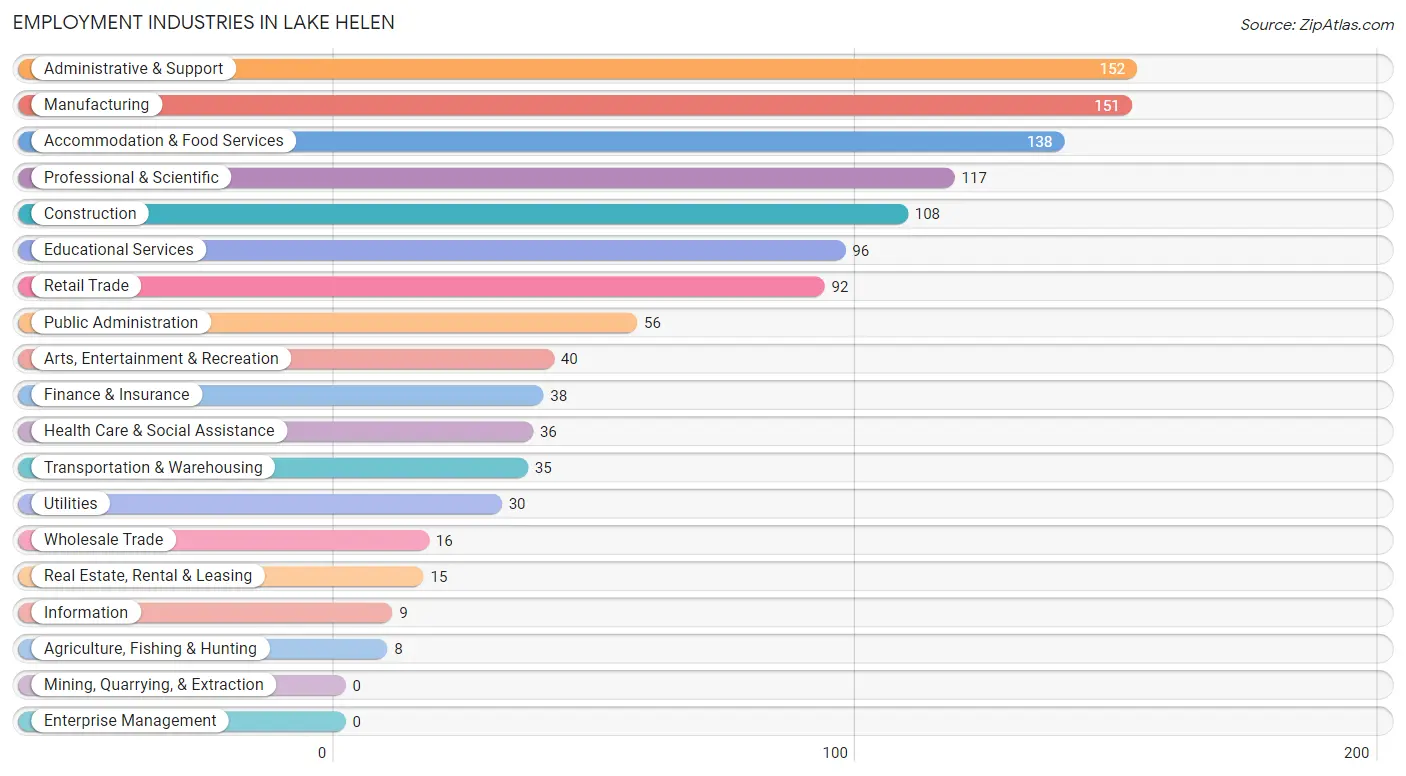
Employment Industries in Lake Helen
The major employment industries in Lake Helen include Administrative & Support (152 | 12.9%), Manufacturing (151 | 12.8%), Accommodation & Food Services (138 | 11.7%), Professional & Scientific (117 | 9.9%), and Construction (108 | 9.1%).
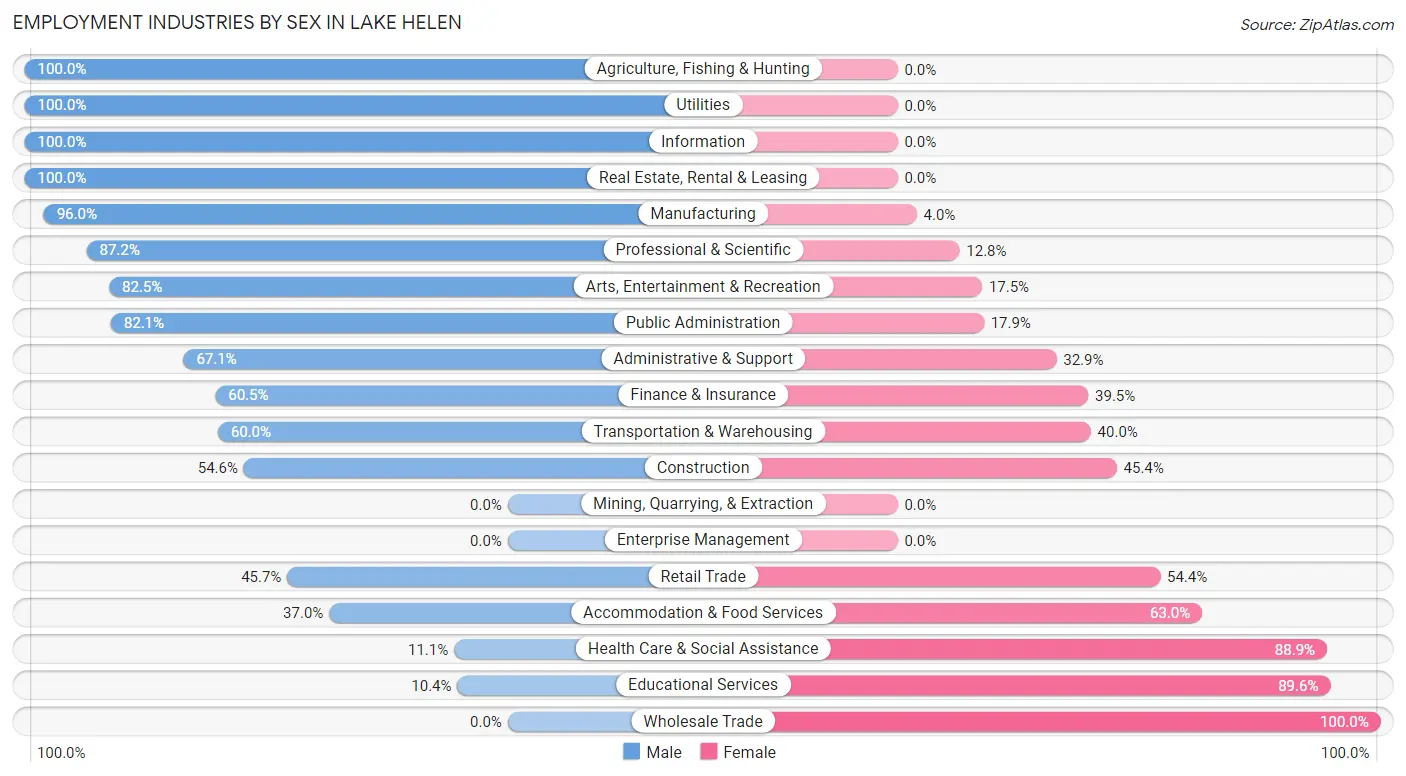
Employment Industries by Sex in Lake Helen
The Lake Helen industries that see more men than women are Agriculture, Fishing & Hunting (100.0%), Utilities (100.0%), and Information (100.0%), whereas the industries that tend to have a higher number of women are Wholesale Trade (100.0%), Educational Services (89.6%), and Health Care & Social Assistance (88.9%).
| Industry | Male | Female |
| Agriculture, Fishing & Hunting | 8 (100.0%) | 0 (0.0%) |
| Mining, Quarrying, & Extraction | 0 (0.0%) | 0 (0.0%) |
| Construction | 59 (54.6%) | 49 (45.4%) |
| Manufacturing | 145 (96.0%) | 6 (4.0%) |
| Wholesale Trade | 0 (0.0%) | 16 (100.0%) |
| Retail Trade | 42 (45.7%) | 50 (54.3%) |
| Transportation & Warehousing | 21 (60.0%) | 14 (40.0%) |
| Utilities | 30 (100.0%) | 0 (0.0%) |
| Information | 9 (100.0%) | 0 (0.0%) |
| Finance & Insurance | 23 (60.5%) | 15 (39.5%) |
| Real Estate, Rental & Leasing | 15 (100.0%) | 0 (0.0%) |
| Professional & Scientific | 102 (87.2%) | 15 (12.8%) |
| Enterprise Management | 0 (0.0%) | 0 (0.0%) |
| Administrative & Support | 102 (67.1%) | 50 (32.9%) |
| Educational Services | 10 (10.4%) | 86 (89.6%) |
| Health Care & Social Assistance | 4 (11.1%) | 32 (88.9%) |
| Arts, Entertainment & Recreation | 33 (82.5%) | 7 (17.5%) |
| Accommodation & Food Services | 51 (37.0%) | 87 (63.0%) |
| Public Administration | 46 (82.1%) | 10 (17.9%) |
| Total | 719 (60.9%) | 462 (39.1%) |
Education in Lake Helen
School Enrollment in Lake Helen
The most common levels of schooling among the 649 students in Lake Helen are elementary school (183 | 28.2%), middle school (144 | 22.2%), and high school (122 | 18.8%).
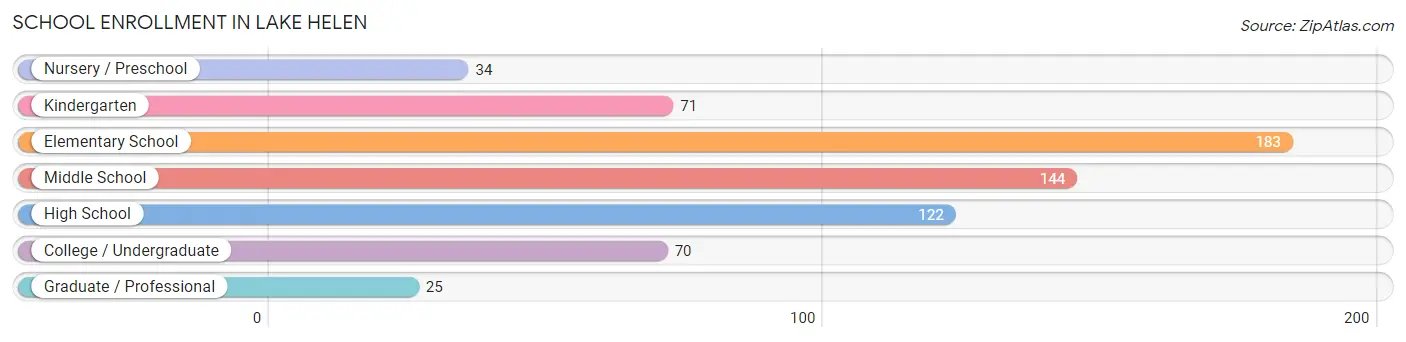
| School Level | # Students | % Students |
| Nursery / Preschool | 34 | 5.2% |
| Kindergarten | 71 | 10.9% |
| Elementary School | 183 | 28.2% |
| Middle School | 144 | 22.2% |
| High School | 122 | 18.8% |
| College / Undergraduate | 70 | 10.8% |
| Graduate / Professional | 25 | 3.8% |
| Total | 649 | 100.0% |
School Enrollment by Age by Funding Source in Lake Helen
Out of a total of 649 students who are enrolled in schools in Lake Helen, 332 (51.2%) attend a private institution, while the remaining 317 (48.8%) are enrolled in public schools. The age group of 3 to 4 year olds has the highest likelihood of being enrolled in private schools, with 33 (70.2% in the age bracket) enrolled. Conversely, the age group of 25 to 34 year olds has the lowest likelihood of being enrolled in a private school, with 43 (100.0% in the age bracket) attending a public institution.
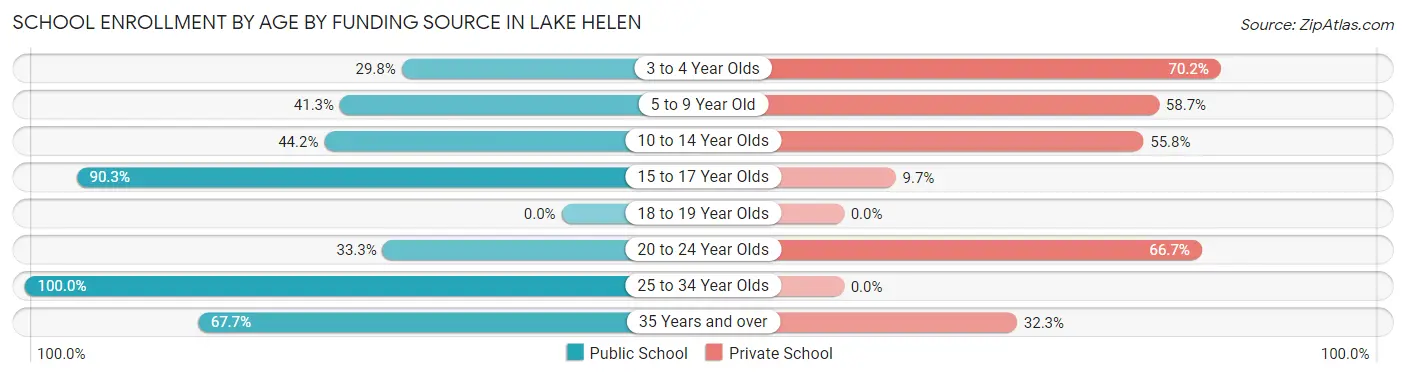
| Age Bracket | Public School | Private School |
| 3 to 4 Year Olds | 14 (29.8%) | 33 (70.2%) |
| 5 to 9 Year Old | 90 (41.3%) | 128 (58.7%) |
| 10 to 14 Year Olds | 114 (44.2%) | 144 (55.8%) |
| 15 to 17 Year Olds | 28 (90.3%) | 3 (9.7%) |
| 18 to 19 Year Olds | 0 (0.0%) | 0 (0.0%) |
| 20 to 24 Year Olds | 7 (33.3%) | 14 (66.7%) |
| 25 to 34 Year Olds | 43 (100.0%) | 0 (0.0%) |
| 35 Years and over | 21 (67.7%) | 10 (32.3%) |
| Total | 317 (48.8%) | 332 (51.2%) |
Educational Attainment by Field of Study in Lake Helen
Business (144 | 27.6%), education (86 | 16.5%), science & technology (80 | 15.3%), arts & humanities (67 | 12.8%), and liberal arts & history (48 | 9.2%) are the most common fields of study among 522 individuals in Lake Helen who have obtained a bachelor's degree or higher.
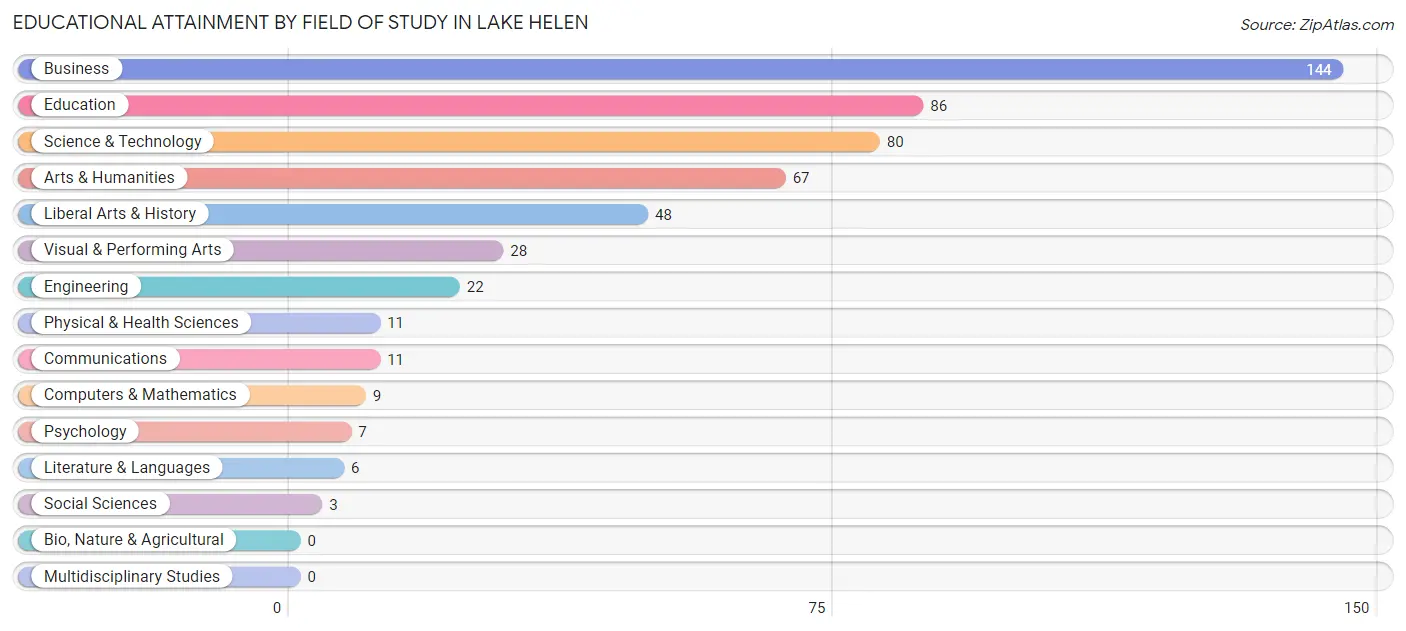
| Field of Study | # Graduates | % Graduates |
| Computers & Mathematics | 9 | 1.7% |
| Bio, Nature & Agricultural | 0 | 0.0% |
| Physical & Health Sciences | 11 | 2.1% |
| Psychology | 7 | 1.3% |
| Social Sciences | 3 | 0.6% |
| Engineering | 22 | 4.2% |
| Multidisciplinary Studies | 0 | 0.0% |
| Science & Technology | 80 | 15.3% |
| Business | 144 | 27.6% |
| Education | 86 | 16.5% |
| Literature & Languages | 6 | 1.1% |
| Liberal Arts & History | 48 | 9.2% |
| Visual & Performing Arts | 28 | 5.4% |
| Communications | 11 | 2.1% |
| Arts & Humanities | 67 | 12.8% |
| Total | 522 | 100.0% |
Transportation & Commute in Lake Helen
Vehicle Availability by Sex in Lake Helen
The most prevalent vehicle ownership categories in Lake Helen are males with 4 vehicles (237, accounting for 33.0%) and females with 4 vehicles (107, making up 51.3%).
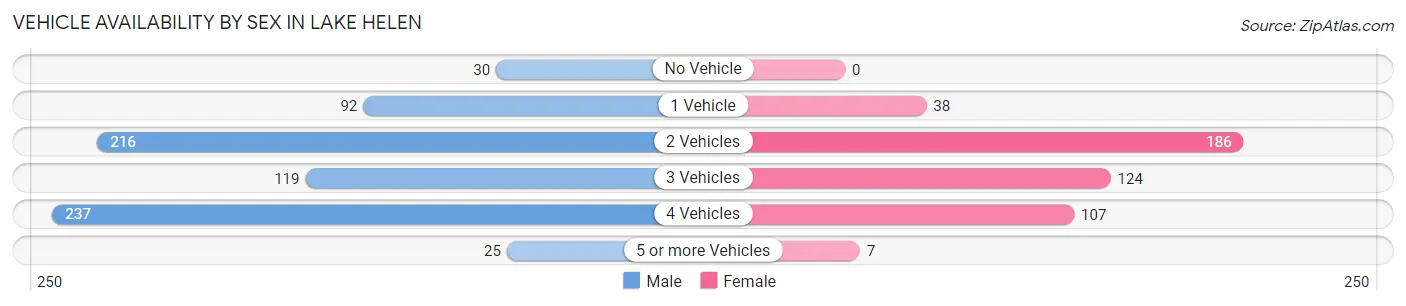
| Vehicles Available | Male | Female |
| No Vehicle | 30 (4.2%) | 0 (0.0%) |
| 1 Vehicle | 92 (12.8%) | 38 (8.2%) |
| 2 Vehicles | 216 (30.0%) | 186 (40.3%) |
| 3 Vehicles | 119 (16.6%) | 124 (26.8%) |
| 4 Vehicles | 237 (33.0%) | 107 (23.2%) |
| 5 or more Vehicles | 25 (3.5%) | 7 (1.5%) |
| Total | 719 (100.0%) | 462 (100.0%) |
Commute Time in Lake Helen
The most frequently occuring commute durations in Lake Helen are 20 to 24 minutes (327 commuters, 29.3%), 30 to 34 minutes (195 commuters, 17.5%), and 60 to 89 minutes (135 commuters, 12.1%).
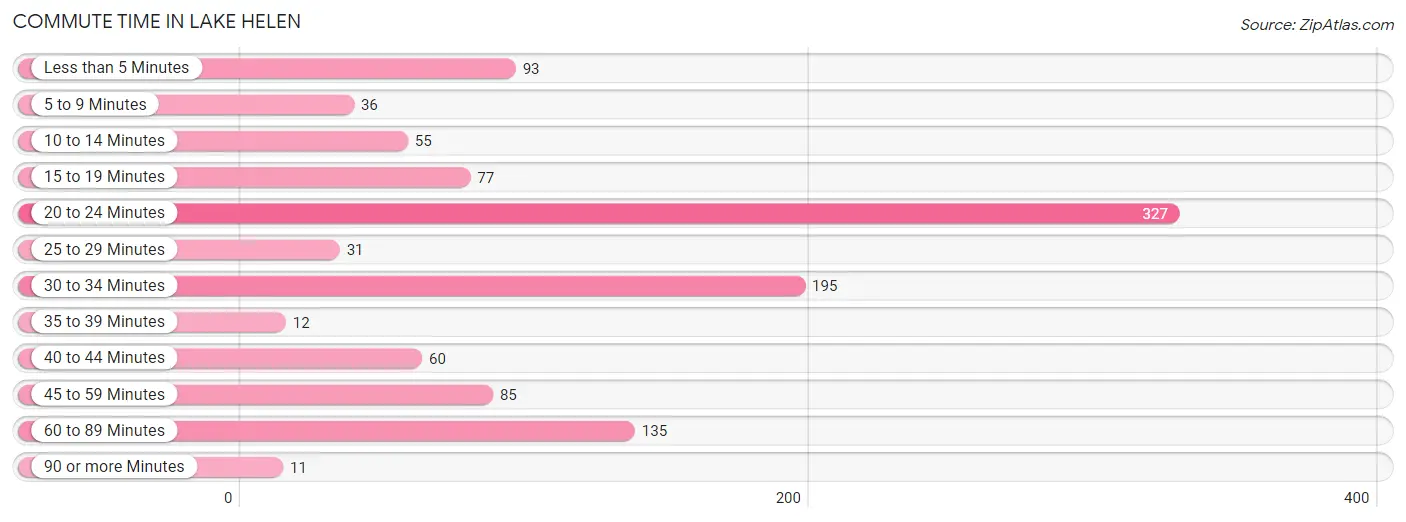
| Commute Time | # Commuters | % Commuters |
| Less than 5 Minutes | 93 | 8.3% |
| 5 to 9 Minutes | 36 | 3.2% |
| 10 to 14 Minutes | 55 | 4.9% |
| 15 to 19 Minutes | 77 | 6.9% |
| 20 to 24 Minutes | 327 | 29.3% |
| 25 to 29 Minutes | 31 | 2.8% |
| 30 to 34 Minutes | 195 | 17.5% |
| 35 to 39 Minutes | 12 | 1.1% |
| 40 to 44 Minutes | 60 | 5.4% |
| 45 to 59 Minutes | 85 | 7.6% |
| 60 to 89 Minutes | 135 | 12.1% |
| 90 or more Minutes | 11 | 1.0% |
Commute Time by Sex in Lake Helen
The most common commute times in Lake Helen are 30 to 34 minutes (188 commuters, 27.4%) for males and 20 to 24 minutes (234 commuters, 54.3%) for females.
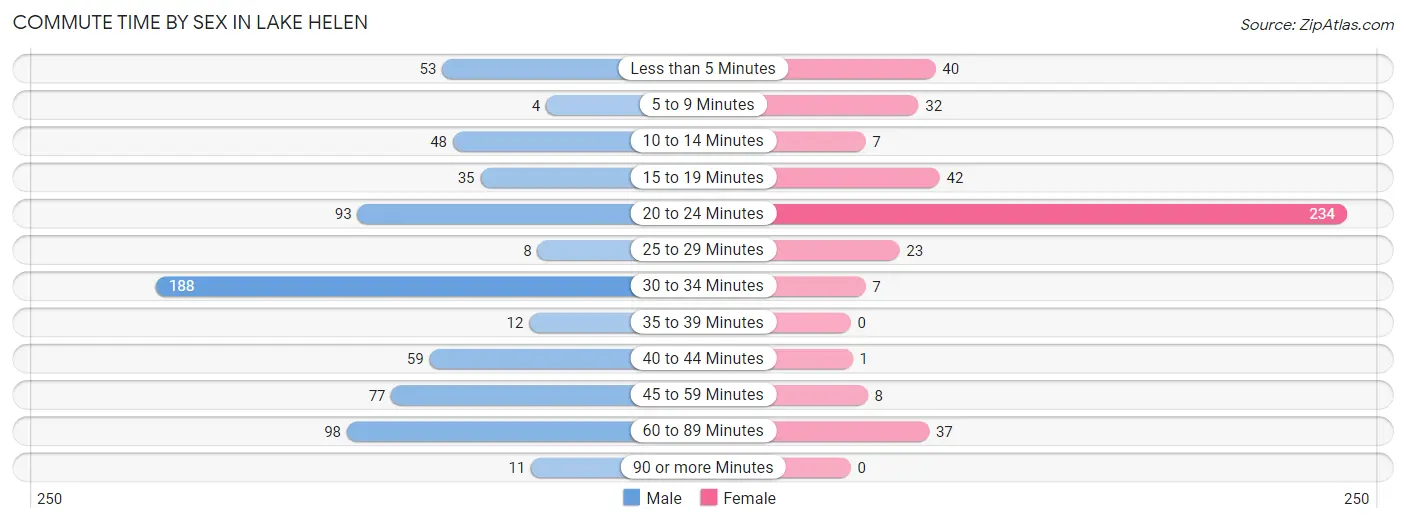
| Commute Time | Male | Female |
| Less than 5 Minutes | 53 (7.7%) | 40 (9.3%) |
| 5 to 9 Minutes | 4 (0.6%) | 32 (7.4%) |
| 10 to 14 Minutes | 48 (7.0%) | 7 (1.6%) |
| 15 to 19 Minutes | 35 (5.1%) | 42 (9.7%) |
| 20 to 24 Minutes | 93 (13.6%) | 234 (54.3%) |
| 25 to 29 Minutes | 8 (1.2%) | 23 (5.3%) |
| 30 to 34 Minutes | 188 (27.4%) | 7 (1.6%) |
| 35 to 39 Minutes | 12 (1.8%) | 0 (0.0%) |
| 40 to 44 Minutes | 59 (8.6%) | 1 (0.2%) |
| 45 to 59 Minutes | 77 (11.2%) | 8 (1.9%) |
| 60 to 89 Minutes | 98 (14.3%) | 37 (8.6%) |
| 90 or more Minutes | 11 (1.6%) | 0 (0.0%) |
Time of Departure to Work by Sex in Lake Helen
The most frequent times of departure to work in Lake Helen are 5:30 AM to 5:59 AM (116, 16.9%) for males and 6:30 AM to 6:59 AM (86, 20.0%) for females.
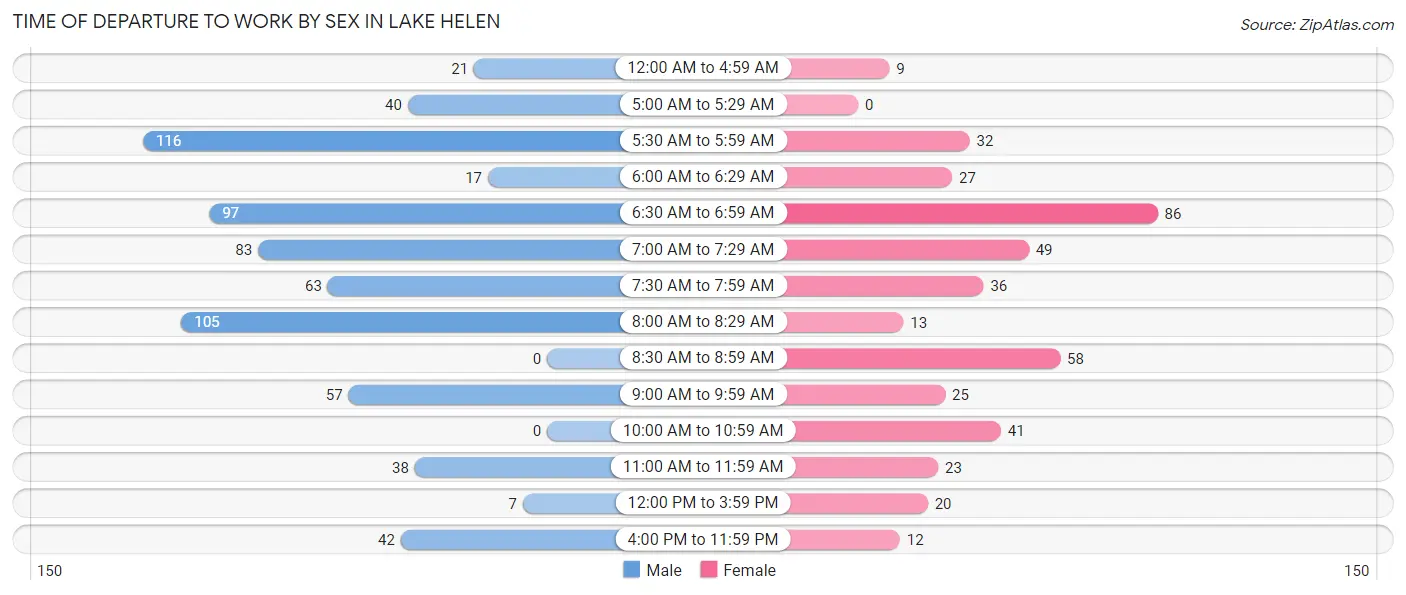
| Time of Departure | Male | Female |
| 12:00 AM to 4:59 AM | 21 (3.1%) | 9 (2.1%) |
| 5:00 AM to 5:29 AM | 40 (5.8%) | 0 (0.0%) |
| 5:30 AM to 5:59 AM | 116 (16.9%) | 32 (7.4%) |
| 6:00 AM to 6:29 AM | 17 (2.5%) | 27 (6.3%) |
| 6:30 AM to 6:59 AM | 97 (14.1%) | 86 (20.0%) |
| 7:00 AM to 7:29 AM | 83 (12.1%) | 49 (11.4%) |
| 7:30 AM to 7:59 AM | 63 (9.2%) | 36 (8.4%) |
| 8:00 AM to 8:29 AM | 105 (15.3%) | 13 (3.0%) |
| 8:30 AM to 8:59 AM | 0 (0.0%) | 58 (13.5%) |
| 9:00 AM to 9:59 AM | 57 (8.3%) | 25 (5.8%) |
| 10:00 AM to 10:59 AM | 0 (0.0%) | 41 (9.5%) |
| 11:00 AM to 11:59 AM | 38 (5.5%) | 23 (5.3%) |
| 12:00 PM to 3:59 PM | 7 (1.0%) | 20 (4.6%) |
| 4:00 PM to 11:59 PM | 42 (6.1%) | 12 (2.8%) |
| Total | 686 (100.0%) | 431 (100.0%) |
Housing Occupancy in Lake Helen
Occupancy by Ownership in Lake Helen
Of the total 939 dwellings in Lake Helen, owner-occupied units account for 804 (85.6%), while renter-occupied units make up 135 (14.4%).
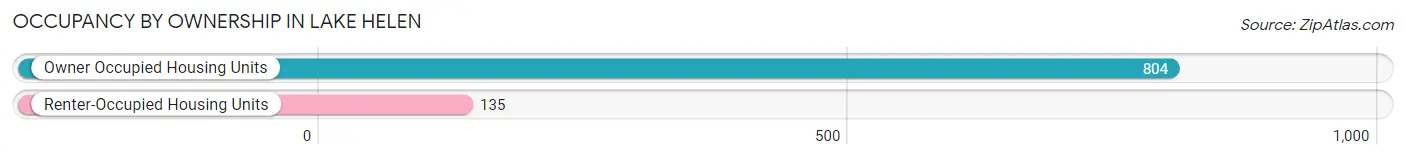
| Occupancy | # Housing Units | % Housing Units |
| Owner Occupied Housing Units | 804 | 85.6% |
| Renter-Occupied Housing Units | 135 | 14.4% |
| Total Occupied Housing Units | 939 | 100.0% |
Occupancy by Household Size in Lake Helen
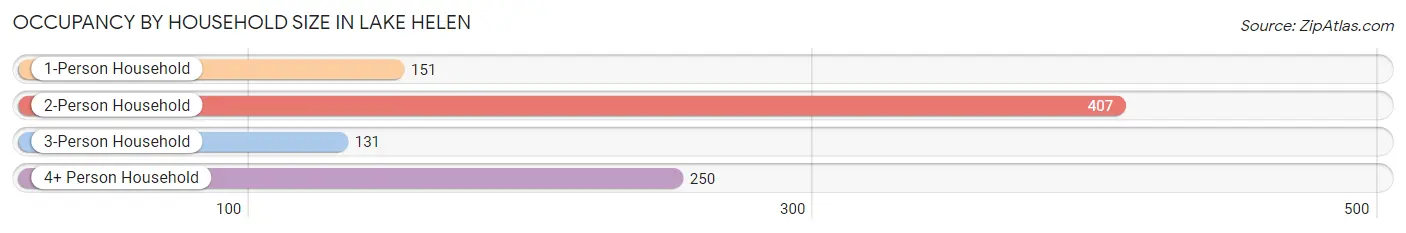
| Household Size | # Housing Units | % Housing Units |
| 1-Person Household | 151 | 16.1% |
| 2-Person Household | 407 | 43.3% |
| 3-Person Household | 131 | 14.0% |
| 4+ Person Household | 250 | 26.6% |
| Total Housing Units | 939 | 100.0% |
Occupancy by Ownership by Household Size in Lake Helen
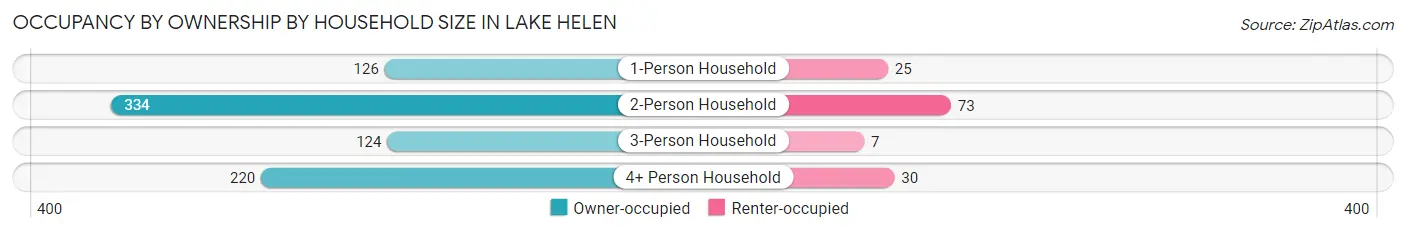
| Household Size | Owner-occupied | Renter-occupied |
| 1-Person Household | 126 (83.4%) | 25 (16.6%) |
| 2-Person Household | 334 (82.1%) | 73 (17.9%) |
| 3-Person Household | 124 (94.7%) | 7 (5.3%) |
| 4+ Person Household | 220 (88.0%) | 30 (12.0%) |
| Total Housing Units | 804 (85.6%) | 135 (14.4%) |
Occupancy by Educational Attainment in Lake Helen
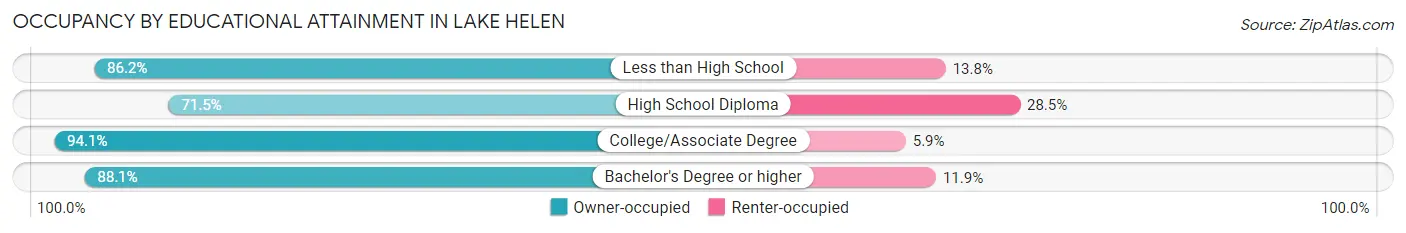
| Household Size | Owner-occupied | Renter-occupied |
| Less than High School | 50 (86.2%) | 8 (13.8%) |
| High School Diploma | 193 (71.5%) | 77 (28.5%) |
| College/Associate Degree | 353 (94.1%) | 22 (5.9%) |
| Bachelor's Degree or higher | 208 (88.1%) | 28 (11.9%) |
Occupancy by Age of Householder in Lake Helen
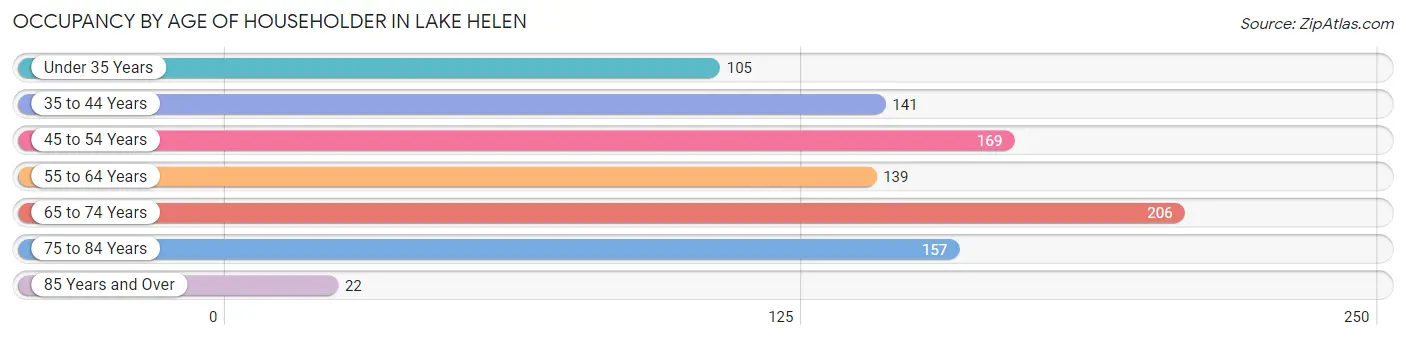
| Age Bracket | # Households | % Households |
| Under 35 Years | 105 | 11.2% |
| 35 to 44 Years | 141 | 15.0% |
| 45 to 54 Years | 169 | 18.0% |
| 55 to 64 Years | 139 | 14.8% |
| 65 to 74 Years | 206 | 21.9% |
| 75 to 84 Years | 157 | 16.7% |
| 85 Years and Over | 22 | 2.3% |
| Total | 939 | 100.0% |
Housing Finances in Lake Helen
Median Income by Occupancy in Lake Helen
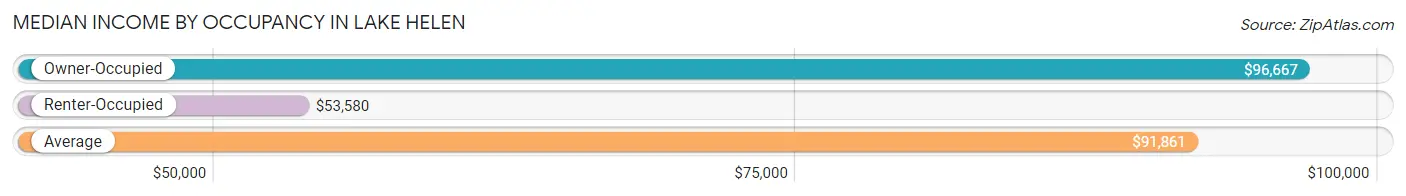
| Occupancy Type | # Households | Median Income |
| Owner-Occupied | 804 (85.6%) | $96,667 |
| Renter-Occupied | 135 (14.4%) | $53,580 |
| Average | 939 (100.0%) | $91,861 |
Occupancy by Householder Income Bracket in Lake Helen
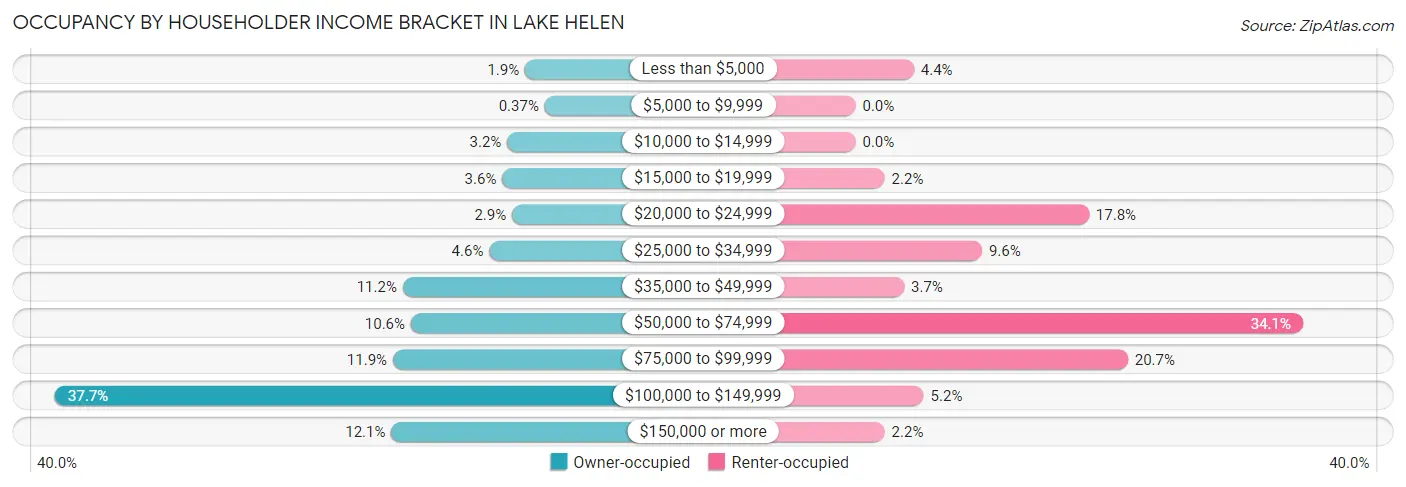
| Income Bracket | Owner-occupied | Renter-occupied |
| Less than $5,000 | 15 (1.9%) | 6 (4.4%) |
| $5,000 to $9,999 | 3 (0.4%) | 0 (0.0%) |
| $10,000 to $14,999 | 26 (3.2%) | 0 (0.0%) |
| $15,000 to $19,999 | 29 (3.6%) | 3 (2.2%) |
| $20,000 to $24,999 | 23 (2.9%) | 24 (17.8%) |
| $25,000 to $34,999 | 37 (4.6%) | 13 (9.6%) |
| $35,000 to $49,999 | 90 (11.2%) | 5 (3.7%) |
| $50,000 to $74,999 | 85 (10.6%) | 46 (34.1%) |
| $75,000 to $99,999 | 96 (11.9%) | 28 (20.7%) |
| $100,000 to $149,999 | 303 (37.7%) | 7 (5.2%) |
| $150,000 or more | 97 (12.1%) | 3 (2.2%) |
| Total | 804 (100.0%) | 135 (100.0%) |
Monthly Housing Cost Tiers in Lake Helen
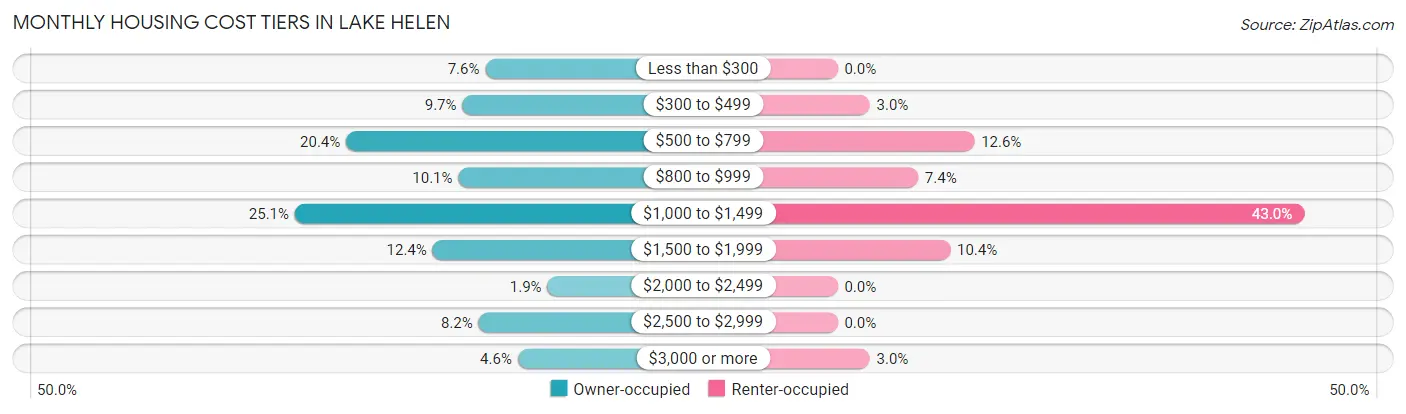
| Monthly Cost | Owner-occupied | Renter-occupied |
| Less than $300 | 61 (7.6%) | 0 (0.0%) |
| $300 to $499 | 78 (9.7%) | 4 (3.0%) |
| $500 to $799 | 164 (20.4%) | 17 (12.6%) |
| $800 to $999 | 81 (10.1%) | 10 (7.4%) |
| $1,000 to $1,499 | 202 (25.1%) | 58 (43.0%) |
| $1,500 to $1,999 | 100 (12.4%) | 14 (10.4%) |
| $2,000 to $2,499 | 15 (1.9%) | 0 (0.0%) |
| $2,500 to $2,999 | 66 (8.2%) | 0 (0.0%) |
| $3,000 or more | 37 (4.6%) | 4 (3.0%) |
| Total | 804 (100.0%) | 135 (100.0%) |
Physical Housing Characteristics in Lake Helen
Housing Structures in Lake Helen
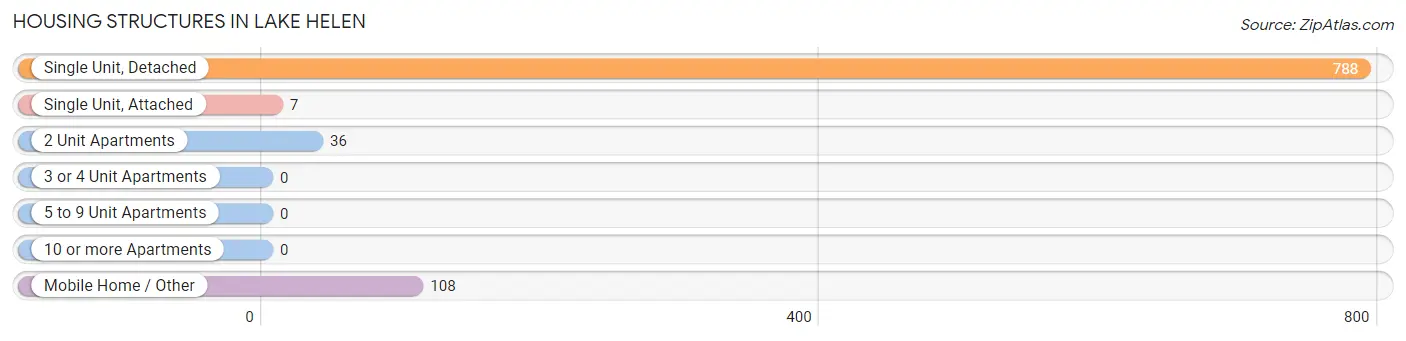
| Structure Type | # Housing Units | % Housing Units |
| Single Unit, Detached | 788 | 83.9% |
| Single Unit, Attached | 7 | 0.7% |
| 2 Unit Apartments | 36 | 3.8% |
| 3 or 4 Unit Apartments | 0 | 0.0% |
| 5 to 9 Unit Apartments | 0 | 0.0% |
| 10 or more Apartments | 0 | 0.0% |
| Mobile Home / Other | 108 | 11.5% |
| Total | 939 | 100.0% |
Housing Structures by Occupancy in Lake Helen
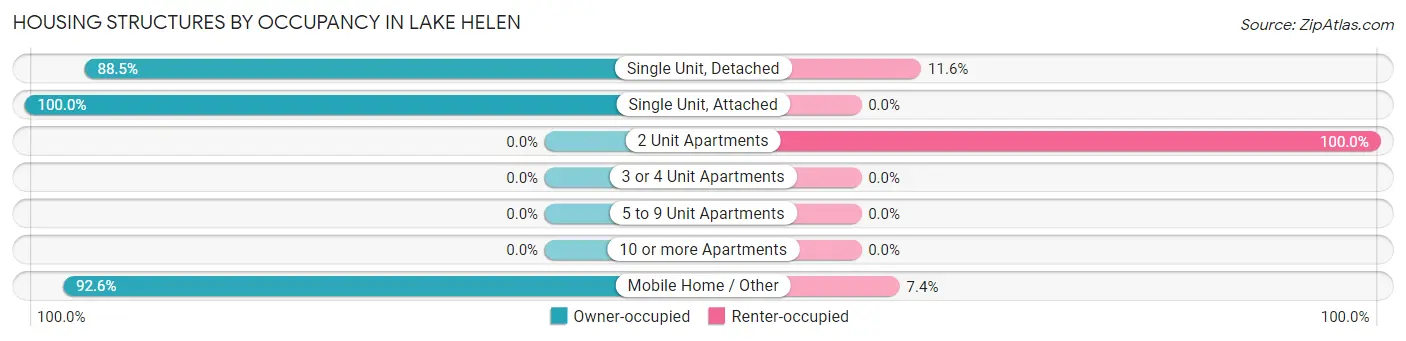
| Structure Type | Owner-occupied | Renter-occupied |
| Single Unit, Detached | 697 (88.4%) | 91 (11.6%) |
| Single Unit, Attached | 7 (100.0%) | 0 (0.0%) |
| 2 Unit Apartments | 0 (0.0%) | 36 (100.0%) |
| 3 or 4 Unit Apartments | 0 (0.0%) | 0 (0.0%) |
| 5 to 9 Unit Apartments | 0 (0.0%) | 0 (0.0%) |
| 10 or more Apartments | 0 (0.0%) | 0 (0.0%) |
| Mobile Home / Other | 100 (92.6%) | 8 (7.4%) |
| Total | 804 (85.6%) | 135 (14.4%) |
Housing Structures by Number of Rooms in Lake Helen
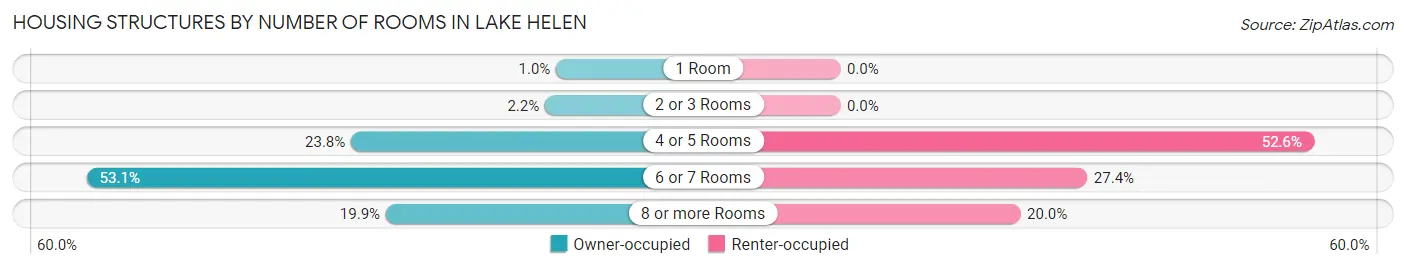
| Number of Rooms | Owner-occupied | Renter-occupied |
| 1 Room | 8 (1.0%) | 0 (0.0%) |
| 2 or 3 Rooms | 18 (2.2%) | 0 (0.0%) |
| 4 or 5 Rooms | 191 (23.8%) | 71 (52.6%) |
| 6 or 7 Rooms | 427 (53.1%) | 37 (27.4%) |
| 8 or more Rooms | 160 (19.9%) | 27 (20.0%) |
| Total | 804 (100.0%) | 135 (100.0%) |
Housing Structure by Heating Type in Lake Helen
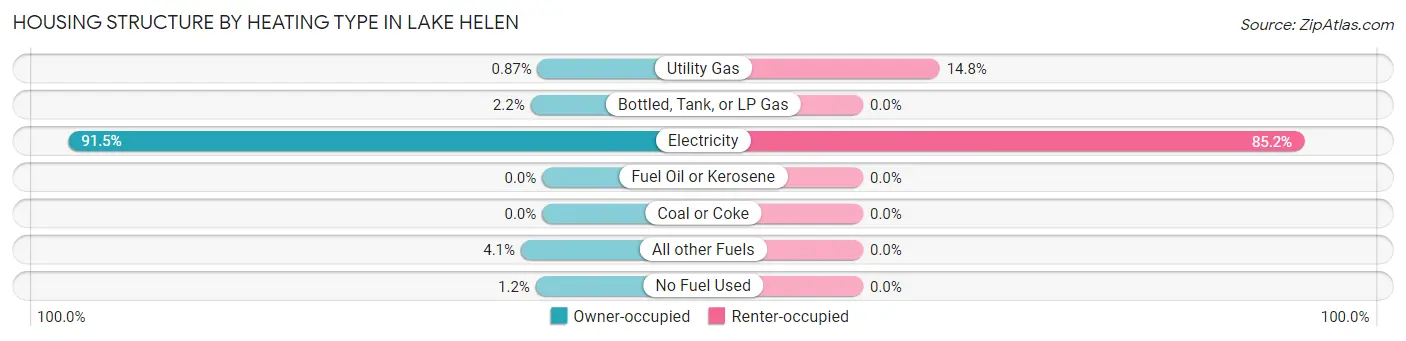
| Heating Type | Owner-occupied | Renter-occupied |
| Utility Gas | 7 (0.9%) | 20 (14.8%) |
| Bottled, Tank, or LP Gas | 18 (2.2%) | 0 (0.0%) |
| Electricity | 736 (91.5%) | 115 (85.2%) |
| Fuel Oil or Kerosene | 0 (0.0%) | 0 (0.0%) |
| Coal or Coke | 0 (0.0%) | 0 (0.0%) |
| All other Fuels | 33 (4.1%) | 0 (0.0%) |
| No Fuel Used | 10 (1.2%) | 0 (0.0%) |
| Total | 804 (100.0%) | 135 (100.0%) |
Household Vehicle Usage in Lake Helen
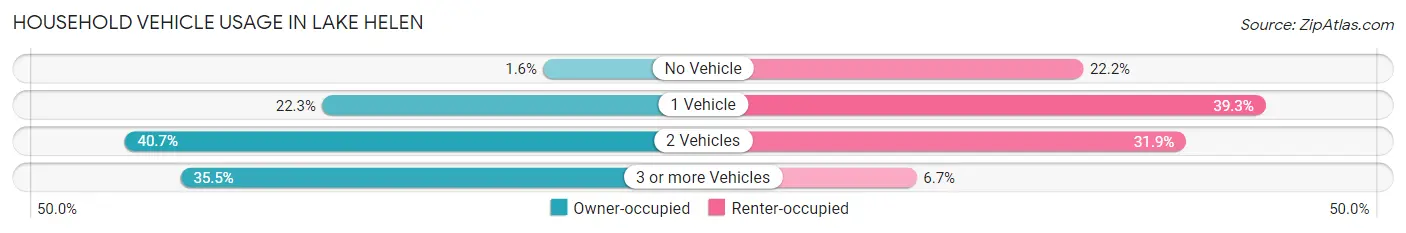
| Vehicles per Household | Owner-occupied | Renter-occupied |
| No Vehicle | 13 (1.6%) | 30 (22.2%) |
| 1 Vehicle | 179 (22.3%) | 53 (39.3%) |
| 2 Vehicles | 327 (40.7%) | 43 (31.9%) |
| 3 or more Vehicles | 285 (35.4%) | 9 (6.7%) |
| Total | 804 (100.0%) | 135 (100.0%) |
Real Estate & Mortgages in Lake Helen
Real Estate and Mortgage Overview in Lake Helen
| Characteristic | Without Mortgage | With Mortgage |
| Housing Units | 386 | 418 |
| Median Property Value | $275,000 | $302,400 |
| Median Household Income | $90,556 | $65 |
| Monthly Housing Costs | $717 | $37 |
| Real Estate Taxes | $2,091 | $20 |
Property Value by Mortgage Status in Lake Helen
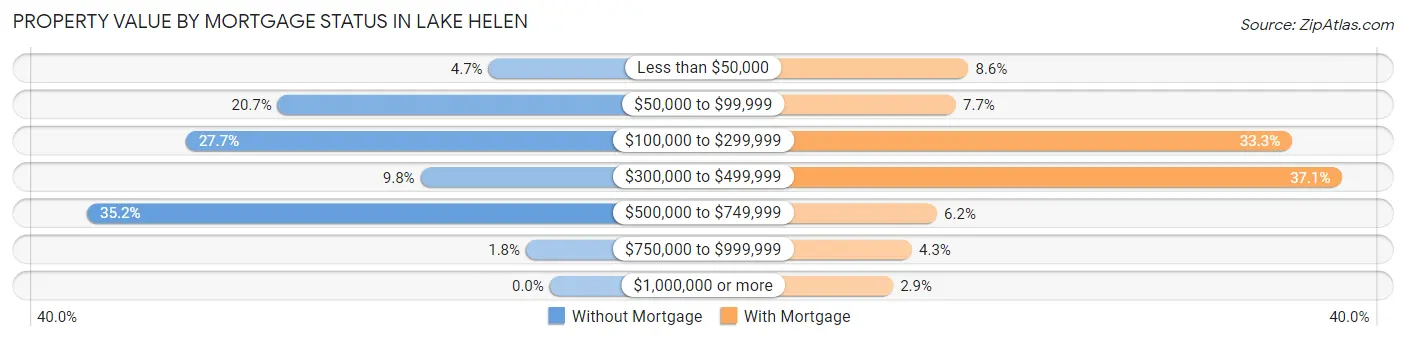
| Property Value | Without Mortgage | With Mortgage |
| Less than $50,000 | 18 (4.7%) | 36 (8.6%) |
| $50,000 to $99,999 | 80 (20.7%) | 32 (7.7%) |
| $100,000 to $299,999 | 107 (27.7%) | 139 (33.3%) |
| $300,000 to $499,999 | 38 (9.8%) | 155 (37.1%) |
| $500,000 to $749,999 | 136 (35.2%) | 26 (6.2%) |
| $750,000 to $999,999 | 7 (1.8%) | 18 (4.3%) |
| $1,000,000 or more | 0 (0.0%) | 12 (2.9%) |
| Total | 386 (100.0%) | 418 (100.0%) |
Household Income by Mortgage Status in Lake Helen
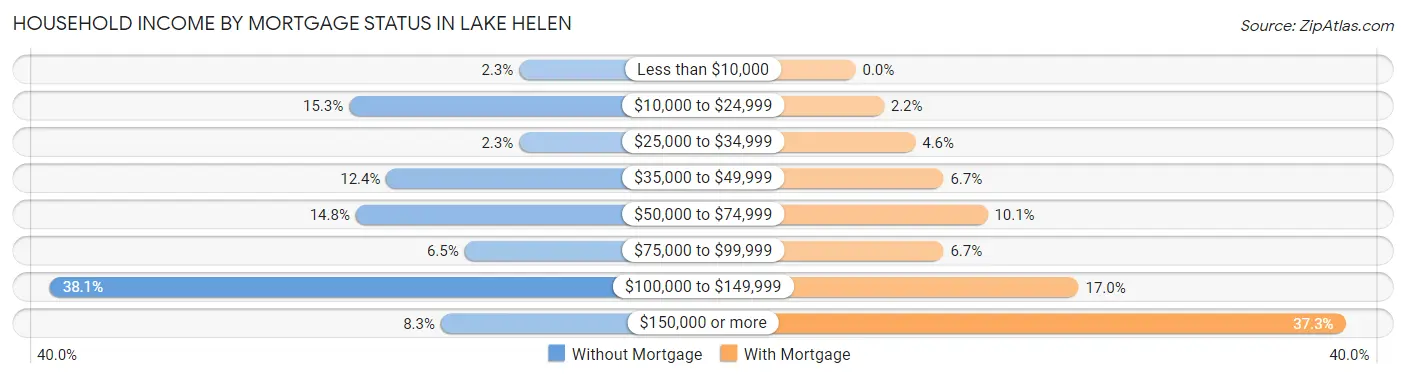
| Household Income | Without Mortgage | With Mortgage |
| Less than $10,000 | 9 (2.3%) | 0 (0.0%) |
| $10,000 to $24,999 | 59 (15.3%) | 9 (2.1%) |
| $25,000 to $34,999 | 9 (2.3%) | 19 (4.5%) |
| $35,000 to $49,999 | 48 (12.4%) | 28 (6.7%) |
| $50,000 to $74,999 | 57 (14.8%) | 42 (10.1%) |
| $75,000 to $99,999 | 25 (6.5%) | 28 (6.7%) |
| $100,000 to $149,999 | 147 (38.1%) | 71 (17.0%) |
| $150,000 or more | 32 (8.3%) | 156 (37.3%) |
| Total | 386 (100.0%) | 418 (100.0%) |
Property Value to Household Income Ratio in Lake Helen
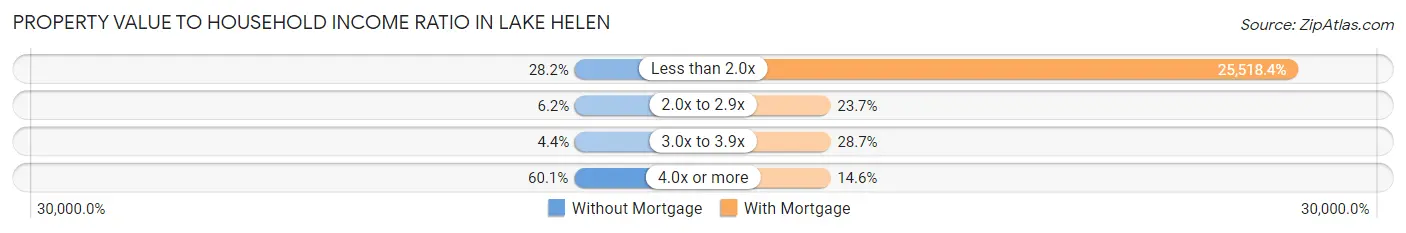
| Value-to-Income Ratio | Without Mortgage | With Mortgage |
| Less than 2.0x | 109 (28.2%) | 106,667 (25,518.4%) |
| 2.0x to 2.9x | 24 (6.2%) | 99 (23.7%) |
| 3.0x to 3.9x | 17 (4.4%) | 120 (28.7%) |
| 4.0x or more | 232 (60.1%) | 61 (14.6%) |
| Total | 386 (100.0%) | 418 (100.0%) |
Real Estate Taxes by Mortgage Status in Lake Helen
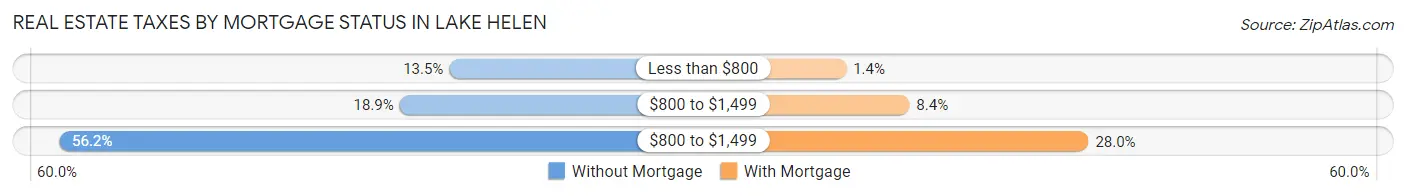
| Property Taxes | Without Mortgage | With Mortgage |
| Less than $800 | 52 (13.5%) | 6 (1.4%) |
| $800 to $1,499 | 73 (18.9%) | 35 (8.4%) |
| $800 to $1,499 | 217 (56.2%) | 117 (28.0%) |
| Total | 386 (100.0%) | 418 (100.0%) |
Health & Disability in Lake Helen
Health Insurance Coverage by Age in Lake Helen
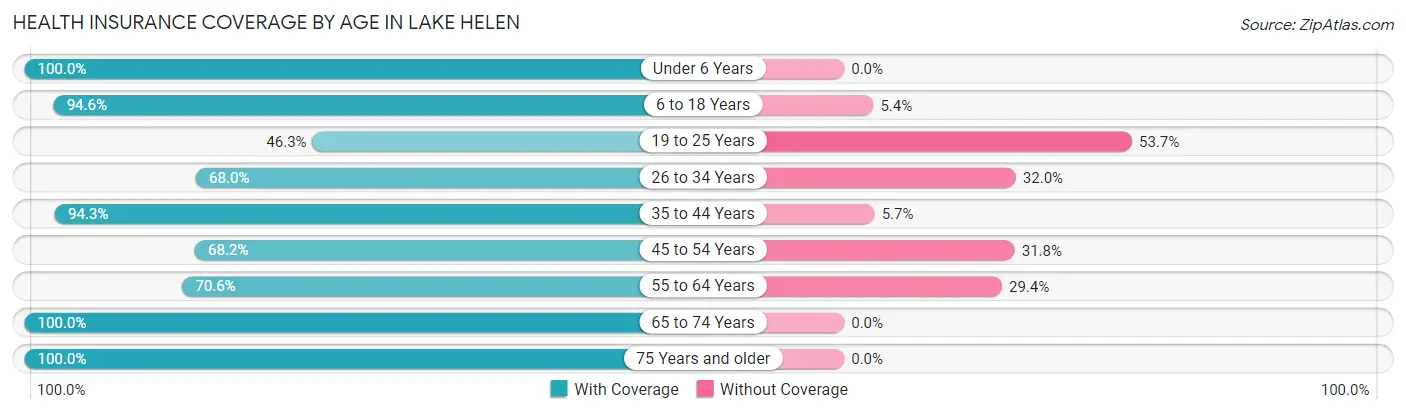
| Age Bracket | With Coverage | Without Coverage |
| Under 6 Years | 184 (100.0%) | 0 (0.0%) |
| 6 to 18 Years | 469 (94.6%) | 27 (5.4%) |
| 19 to 25 Years | 82 (46.3%) | 95 (53.7%) |
| 26 to 34 Years | 238 (68.0%) | 112 (32.0%) |
| 35 to 44 Years | 299 (94.3%) | 18 (5.7%) |
| 45 to 54 Years | 208 (68.2%) | 97 (31.8%) |
| 55 to 64 Years | 247 (70.6%) | 103 (29.4%) |
| 65 to 74 Years | 407 (100.0%) | 0 (0.0%) |
| 75 Years and older | 250 (100.0%) | 0 (0.0%) |
| Total | 2,384 (84.1%) | 452 (15.9%) |
Health Insurance Coverage by Citizenship Status in Lake Helen
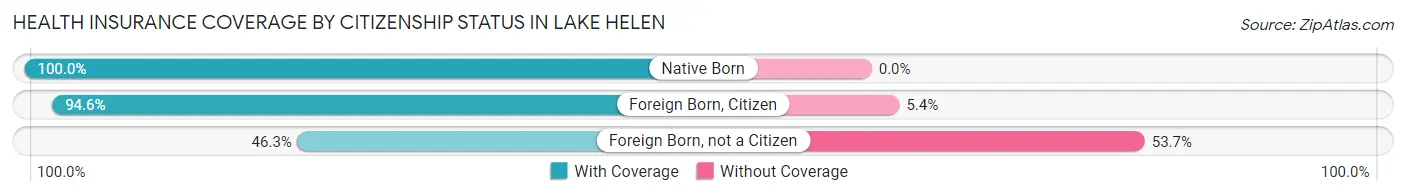
| Citizenship Status | With Coverage | Without Coverage |
| Native Born | 184 (100.0%) | 0 (0.0%) |
| Foreign Born, Citizen | 469 (94.6%) | 27 (5.4%) |
| Foreign Born, not a Citizen | 82 (46.3%) | 95 (53.7%) |
Health Insurance Coverage by Household Income in Lake Helen
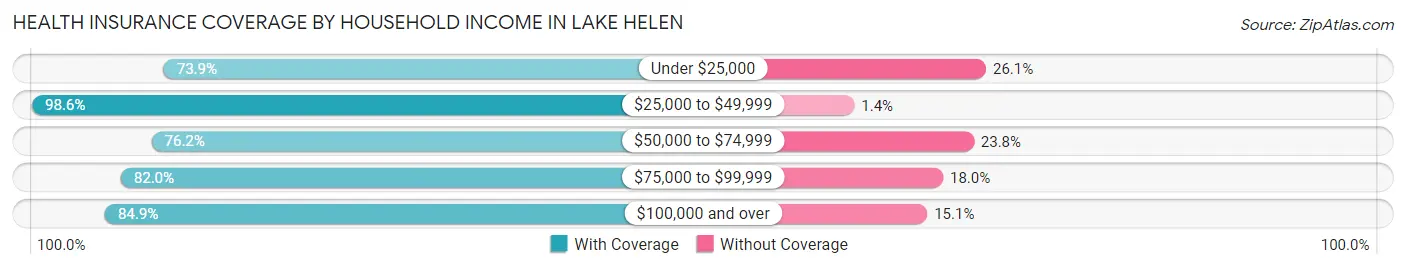
| Household Income | With Coverage | Without Coverage |
| Under $25,000 | 153 (73.9%) | 54 (26.1%) |
| $25,000 to $49,999 | 279 (98.6%) | 4 (1.4%) |
| $50,000 to $74,999 | 253 (76.2%) | 79 (23.8%) |
| $75,000 to $99,999 | 318 (82.0%) | 70 (18.0%) |
| $100,000 and over | 1,381 (84.9%) | 245 (15.1%) |
Public vs Private Health Insurance Coverage by Age in Lake Helen
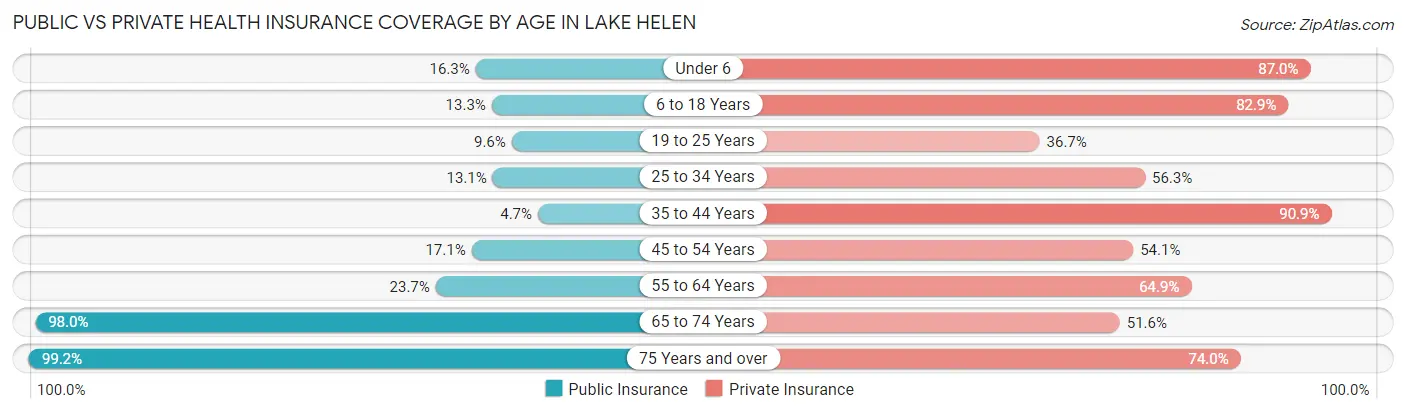
| Age Bracket | Public Insurance | Private Insurance |
| Under 6 | 30 (16.3%) | 160 (87.0%) |
| 6 to 18 Years | 66 (13.3%) | 411 (82.9%) |
| 19 to 25 Years | 17 (9.6%) | 65 (36.7%) |
| 25 to 34 Years | 46 (13.1%) | 197 (56.3%) |
| 35 to 44 Years | 15 (4.7%) | 288 (90.8%) |
| 45 to 54 Years | 52 (17.1%) | 165 (54.1%) |
| 55 to 64 Years | 83 (23.7%) | 227 (64.9%) |
| 65 to 74 Years | 399 (98.0%) | 210 (51.6%) |
| 75 Years and over | 248 (99.2%) | 185 (74.0%) |
| Total | 956 (33.7%) | 1,908 (67.3%) |
Disability Status by Sex by Age in Lake Helen
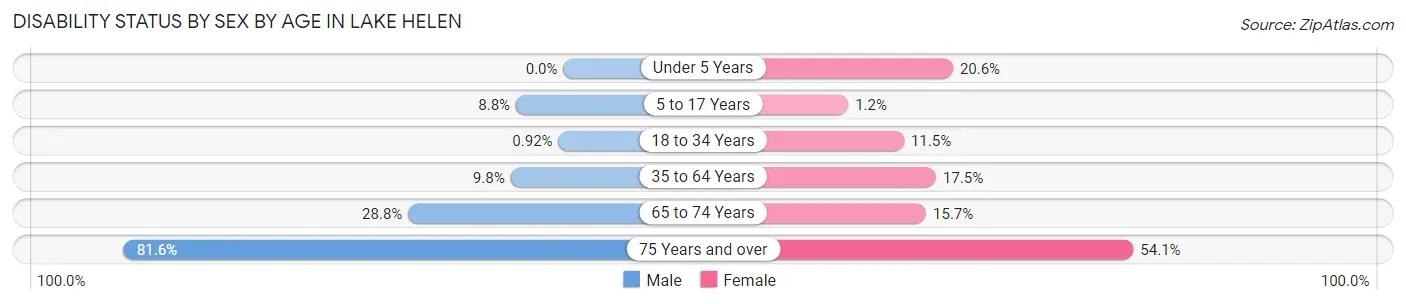
| Age Bracket | Male | Female |
| Under 5 Years | 0 (0.0%) | 13 (20.6%) |
| 5 to 17 Years | 25 (8.8%) | 3 (1.2%) |
| 18 to 34 Years | 3 (0.9%) | 24 (11.5%) |
| 35 to 64 Years | 46 (9.8%) | 88 (17.5%) |
| 65 to 74 Years | 51 (28.8%) | 36 (15.7%) |
| 75 Years and over | 115 (81.6%) | 59 (54.1%) |
Disability Class by Sex by Age in Lake Helen
Disability Class: Hearing Difficulty
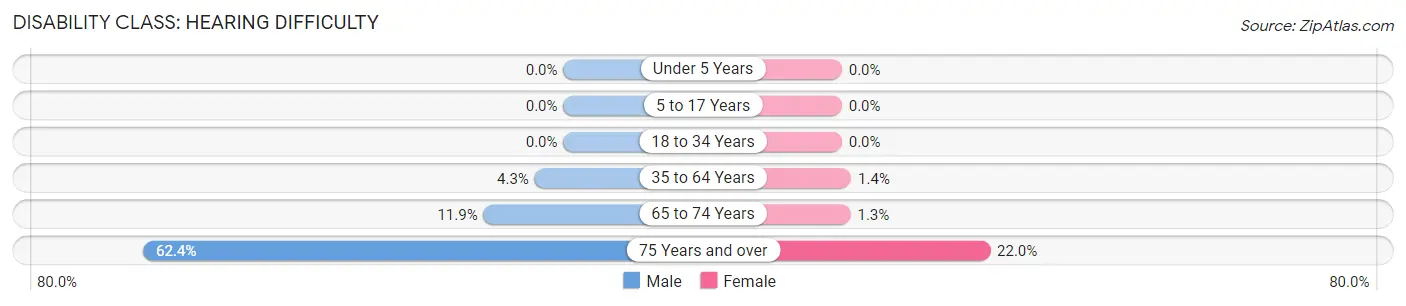
| Age Bracket | Male | Female |
| Under 5 Years | 0 (0.0%) | 0 (0.0%) |
| 5 to 17 Years | 0 (0.0%) | 0 (0.0%) |
| 18 to 34 Years | 0 (0.0%) | 0 (0.0%) |
| 35 to 64 Years | 20 (4.3%) | 7 (1.4%) |
| 65 to 74 Years | 21 (11.9%) | 3 (1.3%) |
| 75 Years and over | 88 (62.4%) | 24 (22.0%) |
Disability Class: Vision Difficulty
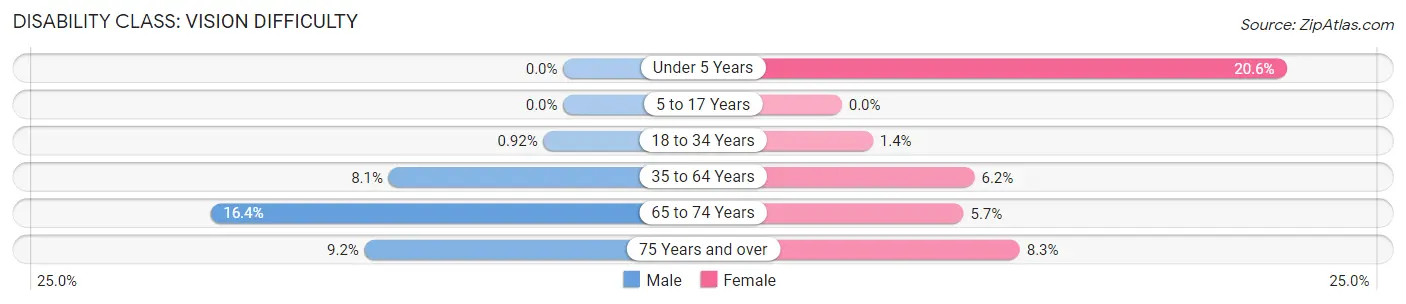
| Age Bracket | Male | Female |
| Under 5 Years | 0 (0.0%) | 13 (20.6%) |
| 5 to 17 Years | 0 (0.0%) | 0 (0.0%) |
| 18 to 34 Years | 3 (0.9%) | 3 (1.4%) |
| 35 to 64 Years | 38 (8.1%) | 31 (6.2%) |
| 65 to 74 Years | 29 (16.4%) | 13 (5.7%) |
| 75 Years and over | 13 (9.2%) | 9 (8.3%) |
Disability Class: Cognitive Difficulty
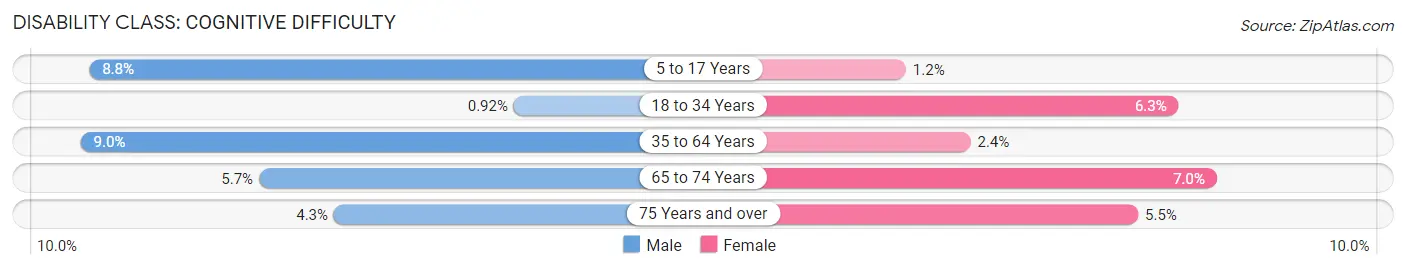
| Age Bracket | Male | Female |
| 5 to 17 Years | 25 (8.8%) | 3 (1.2%) |
| 18 to 34 Years | 3 (0.9%) | 13 (6.2%) |
| 35 to 64 Years | 42 (9.0%) | 12 (2.4%) |
| 65 to 74 Years | 10 (5.7%) | 16 (7.0%) |
| 75 Years and over | 6 (4.3%) | 6 (5.5%) |
Disability Class: Ambulatory Difficulty
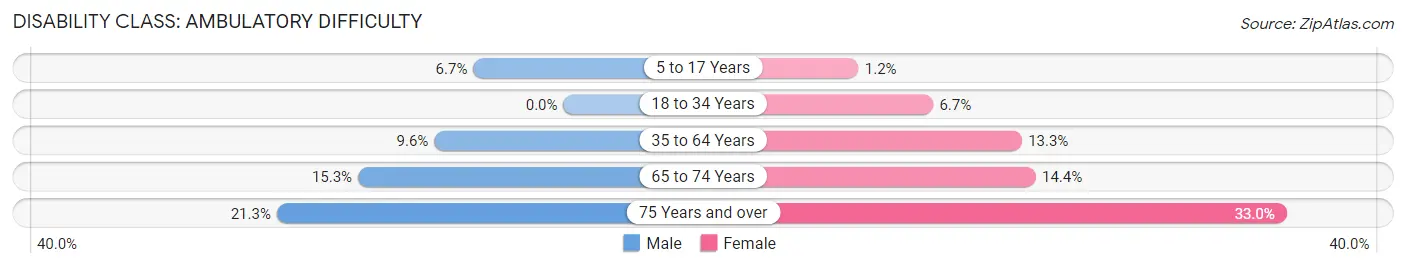
| Age Bracket | Male | Female |
| 5 to 17 Years | 19 (6.7%) | 3 (1.2%) |
| 18 to 34 Years | 0 (0.0%) | 14 (6.7%) |
| 35 to 64 Years | 45 (9.6%) | 67 (13.3%) |
| 65 to 74 Years | 27 (15.2%) | 33 (14.3%) |
| 75 Years and over | 30 (21.3%) | 36 (33.0%) |
Disability Class: Self-Care Difficulty
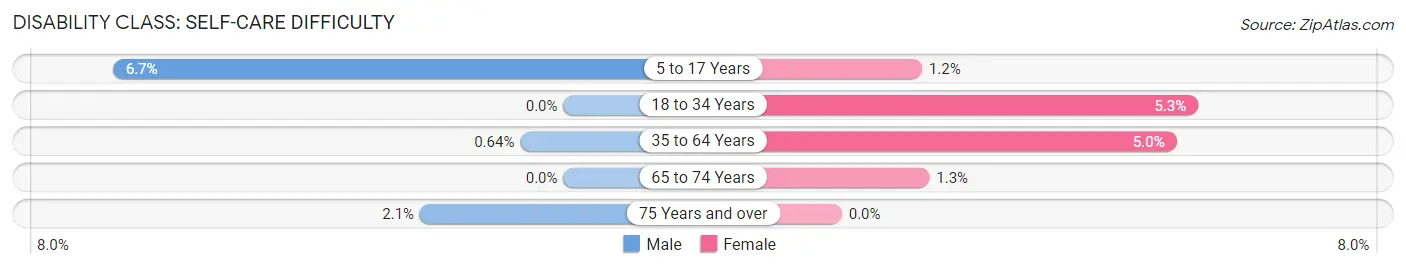
| Age Bracket | Male | Female |
| 5 to 17 Years | 19 (6.7%) | 3 (1.2%) |
| 18 to 34 Years | 0 (0.0%) | 11 (5.3%) |
| 35 to 64 Years | 3 (0.6%) | 25 (5.0%) |
| 65 to 74 Years | 0 (0.0%) | 3 (1.3%) |
| 75 Years and over | 3 (2.1%) | 0 (0.0%) |
Technology Access in Lake Helen
Computing Device Access in Lake Helen
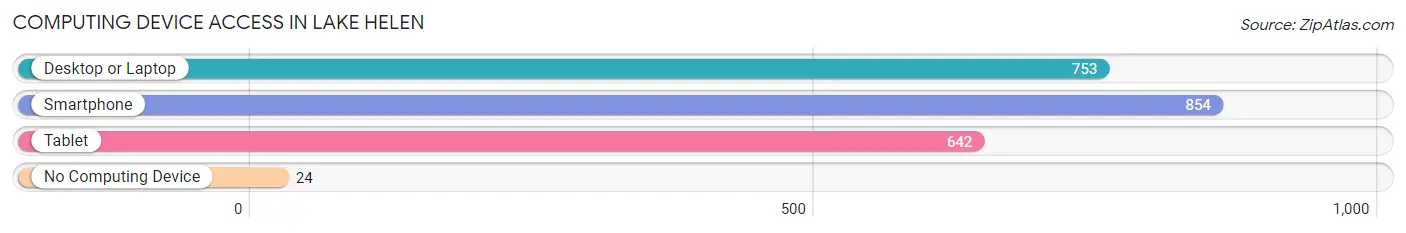
| Device Type | # Households | % Households |
| Desktop or Laptop | 753 | 80.2% |
| Smartphone | 854 | 90.9% |
| Tablet | 642 | 68.4% |
| No Computing Device | 24 | 2.6% |
| Total | 939 | 100.0% |
Internet Access in Lake Helen
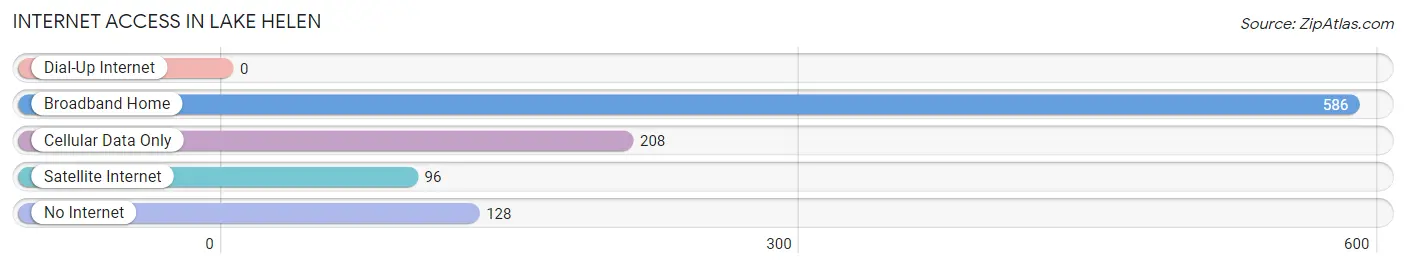
| Internet Type | # Households | % Households |
| Dial-Up Internet | 0 | 0.0% |
| Broadband Home | 586 | 62.4% |
| Cellular Data Only | 208 | 22.2% |
| Satellite Internet | 96 | 10.2% |
| No Internet | 128 | 13.6% |
| Total | 939 | 100.0% |
Lake Helen Summary
History
Lake Helen is a small city located in Volusia County, Florida. It is situated between the cities of Deltona and DeLand, and is part of the Deltona-Daytona Beach-Ormond Beach metropolitan area. The city was founded in 1883 by a group of settlers from Ohio, led by John F. O’Berry. The city was named after O’Berry’s daughter, Helen.
The city was originally a farming community, and the main crops grown were oranges, cotton, and sugar cane. The city was also home to a number of small businesses, including a sawmill, a grist mill, and a general store. In the early 1900s, the city began to grow as a tourist destination, and a number of hotels and resorts were built in the area.
In the 1950s, the city began to experience a population boom, as many people moved to the area to take advantage of the booming economy. The city was incorporated in 1957, and the population continued to grow throughout the 1960s and 1970s.
Geography
Lake Helen is located in central Florida, in Volusia County. The city is situated between the cities of Deltona and DeLand, and is part of the Deltona-Daytona Beach-Ormond Beach metropolitan area. The city is located on the shores of Lake Helen, a small lake that is part of the St. Johns River system. The city is also located near the Ocala National Forest, which is a popular destination for outdoor activities such as camping, hiking, and fishing.
The city has a total area of 1.3 square miles, all of which is land. The city is located at an elevation of 33 feet above sea level. The climate in Lake Helen is classified as humid subtropical, with hot, humid summers and mild winters.
Economy
The economy of Lake Helen is largely based on tourism and retail. The city is home to a number of small businesses, including restaurants, shops, and hotels. The city is also home to a number of manufacturing companies, including a paper mill and a plastics factory.
The city is also home to a number of educational institutions, including Stetson University and Daytona State College. The city is also home to a number of medical facilities, including Florida Hospital DeLand and Florida Hospital Fish Memorial.
Demographics
As of the 2010 census, the population of Lake Helen was 2,534. The racial makeup of the city was 87.3% White, 8.2% African American, 0.4% Native American, 0.7% Asian, 0.1% Pacific Islander, 1.2% from other races, and 2.1% from two or more races. Hispanic or Latino of any race were 4.2% of the population.
The median household income in Lake Helen was $37,917, and the median family income was $45,313. The per capita income for the city was $20,945. About 11.3% of families and 14.2% of the population were below the poverty line, including 19.2% of those under age 18 and 8.3% of those age 65 or over.
Common Questions
What is Per Capita Income in Lake Helen?
Per Capita income in Lake Helen is $31,377.
What is the Median Family Income in Lake Helen?
Median Family Income in Lake Helen is $94,208.
What is the Median Household income in Lake Helen?
Median Household Income in Lake Helen is $91,861.
What is Income or Wage Gap in Lake Helen?
Income or Wage Gap in Lake Helen is 44.2%.
Women in Lake Helen earn 55.8 cents for every dollar earned by a man.
What is Inequality or Gini Index in Lake Helen?
Inequality or Gini Index in Lake Helen is 0.34.
What is the Total Population of Lake Helen?
Total Population of Lake Helen is 2,836.
What is the Total Male Population of Lake Helen?
Total Male Population of Lake Helen is 1,471.
What is the Total Female Population of Lake Helen?
Total Female Population of Lake Helen is 1,365.
What is the Ratio of Males per 100 Females in Lake Helen?
There are 107.77 Males per 100 Females in Lake Helen.
What is the Ratio of Females per 100 Males in Lake Helen?
There are 92.79 Females per 100 Males in Lake Helen.
What is the Median Population Age in Lake Helen?
Median Population Age in Lake Helen is 41.1 Years.
What is the Average Family Size in Lake Helen
Average Family Size in Lake Helen is 3.4 People.
What is the Average Household Size in Lake Helen
Average Household Size in Lake Helen is 3.0 People.
How Large is the Labor Force in Lake Helen?
There are 1,230 People in the Labor Forcein in Lake Helen.
What is the Percentage of People in the Labor Force in Lake Helen?
55.9% of People are in the Labor Force in Lake Helen.
What is the Unemployment Rate in Lake Helen?
Unemployment Rate in Lake Helen is 3.9%.