Talmage, CA Map & Demographics
Talmage Map
Talmage Overview
$33,786
PER CAPITA INCOME
$35,382
AVG FAMILY INCOME
$37,017
AVG HOUSEHOLD INCOME
56.6%
WAGE / INCOME GAP [ % ]
43.4¢/ $1
WAGE / INCOME GAP [ $ ]
$8,246
FAMILY INCOME DEFICIT
0.64
INEQUALITY / GINI INDEX
1,031
TOTAL POPULATION
298
MALE POPULATION
733
FEMALE POPULATION
40.65
MALES / 100 FEMALES
245.97
FEMALES / 100 MALES
31.3
MEDIAN AGE
2.7
AVG FAMILY SIZE
2.2
AVG HOUSEHOLD SIZE
246
LABOR FORCE [ PEOPLE ]
30.3%
PERCENT IN LABOR FORCE
8.1%
UNEMPLOYMENT RATE
Talmage Area Codes
Income in Talmage
Income Overview in Talmage
Per Capita Income in Talmage is $33,786, while median incomes of families and households are $35,382 and $37,017 respectively.
| Characteristic | Number | Measure |
| Per Capita Income | 1,031 | $33,786 |
| Median Family Income | 197 | $35,382 |
| Mean Family Income | 197 | $45,540 |
| Median Household Income | 289 | $37,017 |
| Mean Household Income | 289 | $112,449 |
| Income Deficit | 197 | $8,246 |
| Wage / Income Gap (%) | 1,031 | 56.60% |
| Wage / Income Gap ($) | 1,031 | 43.40¢ per $1 |
| Gini / Inequality Index | 1,031 | 0.64 |
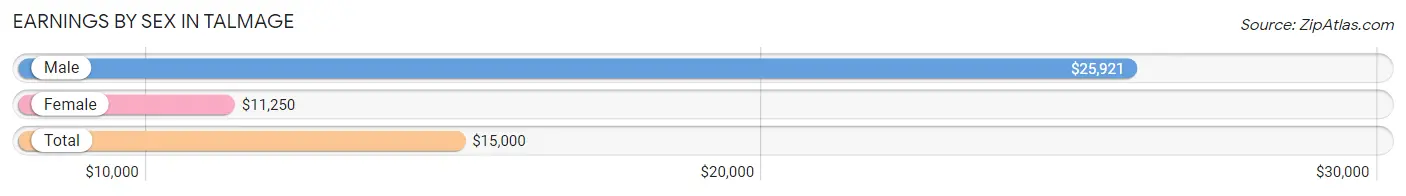
Earnings by Sex in Talmage
Average Earnings in Talmage are $15,000, $25,921 for men and $11,250 for women, a difference of 56.6%.
| Sex | Number | Average Earnings |
| Male | 174 (48.6%) | $25,921 |
| Female | 184 (51.4%) | $11,250 |
| Total | 358 (100.0%) | $15,000 |
Earnings by Sex by Income Bracket in Talmage
The most common earnings brackets in Talmage are $30,000 to $34,999 for men (46 | 26.4%) and $2,499 or less for women (47 | 25.5%).
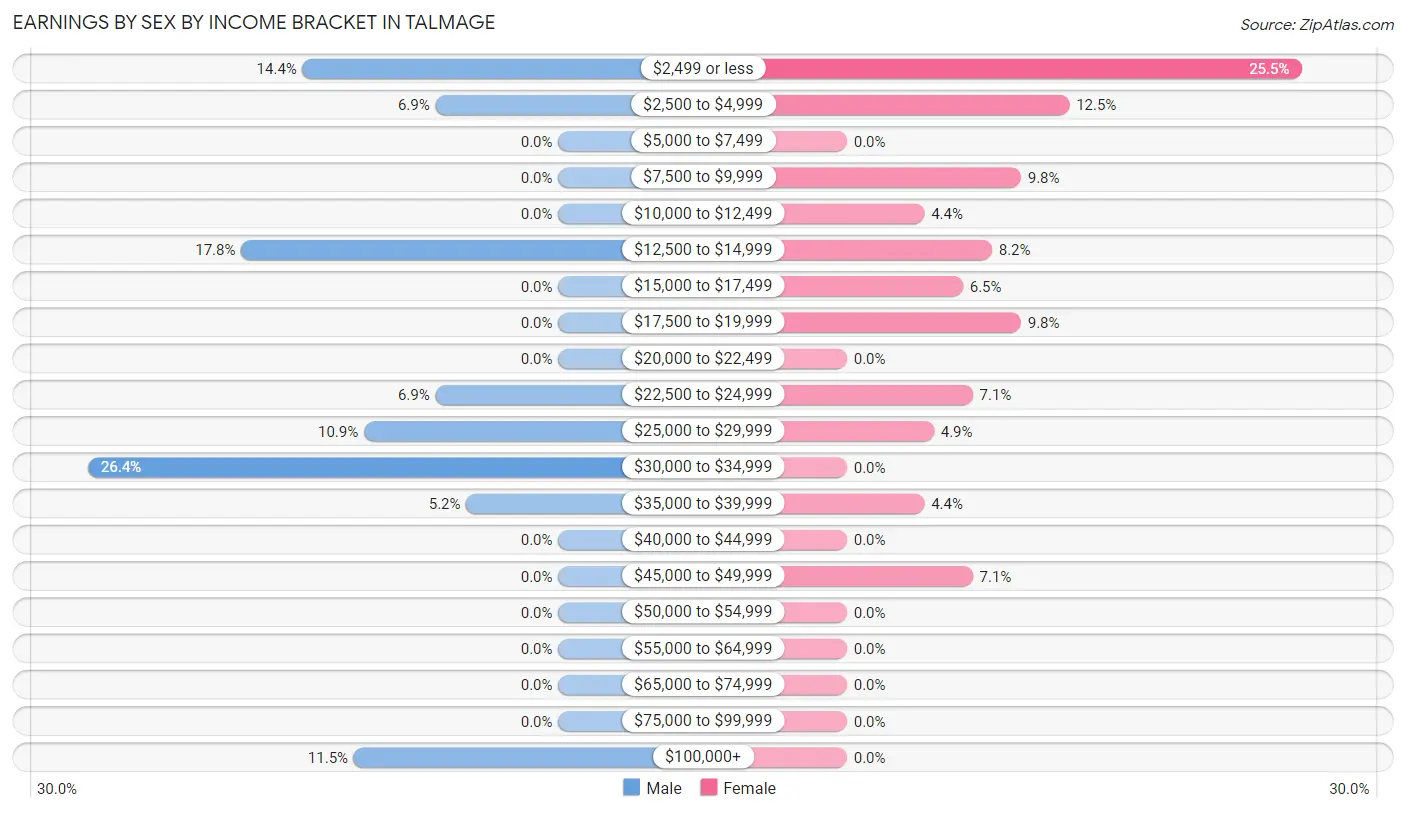
| Income | Male | Female |
| $2,499 or less | 25 (14.4%) | 47 (25.5%) |
| $2,500 to $4,999 | 12 (6.9%) | 23 (12.5%) |
| $5,000 to $7,499 | 0 (0.0%) | 0 (0.0%) |
| $7,500 to $9,999 | 0 (0.0%) | 18 (9.8%) |
| $10,000 to $12,499 | 0 (0.0%) | 8 (4.3%) |
| $12,500 to $14,999 | 31 (17.8%) | 15 (8.2%) |
| $15,000 to $17,499 | 0 (0.0%) | 12 (6.5%) |
| $17,500 to $19,999 | 0 (0.0%) | 18 (9.8%) |
| $20,000 to $22,499 | 0 (0.0%) | 0 (0.0%) |
| $22,500 to $24,999 | 12 (6.9%) | 13 (7.1%) |
| $25,000 to $29,999 | 19 (10.9%) | 9 (4.9%) |
| $30,000 to $34,999 | 46 (26.4%) | 0 (0.0%) |
| $35,000 to $39,999 | 9 (5.2%) | 8 (4.3%) |
| $40,000 to $44,999 | 0 (0.0%) | 0 (0.0%) |
| $45,000 to $49,999 | 0 (0.0%) | 13 (7.1%) |
| $50,000 to $54,999 | 0 (0.0%) | 0 (0.0%) |
| $55,000 to $64,999 | 0 (0.0%) | 0 (0.0%) |
| $65,000 to $74,999 | 0 (0.0%) | 0 (0.0%) |
| $75,000 to $99,999 | 0 (0.0%) | 0 (0.0%) |
| $100,000+ | 20 (11.5%) | 0 (0.0%) |
| Total | 174 (100.0%) | 184 (100.0%) |
Earnings by Sex by Educational Attainment in Talmage
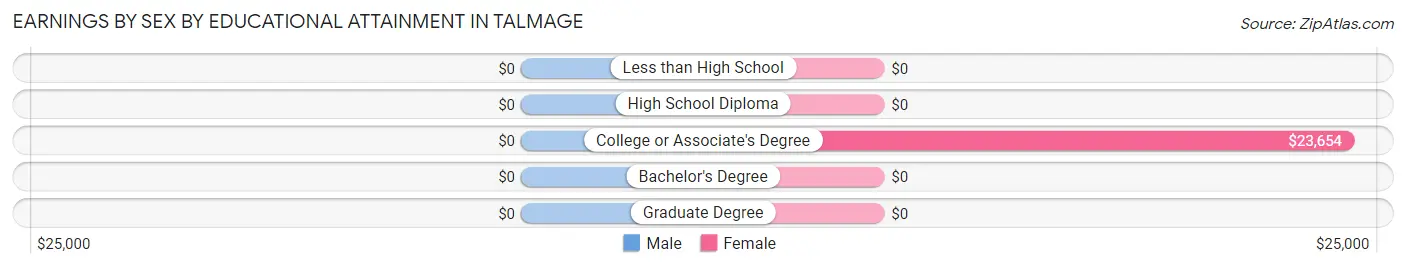
| Educational Attainment | Male Income | Female Income |
| Less than High School | - | - |
| High School Diploma | - | - |
| College or Associate's Degree | - | - |
| Bachelor's Degree | - | - |
| Graduate Degree | - | - |
| Total | $30,190 | $18,542 |
Family Income in Talmage
Family Income Brackets in Talmage
According to the Talmage family income data, there are 69 families falling into the $35,000 to $49,999 income range, which is the most common income bracket and makes up 35.0% of all families.
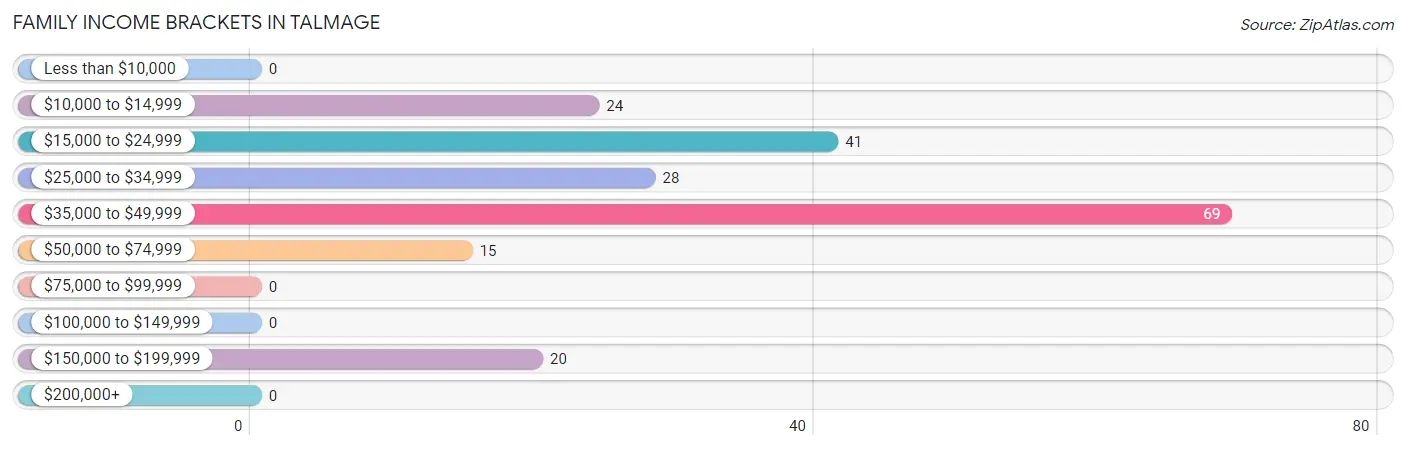
| Income Bracket | # Families | % Families |
| Less than $10,000 | 0 | 0.0% |
| $10,000 to $14,999 | 24 | 12.2% |
| $15,000 to $24,999 | 41 | 20.8% |
| $25,000 to $34,999 | 28 | 14.2% |
| $35,000 to $49,999 | 69 | 35.0% |
| $50,000 to $74,999 | 15 | 7.6% |
| $75,000 to $99,999 | 0 | 0.0% |
| $100,000 to $149,999 | 0 | 0.0% |
| $150,000 to $199,999 | 20 | 10.2% |
| $200,000+ | 0 | 0.0% |
Family Income by Famaliy Size in Talmage
3-person families (62 | 31.5%) account for the highest median family income in Talmage with $35,347 per family, while 2-person families (105 | 53.3%) have the highest median income of $16,875 per family member.
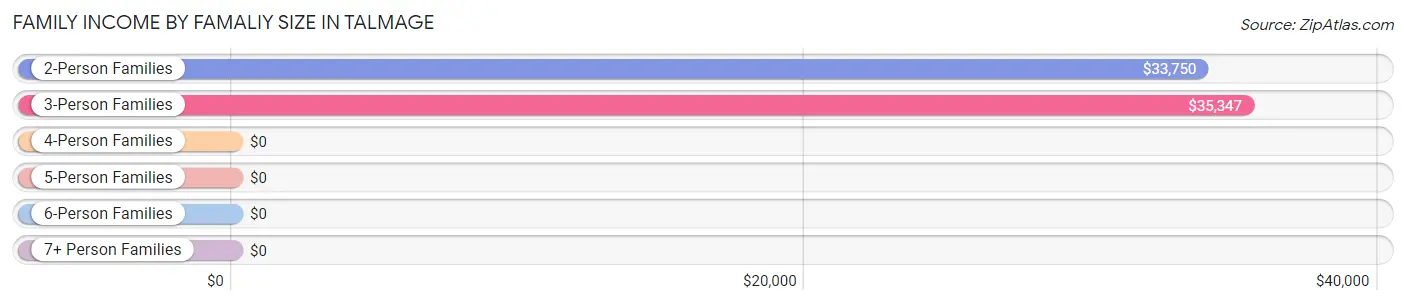
| Income Bracket | # Families | Median Income |
| 2-Person Families | 105 (53.3%) | $33,750 |
| 3-Person Families | 62 (31.5%) | $35,347 |
| 4-Person Families | 20 (10.2%) | $0 |
| 5-Person Families | 10 (5.1%) | $0 |
| 6-Person Families | 0 (0.0%) | $0 |
| 7+ Person Families | 0 (0.0%) | $0 |
| Total | 197 (100.0%) | $35,382 |
Family Income by Number of Earners in Talmage
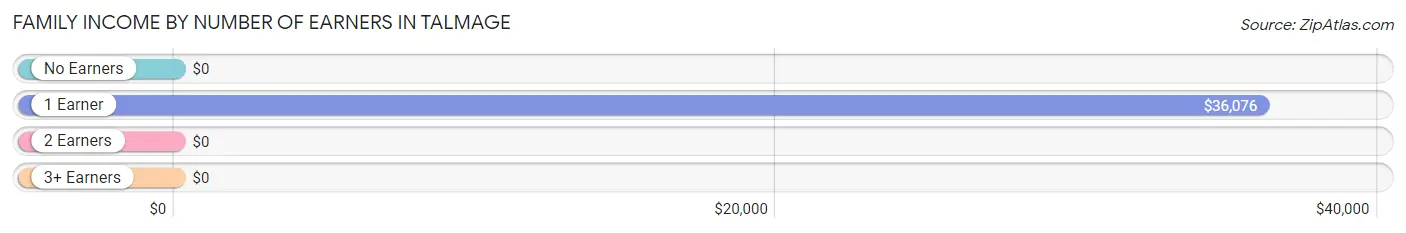
| Number of Earners | # Families | Median Income |
| No Earners | 22 (11.2%) | $0 |
| 1 Earner | 147 (74.6%) | $36,076 |
| 2 Earners | 28 (14.2%) | $0 |
| 3+ Earners | 0 (0.0%) | $0 |
| Total | 197 (100.0%) | $35,382 |
Household Income in Talmage
Household Income Brackets in Talmage
With 77 households falling in the category, the $35,000 to $49,999 income range is the most frequent in Talmage, accounting for 26.6% of all households.
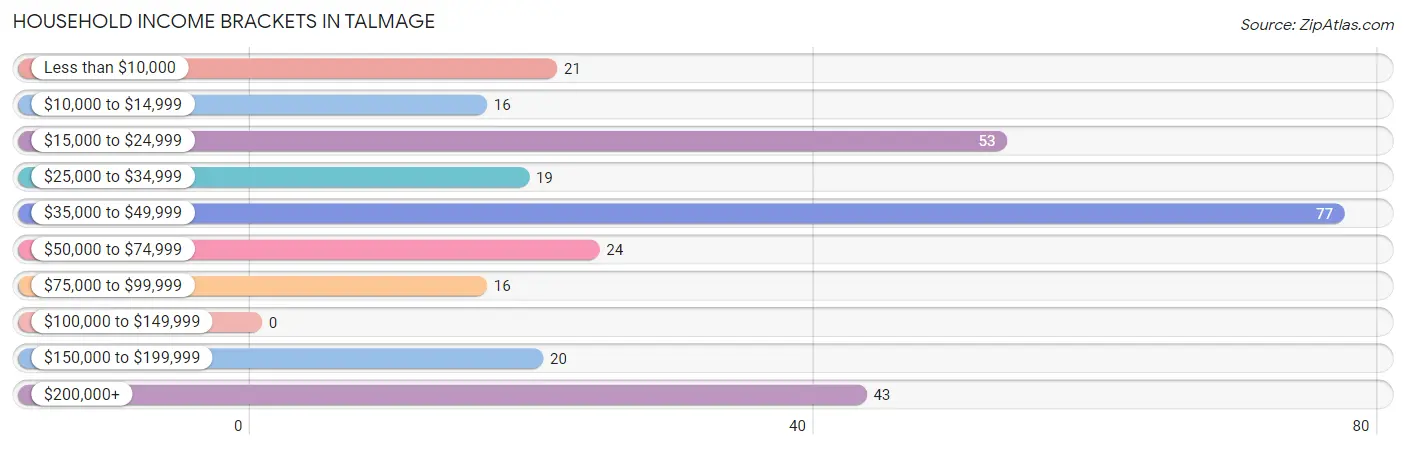
| Income Bracket | # Households | % Households |
| Less than $10,000 | 21 | 7.3% |
| $10,000 to $14,999 | 16 | 5.5% |
| $15,000 to $24,999 | 53 | 18.3% |
| $25,000 to $34,999 | 19 | 6.6% |
| $35,000 to $49,999 | 77 | 26.6% |
| $50,000 to $74,999 | 24 | 8.3% |
| $75,000 to $99,999 | 16 | 5.5% |
| $100,000 to $149,999 | 0 | 0.0% |
| $150,000 to $199,999 | 20 | 6.9% |
| $200,000+ | 43 | 14.9% |
Household Income by Householder Age in Talmage
The median household income in Talmage is $37,017, with the highest median household income of $45,758 found in the 45 to 64 years age bracket for the primary householder. A total of 64 households (22.2%) fall into this category.
| Income Bracket | # Households | Median Income |
| 15 to 24 Years | 0 (0.0%) | $0 |
| 25 to 44 Years | 105 (36.3%) | $35,653 |
| 45 to 64 Years | 64 (22.2%) | $45,758 |
| 65+ Years | 120 (41.5%) | $0 |
| Total | 289 (100.0%) | $37,017 |
Poverty in Talmage
Income Below Poverty by Sex and Age in Talmage
With 23.7% poverty level for males and 49.6% for females among the residents of Talmage, 6 to 11 year old males and 12 to 14 year old females are the most vulnerable to poverty, with 8 males (100.0%) and 17 females (100.0%) in their respective age groups living below the poverty level.
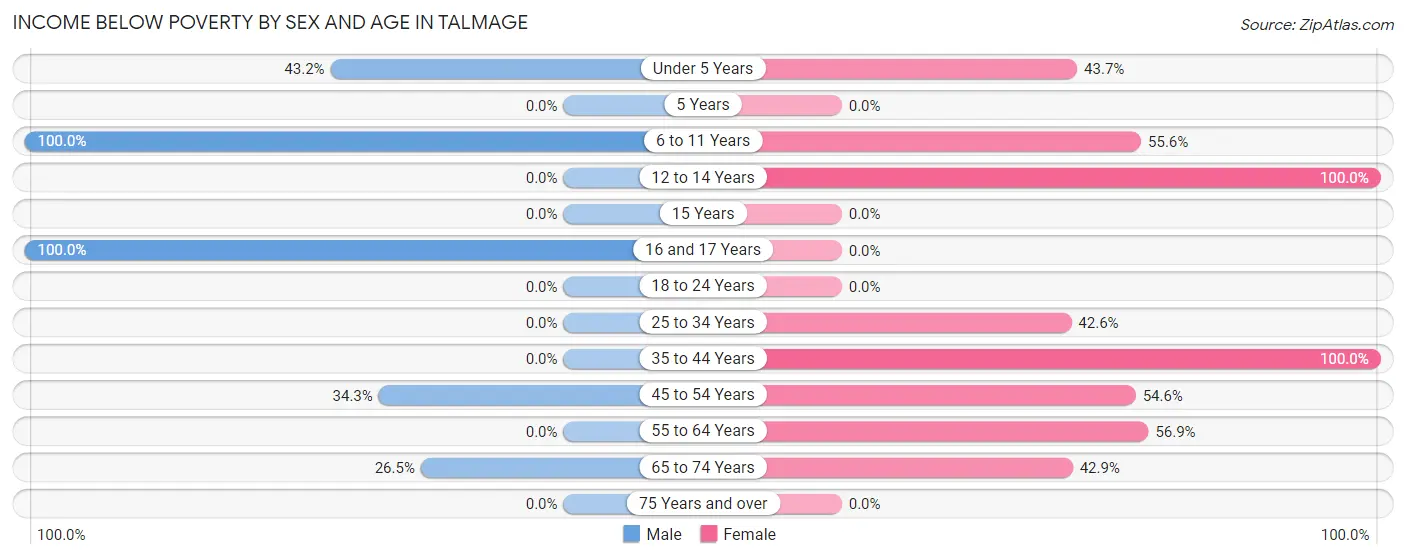
| Age Bracket | Male | Female |
| Under 5 Years | 16 (43.2%) | 45 (43.7%) |
| 5 Years | 0 (0.0%) | 0 (0.0%) |
| 6 to 11 Years | 8 (100.0%) | 30 (55.6%) |
| 12 to 14 Years | 0 (0.0%) | 17 (100.0%) |
| 15 Years | 0 (0.0%) | 0 (0.0%) |
| 16 and 17 Years | 12 (100.0%) | 0 (0.0%) |
| 18 to 24 Years | 0 (0.0%) | 0 (0.0%) |
| 25 to 34 Years | 0 (0.0%) | 26 (42.6%) |
| 35 to 44 Years | 0 (0.0%) | 18 (100.0%) |
| 45 to 54 Years | 12 (34.3%) | 12 (54.5%) |
| 55 to 64 Years | 0 (0.0%) | 74 (56.9%) |
| 65 to 74 Years | 9 (26.5%) | 57 (42.9%) |
| 75 Years and over | 0 (0.0%) | 0 (0.0%) |
| Total | 57 (23.7%) | 279 (49.6%) |
Income Above Poverty by Sex and Age in Talmage
According to the poverty statistics in Talmage, males aged 25 to 34 years and females aged 18 to 24 years are the age groups that are most secure financially, with 100.0% of males and 100.0% of females in these age groups living above the poverty line.
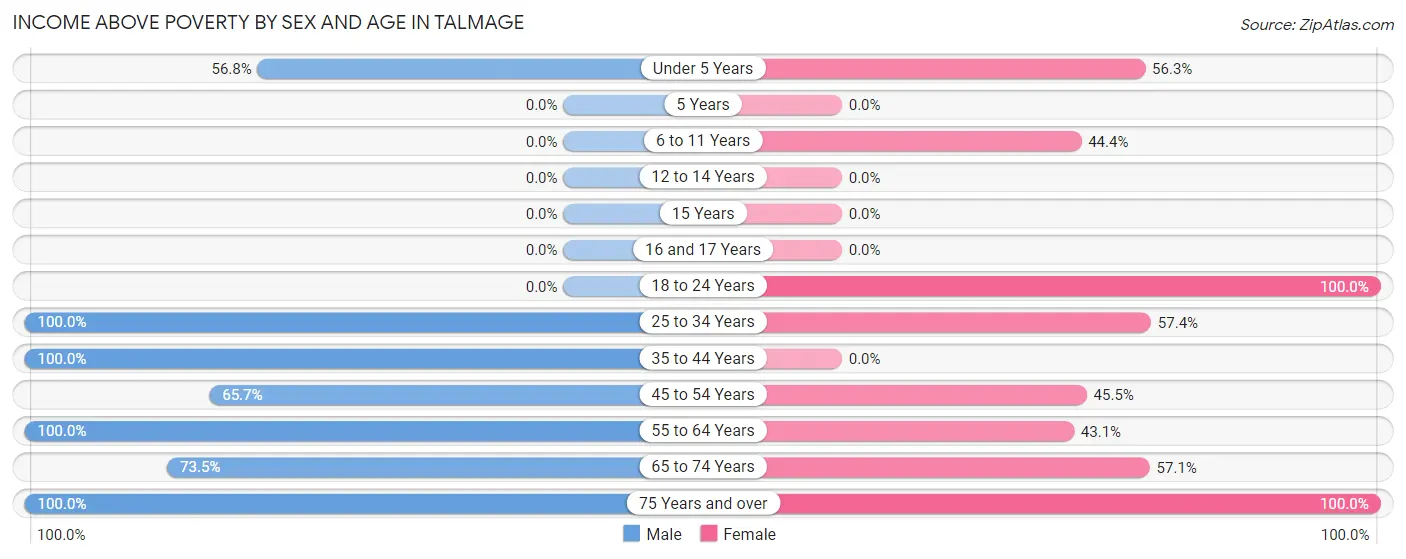
| Age Bracket | Male | Female |
| Under 5 Years | 21 (56.8%) | 58 (56.3%) |
| 5 Years | 0 (0.0%) | 0 (0.0%) |
| 6 to 11 Years | 0 (0.0%) | 24 (44.4%) |
| 12 to 14 Years | 0 (0.0%) | 0 (0.0%) |
| 15 Years | 0 (0.0%) | 0 (0.0%) |
| 16 and 17 Years | 0 (0.0%) | 0 (0.0%) |
| 18 to 24 Years | 0 (0.0%) | 12 (100.0%) |
| 25 to 34 Years | 56 (100.0%) | 35 (57.4%) |
| 35 to 44 Years | 12 (100.0%) | 0 (0.0%) |
| 45 to 54 Years | 23 (65.7%) | 10 (45.5%) |
| 55 to 64 Years | 40 (100.0%) | 56 (43.1%) |
| 65 to 74 Years | 25 (73.5%) | 76 (57.1%) |
| 75 Years and over | 6 (100.0%) | 13 (100.0%) |
| Total | 183 (76.2%) | 284 (50.4%) |
Income Below Poverty Among Married-Couple Families in Talmage
| Children | Above Poverty | Below Poverty |
| No Children | 67 (100.0%) | 0 (0.0%) |
| 1 or 2 Children | 20 (100.0%) | 0 (0.0%) |
| 3 or 4 Children | 0 (0.0%) | 0 (0.0%) |
| 5 or more Children | 0 (0.0%) | 0 (0.0%) |
| Total | 87 (100.0%) | 0 (0.0%) |
Income Below Poverty Among Single-Parent Households in Talmage
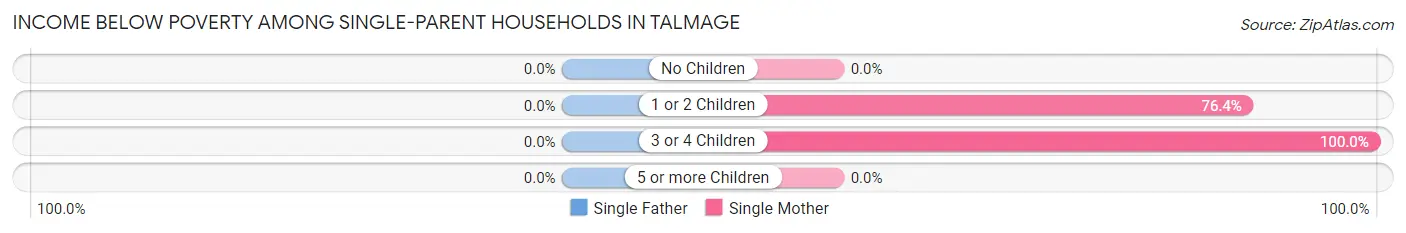
| Children | Single Father | Single Mother |
| No Children | 0 (0.0%) | 0 (0.0%) |
| 1 or 2 Children | 0 (0.0%) | 42 (76.4%) |
| 3 or 4 Children | 0 (0.0%) | 10 (100.0%) |
| 5 or more Children | 0 (0.0%) | 0 (0.0%) |
| Total | 0 (0.0%) | 52 (70.3%) |
Income Below Poverty Among Married-Couple vs Single-Parent Households in Talmage
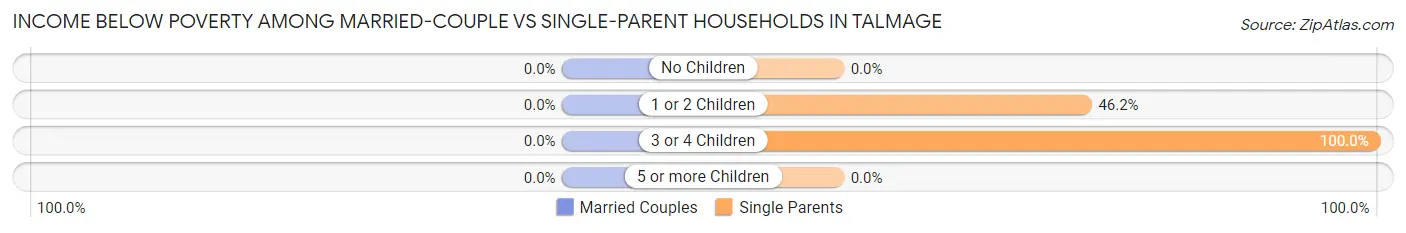
| Children | Married-Couple Families | Single-Parent Households |
| No Children | 0 (0.0%) | 0 (0.0%) |
| 1 or 2 Children | 0 (0.0%) | 42 (46.2%) |
| 3 or 4 Children | 0 (0.0%) | 10 (100.0%) |
| 5 or more Children | 0 (0.0%) | 0 (0.0%) |
| Total | 0 (0.0%) | 52 (47.3%) |
Race in Talmage
The most populous races in Talmage are White / Caucasian (606 | 58.8%), Hispanic or Latino (259 | 25.1%), and Asian (200 | 19.4%).
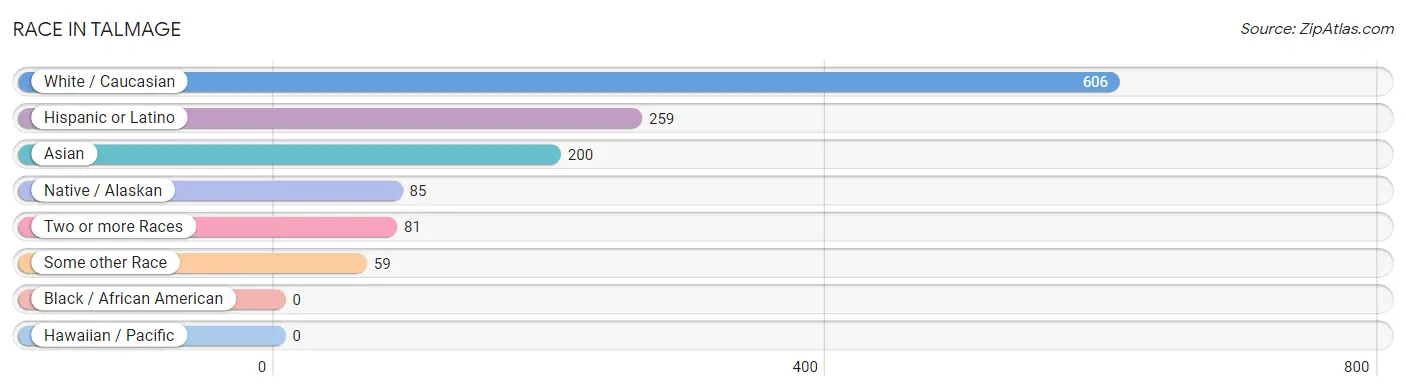
| Race | # Population | % Population |
| Asian | 200 | 19.4% |
| Black / African American | 0 | 0.0% |
| Hawaiian / Pacific | 0 | 0.0% |
| Hispanic or Latino | 259 | 25.1% |
| Native / Alaskan | 85 | 8.2% |
| White / Caucasian | 606 | 58.8% |
| Two or more Races | 81 | 7.9% |
| Some other Race | 59 | 5.7% |
| Total | 1,031 | 100.0% |
Ancestry in Talmage
The most populous ancestries reported in Talmage are Mexican (225 | 21.8%), Indian (Asian) (136 | 13.2%), Swedish (60 | 5.8%), Irish (56 | 5.4%), and German (42 | 4.1%), together accounting for 50.3% of all Talmage residents.
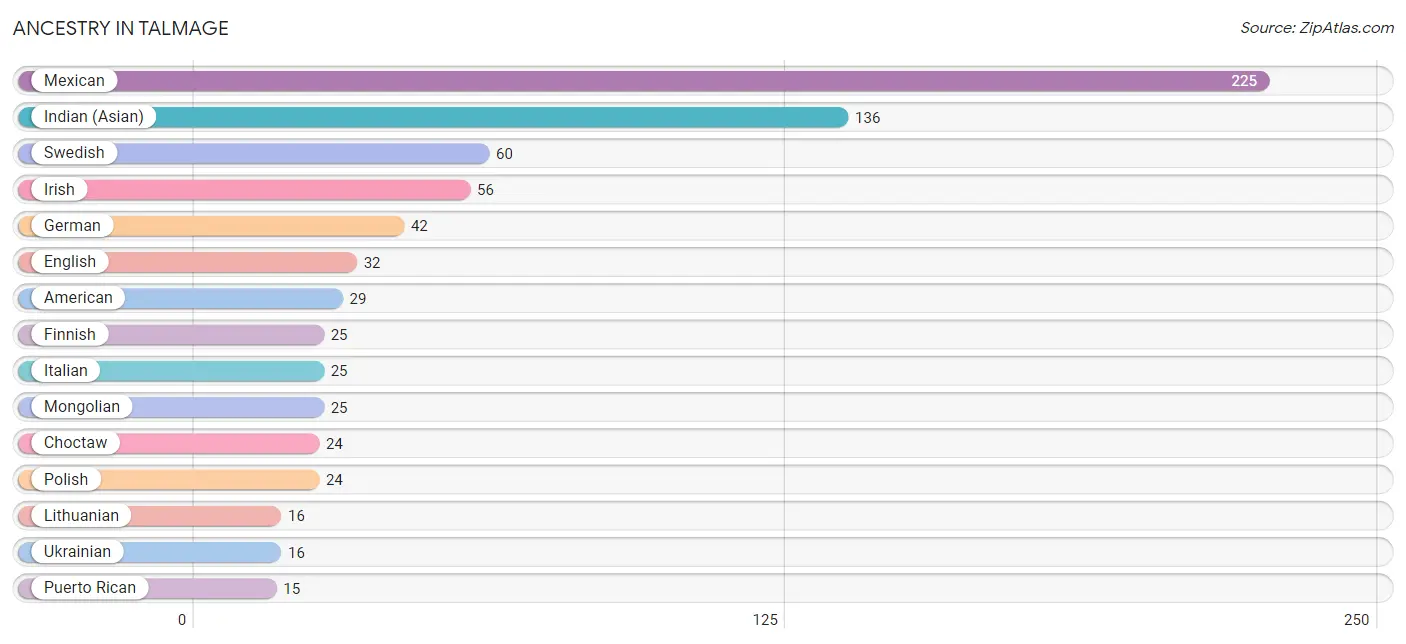
| Ancestry | # Population | % Population |
| American | 29 | 2.8% |
| Apache | 12 | 1.2% |
| Burmese | 13 | 1.3% |
| Choctaw | 24 | 2.3% |
| Dutch | 6 | 0.6% |
| English | 32 | 3.1% |
| Finnish | 25 | 2.4% |
| German | 42 | 4.1% |
| Indian (Asian) | 136 | 13.2% |
| Irish | 56 | 5.4% |
| Italian | 25 | 2.4% |
| Korean | 5 | 0.5% |
| Lithuanian | 16 | 1.5% |
| Mexican | 225 | 21.8% |
| Mongolian | 25 | 2.4% |
| Norwegian | 14 | 1.4% |
| Polish | 24 | 2.3% |
| Puerto Rican | 15 | 1.5% |
| Sri Lankan | 5 | 0.5% |
| Swedish | 60 | 5.8% |
| Ukrainian | 16 | 1.5% | View All 21 Rows |
Immigrants in Talmage
The most numerous immigrant groups reported in Talmage came from Asia (176 | 17.1%), Eastern Asia (117 | 11.4%), China (104 | 10.1%), Taiwan (74 | 7.2%), and South Eastern Asia (52 | 5.0%), together accounting for 50.7% of all Talmage residents.
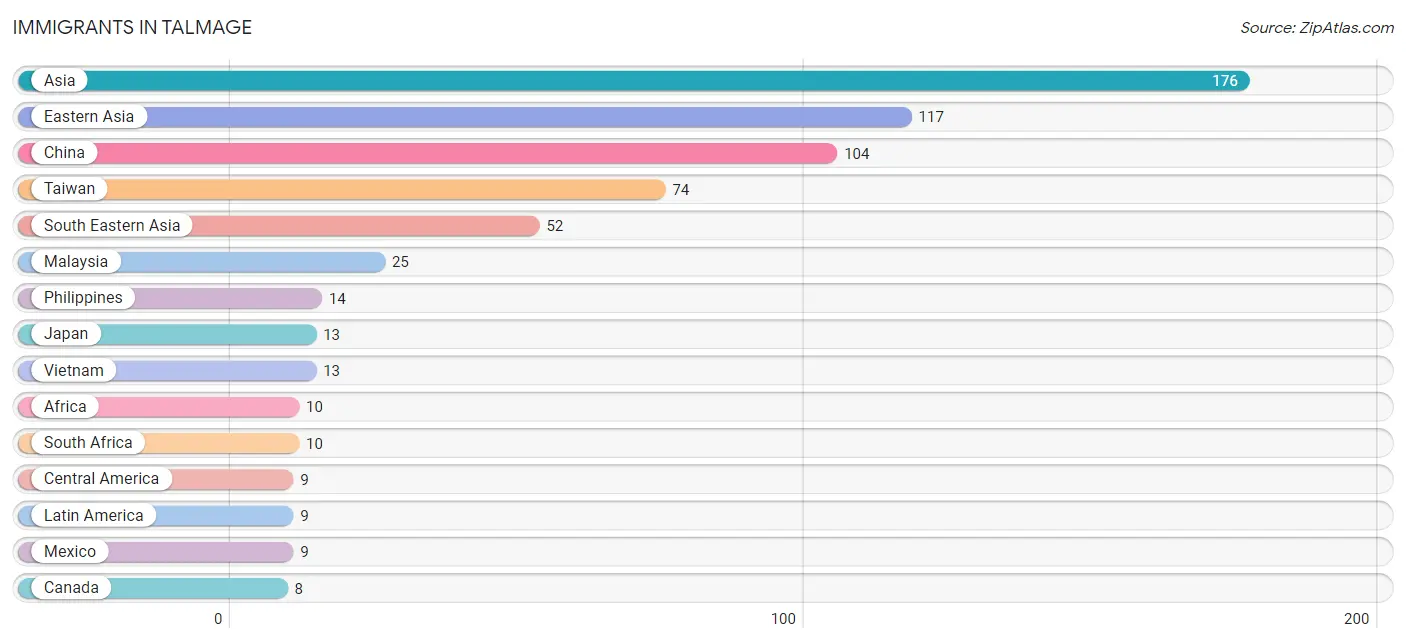
| Immigration Origin | # Population | % Population |
| Africa | 10 | 1.0% |
| Asia | 176 | 17.1% |
| Bangladesh | 7 | 0.7% |
| Canada | 8 | 0.8% |
| Central America | 9 | 0.9% |
| China | 104 | 10.1% |
| Eastern Asia | 117 | 11.4% |
| Japan | 13 | 1.3% |
| Latin America | 9 | 0.9% |
| Malaysia | 25 | 2.4% |
| Mexico | 9 | 0.9% |
| Philippines | 14 | 1.4% |
| South Africa | 10 | 1.0% |
| South Central Asia | 7 | 0.7% |
| South Eastern Asia | 52 | 5.0% |
| Taiwan | 74 | 7.2% |
| Vietnam | 13 | 1.3% | View All 17 Rows |
Sex and Age in Talmage
Sex and Age in Talmage
The most populous age groups in Talmage are 30 to 34 Years (56 | 18.8%) for men and Under 5 Years (103 | 14.1%) for women.
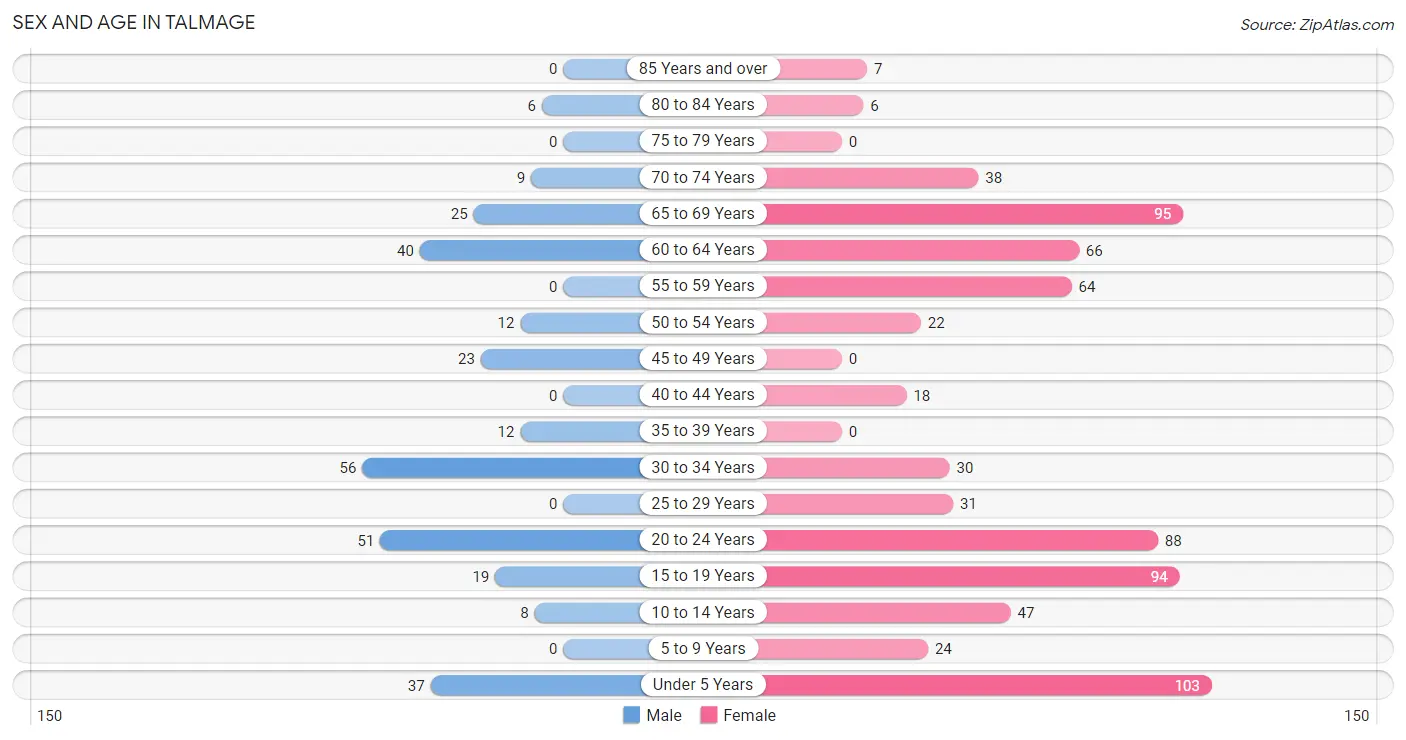
| Age Bracket | Male | Female |
| Under 5 Years | 37 (12.4%) | 103 (14.1%) |
| 5 to 9 Years | 0 (0.0%) | 24 (3.3%) |
| 10 to 14 Years | 8 (2.7%) | 47 (6.4%) |
| 15 to 19 Years | 19 (6.4%) | 94 (12.8%) |
| 20 to 24 Years | 51 (17.1%) | 88 (12.0%) |
| 25 to 29 Years | 0 (0.0%) | 31 (4.2%) |
| 30 to 34 Years | 56 (18.8%) | 30 (4.1%) |
| 35 to 39 Years | 12 (4.0%) | 0 (0.0%) |
| 40 to 44 Years | 0 (0.0%) | 18 (2.5%) |
| 45 to 49 Years | 23 (7.7%) | 0 (0.0%) |
| 50 to 54 Years | 12 (4.0%) | 22 (3.0%) |
| 55 to 59 Years | 0 (0.0%) | 64 (8.7%) |
| 60 to 64 Years | 40 (13.4%) | 66 (9.0%) |
| 65 to 69 Years | 25 (8.4%) | 95 (13.0%) |
| 70 to 74 Years | 9 (3.0%) | 38 (5.2%) |
| 75 to 79 Years | 0 (0.0%) | 0 (0.0%) |
| 80 to 84 Years | 6 (2.0%) | 6 (0.8%) |
| 85 Years and over | 0 (0.0%) | 7 (0.9%) |
| Total | 298 (100.0%) | 733 (100.0%) |
Families and Households in Talmage
Median Family Size in Talmage
The median family size in Talmage is 2.71 persons per family, with single female/mother families (74 | 37.6%) accounting for the largest median family size of 3.05 persons per family. On the other hand, married-couple families (87 | 44.2%) represent the smallest median family size with 2.46 persons per family.
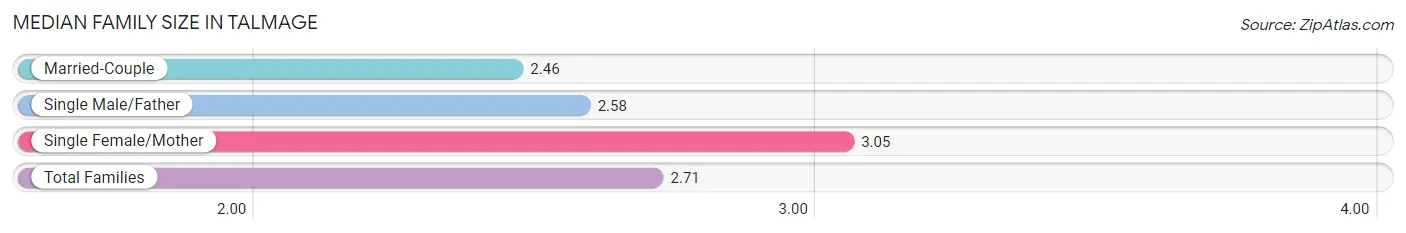
| Family Type | # Families | Family Size |
| Married-Couple | 87 (44.2%) | 2.46 |
| Single Male/Father | 36 (18.3%) | 2.58 |
| Single Female/Mother | 74 (37.6%) | 3.05 |
| Total Families | 197 (100.0%) | 2.71 |
Median Household Size in Talmage
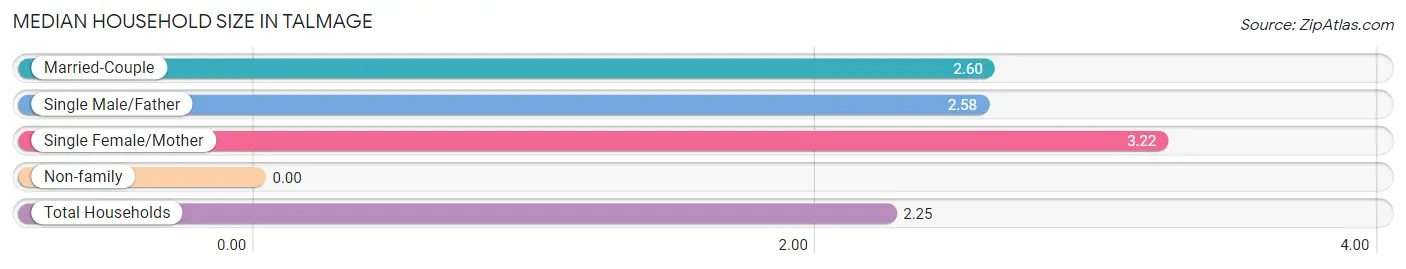
| Household Type | # Households | Household Size |
| Married-Couple | 87 (30.1%) | 2.60 |
| Single Male/Father | 36 (12.5%) | 2.58 |
| Single Female/Mother | 74 (25.6%) | 3.22 |
| Non-family | 92 (31.8%) | - |
| Total Households | 289 (100.0%) | 2.25 |
Household Size by Marriage Status in Talmage
Out of a total of 289 households in Talmage, 197 (68.2%) are family households, while 92 (31.8%) are nonfamily households. The most numerous type of family households are 2-person households, comprising 96, and the most common type of nonfamily households are 1-person households, comprising 92.
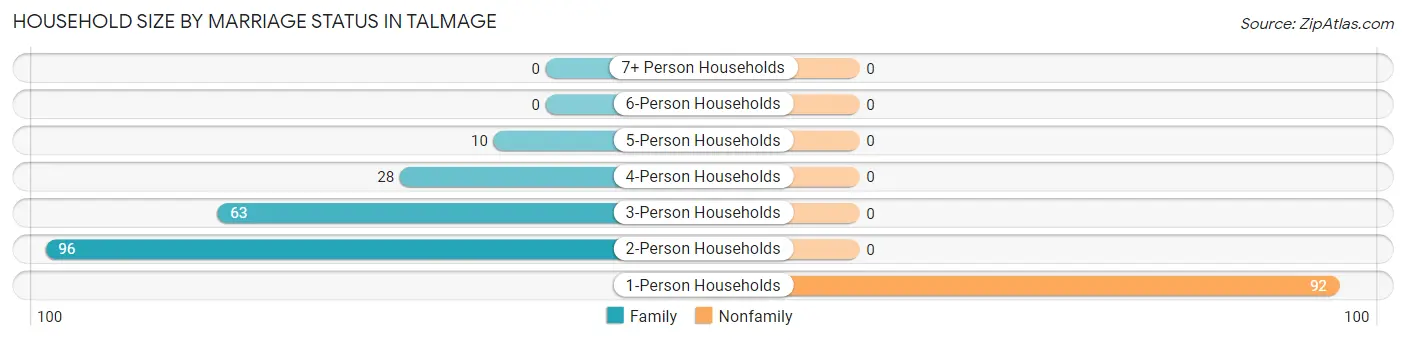
| Household Size | Family Households | Nonfamily Households |
| 1-Person Households | - | 92 (31.8%) |
| 2-Person Households | 96 (33.2%) | 0 (0.0%) |
| 3-Person Households | 63 (21.8%) | 0 (0.0%) |
| 4-Person Households | 28 (9.7%) | 0 (0.0%) |
| 5-Person Households | 10 (3.5%) | 0 (0.0%) |
| 6-Person Households | 0 (0.0%) | 0 (0.0%) |
| 7+ Person Households | 0 (0.0%) | 0 (0.0%) |
| Total | 197 (68.2%) | 92 (31.8%) |
Female Fertility in Talmage
Fertility by Age in Talmage
Average fertility rate in Talmage is 29.0 births per 1,000 women. Women in the age bracket of 20 to 34 years have the highest fertility rate with 54.0 births per 1,000 women. Women in the age bracket of 20 to 34 years acount for 100.0% of all women with births.
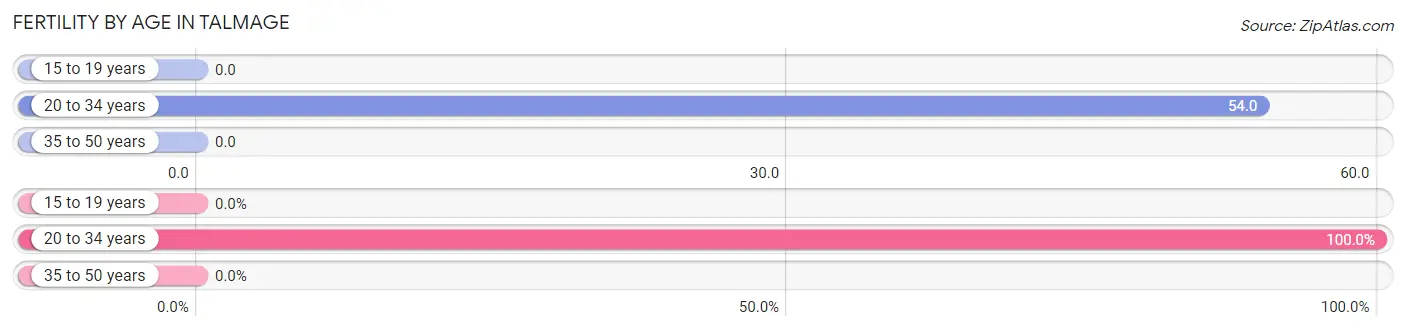
| Age Bracket | Women with Births | Births / 1,000 Women |
| 15 to 19 years | 0 (0.0%) | 0.0 |
| 20 to 34 years | 8 (100.0%) | 54.0 |
| 35 to 50 years | 0 (0.0%) | 0.0 |
| Total | 8 (100.0%) | 29.0 |
Fertility by Age by Marriage Status in Talmage
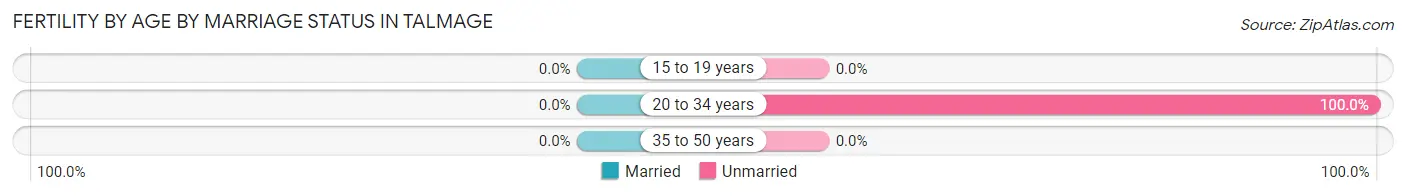
| Age Bracket | Married | Unmarried |
| 15 to 19 years | 0 (0.0%) | 0 (0.0%) |
| 20 to 34 years | 0 (0.0%) | 8 (100.0%) |
| 35 to 50 years | 0 (0.0%) | 0 (0.0%) |
| Total | 0 (0.0%) | 8 (100.0%) |
Fertility by Education in Talmage
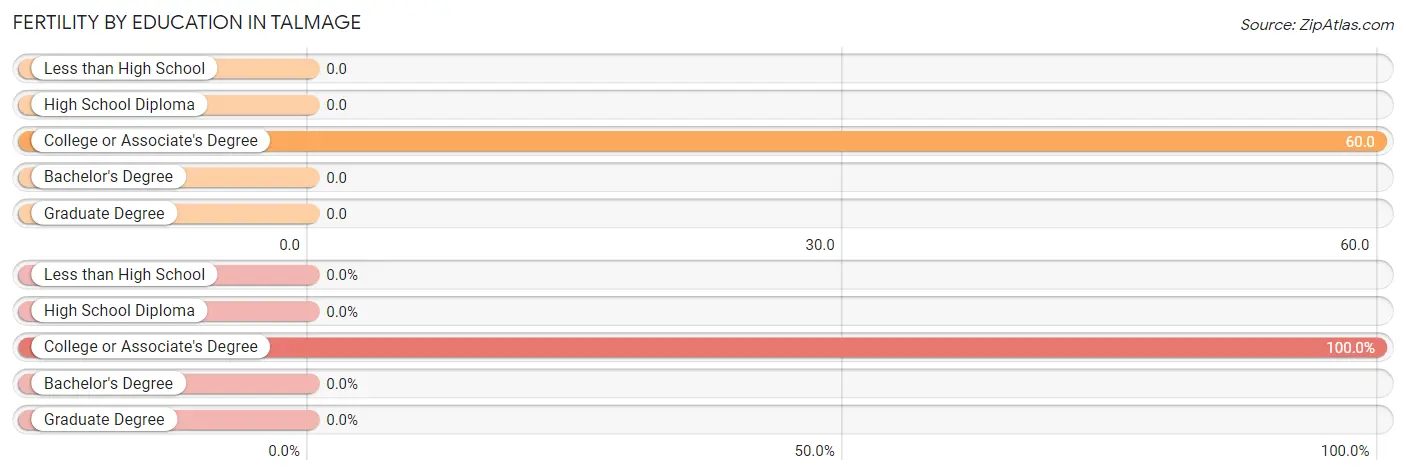
| Educational Attainment | Women with Births | Births / 1,000 Women |
| Less than High School | 0 (0.0%) | 0.0 |
| High School Diploma | 0 (0.0%) | 0.0 |
| College or Associate's Degree | 8 (100.0%) | 60.0 |
| Bachelor's Degree | 0 (0.0%) | 0.0 |
| Graduate Degree | 0 (0.0%) | 0.0 |
| Total | 8 (100.0%) | 29.0 |
Fertility by Education by Marriage Status in Talmage
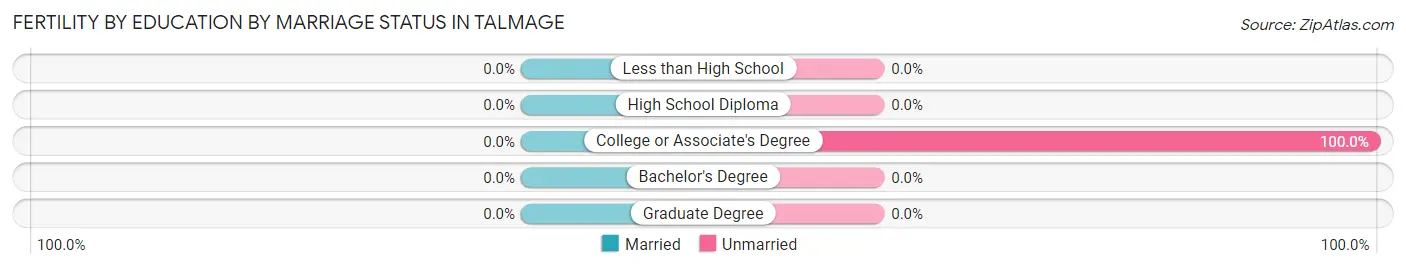
| Educational Attainment | Married | Unmarried |
| Less than High School | 0 (0.0%) | 0 (0.0%) |
| High School Diploma | 0 (0.0%) | 0 (0.0%) |
| College or Associate's Degree | 0 (0.0%) | 8 (100.0%) |
| Bachelor's Degree | 0 (0.0%) | 0 (0.0%) |
| Graduate Degree | 0 (0.0%) | 0 (0.0%) |
| Total | 0 (0.0%) | 8 (100.0%) |
Employment Characteristics in Talmage
Employment by Class of Employer in Talmage
Among the 226 employed individuals in Talmage, private company employees (101 | 44.7%), local government employees (36 | 15.9%), and self-employed (incorporated) (31 | 13.7%) make up the most common classes of employment.
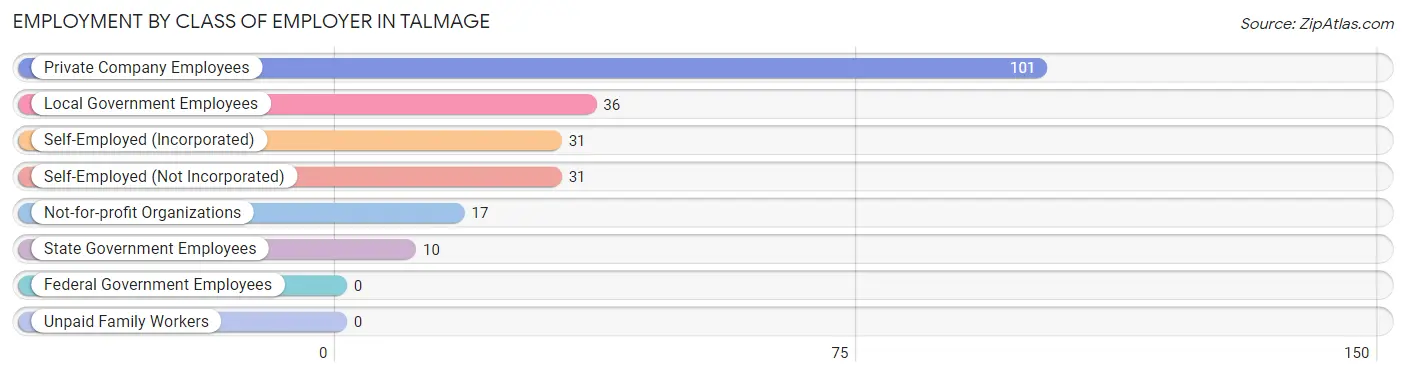
| Employer Class | # Employees | % Employees |
| Private Company Employees | 101 | 44.7% |
| Self-Employed (Incorporated) | 31 | 13.7% |
| Self-Employed (Not Incorporated) | 31 | 13.7% |
| Not-for-profit Organizations | 17 | 7.5% |
| Local Government Employees | 36 | 15.9% |
| State Government Employees | 10 | 4.4% |
| Federal Government Employees | 0 | 0.0% |
| Unpaid Family Workers | 0 | 0.0% |
| Total | 226 | 100.0% |
Employment Status by Age in Talmage
According to the labor force statistics for Talmage, out of the total population over 16 years of age (812), 30.3% or 246 individuals are in the labor force, with 8.1% or 20 of them unemployed. The age group with the highest labor force participation rate is 25 to 29 years, with 100.0% or 31 individuals in the labor force. Within the labor force, the 16 to 19 years age range has the highest percentage of unemployed individuals, with 55.6% or 20 of them being unemployed.
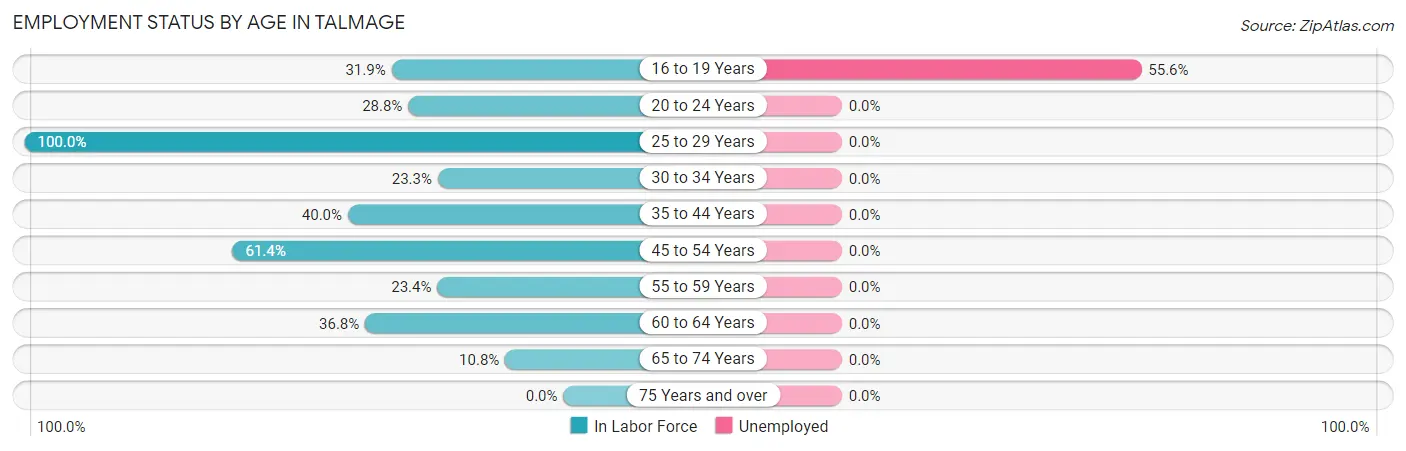
| Age Bracket | In Labor Force | Unemployed |
| 16 to 19 Years | 36 (31.9%) | 20 (55.6%) |
| 20 to 24 Years | 40 (28.8%) | 0 (0.0%) |
| 25 to 29 Years | 31 (100.0%) | 0 (0.0%) |
| 30 to 34 Years | 20 (23.3%) | 0 (0.0%) |
| 35 to 44 Years | 12 (40.0%) | 0 (0.0%) |
| 45 to 54 Years | 35 (61.4%) | 0 (0.0%) |
| 55 to 59 Years | 15 (23.4%) | 0 (0.0%) |
| 60 to 64 Years | 39 (36.8%) | 0 (0.0%) |
| 65 to 74 Years | 18 (10.8%) | 0 (0.0%) |
| 75 Years and over | 0 (0.0%) | 0 (0.0%) |
| Total | 246 (30.3%) | 20 (8.1%) |
Employment Status by Educational Attainment in Talmage
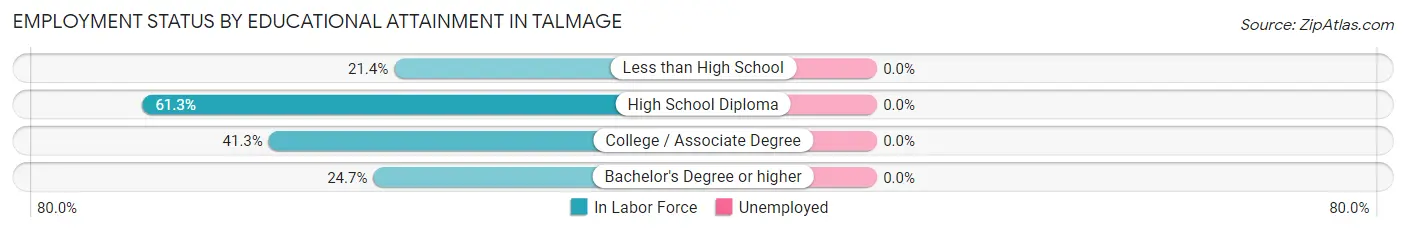
| Educational Attainment | In Labor Force | Unemployed |
| Less than High School | 12 (21.4%) | 0 (0.0%) |
| High School Diploma | 68 (61.3%) | 0 (0.0%) |
| College / Associate Degree | 52 (41.3%) | 0 (0.0%) |
| Bachelor's Degree or higher | 20 (24.7%) | 0 (0.0%) |
| Total | 152 (40.6%) | 0 (0.0%) |
Employment Occupations by Sex in Talmage
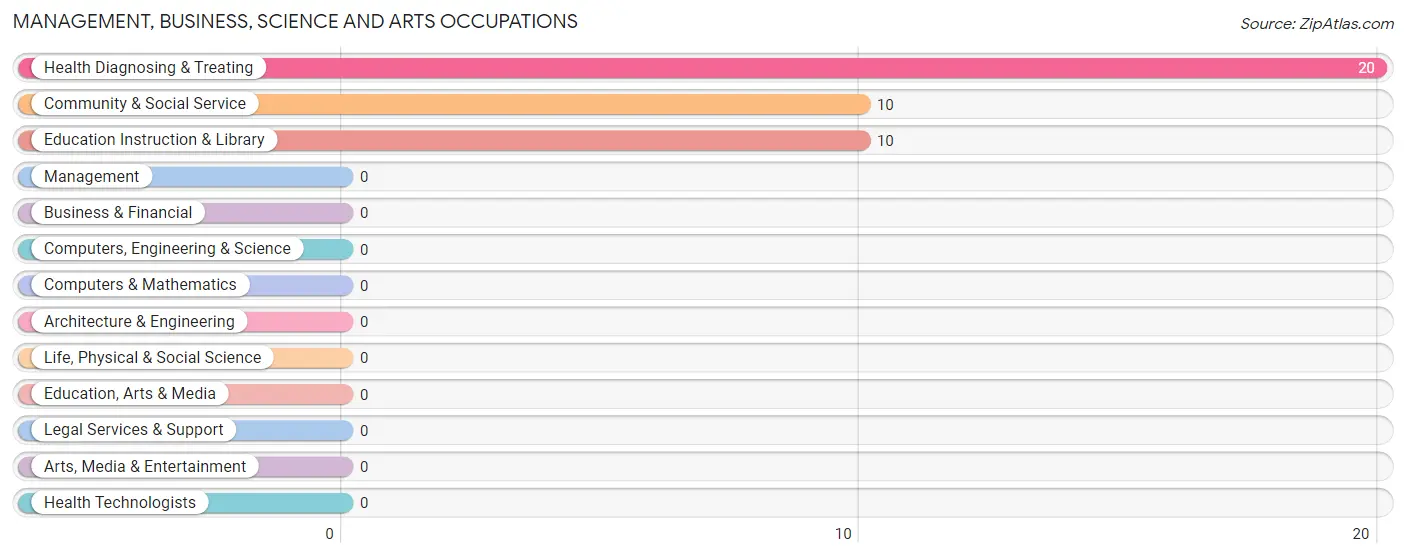
Management, Business, Science and Arts Occupations
The most common Management, Business, Science and Arts occupations in Talmage are Health Diagnosing & Treating (20 | 8.8%), Community & Social Service (10 | 4.4%), and Education Instruction & Library (10 | 4.4%).
Management, Business, Science and Arts Occupations by Sex
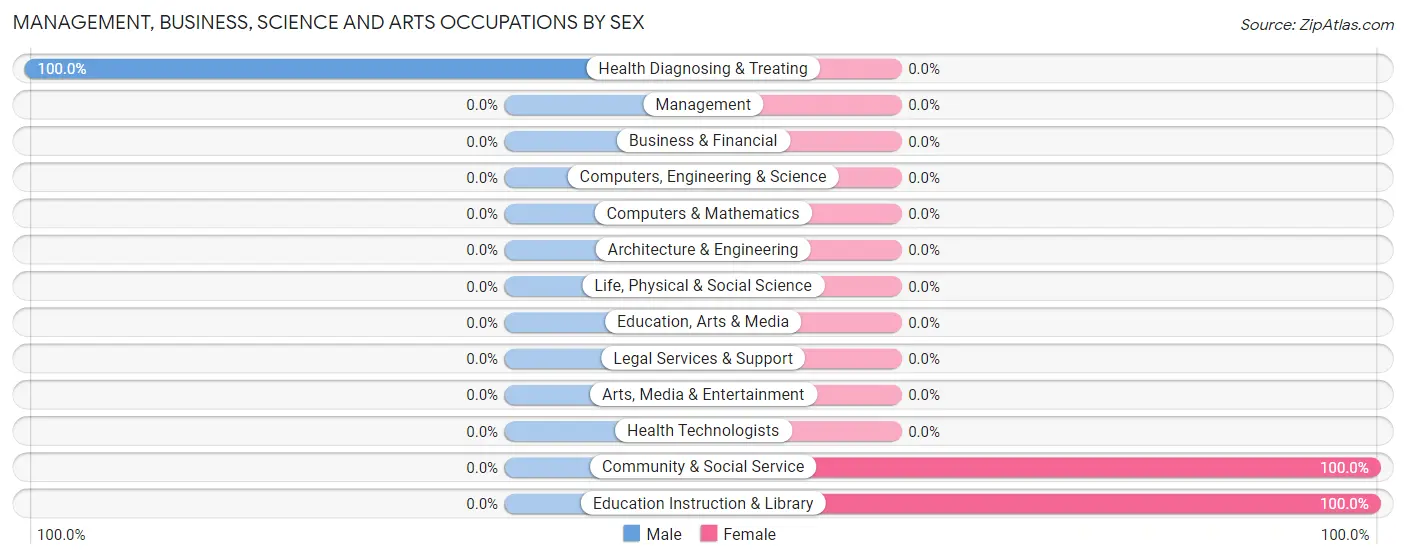
| Occupation | Male | Female |
| Management | 0 (0.0%) | 0 (0.0%) |
| Business & Financial | 0 (0.0%) | 0 (0.0%) |
| Computers, Engineering & Science | 0 (0.0%) | 0 (0.0%) |
| Computers & Mathematics | 0 (0.0%) | 0 (0.0%) |
| Architecture & Engineering | 0 (0.0%) | 0 (0.0%) |
| Life, Physical & Social Science | 0 (0.0%) | 0 (0.0%) |
| Community & Social Service | 0 (0.0%) | 10 (100.0%) |
| Education, Arts & Media | 0 (0.0%) | 0 (0.0%) |
| Legal Services & Support | 0 (0.0%) | 0 (0.0%) |
| Education Instruction & Library | 0 (0.0%) | 10 (100.0%) |
| Arts, Media & Entertainment | 0 (0.0%) | 0 (0.0%) |
| Health Diagnosing & Treating | 20 (100.0%) | 0 (0.0%) |
| Health Technologists | 0 (0.0%) | 0 (0.0%) |
| Total (Category) | 20 (66.7%) | 10 (33.3%) |
| Total (Overall) | 107 (47.3%) | 119 (52.6%) |
Services Occupations
The most common Services occupations in Talmage are Healthcare Support (31 | 13.7%), Cleaning & Maintenance (31 | 13.7%), Food Preparation & Serving (20 | 8.8%), and Personal Care & Service (5 | 2.2%).
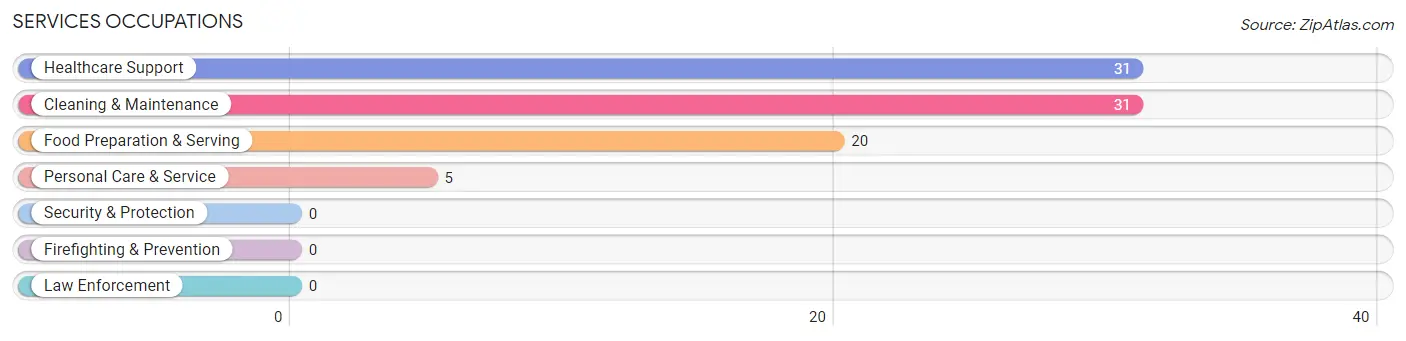
Services Occupations by Sex
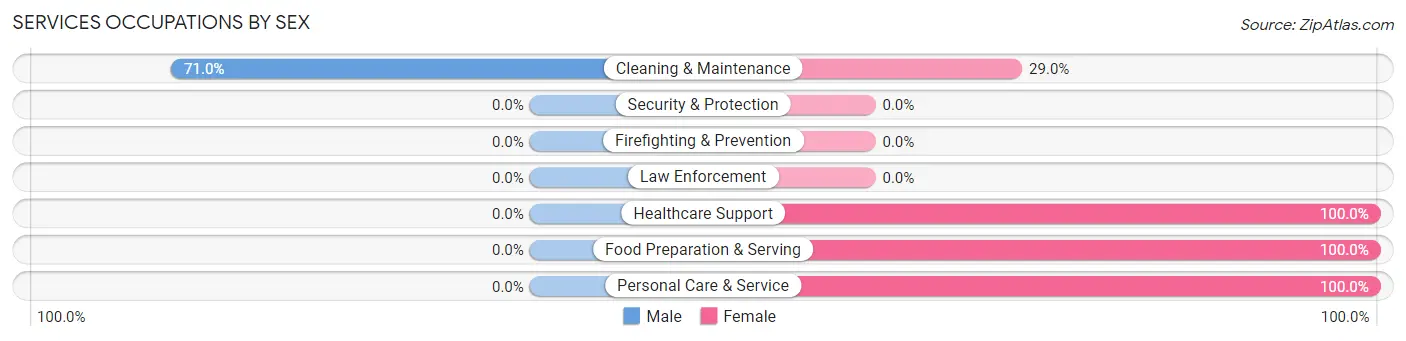
| Occupation | Male | Female |
| Healthcare Support | 0 (0.0%) | 31 (100.0%) |
| Security & Protection | 0 (0.0%) | 0 (0.0%) |
| Firefighting & Prevention | 0 (0.0%) | 0 (0.0%) |
| Law Enforcement | 0 (0.0%) | 0 (0.0%) |
| Food Preparation & Serving | 0 (0.0%) | 20 (100.0%) |
| Cleaning & Maintenance | 22 (71.0%) | 9 (29.0%) |
| Personal Care & Service | 0 (0.0%) | 5 (100.0%) |
| Total (Category) | 22 (25.3%) | 65 (74.7%) |
| Total (Overall) | 107 (47.3%) | 119 (52.6%) |
Sales and Office Occupations
The most common Sales and Office occupations in Talmage are , and Office & Administration (34 | 15.0%).
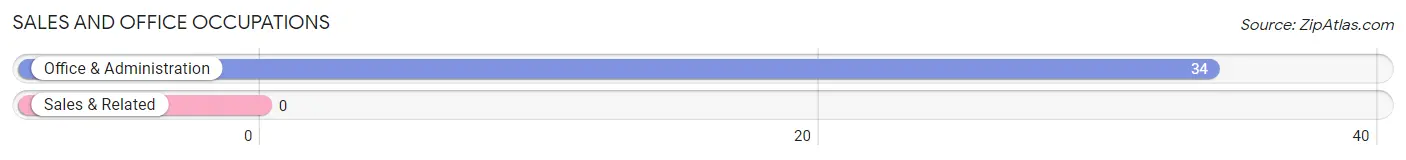
Sales and Office Occupations by Sex
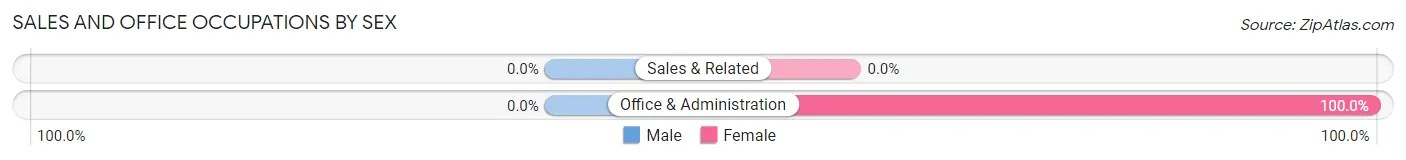
| Occupation | Male | Female |
| Sales & Related | 0 (0.0%) | 0 (0.0%) |
| Office & Administration | 0 (0.0%) | 34 (100.0%) |
| Total (Category) | 0 (0.0%) | 34 (100.0%) |
| Total (Overall) | 107 (47.3%) | 119 (52.6%) |
Natural Resources, Construction and Maintenance Occupations
The most common Natural Resources, Construction and Maintenance occupations in Talmage are , and Construction & Extraction (21 | 9.3%).
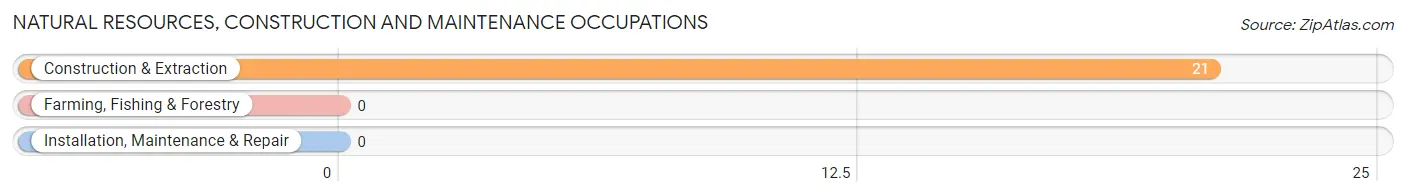
Natural Resources, Construction and Maintenance Occupations by Sex
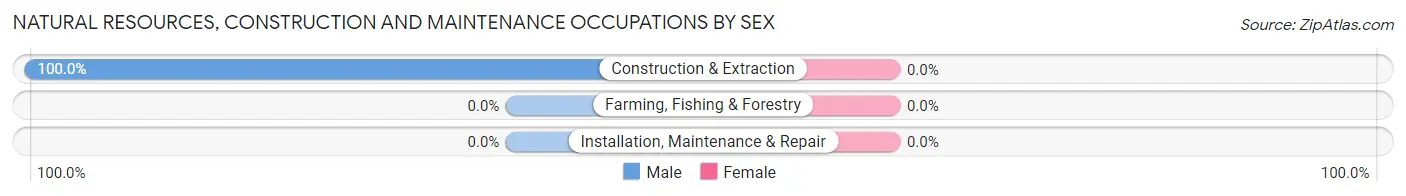
| Occupation | Male | Female |
| Farming, Fishing & Forestry | 0 (0.0%) | 0 (0.0%) |
| Construction & Extraction | 21 (100.0%) | 0 (0.0%) |
| Installation, Maintenance & Repair | 0 (0.0%) | 0 (0.0%) |
| Total (Category) | 21 (100.0%) | 0 (0.0%) |
| Total (Overall) | 107 (47.3%) | 119 (52.6%) |
Production, Transportation and Moving Occupations
The most common Production, Transportation and Moving occupations in Talmage are Production (31 | 13.7%), and Material Moving (23 | 10.2%).
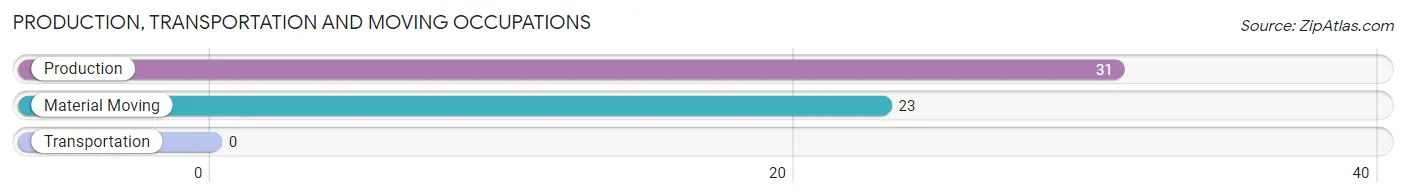
Production, Transportation and Moving Occupations by Sex
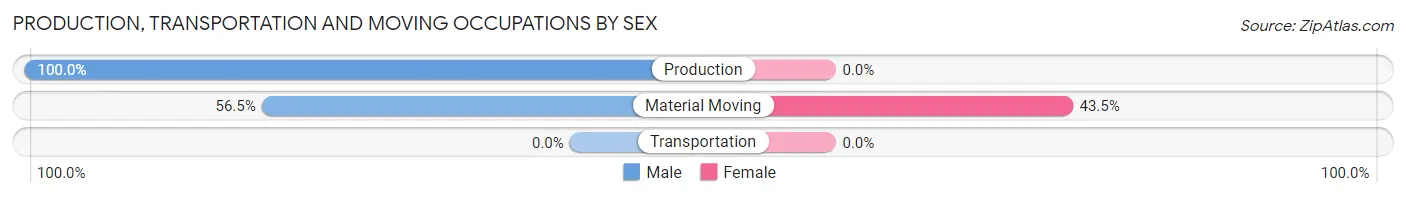
| Occupation | Male | Female |
| Production | 31 (100.0%) | 0 (0.0%) |
| Transportation | 0 (0.0%) | 0 (0.0%) |
| Material Moving | 13 (56.5%) | 10 (43.5%) |
| Total (Category) | 44 (81.5%) | 10 (18.5%) |
| Total (Overall) | 107 (47.3%) | 119 (52.6%) |
Employment Industries by Sex in Talmage
Employment Industries in Talmage
The major employment industries in Talmage include Health Care & Social Assistance (59 | 26.1%), Utilities (31 | 13.7%), Educational Services (27 | 11.9%), Retail Trade (25 | 11.1%), and Construction (21 | 9.3%).
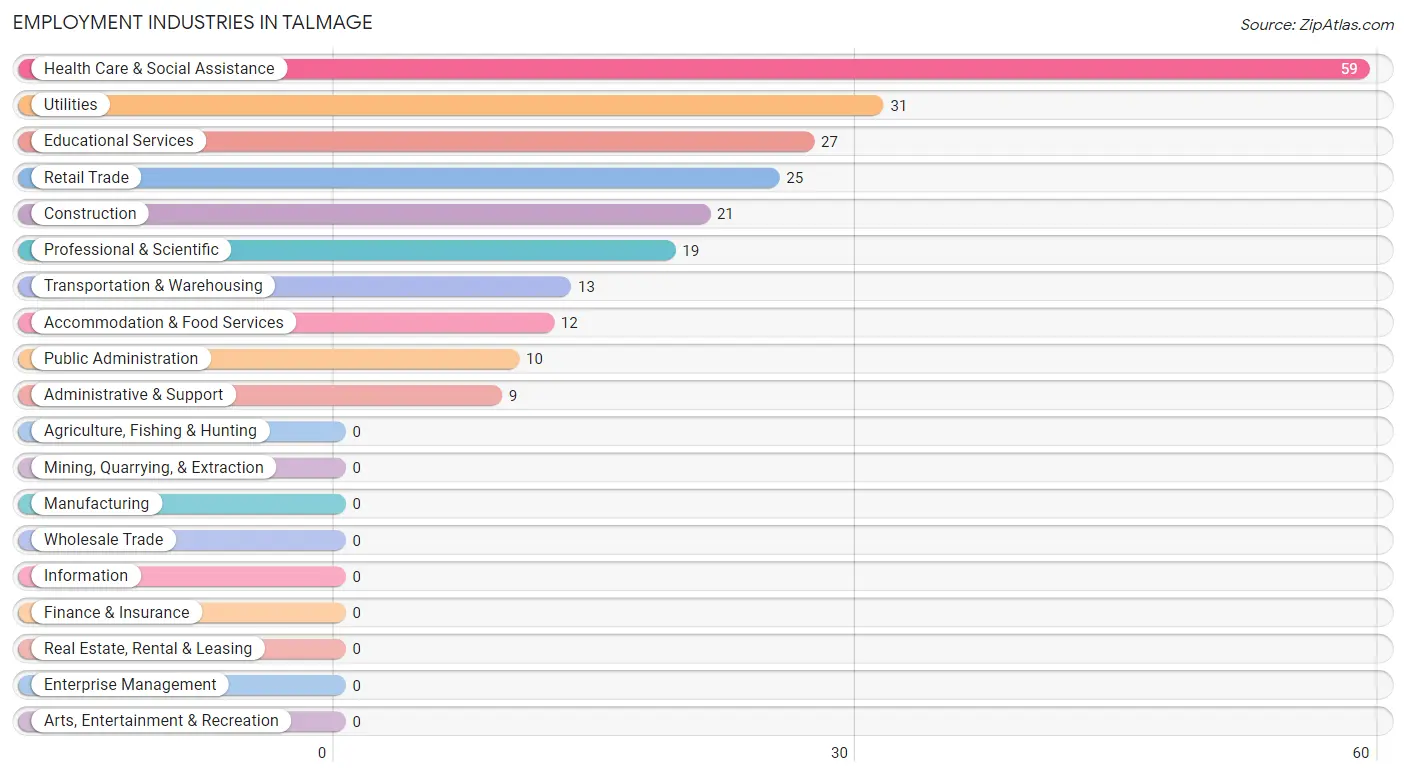
Employment Industries by Sex in Talmage
The Talmage industries that see more men than women are Construction (100.0%), Transportation & Warehousing (100.0%), and Utilities (100.0%), whereas the industries that tend to have a higher number of women are Retail Trade (100.0%), Professional & Scientific (100.0%), and Administrative & Support (100.0%).
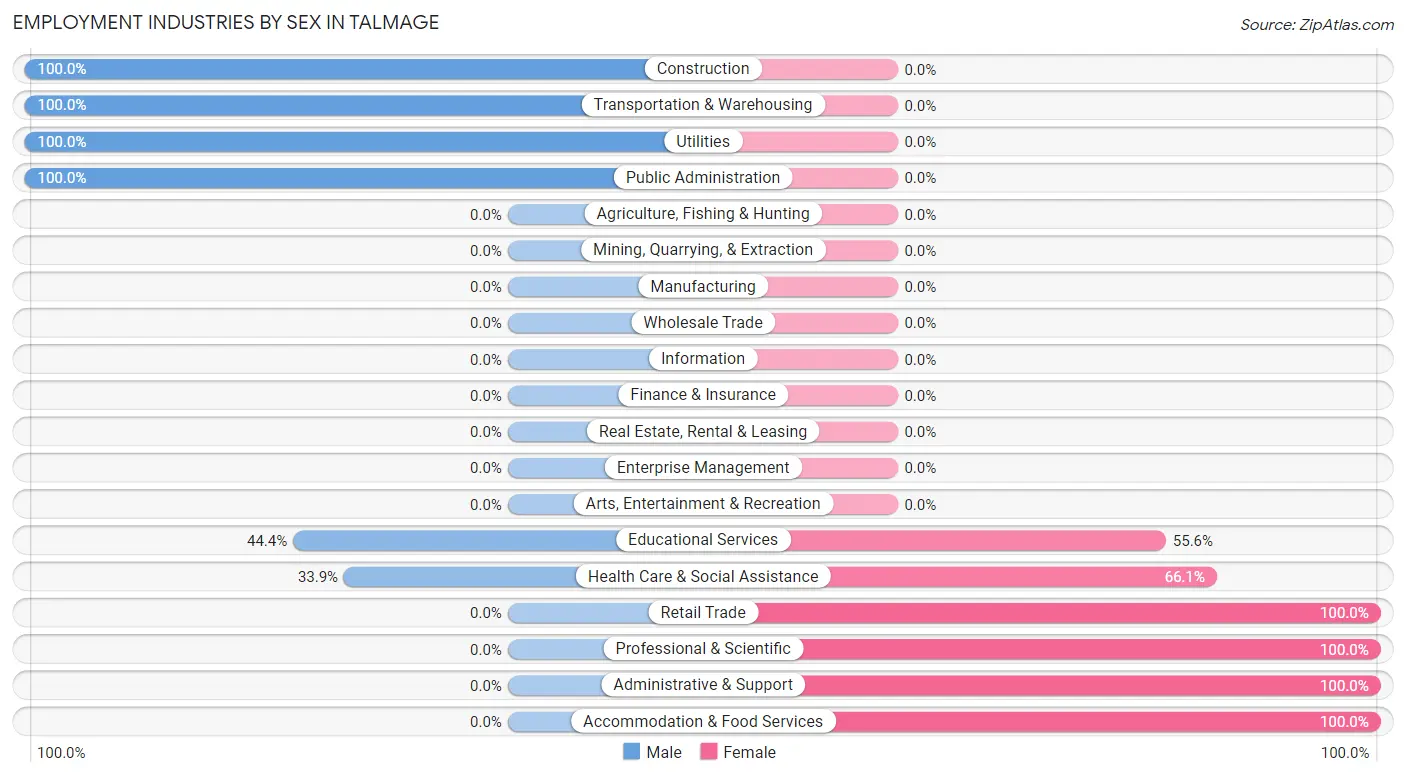
| Industry | Male | Female |
| Agriculture, Fishing & Hunting | 0 (0.0%) | 0 (0.0%) |
| Mining, Quarrying, & Extraction | 0 (0.0%) | 0 (0.0%) |
| Construction | 21 (100.0%) | 0 (0.0%) |
| Manufacturing | 0 (0.0%) | 0 (0.0%) |
| Wholesale Trade | 0 (0.0%) | 0 (0.0%) |
| Retail Trade | 0 (0.0%) | 25 (100.0%) |
| Transportation & Warehousing | 13 (100.0%) | 0 (0.0%) |
| Utilities | 31 (100.0%) | 0 (0.0%) |
| Information | 0 (0.0%) | 0 (0.0%) |
| Finance & Insurance | 0 (0.0%) | 0 (0.0%) |
| Real Estate, Rental & Leasing | 0 (0.0%) | 0 (0.0%) |
| Professional & Scientific | 0 (0.0%) | 19 (100.0%) |
| Enterprise Management | 0 (0.0%) | 0 (0.0%) |
| Administrative & Support | 0 (0.0%) | 9 (100.0%) |
| Educational Services | 12 (44.4%) | 15 (55.6%) |
| Health Care & Social Assistance | 20 (33.9%) | 39 (66.1%) |
| Arts, Entertainment & Recreation | 0 (0.0%) | 0 (0.0%) |
| Accommodation & Food Services | 0 (0.0%) | 12 (100.0%) |
| Public Administration | 10 (100.0%) | 0 (0.0%) |
| Total | 107 (47.3%) | 119 (52.6%) |
Education in Talmage
School Enrollment in Talmage
The most common levels of schooling among the 377 students in Talmage are college / undergraduate (204 | 54.1%), middle school (55 | 14.6%), and nursery / preschool (50 | 13.3%).
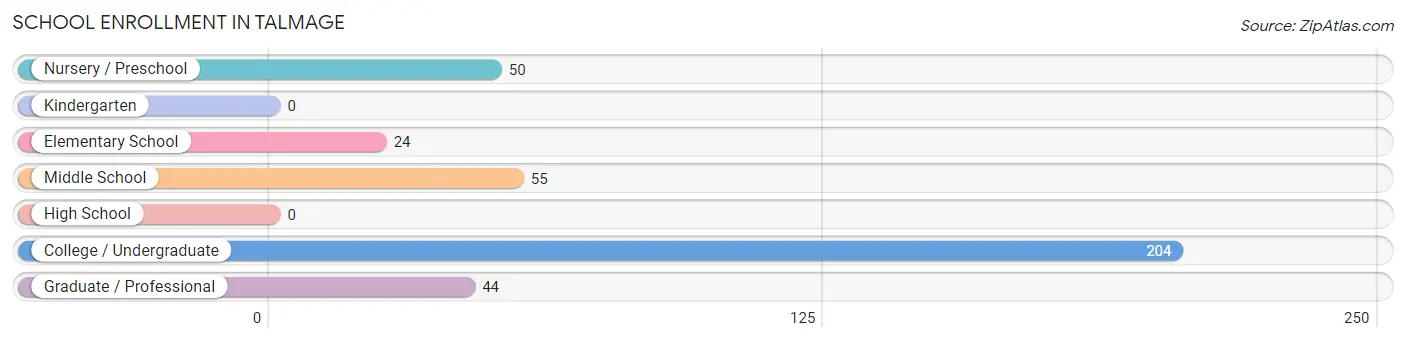
| School Level | # Students | % Students |
| Nursery / Preschool | 50 | 13.3% |
| Kindergarten | 0 | 0.0% |
| Elementary School | 24 | 6.4% |
| Middle School | 55 | 14.6% |
| High School | 0 | 0.0% |
| College / Undergraduate | 204 | 54.1% |
| Graduate / Professional | 44 | 11.7% |
| Total | 377 | 100.0% |
School Enrollment by Age by Funding Source in Talmage
Out of a total of 377 students who are enrolled in schools in Talmage, 53 (14.1%) attend a private institution, while the remaining 324 (85.9%) are enrolled in public schools. The age group of 20 to 24 year olds has the highest likelihood of being enrolled in private schools, with 37 (26.6% in the age bracket) enrolled. Conversely, the age group of 3 to 4 year olds has the lowest likelihood of being enrolled in a private school, with 50 (100.0% in the age bracket) attending a public institution.
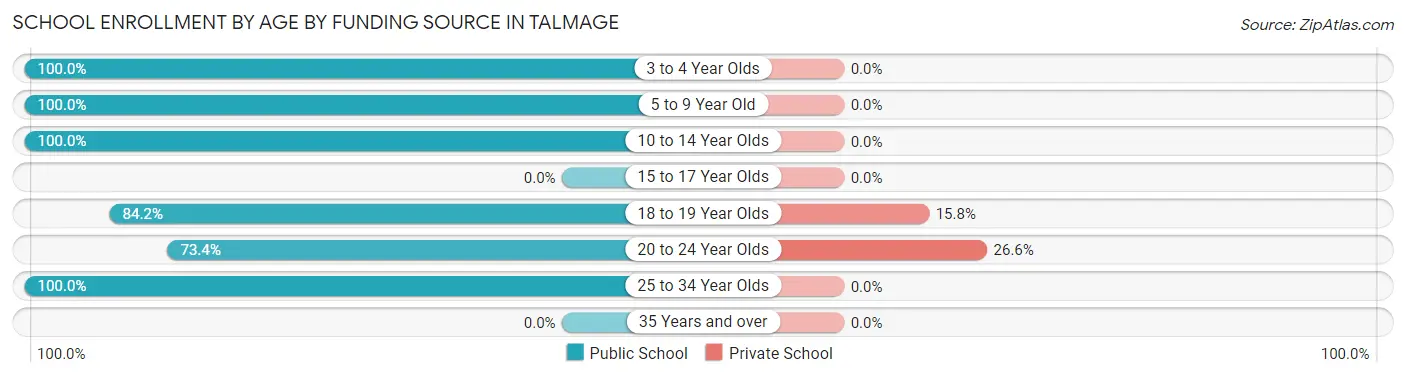
| Age Bracket | Public School | Private School |
| 3 to 4 Year Olds | 50 (100.0%) | 0 (0.0%) |
| 5 to 9 Year Old | 24 (100.0%) | 0 (0.0%) |
| 10 to 14 Year Olds | 55 (100.0%) | 0 (0.0%) |
| 15 to 17 Year Olds | 0 (0.0%) | 0 (0.0%) |
| 18 to 19 Year Olds | 85 (84.2%) | 16 (15.8%) |
| 20 to 24 Year Olds | 102 (73.4%) | 37 (26.6%) |
| 25 to 34 Year Olds | 8 (100.0%) | 0 (0.0%) |
| 35 Years and over | 0 (0.0%) | 0 (0.0%) |
| Total | 324 (85.9%) | 53 (14.1%) |
Educational Attainment by Field of Study in Talmage
Liberal arts & history (73 | 37.8%), bio, nature & agricultural (63 | 32.6%), literature & languages (37 | 19.2%), science & technology (13 | 6.7%), and education (7 | 3.6%) are the most common fields of study among 193 individuals in Talmage who have obtained a bachelor's degree or higher.
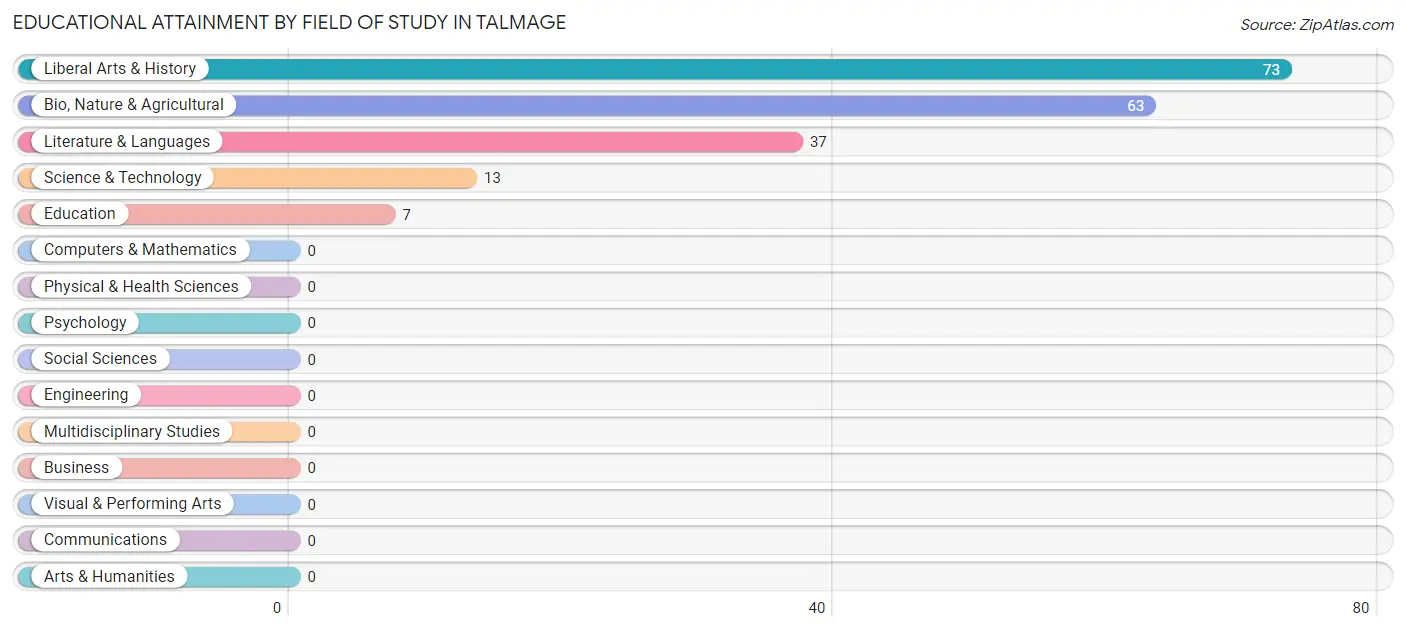
| Field of Study | # Graduates | % Graduates |
| Computers & Mathematics | 0 | 0.0% |
| Bio, Nature & Agricultural | 63 | 32.6% |
| Physical & Health Sciences | 0 | 0.0% |
| Psychology | 0 | 0.0% |
| Social Sciences | 0 | 0.0% |
| Engineering | 0 | 0.0% |
| Multidisciplinary Studies | 0 | 0.0% |
| Science & Technology | 13 | 6.7% |
| Business | 0 | 0.0% |
| Education | 7 | 3.6% |
| Literature & Languages | 37 | 19.2% |
| Liberal Arts & History | 73 | 37.8% |
| Visual & Performing Arts | 0 | 0.0% |
| Communications | 0 | 0.0% |
| Arts & Humanities | 0 | 0.0% |
| Total | 193 | 100.0% |
Transportation & Commute in Talmage
Vehicle Availability by Sex in Talmage
The most prevalent vehicle ownership categories in Talmage are males with 1 vehicle (51, accounting for 47.7%) and females with 1 vehicle (31, making up 68.0%).
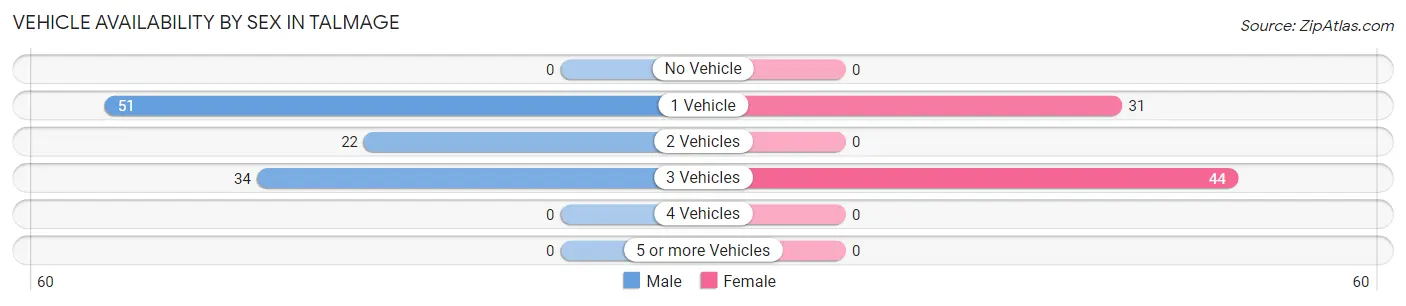
| Vehicles Available | Male | Female |
| No Vehicle | 0 (0.0%) | 0 (0.0%) |
| 1 Vehicle | 51 (47.7%) | 31 (41.3%) |
| 2 Vehicles | 22 (20.6%) | 0 (0.0%) |
| 3 Vehicles | 34 (31.8%) | 44 (58.7%) |
| 4 Vehicles | 0 (0.0%) | 0 (0.0%) |
| 5 or more Vehicles | 0 (0.0%) | 0 (0.0%) |
| Total | 107 (100.0%) | 75 (100.0%) |
Commute Time in Talmage
The most frequently occuring commute durations in Talmage are 10 to 14 minutes (75 commuters, 39.5%), 20 to 24 minutes (50 commuters, 26.3%), and 15 to 19 minutes (42 commuters, 22.1%).
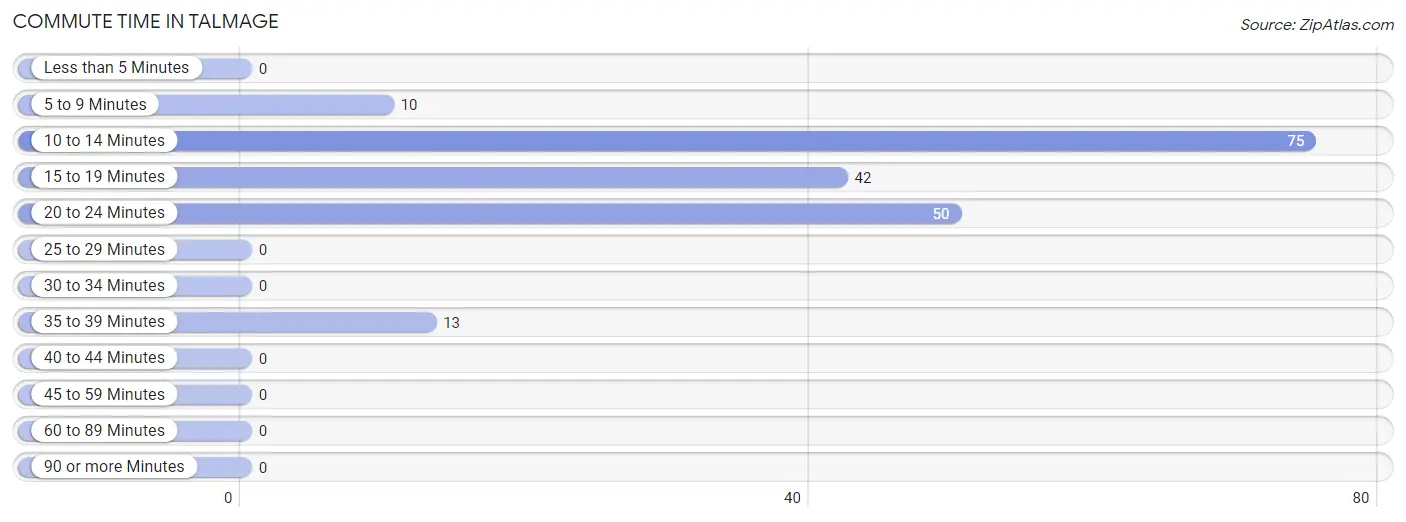
| Commute Time | # Commuters | % Commuters |
| Less than 5 Minutes | 0 | 0.0% |
| 5 to 9 Minutes | 10 | 5.3% |
| 10 to 14 Minutes | 75 | 39.5% |
| 15 to 19 Minutes | 42 | 22.1% |
| 20 to 24 Minutes | 50 | 26.3% |
| 25 to 29 Minutes | 0 | 0.0% |
| 30 to 34 Minutes | 0 | 0.0% |
| 35 to 39 Minutes | 13 | 6.8% |
| 40 to 44 Minutes | 0 | 0.0% |
| 45 to 59 Minutes | 0 | 0.0% |
| 60 to 89 Minutes | 0 | 0.0% |
| 90 or more Minutes | 0 | 0.0% |
Commute Time by Sex in Talmage
The most common commute times in Talmage are 20 to 24 minutes (41 commuters, 47.1%) for males and 10 to 14 minutes (66 commuters, 64.1%) for females.
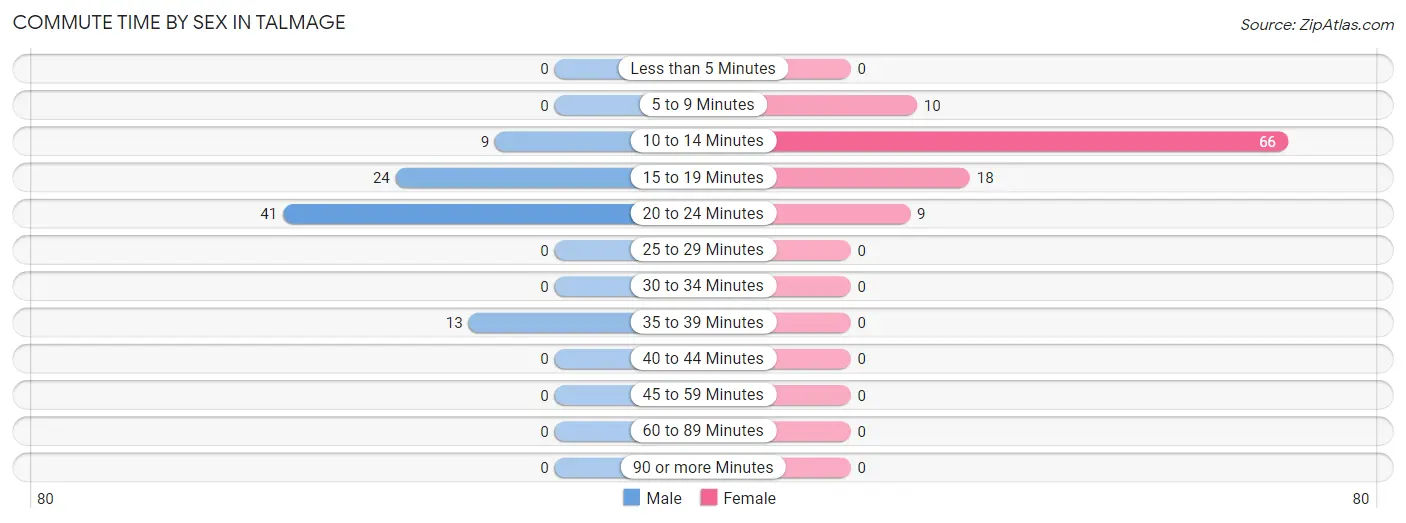
| Commute Time | Male | Female |
| Less than 5 Minutes | 0 (0.0%) | 0 (0.0%) |
| 5 to 9 Minutes | 0 (0.0%) | 10 (9.7%) |
| 10 to 14 Minutes | 9 (10.3%) | 66 (64.1%) |
| 15 to 19 Minutes | 24 (27.6%) | 18 (17.5%) |
| 20 to 24 Minutes | 41 (47.1%) | 9 (8.7%) |
| 25 to 29 Minutes | 0 (0.0%) | 0 (0.0%) |
| 30 to 34 Minutes | 0 (0.0%) | 0 (0.0%) |
| 35 to 39 Minutes | 13 (14.9%) | 0 (0.0%) |
| 40 to 44 Minutes | 0 (0.0%) | 0 (0.0%) |
| 45 to 59 Minutes | 0 (0.0%) | 0 (0.0%) |
| 60 to 89 Minutes | 0 (0.0%) | 0 (0.0%) |
| 90 or more Minutes | 0 (0.0%) | 0 (0.0%) |
Time of Departure to Work by Sex in Talmage
The most frequent times of departure to work in Talmage are 12:00 PM to 3:59 PM (31, 35.6%) for males and 12:00 PM to 3:59 PM (42, 40.8%) for females.
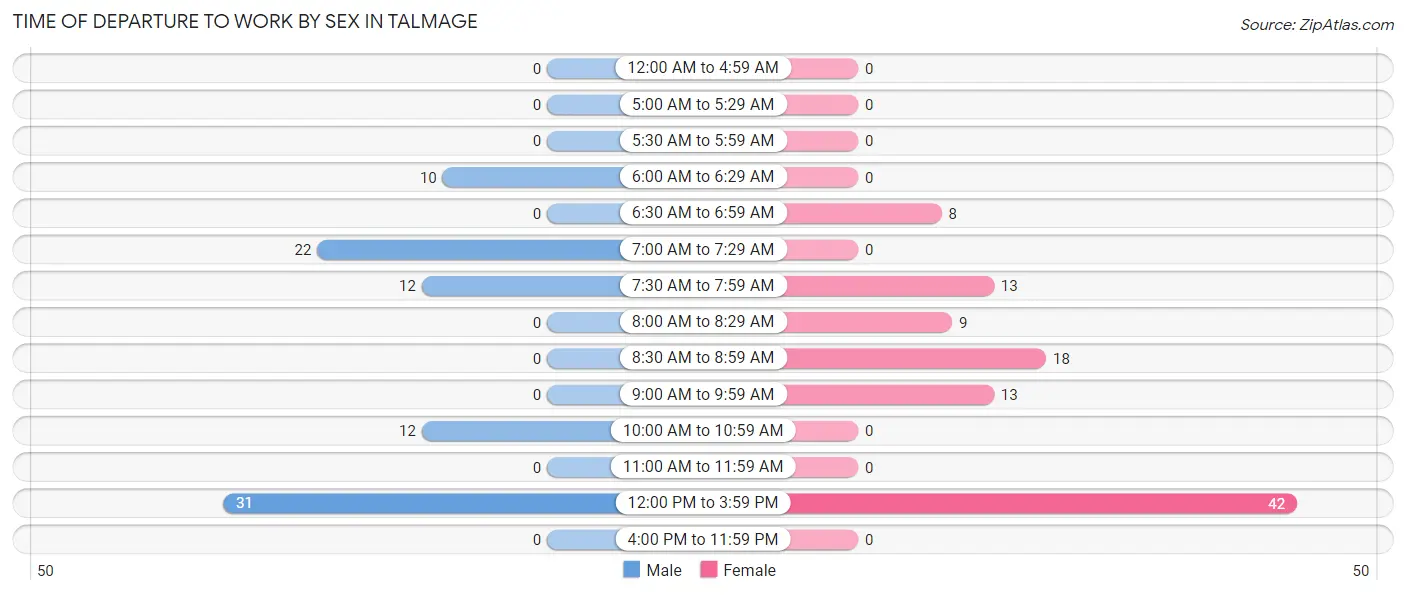
| Time of Departure | Male | Female |
| 12:00 AM to 4:59 AM | 0 (0.0%) | 0 (0.0%) |
| 5:00 AM to 5:29 AM | 0 (0.0%) | 0 (0.0%) |
| 5:30 AM to 5:59 AM | 0 (0.0%) | 0 (0.0%) |
| 6:00 AM to 6:29 AM | 10 (11.5%) | 0 (0.0%) |
| 6:30 AM to 6:59 AM | 0 (0.0%) | 8 (7.8%) |
| 7:00 AM to 7:29 AM | 22 (25.3%) | 0 (0.0%) |
| 7:30 AM to 7:59 AM | 12 (13.8%) | 13 (12.6%) |
| 8:00 AM to 8:29 AM | 0 (0.0%) | 9 (8.7%) |
| 8:30 AM to 8:59 AM | 0 (0.0%) | 18 (17.5%) |
| 9:00 AM to 9:59 AM | 0 (0.0%) | 13 (12.6%) |
| 10:00 AM to 10:59 AM | 12 (13.8%) | 0 (0.0%) |
| 11:00 AM to 11:59 AM | 0 (0.0%) | 0 (0.0%) |
| 12:00 PM to 3:59 PM | 31 (35.6%) | 42 (40.8%) |
| 4:00 PM to 11:59 PM | 0 (0.0%) | 0 (0.0%) |
| Total | 87 (100.0%) | 103 (100.0%) |
Housing Occupancy in Talmage
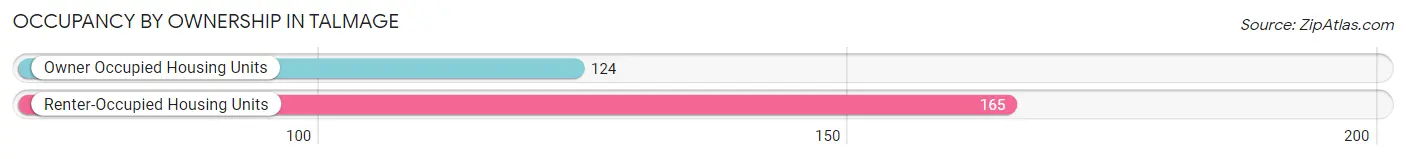
Occupancy by Ownership in Talmage
Of the total 289 dwellings in Talmage, owner-occupied units account for 124 (42.9%), while renter-occupied units make up 165 (57.1%).
| Occupancy | # Housing Units | % Housing Units |
| Owner Occupied Housing Units | 124 | 42.9% |
| Renter-Occupied Housing Units | 165 | 57.1% |
| Total Occupied Housing Units | 289 | 100.0% |
Occupancy by Household Size in Talmage
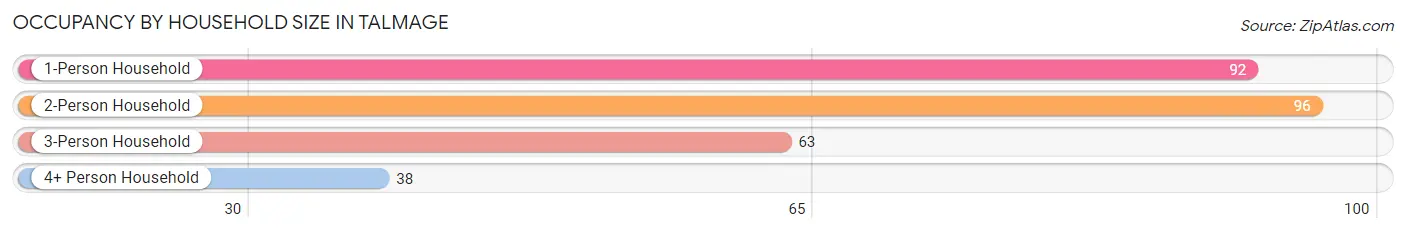
| Household Size | # Housing Units | % Housing Units |
| 1-Person Household | 92 | 31.8% |
| 2-Person Household | 96 | 33.2% |
| 3-Person Household | 63 | 21.8% |
| 4+ Person Household | 38 | 13.2% |
| Total Housing Units | 289 | 100.0% |
Occupancy by Ownership by Household Size in Talmage
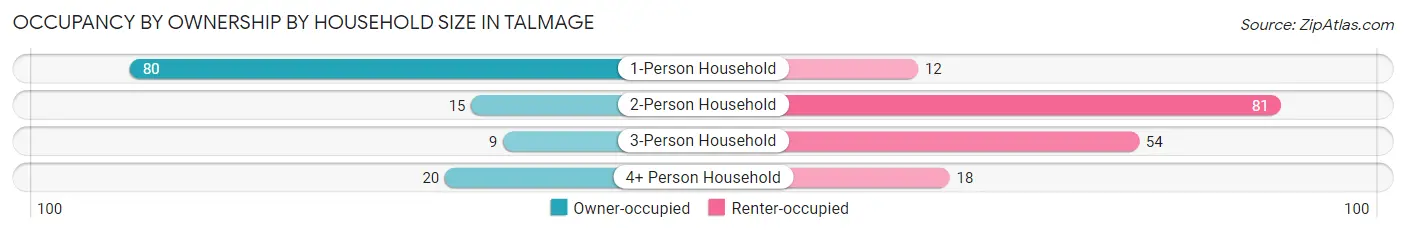
| Household Size | Owner-occupied | Renter-occupied |
| 1-Person Household | 80 (87.0%) | 12 (13.0%) |
| 2-Person Household | 15 (15.6%) | 81 (84.4%) |
| 3-Person Household | 9 (14.3%) | 54 (85.7%) |
| 4+ Person Household | 20 (52.6%) | 18 (47.4%) |
| Total Housing Units | 124 (42.9%) | 165 (57.1%) |
Occupancy by Educational Attainment in Talmage
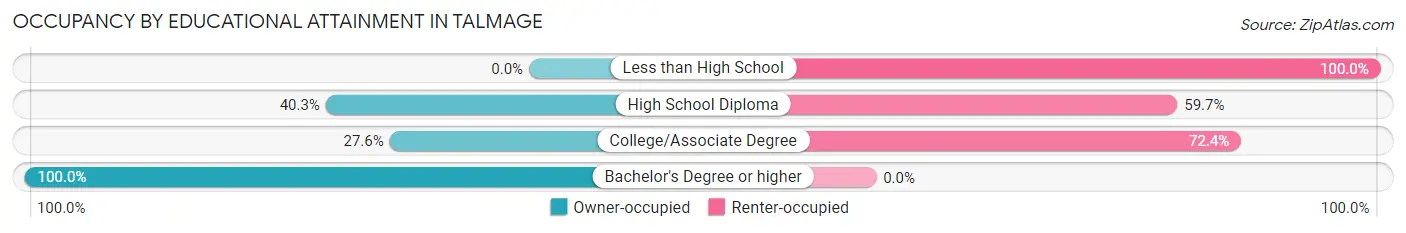
| Household Size | Owner-occupied | Renter-occupied |
| Less than High School | 0 (0.0%) | 36 (100.0%) |
| High School Diploma | 27 (40.3%) | 40 (59.7%) |
| College/Associate Degree | 34 (27.6%) | 89 (72.4%) |
| Bachelor's Degree or higher | 63 (100.0%) | 0 (0.0%) |
Occupancy by Age of Householder in Talmage
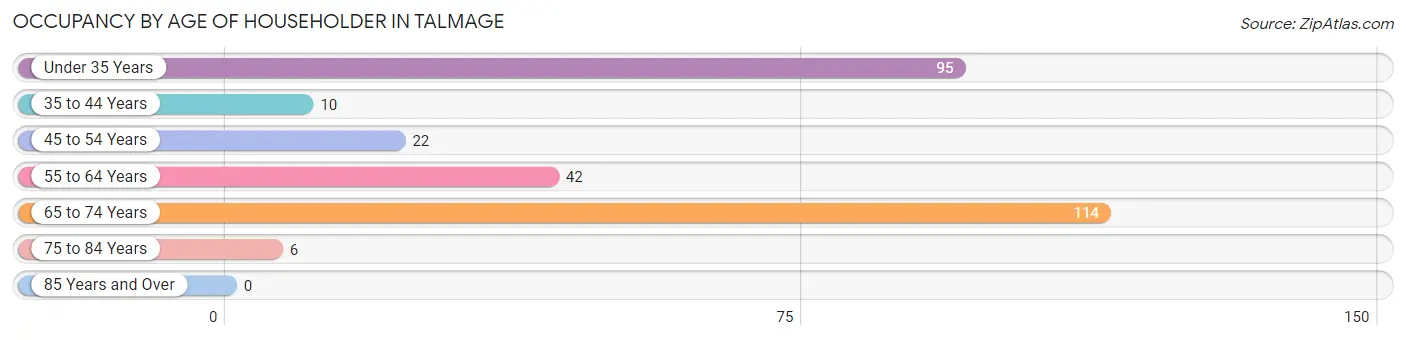
| Age Bracket | # Households | % Households |
| Under 35 Years | 95 | 32.9% |
| 35 to 44 Years | 10 | 3.5% |
| 45 to 54 Years | 22 | 7.6% |
| 55 to 64 Years | 42 | 14.5% |
| 65 to 74 Years | 114 | 39.5% |
| 75 to 84 Years | 6 | 2.1% |
| 85 Years and Over | 0 | 0.0% |
| Total | 289 | 100.0% |
Housing Finances in Talmage
Median Income by Occupancy in Talmage
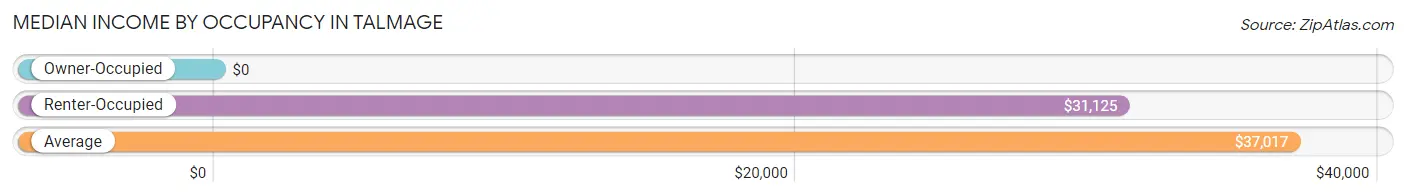
| Occupancy Type | # Households | Median Income |
| Owner-Occupied | 124 (42.9%) | $0 |
| Renter-Occupied | 165 (57.1%) | $31,125 |
| Average | 289 (100.0%) | $37,017 |
Occupancy by Householder Income Bracket in Talmage
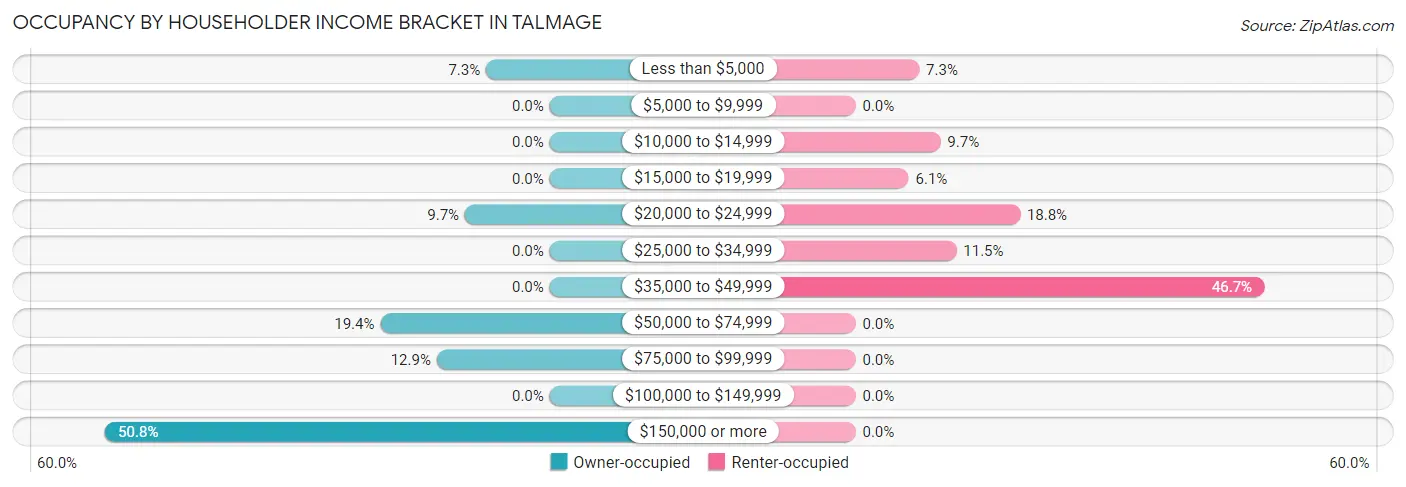
| Income Bracket | Owner-occupied | Renter-occupied |
| Less than $5,000 | 9 (7.3%) | 12 (7.3%) |
| $5,000 to $9,999 | 0 (0.0%) | 0 (0.0%) |
| $10,000 to $14,999 | 0 (0.0%) | 16 (9.7%) |
| $15,000 to $19,999 | 0 (0.0%) | 10 (6.1%) |
| $20,000 to $24,999 | 12 (9.7%) | 31 (18.8%) |
| $25,000 to $34,999 | 0 (0.0%) | 19 (11.5%) |
| $35,000 to $49,999 | 0 (0.0%) | 77 (46.7%) |
| $50,000 to $74,999 | 24 (19.4%) | 0 (0.0%) |
| $75,000 to $99,999 | 16 (12.9%) | 0 (0.0%) |
| $100,000 to $149,999 | 0 (0.0%) | 0 (0.0%) |
| $150,000 or more | 63 (50.8%) | 0 (0.0%) |
| Total | 124 (100.0%) | 165 (100.0%) |
Monthly Housing Cost Tiers in Talmage
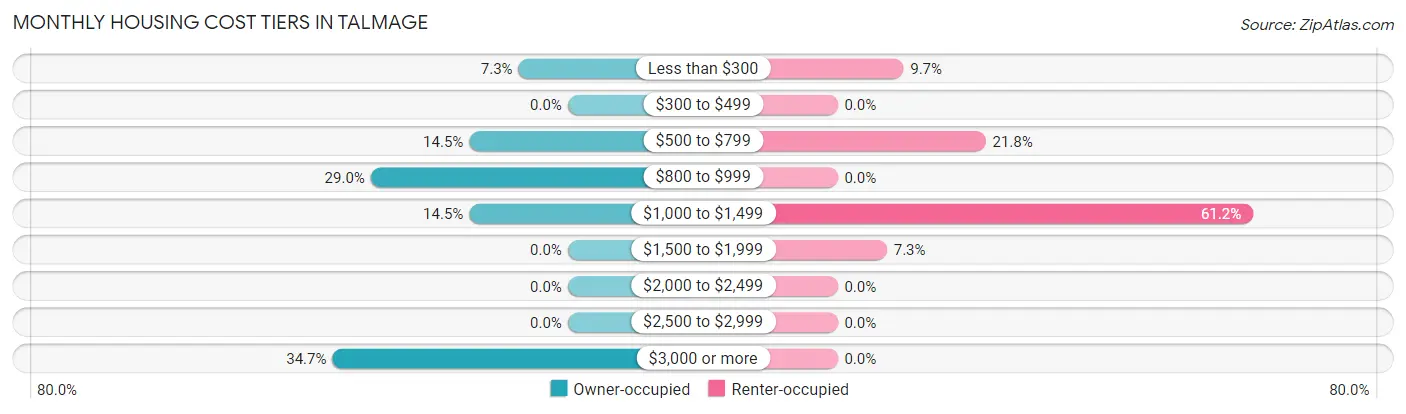
| Monthly Cost | Owner-occupied | Renter-occupied |
| Less than $300 | 9 (7.3%) | 16 (9.7%) |
| $300 to $499 | 0 (0.0%) | 0 (0.0%) |
| $500 to $799 | 18 (14.5%) | 36 (21.8%) |
| $800 to $999 | 36 (29.0%) | 0 (0.0%) |
| $1,000 to $1,499 | 18 (14.5%) | 101 (61.2%) |
| $1,500 to $1,999 | 0 (0.0%) | 12 (7.3%) |
| $2,000 to $2,499 | 0 (0.0%) | 0 (0.0%) |
| $2,500 to $2,999 | 0 (0.0%) | 0 (0.0%) |
| $3,000 or more | 43 (34.7%) | 0 (0.0%) |
| Total | 124 (100.0%) | 165 (100.0%) |
Physical Housing Characteristics in Talmage
Housing Structures in Talmage
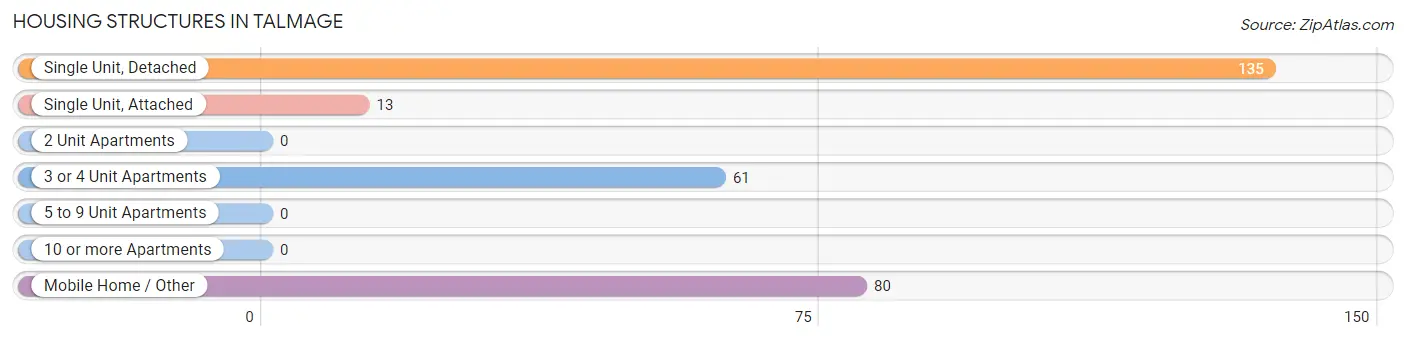
| Structure Type | # Housing Units | % Housing Units |
| Single Unit, Detached | 135 | 46.7% |
| Single Unit, Attached | 13 | 4.5% |
| 2 Unit Apartments | 0 | 0.0% |
| 3 or 4 Unit Apartments | 61 | 21.1% |
| 5 to 9 Unit Apartments | 0 | 0.0% |
| 10 or more Apartments | 0 | 0.0% |
| Mobile Home / Other | 80 | 27.7% |
| Total | 289 | 100.0% |
Housing Structures by Occupancy in Talmage
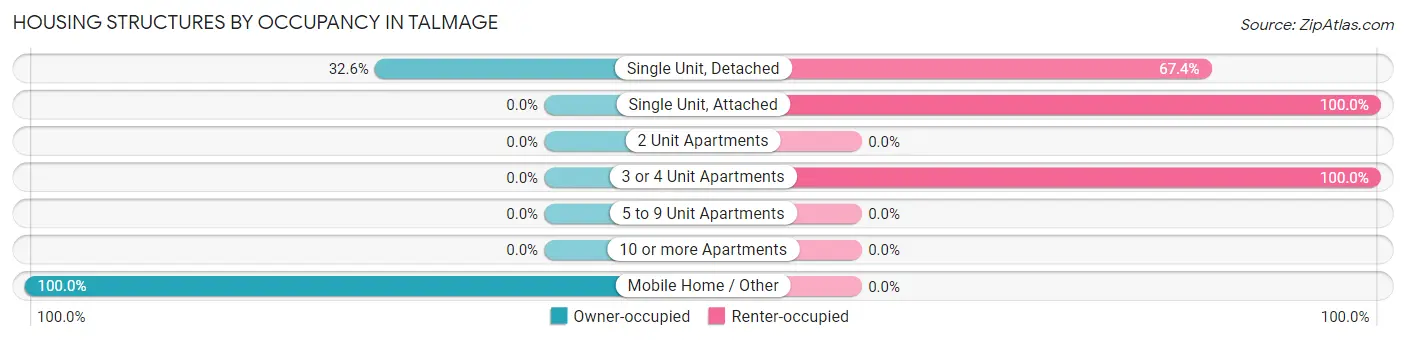
| Structure Type | Owner-occupied | Renter-occupied |
| Single Unit, Detached | 44 (32.6%) | 91 (67.4%) |
| Single Unit, Attached | 0 (0.0%) | 13 (100.0%) |
| 2 Unit Apartments | 0 (0.0%) | 0 (0.0%) |
| 3 or 4 Unit Apartments | 0 (0.0%) | 61 (100.0%) |
| 5 to 9 Unit Apartments | 0 (0.0%) | 0 (0.0%) |
| 10 or more Apartments | 0 (0.0%) | 0 (0.0%) |
| Mobile Home / Other | 80 (100.0%) | 0 (0.0%) |
| Total | 124 (42.9%) | 165 (57.1%) |
Housing Structures by Number of Rooms in Talmage
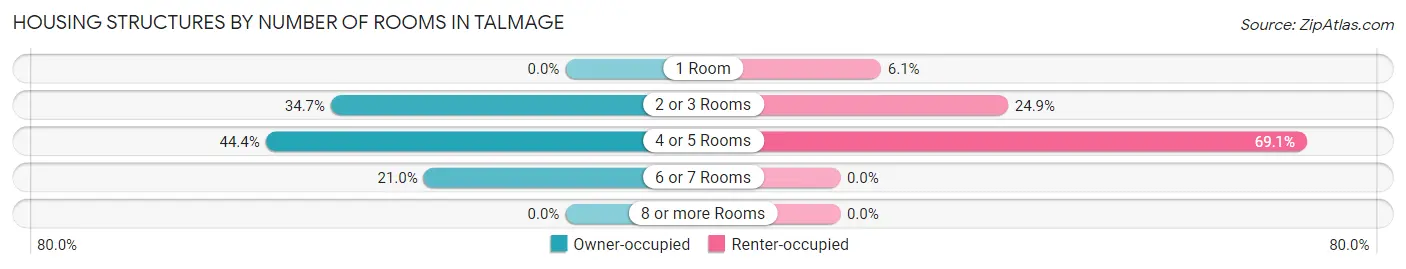
| Number of Rooms | Owner-occupied | Renter-occupied |
| 1 Room | 0 (0.0%) | 10 (6.1%) |
| 2 or 3 Rooms | 43 (34.7%) | 41 (24.8%) |
| 4 or 5 Rooms | 55 (44.4%) | 114 (69.1%) |
| 6 or 7 Rooms | 26 (21.0%) | 0 (0.0%) |
| 8 or more Rooms | 0 (0.0%) | 0 (0.0%) |
| Total | 124 (100.0%) | 165 (100.0%) |
Housing Structure by Heating Type in Talmage
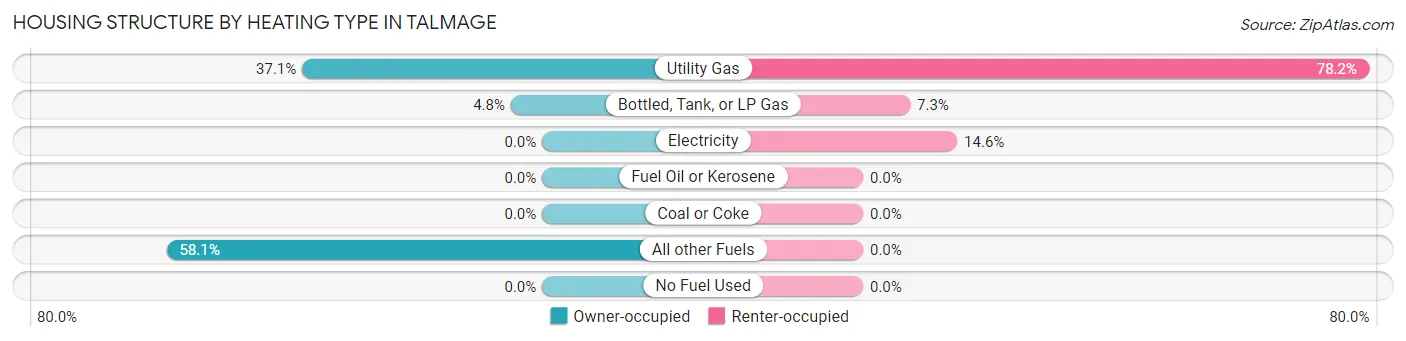
| Heating Type | Owner-occupied | Renter-occupied |
| Utility Gas | 46 (37.1%) | 129 (78.2%) |
| Bottled, Tank, or LP Gas | 6 (4.8%) | 12 (7.3%) |
| Electricity | 0 (0.0%) | 24 (14.5%) |
| Fuel Oil or Kerosene | 0 (0.0%) | 0 (0.0%) |
| Coal or Coke | 0 (0.0%) | 0 (0.0%) |
| All other Fuels | 72 (58.1%) | 0 (0.0%) |
| No Fuel Used | 0 (0.0%) | 0 (0.0%) |
| Total | 124 (100.0%) | 165 (100.0%) |
Household Vehicle Usage in Talmage
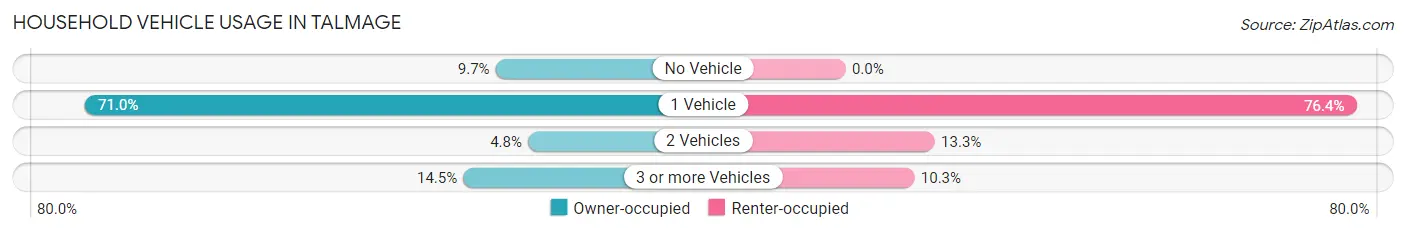
| Vehicles per Household | Owner-occupied | Renter-occupied |
| No Vehicle | 12 (9.7%) | 0 (0.0%) |
| 1 Vehicle | 88 (71.0%) | 126 (76.4%) |
| 2 Vehicles | 6 (4.8%) | 22 (13.3%) |
| 3 or more Vehicles | 18 (14.5%) | 17 (10.3%) |
| Total | 124 (100.0%) | 165 (100.0%) |
Real Estate & Mortgages in Talmage
Real Estate and Mortgage Overview in Talmage
| Characteristic | Without Mortgage | With Mortgage |
| Housing Units | 60 | 64 |
| Median Property Value | - | - |
| Median Household Income | $88,438 | $43 |
| Monthly Housing Costs | $860 | $43 |
| Real Estate Taxes | - | - |
Property Value by Mortgage Status in Talmage
| Property Value | Without Mortgage | With Mortgage |
| Less than $50,000 | 0 (0.0%) | 0 (0.0%) |
| $50,000 to $99,999 | 16 (26.7%) | 0 (0.0%) |
| $100,000 to $299,999 | 9 (15.0%) | 12 (18.8%) |
| $300,000 to $499,999 | 9 (15.0%) | 0 (0.0%) |
| $500,000 to $749,999 | 26 (43.3%) | 9 (14.1%) |
| $750,000 to $999,999 | 0 (0.0%) | 43 (67.2%) |
| $1,000,000 or more | 0 (0.0%) | 0 (0.0%) |
| Total | 60 (100.0%) | 64 (100.0%) |
Household Income by Mortgage Status in Talmage
| Household Income | Without Mortgage | With Mortgage |
| Less than $10,000 | 9 (15.0%) | 0 (0.0%) |
| $10,000 to $24,999 | 0 (0.0%) | 0 (0.0%) |
| $25,000 to $34,999 | 0 (0.0%) | 12 (18.8%) |
| $35,000 to $49,999 | 0 (0.0%) | 0 (0.0%) |
| $50,000 to $74,999 | 15 (25.0%) | 0 (0.0%) |
| $75,000 to $99,999 | 16 (26.7%) | 9 (14.1%) |
| $100,000 to $149,999 | 0 (0.0%) | 0 (0.0%) |
| $150,000 or more | 20 (33.3%) | 0 (0.0%) |
| Total | 60 (100.0%) | 64 (100.0%) |
Property Value to Household Income Ratio in Talmage
| Value-to-Income Ratio | Without Mortgage | With Mortgage |
| Less than 2.0x | 16 (26.7%) | 250,001 (390,626.6%) |
| 2.0x to 2.9x | 0 (0.0%) | 43 (67.2%) |
| 3.0x to 3.9x | 20 (33.3%) | 0 (0.0%) |
| 4.0x or more | 15 (25.0%) | 0 (0.0%) |
| Total | 60 (100.0%) | 64 (100.0%) |
Real Estate Taxes by Mortgage Status in Talmage
| Property Taxes | Without Mortgage | With Mortgage |
| Less than $800 | 9 (15.0%) | 0 (0.0%) |
| $800 to $1,499 | 0 (0.0%) | 0 (0.0%) |
| $800 to $1,499 | 35 (58.3%) | 12 (18.8%) |
| Total | 60 (100.0%) | 64 (100.0%) |
Health & Disability in Talmage
Health Insurance Coverage by Age in Talmage
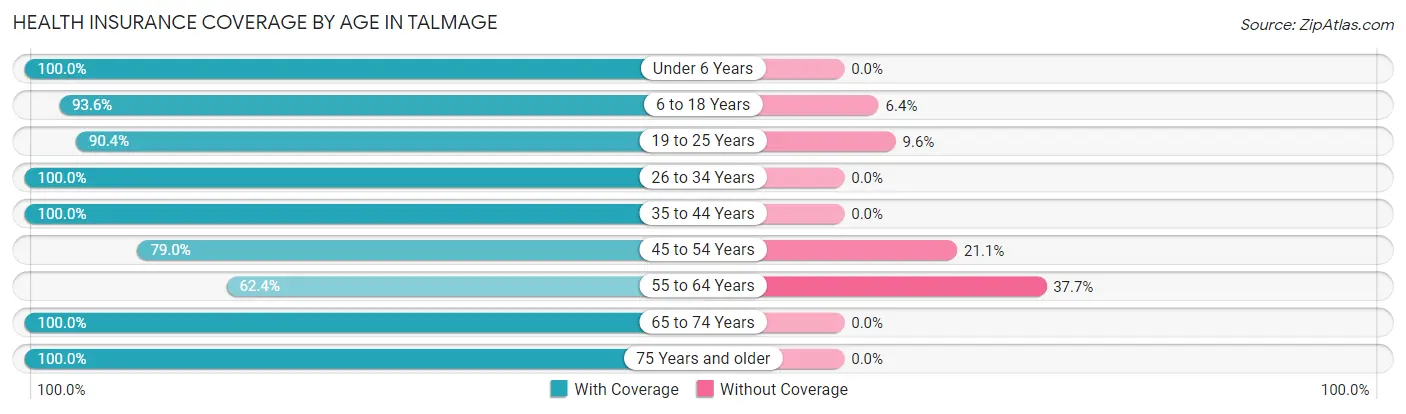
| Age Bracket | With Coverage | Without Coverage |
| Under 6 Years | 140 (100.0%) | 0 (0.0%) |
| 6 to 18 Years | 146 (93.6%) | 10 (6.4%) |
| 19 to 25 Years | 170 (90.4%) | 18 (9.6%) |
| 26 to 34 Years | 104 (100.0%) | 0 (0.0%) |
| 35 to 44 Years | 30 (100.0%) | 0 (0.0%) |
| 45 to 54 Years | 45 (78.9%) | 12 (21.0%) |
| 55 to 64 Years | 106 (62.4%) | 64 (37.7%) |
| 65 to 74 Years | 167 (100.0%) | 0 (0.0%) |
| 75 Years and older | 19 (100.0%) | 0 (0.0%) |
| Total | 927 (89.9%) | 104 (10.1%) |
Health Insurance Coverage by Citizenship Status in Talmage
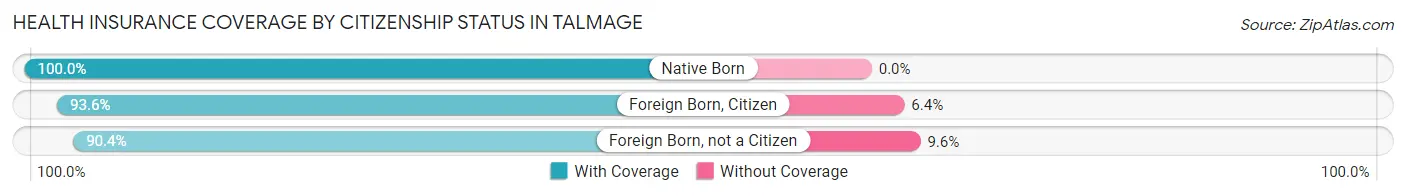
| Citizenship Status | With Coverage | Without Coverage |
| Native Born | 140 (100.0%) | 0 (0.0%) |
| Foreign Born, Citizen | 146 (93.6%) | 10 (6.4%) |
| Foreign Born, not a Citizen | 170 (90.4%) | 18 (9.6%) |
Health Insurance Coverage by Household Income in Talmage
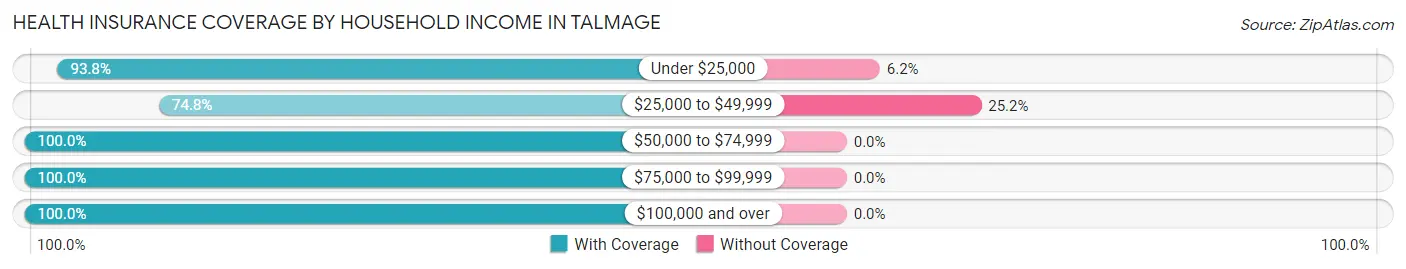
| Household Income | With Coverage | Without Coverage |
| Under $25,000 | 182 (93.8%) | 12 (6.2%) |
| $25,000 to $49,999 | 190 (74.8%) | 64 (25.2%) |
| $50,000 to $74,999 | 65 (100.0%) | 0 (0.0%) |
| $75,000 to $99,999 | 16 (100.0%) | 0 (0.0%) |
| $100,000 and over | 120 (100.0%) | 0 (0.0%) |
Public vs Private Health Insurance Coverage by Age in Talmage
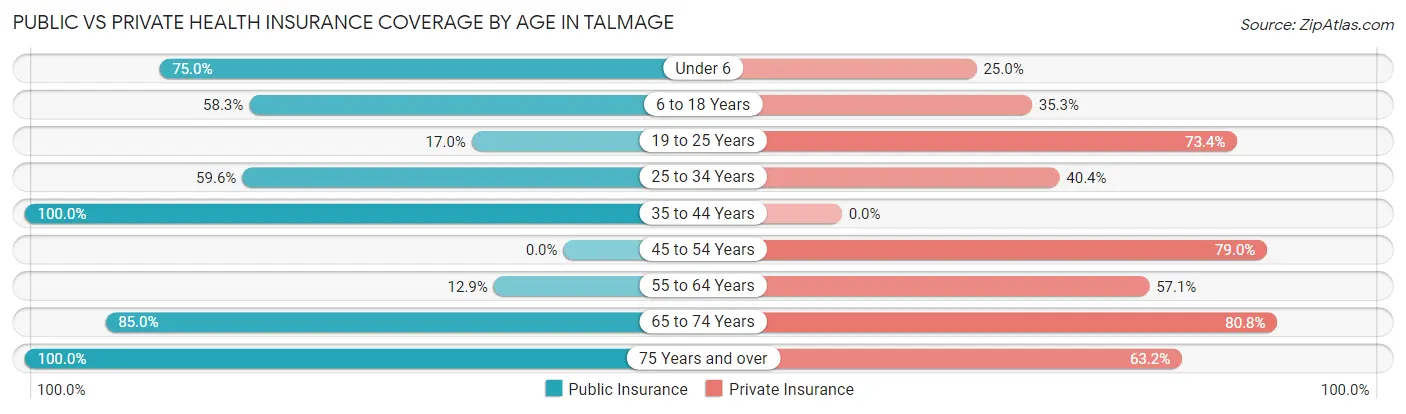
| Age Bracket | Public Insurance | Private Insurance |
| Under 6 | 105 (75.0%) | 35 (25.0%) |
| 6 to 18 Years | 91 (58.3%) | 55 (35.3%) |
| 19 to 25 Years | 32 (17.0%) | 138 (73.4%) |
| 25 to 34 Years | 62 (59.6%) | 42 (40.4%) |
| 35 to 44 Years | 30 (100.0%) | 0 (0.0%) |
| 45 to 54 Years | 0 (0.0%) | 45 (78.9%) |
| 55 to 64 Years | 22 (12.9%) | 97 (57.1%) |
| 65 to 74 Years | 142 (85.0%) | 135 (80.8%) |
| 75 Years and over | 19 (100.0%) | 12 (63.2%) |
| Total | 503 (48.8%) | 559 (54.2%) |
Disability Status by Sex by Age in Talmage
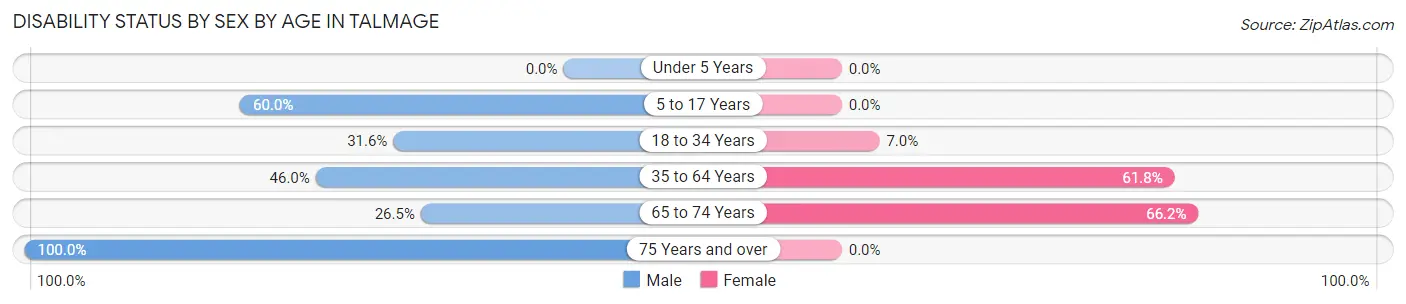
| Age Bracket | Male | Female |
| Under 5 Years | 0 (0.0%) | 0 (0.0%) |
| 5 to 17 Years | 12 (60.0%) | 0 (0.0%) |
| 18 to 34 Years | 36 (31.6%) | 17 (7.0%) |
| 35 to 64 Years | 40 (46.0%) | 105 (61.8%) |
| 65 to 74 Years | 9 (26.5%) | 88 (66.2%) |
| 75 Years and over | 6 (100.0%) | 0 (0.0%) |
Disability Class by Sex by Age in Talmage
Disability Class: Hearing Difficulty
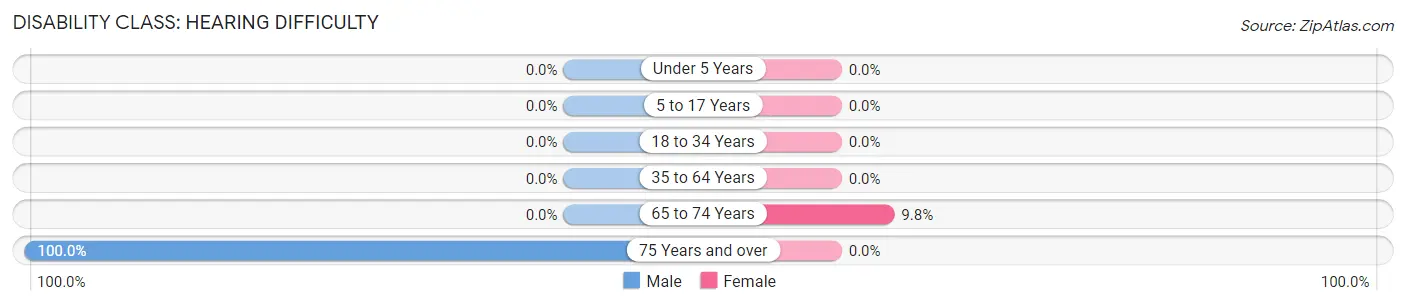
| Age Bracket | Male | Female |
| Under 5 Years | 0 (0.0%) | 0 (0.0%) |
| 5 to 17 Years | 0 (0.0%) | 0 (0.0%) |
| 18 to 34 Years | 0 (0.0%) | 0 (0.0%) |
| 35 to 64 Years | 0 (0.0%) | 0 (0.0%) |
| 65 to 74 Years | 0 (0.0%) | 13 (9.8%) |
| 75 Years and over | 6 (100.0%) | 0 (0.0%) |
Disability Class: Vision Difficulty
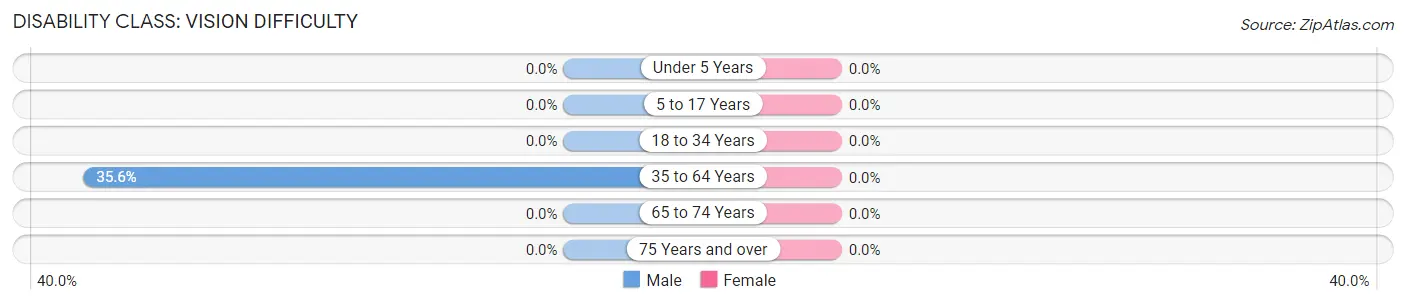
| Age Bracket | Male | Female |
| Under 5 Years | 0 (0.0%) | 0 (0.0%) |
| 5 to 17 Years | 0 (0.0%) | 0 (0.0%) |
| 18 to 34 Years | 0 (0.0%) | 0 (0.0%) |
| 35 to 64 Years | 31 (35.6%) | 0 (0.0%) |
| 65 to 74 Years | 0 (0.0%) | 0 (0.0%) |
| 75 Years and over | 0 (0.0%) | 0 (0.0%) |
Disability Class: Cognitive Difficulty
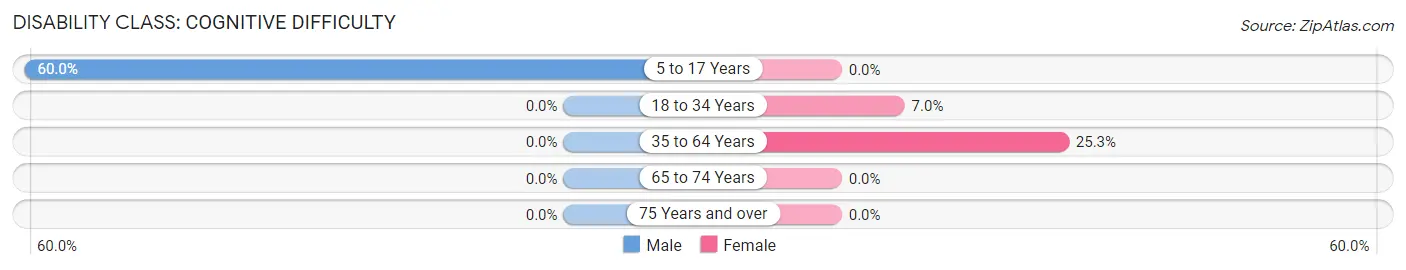
| Age Bracket | Male | Female |
| 5 to 17 Years | 12 (60.0%) | 0 (0.0%) |
| 18 to 34 Years | 0 (0.0%) | 17 (7.0%) |
| 35 to 64 Years | 0 (0.0%) | 43 (25.3%) |
| 65 to 74 Years | 0 (0.0%) | 0 (0.0%) |
| 75 Years and over | 0 (0.0%) | 0 (0.0%) |
Disability Class: Ambulatory Difficulty
| Age Bracket | Male | Female |
| 5 to 17 Years | 0 (0.0%) | 0 (0.0%) |
| 18 to 34 Years | 36 (31.6%) | 0 (0.0%) |
| 35 to 64 Years | 9 (10.3%) | 0 (0.0%) |
| 65 to 74 Years | 9 (26.5%) | 50 (37.6%) |
| 75 Years and over | 0 (0.0%) | 0 (0.0%) |
Disability Class: Self-Care Difficulty
| Age Bracket | Male | Female |
| 5 to 17 Years | 0 (0.0%) | 0 (0.0%) |
| 18 to 34 Years | 36 (31.6%) | 0 (0.0%) |
| 35 to 64 Years | 9 (10.3%) | 0 (0.0%) |
| 65 to 74 Years | 9 (26.5%) | 0 (0.0%) |
| 75 Years and over | 0 (0.0%) | 0 (0.0%) |
Technology Access in Talmage
Computing Device Access in Talmage
| Device Type | # Households | % Households |
| Desktop or Laptop | 226 | 78.2% |
| Smartphone | 247 | 85.5% |
| Tablet | 162 | 56.1% |
| No Computing Device | 9 | 3.1% |
| Total | 289 | 100.0% |
Internet Access in Talmage
| Internet Type | # Households | % Households |
| Dial-Up Internet | 0 | 0.0% |
| Broadband Home | 213 | 73.7% |
| Cellular Data Only | 34 | 11.8% |
| Satellite Internet | 33 | 11.4% |
| No Internet | 9 | 3.1% |
| Total | 289 | 100.0% |
Talmage Summary
Talmage is a small unincorporated community located in Mendocino County, California. It is situated in the Russian River Valley, approximately 8 miles east of Ukiah and about 2 miles south of the town of Hopland. The population of Talmage was estimated to be around 1,000 in 2020.
History
The area now known as Talmage was originally inhabited by the Pomo people, who lived in the area for thousands of years before the arrival of Europeans. The first Europeans to settle in the area were Russian fur traders, who arrived in the early 19th century. The area was later settled by American settlers in the 1850s, who named the area Talmage after a local rancher, John Talmage.
The town of Talmage was officially established in 1876, and the first post office was established in 1877. The town grew slowly over the next few decades, and by the early 20th century, it had become a popular tourist destination due to its proximity to the Russian River.
Geography
Talmage is located in the Russian River Valley, approximately 8 miles east of Ukiah and about 2 miles south of the town of Hopland. The town is situated at an elevation of approximately 500 feet above sea level. The climate in Talmage is generally mild, with temperatures ranging from the mid-50s to the mid-70s throughout the year.
The town is surrounded by vineyards and orchards, and the area is known for its production of wine and other agricultural products. The Russian River runs through the town, providing a source of recreation for locals and visitors alike.
Economy
The economy of Talmage is largely based on agriculture and tourism. The town is home to several wineries and vineyards, and the area is known for its production of wine and other agricultural products. Tourism is also an important part of the local economy, as the town is a popular destination for visitors looking to explore the Russian River Valley.
In addition to agriculture and tourism, Talmage is home to several small businesses, including restaurants, shops, and other services. The town is also home to a number of small manufacturing companies, which produce a variety of products, including furniture, clothing, and electronics.
Demographics
As of the 2020 census, the population of Talmage was estimated to be around 1,000. The racial makeup of the town was 79.2% White, 0.7% African American, 0.3% Native American, 0.3% Asian, 0.1% Pacific Islander, and 19.4% from other races. The median household income in Talmage was $50,000, and the median age was 44.
Talmage is a small, close-knit community, and the town is known for its friendly atmosphere and welcoming attitude towards visitors. The town is home to a variety of churches, and there are several parks and recreational areas in the area. The town is also home to a number of small businesses, which provide a variety of services to the local community.
Common Questions
What is Per Capita Income in Talmage?
Per Capita income in Talmage is $33,786.
What is the Median Family Income in Talmage?
Median Family Income in Talmage is $35,382.
What is the Median Household income in Talmage?
Median Household Income in Talmage is $37,017.
What is Income or Wage Gap in Talmage?
Income or Wage Gap in Talmage is 56.6%.
Women in Talmage earn 43.4 cents for every dollar earned by a man.
What is Family Income Deficit in Talmage?
Family Income Deficit in Talmage is $8,246.
Families that are below poverty line in Talmage earn $8,246 less on average than the poverty threshold level.
What is Inequality or Gini Index in Talmage?
Inequality or Gini Index in Talmage is 0.64.
What is the Total Population of Talmage?
Total Population of Talmage is 1,031.
What is the Total Male Population of Talmage?
Total Male Population of Talmage is 298.
What is the Total Female Population of Talmage?
Total Female Population of Talmage is 733.
What is the Ratio of Males per 100 Females in Talmage?
There are 40.65 Males per 100 Females in Talmage.
What is the Ratio of Females per 100 Males in Talmage?
There are 245.97 Females per 100 Males in Talmage.
What is the Median Population Age in Talmage?
Median Population Age in Talmage is 31.3 Years.
What is the Average Family Size in Talmage
Average Family Size in Talmage is 2.7 People.
What is the Average Household Size in Talmage
Average Household Size in Talmage is 2.2 People.
How Large is the Labor Force in Talmage?
There are 246 People in the Labor Forcein in Talmage.
What is the Percentage of People in the Labor Force in Talmage?
30.3% of People are in the Labor Force in Talmage.
What is the Unemployment Rate in Talmage?
Unemployment Rate in Talmage is 8.1%.