Felton, CA Map & Demographics
Felton Map
Felton Overview
$60,792
PER CAPITA INCOME
$123,036
AVG FAMILY INCOME
$108,370
AVG HOUSEHOLD INCOME
16.8%
WAGE / INCOME GAP [ % ]
83.2¢/ $1
WAGE / INCOME GAP [ $ ]
0.39
INEQUALITY / GINI INDEX
3,701
TOTAL POPULATION
1,984
MALE POPULATION
1,717
FEMALE POPULATION
115.55
MALES / 100 FEMALES
86.54
FEMALES / 100 MALES
45.4
MEDIAN AGE
2.9
AVG FAMILY SIZE
2.4
AVG HOUSEHOLD SIZE
2,136
LABOR FORCE [ PEOPLE ]
66.3%
PERCENT IN LABOR FORCE
2.9%
UNEMPLOYMENT RATE
Felton Zip Codes
Felton Area Codes
Income in Felton
Income Overview in Felton
Per Capita Income in Felton is $60,792, while median incomes of families and households are $123,036 and $108,370 respectively.
| Characteristic | Number | Measure |
| Per Capita Income | 3,701 | $60,792 |
| Median Family Income | 1,011 | $123,036 |
| Mean Family Income | 1,011 | $157,145 |
| Median Household Income | 1,560 | $108,370 |
| Mean Household Income | 1,560 | $137,511 |
| Income Deficit | 1,011 | $0 |
| Wage / Income Gap (%) | 3,701 | 16.80% |
| Wage / Income Gap ($) | 3,701 | 83.20¢ per $1 |
| Gini / Inequality Index | 3,701 | 0.39 |
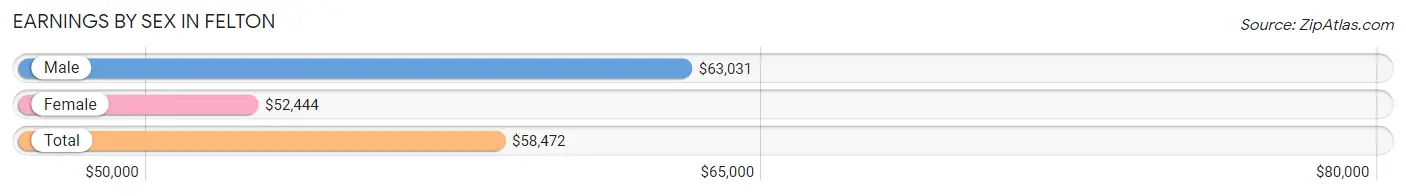
Earnings by Sex in Felton
Average Earnings in Felton are $58,472, $63,031 for men and $52,444 for women, a difference of 16.8%.
| Sex | Number | Average Earnings |
| Male | 1,337 (57.9%) | $63,031 |
| Female | 971 (42.1%) | $52,444 |
| Total | 2,308 (100.0%) | $58,472 |
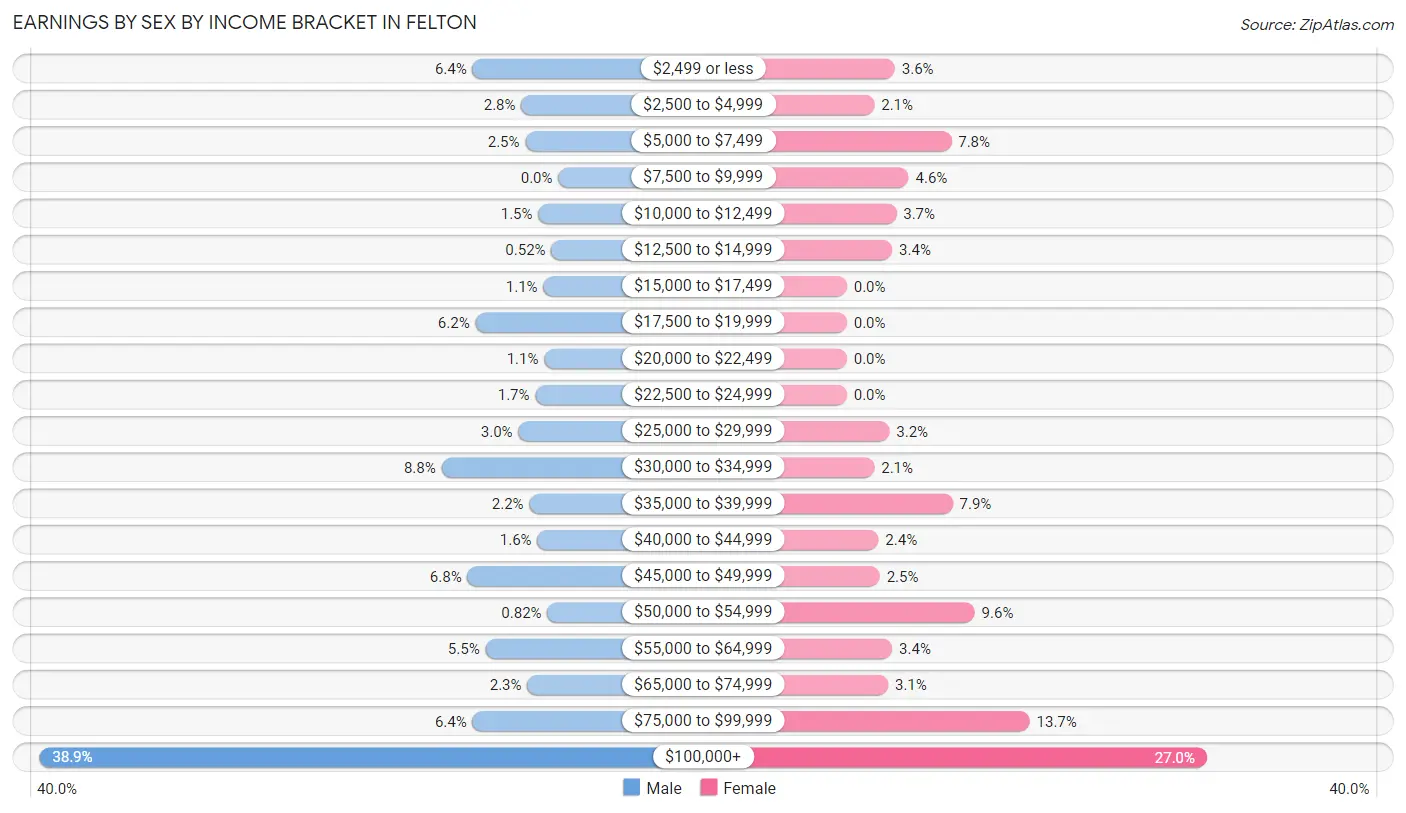
Earnings by Sex by Income Bracket in Felton
The most common earnings brackets in Felton are $100,000+ for men (520 | 38.9%) and $100,000+ for women (262 | 27.0%).
| Income | Male | Female |
| $2,499 or less | 86 (6.4%) | 35 (3.6%) |
| $2,500 to $4,999 | 37 (2.8%) | 20 (2.1%) |
| $5,000 to $7,499 | 33 (2.5%) | 76 (7.8%) |
| $7,500 to $9,999 | 0 (0.0%) | 45 (4.6%) |
| $10,000 to $12,499 | 20 (1.5%) | 36 (3.7%) |
| $12,500 to $14,999 | 7 (0.5%) | 33 (3.4%) |
| $15,000 to $17,499 | 15 (1.1%) | 0 (0.0%) |
| $17,500 to $19,999 | 83 (6.2%) | 0 (0.0%) |
| $20,000 to $22,499 | 14 (1.1%) | 0 (0.0%) |
| $22,500 to $24,999 | 23 (1.7%) | 0 (0.0%) |
| $25,000 to $29,999 | 40 (3.0%) | 31 (3.2%) |
| $30,000 to $34,999 | 117 (8.7%) | 20 (2.1%) |
| $35,000 to $39,999 | 29 (2.2%) | 77 (7.9%) |
| $40,000 to $44,999 | 21 (1.6%) | 23 (2.4%) |
| $45,000 to $49,999 | 91 (6.8%) | 24 (2.5%) |
| $50,000 to $54,999 | 11 (0.8%) | 93 (9.6%) |
| $55,000 to $64,999 | 73 (5.5%) | 33 (3.4%) |
| $65,000 to $74,999 | 31 (2.3%) | 30 (3.1%) |
| $75,000 to $99,999 | 86 (6.4%) | 133 (13.7%) |
| $100,000+ | 520 (38.9%) | 262 (27.0%) |
| Total | 1,337 (100.0%) | 971 (100.0%) |
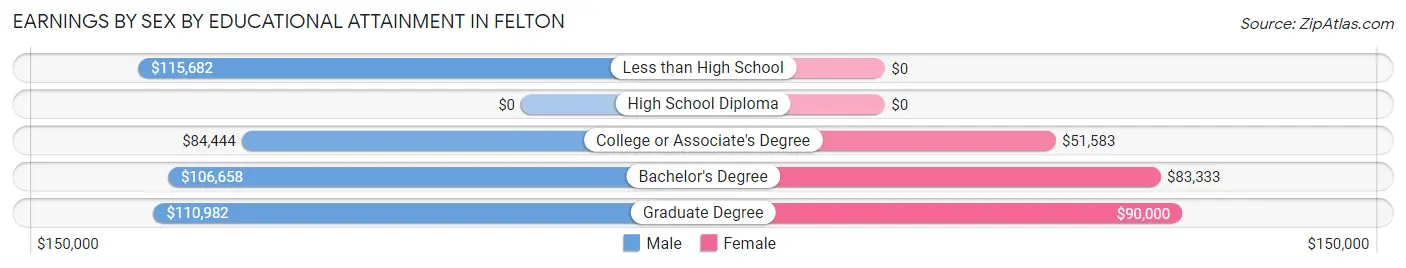
Earnings by Sex by Educational Attainment in Felton
Average earnings in Felton are $101,125 for men and $70,139 for women, a difference of 30.6%. Men with an educational attainment of less than high school enjoy the highest average annual earnings of $115,682, while those with college or associate's degree education earn the least with $84,444. Women with an educational attainment of graduate degree earn the most with the average annual earnings of $90,000, while those with college or associate's degree education have the smallest earnings of $51,583.
| Educational Attainment | Male Income | Female Income |
| Less than High School | $115,682 | $0 |
| High School Diploma | - | - |
| College or Associate's Degree | $84,444 | $51,583 |
| Bachelor's Degree | $106,658 | $83,333 |
| Graduate Degree | $110,982 | $90,000 |
| Total | $101,125 | $70,139 |
Family Income in Felton
Family Income Brackets in Felton
According to the Felton family income data, there are 296 families falling into the $200,000+ income range, which is the most common income bracket and makes up 29.3% of all families.
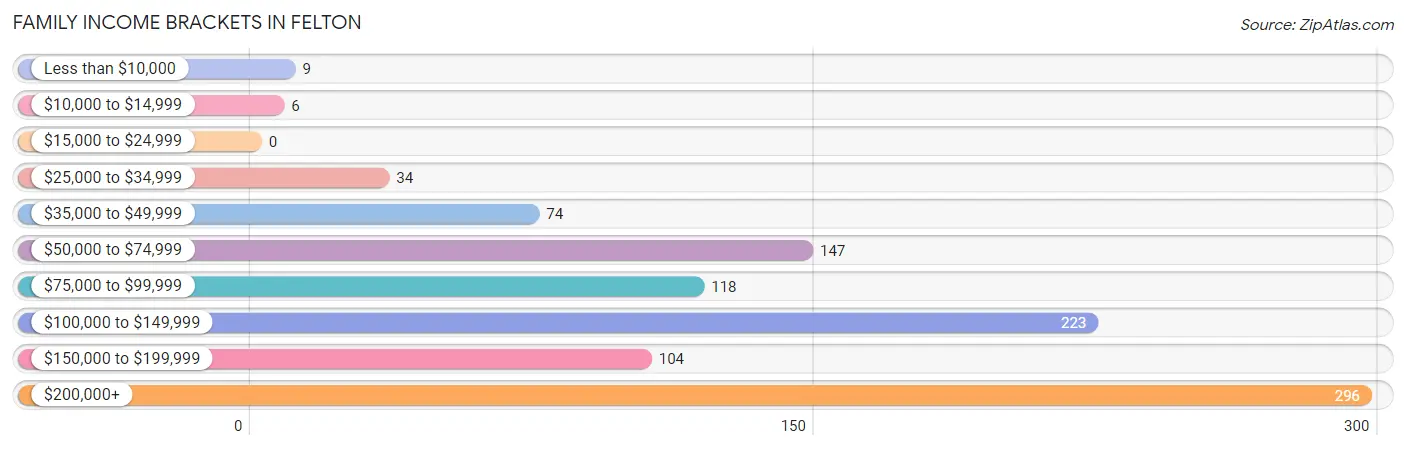
| Income Bracket | # Families | % Families |
| Less than $10,000 | 9 | 0.9% |
| $10,000 to $14,999 | 6 | 0.6% |
| $15,000 to $24,999 | 0 | 0.0% |
| $25,000 to $34,999 | 34 | 3.4% |
| $35,000 to $49,999 | 74 | 7.3% |
| $50,000 to $74,999 | 147 | 14.5% |
| $75,000 to $99,999 | 118 | 11.7% |
| $100,000 to $149,999 | 223 | 22.1% |
| $150,000 to $199,999 | 104 | 10.3% |
| $200,000+ | 296 | 29.3% |
Family Income by Famaliy Size in Felton
5-person families (54 | 5.3%) account for the highest median family income in Felton with $250,001 per family, while 4-person families (153 | 15.1%) have the highest median income of $52,088 per family member.
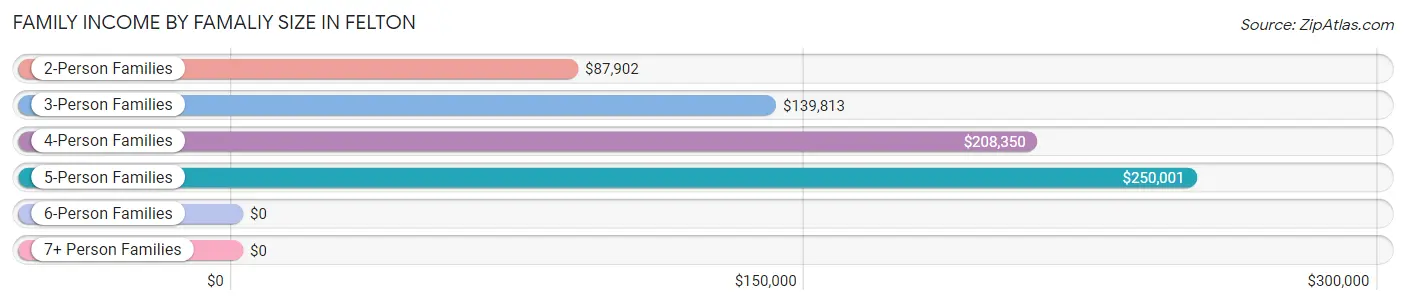
| Income Bracket | # Families | Median Income |
| 2-Person Families | 549 (54.3%) | $87,902 |
| 3-Person Families | 255 (25.2%) | $139,813 |
| 4-Person Families | 153 (15.1%) | $208,350 |
| 5-Person Families | 54 (5.3%) | $250,001 |
| 6-Person Families | 0 (0.0%) | $0 |
| 7+ Person Families | 0 (0.0%) | $0 |
| Total | 1,011 (100.0%) | $123,036 |
Family Income by Number of Earners in Felton
The median family income in Felton is $123,036, with families comprising 3+ earners (139) having the highest median family income of $209,050, while families with no earners (206) have the lowest median family income of $69,643, accounting for 13.8% and 20.4% of families, respectively.
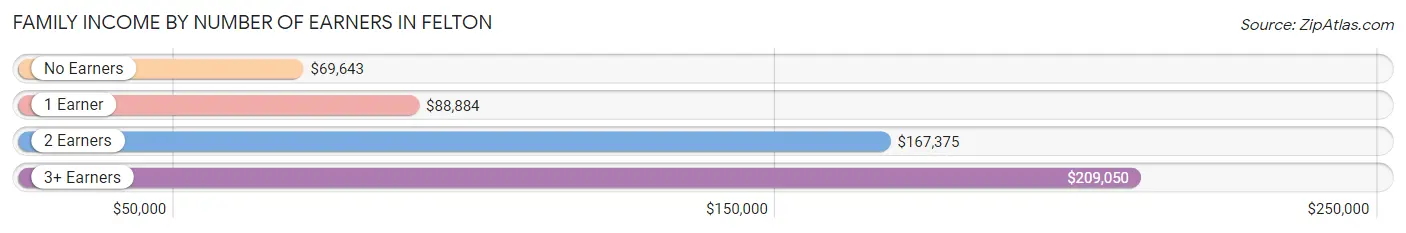
| Number of Earners | # Families | Median Income |
| No Earners | 206 (20.4%) | $69,643 |
| 1 Earner | 231 (22.9%) | $88,884 |
| 2 Earners | 435 (43.0%) | $167,375 |
| 3+ Earners | 139 (13.8%) | $209,050 |
| Total | 1,011 (100.0%) | $123,036 |
Household Income in Felton
Household Income Brackets in Felton
With 371 households falling in the category, the $200,000+ income range is the most frequent in Felton, accounting for 23.8% of all households. In contrast, only 6 households (0.4%) fall into the $10,000 to $14,999 income bracket, making it the least populous group.
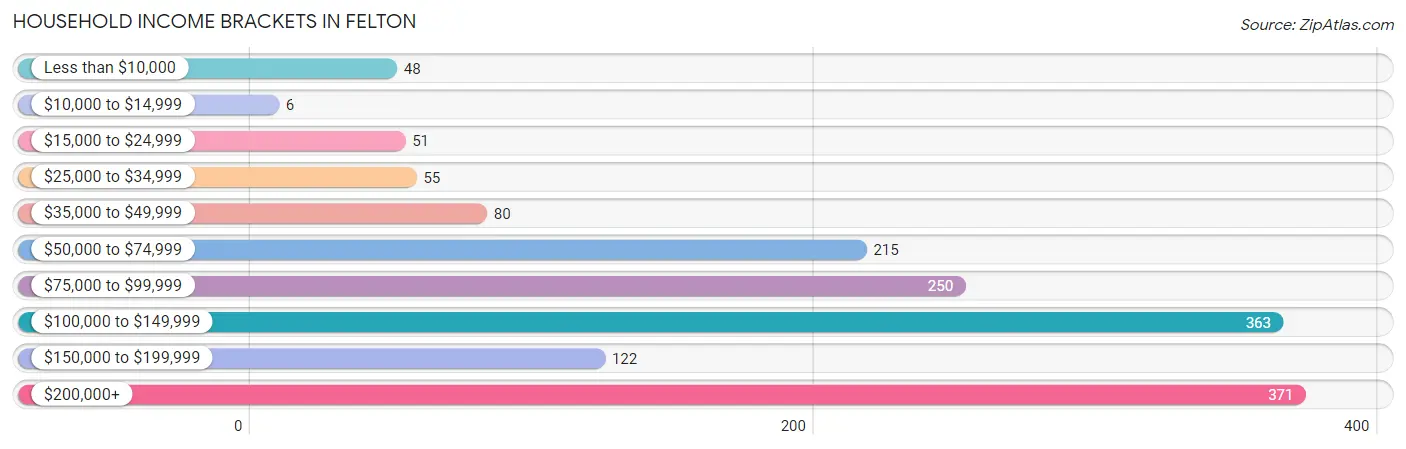
| Income Bracket | # Households | % Households |
| Less than $10,000 | 48 | 3.1% |
| $10,000 to $14,999 | 6 | 0.4% |
| $15,000 to $24,999 | 51 | 3.3% |
| $25,000 to $34,999 | 55 | 3.5% |
| $35,000 to $49,999 | 80 | 5.1% |
| $50,000 to $74,999 | 215 | 13.8% |
| $75,000 to $99,999 | 250 | 16.0% |
| $100,000 to $149,999 | 363 | 23.3% |
| $150,000 to $199,999 | 122 | 7.8% |
| $200,000+ | 371 | 23.8% |
Household Income by Householder Age in Felton
The median household income in Felton is $108,370, with the highest median household income of $207,700 found in the 25 to 44 years age bracket for the primary householder. A total of 334 households (21.4%) fall into this category. Meanwhile, the 15 to 24 years age bracket for the primary householder has the lowest median household income of $0, with 40 households (2.6%) in this group.
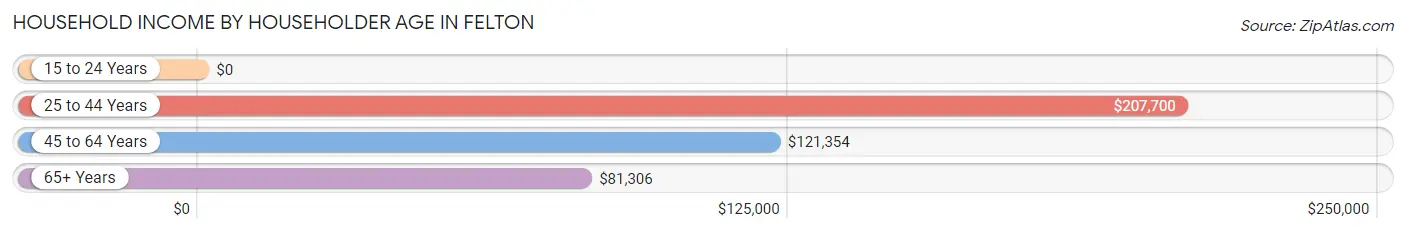
| Income Bracket | # Households | Median Income |
| 15 to 24 Years | 40 (2.6%) | $0 |
| 25 to 44 Years | 334 (21.4%) | $207,700 |
| 45 to 64 Years | 685 (43.9%) | $121,354 |
| 65+ Years | 501 (32.1%) | $81,306 |
| Total | 1,560 (100.0%) | $108,370 |
Poverty in Felton
Income Below Poverty by Sex and Age in Felton
With 2.4% poverty level for males and 6.2% for females among the residents of Felton, 18 to 24 year old males and 18 to 24 year old females are the most vulnerable to poverty, with 27 males (7.6%) and 45 females (34.6%) in their respective age groups living below the poverty level.
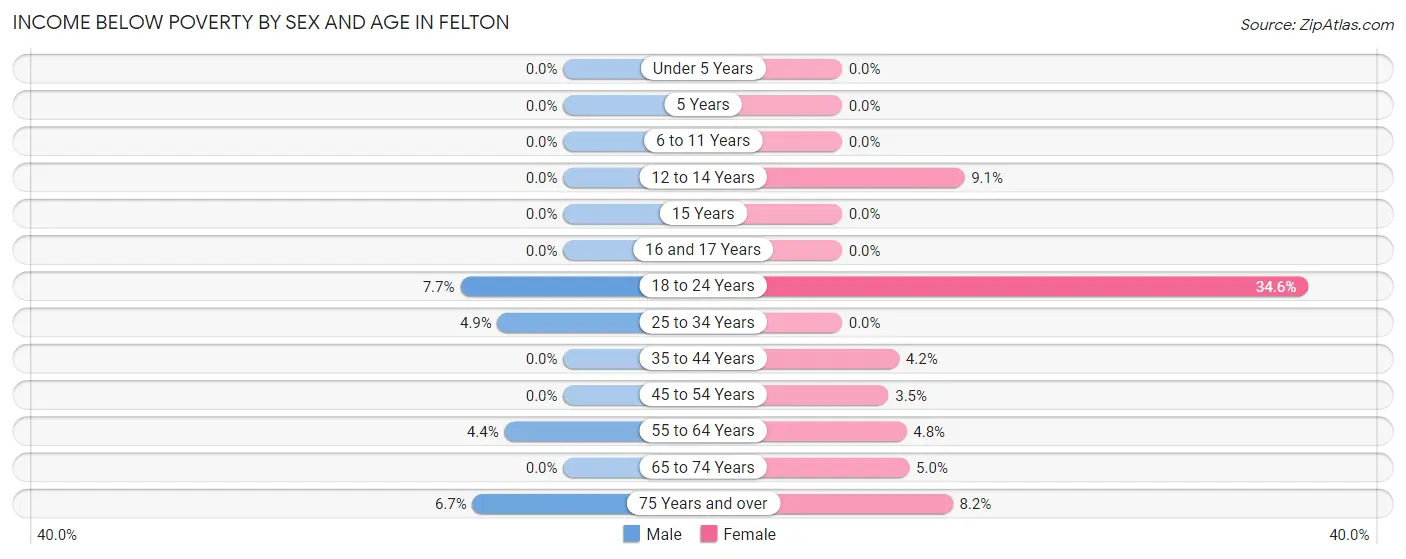
| Age Bracket | Male | Female |
| Under 5 Years | 0 (0.0%) | 0 (0.0%) |
| 5 Years | 0 (0.0%) | 0 (0.0%) |
| 6 to 11 Years | 0 (0.0%) | 0 (0.0%) |
| 12 to 14 Years | 0 (0.0%) | 6 (9.1%) |
| 15 Years | 0 (0.0%) | 0 (0.0%) |
| 16 and 17 Years | 0 (0.0%) | 0 (0.0%) |
| 18 to 24 Years | 27 (7.6%) | 45 (34.6%) |
| 25 to 34 Years | 6 (4.9%) | 0 (0.0%) |
| 35 to 44 Years | 0 (0.0%) | 10 (4.2%) |
| 45 to 54 Years | 0 (0.0%) | 10 (3.5%) |
| 55 to 64 Years | 9 (4.4%) | 14 (4.8%) |
| 65 to 74 Years | 0 (0.0%) | 15 (5.0%) |
| 75 Years and over | 6 (6.7%) | 6 (8.2%) |
| Total | 48 (2.4%) | 106 (6.2%) |
Income Above Poverty by Sex and Age in Felton
According to the poverty statistics in Felton, males aged under 5 years and females aged under 5 years are the age groups that are most secure financially, with 100.0% of males and 100.0% of females in these age groups living above the poverty line.
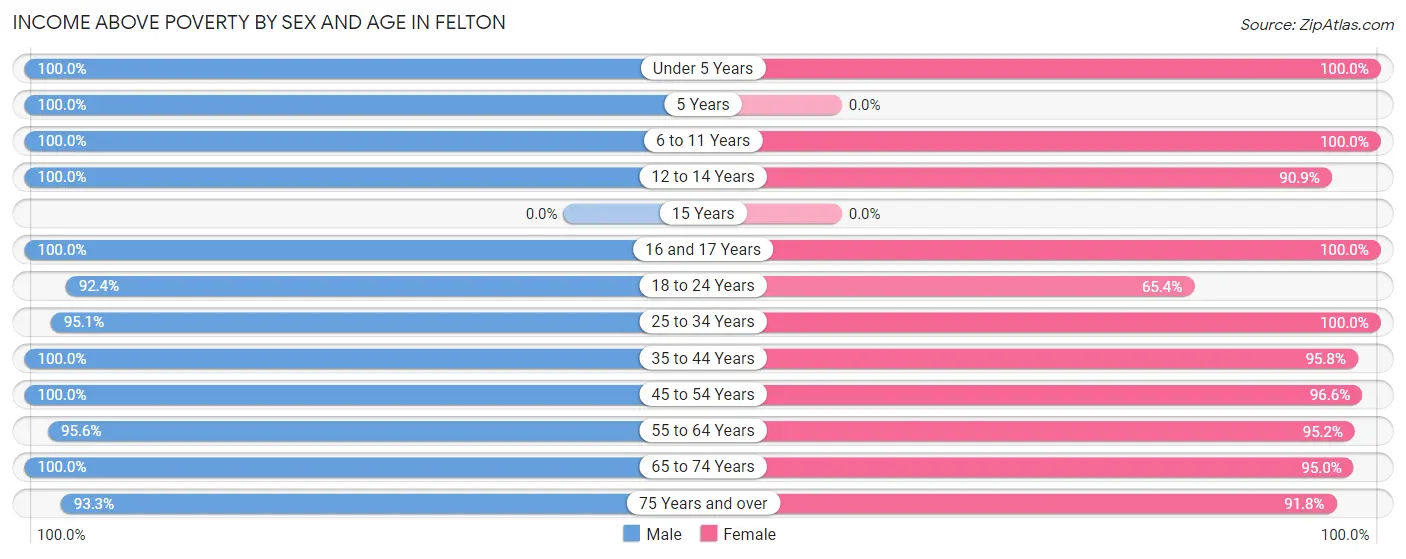
| Age Bracket | Male | Female |
| Under 5 Years | 93 (100.0%) | 34 (100.0%) |
| 5 Years | 15 (100.0%) | 0 (0.0%) |
| 6 to 11 Years | 99 (100.0%) | 132 (100.0%) |
| 12 to 14 Years | 41 (100.0%) | 60 (90.9%) |
| 15 Years | 0 (0.0%) | 0 (0.0%) |
| 16 and 17 Years | 8 (100.0%) | 43 (100.0%) |
| 18 to 24 Years | 326 (92.3%) | 85 (65.4%) |
| 25 to 34 Years | 117 (95.1%) | 121 (100.0%) |
| 35 to 44 Years | 331 (100.0%) | 226 (95.8%) |
| 45 to 54 Years | 318 (100.0%) | 280 (96.6%) |
| 55 to 64 Years | 197 (95.6%) | 278 (95.2%) |
| 65 to 74 Years | 308 (100.0%) | 285 (95.0%) |
| 75 Years and over | 83 (93.3%) | 67 (91.8%) |
| Total | 1,936 (97.6%) | 1,611 (93.8%) |
Income Below Poverty Among Married-Couple Families in Felton
The poverty statistics for married-couple families in Felton show that 0.8% or 6 of the total 764 families live below the poverty line. Families with no children have the highest poverty rate of 1.1%, comprising of 6 families. On the other hand, families with 1 or 2 children have the lowest poverty rate of 0.0%, which includes 0 families.
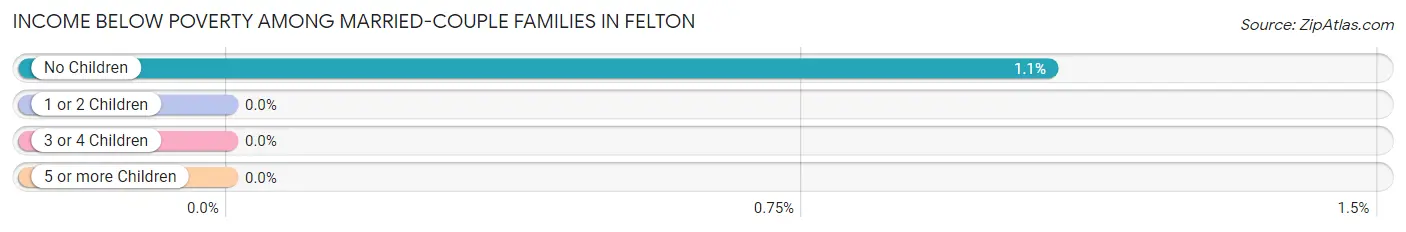
| Children | Above Poverty | Below Poverty |
| No Children | 554 (98.9%) | 6 (1.1%) |
| 1 or 2 Children | 188 (100.0%) | 0 (0.0%) |
| 3 or 4 Children | 16 (100.0%) | 0 (0.0%) |
| 5 or more Children | 0 (0.0%) | 0 (0.0%) |
| Total | 758 (99.2%) | 6 (0.8%) |
Income Below Poverty Among Single-Parent Households in Felton
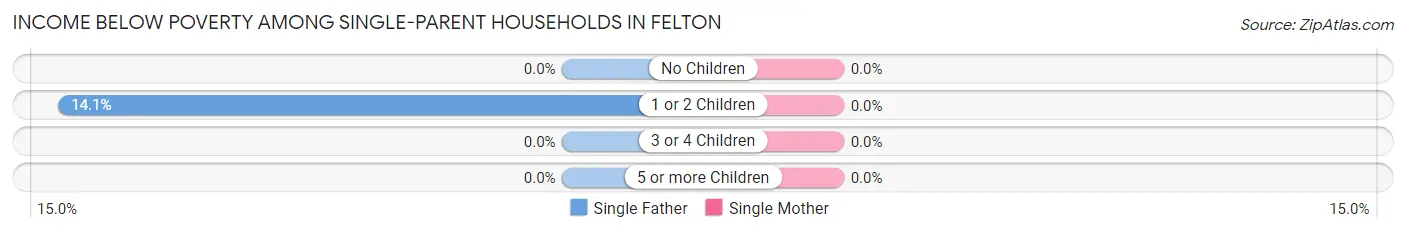
| Children | Single Father | Single Mother |
| No Children | 0 (0.0%) | 0 (0.0%) |
| 1 or 2 Children | 9 (14.1%) | 0 (0.0%) |
| 3 or 4 Children | 0 (0.0%) | 0 (0.0%) |
| 5 or more Children | 0 (0.0%) | 0 (0.0%) |
| Total | 9 (10.1%) | 0 (0.0%) |
Income Below Poverty Among Married-Couple vs Single-Parent Households in Felton
The poverty data for Felton shows that 6 of the married-couple family households (0.8%) and 9 of the single-parent households (3.6%) are living below the poverty level. Within the married-couple family households, those with no children have the highest poverty rate, with 6 households (1.1%) falling below the poverty line. Among the single-parent households, those with 1 or 2 children have the highest poverty rate, with 9 household (6.3%) living below poverty.
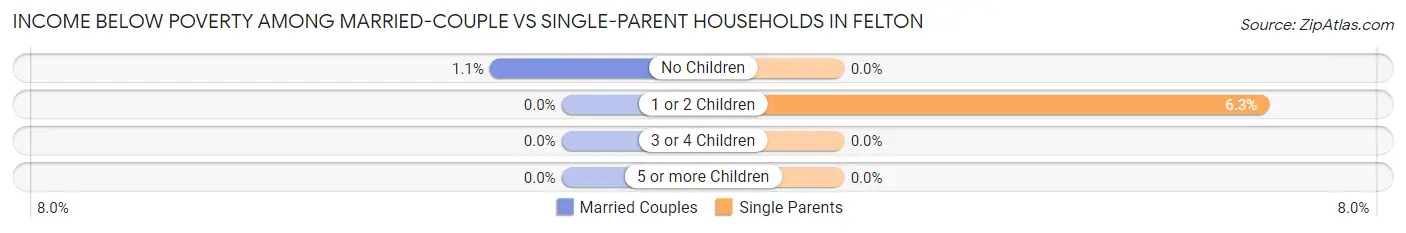
| Children | Married-Couple Families | Single-Parent Households |
| No Children | 6 (1.1%) | 0 (0.0%) |
| 1 or 2 Children | 0 (0.0%) | 9 (6.3%) |
| 3 or 4 Children | 0 (0.0%) | 0 (0.0%) |
| 5 or more Children | 0 (0.0%) | 0 (0.0%) |
| Total | 6 (0.8%) | 9 (3.6%) |
Race in Felton
The most populous races in Felton are White / Caucasian (3,205 | 86.6%), Hispanic or Latino (262 | 7.1%), and Two or more Races (240 | 6.5%).
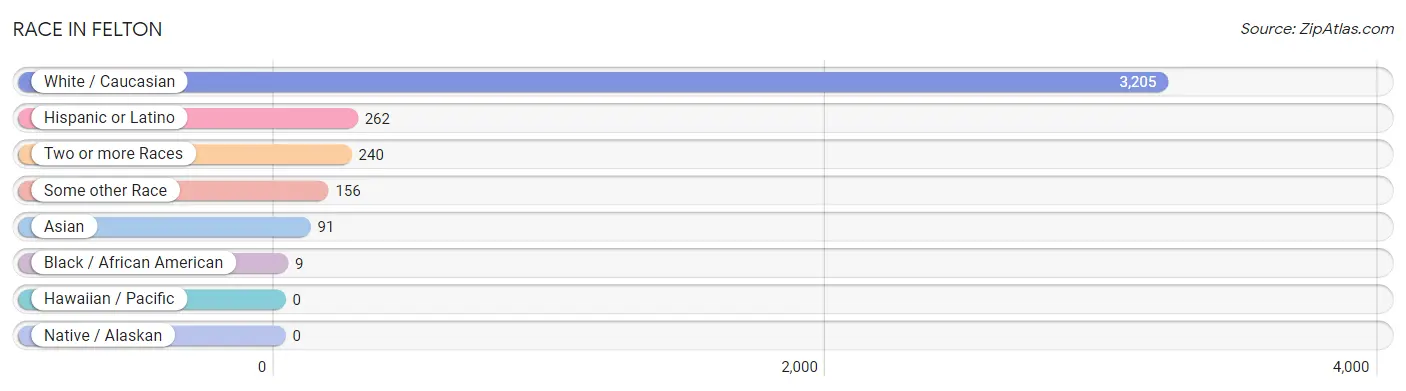
| Race | # Population | % Population |
| Asian | 91 | 2.5% |
| Black / African American | 9 | 0.2% |
| Hawaiian / Pacific | 0 | 0.0% |
| Hispanic or Latino | 262 | 7.1% |
| Native / Alaskan | 0 | 0.0% |
| White / Caucasian | 3,205 | 86.6% |
| Two or more Races | 240 | 6.5% |
| Some other Race | 156 | 4.2% |
| Total | 3,701 | 100.0% |
Ancestry in Felton
The most populous ancestries reported in Felton are German (733 | 19.8%), Irish (571 | 15.4%), English (502 | 13.6%), Italian (325 | 8.8%), and Scottish (289 | 7.8%), together accounting for 65.4% of all Felton residents.
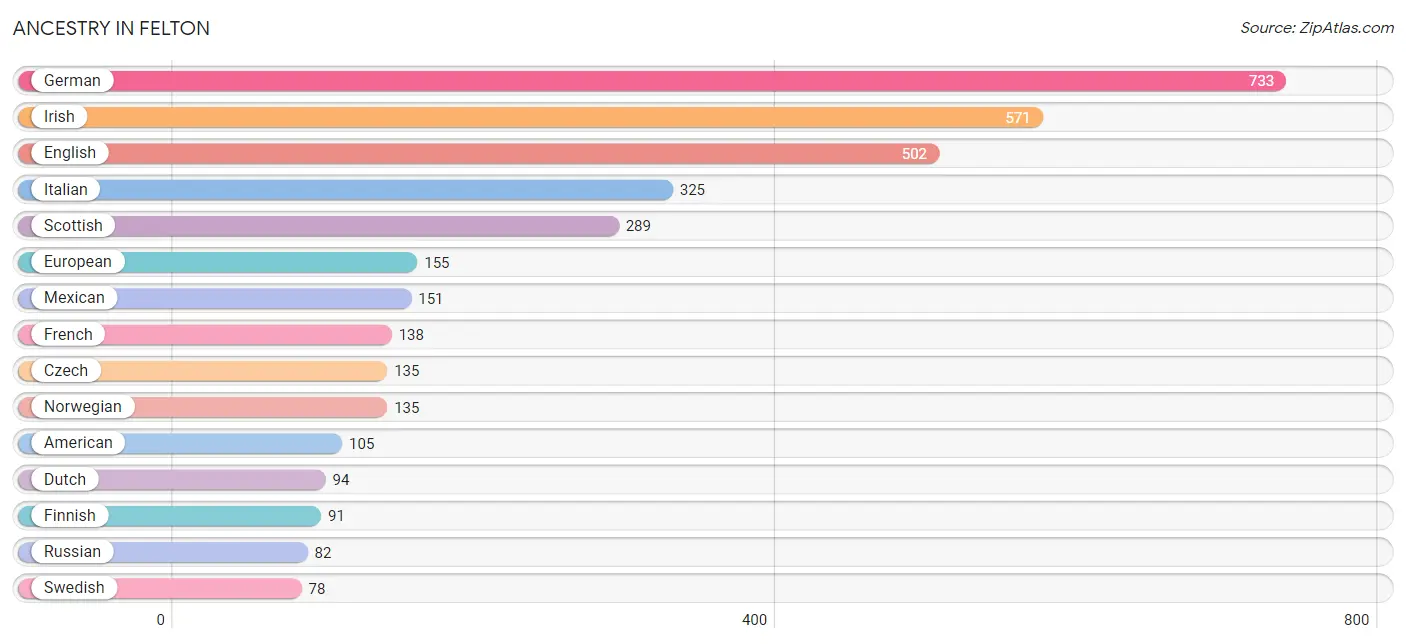
| Ancestry | # Population | % Population |
| American | 105 | 2.8% |
| Austrian | 33 | 0.9% |
| Bhutanese | 33 | 0.9% |
| Brazilian | 9 | 0.2% |
| Canadian | 23 | 0.6% |
| Central American | 10 | 0.3% |
| Cuban | 14 | 0.4% |
| Czech | 135 | 3.6% |
| Danish | 34 | 0.9% |
| Dutch | 94 | 2.5% |
| Eastern European | 51 | 1.4% |
| English | 502 | 13.6% |
| European | 155 | 4.2% |
| Finnish | 91 | 2.5% |
| French | 138 | 3.7% |
| French Canadian | 41 | 1.1% |
| German | 733 | 19.8% |
| Greek | 6 | 0.2% |
| Guatemalan | 10 | 0.3% |
| Hungarian | 21 | 0.6% |
| Indian (Asian) | 38 | 1.0% |
| Irish | 571 | 15.4% |
| Italian | 325 | 8.8% |
| Korean | 47 | 1.3% |
| Laotian | 12 | 0.3% |
| Malaysian | 23 | 0.6% |
| Mexican | 151 | 4.1% |
| Mongolian | 41 | 1.1% |
| Northern European | 27 | 0.7% |
| Norwegian | 135 | 3.6% |
| Polish | 6 | 0.2% |
| Portuguese | 70 | 1.9% |
| Puerto Rican | 31 | 0.8% |
| Russian | 82 | 2.2% |
| Scandinavian | 12 | 0.3% |
| Scotch-Irish | 61 | 1.7% |
| Scottish | 289 | 7.8% |
| Slovak | 6 | 0.2% |
| South American | 10 | 0.3% |
| South American Indian | 9 | 0.2% |
| Swedish | 78 | 2.1% |
| Swiss | 58 | 1.6% |
| Thai | 12 | 0.3% |
| Turkish | 14 | 0.4% |
| Ukrainian | 6 | 0.2% |
| Uruguayan | 10 | 0.3% |
| Welsh | 23 | 0.6% | View All 47 Rows |
Immigrants in Felton
The most numerous immigrant groups reported in Felton came from Asia (135 | 3.6%), Latin America (65 | 1.8%), South Eastern Asia (61 | 1.7%), Western Asia (59 | 1.6%), and Europe (57 | 1.5%), together accounting for 10.2% of all Felton residents.
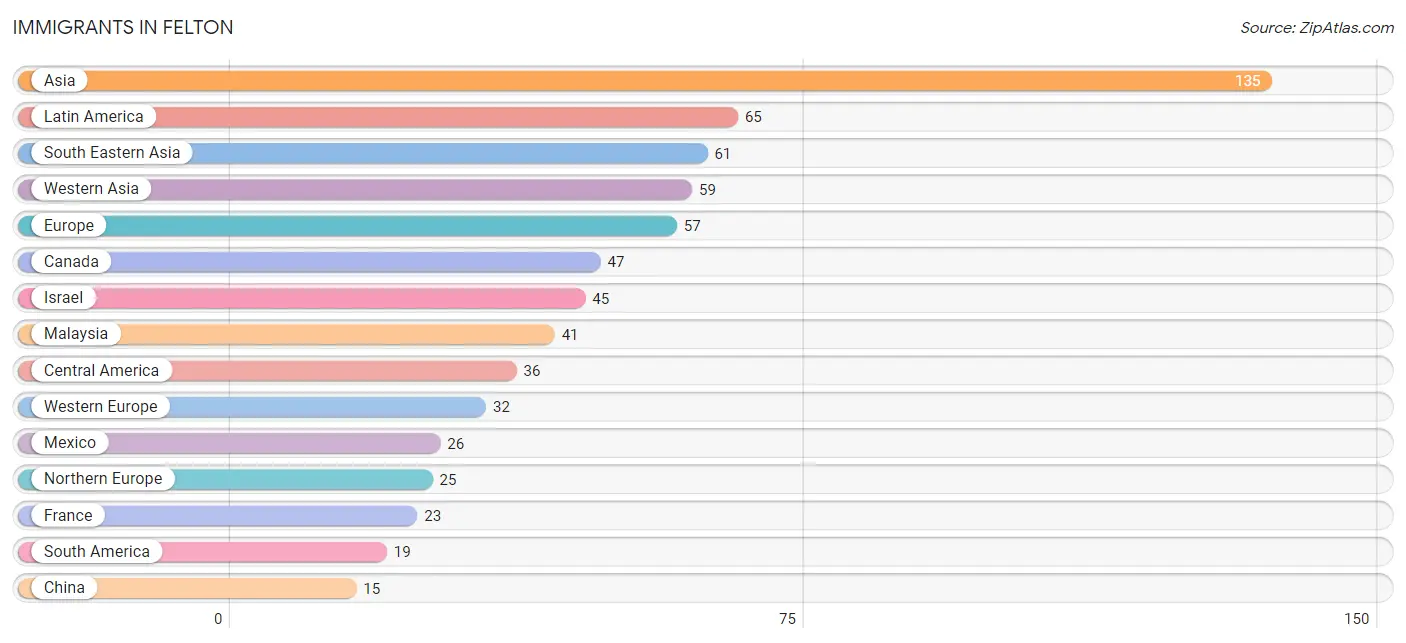
| Immigration Origin | # Population | % Population |
| Asia | 135 | 3.6% |
| Brazil | 9 | 0.2% |
| Canada | 47 | 1.3% |
| Caribbean | 10 | 0.3% |
| Central America | 36 | 1.0% |
| China | 15 | 0.4% |
| Cuba | 10 | 0.3% |
| Eastern Asia | 15 | 0.4% |
| England | 15 | 0.4% |
| Europe | 57 | 1.5% |
| France | 23 | 0.6% |
| Germany | 9 | 0.2% |
| Guatemala | 10 | 0.3% |
| Indonesia | 6 | 0.2% |
| Israel | 45 | 1.2% |
| Latin America | 65 | 1.8% |
| Malaysia | 41 | 1.1% |
| Mexico | 26 | 0.7% |
| Northern Europe | 25 | 0.7% |
| Philippines | 14 | 0.4% |
| South America | 19 | 0.5% |
| South Eastern Asia | 61 | 1.7% |
| Turkey | 14 | 0.4% |
| Uruguay | 10 | 0.3% |
| Western Asia | 59 | 1.6% |
| Western Europe | 32 | 0.9% | View All 26 Rows |
Sex and Age in Felton
Sex and Age in Felton
The most populous age groups in Felton are 50 to 54 Years (216 | 10.9%) for men and 65 to 69 Years (189 | 11.0%) for women.
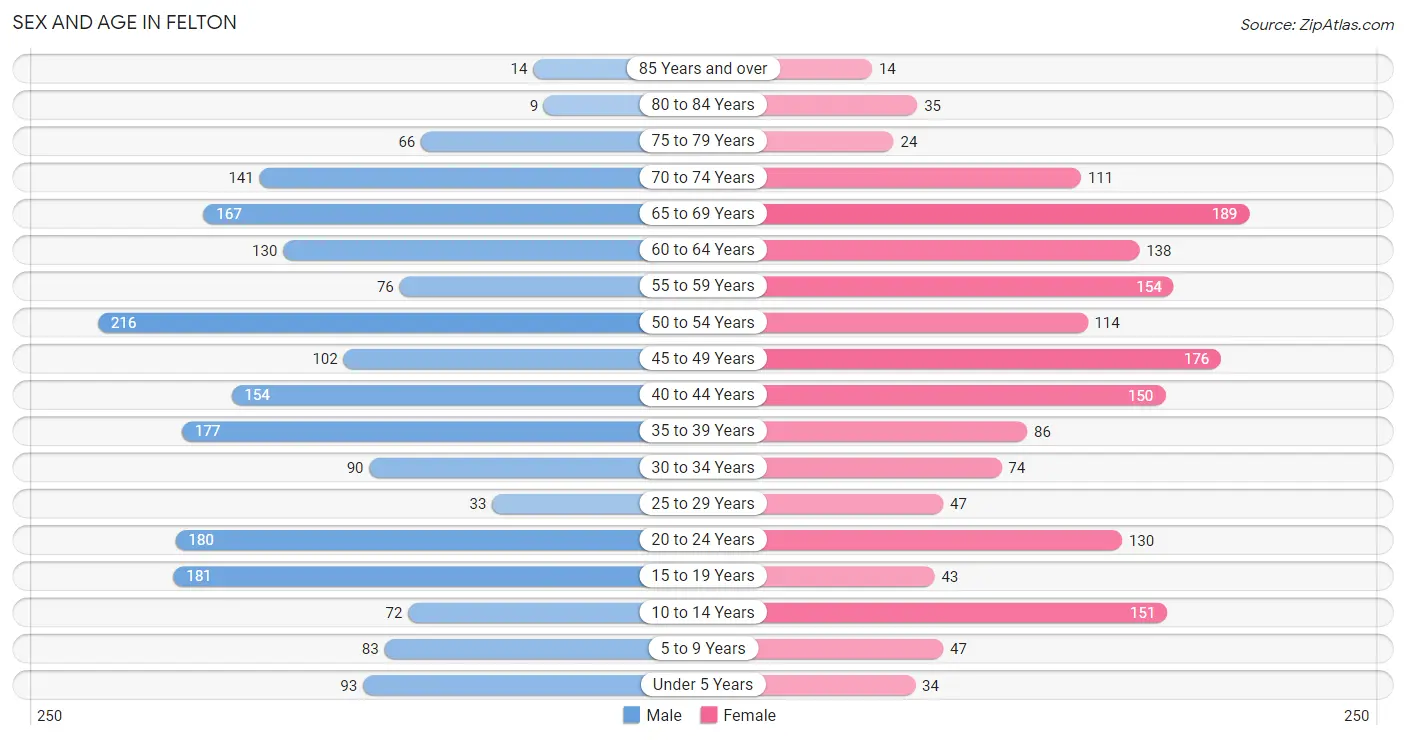
| Age Bracket | Male | Female |
| Under 5 Years | 93 (4.7%) | 34 (2.0%) |
| 5 to 9 Years | 83 (4.2%) | 47 (2.7%) |
| 10 to 14 Years | 72 (3.6%) | 151 (8.8%) |
| 15 to 19 Years | 181 (9.1%) | 43 (2.5%) |
| 20 to 24 Years | 180 (9.1%) | 130 (7.6%) |
| 25 to 29 Years | 33 (1.7%) | 47 (2.7%) |
| 30 to 34 Years | 90 (4.5%) | 74 (4.3%) |
| 35 to 39 Years | 177 (8.9%) | 86 (5.0%) |
| 40 to 44 Years | 154 (7.8%) | 150 (8.7%) |
| 45 to 49 Years | 102 (5.1%) | 176 (10.2%) |
| 50 to 54 Years | 216 (10.9%) | 114 (6.6%) |
| 55 to 59 Years | 76 (3.8%) | 154 (9.0%) |
| 60 to 64 Years | 130 (6.6%) | 138 (8.0%) |
| 65 to 69 Years | 167 (8.4%) | 189 (11.0%) |
| 70 to 74 Years | 141 (7.1%) | 111 (6.5%) |
| 75 to 79 Years | 66 (3.3%) | 24 (1.4%) |
| 80 to 84 Years | 9 (0.4%) | 35 (2.0%) |
| 85 Years and over | 14 (0.7%) | 14 (0.8%) |
| Total | 1,984 (100.0%) | 1,717 (100.0%) |
Families and Households in Felton
Median Family Size in Felton
The median family size in Felton is 2.87 persons per family, with married-couple families (764 | 75.6%) accounting for the largest median family size of 2.93 persons per family. On the other hand, single male/father families (89 | 8.8%) represent the smallest median family size with 2.47 persons per family.
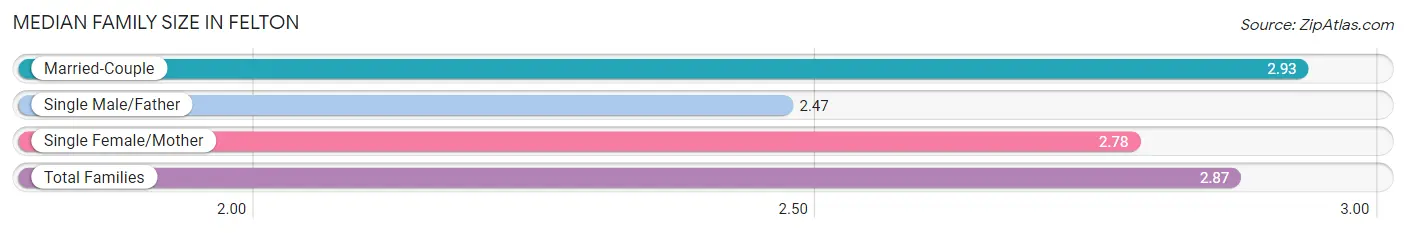
| Family Type | # Families | Family Size |
| Married-Couple | 764 (75.6%) | 2.93 |
| Single Male/Father | 89 (8.8%) | 2.47 |
| Single Female/Mother | 158 (15.6%) | 2.78 |
| Total Families | 1,011 (100.0%) | 2.87 |
Median Household Size in Felton
The median household size in Felton is 2.37 persons per household, with single female/mother households (158 | 10.1%) accounting for the largest median household size of 3.05 persons per household. non-family households (549 | 35.2%) represent the smallest median household size with 1.23 persons per household.
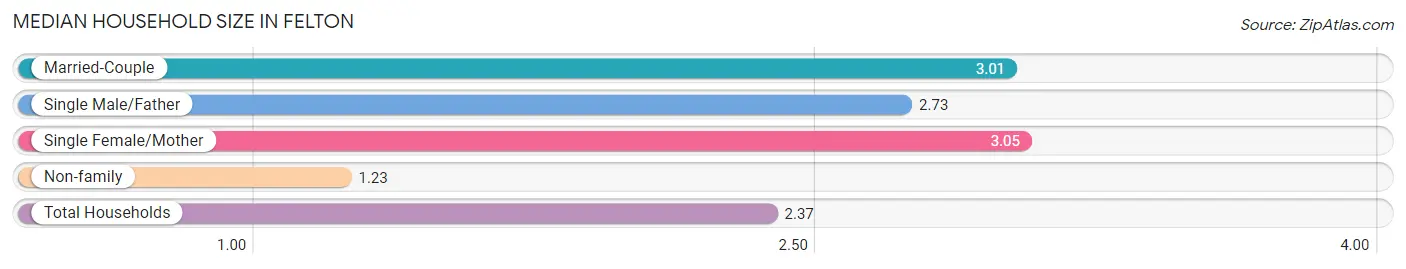
| Household Type | # Households | Household Size |
| Married-Couple | 764 (49.0%) | 3.01 |
| Single Male/Father | 89 (5.7%) | 2.73 |
| Single Female/Mother | 158 (10.1%) | 3.05 |
| Non-family | 549 (35.2%) | 1.23 |
| Total Households | 1,560 (100.0%) | 2.37 |
Household Size by Marriage Status in Felton
Out of a total of 1,560 households in Felton, 1,011 (64.8%) are family households, while 549 (35.2%) are nonfamily households. The most numerous type of family households are 2-person households, comprising 484, and the most common type of nonfamily households are 1-person households, comprising 486.
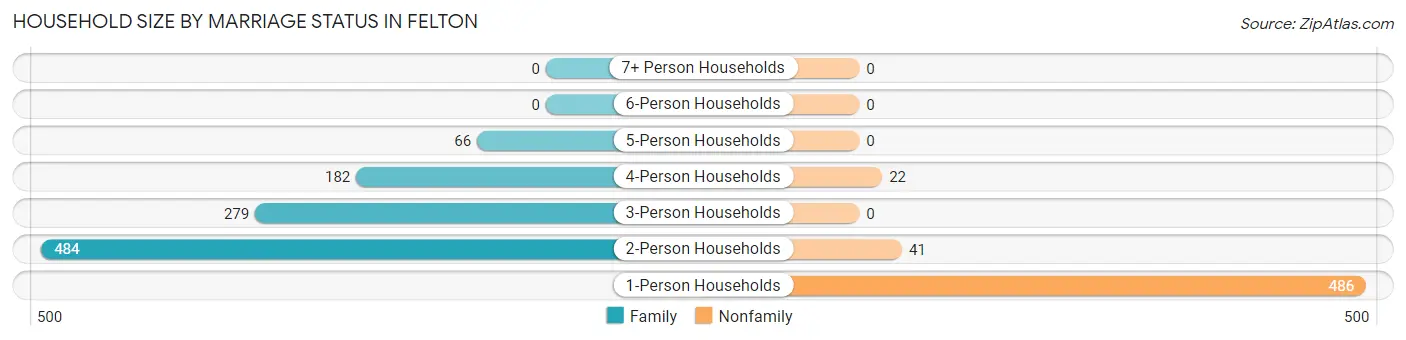
| Household Size | Family Households | Nonfamily Households |
| 1-Person Households | - | 486 (31.1%) |
| 2-Person Households | 484 (31.0%) | 41 (2.6%) |
| 3-Person Households | 279 (17.9%) | 0 (0.0%) |
| 4-Person Households | 182 (11.7%) | 22 (1.4%) |
| 5-Person Households | 66 (4.2%) | 0 (0.0%) |
| 6-Person Households | 0 (0.0%) | 0 (0.0%) |
| 7+ Person Households | 0 (0.0%) | 0 (0.0%) |
| Total | 1,011 (64.8%) | 549 (35.2%) |
Female Fertility in Felton
Fertility by Age in Felton
| Age Bracket | Women with Births | Births / 1,000 Women |
| 15 to 19 years | 0 (0.0%) | 0.0 |
| 20 to 34 years | 0 (0.0%) | 0.0 |
| 35 to 50 years | 0 (0.0%) | 0.0 |
| Total | 0 (0.0%) | 0.0 |
Fertility by Age by Marriage Status in Felton
| Age Bracket | Married | Unmarried |
| 15 to 19 years | 0 (0.0%) | 0 (0.0%) |
| 20 to 34 years | 0 (0.0%) | 0 (0.0%) |
| 35 to 50 years | 0 (0.0%) | 0 (0.0%) |
| Total | 0 (0.0%) | 0 (0.0%) |
Fertility by Education in Felton
| Educational Attainment | Women with Births | Births / 1,000 Women |
| Less than High School | 0 (0.0%) | 0.0 |
| High School Diploma | 0 (0.0%) | 0.0 |
| College or Associate's Degree | 0 (0.0%) | 0.0 |
| Bachelor's Degree | 0 (0.0%) | 0.0 |
| Graduate Degree | 0 (0.0%) | 0.0 |
| Total | 0 (0.0%) | 0.0 |
Fertility by Education by Marriage Status in Felton
| Educational Attainment | Married | Unmarried |
| Less than High School | 0 (0.0%) | 0 (0.0%) |
| High School Diploma | 0 (0.0%) | 0 (0.0%) |
| College or Associate's Degree | 0 (0.0%) | 0 (0.0%) |
| Bachelor's Degree | 0 (0.0%) | 0 (0.0%) |
| Graduate Degree | 0 (0.0%) | 0 (0.0%) |
| Total | 0 (0.0%) | 0 (0.0%) |
Employment Characteristics in Felton
Employment by Class of Employer in Felton
Among the 2,002 employed individuals in Felton, private company employees (1,194 | 59.6%), local government employees (282 | 14.1%), and not-for-profit organizations (221 | 11.0%) make up the most common classes of employment.
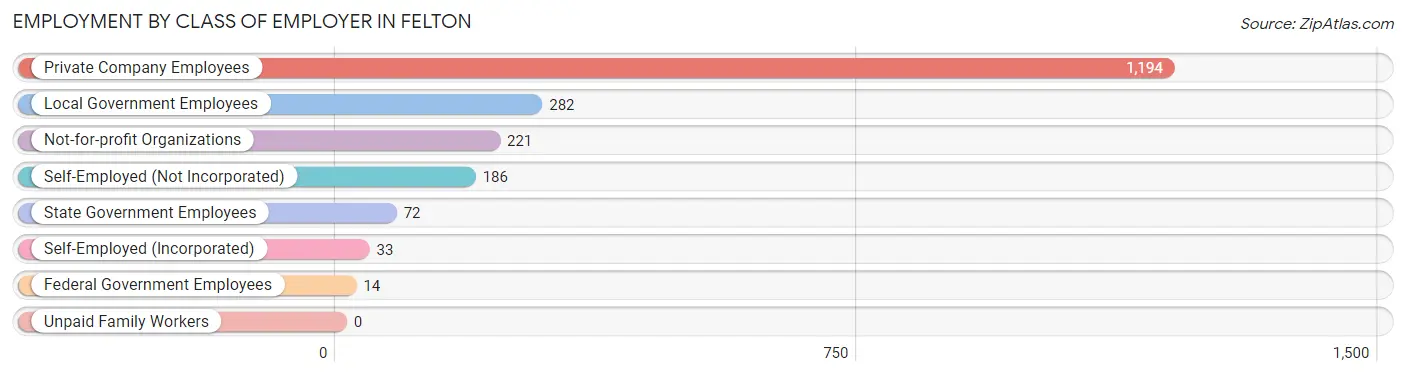
| Employer Class | # Employees | % Employees |
| Private Company Employees | 1,194 | 59.6% |
| Self-Employed (Incorporated) | 33 | 1.7% |
| Self-Employed (Not Incorporated) | 186 | 9.3% |
| Not-for-profit Organizations | 221 | 11.0% |
| Local Government Employees | 282 | 14.1% |
| State Government Employees | 72 | 3.6% |
| Federal Government Employees | 14 | 0.7% |
| Unpaid Family Workers | 0 | 0.0% |
| Total | 2,002 | 100.0% |
Employment Status by Age in Felton
According to the labor force statistics for Felton, out of the total population over 16 years of age (3,221), 66.3% or 2,136 individuals are in the labor force, with 2.9% or 62 of them unemployed. The age group with the highest labor force participation rate is 30 to 34 years, with 100.0% or 164 individuals in the labor force. Within the labor force, the 55 to 59 years age range has the highest percentage of unemployed individuals, with 11.3% or 25 of them being unemployed.
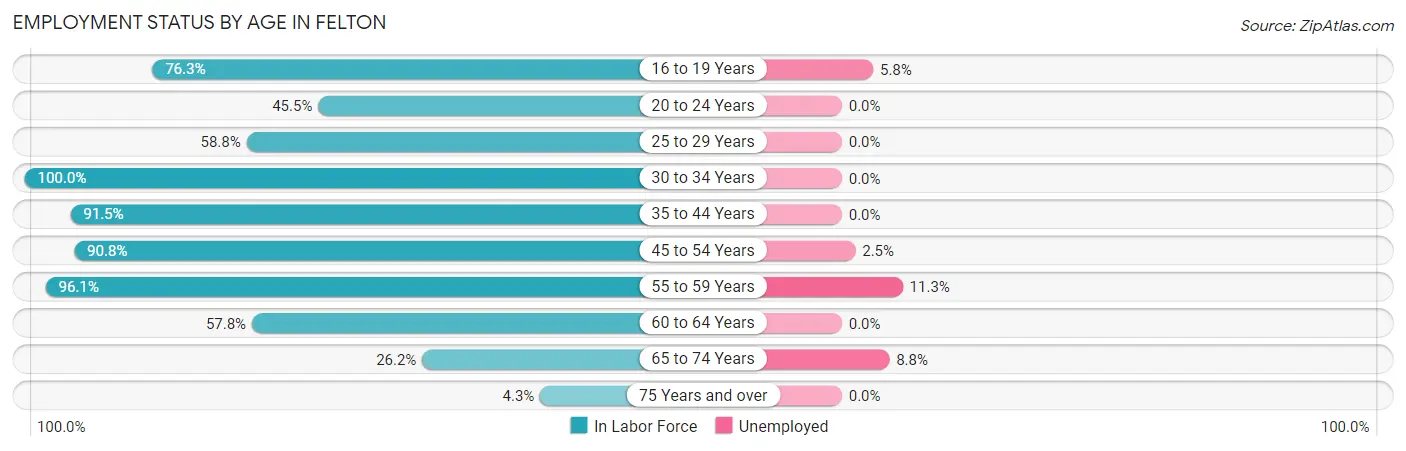
| Age Bracket | In Labor Force | Unemployed |
| 16 to 19 Years | 171 (76.3%) | 10 (5.8%) |
| 20 to 24 Years | 141 (45.5%) | 0 (0.0%) |
| 25 to 29 Years | 47 (58.8%) | 0 (0.0%) |
| 30 to 34 Years | 164 (100.0%) | 0 (0.0%) |
| 35 to 44 Years | 519 (91.5%) | 0 (0.0%) |
| 45 to 54 Years | 552 (90.8%) | 14 (2.5%) |
| 55 to 59 Years | 221 (96.1%) | 25 (11.3%) |
| 60 to 64 Years | 155 (57.8%) | 0 (0.0%) |
| 65 to 74 Years | 159 (26.2%) | 14 (8.8%) |
| 75 Years and over | 7 (4.3%) | 0 (0.0%) |
| Total | 2,136 (66.3%) | 62 (2.9%) |
Employment Status by Educational Attainment in Felton
According to labor force statistics for Felton, 86.5% of individuals (1,658) out of the total population between 25 and 64 years of age (1,917) are in the labor force, with 2.4% or 40 of them being unemployed. The group with the highest labor force participation rate are those with the educational attainment of bachelor's degree or higher, with 98.1% or 1,050 individuals in the labor force. Within the labor force, individuals with high school diploma education have the highest percentage of unemployment, with 16.1% or 25 of them being unemployed.
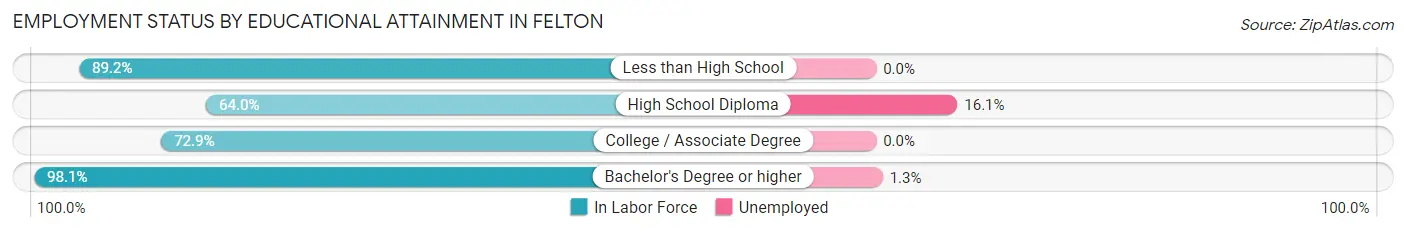
| Educational Attainment | In Labor Force | Unemployed |
| Less than High School | 66 (89.2%) | 0 (0.0%) |
| High School Diploma | 155 (64.0%) | 39 (16.1%) |
| College / Associate Degree | 387 (72.9%) | 0 (0.0%) |
| Bachelor's Degree or higher | 1,050 (98.1%) | 14 (1.3%) |
| Total | 1,658 (86.5%) | 46 (2.4%) |
Employment Occupations by Sex in Felton
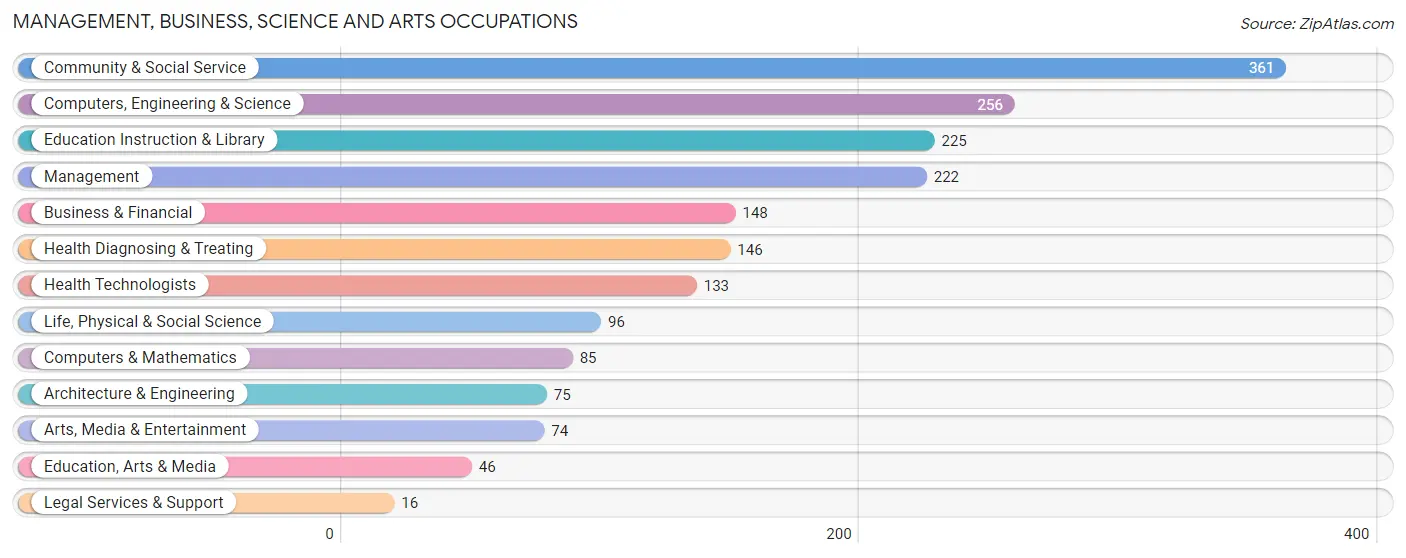
Management, Business, Science and Arts Occupations
The most common Management, Business, Science and Arts occupations in Felton are Community & Social Service (361 | 17.4%), Computers, Engineering & Science (256 | 12.3%), Education Instruction & Library (225 | 10.8%), Management (222 | 10.7%), and Business & Financial (148 | 7.1%).
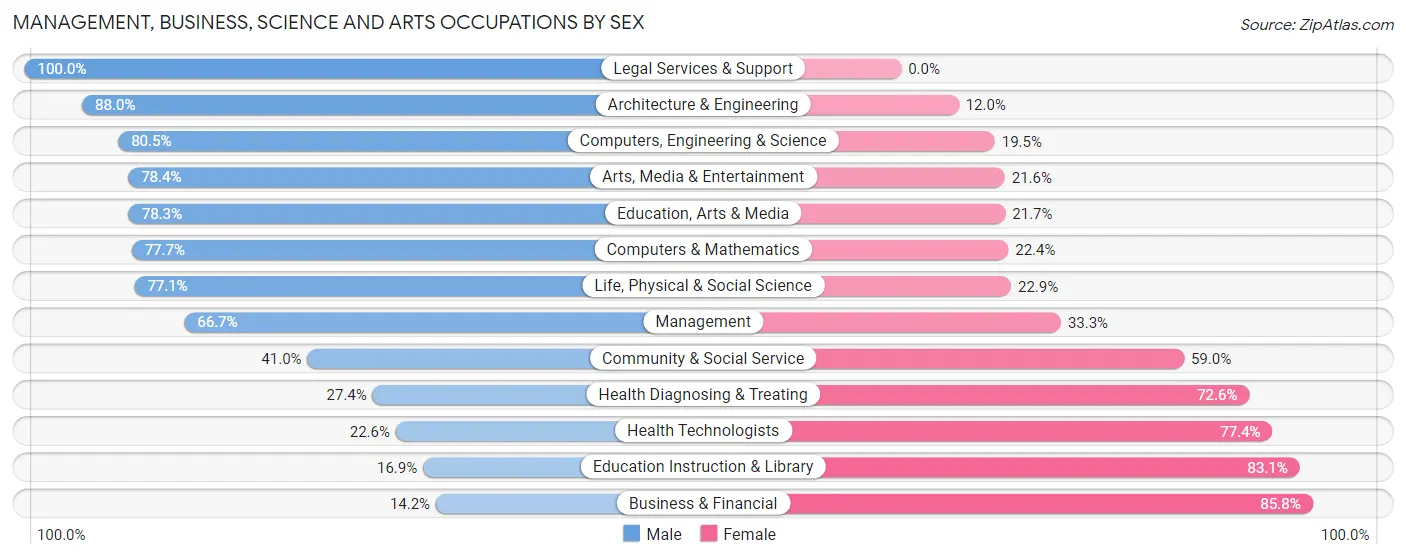
Management, Business, Science and Arts Occupations by Sex
Within the Management, Business, Science and Arts occupations in Felton, the most male-oriented occupations are Legal Services & Support (100.0%), Architecture & Engineering (88.0%), and Computers, Engineering & Science (80.5%), while the most female-oriented occupations are Business & Financial (85.8%), Education Instruction & Library (83.1%), and Health Technologists (77.4%).
| Occupation | Male | Female |
| Management | 148 (66.7%) | 74 (33.3%) |
| Business & Financial | 21 (14.2%) | 127 (85.8%) |
| Computers, Engineering & Science | 206 (80.5%) | 50 (19.5%) |
| Computers & Mathematics | 66 (77.6%) | 19 (22.4%) |
| Architecture & Engineering | 66 (88.0%) | 9 (12.0%) |
| Life, Physical & Social Science | 74 (77.1%) | 22 (22.9%) |
| Community & Social Service | 148 (41.0%) | 213 (59.0%) |
| Education, Arts & Media | 36 (78.3%) | 10 (21.7%) |
| Legal Services & Support | 16 (100.0%) | 0 (0.0%) |
| Education Instruction & Library | 38 (16.9%) | 187 (83.1%) |
| Arts, Media & Entertainment | 58 (78.4%) | 16 (21.6%) |
| Health Diagnosing & Treating | 40 (27.4%) | 106 (72.6%) |
| Health Technologists | 30 (22.6%) | 103 (77.4%) |
| Total (Category) | 563 (49.7%) | 570 (50.3%) |
| Total (Overall) | 1,213 (58.5%) | 860 (41.5%) |
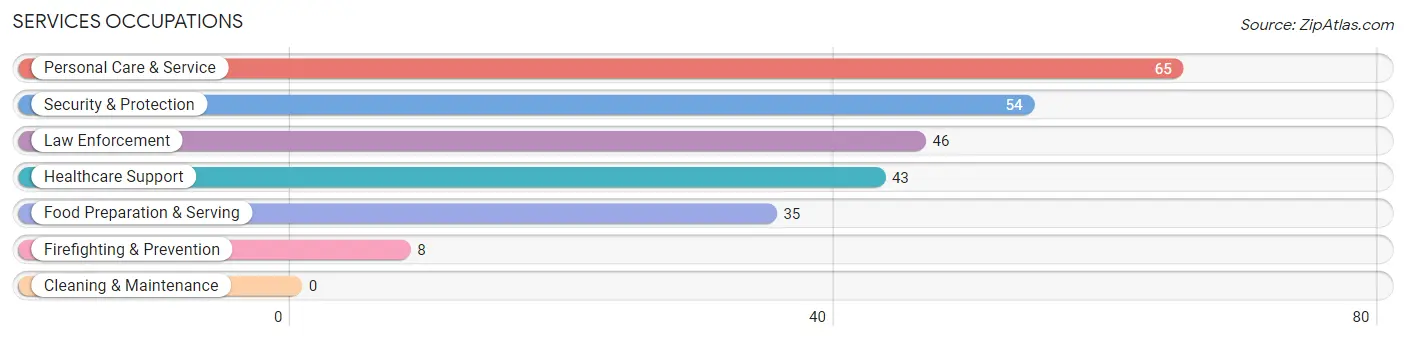
Services Occupations
The most common Services occupations in Felton are Personal Care & Service (65 | 3.1%), Security & Protection (54 | 2.6%), Law Enforcement (46 | 2.2%), Healthcare Support (43 | 2.1%), and Food Preparation & Serving (35 | 1.7%).
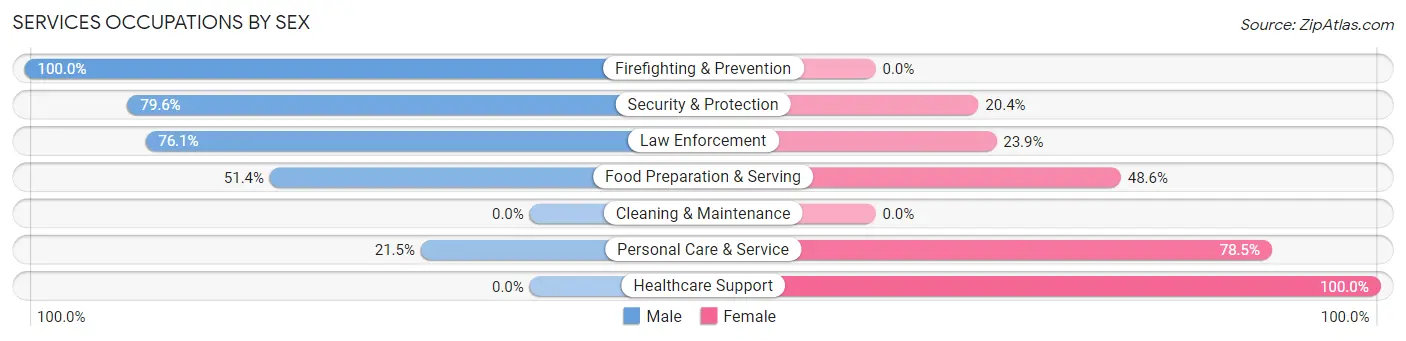
Services Occupations by Sex
Within the Services occupations in Felton, the most male-oriented occupations are Firefighting & Prevention (100.0%), Security & Protection (79.6%), and Law Enforcement (76.1%), while the most female-oriented occupations are Healthcare Support (100.0%), Personal Care & Service (78.5%), and Food Preparation & Serving (48.6%).
| Occupation | Male | Female |
| Healthcare Support | 0 (0.0%) | 43 (100.0%) |
| Security & Protection | 43 (79.6%) | 11 (20.4%) |
| Firefighting & Prevention | 8 (100.0%) | 0 (0.0%) |
| Law Enforcement | 35 (76.1%) | 11 (23.9%) |
| Food Preparation & Serving | 18 (51.4%) | 17 (48.6%) |
| Cleaning & Maintenance | 0 (0.0%) | 0 (0.0%) |
| Personal Care & Service | 14 (21.5%) | 51 (78.5%) |
| Total (Category) | 75 (38.1%) | 122 (61.9%) |
| Total (Overall) | 1,213 (58.5%) | 860 (41.5%) |
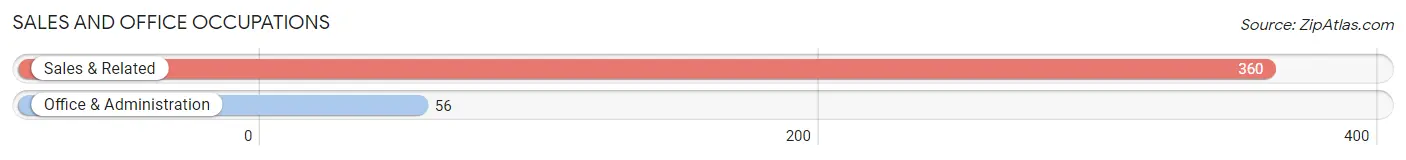
Sales and Office Occupations
The most common Sales and Office occupations in Felton are Sales & Related (360 | 17.4%), and Office & Administration (56 | 2.7%).
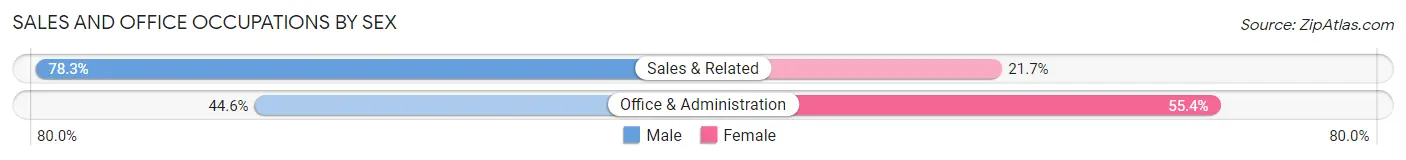
Sales and Office Occupations by Sex
| Occupation | Male | Female |
| Sales & Related | 282 (78.3%) | 78 (21.7%) |
| Office & Administration | 25 (44.6%) | 31 (55.4%) |
| Total (Category) | 307 (73.8%) | 109 (26.2%) |
| Total (Overall) | 1,213 (58.5%) | 860 (41.5%) |
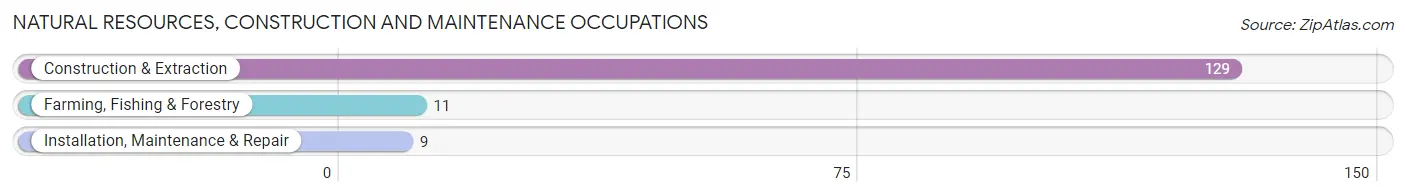
Natural Resources, Construction and Maintenance Occupations
The most common Natural Resources, Construction and Maintenance occupations in Felton are Construction & Extraction (129 | 6.2%), Farming, Fishing & Forestry (11 | 0.5%), and Installation, Maintenance & Repair (9 | 0.4%).
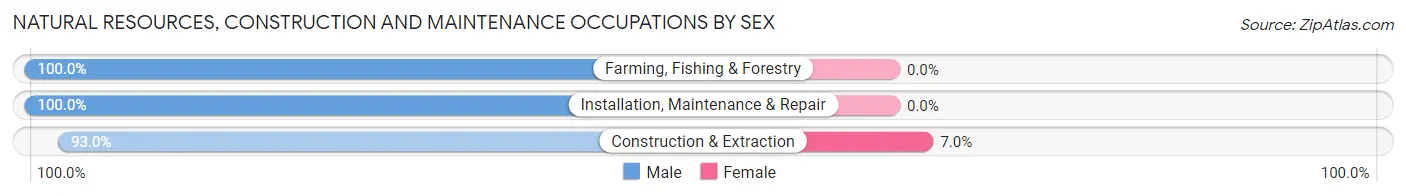
Natural Resources, Construction and Maintenance Occupations by Sex
| Occupation | Male | Female |
| Farming, Fishing & Forestry | 11 (100.0%) | 0 (0.0%) |
| Construction & Extraction | 120 (93.0%) | 9 (7.0%) |
| Installation, Maintenance & Repair | 9 (100.0%) | 0 (0.0%) |
| Total (Category) | 140 (94.0%) | 9 (6.0%) |
| Total (Overall) | 1,213 (58.5%) | 860 (41.5%) |
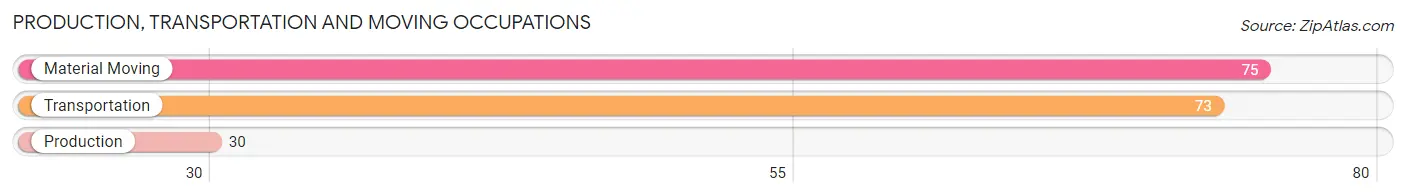
Production, Transportation and Moving Occupations
The most common Production, Transportation and Moving occupations in Felton are Material Moving (75 | 3.6%), Transportation (73 | 3.5%), and Production (30 | 1.5%).
Production, Transportation and Moving Occupations by Sex
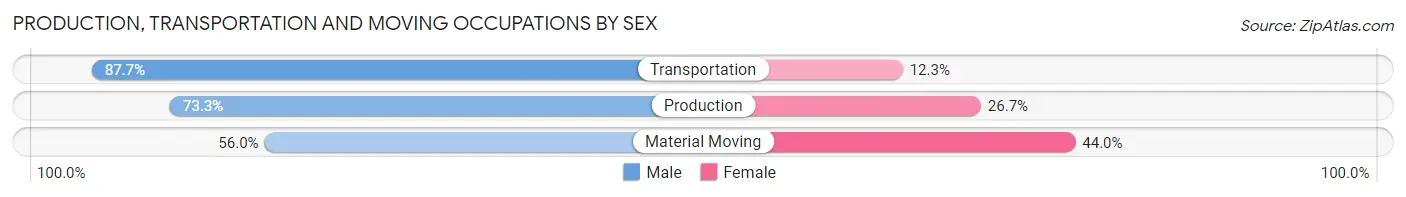
| Occupation | Male | Female |
| Production | 22 (73.3%) | 8 (26.7%) |
| Transportation | 64 (87.7%) | 9 (12.3%) |
| Material Moving | 42 (56.0%) | 33 (44.0%) |
| Total (Category) | 128 (71.9%) | 50 (28.1%) |
| Total (Overall) | 1,213 (58.5%) | 860 (41.5%) |
Employment Industries by Sex in Felton
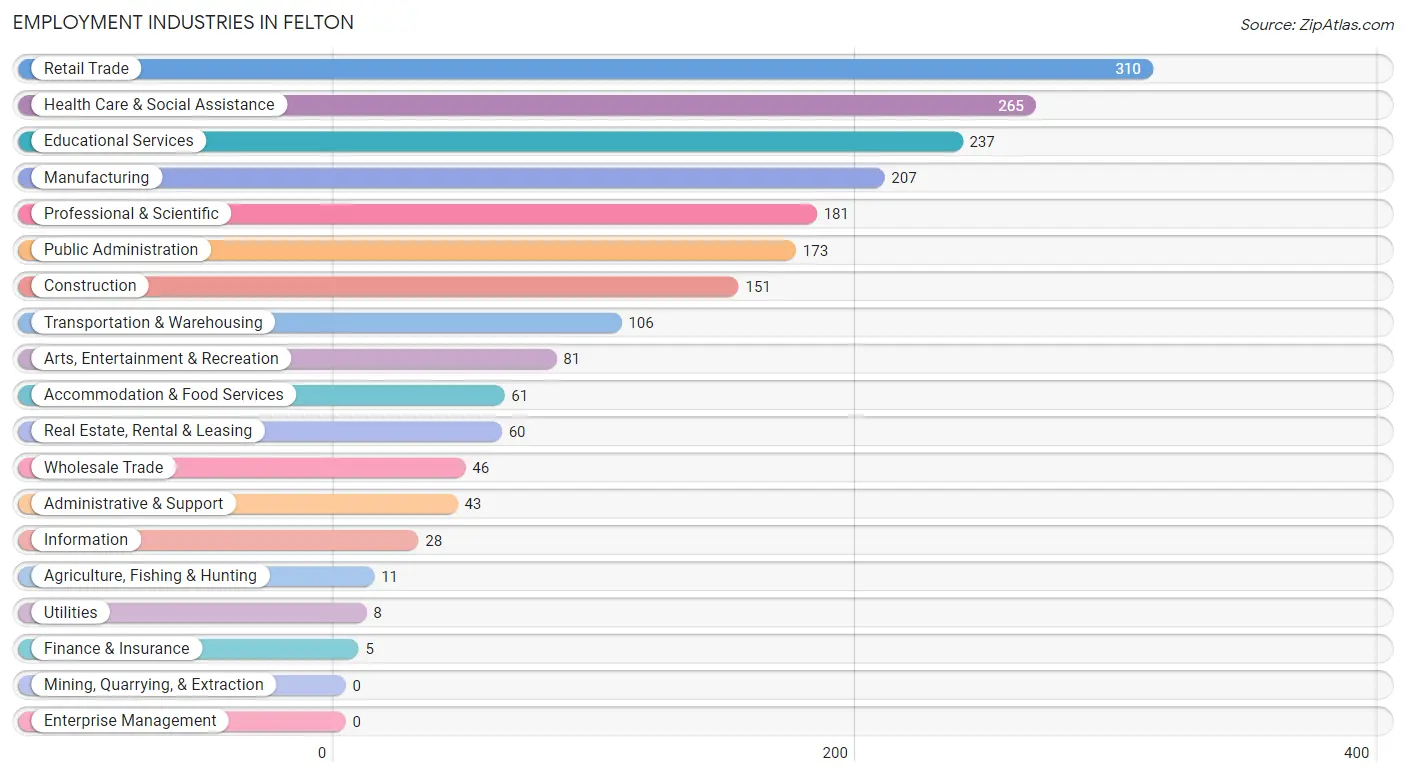
Employment Industries in Felton
The major employment industries in Felton include Retail Trade (310 | 14.9%), Health Care & Social Assistance (265 | 12.8%), Educational Services (237 | 11.4%), Manufacturing (207 | 10.0%), and Professional & Scientific (181 | 8.7%).
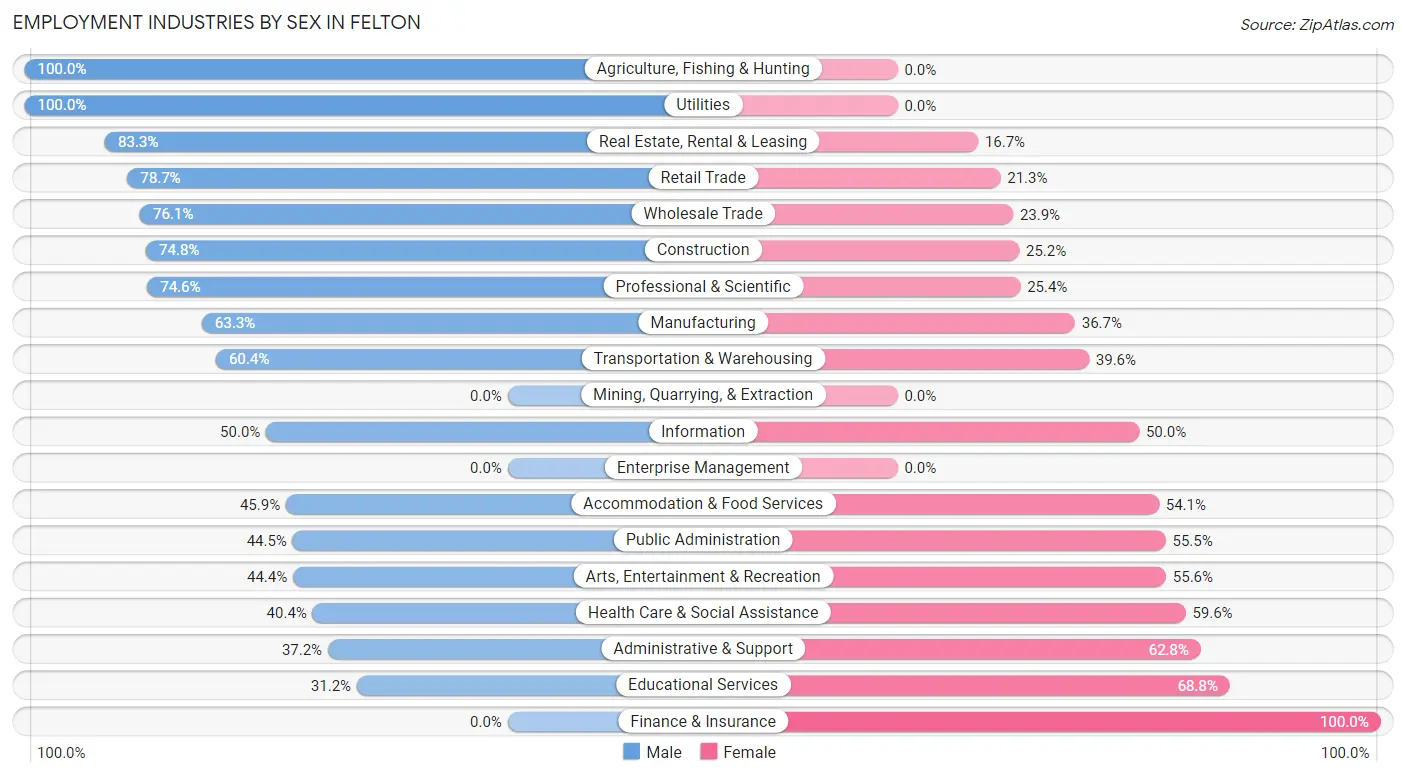
Employment Industries by Sex in Felton
The Felton industries that see more men than women are Agriculture, Fishing & Hunting (100.0%), Utilities (100.0%), and Real Estate, Rental & Leasing (83.3%), whereas the industries that tend to have a higher number of women are Finance & Insurance (100.0%), Educational Services (68.8%), and Administrative & Support (62.8%).
| Industry | Male | Female |
| Agriculture, Fishing & Hunting | 11 (100.0%) | 0 (0.0%) |
| Mining, Quarrying, & Extraction | 0 (0.0%) | 0 (0.0%) |
| Construction | 113 (74.8%) | 38 (25.2%) |
| Manufacturing | 131 (63.3%) | 76 (36.7%) |
| Wholesale Trade | 35 (76.1%) | 11 (23.9%) |
| Retail Trade | 244 (78.7%) | 66 (21.3%) |
| Transportation & Warehousing | 64 (60.4%) | 42 (39.6%) |
| Utilities | 8 (100.0%) | 0 (0.0%) |
| Information | 14 (50.0%) | 14 (50.0%) |
| Finance & Insurance | 0 (0.0%) | 5 (100.0%) |
| Real Estate, Rental & Leasing | 50 (83.3%) | 10 (16.7%) |
| Professional & Scientific | 135 (74.6%) | 46 (25.4%) |
| Enterprise Management | 0 (0.0%) | 0 (0.0%) |
| Administrative & Support | 16 (37.2%) | 27 (62.8%) |
| Educational Services | 74 (31.2%) | 163 (68.8%) |
| Health Care & Social Assistance | 107 (40.4%) | 158 (59.6%) |
| Arts, Entertainment & Recreation | 36 (44.4%) | 45 (55.6%) |
| Accommodation & Food Services | 28 (45.9%) | 33 (54.1%) |
| Public Administration | 77 (44.5%) | 96 (55.5%) |
| Total | 1,213 (58.5%) | 860 (41.5%) |
Education in Felton
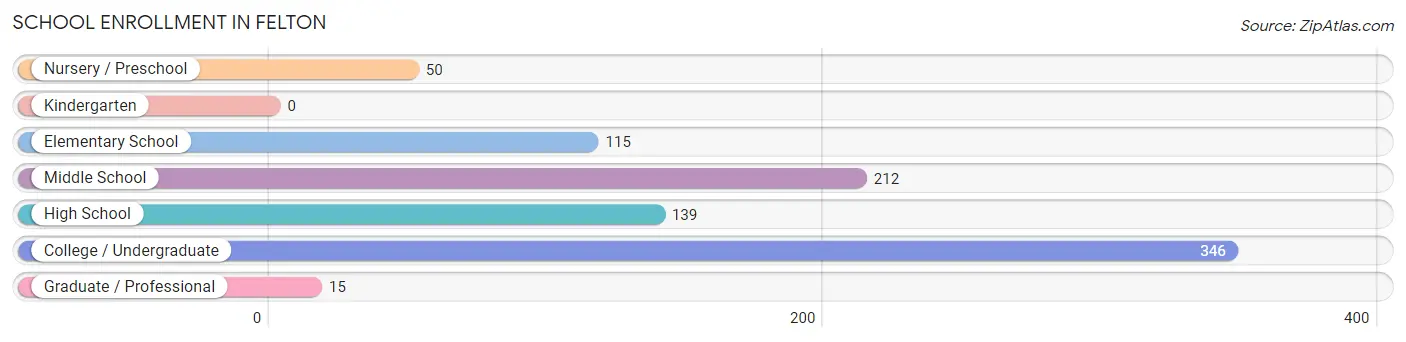
School Enrollment in Felton
The most common levels of schooling among the 877 students in Felton are college / undergraduate (346 | 39.5%), middle school (212 | 24.2%), and high school (139 | 15.9%).
| School Level | # Students | % Students |
| Nursery / Preschool | 50 | 5.7% |
| Kindergarten | 0 | 0.0% |
| Elementary School | 115 | 13.1% |
| Middle School | 212 | 24.2% |
| High School | 139 | 15.9% |
| College / Undergraduate | 346 | 39.5% |
| Graduate / Professional | 15 | 1.7% |
| Total | 877 | 100.0% |
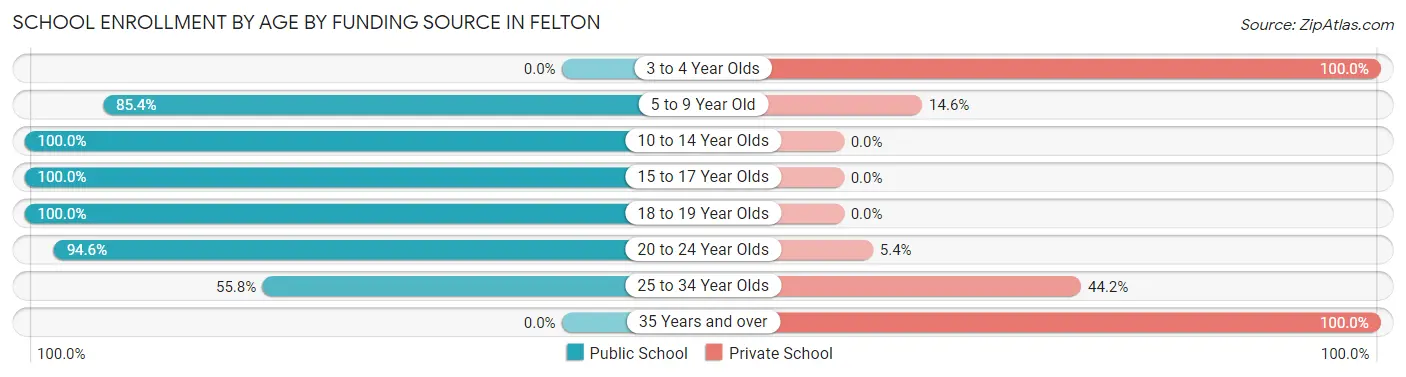
School Enrollment by Age by Funding Source in Felton
Out of a total of 877 students who are enrolled in schools in Felton, 141 (16.1%) attend a private institution, while the remaining 736 (83.9%) are enrolled in public schools. The age group of 3 to 4 year olds has the highest likelihood of being enrolled in private schools, with 35 (100.0% in the age bracket) enrolled. Conversely, the age group of 10 to 14 year olds has the lowest likelihood of being enrolled in a private school, with 223 (100.0% in the age bracket) attending a public institution.
| Age Bracket | Public School | Private School |
| 3 to 4 Year Olds | 0 (0.0%) | 35 (100.0%) |
| 5 to 9 Year Old | 111 (85.4%) | 19 (14.6%) |
| 10 to 14 Year Olds | 223 (100.0%) | 0 (0.0%) |
| 15 to 17 Year Olds | 51 (100.0%) | 0 (0.0%) |
| 18 to 19 Year Olds | 148 (100.0%) | 0 (0.0%) |
| 20 to 24 Year Olds | 174 (94.6%) | 10 (5.4%) |
| 25 to 34 Year Olds | 29 (55.8%) | 23 (44.2%) |
| 35 Years and over | 0 (0.0%) | 54 (100.0%) |
| Total | 736 (83.9%) | 141 (16.1%) |
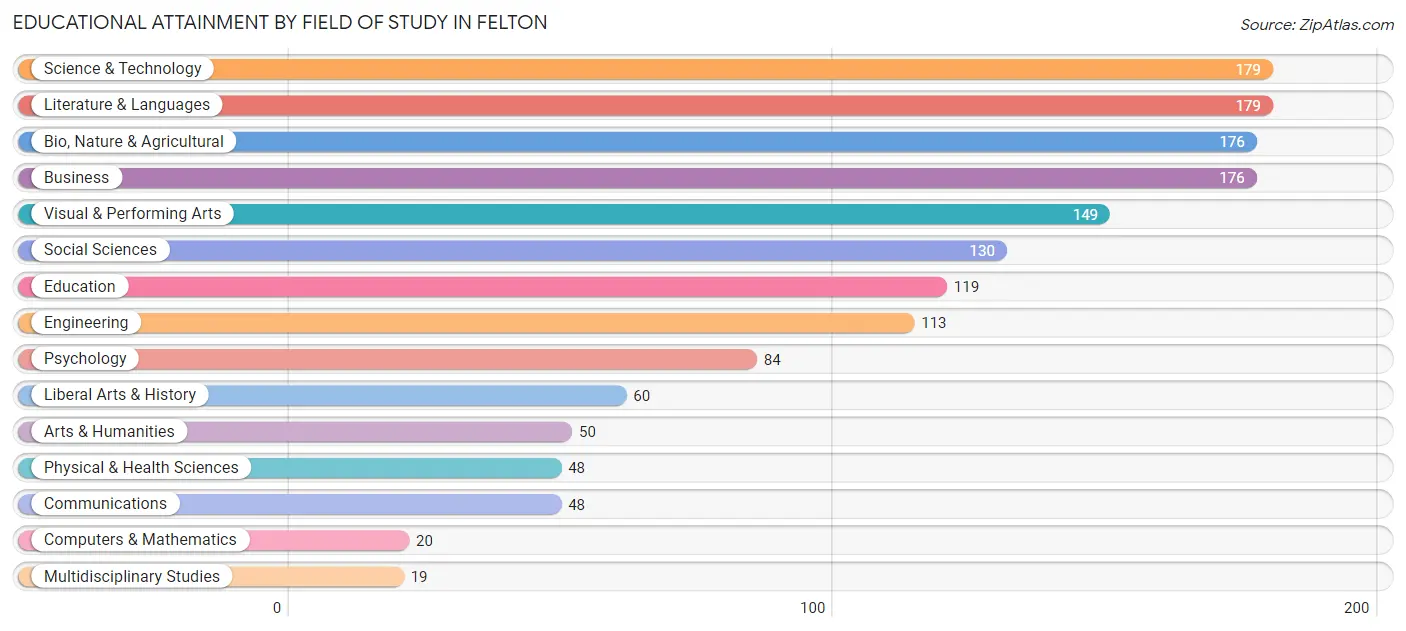
Educational Attainment by Field of Study in Felton
Science & technology (179 | 11.6%), literature & languages (179 | 11.6%), bio, nature & agricultural (176 | 11.4%), business (176 | 11.4%), and visual & performing arts (149 | 9.6%) are the most common fields of study among 1,550 individuals in Felton who have obtained a bachelor's degree or higher.
| Field of Study | # Graduates | % Graduates |
| Computers & Mathematics | 20 | 1.3% |
| Bio, Nature & Agricultural | 176 | 11.4% |
| Physical & Health Sciences | 48 | 3.1% |
| Psychology | 84 | 5.4% |
| Social Sciences | 130 | 8.4% |
| Engineering | 113 | 7.3% |
| Multidisciplinary Studies | 19 | 1.2% |
| Science & Technology | 179 | 11.6% |
| Business | 176 | 11.4% |
| Education | 119 | 7.7% |
| Literature & Languages | 179 | 11.6% |
| Liberal Arts & History | 60 | 3.9% |
| Visual & Performing Arts | 149 | 9.6% |
| Communications | 48 | 3.1% |
| Arts & Humanities | 50 | 3.2% |
| Total | 1,550 | 100.0% |
Transportation & Commute in Felton
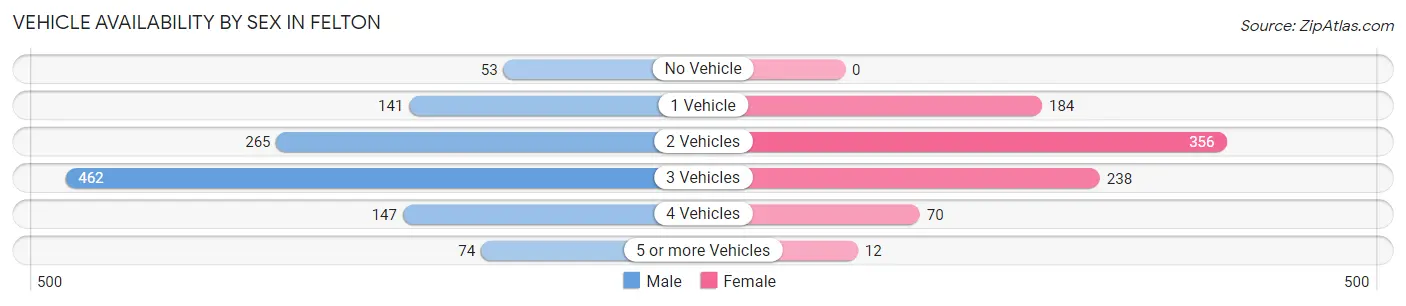
Vehicle Availability by Sex in Felton
The most prevalent vehicle ownership categories in Felton are males with 3 vehicles (462, accounting for 40.5%) and females with 3 vehicles (238, making up 53.7%).
| Vehicles Available | Male | Female |
| No Vehicle | 53 (4.6%) | 0 (0.0%) |
| 1 Vehicle | 141 (12.3%) | 184 (21.4%) |
| 2 Vehicles | 265 (23.2%) | 356 (41.4%) |
| 3 Vehicles | 462 (40.5%) | 238 (27.7%) |
| 4 Vehicles | 147 (12.9%) | 70 (8.1%) |
| 5 or more Vehicles | 74 (6.5%) | 12 (1.4%) |
| Total | 1,142 (100.0%) | 860 (100.0%) |
Commute Time in Felton
The most frequently occuring commute durations in Felton are 20 to 24 minutes (328 commuters, 20.6%), 15 to 19 minutes (244 commuters, 15.3%), and 60 to 89 minutes (181 commuters, 11.4%).
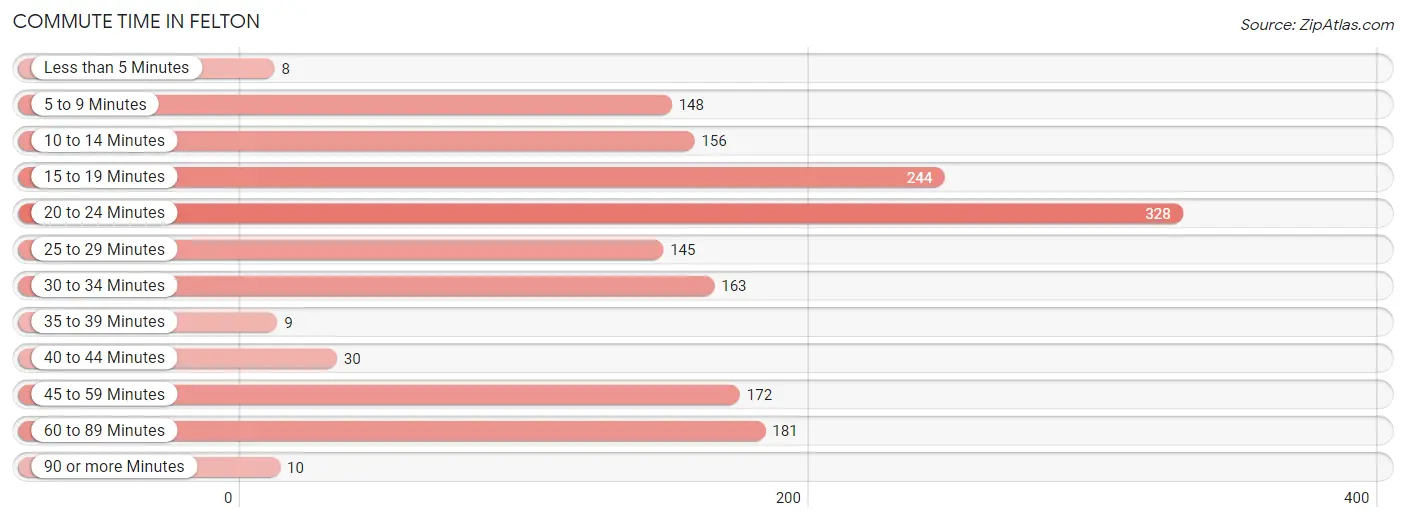
| Commute Time | # Commuters | % Commuters |
| Less than 5 Minutes | 8 | 0.5% |
| 5 to 9 Minutes | 148 | 9.3% |
| 10 to 14 Minutes | 156 | 9.8% |
| 15 to 19 Minutes | 244 | 15.3% |
| 20 to 24 Minutes | 328 | 20.6% |
| 25 to 29 Minutes | 145 | 9.1% |
| 30 to 34 Minutes | 163 | 10.2% |
| 35 to 39 Minutes | 9 | 0.6% |
| 40 to 44 Minutes | 30 | 1.9% |
| 45 to 59 Minutes | 172 | 10.8% |
| 60 to 89 Minutes | 181 | 11.4% |
| 90 or more Minutes | 10 | 0.6% |
Commute Time by Sex in Felton
The most common commute times in Felton are 20 to 24 minutes (203 commuters, 22.2%) for males and 30 to 34 minutes (128 commuters, 18.9%) for females.
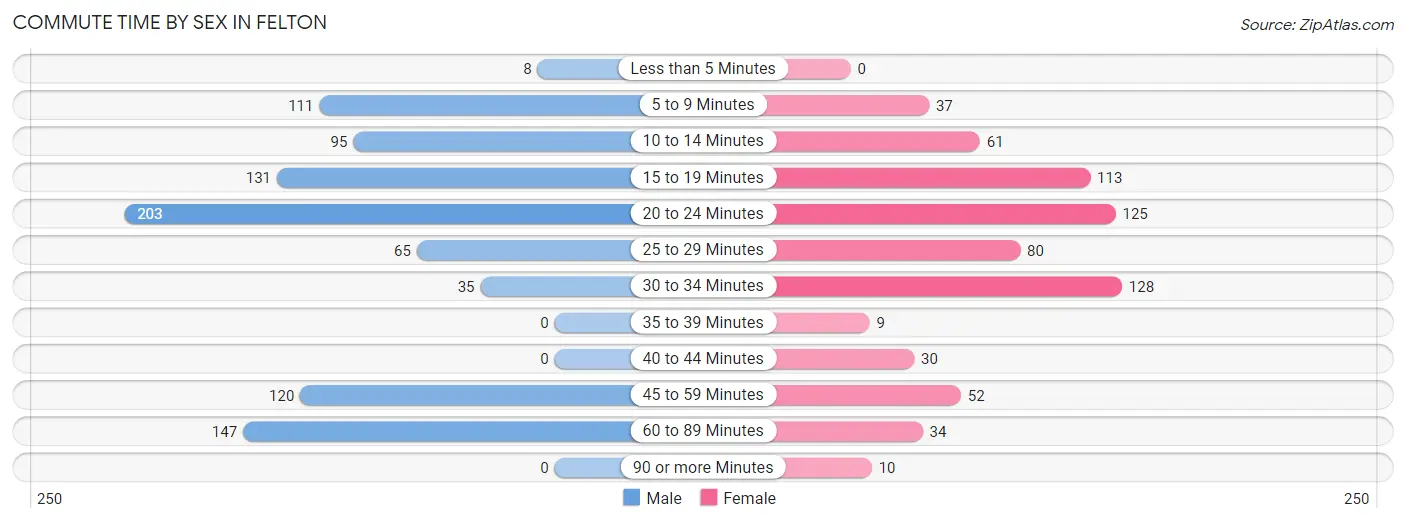
| Commute Time | Male | Female |
| Less than 5 Minutes | 8 (0.9%) | 0 (0.0%) |
| 5 to 9 Minutes | 111 (12.1%) | 37 (5.4%) |
| 10 to 14 Minutes | 95 (10.4%) | 61 (9.0%) |
| 15 to 19 Minutes | 131 (14.3%) | 113 (16.6%) |
| 20 to 24 Minutes | 203 (22.2%) | 125 (18.4%) |
| 25 to 29 Minutes | 65 (7.1%) | 80 (11.8%) |
| 30 to 34 Minutes | 35 (3.8%) | 128 (18.9%) |
| 35 to 39 Minutes | 0 (0.0%) | 9 (1.3%) |
| 40 to 44 Minutes | 0 (0.0%) | 30 (4.4%) |
| 45 to 59 Minutes | 120 (13.1%) | 52 (7.7%) |
| 60 to 89 Minutes | 147 (16.1%) | 34 (5.0%) |
| 90 or more Minutes | 0 (0.0%) | 10 (1.5%) |
Time of Departure to Work by Sex in Felton
The most frequent times of departure to work in Felton are 7:30 AM to 7:59 AM (189, 20.7%) for males and 7:30 AM to 7:59 AM (150, 22.1%) for females.
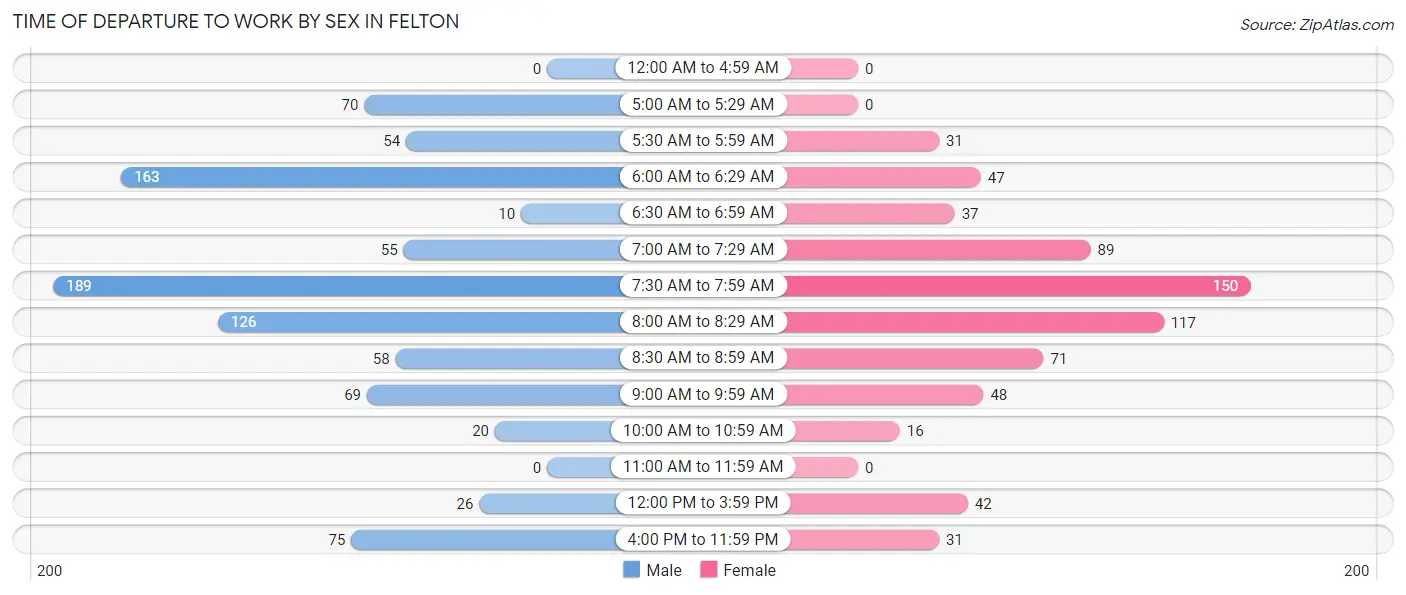
| Time of Departure | Male | Female |
| 12:00 AM to 4:59 AM | 0 (0.0%) | 0 (0.0%) |
| 5:00 AM to 5:29 AM | 70 (7.6%) | 0 (0.0%) |
| 5:30 AM to 5:59 AM | 54 (5.9%) | 31 (4.6%) |
| 6:00 AM to 6:29 AM | 163 (17.8%) | 47 (6.9%) |
| 6:30 AM to 6:59 AM | 10 (1.1%) | 37 (5.4%) |
| 7:00 AM to 7:29 AM | 55 (6.0%) | 89 (13.1%) |
| 7:30 AM to 7:59 AM | 189 (20.7%) | 150 (22.1%) |
| 8:00 AM to 8:29 AM | 126 (13.8%) | 117 (17.2%) |
| 8:30 AM to 8:59 AM | 58 (6.3%) | 71 (10.5%) |
| 9:00 AM to 9:59 AM | 69 (7.5%) | 48 (7.1%) |
| 10:00 AM to 10:59 AM | 20 (2.2%) | 16 (2.4%) |
| 11:00 AM to 11:59 AM | 0 (0.0%) | 0 (0.0%) |
| 12:00 PM to 3:59 PM | 26 (2.8%) | 42 (6.2%) |
| 4:00 PM to 11:59 PM | 75 (8.2%) | 31 (4.6%) |
| Total | 915 (100.0%) | 679 (100.0%) |
Housing Occupancy in Felton
Occupancy by Ownership in Felton
Of the total 1,560 dwellings in Felton, owner-occupied units account for 1,169 (74.9%), while renter-occupied units make up 391 (25.1%).
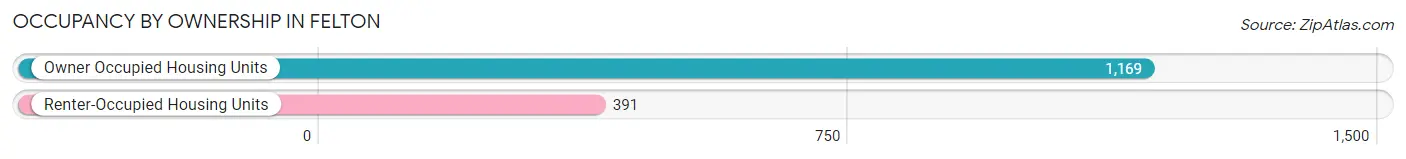
| Occupancy | # Housing Units | % Housing Units |
| Owner Occupied Housing Units | 1,169 | 74.9% |
| Renter-Occupied Housing Units | 391 | 25.1% |
| Total Occupied Housing Units | 1,560 | 100.0% |
Occupancy by Household Size in Felton
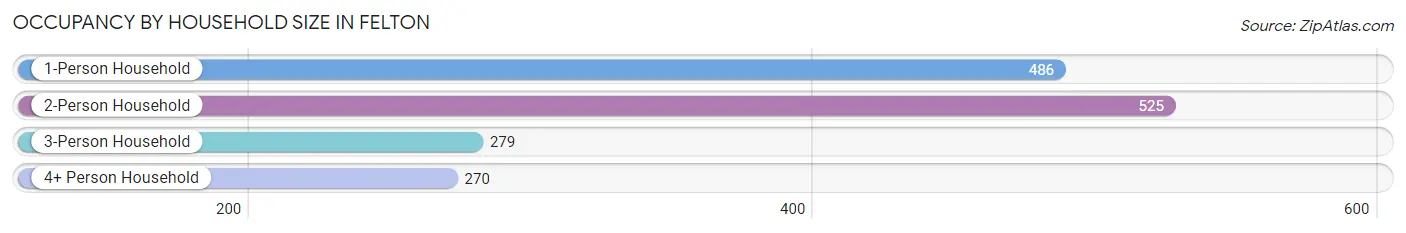
| Household Size | # Housing Units | % Housing Units |
| 1-Person Household | 486 | 31.1% |
| 2-Person Household | 525 | 33.7% |
| 3-Person Household | 279 | 17.9% |
| 4+ Person Household | 270 | 17.3% |
| Total Housing Units | 1,560 | 100.0% |
Occupancy by Ownership by Household Size in Felton
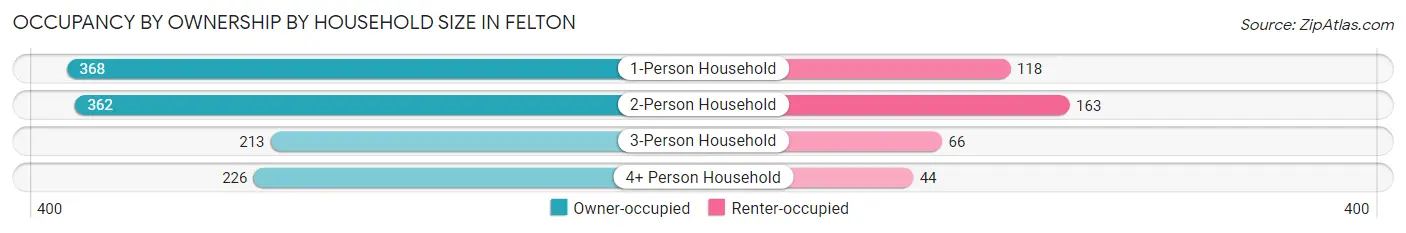
| Household Size | Owner-occupied | Renter-occupied |
| 1-Person Household | 368 (75.7%) | 118 (24.3%) |
| 2-Person Household | 362 (69.0%) | 163 (31.0%) |
| 3-Person Household | 213 (76.3%) | 66 (23.7%) |
| 4+ Person Household | 226 (83.7%) | 44 (16.3%) |
| Total Housing Units | 1,169 (74.9%) | 391 (25.1%) |
Occupancy by Educational Attainment in Felton
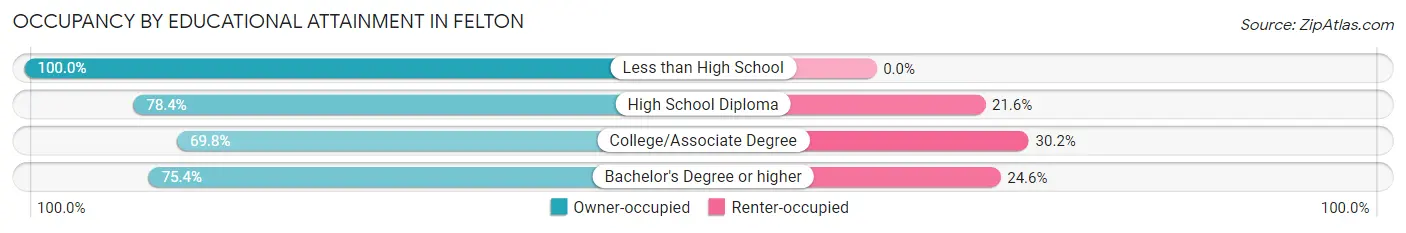
| Household Size | Owner-occupied | Renter-occupied |
| Less than High School | 46 (100.0%) | 0 (0.0%) |
| High School Diploma | 149 (78.4%) | 41 (21.6%) |
| College/Associate Degree | 300 (69.8%) | 130 (30.2%) |
| Bachelor's Degree or higher | 674 (75.4%) | 220 (24.6%) |
Occupancy by Age of Householder in Felton
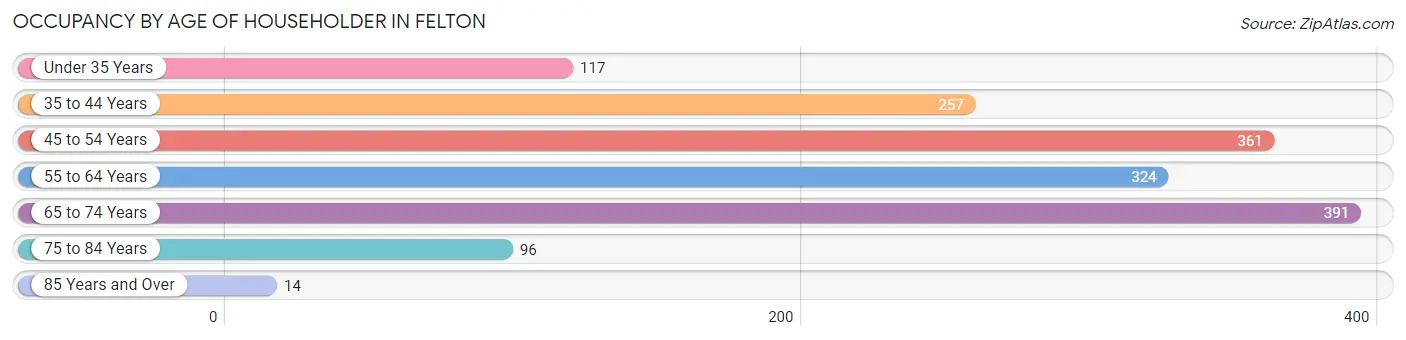
| Age Bracket | # Households | % Households |
| Under 35 Years | 117 | 7.5% |
| 35 to 44 Years | 257 | 16.5% |
| 45 to 54 Years | 361 | 23.1% |
| 55 to 64 Years | 324 | 20.8% |
| 65 to 74 Years | 391 | 25.1% |
| 75 to 84 Years | 96 | 6.1% |
| 85 Years and Over | 14 | 0.9% |
| Total | 1,560 | 100.0% |
Housing Finances in Felton
Median Income by Occupancy in Felton
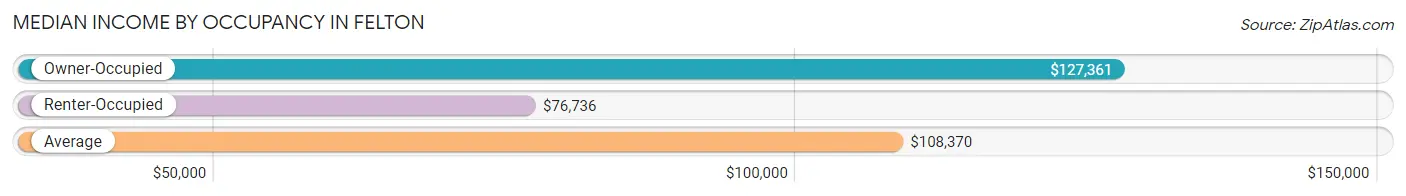
| Occupancy Type | # Households | Median Income |
| Owner-Occupied | 1,169 (74.9%) | $127,361 |
| Renter-Occupied | 391 (25.1%) | $76,736 |
| Average | 1,560 (100.0%) | $108,370 |
Occupancy by Householder Income Bracket in Felton
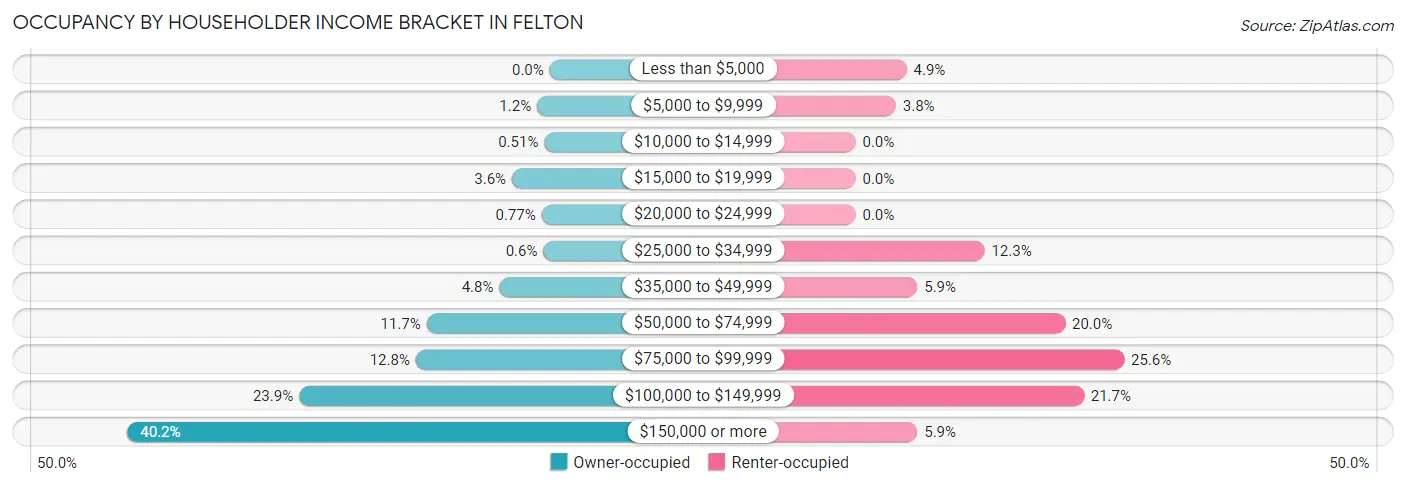
| Income Bracket | Owner-occupied | Renter-occupied |
| Less than $5,000 | 0 (0.0%) | 19 (4.9%) |
| $5,000 to $9,999 | 14 (1.2%) | 15 (3.8%) |
| $10,000 to $14,999 | 6 (0.5%) | 0 (0.0%) |
| $15,000 to $19,999 | 42 (3.6%) | 0 (0.0%) |
| $20,000 to $24,999 | 9 (0.8%) | 0 (0.0%) |
| $25,000 to $34,999 | 7 (0.6%) | 48 (12.3%) |
| $35,000 to $49,999 | 56 (4.8%) | 23 (5.9%) |
| $50,000 to $74,999 | 137 (11.7%) | 78 (20.0%) |
| $75,000 to $99,999 | 149 (12.8%) | 100 (25.6%) |
| $100,000 to $149,999 | 279 (23.9%) | 85 (21.7%) |
| $150,000 or more | 470 (40.2%) | 23 (5.9%) |
| Total | 1,169 (100.0%) | 391 (100.0%) |
Monthly Housing Cost Tiers in Felton
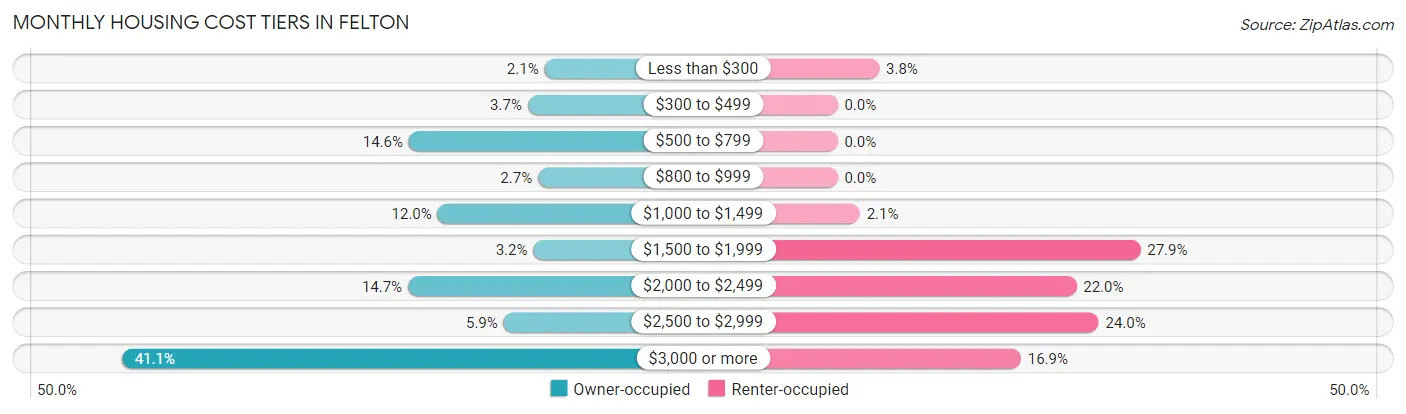
| Monthly Cost | Owner-occupied | Renter-occupied |
| Less than $300 | 25 (2.1%) | 15 (3.8%) |
| $300 to $499 | 43 (3.7%) | 0 (0.0%) |
| $500 to $799 | 171 (14.6%) | 0 (0.0%) |
| $800 to $999 | 32 (2.7%) | 0 (0.0%) |
| $1,000 to $1,499 | 140 (12.0%) | 8 (2.1%) |
| $1,500 to $1,999 | 37 (3.2%) | 109 (27.9%) |
| $2,000 to $2,499 | 172 (14.7%) | 86 (22.0%) |
| $2,500 to $2,999 | 69 (5.9%) | 94 (24.0%) |
| $3,000 or more | 480 (41.1%) | 66 (16.9%) |
| Total | 1,169 (100.0%) | 391 (100.0%) |
Physical Housing Characteristics in Felton
Housing Structures in Felton
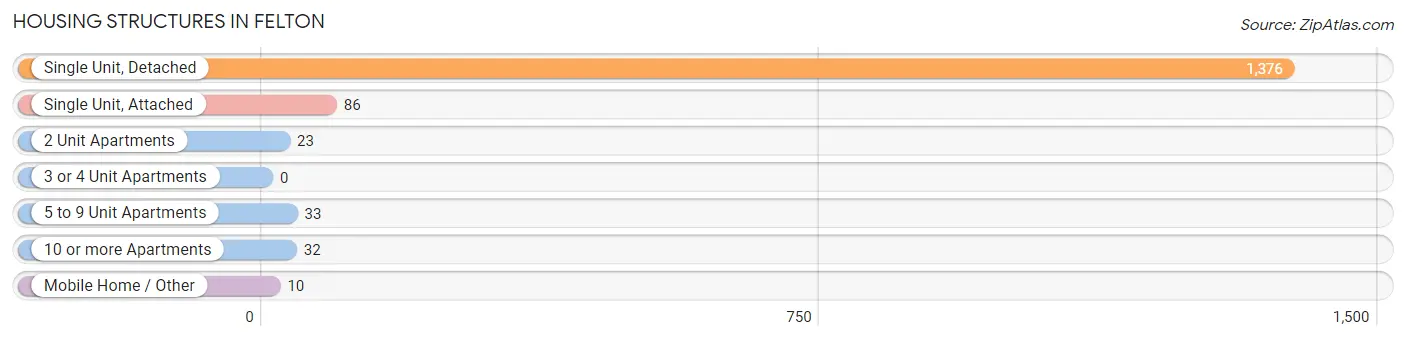
| Structure Type | # Housing Units | % Housing Units |
| Single Unit, Detached | 1,376 | 88.2% |
| Single Unit, Attached | 86 | 5.5% |
| 2 Unit Apartments | 23 | 1.5% |
| 3 or 4 Unit Apartments | 0 | 0.0% |
| 5 to 9 Unit Apartments | 33 | 2.1% |
| 10 or more Apartments | 32 | 2.1% |
| Mobile Home / Other | 10 | 0.6% |
| Total | 1,560 | 100.0% |
Housing Structures by Occupancy in Felton
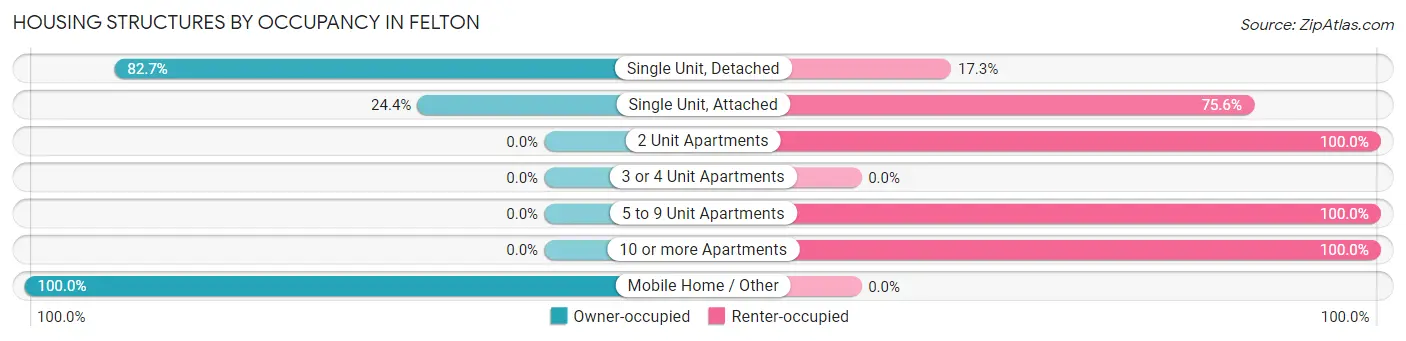
| Structure Type | Owner-occupied | Renter-occupied |
| Single Unit, Detached | 1,138 (82.7%) | 238 (17.3%) |
| Single Unit, Attached | 21 (24.4%) | 65 (75.6%) |
| 2 Unit Apartments | 0 (0.0%) | 23 (100.0%) |
| 3 or 4 Unit Apartments | 0 (0.0%) | 0 (0.0%) |
| 5 to 9 Unit Apartments | 0 (0.0%) | 33 (100.0%) |
| 10 or more Apartments | 0 (0.0%) | 32 (100.0%) |
| Mobile Home / Other | 10 (100.0%) | 0 (0.0%) |
| Total | 1,169 (74.9%) | 391 (25.1%) |
Housing Structures by Number of Rooms in Felton
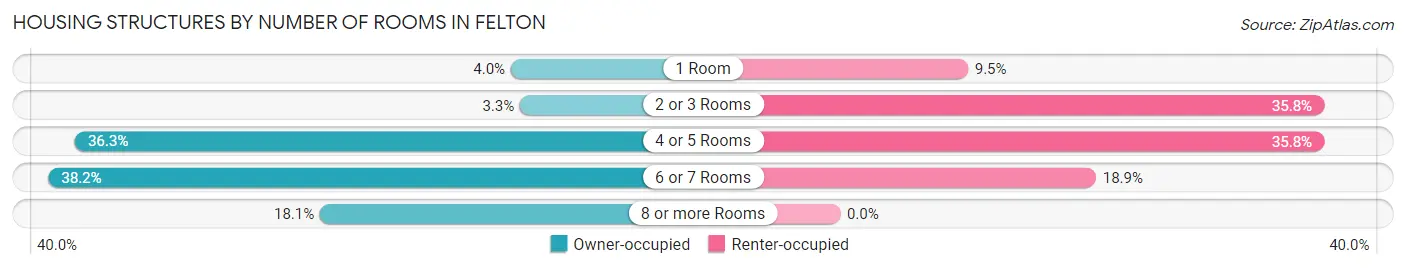
| Number of Rooms | Owner-occupied | Renter-occupied |
| 1 Room | 47 (4.0%) | 37 (9.5%) |
| 2 or 3 Rooms | 39 (3.3%) | 140 (35.8%) |
| 4 or 5 Rooms | 424 (36.3%) | 140 (35.8%) |
| 6 or 7 Rooms | 447 (38.2%) | 74 (18.9%) |
| 8 or more Rooms | 212 (18.1%) | 0 (0.0%) |
| Total | 1,169 (100.0%) | 391 (100.0%) |
Housing Structure by Heating Type in Felton
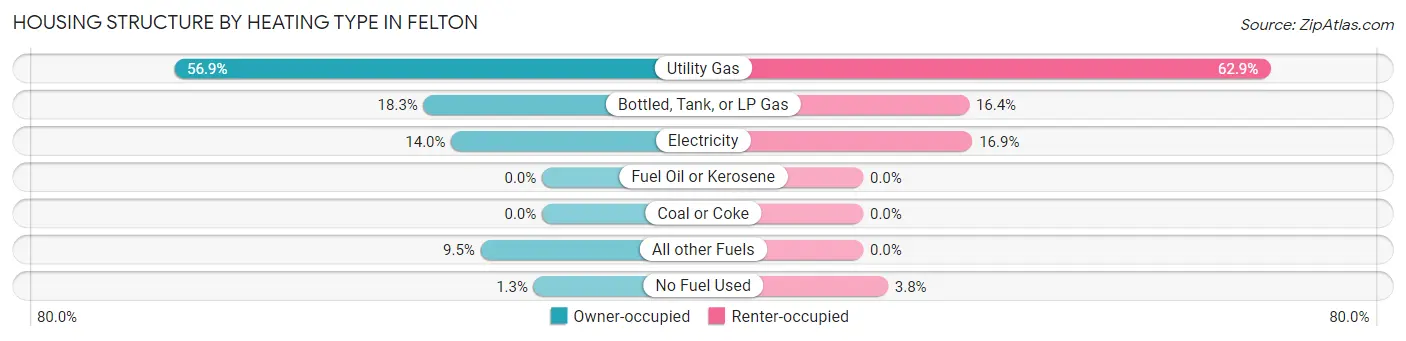
| Heating Type | Owner-occupied | Renter-occupied |
| Utility Gas | 665 (56.9%) | 246 (62.9%) |
| Bottled, Tank, or LP Gas | 214 (18.3%) | 64 (16.4%) |
| Electricity | 164 (14.0%) | 66 (16.9%) |
| Fuel Oil or Kerosene | 0 (0.0%) | 0 (0.0%) |
| Coal or Coke | 0 (0.0%) | 0 (0.0%) |
| All other Fuels | 111 (9.5%) | 0 (0.0%) |
| No Fuel Used | 15 (1.3%) | 15 (3.8%) |
| Total | 1,169 (100.0%) | 391 (100.0%) |
Household Vehicle Usage in Felton
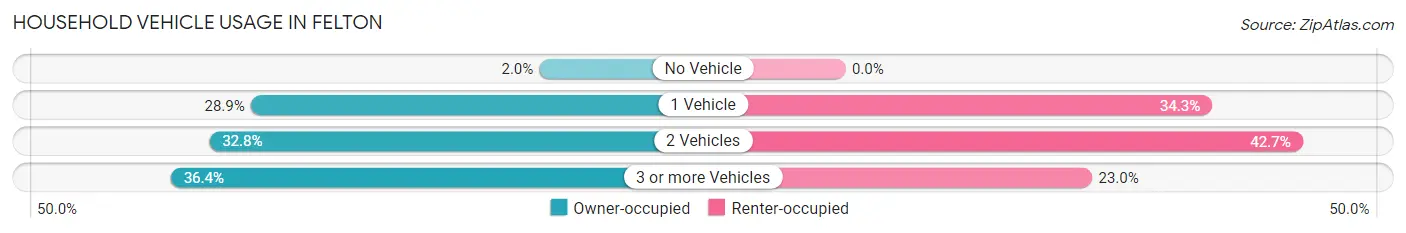
| Vehicles per Household | Owner-occupied | Renter-occupied |
| No Vehicle | 23 (2.0%) | 0 (0.0%) |
| 1 Vehicle | 338 (28.9%) | 134 (34.3%) |
| 2 Vehicles | 383 (32.8%) | 167 (42.7%) |
| 3 or more Vehicles | 425 (36.4%) | 90 (23.0%) |
| Total | 1,169 (100.0%) | 391 (100.0%) |
Real Estate & Mortgages in Felton
Real Estate and Mortgage Overview in Felton
| Characteristic | Without Mortgage | With Mortgage |
| Housing Units | 359 | 810 |
| Median Property Value | $863,400 | $844,600 |
| Median Household Income | $105,982 | $364 |
| Monthly Housing Costs | $707 | $480 |
| Real Estate Taxes | $3,888 | $0 |
Property Value by Mortgage Status in Felton
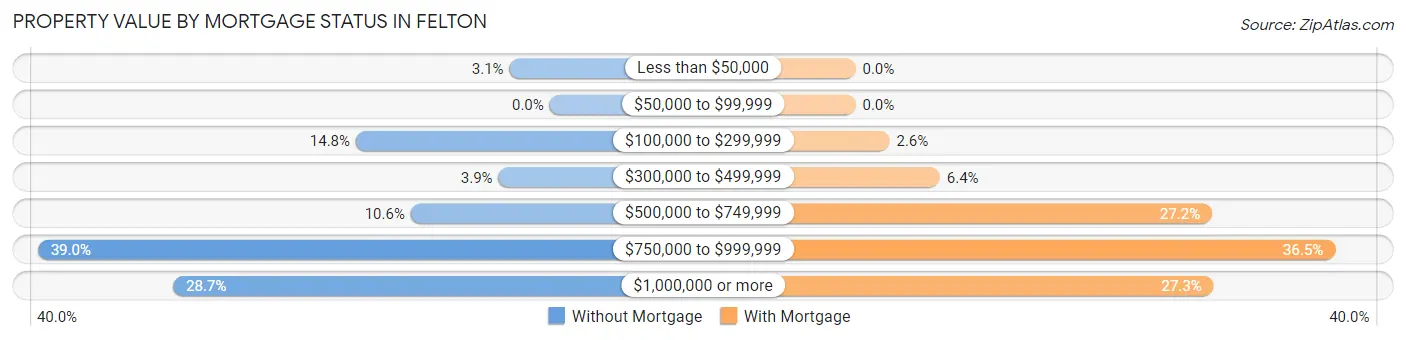
| Property Value | Without Mortgage | With Mortgage |
| Less than $50,000 | 11 (3.1%) | 0 (0.0%) |
| $50,000 to $99,999 | 0 (0.0%) | 0 (0.0%) |
| $100,000 to $299,999 | 53 (14.8%) | 21 (2.6%) |
| $300,000 to $499,999 | 14 (3.9%) | 52 (6.4%) |
| $500,000 to $749,999 | 38 (10.6%) | 220 (27.2%) |
| $750,000 to $999,999 | 140 (39.0%) | 296 (36.5%) |
| $1,000,000 or more | 103 (28.7%) | 221 (27.3%) |
| Total | 359 (100.0%) | 810 (100.0%) |
Household Income by Mortgage Status in Felton
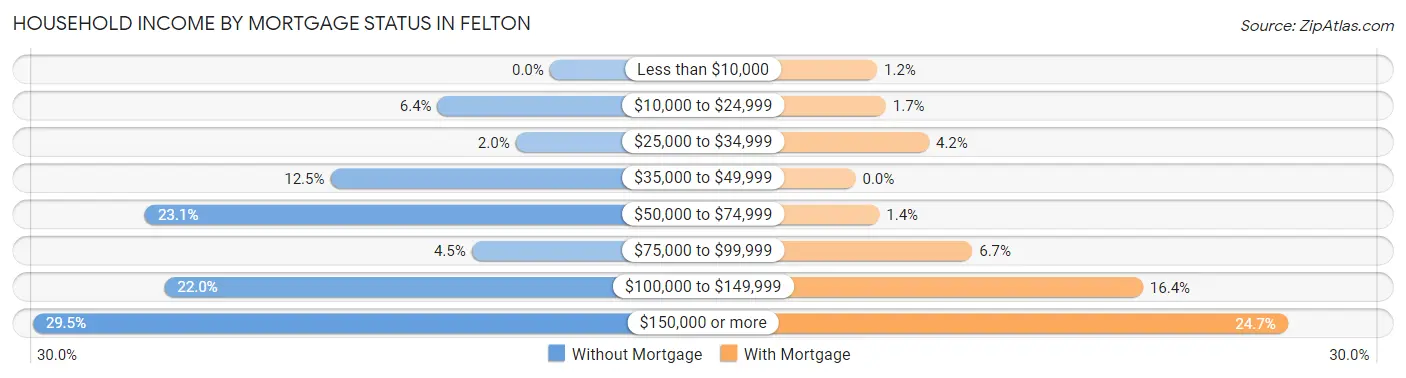
| Household Income | Without Mortgage | With Mortgage |
| Less than $10,000 | 0 (0.0%) | 10 (1.2%) |
| $10,000 to $24,999 | 23 (6.4%) | 14 (1.7%) |
| $25,000 to $34,999 | 7 (1.9%) | 34 (4.2%) |
| $35,000 to $49,999 | 45 (12.5%) | 0 (0.0%) |
| $50,000 to $74,999 | 83 (23.1%) | 11 (1.4%) |
| $75,000 to $99,999 | 16 (4.5%) | 54 (6.7%) |
| $100,000 to $149,999 | 79 (22.0%) | 133 (16.4%) |
| $150,000 or more | 106 (29.5%) | 200 (24.7%) |
| Total | 359 (100.0%) | 810 (100.0%) |
Property Value to Household Income Ratio in Felton
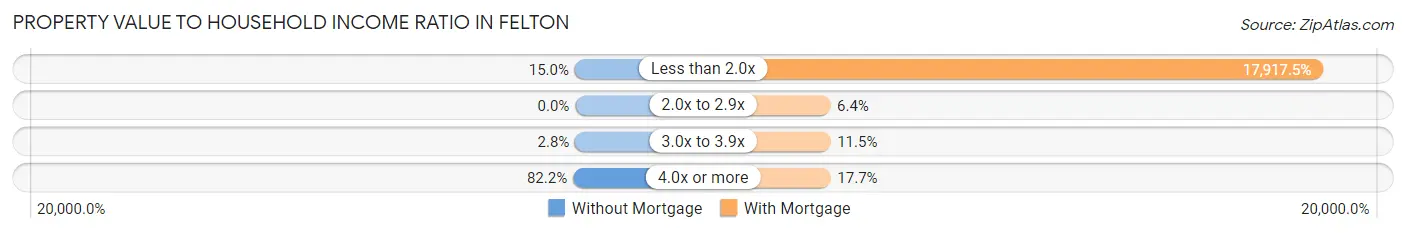
| Value-to-Income Ratio | Without Mortgage | With Mortgage |
| Less than 2.0x | 54 (15.0%) | 145,132 (17,917.5%) |
| 2.0x to 2.9x | 0 (0.0%) | 52 (6.4%) |
| 3.0x to 3.9x | 10 (2.8%) | 93 (11.5%) |
| 4.0x or more | 295 (82.2%) | 143 (17.6%) |
| Total | 359 (100.0%) | 810 (100.0%) |
Real Estate Taxes by Mortgage Status in Felton
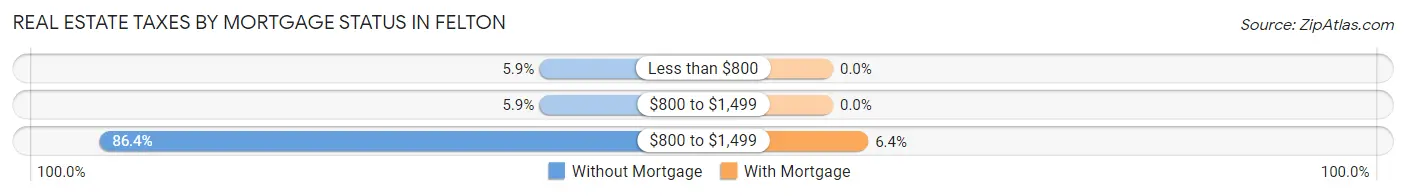
| Property Taxes | Without Mortgage | With Mortgage |
| Less than $800 | 21 (5.9%) | 0 (0.0%) |
| $800 to $1,499 | 21 (5.9%) | 0 (0.0%) |
| $800 to $1,499 | 310 (86.4%) | 52 (6.4%) |
| Total | 359 (100.0%) | 810 (100.0%) |
Health & Disability in Felton
Health Insurance Coverage by Age in Felton
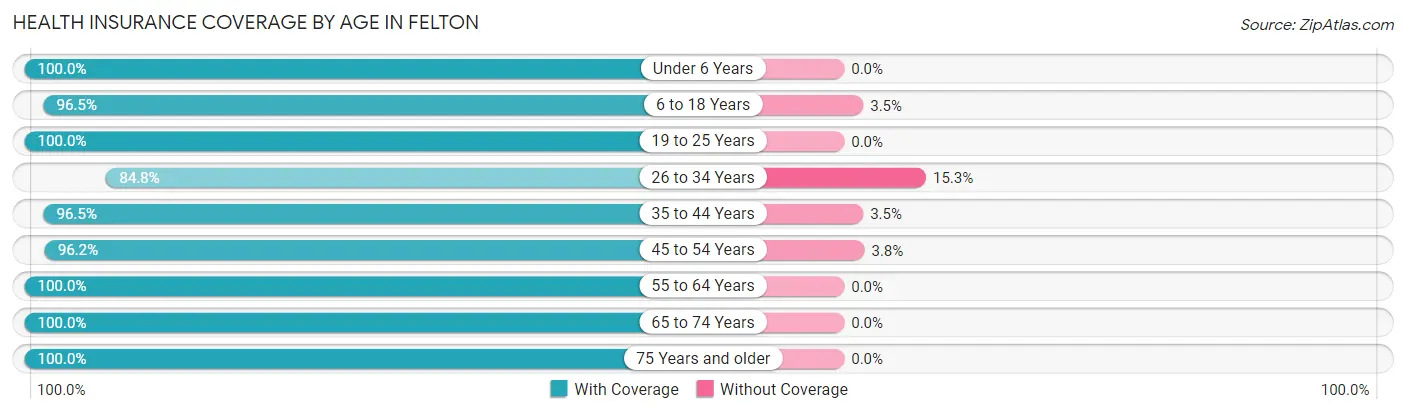
| Age Bracket | With Coverage | Without Coverage |
| Under 6 Years | 142 (100.0%) | 0 (0.0%) |
| 6 to 18 Years | 518 (96.5%) | 19 (3.5%) |
| 19 to 25 Years | 356 (100.0%) | 0 (0.0%) |
| 26 to 34 Years | 189 (84.8%) | 34 (15.2%) |
| 35 to 44 Years | 547 (96.5%) | 20 (3.5%) |
| 45 to 54 Years | 585 (96.2%) | 23 (3.8%) |
| 55 to 64 Years | 498 (100.0%) | 0 (0.0%) |
| 65 to 74 Years | 608 (100.0%) | 0 (0.0%) |
| 75 Years and older | 162 (100.0%) | 0 (0.0%) |
| Total | 3,605 (97.4%) | 96 (2.6%) |
Health Insurance Coverage by Citizenship Status in Felton
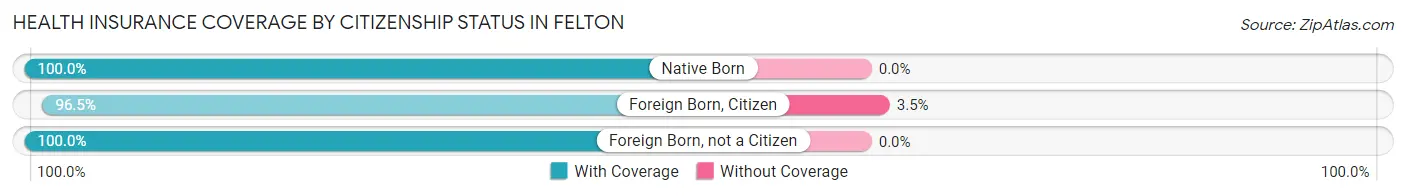
| Citizenship Status | With Coverage | Without Coverage |
| Native Born | 142 (100.0%) | 0 (0.0%) |
| Foreign Born, Citizen | 518 (96.5%) | 19 (3.5%) |
| Foreign Born, not a Citizen | 356 (100.0%) | 0 (0.0%) |
Health Insurance Coverage by Household Income in Felton
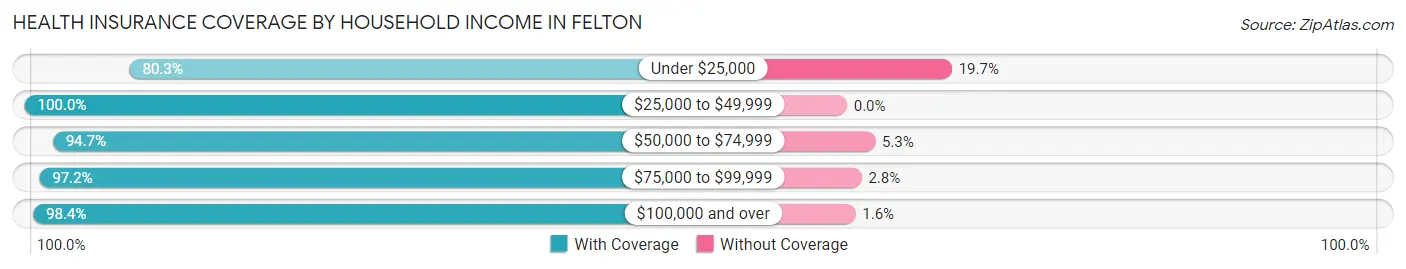
| Household Income | With Coverage | Without Coverage |
| Under $25,000 | 94 (80.3%) | 23 (19.7%) |
| $25,000 to $49,999 | 266 (100.0%) | 0 (0.0%) |
| $50,000 to $74,999 | 359 (94.7%) | 20 (5.3%) |
| $75,000 to $99,999 | 494 (97.2%) | 14 (2.8%) |
| $100,000 and over | 2,392 (98.4%) | 39 (1.6%) |
Public vs Private Health Insurance Coverage by Age in Felton
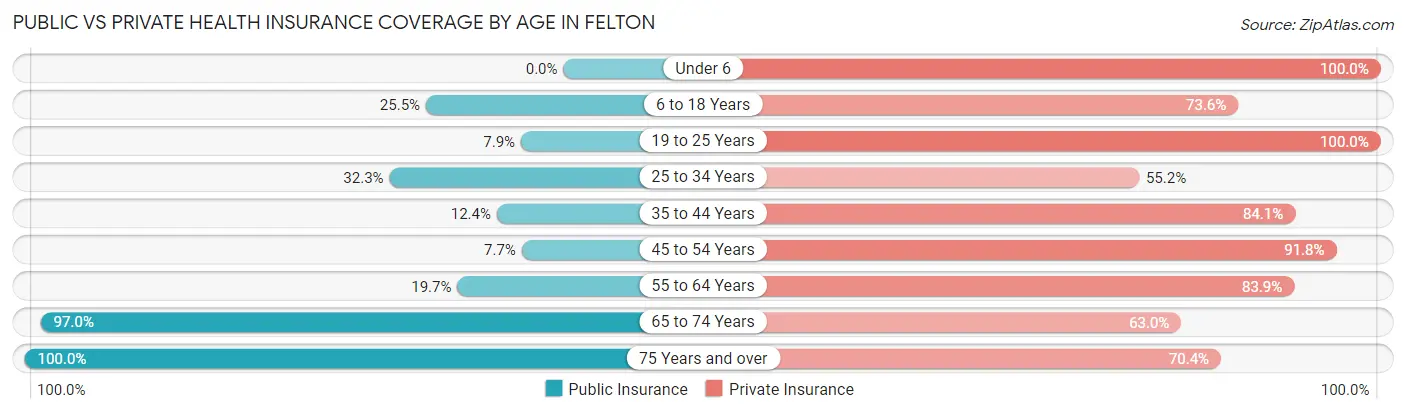
| Age Bracket | Public Insurance | Private Insurance |
| Under 6 | 0 (0.0%) | 142 (100.0%) |
| 6 to 18 Years | 137 (25.5%) | 395 (73.6%) |
| 19 to 25 Years | 28 (7.9%) | 356 (100.0%) |
| 25 to 34 Years | 72 (32.3%) | 123 (55.2%) |
| 35 to 44 Years | 70 (12.3%) | 477 (84.1%) |
| 45 to 54 Years | 47 (7.7%) | 558 (91.8%) |
| 55 to 64 Years | 98 (19.7%) | 418 (83.9%) |
| 65 to 74 Years | 590 (97.0%) | 383 (63.0%) |
| 75 Years and over | 162 (100.0%) | 114 (70.4%) |
| Total | 1,204 (32.5%) | 2,966 (80.1%) |
Disability Status by Sex by Age in Felton
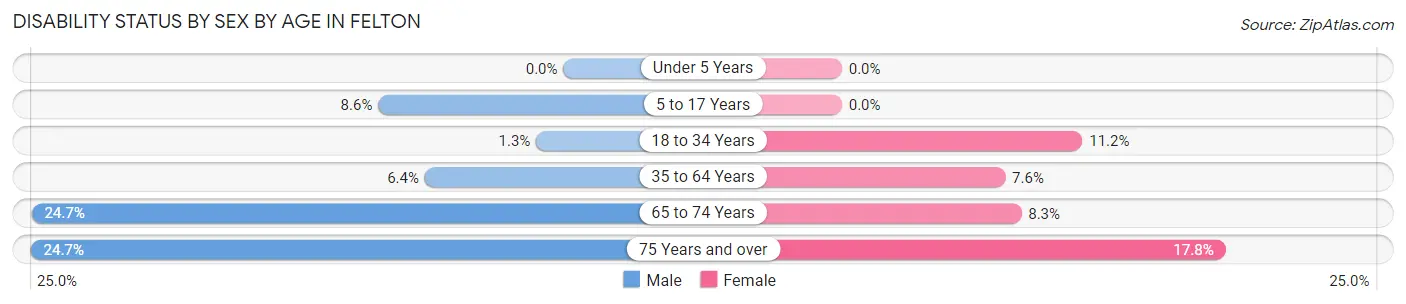
| Age Bracket | Male | Female |
| Under 5 Years | 0 (0.0%) | 0 (0.0%) |
| 5 to 17 Years | 14 (8.6%) | 0 (0.0%) |
| 18 to 34 Years | 6 (1.3%) | 28 (11.2%) |
| 35 to 64 Years | 55 (6.4%) | 62 (7.6%) |
| 65 to 74 Years | 76 (24.7%) | 25 (8.3%) |
| 75 Years and over | 22 (24.7%) | 13 (17.8%) |
Disability Class by Sex by Age in Felton
Disability Class: Hearing Difficulty
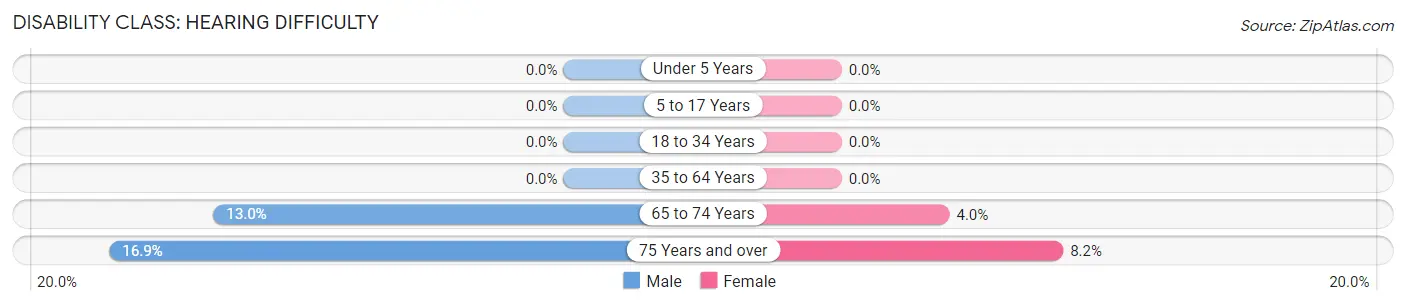
| Age Bracket | Male | Female |
| Under 5 Years | 0 (0.0%) | 0 (0.0%) |
| 5 to 17 Years | 0 (0.0%) | 0 (0.0%) |
| 18 to 34 Years | 0 (0.0%) | 0 (0.0%) |
| 35 to 64 Years | 0 (0.0%) | 0 (0.0%) |
| 65 to 74 Years | 40 (13.0%) | 12 (4.0%) |
| 75 Years and over | 15 (16.9%) | 6 (8.2%) |
Disability Class: Vision Difficulty
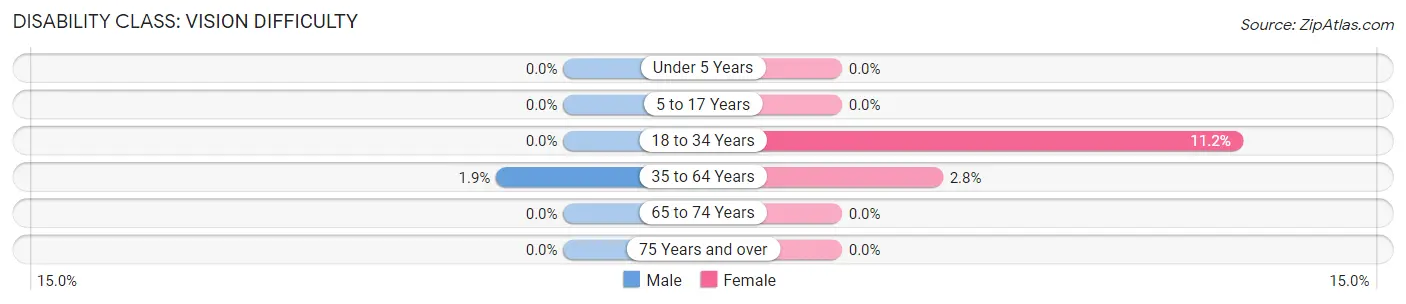
| Age Bracket | Male | Female |
| Under 5 Years | 0 (0.0%) | 0 (0.0%) |
| 5 to 17 Years | 0 (0.0%) | 0 (0.0%) |
| 18 to 34 Years | 0 (0.0%) | 28 (11.2%) |
| 35 to 64 Years | 16 (1.9%) | 23 (2.8%) |
| 65 to 74 Years | 0 (0.0%) | 0 (0.0%) |
| 75 Years and over | 0 (0.0%) | 0 (0.0%) |
Disability Class: Cognitive Difficulty
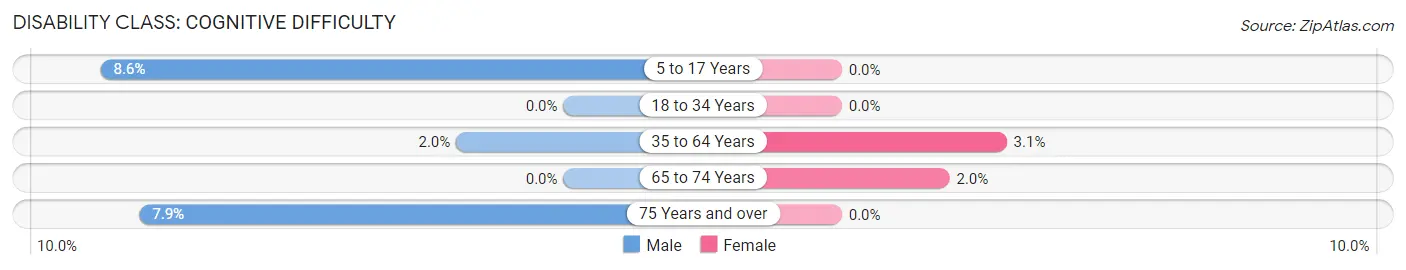
| Age Bracket | Male | Female |
| 5 to 17 Years | 14 (8.6%) | 0 (0.0%) |
| 18 to 34 Years | 0 (0.0%) | 0 (0.0%) |
| 35 to 64 Years | 17 (2.0%) | 25 (3.1%) |
| 65 to 74 Years | 0 (0.0%) | 6 (2.0%) |
| 75 Years and over | 7 (7.9%) | 0 (0.0%) |
Disability Class: Ambulatory Difficulty
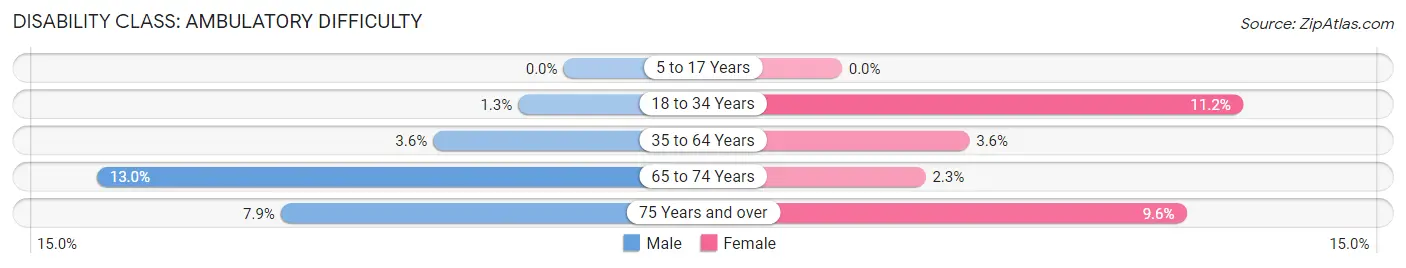
| Age Bracket | Male | Female |
| 5 to 17 Years | 0 (0.0%) | 0 (0.0%) |
| 18 to 34 Years | 6 (1.3%) | 28 (11.2%) |
| 35 to 64 Years | 31 (3.6%) | 29 (3.5%) |
| 65 to 74 Years | 40 (13.0%) | 7 (2.3%) |
| 75 Years and over | 7 (7.9%) | 7 (9.6%) |
Disability Class: Self-Care Difficulty
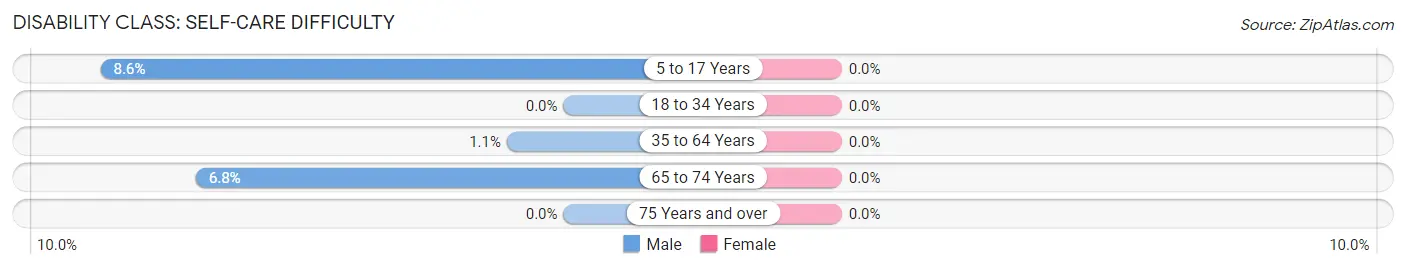
| Age Bracket | Male | Female |
| 5 to 17 Years | 14 (8.6%) | 0 (0.0%) |
| 18 to 34 Years | 0 (0.0%) | 0 (0.0%) |
| 35 to 64 Years | 9 (1.1%) | 0 (0.0%) |
| 65 to 74 Years | 21 (6.8%) | 0 (0.0%) |
| 75 Years and over | 0 (0.0%) | 0 (0.0%) |
Technology Access in Felton
Computing Device Access in Felton
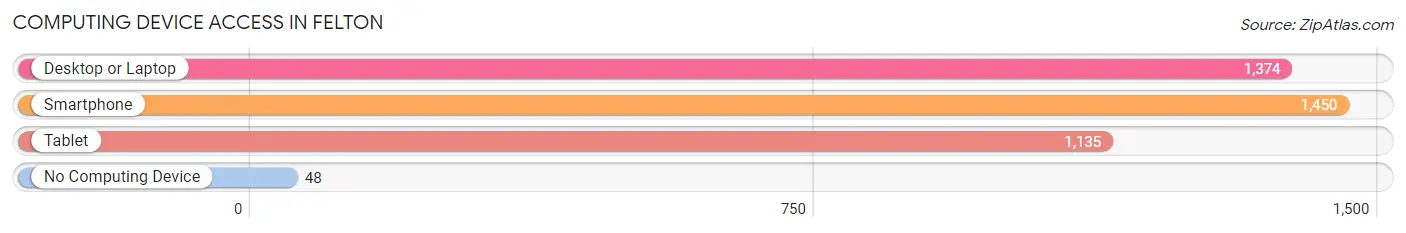
| Device Type | # Households | % Households |
| Desktop or Laptop | 1,374 | 88.1% |
| Smartphone | 1,450 | 92.9% |
| Tablet | 1,135 | 72.8% |
| No Computing Device | 48 | 3.1% |
| Total | 1,560 | 100.0% |
Internet Access in Felton
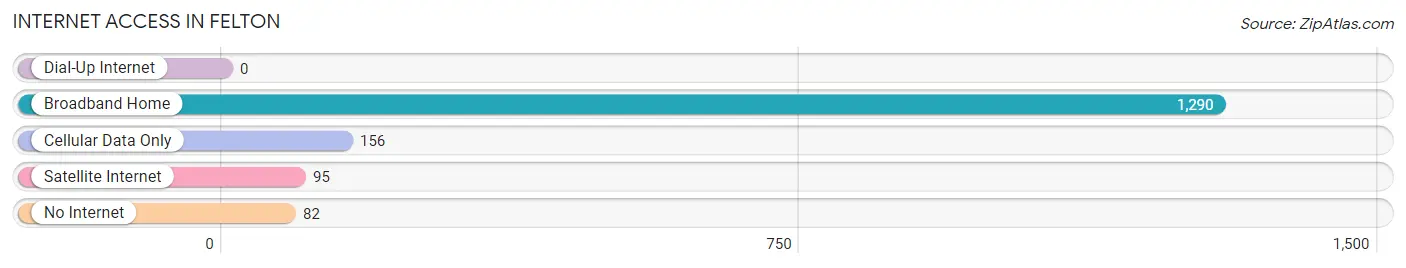
| Internet Type | # Households | % Households |
| Dial-Up Internet | 0 | 0.0% |
| Broadband Home | 1,290 | 82.7% |
| Cellular Data Only | 156 | 10.0% |
| Satellite Internet | 95 | 6.1% |
| No Internet | 82 | 5.3% |
| Total | 1,560 | 100.0% |
Felton Summary
Felton is a small unincorporated community located in Santa Cruz County, California. It is situated in the San Lorenzo Valley, about 8 miles (13 km) from the city of Santa Cruz. The population of Felton was 2,057 at the 2010 census.
History
Felton was founded in 1854 by James H. Felton, a former San Francisco banker. He purchased the land from the San Lorenzo Valley Water Company and built a sawmill and a flour mill. The town was named after him.
In the late 19th century, Felton was a popular tourist destination, with many hotels and resorts. It was also a popular stop for stagecoaches traveling between Santa Cruz and San Jose.
In the early 20th century, the town was home to a large lumber mill, which provided employment for many of the town's residents. The mill closed in the 1950s, and the town's economy shifted to tourism and small businesses.
Geography
Felton is located in the San Lorenzo Valley, about 8 miles (13 km) from the city of Santa Cruz. It is situated at an elevation of about 500 feet (152 m). The town is surrounded by redwood forests and is located near the San Lorenzo River.
The climate in Felton is mild, with temperatures ranging from the mid-50s to the mid-70s Fahrenheit (10-24 Celsius). The area receives an average of about 30 inches (76 cm) of rain per year.
Economy
The economy of Felton is largely based on tourism and small businesses. The town is home to several restaurants, cafes, and shops. It is also home to a number of bed and breakfasts, as well as a few small hotels.
The town is also home to a number of small businesses, including a lumber mill, a winery, and a brewery.
Demographics
As of the 2010 census, the population of Felton was 2,057. The racial makeup of the town was 87.3% White, 0.7% African American, 0.7% Native American, 4.2% Asian, 0.2% Pacific Islander, 3.3% from other races, and 3.8% from two or more races. Hispanic or Latino of any race were 8.3% of the population.
The median household income in Felton was $60,938, and the median family income was $71,250. The per capita income was $30,945. About 8.3% of families and 11.2% of the population were below the poverty line.
Common Questions
What is Per Capita Income in Felton?
Per Capita income in Felton is $60,792.
What is the Median Family Income in Felton?
Median Family Income in Felton is $123,036.
What is the Median Household income in Felton?
Median Household Income in Felton is $108,370.
What is Income or Wage Gap in Felton?
Income or Wage Gap in Felton is 16.8%.
Women in Felton earn 83.2 cents for every dollar earned by a man.
What is Inequality or Gini Index in Felton?
Inequality or Gini Index in Felton is 0.39.
What is the Total Population of Felton?
Total Population of Felton is 3,701.
What is the Total Male Population of Felton?
Total Male Population of Felton is 1,984.
What is the Total Female Population of Felton?
Total Female Population of Felton is 1,717.
What is the Ratio of Males per 100 Females in Felton?
There are 115.55 Males per 100 Females in Felton.
What is the Ratio of Females per 100 Males in Felton?
There are 86.54 Females per 100 Males in Felton.
What is the Median Population Age in Felton?
Median Population Age in Felton is 45.4 Years.
What is the Average Family Size in Felton
Average Family Size in Felton is 2.9 People.
What is the Average Household Size in Felton
Average Household Size in Felton is 2.4 People.
How Large is the Labor Force in Felton?
There are 2,136 People in the Labor Forcein in Felton.
What is the Percentage of People in the Labor Force in Felton?
66.3% of People are in the Labor Force in Felton.
What is the Unemployment Rate in Felton?
Unemployment Rate in Felton is 2.9%.