Butler, PA Map & Demographics
Butler Map
Butler Overview
$26,681
PER CAPITA INCOME
$67,529
AVG FAMILY INCOME
$39,546
AVG HOUSEHOLD INCOME
25.2%
WAGE / INCOME GAP [ % ]
74.8¢/ $1
WAGE / INCOME GAP [ $ ]
$9,709
FAMILY INCOME DEFICIT
0.47
INEQUALITY / GINI INDEX
13,387
TOTAL POPULATION
6,799
MALE POPULATION
6,588
FEMALE POPULATION
103.20
MALES / 100 FEMALES
96.90
FEMALES / 100 MALES
38.2
MEDIAN AGE
3.1
AVG FAMILY SIZE
2.1
AVG HOUSEHOLD SIZE
6,457
LABOR FORCE [ PEOPLE ]
59.0%
PERCENT IN LABOR FORCE
9.4%
UNEMPLOYMENT RATE
Income in Butler
Income Overview in Butler
Per Capita Income in Butler is $26,681, while median incomes of families and households are $67,529 and $39,546 respectively.
| Characteristic | Number | Measure |
| Per Capita Income | 13,387 | $26,681 |
| Median Family Income | 2,853 | $67,529 |
| Mean Family Income | 2,853 | $80,674 |
| Median Household Income | 6,177 | $39,546 |
| Mean Household Income | 6,177 | $56,690 |
| Income Deficit | 2,853 | $9,709 |
| Wage / Income Gap (%) | 13,387 | 25.18% |
| Wage / Income Gap ($) | 13,387 | 74.82¢ per $1 |
| Gini / Inequality Index | 13,387 | 0.47 |
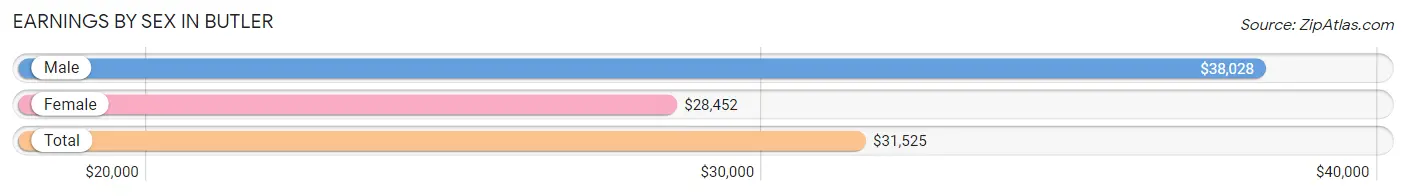
Earnings by Sex in Butler
Average Earnings in Butler are $31,525, $38,028 for men and $28,452 for women, a difference of 25.2%.
| Sex | Number | Average Earnings |
| Male | 3,499 (51.4%) | $38,028 |
| Female | 3,314 (48.6%) | $28,452 |
| Total | 6,813 (100.0%) | $31,525 |
Earnings by Sex by Income Bracket in Butler
The most common earnings brackets in Butler are $75,000 to $99,999 for men (356 | 10.2%) and $25,000 to $29,999 for women (562 | 17.0%).
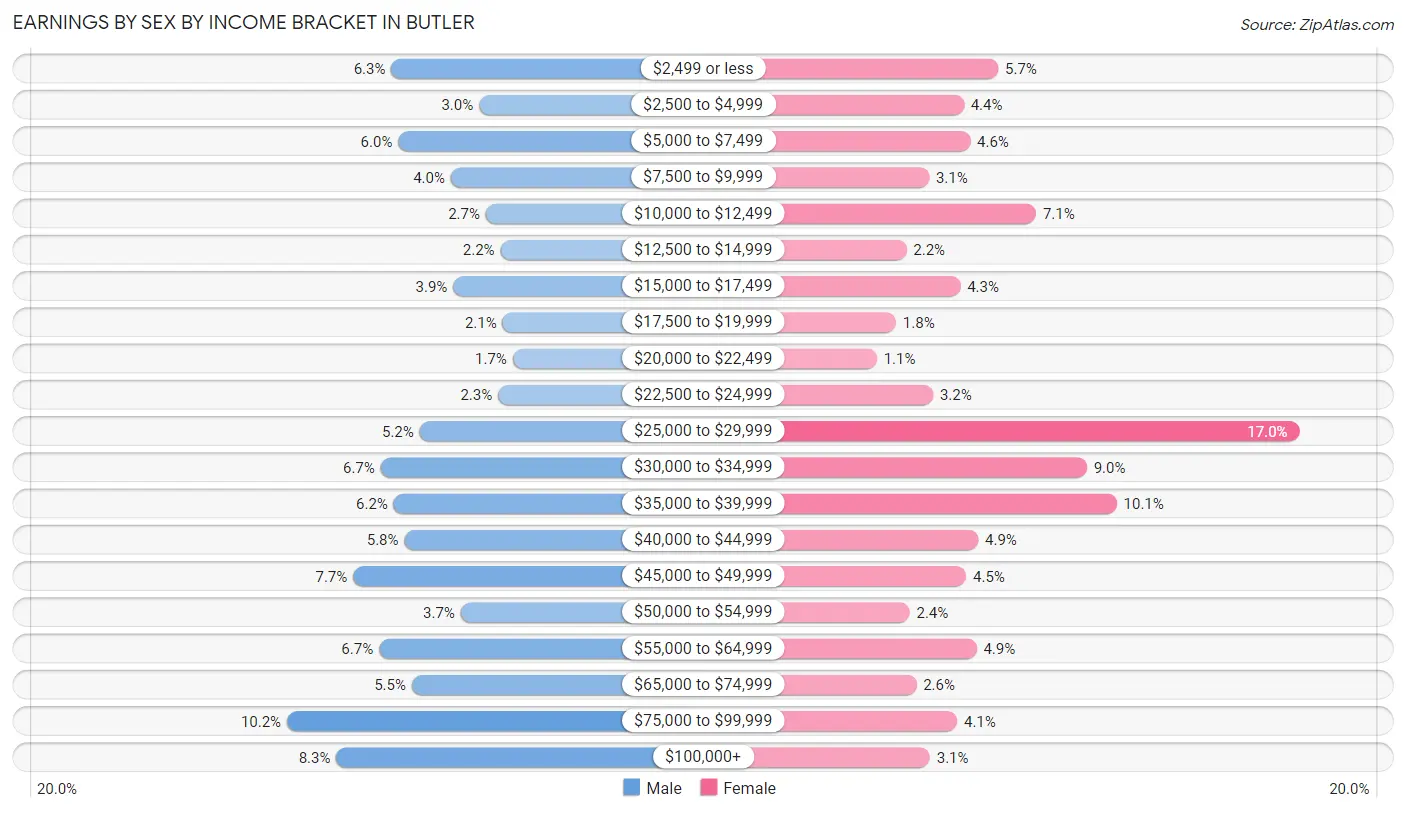
| Income | Male | Female |
| $2,499 or less | 219 (6.3%) | 188 (5.7%) |
| $2,500 to $4,999 | 104 (3.0%) | 145 (4.4%) |
| $5,000 to $7,499 | 210 (6.0%) | 153 (4.6%) |
| $7,500 to $9,999 | 141 (4.0%) | 102 (3.1%) |
| $10,000 to $12,499 | 95 (2.7%) | 235 (7.1%) |
| $12,500 to $14,999 | 76 (2.2%) | 74 (2.2%) |
| $15,000 to $17,499 | 138 (3.9%) | 141 (4.3%) |
| $17,500 to $19,999 | 73 (2.1%) | 61 (1.8%) |
| $20,000 to $22,499 | 60 (1.7%) | 37 (1.1%) |
| $22,500 to $24,999 | 79 (2.3%) | 107 (3.2%) |
| $25,000 to $29,999 | 182 (5.2%) | 562 (17.0%) |
| $30,000 to $34,999 | 233 (6.7%) | 298 (9.0%) |
| $35,000 to $39,999 | 216 (6.2%) | 335 (10.1%) |
| $40,000 to $44,999 | 202 (5.8%) | 163 (4.9%) |
| $45,000 to $49,999 | 269 (7.7%) | 148 (4.5%) |
| $50,000 to $54,999 | 128 (3.7%) | 78 (2.4%) |
| $55,000 to $64,999 | 235 (6.7%) | 161 (4.9%) |
| $65,000 to $74,999 | 192 (5.5%) | 86 (2.6%) |
| $75,000 to $99,999 | 356 (10.2%) | 137 (4.1%) |
| $100,000+ | 291 (8.3%) | 103 (3.1%) |
| Total | 3,499 (100.0%) | 3,314 (100.0%) |
Earnings by Sex by Educational Attainment in Butler
Average earnings in Butler are $43,833 for men and $31,100 for women, a difference of 29.0%. Men with an educational attainment of bachelor's degree enjoy the highest average annual earnings of $70,688, while those with high school diploma education earn the least with $31,957. Women with an educational attainment of graduate degree earn the most with the average annual earnings of $63,036, while those with less than high school education have the smallest earnings of $19,048.
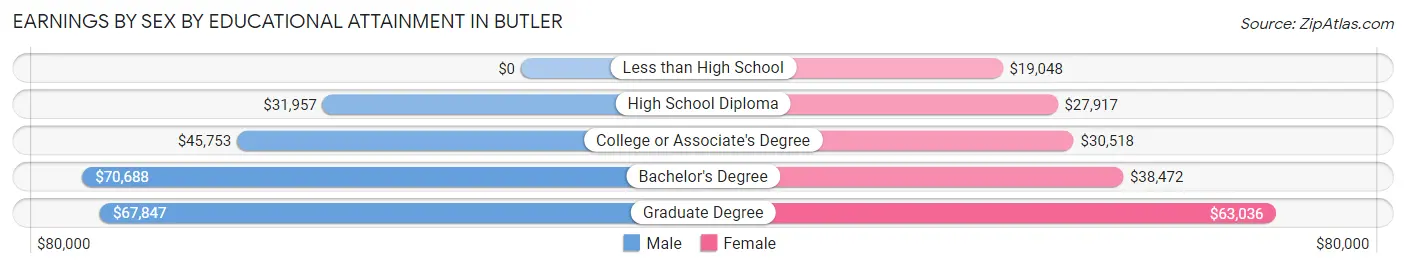
| Educational Attainment | Male Income | Female Income |
| Less than High School | - | - |
| High School Diploma | $31,957 | $27,917 |
| College or Associate's Degree | $45,753 | $30,518 |
| Bachelor's Degree | $70,688 | $38,472 |
| Graduate Degree | $67,847 | $63,036 |
| Total | $43,833 | $31,100 |
Family Income in Butler
Family Income Brackets in Butler
According to the Butler family income data, there are 628 families falling into the $50,000 to $74,999 income range, which is the most common income bracket and makes up 22.0% of all families. Conversely, the less than $10,000 income bracket is the least frequent group with only 111 families (3.9%) belonging to this category.
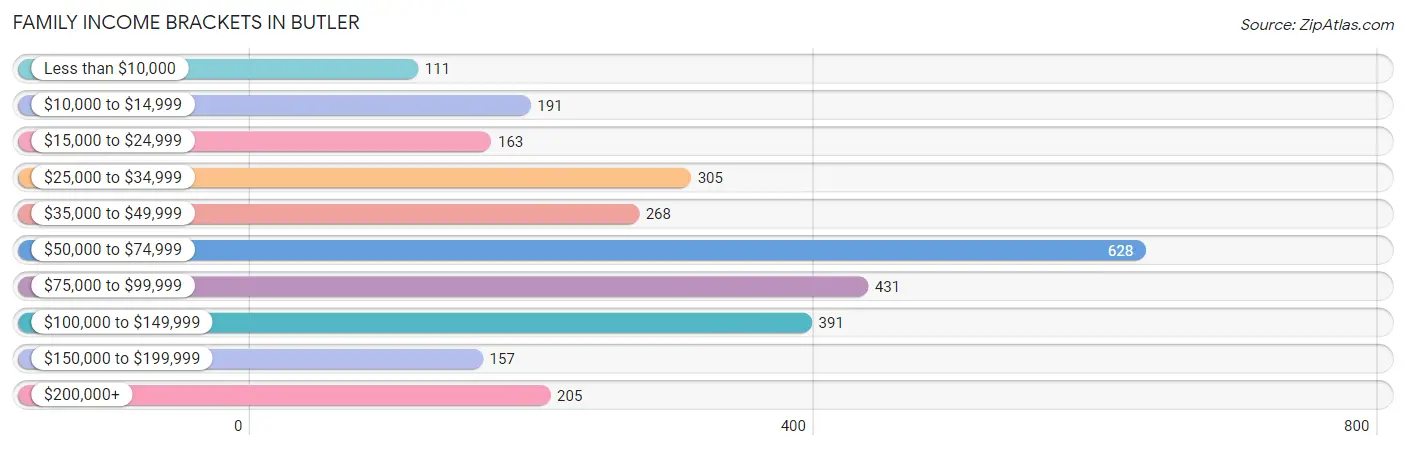
| Income Bracket | # Families | % Families |
| Less than $10,000 | 111 | 3.9% |
| $10,000 to $14,999 | 191 | 6.7% |
| $15,000 to $24,999 | 163 | 5.7% |
| $25,000 to $34,999 | 305 | 10.7% |
| $35,000 to $49,999 | 268 | 9.4% |
| $50,000 to $74,999 | 628 | 22.0% |
| $75,000 to $99,999 | 431 | 15.1% |
| $100,000 to $149,999 | 391 | 13.7% |
| $150,000 to $199,999 | 157 | 5.5% |
| $200,000+ | 205 | 7.2% |
Family Income by Famaliy Size in Butler
6-person families (155 | 5.4%) account for the highest median family income in Butler with $89,261 per family, while 2-person families (1,360 | 47.7%) have the highest median income of $32,898 per family member.
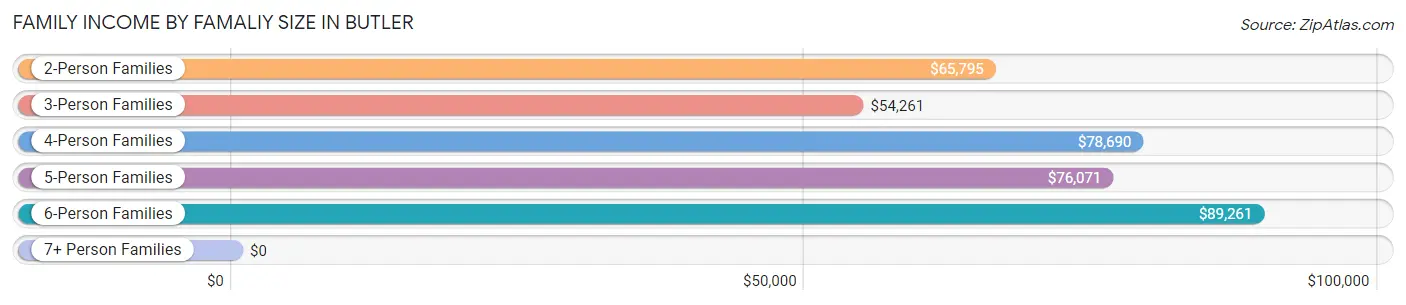
| Income Bracket | # Families | Median Income |
| 2-Person Families | 1,360 (47.7%) | $65,795 |
| 3-Person Families | 743 (26.0%) | $54,261 |
| 4-Person Families | 452 (15.8%) | $78,690 |
| 5-Person Families | 118 (4.1%) | $76,071 |
| 6-Person Families | 155 (5.4%) | $89,261 |
| 7+ Person Families | 25 (0.9%) | $0 |
| Total | 2,853 (100.0%) | $67,529 |
Family Income by Number of Earners in Butler
The median family income in Butler is $67,529, with families comprising 3+ earners (372) having the highest median family income of $102,778, while families with no earners (528) have the lowest median family income of $30,104, accounting for 13.0% and 18.5% of families, respectively.
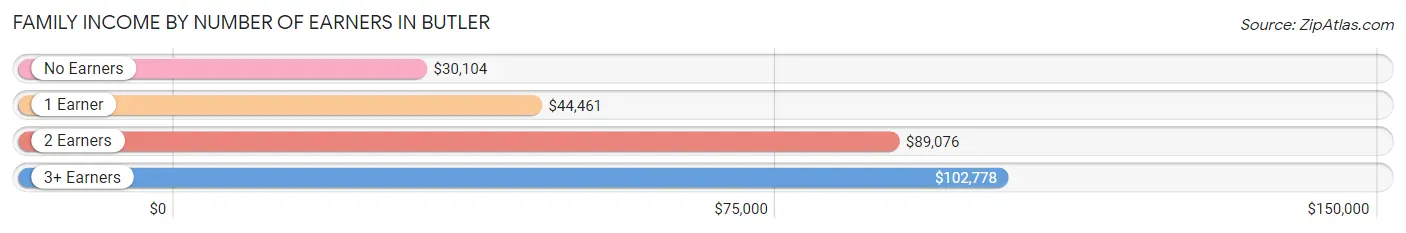
| Number of Earners | # Families | Median Income |
| No Earners | 528 (18.5%) | $30,104 |
| 1 Earner | 984 (34.5%) | $44,461 |
| 2 Earners | 969 (34.0%) | $89,076 |
| 3+ Earners | 372 (13.0%) | $102,778 |
| Total | 2,853 (100.0%) | $67,529 |
Household Income in Butler
Household Income Brackets in Butler
With 1,106 households falling in the category, the $50,000 to $74,999 income range is the most frequent in Butler, accounting for 17.9% of all households. In contrast, only 185 households (3.0%) fall into the $150,000 to $199,999 income bracket, making it the least populous group.
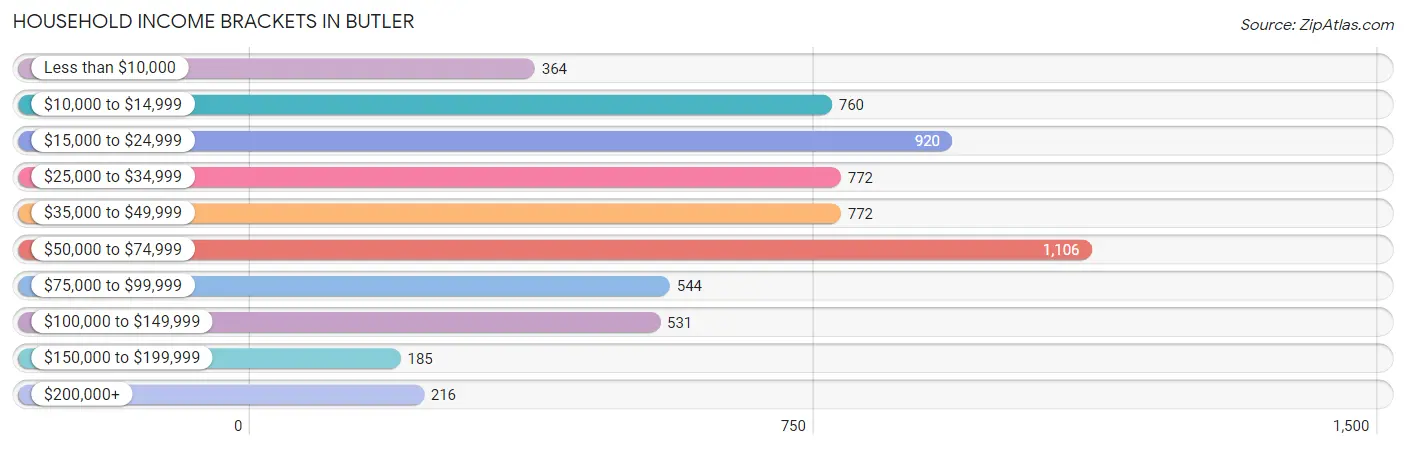
| Income Bracket | # Households | % Households |
| Less than $10,000 | 364 | 5.9% |
| $10,000 to $14,999 | 760 | 12.3% |
| $15,000 to $24,999 | 920 | 14.9% |
| $25,000 to $34,999 | 772 | 12.5% |
| $35,000 to $49,999 | 772 | 12.5% |
| $50,000 to $74,999 | 1,106 | 17.9% |
| $75,000 to $99,999 | 544 | 8.8% |
| $100,000 to $149,999 | 531 | 8.6% |
| $150,000 to $199,999 | 185 | 3.0% |
| $200,000+ | 216 | 3.5% |
Household Income by Householder Age in Butler
The median household income in Butler is $39,546, with the highest median household income of $45,484 found in the 25 to 44 years age bracket for the primary householder. A total of 1,658 households (26.8%) fall into this category. Meanwhile, the 15 to 24 years age bracket for the primary householder has the lowest median household income of $30,991, with 375 households (6.1%) in this group.
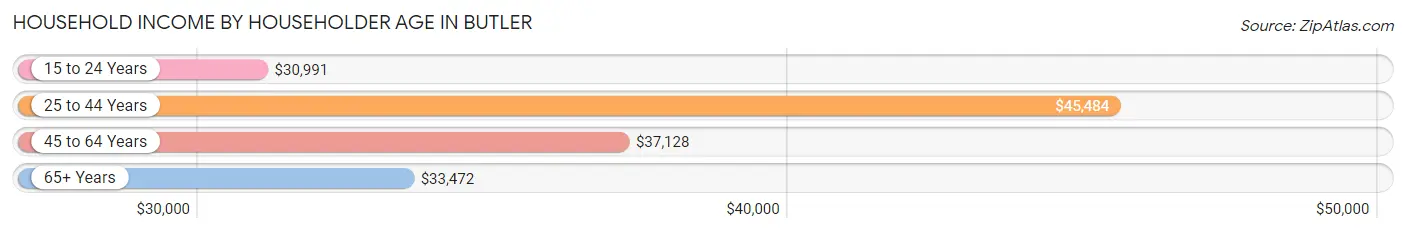
| Income Bracket | # Households | Median Income |
| 15 to 24 Years | 375 (6.1%) | $30,991 |
| 25 to 44 Years | 1,658 (26.8%) | $45,484 |
| 45 to 64 Years | 2,825 (45.7%) | $37,128 |
| 65+ Years | 1,319 (21.3%) | $33,472 |
| Total | 6,177 (100.0%) | $39,546 |
Poverty in Butler
Income Below Poverty by Sex and Age in Butler
With 19.6% poverty level for males and 23.9% for females among the residents of Butler, 5 year old males and 18 to 24 year old females are the most vulnerable to poverty, with 36 males (45.6%) and 251 females (43.7%) in their respective age groups living below the poverty level.
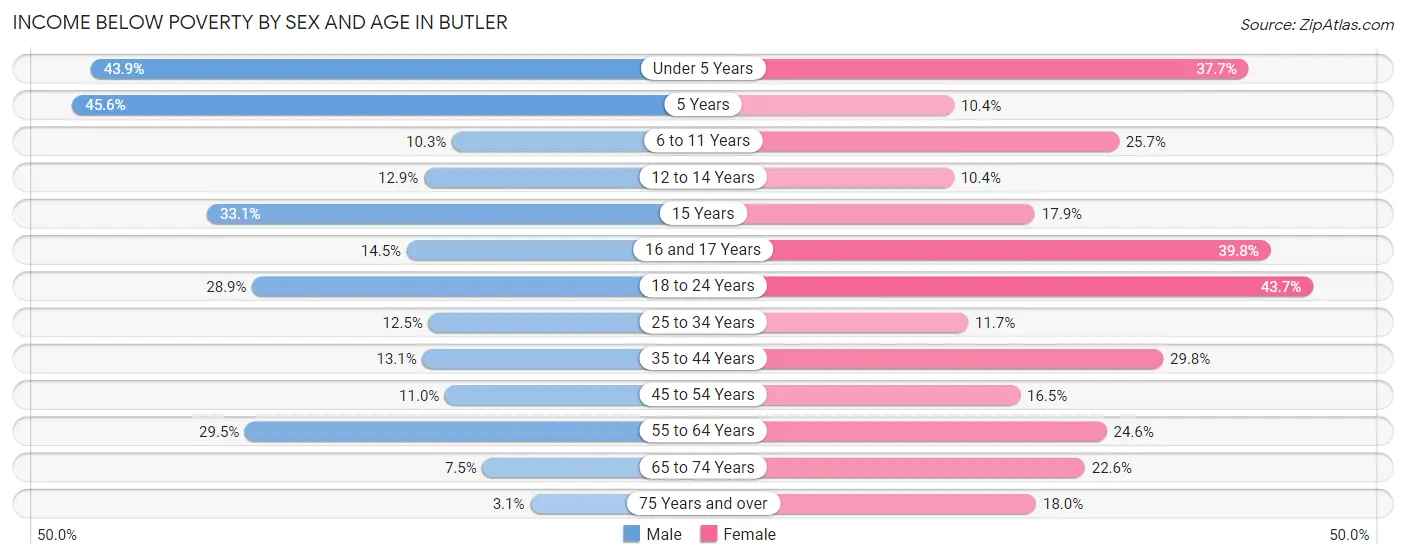
| Age Bracket | Male | Female |
| Under 5 Years | 139 (43.9%) | 157 (37.7%) |
| 5 Years | 36 (45.6%) | 10 (10.4%) |
| 6 to 11 Years | 36 (10.3%) | 129 (25.7%) |
| 12 to 14 Years | 38 (12.9%) | 16 (10.4%) |
| 15 Years | 40 (33.1%) | 19 (17.9%) |
| 16 and 17 Years | 18 (14.5%) | 39 (39.8%) |
| 18 to 24 Years | 258 (28.9%) | 251 (43.7%) |
| 25 to 34 Years | 112 (12.5%) | 109 (11.7%) |
| 35 to 44 Years | 78 (13.1%) | 249 (29.8%) |
| 45 to 54 Years | 96 (11.0%) | 149 (16.5%) |
| 55 to 64 Years | 391 (29.5%) | 215 (24.6%) |
| 65 to 74 Years | 39 (7.5%) | 129 (22.6%) |
| 75 Years and over | 5 (3.1%) | 77 (18.0%) |
| Total | 1,286 (19.6%) | 1,549 (23.9%) |
Income Above Poverty by Sex and Age in Butler
According to the poverty statistics in Butler, males aged 75 years and over and females aged 12 to 14 years are the age groups that are most secure financially, with 96.9% of males and 89.6% of females in these age groups living above the poverty line.
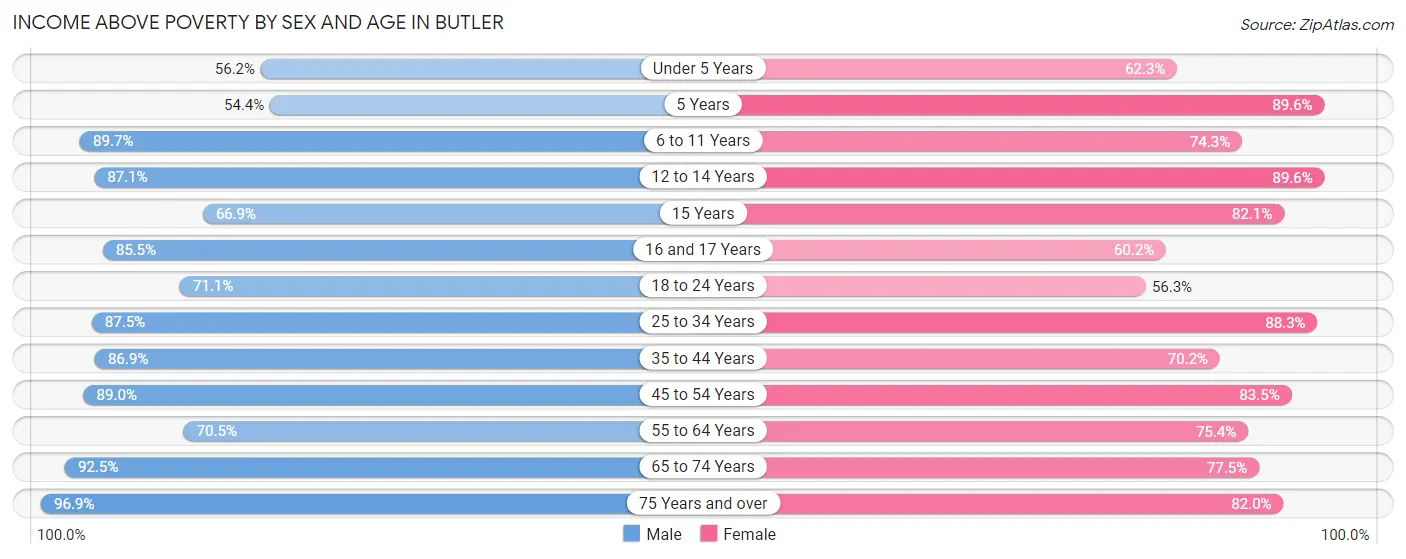
| Age Bracket | Male | Female |
| Under 5 Years | 178 (56.1%) | 259 (62.3%) |
| 5 Years | 43 (54.4%) | 86 (89.6%) |
| 6 to 11 Years | 313 (89.7%) | 373 (74.3%) |
| 12 to 14 Years | 256 (87.1%) | 138 (89.6%) |
| 15 Years | 81 (66.9%) | 87 (82.1%) |
| 16 and 17 Years | 106 (85.5%) | 59 (60.2%) |
| 18 to 24 Years | 636 (71.1%) | 323 (56.3%) |
| 25 to 34 Years | 784 (87.5%) | 821 (88.3%) |
| 35 to 44 Years | 519 (86.9%) | 586 (70.2%) |
| 45 to 54 Years | 779 (89.0%) | 752 (83.5%) |
| 55 to 64 Years | 933 (70.5%) | 660 (75.4%) |
| 65 to 74 Years | 481 (92.5%) | 443 (77.4%) |
| 75 Years and over | 158 (96.9%) | 350 (82.0%) |
| Total | 5,267 (80.4%) | 4,937 (76.1%) |
Income Below Poverty Among Married-Couple Families in Butler
The poverty statistics for married-couple families in Butler show that 2.7% or 45 of the total 1,671 families live below the poverty line. Families with 3 or 4 children have the highest poverty rate of 9.2%, comprising of 23 families. On the other hand, families with 5 or more children have the lowest poverty rate of 0.0%, which includes 0 families.
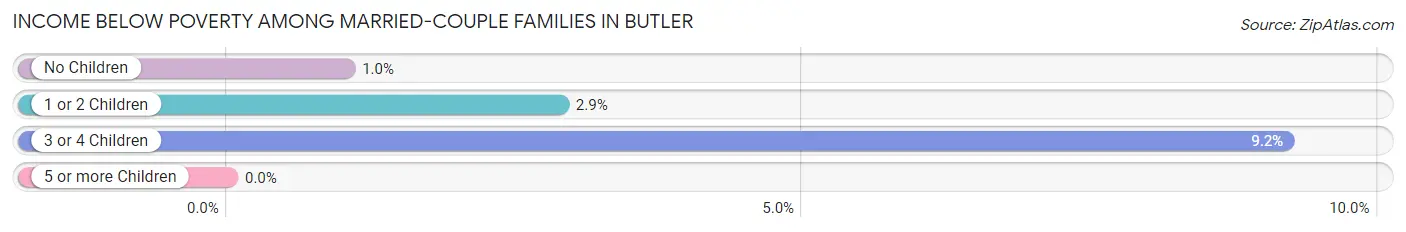
| Children | Above Poverty | Below Poverty |
| No Children | 969 (99.0%) | 10 (1.0%) |
| 1 or 2 Children | 405 (97.1%) | 12 (2.9%) |
| 3 or 4 Children | 227 (90.8%) | 23 (9.2%) |
| 5 or more Children | 25 (100.0%) | 0 (0.0%) |
| Total | 1,626 (97.3%) | 45 (2.7%) |
Income Below Poverty Among Single-Parent Households in Butler
According to the poverty data in Butler, 34.7% or 135 single-father households and 30.5% or 242 single-mother households are living below the poverty line. Among single-father households, those with 1 or 2 children have the highest poverty rate, with 97 households (53.0%) experiencing poverty. Likewise, among single-mother households, those with 3 or 4 children have the highest poverty rate, with 36 households (80.0%) falling below the poverty line.
| Children | Single Father | Single Mother |
| No Children | 38 (18.8%) | 55 (19.1%) |
| 1 or 2 Children | 97 (53.0%) | 151 (32.8%) |
| 3 or 4 Children | 0 (0.0%) | 36 (80.0%) |
| 5 or more Children | 0 (0.0%) | 0 (0.0%) |
| Total | 135 (34.7%) | 242 (30.5%) |
Income Below Poverty Among Married-Couple vs Single-Parent Households in Butler
The poverty data for Butler shows that 45 of the married-couple family households (2.7%) and 377 of the single-parent households (31.9%) are living below the poverty level. Within the married-couple family households, those with 3 or 4 children have the highest poverty rate, with 23 households (9.2%) falling below the poverty line. Among the single-parent households, those with 3 or 4 children have the highest poverty rate, with 36 household (73.5%) living below poverty.
| Children | Married-Couple Families | Single-Parent Households |
| No Children | 10 (1.0%) | 93 (19.0%) |
| 1 or 2 Children | 12 (2.9%) | 248 (38.6%) |
| 3 or 4 Children | 23 (9.2%) | 36 (73.5%) |
| 5 or more Children | 0 (0.0%) | 0 (0.0%) |
| Total | 45 (2.7%) | 377 (31.9%) |
Race in Butler
The most populous races in Butler are White / Caucasian (12,005 | 89.7%), Two or more Races (718 | 5.4%), and Hispanic or Latino (382 | 2.9%).
| Race | # Population | % Population |
| Asian | 67 | 0.5% |
| Black / African American | 356 | 2.7% |
| Hawaiian / Pacific | 0 | 0.0% |
| Hispanic or Latino | 382 | 2.9% |
| Native / Alaskan | 0 | 0.0% |
| White / Caucasian | 12,005 | 89.7% |
| Two or more Races | 718 | 5.4% |
| Some other Race | 241 | 1.8% |
| Total | 13,387 | 100.0% |
Ancestry in Butler
The most populous ancestries reported in Butler are German (4,531 | 33.9%), Irish (2,904 | 21.7%), Italian (2,161 | 16.1%), English (1,177 | 8.8%), and Polish (707 | 5.3%), together accounting for 85.7% of all Butler residents.
| Ancestry | # Population | % Population |
| African | 83 | 0.6% |
| American | 561 | 4.2% |
| Arab | 11 | 0.1% |
| Austrian | 44 | 0.3% |
| Belgian | 16 | 0.1% |
| Bhutanese | 16 | 0.1% |
| Blackfeet | 9 | 0.1% |
| Bulgarian | 10 | 0.1% |
| Canadian | 43 | 0.3% |
| Central American | 66 | 0.5% |
| Cherokee | 19 | 0.1% |
| Colombian | 6 | 0.0% |
| Croatian | 169 | 1.3% |
| Cuban | 2 | 0.0% |
| Czech | 32 | 0.2% |
| Czechoslovakian | 23 | 0.2% |
| Danish | 6 | 0.0% |
| Dominican | 102 | 0.8% |
| Dutch | 151 | 1.1% |
| Eastern European | 9 | 0.1% |
| Ecuadorian | 10 | 0.1% |
| English | 1,177 | 8.8% |
| European | 60 | 0.4% |
| Finnish | 11 | 0.1% |
| French | 204 | 1.5% |
| French Canadian | 9 | 0.1% |
| German | 4,531 | 33.9% |
| Greek | 107 | 0.8% |
| Honduran | 17 | 0.1% |
| Hungarian | 139 | 1.0% |
| Indian (Asian) | 22 | 0.2% |
| Irish | 2,904 | 21.7% |
| Iroquois | 23 | 0.2% |
| Italian | 2,161 | 16.1% |
| Jamaican | 10 | 0.1% |
| Korean | 58 | 0.4% |
| Lebanese | 11 | 0.1% |
| Lithuanian | 17 | 0.1% |
| Luxembourger | 34 | 0.3% |
| Mexican | 164 | 1.2% |
| Mongolian | 42 | 0.3% |
| Norwegian | 55 | 0.4% |
| Polish | 707 | 5.3% |
| Puerto Rican | 15 | 0.1% |
| Romanian | 13 | 0.1% |
| Russian | 159 | 1.2% |
| Salvadoran | 49 | 0.4% |
| Samoan | 10 | 0.1% |
| Scandinavian | 105 | 0.8% |
| Scotch-Irish | 305 | 2.3% |
| Scottish | 457 | 3.4% |
| Serbian | 32 | 0.2% |
| Slavic | 32 | 0.2% |
| Slovak | 352 | 2.6% |
| Slovene | 18 | 0.1% |
| South American | 16 | 0.1% |
| Spaniard | 13 | 0.1% |
| Subsaharan African | 83 | 0.6% |
| Swedish | 107 | 0.8% |
| Swiss | 11 | 0.1% |
| Thai | 34 | 0.3% |
| Ukrainian | 151 | 1.1% |
| Welsh | 35 | 0.3% |
| Yugoslavian | 6 | 0.0% | View All 64 Rows |
Immigrants in Butler
The most numerous immigrant groups reported in Butler came from Asia (103 | 0.8%), Europe (71 | 0.5%), Canada (56 | 0.4%), South Eastern Asia (47 | 0.4%), and Latin America (45 | 0.3%), together accounting for 2.4% of all Butler residents.
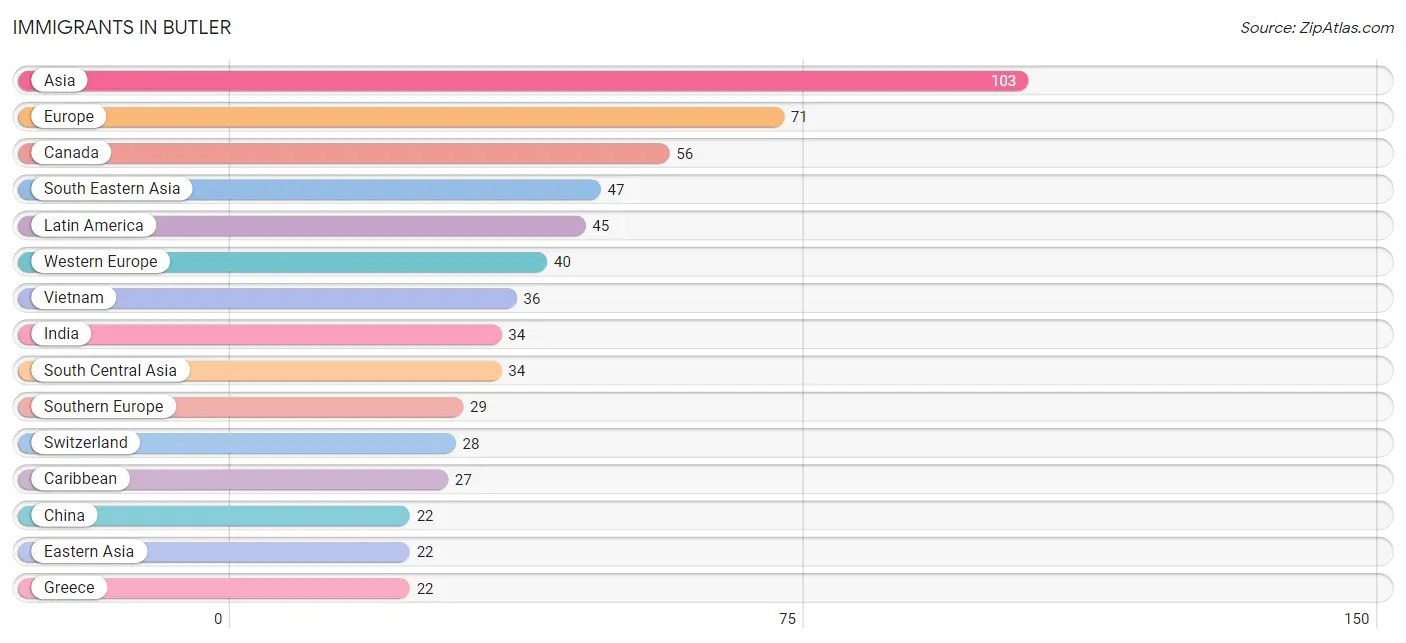
| Immigration Origin | # Population | % Population |
| Asia | 103 | 0.8% |
| Australia | 9 | 0.1% |
| Canada | 56 | 0.4% |
| Caribbean | 27 | 0.2% |
| Central America | 18 | 0.1% |
| China | 22 | 0.2% |
| Dominican Republic | 19 | 0.1% |
| Eastern Asia | 22 | 0.2% |
| Europe | 71 | 0.5% |
| Germany | 12 | 0.1% |
| Greece | 22 | 0.2% |
| Guatemala | 13 | 0.1% |
| India | 34 | 0.3% |
| Ireland | 2 | 0.0% |
| Italy | 7 | 0.1% |
| Jamaica | 8 | 0.1% |
| Latin America | 45 | 0.3% |
| Malaysia | 11 | 0.1% |
| Mexico | 5 | 0.0% |
| Northern Europe | 2 | 0.0% |
| Oceania | 9 | 0.1% |
| South Central Asia | 34 | 0.3% |
| South Eastern Asia | 47 | 0.4% |
| Southern Europe | 29 | 0.2% |
| Switzerland | 28 | 0.2% |
| Vietnam | 36 | 0.3% |
| Western Europe | 40 | 0.3% | View All 27 Rows |
Sex and Age in Butler
Sex and Age in Butler
The most populous age groups in Butler are 55 to 59 Years (734 | 10.8%) for men and 25 to 29 Years (631 | 9.6%) for women.
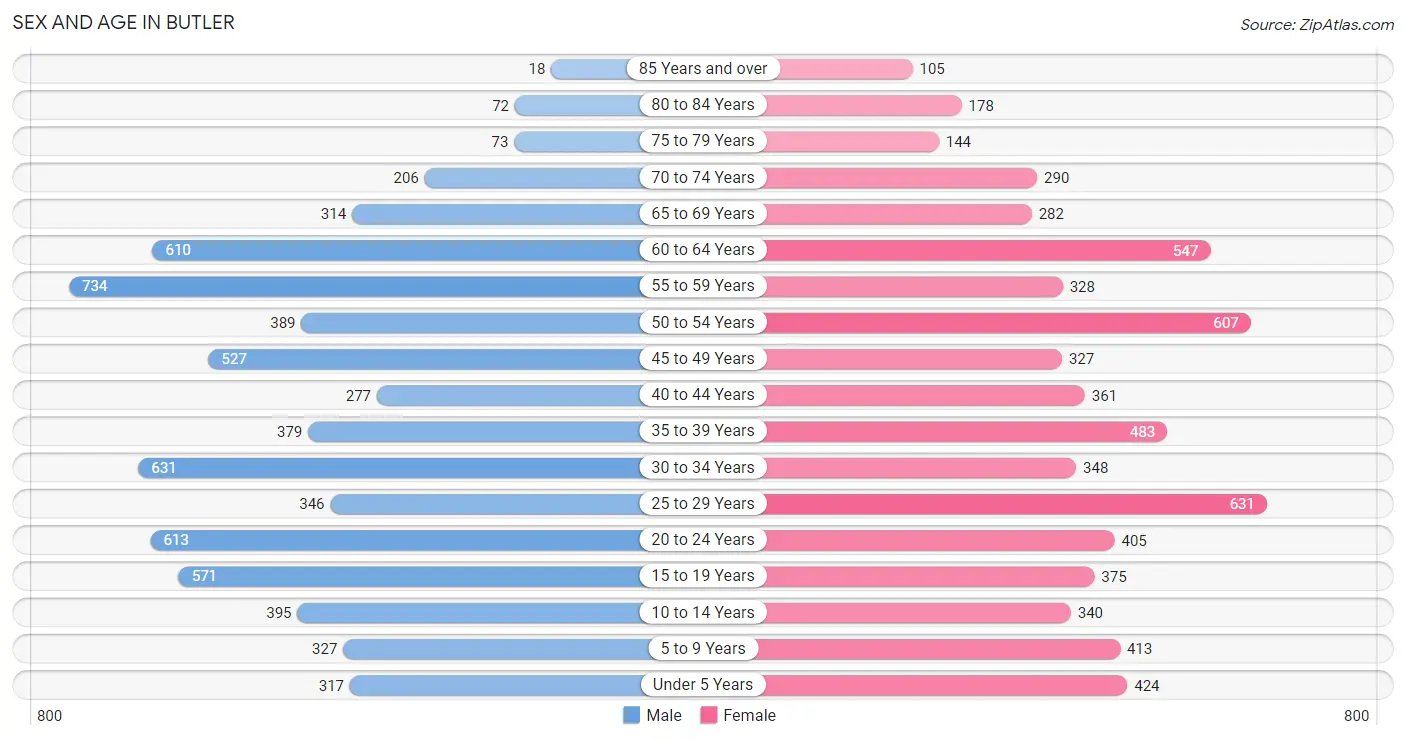
| Age Bracket | Male | Female |
| Under 5 Years | 317 (4.7%) | 424 (6.4%) |
| 5 to 9 Years | 327 (4.8%) | 413 (6.3%) |
| 10 to 14 Years | 395 (5.8%) | 340 (5.2%) |
| 15 to 19 Years | 571 (8.4%) | 375 (5.7%) |
| 20 to 24 Years | 613 (9.0%) | 405 (6.1%) |
| 25 to 29 Years | 346 (5.1%) | 631 (9.6%) |
| 30 to 34 Years | 631 (9.3%) | 348 (5.3%) |
| 35 to 39 Years | 379 (5.6%) | 483 (7.3%) |
| 40 to 44 Years | 277 (4.1%) | 361 (5.5%) |
| 45 to 49 Years | 527 (7.7%) | 327 (5.0%) |
| 50 to 54 Years | 389 (5.7%) | 607 (9.2%) |
| 55 to 59 Years | 734 (10.8%) | 328 (5.0%) |
| 60 to 64 Years | 610 (9.0%) | 547 (8.3%) |
| 65 to 69 Years | 314 (4.6%) | 282 (4.3%) |
| 70 to 74 Years | 206 (3.0%) | 290 (4.4%) |
| 75 to 79 Years | 73 (1.1%) | 144 (2.2%) |
| 80 to 84 Years | 72 (1.1%) | 178 (2.7%) |
| 85 Years and over | 18 (0.3%) | 105 (1.6%) |
| Total | 6,799 (100.0%) | 6,588 (100.0%) |
Families and Households in Butler
Median Family Size in Butler
The median family size in Butler is 3.07 persons per family, with married-couple families (1,671 | 58.6%) accounting for the largest median family size of 3.28 persons per family. On the other hand, single male/father families (389 | 13.6%) represent the smallest median family size with 2.70 persons per family.
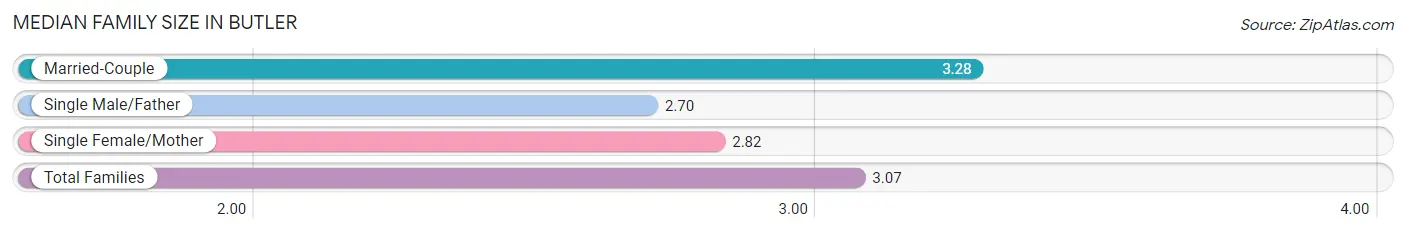
| Family Type | # Families | Family Size |
| Married-Couple | 1,671 (58.6%) | 3.28 |
| Single Male/Father | 389 (13.6%) | 2.70 |
| Single Female/Mother | 793 (27.8%) | 2.82 |
| Total Families | 2,853 (100.0%) | 3.07 |
Median Household Size in Butler
The median household size in Butler is 2.10 persons per household, with married-couple households (1,671 | 27.1%) accounting for the largest median household size of 3.28 persons per household. non-family households (3,324 | 53.8%) represent the smallest median household size with 1.18 persons per household.
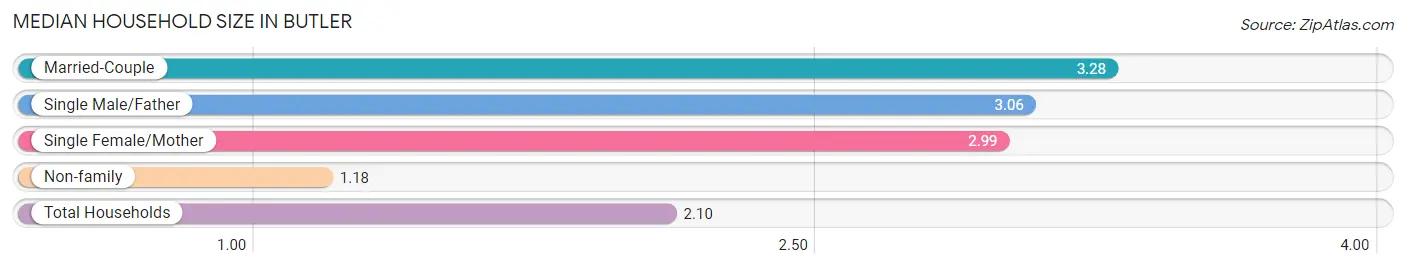
| Household Type | # Households | Household Size |
| Married-Couple | 1,671 (27.1%) | 3.28 |
| Single Male/Father | 389 (6.3%) | 3.06 |
| Single Female/Mother | 793 (12.8%) | 2.99 |
| Non-family | 3,324 (53.8%) | 1.18 |
| Total Households | 6,177 (100.0%) | 2.10 |
Household Size by Marriage Status in Butler
Out of a total of 6,177 households in Butler, 2,853 (46.2%) are family households, while 3,324 (53.8%) are nonfamily households. The most numerous type of family households are 2-person households, comprising 1,255, and the most common type of nonfamily households are 1-person households, comprising 2,771.
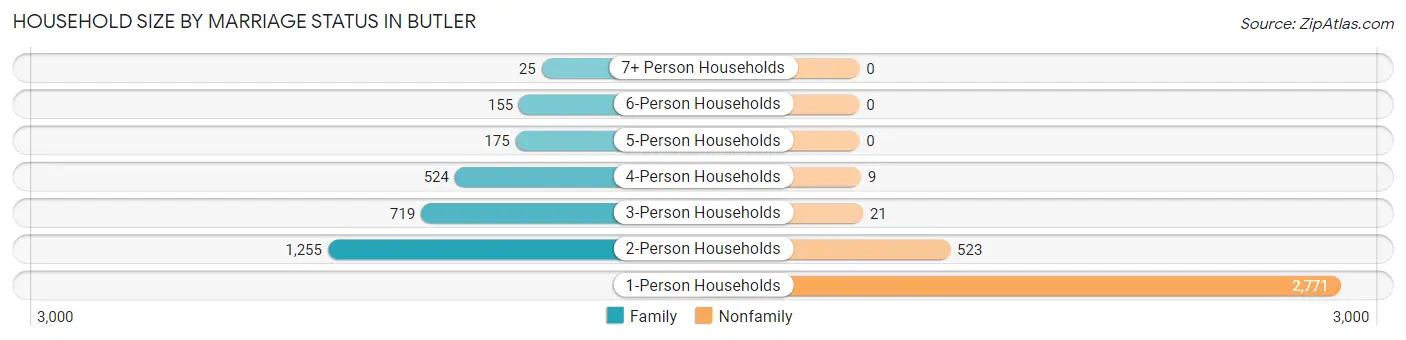
| Household Size | Family Households | Nonfamily Households |
| 1-Person Households | - | 2,771 (44.9%) |
| 2-Person Households | 1,255 (20.3%) | 523 (8.5%) |
| 3-Person Households | 719 (11.6%) | 21 (0.3%) |
| 4-Person Households | 524 (8.5%) | 9 (0.2%) |
| 5-Person Households | 175 (2.8%) | 0 (0.0%) |
| 6-Person Households | 155 (2.5%) | 0 (0.0%) |
| 7+ Person Households | 25 (0.4%) | 0 (0.0%) |
| Total | 2,853 (46.2%) | 3,324 (53.8%) |
Female Fertility in Butler
Fertility by Age in Butler
Average fertility rate in Butler is 30.0 births per 1,000 women. Women in the age bracket of 20 to 34 years have the highest fertility rate with 50.0 births per 1,000 women. Women in the age bracket of 20 to 34 years acount for 78.4% of all women with births.
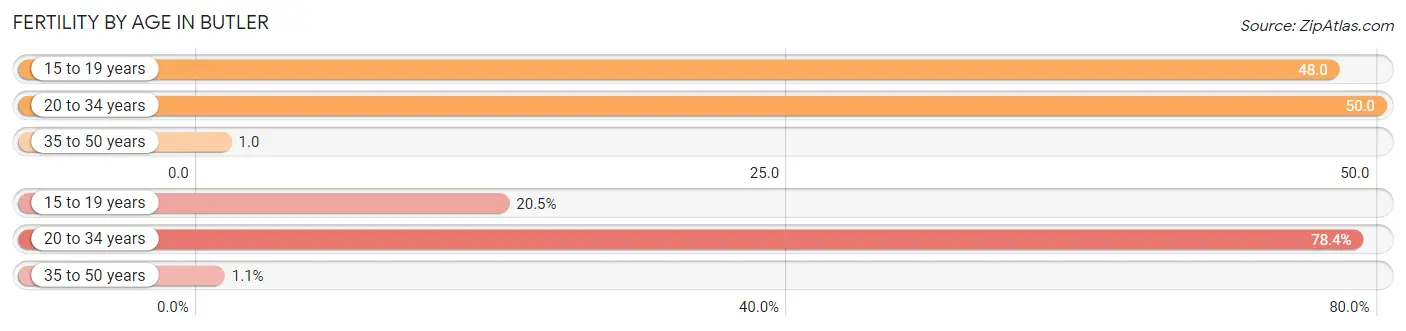
| Age Bracket | Women with Births | Births / 1,000 Women |
| 15 to 19 years | 18 (20.4%) | 48.0 |
| 20 to 34 years | 69 (78.4%) | 50.0 |
| 35 to 50 years | 1 (1.1%) | 1.0 |
| Total | 88 (100.0%) | 30.0 |
Fertility by Age by Marriage Status in Butler
65.9% of women with births (88) in Butler are married. The highest percentage of unmarried women with births falls into 15 to 19 years age bracket with 100.0% of them unmarried at the time of birth, while the lowest percentage of unmarried women with births belong to 35 to 50 years age bracket with 0.0% of them unmarried.
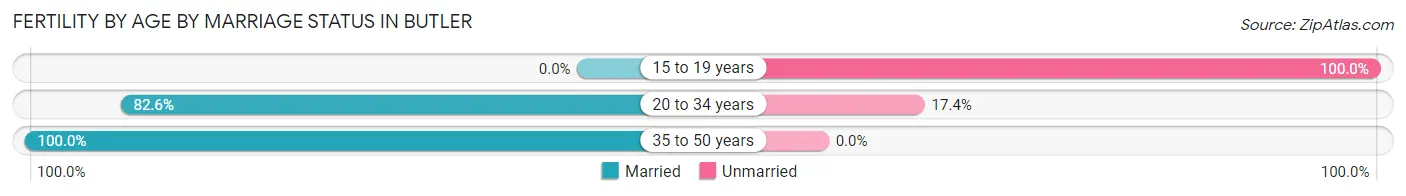
| Age Bracket | Married | Unmarried |
| 15 to 19 years | 0 (0.0%) | 18 (100.0%) |
| 20 to 34 years | 57 (82.6%) | 12 (17.4%) |
| 35 to 50 years | 1 (100.0%) | 0 (0.0%) |
| Total | 58 (65.9%) | 30 (34.1%) |
Fertility by Education in Butler
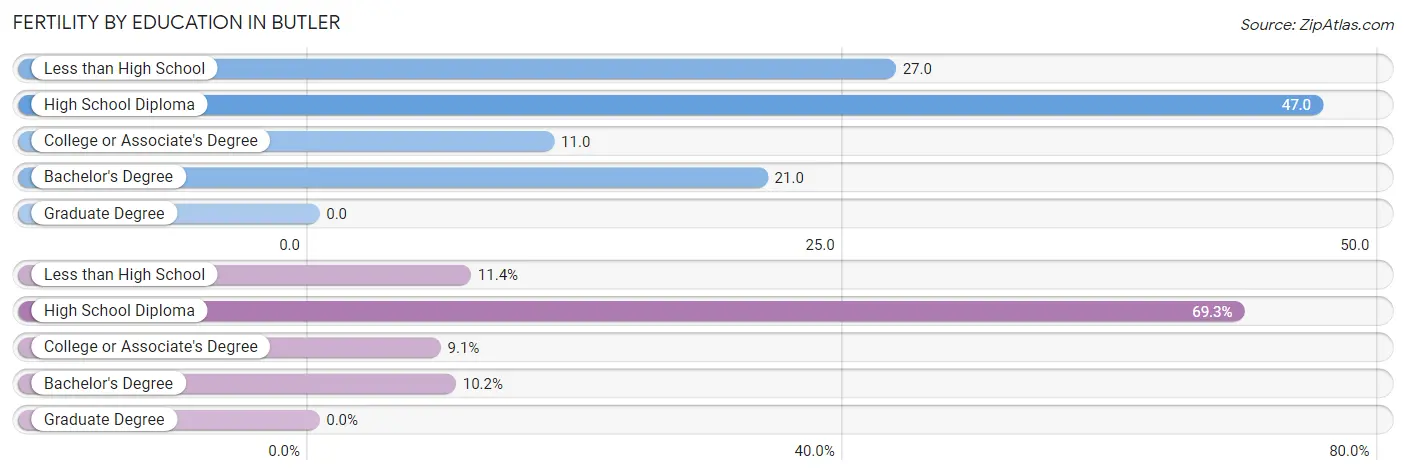
| Educational Attainment | Women with Births | Births / 1,000 Women |
| Less than High School | 10 (11.4%) | 27.0 |
| High School Diploma | 61 (69.3%) | 47.0 |
| College or Associate's Degree | 8 (9.1%) | 11.0 |
| Bachelor's Degree | 9 (10.2%) | 21.0 |
| Graduate Degree | 0 (0.0%) | 0.0 |
| Total | 88 (100.0%) | 30.0 |
Fertility by Education by Marriage Status in Butler
34.1% of women with births in Butler are unmarried. Women with the educational attainment of less than high school are most likely to be married with 100.0% of them married at childbirth, while women with the educational attainment of high school diploma are least likely to be married with 49.2% of them unmarried at childbirth.
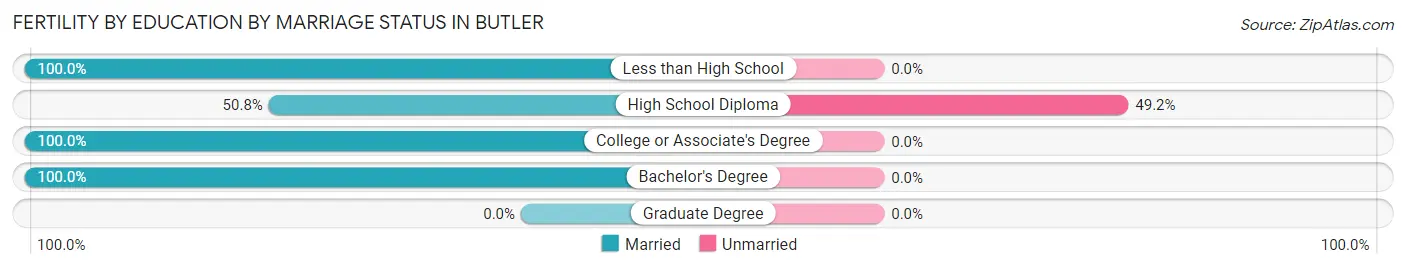
| Educational Attainment | Married | Unmarried |
| Less than High School | 10 (100.0%) | 0 (0.0%) |
| High School Diploma | 31 (50.8%) | 30 (49.2%) |
| College or Associate's Degree | 8 (100.0%) | 0 (0.0%) |
| Bachelor's Degree | 9 (100.0%) | 0 (0.0%) |
| Graduate Degree | 0 (0.0%) | 0 (0.0%) |
| Total | 58 (65.9%) | 30 (34.1%) |
Employment Characteristics in Butler
Employment by Class of Employer in Butler
Among the 5,736 employed individuals in Butler, private company employees (4,395 | 76.6%), not-for-profit organizations (555 | 9.7%), and local government employees (276 | 4.8%) make up the most common classes of employment.
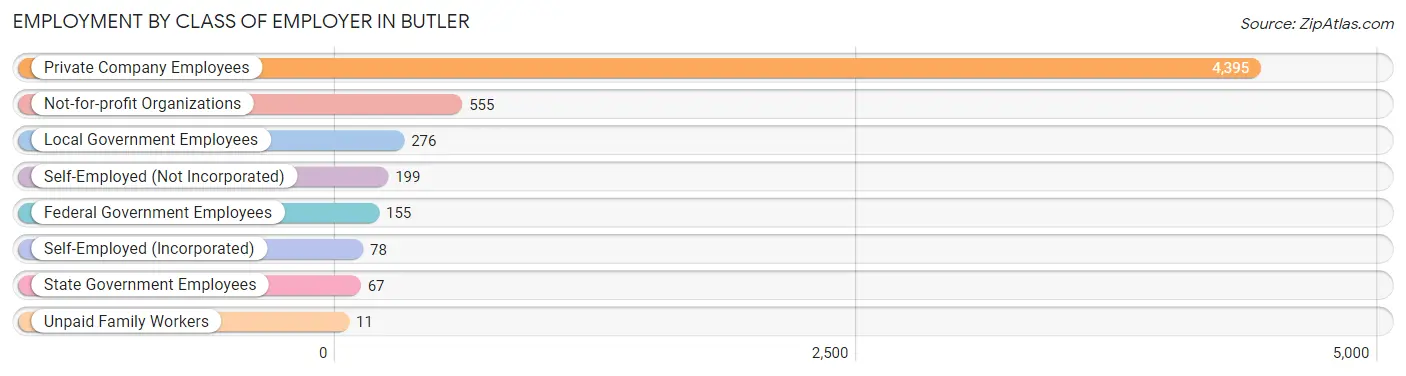
| Employer Class | # Employees | % Employees |
| Private Company Employees | 4,395 | 76.6% |
| Self-Employed (Incorporated) | 78 | 1.4% |
| Self-Employed (Not Incorporated) | 199 | 3.5% |
| Not-for-profit Organizations | 555 | 9.7% |
| Local Government Employees | 276 | 4.8% |
| State Government Employees | 67 | 1.2% |
| Federal Government Employees | 155 | 2.7% |
| Unpaid Family Workers | 11 | 0.2% |
| Total | 5,736 | 100.0% |
Employment Status by Age in Butler
According to the labor force statistics for Butler, out of the total population over 16 years of age (10,944), 59.0% or 6,457 individuals are in the labor force, with 9.4% or 607 of them unemployed. The age group with the highest labor force participation rate is 35 to 44 years, with 75.9% or 1,138 individuals in the labor force. Within the labor force, the 30 to 34 years age range has the highest percentage of unemployed individuals, with 17.8% or 126 of them being unemployed.
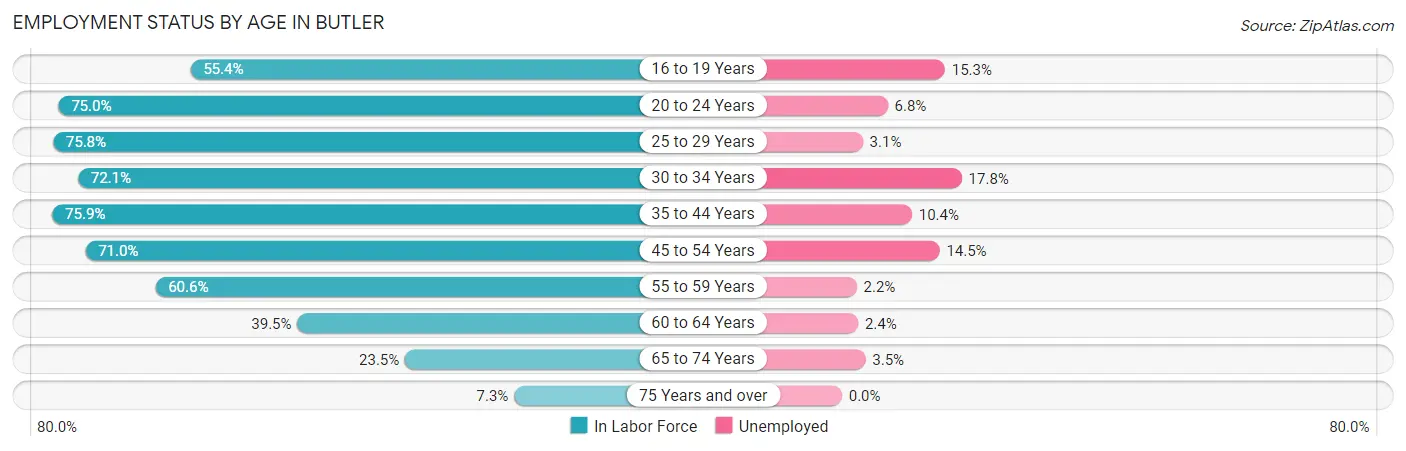
| Age Bracket | In Labor Force | Unemployed |
| 16 to 19 Years | 398 (55.4%) | 61 (15.3%) |
| 20 to 24 Years | 764 (75.0%) | 52 (6.8%) |
| 25 to 29 Years | 741 (75.8%) | 23 (3.1%) |
| 30 to 34 Years | 706 (72.1%) | 126 (17.8%) |
| 35 to 44 Years | 1,139 (75.9%) | 118 (10.4%) |
| 45 to 54 Years | 1,314 (71.0%) | 191 (14.5%) |
| 55 to 59 Years | 644 (60.6%) | 14 (2.2%) |
| 60 to 64 Years | 457 (39.5%) | 11 (2.4%) |
| 65 to 74 Years | 257 (23.5%) | 9 (3.5%) |
| 75 Years and over | 43 (7.3%) | 0 (0.0%) |
| Total | 6,457 (59.0%) | 607 (9.4%) |
Employment Status by Educational Attainment in Butler
According to labor force statistics for Butler, 66.5% of individuals (5,004) out of the total population between 25 and 64 years of age (7,525) are in the labor force, with 9.7% or 485 of them being unemployed. The group with the highest labor force participation rate are those with the educational attainment of bachelor's degree or higher, with 82.9% or 1,351 individuals in the labor force. Within the labor force, individuals with high school diploma education have the highest percentage of unemployment, with 17.0% or 343 of them being unemployed.
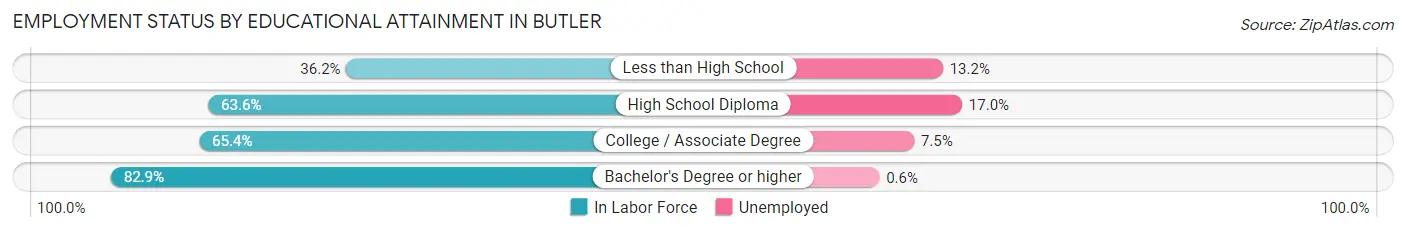
| Educational Attainment | In Labor Force | Unemployed |
| Less than High School | 182 (36.2%) | 66 (13.2%) |
| High School Diploma | 2,015 (63.6%) | 539 (17.0%) |
| College / Associate Degree | 1,454 (65.4%) | 167 (7.5%) |
| Bachelor's Degree or higher | 1,351 (82.9%) | 10 (0.6%) |
| Total | 5,004 (66.5%) | 730 (9.7%) |
Employment Occupations by Sex in Butler
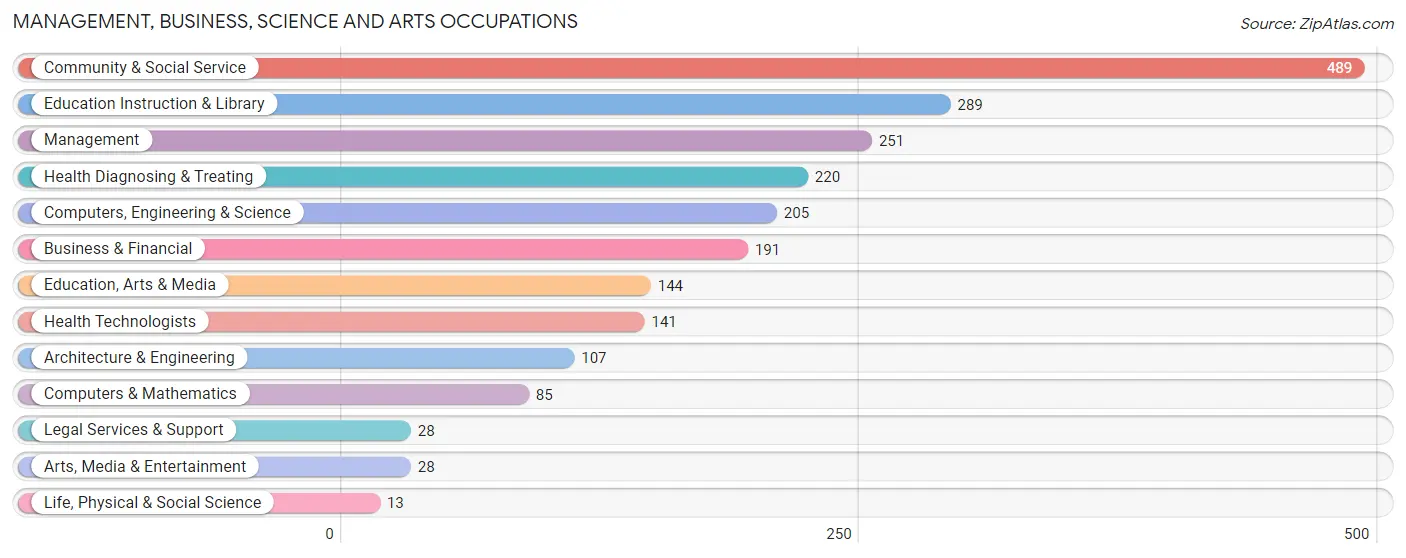
Management, Business, Science and Arts Occupations
The most common Management, Business, Science and Arts occupations in Butler are Community & Social Service (489 | 8.4%), Education Instruction & Library (289 | 4.9%), Management (251 | 4.3%), Health Diagnosing & Treating (220 | 3.8%), and Computers, Engineering & Science (205 | 3.5%).
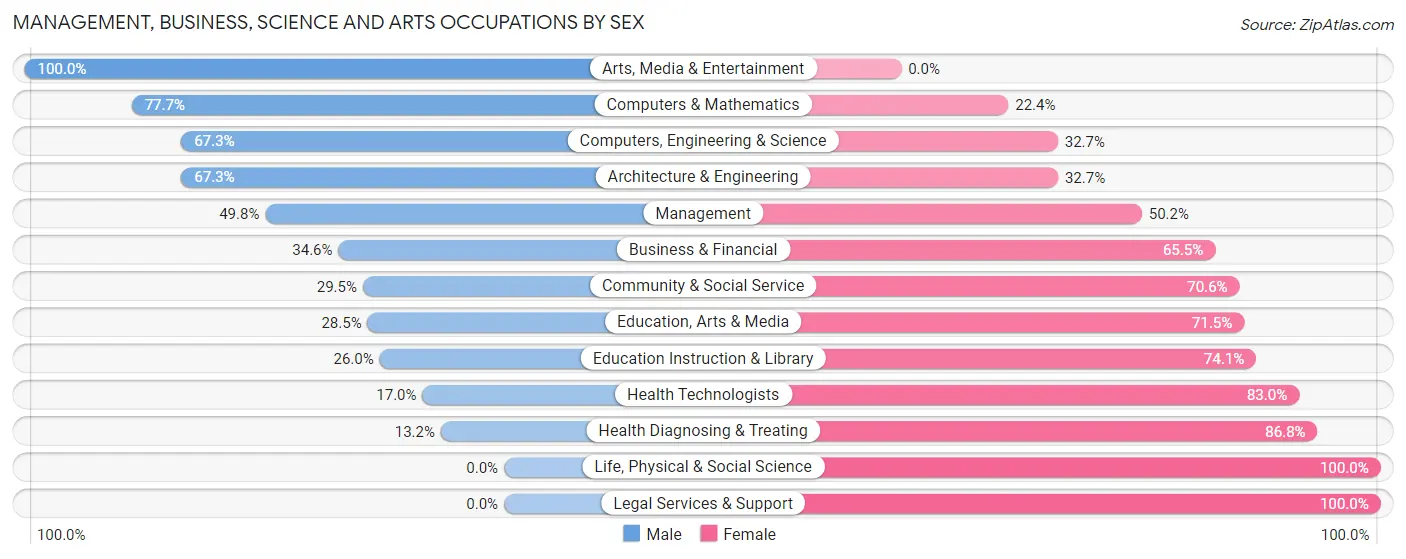
Management, Business, Science and Arts Occupations by Sex
Within the Management, Business, Science and Arts occupations in Butler, the most male-oriented occupations are Arts, Media & Entertainment (100.0%), Computers & Mathematics (77.6%), and Computers, Engineering & Science (67.3%), while the most female-oriented occupations are Life, Physical & Social Science (100.0%), Legal Services & Support (100.0%), and Health Diagnosing & Treating (86.8%).
| Occupation | Male | Female |
| Management | 125 (49.8%) | 126 (50.2%) |
| Business & Financial | 66 (34.5%) | 125 (65.4%) |
| Computers, Engineering & Science | 138 (67.3%) | 67 (32.7%) |
| Computers & Mathematics | 66 (77.6%) | 19 (22.4%) |
| Architecture & Engineering | 72 (67.3%) | 35 (32.7%) |
| Life, Physical & Social Science | 0 (0.0%) | 13 (100.0%) |
| Community & Social Service | 144 (29.4%) | 345 (70.6%) |
| Education, Arts & Media | 41 (28.5%) | 103 (71.5%) |
| Legal Services & Support | 0 (0.0%) | 28 (100.0%) |
| Education Instruction & Library | 75 (26.0%) | 214 (74.1%) |
| Arts, Media & Entertainment | 28 (100.0%) | 0 (0.0%) |
| Health Diagnosing & Treating | 29 (13.2%) | 191 (86.8%) |
| Health Technologists | 24 (17.0%) | 117 (83.0%) |
| Total (Category) | 502 (37.0%) | 854 (63.0%) |
| Total (Overall) | 3,071 (52.4%) | 2,785 (47.6%) |
Services Occupations
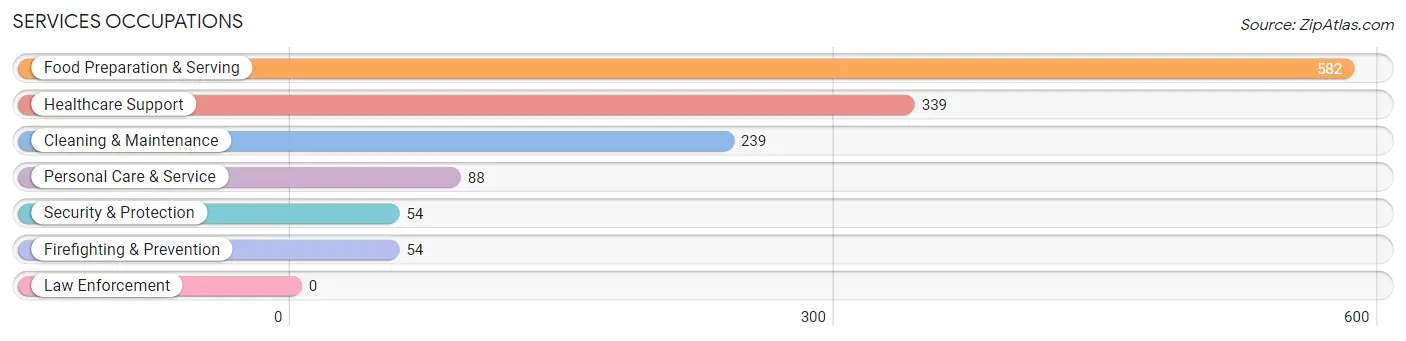
The most common Services occupations in Butler are Food Preparation & Serving (582 | 9.9%), Healthcare Support (339 | 5.8%), Cleaning & Maintenance (239 | 4.1%), Personal Care & Service (88 | 1.5%), and Security & Protection (54 | 0.9%).
Services Occupations by Sex
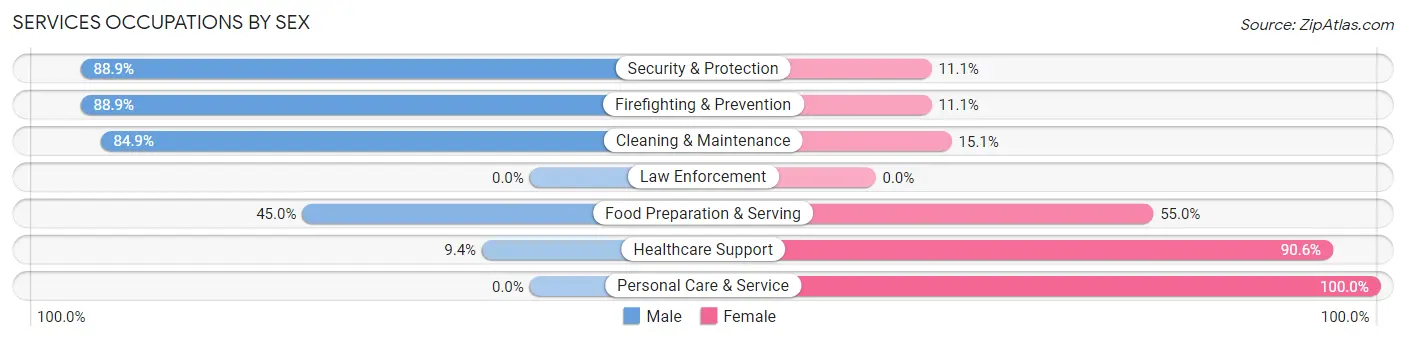
Within the Services occupations in Butler, the most male-oriented occupations are Security & Protection (88.9%), Firefighting & Prevention (88.9%), and Cleaning & Maintenance (84.9%), while the most female-oriented occupations are Personal Care & Service (100.0%), Healthcare Support (90.6%), and Food Preparation & Serving (55.0%).
| Occupation | Male | Female |
| Healthcare Support | 32 (9.4%) | 307 (90.6%) |
| Security & Protection | 48 (88.9%) | 6 (11.1%) |
| Firefighting & Prevention | 48 (88.9%) | 6 (11.1%) |
| Law Enforcement | 0 (0.0%) | 0 (0.0%) |
| Food Preparation & Serving | 262 (45.0%) | 320 (55.0%) |
| Cleaning & Maintenance | 203 (84.9%) | 36 (15.1%) |
| Personal Care & Service | 0 (0.0%) | 88 (100.0%) |
| Total (Category) | 545 (41.9%) | 757 (58.1%) |
| Total (Overall) | 3,071 (52.4%) | 2,785 (47.6%) |
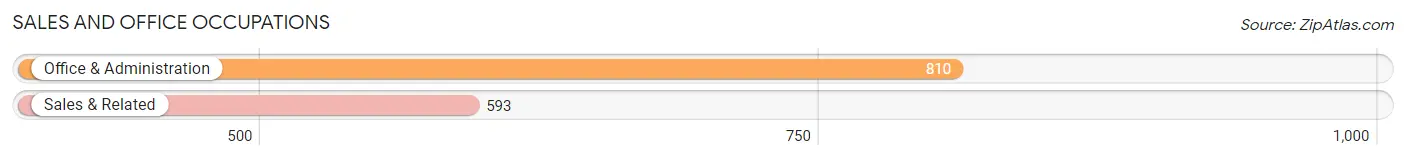
Sales and Office Occupations
The most common Sales and Office occupations in Butler are Office & Administration (810 | 13.8%), and Sales & Related (593 | 10.1%).
Sales and Office Occupations by Sex
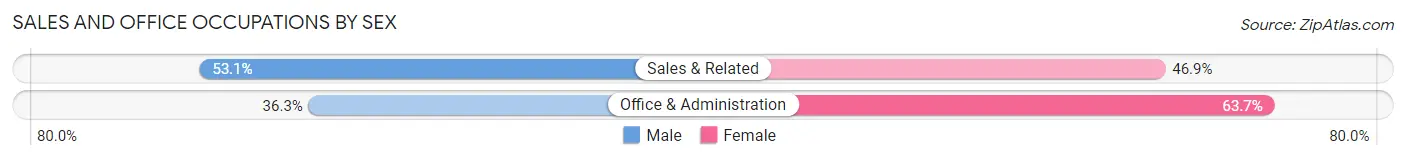
| Occupation | Male | Female |
| Sales & Related | 315 (53.1%) | 278 (46.9%) |
| Office & Administration | 294 (36.3%) | 516 (63.7%) |
| Total (Category) | 609 (43.4%) | 794 (56.6%) |
| Total (Overall) | 3,071 (52.4%) | 2,785 (47.6%) |
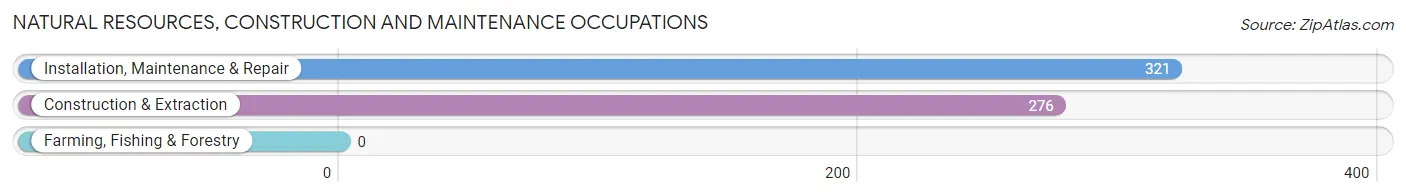
Natural Resources, Construction and Maintenance Occupations
The most common Natural Resources, Construction and Maintenance occupations in Butler are Installation, Maintenance & Repair (321 | 5.5%), and Construction & Extraction (276 | 4.7%).
Natural Resources, Construction and Maintenance Occupations by Sex
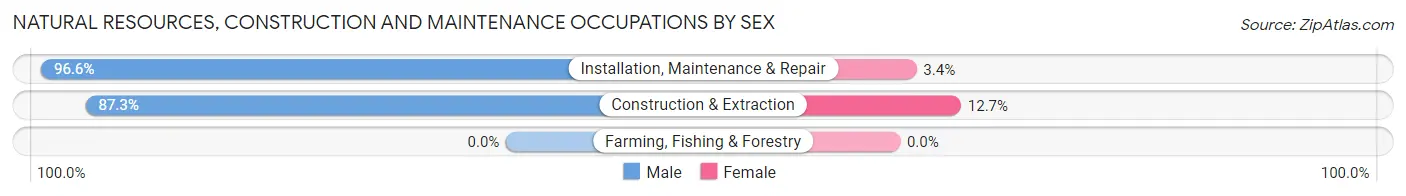
| Occupation | Male | Female |
| Farming, Fishing & Forestry | 0 (0.0%) | 0 (0.0%) |
| Construction & Extraction | 241 (87.3%) | 35 (12.7%) |
| Installation, Maintenance & Repair | 310 (96.6%) | 11 (3.4%) |
| Total (Category) | 551 (92.3%) | 46 (7.7%) |
| Total (Overall) | 3,071 (52.4%) | 2,785 (47.6%) |
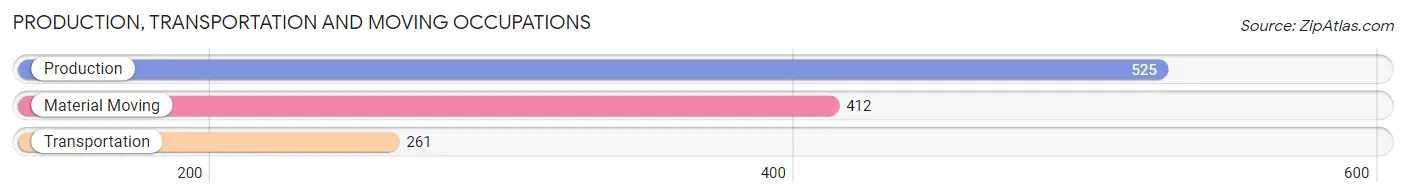
Production, Transportation and Moving Occupations
The most common Production, Transportation and Moving occupations in Butler are Production (525 | 9.0%), Material Moving (412 | 7.0%), and Transportation (261 | 4.5%).
Production, Transportation and Moving Occupations by Sex
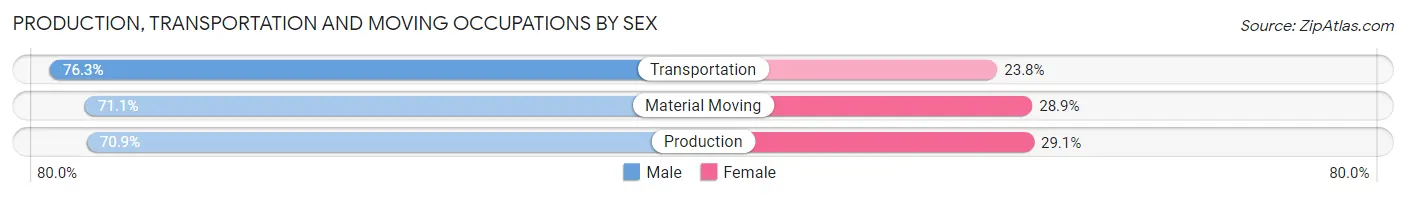
| Occupation | Male | Female |
| Production | 372 (70.9%) | 153 (29.1%) |
| Transportation | 199 (76.2%) | 62 (23.7%) |
| Material Moving | 293 (71.1%) | 119 (28.9%) |
| Total (Category) | 864 (72.1%) | 334 (27.9%) |
| Total (Overall) | 3,071 (52.4%) | 2,785 (47.6%) |
Employment Industries by Sex in Butler
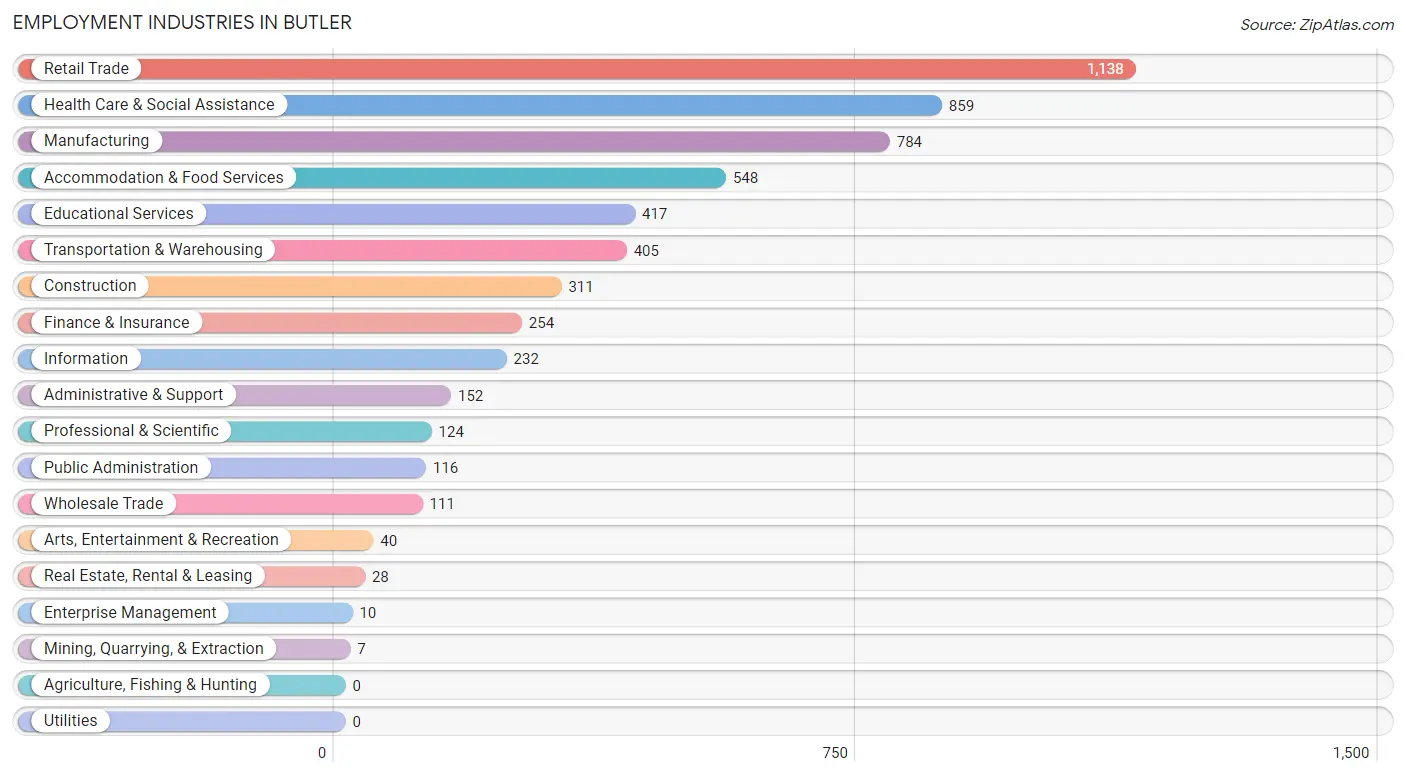
Employment Industries in Butler
The major employment industries in Butler include Retail Trade (1,138 | 19.4%), Health Care & Social Assistance (859 | 14.7%), Manufacturing (784 | 13.4%), Accommodation & Food Services (548 | 9.4%), and Educational Services (417 | 7.1%).
Employment Industries by Sex in Butler
The Butler industries that see more men than women are Mining, Quarrying, & Extraction (100.0%), Construction (93.6%), and Arts, Entertainment & Recreation (85.0%), whereas the industries that tend to have a higher number of women are Enterprise Management (100.0%), Health Care & Social Assistance (86.6%), and Finance & Insurance (84.3%).
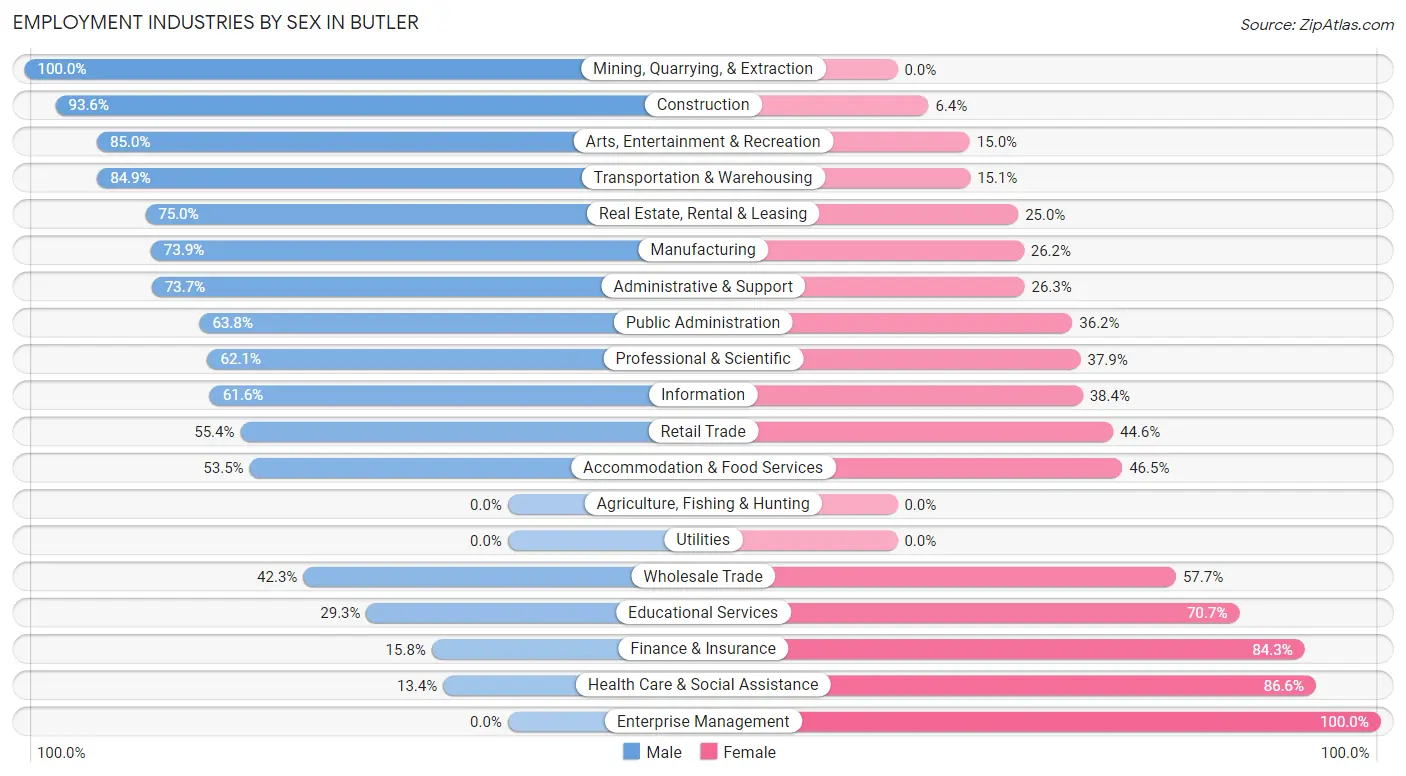
| Industry | Male | Female |
| Agriculture, Fishing & Hunting | 0 (0.0%) | 0 (0.0%) |
| Mining, Quarrying, & Extraction | 7 (100.0%) | 0 (0.0%) |
| Construction | 291 (93.6%) | 20 (6.4%) |
| Manufacturing | 579 (73.9%) | 205 (26.2%) |
| Wholesale Trade | 47 (42.3%) | 64 (57.7%) |
| Retail Trade | 630 (55.4%) | 508 (44.6%) |
| Transportation & Warehousing | 344 (84.9%) | 61 (15.1%) |
| Utilities | 0 (0.0%) | 0 (0.0%) |
| Information | 143 (61.6%) | 89 (38.4%) |
| Finance & Insurance | 40 (15.8%) | 214 (84.3%) |
| Real Estate, Rental & Leasing | 21 (75.0%) | 7 (25.0%) |
| Professional & Scientific | 77 (62.1%) | 47 (37.9%) |
| Enterprise Management | 0 (0.0%) | 10 (100.0%) |
| Administrative & Support | 112 (73.7%) | 40 (26.3%) |
| Educational Services | 122 (29.3%) | 295 (70.7%) |
| Health Care & Social Assistance | 115 (13.4%) | 744 (86.6%) |
| Arts, Entertainment & Recreation | 34 (85.0%) | 6 (15.0%) |
| Accommodation & Food Services | 293 (53.5%) | 255 (46.5%) |
| Public Administration | 74 (63.8%) | 42 (36.2%) |
| Total | 3,071 (52.4%) | 2,785 (47.6%) |
Education in Butler
School Enrollment in Butler
The most common levels of schooling among the 2,492 students in Butler are high school (685 | 27.5%), middle school (639 | 25.6%), and elementary school (531 | 21.3%).
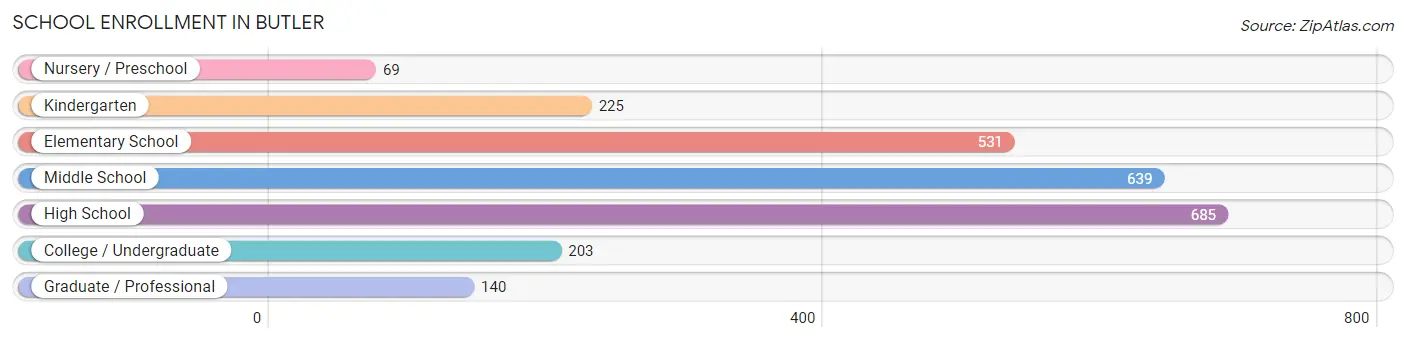
| School Level | # Students | % Students |
| Nursery / Preschool | 69 | 2.8% |
| Kindergarten | 225 | 9.0% |
| Elementary School | 531 | 21.3% |
| Middle School | 639 | 25.6% |
| High School | 685 | 27.5% |
| College / Undergraduate | 203 | 8.2% |
| Graduate / Professional | 140 | 5.6% |
| Total | 2,492 | 100.0% |
School Enrollment by Age by Funding Source in Butler
Out of a total of 2,492 students who are enrolled in schools in Butler, 381 (15.3%) attend a private institution, while the remaining 2,111 (84.7%) are enrolled in public schools. The age group of 25 to 34 year olds has the highest likelihood of being enrolled in private schools, with 52 (57.1% in the age bracket) enrolled. Conversely, the age group of 18 to 19 year olds has the lowest likelihood of being enrolled in a private school, with 196 (98.5% in the age bracket) attending a public institution.
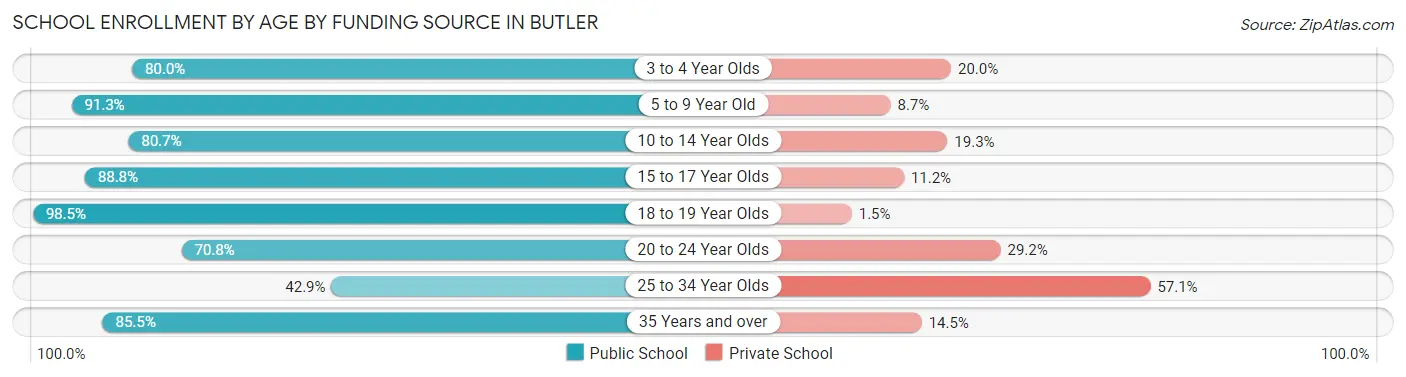
| Age Bracket | Public School | Private School |
| 3 to 4 Year Olds | 44 (80.0%) | 11 (20.0%) |
| 5 to 9 Year Old | 627 (91.3%) | 60 (8.7%) |
| 10 to 14 Year Olds | 593 (80.7%) | 142 (19.3%) |
| 15 to 17 Year Olds | 403 (88.8%) | 51 (11.2%) |
| 18 to 19 Year Olds | 196 (98.5%) | 3 (1.5%) |
| 20 to 24 Year Olds | 109 (70.8%) | 45 (29.2%) |
| 25 to 34 Year Olds | 39 (42.9%) | 52 (57.1%) |
| 35 Years and over | 100 (85.5%) | 17 (14.5%) |
| Total | 2,111 (84.7%) | 381 (15.3%) |
Educational Attainment by Field of Study in Butler
Education (455 | 20.7%), business (393 | 17.9%), science & technology (198 | 9.0%), liberal arts & history (161 | 7.3%), and arts & humanities (161 | 7.3%) are the most common fields of study among 2,194 individuals in Butler who have obtained a bachelor's degree or higher.
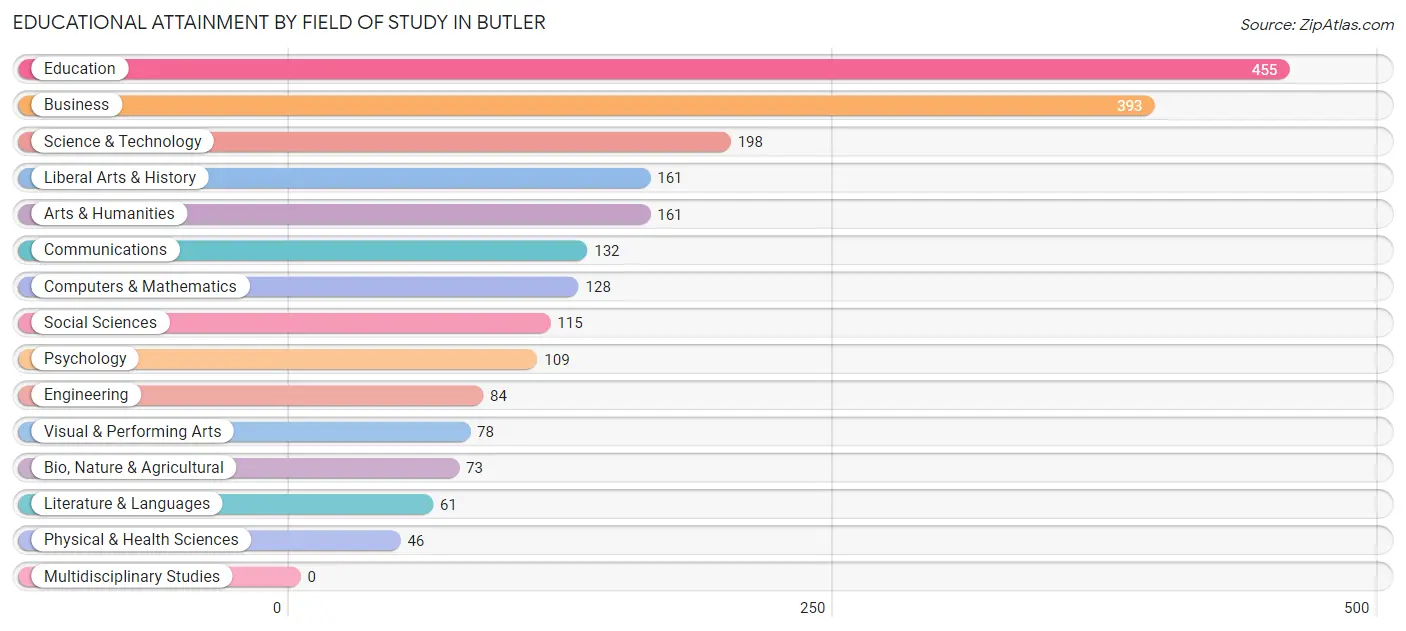
| Field of Study | # Graduates | % Graduates |
| Computers & Mathematics | 128 | 5.8% |
| Bio, Nature & Agricultural | 73 | 3.3% |
| Physical & Health Sciences | 46 | 2.1% |
| Psychology | 109 | 5.0% |
| Social Sciences | 115 | 5.2% |
| Engineering | 84 | 3.8% |
| Multidisciplinary Studies | 0 | 0.0% |
| Science & Technology | 198 | 9.0% |
| Business | 393 | 17.9% |
| Education | 455 | 20.7% |
| Literature & Languages | 61 | 2.8% |
| Liberal Arts & History | 161 | 7.3% |
| Visual & Performing Arts | 78 | 3.6% |
| Communications | 132 | 6.0% |
| Arts & Humanities | 161 | 7.3% |
| Total | 2,194 | 100.0% |
Transportation & Commute in Butler
Vehicle Availability by Sex in Butler
The most prevalent vehicle ownership categories in Butler are males with 1 vehicle (1,050, accounting for 34.9%) and females with 1 vehicle (1,201, making up 38.5%).
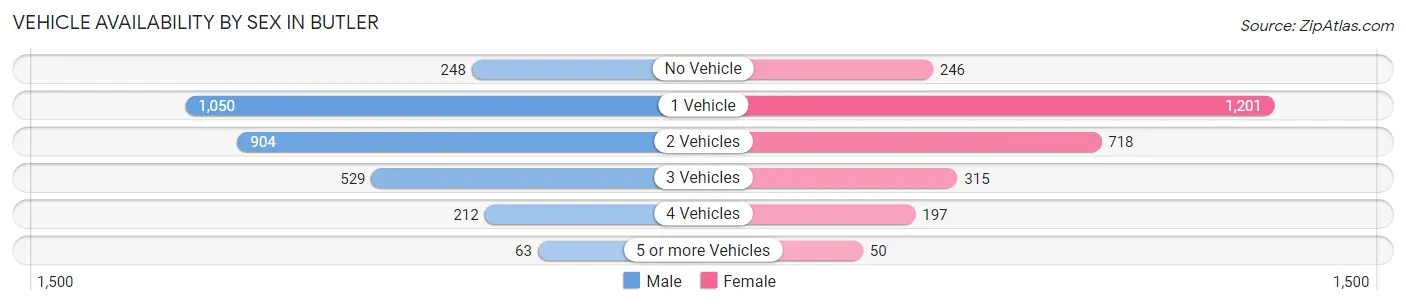
| Vehicles Available | Male | Female |
| No Vehicle | 248 (8.3%) | 246 (9.0%) |
| 1 Vehicle | 1,050 (34.9%) | 1,201 (44.0%) |
| 2 Vehicles | 904 (30.1%) | 718 (26.3%) |
| 3 Vehicles | 529 (17.6%) | 315 (11.6%) |
| 4 Vehicles | 212 (7.0%) | 197 (7.2%) |
| 5 or more Vehicles | 63 (2.1%) | 50 (1.8%) |
| Total | 3,006 (100.0%) | 2,727 (100.0%) |
Commute Time in Butler
The most frequently occuring commute durations in Butler are 10 to 14 minutes (1,095 commuters, 20.0%), 15 to 19 minutes (1,020 commuters, 18.6%), and 5 to 9 minutes (953 commuters, 17.4%).
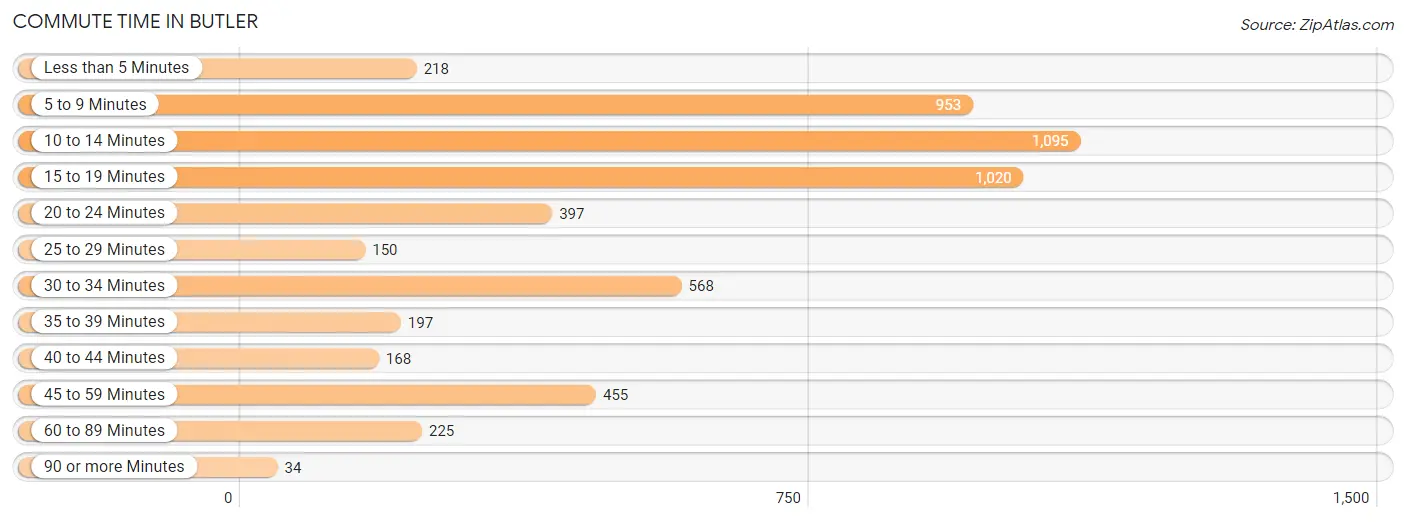
| Commute Time | # Commuters | % Commuters |
| Less than 5 Minutes | 218 | 4.0% |
| 5 to 9 Minutes | 953 | 17.4% |
| 10 to 14 Minutes | 1,095 | 20.0% |
| 15 to 19 Minutes | 1,020 | 18.6% |
| 20 to 24 Minutes | 397 | 7.2% |
| 25 to 29 Minutes | 150 | 2.7% |
| 30 to 34 Minutes | 568 | 10.4% |
| 35 to 39 Minutes | 197 | 3.6% |
| 40 to 44 Minutes | 168 | 3.1% |
| 45 to 59 Minutes | 455 | 8.3% |
| 60 to 89 Minutes | 225 | 4.1% |
| 90 or more Minutes | 34 | 0.6% |
Commute Time by Sex in Butler
The most common commute times in Butler are 15 to 19 minutes (544 commuters, 18.9%) for males and 10 to 14 minutes (559 commuters, 21.5%) for females.
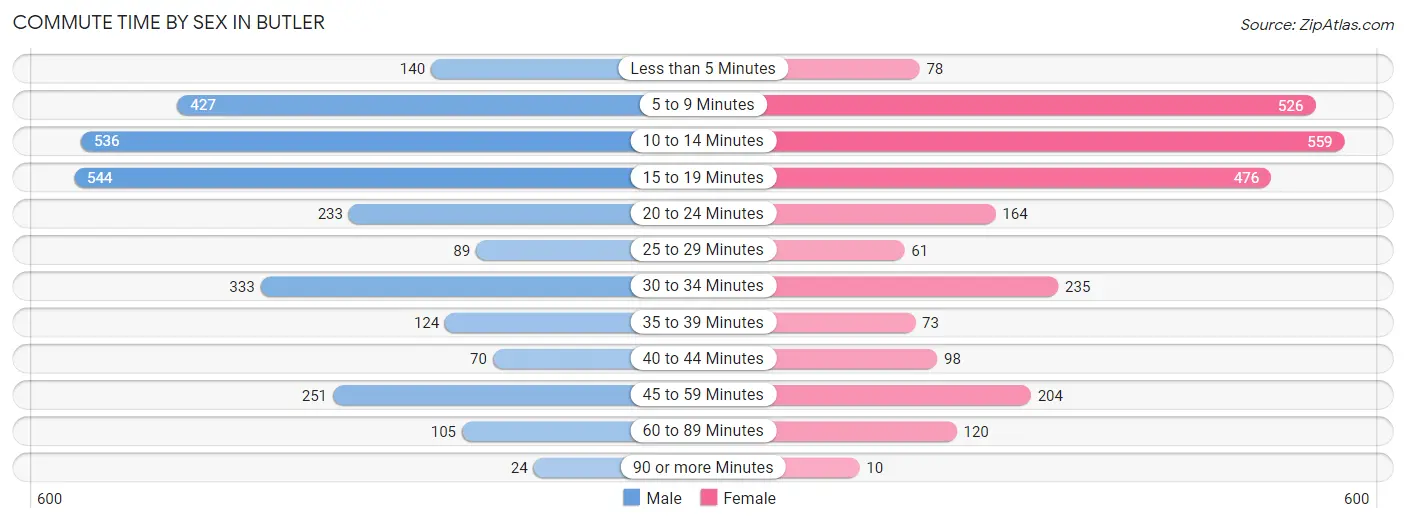
| Commute Time | Male | Female |
| Less than 5 Minutes | 140 (4.9%) | 78 (3.0%) |
| 5 to 9 Minutes | 427 (14.8%) | 526 (20.2%) |
| 10 to 14 Minutes | 536 (18.6%) | 559 (21.5%) |
| 15 to 19 Minutes | 544 (18.9%) | 476 (18.3%) |
| 20 to 24 Minutes | 233 (8.1%) | 164 (6.3%) |
| 25 to 29 Minutes | 89 (3.1%) | 61 (2.3%) |
| 30 to 34 Minutes | 333 (11.6%) | 235 (9.0%) |
| 35 to 39 Minutes | 124 (4.3%) | 73 (2.8%) |
| 40 to 44 Minutes | 70 (2.4%) | 98 (3.8%) |
| 45 to 59 Minutes | 251 (8.7%) | 204 (7.8%) |
| 60 to 89 Minutes | 105 (3.6%) | 120 (4.6%) |
| 90 or more Minutes | 24 (0.8%) | 10 (0.4%) |
Time of Departure to Work by Sex in Butler
The most frequent times of departure to work in Butler are 7:00 AM to 7:29 AM (450, 15.7%) for males and 7:30 AM to 7:59 AM (384, 14.7%) for females.
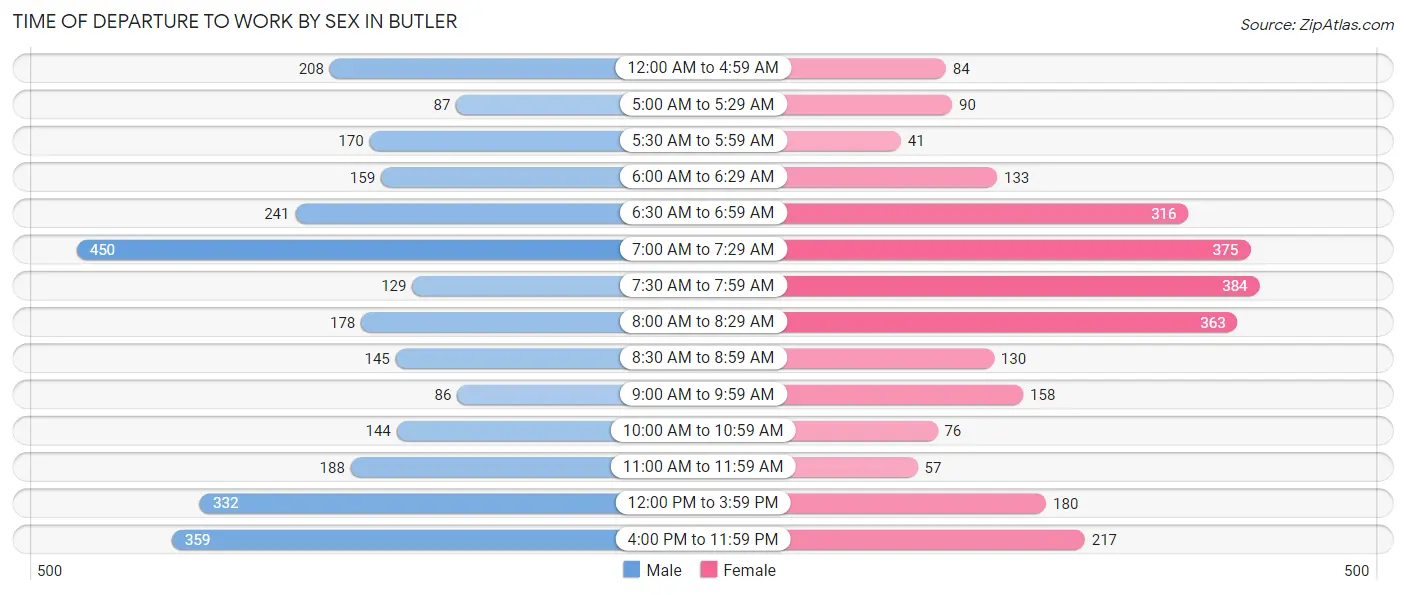
| Time of Departure | Male | Female |
| 12:00 AM to 4:59 AM | 208 (7.2%) | 84 (3.2%) |
| 5:00 AM to 5:29 AM | 87 (3.0%) | 90 (3.5%) |
| 5:30 AM to 5:59 AM | 170 (5.9%) | 41 (1.6%) |
| 6:00 AM to 6:29 AM | 159 (5.5%) | 133 (5.1%) |
| 6:30 AM to 6:59 AM | 241 (8.4%) | 316 (12.1%) |
| 7:00 AM to 7:29 AM | 450 (15.7%) | 375 (14.4%) |
| 7:30 AM to 7:59 AM | 129 (4.5%) | 384 (14.7%) |
| 8:00 AM to 8:29 AM | 178 (6.2%) | 363 (13.9%) |
| 8:30 AM to 8:59 AM | 145 (5.0%) | 130 (5.0%) |
| 9:00 AM to 9:59 AM | 86 (3.0%) | 158 (6.1%) |
| 10:00 AM to 10:59 AM | 144 (5.0%) | 76 (2.9%) |
| 11:00 AM to 11:59 AM | 188 (6.5%) | 57 (2.2%) |
| 12:00 PM to 3:59 PM | 332 (11.5%) | 180 (6.9%) |
| 4:00 PM to 11:59 PM | 359 (12.5%) | 217 (8.3%) |
| Total | 2,876 (100.0%) | 2,604 (100.0%) |
Housing Occupancy in Butler
Occupancy by Ownership in Butler
Of the total 6,177 dwellings in Butler, owner-occupied units account for 2,540 (41.1%), while renter-occupied units make up 3,637 (58.9%).
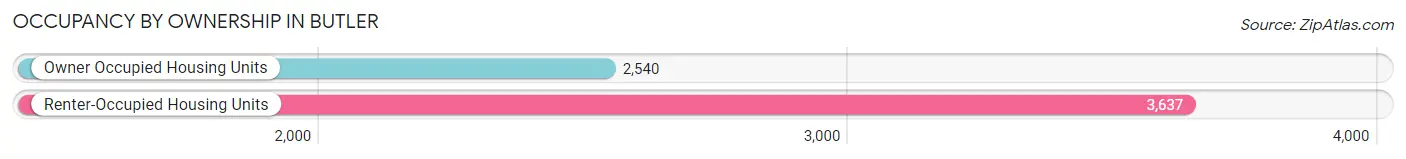
| Occupancy | # Housing Units | % Housing Units |
| Owner Occupied Housing Units | 2,540 | 41.1% |
| Renter-Occupied Housing Units | 3,637 | 58.9% |
| Total Occupied Housing Units | 6,177 | 100.0% |
Occupancy by Household Size in Butler
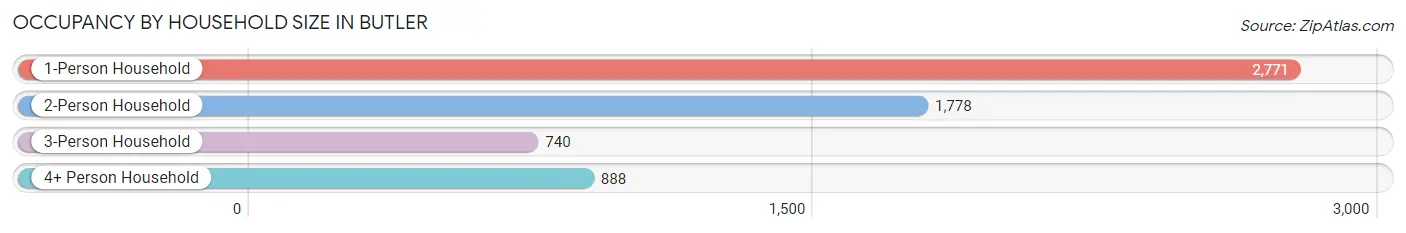
| Household Size | # Housing Units | % Housing Units |
| 1-Person Household | 2,771 | 44.9% |
| 2-Person Household | 1,778 | 28.8% |
| 3-Person Household | 740 | 12.0% |
| 4+ Person Household | 888 | 14.4% |
| Total Housing Units | 6,177 | 100.0% |
Occupancy by Ownership by Household Size in Butler
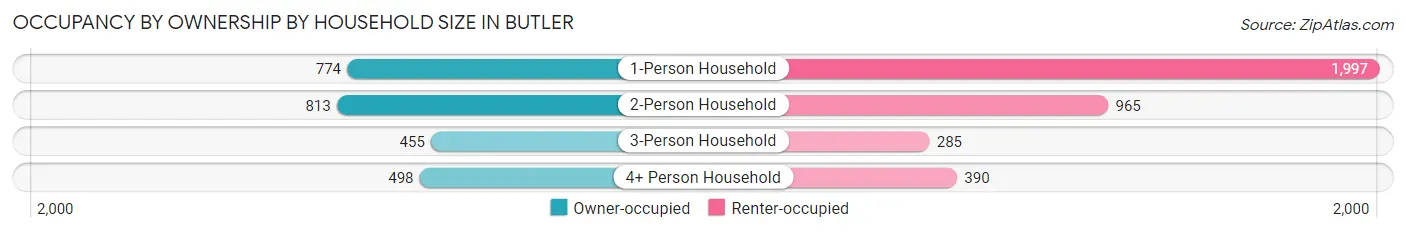
| Household Size | Owner-occupied | Renter-occupied |
| 1-Person Household | 774 (27.9%) | 1,997 (72.1%) |
| 2-Person Household | 813 (45.7%) | 965 (54.3%) |
| 3-Person Household | 455 (61.5%) | 285 (38.5%) |
| 4+ Person Household | 498 (56.1%) | 390 (43.9%) |
| Total Housing Units | 2,540 (41.1%) | 3,637 (58.9%) |
Occupancy by Educational Attainment in Butler
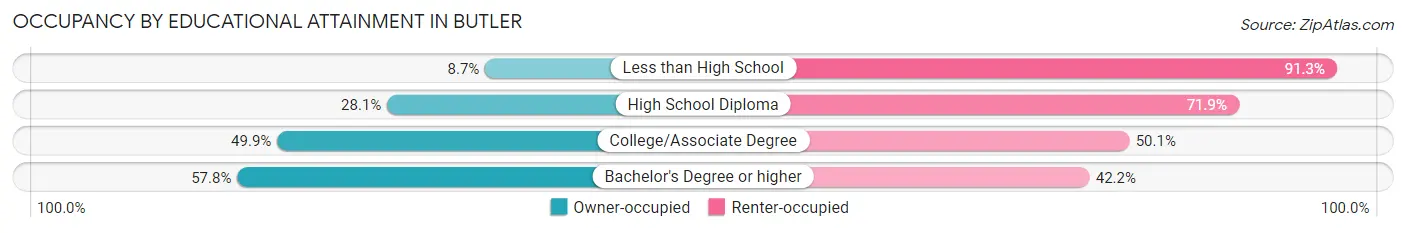
| Household Size | Owner-occupied | Renter-occupied |
| Less than High School | 44 (8.7%) | 463 (91.3%) |
| High School Diploma | 585 (28.1%) | 1,495 (71.9%) |
| College/Associate Degree | 1,044 (49.9%) | 1,047 (50.1%) |
| Bachelor's Degree or higher | 867 (57.8%) | 632 (42.2%) |
Occupancy by Age of Householder in Butler
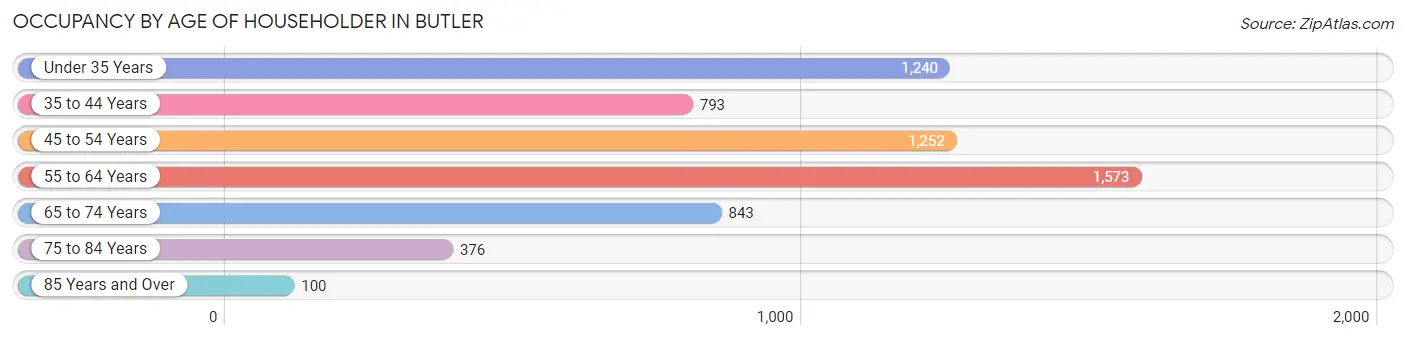
| Age Bracket | # Households | % Households |
| Under 35 Years | 1,240 | 20.1% |
| 35 to 44 Years | 793 | 12.8% |
| 45 to 54 Years | 1,252 | 20.3% |
| 55 to 64 Years | 1,573 | 25.5% |
| 65 to 74 Years | 843 | 13.7% |
| 75 to 84 Years | 376 | 6.1% |
| 85 Years and Over | 100 | 1.6% |
| Total | 6,177 | 100.0% |
Housing Finances in Butler
Median Income by Occupancy in Butler
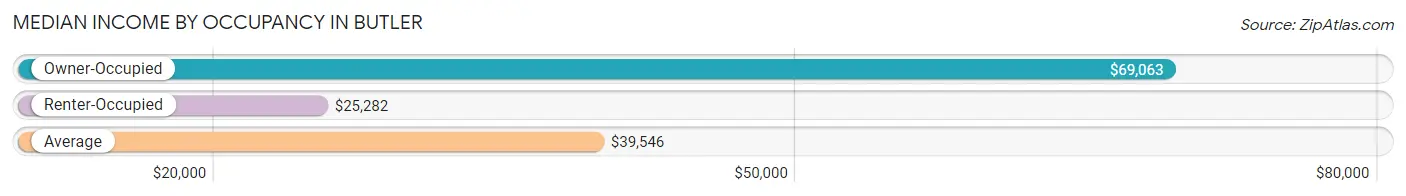
| Occupancy Type | # Households | Median Income |
| Owner-Occupied | 2,540 (41.1%) | $69,063 |
| Renter-Occupied | 3,637 (58.9%) | $25,282 |
| Average | 6,177 (100.0%) | $39,546 |
Occupancy by Householder Income Bracket in Butler
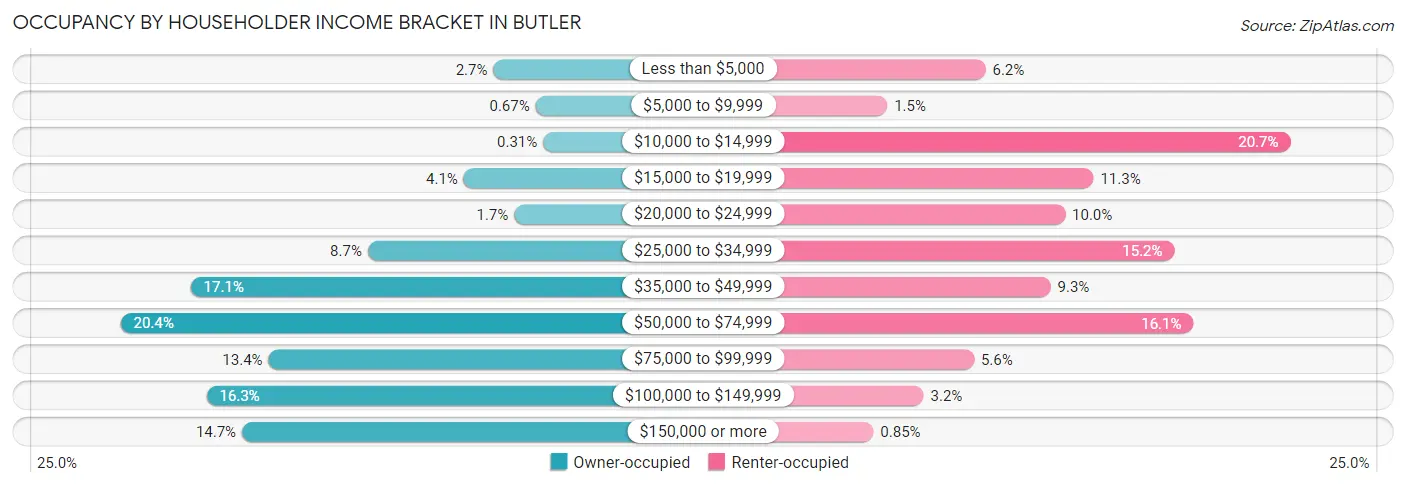
| Income Bracket | Owner-occupied | Renter-occupied |
| Less than $5,000 | 68 (2.7%) | 225 (6.2%) |
| $5,000 to $9,999 | 17 (0.7%) | 55 (1.5%) |
| $10,000 to $14,999 | 8 (0.3%) | 753 (20.7%) |
| $15,000 to $19,999 | 104 (4.1%) | 412 (11.3%) |
| $20,000 to $24,999 | 43 (1.7%) | 363 (10.0%) |
| $25,000 to $34,999 | 220 (8.7%) | 552 (15.2%) |
| $35,000 to $49,999 | 434 (17.1%) | 338 (9.3%) |
| $50,000 to $74,999 | 519 (20.4%) | 585 (16.1%) |
| $75,000 to $99,999 | 340 (13.4%) | 205 (5.6%) |
| $100,000 to $149,999 | 415 (16.3%) | 118 (3.2%) |
| $150,000 or more | 372 (14.6%) | 31 (0.9%) |
| Total | 2,540 (100.0%) | 3,637 (100.0%) |
Monthly Housing Cost Tiers in Butler
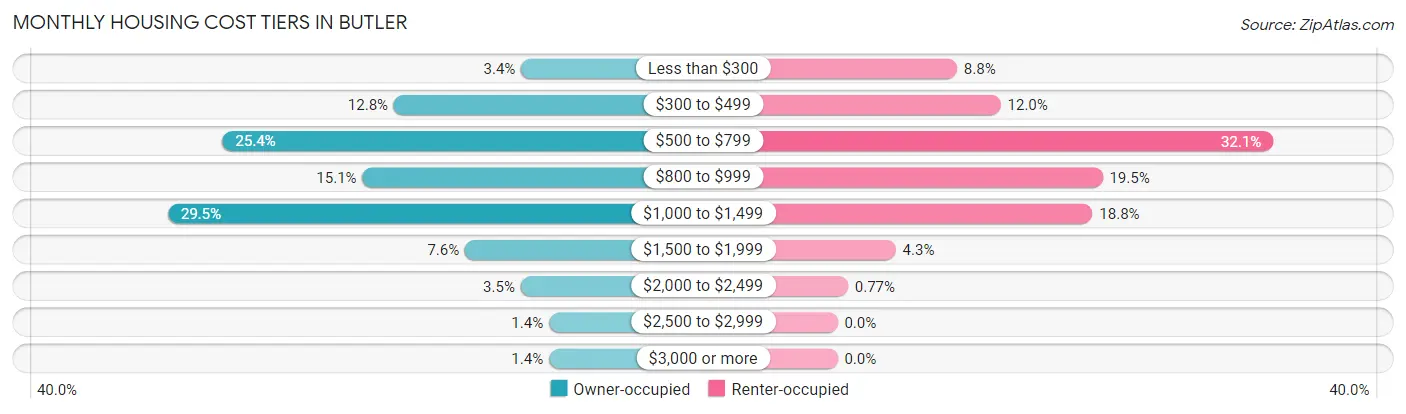
| Monthly Cost | Owner-occupied | Renter-occupied |
| Less than $300 | 87 (3.4%) | 320 (8.8%) |
| $300 to $499 | 325 (12.8%) | 437 (12.0%) |
| $500 to $799 | 646 (25.4%) | 1,167 (32.1%) |
| $800 to $999 | 384 (15.1%) | 710 (19.5%) |
| $1,000 to $1,499 | 748 (29.4%) | 683 (18.8%) |
| $1,500 to $1,999 | 192 (7.6%) | 156 (4.3%) |
| $2,000 to $2,499 | 88 (3.5%) | 28 (0.8%) |
| $2,500 to $2,999 | 35 (1.4%) | 0 (0.0%) |
| $3,000 or more | 35 (1.4%) | 0 (0.0%) |
| Total | 2,540 (100.0%) | 3,637 (100.0%) |
Physical Housing Characteristics in Butler
Housing Structures in Butler
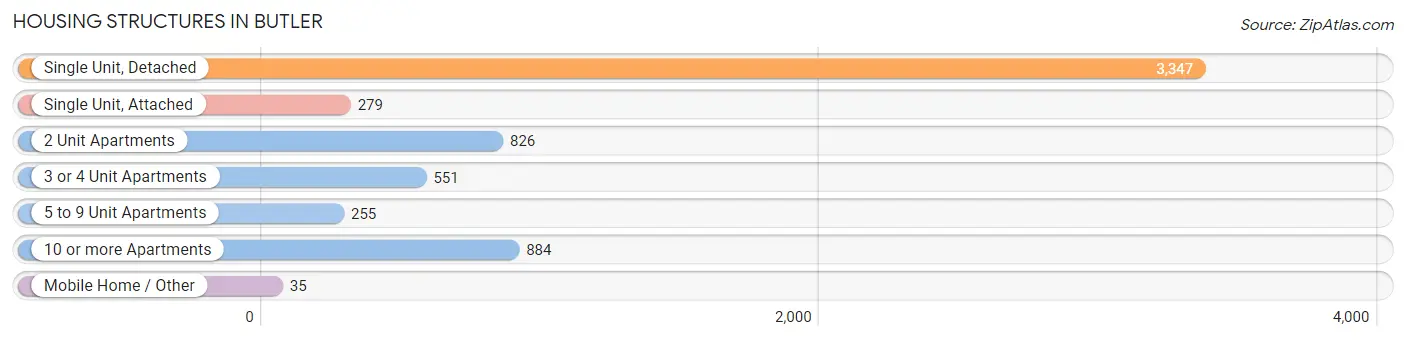
| Structure Type | # Housing Units | % Housing Units |
| Single Unit, Detached | 3,347 | 54.2% |
| Single Unit, Attached | 279 | 4.5% |
| 2 Unit Apartments | 826 | 13.4% |
| 3 or 4 Unit Apartments | 551 | 8.9% |
| 5 to 9 Unit Apartments | 255 | 4.1% |
| 10 or more Apartments | 884 | 14.3% |
| Mobile Home / Other | 35 | 0.6% |
| Total | 6,177 | 100.0% |
Housing Structures by Occupancy in Butler
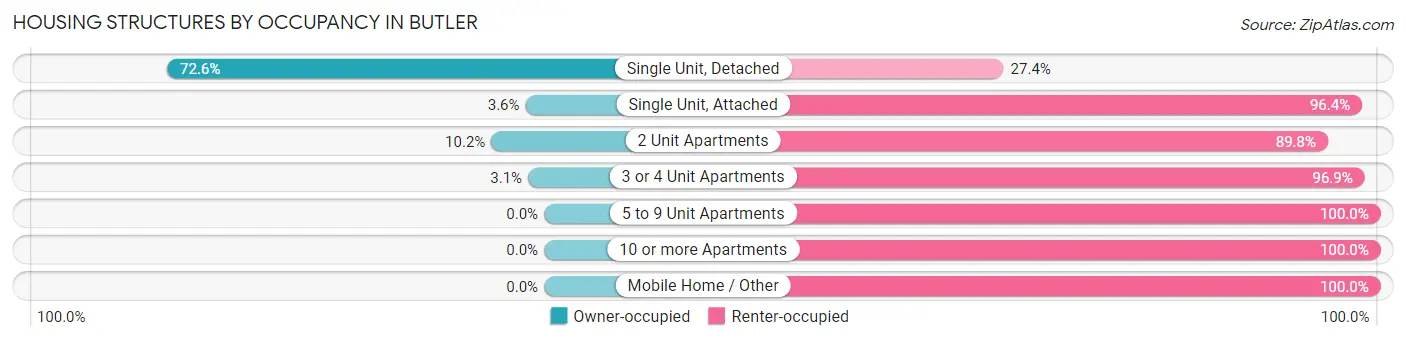
| Structure Type | Owner-occupied | Renter-occupied |
| Single Unit, Detached | 2,429 (72.6%) | 918 (27.4%) |
| Single Unit, Attached | 10 (3.6%) | 269 (96.4%) |
| 2 Unit Apartments | 84 (10.2%) | 742 (89.8%) |
| 3 or 4 Unit Apartments | 17 (3.1%) | 534 (96.9%) |
| 5 to 9 Unit Apartments | 0 (0.0%) | 255 (100.0%) |
| 10 or more Apartments | 0 (0.0%) | 884 (100.0%) |
| Mobile Home / Other | 0 (0.0%) | 35 (100.0%) |
| Total | 2,540 (41.1%) | 3,637 (58.9%) |
Housing Structures by Number of Rooms in Butler
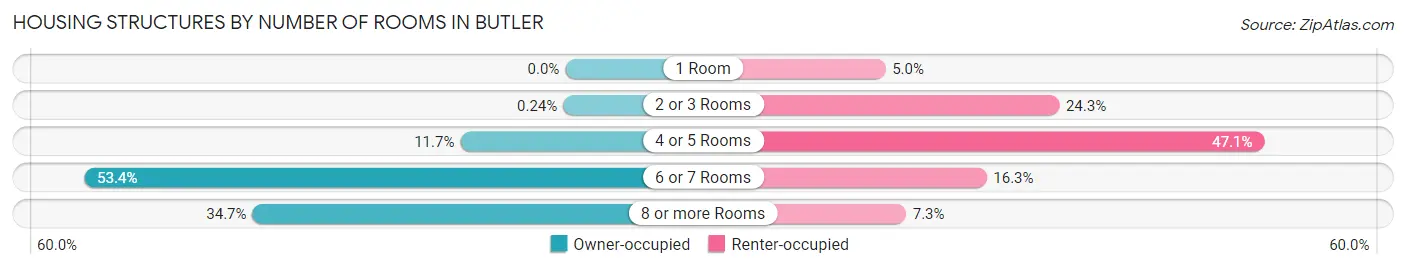
| Number of Rooms | Owner-occupied | Renter-occupied |
| 1 Room | 0 (0.0%) | 183 (5.0%) |
| 2 or 3 Rooms | 6 (0.2%) | 884 (24.3%) |
| 4 or 5 Rooms | 296 (11.7%) | 1,713 (47.1%) |
| 6 or 7 Rooms | 1,356 (53.4%) | 591 (16.3%) |
| 8 or more Rooms | 882 (34.7%) | 266 (7.3%) |
| Total | 2,540 (100.0%) | 3,637 (100.0%) |
Housing Structure by Heating Type in Butler
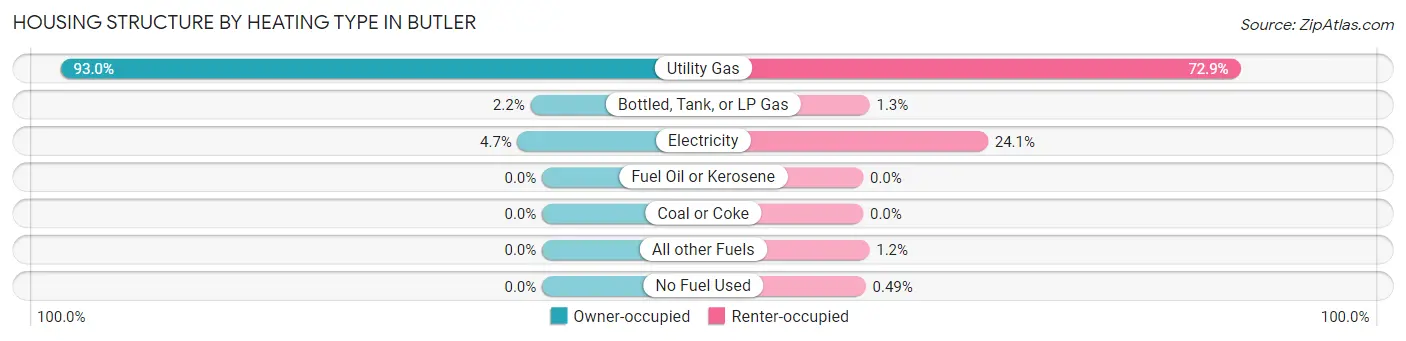
| Heating Type | Owner-occupied | Renter-occupied |
| Utility Gas | 2,363 (93.0%) | 2,652 (72.9%) |
| Bottled, Tank, or LP Gas | 57 (2.2%) | 46 (1.3%) |
| Electricity | 120 (4.7%) | 877 (24.1%) |
| Fuel Oil or Kerosene | 0 (0.0%) | 0 (0.0%) |
| Coal or Coke | 0 (0.0%) | 0 (0.0%) |
| All other Fuels | 0 (0.0%) | 44 (1.2%) |
| No Fuel Used | 0 (0.0%) | 18 (0.5%) |
| Total | 2,540 (100.0%) | 3,637 (100.0%) |
Household Vehicle Usage in Butler
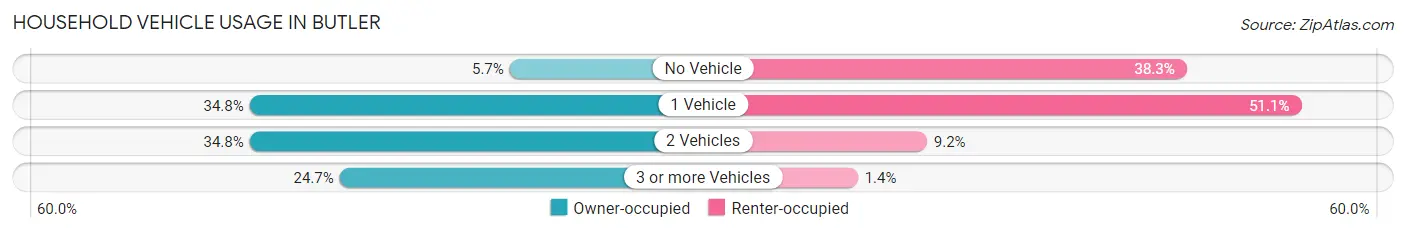
| Vehicles per Household | Owner-occupied | Renter-occupied |
| No Vehicle | 144 (5.7%) | 1,392 (38.3%) |
| 1 Vehicle | 884 (34.8%) | 1,859 (51.1%) |
| 2 Vehicles | 884 (34.8%) | 334 (9.2%) |
| 3 or more Vehicles | 628 (24.7%) | 52 (1.4%) |
| Total | 2,540 (100.0%) | 3,637 (100.0%) |
Real Estate & Mortgages in Butler
Real Estate and Mortgage Overview in Butler
| Characteristic | Without Mortgage | With Mortgage |
| Housing Units | 911 | 1,629 |
| Median Property Value | $96,600 | $113,900 |
| Median Household Income | $55,781 | $287 |
| Monthly Housing Costs | $540 | $35 |
| Real Estate Taxes | $1,663 | $50 |
Property Value by Mortgage Status in Butler
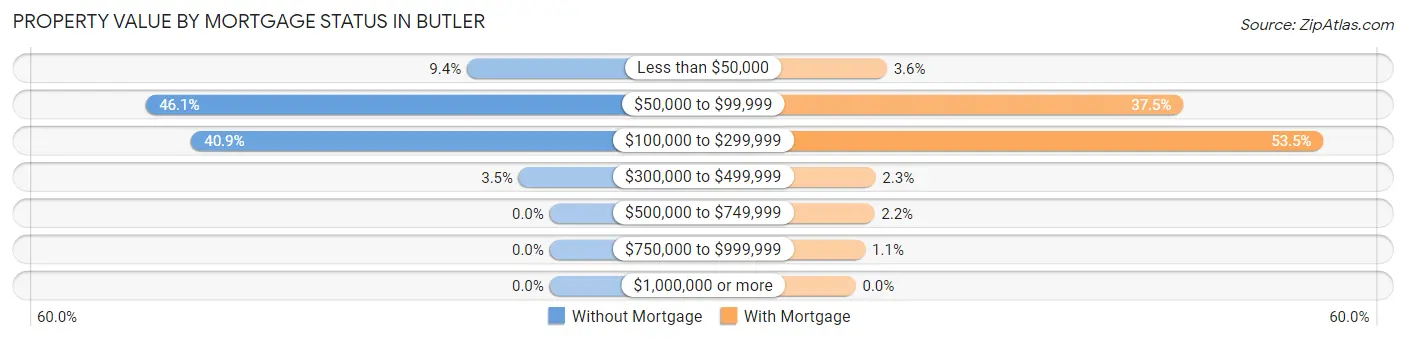
| Property Value | Without Mortgage | With Mortgage |
| Less than $50,000 | 86 (9.4%) | 58 (3.6%) |
| $50,000 to $99,999 | 420 (46.1%) | 610 (37.4%) |
| $100,000 to $299,999 | 373 (40.9%) | 871 (53.5%) |
| $300,000 to $499,999 | 32 (3.5%) | 37 (2.3%) |
| $500,000 to $749,999 | 0 (0.0%) | 35 (2.1%) |
| $750,000 to $999,999 | 0 (0.0%) | 18 (1.1%) |
| $1,000,000 or more | 0 (0.0%) | 0 (0.0%) |
| Total | 911 (100.0%) | 1,629 (100.0%) |
Household Income by Mortgage Status in Butler
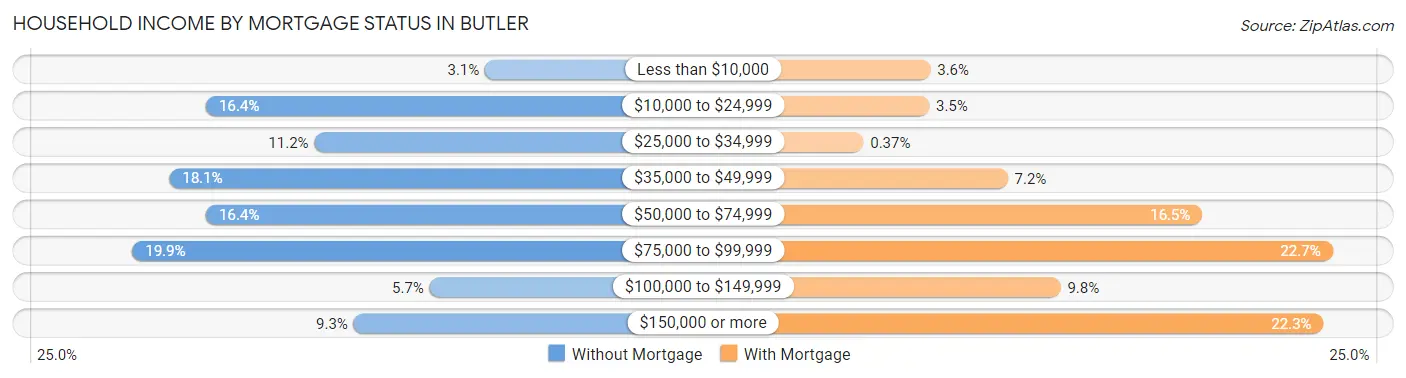
| Household Income | Without Mortgage | With Mortgage |
| Less than $10,000 | 28 (3.1%) | 58 (3.6%) |
| $10,000 to $24,999 | 149 (16.4%) | 57 (3.5%) |
| $25,000 to $34,999 | 102 (11.2%) | 6 (0.4%) |
| $35,000 to $49,999 | 165 (18.1%) | 118 (7.2%) |
| $50,000 to $74,999 | 149 (16.4%) | 269 (16.5%) |
| $75,000 to $99,999 | 181 (19.9%) | 370 (22.7%) |
| $100,000 to $149,999 | 52 (5.7%) | 159 (9.8%) |
| $150,000 or more | 85 (9.3%) | 363 (22.3%) |
| Total | 911 (100.0%) | 1,629 (100.0%) |
Property Value to Household Income Ratio in Butler
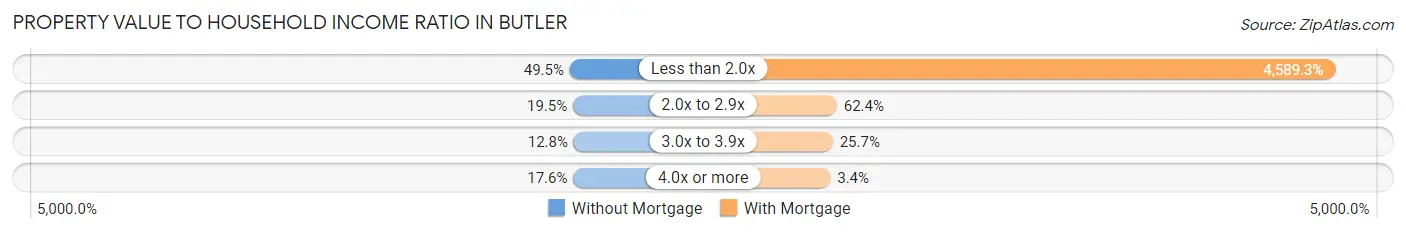
| Value-to-Income Ratio | Without Mortgage | With Mortgage |
| Less than 2.0x | 451 (49.5%) | 74,759 (4,589.3%) |
| 2.0x to 2.9x | 178 (19.5%) | 1,016 (62.4%) |
| 3.0x to 3.9x | 117 (12.8%) | 418 (25.7%) |
| 4.0x or more | 160 (17.6%) | 56 (3.4%) |
| Total | 911 (100.0%) | 1,629 (100.0%) |
Real Estate Taxes by Mortgage Status in Butler
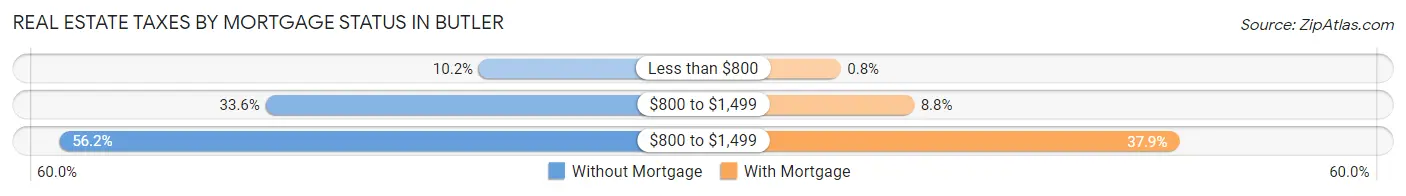
| Property Taxes | Without Mortgage | With Mortgage |
| Less than $800 | 93 (10.2%) | 13 (0.8%) |
| $800 to $1,499 | 306 (33.6%) | 144 (8.8%) |
| $800 to $1,499 | 512 (56.2%) | 618 (37.9%) |
| Total | 911 (100.0%) | 1,629 (100.0%) |
Health & Disability in Butler
Health Insurance Coverage by Age in Butler
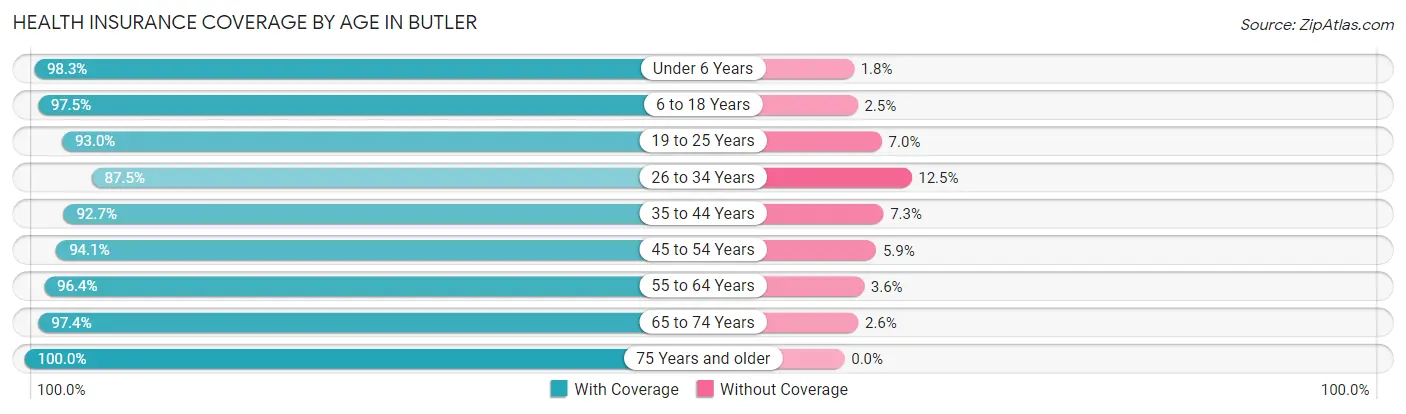
| Age Bracket | With Coverage | Without Coverage |
| Under 6 Years | 900 (98.3%) | 16 (1.8%) |
| 6 to 18 Years | 1,906 (97.5%) | 48 (2.5%) |
| 19 to 25 Years | 1,308 (93.0%) | 98 (7.0%) |
| 26 to 34 Years | 1,472 (87.5%) | 210 (12.5%) |
| 35 to 44 Years | 1,328 (92.7%) | 104 (7.3%) |
| 45 to 54 Years | 1,671 (94.1%) | 105 (5.9%) |
| 55 to 64 Years | 2,119 (96.4%) | 80 (3.6%) |
| 65 to 74 Years | 1,064 (97.4%) | 28 (2.6%) |
| 75 Years and older | 590 (100.0%) | 0 (0.0%) |
| Total | 12,358 (94.7%) | 689 (5.3%) |
Health Insurance Coverage by Citizenship Status in Butler
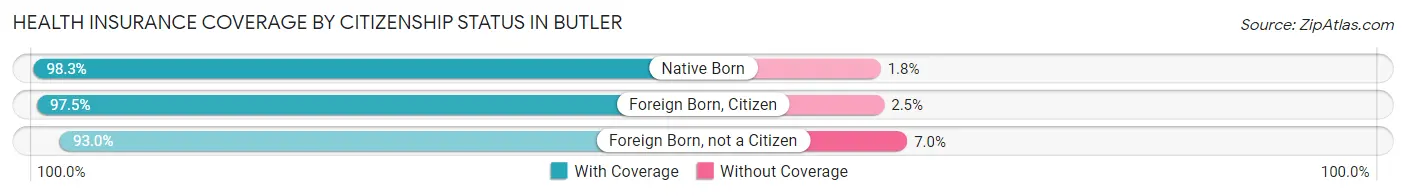
| Citizenship Status | With Coverage | Without Coverage |
| Native Born | 900 (98.3%) | 16 (1.8%) |
| Foreign Born, Citizen | 1,906 (97.5%) | 48 (2.5%) |
| Foreign Born, not a Citizen | 1,308 (93.0%) | 98 (7.0%) |
Health Insurance Coverage by Household Income in Butler
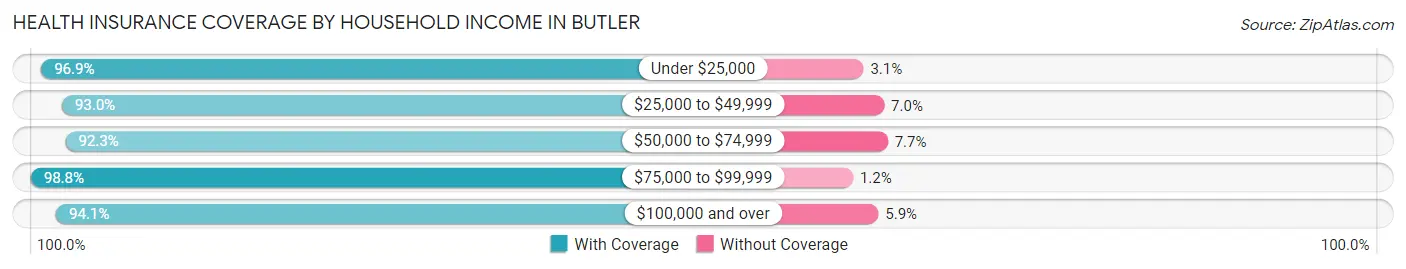
| Household Income | With Coverage | Without Coverage |
| Under $25,000 | 2,914 (96.9%) | 94 (3.1%) |
| $25,000 to $49,999 | 2,699 (93.0%) | 203 (7.0%) |
| $50,000 to $74,999 | 2,290 (92.3%) | 190 (7.7%) |
| $75,000 to $99,999 | 1,532 (98.8%) | 18 (1.2%) |
| $100,000 and over | 2,865 (94.1%) | 180 (5.9%) |
Public vs Private Health Insurance Coverage by Age in Butler
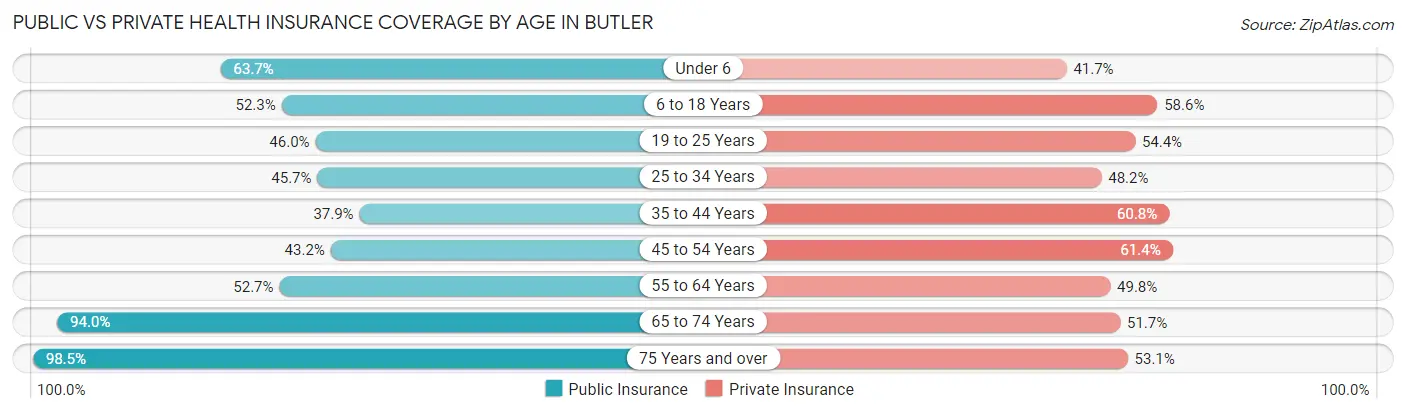
| Age Bracket | Public Insurance | Private Insurance |
| Under 6 | 583 (63.6%) | 382 (41.7%) |
| 6 to 18 Years | 1,022 (52.3%) | 1,144 (58.6%) |
| 19 to 25 Years | 647 (46.0%) | 765 (54.4%) |
| 25 to 34 Years | 768 (45.7%) | 810 (48.2%) |
| 35 to 44 Years | 542 (37.9%) | 870 (60.8%) |
| 45 to 54 Years | 767 (43.2%) | 1,090 (61.4%) |
| 55 to 64 Years | 1,159 (52.7%) | 1,095 (49.8%) |
| 65 to 74 Years | 1,026 (94.0%) | 564 (51.6%) |
| 75 Years and over | 581 (98.5%) | 313 (53.0%) |
| Total | 7,095 (54.4%) | 7,033 (53.9%) |
Disability Status by Sex by Age in Butler
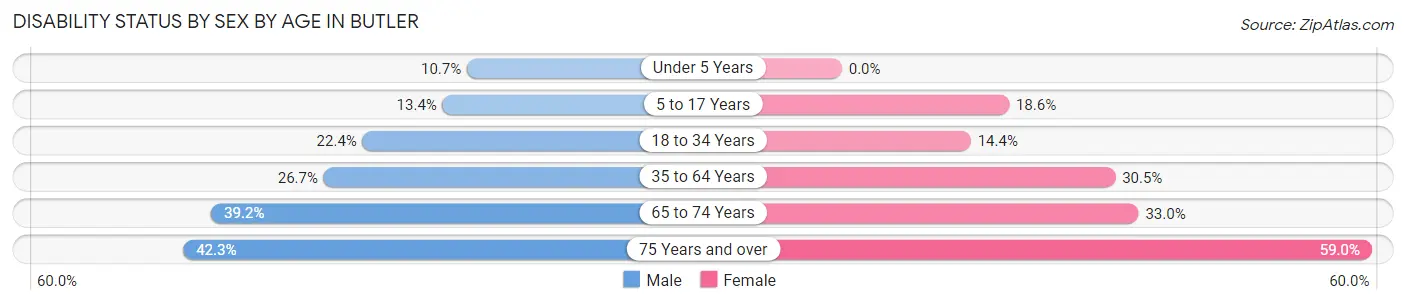
| Age Bracket | Male | Female |
| Under 5 Years | 34 (10.7%) | 0 (0.0%) |
| 5 to 17 Years | 130 (13.4%) | 178 (18.6%) |
| 18 to 34 Years | 400 (22.4%) | 216 (14.4%) |
| 35 to 64 Years | 746 (26.7%) | 795 (30.4%) |
| 65 to 74 Years | 204 (39.2%) | 189 (33.0%) |
| 75 Years and over | 69 (42.3%) | 252 (59.0%) |
Disability Class by Sex by Age in Butler
Disability Class: Hearing Difficulty
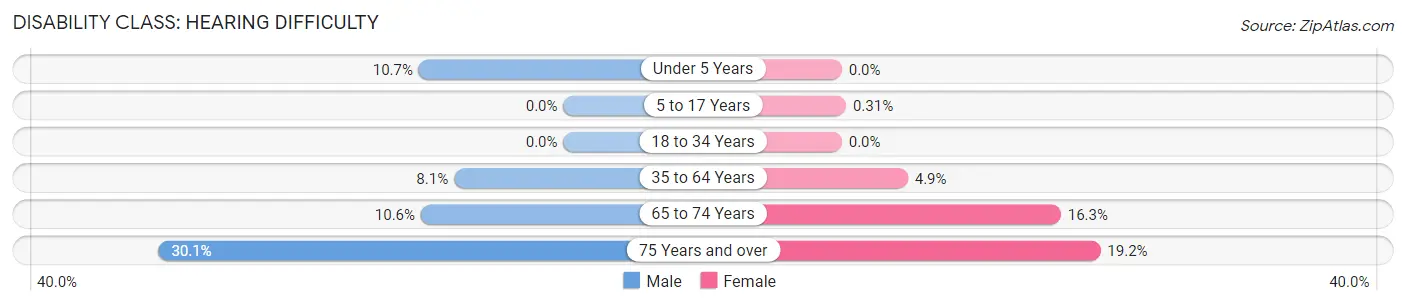
| Age Bracket | Male | Female |
| Under 5 Years | 34 (10.7%) | 0 (0.0%) |
| 5 to 17 Years | 0 (0.0%) | 3 (0.3%) |
| 18 to 34 Years | 0 (0.0%) | 0 (0.0%) |
| 35 to 64 Years | 227 (8.1%) | 128 (4.9%) |
| 65 to 74 Years | 55 (10.6%) | 93 (16.3%) |
| 75 Years and over | 49 (30.1%) | 82 (19.2%) |
Disability Class: Vision Difficulty
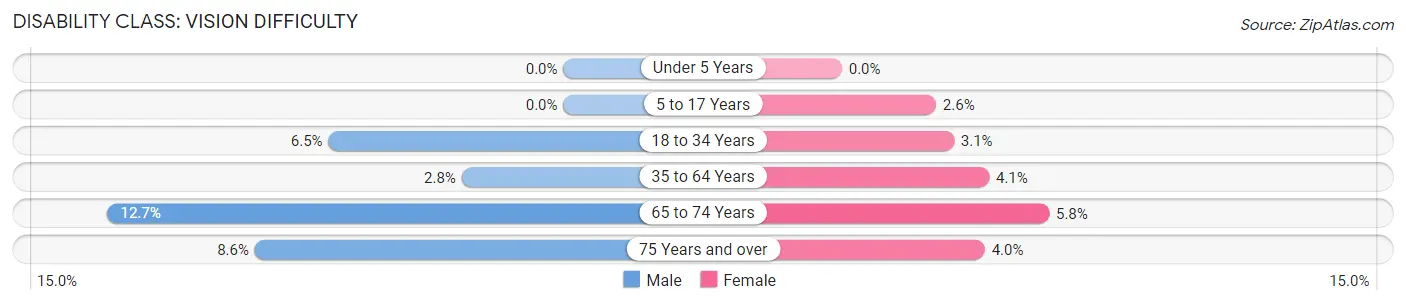
| Age Bracket | Male | Female |
| Under 5 Years | 0 (0.0%) | 0 (0.0%) |
| 5 to 17 Years | 0 (0.0%) | 25 (2.6%) |
| 18 to 34 Years | 117 (6.5%) | 47 (3.1%) |
| 35 to 64 Years | 79 (2.8%) | 107 (4.1%) |
| 65 to 74 Years | 66 (12.7%) | 33 (5.8%) |
| 75 Years and over | 14 (8.6%) | 17 (4.0%) |
Disability Class: Cognitive Difficulty
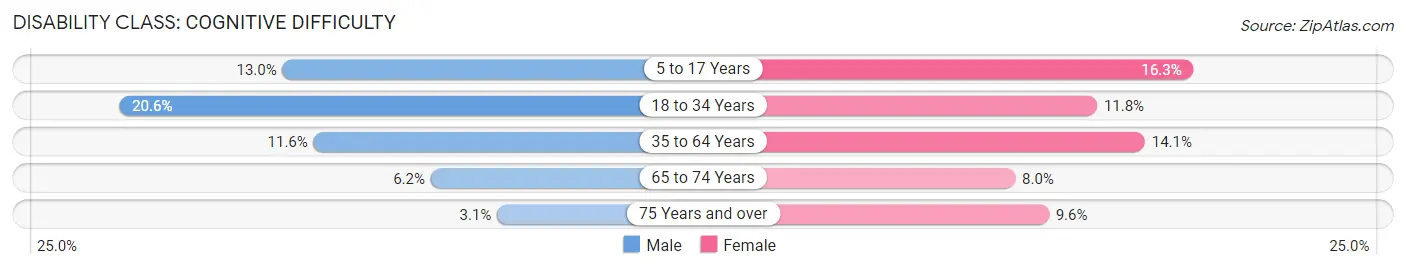
| Age Bracket | Male | Female |
| 5 to 17 Years | 126 (13.0%) | 156 (16.3%) |
| 18 to 34 Years | 369 (20.6%) | 178 (11.8%) |
| 35 to 64 Years | 324 (11.6%) | 367 (14.1%) |
| 65 to 74 Years | 32 (6.1%) | 46 (8.0%) |
| 75 Years and over | 5 (3.1%) | 41 (9.6%) |
Disability Class: Ambulatory Difficulty
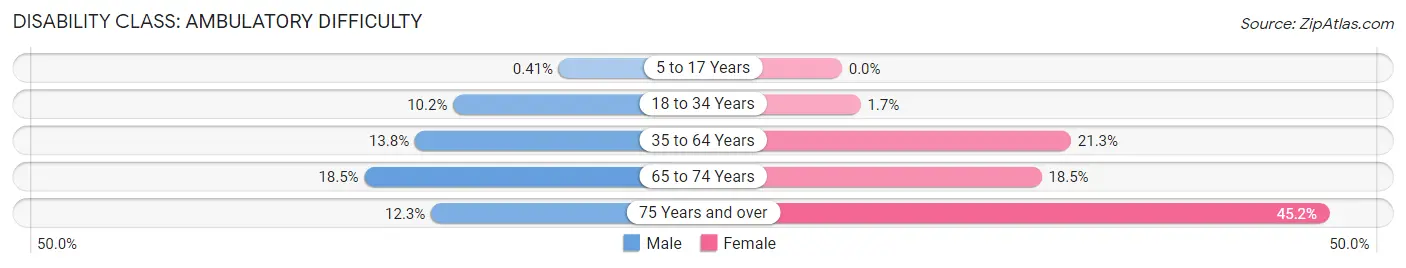
| Age Bracket | Male | Female |
| 5 to 17 Years | 4 (0.4%) | 0 (0.0%) |
| 18 to 34 Years | 183 (10.2%) | 26 (1.7%) |
| 35 to 64 Years | 385 (13.8%) | 555 (21.3%) |
| 65 to 74 Years | 96 (18.5%) | 106 (18.5%) |
| 75 Years and over | 20 (12.3%) | 193 (45.2%) |
Disability Class: Self-Care Difficulty
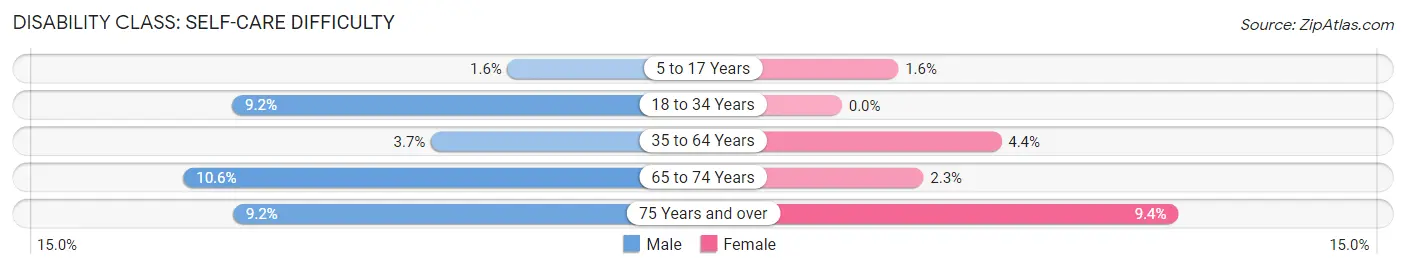
| Age Bracket | Male | Female |
| 5 to 17 Years | 15 (1.5%) | 15 (1.6%) |
| 18 to 34 Years | 165 (9.2%) | 0 (0.0%) |
| 35 to 64 Years | 103 (3.7%) | 116 (4.4%) |
| 65 to 74 Years | 55 (10.6%) | 13 (2.3%) |
| 75 Years and over | 15 (9.2%) | 40 (9.4%) |
Technology Access in Butler
Computing Device Access in Butler
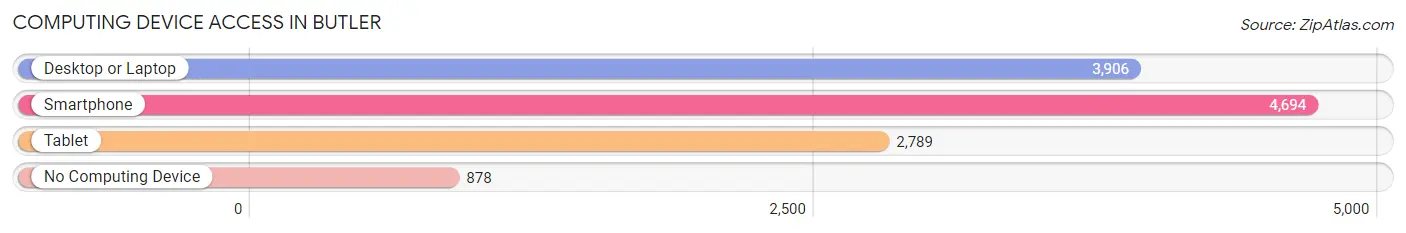
| Device Type | # Households | % Households |
| Desktop or Laptop | 3,906 | 63.2% |
| Smartphone | 4,694 | 76.0% |
| Tablet | 2,789 | 45.2% |
| No Computing Device | 878 | 14.2% |
| Total | 6,177 | 100.0% |
Internet Access in Butler
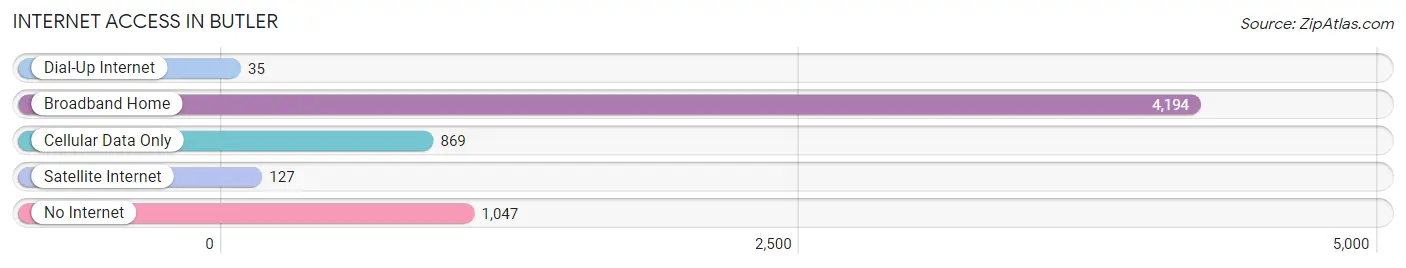
| Internet Type | # Households | % Households |
| Dial-Up Internet | 35 | 0.6% |
| Broadband Home | 4,194 | 67.9% |
| Cellular Data Only | 869 | 14.1% |
| Satellite Internet | 127 | 2.1% |
| No Internet | 1,047 | 17.0% |
| Total | 6,177 | 100.0% |
Butler Summary
Butler, Pennsylvania is a city located in Butler County, Pennsylvania, United States. It is situated approximately 30 miles north of Pittsburgh and is the county seat of Butler County. The city has a population of approximately 13,757 people, according to the 2010 census.
History
The area that is now Butler, Pennsylvania was first settled in 1796 by William and Mary Marshall, who were among the first settlers in the area. The city was officially incorporated in 1803 and was named after General Richard Butler, who was a hero of the American Revolution.
In the early 19th century, Butler was a major center for the production of iron and steel. The city was home to several large steel mills, including the Butler Iron and Steel Company, which was founded in 1872. The city also had a thriving coal mining industry, which provided jobs for many of the city’s residents.
In the late 19th century, Butler became a major center for the production of glass. The city was home to several glass factories, including the Butler Glass Company, which was founded in 1891. The city also had a thriving brick-making industry, which provided jobs for many of the city’s residents.
Geography
Butler is located in western Pennsylvania, approximately 30 miles north of Pittsburgh. The city is situated in the Allegheny Plateau region of the Appalachian Mountains. The city is located on the banks of the Connoquenessing Creek, which flows through the city.
The city has a total area of 4.3 square miles, of which 4.2 square miles is land and 0.1 square miles is water. The city has a humid continental climate, with cold winters and hot, humid summers.
Economy
Butler’s economy is largely based on manufacturing and services. The city is home to several large manufacturing companies, including the Butler Iron and Steel Company, the Butler Glass Company, and the Butler Brick Company. The city also has a thriving healthcare industry, with several hospitals and medical centers located in the city.
The city also has a thriving retail sector, with several shopping centers and malls located in the city. The city is also home to several educational institutions, including Butler County Community College and Slippery Rock University.
Demographics
According to the 2010 census, the population of Butler was 13,757. The city has a population that is predominantly white, with approximately 87.3% of the population being white. The city also has a large Hispanic population, with approximately 8.3% of the population being Hispanic. The city also has a small African American population, with approximately 2.2% of the population being African American.
The median household income in Butler is $41,945, and the median family income is $50,945. The city has a poverty rate of 16.3%, which is higher than the national average. The city also has a high unemployment rate, with approximately 8.2% of the population being unemployed.
Common Questions
What is Per Capita Income in Butler?
Per Capita income in Butler is $26,681.
What is the Median Family Income in Butler?
Median Family Income in Butler is $67,529.
What is the Median Household income in Butler?
Median Household Income in Butler is $39,546.
What is Income or Wage Gap in Butler?
Income or Wage Gap in Butler is 25.2%.
Women in Butler earn 74.8 cents for every dollar earned by a man.
What is Family Income Deficit in Butler?
Family Income Deficit in Butler is $9,709.
Families that are below poverty line in Butler earn $9,709 less on average than the poverty threshold level.
What is Inequality or Gini Index in Butler?
Inequality or Gini Index in Butler is 0.47.
What is the Total Population of Butler?
Total Population of Butler is 13,387.
What is the Total Male Population of Butler?
Total Male Population of Butler is 6,799.
What is the Total Female Population of Butler?
Total Female Population of Butler is 6,588.
What is the Ratio of Males per 100 Females in Butler?
There are 103.20 Males per 100 Females in Butler.
What is the Ratio of Females per 100 Males in Butler?
There are 96.90 Females per 100 Males in Butler.
What is the Median Population Age in Butler?
Median Population Age in Butler is 38.2 Years.
What is the Average Family Size in Butler
Average Family Size in Butler is 3.1 People.
What is the Average Household Size in Butler
Average Household Size in Butler is 2.1 People.
How Large is the Labor Force in Butler?
There are 6,457 People in the Labor Forcein in Butler.
What is the Percentage of People in the Labor Force in Butler?
59.0% of People are in the Labor Force in Butler.
What is the Unemployment Rate in Butler?
Unemployment Rate in Butler is 9.4%.