Medina, MN Map & Demographics
Medina Map
Medina Overview
$108,945
PER CAPITA INCOME
$250,001
AVG FAMILY INCOME
$202,153
AVG HOUSEHOLD INCOME
59.6%
WAGE / INCOME GAP [ % ]
40.4¢/ $1
WAGE / INCOME GAP [ $ ]
0.52
INEQUALITY / GINI INDEX
6,746
TOTAL POPULATION
3,345
MALE POPULATION
3,401
FEMALE POPULATION
98.35
MALES / 100 FEMALES
101.67
FEMALES / 100 MALES
39.2
MEDIAN AGE
3.3
AVG FAMILY SIZE
2.9
AVG HOUSEHOLD SIZE
3,324
LABOR FORCE [ PEOPLE ]
71.4%
PERCENT IN LABOR FORCE
1.8%
UNEMPLOYMENT RATE
Medina Area Codes
Income in Medina
Income Overview in Medina
Per Capita Income in Medina is $108,945, while median incomes of families and households are $250,001 and $202,153 respectively.
| Characteristic | Number | Measure |
| Per Capita Income | 6,746 | $108,945 |
| Median Family Income | 1,879 | $250,001 |
| Mean Family Income | 1,879 | $357,948 |
| Median Household Income | 2,311 | $202,153 |
| Mean Household Income | 2,311 | $316,620 |
| Income Deficit | 1,879 | $0 |
| Wage / Income Gap (%) | 6,746 | 59.57% |
| Wage / Income Gap ($) | 6,746 | 40.43¢ per $1 |
| Gini / Inequality Index | 6,746 | 0.52 |
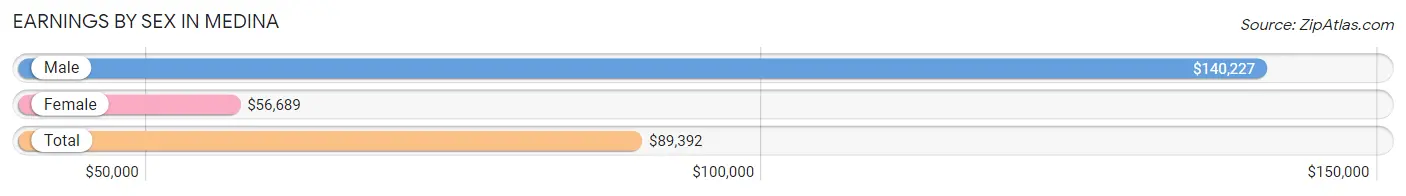
Earnings by Sex in Medina
Average Earnings in Medina are $89,392, $140,227 for men and $56,689 for women, a difference of 59.6%.
| Sex | Number | Average Earnings |
| Male | 2,058 (58.1%) | $140,227 |
| Female | 1,484 (41.9%) | $56,689 |
| Total | 3,542 (100.0%) | $89,392 |
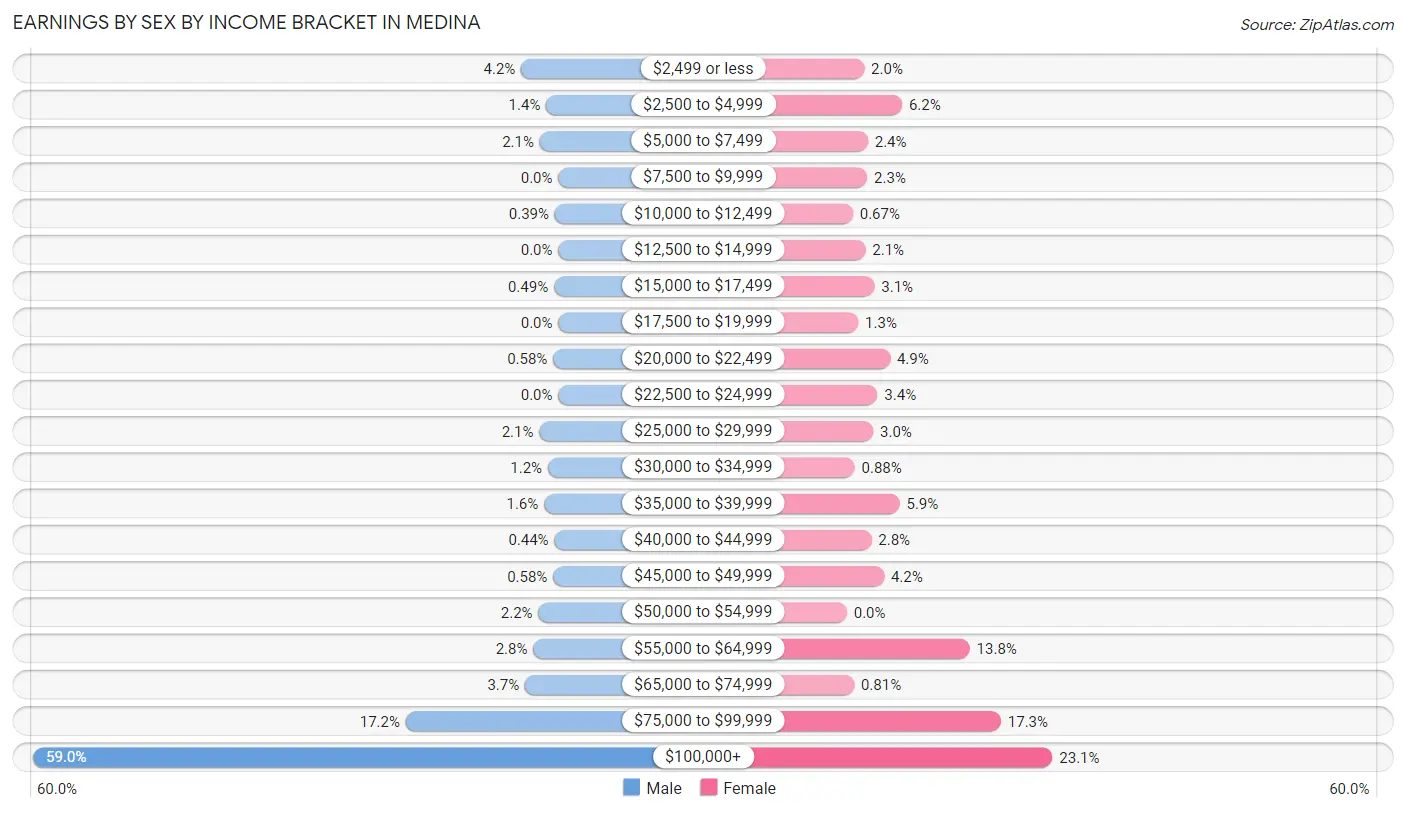
Earnings by Sex by Income Bracket in Medina
The most common earnings brackets in Medina are $100,000+ for men (1,215 | 59.0%) and $100,000+ for women (343 | 23.1%).
| Income | Male | Female |
| $2,499 or less | 86 (4.2%) | 29 (1.9%) |
| $2,500 to $4,999 | 28 (1.4%) | 92 (6.2%) |
| $5,000 to $7,499 | 43 (2.1%) | 35 (2.4%) |
| $7,500 to $9,999 | 0 (0.0%) | 34 (2.3%) |
| $10,000 to $12,499 | 8 (0.4%) | 10 (0.7%) |
| $12,500 to $14,999 | 0 (0.0%) | 31 (2.1%) |
| $15,000 to $17,499 | 10 (0.5%) | 46 (3.1%) |
| $17,500 to $19,999 | 0 (0.0%) | 19 (1.3%) |
| $20,000 to $22,499 | 12 (0.6%) | 72 (4.9%) |
| $22,500 to $24,999 | 0 (0.0%) | 51 (3.4%) |
| $25,000 to $29,999 | 44 (2.1%) | 44 (3.0%) |
| $30,000 to $34,999 | 24 (1.2%) | 13 (0.9%) |
| $35,000 to $39,999 | 33 (1.6%) | 88 (5.9%) |
| $40,000 to $44,999 | 9 (0.4%) | 41 (2.8%) |
| $45,000 to $49,999 | 12 (0.6%) | 62 (4.2%) |
| $50,000 to $54,999 | 46 (2.2%) | 0 (0.0%) |
| $55,000 to $64,999 | 58 (2.8%) | 205 (13.8%) |
| $65,000 to $74,999 | 77 (3.7%) | 12 (0.8%) |
| $75,000 to $99,999 | 353 (17.2%) | 257 (17.3%) |
| $100,000+ | 1,215 (59.0%) | 343 (23.1%) |
| Total | 2,058 (100.0%) | 1,484 (100.0%) |
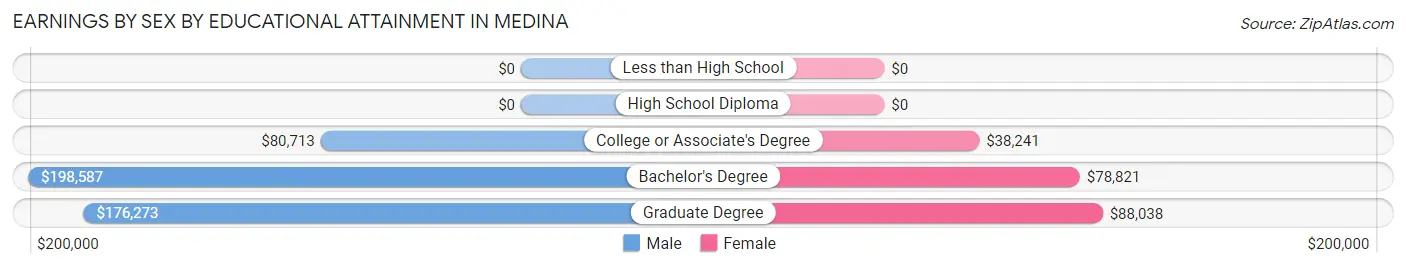
Earnings by Sex by Educational Attainment in Medina
Average earnings in Medina are $146,500 for men and $58,217 for women, a difference of 60.3%. Men with an educational attainment of bachelor's degree enjoy the highest average annual earnings of $198,587, while those with college or associate's degree education earn the least with $80,713. Women with an educational attainment of graduate degree earn the most with the average annual earnings of $88,038, while those with college or associate's degree education have the smallest earnings of $38,241.
| Educational Attainment | Male Income | Female Income |
| Less than High School | - | - |
| High School Diploma | - | - |
| College or Associate's Degree | $80,713 | $38,241 |
| Bachelor's Degree | $198,587 | $78,821 |
| Graduate Degree | $176,273 | $88,038 |
| Total | $146,500 | $58,217 |
Family Income in Medina
Family Income Brackets in Medina
According to the Medina family income data, there are 1,112 families falling into the $200,000+ income range, which is the most common income bracket and makes up 59.2% of all families.
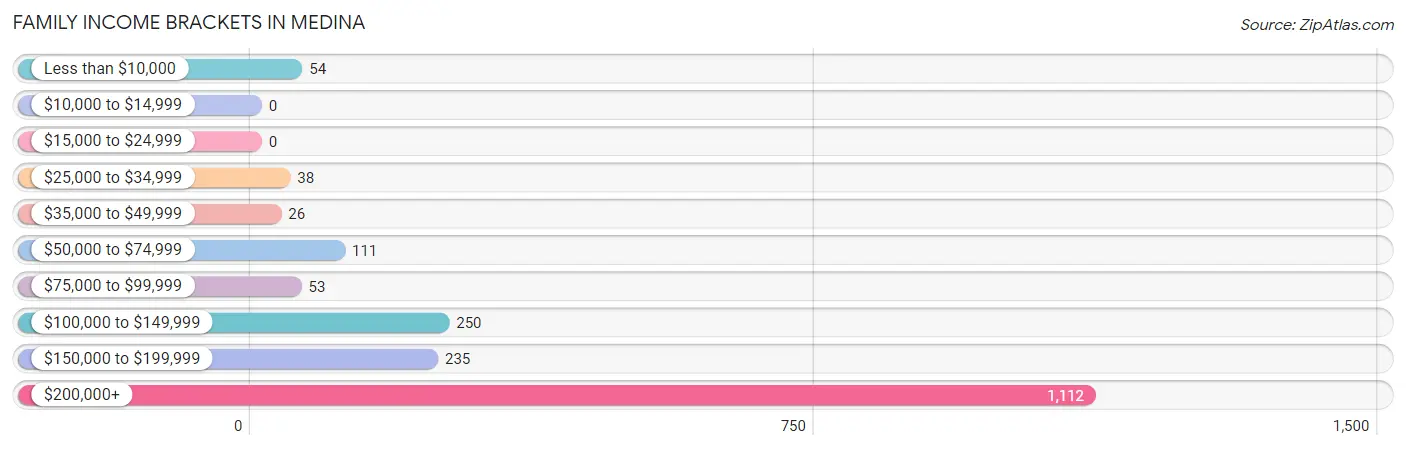
| Income Bracket | # Families | % Families |
| Less than $10,000 | 54 | 2.9% |
| $10,000 to $14,999 | 0 | 0.0% |
| $15,000 to $24,999 | 0 | 0.0% |
| $25,000 to $34,999 | 38 | 2.0% |
| $35,000 to $49,999 | 26 | 1.4% |
| $50,000 to $74,999 | 111 | 5.9% |
| $75,000 to $99,999 | 53 | 2.8% |
| $100,000 to $149,999 | 250 | 13.3% |
| $150,000 to $199,999 | 235 | 12.5% |
| $200,000+ | 1,112 | 59.2% |
Family Income by Famaliy Size in Medina
4-person families (643 | 34.2%) account for the highest median family income in Medina with $250,001 per family, while 2-person families (633 | 33.7%) have the highest median income of $89,394 per family member.
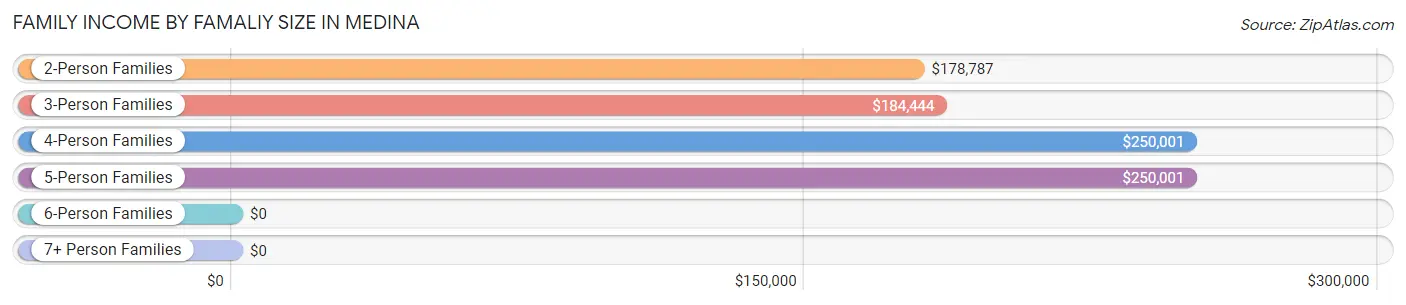
| Income Bracket | # Families | Median Income |
| 2-Person Families | 633 (33.7%) | $178,787 |
| 3-Person Families | 358 (19.1%) | $184,444 |
| 4-Person Families | 643 (34.2%) | $250,001 |
| 5-Person Families | 204 (10.9%) | $250,001 |
| 6-Person Families | 21 (1.1%) | $0 |
| 7+ Person Families | 20 (1.1%) | $0 |
| Total | 1,879 (100.0%) | $250,001 |
Family Income by Number of Earners in Medina
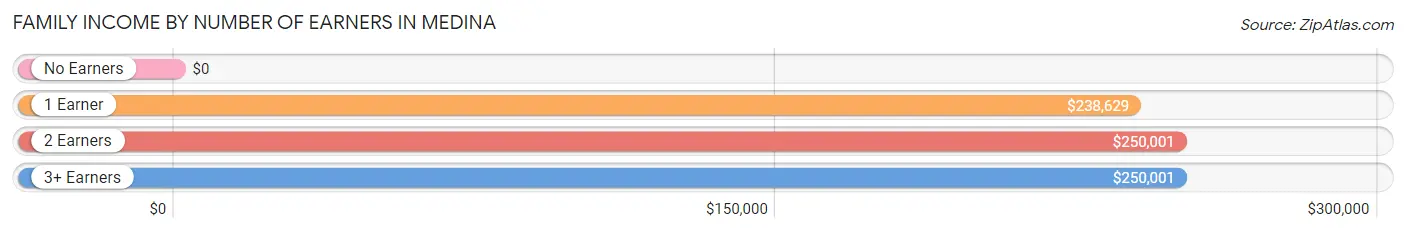
| Number of Earners | # Families | Median Income |
| No Earners | 106 (5.6%) | $0 |
| 1 Earner | 614 (32.7%) | $238,629 |
| 2 Earners | 1,012 (53.9%) | $250,001 |
| 3+ Earners | 147 (7.8%) | $250,001 |
| Total | 1,879 (100.0%) | $250,001 |
Household Income in Medina
Household Income Brackets in Medina
With 1,172 households falling in the category, the $200,000+ income range is the most frequent in Medina, accounting for 50.7% of all households.
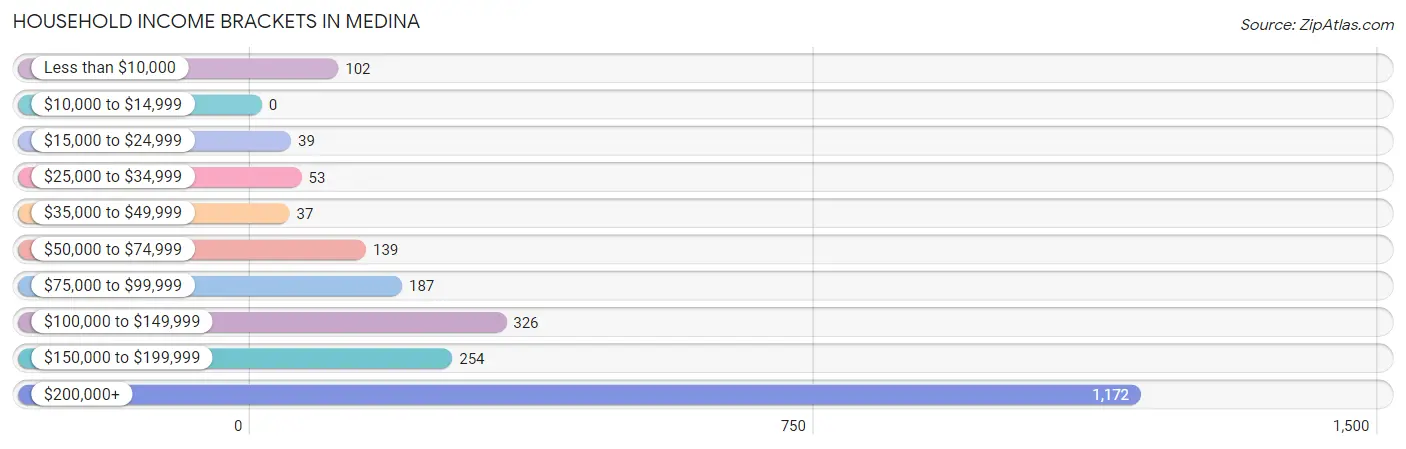
| Income Bracket | # Households | % Households |
| Less than $10,000 | 102 | 4.4% |
| $10,000 to $14,999 | 0 | 0.0% |
| $15,000 to $24,999 | 39 | 1.7% |
| $25,000 to $34,999 | 53 | 2.3% |
| $35,000 to $49,999 | 37 | 1.6% |
| $50,000 to $74,999 | 139 | 6.0% |
| $75,000 to $99,999 | 187 | 8.1% |
| $100,000 to $149,999 | 326 | 14.1% |
| $150,000 to $199,999 | 254 | 11.0% |
| $200,000+ | 1,172 | 50.7% |
Household Income by Householder Age in Medina
The median household income in Medina is $202,153, with the highest median household income of $250,001 found in the 25 to 44 years age bracket for the primary householder. A total of 787 households (34.1%) fall into this category. Meanwhile, the 15 to 24 years age bracket for the primary householder has the lowest median household income of $0, with 16 households (0.7%) in this group.
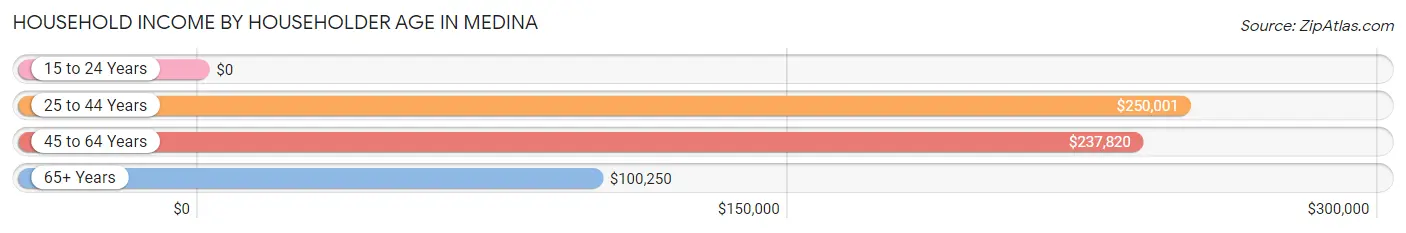
| Income Bracket | # Households | Median Income |
| 15 to 24 Years | 16 (0.7%) | $0 |
| 25 to 44 Years | 787 (34.1%) | $250,001 |
| 45 to 64 Years | 1,145 (49.5%) | $237,820 |
| 65+ Years | 363 (15.7%) | $100,250 |
| Total | 2,311 (100.0%) | $202,153 |
Poverty in Medina
Income Below Poverty by Sex and Age in Medina
With 2.5% poverty level for males and 4.3% for females among the residents of Medina, 25 to 34 year old males and 75 year old and over females are the most vulnerable to poverty, with 44 males (15.9%) and 23 females (26.1%) in their respective age groups living below the poverty level.
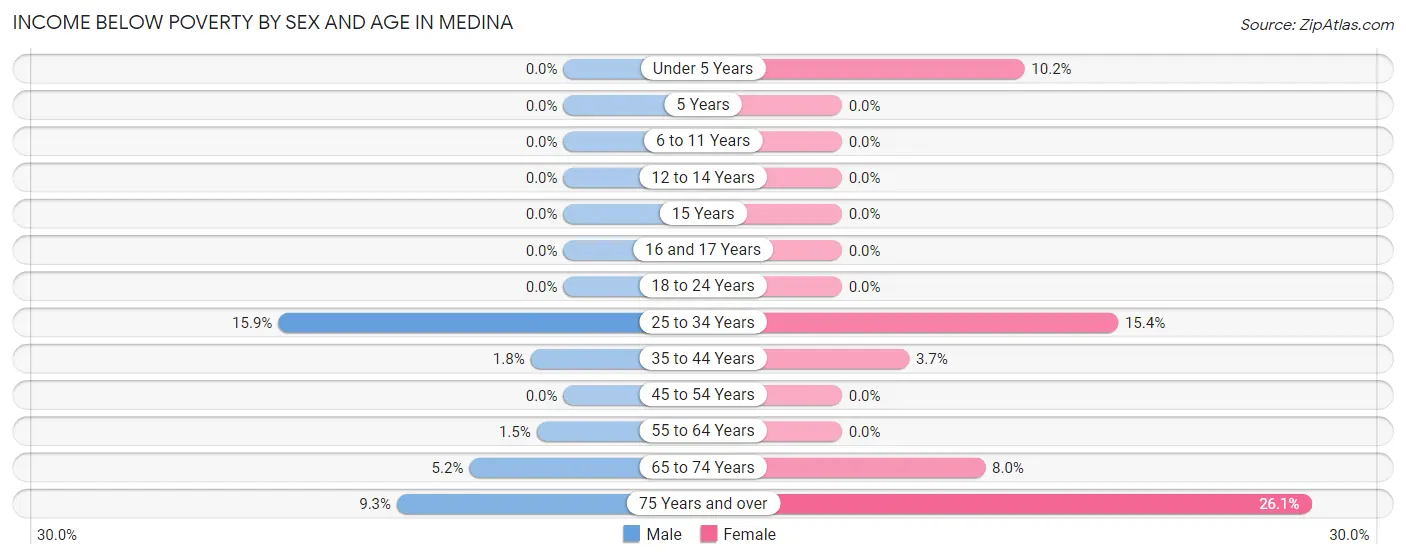
| Age Bracket | Male | Female |
| Under 5 Years | 0 (0.0%) | 42 (10.2%) |
| 5 Years | 0 (0.0%) | 0 (0.0%) |
| 6 to 11 Years | 0 (0.0%) | 0 (0.0%) |
| 12 to 14 Years | 0 (0.0%) | 0 (0.0%) |
| 15 Years | 0 (0.0%) | 0 (0.0%) |
| 16 and 17 Years | 0 (0.0%) | 0 (0.0%) |
| 18 to 24 Years | 0 (0.0%) | 0 (0.0%) |
| 25 to 34 Years | 44 (15.9%) | 42 (15.4%) |
| 35 to 44 Years | 8 (1.8%) | 20 (3.7%) |
| 45 to 54 Years | 0 (0.0%) | 0 (0.0%) |
| 55 to 64 Years | 9 (1.5%) | 0 (0.0%) |
| 65 to 74 Years | 10 (5.2%) | 19 (8.0%) |
| 75 Years and over | 14 (9.3%) | 23 (26.1%) |
| Total | 85 (2.5%) | 146 (4.3%) |
Income Above Poverty by Sex and Age in Medina
According to the poverty statistics in Medina, males aged under 5 years and females aged 5 years are the age groups that are most secure financially, with 100.0% of males and 100.0% of females in these age groups living above the poverty line.
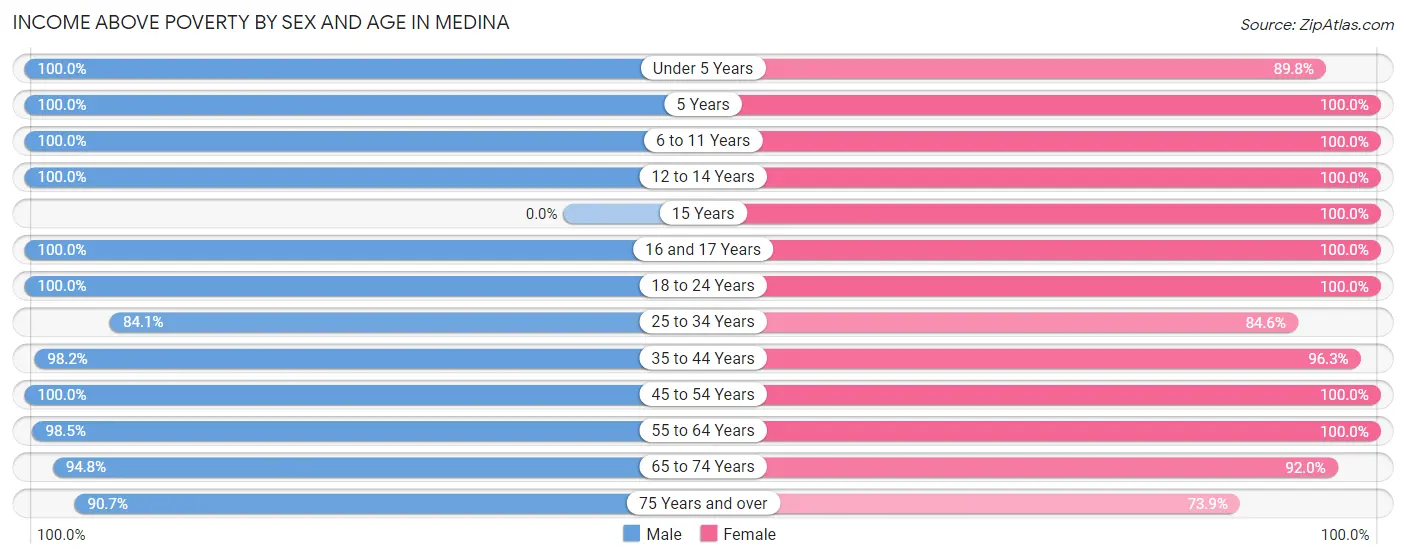
| Age Bracket | Male | Female |
| Under 5 Years | 136 (100.0%) | 371 (89.8%) |
| 5 Years | 69 (100.0%) | 32 (100.0%) |
| 6 to 11 Years | 528 (100.0%) | 507 (100.0%) |
| 12 to 14 Years | 182 (100.0%) | 137 (100.0%) |
| 15 Years | 0 (0.0%) | 87 (100.0%) |
| 16 and 17 Years | 95 (100.0%) | 47 (100.0%) |
| 18 to 24 Years | 47 (100.0%) | 127 (100.0%) |
| 25 to 34 Years | 233 (84.1%) | 231 (84.6%) |
| 35 to 44 Years | 428 (98.2%) | 515 (96.3%) |
| 45 to 54 Years | 628 (100.0%) | 567 (100.0%) |
| 55 to 64 Years | 596 (98.5%) | 342 (100.0%) |
| 65 to 74 Years | 181 (94.8%) | 219 (92.0%) |
| 75 Years and over | 137 (90.7%) | 65 (73.9%) |
| Total | 3,260 (97.5%) | 3,247 (95.7%) |
Income Below Poverty Among Married-Couple Families in Medina
The poverty statistics for married-couple families in Medina show that 3.0% or 54 of the total 1,771 families live below the poverty line. Families with 1 or 2 children have the highest poverty rate of 5.4%, comprising of 44 families. On the other hand, families with 3 or 4 children have the lowest poverty rate of 0.0%, which includes 0 families.
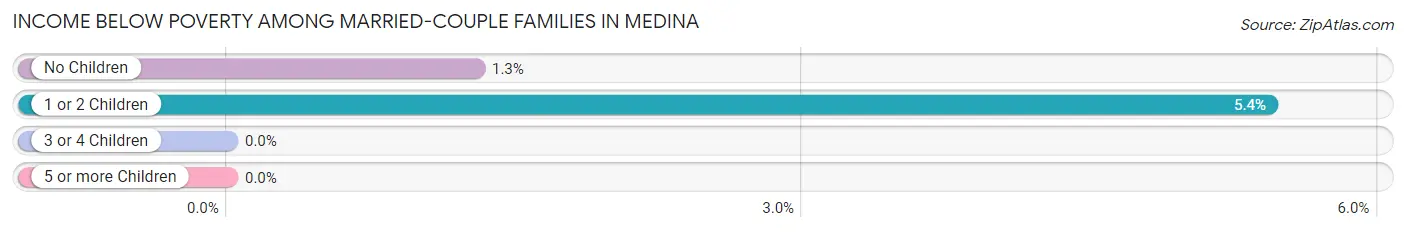
| Children | Above Poverty | Below Poverty |
| No Children | 764 (98.7%) | 10 (1.3%) |
| 1 or 2 Children | 766 (94.6%) | 44 (5.4%) |
| 3 or 4 Children | 180 (100.0%) | 0 (0.0%) |
| 5 or more Children | 7 (100.0%) | 0 (0.0%) |
| Total | 1,717 (97.0%) | 54 (3.0%) |
Income Below Poverty Among Single-Parent Households in Medina
| Children | Single Father | Single Mother |
| No Children | 0 (0.0%) | 0 (0.0%) |
| 1 or 2 Children | 0 (0.0%) | 0 (0.0%) |
| 3 or 4 Children | 0 (0.0%) | 0 (0.0%) |
| 5 or more Children | 0 (0.0%) | 0 (0.0%) |
| Total | 0 (0.0%) | 0 (0.0%) |
Income Below Poverty Among Married-Couple vs Single-Parent Households in Medina
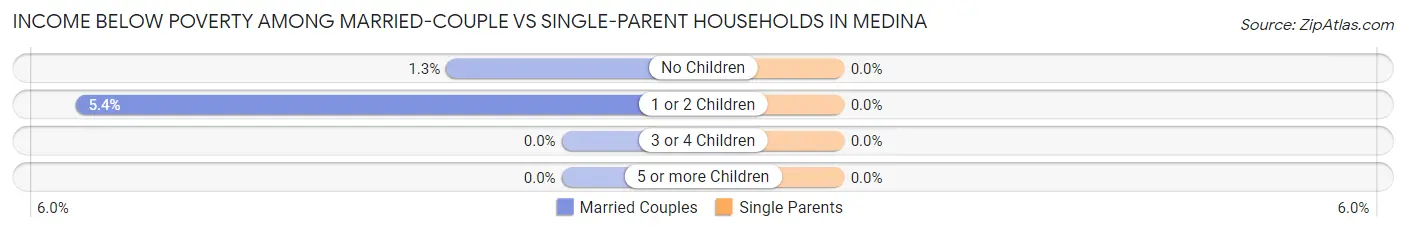
| Children | Married-Couple Families | Single-Parent Households |
| No Children | 10 (1.3%) | 0 (0.0%) |
| 1 or 2 Children | 44 (5.4%) | 0 (0.0%) |
| 3 or 4 Children | 0 (0.0%) | 0 (0.0%) |
| 5 or more Children | 0 (0.0%) | 0 (0.0%) |
| Total | 54 (3.0%) | 0 (0.0%) |
Race in Medina
The most populous races in Medina are White / Caucasian (5,428 | 80.5%), Asian (765 | 11.3%), and Two or more Races (321 | 4.8%).
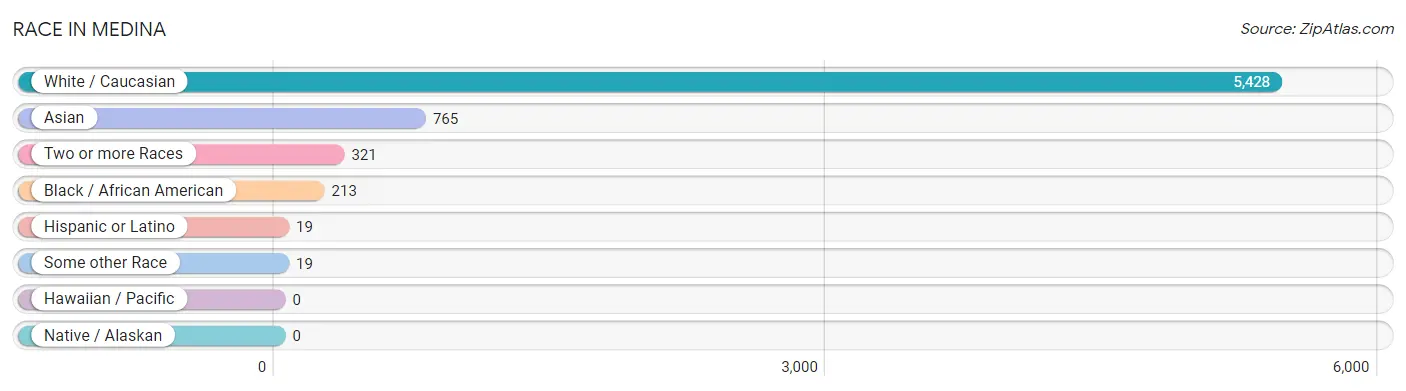
| Race | # Population | % Population |
| Asian | 765 | 11.3% |
| Black / African American | 213 | 3.2% |
| Hawaiian / Pacific | 0 | 0.0% |
| Hispanic or Latino | 19 | 0.3% |
| Native / Alaskan | 0 | 0.0% |
| White / Caucasian | 5,428 | 80.5% |
| Two or more Races | 321 | 4.8% |
| Some other Race | 19 | 0.3% |
| Total | 6,746 | 100.0% |
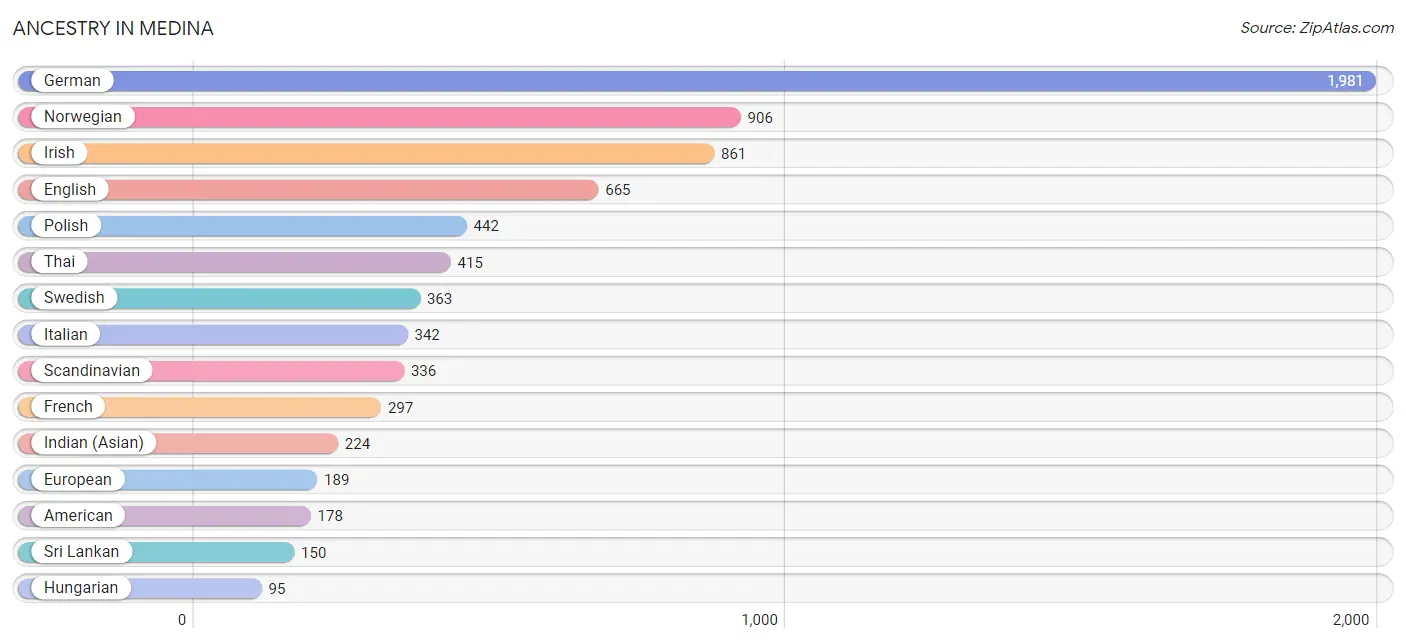
Ancestry in Medina
The most populous ancestries reported in Medina are German (1,981 | 29.4%), Norwegian (906 | 13.4%), Irish (861 | 12.8%), English (665 | 9.9%), and Polish (442 | 6.6%), together accounting for 72.0% of all Medina residents.
| Ancestry | # Population | % Population |
| African | 8 | 0.1% |
| American | 178 | 2.6% |
| Arab | 76 | 1.1% |
| Austrian | 23 | 0.3% |
| Belgian | 13 | 0.2% |
| Blackfeet | 5 | 0.1% |
| Burmese | 69 | 1.0% |
| Canadian | 16 | 0.2% |
| Cherokee | 12 | 0.2% |
| Chickasaw | 42 | 0.6% |
| Croatian | 15 | 0.2% |
| Czech | 44 | 0.6% |
| Czechoslovakian | 17 | 0.3% |
| Danish | 92 | 1.4% |
| Dutch | 23 | 0.3% |
| Eastern European | 21 | 0.3% |
| English | 665 | 9.9% |
| European | 189 | 2.8% |
| Filipino | 52 | 0.8% |
| Finnish | 84 | 1.3% |
| French | 297 | 4.4% |
| French Canadian | 54 | 0.8% |
| German | 1,981 | 29.4% |
| Hungarian | 95 | 1.4% |
| Indian (Asian) | 224 | 3.3% |
| Irish | 861 | 12.8% |
| Italian | 342 | 5.1% |
| Lithuanian | 39 | 0.6% |
| Mongolian | 23 | 0.3% |
| Northern European | 59 | 0.9% |
| Norwegian | 906 | 13.4% |
| Palestinian | 76 | 1.1% |
| Peruvian | 19 | 0.3% |
| Polish | 442 | 6.6% |
| Russian | 51 | 0.8% |
| Scandinavian | 336 | 5.0% |
| Scotch-Irish | 45 | 0.7% |
| Scottish | 59 | 0.9% |
| Sioux | 5 | 0.1% |
| Slovene | 10 | 0.2% |
| South American | 19 | 0.3% |
| Sri Lankan | 150 | 2.2% |
| Subsaharan African | 8 | 0.1% |
| Swedish | 363 | 5.4% |
| Swiss | 17 | 0.3% |
| Thai | 415 | 6.1% |
| Welsh | 12 | 0.2% | View All 47 Rows |
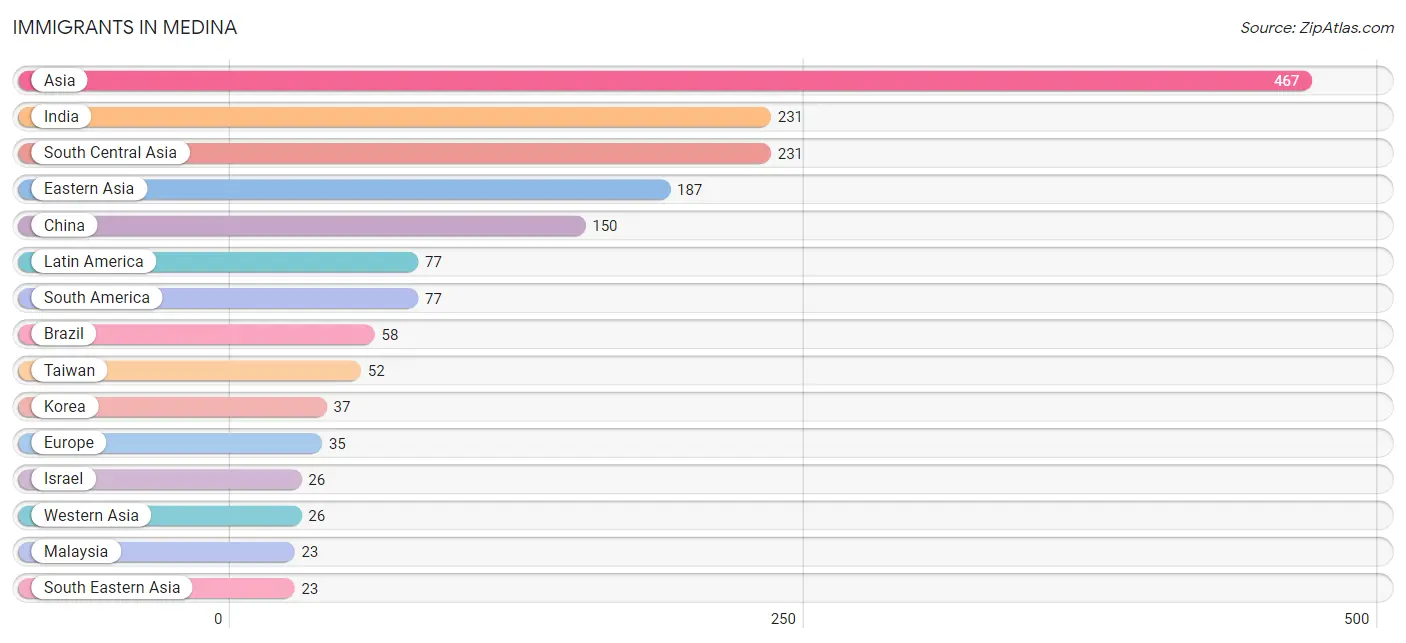
Immigrants in Medina
The most numerous immigrant groups reported in Medina came from Asia (467 | 6.9%), India (231 | 3.4%), South Central Asia (231 | 3.4%), Eastern Asia (187 | 2.8%), and China (150 | 2.2%), together accounting for 18.8% of all Medina residents.
| Immigration Origin | # Population | % Population |
| Asia | 467 | 6.9% |
| Brazil | 58 | 0.9% |
| China | 150 | 2.2% |
| Eastern Asia | 187 | 2.8% |
| Eastern Europe | 21 | 0.3% |
| Europe | 35 | 0.5% |
| India | 231 | 3.4% |
| Ireland | 14 | 0.2% |
| Israel | 26 | 0.4% |
| Korea | 37 | 0.5% |
| Latin America | 77 | 1.1% |
| Latvia | 21 | 0.3% |
| Malaysia | 23 | 0.3% |
| Northern Europe | 14 | 0.2% |
| Peru | 19 | 0.3% |
| South America | 77 | 1.1% |
| South Central Asia | 231 | 3.4% |
| South Eastern Asia | 23 | 0.3% |
| Taiwan | 52 | 0.8% |
| Western Asia | 26 | 0.4% | View All 20 Rows |
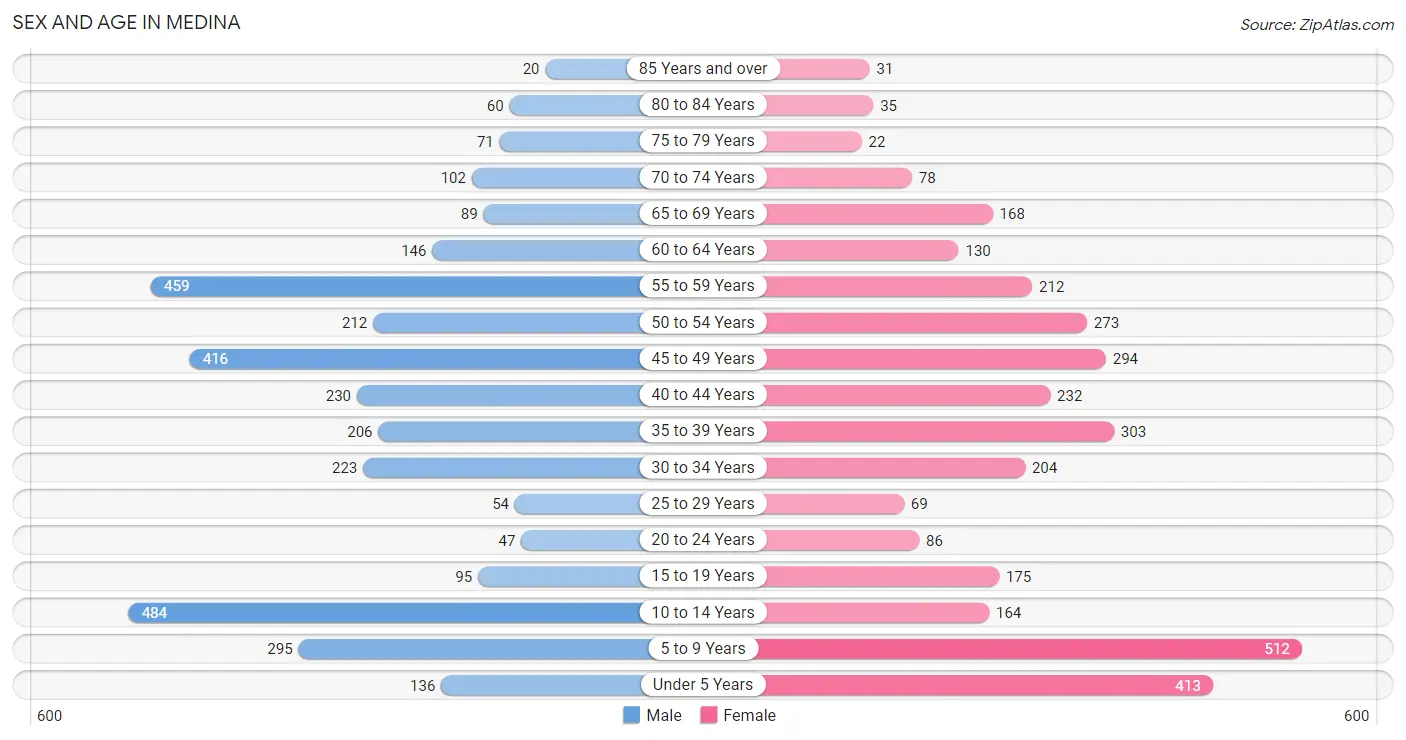
Sex and Age in Medina
Sex and Age in Medina
The most populous age groups in Medina are 10 to 14 Years (484 | 14.5%) for men and 5 to 9 Years (512 | 15.0%) for women.
| Age Bracket | Male | Female |
| Under 5 Years | 136 (4.1%) | 413 (12.1%) |
| 5 to 9 Years | 295 (8.8%) | 512 (15.0%) |
| 10 to 14 Years | 484 (14.5%) | 164 (4.8%) |
| 15 to 19 Years | 95 (2.8%) | 175 (5.1%) |
| 20 to 24 Years | 47 (1.4%) | 86 (2.5%) |
| 25 to 29 Years | 54 (1.6%) | 69 (2.0%) |
| 30 to 34 Years | 223 (6.7%) | 204 (6.0%) |
| 35 to 39 Years | 206 (6.2%) | 303 (8.9%) |
| 40 to 44 Years | 230 (6.9%) | 232 (6.8%) |
| 45 to 49 Years | 416 (12.4%) | 294 (8.6%) |
| 50 to 54 Years | 212 (6.3%) | 273 (8.0%) |
| 55 to 59 Years | 459 (13.7%) | 212 (6.2%) |
| 60 to 64 Years | 146 (4.4%) | 130 (3.8%) |
| 65 to 69 Years | 89 (2.7%) | 168 (4.9%) |
| 70 to 74 Years | 102 (3.0%) | 78 (2.3%) |
| 75 to 79 Years | 71 (2.1%) | 22 (0.6%) |
| 80 to 84 Years | 60 (1.8%) | 35 (1.0%) |
| 85 Years and over | 20 (0.6%) | 31 (0.9%) |
| Total | 3,345 (100.0%) | 3,401 (100.0%) |
Families and Households in Medina
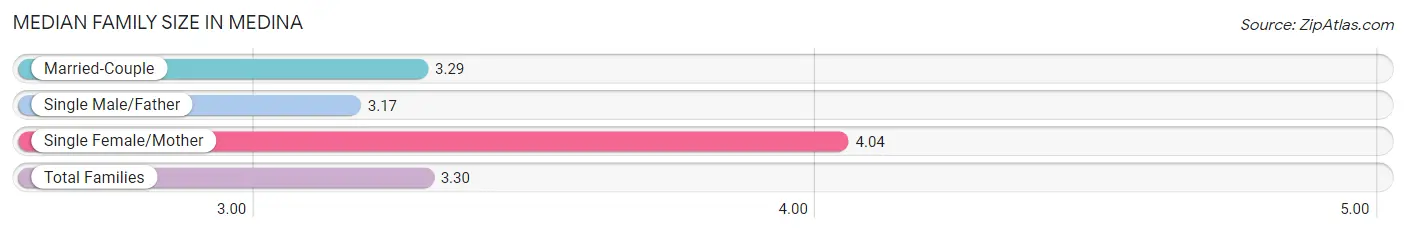
Median Family Size in Medina
The median family size in Medina is 3.30 persons per family, with single female/mother families (45 | 2.4%) accounting for the largest median family size of 4.04 persons per family. On the other hand, single male/father families (63 | 3.4%) represent the smallest median family size with 3.17 persons per family.
| Family Type | # Families | Family Size |
| Married-Couple | 1,771 (94.3%) | 3.29 |
| Single Male/Father | 63 (3.4%) | 3.17 |
| Single Female/Mother | 45 (2.4%) | 4.04 |
| Total Families | 1,879 (100.0%) | 3.30 |
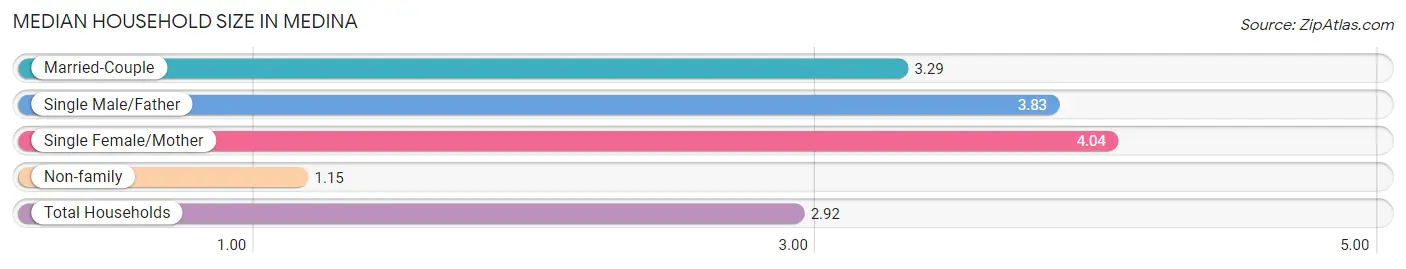
Median Household Size in Medina
The median household size in Medina is 2.92 persons per household, with single female/mother households (45 | 1.9%) accounting for the largest median household size of 4.04 persons per household. non-family households (432 | 18.7%) represent the smallest median household size with 1.15 persons per household.
| Household Type | # Households | Household Size |
| Married-Couple | 1,771 (76.6%) | 3.29 |
| Single Male/Father | 63 (2.7%) | 3.83 |
| Single Female/Mother | 45 (1.9%) | 4.04 |
| Non-family | 432 (18.7%) | 1.15 |
| Total Households | 2,311 (100.0%) | 2.92 |
Household Size by Marriage Status in Medina
Out of a total of 2,311 households in Medina, 1,879 (81.3%) are family households, while 432 (18.7%) are nonfamily households. The most numerous type of family households are 4-person households, comprising 622, and the most common type of nonfamily households are 1-person households, comprising 386.
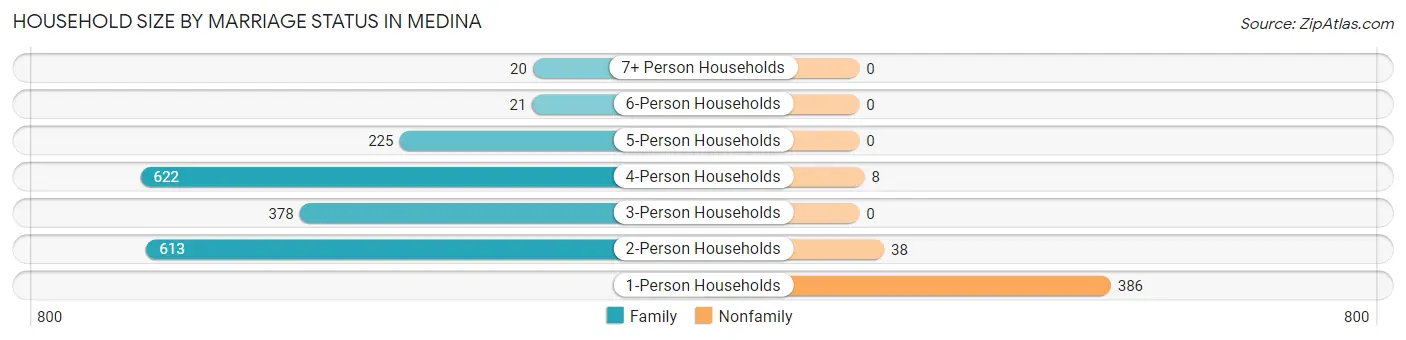
| Household Size | Family Households | Nonfamily Households |
| 1-Person Households | - | 386 (16.7%) |
| 2-Person Households | 613 (26.5%) | 38 (1.6%) |
| 3-Person Households | 378 (16.4%) | 0 (0.0%) |
| 4-Person Households | 622 (26.9%) | 8 (0.4%) |
| 5-Person Households | 225 (9.7%) | 0 (0.0%) |
| 6-Person Households | 21 (0.9%) | 0 (0.0%) |
| 7+ Person Households | 20 (0.9%) | 0 (0.0%) |
| Total | 1,879 (81.3%) | 432 (18.7%) |
Female Fertility in Medina
Fertility by Age in Medina
Average fertility rate in Medina is 52.0 births per 1,000 women. Women in the age bracket of 20 to 34 years have the highest fertility rate with 201.0 births per 1,000 women. Women in the age bracket of 20 to 34 years acount for 100.0% of all women with births.
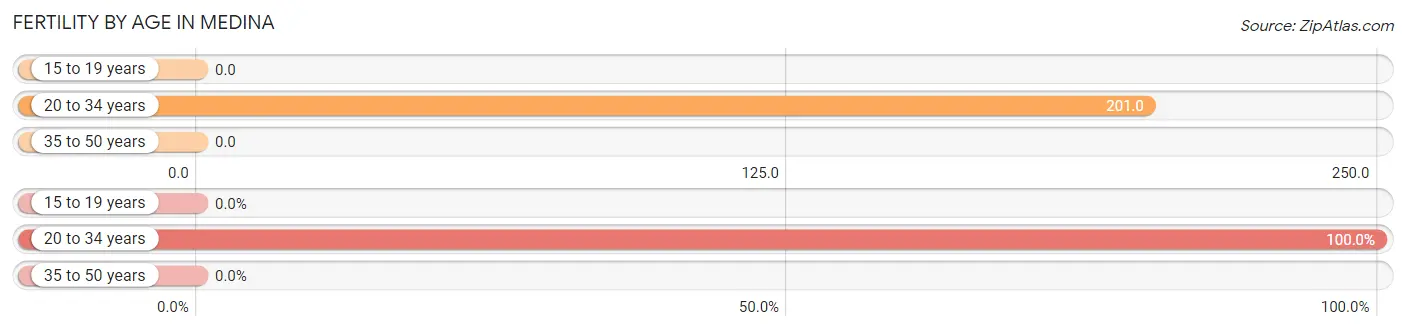
| Age Bracket | Women with Births | Births / 1,000 Women |
| 15 to 19 years | 0 (0.0%) | 0.0 |
| 20 to 34 years | 72 (100.0%) | 201.0 |
| 35 to 50 years | 0 (0.0%) | 0.0 |
| Total | 72 (100.0%) | 52.0 |
Fertility by Age by Marriage Status in Medina
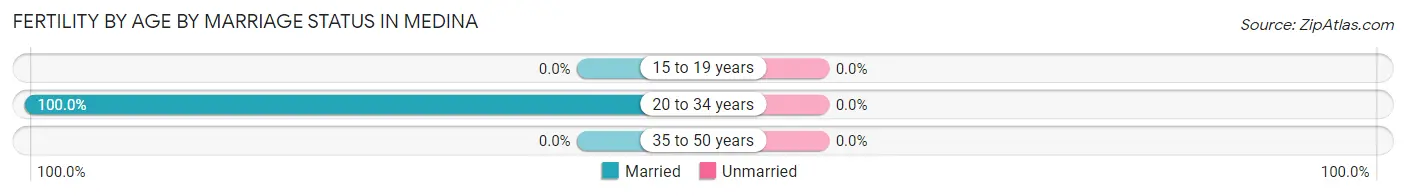
| Age Bracket | Married | Unmarried |
| 15 to 19 years | 0 (0.0%) | 0 (0.0%) |
| 20 to 34 years | 72 (100.0%) | 0 (0.0%) |
| 35 to 50 years | 0 (0.0%) | 0 (0.0%) |
| Total | 72 (100.0%) | 0 (0.0%) |
Fertility by Education in Medina
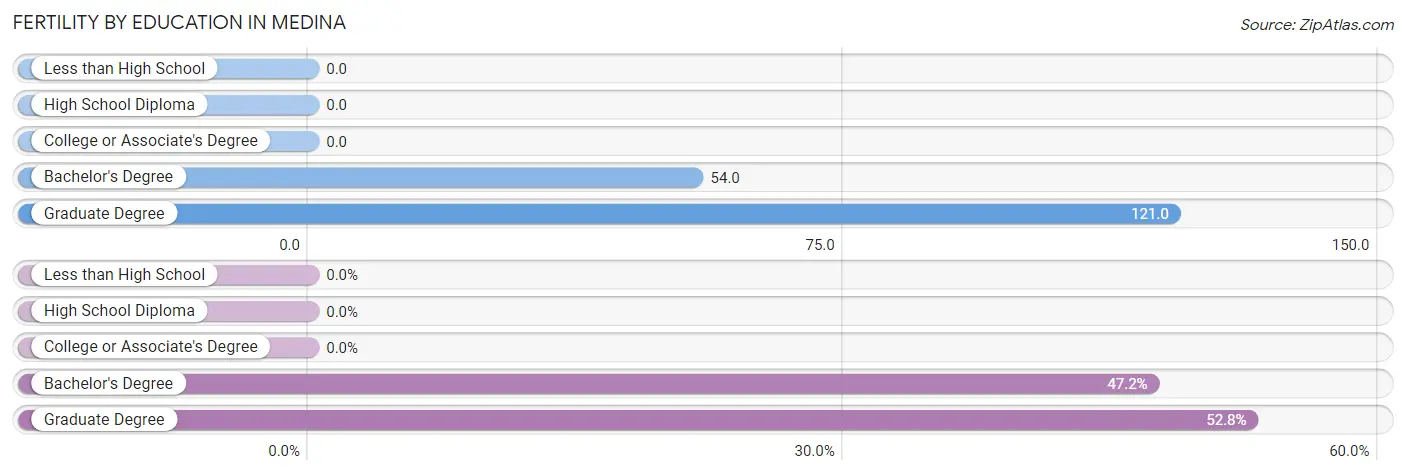
| Educational Attainment | Women with Births | Births / 1,000 Women |
| Less than High School | 0 (0.0%) | 0.0 |
| High School Diploma | 0 (0.0%) | 0.0 |
| College or Associate's Degree | 0 (0.0%) | 0.0 |
| Bachelor's Degree | 34 (47.2%) | 54.0 |
| Graduate Degree | 38 (52.8%) | 121.0 |
| Total | 72 (100.0%) | 52.0 |
Fertility by Education by Marriage Status in Medina
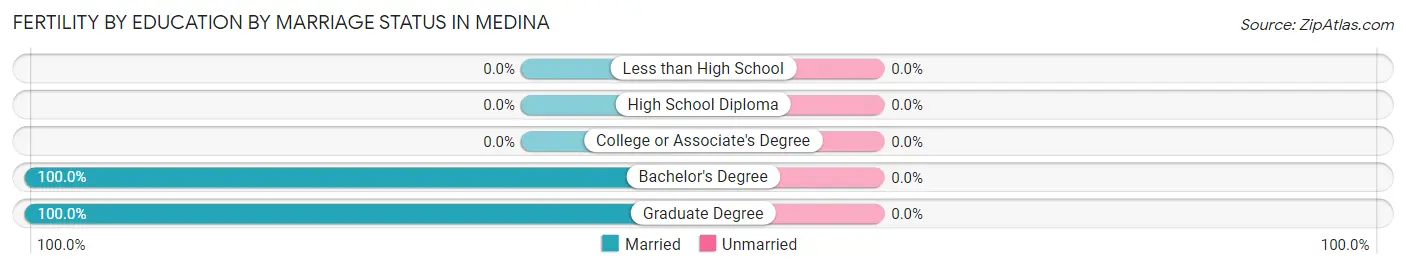
| Educational Attainment | Married | Unmarried |
| Less than High School | 0 (0.0%) | 0 (0.0%) |
| High School Diploma | 0 (0.0%) | 0 (0.0%) |
| College or Associate's Degree | 0 (0.0%) | 0 (0.0%) |
| Bachelor's Degree | 34 (100.0%) | 0 (0.0%) |
| Graduate Degree | 38 (100.0%) | 0 (0.0%) |
| Total | 72 (100.0%) | 0 (0.0%) |
Employment Characteristics in Medina
Employment by Class of Employer in Medina
Among the 3,246 employed individuals in Medina, private company employees (2,164 | 66.7%), local government employees (327 | 10.1%), and self-employed (incorporated) (264 | 8.1%) make up the most common classes of employment.
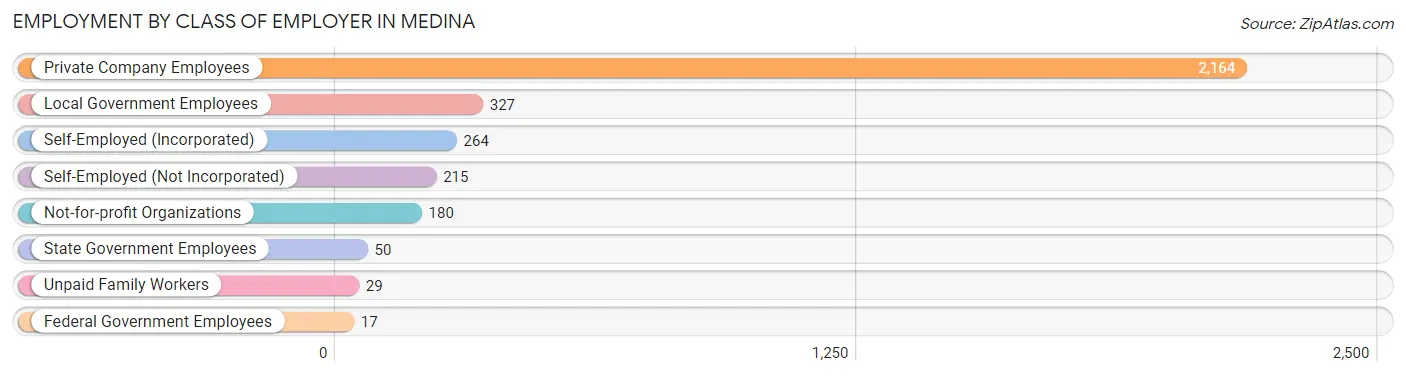
| Employer Class | # Employees | % Employees |
| Private Company Employees | 2,164 | 66.7% |
| Self-Employed (Incorporated) | 264 | 8.1% |
| Self-Employed (Not Incorporated) | 215 | 6.6% |
| Not-for-profit Organizations | 180 | 5.6% |
| Local Government Employees | 327 | 10.1% |
| State Government Employees | 50 | 1.5% |
| Federal Government Employees | 17 | 0.5% |
| Unpaid Family Workers | 29 | 0.9% |
| Total | 3,246 | 100.0% |
Employment Status by Age in Medina
According to the labor force statistics for Medina, out of the total population over 16 years of age (4,655), 71.4% or 3,324 individuals are in the labor force, with 1.8% or 60 of them unemployed. The age group with the highest labor force participation rate is 30 to 34 years, with 90.2% or 385 individuals in the labor force. Within the labor force, the 55 to 59 years age range has the highest percentage of unemployed individuals, with 5.1% or 29 of them being unemployed.
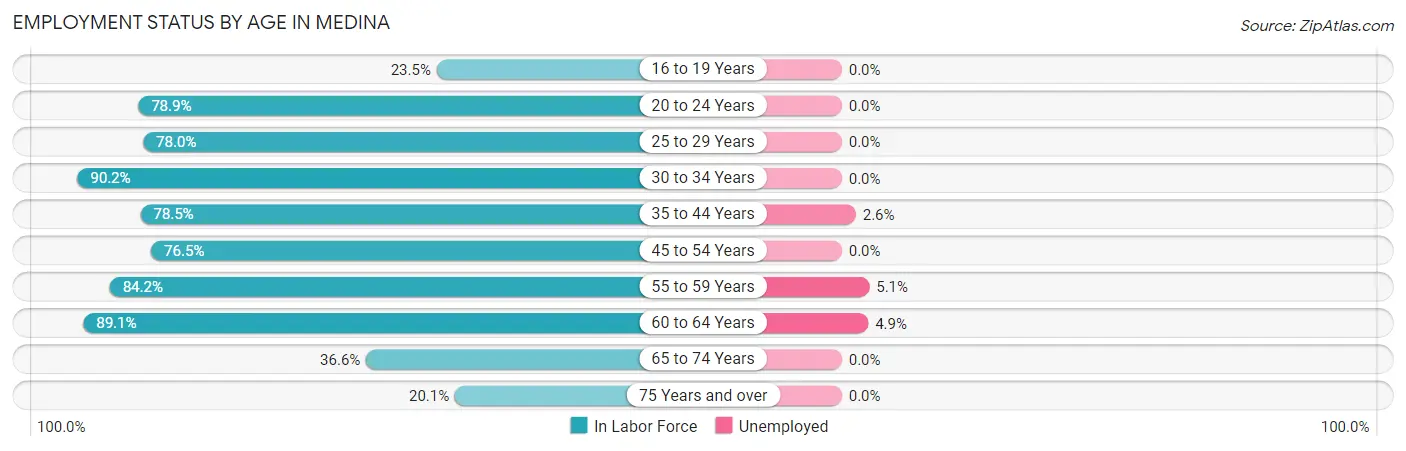
| Age Bracket | In Labor Force | Unemployed |
| 16 to 19 Years | 43 (23.5%) | 0 (0.0%) |
| 20 to 24 Years | 105 (78.9%) | 0 (0.0%) |
| 25 to 29 Years | 96 (78.0%) | 0 (0.0%) |
| 30 to 34 Years | 385 (90.2%) | 0 (0.0%) |
| 35 to 44 Years | 762 (78.5%) | 20 (2.6%) |
| 45 to 54 Years | 914 (76.5%) | 0 (0.0%) |
| 55 to 59 Years | 565 (84.2%) | 29 (5.1%) |
| 60 to 64 Years | 246 (89.1%) | 12 (4.9%) |
| 65 to 74 Years | 160 (36.6%) | 0 (0.0%) |
| 75 Years and over | 48 (20.1%) | 0 (0.0%) |
| Total | 3,324 (71.4%) | 60 (1.8%) |
Employment Status by Educational Attainment in Medina
According to labor force statistics for Medina, 81.0% of individuals (2,967) out of the total population between 25 and 64 years of age (3,663) are in the labor force, with 2.1% or 62 of them being unemployed. The group with the highest labor force participation rate are those with the educational attainment of bachelor's degree or higher, with 85.5% or 2,338 individuals in the labor force. Within the labor force, individuals with high school diploma education have the highest percentage of unemployment, with 27.6% or 42 of them being unemployed.
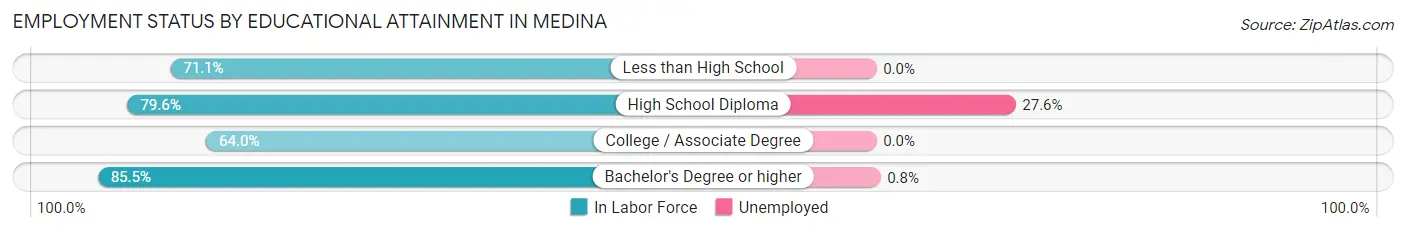
| Educational Attainment | In Labor Force | Unemployed |
| Less than High School | 59 (71.1%) | 0 (0.0%) |
| High School Diploma | 152 (79.6%) | 53 (27.6%) |
| College / Associate Degree | 419 (64.0%) | 0 (0.0%) |
| Bachelor's Degree or higher | 2,338 (85.5%) | 22 (0.8%) |
| Total | 2,967 (81.0%) | 77 (2.1%) |
Employment Occupations by Sex in Medina
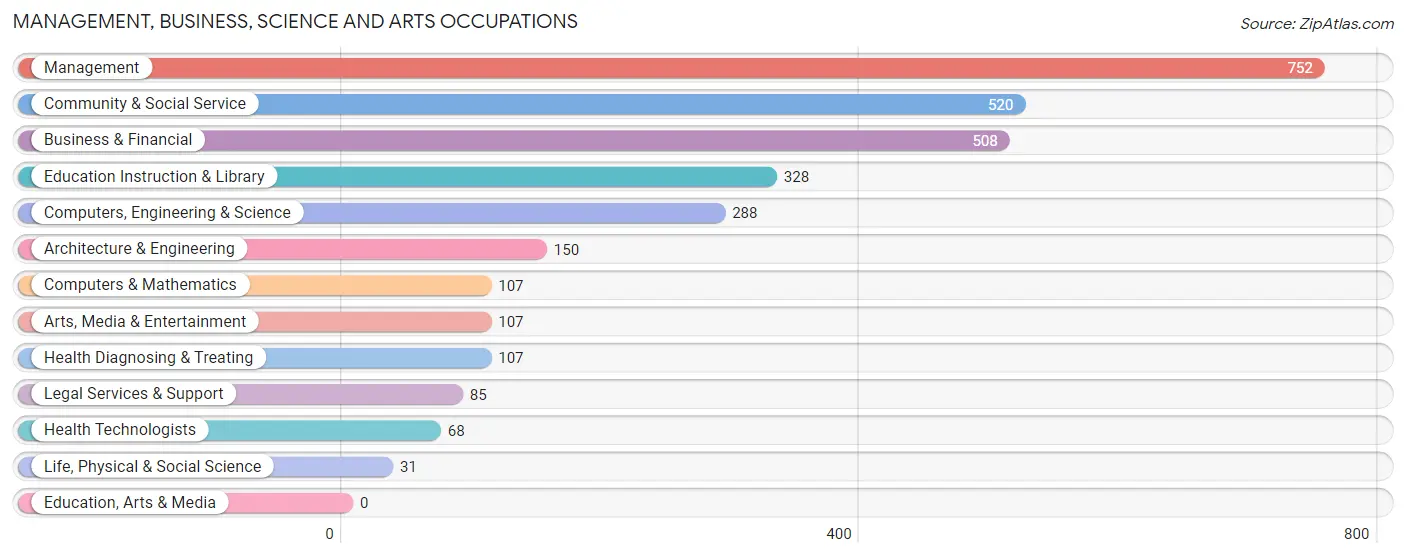
Management, Business, Science and Arts Occupations
The most common Management, Business, Science and Arts occupations in Medina are Management (752 | 23.1%), Community & Social Service (520 | 15.9%), Business & Financial (508 | 15.6%), Education Instruction & Library (328 | 10.1%), and Computers, Engineering & Science (288 | 8.8%).
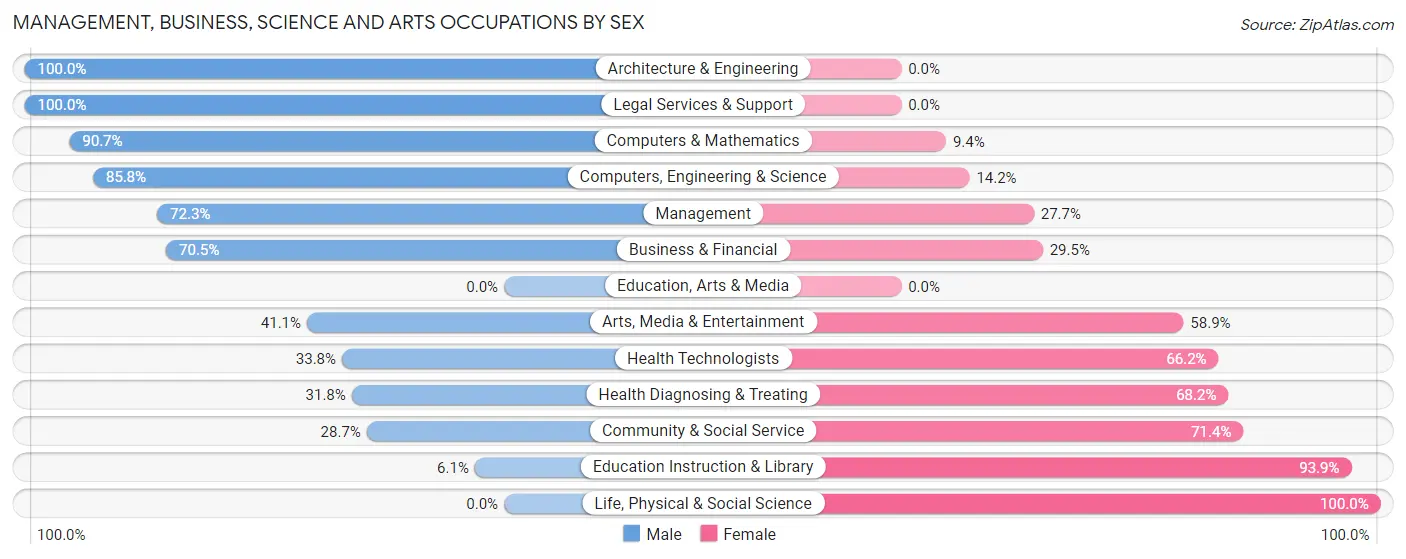
Management, Business, Science and Arts Occupations by Sex
Within the Management, Business, Science and Arts occupations in Medina, the most male-oriented occupations are Architecture & Engineering (100.0%), Legal Services & Support (100.0%), and Computers & Mathematics (90.6%), while the most female-oriented occupations are Life, Physical & Social Science (100.0%), Education Instruction & Library (93.9%), and Community & Social Service (71.4%).
| Occupation | Male | Female |
| Management | 544 (72.3%) | 208 (27.7%) |
| Business & Financial | 358 (70.5%) | 150 (29.5%) |
| Computers, Engineering & Science | 247 (85.8%) | 41 (14.2%) |
| Computers & Mathematics | 97 (90.6%) | 10 (9.3%) |
| Architecture & Engineering | 150 (100.0%) | 0 (0.0%) |
| Life, Physical & Social Science | 0 (0.0%) | 31 (100.0%) |
| Community & Social Service | 149 (28.6%) | 371 (71.4%) |
| Education, Arts & Media | 0 (0.0%) | 0 (0.0%) |
| Legal Services & Support | 85 (100.0%) | 0 (0.0%) |
| Education Instruction & Library | 20 (6.1%) | 308 (93.9%) |
| Arts, Media & Entertainment | 44 (41.1%) | 63 (58.9%) |
| Health Diagnosing & Treating | 34 (31.8%) | 73 (68.2%) |
| Health Technologists | 23 (33.8%) | 45 (66.2%) |
| Total (Category) | 1,332 (61.2%) | 843 (38.8%) |
| Total (Overall) | 1,967 (60.3%) | 1,296 (39.7%) |
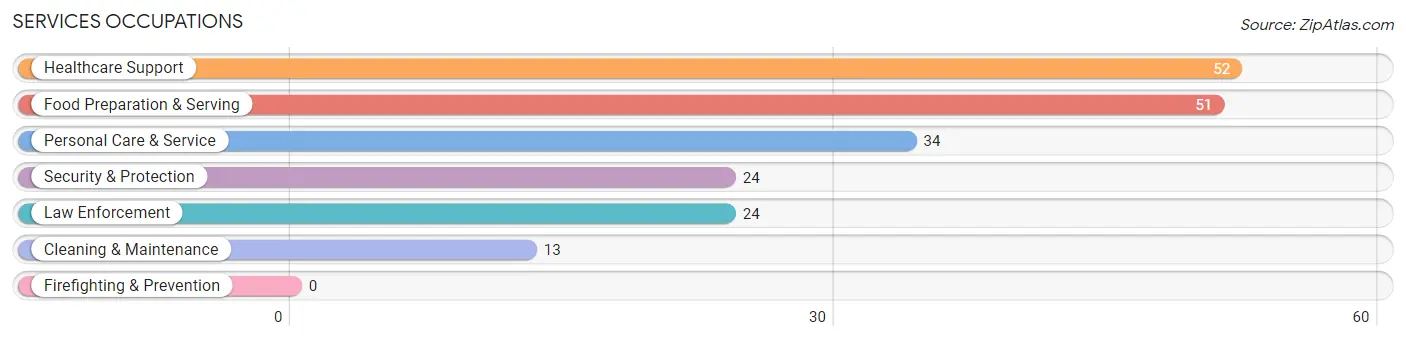
Services Occupations
The most common Services occupations in Medina are Healthcare Support (52 | 1.6%), Food Preparation & Serving (51 | 1.6%), Personal Care & Service (34 | 1.0%), Security & Protection (24 | 0.7%), and Law Enforcement (24 | 0.7%).
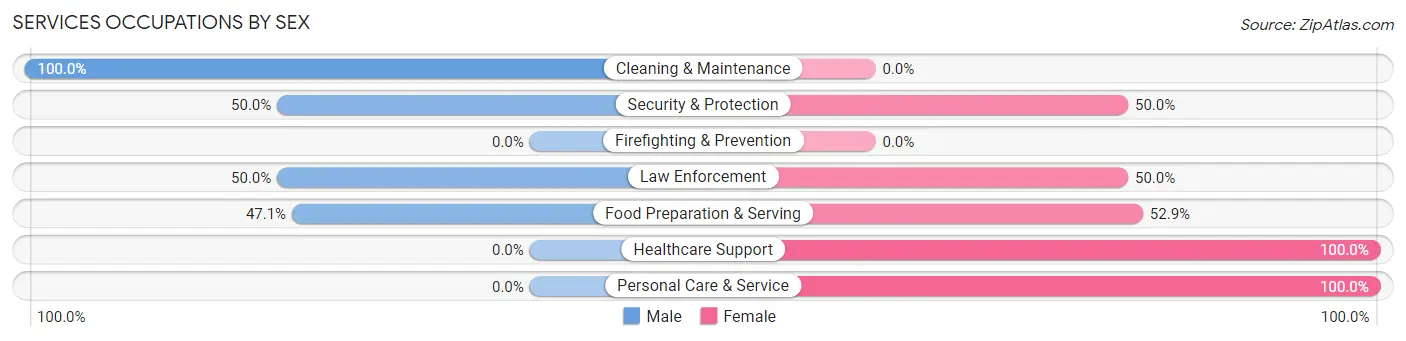
Services Occupations by Sex
Within the Services occupations in Medina, the most male-oriented occupations are Cleaning & Maintenance (100.0%), Security & Protection (50.0%), and Law Enforcement (50.0%), while the most female-oriented occupations are Healthcare Support (100.0%), Personal Care & Service (100.0%), and Food Preparation & Serving (52.9%).
| Occupation | Male | Female |
| Healthcare Support | 0 (0.0%) | 52 (100.0%) |
| Security & Protection | 12 (50.0%) | 12 (50.0%) |
| Firefighting & Prevention | 0 (0.0%) | 0 (0.0%) |
| Law Enforcement | 12 (50.0%) | 12 (50.0%) |
| Food Preparation & Serving | 24 (47.1%) | 27 (52.9%) |
| Cleaning & Maintenance | 13 (100.0%) | 0 (0.0%) |
| Personal Care & Service | 0 (0.0%) | 34 (100.0%) |
| Total (Category) | 49 (28.2%) | 125 (71.8%) |
| Total (Overall) | 1,967 (60.3%) | 1,296 (39.7%) |
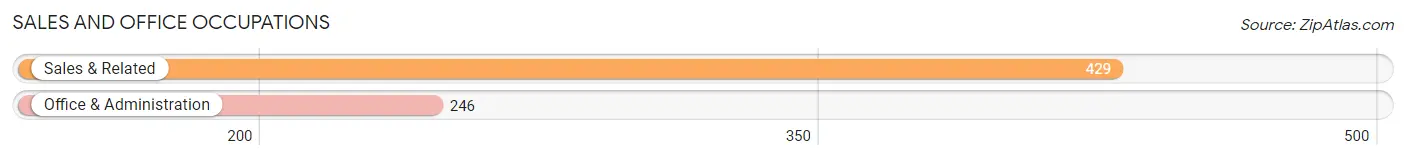
Sales and Office Occupations
The most common Sales and Office occupations in Medina are Sales & Related (429 | 13.2%), and Office & Administration (246 | 7.5%).
Sales and Office Occupations by Sex
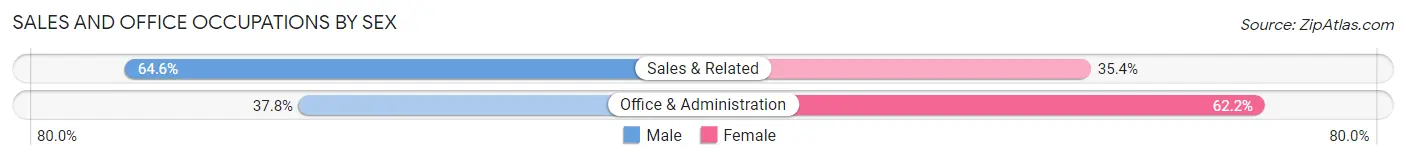
| Occupation | Male | Female |
| Sales & Related | 277 (64.6%) | 152 (35.4%) |
| Office & Administration | 93 (37.8%) | 153 (62.2%) |
| Total (Category) | 370 (54.8%) | 305 (45.2%) |
| Total (Overall) | 1,967 (60.3%) | 1,296 (39.7%) |
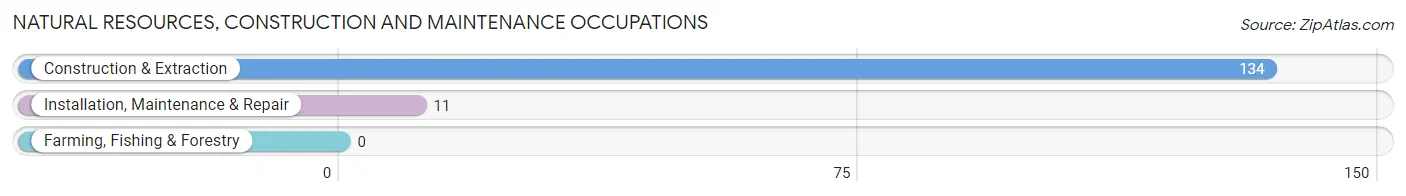
Natural Resources, Construction and Maintenance Occupations
The most common Natural Resources, Construction and Maintenance occupations in Medina are Construction & Extraction (134 | 4.1%), and Installation, Maintenance & Repair (11 | 0.3%).
Natural Resources, Construction and Maintenance Occupations by Sex
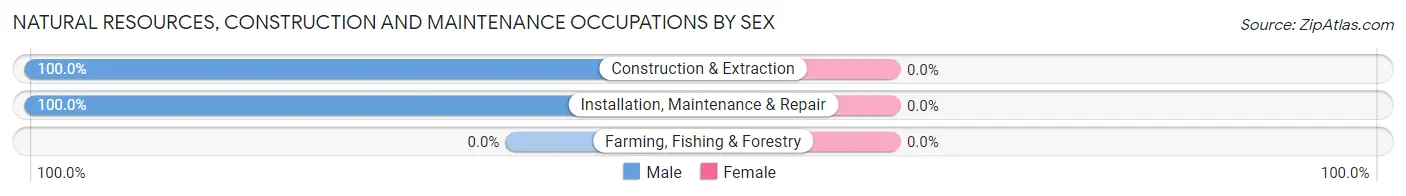
| Occupation | Male | Female |
| Farming, Fishing & Forestry | 0 (0.0%) | 0 (0.0%) |
| Construction & Extraction | 134 (100.0%) | 0 (0.0%) |
| Installation, Maintenance & Repair | 11 (100.0%) | 0 (0.0%) |
| Total (Category) | 145 (100.0%) | 0 (0.0%) |
| Total (Overall) | 1,967 (60.3%) | 1,296 (39.7%) |
Production, Transportation and Moving Occupations
The most common Production, Transportation and Moving occupations in Medina are Production (82 | 2.5%), and Transportation (12 | 0.4%).
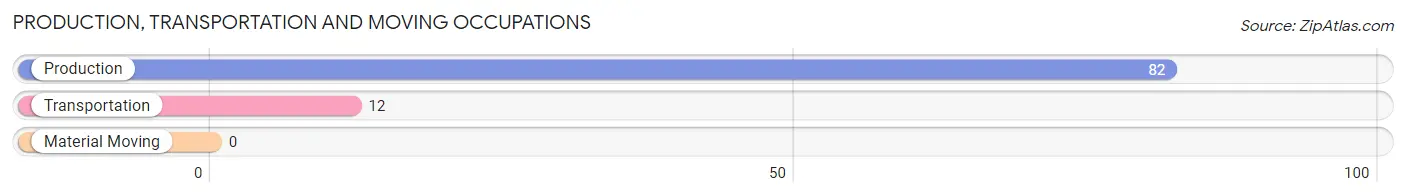
Production, Transportation and Moving Occupations by Sex
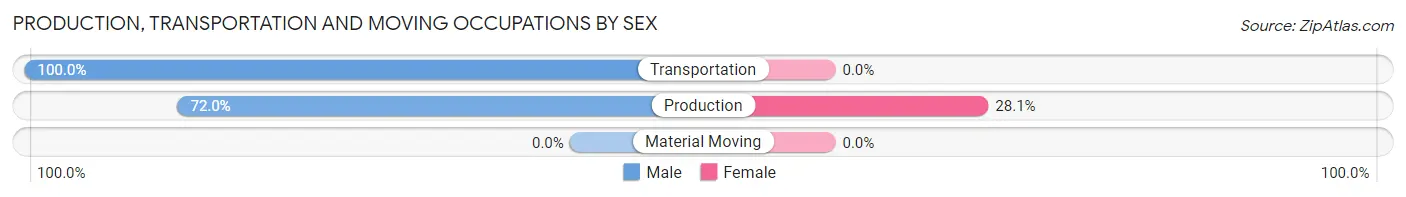
| Occupation | Male | Female |
| Production | 59 (72.0%) | 23 (28.1%) |
| Transportation | 12 (100.0%) | 0 (0.0%) |
| Material Moving | 0 (0.0%) | 0 (0.0%) |
| Total (Category) | 71 (75.5%) | 23 (24.5%) |
| Total (Overall) | 1,967 (60.3%) | 1,296 (39.7%) |
Employment Industries by Sex in Medina
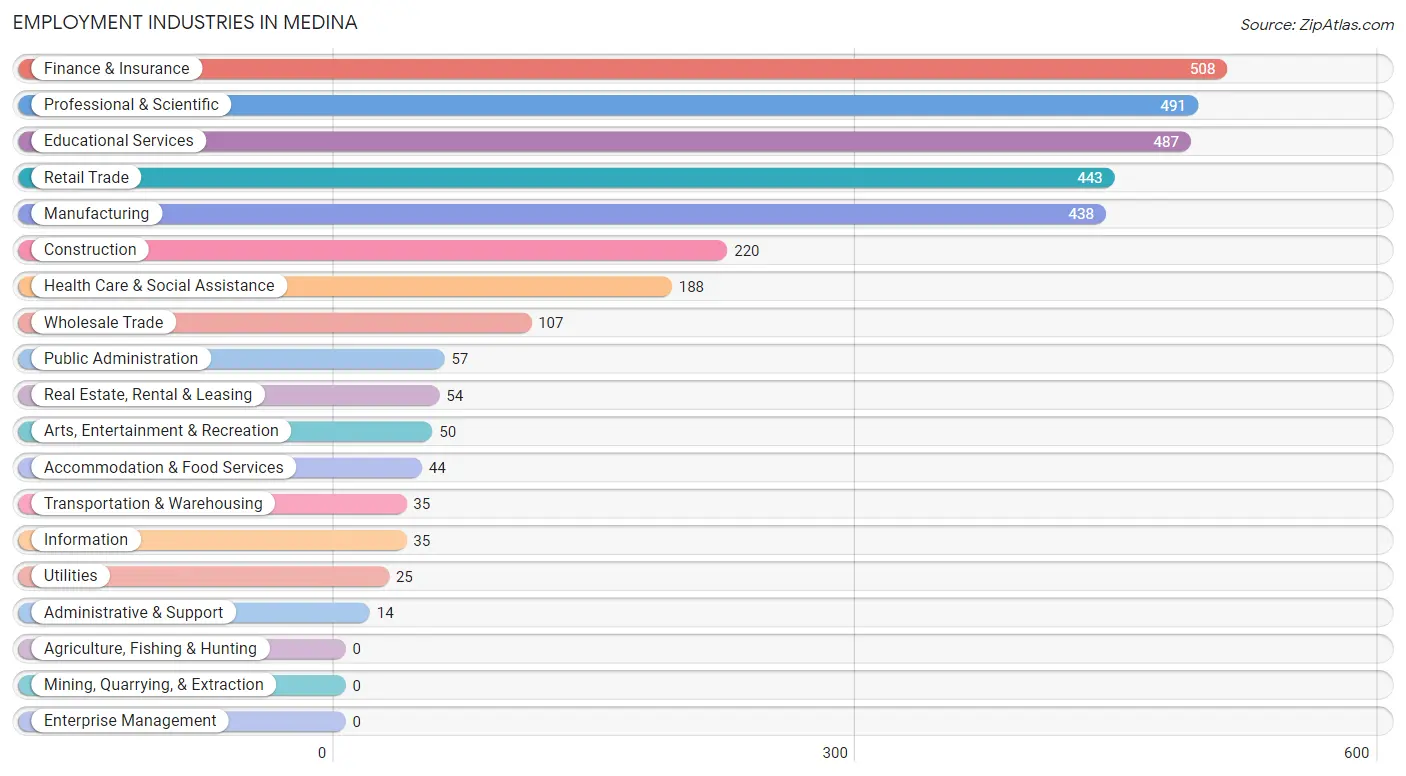
Employment Industries in Medina
The major employment industries in Medina include Finance & Insurance (508 | 15.6%), Professional & Scientific (491 | 15.0%), Educational Services (487 | 14.9%), Retail Trade (443 | 13.6%), and Manufacturing (438 | 13.4%).
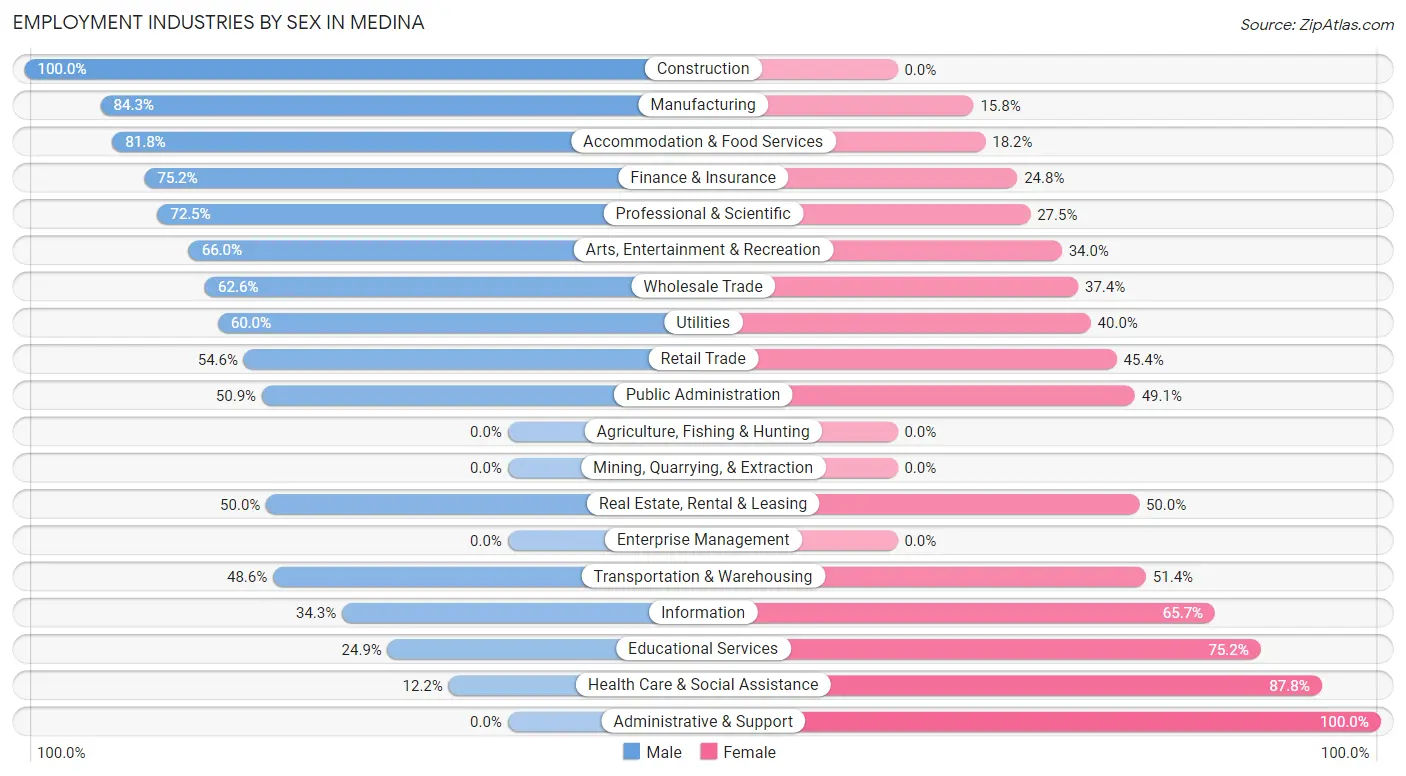
Employment Industries by Sex in Medina
The Medina industries that see more men than women are Construction (100.0%), Manufacturing (84.3%), and Accommodation & Food Services (81.8%), whereas the industries that tend to have a higher number of women are Administrative & Support (100.0%), Health Care & Social Assistance (87.8%), and Educational Services (75.1%).
| Industry | Male | Female |
| Agriculture, Fishing & Hunting | 0 (0.0%) | 0 (0.0%) |
| Mining, Quarrying, & Extraction | 0 (0.0%) | 0 (0.0%) |
| Construction | 220 (100.0%) | 0 (0.0%) |
| Manufacturing | 369 (84.3%) | 69 (15.8%) |
| Wholesale Trade | 67 (62.6%) | 40 (37.4%) |
| Retail Trade | 242 (54.6%) | 201 (45.4%) |
| Transportation & Warehousing | 17 (48.6%) | 18 (51.4%) |
| Utilities | 15 (60.0%) | 10 (40.0%) |
| Information | 12 (34.3%) | 23 (65.7%) |
| Finance & Insurance | 382 (75.2%) | 126 (24.8%) |
| Real Estate, Rental & Leasing | 27 (50.0%) | 27 (50.0%) |
| Professional & Scientific | 356 (72.5%) | 135 (27.5%) |
| Enterprise Management | 0 (0.0%) | 0 (0.0%) |
| Administrative & Support | 0 (0.0%) | 14 (100.0%) |
| Educational Services | 121 (24.8%) | 366 (75.1%) |
| Health Care & Social Assistance | 23 (12.2%) | 165 (87.8%) |
| Arts, Entertainment & Recreation | 33 (66.0%) | 17 (34.0%) |
| Accommodation & Food Services | 36 (81.8%) | 8 (18.2%) |
| Public Administration | 29 (50.9%) | 28 (49.1%) |
| Total | 1,967 (60.3%) | 1,296 (39.7%) |
Education in Medina
School Enrollment in Medina
The most common levels of schooling among the 1,820 students in Medina are elementary school (609 | 33.5%), middle school (537 | 29.5%), and high school (276 | 15.2%).
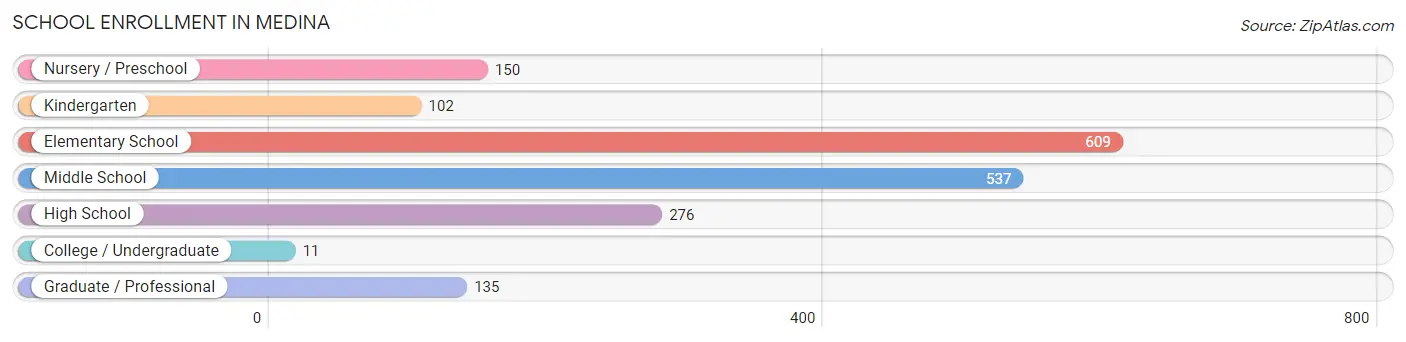
| School Level | # Students | % Students |
| Nursery / Preschool | 150 | 8.2% |
| Kindergarten | 102 | 5.6% |
| Elementary School | 609 | 33.5% |
| Middle School | 537 | 29.5% |
| High School | 276 | 15.2% |
| College / Undergraduate | 11 | 0.6% |
| Graduate / Professional | 135 | 7.4% |
| Total | 1,820 | 100.0% |
School Enrollment by Age by Funding Source in Medina
Out of a total of 1,820 students who are enrolled in schools in Medina, 273 (15.0%) attend a private institution, while the remaining 1,547 (85.0%) are enrolled in public schools. The age group of 3 to 4 year olds has the highest likelihood of being enrolled in private schools, with 51 (43.2% in the age bracket) enrolled. Conversely, the age group of 15 to 17 year olds has the lowest likelihood of being enrolled in a private school, with 229 (100.0% in the age bracket) attending a public institution.
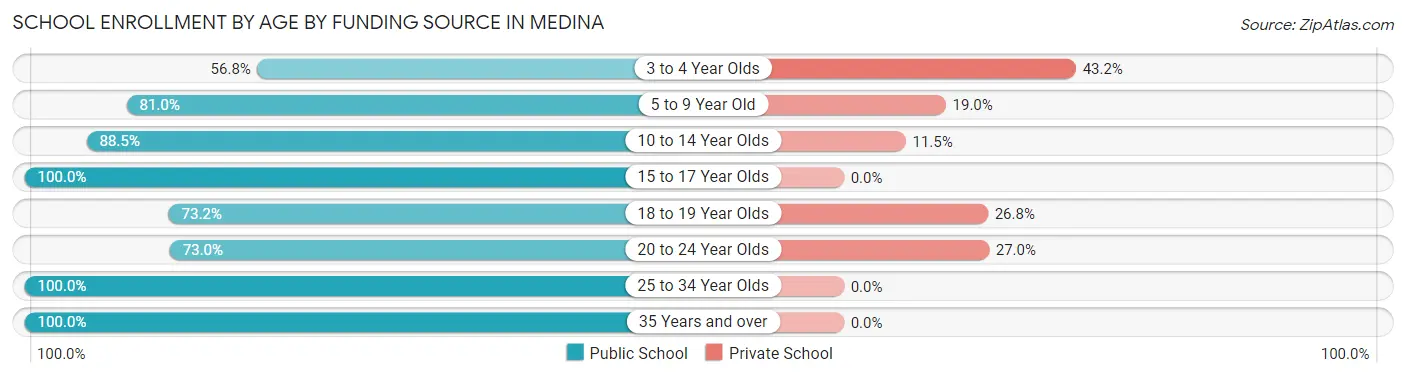
| Age Bracket | Public School | Private School |
| 3 to 4 Year Olds | 67 (56.8%) | 51 (43.2%) |
| 5 to 9 Year Old | 559 (81.0%) | 131 (19.0%) |
| 10 to 14 Year Olds | 537 (88.5%) | 70 (11.5%) |
| 15 to 17 Year Olds | 229 (100.0%) | 0 (0.0%) |
| 18 to 19 Year Olds | 30 (73.2%) | 11 (26.8%) |
| 20 to 24 Year Olds | 27 (73.0%) | 10 (27.0%) |
| 25 to 34 Year Olds | 54 (100.0%) | 0 (0.0%) |
| 35 Years and over | 44 (100.0%) | 0 (0.0%) |
| Total | 1,547 (85.0%) | 273 (15.0%) |
Educational Attainment by Field of Study in Medina
Business (1,060 | 32.3%), engineering (374 | 11.4%), education (372 | 11.4%), social sciences (332 | 10.1%), and science & technology (252 | 7.7%) are the most common fields of study among 3,278 individuals in Medina who have obtained a bachelor's degree or higher.
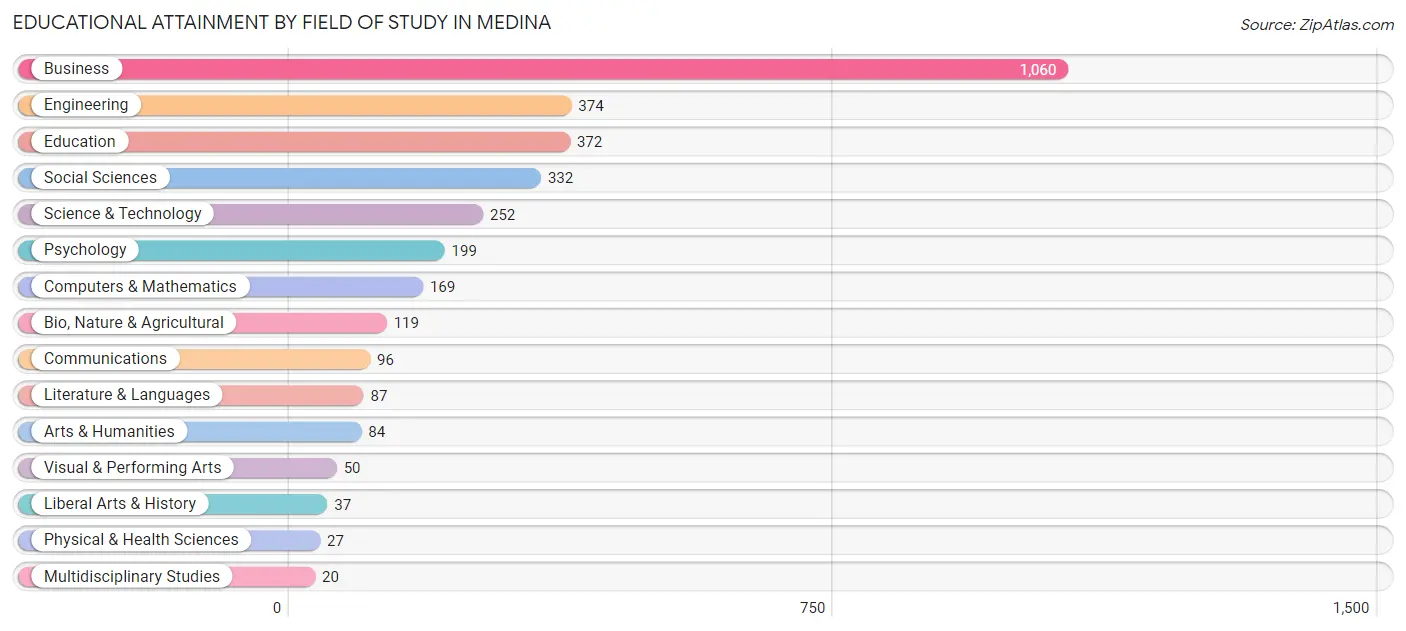
| Field of Study | # Graduates | % Graduates |
| Computers & Mathematics | 169 | 5.2% |
| Bio, Nature & Agricultural | 119 | 3.6% |
| Physical & Health Sciences | 27 | 0.8% |
| Psychology | 199 | 6.1% |
| Social Sciences | 332 | 10.1% |
| Engineering | 374 | 11.4% |
| Multidisciplinary Studies | 20 | 0.6% |
| Science & Technology | 252 | 7.7% |
| Business | 1,060 | 32.3% |
| Education | 372 | 11.4% |
| Literature & Languages | 87 | 2.6% |
| Liberal Arts & History | 37 | 1.1% |
| Visual & Performing Arts | 50 | 1.5% |
| Communications | 96 | 2.9% |
| Arts & Humanities | 84 | 2.6% |
| Total | 3,278 | 100.0% |
Transportation & Commute in Medina
Vehicle Availability by Sex in Medina
The most prevalent vehicle ownership categories in Medina are males with 2 vehicles (1,095, accounting for 55.9%) and females with 2 vehicles (746, making up 85.0%).
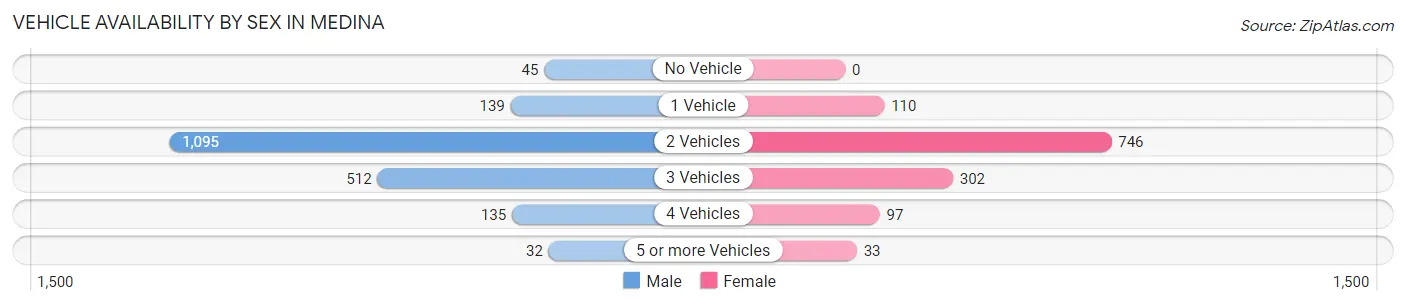
| Vehicles Available | Male | Female |
| No Vehicle | 45 (2.3%) | 0 (0.0%) |
| 1 Vehicle | 139 (7.1%) | 110 (8.5%) |
| 2 Vehicles | 1,095 (55.9%) | 746 (57.9%) |
| 3 Vehicles | 512 (26.2%) | 302 (23.4%) |
| 4 Vehicles | 135 (6.9%) | 97 (7.5%) |
| 5 or more Vehicles | 32 (1.6%) | 33 (2.6%) |
| Total | 1,958 (100.0%) | 1,288 (100.0%) |
Commute Time in Medina
The most frequently occuring commute durations in Medina are 15 to 19 minutes (330 commuters, 16.1%), 20 to 24 minutes (316 commuters, 15.4%), and 30 to 34 minutes (293 commuters, 14.3%).
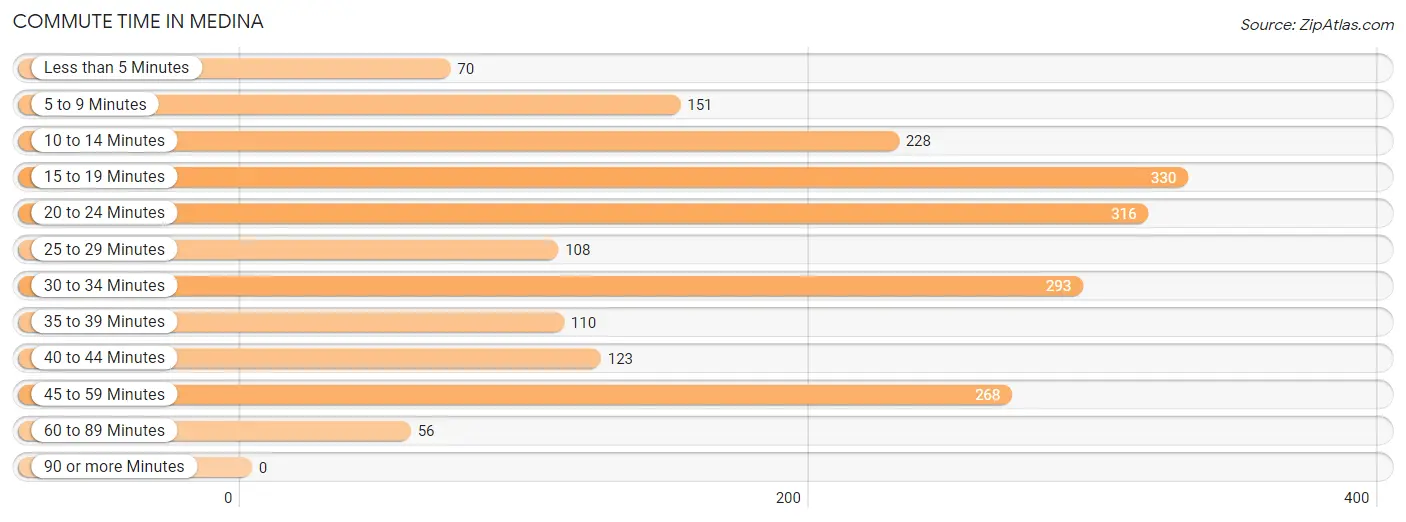
| Commute Time | # Commuters | % Commuters |
| Less than 5 Minutes | 70 | 3.4% |
| 5 to 9 Minutes | 151 | 7.4% |
| 10 to 14 Minutes | 228 | 11.1% |
| 15 to 19 Minutes | 330 | 16.1% |
| 20 to 24 Minutes | 316 | 15.4% |
| 25 to 29 Minutes | 108 | 5.3% |
| 30 to 34 Minutes | 293 | 14.3% |
| 35 to 39 Minutes | 110 | 5.4% |
| 40 to 44 Minutes | 123 | 6.0% |
| 45 to 59 Minutes | 268 | 13.1% |
| 60 to 89 Minutes | 56 | 2.7% |
| 90 or more Minutes | 0 | 0.0% |
Commute Time by Sex in Medina
The most common commute times in Medina are 45 to 59 minutes (234 commuters, 19.0%) for males and 30 to 34 minutes (171 commuters, 20.7%) for females.
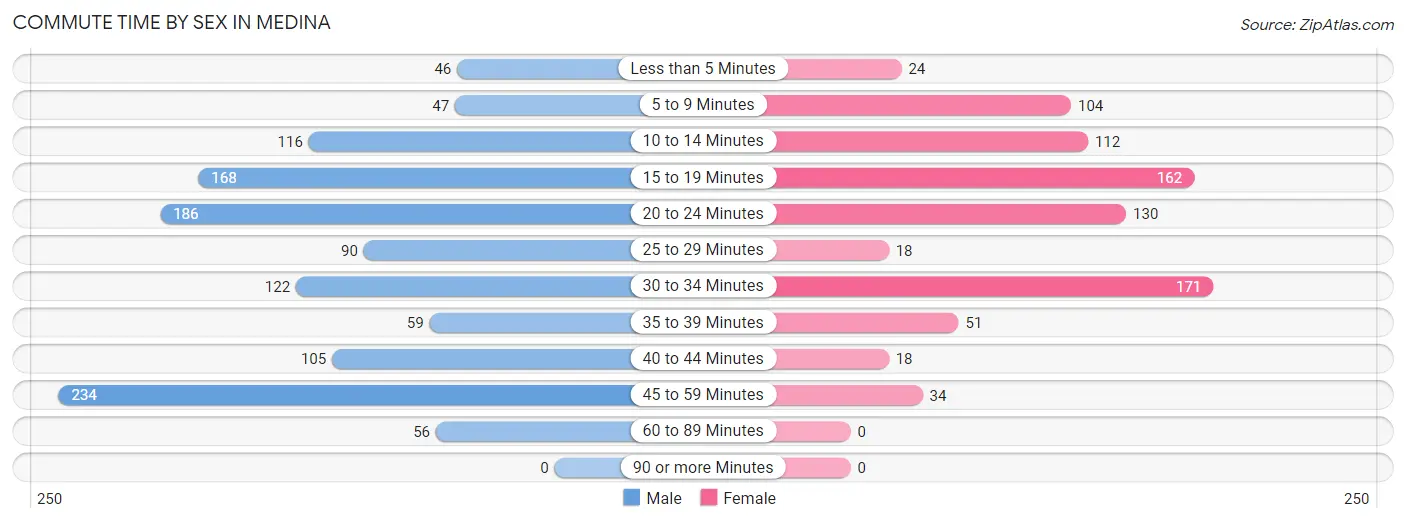
| Commute Time | Male | Female |
| Less than 5 Minutes | 46 (3.7%) | 24 (2.9%) |
| 5 to 9 Minutes | 47 (3.8%) | 104 (12.6%) |
| 10 to 14 Minutes | 116 (9.4%) | 112 (13.6%) |
| 15 to 19 Minutes | 168 (13.7%) | 162 (19.7%) |
| 20 to 24 Minutes | 186 (15.1%) | 130 (15.8%) |
| 25 to 29 Minutes | 90 (7.3%) | 18 (2.2%) |
| 30 to 34 Minutes | 122 (9.9%) | 171 (20.7%) |
| 35 to 39 Minutes | 59 (4.8%) | 51 (6.2%) |
| 40 to 44 Minutes | 105 (8.5%) | 18 (2.2%) |
| 45 to 59 Minutes | 234 (19.0%) | 34 (4.1%) |
| 60 to 89 Minutes | 56 (4.6%) | 0 (0.0%) |
| 90 or more Minutes | 0 (0.0%) | 0 (0.0%) |
Time of Departure to Work by Sex in Medina
The most frequent times of departure to work in Medina are 7:00 AM to 7:29 AM (250, 20.3%) for males and 8:00 AM to 8:29 AM (140, 17.0%) for females.
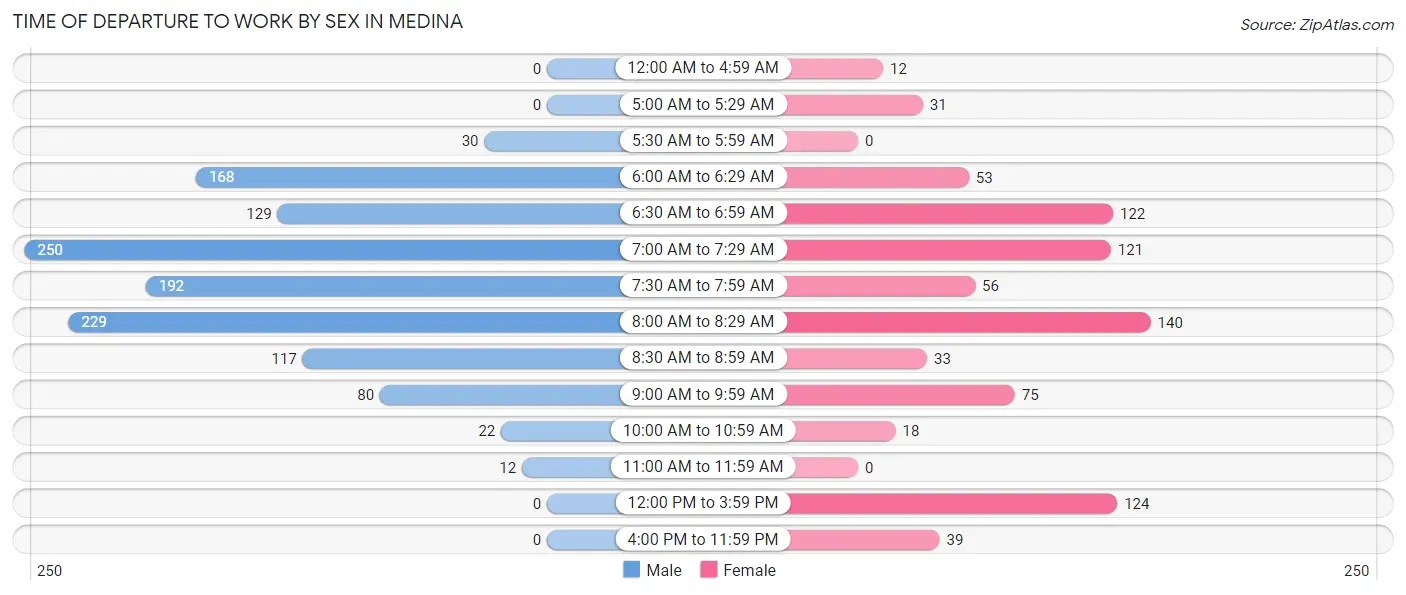
| Time of Departure | Male | Female |
| 12:00 AM to 4:59 AM | 0 (0.0%) | 12 (1.5%) |
| 5:00 AM to 5:29 AM | 0 (0.0%) | 31 (3.8%) |
| 5:30 AM to 5:59 AM | 30 (2.4%) | 0 (0.0%) |
| 6:00 AM to 6:29 AM | 168 (13.7%) | 53 (6.4%) |
| 6:30 AM to 6:59 AM | 129 (10.5%) | 122 (14.8%) |
| 7:00 AM to 7:29 AM | 250 (20.3%) | 121 (14.7%) |
| 7:30 AM to 7:59 AM | 192 (15.6%) | 56 (6.8%) |
| 8:00 AM to 8:29 AM | 229 (18.6%) | 140 (17.0%) |
| 8:30 AM to 8:59 AM | 117 (9.5%) | 33 (4.0%) |
| 9:00 AM to 9:59 AM | 80 (6.5%) | 75 (9.1%) |
| 10:00 AM to 10:59 AM | 22 (1.8%) | 18 (2.2%) |
| 11:00 AM to 11:59 AM | 12 (1.0%) | 0 (0.0%) |
| 12:00 PM to 3:59 PM | 0 (0.0%) | 124 (15.0%) |
| 4:00 PM to 11:59 PM | 0 (0.0%) | 39 (4.7%) |
| Total | 1,229 (100.0%) | 824 (100.0%) |
Housing Occupancy in Medina
Occupancy by Ownership in Medina
Of the total 2,311 dwellings in Medina, owner-occupied units account for 2,137 (92.5%), while renter-occupied units make up 174 (7.5%).
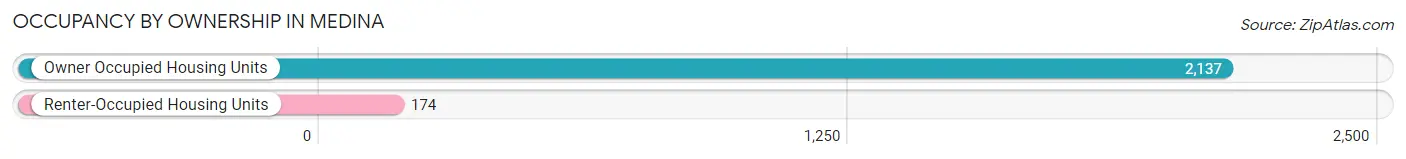
| Occupancy | # Housing Units | % Housing Units |
| Owner Occupied Housing Units | 2,137 | 92.5% |
| Renter-Occupied Housing Units | 174 | 7.5% |
| Total Occupied Housing Units | 2,311 | 100.0% |
Occupancy by Household Size in Medina
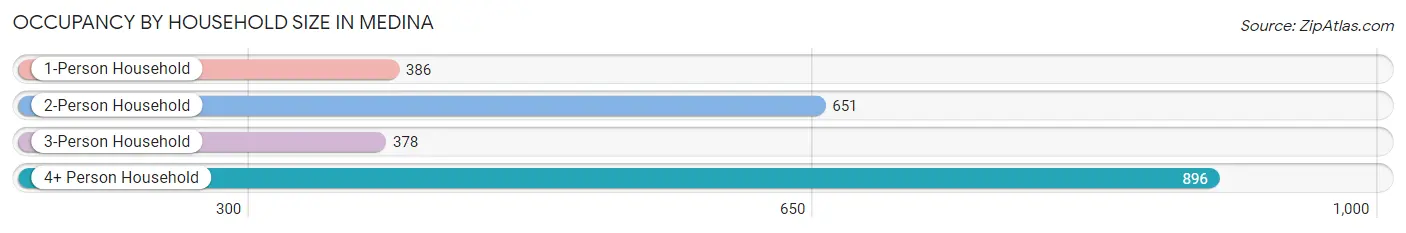
| Household Size | # Housing Units | % Housing Units |
| 1-Person Household | 386 | 16.7% |
| 2-Person Household | 651 | 28.2% |
| 3-Person Household | 378 | 16.4% |
| 4+ Person Household | 896 | 38.8% |
| Total Housing Units | 2,311 | 100.0% |
Occupancy by Ownership by Household Size in Medina
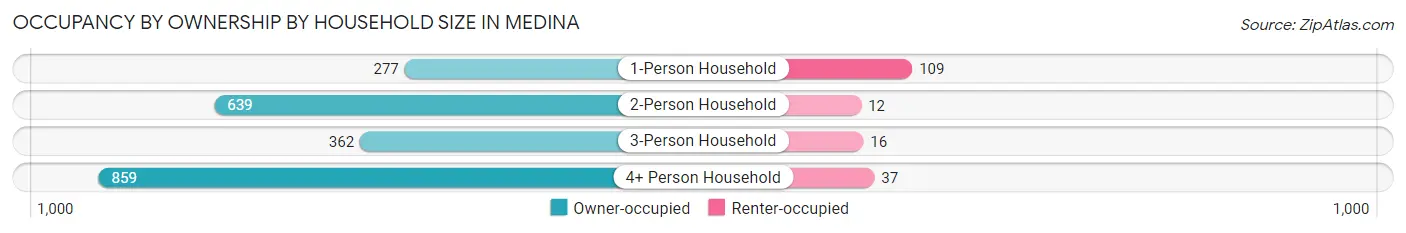
| Household Size | Owner-occupied | Renter-occupied |
| 1-Person Household | 277 (71.8%) | 109 (28.2%) |
| 2-Person Household | 639 (98.2%) | 12 (1.8%) |
| 3-Person Household | 362 (95.8%) | 16 (4.2%) |
| 4+ Person Household | 859 (95.9%) | 37 (4.1%) |
| Total Housing Units | 2,137 (92.5%) | 174 (7.5%) |
Occupancy by Educational Attainment in Medina
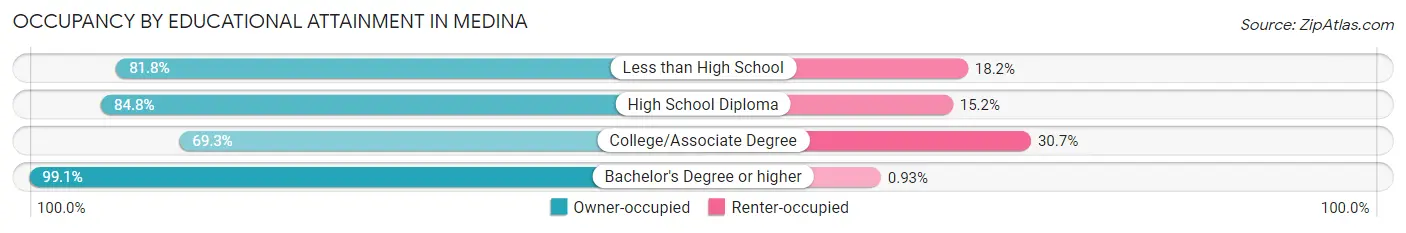
| Household Size | Owner-occupied | Renter-occupied |
| Less than High School | 63 (81.8%) | 14 (18.2%) |
| High School Diploma | 67 (84.8%) | 12 (15.2%) |
| College/Associate Degree | 298 (69.3%) | 132 (30.7%) |
| Bachelor's Degree or higher | 1,709 (99.1%) | 16 (0.9%) |
Occupancy by Age of Householder in Medina
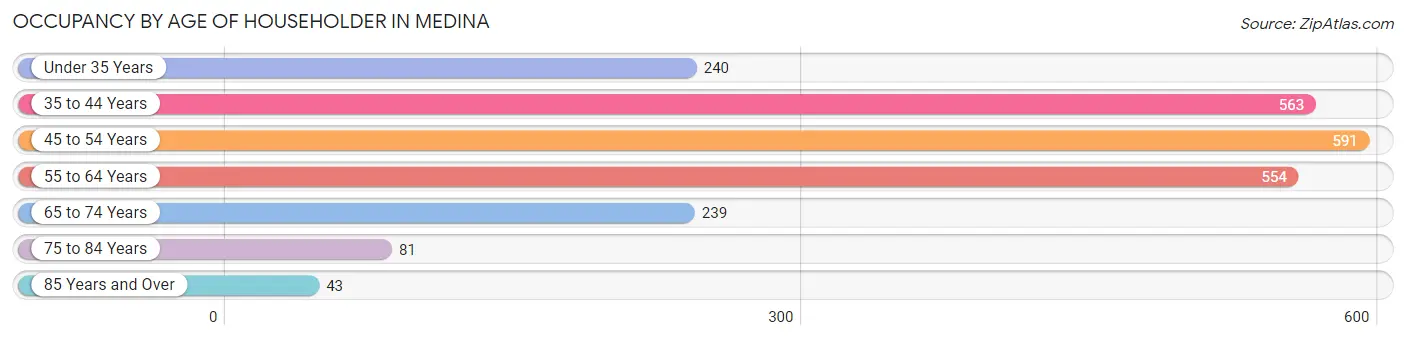
| Age Bracket | # Households | % Households |
| Under 35 Years | 240 | 10.4% |
| 35 to 44 Years | 563 | 24.4% |
| 45 to 54 Years | 591 | 25.6% |
| 55 to 64 Years | 554 | 24.0% |
| 65 to 74 Years | 239 | 10.3% |
| 75 to 84 Years | 81 | 3.5% |
| 85 Years and Over | 43 | 1.9% |
| Total | 2,311 | 100.0% |
Housing Finances in Medina
Median Income by Occupancy in Medina
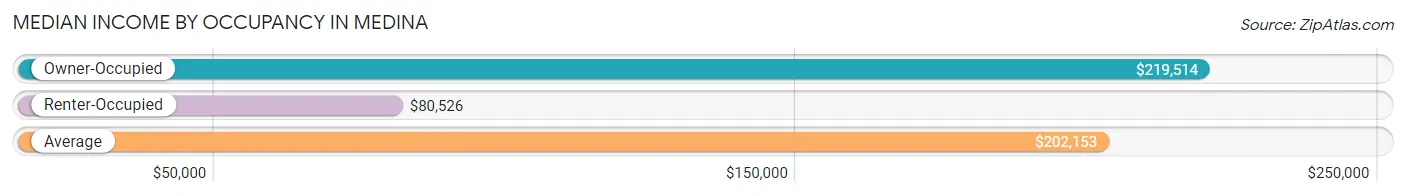
| Occupancy Type | # Households | Median Income |
| Owner-Occupied | 2,137 (92.5%) | $219,514 |
| Renter-Occupied | 174 (7.5%) | $80,526 |
| Average | 2,311 (100.0%) | $202,153 |
Occupancy by Householder Income Bracket in Medina
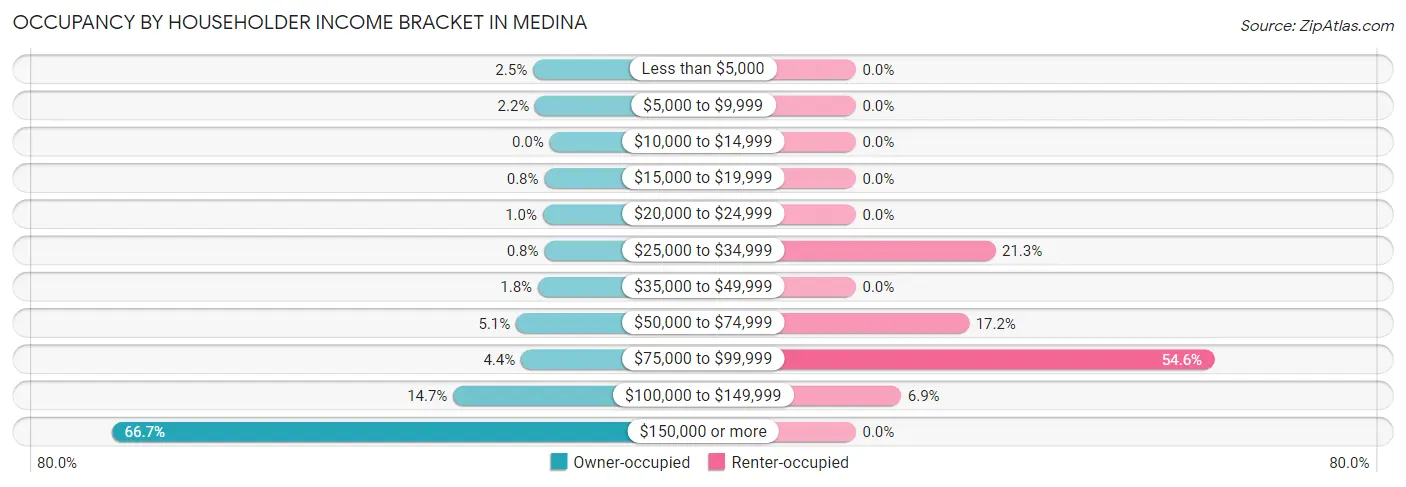
| Income Bracket | Owner-occupied | Renter-occupied |
| Less than $5,000 | 54 (2.5%) | 0 (0.0%) |
| $5,000 to $9,999 | 47 (2.2%) | 0 (0.0%) |
| $10,000 to $14,999 | 0 (0.0%) | 0 (0.0%) |
| $15,000 to $19,999 | 17 (0.8%) | 0 (0.0%) |
| $20,000 to $24,999 | 22 (1.0%) | 0 (0.0%) |
| $25,000 to $34,999 | 17 (0.8%) | 37 (21.3%) |
| $35,000 to $49,999 | 38 (1.8%) | 0 (0.0%) |
| $50,000 to $74,999 | 109 (5.1%) | 30 (17.2%) |
| $75,000 to $99,999 | 93 (4.3%) | 95 (54.6%) |
| $100,000 to $149,999 | 314 (14.7%) | 12 (6.9%) |
| $150,000 or more | 1,426 (66.7%) | 0 (0.0%) |
| Total | 2,137 (100.0%) | 174 (100.0%) |
Monthly Housing Cost Tiers in Medina
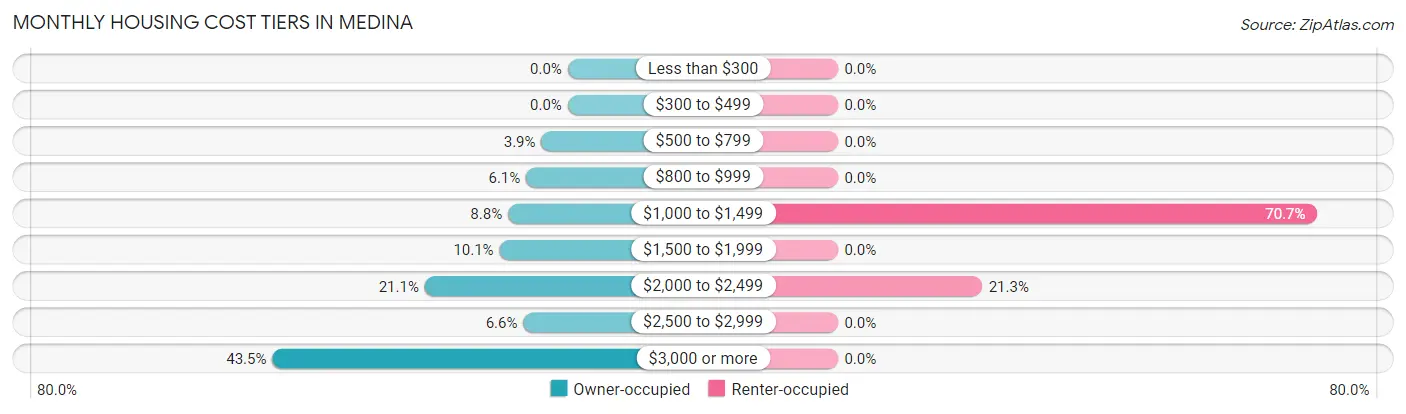
| Monthly Cost | Owner-occupied | Renter-occupied |
| Less than $300 | 0 (0.0%) | 0 (0.0%) |
| $300 to $499 | 0 (0.0%) | 0 (0.0%) |
| $500 to $799 | 83 (3.9%) | 0 (0.0%) |
| $800 to $999 | 131 (6.1%) | 0 (0.0%) |
| $1,000 to $1,499 | 188 (8.8%) | 123 (70.7%) |
| $1,500 to $1,999 | 215 (10.1%) | 0 (0.0%) |
| $2,000 to $2,499 | 450 (21.1%) | 37 (21.3%) |
| $2,500 to $2,999 | 140 (6.6%) | 0 (0.0%) |
| $3,000 or more | 930 (43.5%) | 0 (0.0%) |
| Total | 2,137 (100.0%) | 174 (100.0%) |
Physical Housing Characteristics in Medina
Housing Structures in Medina
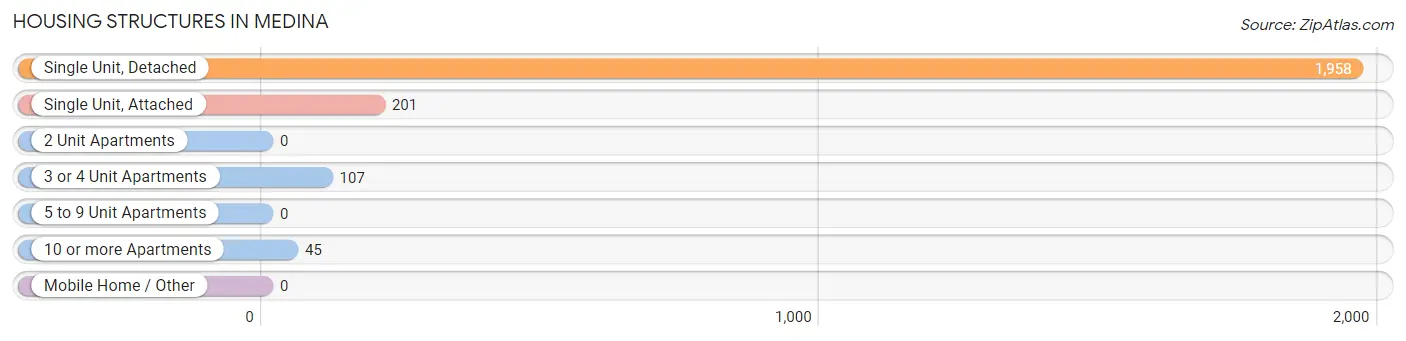
| Structure Type | # Housing Units | % Housing Units |
| Single Unit, Detached | 1,958 | 84.7% |
| Single Unit, Attached | 201 | 8.7% |
| 2 Unit Apartments | 0 | 0.0% |
| 3 or 4 Unit Apartments | 107 | 4.6% |
| 5 to 9 Unit Apartments | 0 | 0.0% |
| 10 or more Apartments | 45 | 1.9% |
| Mobile Home / Other | 0 | 0.0% |
| Total | 2,311 | 100.0% |
Housing Structures by Occupancy in Medina
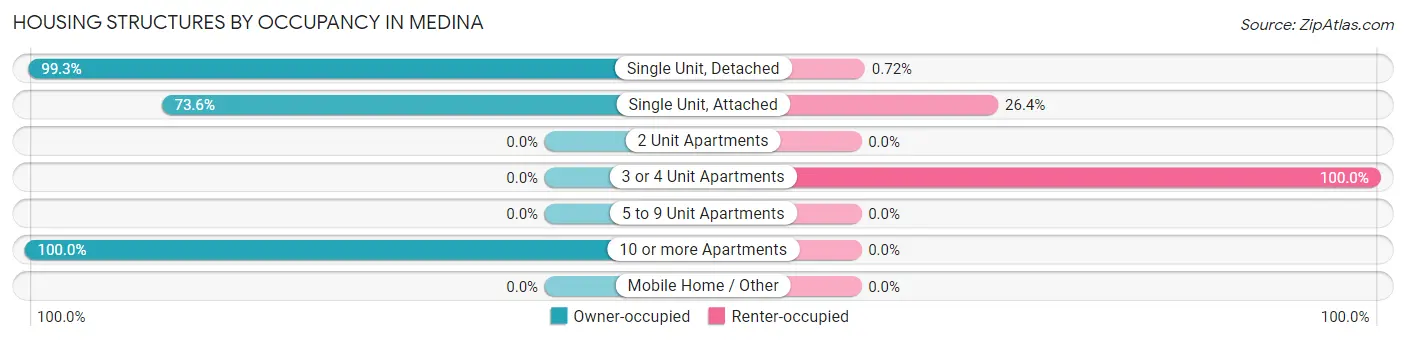
| Structure Type | Owner-occupied | Renter-occupied |
| Single Unit, Detached | 1,944 (99.3%) | 14 (0.7%) |
| Single Unit, Attached | 148 (73.6%) | 53 (26.4%) |
| 2 Unit Apartments | 0 (0.0%) | 0 (0.0%) |
| 3 or 4 Unit Apartments | 0 (0.0%) | 107 (100.0%) |
| 5 to 9 Unit Apartments | 0 (0.0%) | 0 (0.0%) |
| 10 or more Apartments | 45 (100.0%) | 0 (0.0%) |
| Mobile Home / Other | 0 (0.0%) | 0 (0.0%) |
| Total | 2,137 (92.5%) | 174 (7.5%) |
Housing Structures by Number of Rooms in Medina
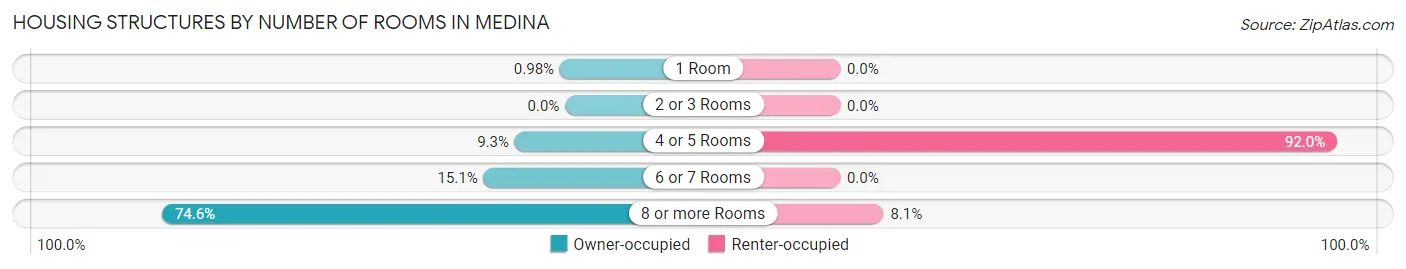
| Number of Rooms | Owner-occupied | Renter-occupied |
| 1 Room | 21 (1.0%) | 0 (0.0%) |
| 2 or 3 Rooms | 0 (0.0%) | 0 (0.0%) |
| 4 or 5 Rooms | 199 (9.3%) | 160 (91.9%) |
| 6 or 7 Rooms | 323 (15.1%) | 0 (0.0%) |
| 8 or more Rooms | 1,594 (74.6%) | 14 (8.1%) |
| Total | 2,137 (100.0%) | 174 (100.0%) |
Housing Structure by Heating Type in Medina
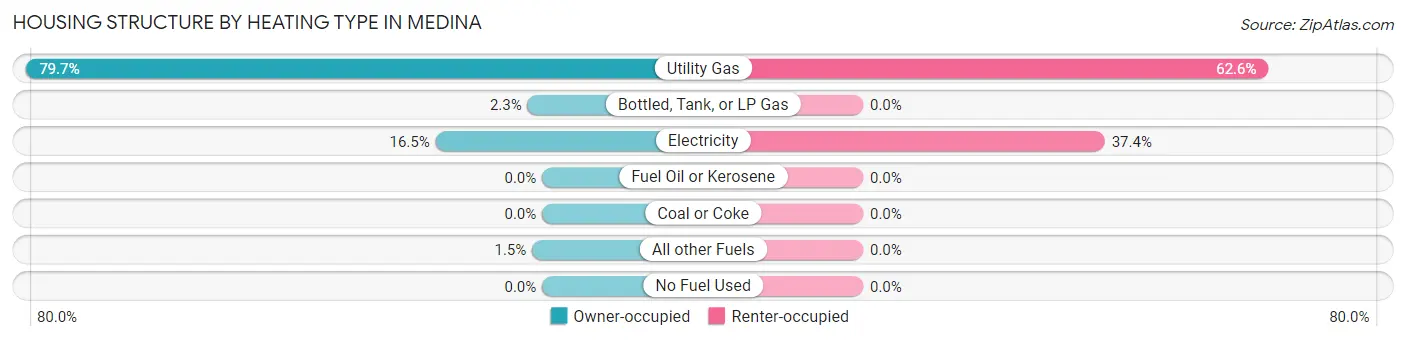
| Heating Type | Owner-occupied | Renter-occupied |
| Utility Gas | 1,704 (79.7%) | 109 (62.6%) |
| Bottled, Tank, or LP Gas | 48 (2.2%) | 0 (0.0%) |
| Electricity | 352 (16.5%) | 65 (37.4%) |
| Fuel Oil or Kerosene | 0 (0.0%) | 0 (0.0%) |
| Coal or Coke | 0 (0.0%) | 0 (0.0%) |
| All other Fuels | 33 (1.5%) | 0 (0.0%) |
| No Fuel Used | 0 (0.0%) | 0 (0.0%) |
| Total | 2,137 (100.0%) | 174 (100.0%) |
Household Vehicle Usage in Medina
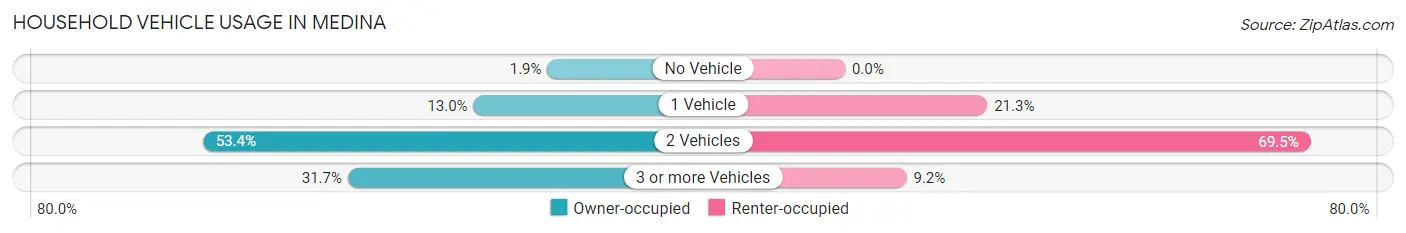
| Vehicles per Household | Owner-occupied | Renter-occupied |
| No Vehicle | 41 (1.9%) | 0 (0.0%) |
| 1 Vehicle | 277 (13.0%) | 37 (21.3%) |
| 2 Vehicles | 1,141 (53.4%) | 121 (69.5%) |
| 3 or more Vehicles | 678 (31.7%) | 16 (9.2%) |
| Total | 2,137 (100.0%) | 174 (100.0%) |
Real Estate & Mortgages in Medina
Real Estate and Mortgage Overview in Medina
| Characteristic | Without Mortgage | With Mortgage |
| Housing Units | 546 | 1,591 |
| Median Property Value | $622,600 | $709,300 |
| Median Household Income | $145,690 | $1,174 |
| Monthly Housing Costs | $1,280 | $897 |
| Real Estate Taxes | $7,513 | $0 |
Property Value by Mortgage Status in Medina
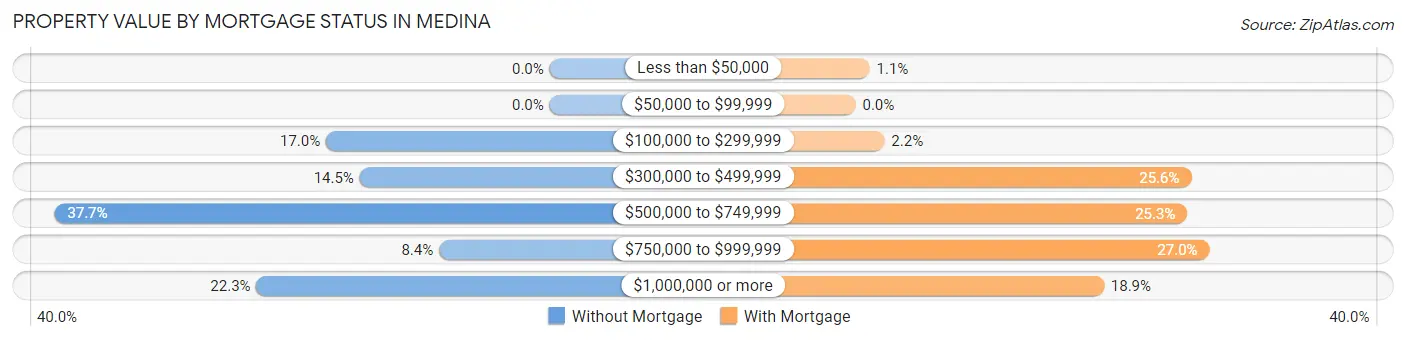
| Property Value | Without Mortgage | With Mortgage |
| Less than $50,000 | 0 (0.0%) | 17 (1.1%) |
| $50,000 to $99,999 | 0 (0.0%) | 0 (0.0%) |
| $100,000 to $299,999 | 93 (17.0%) | 35 (2.2%) |
| $300,000 to $499,999 | 79 (14.5%) | 407 (25.6%) |
| $500,000 to $749,999 | 206 (37.7%) | 402 (25.3%) |
| $750,000 to $999,999 | 46 (8.4%) | 429 (27.0%) |
| $1,000,000 or more | 122 (22.3%) | 301 (18.9%) |
| Total | 546 (100.0%) | 1,591 (100.0%) |
Household Income by Mortgage Status in Medina
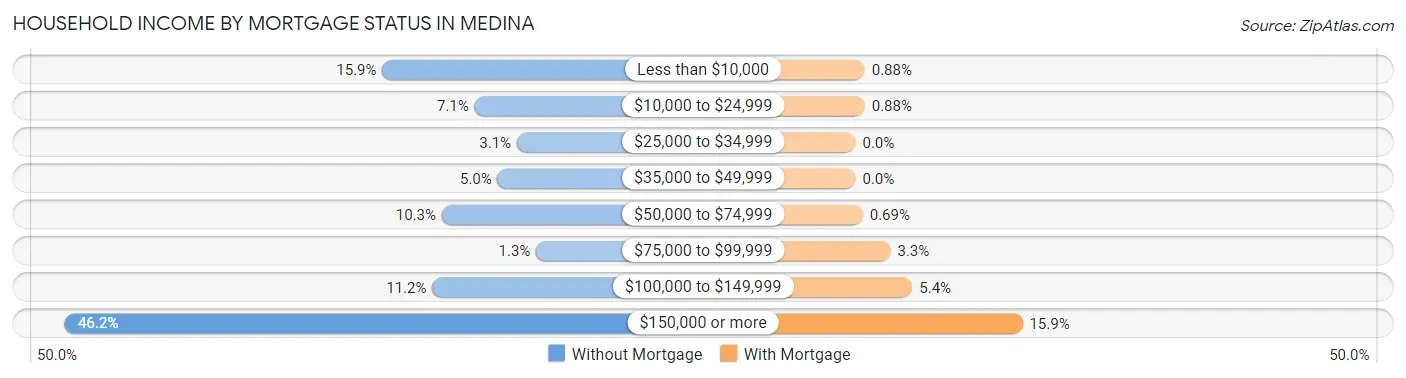
| Household Income | Without Mortgage | With Mortgage |
| Less than $10,000 | 87 (15.9%) | 14 (0.9%) |
| $10,000 to $24,999 | 39 (7.1%) | 14 (0.9%) |
| $25,000 to $34,999 | 17 (3.1%) | 0 (0.0%) |
| $35,000 to $49,999 | 27 (5.0%) | 0 (0.0%) |
| $50,000 to $74,999 | 56 (10.3%) | 11 (0.7%) |
| $75,000 to $99,999 | 7 (1.3%) | 53 (3.3%) |
| $100,000 to $149,999 | 61 (11.2%) | 86 (5.4%) |
| $150,000 or more | 252 (46.2%) | 253 (15.9%) |
| Total | 546 (100.0%) | 1,591 (100.0%) |
Property Value to Household Income Ratio in Medina
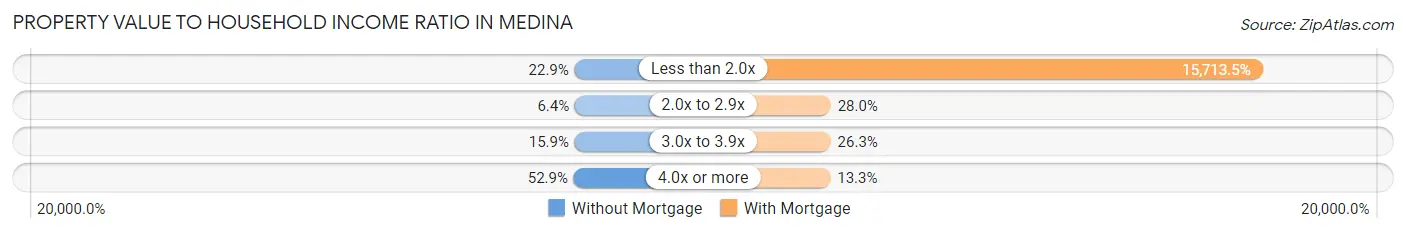
| Value-to-Income Ratio | Without Mortgage | With Mortgage |
| Less than 2.0x | 125 (22.9%) | 250,001 (15,713.5%) |
| 2.0x to 2.9x | 35 (6.4%) | 446 (28.0%) |
| 3.0x to 3.9x | 87 (15.9%) | 418 (26.3%) |
| 4.0x or more | 289 (52.9%) | 212 (13.3%) |
| Total | 546 (100.0%) | 1,591 (100.0%) |
Real Estate Taxes by Mortgage Status in Medina
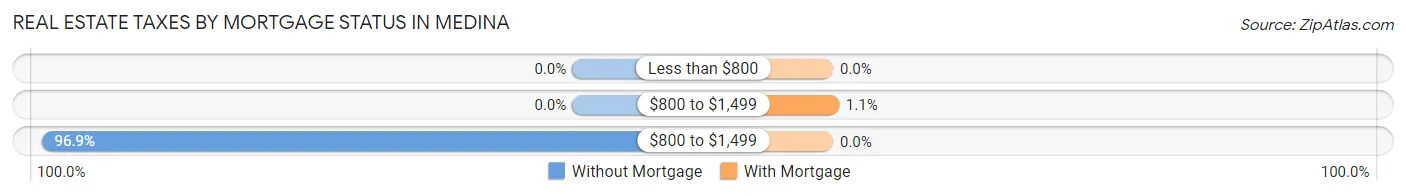
| Property Taxes | Without Mortgage | With Mortgage |
| Less than $800 | 0 (0.0%) | 0 (0.0%) |
| $800 to $1,499 | 0 (0.0%) | 17 (1.1%) |
| $800 to $1,499 | 529 (96.9%) | 0 (0.0%) |
| Total | 546 (100.0%) | 1,591 (100.0%) |
Health & Disability in Medina
Health Insurance Coverage by Age in Medina
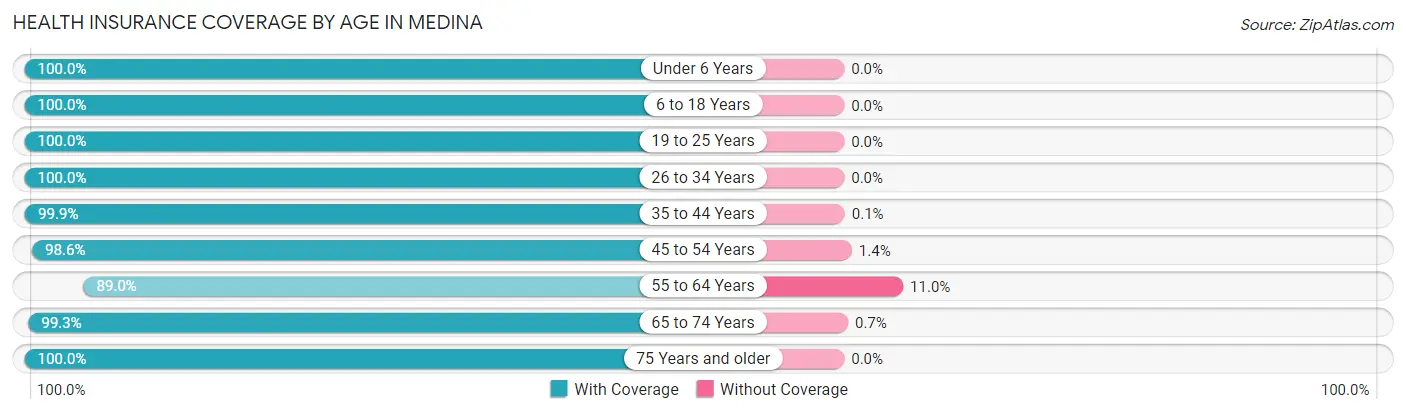
| Age Bracket | With Coverage | Without Coverage |
| Under 6 Years | 650 (100.0%) | 0 (0.0%) |
| 6 to 18 Years | 1,605 (100.0%) | 0 (0.0%) |
| 19 to 25 Years | 190 (100.0%) | 0 (0.0%) |
| 26 to 34 Years | 512 (100.0%) | 0 (0.0%) |
| 35 to 44 Years | 970 (99.9%) | 1 (0.1%) |
| 45 to 54 Years | 1,178 (98.6%) | 17 (1.4%) |
| 55 to 64 Years | 843 (89.0%) | 104 (11.0%) |
| 65 to 74 Years | 426 (99.3%) | 3 (0.7%) |
| 75 Years and older | 239 (100.0%) | 0 (0.0%) |
| Total | 6,613 (98.1%) | 125 (1.9%) |
Health Insurance Coverage by Citizenship Status in Medina
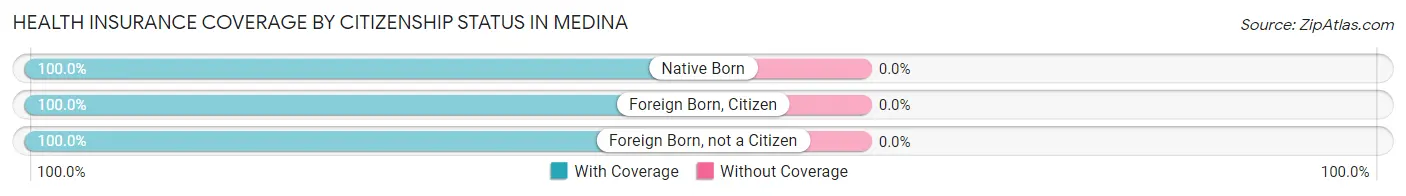
| Citizenship Status | With Coverage | Without Coverage |
| Native Born | 650 (100.0%) | 0 (0.0%) |
| Foreign Born, Citizen | 1,605 (100.0%) | 0 (0.0%) |
| Foreign Born, not a Citizen | 190 (100.0%) | 0 (0.0%) |
Health Insurance Coverage by Household Income in Medina
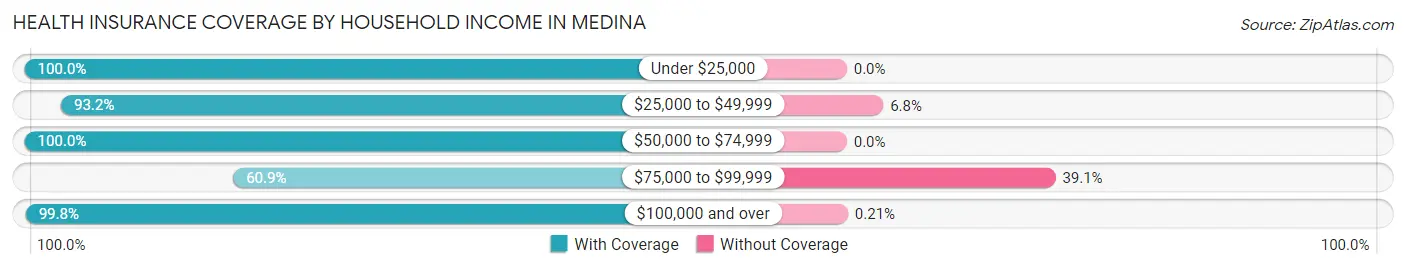
| Household Income | With Coverage | Without Coverage |
| Under $25,000 | 233 (100.0%) | 0 (0.0%) |
| $25,000 to $49,999 | 232 (93.2%) | 17 (6.8%) |
| $50,000 to $74,999 | 275 (100.0%) | 0 (0.0%) |
| $75,000 to $99,999 | 148 (60.9%) | 95 (39.1%) |
| $100,000 and over | 5,725 (99.8%) | 12 (0.2%) |
Public vs Private Health Insurance Coverage by Age in Medina
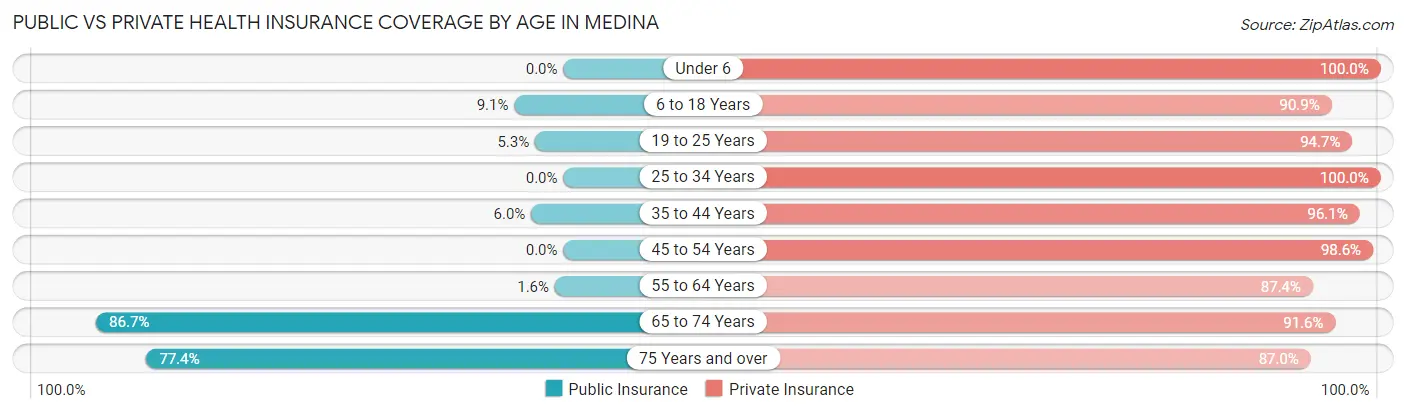
| Age Bracket | Public Insurance | Private Insurance |
| Under 6 | 0 (0.0%) | 650 (100.0%) |
| 6 to 18 Years | 146 (9.1%) | 1,459 (90.9%) |
| 19 to 25 Years | 10 (5.3%) | 180 (94.7%) |
| 25 to 34 Years | 0 (0.0%) | 512 (100.0%) |
| 35 to 44 Years | 58 (6.0%) | 933 (96.1%) |
| 45 to 54 Years | 0 (0.0%) | 1,178 (98.6%) |
| 55 to 64 Years | 15 (1.6%) | 828 (87.4%) |
| 65 to 74 Years | 372 (86.7%) | 393 (91.6%) |
| 75 Years and over | 185 (77.4%) | 208 (87.0%) |
| Total | 786 (11.7%) | 6,341 (94.1%) |
Disability Status by Sex by Age in Medina
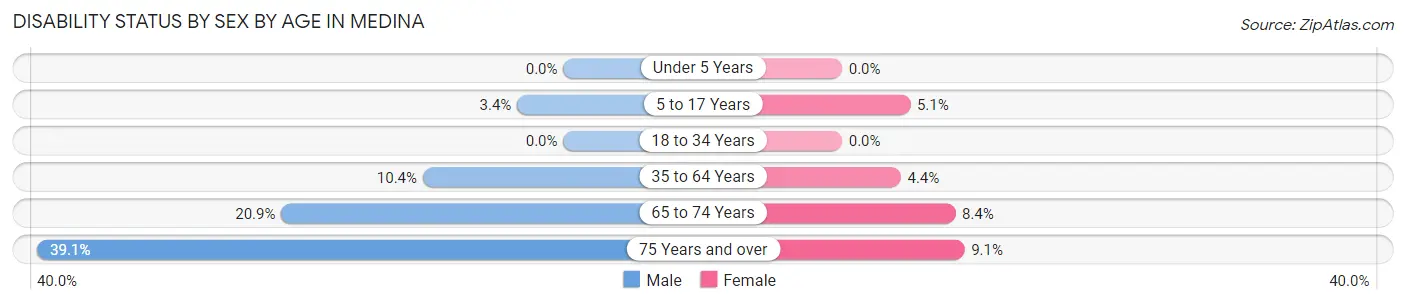
| Age Bracket | Male | Female |
| Under 5 Years | 0 (0.0%) | 0 (0.0%) |
| 5 to 17 Years | 30 (3.4%) | 41 (5.1%) |
| 18 to 34 Years | 0 (0.0%) | 0 (0.0%) |
| 35 to 64 Years | 174 (10.4%) | 63 (4.4%) |
| 65 to 74 Years | 40 (20.9%) | 20 (8.4%) |
| 75 Years and over | 59 (39.1%) | 8 (9.1%) |
Disability Class by Sex by Age in Medina
Disability Class: Hearing Difficulty
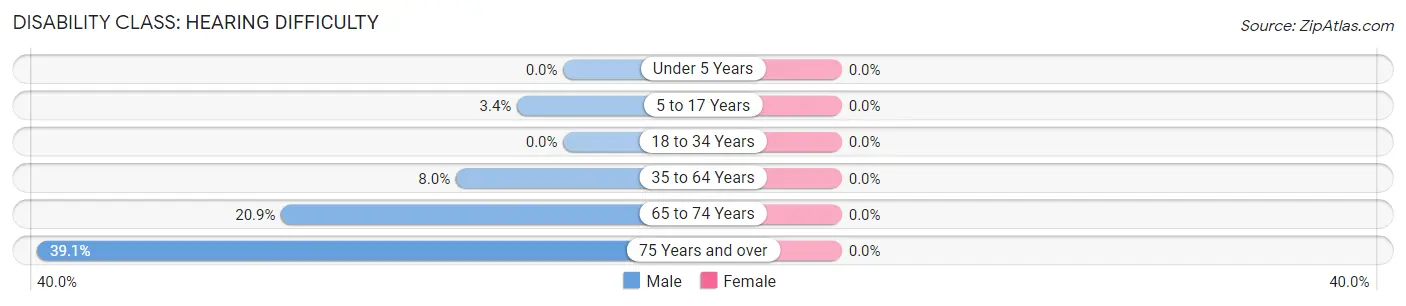
| Age Bracket | Male | Female |
| Under 5 Years | 0 (0.0%) | 0 (0.0%) |
| 5 to 17 Years | 30 (3.4%) | 0 (0.0%) |
| 18 to 34 Years | 0 (0.0%) | 0 (0.0%) |
| 35 to 64 Years | 133 (8.0%) | 0 (0.0%) |
| 65 to 74 Years | 40 (20.9%) | 0 (0.0%) |
| 75 Years and over | 59 (39.1%) | 0 (0.0%) |
Disability Class: Vision Difficulty
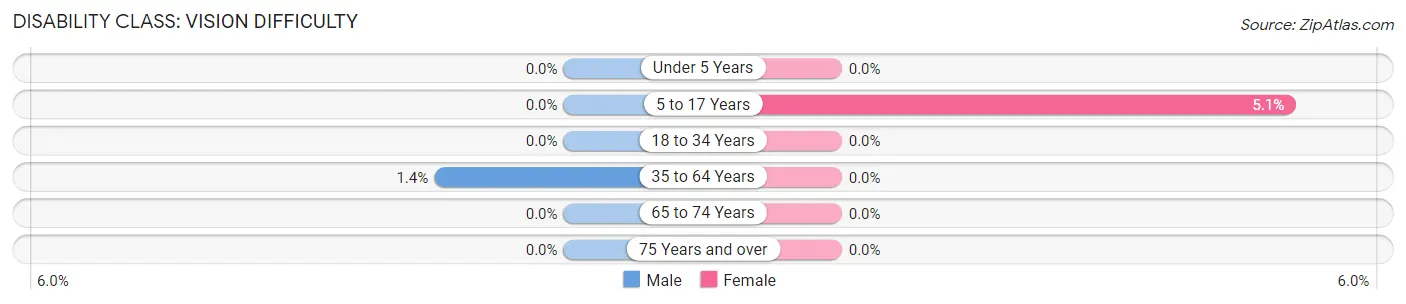
| Age Bracket | Male | Female |
| Under 5 Years | 0 (0.0%) | 0 (0.0%) |
| 5 to 17 Years | 0 (0.0%) | 41 (5.1%) |
| 18 to 34 Years | 0 (0.0%) | 0 (0.0%) |
| 35 to 64 Years | 24 (1.4%) | 0 (0.0%) |
| 65 to 74 Years | 0 (0.0%) | 0 (0.0%) |
| 75 Years and over | 0 (0.0%) | 0 (0.0%) |
Disability Class: Cognitive Difficulty
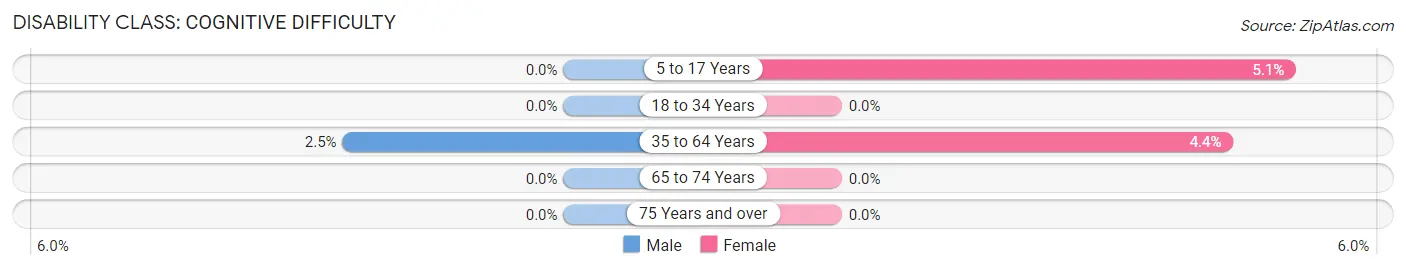
| Age Bracket | Male | Female |
| 5 to 17 Years | 0 (0.0%) | 41 (5.1%) |
| 18 to 34 Years | 0 (0.0%) | 0 (0.0%) |
| 35 to 64 Years | 41 (2.5%) | 63 (4.4%) |
| 65 to 74 Years | 0 (0.0%) | 0 (0.0%) |
| 75 Years and over | 0 (0.0%) | 0 (0.0%) |
Disability Class: Ambulatory Difficulty
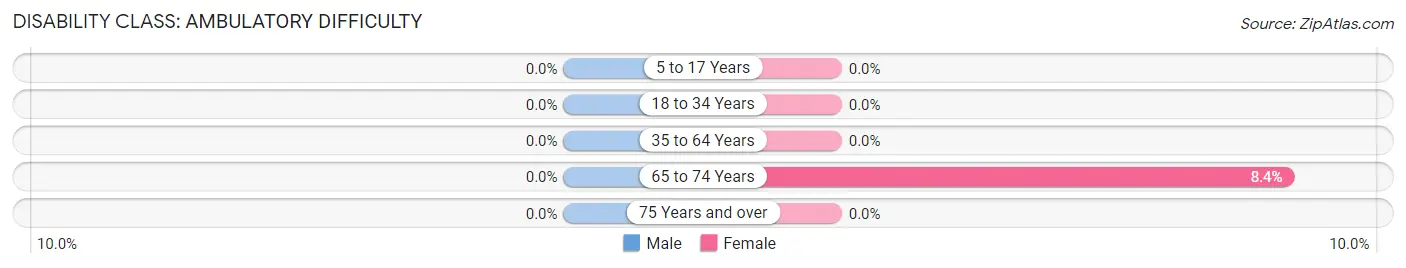
| Age Bracket | Male | Female |
| 5 to 17 Years | 0 (0.0%) | 0 (0.0%) |
| 18 to 34 Years | 0 (0.0%) | 0 (0.0%) |
| 35 to 64 Years | 0 (0.0%) | 0 (0.0%) |
| 65 to 74 Years | 0 (0.0%) | 20 (8.4%) |
| 75 Years and over | 0 (0.0%) | 0 (0.0%) |
Disability Class: Self-Care Difficulty
| Age Bracket | Male | Female |
| 5 to 17 Years | 0 (0.0%) | 0 (0.0%) |
| 18 to 34 Years | 0 (0.0%) | 0 (0.0%) |
| 35 to 64 Years | 0 (0.0%) | 0 (0.0%) |
| 65 to 74 Years | 0 (0.0%) | 0 (0.0%) |
| 75 Years and over | 0 (0.0%) | 0 (0.0%) |
Technology Access in Medina
Computing Device Access in Medina
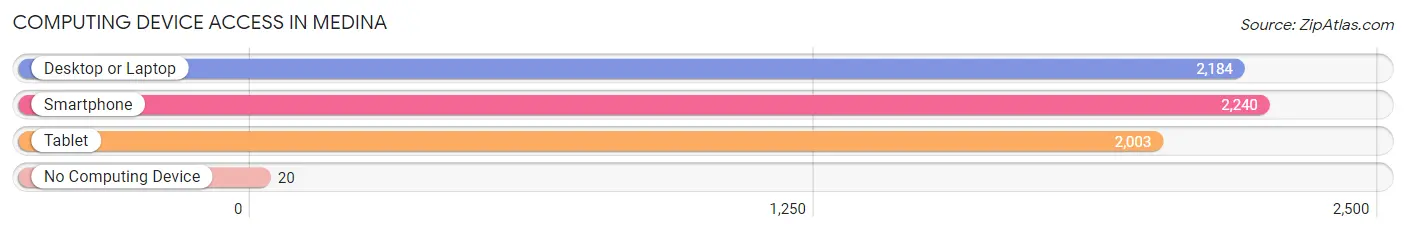
| Device Type | # Households | % Households |
| Desktop or Laptop | 2,184 | 94.5% |
| Smartphone | 2,240 | 96.9% |
| Tablet | 2,003 | 86.7% |
| No Computing Device | 20 | 0.9% |
| Total | 2,311 | 100.0% |
Internet Access in Medina
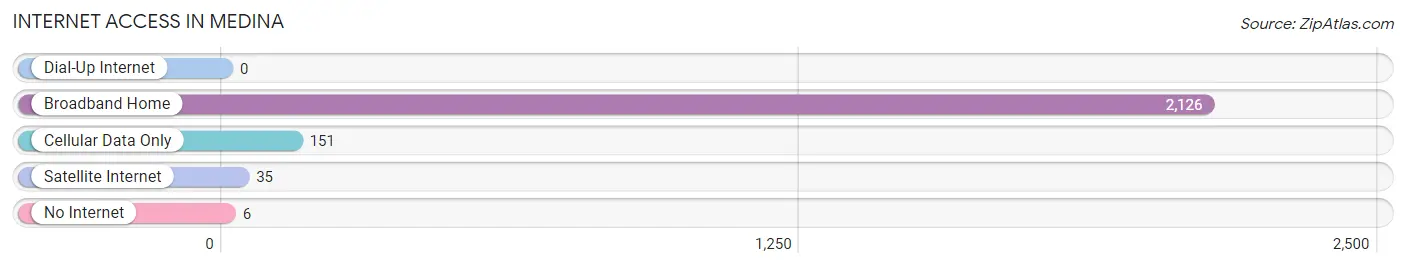
| Internet Type | # Households | % Households |
| Dial-Up Internet | 0 | 0.0% |
| Broadband Home | 2,126 | 92.0% |
| Cellular Data Only | 151 | 6.5% |
| Satellite Internet | 35 | 1.5% |
| No Internet | 6 | 0.3% |
| Total | 2,311 | 100.0% |
Medina Summary
Medina is a city located in Hennepin County, Minnesota, United States. The population was 22,070 at the 2010 census. It is a suburb of Minneapolis and is located on the north side of the Twin Cities metropolitan area.
Geography
Medina is located at 45°14'7" North, 93°30'45" West (45.235, -93.512). According to the United States Census Bureau, the city has a total area of 11.2 square miles, of which 11.1 square miles is land and 0.1 square miles is water.
The city is located on the north side of the Twin Cities metropolitan area, and is bordered by Plymouth to the north, Maple Grove to the east, Corcoran to the south, and Loretto to the west.
History
Medina was first settled in 1855 by settlers from New England. The city was named after the city of Medina in Saudi Arabia, which was the birthplace of the Prophet Muhammad. The city was incorporated in 1950.
Economy
Medina is home to several large employers, including Polaris Industries, a manufacturer of snowmobiles, all-terrain vehicles, and motorcycles; and Andersen Corporation, a manufacturer of windows and doors. Other major employers include the University of Minnesota, the Mayo Clinic, and the Minneapolis-St. Paul International Airport.
Demographics
As of the 2010 census, there were 22,070 people, 8,845 households, and 6,072 families residing in the city. The population density was 1,988.3 people per square mile. The racial makeup of the city was 87.2% White, 4.3% African American, 0.3% Native American, 4.7% Asian, 0.1% Pacific Islander, 1.3% from other races, and 2.2% from two or more races. Hispanic or Latino of any race were 3.7% of the population.
The median income for a household in the city was $76,845, and the median income for a family was $93,945. The per capita income for the city was $37,945. About 2.3% of families and 3.7% of the population were below the poverty line, including 4.2% of those under age 18 and 3.2% of those age 65 or over.
Conclusion
Medina is a city located in Hennepin County, Minnesota, United States. It is a suburb of Minneapolis and is located on the north side of the Twin Cities metropolitan area. The city was first settled in 1855 by settlers from New England and was named after the city of Medina in Saudi Arabia. The population was 22,070 at the 2010 census. The city is home to several large employers, including Polaris Industries, Andersen Corporation, the University of Minnesota, the Mayo Clinic, and the Minneapolis-St. Paul International Airport. The median income for a household in the city was $76,845, and the median income for a family was $93,945. The racial makeup of the city was 87.2% White, 4.3% African American, 0.3% Native American, 4.7% Asian, 0.1% Pacific Islander, 1.3% from other races, and 2.2% from two or more races. Hispanic or Latino of any race were 3.7% of the population.
Common Questions
What is Per Capita Income in Medina?
Per Capita income in Medina is $108,945.
What is the Median Family Income in Medina?
Median Family Income in Medina is $250,001.
What is the Median Household income in Medina?
Median Household Income in Medina is $202,153.
What is Income or Wage Gap in Medina?
Income or Wage Gap in Medina is 59.6%.
Women in Medina earn 40.4 cents for every dollar earned by a man.
What is Inequality or Gini Index in Medina?
Inequality or Gini Index in Medina is 0.52.
What is the Total Population of Medina?
Total Population of Medina is 6,746.
What is the Total Male Population of Medina?
Total Male Population of Medina is 3,345.
What is the Total Female Population of Medina?
Total Female Population of Medina is 3,401.
What is the Ratio of Males per 100 Females in Medina?
There are 98.35 Males per 100 Females in Medina.
What is the Ratio of Females per 100 Males in Medina?
There are 101.67 Females per 100 Males in Medina.
What is the Median Population Age in Medina?
Median Population Age in Medina is 39.2 Years.
What is the Average Family Size in Medina
Average Family Size in Medina is 3.3 People.
What is the Average Household Size in Medina
Average Household Size in Medina is 2.9 People.
How Large is the Labor Force in Medina?
There are 3,324 People in the Labor Forcein in Medina.
What is the Percentage of People in the Labor Force in Medina?
71.4% of People are in the Labor Force in Medina.
What is the Unemployment Rate in Medina?
Unemployment Rate in Medina is 1.8%.