Genoa, NV Map & Demographics
Genoa Map
Genoa Overview
$83,005
PER CAPITA INCOME
$129,474
AVG FAMILY INCOME
$116,250
AVG HOUSEHOLD INCOME
20.2%
WAGE / INCOME GAP [ % ]
79.8¢/ $1
WAGE / INCOME GAP [ $ ]
0.45
INEQUALITY / GINI INDEX
1,013
TOTAL POPULATION
533
MALE POPULATION
480
FEMALE POPULATION
111.04
MALES / 100 FEMALES
90.06
FEMALES / 100 MALES
62.8
MEDIAN AGE
2.5
AVG FAMILY SIZE
2.2
AVG HOUSEHOLD SIZE
448
LABOR FORCE [ PEOPLE ]
48.7%
PERCENT IN LABOR FORCE
3.8%
UNEMPLOYMENT RATE
Genoa Zip Codes
Genoa Area Codes
Income in Genoa
Income Overview in Genoa
Per Capita Income in Genoa is $83,005, while median incomes of families and households are $129,474 and $116,250 respectively.
| Characteristic | Number | Measure |
| Per Capita Income | 1,013 | $83,005 |
| Median Family Income | 314 | $129,474 |
| Mean Family Income | 314 | $204,104 |
| Median Household Income | 469 | $116,250 |
| Mean Household Income | 469 | $176,474 |
| Income Deficit | 314 | $0 |
| Wage / Income Gap (%) | 1,013 | 20.18% |
| Wage / Income Gap ($) | 1,013 | 79.82¢ per $1 |
| Gini / Inequality Index | 1,013 | 0.45 |
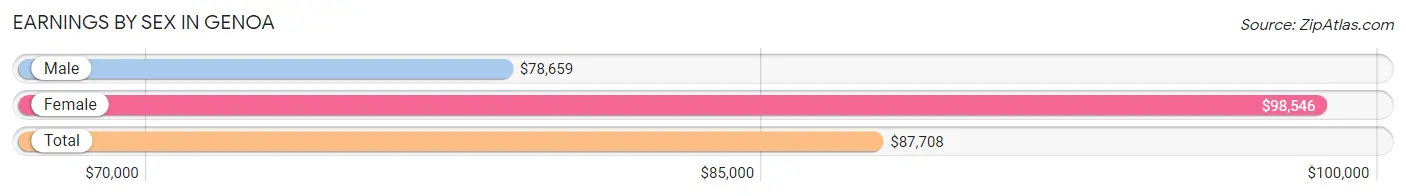
Earnings by Sex in Genoa
Average Earnings in Genoa are $87,708, $78,659 for men and $98,546 for women, a difference of 20.2%.
| Sex | Number | Average Earnings |
| Male | 346 (66.2%) | $78,659 |
| Female | 177 (33.8%) | $98,546 |
| Total | 523 (100.0%) | $87,708 |
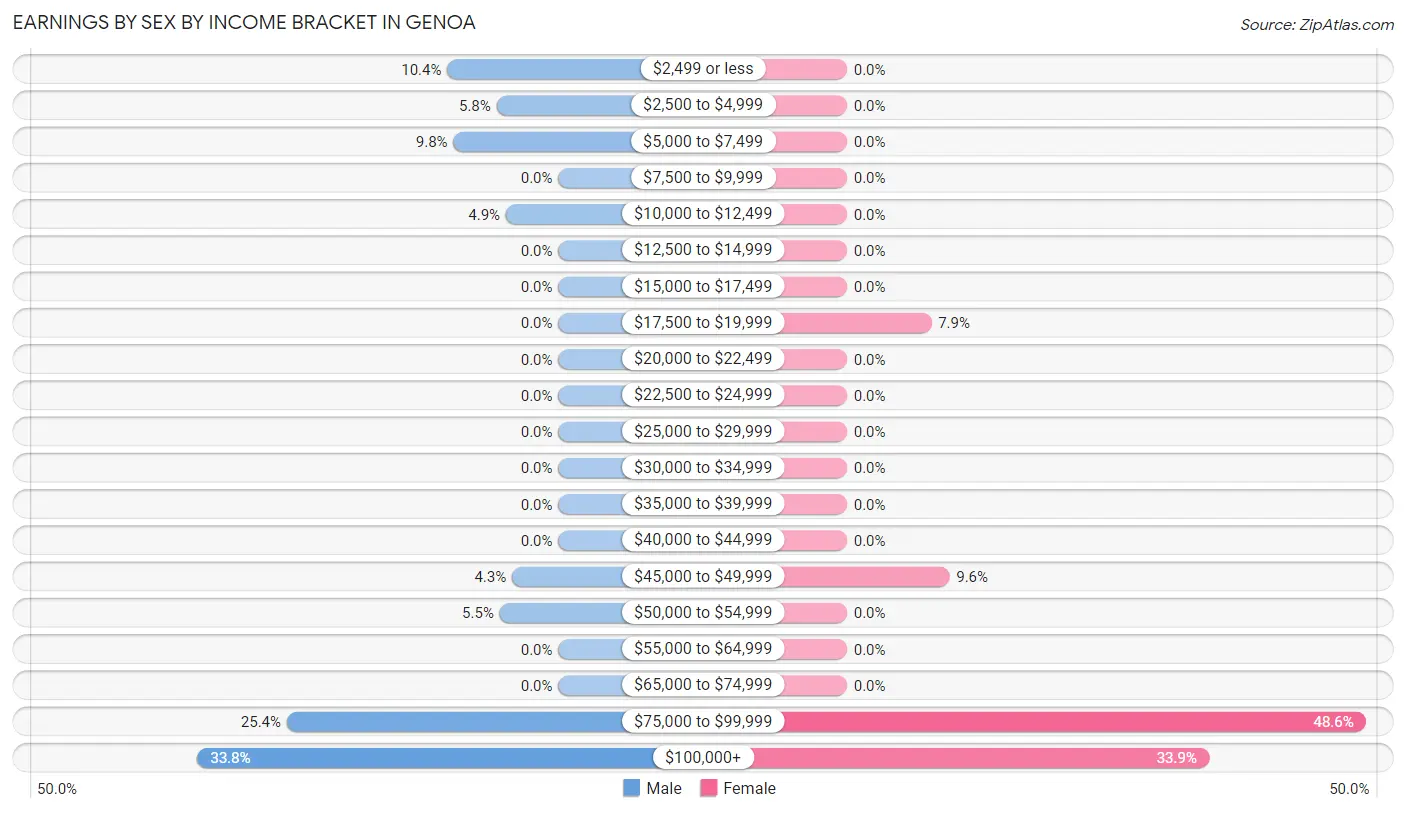
Earnings by Sex by Income Bracket in Genoa
The most common earnings brackets in Genoa are $100,000+ for men (117 | 33.8%) and $75,000 to $99,999 for women (86 | 48.6%).
| Income | Male | Female |
| $2,499 or less | 36 (10.4%) | 0 (0.0%) |
| $2,500 to $4,999 | 20 (5.8%) | 0 (0.0%) |
| $5,000 to $7,499 | 34 (9.8%) | 0 (0.0%) |
| $7,500 to $9,999 | 0 (0.0%) | 0 (0.0%) |
| $10,000 to $12,499 | 17 (4.9%) | 0 (0.0%) |
| $12,500 to $14,999 | 0 (0.0%) | 0 (0.0%) |
| $15,000 to $17,499 | 0 (0.0%) | 0 (0.0%) |
| $17,500 to $19,999 | 0 (0.0%) | 14 (7.9%) |
| $20,000 to $22,499 | 0 (0.0%) | 0 (0.0%) |
| $22,500 to $24,999 | 0 (0.0%) | 0 (0.0%) |
| $25,000 to $29,999 | 0 (0.0%) | 0 (0.0%) |
| $30,000 to $34,999 | 0 (0.0%) | 0 (0.0%) |
| $35,000 to $39,999 | 0 (0.0%) | 0 (0.0%) |
| $40,000 to $44,999 | 0 (0.0%) | 0 (0.0%) |
| $45,000 to $49,999 | 15 (4.3%) | 17 (9.6%) |
| $50,000 to $54,999 | 19 (5.5%) | 0 (0.0%) |
| $55,000 to $64,999 | 0 (0.0%) | 0 (0.0%) |
| $65,000 to $74,999 | 0 (0.0%) | 0 (0.0%) |
| $75,000 to $99,999 | 88 (25.4%) | 86 (48.6%) |
| $100,000+ | 117 (33.8%) | 60 (33.9%) |
| Total | 346 (100.0%) | 177 (100.0%) |
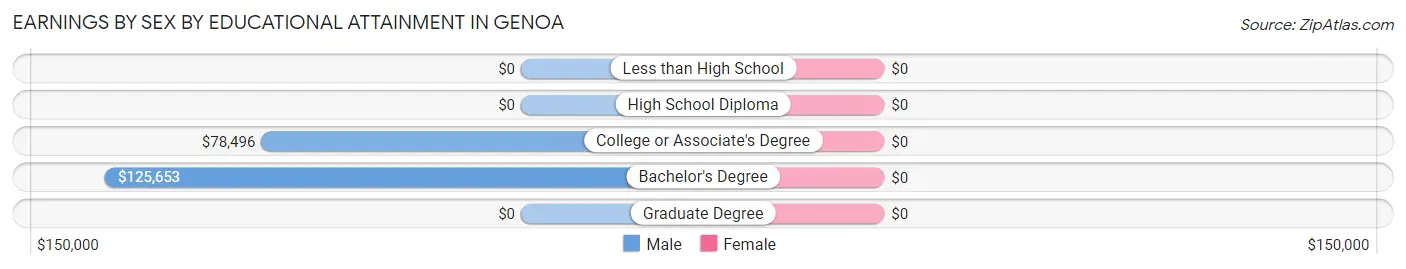
Earnings by Sex by Educational Attainment in Genoa
| Educational Attainment | Male Income | Female Income |
| Less than High School | - | - |
| High School Diploma | - | - |
| College or Associate's Degree | $78,496 | $0 |
| Bachelor's Degree | $125,653 | $0 |
| Graduate Degree | - | - |
| Total | $79,275 | $98,546 |
Family Income in Genoa
Family Income Brackets in Genoa
According to the Genoa family income data, there are 109 families falling into the $200,000+ income range, which is the most common income bracket and makes up 34.7% of all families.
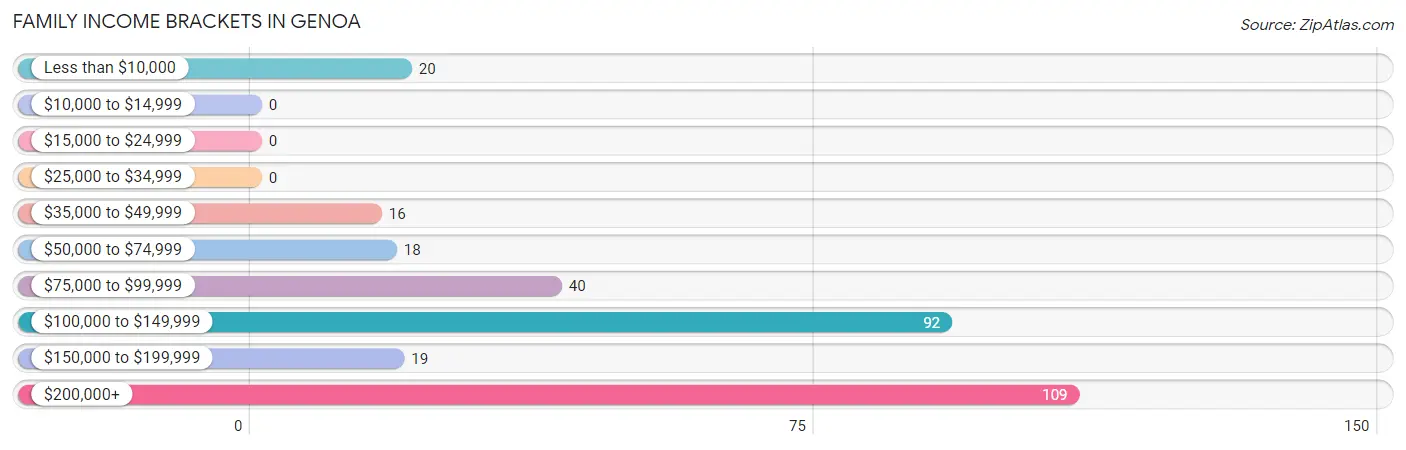
| Income Bracket | # Families | % Families |
| Less than $10,000 | 20 | 6.4% |
| $10,000 to $14,999 | 0 | 0.0% |
| $15,000 to $24,999 | 0 | 0.0% |
| $25,000 to $34,999 | 0 | 0.0% |
| $35,000 to $49,999 | 16 | 5.1% |
| $50,000 to $74,999 | 18 | 5.7% |
| $75,000 to $99,999 | 40 | 12.7% |
| $100,000 to $149,999 | 92 | 29.3% |
| $150,000 to $199,999 | 19 | 6.1% |
| $200,000+ | 109 | 34.7% |
Family Income by Famaliy Size in Genoa
2-person families (253 | 80.6%) account for the highest median family income in Genoa with $120,347 per family, while 2-person families (253 | 80.6%) have the highest median income of $60,174 per family member.
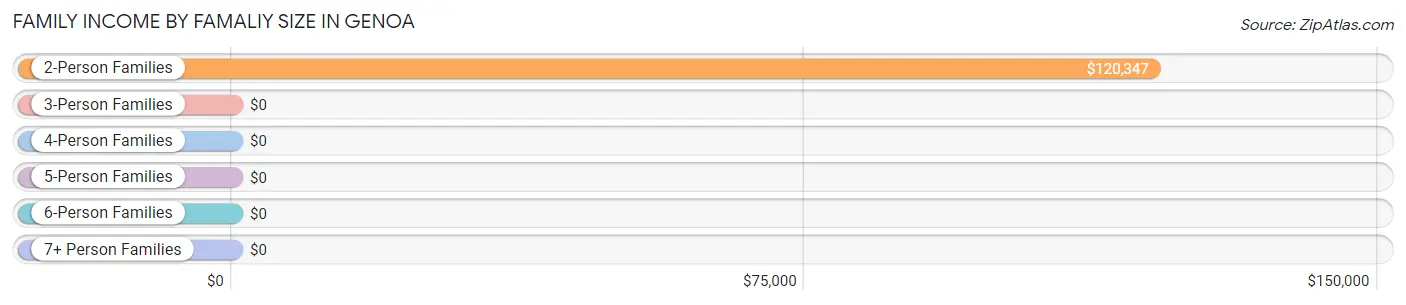
| Income Bracket | # Families | Median Income |
| 2-Person Families | 253 (80.6%) | $120,347 |
| 3-Person Families | 0 (0.0%) | $0 |
| 4-Person Families | 42 (13.4%) | $0 |
| 5-Person Families | 19 (6.0%) | $0 |
| 6-Person Families | 0 (0.0%) | $0 |
| 7+ Person Families | 0 (0.0%) | $0 |
| Total | 314 (100.0%) | $129,474 |
Family Income by Number of Earners in Genoa
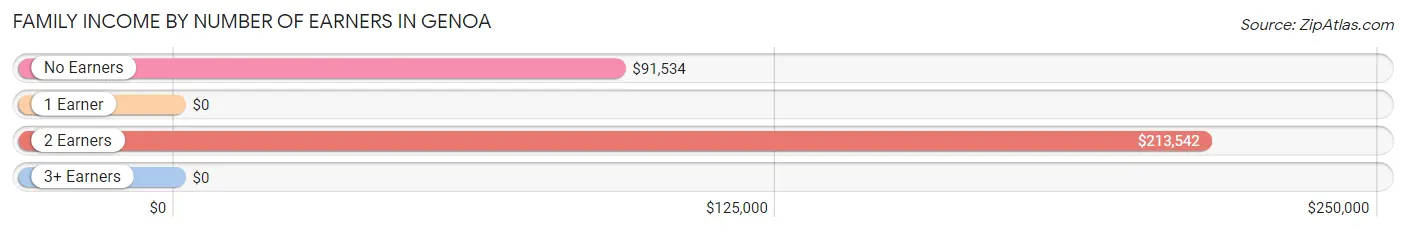
| Number of Earners | # Families | Median Income |
| No Earners | 135 (43.0%) | $91,534 |
| 1 Earner | 18 (5.7%) | $0 |
| 2 Earners | 119 (37.9%) | $213,542 |
| 3+ Earners | 42 (13.4%) | $0 |
| Total | 314 (100.0%) | $129,474 |
Household Income in Genoa
Household Income Brackets in Genoa
With 159 households falling in the category, the $100,000 to $149,999 income range is the most frequent in Genoa, accounting for 33.9% of all households.
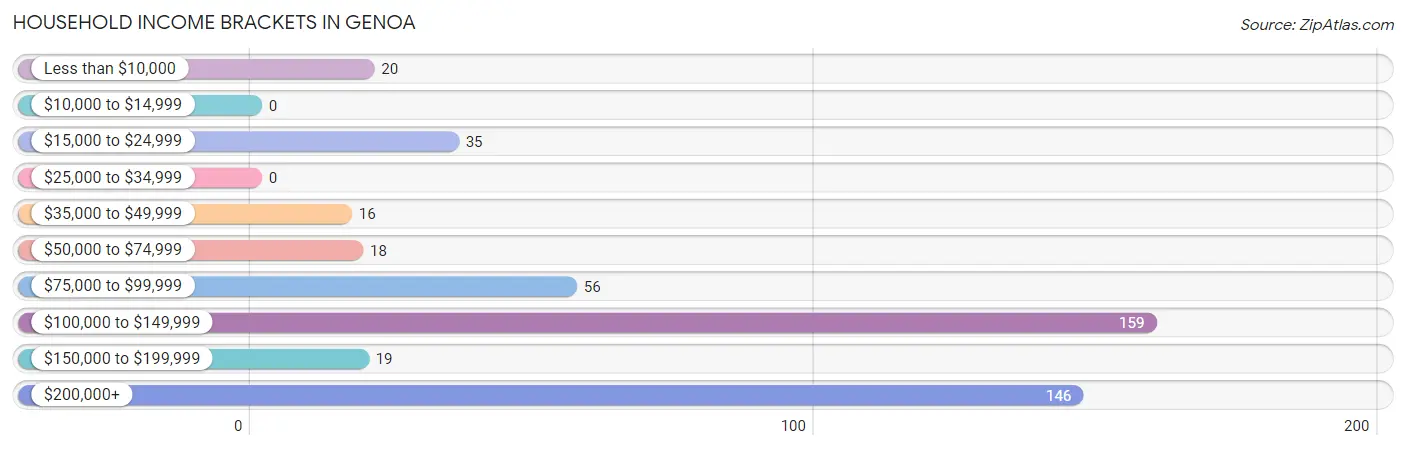
| Income Bracket | # Households | % Households |
| Less than $10,000 | 20 | 4.3% |
| $10,000 to $14,999 | 0 | 0.0% |
| $15,000 to $24,999 | 35 | 7.5% |
| $25,000 to $34,999 | 0 | 0.0% |
| $35,000 to $49,999 | 16 | 3.4% |
| $50,000 to $74,999 | 18 | 3.8% |
| $75,000 to $99,999 | 56 | 11.9% |
| $100,000 to $149,999 | 159 | 33.9% |
| $150,000 to $199,999 | 19 | 4.1% |
| $200,000+ | 146 | 31.1% |
Household Income by Householder Age in Genoa
The median household income in Genoa is $116,250, with the highest median household income of $250,001 found in the 45 to 64 years age bracket for the primary householder. A total of 115 households (24.5%) fall into this category.
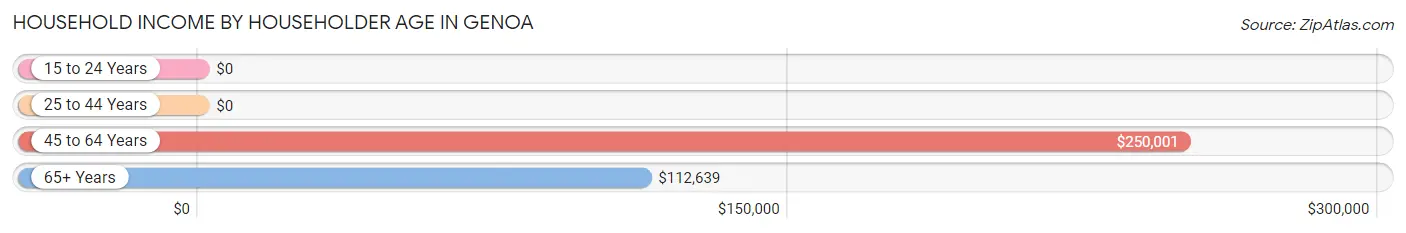
| Income Bracket | # Households | Median Income |
| 15 to 24 Years | 0 (0.0%) | $0 |
| 25 to 44 Years | 62 (13.2%) | $0 |
| 45 to 64 Years | 115 (24.5%) | $250,001 |
| 65+ Years | 292 (62.3%) | $112,639 |
| Total | 469 (100.0%) | $116,250 |
Poverty in Genoa
Income Below Poverty by Sex and Age in Genoa
With 3.9% poverty level for males and 4.2% for females among the residents of Genoa, 65 to 74 year old males and 65 to 74 year old females are the most vulnerable to poverty, with 21 males (20.8%) and 20 females (15.3%) in their respective age groups living below the poverty level.
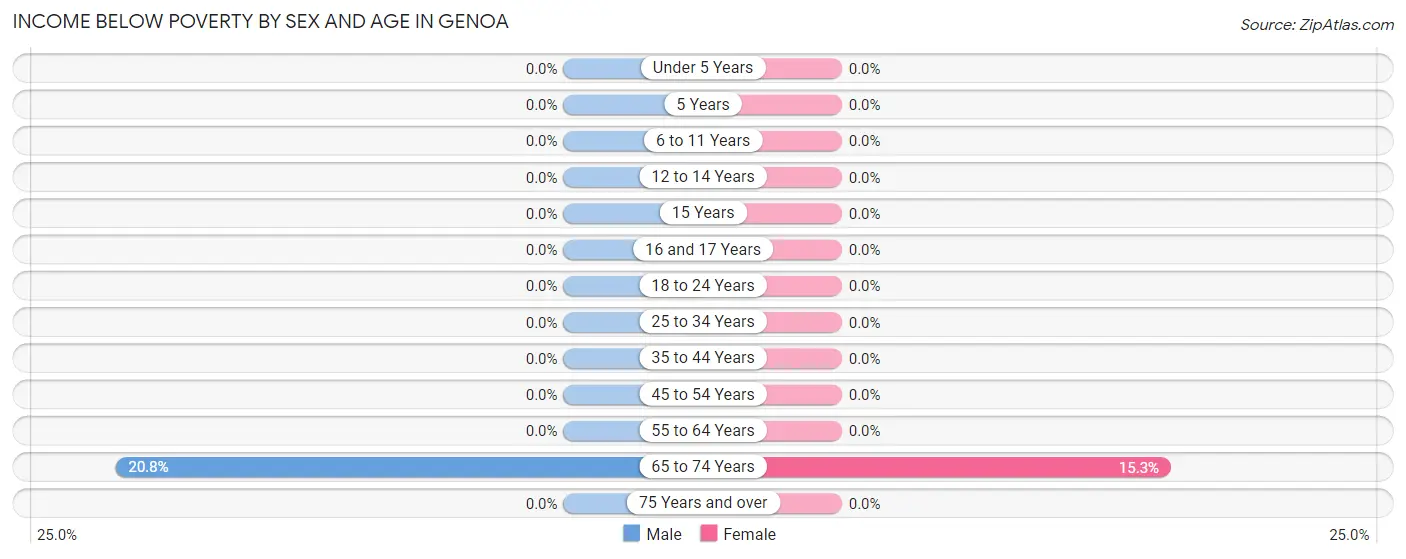
| Age Bracket | Male | Female |
| Under 5 Years | 0 (0.0%) | 0 (0.0%) |
| 5 Years | 0 (0.0%) | 0 (0.0%) |
| 6 to 11 Years | 0 (0.0%) | 0 (0.0%) |
| 12 to 14 Years | 0 (0.0%) | 0 (0.0%) |
| 15 Years | 0 (0.0%) | 0 (0.0%) |
| 16 and 17 Years | 0 (0.0%) | 0 (0.0%) |
| 18 to 24 Years | 0 (0.0%) | 0 (0.0%) |
| 25 to 34 Years | 0 (0.0%) | 0 (0.0%) |
| 35 to 44 Years | 0 (0.0%) | 0 (0.0%) |
| 45 to 54 Years | 0 (0.0%) | 0 (0.0%) |
| 55 to 64 Years | 0 (0.0%) | 0 (0.0%) |
| 65 to 74 Years | 21 (20.8%) | 20 (15.3%) |
| 75 Years and over | 0 (0.0%) | 0 (0.0%) |
| Total | 21 (3.9%) | 20 (4.2%) |
Income Above Poverty by Sex and Age in Genoa
According to the poverty statistics in Genoa, males aged 6 to 11 years and females aged 6 to 11 years are the age groups that are most secure financially, with 100.0% of males and 100.0% of females in these age groups living above the poverty line.
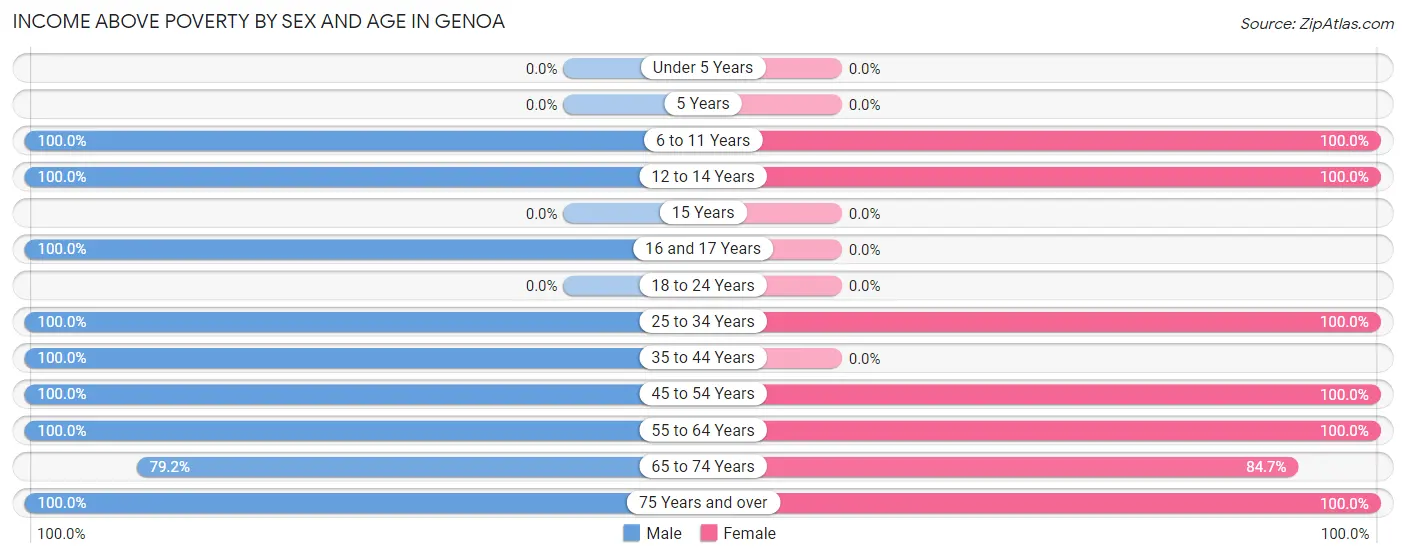
| Age Bracket | Male | Female |
| Under 5 Years | 0 (0.0%) | 0 (0.0%) |
| 5 Years | 0 (0.0%) | 0 (0.0%) |
| 6 to 11 Years | 18 (100.0%) | 20 (100.0%) |
| 12 to 14 Years | 17 (100.0%) | 38 (100.0%) |
| 15 Years | 0 (0.0%) | 0 (0.0%) |
| 16 and 17 Years | 34 (100.0%) | 0 (0.0%) |
| 18 to 24 Years | 0 (0.0%) | 0 (0.0%) |
| 25 to 34 Years | 13 (100.0%) | 49 (100.0%) |
| 35 to 44 Years | 67 (100.0%) | 0 (0.0%) |
| 45 to 54 Years | 73 (100.0%) | 61 (100.0%) |
| 55 to 64 Years | 106 (100.0%) | 54 (100.0%) |
| 65 to 74 Years | 80 (79.2%) | 111 (84.7%) |
| 75 Years and over | 104 (100.0%) | 127 (100.0%) |
| Total | 512 (96.1%) | 460 (95.8%) |
Income Below Poverty Among Married-Couple Families in Genoa
The poverty statistics for married-couple families in Genoa show that 6.4% or 20 of the total 314 families live below the poverty line. Families with no children have the highest poverty rate of 7.9%, comprising of 20 families. On the other hand, families with 1 or 2 children have the lowest poverty rate of 0.0%, which includes 0 families.
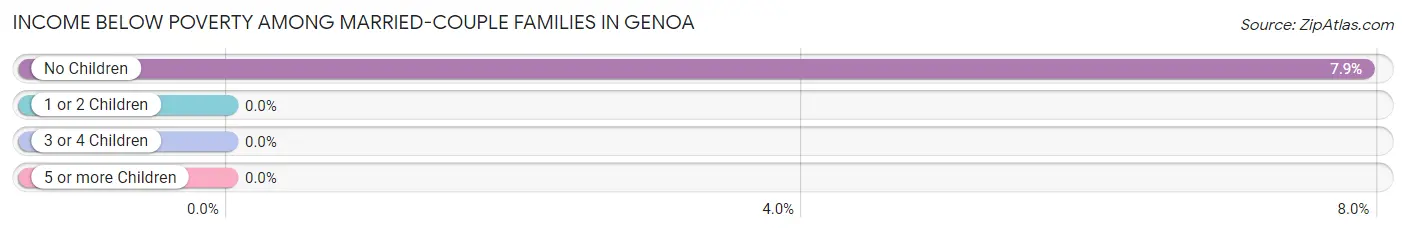
| Children | Above Poverty | Below Poverty |
| No Children | 233 (92.1%) | 20 (7.9%) |
| 1 or 2 Children | 42 (100.0%) | 0 (0.0%) |
| 3 or 4 Children | 19 (100.0%) | 0 (0.0%) |
| 5 or more Children | 0 (0.0%) | 0 (0.0%) |
| Total | 294 (93.6%) | 20 (6.4%) |
Income Below Poverty Among Single-Parent Households in Genoa
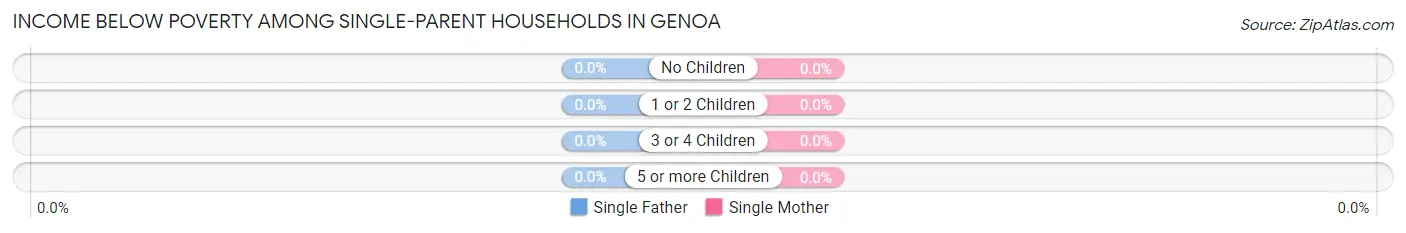
| Children | Single Father | Single Mother |
| No Children | 0 (0.0%) | 0 (0.0%) |
| 1 or 2 Children | 0 (0.0%) | 0 (0.0%) |
| 3 or 4 Children | 0 (0.0%) | 0 (0.0%) |
| 5 or more Children | 0 (0.0%) | 0 (0.0%) |
| Total | 0 (0.0%) | 0 (0.0%) |
Income Below Poverty Among Married-Couple vs Single-Parent Households in Genoa
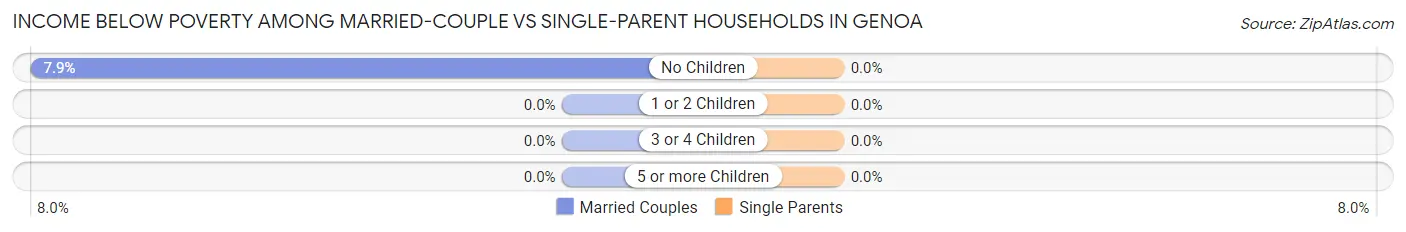
| Children | Married-Couple Families | Single-Parent Households |
| No Children | 20 (7.9%) | 0 (0.0%) |
| 1 or 2 Children | 0 (0.0%) | 0 (0.0%) |
| 3 or 4 Children | 0 (0.0%) | 0 (0.0%) |
| 5 or more Children | 0 (0.0%) | 0 (0.0%) |
| Total | 20 (6.4%) | 0 (0.0%) |
Race in Genoa
The most populous races in Genoa are White / Caucasian (903 | 89.1%), Hispanic or Latino (69 | 6.8%), and Some other Race (69 | 6.8%).
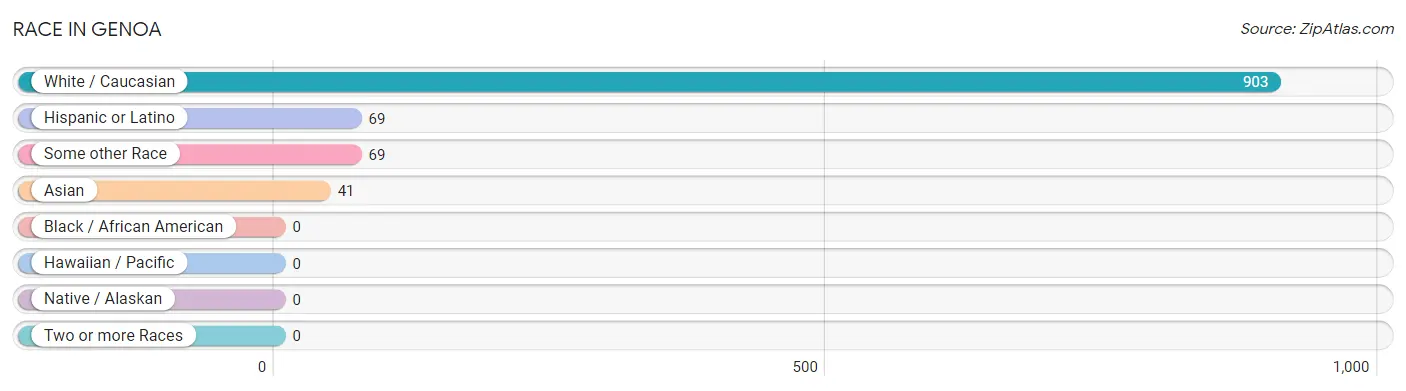
| Race | # Population | % Population |
| Asian | 41 | 4.1% |
| Black / African American | 0 | 0.0% |
| Hawaiian / Pacific | 0 | 0.0% |
| Hispanic or Latino | 69 | 6.8% |
| Native / Alaskan | 0 | 0.0% |
| White / Caucasian | 903 | 89.1% |
| Two or more Races | 0 | 0.0% |
| Some other Race | 69 | 6.8% |
| Total | 1,013 | 100.0% |
Ancestry in Genoa
The most populous ancestries reported in Genoa are English (261 | 25.8%), European (216 | 21.3%), German (195 | 19.3%), Irish (116 | 11.5%), and American (114 | 11.3%), together accounting for 89.0% of all Genoa residents.
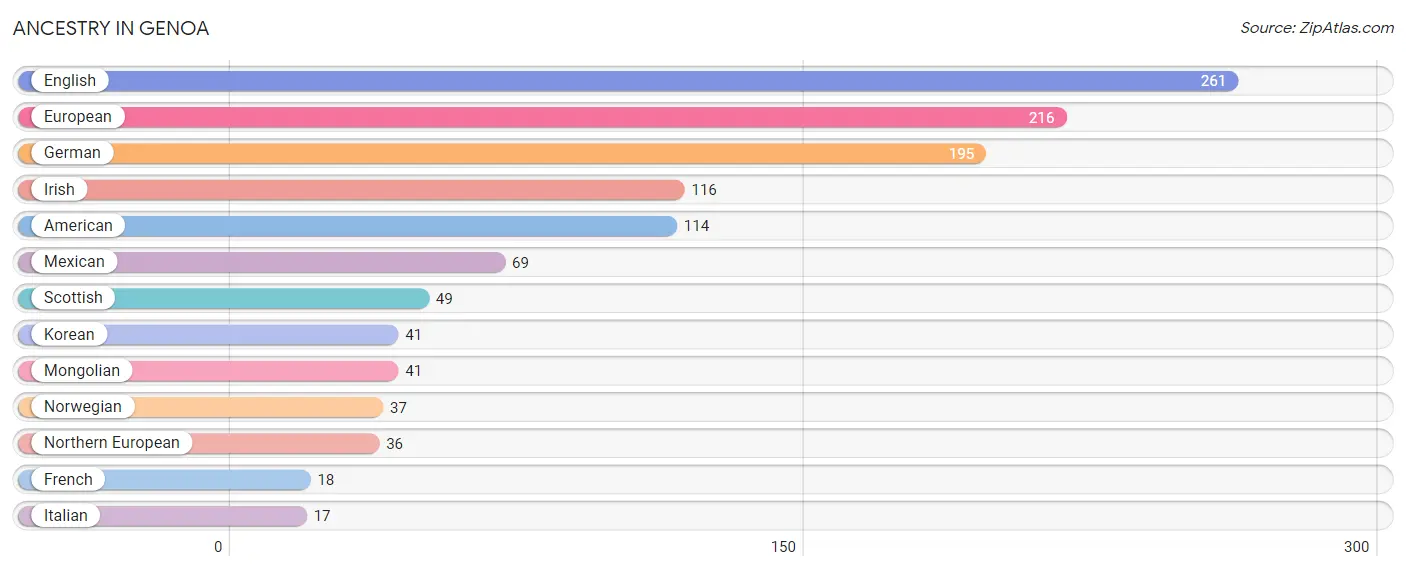
| Ancestry | # Population | % Population |
| American | 114 | 11.3% |
| English | 261 | 25.8% |
| European | 216 | 21.3% |
| French | 18 | 1.8% |
| German | 195 | 19.3% |
| Irish | 116 | 11.5% |
| Italian | 17 | 1.7% |
| Korean | 41 | 4.1% |
| Mexican | 69 | 6.8% |
| Mongolian | 41 | 4.1% |
| Northern European | 36 | 3.5% |
| Norwegian | 37 | 3.6% |
| Scottish | 49 | 4.8% | View All 13 Rows |
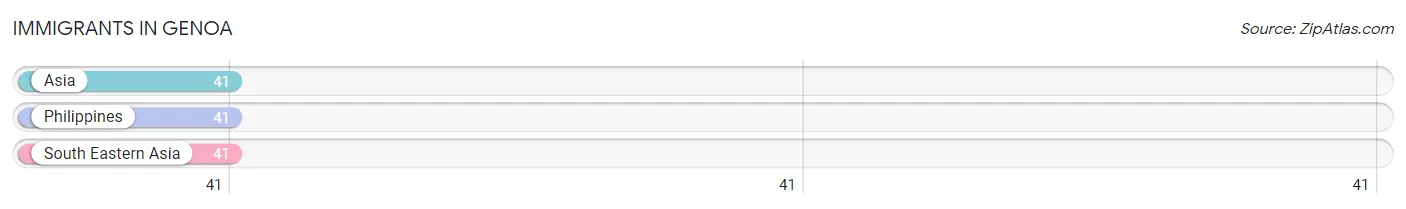
Immigrants in Genoa
The most numerous immigrant groups reported in Genoa came from Asia (41 | 4.1%), Philippines (41 | 4.1%), and South Eastern Asia (41 | 4.1%), together accounting for 12.1% of all Genoa residents.
| Immigration Origin | # Population | % Population |
| Asia | 41 | 4.1% |
| Philippines | 41 | 4.1% |
| South Eastern Asia | 41 | 4.1% | View All 3 Rows |
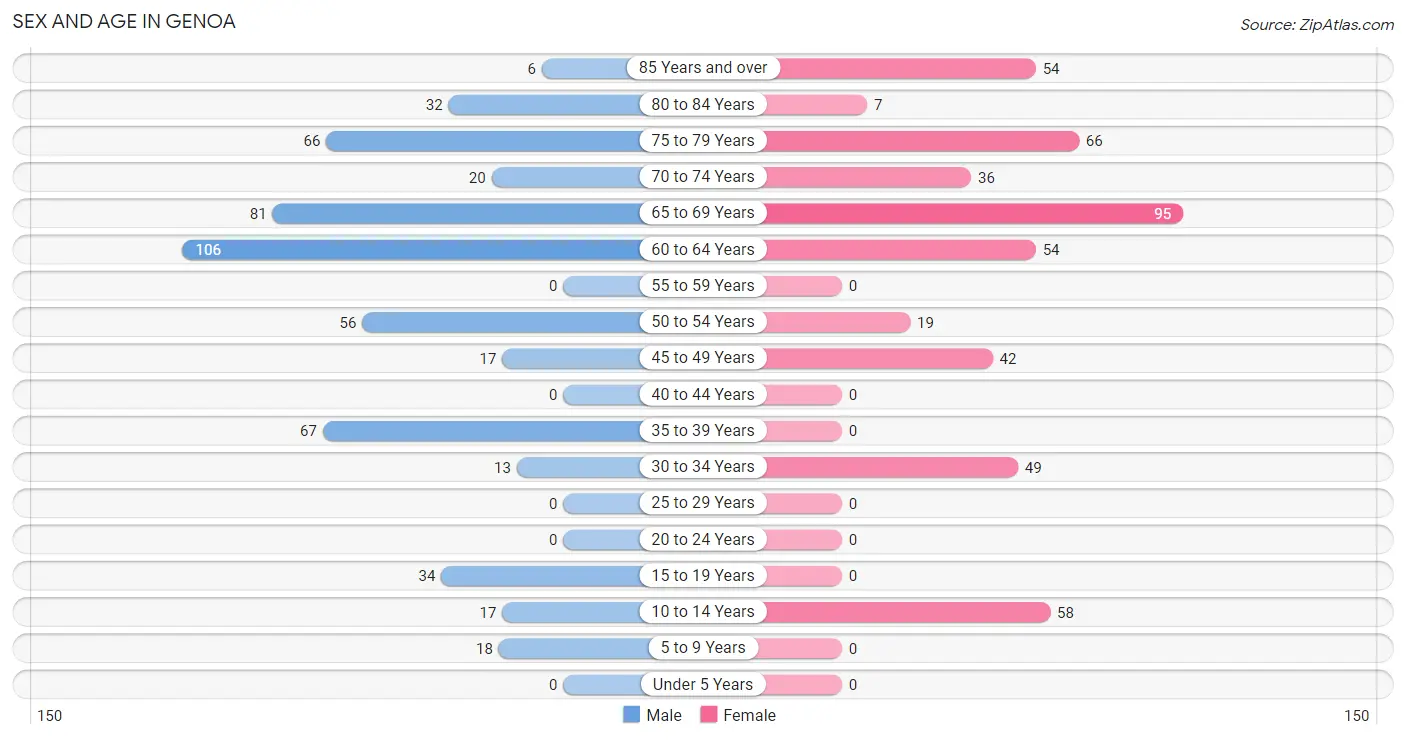
Sex and Age in Genoa
Sex and Age in Genoa
The most populous age groups in Genoa are 60 to 64 Years (106 | 19.9%) for men and 65 to 69 Years (95 | 19.8%) for women.
| Age Bracket | Male | Female |
| Under 5 Years | 0 (0.0%) | 0 (0.0%) |
| 5 to 9 Years | 18 (3.4%) | 0 (0.0%) |
| 10 to 14 Years | 17 (3.2%) | 58 (12.1%) |
| 15 to 19 Years | 34 (6.4%) | 0 (0.0%) |
| 20 to 24 Years | 0 (0.0%) | 0 (0.0%) |
| 25 to 29 Years | 0 (0.0%) | 0 (0.0%) |
| 30 to 34 Years | 13 (2.4%) | 49 (10.2%) |
| 35 to 39 Years | 67 (12.6%) | 0 (0.0%) |
| 40 to 44 Years | 0 (0.0%) | 0 (0.0%) |
| 45 to 49 Years | 17 (3.2%) | 42 (8.7%) |
| 50 to 54 Years | 56 (10.5%) | 19 (4.0%) |
| 55 to 59 Years | 0 (0.0%) | 0 (0.0%) |
| 60 to 64 Years | 106 (19.9%) | 54 (11.3%) |
| 65 to 69 Years | 81 (15.2%) | 95 (19.8%) |
| 70 to 74 Years | 20 (3.7%) | 36 (7.5%) |
| 75 to 79 Years | 66 (12.4%) | 66 (13.8%) |
| 80 to 84 Years | 32 (6.0%) | 7 (1.5%) |
| 85 Years and over | 6 (1.1%) | 54 (11.3%) |
| Total | 533 (100.0%) | 480 (100.0%) |
Families and Households in Genoa
Median Family Size in Genoa
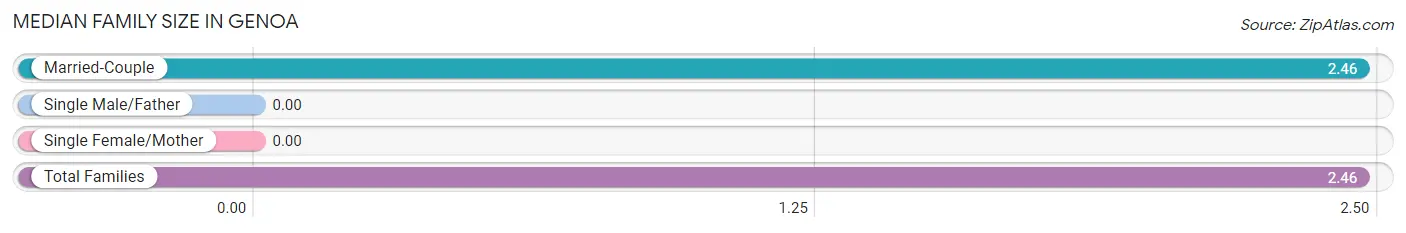
| Family Type | # Families | Family Size |
| Married-Couple | 314 (100.0%) | 2.46 |
| Single Male/Father | 0 (0.0%) | - |
| Single Female/Mother | 0 (0.0%) | - |
| Total Families | 314 (100.0%) | 2.46 |
Median Household Size in Genoa
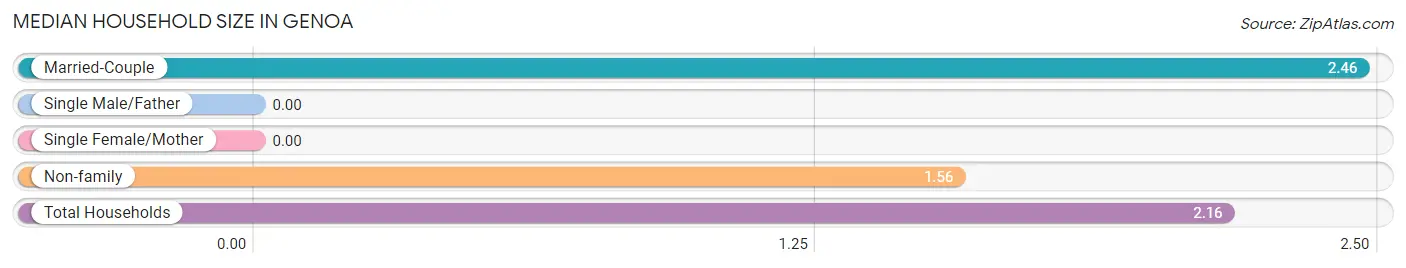
| Household Type | # Households | Household Size |
| Married-Couple | 314 (66.9%) | 2.46 |
| Single Male/Father | 0 (0.0%) | - |
| Single Female/Mother | 0 (0.0%) | - |
| Non-family | 155 (33.1%) | 1.56 |
| Total Households | 469 (100.0%) | 2.16 |
Household Size by Marriage Status in Genoa
Out of a total of 469 households in Genoa, 314 (66.9%) are family households, while 155 (33.1%) are nonfamily households. The most numerous type of family households are 2-person households, comprising 253, and the most common type of nonfamily households are 1-person households, comprising 83.
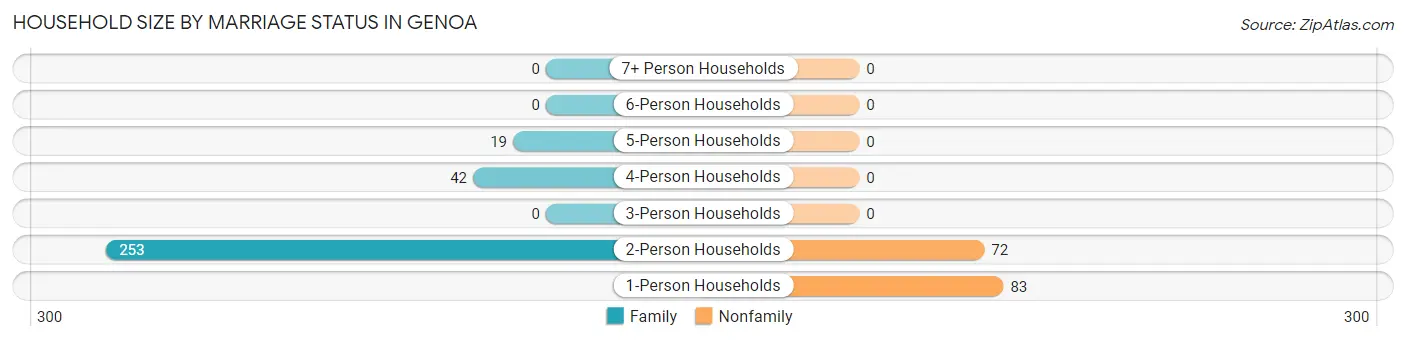
| Household Size | Family Households | Nonfamily Households |
| 1-Person Households | - | 83 (17.7%) |
| 2-Person Households | 253 (53.9%) | 72 (15.3%) |
| 3-Person Households | 0 (0.0%) | 0 (0.0%) |
| 4-Person Households | 42 (9.0%) | 0 (0.0%) |
| 5-Person Households | 19 (4.1%) | 0 (0.0%) |
| 6-Person Households | 0 (0.0%) | 0 (0.0%) |
| 7+ Person Households | 0 (0.0%) | 0 (0.0%) |
| Total | 314 (66.9%) | 155 (33.1%) |
Female Fertility in Genoa
Fertility by Age in Genoa
| Age Bracket | Women with Births | Births / 1,000 Women |
| 15 to 19 years | 0 (0.0%) | 0.0 |
| 20 to 34 years | 0 (0.0%) | 0.0 |
| 35 to 50 years | 0 (0.0%) | 0.0 |
| Total | 0 (0.0%) | 0.0 |
Fertility by Age by Marriage Status in Genoa
| Age Bracket | Married | Unmarried |
| 15 to 19 years | 0 (0.0%) | 0 (0.0%) |
| 20 to 34 years | 0 (0.0%) | 0 (0.0%) |
| 35 to 50 years | 0 (0.0%) | 0 (0.0%) |
| Total | 0 (0.0%) | 0 (0.0%) |
Fertility by Education in Genoa
| Educational Attainment | Women with Births | Births / 1,000 Women |
| Less than High School | 0 (0.0%) | 0.0 |
| High School Diploma | 0 (0.0%) | 0.0 |
| College or Associate's Degree | 0 (0.0%) | 0.0 |
| Bachelor's Degree | 0 (0.0%) | 0.0 |
| Graduate Degree | 0 (0.0%) | 0.0 |
| Total | 0 (0.0%) | 0.0 |
Fertility by Education by Marriage Status in Genoa
| Educational Attainment | Married | Unmarried |
| Less than High School | 0 (0.0%) | 0 (0.0%) |
| High School Diploma | 0 (0.0%) | 0 (0.0%) |
| College or Associate's Degree | 0 (0.0%) | 0 (0.0%) |
| Bachelor's Degree | 0 (0.0%) | 0 (0.0%) |
| Graduate Degree | 0 (0.0%) | 0 (0.0%) |
| Total | 0 (0.0%) | 0 (0.0%) |
Employment Characteristics in Genoa
Employment by Class of Employer in Genoa
Among the 431 employed individuals in Genoa, private company employees (291 | 67.5%), local government employees (68 | 15.8%), and state government employees (36 | 8.4%) make up the most common classes of employment.
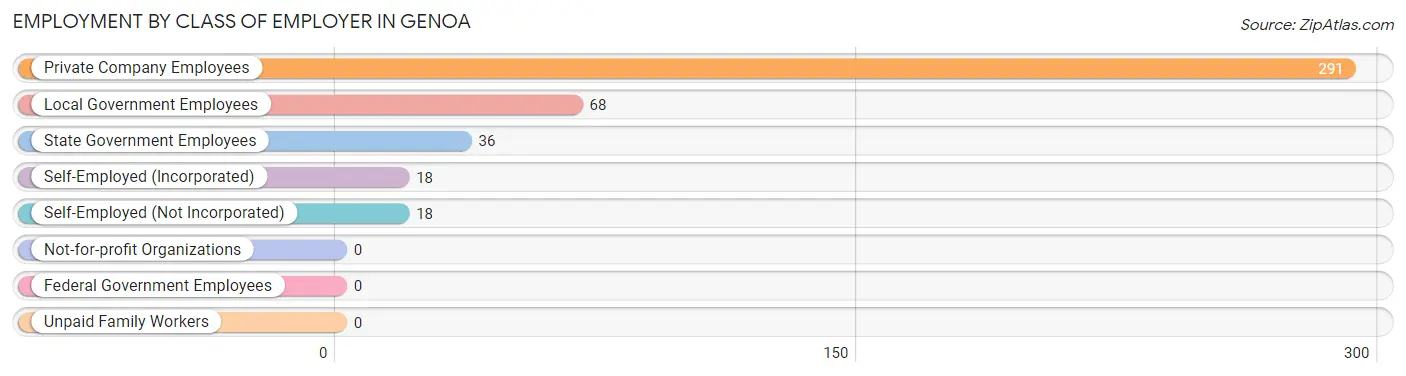
| Employer Class | # Employees | % Employees |
| Private Company Employees | 291 | 67.5% |
| Self-Employed (Incorporated) | 18 | 4.2% |
| Self-Employed (Not Incorporated) | 18 | 4.2% |
| Not-for-profit Organizations | 0 | 0.0% |
| Local Government Employees | 68 | 15.8% |
| State Government Employees | 36 | 8.4% |
| Federal Government Employees | 0 | 0.0% |
| Unpaid Family Workers | 0 | 0.0% |
| Total | 431 | 100.0% |
Employment Status by Age in Genoa
According to the labor force statistics for Genoa, out of the total population over 16 years of age (920), 48.7% or 448 individuals are in the labor force, with 3.8% or 17 of them unemployed. The age group with the highest labor force participation rate is 16 to 19 years, with 100.0% or 34 individuals in the labor force. Within the labor force, the 45 to 54 years age range has the highest percentage of unemployed individuals, with 12.7% or 17 of them being unemployed.
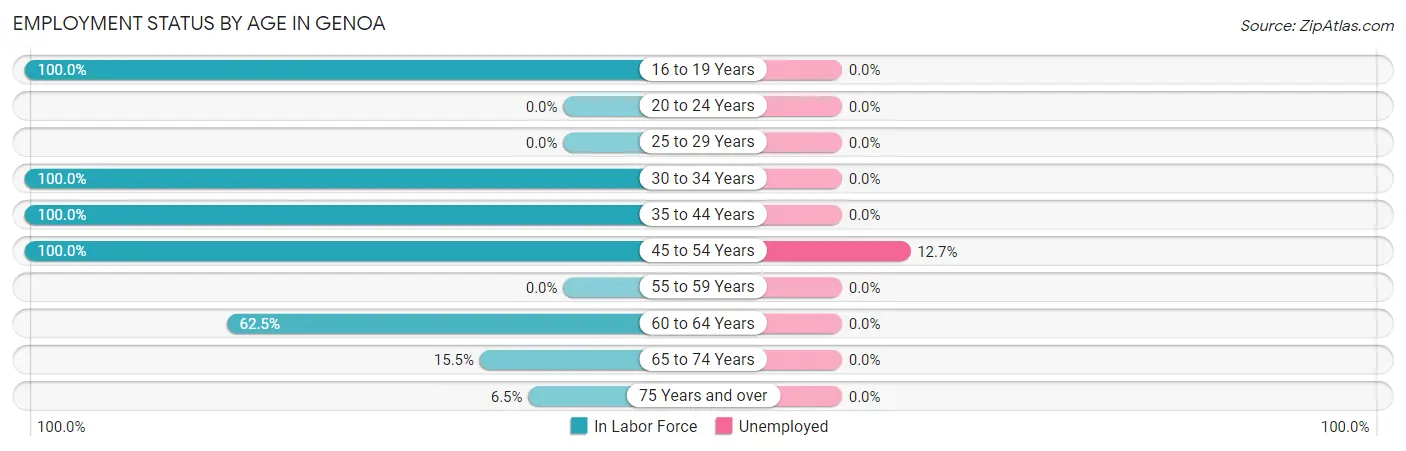
| Age Bracket | In Labor Force | Unemployed |
| 16 to 19 Years | 34 (100.0%) | 0 (0.0%) |
| 20 to 24 Years | 0 (0.0%) | 0 (0.0%) |
| 25 to 29 Years | 0 (0.0%) | 0 (0.0%) |
| 30 to 34 Years | 62 (100.0%) | 0 (0.0%) |
| 35 to 44 Years | 67 (100.0%) | 0 (0.0%) |
| 45 to 54 Years | 134 (100.0%) | 17 (12.7%) |
| 55 to 59 Years | 0 (0.0%) | 0 (0.0%) |
| 60 to 64 Years | 100 (62.5%) | 0 (0.0%) |
| 65 to 74 Years | 36 (15.5%) | 0 (0.0%) |
| 75 Years and over | 15 (6.5%) | 0 (0.0%) |
| Total | 448 (48.7%) | 17 (3.8%) |
Employment Status by Educational Attainment in Genoa
According to labor force statistics for Genoa, 85.8% of individuals (363) out of the total population between 25 and 64 years of age (423) are in the labor force, with 4.7% or 17 of them being unemployed. The group with the highest labor force participation rate are those with the educational attainment of less than high school, with 100.0% or 17 individuals in the labor force. Within the labor force, individuals with college / associate degree education have the highest percentage of unemployment, with 13.8% or 17 of them being unemployed.
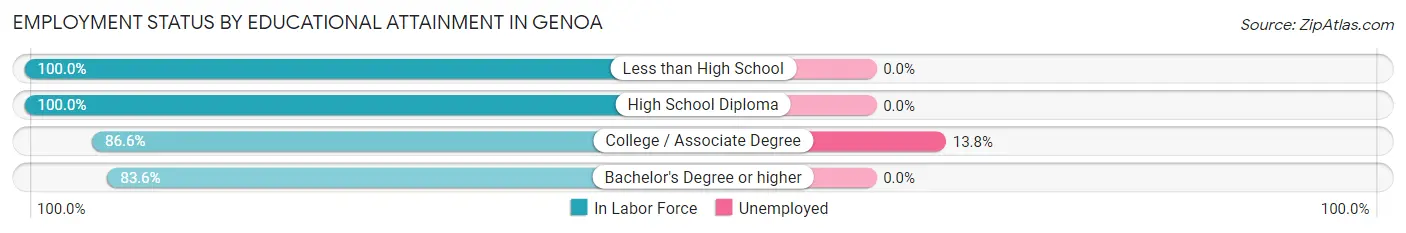
| Educational Attainment | In Labor Force | Unemployed |
| Less than High School | 17 (100.0%) | 0 (0.0%) |
| High School Diploma | 14 (100.0%) | 0 (0.0%) |
| College / Associate Degree | 123 (86.6%) | 20 (13.8%) |
| Bachelor's Degree or higher | 209 (83.6%) | 0 (0.0%) |
| Total | 363 (85.8%) | 20 (4.7%) |
Employment Occupations by Sex in Genoa
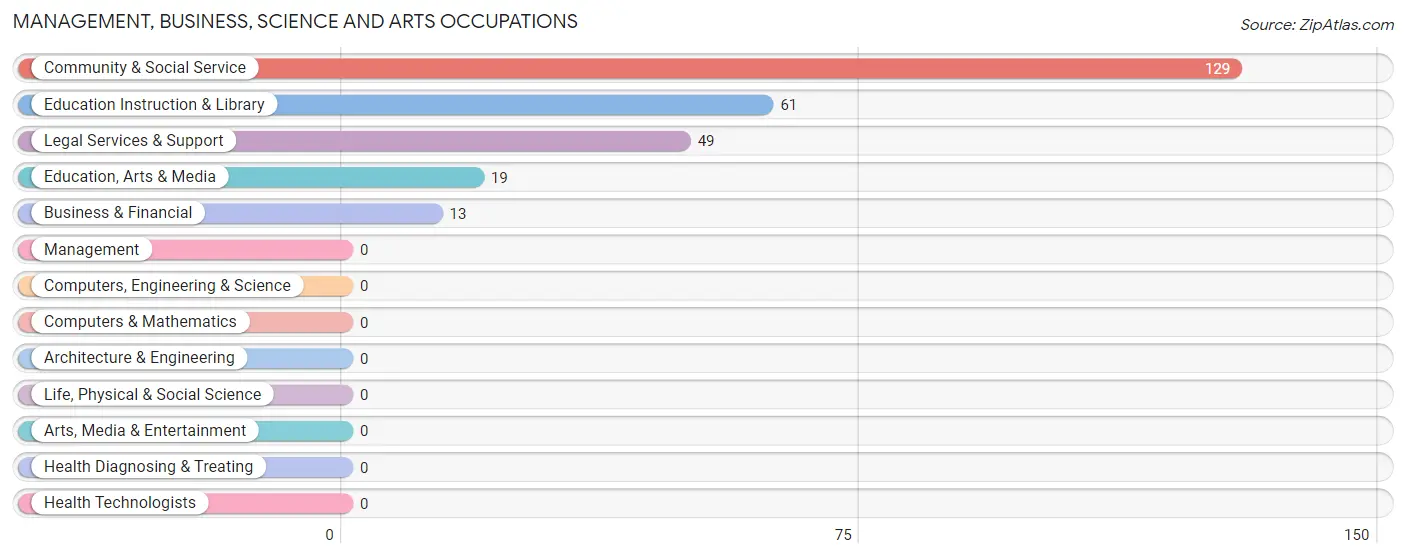
Management, Business, Science and Arts Occupations
The most common Management, Business, Science and Arts occupations in Genoa are Community & Social Service (129 | 29.9%), Education Instruction & Library (61 | 14.1%), Legal Services & Support (49 | 11.4%), Education, Arts & Media (19 | 4.4%), and Business & Financial (13 | 3.0%).
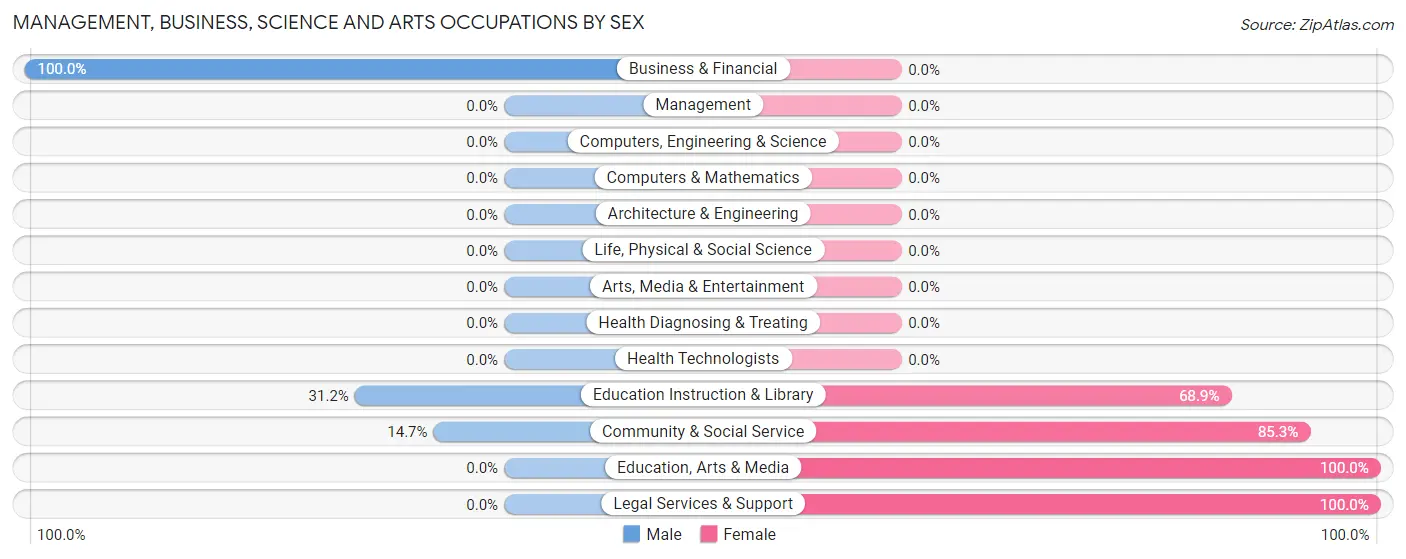
Management, Business, Science and Arts Occupations by Sex
Within the Management, Business, Science and Arts occupations in Genoa, the most male-oriented occupations are Business & Financial (100.0%), Education Instruction & Library (31.1%), and Community & Social Service (14.7%), while the most female-oriented occupations are Education, Arts & Media (100.0%), Legal Services & Support (100.0%), and Community & Social Service (85.3%).
| Occupation | Male | Female |
| Management | 0 (0.0%) | 0 (0.0%) |
| Business & Financial | 13 (100.0%) | 0 (0.0%) |
| Computers, Engineering & Science | 0 (0.0%) | 0 (0.0%) |
| Computers & Mathematics | 0 (0.0%) | 0 (0.0%) |
| Architecture & Engineering | 0 (0.0%) | 0 (0.0%) |
| Life, Physical & Social Science | 0 (0.0%) | 0 (0.0%) |
| Community & Social Service | 19 (14.7%) | 110 (85.3%) |
| Education, Arts & Media | 0 (0.0%) | 19 (100.0%) |
| Legal Services & Support | 0 (0.0%) | 49 (100.0%) |
| Education Instruction & Library | 19 (31.1%) | 42 (68.9%) |
| Arts, Media & Entertainment | 0 (0.0%) | 0 (0.0%) |
| Health Diagnosing & Treating | 0 (0.0%) | 0 (0.0%) |
| Health Technologists | 0 (0.0%) | 0 (0.0%) |
| Total (Category) | 32 (22.5%) | 110 (77.5%) |
| Total (Overall) | 254 (58.9%) | 177 (41.1%) |
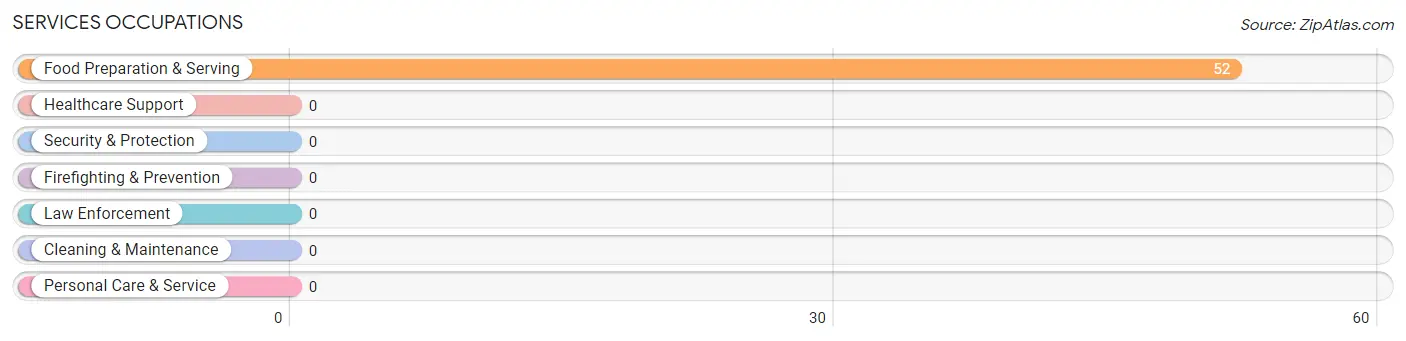
Services Occupations
The most common Services occupations in Genoa are , and Food Preparation & Serving (52 | 12.1%).
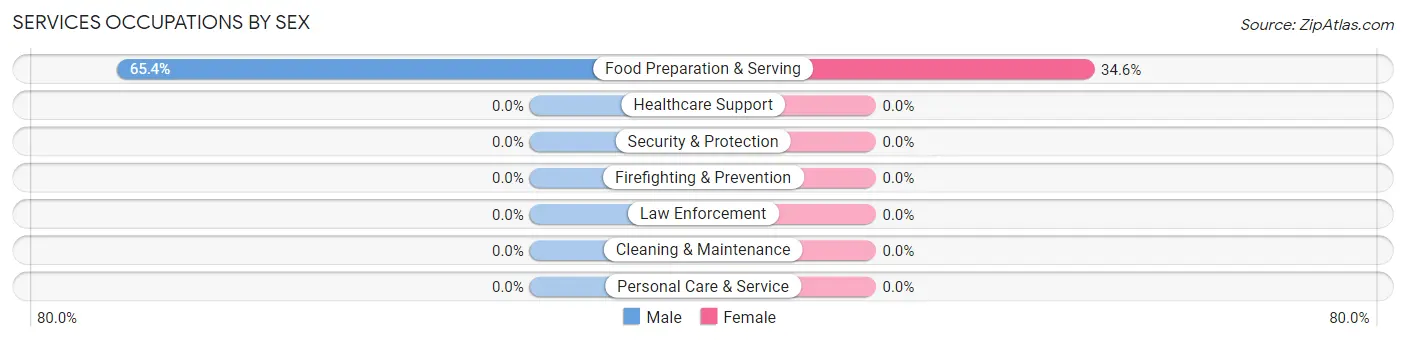
Services Occupations by Sex
| Occupation | Male | Female |
| Healthcare Support | 0 (0.0%) | 0 (0.0%) |
| Security & Protection | 0 (0.0%) | 0 (0.0%) |
| Firefighting & Prevention | 0 (0.0%) | 0 (0.0%) |
| Law Enforcement | 0 (0.0%) | 0 (0.0%) |
| Food Preparation & Serving | 34 (65.4%) | 18 (34.6%) |
| Cleaning & Maintenance | 0 (0.0%) | 0 (0.0%) |
| Personal Care & Service | 0 (0.0%) | 0 (0.0%) |
| Total (Category) | 34 (65.4%) | 18 (34.6%) |
| Total (Overall) | 254 (58.9%) | 177 (41.1%) |
Sales and Office Occupations
The most common Sales and Office occupations in Genoa are Sales & Related (69 | 16.0%), and Office & Administration (32 | 7.4%).
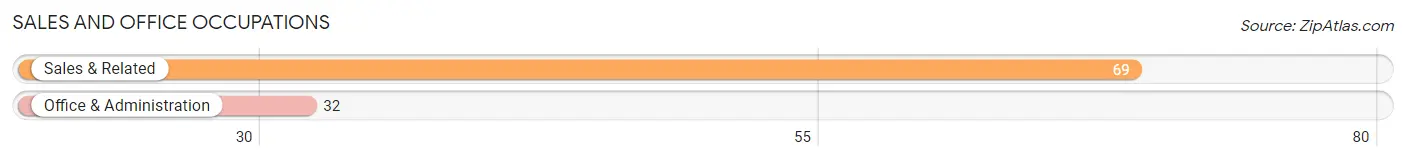
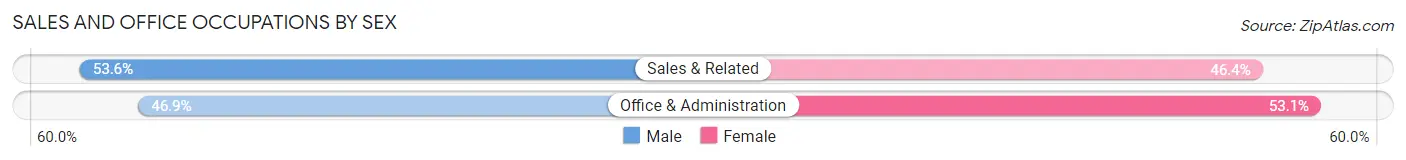
Sales and Office Occupations by Sex
| Occupation | Male | Female |
| Sales & Related | 37 (53.6%) | 32 (46.4%) |
| Office & Administration | 15 (46.9%) | 17 (53.1%) |
| Total (Category) | 52 (51.5%) | 49 (48.5%) |
| Total (Overall) | 254 (58.9%) | 177 (41.1%) |
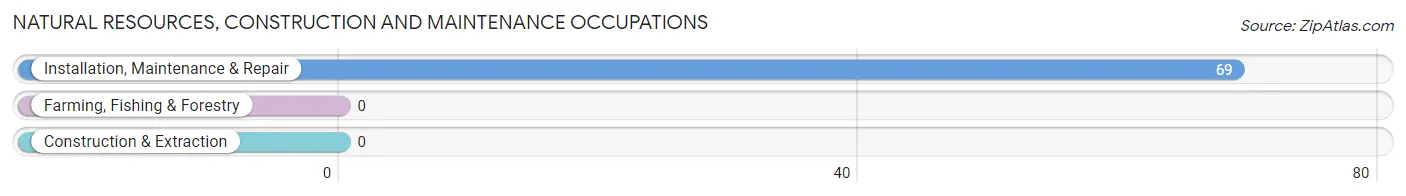
Natural Resources, Construction and Maintenance Occupations
The most common Natural Resources, Construction and Maintenance occupations in Genoa are , and Installation, Maintenance & Repair (69 | 16.0%).
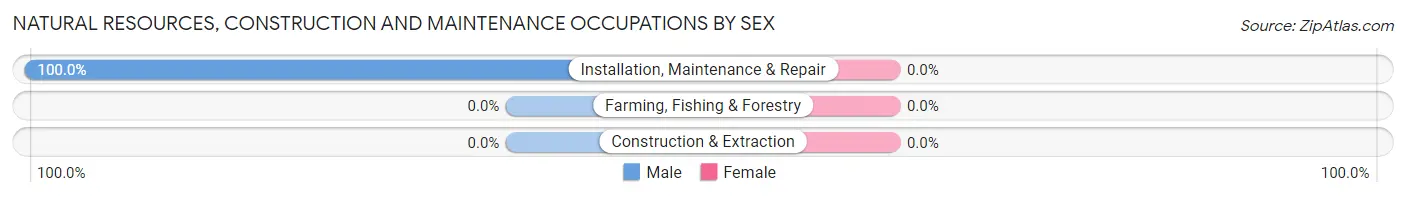
Natural Resources, Construction and Maintenance Occupations by Sex
| Occupation | Male | Female |
| Farming, Fishing & Forestry | 0 (0.0%) | 0 (0.0%) |
| Construction & Extraction | 0 (0.0%) | 0 (0.0%) |
| Installation, Maintenance & Repair | 69 (100.0%) | 0 (0.0%) |
| Total (Category) | 69 (100.0%) | 0 (0.0%) |
| Total (Overall) | 254 (58.9%) | 177 (41.1%) |
Production, Transportation and Moving Occupations
The most common Production, Transportation and Moving occupations in Genoa are , and Transportation (67 | 15.5%).
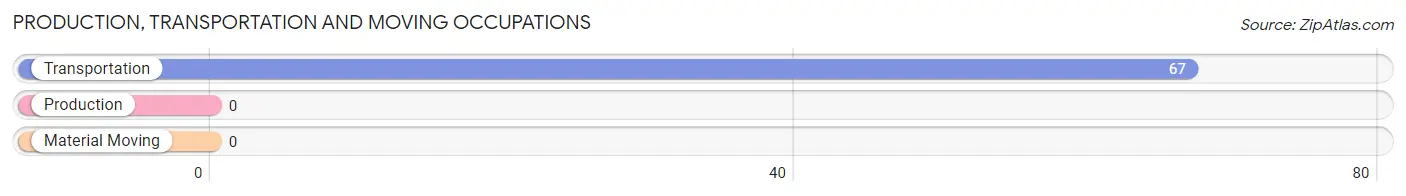
Production, Transportation and Moving Occupations by Sex
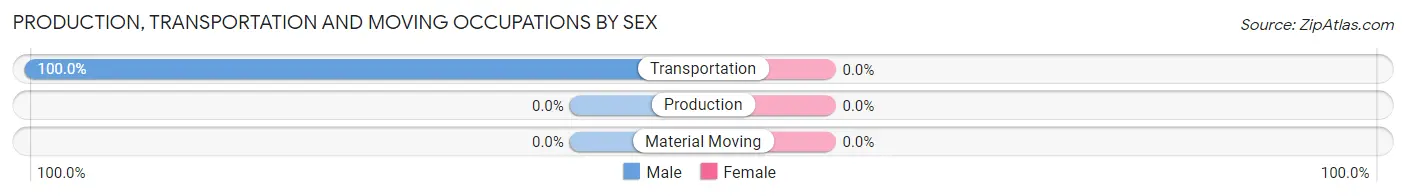
| Occupation | Male | Female |
| Production | 0 (0.0%) | 0 (0.0%) |
| Transportation | 67 (100.0%) | 0 (0.0%) |
| Material Moving | 0 (0.0%) | 0 (0.0%) |
| Total (Category) | 67 (100.0%) | 0 (0.0%) |
| Total (Overall) | 254 (58.9%) | 177 (41.1%) |
Employment Industries by Sex in Genoa
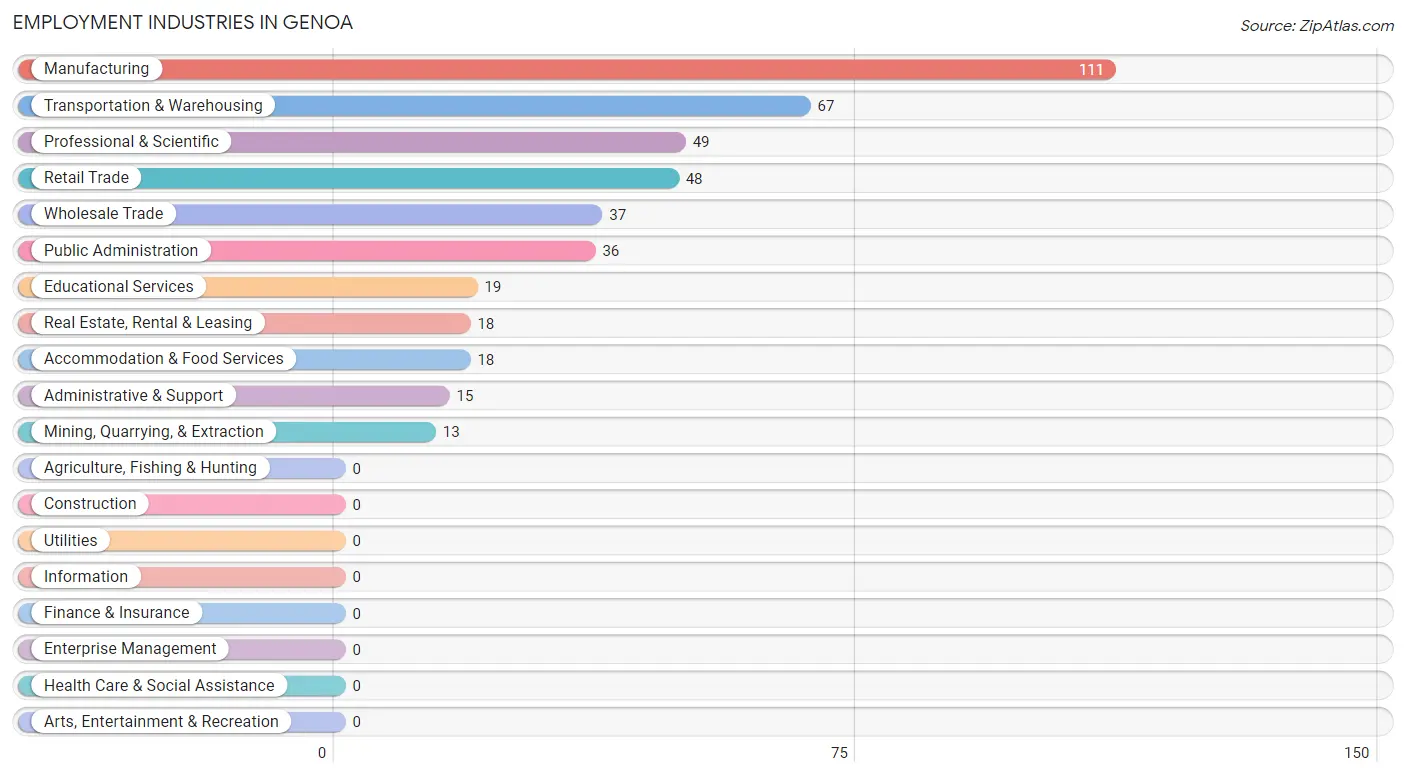
Employment Industries in Genoa
The major employment industries in Genoa include Manufacturing (111 | 25.8%), Transportation & Warehousing (67 | 15.5%), Professional & Scientific (49 | 11.4%), Retail Trade (48 | 11.1%), and Wholesale Trade (37 | 8.6%).
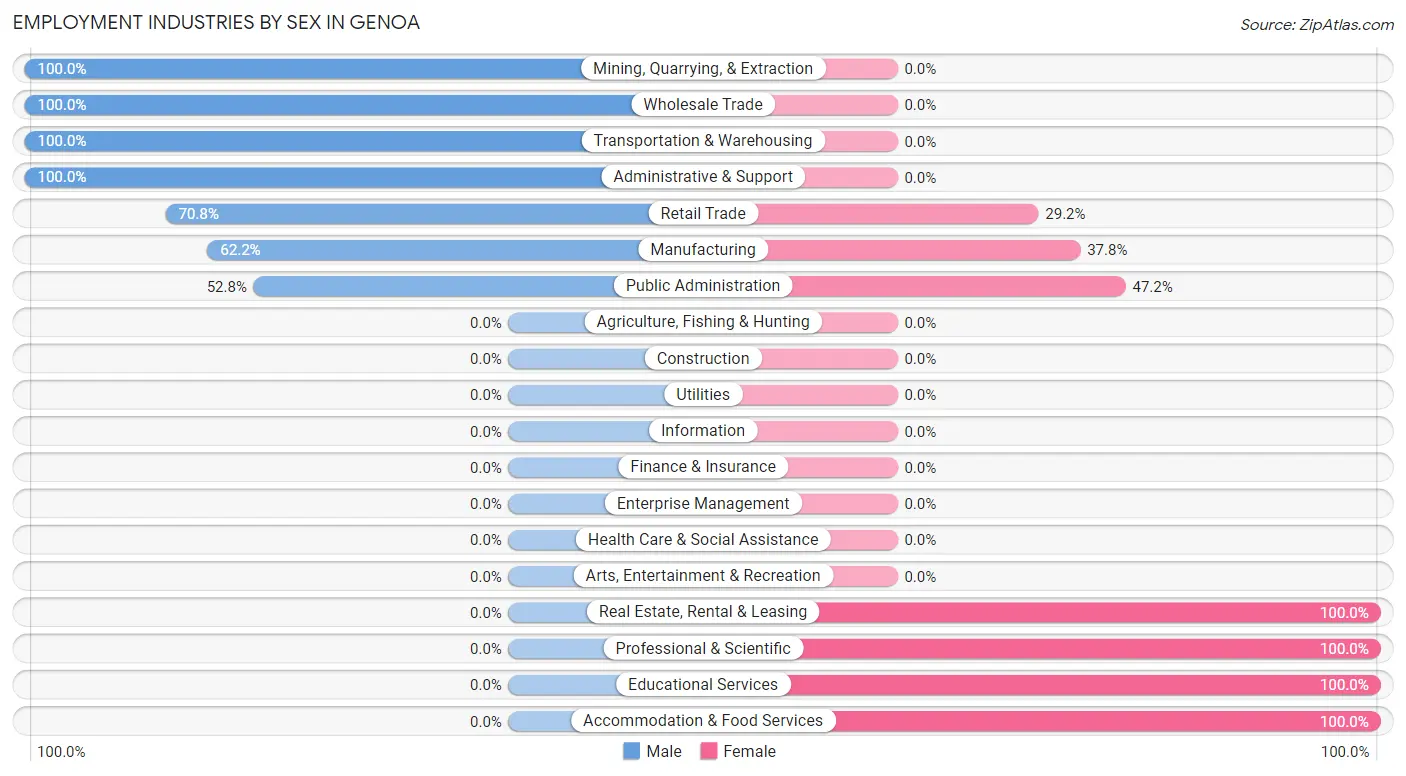
Employment Industries by Sex in Genoa
The Genoa industries that see more men than women are Mining, Quarrying, & Extraction (100.0%), Wholesale Trade (100.0%), and Transportation & Warehousing (100.0%), whereas the industries that tend to have a higher number of women are Real Estate, Rental & Leasing (100.0%), Professional & Scientific (100.0%), and Educational Services (100.0%).
| Industry | Male | Female |
| Agriculture, Fishing & Hunting | 0 (0.0%) | 0 (0.0%) |
| Mining, Quarrying, & Extraction | 13 (100.0%) | 0 (0.0%) |
| Construction | 0 (0.0%) | 0 (0.0%) |
| Manufacturing | 69 (62.2%) | 42 (37.8%) |
| Wholesale Trade | 37 (100.0%) | 0 (0.0%) |
| Retail Trade | 34 (70.8%) | 14 (29.2%) |
| Transportation & Warehousing | 67 (100.0%) | 0 (0.0%) |
| Utilities | 0 (0.0%) | 0 (0.0%) |
| Information | 0 (0.0%) | 0 (0.0%) |
| Finance & Insurance | 0 (0.0%) | 0 (0.0%) |
| Real Estate, Rental & Leasing | 0 (0.0%) | 18 (100.0%) |
| Professional & Scientific | 0 (0.0%) | 49 (100.0%) |
| Enterprise Management | 0 (0.0%) | 0 (0.0%) |
| Administrative & Support | 15 (100.0%) | 0 (0.0%) |
| Educational Services | 0 (0.0%) | 19 (100.0%) |
| Health Care & Social Assistance | 0 (0.0%) | 0 (0.0%) |
| Arts, Entertainment & Recreation | 0 (0.0%) | 0 (0.0%) |
| Accommodation & Food Services | 0 (0.0%) | 18 (100.0%) |
| Public Administration | 19 (52.8%) | 17 (47.2%) |
| Total | 254 (58.9%) | 177 (41.1%) |
Education in Genoa
School Enrollment in Genoa
The most common levels of schooling among the 127 students in Genoa are middle school (75 | 59.1%), high school (34 | 26.8%), and elementary school (18 | 14.2%).
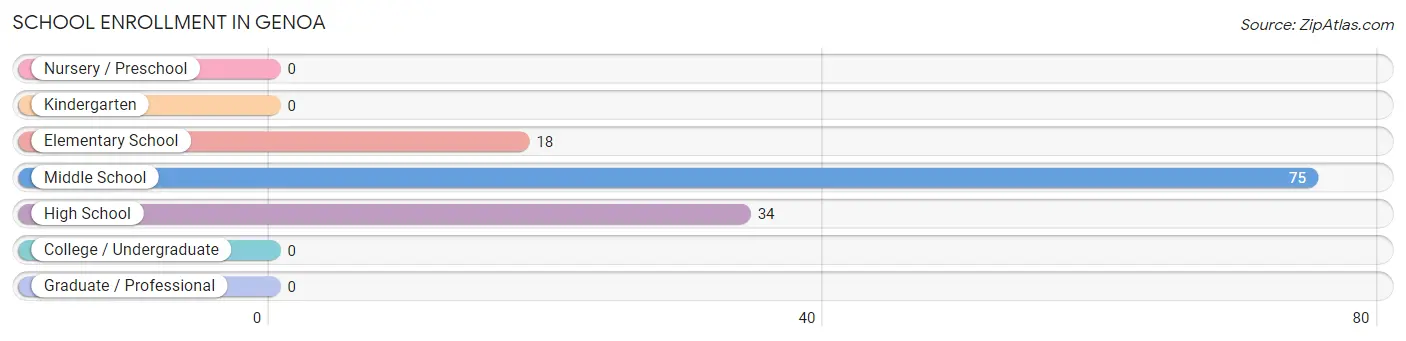
| School Level | # Students | % Students |
| Nursery / Preschool | 0 | 0.0% |
| Kindergarten | 0 | 0.0% |
| Elementary School | 18 | 14.2% |
| Middle School | 75 | 59.1% |
| High School | 34 | 26.8% |
| College / Undergraduate | 0 | 0.0% |
| Graduate / Professional | 0 | 0.0% |
| Total | 127 | 100.0% |
School Enrollment by Age by Funding Source in Genoa
Out of a total of 127 students who are enrolled in schools in Genoa, 72 (56.7%) attend a private institution, while the remaining 55 (43.3%) are enrolled in public schools. The age group of 15 to 17 year olds has the highest likelihood of being enrolled in private schools, with 34 (100.0% in the age bracket) enrolled. Conversely, the age group of 5 to 9 year old has the lowest likelihood of being enrolled in a private school, with 18 (100.0% in the age bracket) attending a public institution.
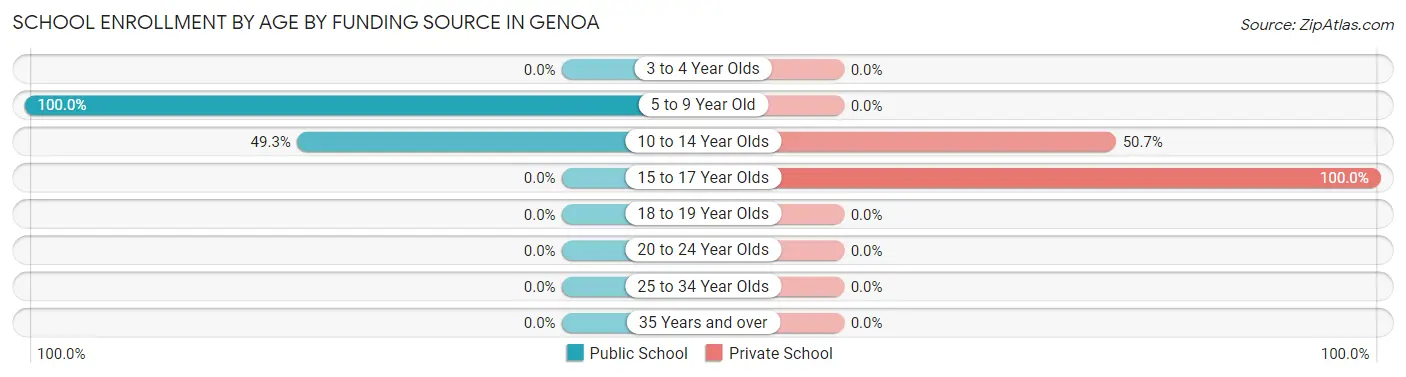
| Age Bracket | Public School | Private School |
| 3 to 4 Year Olds | 0 (0.0%) | 0 (0.0%) |
| 5 to 9 Year Old | 18 (100.0%) | 0 (0.0%) |
| 10 to 14 Year Olds | 37 (49.3%) | 38 (50.7%) |
| 15 to 17 Year Olds | 0 (0.0%) | 34 (100.0%) |
| 18 to 19 Year Olds | 0 (0.0%) | 0 (0.0%) |
| 20 to 24 Year Olds | 0 (0.0%) | 0 (0.0%) |
| 25 to 34 Year Olds | 0 (0.0%) | 0 (0.0%) |
| 35 Years and over | 0 (0.0%) | 0 (0.0%) |
| Total | 55 (43.3%) | 72 (56.7%) |
Educational Attainment by Field of Study in Genoa
Engineering (98 | 20.9%), education (69 | 14.7%), business (58 | 12.4%), social sciences (49 | 10.5%), and bio, nature & agricultural (42 | 9.0%) are the most common fields of study among 468 individuals in Genoa who have obtained a bachelor's degree or higher.
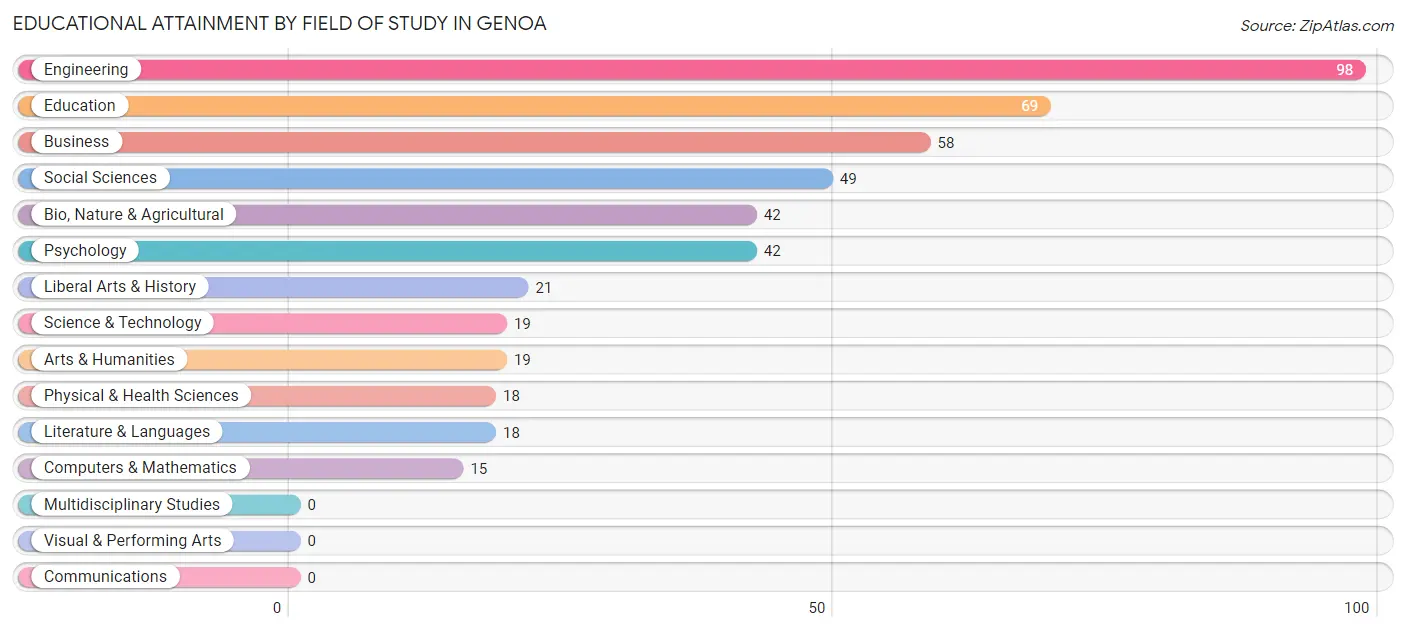
| Field of Study | # Graduates | % Graduates |
| Computers & Mathematics | 15 | 3.2% |
| Bio, Nature & Agricultural | 42 | 9.0% |
| Physical & Health Sciences | 18 | 3.8% |
| Psychology | 42 | 9.0% |
| Social Sciences | 49 | 10.5% |
| Engineering | 98 | 20.9% |
| Multidisciplinary Studies | 0 | 0.0% |
| Science & Technology | 19 | 4.1% |
| Business | 58 | 12.4% |
| Education | 69 | 14.7% |
| Literature & Languages | 18 | 3.8% |
| Liberal Arts & History | 21 | 4.5% |
| Visual & Performing Arts | 0 | 0.0% |
| Communications | 0 | 0.0% |
| Arts & Humanities | 19 | 4.1% |
| Total | 468 | 100.0% |
Transportation & Commute in Genoa
Vehicle Availability by Sex in Genoa
The most prevalent vehicle ownership categories in Genoa are males with 3 vehicles (86, accounting for 33.9%) and females with 3 vehicles (86, making up 48.6%).
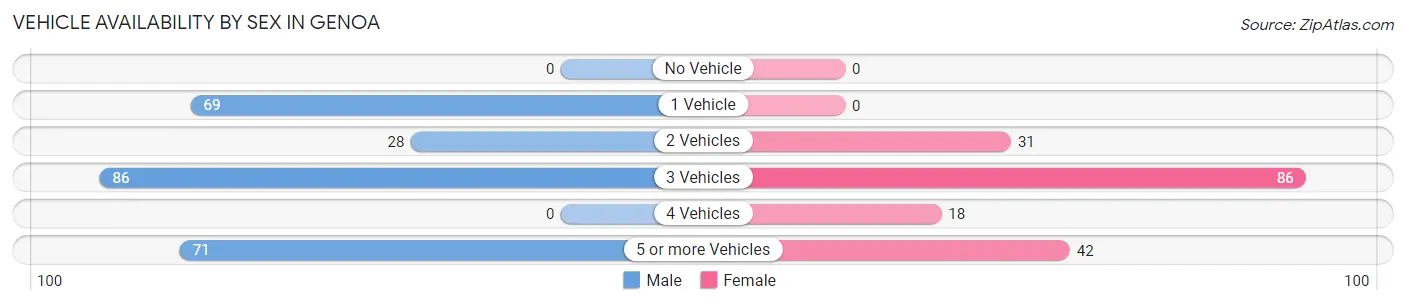
| Vehicles Available | Male | Female |
| No Vehicle | 0 (0.0%) | 0 (0.0%) |
| 1 Vehicle | 69 (27.2%) | 0 (0.0%) |
| 2 Vehicles | 28 (11.0%) | 31 (17.5%) |
| 3 Vehicles | 86 (33.9%) | 86 (48.6%) |
| 4 Vehicles | 0 (0.0%) | 18 (10.2%) |
| 5 or more Vehicles | 71 (28.0%) | 42 (23.7%) |
| Total | 254 (100.0%) | 177 (100.0%) |
Commute Time in Genoa
The most frequently occuring commute durations in Genoa are 10 to 14 minutes (164 commuters, 49.1%), less than 5 minutes (86 commuters, 25.8%), and 20 to 24 minutes (32 commuters, 9.6%).
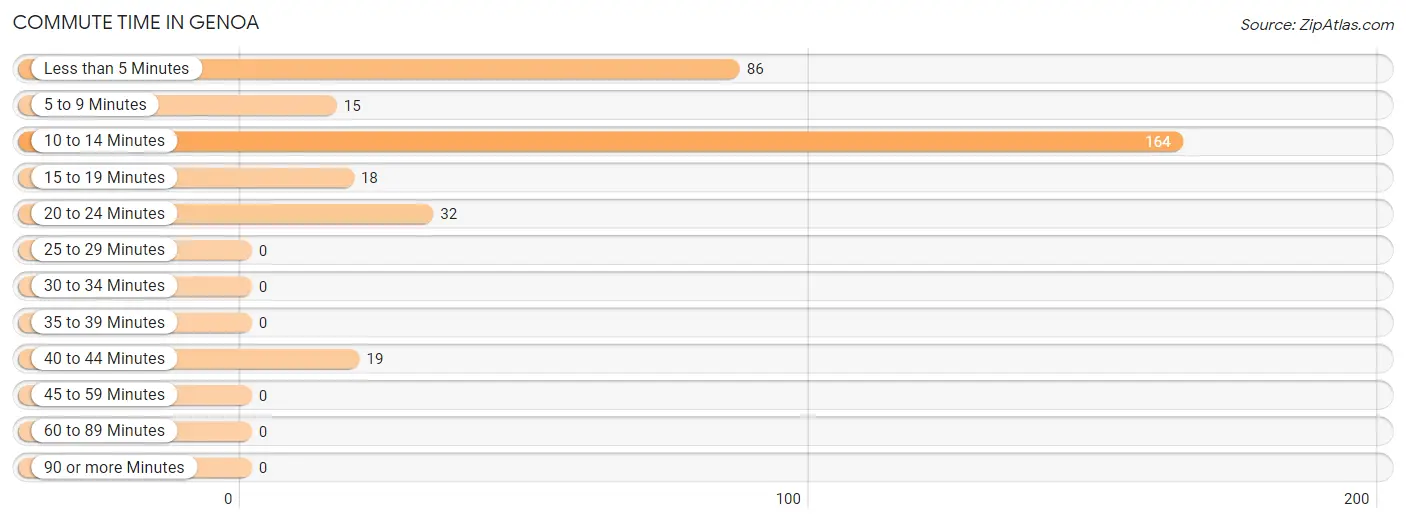
| Commute Time | # Commuters | % Commuters |
| Less than 5 Minutes | 86 | 25.8% |
| 5 to 9 Minutes | 15 | 4.5% |
| 10 to 14 Minutes | 164 | 49.1% |
| 15 to 19 Minutes | 18 | 5.4% |
| 20 to 24 Minutes | 32 | 9.6% |
| 25 to 29 Minutes | 0 | 0.0% |
| 30 to 34 Minutes | 0 | 0.0% |
| 35 to 39 Minutes | 0 | 0.0% |
| 40 to 44 Minutes | 19 | 5.7% |
| 45 to 59 Minutes | 0 | 0.0% |
| 60 to 89 Minutes | 0 | 0.0% |
| 90 or more Minutes | 0 | 0.0% |
Commute Time by Sex in Genoa
The most common commute times in Genoa are 10 to 14 minutes (101 commuters, 46.5%) for males and 10 to 14 minutes (63 commuters, 53.8%) for females.
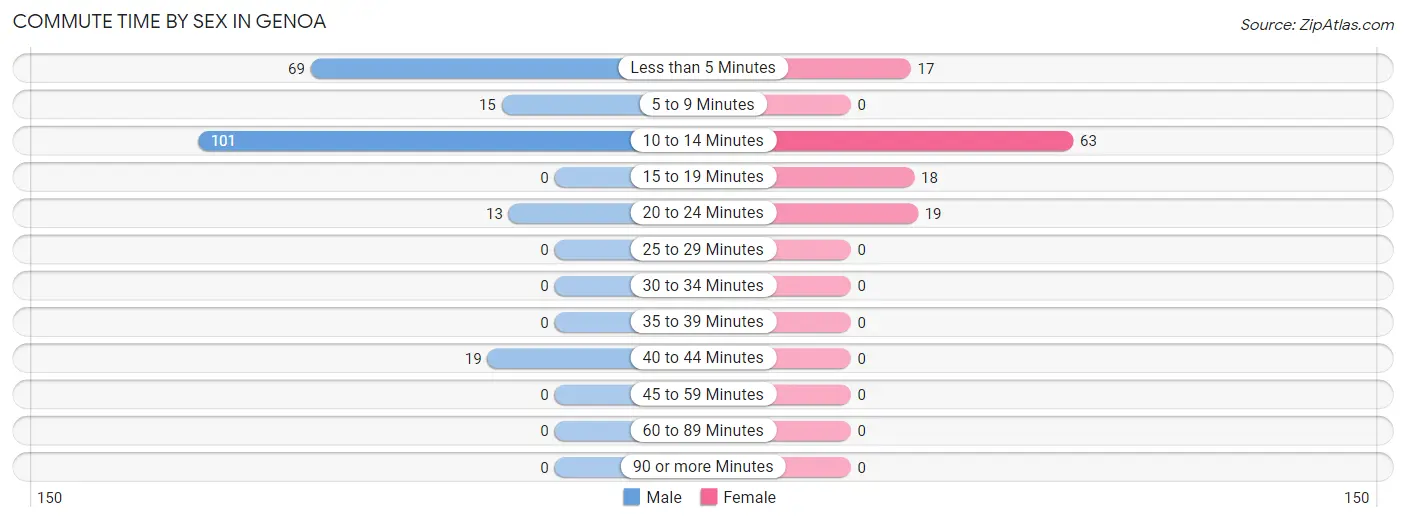
| Commute Time | Male | Female |
| Less than 5 Minutes | 69 (31.8%) | 17 (14.5%) |
| 5 to 9 Minutes | 15 (6.9%) | 0 (0.0%) |
| 10 to 14 Minutes | 101 (46.5%) | 63 (53.8%) |
| 15 to 19 Minutes | 0 (0.0%) | 18 (15.4%) |
| 20 to 24 Minutes | 13 (6.0%) | 19 (16.2%) |
| 25 to 29 Minutes | 0 (0.0%) | 0 (0.0%) |
| 30 to 34 Minutes | 0 (0.0%) | 0 (0.0%) |
| 35 to 39 Minutes | 0 (0.0%) | 0 (0.0%) |
| 40 to 44 Minutes | 19 (8.8%) | 0 (0.0%) |
| 45 to 59 Minutes | 0 (0.0%) | 0 (0.0%) |
| 60 to 89 Minutes | 0 (0.0%) | 0 (0.0%) |
| 90 or more Minutes | 0 (0.0%) | 0 (0.0%) |
Time of Departure to Work by Sex in Genoa
The most frequent times of departure to work in Genoa are 12:00 AM to 4:59 AM (69, 31.8%) for males and 7:30 AM to 7:59 AM (49, 41.9%) for females.
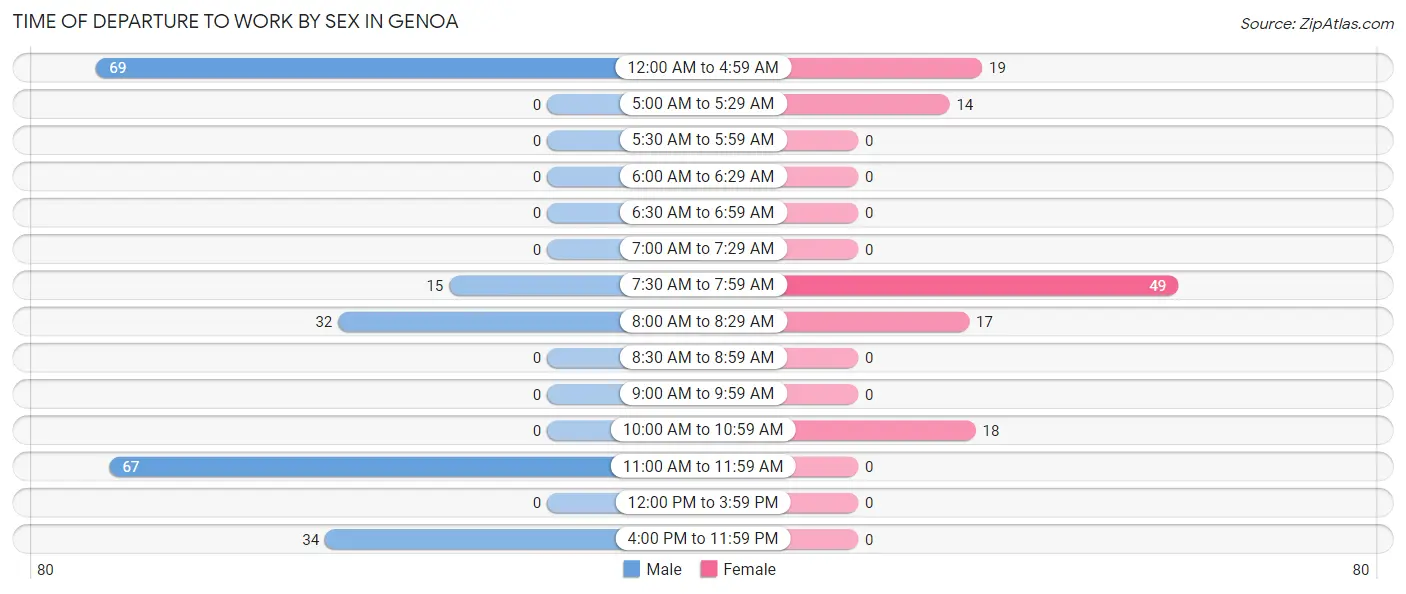
| Time of Departure | Male | Female |
| 12:00 AM to 4:59 AM | 69 (31.8%) | 19 (16.2%) |
| 5:00 AM to 5:29 AM | 0 (0.0%) | 14 (12.0%) |
| 5:30 AM to 5:59 AM | 0 (0.0%) | 0 (0.0%) |
| 6:00 AM to 6:29 AM | 0 (0.0%) | 0 (0.0%) |
| 6:30 AM to 6:59 AM | 0 (0.0%) | 0 (0.0%) |
| 7:00 AM to 7:29 AM | 0 (0.0%) | 0 (0.0%) |
| 7:30 AM to 7:59 AM | 15 (6.9%) | 49 (41.9%) |
| 8:00 AM to 8:29 AM | 32 (14.7%) | 17 (14.5%) |
| 8:30 AM to 8:59 AM | 0 (0.0%) | 0 (0.0%) |
| 9:00 AM to 9:59 AM | 0 (0.0%) | 0 (0.0%) |
| 10:00 AM to 10:59 AM | 0 (0.0%) | 18 (15.4%) |
| 11:00 AM to 11:59 AM | 67 (30.9%) | 0 (0.0%) |
| 12:00 PM to 3:59 PM | 0 (0.0%) | 0 (0.0%) |
| 4:00 PM to 11:59 PM | 34 (15.7%) | 0 (0.0%) |
| Total | 217 (100.0%) | 117 (100.0%) |
Housing Occupancy in Genoa
Occupancy by Ownership in Genoa
Of the total 469 dwellings in Genoa, owner-occupied units account for 438 (93.4%), while renter-occupied units make up 31 (6.6%).
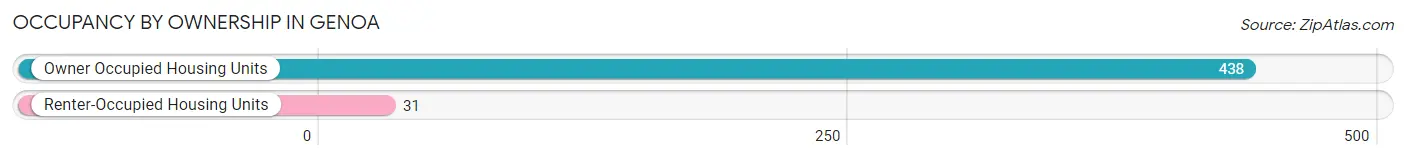
| Occupancy | # Housing Units | % Housing Units |
| Owner Occupied Housing Units | 438 | 93.4% |
| Renter-Occupied Housing Units | 31 | 6.6% |
| Total Occupied Housing Units | 469 | 100.0% |
Occupancy by Household Size in Genoa
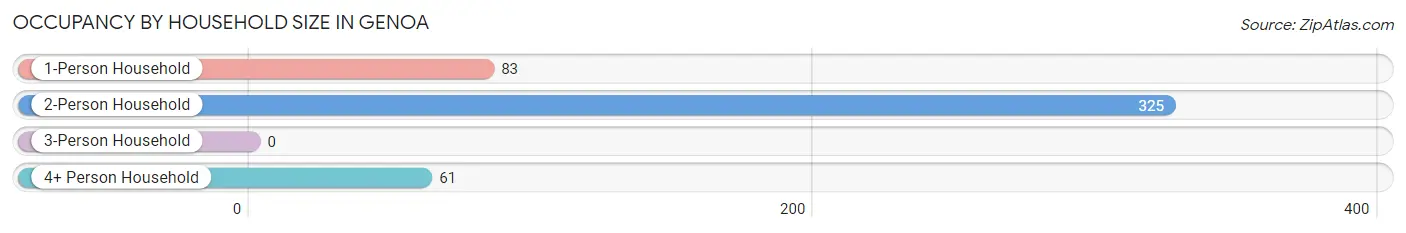
| Household Size | # Housing Units | % Housing Units |
| 1-Person Household | 83 | 17.7% |
| 2-Person Household | 325 | 69.3% |
| 3-Person Household | 0 | 0.0% |
| 4+ Person Household | 61 | 13.0% |
| Total Housing Units | 469 | 100.0% |
Occupancy by Ownership by Household Size in Genoa
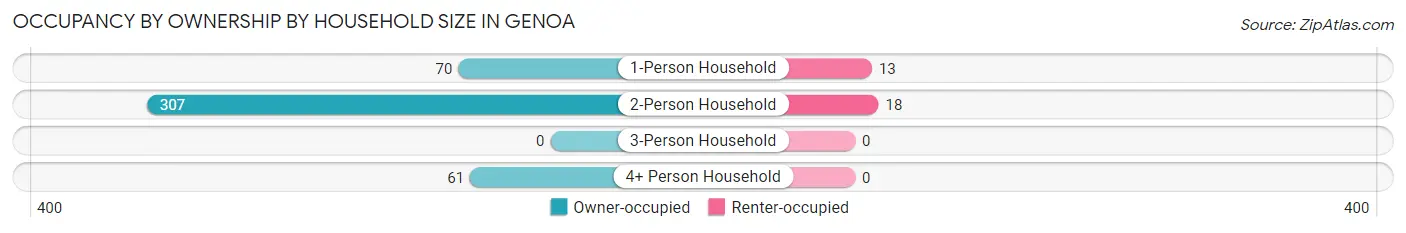
| Household Size | Owner-occupied | Renter-occupied |
| 1-Person Household | 70 (84.3%) | 13 (15.7%) |
| 2-Person Household | 307 (94.5%) | 18 (5.5%) |
| 3-Person Household | 0 (0.0%) | 0 (0.0%) |
| 4+ Person Household | 61 (100.0%) | 0 (0.0%) |
| Total Housing Units | 438 (93.4%) | 31 (6.6%) |
Occupancy by Educational Attainment in Genoa
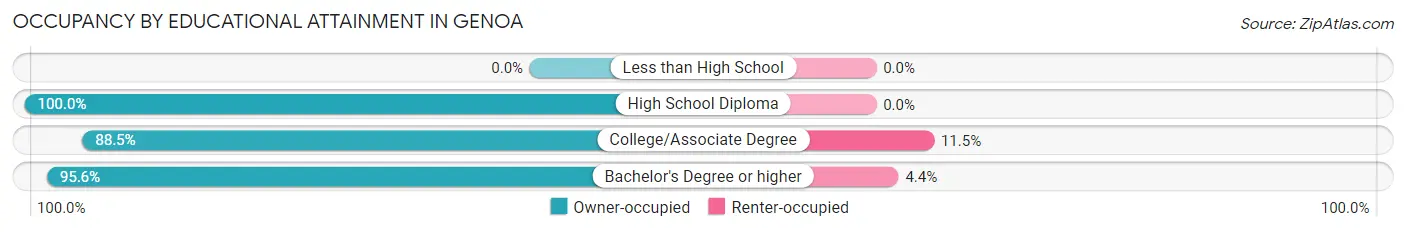
| Household Size | Owner-occupied | Renter-occupied |
| Less than High School | 0 (0.0%) | 0 (0.0%) |
| High School Diploma | 18 (100.0%) | 0 (0.0%) |
| College/Associate Degree | 139 (88.5%) | 18 (11.5%) |
| Bachelor's Degree or higher | 281 (95.6%) | 13 (4.4%) |
Occupancy by Age of Householder in Genoa
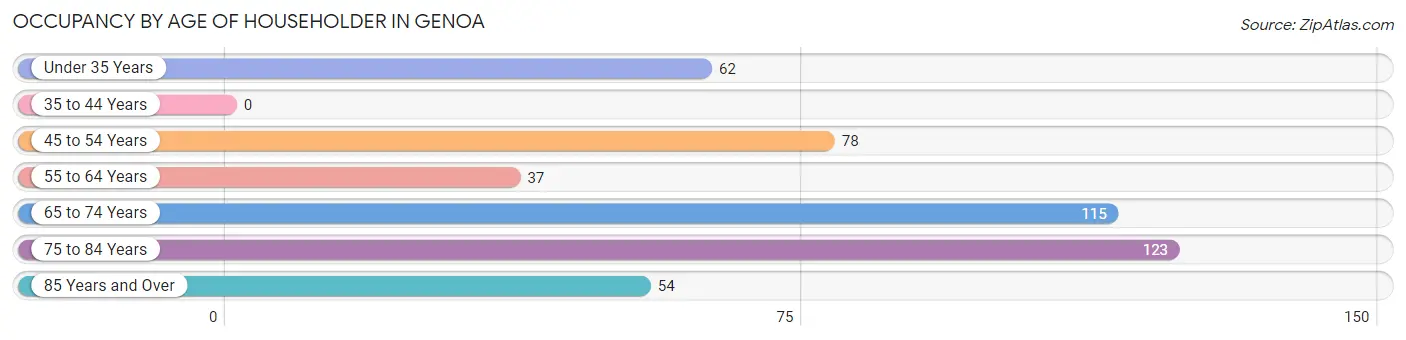
| Age Bracket | # Households | % Households |
| Under 35 Years | 62 | 13.2% |
| 35 to 44 Years | 0 | 0.0% |
| 45 to 54 Years | 78 | 16.6% |
| 55 to 64 Years | 37 | 7.9% |
| 65 to 74 Years | 115 | 24.5% |
| 75 to 84 Years | 123 | 26.2% |
| 85 Years and Over | 54 | 11.5% |
| Total | 469 | 100.0% |
Housing Finances in Genoa
Median Income by Occupancy in Genoa
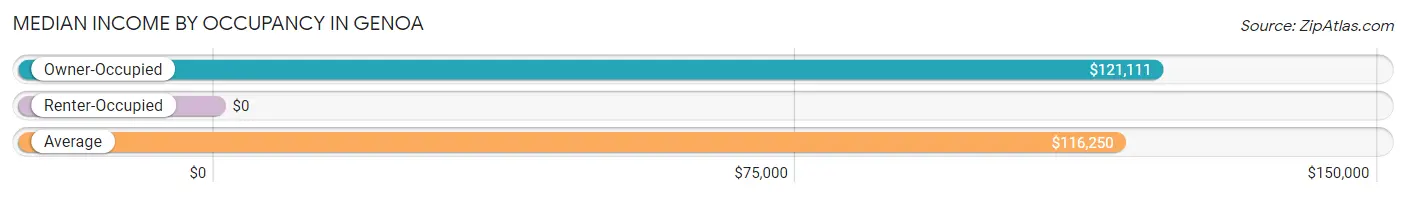
| Occupancy Type | # Households | Median Income |
| Owner-Occupied | 438 (93.4%) | $121,111 |
| Renter-Occupied | 31 (6.6%) | $0 |
| Average | 469 (100.0%) | $116,250 |
Occupancy by Householder Income Bracket in Genoa
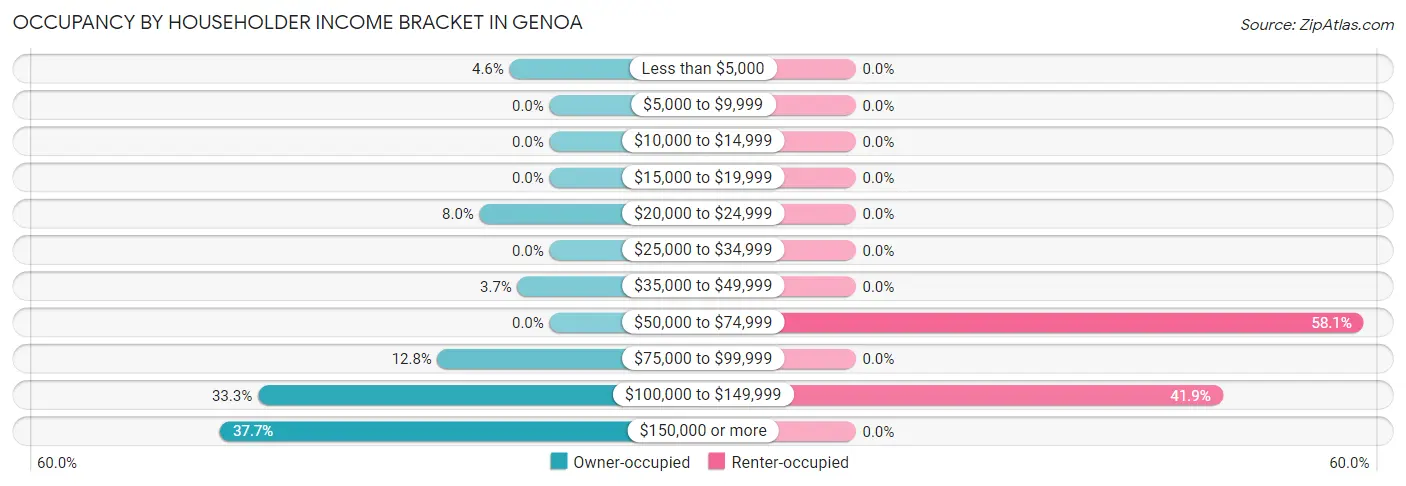
| Income Bracket | Owner-occupied | Renter-occupied |
| Less than $5,000 | 20 (4.6%) | 0 (0.0%) |
| $5,000 to $9,999 | 0 (0.0%) | 0 (0.0%) |
| $10,000 to $14,999 | 0 (0.0%) | 0 (0.0%) |
| $15,000 to $19,999 | 0 (0.0%) | 0 (0.0%) |
| $20,000 to $24,999 | 35 (8.0%) | 0 (0.0%) |
| $25,000 to $34,999 | 0 (0.0%) | 0 (0.0%) |
| $35,000 to $49,999 | 16 (3.6%) | 0 (0.0%) |
| $50,000 to $74,999 | 0 (0.0%) | 18 (58.1%) |
| $75,000 to $99,999 | 56 (12.8%) | 0 (0.0%) |
| $100,000 to $149,999 | 146 (33.3%) | 13 (41.9%) |
| $150,000 or more | 165 (37.7%) | 0 (0.0%) |
| Total | 438 (100.0%) | 31 (100.0%) |
Monthly Housing Cost Tiers in Genoa
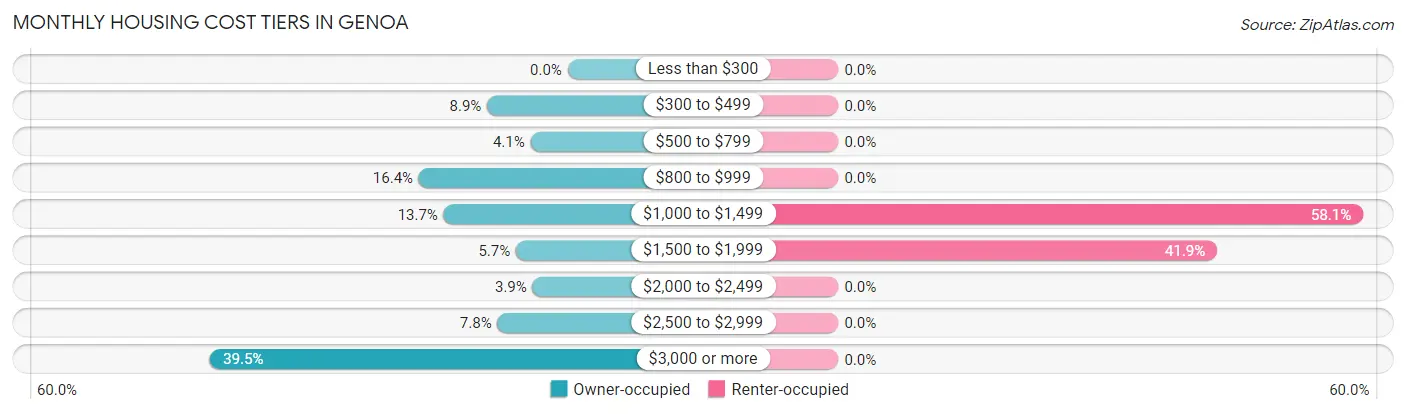
| Monthly Cost | Owner-occupied | Renter-occupied |
| Less than $300 | 0 (0.0%) | 0 (0.0%) |
| $300 to $499 | 39 (8.9%) | 0 (0.0%) |
| $500 to $799 | 18 (4.1%) | 0 (0.0%) |
| $800 to $999 | 72 (16.4%) | 0 (0.0%) |
| $1,000 to $1,499 | 60 (13.7%) | 18 (58.1%) |
| $1,500 to $1,999 | 25 (5.7%) | 13 (41.9%) |
| $2,000 to $2,499 | 17 (3.9%) | 0 (0.0%) |
| $2,500 to $2,999 | 34 (7.8%) | 0 (0.0%) |
| $3,000 or more | 173 (39.5%) | 0 (0.0%) |
| Total | 438 (100.0%) | 31 (100.0%) |
Physical Housing Characteristics in Genoa
Housing Structures in Genoa
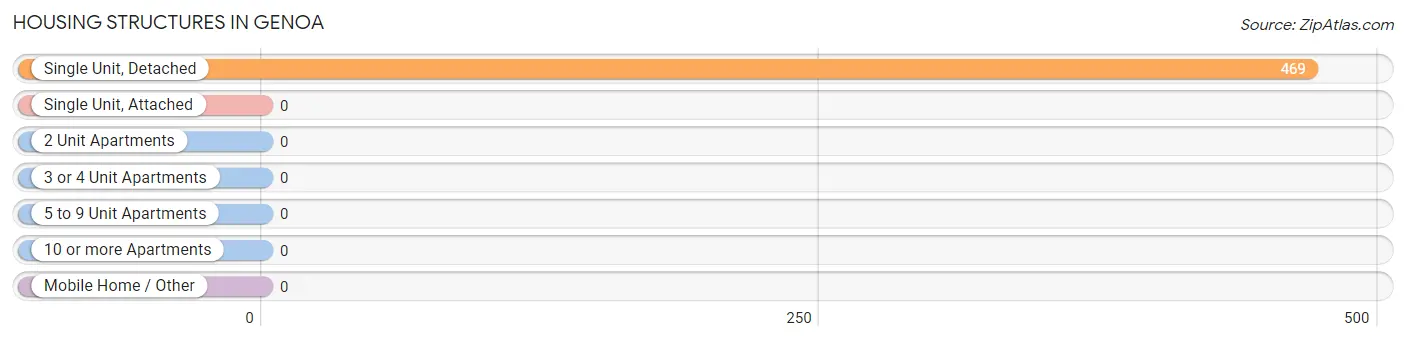
| Structure Type | # Housing Units | % Housing Units |
| Single Unit, Detached | 469 | 100.0% |
| Single Unit, Attached | 0 | 0.0% |
| 2 Unit Apartments | 0 | 0.0% |
| 3 or 4 Unit Apartments | 0 | 0.0% |
| 5 to 9 Unit Apartments | 0 | 0.0% |
| 10 or more Apartments | 0 | 0.0% |
| Mobile Home / Other | 0 | 0.0% |
| Total | 469 | 100.0% |
Housing Structures by Occupancy in Genoa
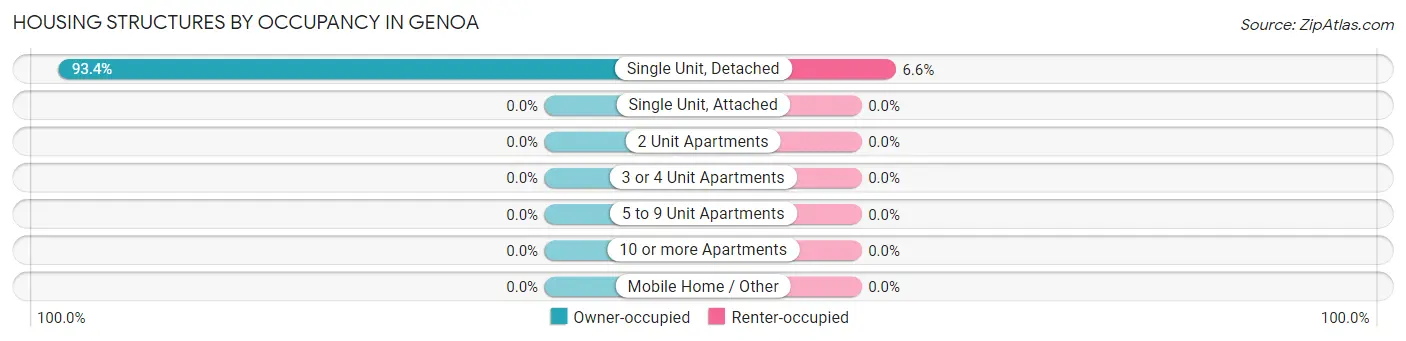
| Structure Type | Owner-occupied | Renter-occupied |
| Single Unit, Detached | 438 (93.4%) | 31 (6.6%) |
| Single Unit, Attached | 0 (0.0%) | 0 (0.0%) |
| 2 Unit Apartments | 0 (0.0%) | 0 (0.0%) |
| 3 or 4 Unit Apartments | 0 (0.0%) | 0 (0.0%) |
| 5 to 9 Unit Apartments | 0 (0.0%) | 0 (0.0%) |
| 10 or more Apartments | 0 (0.0%) | 0 (0.0%) |
| Mobile Home / Other | 0 (0.0%) | 0 (0.0%) |
| Total | 438 (93.4%) | 31 (6.6%) |
Housing Structures by Number of Rooms in Genoa
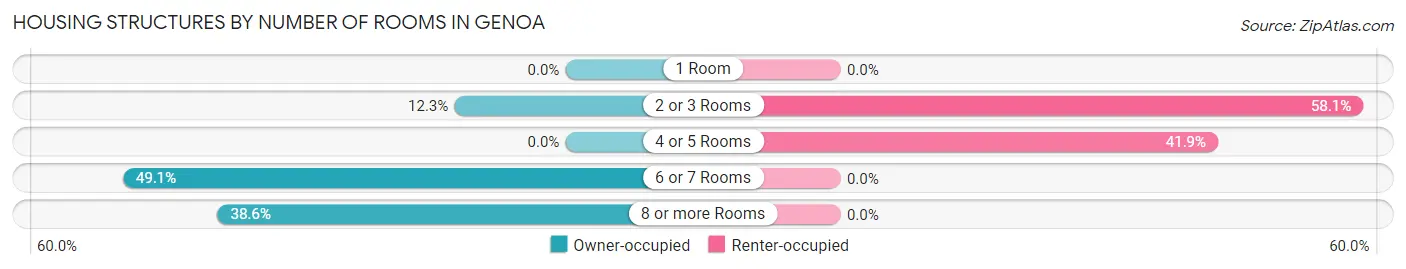
| Number of Rooms | Owner-occupied | Renter-occupied |
| 1 Room | 0 (0.0%) | 0 (0.0%) |
| 2 or 3 Rooms | 54 (12.3%) | 18 (58.1%) |
| 4 or 5 Rooms | 0 (0.0%) | 13 (41.9%) |
| 6 or 7 Rooms | 215 (49.1%) | 0 (0.0%) |
| 8 or more Rooms | 169 (38.6%) | 0 (0.0%) |
| Total | 438 (100.0%) | 31 (100.0%) |
Housing Structure by Heating Type in Genoa
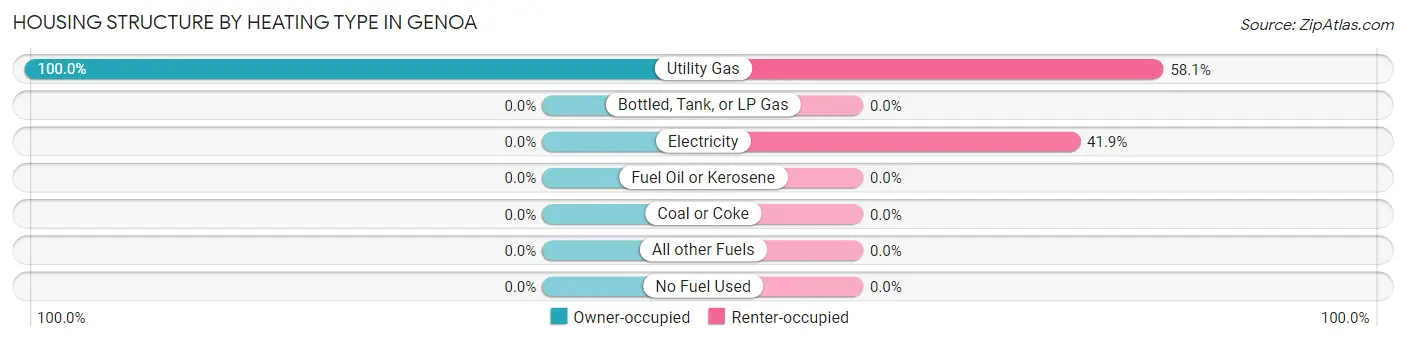
| Heating Type | Owner-occupied | Renter-occupied |
| Utility Gas | 438 (100.0%) | 18 (58.1%) |
| Bottled, Tank, or LP Gas | 0 (0.0%) | 0 (0.0%) |
| Electricity | 0 (0.0%) | 13 (41.9%) |
| Fuel Oil or Kerosene | 0 (0.0%) | 0 (0.0%) |
| Coal or Coke | 0 (0.0%) | 0 (0.0%) |
| All other Fuels | 0 (0.0%) | 0 (0.0%) |
| No Fuel Used | 0 (0.0%) | 0 (0.0%) |
| Total | 438 (100.0%) | 31 (100.0%) |
Household Vehicle Usage in Genoa
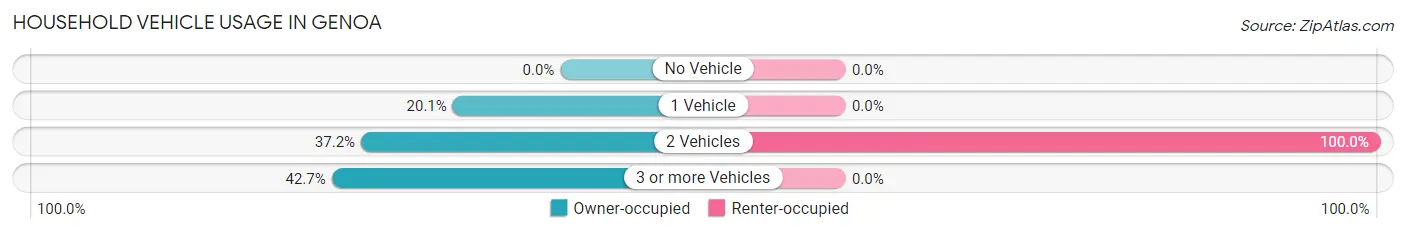
| Vehicles per Household | Owner-occupied | Renter-occupied |
| No Vehicle | 0 (0.0%) | 0 (0.0%) |
| 1 Vehicle | 88 (20.1%) | 0 (0.0%) |
| 2 Vehicles | 163 (37.2%) | 31 (100.0%) |
| 3 or more Vehicles | 187 (42.7%) | 0 (0.0%) |
| Total | 438 (100.0%) | 31 (100.0%) |
Real Estate & Mortgages in Genoa
Real Estate and Mortgage Overview in Genoa
| Characteristic | Without Mortgage | With Mortgage |
| Housing Units | 250 | 188 |
| Median Property Value | $1,385,200 | $875,000 |
| Median Household Income | $114,074 | $86 |
| Monthly Housing Costs | $975 | $119 |
| Real Estate Taxes | $6,902 | $0 |
Property Value by Mortgage Status in Genoa
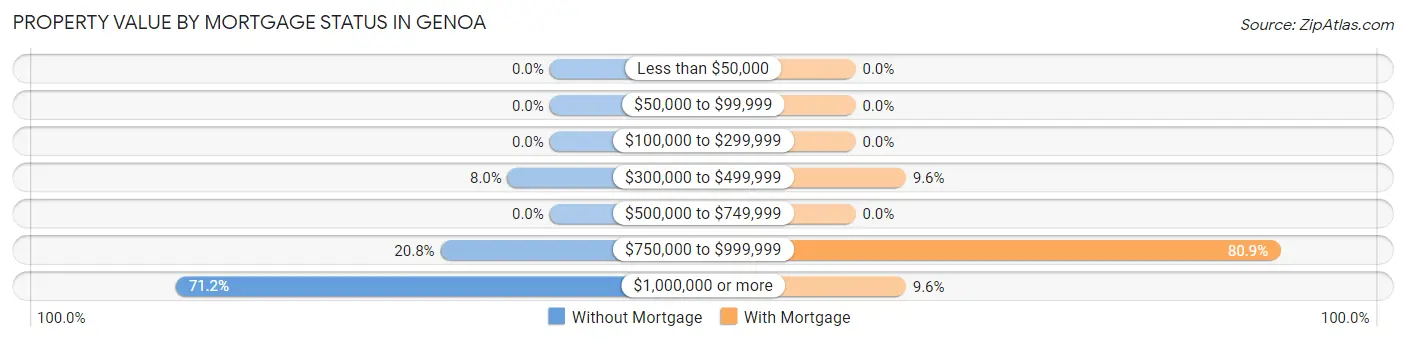
| Property Value | Without Mortgage | With Mortgage |
| Less than $50,000 | 0 (0.0%) | 0 (0.0%) |
| $50,000 to $99,999 | 0 (0.0%) | 0 (0.0%) |
| $100,000 to $299,999 | 0 (0.0%) | 0 (0.0%) |
| $300,000 to $499,999 | 20 (8.0%) | 18 (9.6%) |
| $500,000 to $749,999 | 0 (0.0%) | 0 (0.0%) |
| $750,000 to $999,999 | 52 (20.8%) | 152 (80.8%) |
| $1,000,000 or more | 178 (71.2%) | 18 (9.6%) |
| Total | 250 (100.0%) | 188 (100.0%) |
Household Income by Mortgage Status in Genoa
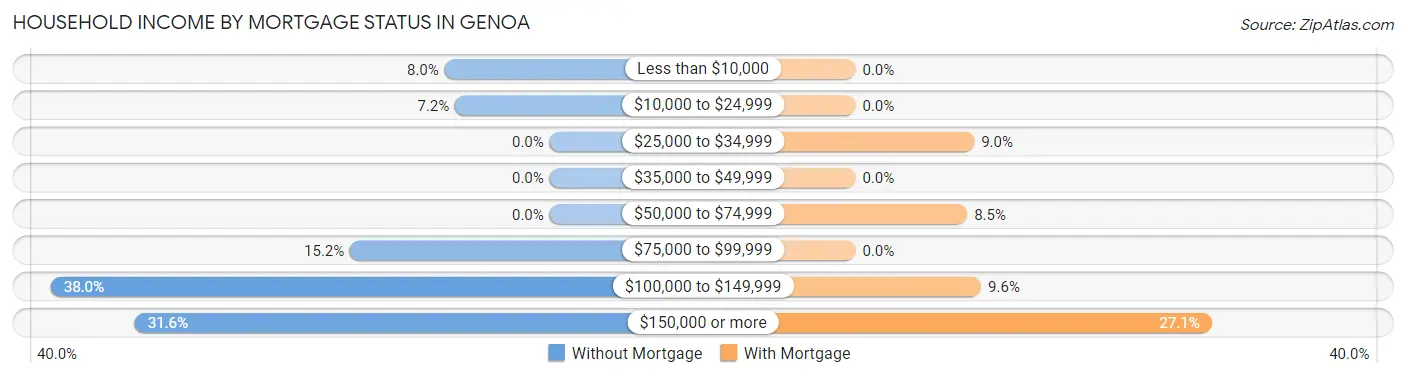
| Household Income | Without Mortgage | With Mortgage |
| Less than $10,000 | 20 (8.0%) | 0 (0.0%) |
| $10,000 to $24,999 | 18 (7.2%) | 0 (0.0%) |
| $25,000 to $34,999 | 0 (0.0%) | 17 (9.0%) |
| $35,000 to $49,999 | 0 (0.0%) | 0 (0.0%) |
| $50,000 to $74,999 | 0 (0.0%) | 16 (8.5%) |
| $75,000 to $99,999 | 38 (15.2%) | 0 (0.0%) |
| $100,000 to $149,999 | 95 (38.0%) | 18 (9.6%) |
| $150,000 or more | 79 (31.6%) | 51 (27.1%) |
| Total | 250 (100.0%) | 188 (100.0%) |
Property Value to Household Income Ratio in Genoa
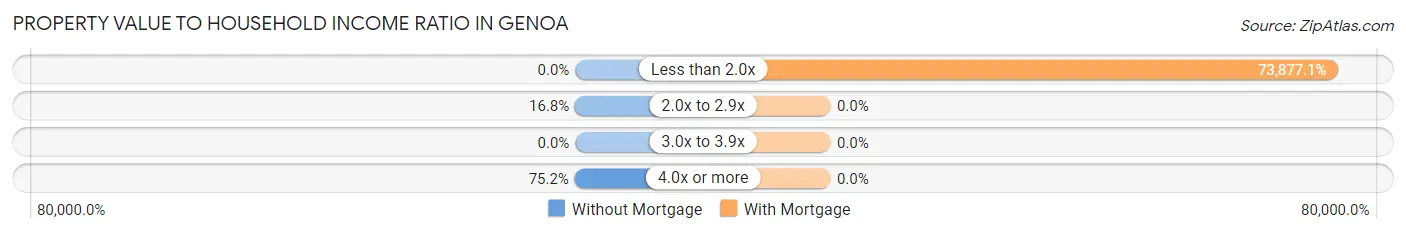
| Value-to-Income Ratio | Without Mortgage | With Mortgage |
| Less than 2.0x | 0 (0.0%) | 138,889 (73,877.1%) |
| 2.0x to 2.9x | 42 (16.8%) | 0 (0.0%) |
| 3.0x to 3.9x | 0 (0.0%) | 0 (0.0%) |
| 4.0x or more | 188 (75.2%) | 0 (0.0%) |
| Total | 250 (100.0%) | 188 (100.0%) |
Real Estate Taxes by Mortgage Status in Genoa
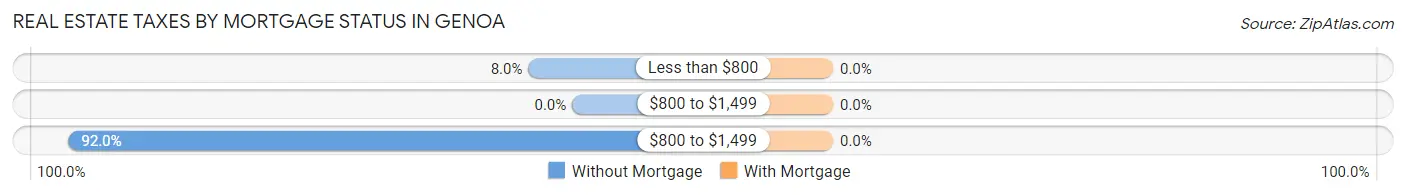
| Property Taxes | Without Mortgage | With Mortgage |
| Less than $800 | 20 (8.0%) | 0 (0.0%) |
| $800 to $1,499 | 0 (0.0%) | 0 (0.0%) |
| $800 to $1,499 | 230 (92.0%) | 0 (0.0%) |
| Total | 250 (100.0%) | 188 (100.0%) |
Health & Disability in Genoa
Health Insurance Coverage by Age in Genoa
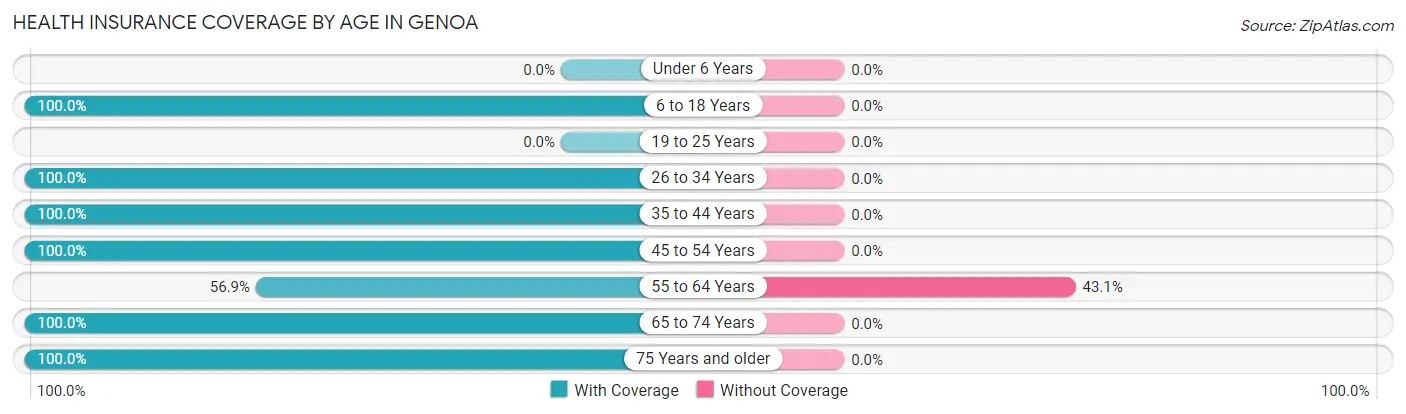
| Age Bracket | With Coverage | Without Coverage |
| Under 6 Years | 0 (0.0%) | 0 (0.0%) |
| 6 to 18 Years | 127 (100.0%) | 0 (0.0%) |
| 19 to 25 Years | 0 (0.0%) | 0 (0.0%) |
| 26 to 34 Years | 62 (100.0%) | 0 (0.0%) |
| 35 to 44 Years | 67 (100.0%) | 0 (0.0%) |
| 45 to 54 Years | 134 (100.0%) | 0 (0.0%) |
| 55 to 64 Years | 91 (56.9%) | 69 (43.1%) |
| 65 to 74 Years | 232 (100.0%) | 0 (0.0%) |
| 75 Years and older | 231 (100.0%) | 0 (0.0%) |
| Total | 944 (93.2%) | 69 (6.8%) |
Health Insurance Coverage by Citizenship Status in Genoa
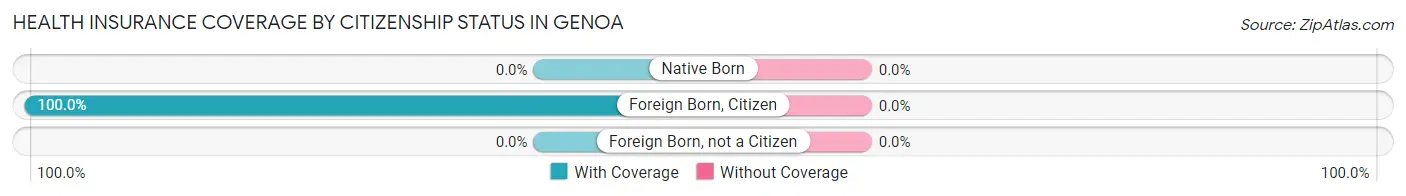
| Citizenship Status | With Coverage | Without Coverage |
| Native Born | 0 (0.0%) | 0 (0.0%) |
| Foreign Born, Citizen | 127 (100.0%) | 0 (0.0%) |
| Foreign Born, not a Citizen | 0 (0.0%) | 0 (0.0%) |
Health Insurance Coverage by Household Income in Genoa
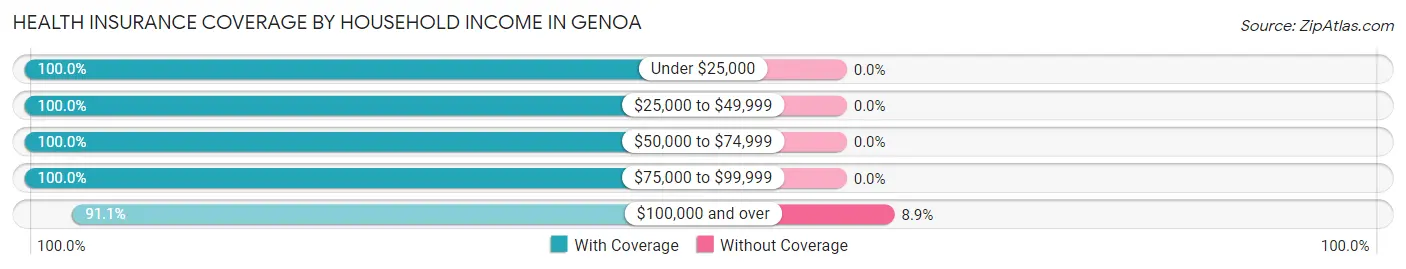
| Household Income | With Coverage | Without Coverage |
| Under $25,000 | 76 (100.0%) | 0 (0.0%) |
| $25,000 to $49,999 | 31 (100.0%) | 0 (0.0%) |
| $50,000 to $74,999 | 35 (100.0%) | 0 (0.0%) |
| $75,000 to $99,999 | 99 (100.0%) | 0 (0.0%) |
| $100,000 and over | 703 (91.1%) | 69 (8.9%) |
Public vs Private Health Insurance Coverage by Age in Genoa
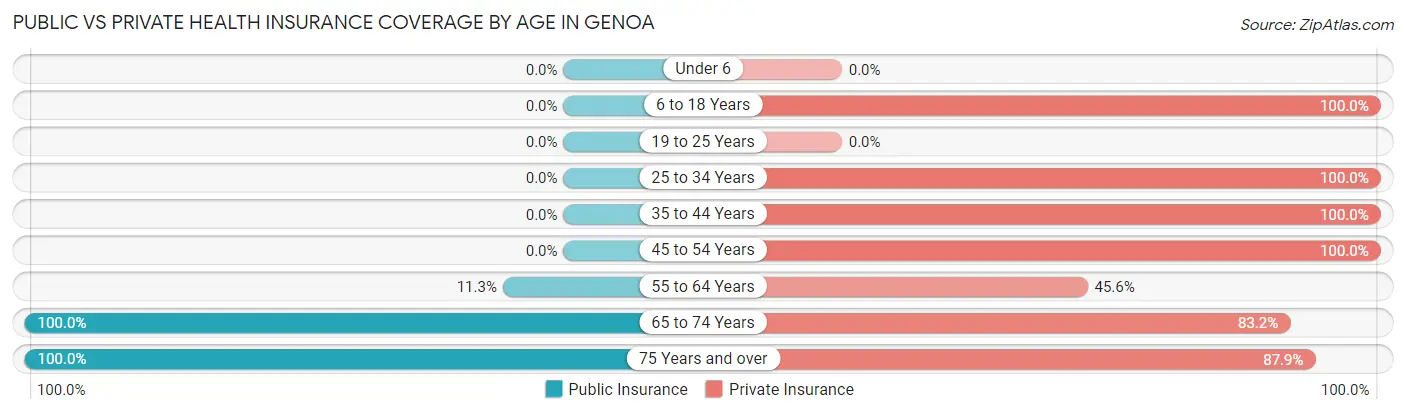
| Age Bracket | Public Insurance | Private Insurance |
| Under 6 | 0 (0.0%) | 0 (0.0%) |
| 6 to 18 Years | 0 (0.0%) | 127 (100.0%) |
| 19 to 25 Years | 0 (0.0%) | 0 (0.0%) |
| 25 to 34 Years | 0 (0.0%) | 62 (100.0%) |
| 35 to 44 Years | 0 (0.0%) | 67 (100.0%) |
| 45 to 54 Years | 0 (0.0%) | 134 (100.0%) |
| 55 to 64 Years | 18 (11.3%) | 73 (45.6%) |
| 65 to 74 Years | 232 (100.0%) | 193 (83.2%) |
| 75 Years and over | 231 (100.0%) | 203 (87.9%) |
| Total | 481 (47.5%) | 859 (84.8%) |
Disability Status by Sex by Age in Genoa
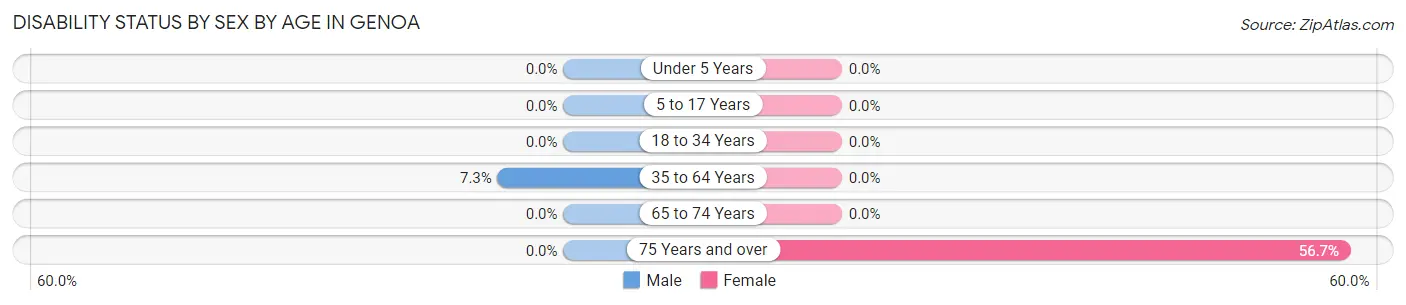
| Age Bracket | Male | Female |
| Under 5 Years | 0 (0.0%) | 0 (0.0%) |
| 5 to 17 Years | 0 (0.0%) | 0 (0.0%) |
| 18 to 34 Years | 0 (0.0%) | 0 (0.0%) |
| 35 to 64 Years | 18 (7.3%) | 0 (0.0%) |
| 65 to 74 Years | 0 (0.0%) | 0 (0.0%) |
| 75 Years and over | 0 (0.0%) | 72 (56.7%) |
Disability Class by Sex by Age in Genoa
Disability Class: Hearing Difficulty
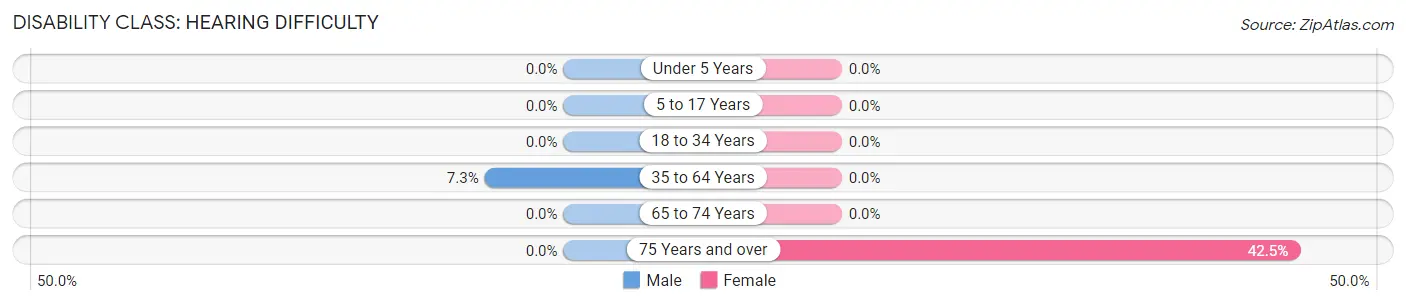
| Age Bracket | Male | Female |
| Under 5 Years | 0 (0.0%) | 0 (0.0%) |
| 5 to 17 Years | 0 (0.0%) | 0 (0.0%) |
| 18 to 34 Years | 0 (0.0%) | 0 (0.0%) |
| 35 to 64 Years | 18 (7.3%) | 0 (0.0%) |
| 65 to 74 Years | 0 (0.0%) | 0 (0.0%) |
| 75 Years and over | 0 (0.0%) | 54 (42.5%) |
Disability Class: Vision Difficulty
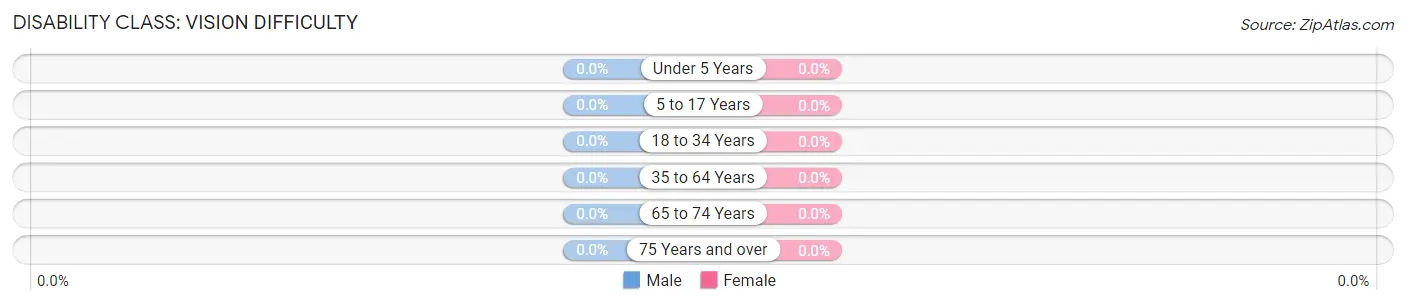
| Age Bracket | Male | Female |
| Under 5 Years | 0 (0.0%) | 0 (0.0%) |
| 5 to 17 Years | 0 (0.0%) | 0 (0.0%) |
| 18 to 34 Years | 0 (0.0%) | 0 (0.0%) |
| 35 to 64 Years | 0 (0.0%) | 0 (0.0%) |
| 65 to 74 Years | 0 (0.0%) | 0 (0.0%) |
| 75 Years and over | 0 (0.0%) | 0 (0.0%) |
Disability Class: Cognitive Difficulty
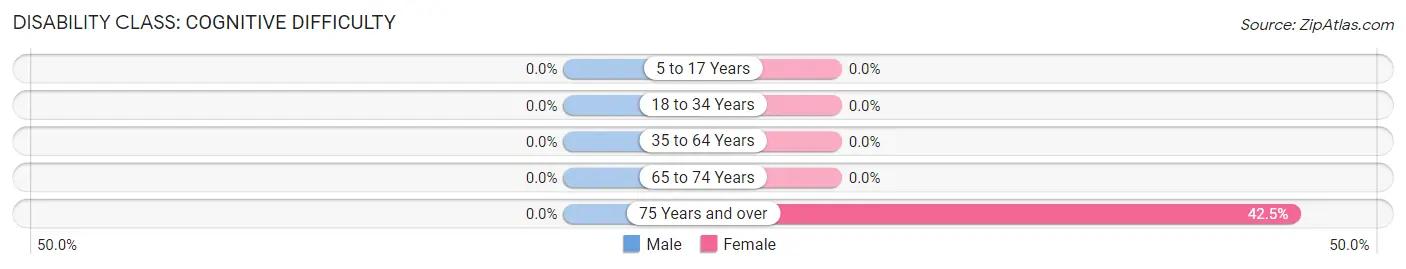
| Age Bracket | Male | Female |
| 5 to 17 Years | 0 (0.0%) | 0 (0.0%) |
| 18 to 34 Years | 0 (0.0%) | 0 (0.0%) |
| 35 to 64 Years | 0 (0.0%) | 0 (0.0%) |
| 65 to 74 Years | 0 (0.0%) | 0 (0.0%) |
| 75 Years and over | 0 (0.0%) | 54 (42.5%) |
Disability Class: Ambulatory Difficulty
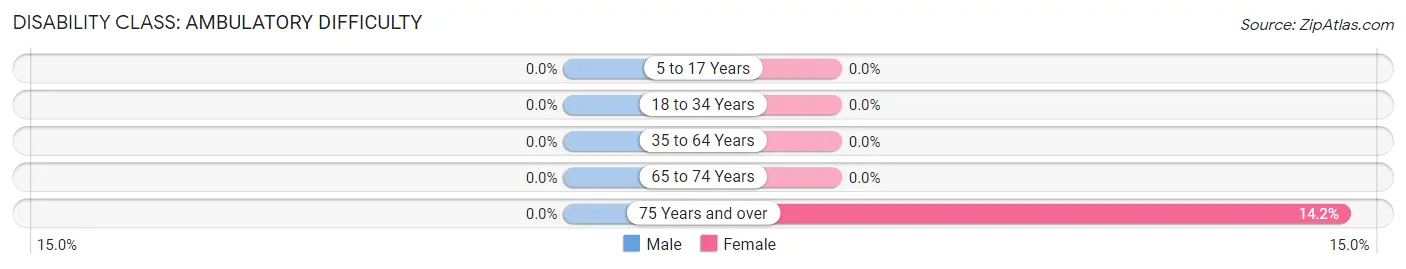
| Age Bracket | Male | Female |
| 5 to 17 Years | 0 (0.0%) | 0 (0.0%) |
| 18 to 34 Years | 0 (0.0%) | 0 (0.0%) |
| 35 to 64 Years | 0 (0.0%) | 0 (0.0%) |
| 65 to 74 Years | 0 (0.0%) | 0 (0.0%) |
| 75 Years and over | 0 (0.0%) | 18 (14.2%) |
Disability Class: Self-Care Difficulty
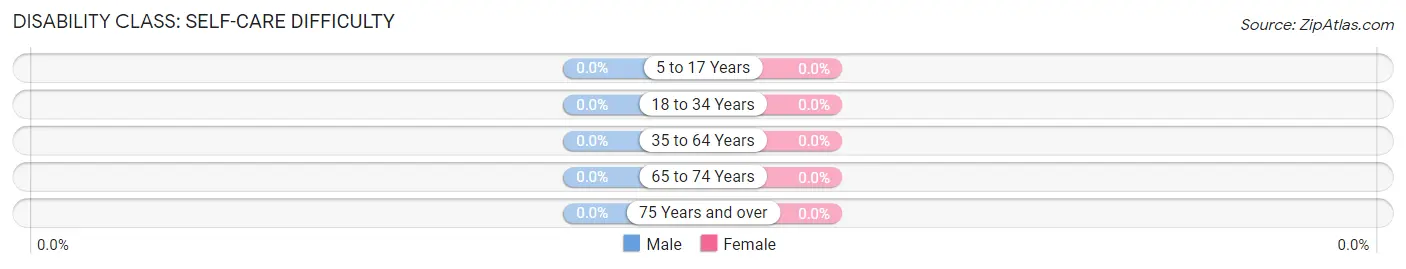
| Age Bracket | Male | Female |
| 5 to 17 Years | 0 (0.0%) | 0 (0.0%) |
| 18 to 34 Years | 0 (0.0%) | 0 (0.0%) |
| 35 to 64 Years | 0 (0.0%) | 0 (0.0%) |
| 65 to 74 Years | 0 (0.0%) | 0 (0.0%) |
| 75 Years and over | 0 (0.0%) | 0 (0.0%) |
Technology Access in Genoa
Computing Device Access in Genoa
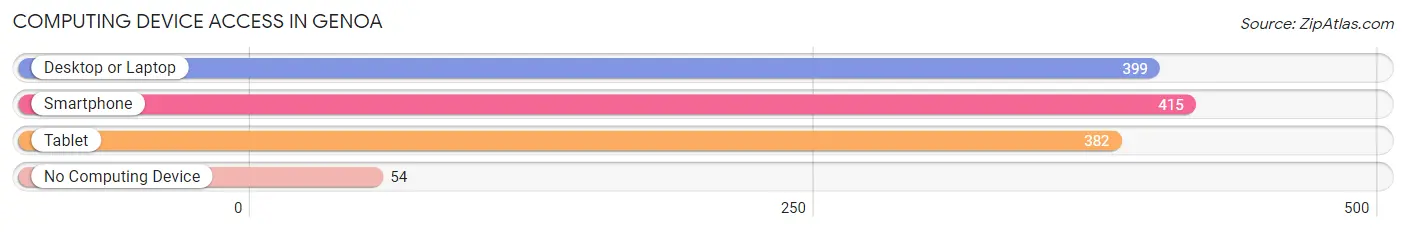
| Device Type | # Households | % Households |
| Desktop or Laptop | 399 | 85.1% |
| Smartphone | 415 | 88.5% |
| Tablet | 382 | 81.5% |
| No Computing Device | 54 | 11.5% |
| Total | 469 | 100.0% |
Internet Access in Genoa
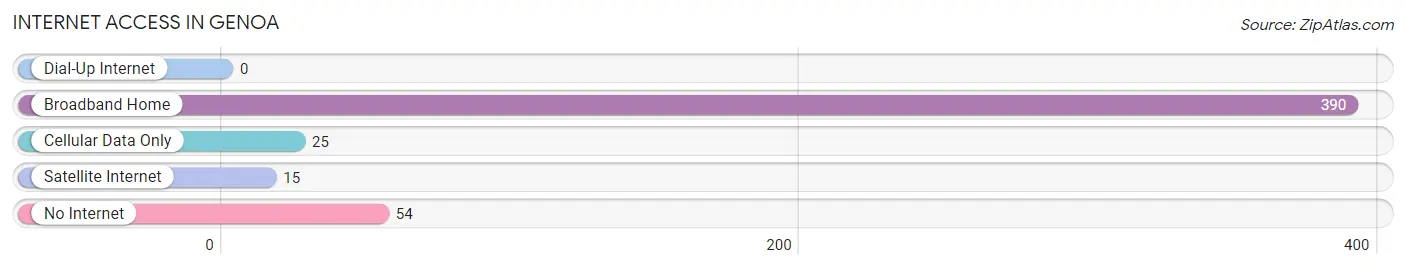
| Internet Type | # Households | % Households |
| Dial-Up Internet | 0 | 0.0% |
| Broadband Home | 390 | 83.2% |
| Cellular Data Only | 25 | 5.3% |
| Satellite Internet | 15 | 3.2% |
| No Internet | 54 | 11.5% |
| Total | 469 | 100.0% |
Genoa Summary
Genoa, Nevada is a small town located in Douglas County, Nevada. It is situated in the Carson Valley, approximately 20 miles south of Carson City and about 40 miles south of Reno. The town was founded in 1851 by John Reese and is the oldest settlement in Nevada. Genoa is known as the “Mother of Nevada” and is the birthplace of Nevada statehood.
History
Genoa was founded in 1851 by John Reese, a former trapper and trader. Reese had been living in the area since 1848 and had established a trading post and a ferry service across the Carson River. He named the settlement after Genoa, Italy, which was the birthplace of Christopher Columbus.
In 1859, the Nevada Territory was created and Genoa was chosen as the first county seat of Douglas County. The town was the site of the first Nevada Territorial Legislature in 1861. The legislature passed the Organic Act, which established the Nevada Territory and made Genoa the first capital of the state.
In 1862, the capital was moved to Carson City and Genoa began to decline. The town was bypassed by the transcontinental railroad in 1869 and the population began to dwindle. By the early 1900s, the town had become a ghost town.
In the 1950s, Genoa began to experience a revival. The town was designated as a National Historic Landmark in 1961 and the Genoa Historic District was established in 1965. The district includes the original town site, the Reese House, the Genoa Courthouse Museum, and the Genoa Cemetery.
Geography
Genoa is located in the Carson Valley, approximately 20 miles south of Carson City and about 40 miles south of Reno. The town is situated at an elevation of 4,719 feet and is surrounded by the Sierra Nevada Mountains. The Carson River runs through the town and is a popular spot for fishing and boating.
The climate in Genoa is semi-arid, with hot summers and cold winters. The average high temperature in July is 92°F and the average low temperature in January is 22°F. The town receives an average of 8.5 inches of precipitation per year.
Economy
Genoa’s economy is largely based on tourism. The town is a popular destination for outdoor recreation, such as fishing, boating, hiking, and camping. The town is also home to several wineries and is a popular destination for wine tasting.
The town is also home to several businesses, including restaurants, shops, and lodging. The Genoa Bar & Saloon is the oldest bar in Nevada and is a popular destination for locals and tourists alike.
Demographics
As of the 2010 census, Genoa had a population of 862. The racial makeup of the town was 94.2% White, 0.2% African American, 0.7% Native American, 0.7% Asian, 0.1% Pacific Islander, and 3.2% from other races. Hispanic or Latino of any race were 5.2% of the population.
The median household income in Genoa was $50,000 and the median family income was $54,000. The per capita income was $25,000. About 8.2% of families and 10.2% of the population were below the poverty line.
Genoa is a small town with a rich history and a vibrant economy. The town is a popular destination for outdoor recreation and is home to several businesses. The town has a diverse population and is a great place to live and work.
Common Questions
What is Per Capita Income in Genoa?
Per Capita income in Genoa is $83,005.
What is the Median Family Income in Genoa?
Median Family Income in Genoa is $129,474.
What is the Median Household income in Genoa?
Median Household Income in Genoa is $116,250.
What is Income or Wage Gap in Genoa?
Income or Wage Gap in Genoa is 20.2%.
Women in Genoa earn 79.8 cents for every dollar earned by a man.
What is Inequality or Gini Index in Genoa?
Inequality or Gini Index in Genoa is 0.45.
What is the Total Population of Genoa?
Total Population of Genoa is 1,013.
What is the Total Male Population of Genoa?
Total Male Population of Genoa is 533.
What is the Total Female Population of Genoa?
Total Female Population of Genoa is 480.
What is the Ratio of Males per 100 Females in Genoa?
There are 111.04 Males per 100 Females in Genoa.
What is the Ratio of Females per 100 Males in Genoa?
There are 90.06 Females per 100 Males in Genoa.
What is the Median Population Age in Genoa?
Median Population Age in Genoa is 62.8 Years.
What is the Average Family Size in Genoa
Average Family Size in Genoa is 2.5 People.
What is the Average Household Size in Genoa
Average Household Size in Genoa is 2.2 People.
How Large is the Labor Force in Genoa?
There are 448 People in the Labor Forcein in Genoa.
What is the Percentage of People in the Labor Force in Genoa?
48.7% of People are in the Labor Force in Genoa.
What is the Unemployment Rate in Genoa?
Unemployment Rate in Genoa is 3.8%.