Kingston, RI Map & Demographics
Kingston Map
Kingston Overview
$13,680
PER CAPITA INCOME
$117,550
AVG FAMILY INCOME
$108,056
AVG HOUSEHOLD INCOME
5.6%
WAGE / INCOME GAP [ % ]
94.4¢/ $1
WAGE / INCOME GAP [ $ ]
0.32
INEQUALITY / GINI INDEX
6,560
TOTAL POPULATION
2,927
MALE POPULATION
3,633
FEMALE POPULATION
80.57
MALES / 100 FEMALES
124.12
FEMALES / 100 MALES
19.6
MEDIAN AGE
2.9
AVG FAMILY SIZE
2.5
AVG HOUSEHOLD SIZE
2,450
LABOR FORCE [ PEOPLE ]
38.9%
PERCENT IN LABOR FORCE
11.0%
UNEMPLOYMENT RATE
Kingston Zip Codes
Kingston Area Codes
Income in Kingston
Income Overview in Kingston
Per Capita Income in Kingston is $13,680, while median incomes of families and households are $117,550 and $108,056 respectively.
| Characteristic | Number | Measure |
| Per Capita Income | 6,560 | $13,680 |
| Median Family Income | 478 | $117,550 |
| Mean Family Income | 478 | $113,483 |
| Median Household Income | 592 | $108,056 |
| Mean Household Income | 592 | $106,840 |
| Income Deficit | 478 | $0 |
| Wage / Income Gap (%) | 6,560 | 5.55% |
| Wage / Income Gap ($) | 6,560 | 94.45¢ per $1 |
| Gini / Inequality Index | 6,560 | 0.32 |
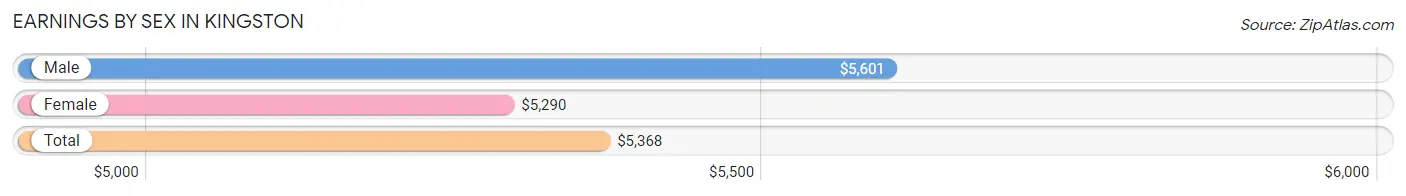
Earnings by Sex in Kingston
Average Earnings in Kingston are $5,368, $5,601 for men and $5,290 for women, a difference of 5.6%.
| Sex | Number | Average Earnings |
| Male | 1,838 (41.0%) | $5,601 |
| Female | 2,639 (59.0%) | $5,290 |
| Total | 4,477 (100.0%) | $5,368 |
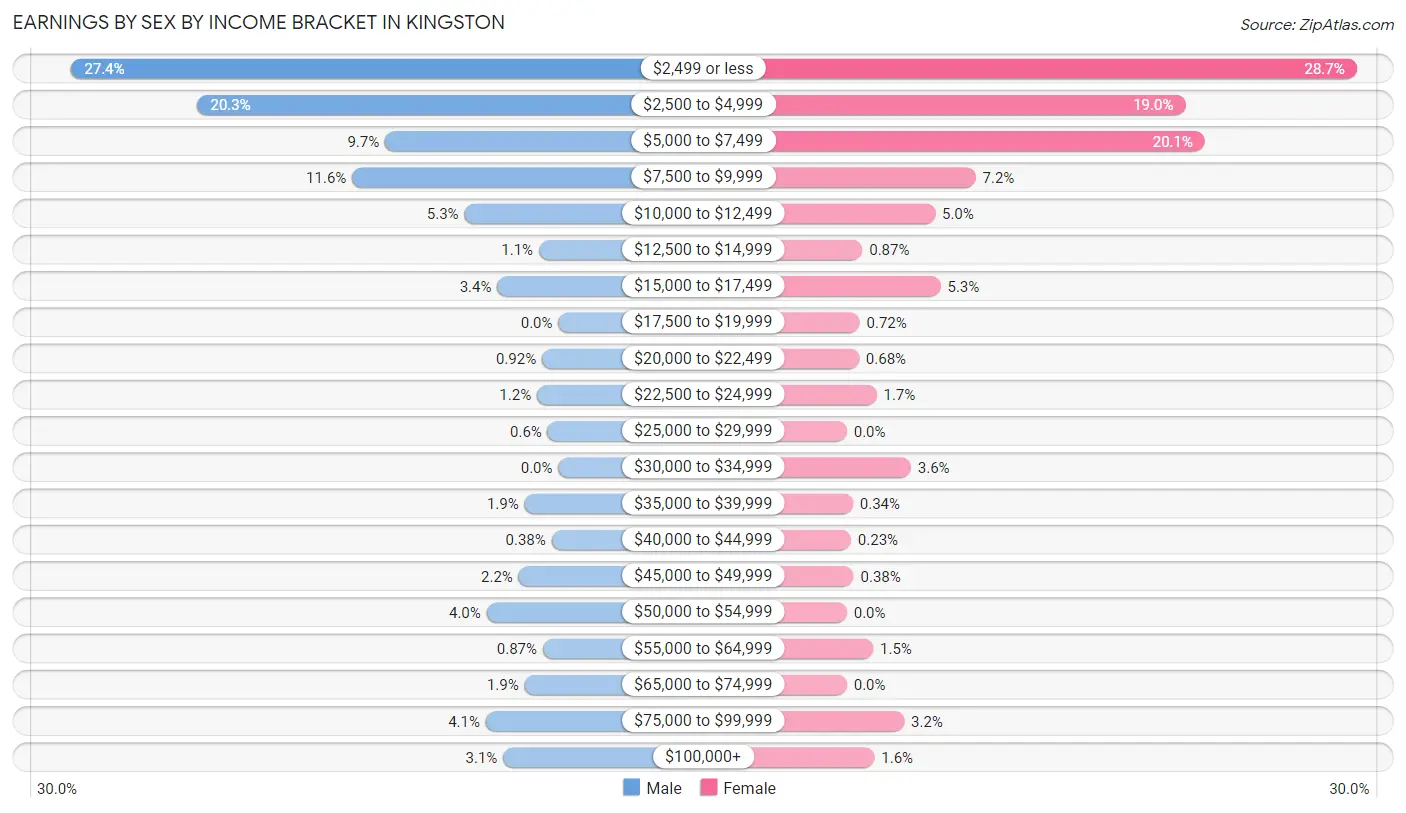
Earnings by Sex by Income Bracket in Kingston
The most common earnings brackets in Kingston are $2,499 or less for men (503 | 27.4%) and $2,499 or less for women (756 | 28.6%).
| Income | Male | Female |
| $2,499 or less | 503 (27.4%) | 756 (28.6%) |
| $2,500 to $4,999 | 373 (20.3%) | 502 (19.0%) |
| $5,000 to $7,499 | 179 (9.7%) | 531 (20.1%) |
| $7,500 to $9,999 | 213 (11.6%) | 191 (7.2%) |
| $10,000 to $12,499 | 97 (5.3%) | 131 (5.0%) |
| $12,500 to $14,999 | 20 (1.1%) | 23 (0.9%) |
| $15,000 to $17,499 | 63 (3.4%) | 139 (5.3%) |
| $17,500 to $19,999 | 0 (0.0%) | 19 (0.7%) |
| $20,000 to $22,499 | 17 (0.9%) | 18 (0.7%) |
| $22,500 to $24,999 | 22 (1.2%) | 44 (1.7%) |
| $25,000 to $29,999 | 11 (0.6%) | 0 (0.0%) |
| $30,000 to $34,999 | 0 (0.0%) | 95 (3.6%) |
| $35,000 to $39,999 | 35 (1.9%) | 9 (0.3%) |
| $40,000 to $44,999 | 7 (0.4%) | 6 (0.2%) |
| $45,000 to $49,999 | 41 (2.2%) | 10 (0.4%) |
| $50,000 to $54,999 | 74 (4.0%) | 0 (0.0%) |
| $55,000 to $64,999 | 16 (0.9%) | 39 (1.5%) |
| $65,000 to $74,999 | 35 (1.9%) | 0 (0.0%) |
| $75,000 to $99,999 | 75 (4.1%) | 85 (3.2%) |
| $100,000+ | 57 (3.1%) | 41 (1.5%) |
| Total | 1,838 (100.0%) | 2,639 (100.0%) |
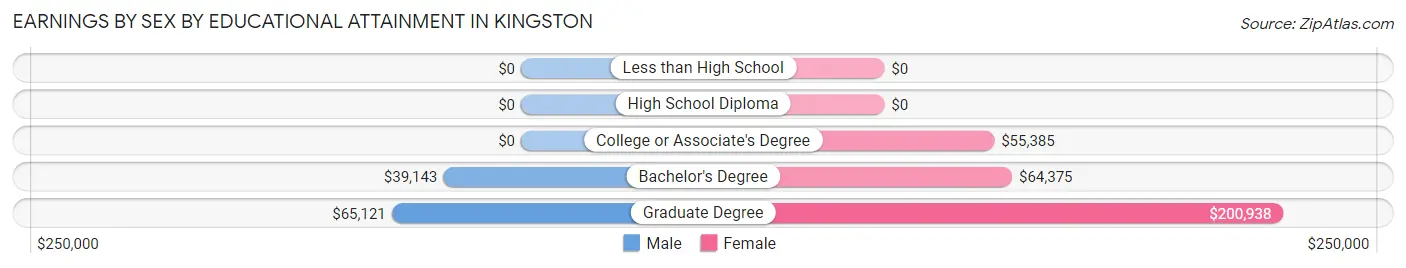
Earnings by Sex by Educational Attainment in Kingston
Average earnings in Kingston are $54,206 for men and $61,250 for women, a difference of 11.5%. Men with an educational attainment of graduate degree enjoy the highest average annual earnings of $65,121, while those with bachelor's degree education earn the least with $39,143. Women with an educational attainment of graduate degree earn the most with the average annual earnings of $200,938, while those with college or associate's degree education have the smallest earnings of $55,385.
| Educational Attainment | Male Income | Female Income |
| Less than High School | - | - |
| High School Diploma | - | - |
| College or Associate's Degree | - | - |
| Bachelor's Degree | $39,143 | $64,375 |
| Graduate Degree | $65,121 | $200,938 |
| Total | $54,206 | $61,250 |
Family Income in Kingston
Family Income Brackets in Kingston
According to the Kingston family income data, there are 200 families falling into the $100,000 to $149,999 income range, which is the most common income bracket and makes up 41.8% of all families.
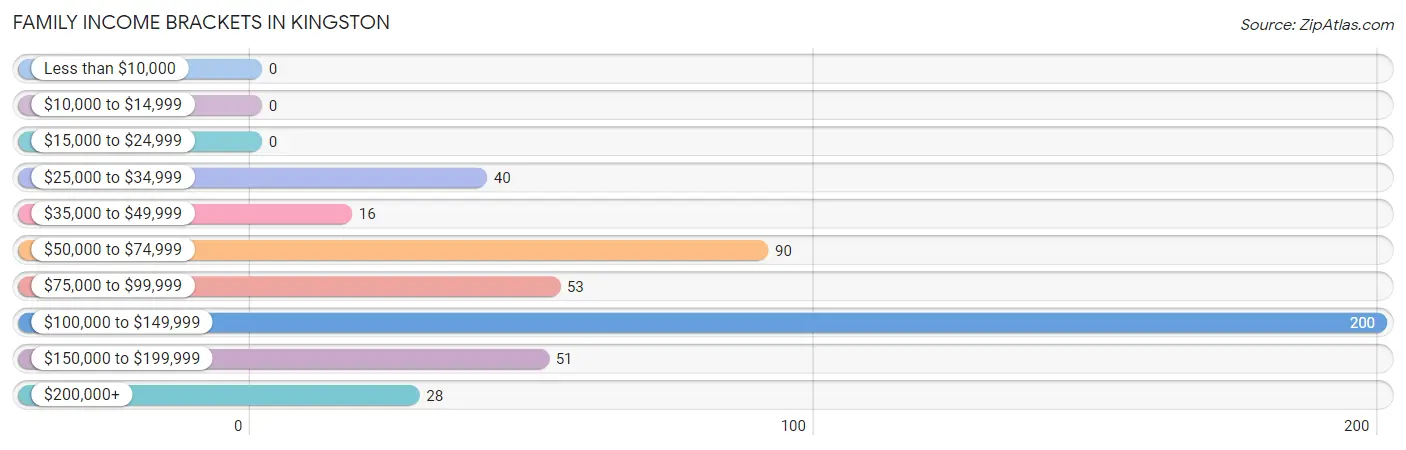
| Income Bracket | # Families | % Families |
| Less than $10,000 | 0 | 0.0% |
| $10,000 to $14,999 | 0 | 0.0% |
| $15,000 to $24,999 | 0 | 0.0% |
| $25,000 to $34,999 | 40 | 8.4% |
| $35,000 to $49,999 | 16 | 3.3% |
| $50,000 to $74,999 | 90 | 18.8% |
| $75,000 to $99,999 | 53 | 11.1% |
| $100,000 to $149,999 | 200 | 41.8% |
| $150,000 to $199,999 | 51 | 10.7% |
| $200,000+ | 28 | 5.9% |
Family Income by Famaliy Size in Kingston
3-person families (121 | 25.3%) account for the highest median family income in Kingston with $126,006 per family, while 2-person families (243 | 50.8%) have the highest median income of $45,208 per family member.
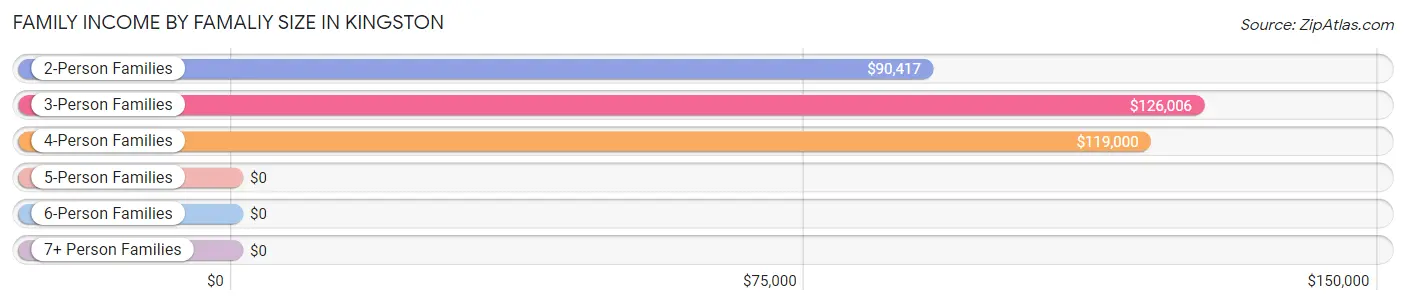
| Income Bracket | # Families | Median Income |
| 2-Person Families | 243 (50.8%) | $90,417 |
| 3-Person Families | 121 (25.3%) | $126,006 |
| 4-Person Families | 110 (23.0%) | $119,000 |
| 5-Person Families | 4 (0.8%) | $0 |
| 6-Person Families | 0 (0.0%) | $0 |
| 7+ Person Families | 0 (0.0%) | $0 |
| Total | 478 (100.0%) | $117,550 |
Family Income by Number of Earners in Kingston
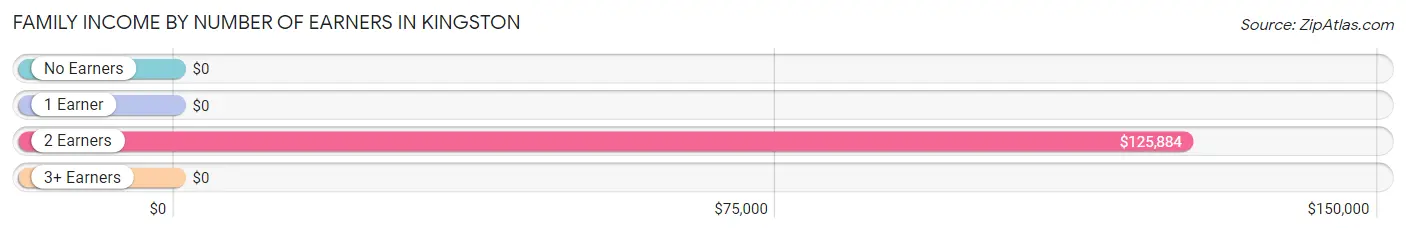
| Number of Earners | # Families | Median Income |
| No Earners | 120 (25.1%) | $0 |
| 1 Earner | 125 (26.2%) | $0 |
| 2 Earners | 221 (46.2%) | $125,884 |
| 3+ Earners | 12 (2.5%) | $0 |
| Total | 478 (100.0%) | $117,550 |
Household Income in Kingston
Household Income Brackets in Kingston
With 211 households falling in the category, the $100,000 to $149,999 income range is the most frequent in Kingston, accounting for 35.6% of all households.
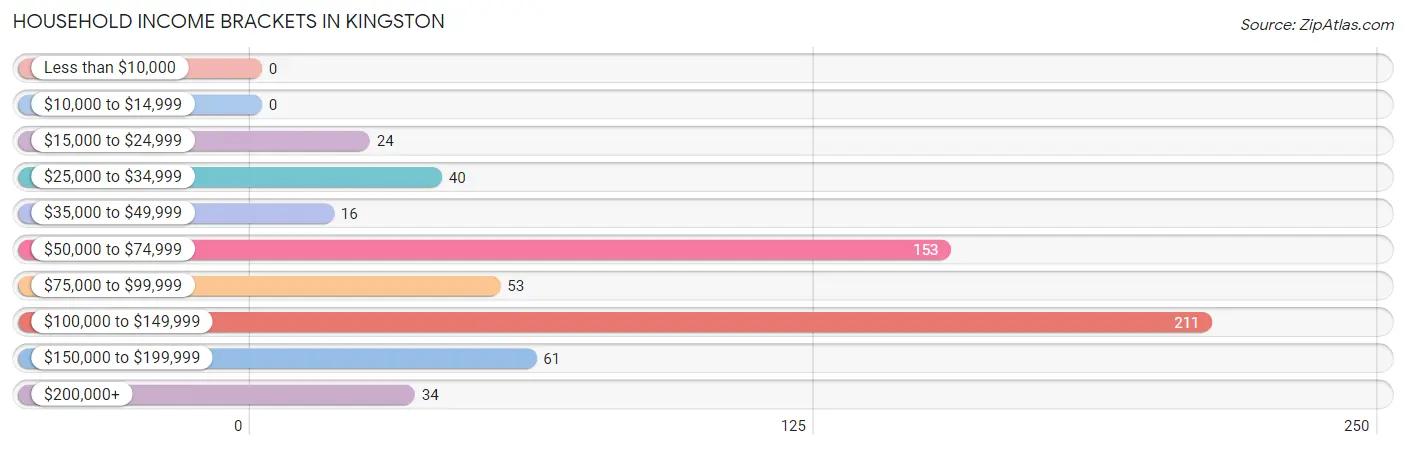
| Income Bracket | # Households | % Households |
| Less than $10,000 | 0 | 0.0% |
| $10,000 to $14,999 | 0 | 0.0% |
| $15,000 to $24,999 | 24 | 4.1% |
| $25,000 to $34,999 | 40 | 6.8% |
| $35,000 to $49,999 | 16 | 2.7% |
| $50,000 to $74,999 | 153 | 25.8% |
| $75,000 to $99,999 | 53 | 9.0% |
| $100,000 to $149,999 | 211 | 35.6% |
| $150,000 to $199,999 | 61 | 10.3% |
| $200,000+ | 34 | 5.7% |
Household Income by Householder Age in Kingston
The median household income in Kingston is $108,056, with the highest median household income of $125,152 found in the 45 to 64 years age bracket for the primary householder. A total of 325 households (54.9%) fall into this category. Meanwhile, the 15 to 24 years age bracket for the primary householder has the lowest median household income of $0, with 12 households (2.0%) in this group.
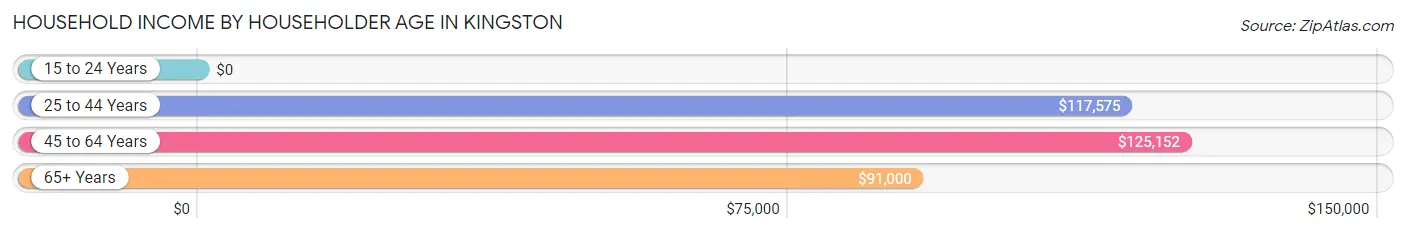
| Income Bracket | # Households | Median Income |
| 15 to 24 Years | 12 (2.0%) | $0 |
| 25 to 44 Years | 97 (16.4%) | $117,575 |
| 45 to 64 Years | 325 (54.9%) | $125,152 |
| 65+ Years | 158 (26.7%) | $91,000 |
| Total | 592 (100.0%) | $108,056 |
Poverty in Kingston
Income Below Poverty by Sex and Age in Kingston
With 3.9% poverty level for males and 2.8% for females among the residents of Kingston, 18 to 24 year old males and 18 to 24 year old females are the most vulnerable to poverty, with 34 males (36.2%) and 16 females (100.0%) in their respective age groups living below the poverty level.
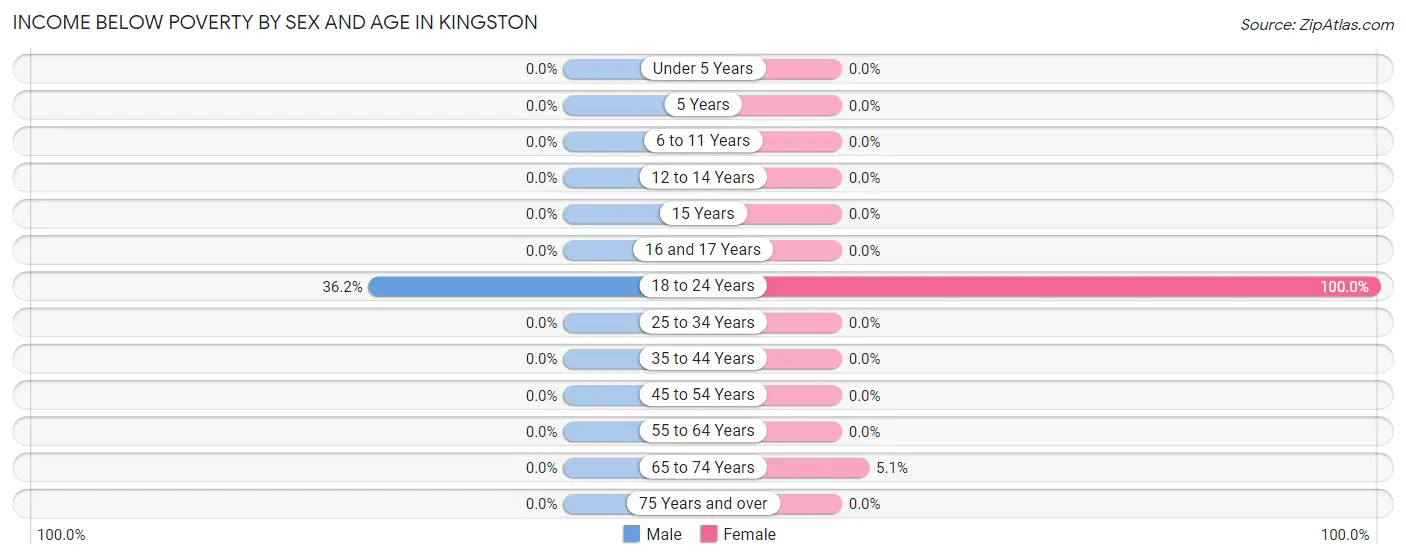
| Age Bracket | Male | Female |
| Under 5 Years | 0 (0.0%) | 0 (0.0%) |
| 5 Years | 0 (0.0%) | 0 (0.0%) |
| 6 to 11 Years | 0 (0.0%) | 0 (0.0%) |
| 12 to 14 Years | 0 (0.0%) | 0 (0.0%) |
| 15 Years | 0 (0.0%) | 0 (0.0%) |
| 16 and 17 Years | 0 (0.0%) | 0 (0.0%) |
| 18 to 24 Years | 34 (36.2%) | 16 (100.0%) |
| 25 to 34 Years | 0 (0.0%) | 0 (0.0%) |
| 35 to 44 Years | 0 (0.0%) | 0 (0.0%) |
| 45 to 54 Years | 0 (0.0%) | 0 (0.0%) |
| 55 to 64 Years | 0 (0.0%) | 0 (0.0%) |
| 65 to 74 Years | 0 (0.0%) | 3 (5.1%) |
| 75 Years and over | 0 (0.0%) | 0 (0.0%) |
| Total | 34 (3.9%) | 19 (2.8%) |
Income Above Poverty by Sex and Age in Kingston
According to the poverty statistics in Kingston, males aged under 5 years and females aged under 5 years are the age groups that are most secure financially, with 100.0% of males and 100.0% of females in these age groups living above the poverty line.
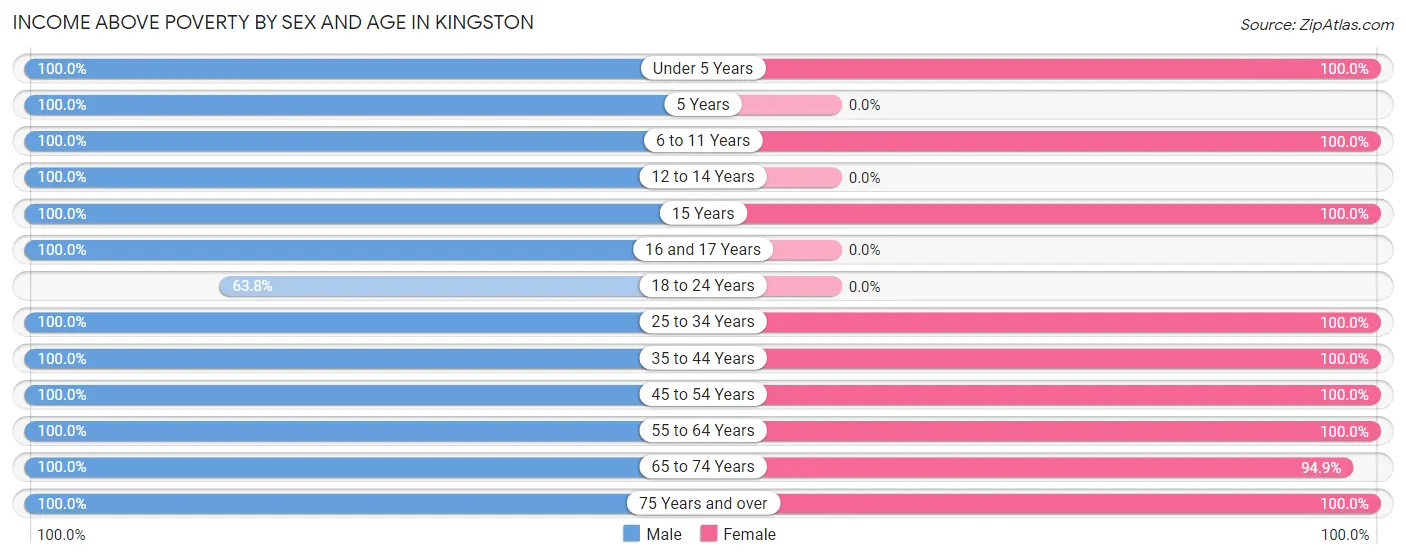
| Age Bracket | Male | Female |
| Under 5 Years | 4 (100.0%) | 47 (100.0%) |
| 5 Years | 51 (100.0%) | 0 (0.0%) |
| 6 to 11 Years | 48 (100.0%) | 52 (100.0%) |
| 12 to 14 Years | 33 (100.0%) | 0 (0.0%) |
| 15 Years | 25 (100.0%) | 1 (100.0%) |
| 16 and 17 Years | 89 (100.0%) | 0 (0.0%) |
| 18 to 24 Years | 60 (63.8%) | 0 (0.0%) |
| 25 to 34 Years | 81 (100.0%) | 20 (100.0%) |
| 35 to 44 Years | 54 (100.0%) | 114 (100.0%) |
| 45 to 54 Years | 213 (100.0%) | 136 (100.0%) |
| 55 to 64 Years | 55 (100.0%) | 133 (100.0%) |
| 65 to 74 Years | 74 (100.0%) | 56 (94.9%) |
| 75 Years and over | 55 (100.0%) | 95 (100.0%) |
| Total | 842 (96.1%) | 654 (97.2%) |
Income Below Poverty Among Married-Couple Families in Kingston
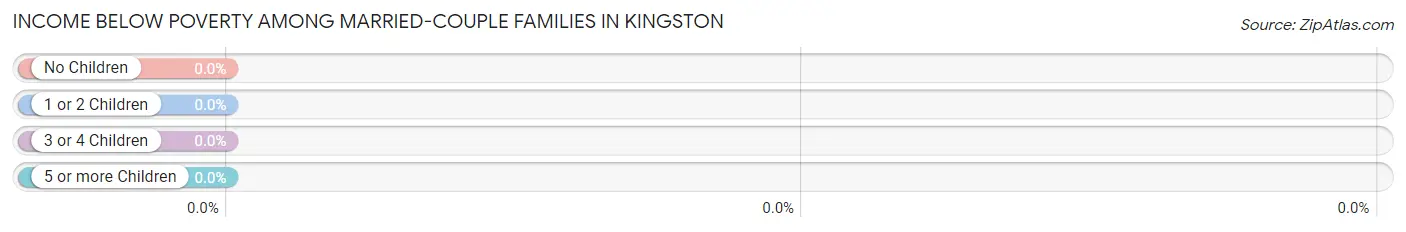
| Children | Above Poverty | Below Poverty |
| No Children | 240 (100.0%) | 0 (0.0%) |
| 1 or 2 Children | 174 (100.0%) | 0 (0.0%) |
| 3 or 4 Children | 0 (0.0%) | 0 (0.0%) |
| 5 or more Children | 0 (0.0%) | 0 (0.0%) |
| Total | 414 (100.0%) | 0 (0.0%) |
Income Below Poverty Among Single-Parent Households in Kingston
| Children | Single Father | Single Mother |
| No Children | 0 (0.0%) | 0 (0.0%) |
| 1 or 2 Children | 0 (0.0%) | 0 (0.0%) |
| 3 or 4 Children | 0 (0.0%) | 0 (0.0%) |
| 5 or more Children | 0 (0.0%) | 0 (0.0%) |
| Total | 0 (0.0%) | 0 (0.0%) |
Income Below Poverty Among Married-Couple vs Single-Parent Households in Kingston
| Children | Married-Couple Families | Single-Parent Households |
| No Children | 0 (0.0%) | 0 (0.0%) |
| 1 or 2 Children | 0 (0.0%) | 0 (0.0%) |
| 3 or 4 Children | 0 (0.0%) | 0 (0.0%) |
| 5 or more Children | 0 (0.0%) | 0 (0.0%) |
| Total | 0 (0.0%) | 0 (0.0%) |
Race in Kingston
The most populous races in Kingston are White / Caucasian (5,522 | 84.2%), Hispanic or Latino (413 | 6.3%), and Two or more Races (364 | 5.6%).
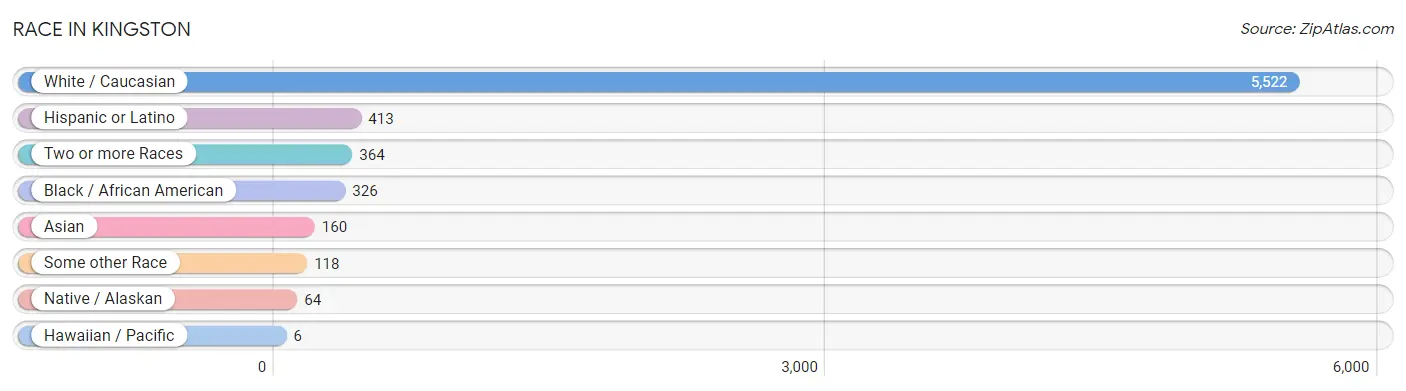
| Race | # Population | % Population |
| Asian | 160 | 2.4% |
| Black / African American | 326 | 5.0% |
| Hawaiian / Pacific | 6 | 0.1% |
| Hispanic or Latino | 413 | 6.3% |
| Native / Alaskan | 64 | 1.0% |
| White / Caucasian | 5,522 | 84.2% |
| Two or more Races | 364 | 5.6% |
| Some other Race | 118 | 1.8% |
| Total | 6,560 | 100.0% |
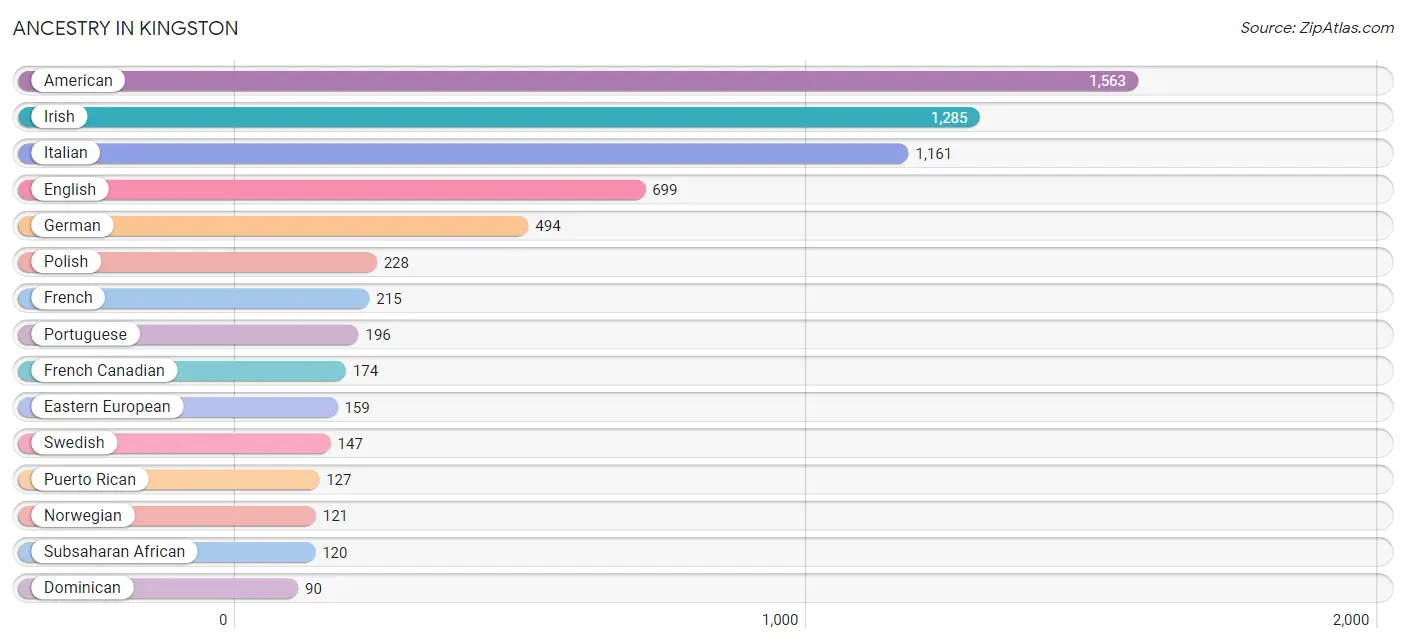
Ancestry in Kingston
The most populous ancestries reported in Kingston are American (1,563 | 23.8%), Irish (1,285 | 19.6%), Italian (1,161 | 17.7%), English (699 | 10.7%), and German (494 | 7.5%), together accounting for 79.3% of all Kingston residents.
| Ancestry | # Population | % Population |
| African | 28 | 0.4% |
| American | 1,563 | 23.8% |
| Arab | 31 | 0.5% |
| Armenian | 30 | 0.5% |
| Austrian | 6 | 0.1% |
| Bhutanese | 28 | 0.4% |
| Blackfeet | 5 | 0.1% |
| Brazilian | 1 | 0.0% |
| British | 18 | 0.3% |
| British West Indian | 8 | 0.1% |
| Burmese | 30 | 0.5% |
| Canadian | 7 | 0.1% |
| Cape Verdean | 32 | 0.5% |
| Central American | 35 | 0.5% |
| Chilean | 8 | 0.1% |
| Croatian | 42 | 0.6% |
| Cuban | 26 | 0.4% |
| Czech | 61 | 0.9% |
| Czechoslovakian | 5 | 0.1% |
| Dominican | 90 | 1.4% |
| Dutch | 11 | 0.2% |
| Eastern European | 159 | 2.4% |
| Ecuadorian | 12 | 0.2% |
| English | 699 | 10.7% |
| European | 34 | 0.5% |
| Filipino | 48 | 0.7% |
| French | 215 | 3.3% |
| French Canadian | 174 | 2.6% |
| German | 494 | 7.5% |
| Greek | 61 | 0.9% |
| Guamanian / Chamorro | 6 | 0.1% |
| Guatemalan | 16 | 0.2% |
| Haitian | 9 | 0.1% |
| Honduran | 12 | 0.2% |
| Hungarian | 21 | 0.3% |
| Icelander | 13 | 0.2% |
| Indian (Asian) | 39 | 0.6% |
| Irish | 1,285 | 19.6% |
| Italian | 1,161 | 17.7% |
| Japanese | 17 | 0.3% |
| Korean | 12 | 0.2% |
| Lebanese | 27 | 0.4% |
| Liberian | 34 | 0.5% |
| Lithuanian | 47 | 0.7% |
| Malaysian | 12 | 0.2% |
| Mexican | 55 | 0.8% |
| Mongolian | 24 | 0.4% |
| Nigerian | 9 | 0.1% |
| Norwegian | 121 | 1.8% |
| Pakistani | 9 | 0.1% |
| Polish | 228 | 3.5% |
| Portuguese | 196 | 3.0% |
| Puerto Rican | 127 | 1.9% |
| Russian | 70 | 1.1% |
| Salvadoran | 7 | 0.1% |
| Scandinavian | 5 | 0.1% |
| Scotch-Irish | 6 | 0.1% |
| Scottish | 56 | 0.9% |
| Senegalese | 17 | 0.3% |
| Serbian | 24 | 0.4% |
| South American | 20 | 0.3% |
| Sri Lankan | 53 | 0.8% |
| Subsaharan African | 120 | 1.8% |
| Swedish | 147 | 2.2% |
| Swiss | 1 | 0.0% |
| Syrian | 4 | 0.1% |
| Thai | 5 | 0.1% |
| Turkish | 17 | 0.3% |
| Ukrainian | 8 | 0.1% |
| Welsh | 1 | 0.0% | View All 70 Rows |
Immigrants in Kingston
The most numerous immigrant groups reported in Kingston came from Asia (96 | 1.5%), Eastern Asia (53 | 0.8%), Latin America (49 | 0.7%), Africa (36 | 0.5%), and China (35 | 0.5%), together accounting for 4.1% of all Kingston residents.
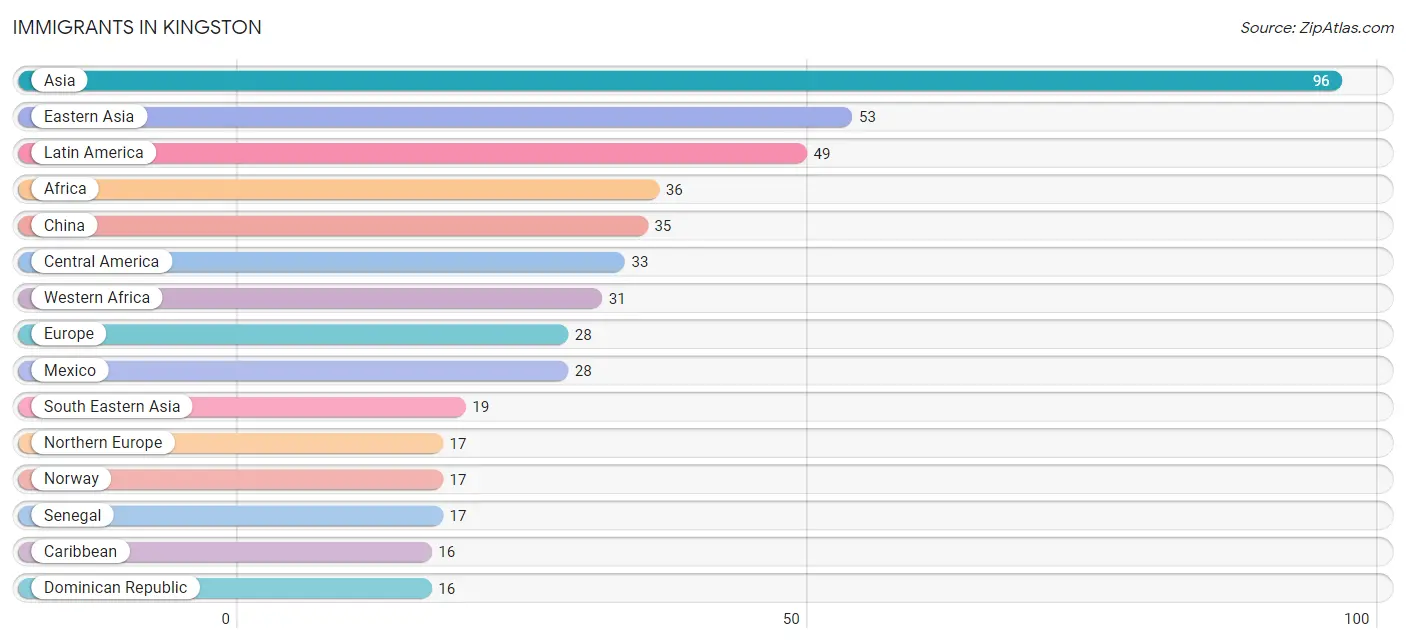
| Immigration Origin | # Population | % Population |
| Africa | 36 | 0.5% |
| Asia | 96 | 1.5% |
| Canada | 7 | 0.1% |
| Caribbean | 16 | 0.2% |
| Central America | 33 | 0.5% |
| China | 35 | 0.5% |
| Dominican Republic | 16 | 0.2% |
| Eastern Africa | 5 | 0.1% |
| Eastern Asia | 53 | 0.8% |
| Europe | 28 | 0.4% |
| Honduras | 5 | 0.1% |
| Indonesia | 12 | 0.2% |
| Italy | 8 | 0.1% |
| Japan | 11 | 0.2% |
| Korea | 7 | 0.1% |
| Latin America | 49 | 0.7% |
| Mexico | 28 | 0.4% |
| Nigeria | 14 | 0.2% |
| Northern Europe | 17 | 0.3% |
| Norway | 17 | 0.3% |
| Pakistan | 7 | 0.1% |
| Philippines | 7 | 0.1% |
| Portugal | 3 | 0.1% |
| Senegal | 17 | 0.3% |
| South Central Asia | 13 | 0.2% |
| South Eastern Asia | 19 | 0.3% |
| Southern Europe | 11 | 0.2% |
| Sri Lanka | 6 | 0.1% |
| Turkey | 11 | 0.2% |
| Western Africa | 31 | 0.5% |
| Western Asia | 11 | 0.2% | View All 31 Rows |
Sex and Age in Kingston
Sex and Age in Kingston
The most populous age groups in Kingston are 15 to 19 Years (1,713 | 58.5%) for men and 15 to 19 Years (2,033 | 56.0%) for women.
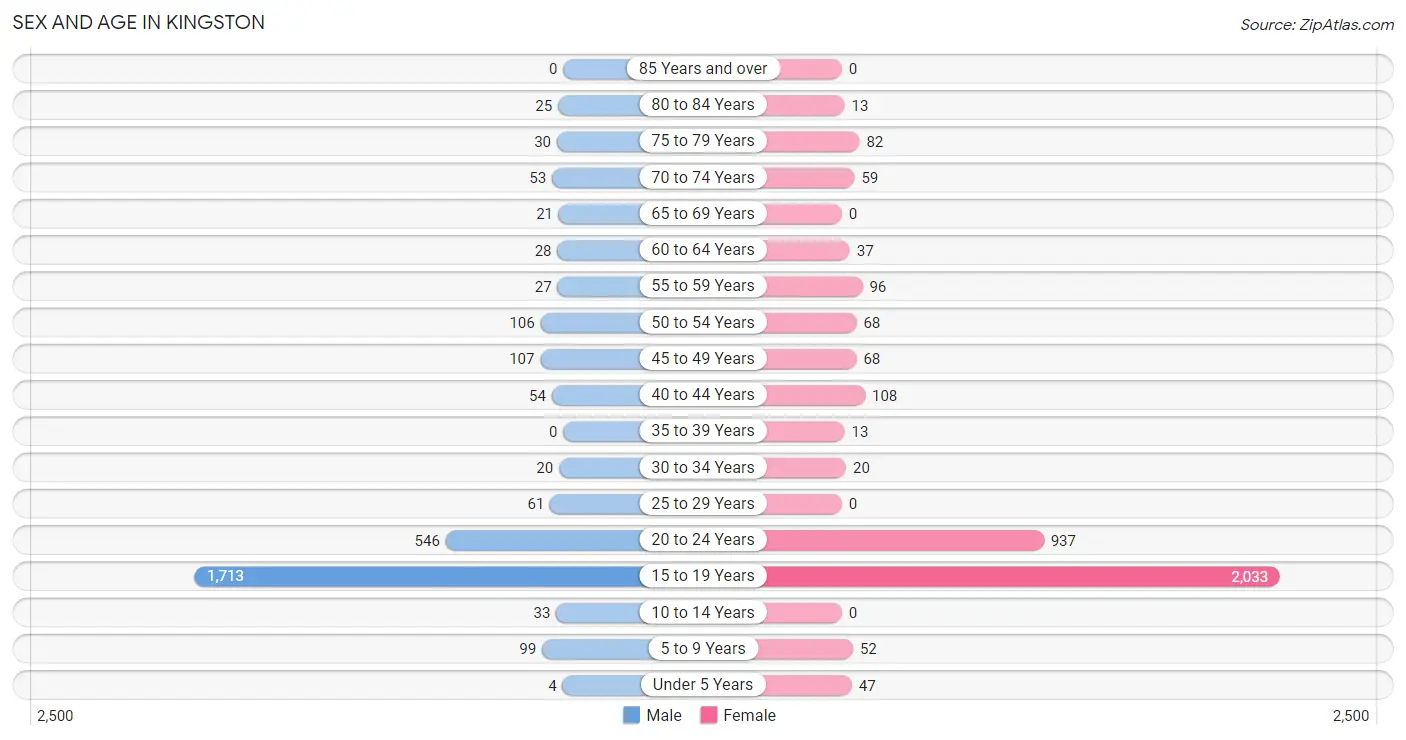
| Age Bracket | Male | Female |
| Under 5 Years | 4 (0.1%) | 47 (1.3%) |
| 5 to 9 Years | 99 (3.4%) | 52 (1.4%) |
| 10 to 14 Years | 33 (1.1%) | 0 (0.0%) |
| 15 to 19 Years | 1,713 (58.5%) | 2,033 (56.0%) |
| 20 to 24 Years | 546 (18.6%) | 937 (25.8%) |
| 25 to 29 Years | 61 (2.1%) | 0 (0.0%) |
| 30 to 34 Years | 20 (0.7%) | 20 (0.5%) |
| 35 to 39 Years | 0 (0.0%) | 13 (0.4%) |
| 40 to 44 Years | 54 (1.8%) | 108 (3.0%) |
| 45 to 49 Years | 107 (3.7%) | 68 (1.9%) |
| 50 to 54 Years | 106 (3.6%) | 68 (1.9%) |
| 55 to 59 Years | 27 (0.9%) | 96 (2.6%) |
| 60 to 64 Years | 28 (1.0%) | 37 (1.0%) |
| 65 to 69 Years | 21 (0.7%) | 0 (0.0%) |
| 70 to 74 Years | 53 (1.8%) | 59 (1.6%) |
| 75 to 79 Years | 30 (1.0%) | 82 (2.3%) |
| 80 to 84 Years | 25 (0.9%) | 13 (0.4%) |
| 85 Years and over | 0 (0.0%) | 0 (0.0%) |
| Total | 2,927 (100.0%) | 3,633 (100.0%) |
Families and Households in Kingston
Median Family Size in Kingston
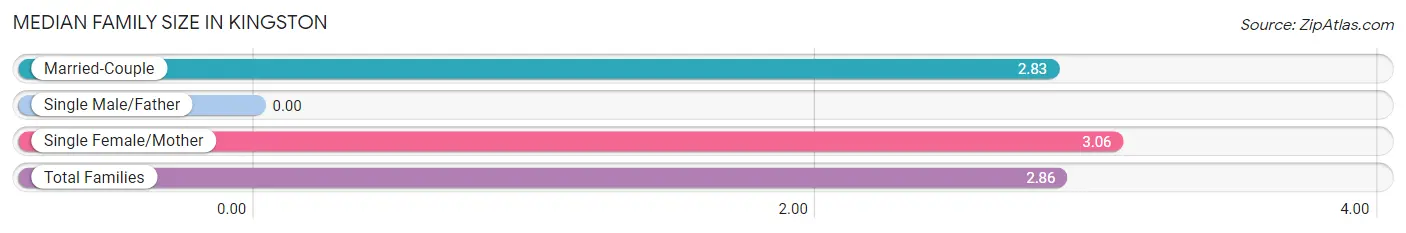
| Family Type | # Families | Family Size |
| Married-Couple | 414 (86.6%) | 2.83 |
| Single Male/Father | 0 (0.0%) | - |
| Single Female/Mother | 64 (13.4%) | 3.06 |
| Total Families | 478 (100.0%) | 2.86 |
Median Household Size in Kingston
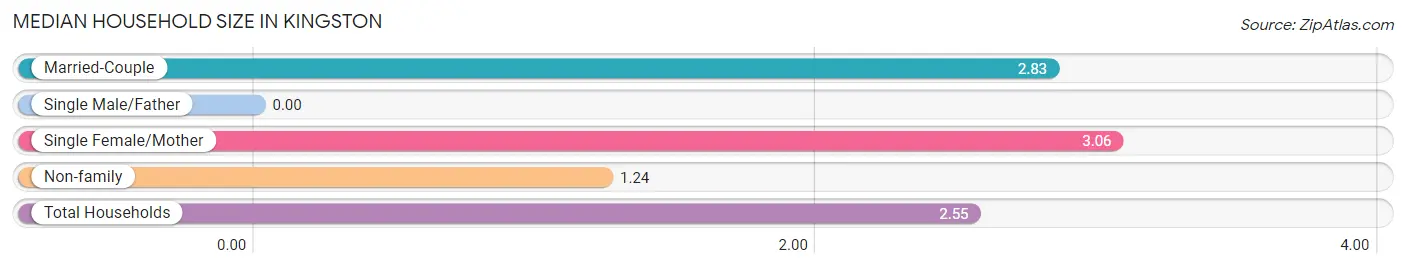
| Household Type | # Households | Household Size |
| Married-Couple | 414 (69.9%) | 2.83 |
| Single Male/Father | 0 (0.0%) | - |
| Single Female/Mother | 64 (10.8%) | 3.06 |
| Non-family | 114 (19.3%) | 1.24 |
| Total Households | 592 (100.0%) | 2.55 |
Household Size by Marriage Status in Kingston
Out of a total of 592 households in Kingston, 478 (80.7%) are family households, while 114 (19.3%) are nonfamily households. The most numerous type of family households are 2-person households, comprising 243, and the most common type of nonfamily households are 1-person households, comprising 91.
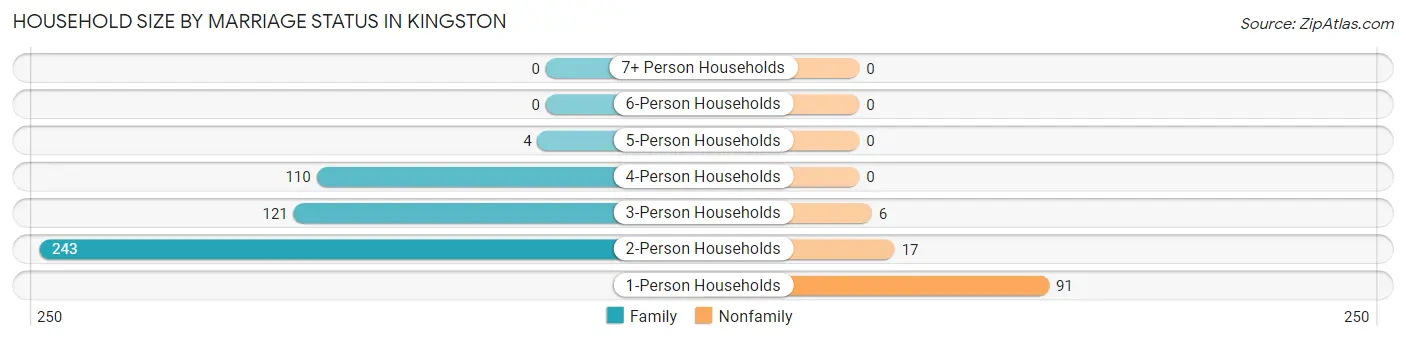
| Household Size | Family Households | Nonfamily Households |
| 1-Person Households | - | 91 (15.4%) |
| 2-Person Households | 243 (41.0%) | 17 (2.9%) |
| 3-Person Households | 121 (20.4%) | 6 (1.0%) |
| 4-Person Households | 110 (18.6%) | 0 (0.0%) |
| 5-Person Households | 4 (0.7%) | 0 (0.0%) |
| 6-Person Households | 0 (0.0%) | 0 (0.0%) |
| 7+ Person Households | 0 (0.0%) | 0 (0.0%) |
| Total | 478 (80.7%) | 114 (19.3%) |
Female Fertility in Kingston
Fertility by Age in Kingston
| Age Bracket | Women with Births | Births / 1,000 Women |
| 15 to 19 years | 0 (0.0%) | 0.0 |
| 20 to 34 years | 0 (0.0%) | 0.0 |
| 35 to 50 years | 0 (0.0%) | 0.0 |
| Total | 0 (0.0%) | 0.0 |
Fertility by Age by Marriage Status in Kingston
| Age Bracket | Married | Unmarried |
| 15 to 19 years | 0 (0.0%) | 0 (0.0%) |
| 20 to 34 years | 0 (0.0%) | 0 (0.0%) |
| 35 to 50 years | 0 (0.0%) | 0 (0.0%) |
| Total | 0 (0.0%) | 0 (0.0%) |
Fertility by Education in Kingston
| Educational Attainment | Women with Births | Births / 1,000 Women |
| Less than High School | 0 (0.0%) | 0.0 |
| High School Diploma | 0 (0.0%) | 0.0 |
| College or Associate's Degree | 0 (0.0%) | 0.0 |
| Bachelor's Degree | 0 (0.0%) | 0.0 |
| Graduate Degree | 0 (0.0%) | 0.0 |
| Total | 0 (0.0%) | 0.0 |
Fertility by Education by Marriage Status in Kingston
| Educational Attainment | Married | Unmarried |
| Less than High School | 0 (0.0%) | 0 (0.0%) |
| High School Diploma | 0 (0.0%) | 0 (0.0%) |
| College or Associate's Degree | 0 (0.0%) | 0 (0.0%) |
| Bachelor's Degree | 0 (0.0%) | 0 (0.0%) |
| Graduate Degree | 0 (0.0%) | 0 (0.0%) |
| Total | 0 (0.0%) | 0 (0.0%) |
Employment Characteristics in Kingston
Employment by Class of Employer in Kingston
Among the 1,948 employed individuals in Kingston, private company employees (1,193 | 61.2%), state government employees (355 | 18.2%), and not-for-profit organizations (188 | 9.7%) make up the most common classes of employment.
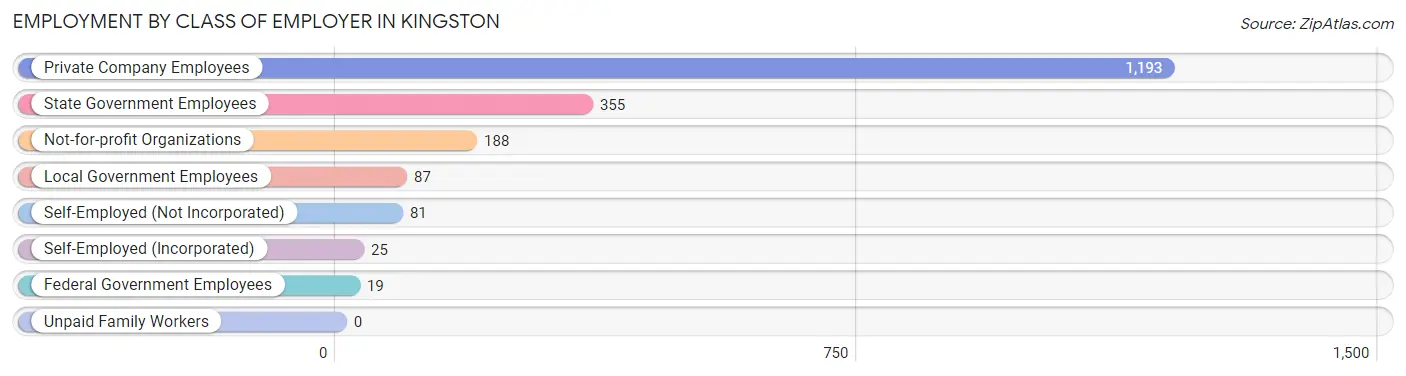
| Employer Class | # Employees | % Employees |
| Private Company Employees | 1,193 | 61.2% |
| Self-Employed (Incorporated) | 25 | 1.3% |
| Self-Employed (Not Incorporated) | 81 | 4.2% |
| Not-for-profit Organizations | 188 | 9.7% |
| Local Government Employees | 87 | 4.5% |
| State Government Employees | 355 | 18.2% |
| Federal Government Employees | 19 | 1.0% |
| Unpaid Family Workers | 0 | 0.0% |
| Total | 1,948 | 100.0% |
Employment Status by Age in Kingston
According to the labor force statistics for Kingston, out of the total population over 16 years of age (6,299), 38.9% or 2,450 individuals are in the labor force, with 11.0% or 270 of them unemployed. The age group with the highest labor force participation rate is 30 to 34 years, with 100.0% or 40 individuals in the labor force. Within the labor force, the 25 to 29 years age range has the highest percentage of unemployed individuals, with 38.0% or 19 of them being unemployed.
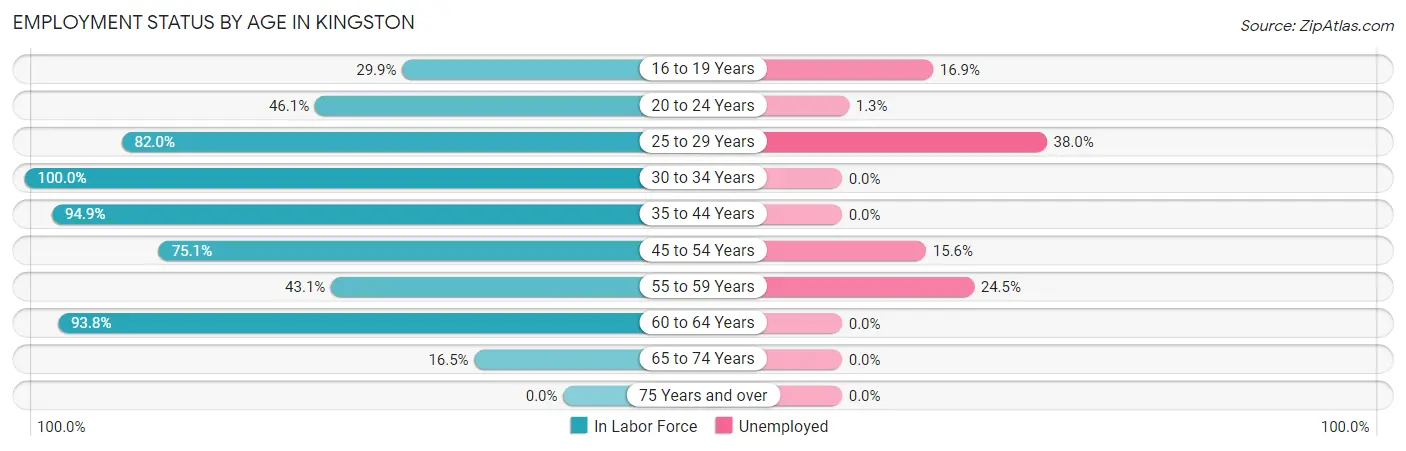
| Age Bracket | In Labor Force | Unemployed |
| 16 to 19 Years | 1,112 (29.9%) | 188 (16.9%) |
| 20 to 24 Years | 684 (46.1%) | 9 (1.3%) |
| 25 to 29 Years | 50 (82.0%) | 19 (38.0%) |
| 30 to 34 Years | 40 (100.0%) | 0 (0.0%) |
| 35 to 44 Years | 166 (94.9%) | 0 (0.0%) |
| 45 to 54 Years | 262 (75.1%) | 41 (15.6%) |
| 55 to 59 Years | 53 (43.1%) | 13 (24.5%) |
| 60 to 64 Years | 61 (93.8%) | 0 (0.0%) |
| 65 to 74 Years | 22 (16.5%) | 0 (0.0%) |
| 75 Years and over | 0 (0.0%) | 0 (0.0%) |
| Total | 2,450 (38.9%) | 270 (11.0%) |
Employment Status by Educational Attainment in Kingston
According to labor force statistics for Kingston, 77.7% of individuals (632) out of the total population between 25 and 64 years of age (813) are in the labor force, with 11.6% or 73 of them being unemployed. The group with the highest labor force participation rate are those with the educational attainment of college / associate degree, with 79.9% or 111 individuals in the labor force. Within the labor force, individuals with high school diploma education have the highest percentage of unemployment, with 100.0% or 19 of them being unemployed.
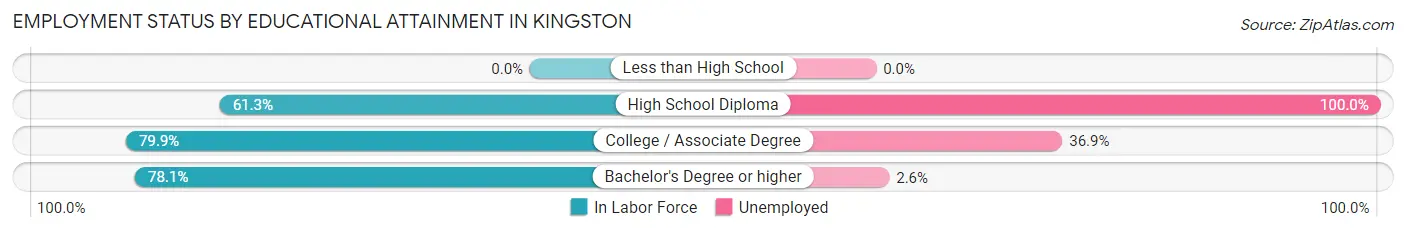
| Educational Attainment | In Labor Force | Unemployed |
| Less than High School | 0 (0.0%) | 0 (0.0%) |
| High School Diploma | 19 (61.3%) | 31 (100.0%) |
| College / Associate Degree | 111 (79.9%) | 51 (36.9%) |
| Bachelor's Degree or higher | 502 (78.1%) | 17 (2.6%) |
| Total | 632 (77.7%) | 94 (11.6%) |
Employment Occupations by Sex in Kingston
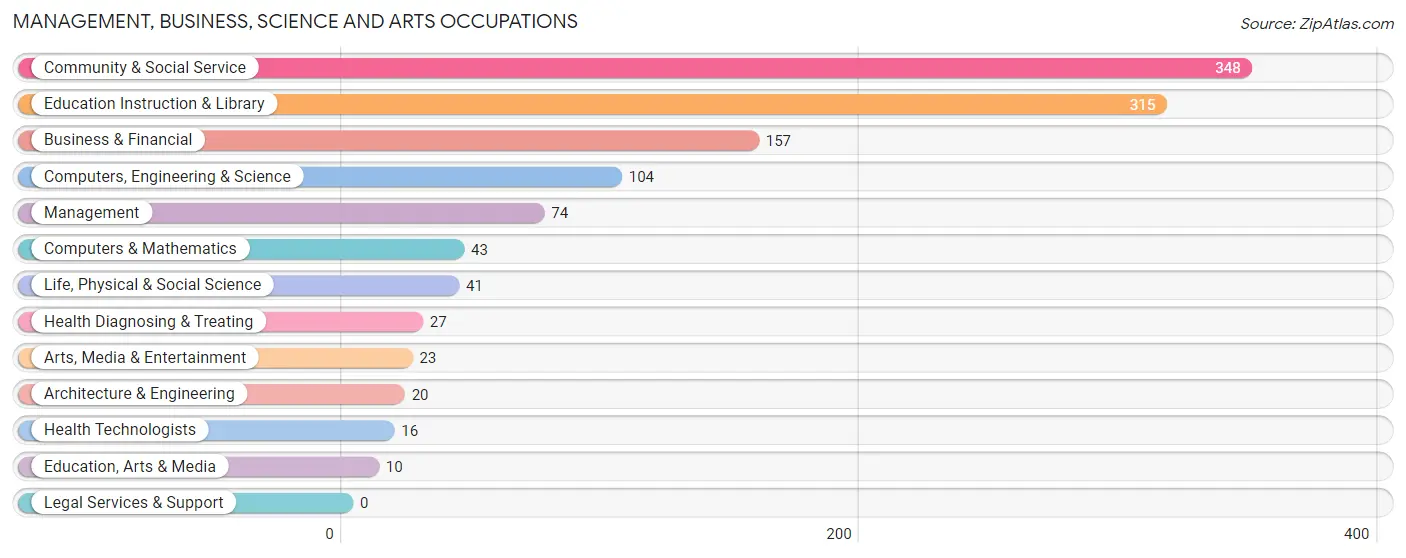
Management, Business, Science and Arts Occupations
The most common Management, Business, Science and Arts occupations in Kingston are Community & Social Service (348 | 16.0%), Education Instruction & Library (315 | 14.4%), Business & Financial (157 | 7.2%), Computers, Engineering & Science (104 | 4.8%), and Management (74 | 3.4%).
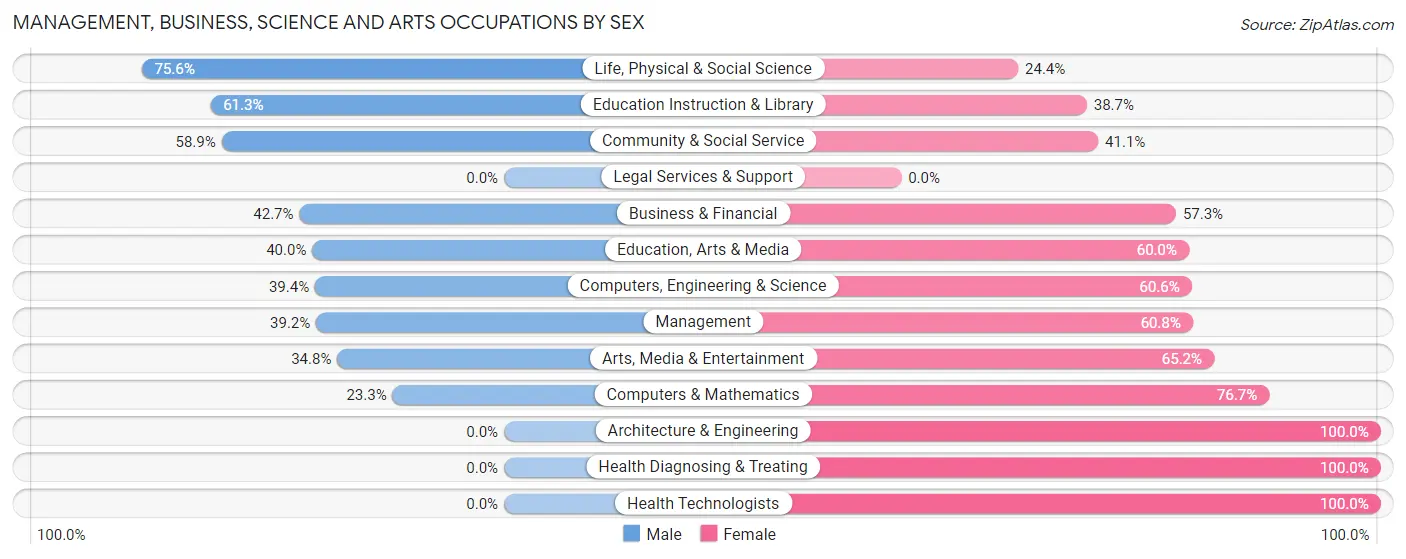
Management, Business, Science and Arts Occupations by Sex
Within the Management, Business, Science and Arts occupations in Kingston, the most male-oriented occupations are Life, Physical & Social Science (75.6%), Education Instruction & Library (61.3%), and Community & Social Service (58.9%), while the most female-oriented occupations are Architecture & Engineering (100.0%), Health Diagnosing & Treating (100.0%), and Health Technologists (100.0%).
| Occupation | Male | Female |
| Management | 29 (39.2%) | 45 (60.8%) |
| Business & Financial | 67 (42.7%) | 90 (57.3%) |
| Computers, Engineering & Science | 41 (39.4%) | 63 (60.6%) |
| Computers & Mathematics | 10 (23.3%) | 33 (76.7%) |
| Architecture & Engineering | 0 (0.0%) | 20 (100.0%) |
| Life, Physical & Social Science | 31 (75.6%) | 10 (24.4%) |
| Community & Social Service | 205 (58.9%) | 143 (41.1%) |
| Education, Arts & Media | 4 (40.0%) | 6 (60.0%) |
| Legal Services & Support | 0 (0.0%) | 0 (0.0%) |
| Education Instruction & Library | 193 (61.3%) | 122 (38.7%) |
| Arts, Media & Entertainment | 8 (34.8%) | 15 (65.2%) |
| Health Diagnosing & Treating | 0 (0.0%) | 27 (100.0%) |
| Health Technologists | 0 (0.0%) | 16 (100.0%) |
| Total (Category) | 342 (48.2%) | 368 (51.8%) |
| Total (Overall) | 819 (37.6%) | 1,361 (62.4%) |
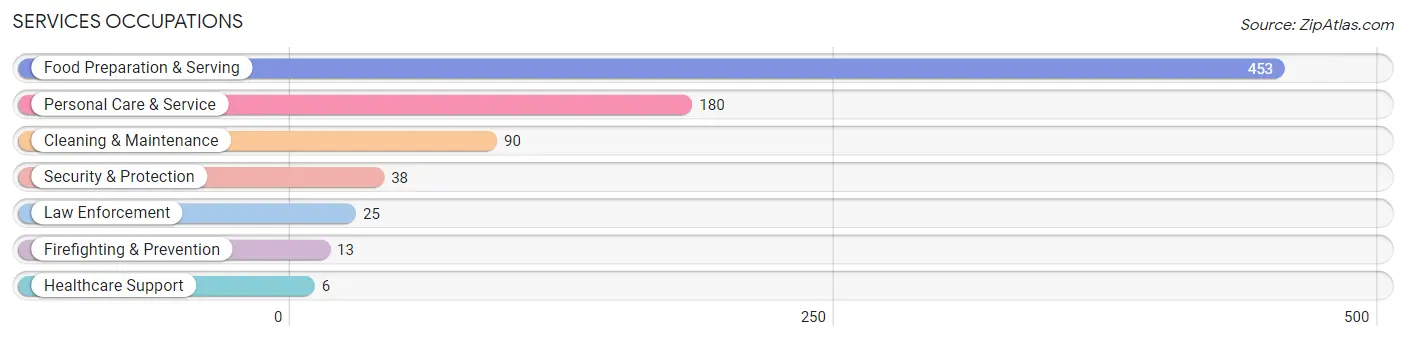
Services Occupations
The most common Services occupations in Kingston are Food Preparation & Serving (453 | 20.8%), Personal Care & Service (180 | 8.3%), Cleaning & Maintenance (90 | 4.1%), Security & Protection (38 | 1.7%), and Law Enforcement (25 | 1.1%).
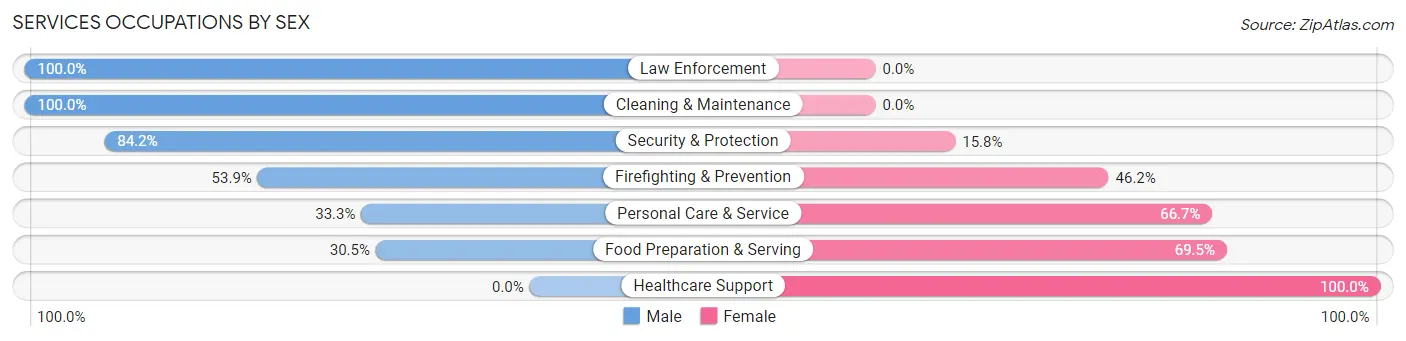
Services Occupations by Sex
Within the Services occupations in Kingston, the most male-oriented occupations are Law Enforcement (100.0%), Cleaning & Maintenance (100.0%), and Security & Protection (84.2%), while the most female-oriented occupations are Healthcare Support (100.0%), Food Preparation & Serving (69.5%), and Personal Care & Service (66.7%).
| Occupation | Male | Female |
| Healthcare Support | 0 (0.0%) | 6 (100.0%) |
| Security & Protection | 32 (84.2%) | 6 (15.8%) |
| Firefighting & Prevention | 7 (53.8%) | 6 (46.2%) |
| Law Enforcement | 25 (100.0%) | 0 (0.0%) |
| Food Preparation & Serving | 138 (30.5%) | 315 (69.5%) |
| Cleaning & Maintenance | 90 (100.0%) | 0 (0.0%) |
| Personal Care & Service | 60 (33.3%) | 120 (66.7%) |
| Total (Category) | 320 (41.7%) | 447 (58.3%) |
| Total (Overall) | 819 (37.6%) | 1,361 (62.4%) |
Sales and Office Occupations
The most common Sales and Office occupations in Kingston are Sales & Related (352 | 16.2%), and Office & Administration (192 | 8.8%).
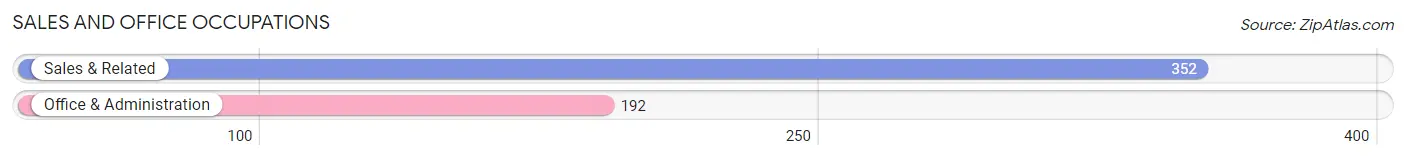
Sales and Office Occupations by Sex
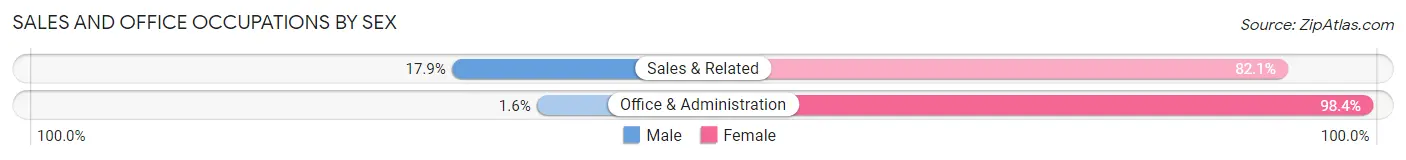
| Occupation | Male | Female |
| Sales & Related | 63 (17.9%) | 289 (82.1%) |
| Office & Administration | 3 (1.6%) | 189 (98.4%) |
| Total (Category) | 66 (12.1%) | 478 (87.9%) |
| Total (Overall) | 819 (37.6%) | 1,361 (62.4%) |
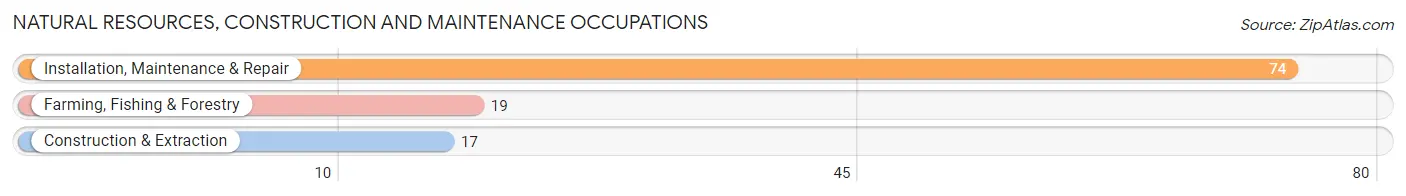
Natural Resources, Construction and Maintenance Occupations
The most common Natural Resources, Construction and Maintenance occupations in Kingston are Installation, Maintenance & Repair (74 | 3.4%), Farming, Fishing & Forestry (19 | 0.9%), and Construction & Extraction (17 | 0.8%).
Natural Resources, Construction and Maintenance Occupations by Sex
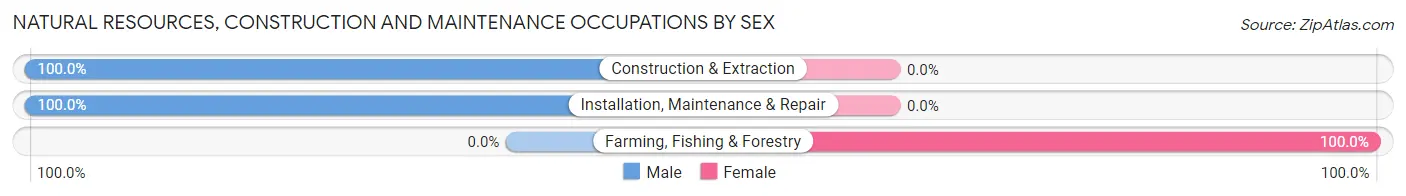
| Occupation | Male | Female |
| Farming, Fishing & Forestry | 0 (0.0%) | 19 (100.0%) |
| Construction & Extraction | 17 (100.0%) | 0 (0.0%) |
| Installation, Maintenance & Repair | 74 (100.0%) | 0 (0.0%) |
| Total (Category) | 91 (82.7%) | 19 (17.3%) |
| Total (Overall) | 819 (37.6%) | 1,361 (62.4%) |
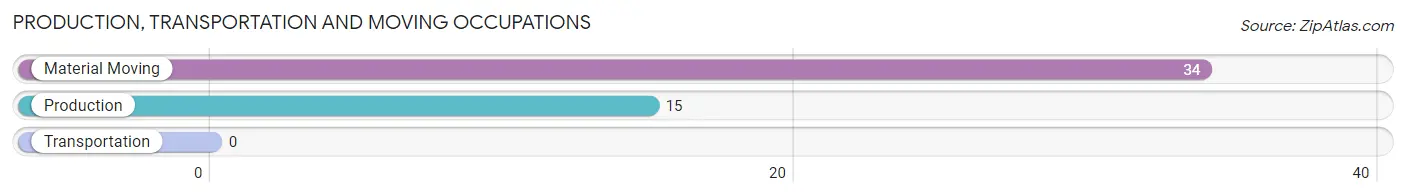
Production, Transportation and Moving Occupations
The most common Production, Transportation and Moving occupations in Kingston are Material Moving (34 | 1.6%), and Production (15 | 0.7%).
Production, Transportation and Moving Occupations by Sex
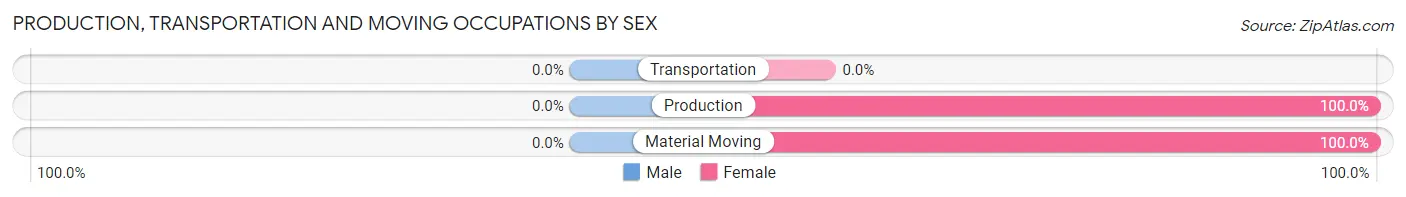
| Occupation | Male | Female |
| Production | 0 (0.0%) | 15 (100.0%) |
| Transportation | 0 (0.0%) | 0 (0.0%) |
| Material Moving | 0 (0.0%) | 34 (100.0%) |
| Total (Category) | 0 (0.0%) | 49 (100.0%) |
| Total (Overall) | 819 (37.6%) | 1,361 (62.4%) |
Employment Industries by Sex in Kingston
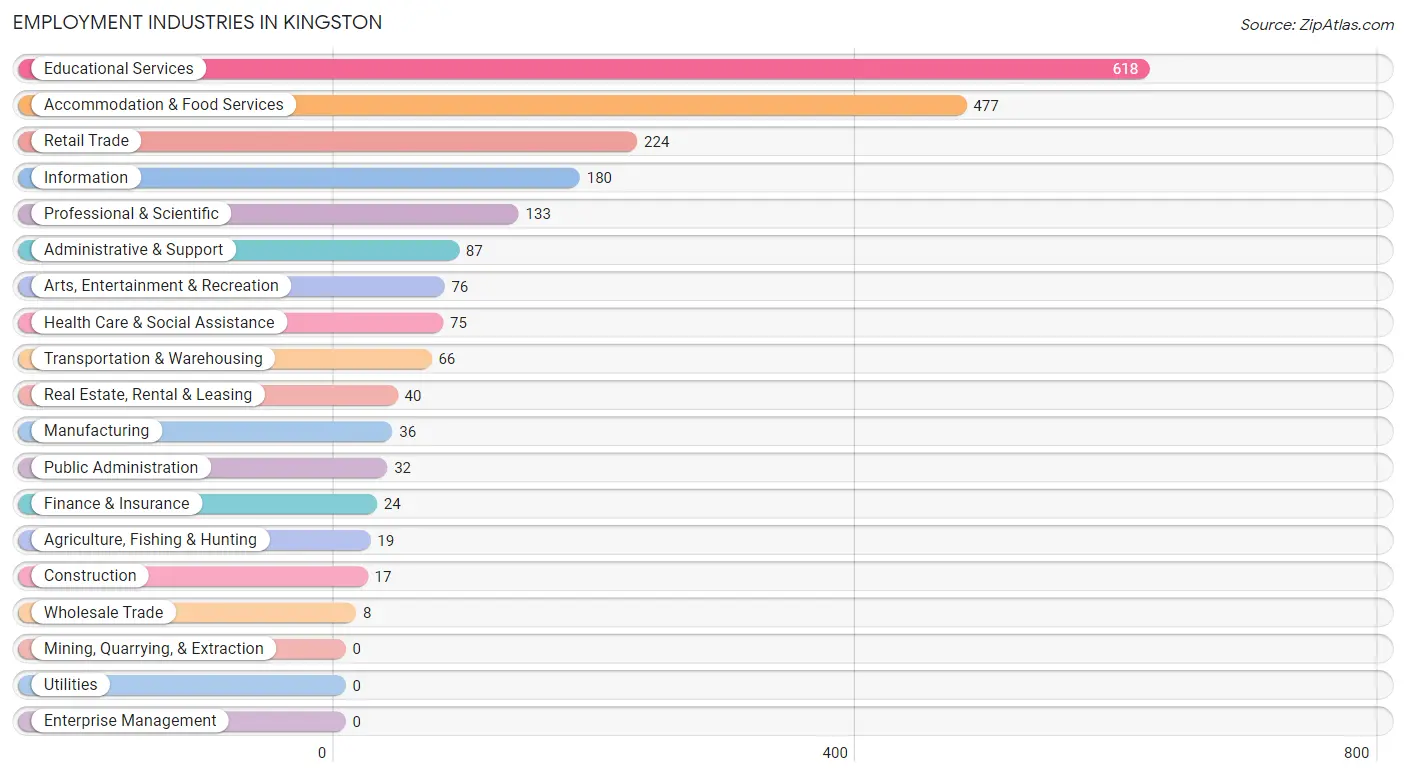
Employment Industries in Kingston
The major employment industries in Kingston include Educational Services (618 | 28.3%), Accommodation & Food Services (477 | 21.9%), Retail Trade (224 | 10.3%), Information (180 | 8.3%), and Professional & Scientific (133 | 6.1%).
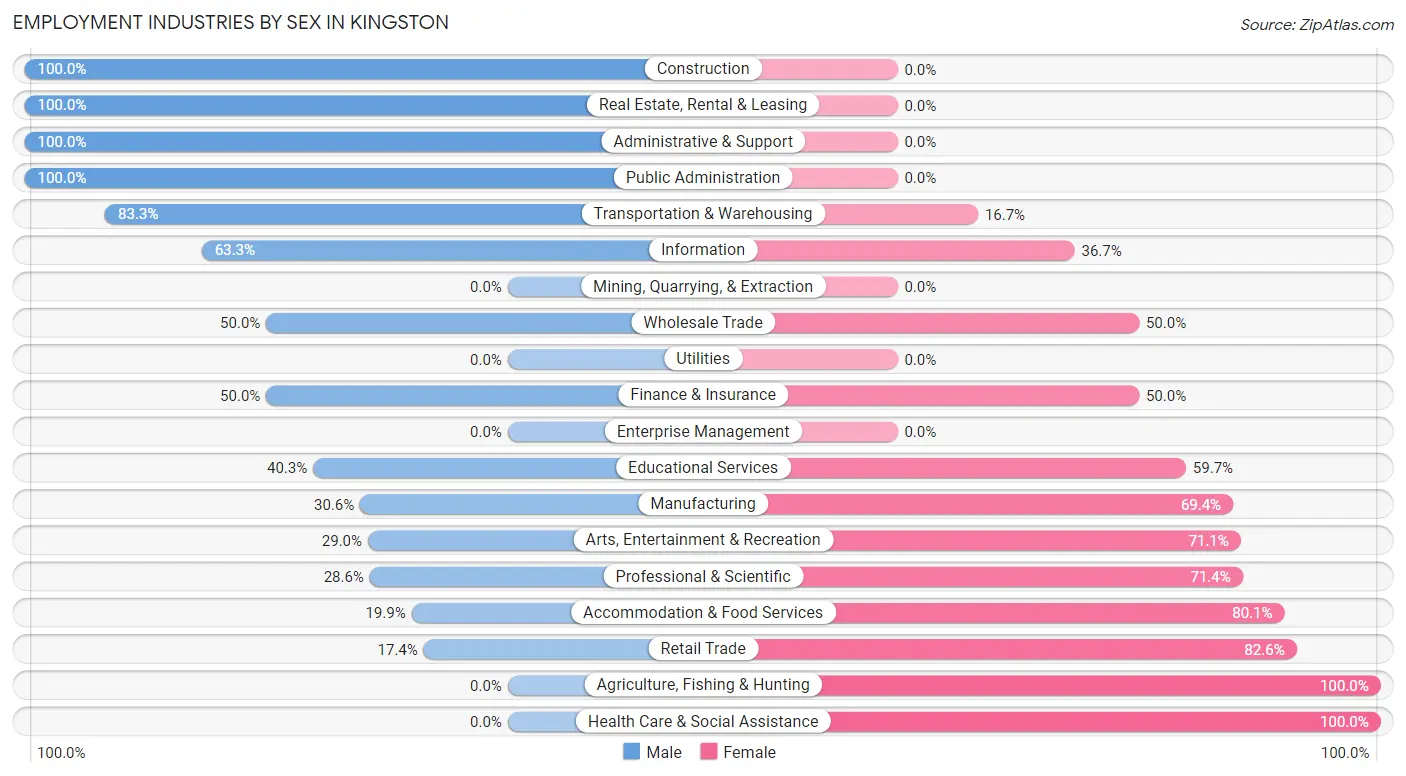
Employment Industries by Sex in Kingston
The Kingston industries that see more men than women are Construction (100.0%), Real Estate, Rental & Leasing (100.0%), and Administrative & Support (100.0%), whereas the industries that tend to have a higher number of women are Agriculture, Fishing & Hunting (100.0%), Health Care & Social Assistance (100.0%), and Retail Trade (82.6%).
| Industry | Male | Female |
| Agriculture, Fishing & Hunting | 0 (0.0%) | 19 (100.0%) |
| Mining, Quarrying, & Extraction | 0 (0.0%) | 0 (0.0%) |
| Construction | 17 (100.0%) | 0 (0.0%) |
| Manufacturing | 11 (30.6%) | 25 (69.4%) |
| Wholesale Trade | 4 (50.0%) | 4 (50.0%) |
| Retail Trade | 39 (17.4%) | 185 (82.6%) |
| Transportation & Warehousing | 55 (83.3%) | 11 (16.7%) |
| Utilities | 0 (0.0%) | 0 (0.0%) |
| Information | 114 (63.3%) | 66 (36.7%) |
| Finance & Insurance | 12 (50.0%) | 12 (50.0%) |
| Real Estate, Rental & Leasing | 40 (100.0%) | 0 (0.0%) |
| Professional & Scientific | 38 (28.6%) | 95 (71.4%) |
| Enterprise Management | 0 (0.0%) | 0 (0.0%) |
| Administrative & Support | 87 (100.0%) | 0 (0.0%) |
| Educational Services | 249 (40.3%) | 369 (59.7%) |
| Health Care & Social Assistance | 0 (0.0%) | 75 (100.0%) |
| Arts, Entertainment & Recreation | 22 (28.9%) | 54 (71.1%) |
| Accommodation & Food Services | 95 (19.9%) | 382 (80.1%) |
| Public Administration | 32 (100.0%) | 0 (0.0%) |
| Total | 819 (37.6%) | 1,361 (62.4%) |
Education in Kingston
School Enrollment in Kingston
The most common levels of schooling among the 5,482 students in Kingston are college / undergraduate (5,013 | 91.4%), high school (205 | 3.7%), and elementary school (100 | 1.8%).
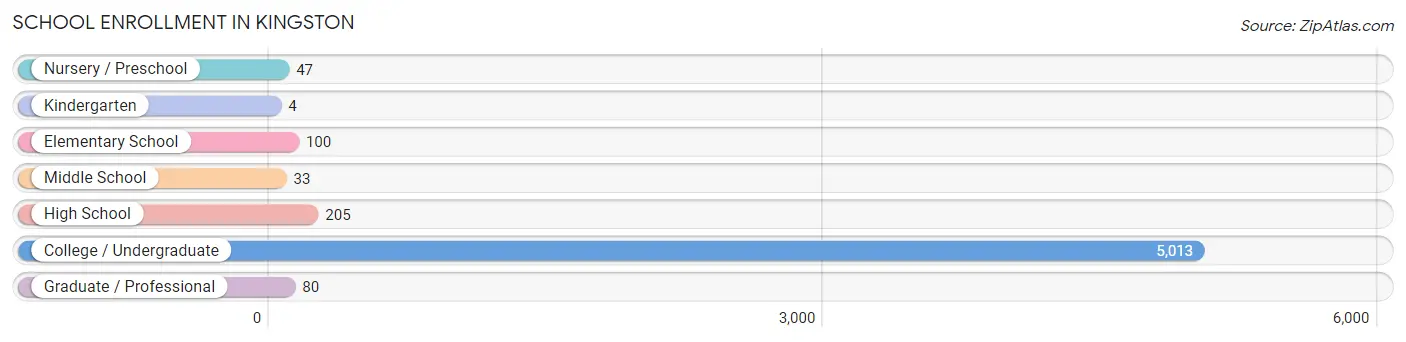
| School Level | # Students | % Students |
| Nursery / Preschool | 47 | 0.9% |
| Kindergarten | 4 | 0.1% |
| Elementary School | 100 | 1.8% |
| Middle School | 33 | 0.6% |
| High School | 205 | 3.7% |
| College / Undergraduate | 5,013 | 91.4% |
| Graduate / Professional | 80 | 1.5% |
| Total | 5,482 | 100.0% |
School Enrollment by Age by Funding Source in Kingston
Out of a total of 5,482 students who are enrolled in schools in Kingston, 126 (2.3%) attend a private institution, while the remaining 5,356 (97.7%) are enrolled in public schools. The age group of 35 years and over has the highest likelihood of being enrolled in private schools, with 4 (7.1% in the age bracket) enrolled. Conversely, the age group of 5 to 9 year old has the lowest likelihood of being enrolled in a private school, with 151 (100.0% in the age bracket) attending a public institution.
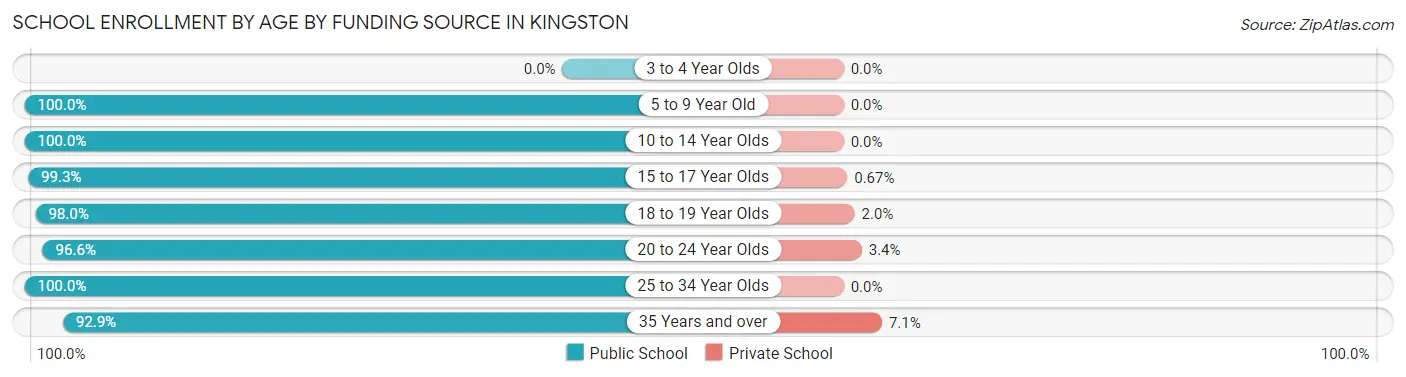
| Age Bracket | Public School | Private School |
| 3 to 4 Year Olds | 0 (0.0%) | 0 (0.0%) |
| 5 to 9 Year Old | 151 (100.0%) | 0 (0.0%) |
| 10 to 14 Year Olds | 33 (100.0%) | 0 (0.0%) |
| 15 to 17 Year Olds | 149 (99.3%) | 1 (0.7%) |
| 18 to 19 Year Olds | 3,523 (98.0%) | 73 (2.0%) |
| 20 to 24 Year Olds | 1,433 (96.6%) | 50 (3.4%) |
| 25 to 34 Year Olds | 13 (100.0%) | 0 (0.0%) |
| 35 Years and over | 52 (92.9%) | 4 (7.1%) |
| Total | 5,356 (97.7%) | 126 (2.3%) |
Educational Attainment by Field of Study in Kingston
Literature & languages (165 | 17.6%), education (130 | 13.9%), social sciences (97 | 10.4%), business (93 | 10.0%), and visual & performing arts (84 | 9.0%) are the most common fields of study among 935 individuals in Kingston who have obtained a bachelor's degree or higher.
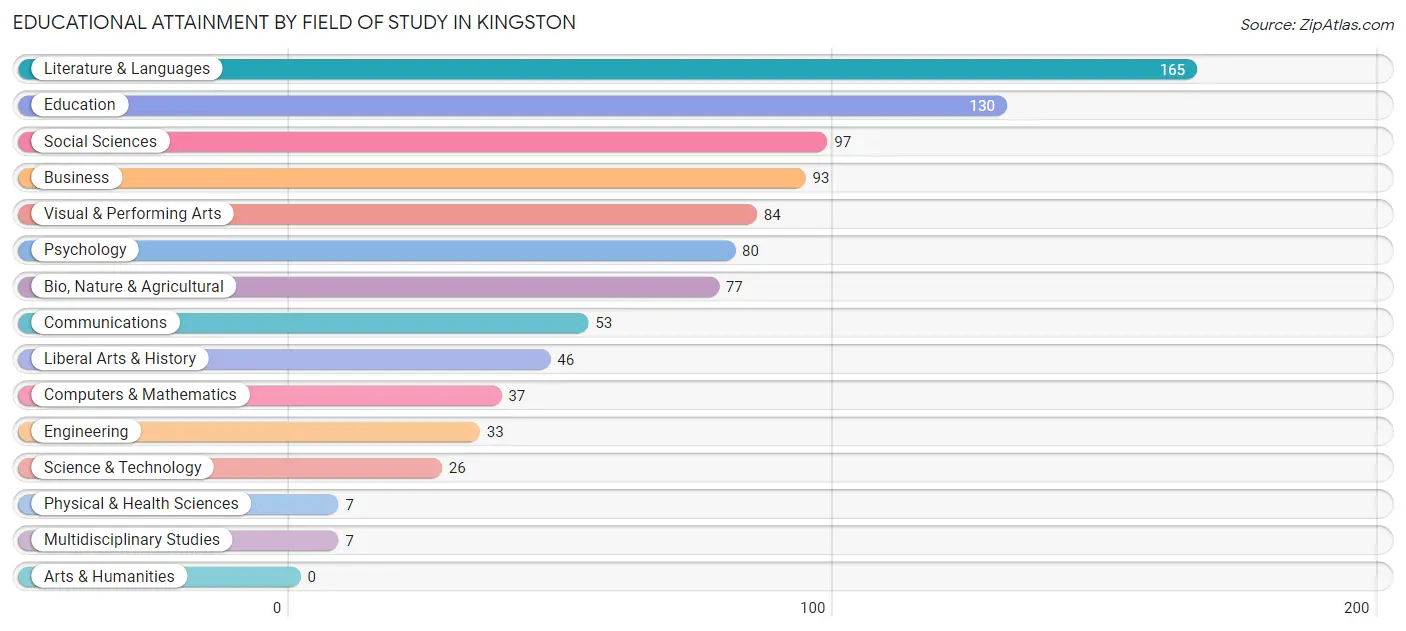
| Field of Study | # Graduates | % Graduates |
| Computers & Mathematics | 37 | 4.0% |
| Bio, Nature & Agricultural | 77 | 8.2% |
| Physical & Health Sciences | 7 | 0.7% |
| Psychology | 80 | 8.6% |
| Social Sciences | 97 | 10.4% |
| Engineering | 33 | 3.5% |
| Multidisciplinary Studies | 7 | 0.7% |
| Science & Technology | 26 | 2.8% |
| Business | 93 | 10.0% |
| Education | 130 | 13.9% |
| Literature & Languages | 165 | 17.6% |
| Liberal Arts & History | 46 | 4.9% |
| Visual & Performing Arts | 84 | 9.0% |
| Communications | 53 | 5.7% |
| Arts & Humanities | 0 | 0.0% |
| Total | 935 | 100.0% |
Transportation & Commute in Kingston
Vehicle Availability by Sex in Kingston
The most prevalent vehicle ownership categories in Kingston are males with 2 vehicles (208, accounting for 62.3%) and females with 2 vehicles (179, making up 86.3%).
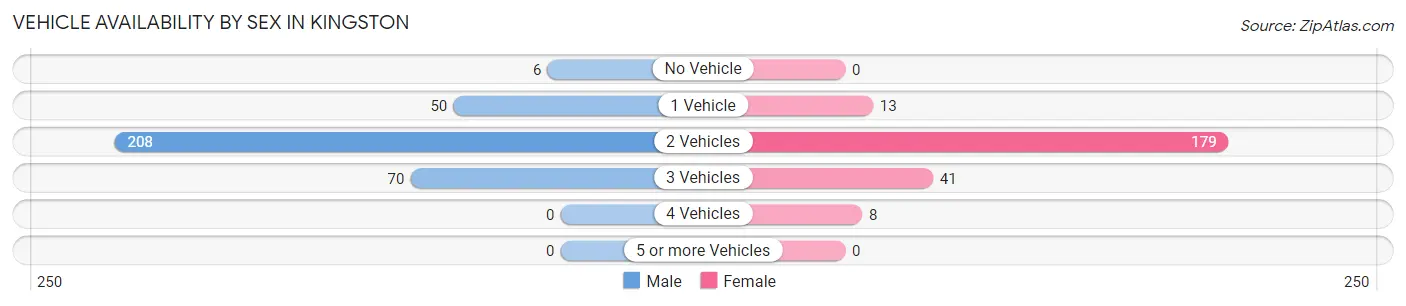
| Vehicles Available | Male | Female |
| No Vehicle | 6 (1.8%) | 0 (0.0%) |
| 1 Vehicle | 50 (15.0%) | 13 (5.4%) |
| 2 Vehicles | 208 (62.3%) | 179 (74.3%) |
| 3 Vehicles | 70 (21.0%) | 41 (17.0%) |
| 4 Vehicles | 0 (0.0%) | 8 (3.3%) |
| 5 or more Vehicles | 0 (0.0%) | 0 (0.0%) |
| Total | 334 (100.0%) | 241 (100.0%) |
Commute Time in Kingston
The most frequently occuring commute durations in Kingston are 5 to 9 minutes (439 commuters, 26.6%), 15 to 19 minutes (359 commuters, 21.8%), and 10 to 14 minutes (285 commuters, 17.3%).
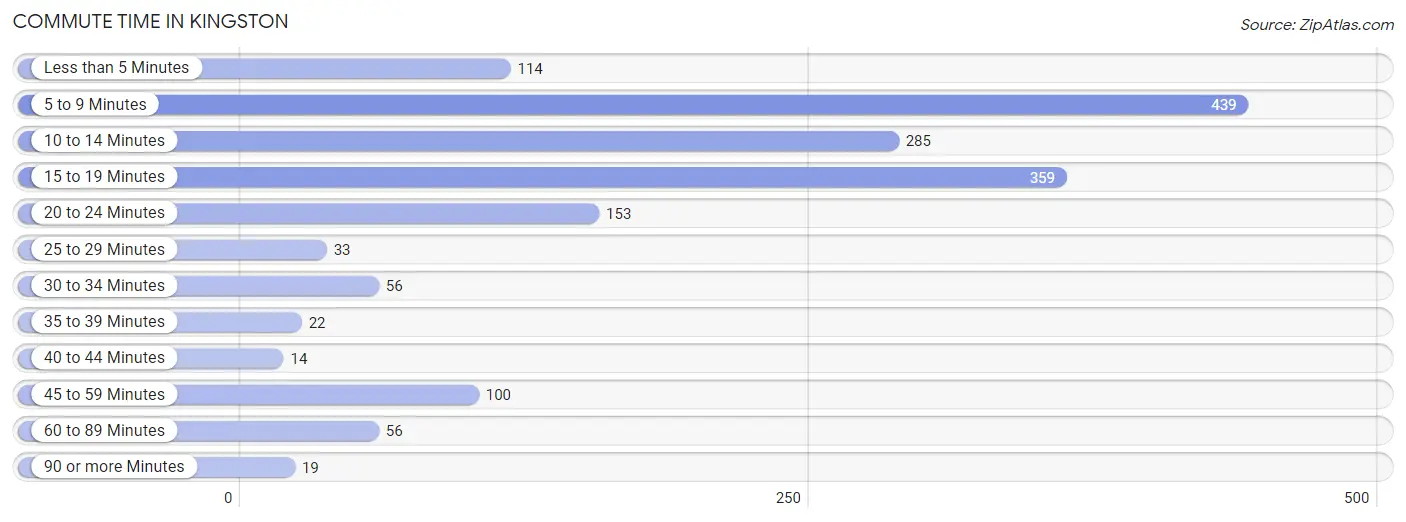
| Commute Time | # Commuters | % Commuters |
| Less than 5 Minutes | 114 | 6.9% |
| 5 to 9 Minutes | 439 | 26.6% |
| 10 to 14 Minutes | 285 | 17.3% |
| 15 to 19 Minutes | 359 | 21.8% |
| 20 to 24 Minutes | 153 | 9.3% |
| 25 to 29 Minutes | 33 | 2.0% |
| 30 to 34 Minutes | 56 | 3.4% |
| 35 to 39 Minutes | 22 | 1.3% |
| 40 to 44 Minutes | 14 | 0.9% |
| 45 to 59 Minutes | 100 | 6.1% |
| 60 to 89 Minutes | 56 | 3.4% |
| 90 or more Minutes | 19 | 1.1% |
Commute Time by Sex in Kingston
The most common commute times in Kingston are 15 to 19 minutes (237 commuters, 34.7%) for males and 5 to 9 minutes (306 commuters, 31.6%) for females.
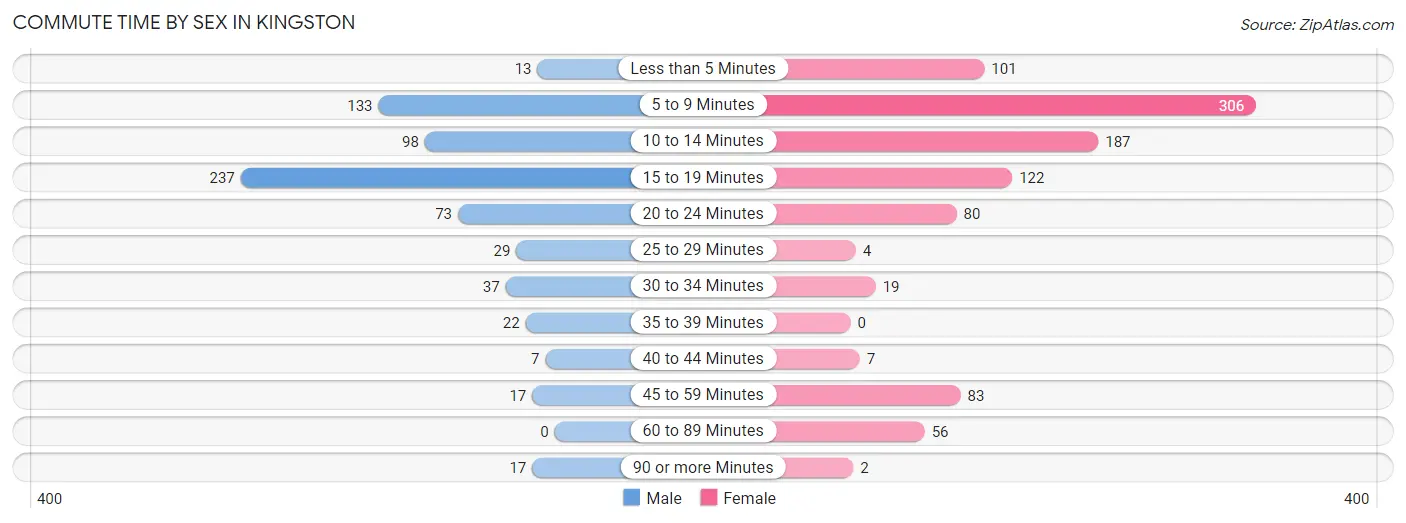
| Commute Time | Male | Female |
| Less than 5 Minutes | 13 (1.9%) | 101 (10.4%) |
| 5 to 9 Minutes | 133 (19.5%) | 306 (31.6%) |
| 10 to 14 Minutes | 98 (14.3%) | 187 (19.3%) |
| 15 to 19 Minutes | 237 (34.7%) | 122 (12.6%) |
| 20 to 24 Minutes | 73 (10.7%) | 80 (8.3%) |
| 25 to 29 Minutes | 29 (4.3%) | 4 (0.4%) |
| 30 to 34 Minutes | 37 (5.4%) | 19 (2.0%) |
| 35 to 39 Minutes | 22 (3.2%) | 0 (0.0%) |
| 40 to 44 Minutes | 7 (1.0%) | 7 (0.7%) |
| 45 to 59 Minutes | 17 (2.5%) | 83 (8.6%) |
| 60 to 89 Minutes | 0 (0.0%) | 56 (5.8%) |
| 90 or more Minutes | 17 (2.5%) | 2 (0.2%) |
Time of Departure to Work by Sex in Kingston
The most frequent times of departure to work in Kingston are 12:00 PM to 3:59 PM (234, 34.3%) for males and 12:00 PM to 3:59 PM (240, 24.8%) for females.
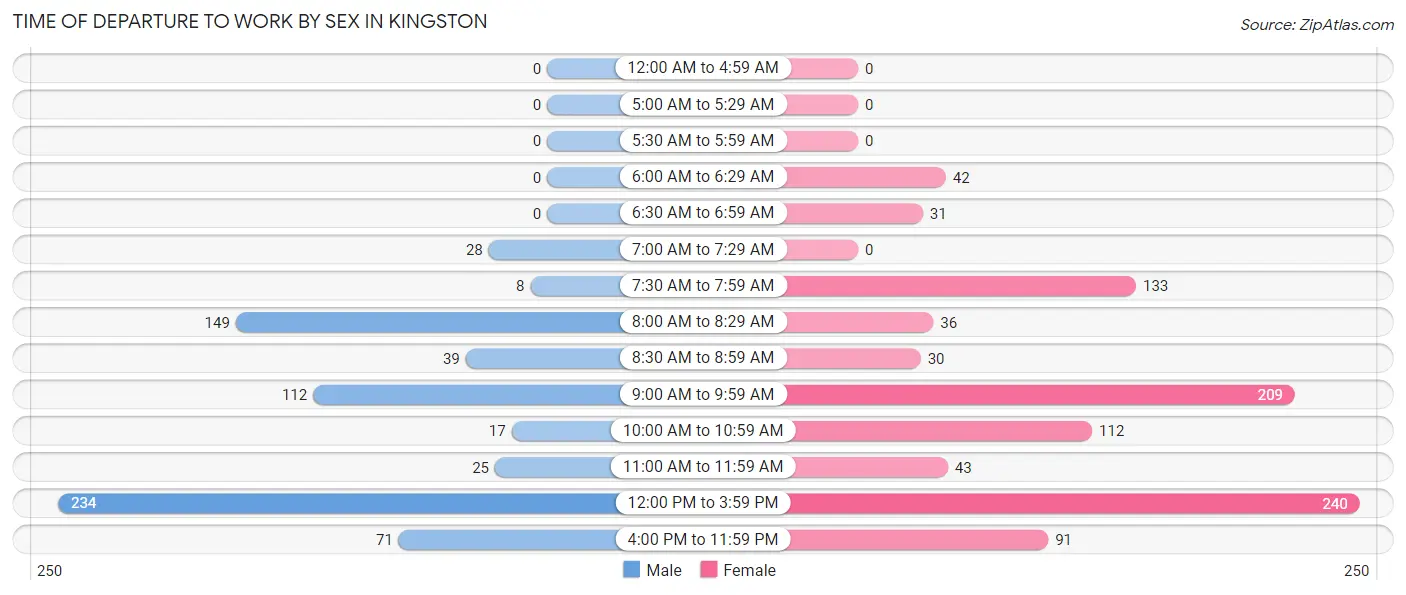
| Time of Departure | Male | Female |
| 12:00 AM to 4:59 AM | 0 (0.0%) | 0 (0.0%) |
| 5:00 AM to 5:29 AM | 0 (0.0%) | 0 (0.0%) |
| 5:30 AM to 5:59 AM | 0 (0.0%) | 0 (0.0%) |
| 6:00 AM to 6:29 AM | 0 (0.0%) | 42 (4.3%) |
| 6:30 AM to 6:59 AM | 0 (0.0%) | 31 (3.2%) |
| 7:00 AM to 7:29 AM | 28 (4.1%) | 0 (0.0%) |
| 7:30 AM to 7:59 AM | 8 (1.2%) | 133 (13.8%) |
| 8:00 AM to 8:29 AM | 149 (21.8%) | 36 (3.7%) |
| 8:30 AM to 8:59 AM | 39 (5.7%) | 30 (3.1%) |
| 9:00 AM to 9:59 AM | 112 (16.4%) | 209 (21.6%) |
| 10:00 AM to 10:59 AM | 17 (2.5%) | 112 (11.6%) |
| 11:00 AM to 11:59 AM | 25 (3.7%) | 43 (4.4%) |
| 12:00 PM to 3:59 PM | 234 (34.3%) | 240 (24.8%) |
| 4:00 PM to 11:59 PM | 71 (10.4%) | 91 (9.4%) |
| Total | 683 (100.0%) | 967 (100.0%) |
Housing Occupancy in Kingston
Occupancy by Ownership in Kingston
Of the total 592 dwellings in Kingston, owner-occupied units account for 490 (82.8%), while renter-occupied units make up 102 (17.2%).
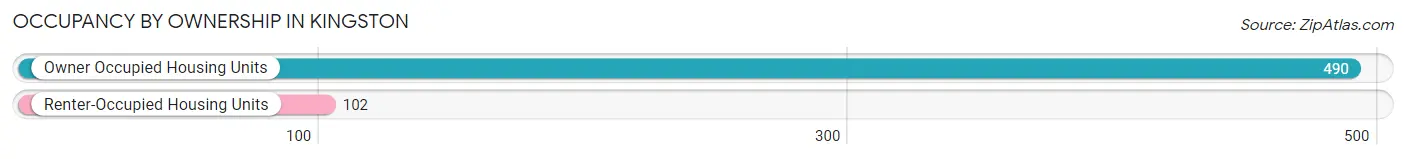
| Occupancy | # Housing Units | % Housing Units |
| Owner Occupied Housing Units | 490 | 82.8% |
| Renter-Occupied Housing Units | 102 | 17.2% |
| Total Occupied Housing Units | 592 | 100.0% |
Occupancy by Household Size in Kingston
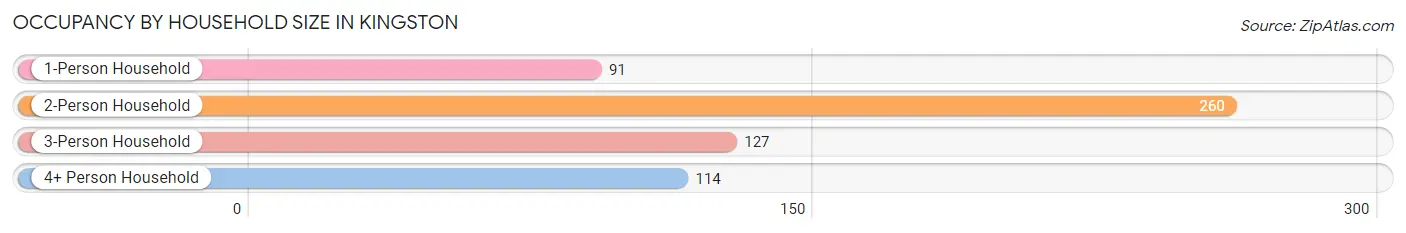
| Household Size | # Housing Units | % Housing Units |
| 1-Person Household | 91 | 15.4% |
| 2-Person Household | 260 | 43.9% |
| 3-Person Household | 127 | 21.4% |
| 4+ Person Household | 114 | 19.3% |
| Total Housing Units | 592 | 100.0% |
Occupancy by Ownership by Household Size in Kingston
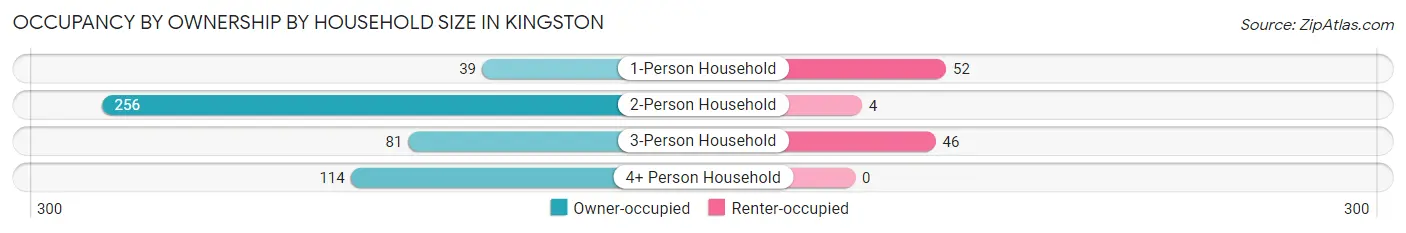
| Household Size | Owner-occupied | Renter-occupied |
| 1-Person Household | 39 (42.9%) | 52 (57.1%) |
| 2-Person Household | 256 (98.5%) | 4 (1.5%) |
| 3-Person Household | 81 (63.8%) | 46 (36.2%) |
| 4+ Person Household | 114 (100.0%) | 0 (0.0%) |
| Total Housing Units | 490 (82.8%) | 102 (17.2%) |
Occupancy by Educational Attainment in Kingston
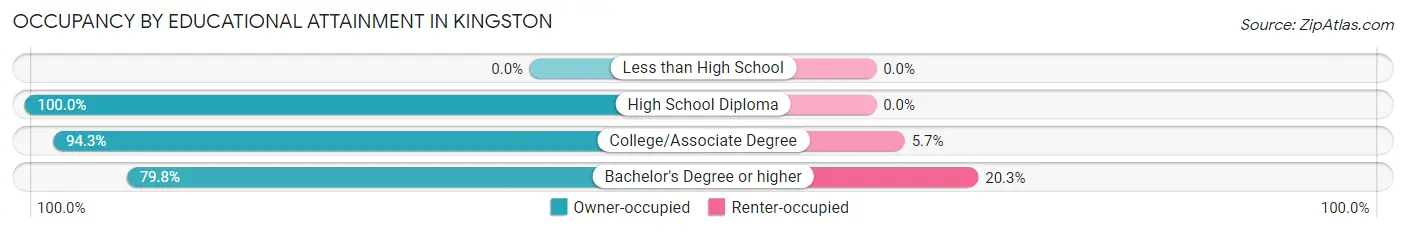
| Household Size | Owner-occupied | Renter-occupied |
| Less than High School | 0 (0.0%) | 0 (0.0%) |
| High School Diploma | 12 (100.0%) | 0 (0.0%) |
| College/Associate Degree | 100 (94.3%) | 6 (5.7%) |
| Bachelor's Degree or higher | 378 (79.7%) | 96 (20.3%) |
Occupancy by Age of Householder in Kingston
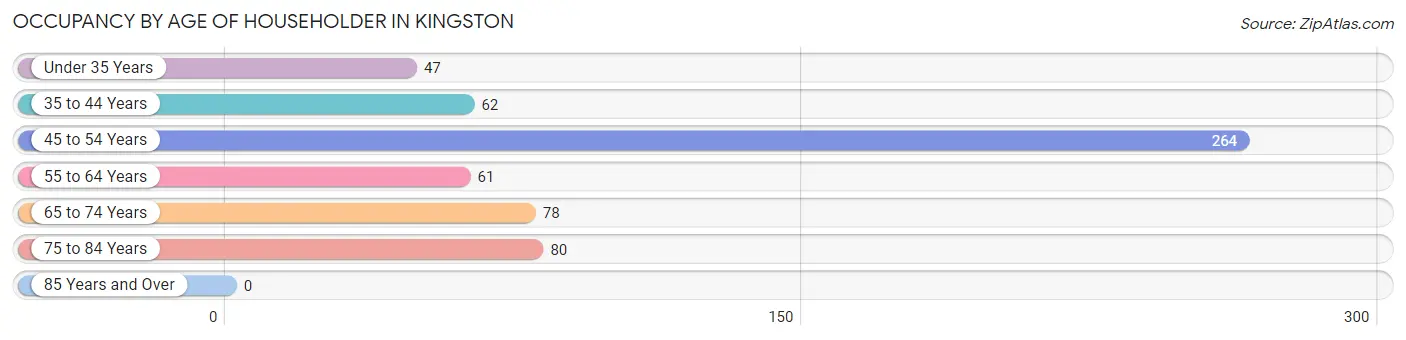
| Age Bracket | # Households | % Households |
| Under 35 Years | 47 | 7.9% |
| 35 to 44 Years | 62 | 10.5% |
| 45 to 54 Years | 264 | 44.6% |
| 55 to 64 Years | 61 | 10.3% |
| 65 to 74 Years | 78 | 13.2% |
| 75 to 84 Years | 80 | 13.5% |
| 85 Years and Over | 0 | 0.0% |
| Total | 592 | 100.0% |
Housing Finances in Kingston
Median Income by Occupancy in Kingston
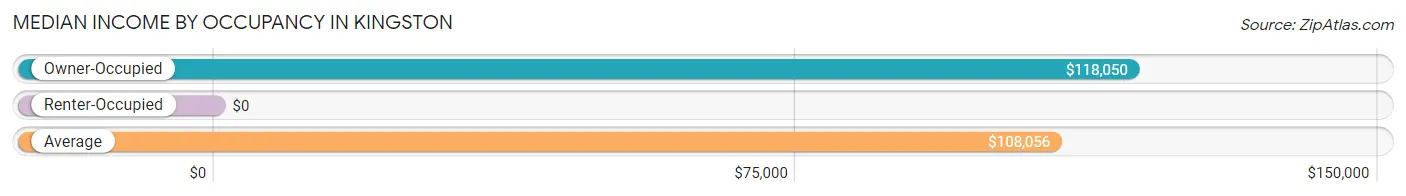
| Occupancy Type | # Households | Median Income |
| Owner-Occupied | 490 (82.8%) | $118,050 |
| Renter-Occupied | 102 (17.2%) | $0 |
| Average | 592 (100.0%) | $108,056 |
Occupancy by Householder Income Bracket in Kingston
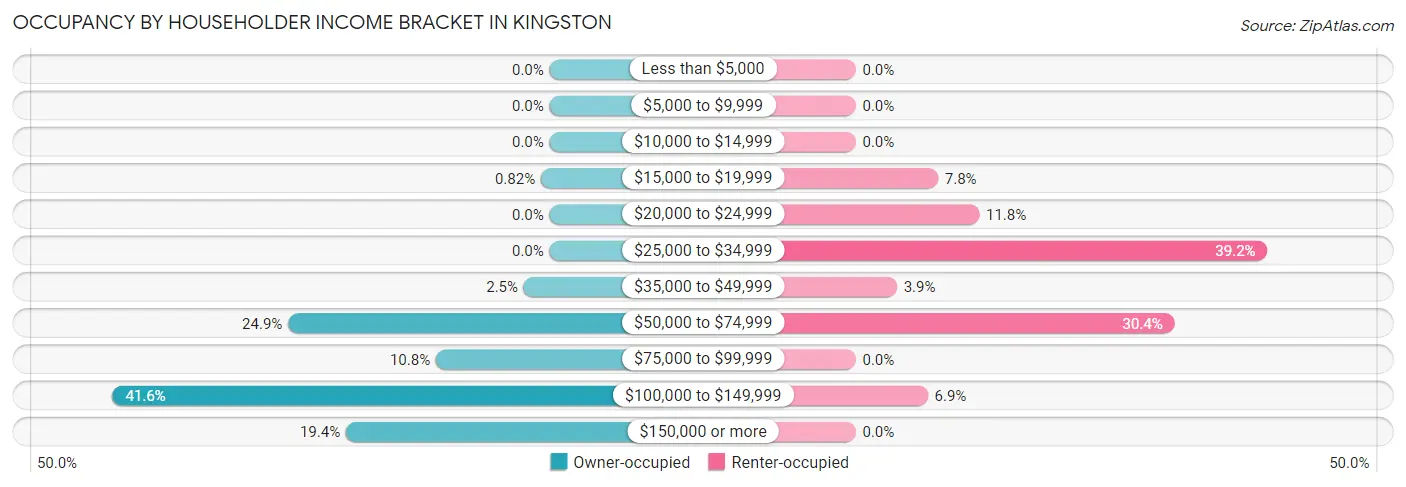
| Income Bracket | Owner-occupied | Renter-occupied |
| Less than $5,000 | 0 (0.0%) | 0 (0.0%) |
| $5,000 to $9,999 | 0 (0.0%) | 0 (0.0%) |
| $10,000 to $14,999 | 0 (0.0%) | 0 (0.0%) |
| $15,000 to $19,999 | 4 (0.8%) | 8 (7.8%) |
| $20,000 to $24,999 | 0 (0.0%) | 12 (11.8%) |
| $25,000 to $34,999 | 0 (0.0%) | 40 (39.2%) |
| $35,000 to $49,999 | 12 (2.5%) | 4 (3.9%) |
| $50,000 to $74,999 | 122 (24.9%) | 31 (30.4%) |
| $75,000 to $99,999 | 53 (10.8%) | 0 (0.0%) |
| $100,000 to $149,999 | 204 (41.6%) | 7 (6.9%) |
| $150,000 or more | 95 (19.4%) | 0 (0.0%) |
| Total | 490 (100.0%) | 102 (100.0%) |
Monthly Housing Cost Tiers in Kingston
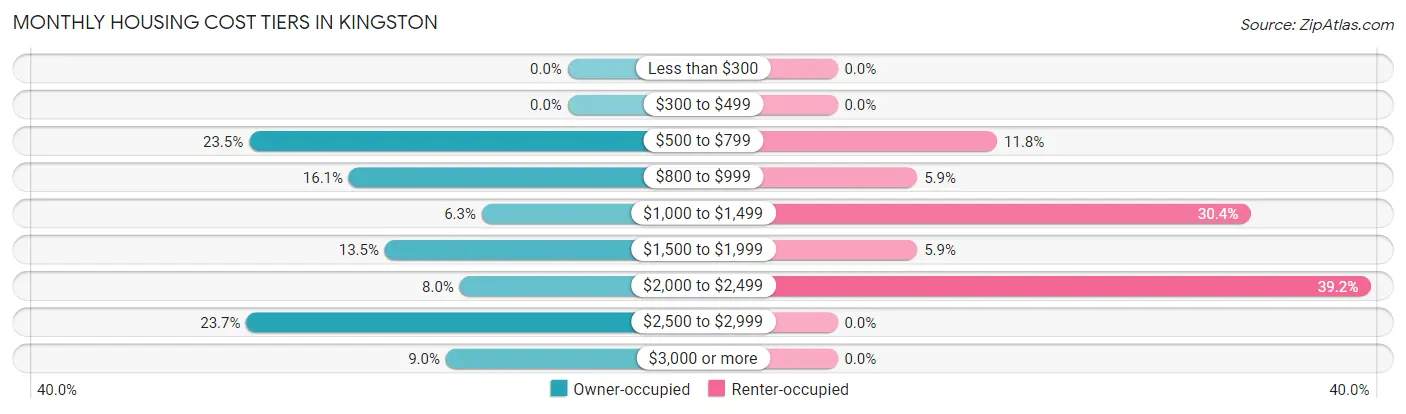
| Monthly Cost | Owner-occupied | Renter-occupied |
| Less than $300 | 0 (0.0%) | 0 (0.0%) |
| $300 to $499 | 0 (0.0%) | 0 (0.0%) |
| $500 to $799 | 115 (23.5%) | 12 (11.8%) |
| $800 to $999 | 79 (16.1%) | 6 (5.9%) |
| $1,000 to $1,499 | 31 (6.3%) | 31 (30.4%) |
| $1,500 to $1,999 | 66 (13.5%) | 6 (5.9%) |
| $2,000 to $2,499 | 39 (8.0%) | 40 (39.2%) |
| $2,500 to $2,999 | 116 (23.7%) | 0 (0.0%) |
| $3,000 or more | 44 (9.0%) | 0 (0.0%) |
| Total | 490 (100.0%) | 102 (100.0%) |
Physical Housing Characteristics in Kingston
Housing Structures in Kingston
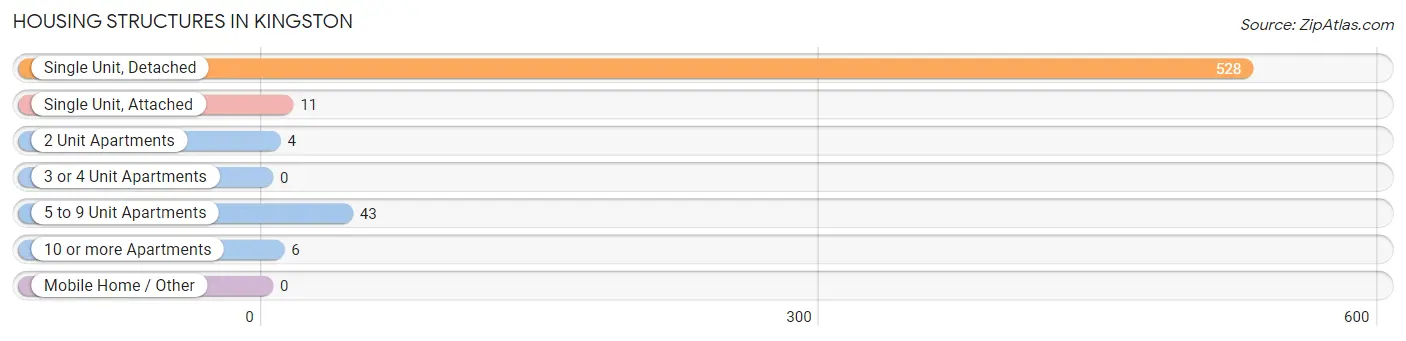
| Structure Type | # Housing Units | % Housing Units |
| Single Unit, Detached | 528 | 89.2% |
| Single Unit, Attached | 11 | 1.9% |
| 2 Unit Apartments | 4 | 0.7% |
| 3 or 4 Unit Apartments | 0 | 0.0% |
| 5 to 9 Unit Apartments | 43 | 7.3% |
| 10 or more Apartments | 6 | 1.0% |
| Mobile Home / Other | 0 | 0.0% |
| Total | 592 | 100.0% |
Housing Structures by Occupancy in Kingston
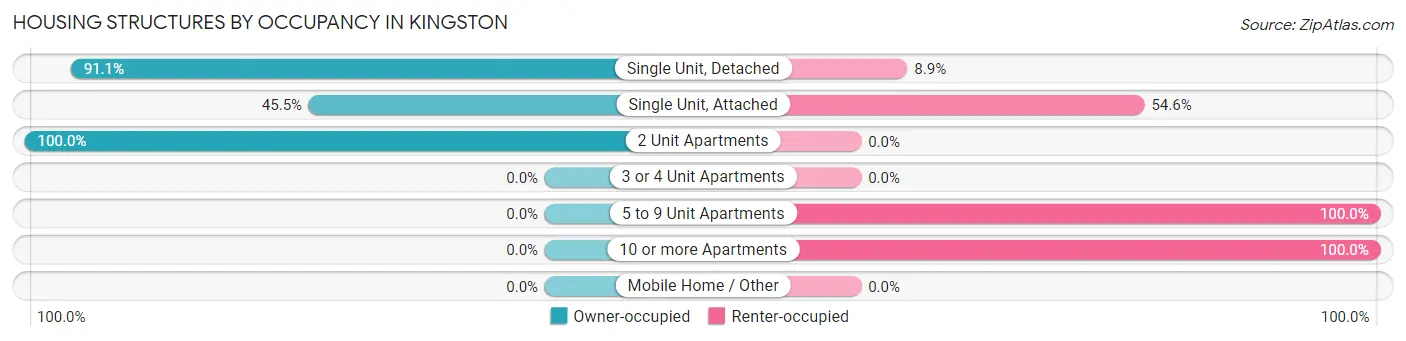
| Structure Type | Owner-occupied | Renter-occupied |
| Single Unit, Detached | 481 (91.1%) | 47 (8.9%) |
| Single Unit, Attached | 5 (45.5%) | 6 (54.5%) |
| 2 Unit Apartments | 4 (100.0%) | 0 (0.0%) |
| 3 or 4 Unit Apartments | 0 (0.0%) | 0 (0.0%) |
| 5 to 9 Unit Apartments | 0 (0.0%) | 43 (100.0%) |
| 10 or more Apartments | 0 (0.0%) | 6 (100.0%) |
| Mobile Home / Other | 0 (0.0%) | 0 (0.0%) |
| Total | 490 (82.8%) | 102 (17.2%) |
Housing Structures by Number of Rooms in Kingston
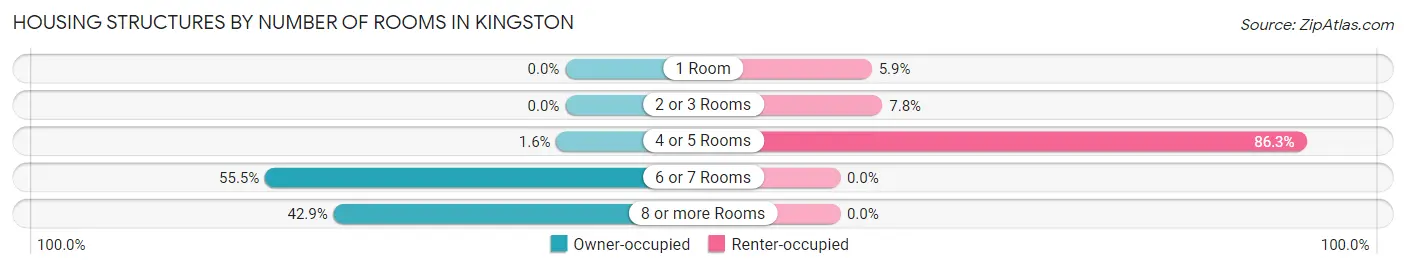
| Number of Rooms | Owner-occupied | Renter-occupied |
| 1 Room | 0 (0.0%) | 6 (5.9%) |
| 2 or 3 Rooms | 0 (0.0%) | 8 (7.8%) |
| 4 or 5 Rooms | 8 (1.6%) | 88 (86.3%) |
| 6 or 7 Rooms | 272 (55.5%) | 0 (0.0%) |
| 8 or more Rooms | 210 (42.9%) | 0 (0.0%) |
| Total | 490 (100.0%) | 102 (100.0%) |
Housing Structure by Heating Type in Kingston
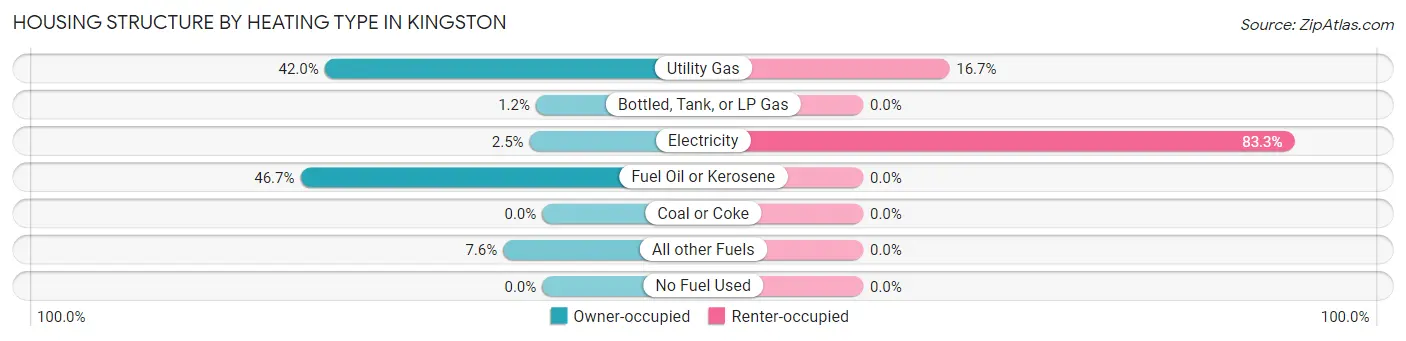
| Heating Type | Owner-occupied | Renter-occupied |
| Utility Gas | 206 (42.0%) | 17 (16.7%) |
| Bottled, Tank, or LP Gas | 6 (1.2%) | 0 (0.0%) |
| Electricity | 12 (2.5%) | 85 (83.3%) |
| Fuel Oil or Kerosene | 229 (46.7%) | 0 (0.0%) |
| Coal or Coke | 0 (0.0%) | 0 (0.0%) |
| All other Fuels | 37 (7.5%) | 0 (0.0%) |
| No Fuel Used | 0 (0.0%) | 0 (0.0%) |
| Total | 490 (100.0%) | 102 (100.0%) |
Household Vehicle Usage in Kingston
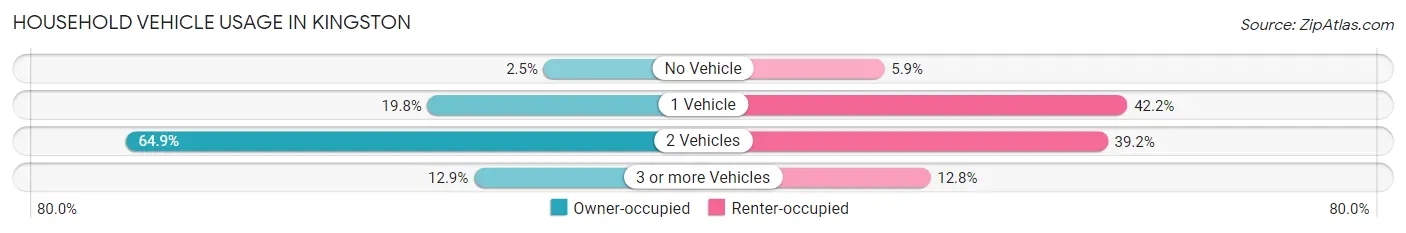
| Vehicles per Household | Owner-occupied | Renter-occupied |
| No Vehicle | 12 (2.5%) | 6 (5.9%) |
| 1 Vehicle | 97 (19.8%) | 43 (42.2%) |
| 2 Vehicles | 318 (64.9%) | 40 (39.2%) |
| 3 or more Vehicles | 63 (12.9%) | 13 (12.8%) |
| Total | 490 (100.0%) | 102 (100.0%) |
Real Estate & Mortgages in Kingston
Real Estate and Mortgage Overview in Kingston
| Characteristic | Without Mortgage | With Mortgage |
| Housing Units | 198 | 292 |
| Median Property Value | $454,200 | $463,000 |
| Median Household Income | - | - |
| Monthly Housing Costs | $825 | $44 |
| Real Estate Taxes | $4,884 | $0 |
Property Value by Mortgage Status in Kingston
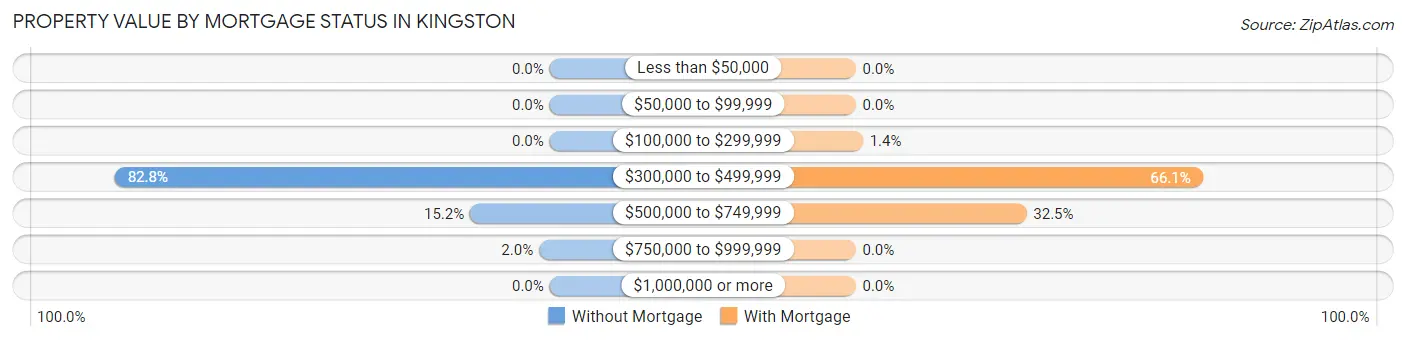
| Property Value | Without Mortgage | With Mortgage |
| Less than $50,000 | 0 (0.0%) | 0 (0.0%) |
| $50,000 to $99,999 | 0 (0.0%) | 0 (0.0%) |
| $100,000 to $299,999 | 0 (0.0%) | 4 (1.4%) |
| $300,000 to $499,999 | 164 (82.8%) | 193 (66.1%) |
| $500,000 to $749,999 | 30 (15.1%) | 95 (32.5%) |
| $750,000 to $999,999 | 4 (2.0%) | 0 (0.0%) |
| $1,000,000 or more | 0 (0.0%) | 0 (0.0%) |
| Total | 198 (100.0%) | 292 (100.0%) |
Household Income by Mortgage Status in Kingston
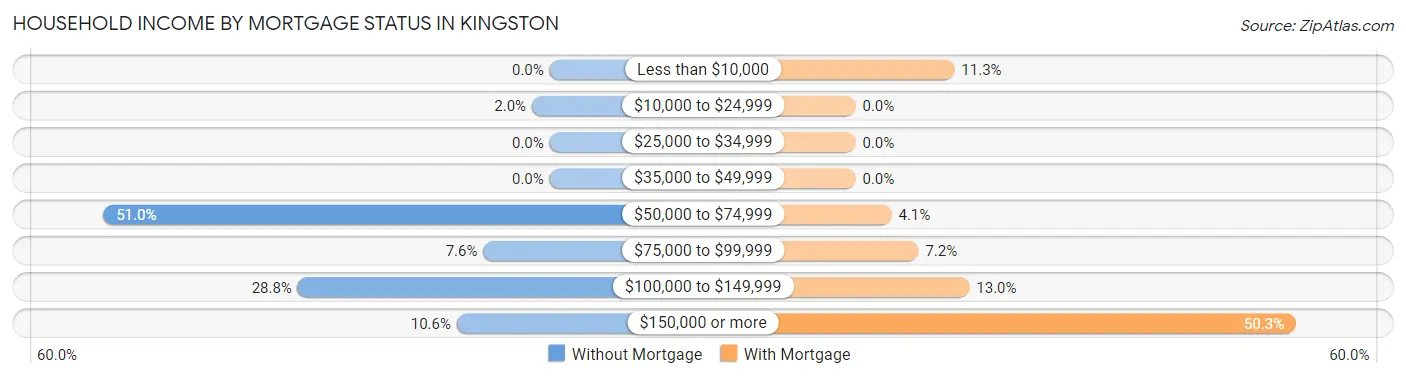
| Household Income | Without Mortgage | With Mortgage |
| Less than $10,000 | 0 (0.0%) | 33 (11.3%) |
| $10,000 to $24,999 | 4 (2.0%) | 0 (0.0%) |
| $25,000 to $34,999 | 0 (0.0%) | 0 (0.0%) |
| $35,000 to $49,999 | 0 (0.0%) | 0 (0.0%) |
| $50,000 to $74,999 | 101 (51.0%) | 12 (4.1%) |
| $75,000 to $99,999 | 15 (7.6%) | 21 (7.2%) |
| $100,000 to $149,999 | 57 (28.8%) | 38 (13.0%) |
| $150,000 or more | 21 (10.6%) | 147 (50.3%) |
| Total | 198 (100.0%) | 292 (100.0%) |
Property Value to Household Income Ratio in Kingston
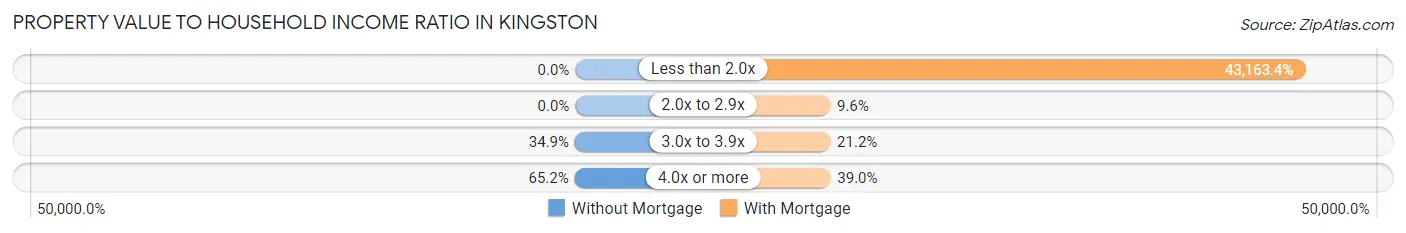
| Value-to-Income Ratio | Without Mortgage | With Mortgage |
| Less than 2.0x | 0 (0.0%) | 126,037 (43,163.4%) |
| 2.0x to 2.9x | 0 (0.0%) | 28 (9.6%) |
| 3.0x to 3.9x | 69 (34.8%) | 62 (21.2%) |
| 4.0x or more | 129 (65.1%) | 114 (39.0%) |
| Total | 198 (100.0%) | 292 (100.0%) |
Real Estate Taxes by Mortgage Status in Kingston

| Property Taxes | Without Mortgage | With Mortgage |
| Less than $800 | 0 (0.0%) | 0 (0.0%) |
| $800 to $1,499 | 0 (0.0%) | 0 (0.0%) |
| $800 to $1,499 | 198 (100.0%) | 0 (0.0%) |
| Total | 198 (100.0%) | 292 (100.0%) |
Health & Disability in Kingston
Health Insurance Coverage by Age in Kingston
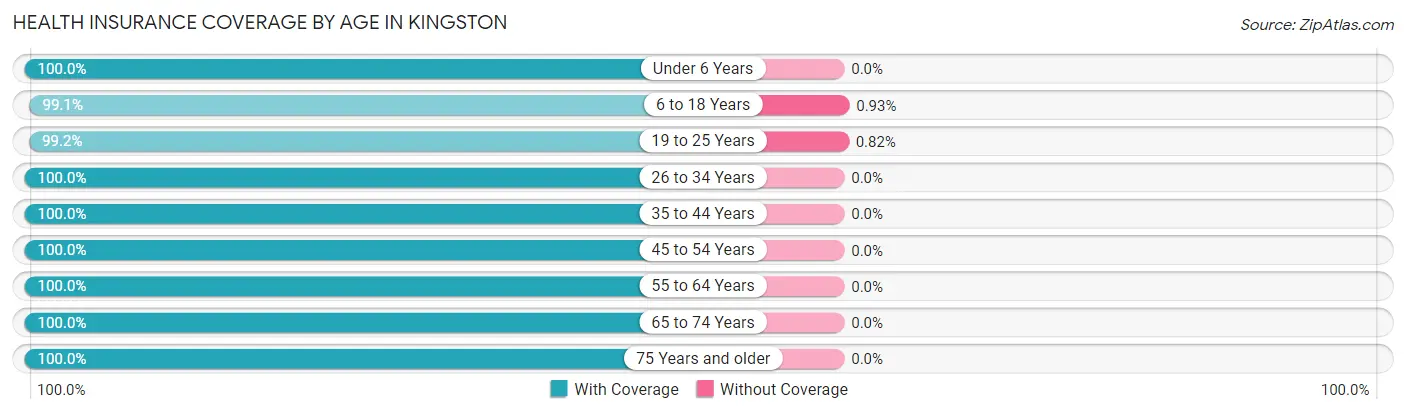
| Age Bracket | With Coverage | Without Coverage |
| Under 6 Years | 102 (100.0%) | 0 (0.0%) |
| 6 to 18 Years | 2,034 (99.1%) | 19 (0.9%) |
| 19 to 25 Years | 3,282 (99.2%) | 27 (0.8%) |
| 26 to 34 Years | 101 (100.0%) | 0 (0.0%) |
| 35 to 44 Years | 175 (100.0%) | 0 (0.0%) |
| 45 to 54 Years | 349 (100.0%) | 0 (0.0%) |
| 55 to 64 Years | 188 (100.0%) | 0 (0.0%) |
| 65 to 74 Years | 133 (100.0%) | 0 (0.0%) |
| 75 Years and older | 150 (100.0%) | 0 (0.0%) |
| Total | 6,514 (99.3%) | 46 (0.7%) |
Health Insurance Coverage by Citizenship Status in Kingston
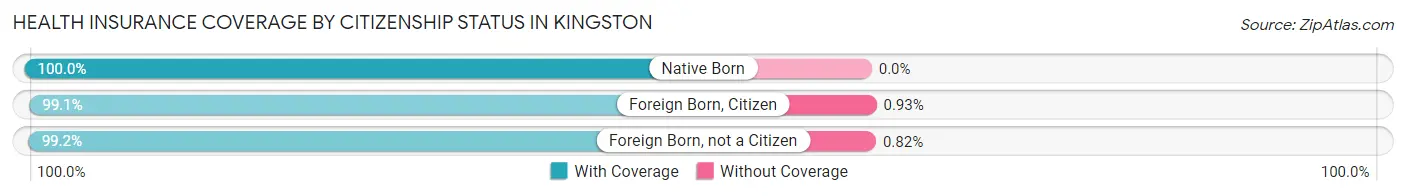
| Citizenship Status | With Coverage | Without Coverage |
| Native Born | 102 (100.0%) | 0 (0.0%) |
| Foreign Born, Citizen | 2,034 (99.1%) | 19 (0.9%) |
| Foreign Born, not a Citizen | 3,282 (99.2%) | 27 (0.8%) |
Health Insurance Coverage by Household Income in Kingston
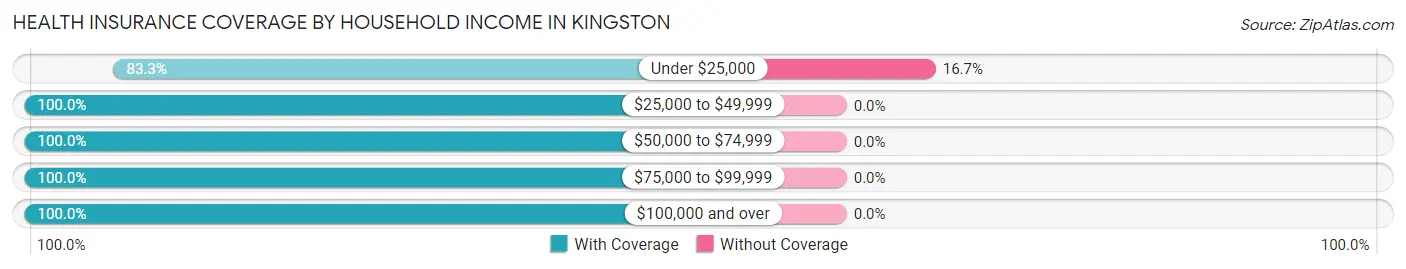
| Household Income | With Coverage | Without Coverage |
| Under $25,000 | 30 (83.3%) | 6 (16.7%) |
| $25,000 to $49,999 | 182 (100.0%) | 0 (0.0%) |
| $50,000 to $74,999 | 258 (100.0%) | 0 (0.0%) |
| $75,000 to $99,999 | 162 (100.0%) | 0 (0.0%) |
| $100,000 and over | 870 (100.0%) | 0 (0.0%) |
Public vs Private Health Insurance Coverage by Age in Kingston
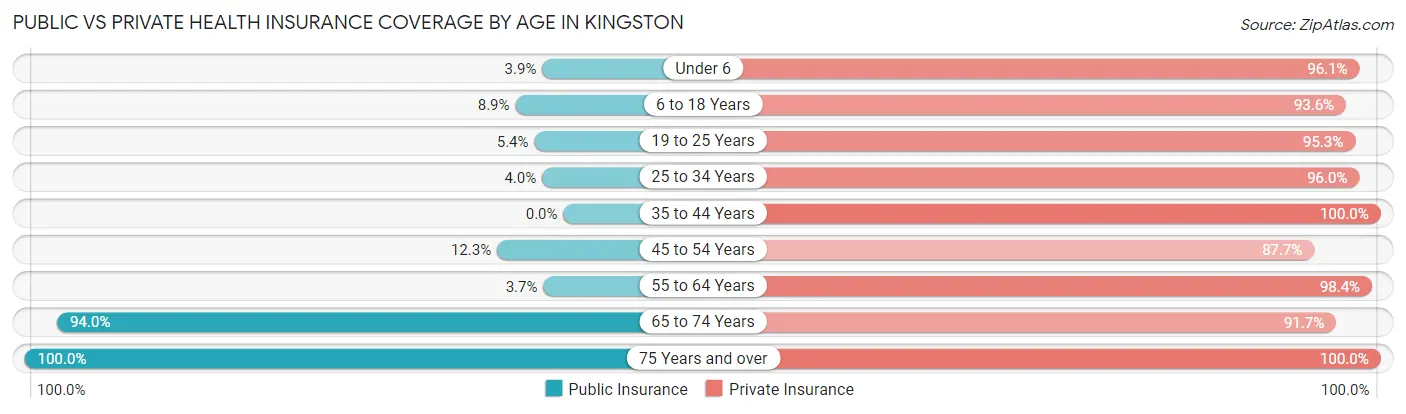
| Age Bracket | Public Insurance | Private Insurance |
| Under 6 | 4 (3.9%) | 98 (96.1%) |
| 6 to 18 Years | 183 (8.9%) | 1,921 (93.6%) |
| 19 to 25 Years | 178 (5.4%) | 3,152 (95.3%) |
| 25 to 34 Years | 4 (4.0%) | 97 (96.0%) |
| 35 to 44 Years | 0 (0.0%) | 175 (100.0%) |
| 45 to 54 Years | 43 (12.3%) | 306 (87.7%) |
| 55 to 64 Years | 7 (3.7%) | 185 (98.4%) |
| 65 to 74 Years | 125 (94.0%) | 122 (91.7%) |
| 75 Years and over | 150 (100.0%) | 150 (100.0%) |
| Total | 694 (10.6%) | 6,206 (94.6%) |
Disability Status by Sex by Age in Kingston
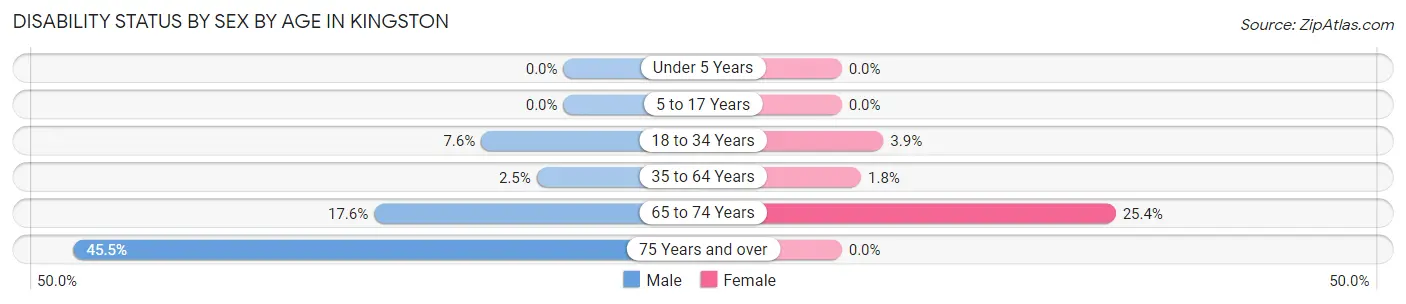
| Age Bracket | Male | Female |
| Under 5 Years | 0 (0.0%) | 0 (0.0%) |
| 5 to 17 Years | 0 (0.0%) | 0 (0.0%) |
| 18 to 34 Years | 170 (7.6%) | 114 (3.9%) |
| 35 to 64 Years | 8 (2.5%) | 7 (1.8%) |
| 65 to 74 Years | 13 (17.6%) | 15 (25.4%) |
| 75 Years and over | 25 (45.5%) | 0 (0.0%) |
Disability Class by Sex by Age in Kingston
Disability Class: Hearing Difficulty
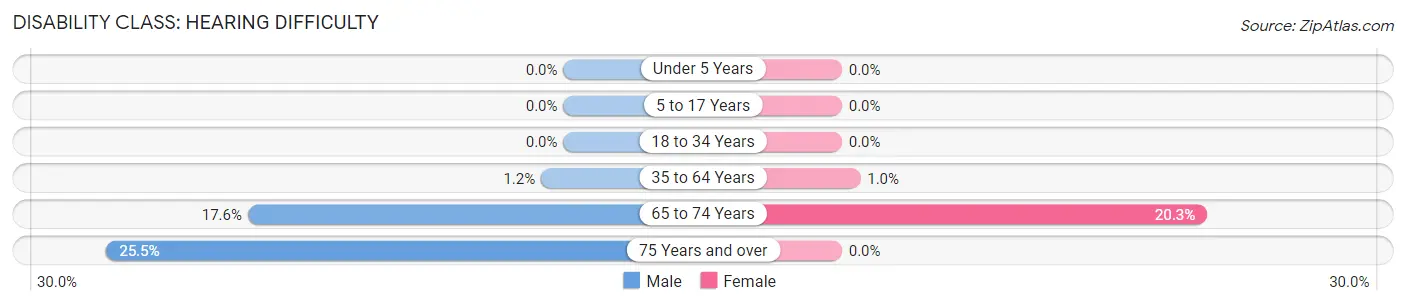
| Age Bracket | Male | Female |
| Under 5 Years | 0 (0.0%) | 0 (0.0%) |
| 5 to 17 Years | 0 (0.0%) | 0 (0.0%) |
| 18 to 34 Years | 0 (0.0%) | 0 (0.0%) |
| 35 to 64 Years | 4 (1.2%) | 4 (1.0%) |
| 65 to 74 Years | 13 (17.6%) | 12 (20.3%) |
| 75 Years and over | 14 (25.5%) | 0 (0.0%) |
Disability Class: Vision Difficulty
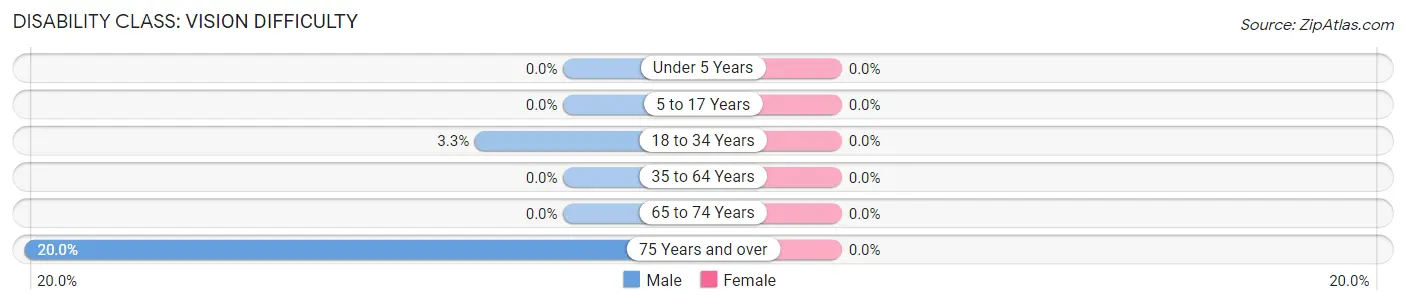
| Age Bracket | Male | Female |
| Under 5 Years | 0 (0.0%) | 0 (0.0%) |
| 5 to 17 Years | 0 (0.0%) | 0 (0.0%) |
| 18 to 34 Years | 73 (3.3%) | 0 (0.0%) |
| 35 to 64 Years | 0 (0.0%) | 0 (0.0%) |
| 65 to 74 Years | 0 (0.0%) | 0 (0.0%) |
| 75 Years and over | 11 (20.0%) | 0 (0.0%) |
Disability Class: Cognitive Difficulty
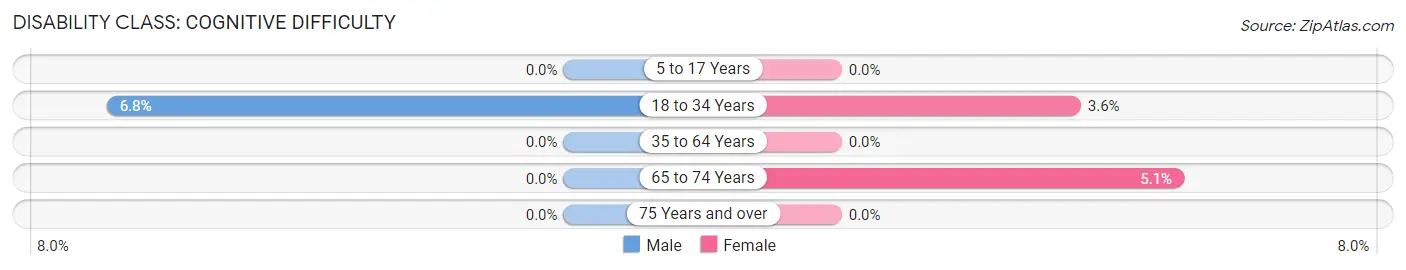
| Age Bracket | Male | Female |
| 5 to 17 Years | 0 (0.0%) | 0 (0.0%) |
| 18 to 34 Years | 151 (6.8%) | 105 (3.5%) |
| 35 to 64 Years | 0 (0.0%) | 0 (0.0%) |
| 65 to 74 Years | 0 (0.0%) | 3 (5.1%) |
| 75 Years and over | 0 (0.0%) | 0 (0.0%) |
Disability Class: Ambulatory Difficulty
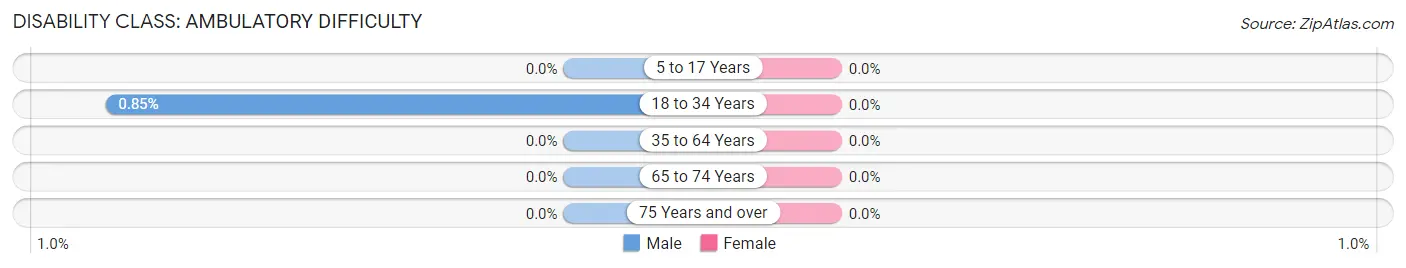
| Age Bracket | Male | Female |
| 5 to 17 Years | 0 (0.0%) | 0 (0.0%) |
| 18 to 34 Years | 19 (0.9%) | 0 (0.0%) |
| 35 to 64 Years | 0 (0.0%) | 0 (0.0%) |
| 65 to 74 Years | 0 (0.0%) | 0 (0.0%) |
| 75 Years and over | 0 (0.0%) | 0 (0.0%) |
Disability Class: Self-Care Difficulty
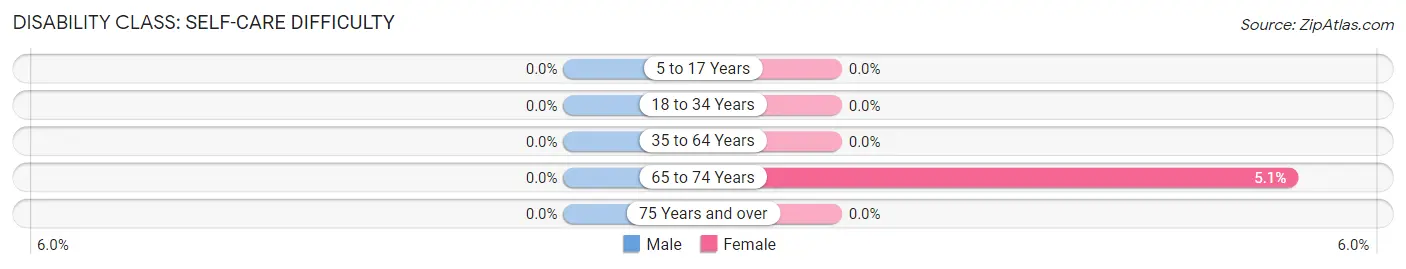
| Age Bracket | Male | Female |
| 5 to 17 Years | 0 (0.0%) | 0 (0.0%) |
| 18 to 34 Years | 0 (0.0%) | 0 (0.0%) |
| 35 to 64 Years | 0 (0.0%) | 0 (0.0%) |
| 65 to 74 Years | 0 (0.0%) | 3 (5.1%) |
| 75 Years and over | 0 (0.0%) | 0 (0.0%) |
Technology Access in Kingston
Computing Device Access in Kingston

| Device Type | # Households | % Households |
| Desktop or Laptop | 557 | 94.1% |
| Smartphone | 542 | 91.5% |
| Tablet | 487 | 82.3% |
| No Computing Device | 35 | 5.9% |
| Total | 592 | 100.0% |
Internet Access in Kingston
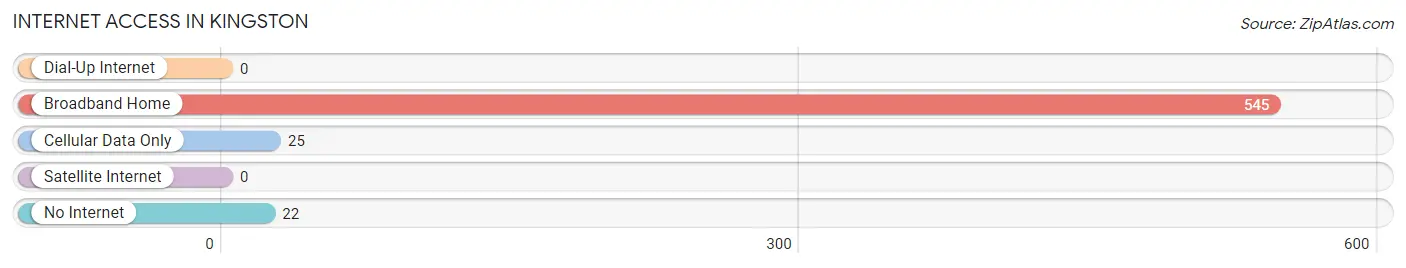
| Internet Type | # Households | % Households |
| Dial-Up Internet | 0 | 0.0% |
| Broadband Home | 545 | 92.1% |
| Cellular Data Only | 25 | 4.2% |
| Satellite Internet | 0 | 0.0% |
| No Internet | 22 | 3.7% |
| Total | 592 | 100.0% |
Kingston Summary
Kingston is a small village located in the state of Rhode Island in the United States. It is located in the southwestern part of the state, just north of the city of Providence. The village is part of the town of South Kingstown and is bordered by the towns of Narragansett and North Kingstown. The village has a population of approximately 4,000 people and is home to the University of Rhode Island.
History
The area that is now Kingston was originally inhabited by the Narragansett Native American tribe. The first European settlers arrived in the area in 1657 and the village was officially established in 1722. The village was named after King George II of England and was originally part of the town of South Kingstown.
In the late 18th century, Kingston became an important port for the shipping of goods and was home to several wharves and warehouses. The village was also home to several mills and factories, including a cotton mill, a paper mill, and a grist mill.
In the 19th century, Kingston was a popular summer resort destination for wealthy families from Providence and other nearby cities. The village was also home to several large estates, including the historic Whitehall Mansion.
Geography
Kingston is located in the southwestern part of Rhode Island, just north of the city of Providence. The village is bordered by the towns of Narragansett and North Kingstown. The village is situated on the banks of the Queen's River, which flows into Narragansett Bay.
The village is located in a rural area and is surrounded by forests and farmland. The village is located in a hilly area and is home to several small lakes and ponds.
Economy
The economy of Kingston is largely based on tourism and education. The village is home to the University of Rhode Island, which is the state's flagship university. The university is a major employer in the area and provides jobs for many of the village's residents.
The village is also home to several small businesses, including restaurants, shops, and galleries. The village is also home to several historic sites, including the Whitehall Mansion and the Kingston Free Library.
Demographics
As of the 2010 census, the population of Kingston was 4,079. The village is predominantly white, with approximately 90% of the population identifying as white. The village is also home to a small Hispanic population, with approximately 5% of the population identifying as Hispanic or Latino.
The median household income in Kingston is $50,000, which is slightly higher than the state average. The village is also home to a large number of college students, with approximately 25% of the population being enrolled in college.
Conclusion
Kingston is a small village located in the state of Rhode Island in the United States. The village is home to the University of Rhode Island and is a popular summer resort destination for wealthy families from Providence and other nearby cities. The village is predominantly white, with approximately 90% of the population identifying as white. The economy of Kingston is largely based on tourism and education, with the University of Rhode Island being a major employer in the area.
Common Questions
What is Per Capita Income in Kingston?
Per Capita income in Kingston is $13,680.
What is the Median Family Income in Kingston?
Median Family Income in Kingston is $117,550.
What is the Median Household income in Kingston?
Median Household Income in Kingston is $108,056.
What is Income or Wage Gap in Kingston?
Income or Wage Gap in Kingston is 5.6%.
Women in Kingston earn 94.4 cents for every dollar earned by a man.
What is Inequality or Gini Index in Kingston?
Inequality or Gini Index in Kingston is 0.32.
What is the Total Population of Kingston?
Total Population of Kingston is 6,560.
What is the Total Male Population of Kingston?
Total Male Population of Kingston is 2,927.
What is the Total Female Population of Kingston?
Total Female Population of Kingston is 3,633.
What is the Ratio of Males per 100 Females in Kingston?
There are 80.57 Males per 100 Females in Kingston.
What is the Ratio of Females per 100 Males in Kingston?
There are 124.12 Females per 100 Males in Kingston.
What is the Median Population Age in Kingston?
Median Population Age in Kingston is 19.6 Years.
What is the Average Family Size in Kingston
Average Family Size in Kingston is 2.9 People.
What is the Average Household Size in Kingston
Average Household Size in Kingston is 2.5 People.
How Large is the Labor Force in Kingston?
There are 2,450 People in the Labor Forcein in Kingston.
What is the Percentage of People in the Labor Force in Kingston?
38.9% of People are in the Labor Force in Kingston.
What is the Unemployment Rate in Kingston?
Unemployment Rate in Kingston is 11.0%.