Trussville, AL Map & Demographics
Trussville Map
Trussville Overview
$51,807
PER CAPITA INCOME
$135,887
AVG FAMILY INCOME
$118,028
AVG HOUSEHOLD INCOME
40.7%
WAGE / INCOME GAP [ % ]
59.3¢/ $1
WAGE / INCOME GAP [ $ ]
0.37
INEQUALITY / GINI INDEX
25,621
TOTAL POPULATION
12,789
MALE POPULATION
12,832
FEMALE POPULATION
99.66
MALES / 100 FEMALES
100.34
FEMALES / 100 MALES
42.0
MEDIAN AGE
3.1
AVG FAMILY SIZE
2.8
AVG HOUSEHOLD SIZE
13,443
LABOR FORCE [ PEOPLE ]
66.0%
PERCENT IN LABOR FORCE
2.8%
UNEMPLOYMENT RATE
Trussville Zip Codes
Trussville Area Codes
Income in Trussville
Income Overview in Trussville
Per Capita Income in Trussville is $51,807, while median incomes of families and households are $135,887 and $118,028 respectively.
| Characteristic | Number | Measure |
| Per Capita Income | 25,621 | $51,807 |
| Median Family Income | 7,350 | $135,887 |
| Mean Family Income | 7,350 | $160,630 |
| Median Household Income | 9,126 | $118,028 |
| Mean Household Income | 9,126 | $143,833 |
| Income Deficit | 7,350 | $0 |
| Wage / Income Gap (%) | 25,621 | 40.66% |
| Wage / Income Gap ($) | 25,621 | 59.34¢ per $1 |
| Gini / Inequality Index | 25,621 | 0.37 |
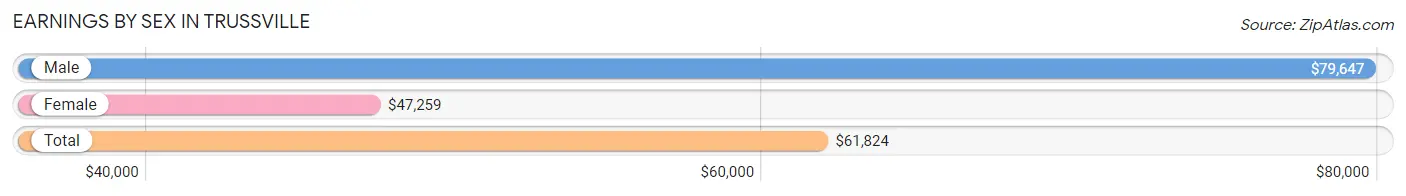
Earnings by Sex in Trussville
Average Earnings in Trussville are $61,824, $79,647 for men and $47,259 for women, a difference of 40.7%.
| Sex | Number | Average Earnings |
| Male | 7,583 (53.8%) | $79,647 |
| Female | 6,513 (46.2%) | $47,259 |
| Total | 14,096 (100.0%) | $61,824 |
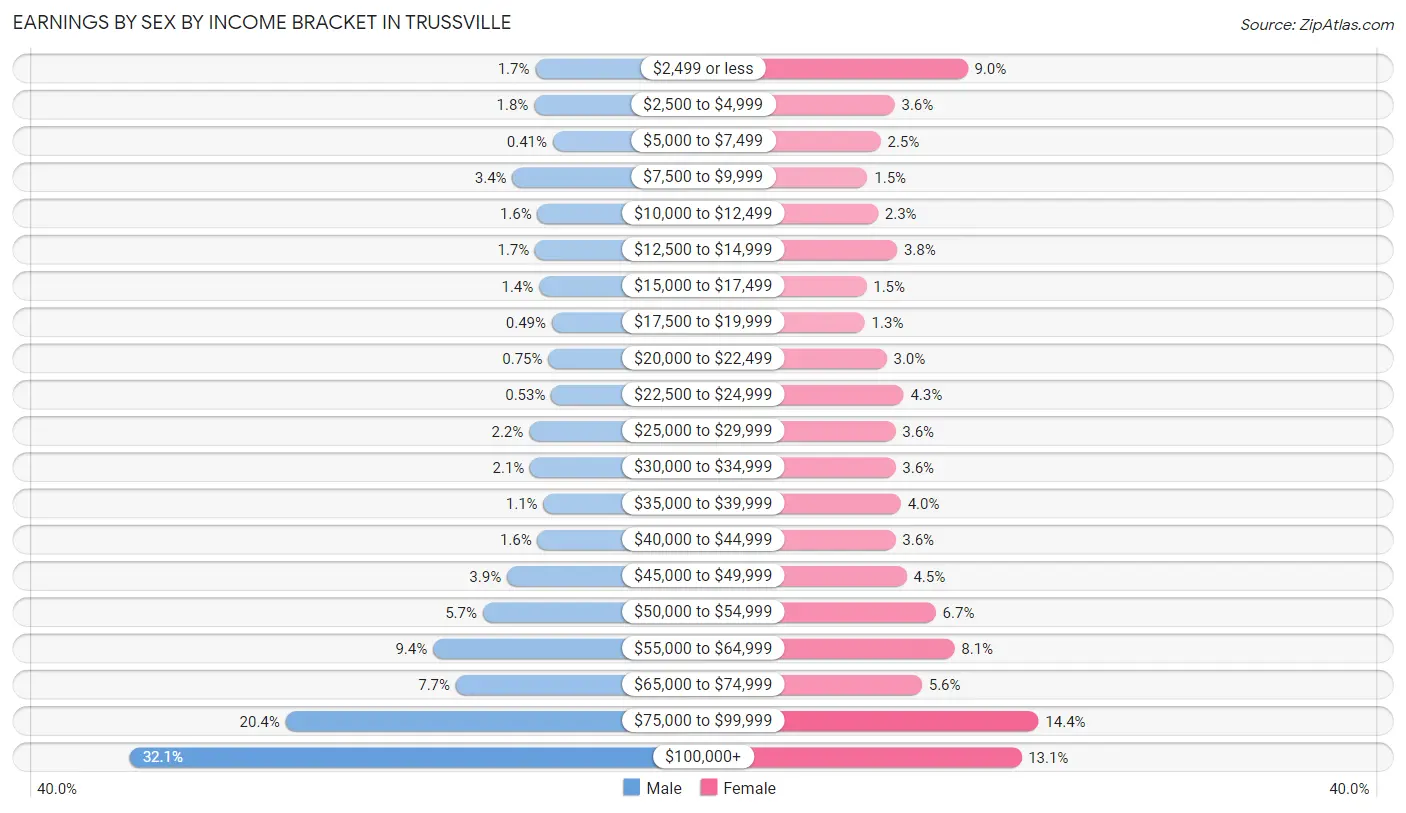
Earnings by Sex by Income Bracket in Trussville
The most common earnings brackets in Trussville are $100,000+ for men (2,436 | 32.1%) and $75,000 to $99,999 for women (935 | 14.4%).
| Income | Male | Female |
| $2,499 or less | 131 (1.7%) | 589 (9.0%) |
| $2,500 to $4,999 | 137 (1.8%) | 233 (3.6%) |
| $5,000 to $7,499 | 31 (0.4%) | 165 (2.5%) |
| $7,500 to $9,999 | 261 (3.4%) | 100 (1.5%) |
| $10,000 to $12,499 | 118 (1.6%) | 152 (2.3%) |
| $12,500 to $14,999 | 132 (1.7%) | 245 (3.8%) |
| $15,000 to $17,499 | 109 (1.4%) | 95 (1.5%) |
| $17,500 to $19,999 | 37 (0.5%) | 87 (1.3%) |
| $20,000 to $22,499 | 57 (0.7%) | 194 (3.0%) |
| $22,500 to $24,999 | 40 (0.5%) | 277 (4.3%) |
| $25,000 to $29,999 | 166 (2.2%) | 237 (3.6%) |
| $30,000 to $34,999 | 160 (2.1%) | 237 (3.6%) |
| $35,000 to $39,999 | 85 (1.1%) | 263 (4.0%) |
| $40,000 to $44,999 | 118 (1.6%) | 237 (3.6%) |
| $45,000 to $49,999 | 292 (3.8%) | 291 (4.5%) |
| $50,000 to $54,999 | 429 (5.7%) | 434 (6.7%) |
| $55,000 to $64,999 | 712 (9.4%) | 525 (8.1%) |
| $65,000 to $74,999 | 582 (7.7%) | 366 (5.6%) |
| $75,000 to $99,999 | 1,550 (20.4%) | 935 (14.4%) |
| $100,000+ | 2,436 (32.1%) | 851 (13.1%) |
| Total | 7,583 (100.0%) | 6,513 (100.0%) |
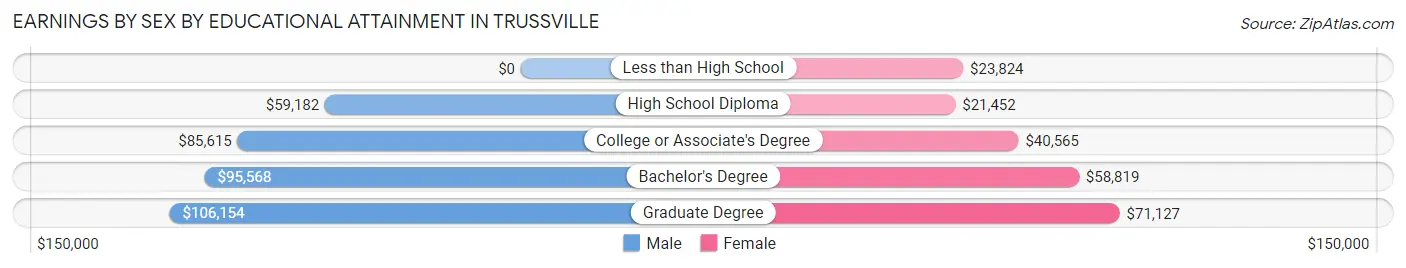
Earnings by Sex by Educational Attainment in Trussville
Average earnings in Trussville are $85,805 for men and $52,698 for women, a difference of 38.6%. Men with an educational attainment of graduate degree enjoy the highest average annual earnings of $106,154, while those with high school diploma education earn the least with $59,182. Women with an educational attainment of graduate degree earn the most with the average annual earnings of $71,127, while those with high school diploma education have the smallest earnings of $21,452.
| Educational Attainment | Male Income | Female Income |
| Less than High School | - | - |
| High School Diploma | $59,182 | $21,452 |
| College or Associate's Degree | $85,615 | $40,565 |
| Bachelor's Degree | $95,568 | $58,819 |
| Graduate Degree | $106,154 | $71,127 |
| Total | $85,805 | $52,698 |
Family Income in Trussville
Family Income Brackets in Trussville
According to the Trussville family income data, there are 1,852 families falling into the $200,000+ income range, which is the most common income bracket and makes up 25.2% of all families. Conversely, the less than $10,000 income bracket is the least frequent group with only 15 families (0.2%) belonging to this category.
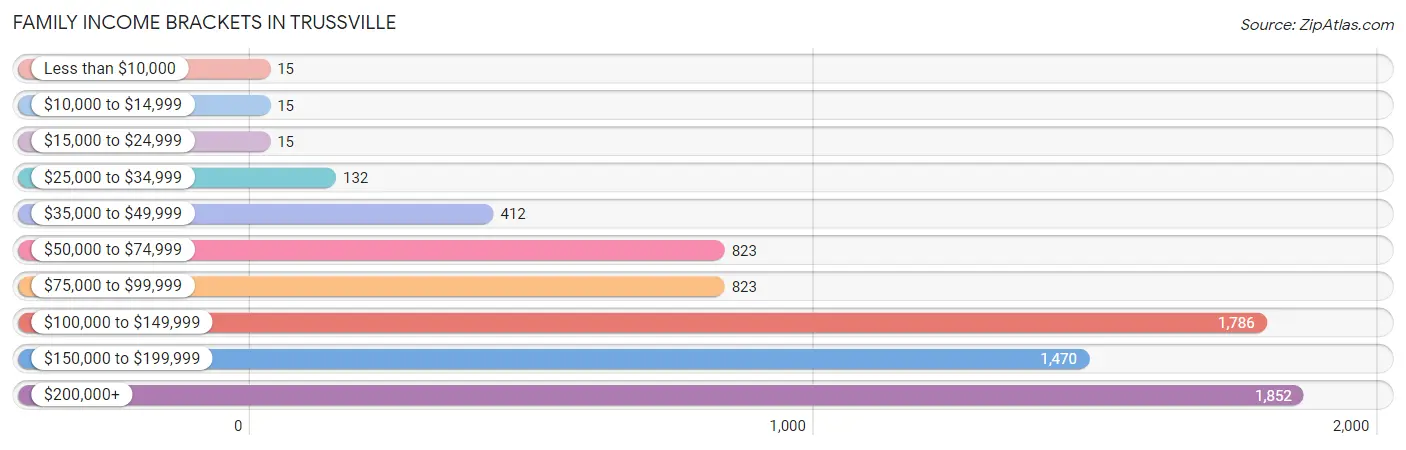
| Income Bracket | # Families | % Families |
| Less than $10,000 | 15 | 0.2% |
| $10,000 to $14,999 | 15 | 0.2% |
| $15,000 to $24,999 | 15 | 0.2% |
| $25,000 to $34,999 | 132 | 1.8% |
| $35,000 to $49,999 | 412 | 5.6% |
| $50,000 to $74,999 | 823 | 11.2% |
| $75,000 to $99,999 | 823 | 11.2% |
| $100,000 to $149,999 | 1,786 | 24.3% |
| $150,000 to $199,999 | 1,470 | 20.0% |
| $200,000+ | 1,852 | 25.2% |
Family Income by Famaliy Size in Trussville
5-person families (540 | 7.3%) account for the highest median family income in Trussville with $160,326 per family, while 3-person families (2,177 | 29.6%) have the highest median income of $53,338 per family member.
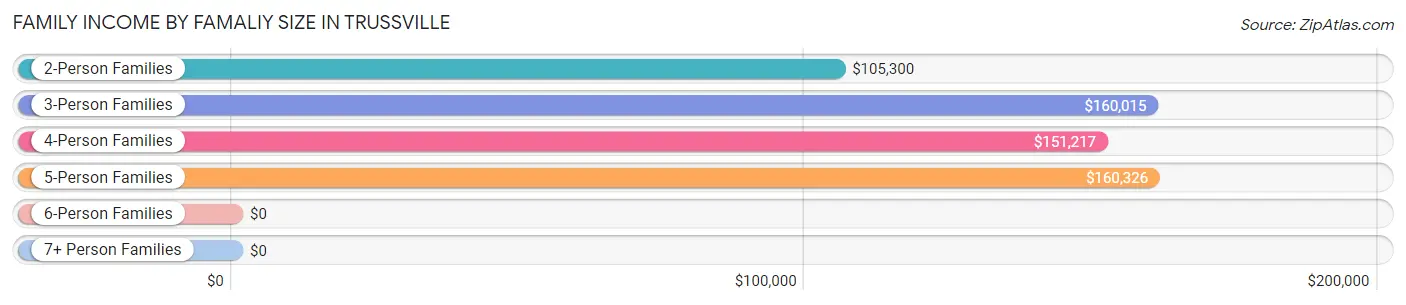
| Income Bracket | # Families | Median Income |
| 2-Person Families | 3,048 (41.5%) | $105,300 |
| 3-Person Families | 2,177 (29.6%) | $160,015 |
| 4-Person Families | 1,345 (18.3%) | $151,217 |
| 5-Person Families | 540 (7.3%) | $160,326 |
| 6-Person Families | 190 (2.6%) | $0 |
| 7+ Person Families | 50 (0.7%) | $0 |
| Total | 7,350 (100.0%) | $135,887 |
Family Income by Number of Earners in Trussville
The median family income in Trussville is $135,887, with families comprising 3+ earners (909) having the highest median family income of $205,685, while families with no earners (908) have the lowest median family income of $72,639, accounting for 12.4% and 12.3% of families, respectively.
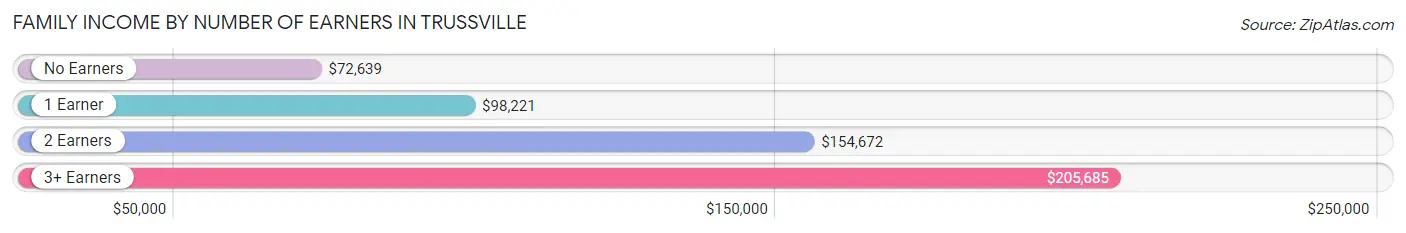
| Number of Earners | # Families | Median Income |
| No Earners | 908 (12.3%) | $72,639 |
| 1 Earner | 1,876 (25.5%) | $98,221 |
| 2 Earners | 3,657 (49.8%) | $154,672 |
| 3+ Earners | 909 (12.4%) | $205,685 |
| Total | 7,350 (100.0%) | $135,887 |
Household Income in Trussville
Household Income Brackets in Trussville
With 1,926 households falling in the category, the $100,000 to $149,999 income range is the most frequent in Trussville, accounting for 21.1% of all households. In contrast, only 37 households (0.4%) fall into the $10,000 to $14,999 income bracket, making it the least populous group.
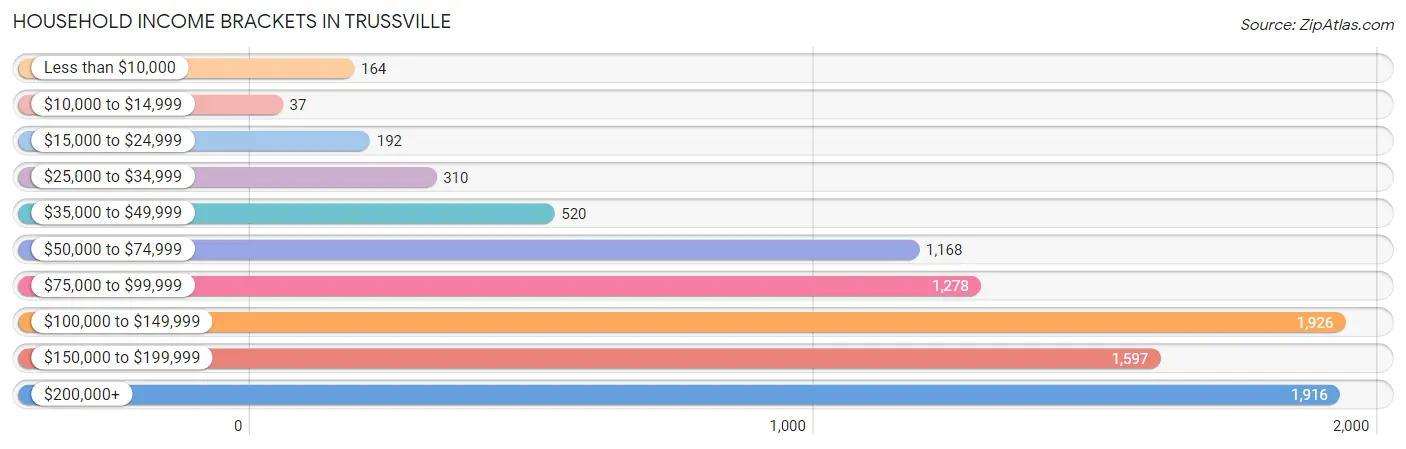
| Income Bracket | # Households | % Households |
| Less than $10,000 | 164 | 1.8% |
| $10,000 to $14,999 | 37 | 0.4% |
| $15,000 to $24,999 | 192 | 2.1% |
| $25,000 to $34,999 | 310 | 3.4% |
| $35,000 to $49,999 | 520 | 5.7% |
| $50,000 to $74,999 | 1,168 | 12.8% |
| $75,000 to $99,999 | 1,278 | 14.0% |
| $100,000 to $149,999 | 1,926 | 21.1% |
| $150,000 to $199,999 | 1,597 | 17.5% |
| $200,000+ | 1,916 | 21.0% |
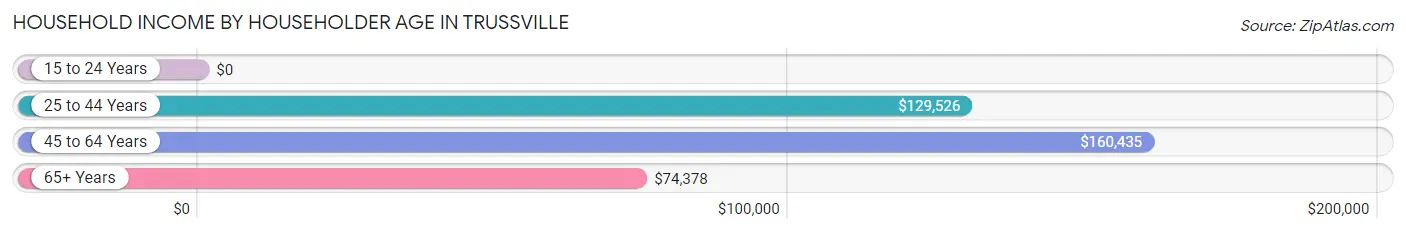
Household Income by Householder Age in Trussville
The median household income in Trussville is $118,028, with the highest median household income of $160,435 found in the 45 to 64 years age bracket for the primary householder. A total of 4,054 households (44.4%) fall into this category. Meanwhile, the 15 to 24 years age bracket for the primary householder has the lowest median household income of $0, with 11 households (0.1%) in this group.
| Income Bracket | # Households | Median Income |
| 15 to 24 Years | 11 (0.1%) | $0 |
| 25 to 44 Years | 2,677 (29.3%) | $129,526 |
| 45 to 64 Years | 4,054 (44.4%) | $160,435 |
| 65+ Years | 2,384 (26.1%) | $74,378 |
| Total | 9,126 (100.0%) | $118,028 |
Poverty in Trussville
Income Below Poverty by Sex and Age in Trussville
With 1.0% poverty level for males and 2.4% for females among the residents of Trussville, 18 to 24 year old males and 75 year old and over females are the most vulnerable to poverty, with 27 males (2.8%) and 138 females (16.9%) in their respective age groups living below the poverty level.
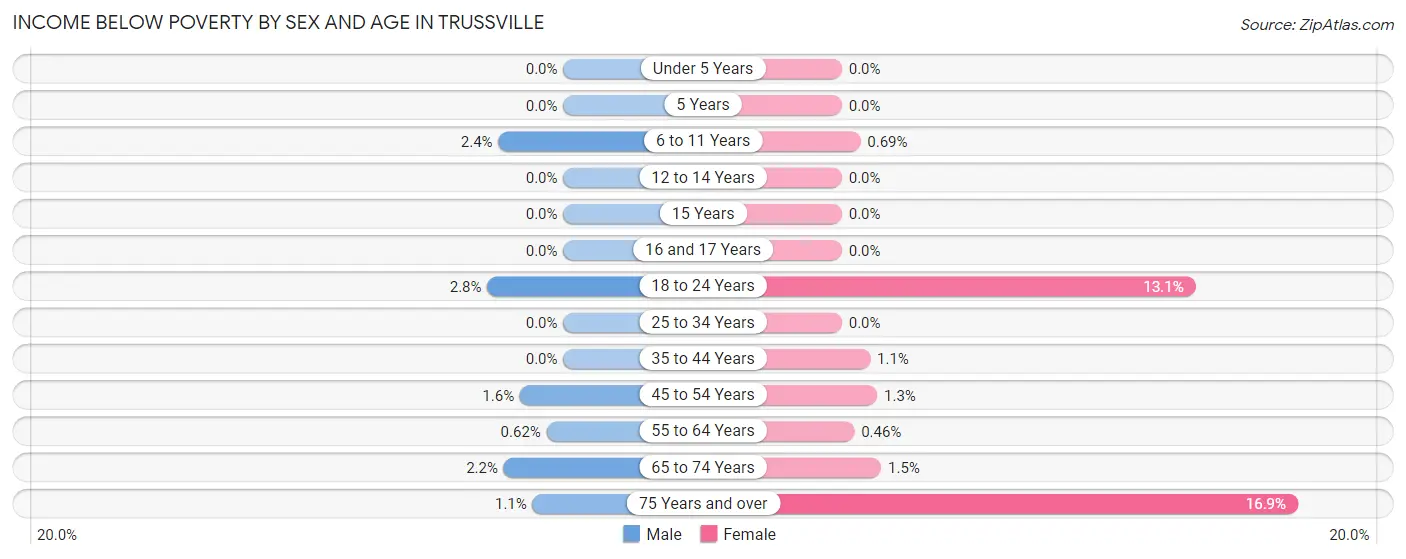
| Age Bracket | Male | Female |
| Under 5 Years | 0 (0.0%) | 0 (0.0%) |
| 5 Years | 0 (0.0%) | 0 (0.0%) |
| 6 to 11 Years | 24 (2.4%) | 8 (0.7%) |
| 12 to 14 Years | 0 (0.0%) | 0 (0.0%) |
| 15 Years | 0 (0.0%) | 0 (0.0%) |
| 16 and 17 Years | 0 (0.0%) | 0 (0.0%) |
| 18 to 24 Years | 27 (2.8%) | 88 (13.1%) |
| 25 to 34 Years | 0 (0.0%) | 0 (0.0%) |
| 35 to 44 Years | 0 (0.0%) | 22 (1.1%) |
| 45 to 54 Years | 34 (1.6%) | 24 (1.3%) |
| 55 to 64 Years | 11 (0.6%) | 9 (0.5%) |
| 65 to 74 Years | 24 (2.2%) | 19 (1.5%) |
| 75 Years and over | 7 (1.1%) | 138 (16.9%) |
| Total | 127 (1.0%) | 308 (2.4%) |
Income Above Poverty by Sex and Age in Trussville
According to the poverty statistics in Trussville, males aged under 5 years and females aged under 5 years are the age groups that are most secure financially, with 100.0% of males and 100.0% of females in these age groups living above the poverty line.
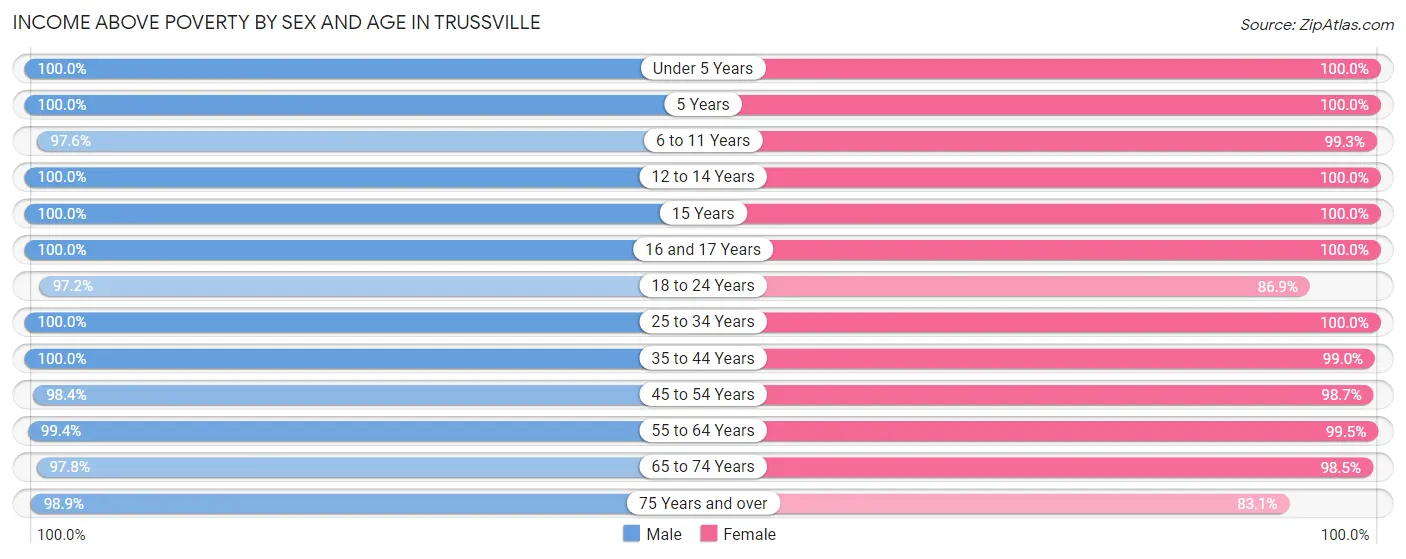
| Age Bracket | Male | Female |
| Under 5 Years | 683 (100.0%) | 509 (100.0%) |
| 5 Years | 207 (100.0%) | 179 (100.0%) |
| 6 to 11 Years | 970 (97.6%) | 1,151 (99.3%) |
| 12 to 14 Years | 748 (100.0%) | 574 (100.0%) |
| 15 Years | 108 (100.0%) | 92 (100.0%) |
| 16 and 17 Years | 311 (100.0%) | 638 (100.0%) |
| 18 to 24 Years | 929 (97.2%) | 582 (86.9%) |
| 25 to 34 Years | 1,058 (100.0%) | 837 (100.0%) |
| 35 to 44 Years | 2,099 (100.0%) | 2,083 (99.0%) |
| 45 to 54 Years | 2,074 (98.4%) | 1,803 (98.7%) |
| 55 to 64 Years | 1,769 (99.4%) | 1,968 (99.5%) |
| 65 to 74 Years | 1,062 (97.8%) | 1,285 (98.5%) |
| 75 Years and over | 606 (98.9%) | 677 (83.1%) |
| Total | 12,624 (99.0%) | 12,378 (97.6%) |
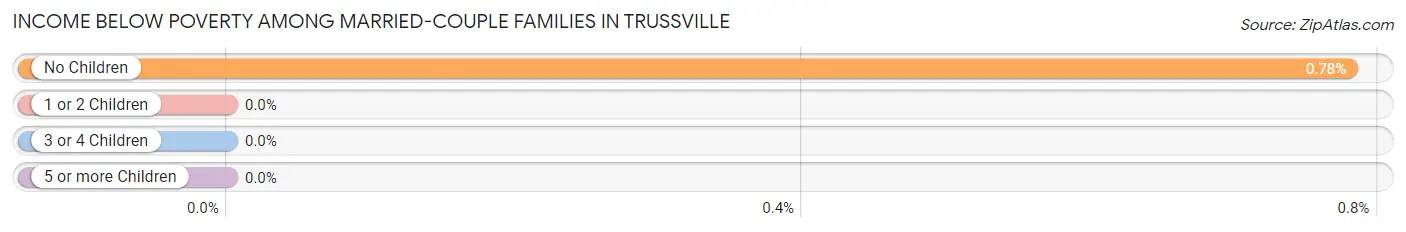
Income Below Poverty Among Married-Couple Families in Trussville
The poverty statistics for married-couple families in Trussville show that 0.5% or 30 of the total 6,485 families live below the poverty line. Families with no children have the highest poverty rate of 0.8%, comprising of 30 families. On the other hand, families with 1 or 2 children have the lowest poverty rate of 0.0%, which includes 0 families.
| Children | Above Poverty | Below Poverty |
| No Children | 3,793 (99.2%) | 30 (0.8%) |
| 1 or 2 Children | 2,176 (100.0%) | 0 (0.0%) |
| 3 or 4 Children | 482 (100.0%) | 0 (0.0%) |
| 5 or more Children | 4 (100.0%) | 0 (0.0%) |
| Total | 6,455 (99.5%) | 30 (0.5%) |
Income Below Poverty Among Single-Parent Households in Trussville
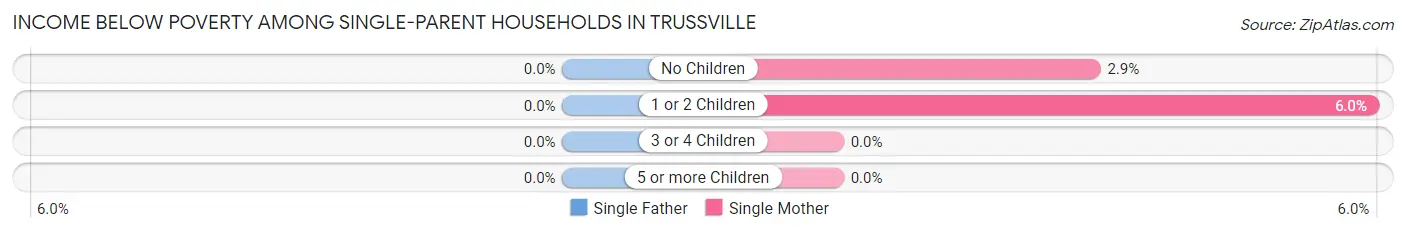
| Children | Single Father | Single Mother |
| No Children | 0 (0.0%) | 8 (2.9%) |
| 1 or 2 Children | 0 (0.0%) | 22 (6.0%) |
| 3 or 4 Children | 0 (0.0%) | 0 (0.0%) |
| 5 or more Children | 0 (0.0%) | 0 (0.0%) |
| Total | 0 (0.0%) | 30 (4.3%) |
Income Below Poverty Among Married-Couple vs Single-Parent Households in Trussville
The poverty data for Trussville shows that 30 of the married-couple family households (0.5%) and 30 of the single-parent households (3.5%) are living below the poverty level. Within the married-couple family households, those with no children have the highest poverty rate, with 30 households (0.8%) falling below the poverty line. Among the single-parent households, those with 1 or 2 children have the highest poverty rate, with 22 household (4.9%) living below poverty.
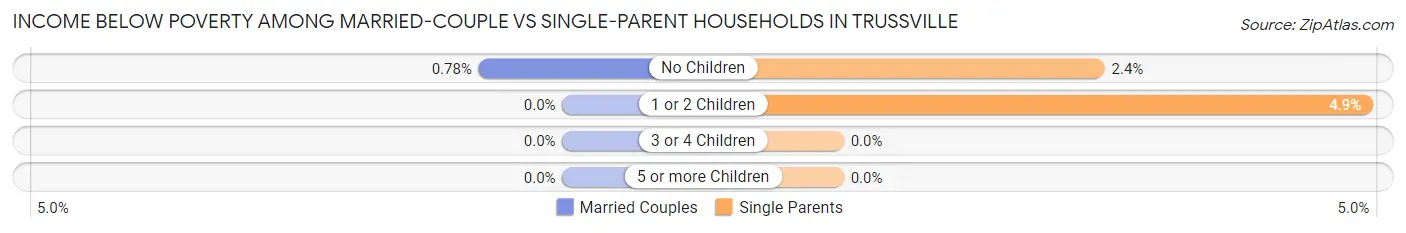
| Children | Married-Couple Families | Single-Parent Households |
| No Children | 30 (0.8%) | 8 (2.4%) |
| 1 or 2 Children | 0 (0.0%) | 22 (4.9%) |
| 3 or 4 Children | 0 (0.0%) | 0 (0.0%) |
| 5 or more Children | 0 (0.0%) | 0 (0.0%) |
| Total | 30 (0.5%) | 30 (3.5%) |
Race in Trussville
The most populous races in Trussville are White / Caucasian (21,789 | 85.0%), Black / African American (2,321 | 9.1%), and Two or more Races (895 | 3.5%).
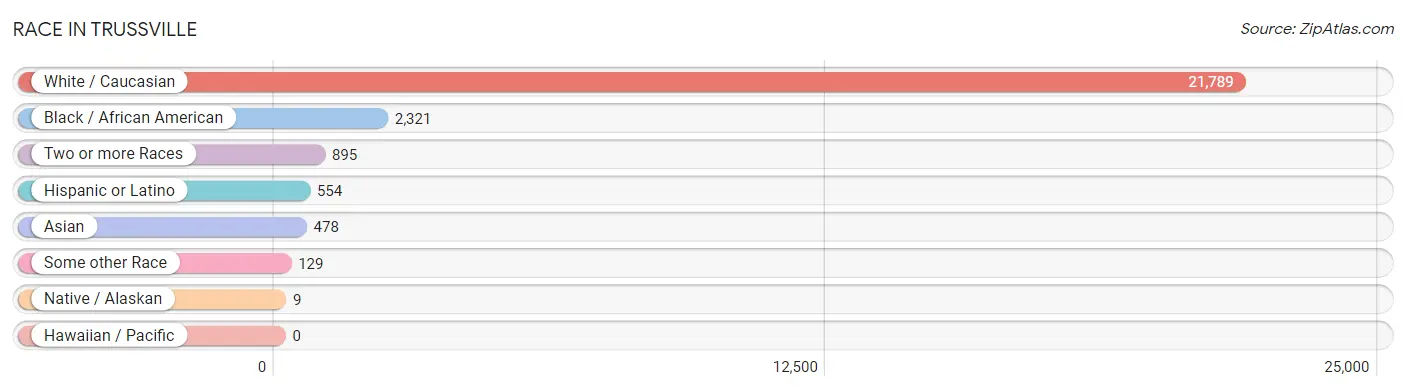
| Race | # Population | % Population |
| Asian | 478 | 1.9% |
| Black / African American | 2,321 | 9.1% |
| Hawaiian / Pacific | 0 | 0.0% |
| Hispanic or Latino | 554 | 2.2% |
| Native / Alaskan | 9 | 0.0% |
| White / Caucasian | 21,789 | 85.0% |
| Two or more Races | 895 | 3.5% |
| Some other Race | 129 | 0.5% |
| Total | 25,621 | 100.0% |
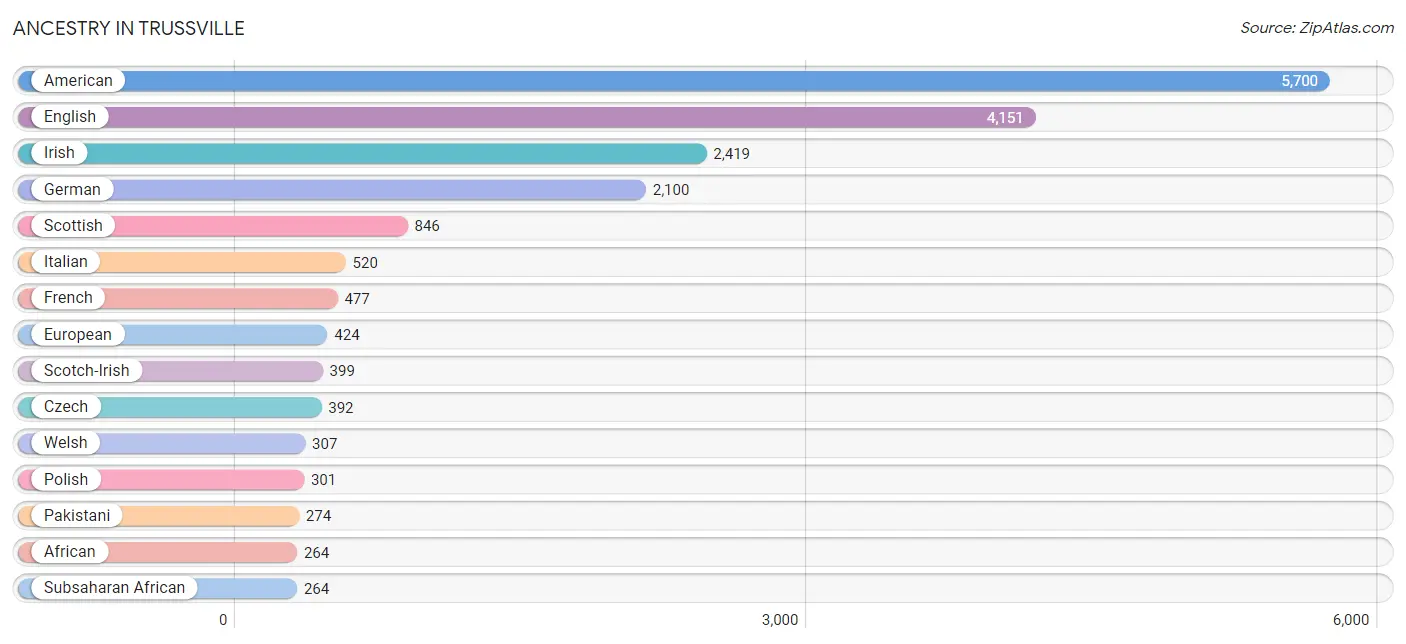
Ancestry in Trussville
The most populous ancestries reported in Trussville are American (5,700 | 22.3%), English (4,151 | 16.2%), Irish (2,419 | 9.4%), German (2,100 | 8.2%), and Scottish (846 | 3.3%), together accounting for 59.4% of all Trussville residents.
| Ancestry | # Population | % Population |
| African | 264 | 1.0% |
| American | 5,700 | 22.3% |
| Arab | 93 | 0.4% |
| Argentinean | 68 | 0.3% |
| Austrian | 43 | 0.2% |
| Belgian | 23 | 0.1% |
| British | 129 | 0.5% |
| Canadian | 8 | 0.0% |
| Cherokee | 167 | 0.6% |
| Colombian | 61 | 0.2% |
| Creek | 14 | 0.1% |
| Cuban | 88 | 0.3% |
| Czech | 392 | 1.5% |
| Danish | 11 | 0.0% |
| Dutch | 147 | 0.6% |
| Eastern European | 9 | 0.0% |
| English | 4,151 | 16.2% |
| European | 424 | 1.7% |
| French | 477 | 1.9% |
| French Canadian | 150 | 0.6% |
| German | 2,100 | 8.2% |
| Greek | 9 | 0.0% |
| Hungarian | 44 | 0.2% |
| Indian (Asian) | 93 | 0.4% |
| Iranian | 8 | 0.0% |
| Irish | 2,419 | 9.4% |
| Italian | 520 | 2.0% |
| Kenyan | 27 | 0.1% |
| Korean | 108 | 0.4% |
| Latvian | 13 | 0.1% |
| Mexican | 89 | 0.4% |
| Mongolian | 243 | 0.9% |
| Northern European | 12 | 0.1% |
| Norwegian | 42 | 0.2% |
| Pakistani | 274 | 1.1% |
| Polish | 301 | 1.2% |
| Puerto Rican | 49 | 0.2% |
| Russian | 172 | 0.7% |
| Scotch-Irish | 399 | 1.6% |
| Scottish | 846 | 3.3% |
| Slovak | 17 | 0.1% |
| South American | 129 | 0.5% |
| Spanish | 117 | 0.5% |
| Sri Lankan | 22 | 0.1% |
| Subsaharan African | 264 | 1.0% |
| Swedish | 89 | 0.4% |
| Swiss | 39 | 0.2% |
| Syrian | 93 | 0.4% |
| Thai | 73 | 0.3% |
| Welsh | 307 | 1.2% | View All 50 Rows |
Immigrants in Trussville
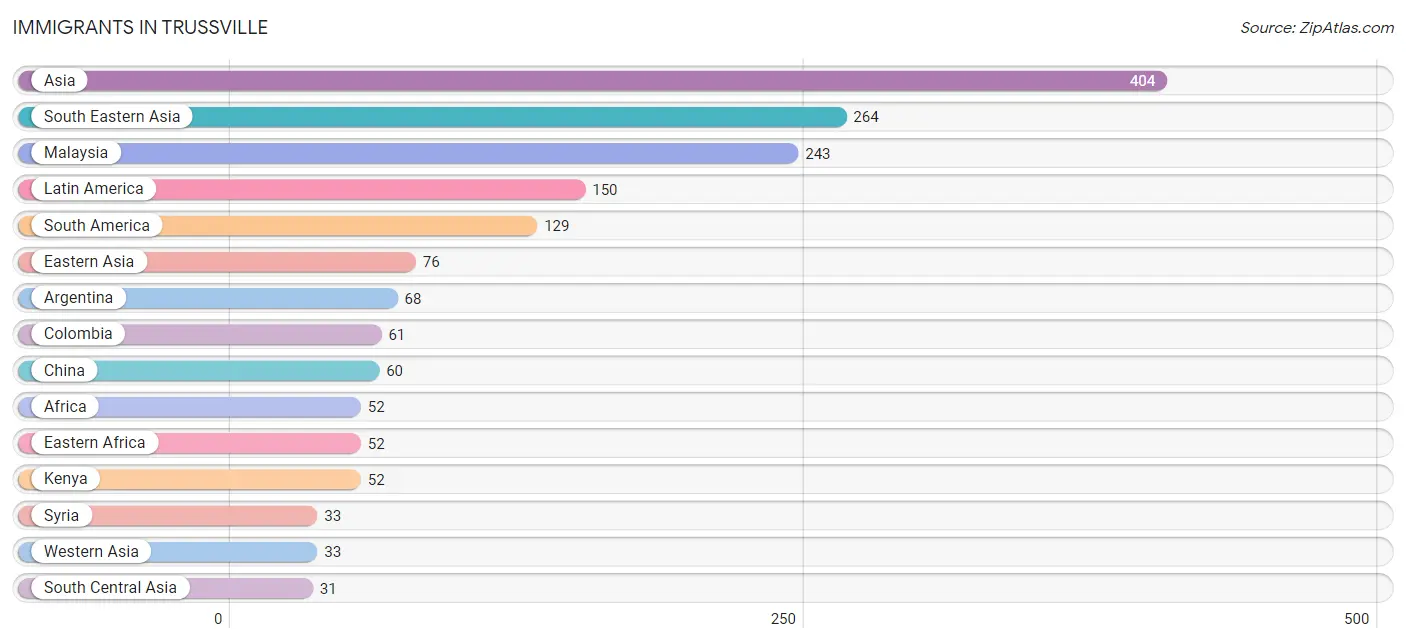
The most numerous immigrant groups reported in Trussville came from Asia (404 | 1.6%), South Eastern Asia (264 | 1.0%), Malaysia (243 | 0.9%), Latin America (150 | 0.6%), and South America (129 | 0.5%), together accounting for 4.6% of all Trussville residents.
| Immigration Origin | # Population | % Population |
| Africa | 52 | 0.2% |
| Argentina | 68 | 0.3% |
| Asia | 404 | 1.6% |
| Canada | 15 | 0.1% |
| Central America | 21 | 0.1% |
| China | 60 | 0.2% |
| Colombia | 61 | 0.2% |
| Eastern Africa | 52 | 0.2% |
| Eastern Asia | 76 | 0.3% |
| Europe | 16 | 0.1% |
| Germany | 16 | 0.1% |
| India | 23 | 0.1% |
| Iran | 8 | 0.0% |
| Kenya | 52 | 0.2% |
| Korea | 16 | 0.1% |
| Latin America | 150 | 0.6% |
| Malaysia | 243 | 0.9% |
| Mexico | 21 | 0.1% |
| Philippines | 5 | 0.0% |
| South America | 129 | 0.5% |
| South Central Asia | 31 | 0.1% |
| South Eastern Asia | 264 | 1.0% |
| Syria | 33 | 0.1% |
| Vietnam | 16 | 0.1% |
| Western Asia | 33 | 0.1% |
| Western Europe | 16 | 0.1% | View All 26 Rows |
Sex and Age in Trussville
Sex and Age in Trussville
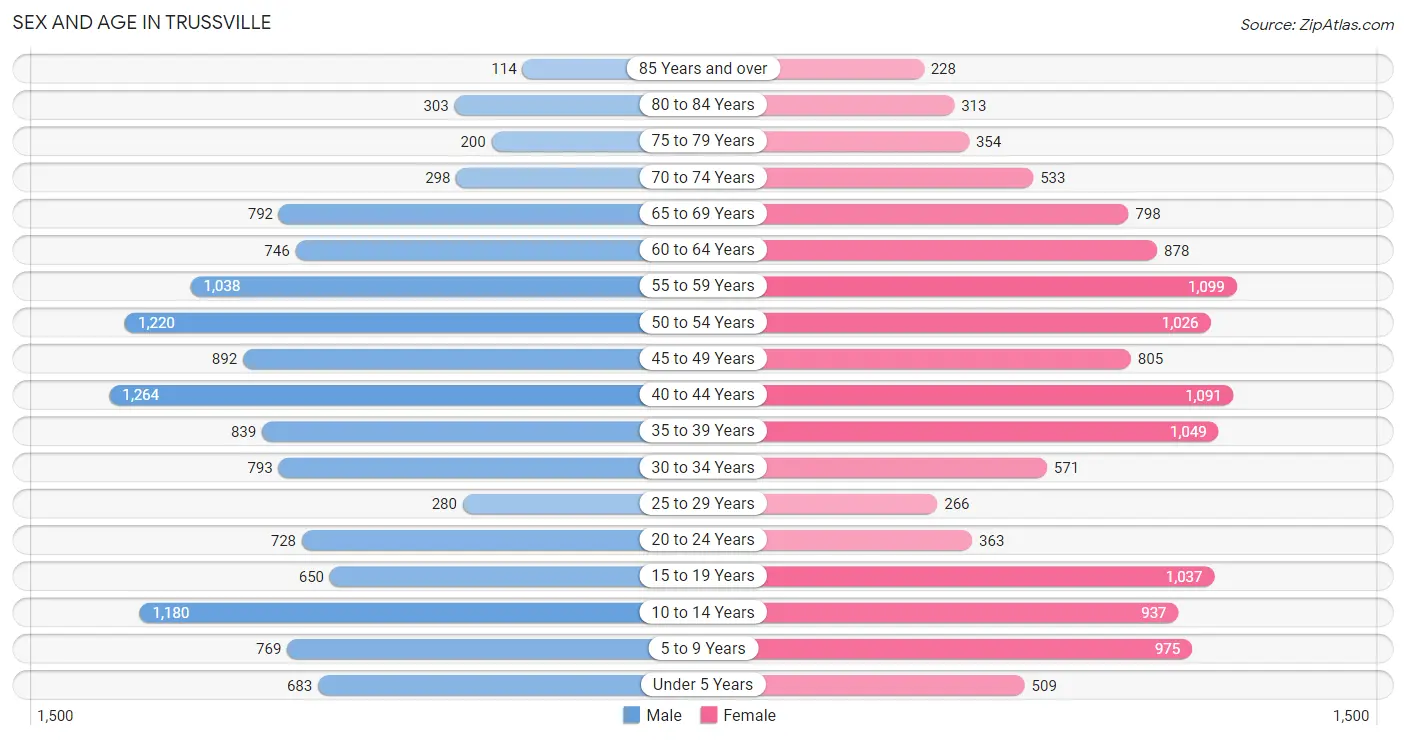
The most populous age groups in Trussville are 40 to 44 Years (1,264 | 9.9%) for men and 55 to 59 Years (1,099 | 8.6%) for women.
| Age Bracket | Male | Female |
| Under 5 Years | 683 (5.3%) | 509 (4.0%) |
| 5 to 9 Years | 769 (6.0%) | 975 (7.6%) |
| 10 to 14 Years | 1,180 (9.2%) | 937 (7.3%) |
| 15 to 19 Years | 650 (5.1%) | 1,037 (8.1%) |
| 20 to 24 Years | 728 (5.7%) | 363 (2.8%) |
| 25 to 29 Years | 280 (2.2%) | 266 (2.1%) |
| 30 to 34 Years | 793 (6.2%) | 571 (4.4%) |
| 35 to 39 Years | 839 (6.6%) | 1,049 (8.2%) |
| 40 to 44 Years | 1,264 (9.9%) | 1,091 (8.5%) |
| 45 to 49 Years | 892 (7.0%) | 805 (6.3%) |
| 50 to 54 Years | 1,220 (9.5%) | 1,026 (8.0%) |
| 55 to 59 Years | 1,038 (8.1%) | 1,099 (8.6%) |
| 60 to 64 Years | 746 (5.8%) | 878 (6.8%) |
| 65 to 69 Years | 792 (6.2%) | 798 (6.2%) |
| 70 to 74 Years | 298 (2.3%) | 533 (4.2%) |
| 75 to 79 Years | 200 (1.6%) | 354 (2.8%) |
| 80 to 84 Years | 303 (2.4%) | 313 (2.4%) |
| 85 Years and over | 114 (0.9%) | 228 (1.8%) |
| Total | 12,789 (100.0%) | 12,832 (100.0%) |
Families and Households in Trussville
Median Family Size in Trussville
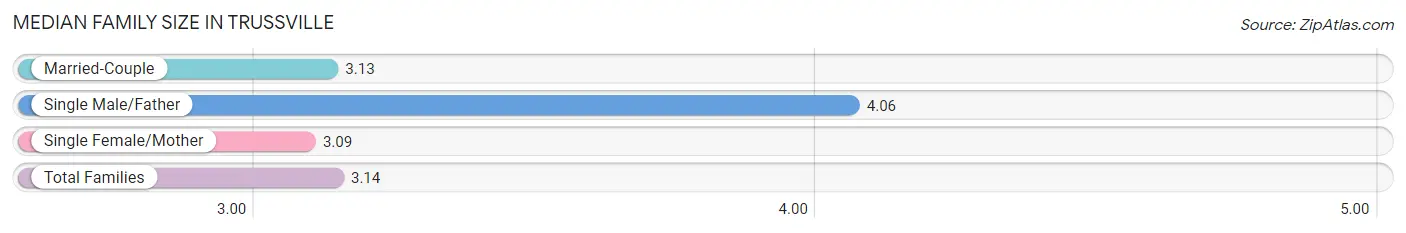
The median family size in Trussville is 3.14 persons per family, with single male/father families (160 | 2.2%) accounting for the largest median family size of 4.06 persons per family. On the other hand, single female/mother families (705 | 9.6%) represent the smallest median family size with 3.09 persons per family.
| Family Type | # Families | Family Size |
| Married-Couple | 6,485 (88.2%) | 3.13 |
| Single Male/Father | 160 (2.2%) | 4.06 |
| Single Female/Mother | 705 (9.6%) | 3.09 |
| Total Families | 7,350 (100.0%) | 3.14 |
Median Household Size in Trussville
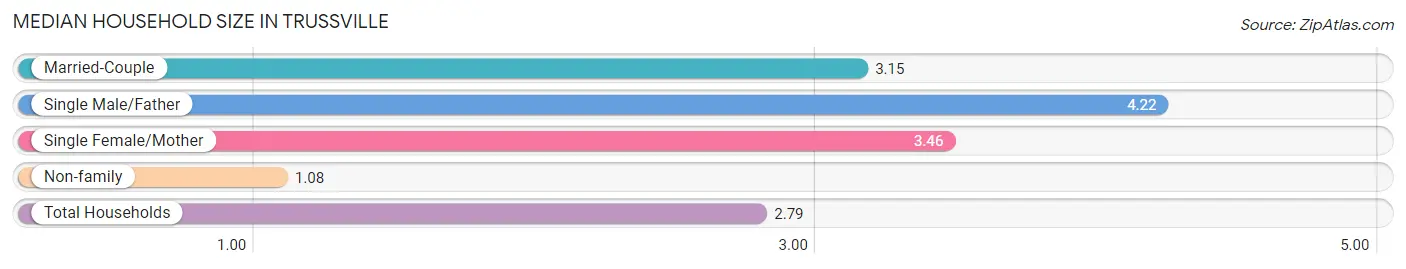
The median household size in Trussville is 2.79 persons per household, with single male/father households (160 | 1.8%) accounting for the largest median household size of 4.22 persons per household. non-family households (1,776 | 19.5%) represent the smallest median household size with 1.08 persons per household.
| Household Type | # Households | Household Size |
| Married-Couple | 6,485 (71.1%) | 3.15 |
| Single Male/Father | 160 (1.8%) | 4.22 |
| Single Female/Mother | 705 (7.7%) | 3.46 |
| Non-family | 1,776 (19.5%) | 1.08 |
| Total Households | 9,126 (100.0%) | 2.79 |
Household Size by Marriage Status in Trussville
Out of a total of 9,126 households in Trussville, 7,350 (80.5%) are family households, while 1,776 (19.5%) are nonfamily households. The most numerous type of family households are 2-person households, comprising 2,855, and the most common type of nonfamily households are 1-person households, comprising 1,560.
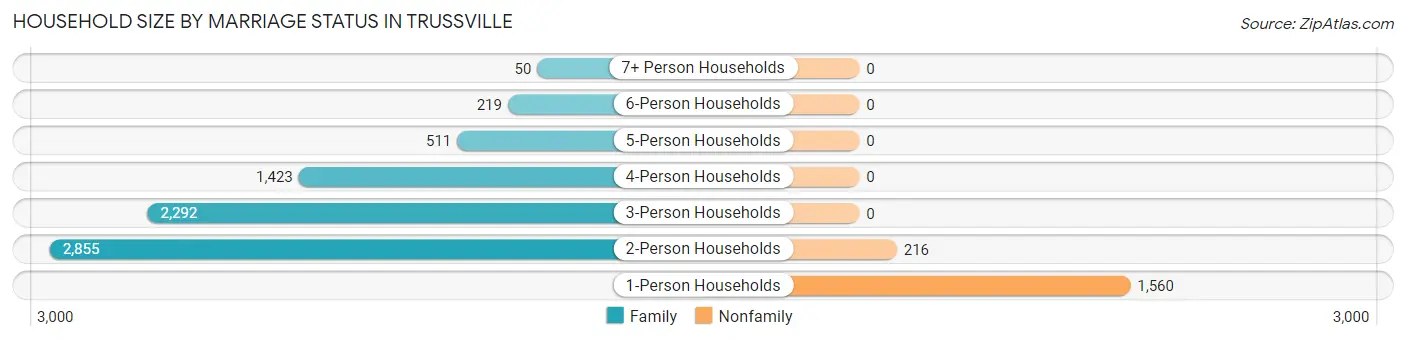
| Household Size | Family Households | Nonfamily Households |
| 1-Person Households | - | 1,560 (17.1%) |
| 2-Person Households | 2,855 (31.3%) | 216 (2.4%) |
| 3-Person Households | 2,292 (25.1%) | 0 (0.0%) |
| 4-Person Households | 1,423 (15.6%) | 0 (0.0%) |
| 5-Person Households | 511 (5.6%) | 0 (0.0%) |
| 6-Person Households | 219 (2.4%) | 0 (0.0%) |
| 7+ Person Households | 50 (0.5%) | 0 (0.0%) |
| Total | 7,350 (80.5%) | 1,776 (19.5%) |
Female Fertility in Trussville
Fertility by Age in Trussville
Average fertility rate in Trussville is 40.0 births per 1,000 women. Women in the age bracket of 20 to 34 years have the highest fertility rate with 113.0 births per 1,000 women. Women in the age bracket of 20 to 34 years acount for 61.9% of all women with births.
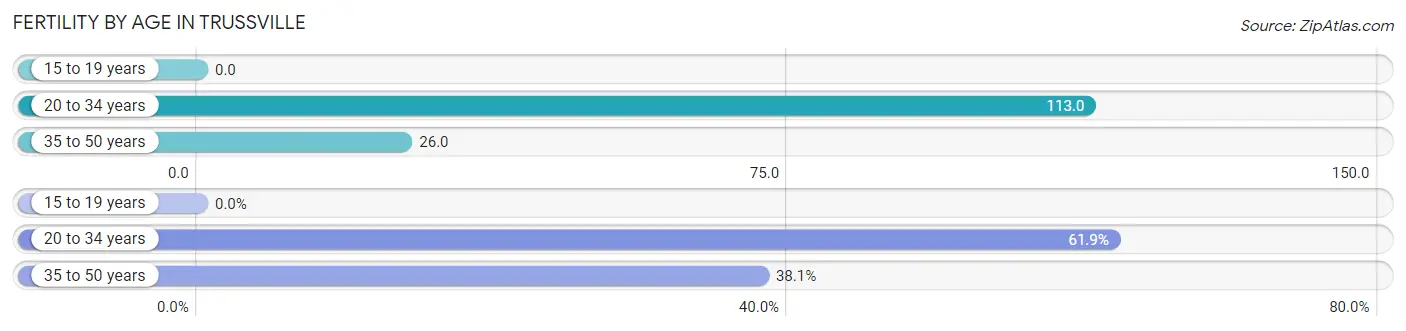
| Age Bracket | Women with Births | Births / 1,000 Women |
| 15 to 19 years | 0 (0.0%) | 0.0 |
| 20 to 34 years | 135 (61.9%) | 113.0 |
| 35 to 50 years | 83 (38.1%) | 26.0 |
| Total | 218 (100.0%) | 40.0 |
Fertility by Age by Marriage Status in Trussville
82.1% of women with births (218) in Trussville are married. The highest percentage of unmarried women with births falls into 20 to 34 years age bracket with 19.3% of them unmarried at the time of birth, while the lowest percentage of unmarried women with births belong to 35 to 50 years age bracket with 15.7% of them unmarried.
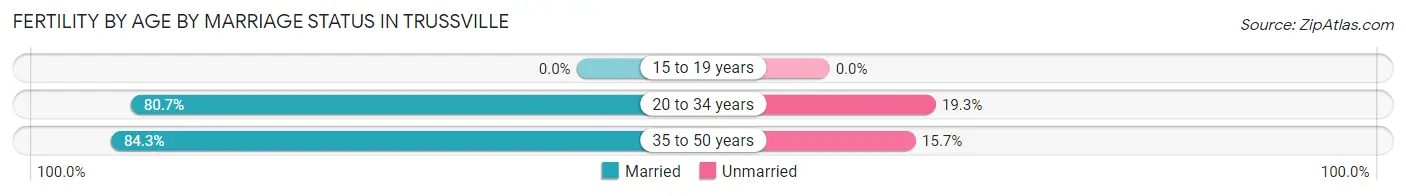
| Age Bracket | Married | Unmarried |
| 15 to 19 years | 0 (0.0%) | 0 (0.0%) |
| 20 to 34 years | 109 (80.7%) | 26 (19.3%) |
| 35 to 50 years | 70 (84.3%) | 13 (15.7%) |
| Total | 179 (82.1%) | 39 (17.9%) |
Fertility by Education in Trussville
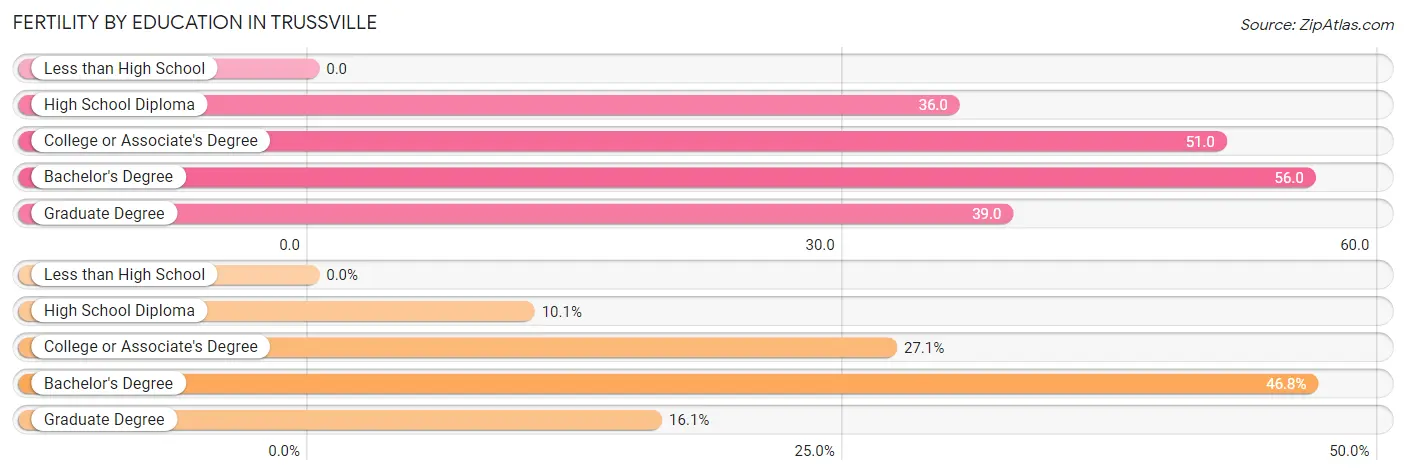
| Educational Attainment | Women with Births | Births / 1,000 Women |
| Less than High School | 0 (0.0%) | 0.0 |
| High School Diploma | 22 (10.1%) | 36.0 |
| College or Associate's Degree | 59 (27.1%) | 51.0 |
| Bachelor's Degree | 102 (46.8%) | 56.0 |
| Graduate Degree | 35 (16.1%) | 39.0 |
| Total | 218 (100.0%) | 40.0 |
Fertility by Education by Marriage Status in Trussville
17.9% of women with births in Trussville are unmarried. Women with the educational attainment of bachelor's degree are most likely to be married with 100.0% of them married at childbirth, while women with the educational attainment of high school diploma are least likely to be married with 59.1% of them unmarried at childbirth.
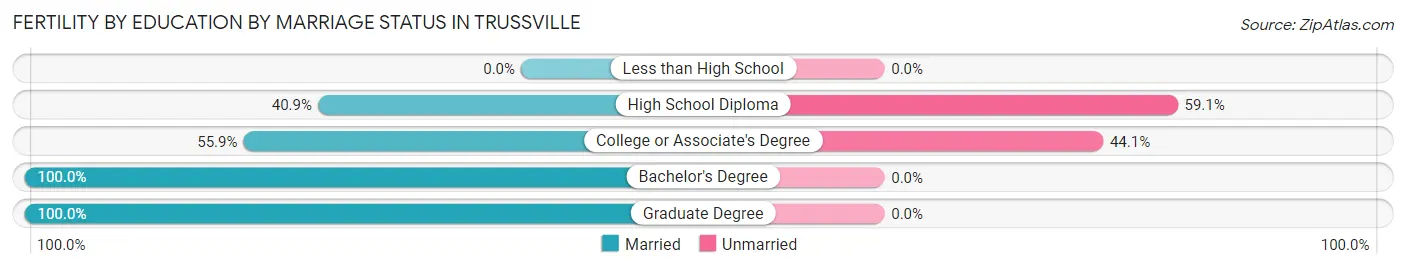
| Educational Attainment | Married | Unmarried |
| Less than High School | 0 (0.0%) | 0 (0.0%) |
| High School Diploma | 9 (40.9%) | 13 (59.1%) |
| College or Associate's Degree | 33 (55.9%) | 26 (44.1%) |
| Bachelor's Degree | 102 (100.0%) | 0 (0.0%) |
| Graduate Degree | 35 (100.0%) | 0 (0.0%) |
| Total | 179 (82.1%) | 39 (17.9%) |
Employment Characteristics in Trussville
Employment by Class of Employer in Trussville
Among the 12,843 employed individuals in Trussville, private company employees (7,690 | 59.9%), not-for-profit organizations (1,413 | 11.0%), and local government employees (1,292 | 10.1%) make up the most common classes of employment.
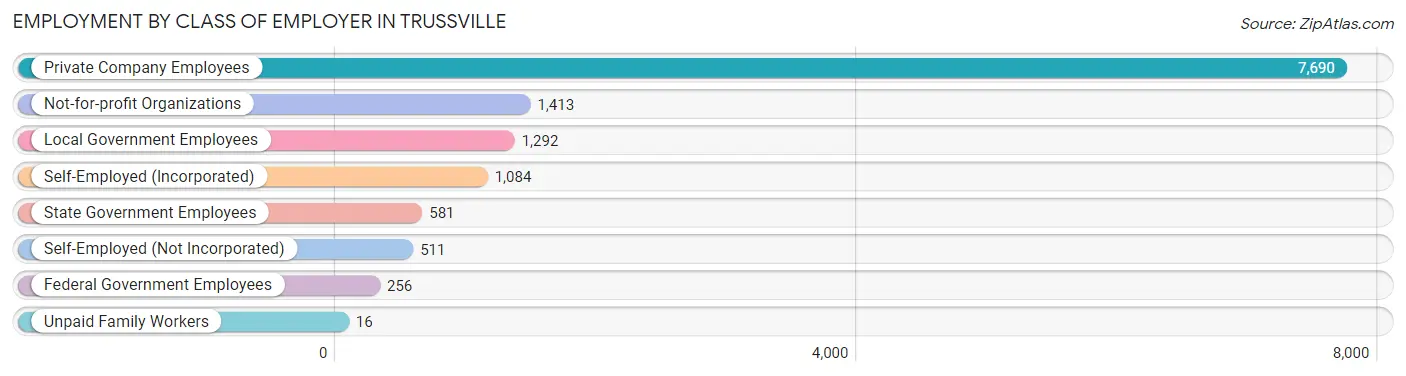
| Employer Class | # Employees | % Employees |
| Private Company Employees | 7,690 | 59.9% |
| Self-Employed (Incorporated) | 1,084 | 8.4% |
| Self-Employed (Not Incorporated) | 511 | 4.0% |
| Not-for-profit Organizations | 1,413 | 11.0% |
| Local Government Employees | 1,292 | 10.1% |
| State Government Employees | 581 | 4.5% |
| Federal Government Employees | 256 | 2.0% |
| Unpaid Family Workers | 16 | 0.1% |
| Total | 12,843 | 100.0% |
Employment Status by Age in Trussville
According to the labor force statistics for Trussville, out of the total population over 16 years of age (20,368), 66.0% or 13,443 individuals are in the labor force, with 2.8% or 376 of them unemployed. The age group with the highest labor force participation rate is 55 to 59 years, with 91.0% or 1,945 individuals in the labor force. Within the labor force, the 16 to 19 years age range has the highest percentage of unemployed individuals, with 9.0% or 50 of them being unemployed.
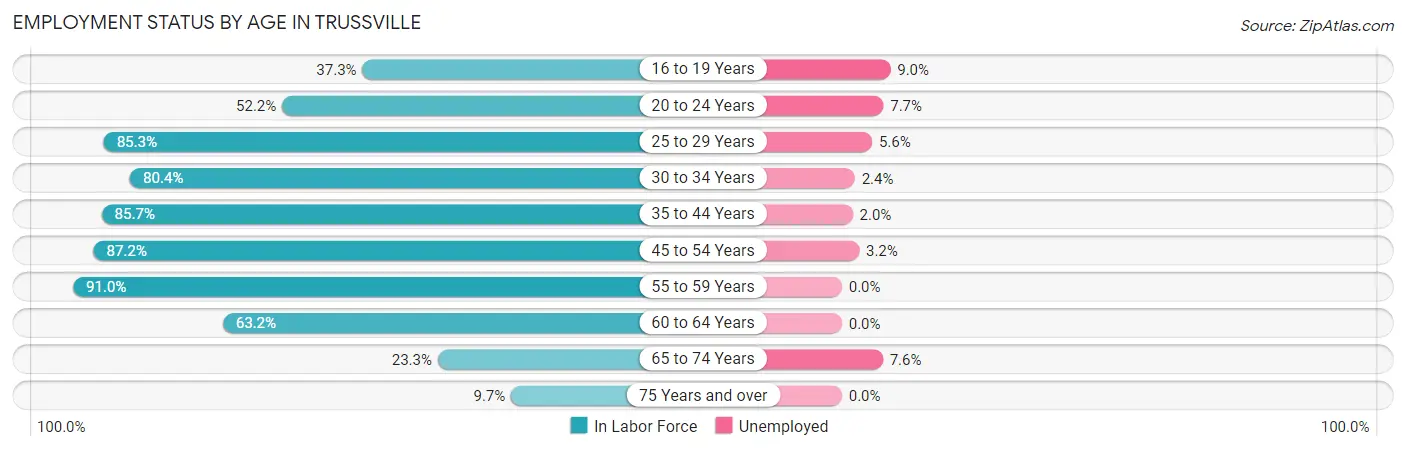
| Age Bracket | In Labor Force | Unemployed |
| 16 to 19 Years | 555 (37.3%) | 50 (9.0%) |
| 20 to 24 Years | 570 (52.2%) | 44 (7.7%) |
| 25 to 29 Years | 466 (85.3%) | 26 (5.6%) |
| 30 to 34 Years | 1,097 (80.4%) | 26 (2.4%) |
| 35 to 44 Years | 3,636 (85.7%) | 73 (2.0%) |
| 45 to 54 Years | 3,438 (87.2%) | 110 (3.2%) |
| 55 to 59 Years | 1,945 (91.0%) | 0 (0.0%) |
| 60 to 64 Years | 1,026 (63.2%) | 0 (0.0%) |
| 65 to 74 Years | 564 (23.3%) | 43 (7.6%) |
| 75 Years and over | 147 (9.7%) | 0 (0.0%) |
| Total | 13,443 (66.0%) | 376 (2.8%) |
Employment Status by Educational Attainment in Trussville
According to labor force statistics for Trussville, 83.8% of individuals (11,612) out of the total population between 25 and 64 years of age (13,857) are in the labor force, with 2.0% or 232 of them being unemployed. The group with the highest labor force participation rate are those with the educational attainment of bachelor's degree or higher, with 91.1% or 6,391 individuals in the labor force. Within the labor force, individuals with less than high school education have the highest percentage of unemployment, with 9.9% or 21 of them being unemployed.
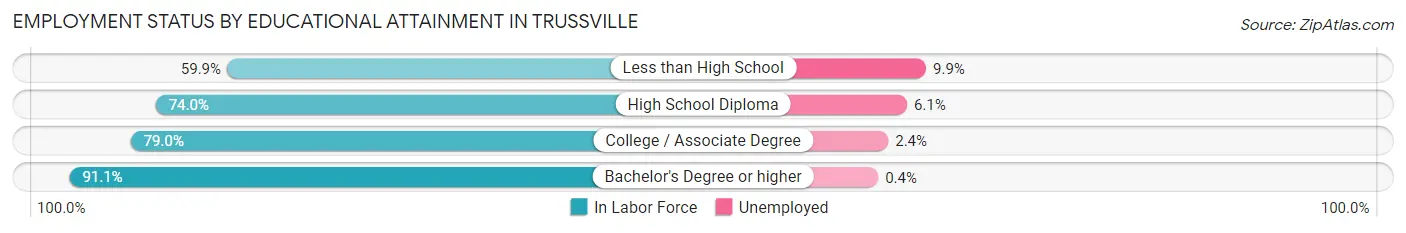
| Educational Attainment | In Labor Force | Unemployed |
| Less than High School | 212 (59.9%) | 35 (9.9%) |
| High School Diploma | 1,814 (74.0%) | 150 (6.1%) |
| College / Associate Degree | 3,188 (79.0%) | 97 (2.4%) |
| Bachelor's Degree or higher | 6,391 (91.1%) | 28 (0.4%) |
| Total | 11,612 (83.8%) | 277 (2.0%) |
Employment Occupations by Sex in Trussville
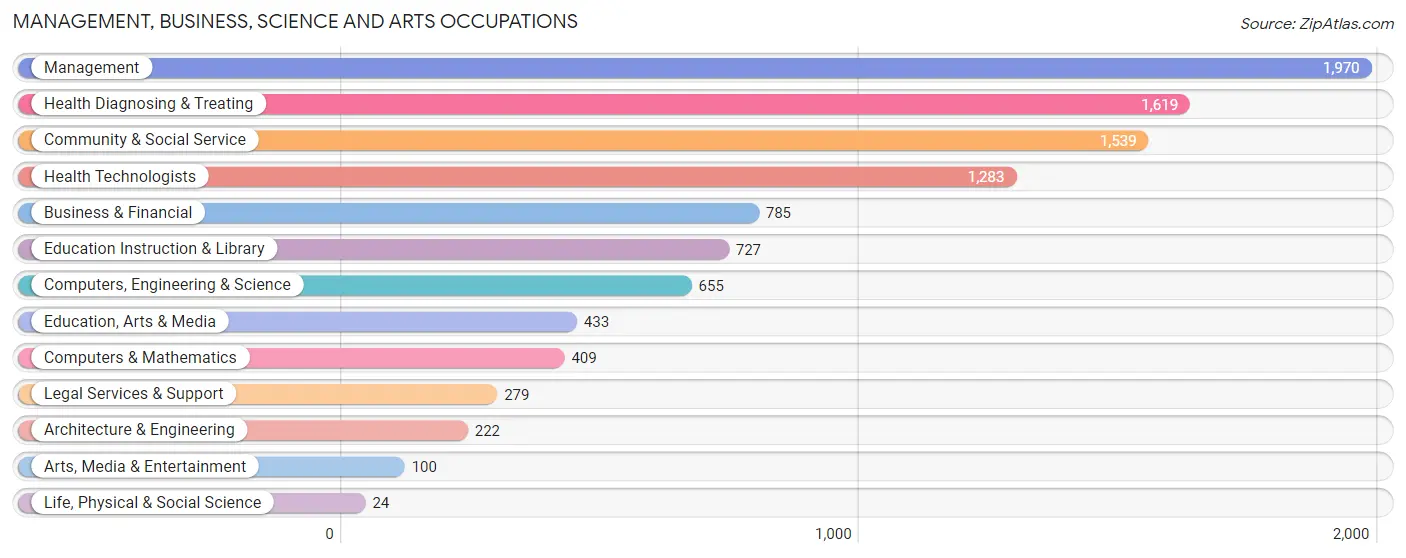
Management, Business, Science and Arts Occupations
The most common Management, Business, Science and Arts occupations in Trussville are Management (1,970 | 15.1%), Health Diagnosing & Treating (1,619 | 12.4%), Community & Social Service (1,539 | 11.8%), Health Technologists (1,283 | 9.8%), and Business & Financial (785 | 6.0%).
Management, Business, Science and Arts Occupations by Sex
Within the Management, Business, Science and Arts occupations in Trussville, the most male-oriented occupations are Architecture & Engineering (100.0%), Arts, Media & Entertainment (78.0%), and Computers, Engineering & Science (75.4%), while the most female-oriented occupations are Life, Physical & Social Science (100.0%), Health Technologists (87.7%), and Health Diagnosing & Treating (86.9%).
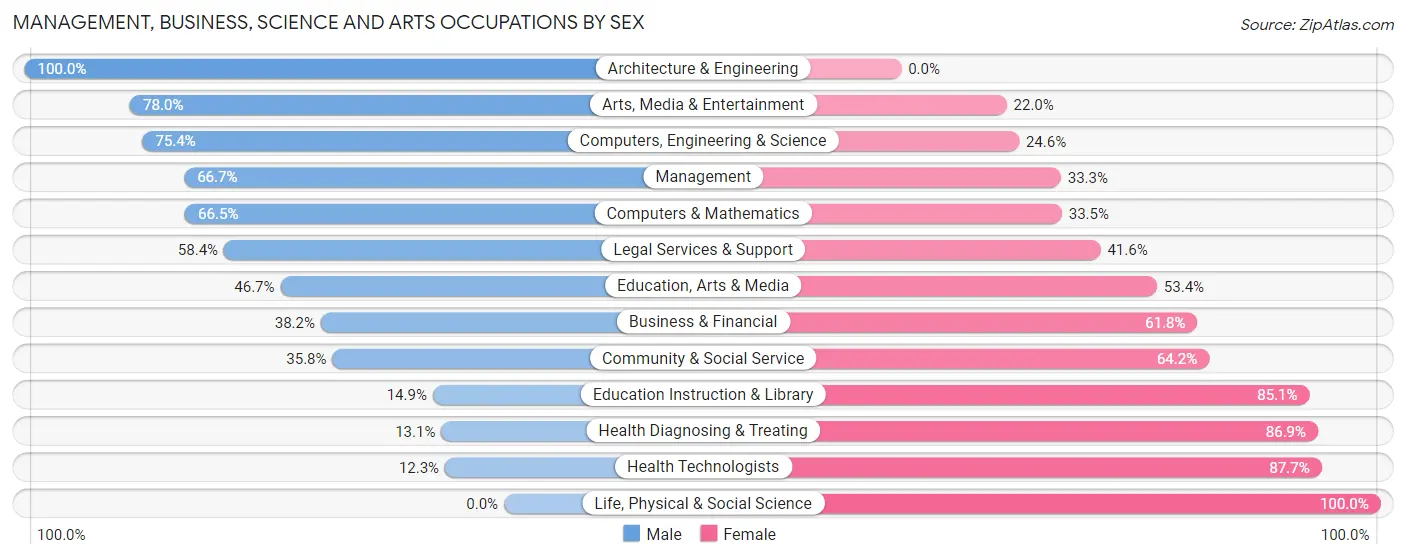
| Occupation | Male | Female |
| Management | 1,314 (66.7%) | 656 (33.3%) |
| Business & Financial | 300 (38.2%) | 485 (61.8%) |
| Computers, Engineering & Science | 494 (75.4%) | 161 (24.6%) |
| Computers & Mathematics | 272 (66.5%) | 137 (33.5%) |
| Architecture & Engineering | 222 (100.0%) | 0 (0.0%) |
| Life, Physical & Social Science | 0 (0.0%) | 24 (100.0%) |
| Community & Social Service | 551 (35.8%) | 988 (64.2%) |
| Education, Arts & Media | 202 (46.7%) | 231 (53.3%) |
| Legal Services & Support | 163 (58.4%) | 116 (41.6%) |
| Education Instruction & Library | 108 (14.9%) | 619 (85.1%) |
| Arts, Media & Entertainment | 78 (78.0%) | 22 (22.0%) |
| Health Diagnosing & Treating | 212 (13.1%) | 1,407 (86.9%) |
| Health Technologists | 158 (12.3%) | 1,125 (87.7%) |
| Total (Category) | 2,871 (43.7%) | 3,697 (56.3%) |
| Total (Overall) | 7,188 (55.2%) | 5,844 (44.8%) |
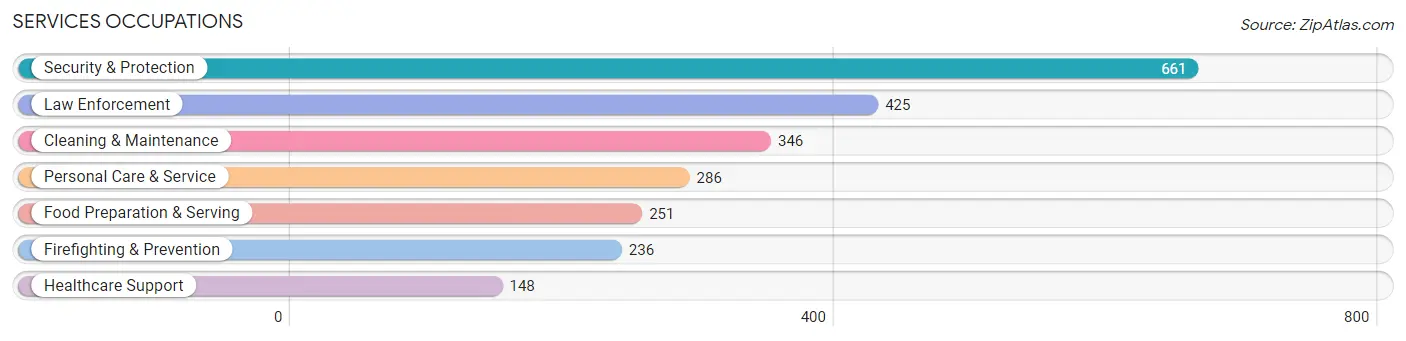
Services Occupations
The most common Services occupations in Trussville are Security & Protection (661 | 5.1%), Law Enforcement (425 | 3.3%), Cleaning & Maintenance (346 | 2.7%), Personal Care & Service (286 | 2.2%), and Food Preparation & Serving (251 | 1.9%).
Services Occupations by Sex
Within the Services occupations in Trussville, the most male-oriented occupations are Security & Protection (100.0%), Firefighting & Prevention (100.0%), and Law Enforcement (100.0%), while the most female-oriented occupations are Healthcare Support (83.8%), Personal Care & Service (81.5%), and Food Preparation & Serving (37.4%).
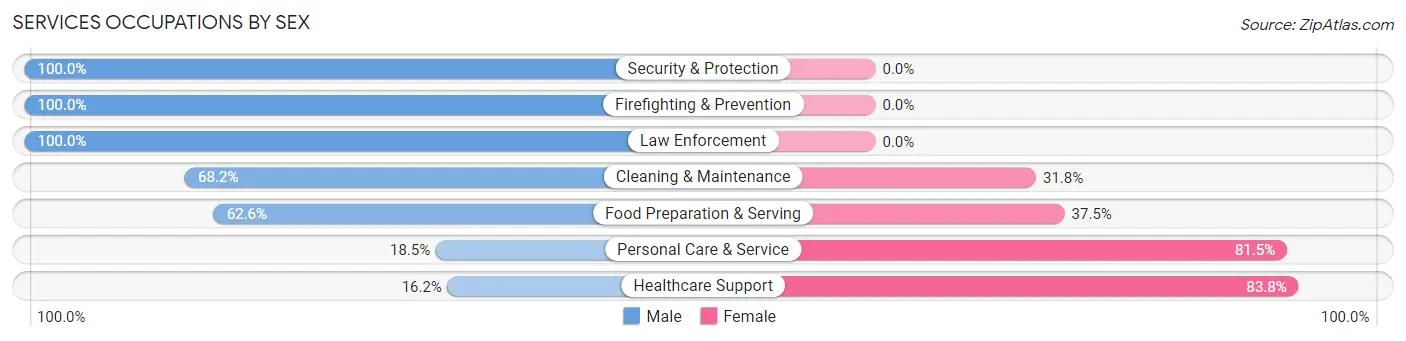
| Occupation | Male | Female |
| Healthcare Support | 24 (16.2%) | 124 (83.8%) |
| Security & Protection | 661 (100.0%) | 0 (0.0%) |
| Firefighting & Prevention | 236 (100.0%) | 0 (0.0%) |
| Law Enforcement | 425 (100.0%) | 0 (0.0%) |
| Food Preparation & Serving | 157 (62.5%) | 94 (37.4%) |
| Cleaning & Maintenance | 236 (68.2%) | 110 (31.8%) |
| Personal Care & Service | 53 (18.5%) | 233 (81.5%) |
| Total (Category) | 1,131 (66.8%) | 561 (33.2%) |
| Total (Overall) | 7,188 (55.2%) | 5,844 (44.8%) |
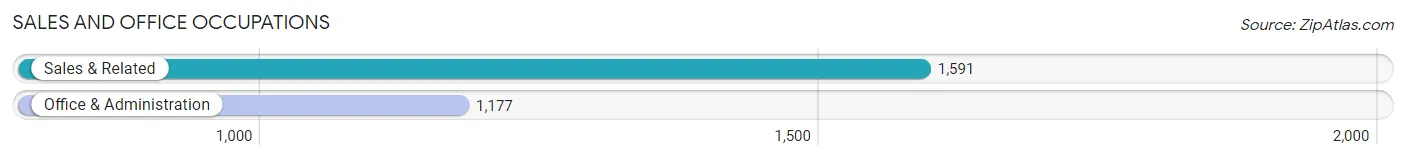
Sales and Office Occupations
The most common Sales and Office occupations in Trussville are Sales & Related (1,591 | 12.2%), and Office & Administration (1,177 | 9.0%).
Sales and Office Occupations by Sex
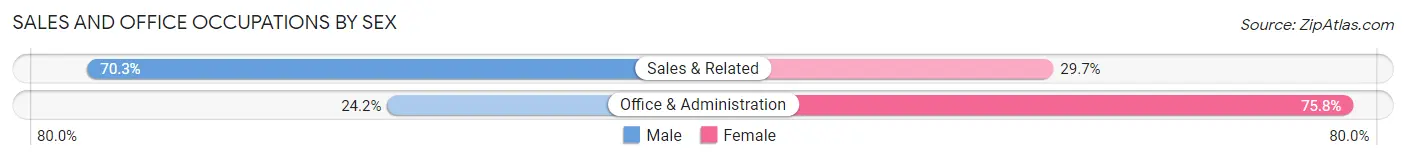
| Occupation | Male | Female |
| Sales & Related | 1,119 (70.3%) | 472 (29.7%) |
| Office & Administration | 285 (24.2%) | 892 (75.8%) |
| Total (Category) | 1,404 (50.7%) | 1,364 (49.3%) |
| Total (Overall) | 7,188 (55.2%) | 5,844 (44.8%) |
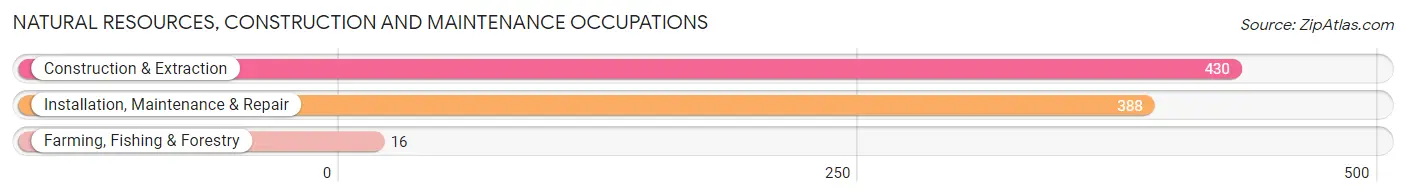
Natural Resources, Construction and Maintenance Occupations
The most common Natural Resources, Construction and Maintenance occupations in Trussville are Construction & Extraction (430 | 3.3%), Installation, Maintenance & Repair (388 | 3.0%), and Farming, Fishing & Forestry (16 | 0.1%).
Natural Resources, Construction and Maintenance Occupations by Sex
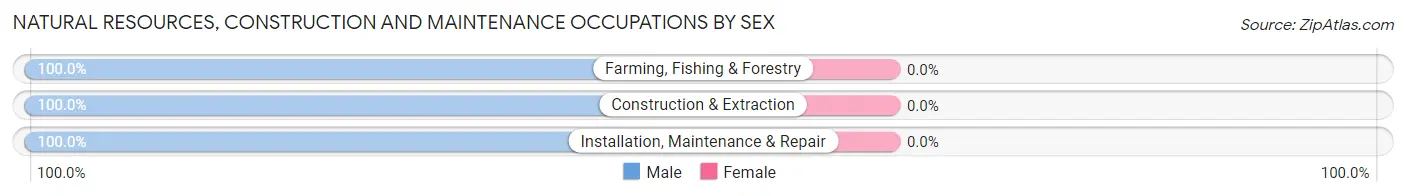
| Occupation | Male | Female |
| Farming, Fishing & Forestry | 16 (100.0%) | 0 (0.0%) |
| Construction & Extraction | 430 (100.0%) | 0 (0.0%) |
| Installation, Maintenance & Repair | 388 (100.0%) | 0 (0.0%) |
| Total (Category) | 834 (100.0%) | 0 (0.0%) |
| Total (Overall) | 7,188 (55.2%) | 5,844 (44.8%) |
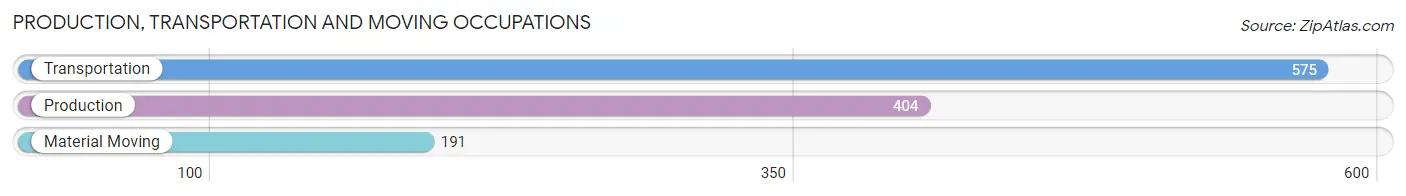
Production, Transportation and Moving Occupations
The most common Production, Transportation and Moving occupations in Trussville are Transportation (575 | 4.4%), Production (404 | 3.1%), and Material Moving (191 | 1.5%).
Production, Transportation and Moving Occupations by Sex
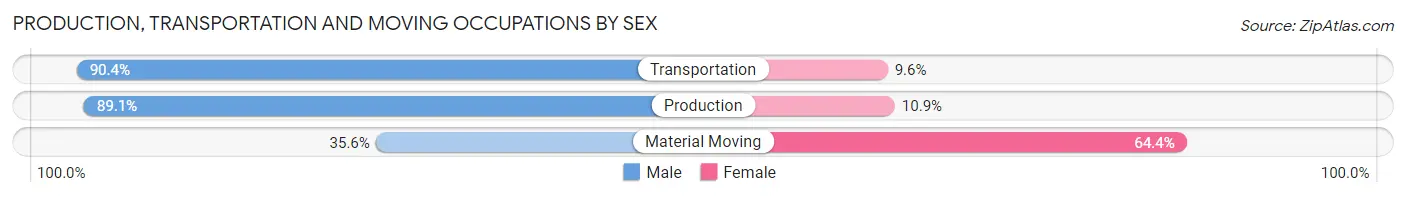
| Occupation | Male | Female |
| Production | 360 (89.1%) | 44 (10.9%) |
| Transportation | 520 (90.4%) | 55 (9.6%) |
| Material Moving | 68 (35.6%) | 123 (64.4%) |
| Total (Category) | 948 (81.0%) | 222 (19.0%) |
| Total (Overall) | 7,188 (55.2%) | 5,844 (44.8%) |
Employment Industries by Sex in Trussville
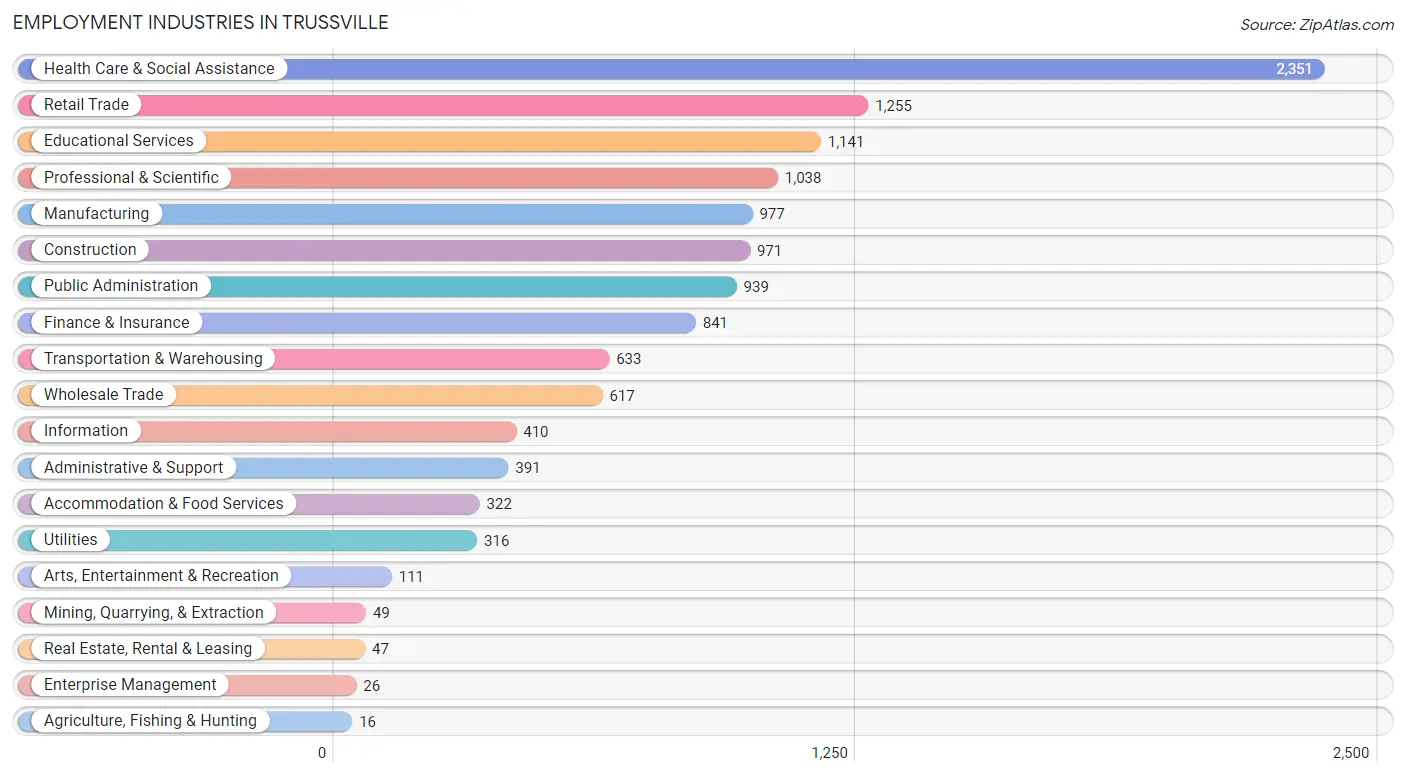
Employment Industries in Trussville
The major employment industries in Trussville include Health Care & Social Assistance (2,351 | 18.0%), Retail Trade (1,255 | 9.6%), Educational Services (1,141 | 8.8%), Professional & Scientific (1,038 | 8.0%), and Manufacturing (977 | 7.5%).
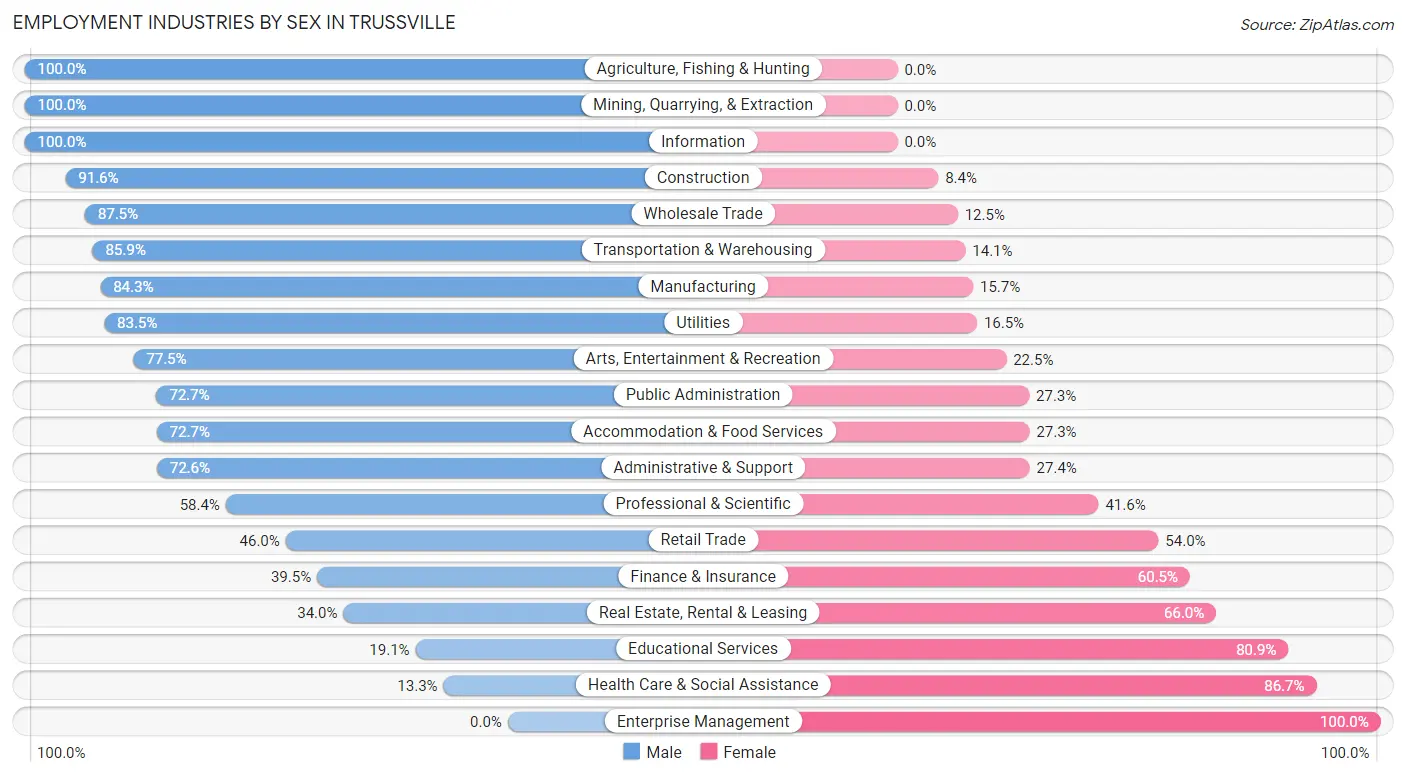
Employment Industries by Sex in Trussville
The Trussville industries that see more men than women are Agriculture, Fishing & Hunting (100.0%), Mining, Quarrying, & Extraction (100.0%), and Information (100.0%), whereas the industries that tend to have a higher number of women are Enterprise Management (100.0%), Health Care & Social Assistance (86.7%), and Educational Services (80.9%).
| Industry | Male | Female |
| Agriculture, Fishing & Hunting | 16 (100.0%) | 0 (0.0%) |
| Mining, Quarrying, & Extraction | 49 (100.0%) | 0 (0.0%) |
| Construction | 889 (91.6%) | 82 (8.4%) |
| Manufacturing | 824 (84.3%) | 153 (15.7%) |
| Wholesale Trade | 540 (87.5%) | 77 (12.5%) |
| Retail Trade | 577 (46.0%) | 678 (54.0%) |
| Transportation & Warehousing | 544 (85.9%) | 89 (14.1%) |
| Utilities | 264 (83.5%) | 52 (16.5%) |
| Information | 410 (100.0%) | 0 (0.0%) |
| Finance & Insurance | 332 (39.5%) | 509 (60.5%) |
| Real Estate, Rental & Leasing | 16 (34.0%) | 31 (66.0%) |
| Professional & Scientific | 606 (58.4%) | 432 (41.6%) |
| Enterprise Management | 0 (0.0%) | 26 (100.0%) |
| Administrative & Support | 284 (72.6%) | 107 (27.4%) |
| Educational Services | 218 (19.1%) | 923 (80.9%) |
| Health Care & Social Assistance | 313 (13.3%) | 2,038 (86.7%) |
| Arts, Entertainment & Recreation | 86 (77.5%) | 25 (22.5%) |
| Accommodation & Food Services | 234 (72.7%) | 88 (27.3%) |
| Public Administration | 683 (72.7%) | 256 (27.3%) |
| Total | 7,188 (55.2%) | 5,844 (44.8%) |
Education in Trussville
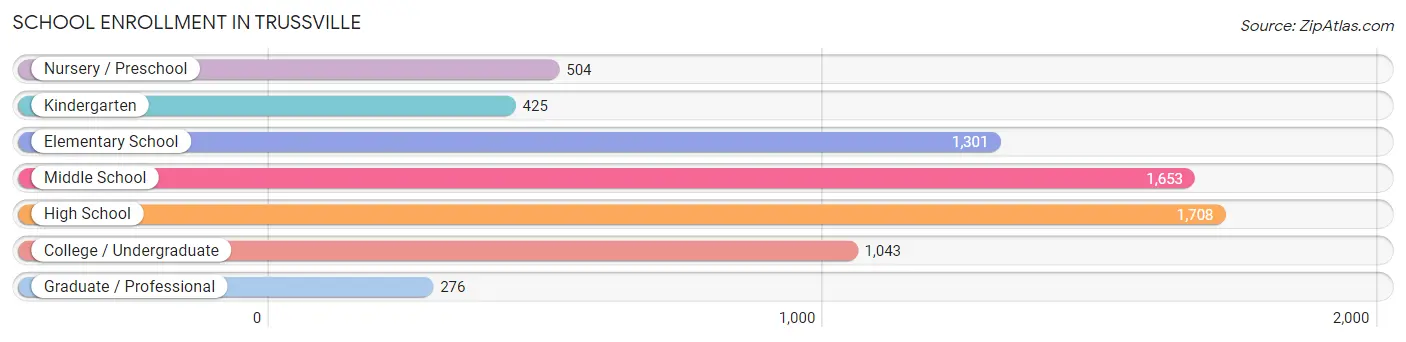
School Enrollment in Trussville
The most common levels of schooling among the 6,910 students in Trussville are high school (1,708 | 24.7%), middle school (1,653 | 23.9%), and elementary school (1,301 | 18.8%).
| School Level | # Students | % Students |
| Nursery / Preschool | 504 | 7.3% |
| Kindergarten | 425 | 6.1% |
| Elementary School | 1,301 | 18.8% |
| Middle School | 1,653 | 23.9% |
| High School | 1,708 | 24.7% |
| College / Undergraduate | 1,043 | 15.1% |
| Graduate / Professional | 276 | 4.0% |
| Total | 6,910 | 100.0% |
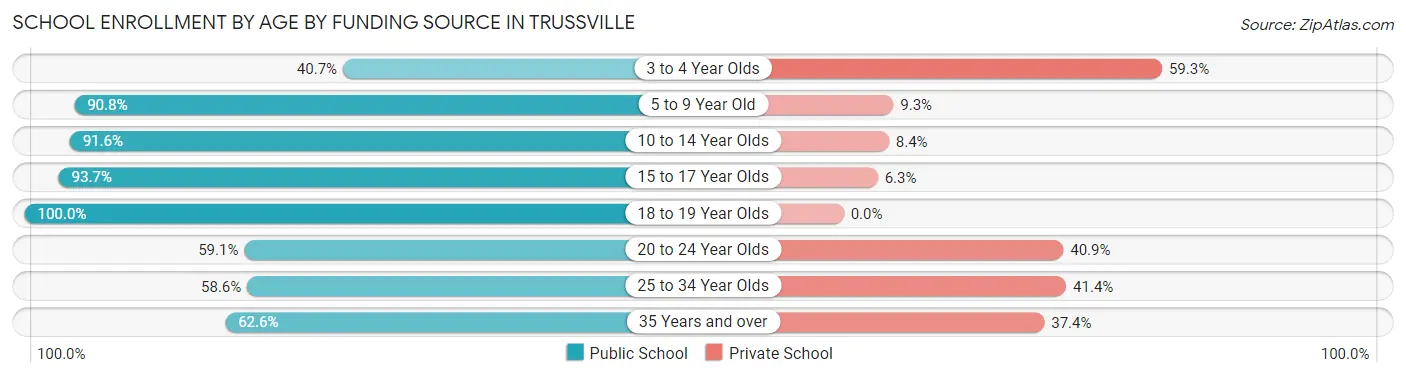
School Enrollment by Age by Funding Source in Trussville
Out of a total of 6,910 students who are enrolled in schools in Trussville, 1,071 (15.5%) attend a private institution, while the remaining 5,839 (84.5%) are enrolled in public schools. The age group of 3 to 4 year olds has the highest likelihood of being enrolled in private schools, with 201 (59.3% in the age bracket) enrolled. Conversely, the age group of 18 to 19 year olds has the lowest likelihood of being enrolled in a private school, with 521 (100.0% in the age bracket) attending a public institution.
| Age Bracket | Public School | Private School |
| 3 to 4 Year Olds | 138 (40.7%) | 201 (59.3%) |
| 5 to 9 Year Old | 1,481 (90.7%) | 151 (9.2%) |
| 10 to 14 Year Olds | 1,927 (91.6%) | 177 (8.4%) |
| 15 to 17 Year Olds | 1,063 (93.7%) | 72 (6.3%) |
| 18 to 19 Year Olds | 521 (100.0%) | 0 (0.0%) |
| 20 to 24 Year Olds | 390 (59.1%) | 270 (40.9%) |
| 25 to 34 Year Olds | 130 (58.6%) | 92 (41.4%) |
| 35 Years and over | 186 (62.6%) | 111 (37.4%) |
| Total | 5,839 (84.5%) | 1,071 (15.5%) |
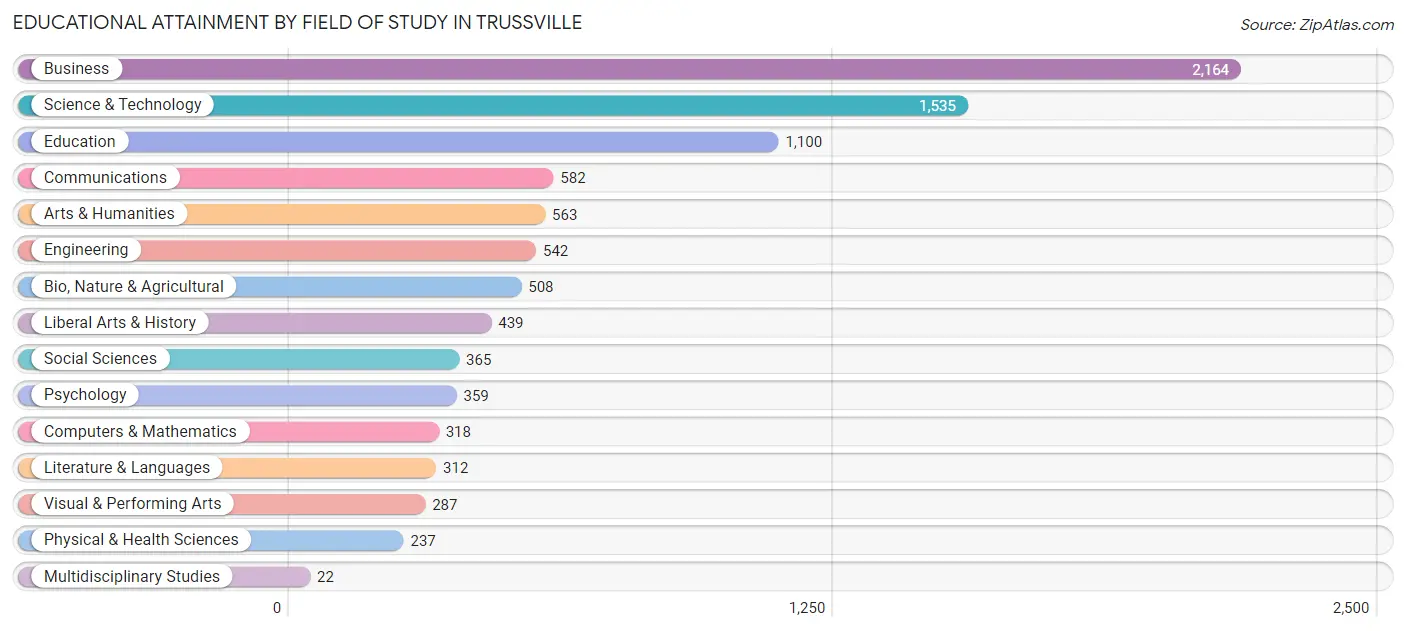
Educational Attainment by Field of Study in Trussville
Business (2,164 | 23.2%), science & technology (1,535 | 16.5%), education (1,100 | 11.8%), communications (582 | 6.2%), and arts & humanities (563 | 6.0%) are the most common fields of study among 9,333 individuals in Trussville who have obtained a bachelor's degree or higher.
| Field of Study | # Graduates | % Graduates |
| Computers & Mathematics | 318 | 3.4% |
| Bio, Nature & Agricultural | 508 | 5.4% |
| Physical & Health Sciences | 237 | 2.5% |
| Psychology | 359 | 3.8% |
| Social Sciences | 365 | 3.9% |
| Engineering | 542 | 5.8% |
| Multidisciplinary Studies | 22 | 0.2% |
| Science & Technology | 1,535 | 16.5% |
| Business | 2,164 | 23.2% |
| Education | 1,100 | 11.8% |
| Literature & Languages | 312 | 3.3% |
| Liberal Arts & History | 439 | 4.7% |
| Visual & Performing Arts | 287 | 3.1% |
| Communications | 582 | 6.2% |
| Arts & Humanities | 563 | 6.0% |
| Total | 9,333 | 100.0% |
Transportation & Commute in Trussville
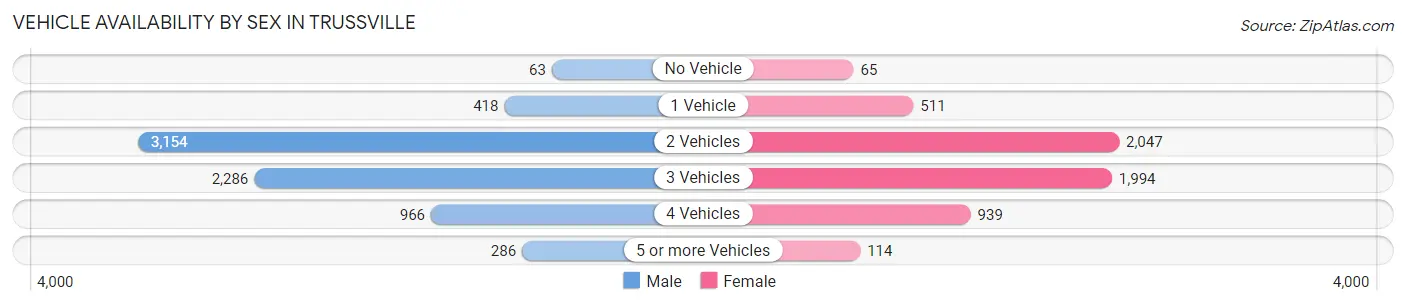
Vehicle Availability by Sex in Trussville
The most prevalent vehicle ownership categories in Trussville are males with 2 vehicles (3,154, accounting for 44.0%) and females with 2 vehicles (2,047, making up 55.6%).
| Vehicles Available | Male | Female |
| No Vehicle | 63 (0.9%) | 65 (1.1%) |
| 1 Vehicle | 418 (5.8%) | 511 (9.0%) |
| 2 Vehicles | 3,154 (44.0%) | 2,047 (36.1%) |
| 3 Vehicles | 2,286 (31.9%) | 1,994 (35.2%) |
| 4 Vehicles | 966 (13.5%) | 939 (16.6%) |
| 5 or more Vehicles | 286 (4.0%) | 114 (2.0%) |
| Total | 7,173 (100.0%) | 5,670 (100.0%) |
Commute Time in Trussville
The most frequently occuring commute durations in Trussville are 30 to 34 minutes (2,803 commuters, 23.8%), 25 to 29 minutes (1,349 commuters, 11.5%), and 45 to 59 minutes (1,218 commuters, 10.3%).
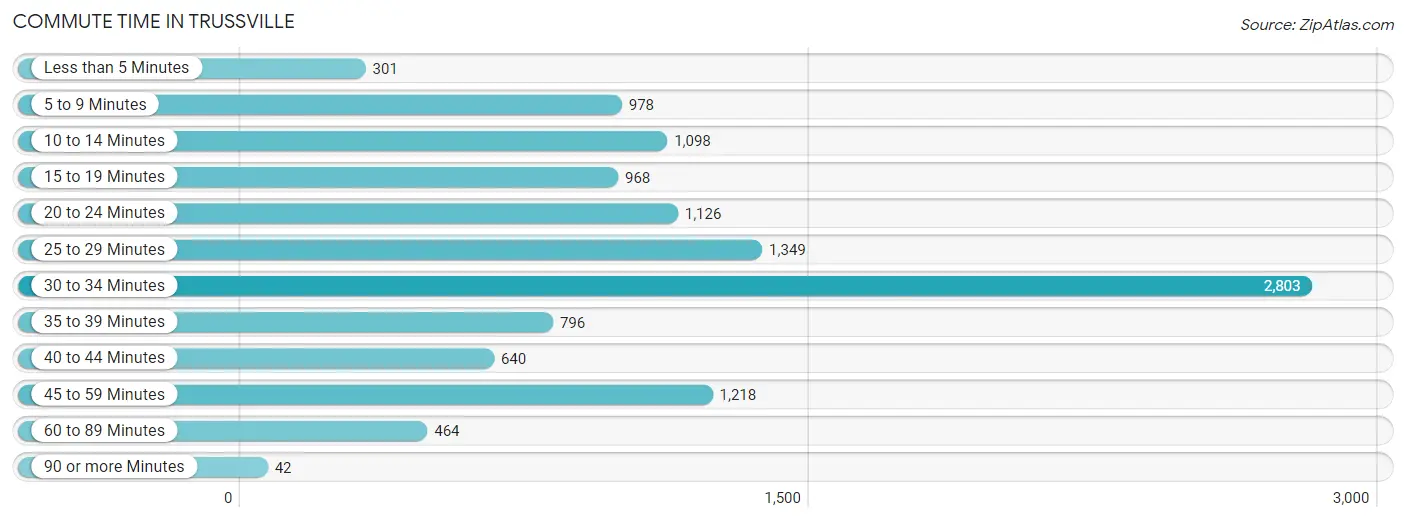
| Commute Time | # Commuters | % Commuters |
| Less than 5 Minutes | 301 | 2.5% |
| 5 to 9 Minutes | 978 | 8.3% |
| 10 to 14 Minutes | 1,098 | 9.3% |
| 15 to 19 Minutes | 968 | 8.2% |
| 20 to 24 Minutes | 1,126 | 9.6% |
| 25 to 29 Minutes | 1,349 | 11.5% |
| 30 to 34 Minutes | 2,803 | 23.8% |
| 35 to 39 Minutes | 796 | 6.8% |
| 40 to 44 Minutes | 640 | 5.4% |
| 45 to 59 Minutes | 1,218 | 10.3% |
| 60 to 89 Minutes | 464 | 3.9% |
| 90 or more Minutes | 42 | 0.4% |
Commute Time by Sex in Trussville
The most common commute times in Trussville are 30 to 34 minutes (1,304 commuters, 19.8%) for males and 30 to 34 minutes (1,499 commuters, 28.8%) for females.
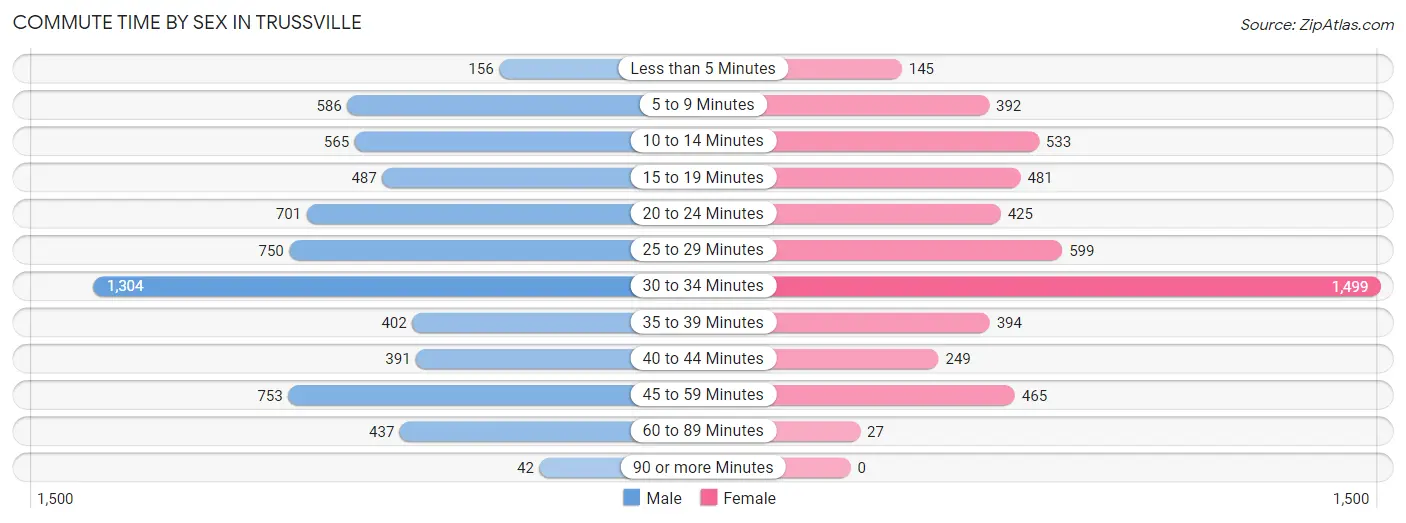
| Commute Time | Male | Female |
| Less than 5 Minutes | 156 (2.4%) | 145 (2.8%) |
| 5 to 9 Minutes | 586 (8.9%) | 392 (7.5%) |
| 10 to 14 Minutes | 565 (8.6%) | 533 (10.2%) |
| 15 to 19 Minutes | 487 (7.4%) | 481 (9.2%) |
| 20 to 24 Minutes | 701 (10.7%) | 425 (8.2%) |
| 25 to 29 Minutes | 750 (11.4%) | 599 (11.5%) |
| 30 to 34 Minutes | 1,304 (19.8%) | 1,499 (28.8%) |
| 35 to 39 Minutes | 402 (6.1%) | 394 (7.6%) |
| 40 to 44 Minutes | 391 (5.9%) | 249 (4.8%) |
| 45 to 59 Minutes | 753 (11.5%) | 465 (8.9%) |
| 60 to 89 Minutes | 437 (6.7%) | 27 (0.5%) |
| 90 or more Minutes | 42 (0.6%) | 0 (0.0%) |
Time of Departure to Work by Sex in Trussville
The most frequent times of departure to work in Trussville are 8:00 AM to 8:29 AM (1,335, 20.3%) for males and 8:00 AM to 8:29 AM (1,114, 21.4%) for females.
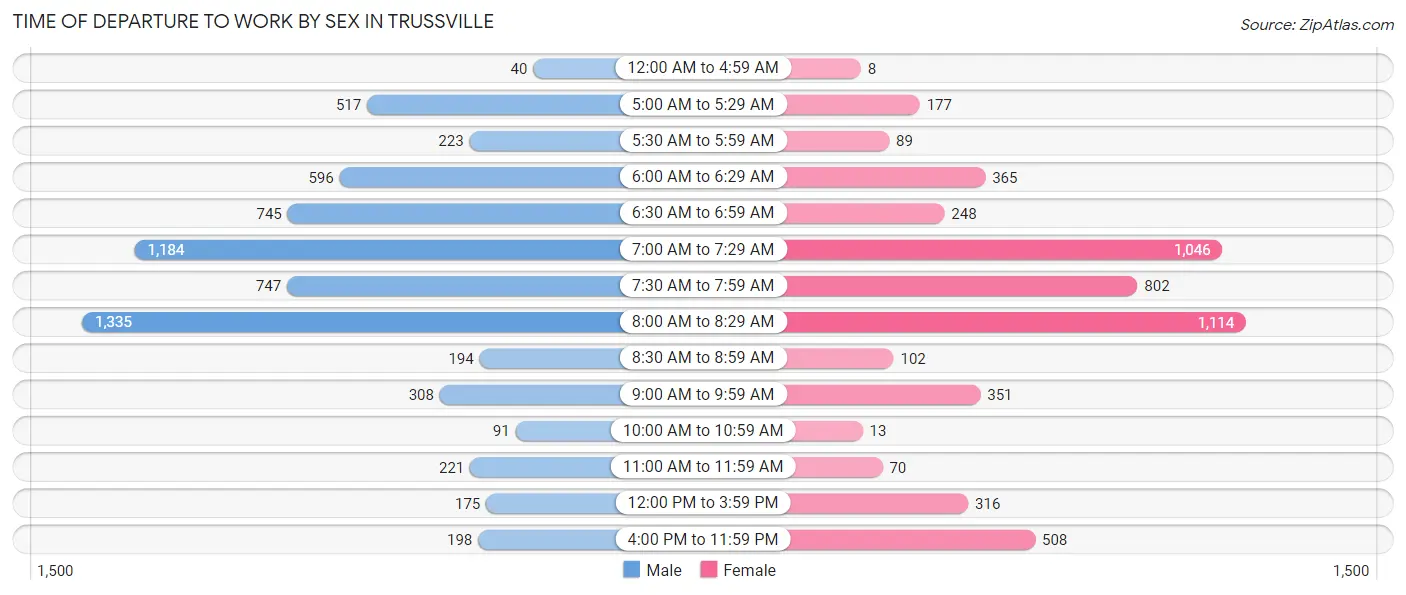
| Time of Departure | Male | Female |
| 12:00 AM to 4:59 AM | 40 (0.6%) | 8 (0.2%) |
| 5:00 AM to 5:29 AM | 517 (7.9%) | 177 (3.4%) |
| 5:30 AM to 5:59 AM | 223 (3.4%) | 89 (1.7%) |
| 6:00 AM to 6:29 AM | 596 (9.1%) | 365 (7.0%) |
| 6:30 AM to 6:59 AM | 745 (11.3%) | 248 (4.8%) |
| 7:00 AM to 7:29 AM | 1,184 (18.0%) | 1,046 (20.1%) |
| 7:30 AM to 7:59 AM | 747 (11.4%) | 802 (15.4%) |
| 8:00 AM to 8:29 AM | 1,335 (20.3%) | 1,114 (21.4%) |
| 8:30 AM to 8:59 AM | 194 (2.9%) | 102 (2.0%) |
| 9:00 AM to 9:59 AM | 308 (4.7%) | 351 (6.7%) |
| 10:00 AM to 10:59 AM | 91 (1.4%) | 13 (0.3%) |
| 11:00 AM to 11:59 AM | 221 (3.4%) | 70 (1.3%) |
| 12:00 PM to 3:59 PM | 175 (2.7%) | 316 (6.1%) |
| 4:00 PM to 11:59 PM | 198 (3.0%) | 508 (9.8%) |
| Total | 6,574 (100.0%) | 5,209 (100.0%) |
Housing Occupancy in Trussville
Occupancy by Ownership in Trussville
Of the total 9,126 dwellings in Trussville, owner-occupied units account for 8,482 (92.9%), while renter-occupied units make up 644 (7.1%).
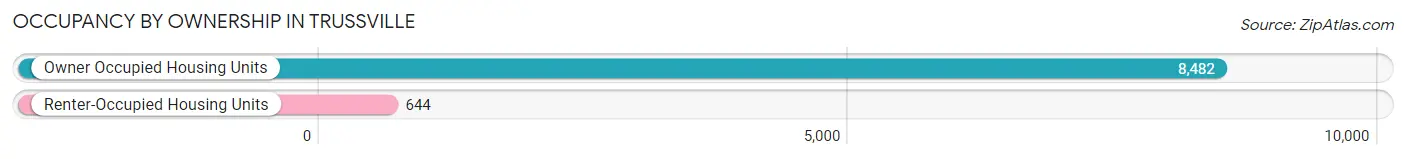
| Occupancy | # Housing Units | % Housing Units |
| Owner Occupied Housing Units | 8,482 | 92.9% |
| Renter-Occupied Housing Units | 644 | 7.1% |
| Total Occupied Housing Units | 9,126 | 100.0% |
Occupancy by Household Size in Trussville
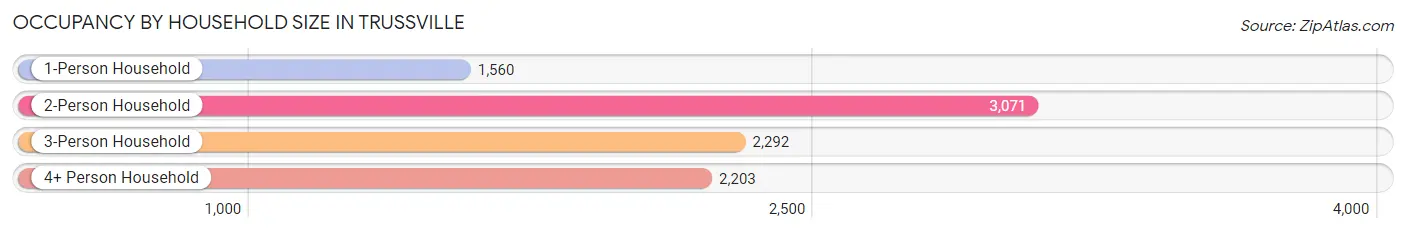
| Household Size | # Housing Units | % Housing Units |
| 1-Person Household | 1,560 | 17.1% |
| 2-Person Household | 3,071 | 33.7% |
| 3-Person Household | 2,292 | 25.1% |
| 4+ Person Household | 2,203 | 24.1% |
| Total Housing Units | 9,126 | 100.0% |
Occupancy by Ownership by Household Size in Trussville
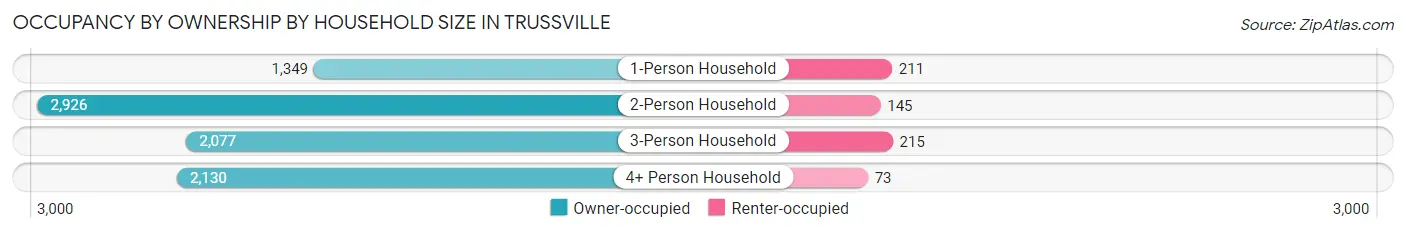
| Household Size | Owner-occupied | Renter-occupied |
| 1-Person Household | 1,349 (86.5%) | 211 (13.5%) |
| 2-Person Household | 2,926 (95.3%) | 145 (4.7%) |
| 3-Person Household | 2,077 (90.6%) | 215 (9.4%) |
| 4+ Person Household | 2,130 (96.7%) | 73 (3.3%) |
| Total Housing Units | 8,482 (92.9%) | 644 (7.1%) |
Occupancy by Educational Attainment in Trussville
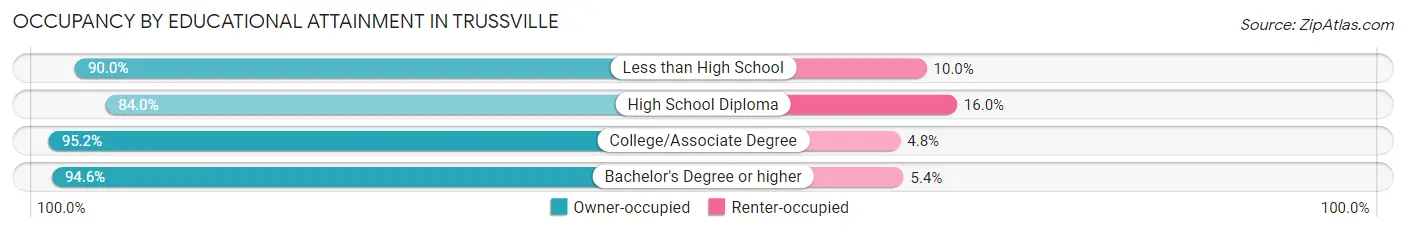
| Household Size | Owner-occupied | Renter-occupied |
| Less than High School | 99 (90.0%) | 11 (10.0%) |
| High School Diploma | 1,254 (84.0%) | 239 (16.0%) |
| College/Associate Degree | 2,221 (95.2%) | 112 (4.8%) |
| Bachelor's Degree or higher | 4,908 (94.6%) | 282 (5.4%) |
Occupancy by Age of Householder in Trussville
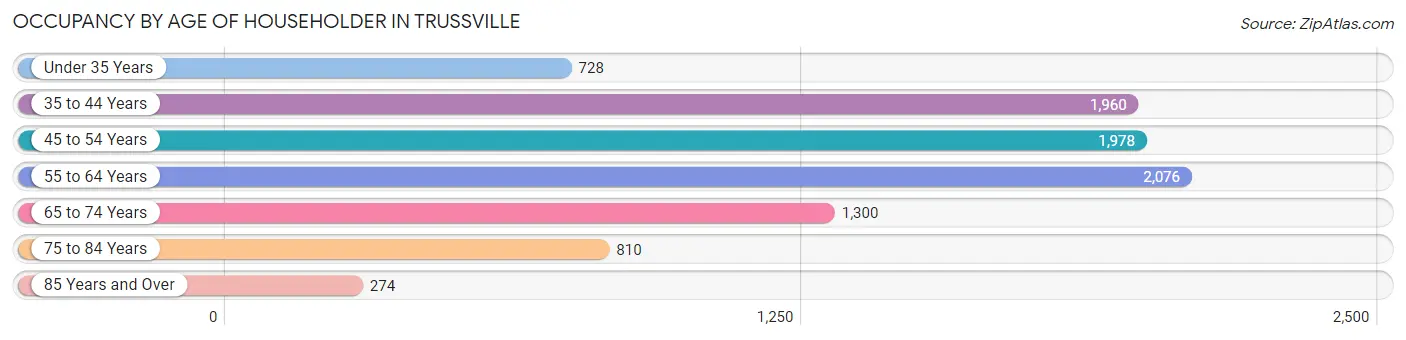
| Age Bracket | # Households | % Households |
| Under 35 Years | 728 | 8.0% |
| 35 to 44 Years | 1,960 | 21.5% |
| 45 to 54 Years | 1,978 | 21.7% |
| 55 to 64 Years | 2,076 | 22.8% |
| 65 to 74 Years | 1,300 | 14.2% |
| 75 to 84 Years | 810 | 8.9% |
| 85 Years and Over | 274 | 3.0% |
| Total | 9,126 | 100.0% |
Housing Finances in Trussville
Median Income by Occupancy in Trussville
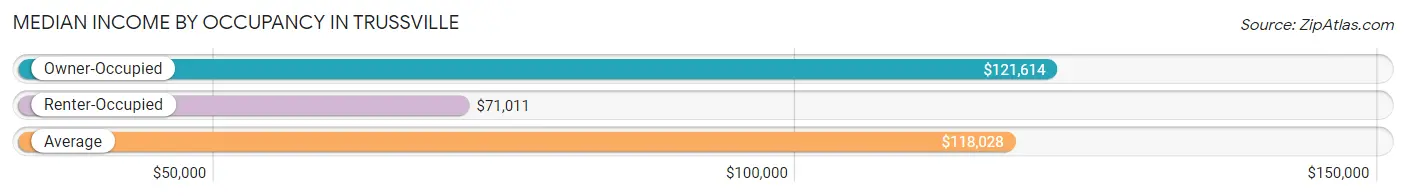
| Occupancy Type | # Households | Median Income |
| Owner-Occupied | 8,482 (92.9%) | $121,614 |
| Renter-Occupied | 644 (7.1%) | $71,011 |
| Average | 9,126 (100.0%) | $118,028 |
Occupancy by Householder Income Bracket in Trussville
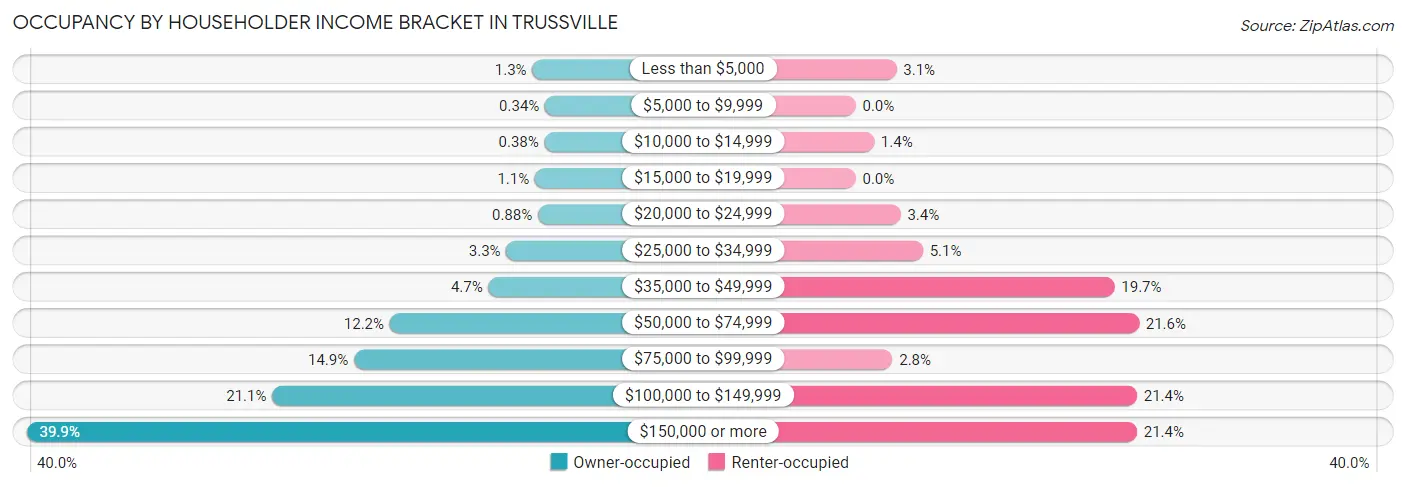
| Income Bracket | Owner-occupied | Renter-occupied |
| Less than $5,000 | 111 (1.3%) | 20 (3.1%) |
| $5,000 to $9,999 | 29 (0.3%) | 0 (0.0%) |
| $10,000 to $14,999 | 32 (0.4%) | 9 (1.4%) |
| $15,000 to $19,999 | 94 (1.1%) | 0 (0.0%) |
| $20,000 to $24,999 | 75 (0.9%) | 22 (3.4%) |
| $25,000 to $34,999 | 279 (3.3%) | 33 (5.1%) |
| $35,000 to $49,999 | 394 (4.6%) | 127 (19.7%) |
| $50,000 to $74,999 | 1,032 (12.2%) | 139 (21.6%) |
| $75,000 to $99,999 | 1,264 (14.9%) | 18 (2.8%) |
| $100,000 to $149,999 | 1,792 (21.1%) | 138 (21.4%) |
| $150,000 or more | 3,380 (39.9%) | 138 (21.4%) |
| Total | 8,482 (100.0%) | 644 (100.0%) |
Monthly Housing Cost Tiers in Trussville
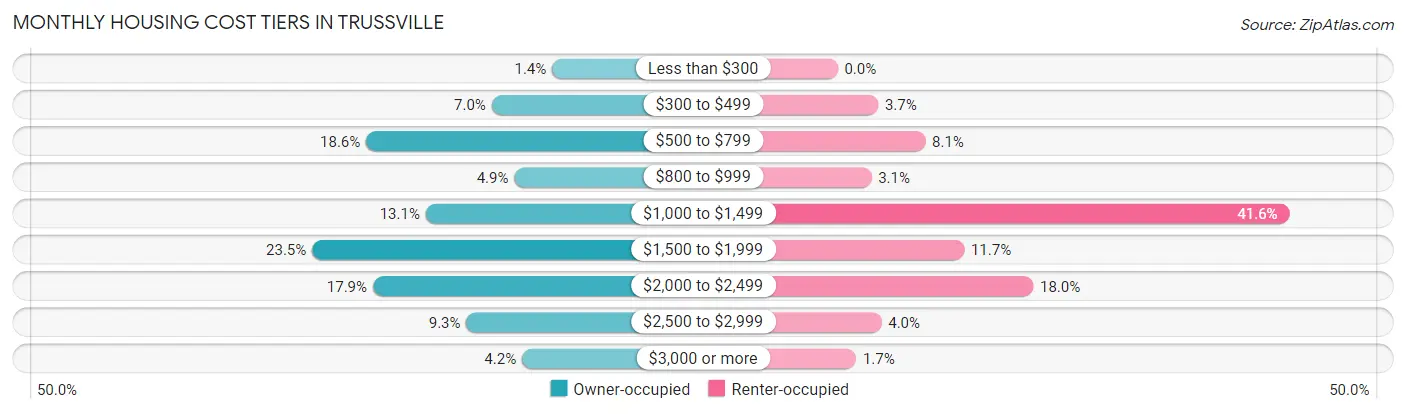
| Monthly Cost | Owner-occupied | Renter-occupied |
| Less than $300 | 122 (1.4%) | 0 (0.0%) |
| $300 to $499 | 594 (7.0%) | 24 (3.7%) |
| $500 to $799 | 1,574 (18.6%) | 52 (8.1%) |
| $800 to $999 | 417 (4.9%) | 20 (3.1%) |
| $1,000 to $1,499 | 1,109 (13.1%) | 268 (41.6%) |
| $1,500 to $1,999 | 1,996 (23.5%) | 75 (11.7%) |
| $2,000 to $2,499 | 1,522 (17.9%) | 116 (18.0%) |
| $2,500 to $2,999 | 791 (9.3%) | 26 (4.0%) |
| $3,000 or more | 357 (4.2%) | 11 (1.7%) |
| Total | 8,482 (100.0%) | 644 (100.0%) |
Physical Housing Characteristics in Trussville
Housing Structures in Trussville
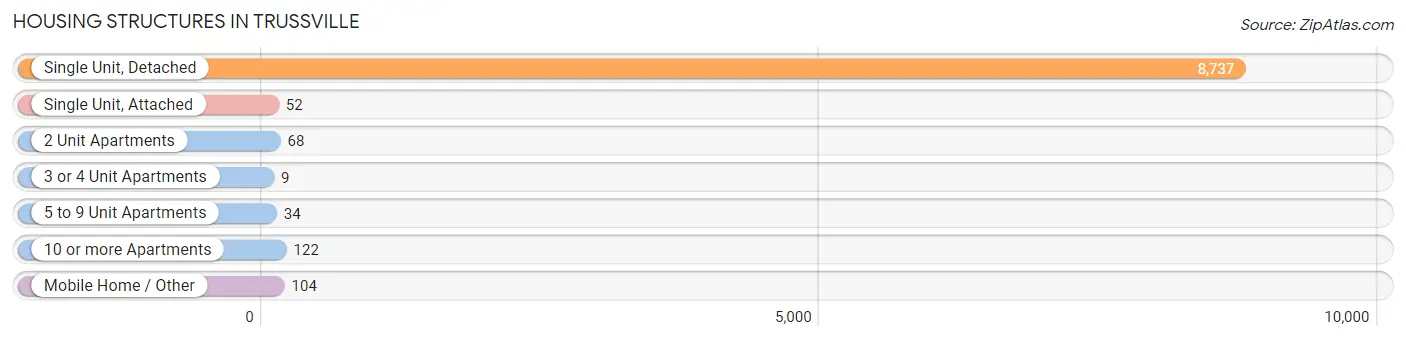
| Structure Type | # Housing Units | % Housing Units |
| Single Unit, Detached | 8,737 | 95.7% |
| Single Unit, Attached | 52 | 0.6% |
| 2 Unit Apartments | 68 | 0.7% |
| 3 or 4 Unit Apartments | 9 | 0.1% |
| 5 to 9 Unit Apartments | 34 | 0.4% |
| 10 or more Apartments | 122 | 1.3% |
| Mobile Home / Other | 104 | 1.1% |
| Total | 9,126 | 100.0% |
Housing Structures by Occupancy in Trussville
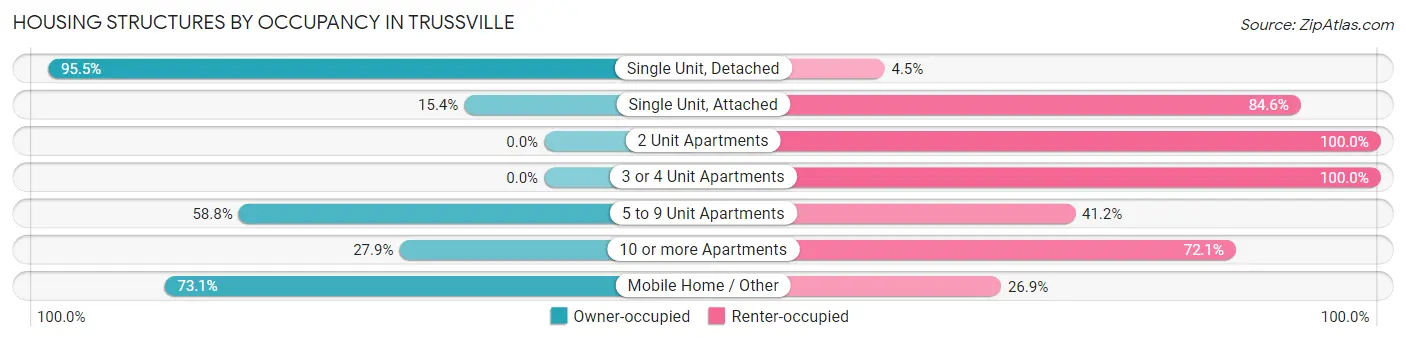
| Structure Type | Owner-occupied | Renter-occupied |
| Single Unit, Detached | 8,344 (95.5%) | 393 (4.5%) |
| Single Unit, Attached | 8 (15.4%) | 44 (84.6%) |
| 2 Unit Apartments | 0 (0.0%) | 68 (100.0%) |
| 3 or 4 Unit Apartments | 0 (0.0%) | 9 (100.0%) |
| 5 to 9 Unit Apartments | 20 (58.8%) | 14 (41.2%) |
| 10 or more Apartments | 34 (27.9%) | 88 (72.1%) |
| Mobile Home / Other | 76 (73.1%) | 28 (26.9%) |
| Total | 8,482 (92.9%) | 644 (7.1%) |
Housing Structures by Number of Rooms in Trussville
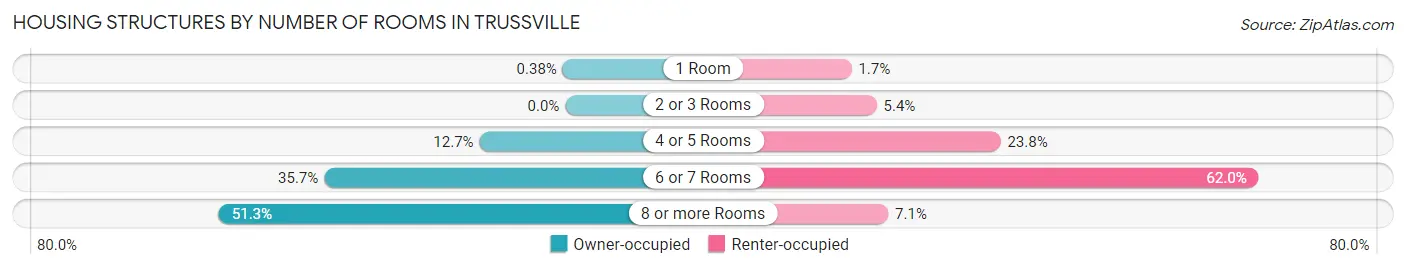
| Number of Rooms | Owner-occupied | Renter-occupied |
| 1 Room | 32 (0.4%) | 11 (1.7%) |
| 2 or 3 Rooms | 0 (0.0%) | 35 (5.4%) |
| 4 or 5 Rooms | 1,077 (12.7%) | 153 (23.8%) |
| 6 or 7 Rooms | 3,026 (35.7%) | 399 (62.0%) |
| 8 or more Rooms | 4,347 (51.2%) | 46 (7.1%) |
| Total | 8,482 (100.0%) | 644 (100.0%) |
Housing Structure by Heating Type in Trussville
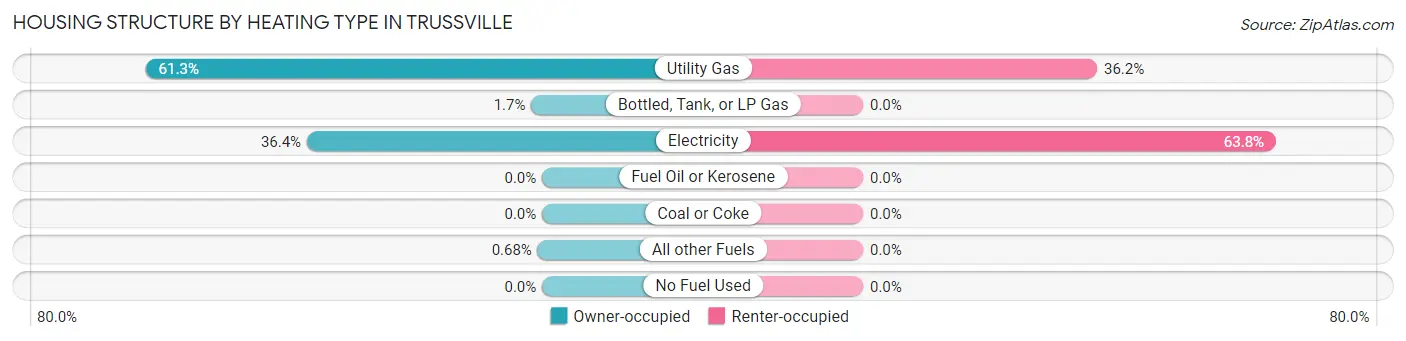
| Heating Type | Owner-occupied | Renter-occupied |
| Utility Gas | 5,199 (61.3%) | 233 (36.2%) |
| Bottled, Tank, or LP Gas | 142 (1.7%) | 0 (0.0%) |
| Electricity | 3,083 (36.3%) | 411 (63.8%) |
| Fuel Oil or Kerosene | 0 (0.0%) | 0 (0.0%) |
| Coal or Coke | 0 (0.0%) | 0 (0.0%) |
| All other Fuels | 58 (0.7%) | 0 (0.0%) |
| No Fuel Used | 0 (0.0%) | 0 (0.0%) |
| Total | 8,482 (100.0%) | 644 (100.0%) |
Household Vehicle Usage in Trussville
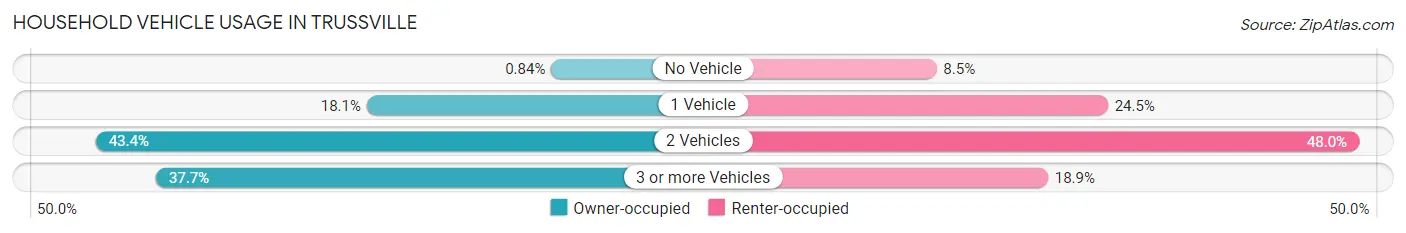
| Vehicles per Household | Owner-occupied | Renter-occupied |
| No Vehicle | 71 (0.8%) | 55 (8.5%) |
| 1 Vehicle | 1,532 (18.1%) | 158 (24.5%) |
| 2 Vehicles | 3,678 (43.4%) | 309 (48.0%) |
| 3 or more Vehicles | 3,201 (37.7%) | 122 (18.9%) |
| Total | 8,482 (100.0%) | 644 (100.0%) |
Real Estate & Mortgages in Trussville
Real Estate and Mortgage Overview in Trussville
| Characteristic | Without Mortgage | With Mortgage |
| Housing Units | 2,530 | 5,952 |
| Median Property Value | $317,200 | $339,800 |
| Median Household Income | $97,000 | $2,563 |
| Monthly Housing Costs | $594 | $357 |
| Real Estate Taxes | $1,737 | $124 |
Property Value by Mortgage Status in Trussville
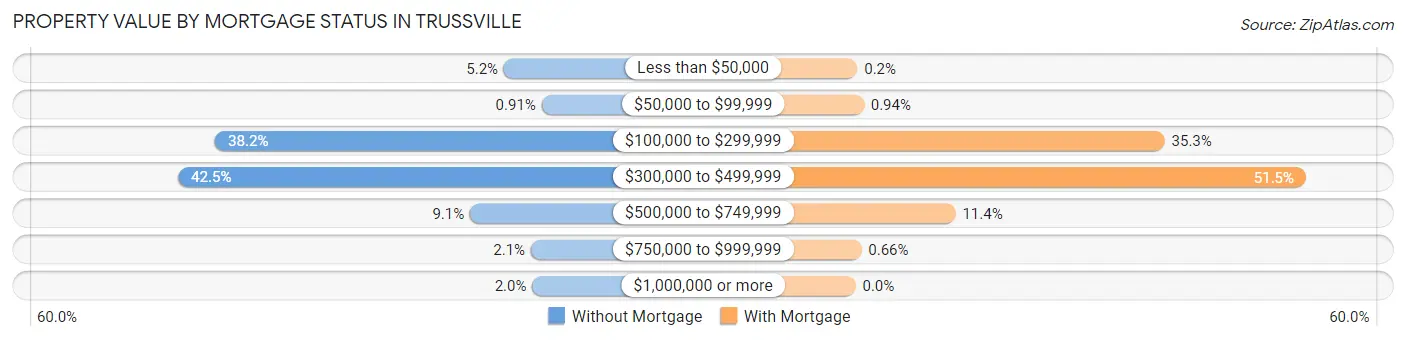
| Property Value | Without Mortgage | With Mortgage |
| Less than $50,000 | 132 (5.2%) | 12 (0.2%) |
| $50,000 to $99,999 | 23 (0.9%) | 56 (0.9%) |
| $100,000 to $299,999 | 967 (38.2%) | 2,102 (35.3%) |
| $300,000 to $499,999 | 1,074 (42.4%) | 3,063 (51.5%) |
| $500,000 to $749,999 | 230 (9.1%) | 680 (11.4%) |
| $750,000 to $999,999 | 54 (2.1%) | 39 (0.7%) |
| $1,000,000 or more | 50 (2.0%) | 0 (0.0%) |
| Total | 2,530 (100.0%) | 5,952 (100.0%) |
Household Income by Mortgage Status in Trussville
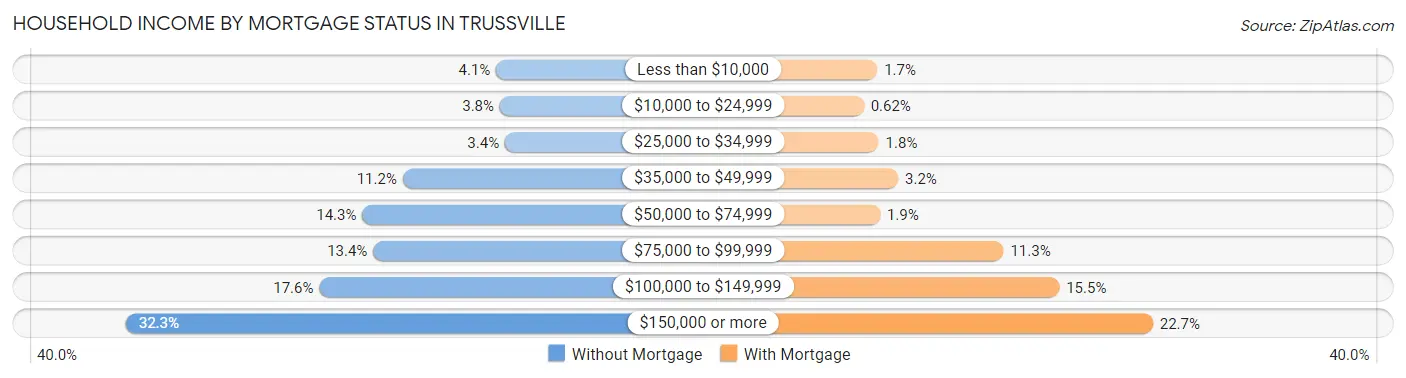
| Household Income | Without Mortgage | With Mortgage |
| Less than $10,000 | 103 (4.1%) | 98 (1.7%) |
| $10,000 to $24,999 | 96 (3.8%) | 37 (0.6%) |
| $25,000 to $34,999 | 86 (3.4%) | 105 (1.8%) |
| $35,000 to $49,999 | 283 (11.2%) | 193 (3.2%) |
| $50,000 to $74,999 | 361 (14.3%) | 111 (1.9%) |
| $75,000 to $99,999 | 340 (13.4%) | 671 (11.3%) |
| $100,000 to $149,999 | 444 (17.5%) | 924 (15.5%) |
| $150,000 or more | 817 (32.3%) | 1,348 (22.7%) |
| Total | 2,530 (100.0%) | 5,952 (100.0%) |
Property Value to Household Income Ratio in Trussville
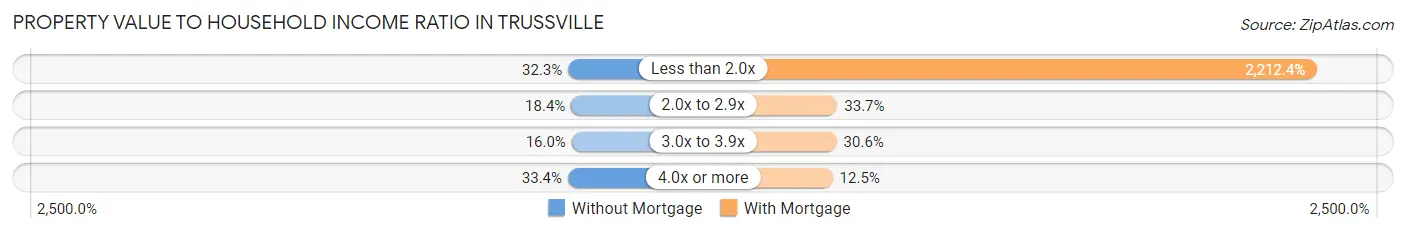
| Value-to-Income Ratio | Without Mortgage | With Mortgage |
| Less than 2.0x | 816 (32.3%) | 131,679 (2,212.3%) |
| 2.0x to 2.9x | 466 (18.4%) | 2,006 (33.7%) |
| 3.0x to 3.9x | 404 (16.0%) | 1,821 (30.6%) |
| 4.0x or more | 844 (33.4%) | 742 (12.5%) |
| Total | 2,530 (100.0%) | 5,952 (100.0%) |
Real Estate Taxes by Mortgage Status in Trussville
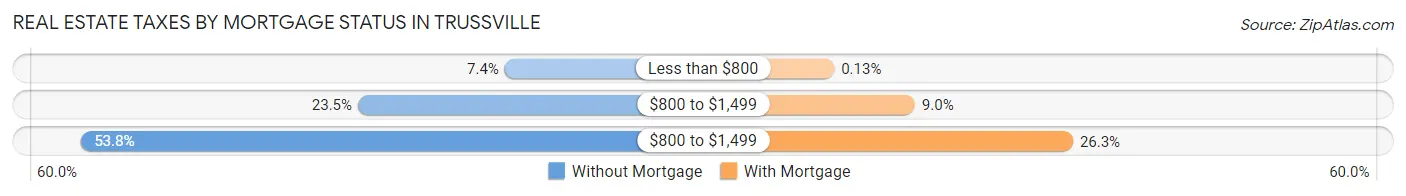
| Property Taxes | Without Mortgage | With Mortgage |
| Less than $800 | 187 (7.4%) | 8 (0.1%) |
| $800 to $1,499 | 594 (23.5%) | 534 (9.0%) |
| $800 to $1,499 | 1,361 (53.8%) | 1,565 (26.3%) |
| Total | 2,530 (100.0%) | 5,952 (100.0%) |
Health & Disability in Trussville
Health Insurance Coverage by Age in Trussville
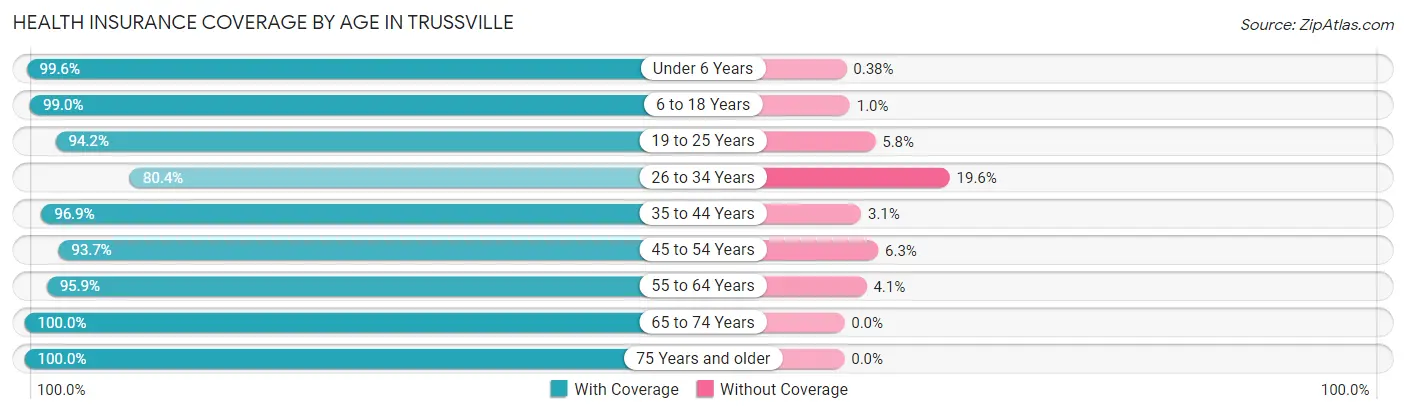
| Age Bracket | With Coverage | Without Coverage |
| Under 6 Years | 1,572 (99.6%) | 6 (0.4%) |
| 6 to 18 Years | 4,933 (99.0%) | 51 (1.0%) |
| 19 to 25 Years | 1,240 (94.2%) | 76 (5.8%) |
| 26 to 34 Years | 1,461 (80.4%) | 357 (19.6%) |
| 35 to 44 Years | 4,063 (96.9%) | 131 (3.1%) |
| 45 to 54 Years | 3,684 (93.7%) | 248 (6.3%) |
| 55 to 64 Years | 3,602 (95.9%) | 155 (4.1%) |
| 65 to 74 Years | 2,390 (100.0%) | 0 (0.0%) |
| 75 Years and older | 1,428 (100.0%) | 0 (0.0%) |
| Total | 24,373 (96.0%) | 1,024 (4.0%) |
Health Insurance Coverage by Citizenship Status in Trussville
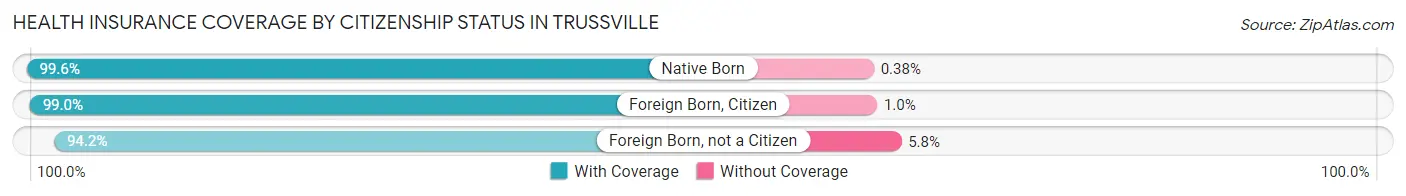
| Citizenship Status | With Coverage | Without Coverage |
| Native Born | 1,572 (99.6%) | 6 (0.4%) |
| Foreign Born, Citizen | 4,933 (99.0%) | 51 (1.0%) |
| Foreign Born, not a Citizen | 1,240 (94.2%) | 76 (5.8%) |
Health Insurance Coverage by Household Income in Trussville
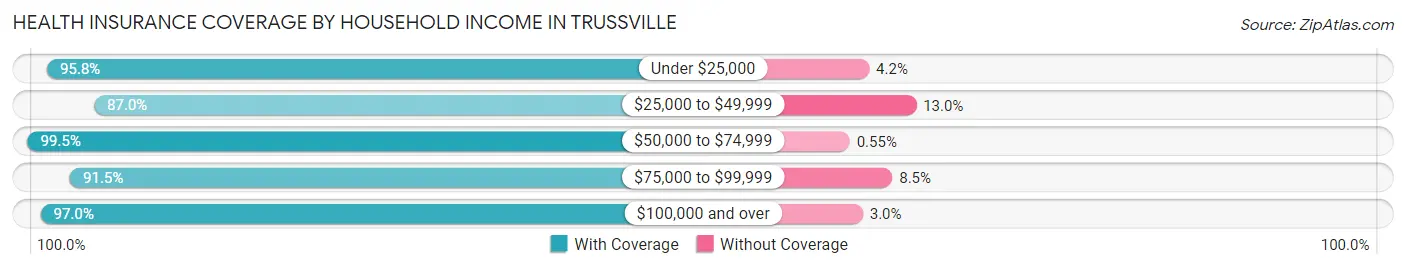
| Household Income | With Coverage | Without Coverage |
| Under $25,000 | 434 (95.8%) | 19 (4.2%) |
| $25,000 to $49,999 | 1,271 (87.0%) | 190 (13.0%) |
| $50,000 to $74,999 | 2,880 (99.5%) | 16 (0.5%) |
| $75,000 to $99,999 | 3,051 (91.5%) | 284 (8.5%) |
| $100,000 and over | 16,737 (97.0%) | 515 (3.0%) |
Public vs Private Health Insurance Coverage by Age in Trussville
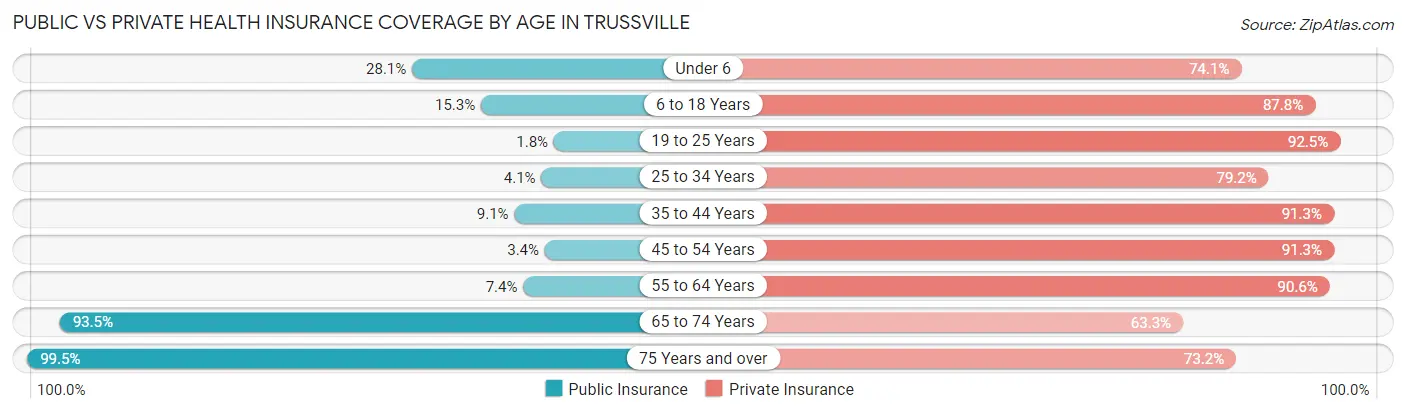
| Age Bracket | Public Insurance | Private Insurance |
| Under 6 | 443 (28.1%) | 1,170 (74.1%) |
| 6 to 18 Years | 761 (15.3%) | 4,377 (87.8%) |
| 19 to 25 Years | 23 (1.8%) | 1,217 (92.5%) |
| 25 to 34 Years | 74 (4.1%) | 1,440 (79.2%) |
| 35 to 44 Years | 381 (9.1%) | 3,829 (91.3%) |
| 45 to 54 Years | 135 (3.4%) | 3,591 (91.3%) |
| 55 to 64 Years | 279 (7.4%) | 3,402 (90.5%) |
| 65 to 74 Years | 2,234 (93.5%) | 1,513 (63.3%) |
| 75 Years and over | 1,421 (99.5%) | 1,045 (73.2%) |
| Total | 5,751 (22.6%) | 21,584 (85.0%) |
Disability Status by Sex by Age in Trussville
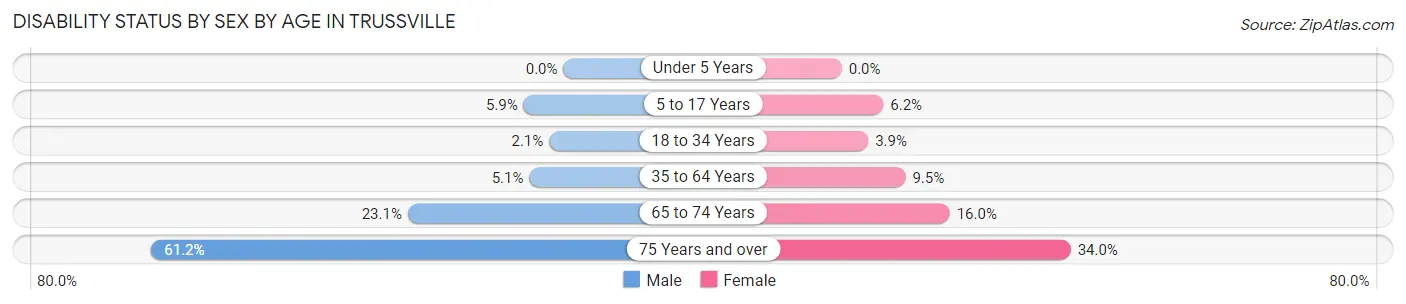
| Age Bracket | Male | Female |
| Under 5 Years | 0 (0.0%) | 0 (0.0%) |
| 5 to 17 Years | 140 (5.9%) | 163 (6.2%) |
| 18 to 34 Years | 42 (2.1%) | 59 (3.9%) |
| 35 to 64 Years | 302 (5.1%) | 558 (9.5%) |
| 65 to 74 Years | 251 (23.1%) | 209 (16.0%) |
| 75 Years and over | 375 (61.2%) | 277 (34.0%) |
Disability Class by Sex by Age in Trussville
Disability Class: Hearing Difficulty
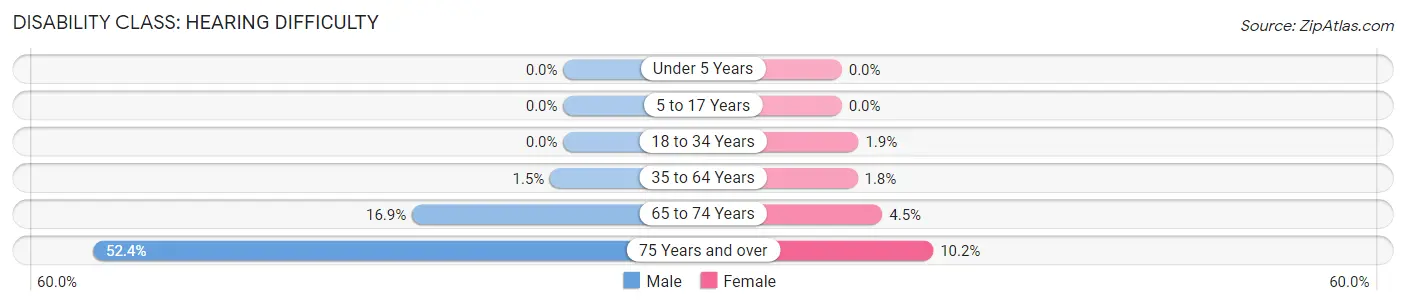
| Age Bracket | Male | Female |
| Under 5 Years | 0 (0.0%) | 0 (0.0%) |
| 5 to 17 Years | 0 (0.0%) | 0 (0.0%) |
| 18 to 34 Years | 0 (0.0%) | 28 (1.9%) |
| 35 to 64 Years | 88 (1.5%) | 103 (1.8%) |
| 65 to 74 Years | 183 (16.9%) | 59 (4.5%) |
| 75 Years and over | 321 (52.4%) | 83 (10.2%) |
Disability Class: Vision Difficulty
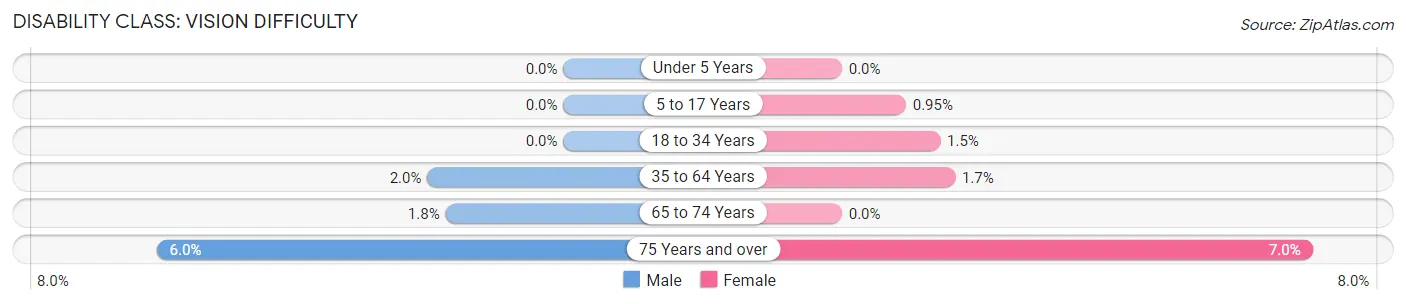
| Age Bracket | Male | Female |
| Under 5 Years | 0 (0.0%) | 0 (0.0%) |
| 5 to 17 Years | 0 (0.0%) | 25 (0.9%) |
| 18 to 34 Years | 0 (0.0%) | 22 (1.5%) |
| 35 to 64 Years | 121 (2.0%) | 99 (1.7%) |
| 65 to 74 Years | 19 (1.8%) | 0 (0.0%) |
| 75 Years and over | 37 (6.0%) | 57 (7.0%) |
Disability Class: Cognitive Difficulty
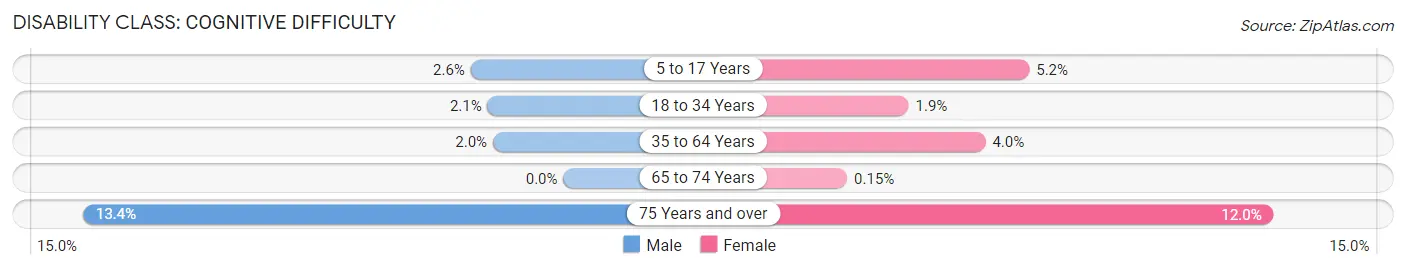
| Age Bracket | Male | Female |
| 5 to 17 Years | 61 (2.6%) | 138 (5.2%) |
| 18 to 34 Years | 42 (2.1%) | 28 (1.9%) |
| 35 to 64 Years | 117 (2.0%) | 236 (4.0%) |
| 65 to 74 Years | 0 (0.0%) | 2 (0.2%) |
| 75 Years and over | 82 (13.4%) | 98 (12.0%) |
Disability Class: Ambulatory Difficulty
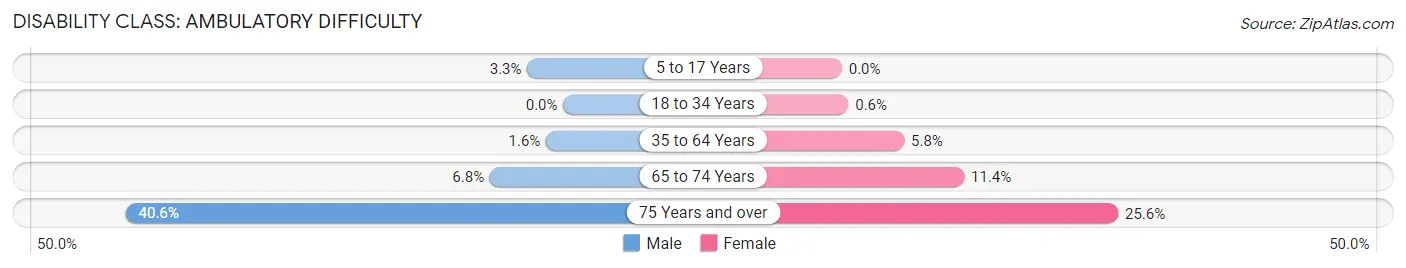
| Age Bracket | Male | Female |
| 5 to 17 Years | 79 (3.3%) | 0 (0.0%) |
| 18 to 34 Years | 0 (0.0%) | 9 (0.6%) |
| 35 to 64 Years | 95 (1.6%) | 341 (5.8%) |
| 65 to 74 Years | 74 (6.8%) | 148 (11.4%) |
| 75 Years and over | 249 (40.6%) | 209 (25.6%) |
Disability Class: Self-Care Difficulty
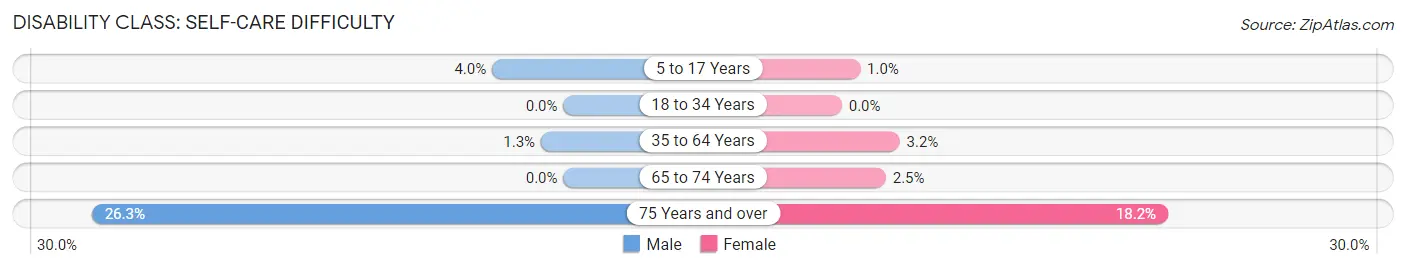
| Age Bracket | Male | Female |
| 5 to 17 Years | 94 (4.0%) | 27 (1.0%) |
| 18 to 34 Years | 0 (0.0%) | 0 (0.0%) |
| 35 to 64 Years | 75 (1.3%) | 190 (3.2%) |
| 65 to 74 Years | 0 (0.0%) | 32 (2.5%) |
| 75 Years and over | 161 (26.3%) | 148 (18.2%) |
Technology Access in Trussville
Computing Device Access in Trussville
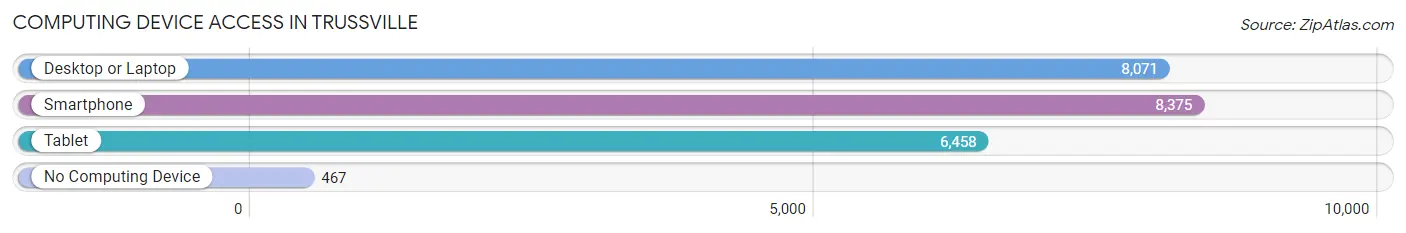
| Device Type | # Households | % Households |
| Desktop or Laptop | 8,071 | 88.4% |
| Smartphone | 8,375 | 91.8% |
| Tablet | 6,458 | 70.8% |
| No Computing Device | 467 | 5.1% |
| Total | 9,126 | 100.0% |
Internet Access in Trussville
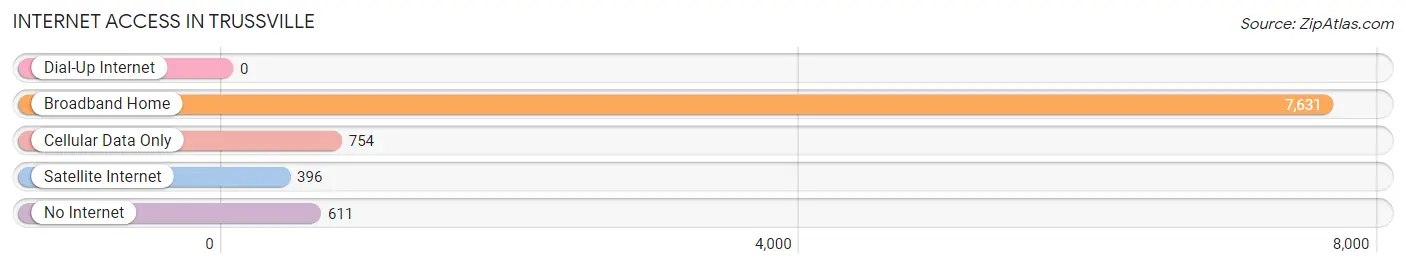
| Internet Type | # Households | % Households |
| Dial-Up Internet | 0 | 0.0% |
| Broadband Home | 7,631 | 83.6% |
| Cellular Data Only | 754 | 8.3% |
| Satellite Internet | 396 | 4.3% |
| No Internet | 611 | 6.7% |
| Total | 9,126 | 100.0% |
Trussville Summary
Trussville is a city located in Jefferson and St. Clair counties in the state of Alabama. It is a suburb of Birmingham and is located about 15 miles northeast of the city. The population of Trussville was 19,933 at the 2010 census.
History
Trussville was founded in 1839 by John Truss, a settler from Tennessee. The city was originally known as “Truss’s Crossroads” and was a small farming community. In 1887, the Louisville and Nashville Railroad was built through the area, and the town was renamed Trussville. The railroad brought new economic opportunities to the area, and the town began to grow.
In the early 1900s, Trussville was a thriving community with a variety of businesses, including a cotton gin, a grist mill, a sawmill, and a brickyard. The town also had a hotel, a bank, and several churches.
In the 1950s, Trussville began to experience rapid growth due to its proximity to Birmingham. The city was incorporated in 1957 and has continued to grow since then.
Geography
Trussville is located at 33°37'N 86°33'W (33.619, -86.547). According to the U.S. Census Bureau, the city has a total area of 16.2 square miles, of which 16.1 square miles is land and 0.1 square miles is water.
Trussville is located in the foothills of the Appalachian Mountains and is part of the Appalachian Plateau. The city is situated on the banks of the Cahaba River and is surrounded by rolling hills and forests.
Economy
Trussville’s economy is largely based on retail and services. The city is home to several large shopping centers, including the Trussville Mall and the Colonial Promenade. The city also has a variety of restaurants, hotels, and other businesses.
Trussville is also home to several large employers, including the Honda Manufacturing of Alabama plant, which produces the Honda Odyssey minivan. The city is also home to several medical facilities, including St. Vincent’s Hospital and the Trussville Medical Center.
Demographics
As of the 2010 census, there were 19,933 people, 7,845 households, and 5,717 families residing in the city. The population density was 1,235.3 people per square mile. The racial makeup of the city was 81.2% White, 15.2% African American, 0.3% Native American, 1.2% Asian, 0.1% Pacific Islander, 0.7% from other races, and 1.3% from two or more races. Hispanic or Latino of any race were 2.3% of the population.
The median income for a household in the city was $60,945, and the median income for a family was $71,945. The per capita income for the city was $27,945. About 4.2% of families and 5.7% of the population were below the poverty line, including 7.2% of those under age 18 and 4.2% of those age 65 or over.
Common Questions
What is Per Capita Income in Trussville?
Per Capita income in Trussville is $51,807.
What is the Median Family Income in Trussville?
Median Family Income in Trussville is $135,887.
What is the Median Household income in Trussville?
Median Household Income in Trussville is $118,028.
What is Income or Wage Gap in Trussville?
Income or Wage Gap in Trussville is 40.7%.
Women in Trussville earn 59.3 cents for every dollar earned by a man.
What is Inequality or Gini Index in Trussville?
Inequality or Gini Index in Trussville is 0.37.
What is the Total Population of Trussville?
Total Population of Trussville is 25,621.
What is the Total Male Population of Trussville?
Total Male Population of Trussville is 12,789.
What is the Total Female Population of Trussville?
Total Female Population of Trussville is 12,832.
What is the Ratio of Males per 100 Females in Trussville?
There are 99.66 Males per 100 Females in Trussville.
What is the Ratio of Females per 100 Males in Trussville?
There are 100.34 Females per 100 Males in Trussville.
What is the Median Population Age in Trussville?
Median Population Age in Trussville is 42.0 Years.
What is the Average Family Size in Trussville
Average Family Size in Trussville is 3.1 People.
What is the Average Household Size in Trussville
Average Household Size in Trussville is 2.8 People.
How Large is the Labor Force in Trussville?
There are 13,443 People in the Labor Forcein in Trussville.
What is the Percentage of People in the Labor Force in Trussville?
66.0% of People are in the Labor Force in Trussville.
What is the Unemployment Rate in Trussville?
Unemployment Rate in Trussville is 2.8%.