Buffalo, WY Map & Demographics
Buffalo Map
Buffalo Overview
$33,893
PER CAPITA INCOME
$78,494
AVG FAMILY INCOME
$55,245
AVG HOUSEHOLD INCOME
26.3%
WAGE / INCOME GAP [ % ]
73.7¢/ $1
WAGE / INCOME GAP [ $ ]
$10,776
FAMILY INCOME DEFICIT
0.48
INEQUALITY / GINI INDEX
4,475
TOTAL POPULATION
2,252
MALE POPULATION
2,223
FEMALE POPULATION
101.30
MALES / 100 FEMALES
98.71
FEMALES / 100 MALES
49.0
MEDIAN AGE
2.8
AVG FAMILY SIZE
1.9
AVG HOUSEHOLD SIZE
2,006
LABOR FORCE [ PEOPLE ]
52.7%
PERCENT IN LABOR FORCE
4.0%
UNEMPLOYMENT RATE
Buffalo Zip Codes
Buffalo Area Codes
Income in Buffalo
Income Overview in Buffalo
Per Capita Income in Buffalo is $33,893, while median incomes of families and households are $78,494 and $55,245 respectively.
| Characteristic | Number | Measure |
| Per Capita Income | 4,475 | $33,893 |
| Median Family Income | 1,105 | $78,494 |
| Mean Family Income | 1,105 | $89,617 |
| Median Household Income | 2,283 | $55,245 |
| Mean Household Income | 2,283 | $64,186 |
| Income Deficit | 1,105 | $10,776 |
| Wage / Income Gap (%) | 4,475 | 26.31% |
| Wage / Income Gap ($) | 4,475 | 73.69¢ per $1 |
| Gini / Inequality Index | 4,475 | 0.48 |
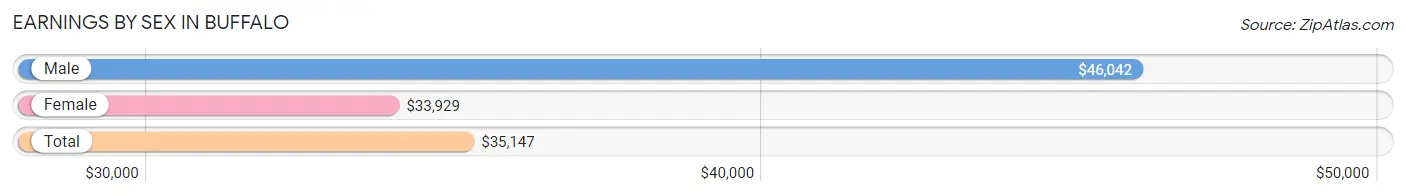
Earnings by Sex in Buffalo
Average Earnings in Buffalo are $35,147, $46,042 for men and $33,929 for women, a difference of 26.3%.
| Sex | Number | Average Earnings |
| Male | 1,218 (55.8%) | $46,042 |
| Female | 966 (44.2%) | $33,929 |
| Total | 2,184 (100.0%) | $35,147 |
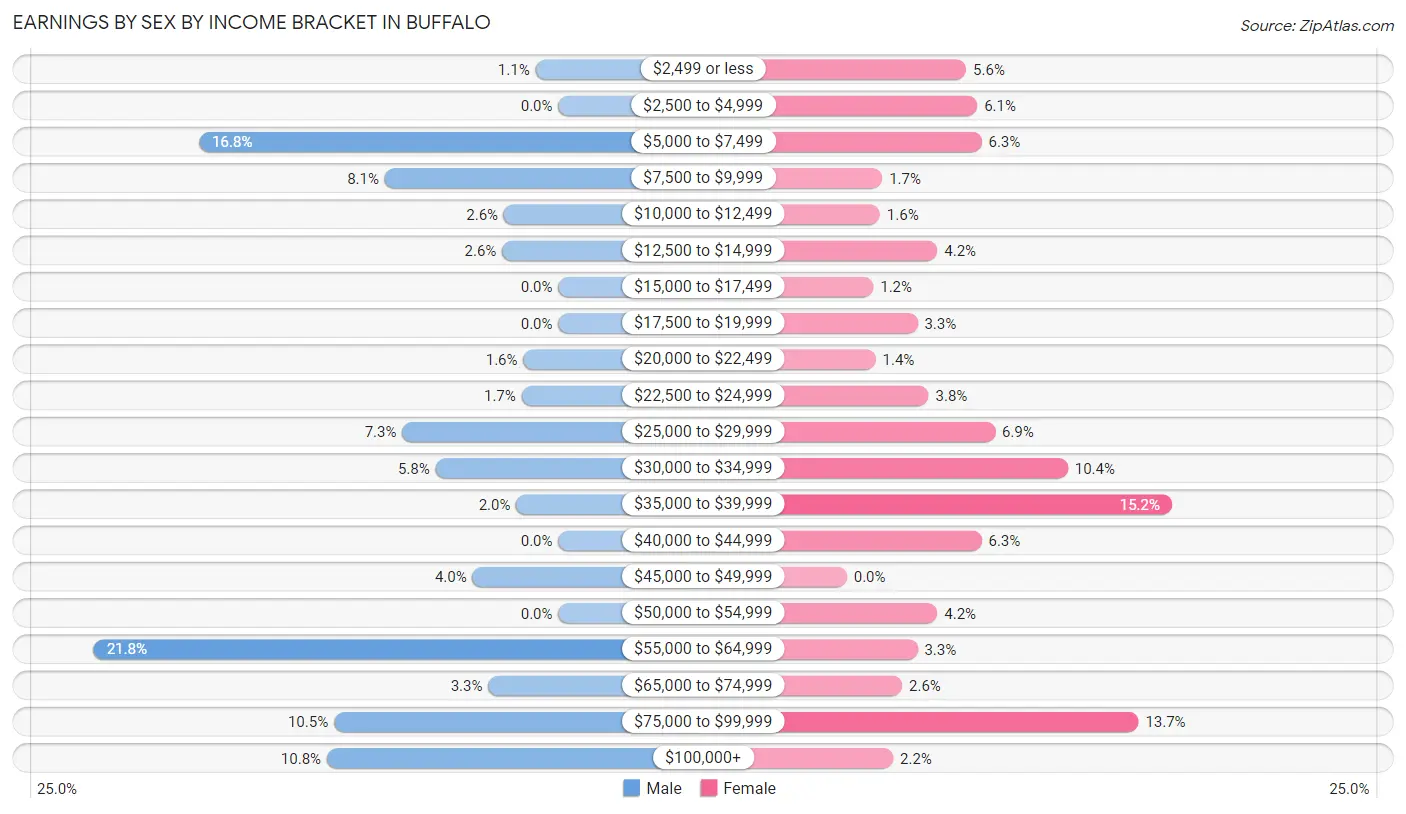
Earnings by Sex by Income Bracket in Buffalo
The most common earnings brackets in Buffalo are $55,000 to $64,999 for men (265 | 21.8%) and $35,000 to $39,999 for women (147 | 15.2%).
| Income | Male | Female |
| $2,499 or less | 13 (1.1%) | 54 (5.6%) |
| $2,500 to $4,999 | 0 (0.0%) | 59 (6.1%) |
| $5,000 to $7,499 | 205 (16.8%) | 61 (6.3%) |
| $7,500 to $9,999 | 99 (8.1%) | 16 (1.7%) |
| $10,000 to $12,499 | 31 (2.5%) | 15 (1.5%) |
| $12,500 to $14,999 | 32 (2.6%) | 41 (4.2%) |
| $15,000 to $17,499 | 0 (0.0%) | 12 (1.2%) |
| $17,500 to $19,999 | 0 (0.0%) | 32 (3.3%) |
| $20,000 to $22,499 | 20 (1.6%) | 13 (1.3%) |
| $22,500 to $24,999 | 21 (1.7%) | 37 (3.8%) |
| $25,000 to $29,999 | 89 (7.3%) | 67 (6.9%) |
| $30,000 to $34,999 | 70 (5.8%) | 100 (10.3%) |
| $35,000 to $39,999 | 24 (2.0%) | 147 (15.2%) |
| $40,000 to $44,999 | 0 (0.0%) | 61 (6.3%) |
| $45,000 to $49,999 | 49 (4.0%) | 0 (0.0%) |
| $50,000 to $54,999 | 0 (0.0%) | 41 (4.2%) |
| $55,000 to $64,999 | 265 (21.8%) | 32 (3.3%) |
| $65,000 to $74,999 | 40 (3.3%) | 25 (2.6%) |
| $75,000 to $99,999 | 128 (10.5%) | 132 (13.7%) |
| $100,000+ | 132 (10.8%) | 21 (2.2%) |
| Total | 1,218 (100.0%) | 966 (100.0%) |
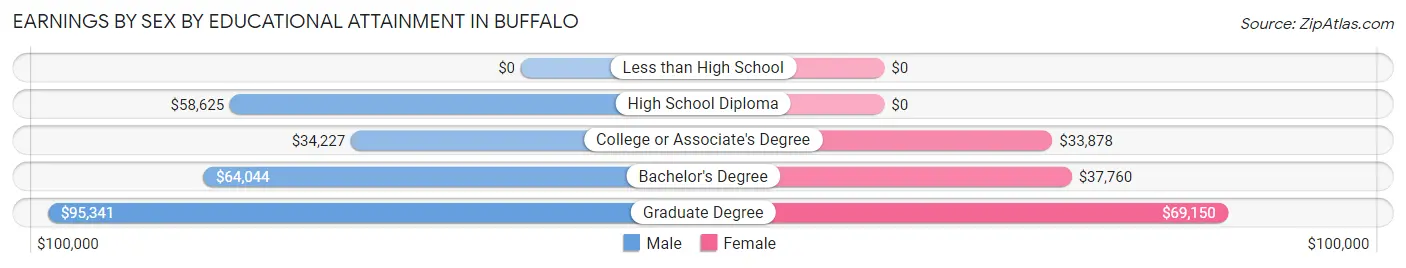
Earnings by Sex by Educational Attainment in Buffalo
Average earnings in Buffalo are $56,741 for men and $34,643 for women, a difference of 39.0%. Men with an educational attainment of graduate degree enjoy the highest average annual earnings of $95,341, while those with college or associate's degree education earn the least with $34,227. Women with an educational attainment of graduate degree earn the most with the average annual earnings of $69,150, while those with college or associate's degree education have the smallest earnings of $33,878.
| Educational Attainment | Male Income | Female Income |
| Less than High School | - | - |
| High School Diploma | $58,625 | $0 |
| College or Associate's Degree | $34,227 | $33,878 |
| Bachelor's Degree | $64,044 | $37,760 |
| Graduate Degree | $95,341 | $69,150 |
| Total | $56,741 | $34,643 |
Family Income in Buffalo
Family Income Brackets in Buffalo
According to the Buffalo family income data, there are 292 families falling into the $100,000 to $149,999 income range, which is the most common income bracket and makes up 26.4% of all families.
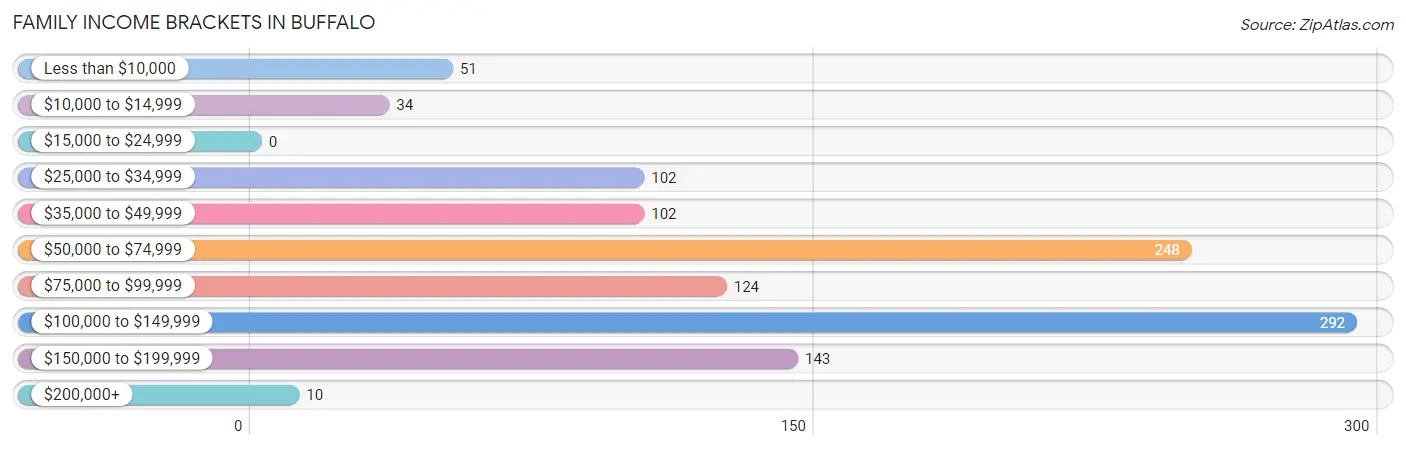
| Income Bracket | # Families | % Families |
| Less than $10,000 | 51 | 4.6% |
| $10,000 to $14,999 | 34 | 3.1% |
| $15,000 to $24,999 | 0 | 0.0% |
| $25,000 to $34,999 | 102 | 9.2% |
| $35,000 to $49,999 | 102 | 9.2% |
| $50,000 to $74,999 | 248 | 22.4% |
| $75,000 to $99,999 | 124 | 11.2% |
| $100,000 to $149,999 | 292 | 26.4% |
| $150,000 to $199,999 | 143 | 12.9% |
| $200,000+ | 10 | 0.9% |
Family Income by Famaliy Size in Buffalo
4-person families (124 | 11.2%) account for the highest median family income in Buffalo with $120,921 per family, while 3-person families (192 | 17.4%) have the highest median income of $37,333 per family member.
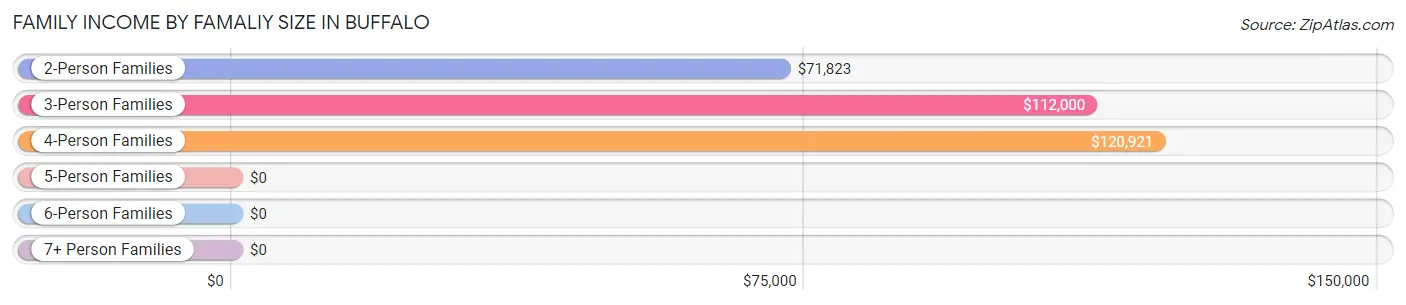
| Income Bracket | # Families | Median Income |
| 2-Person Families | 715 (64.7%) | $71,823 |
| 3-Person Families | 192 (17.4%) | $112,000 |
| 4-Person Families | 124 (11.2%) | $120,921 |
| 5-Person Families | 58 (5.2%) | $0 |
| 6-Person Families | 16 (1.5%) | $0 |
| 7+ Person Families | 0 (0.0%) | $0 |
| Total | 1,105 (100.0%) | $78,494 |
Family Income by Number of Earners in Buffalo
The median family income in Buffalo is $78,494, with families comprising 3+ earners (71) having the highest median family income of $175,625, while families with no earners (247) have the lowest median family income of $47,697, accounting for 6.4% and 22.4% of families, respectively.
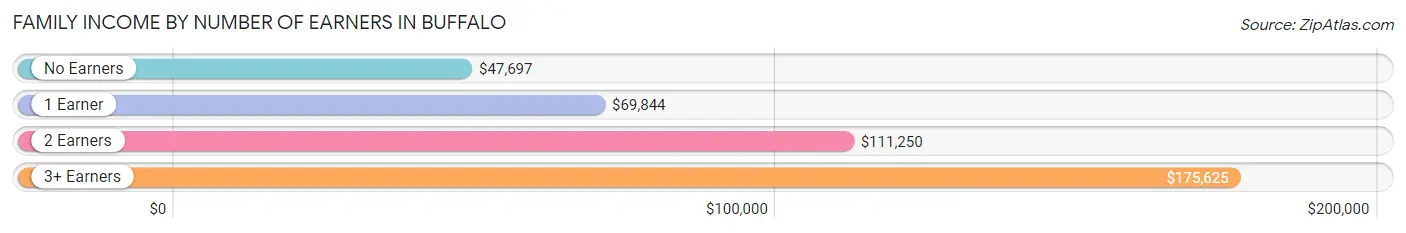
| Number of Earners | # Families | Median Income |
| No Earners | 247 (22.4%) | $47,697 |
| 1 Earner | 312 (28.2%) | $69,844 |
| 2 Earners | 475 (43.0%) | $111,250 |
| 3+ Earners | 71 (6.4%) | $175,625 |
| Total | 1,105 (100.0%) | $78,494 |
Household Income in Buffalo
Household Income Brackets in Buffalo
With 459 households falling in the category, the $50,000 to $74,999 income range is the most frequent in Buffalo, accounting for 20.1% of all households. In contrast, only 30 households (1.3%) fall into the $200,000+ income bracket, making it the least populous group.
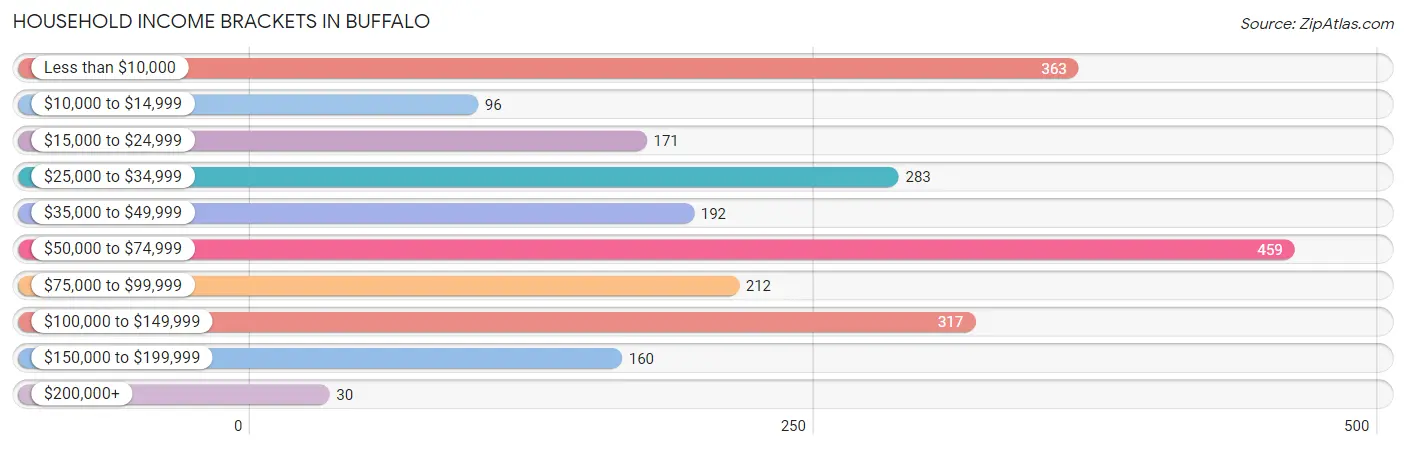
| Income Bracket | # Households | % Households |
| Less than $10,000 | 363 | 15.9% |
| $10,000 to $14,999 | 96 | 4.2% |
| $15,000 to $24,999 | 171 | 7.5% |
| $25,000 to $34,999 | 283 | 12.4% |
| $35,000 to $49,999 | 192 | 8.4% |
| $50,000 to $74,999 | 459 | 20.1% |
| $75,000 to $99,999 | 212 | 9.3% |
| $100,000 to $149,999 | 317 | 13.9% |
| $150,000 to $199,999 | 160 | 7.0% |
| $200,000+ | 30 | 1.3% |
Household Income by Householder Age in Buffalo
The median household income in Buffalo is $55,245, with the highest median household income of $88,750 found in the 45 to 64 years age bracket for the primary householder. A total of 625 households (27.4%) fall into this category. Meanwhile, the 15 to 24 years age bracket for the primary householder has the lowest median household income of $2,499, with 231 households (10.1%) in this group.
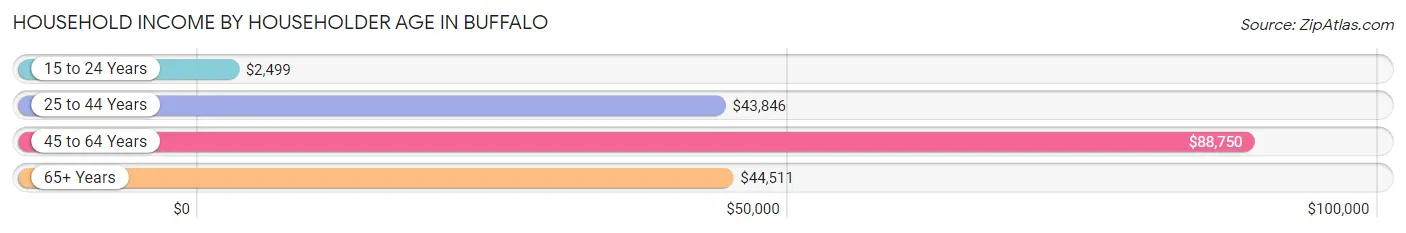
| Income Bracket | # Households | Median Income |
| 15 to 24 Years | 231 (10.1%) | $2,499 |
| 25 to 44 Years | 516 (22.6%) | $43,846 |
| 45 to 64 Years | 625 (27.4%) | $88,750 |
| 65+ Years | 911 (39.9%) | $44,511 |
| Total | 2,283 (100.0%) | $55,245 |
Poverty in Buffalo
Income Below Poverty by Sex and Age in Buffalo
With 19.9% poverty level for males and 16.9% for females among the residents of Buffalo, 6 to 11 year old males and under 5 year old females are the most vulnerable to poverty, with 68 males (72.3%) and 74 females (45.7%) in their respective age groups living below the poverty level.
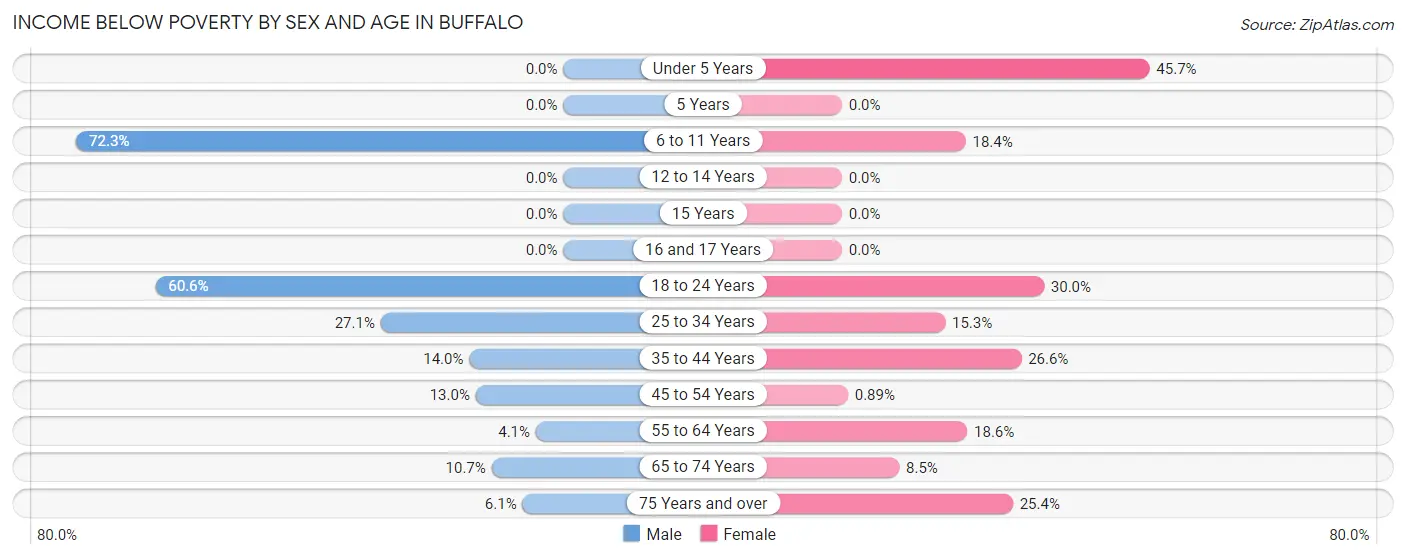
| Age Bracket | Male | Female |
| Under 5 Years | 0 (0.0%) | 74 (45.7%) |
| 5 Years | 0 (0.0%) | 0 (0.0%) |
| 6 to 11 Years | 68 (72.3%) | 25 (18.4%) |
| 12 to 14 Years | 0 (0.0%) | 0 (0.0%) |
| 15 Years | 0 (0.0%) | 0 (0.0%) |
| 16 and 17 Years | 0 (0.0%) | 0 (0.0%) |
| 18 to 24 Years | 166 (60.6%) | 15 (30.0%) |
| 25 to 34 Years | 80 (27.1%) | 40 (15.3%) |
| 35 to 44 Years | 25 (14.0%) | 57 (26.6%) |
| 45 to 54 Years | 32 (13.0%) | 2 (0.9%) |
| 55 to 64 Years | 12 (4.1%) | 51 (18.6%) |
| 65 to 74 Years | 33 (10.6%) | 33 (8.5%) |
| 75 Years and over | 19 (6.1%) | 67 (25.4%) |
| Total | 435 (19.9%) | 364 (16.9%) |
Income Above Poverty by Sex and Age in Buffalo
According to the poverty statistics in Buffalo, males aged under 5 years and females aged 5 years are the age groups that are most secure financially, with 100.0% of males and 100.0% of females in these age groups living above the poverty line.
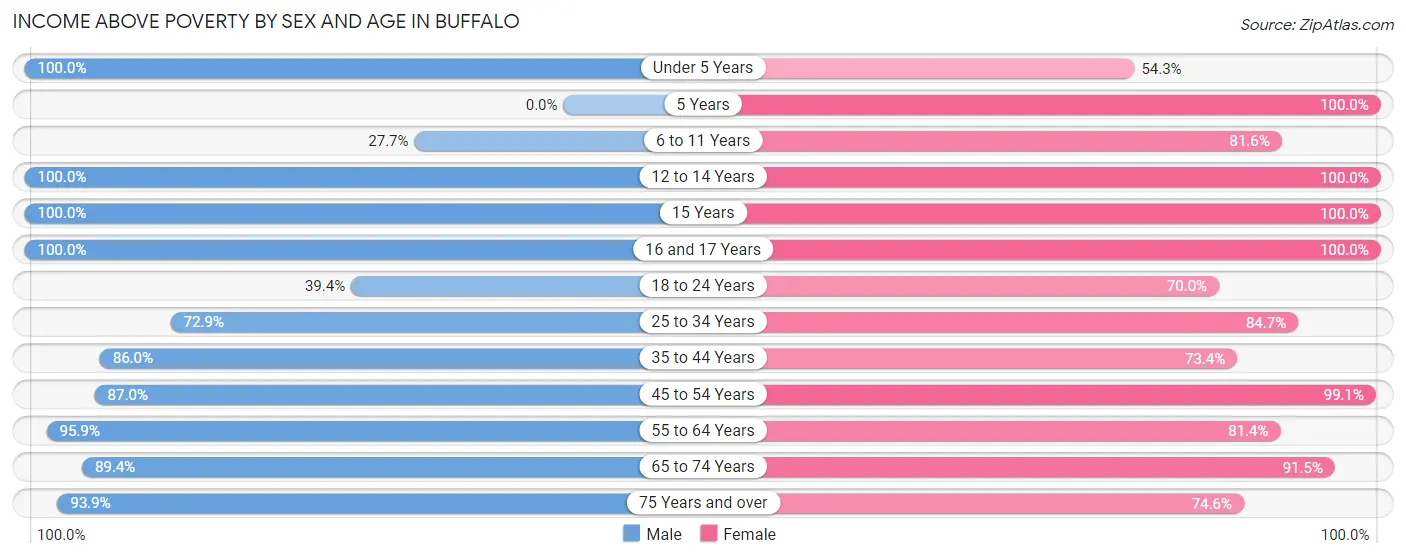
| Age Bracket | Male | Female |
| Under 5 Years | 111 (100.0%) | 88 (54.3%) |
| 5 Years | 0 (0.0%) | 50 (100.0%) |
| 6 to 11 Years | 26 (27.7%) | 111 (81.6%) |
| 12 to 14 Years | 52 (100.0%) | 41 (100.0%) |
| 15 Years | 15 (100.0%) | 7 (100.0%) |
| 16 and 17 Years | 4 (100.0%) | 88 (100.0%) |
| 18 to 24 Years | 108 (39.4%) | 35 (70.0%) |
| 25 to 34 Years | 215 (72.9%) | 221 (84.7%) |
| 35 to 44 Years | 154 (86.0%) | 157 (73.4%) |
| 45 to 54 Years | 214 (87.0%) | 222 (99.1%) |
| 55 to 64 Years | 282 (95.9%) | 223 (81.4%) |
| 65 to 74 Years | 277 (89.3%) | 355 (91.5%) |
| 75 Years and over | 294 (93.9%) | 197 (74.6%) |
| Total | 1,752 (80.1%) | 1,795 (83.1%) |
Income Below Poverty Among Married-Couple Families in Buffalo
The poverty statistics for married-couple families in Buffalo show that 11.2% or 115 of the total 1,027 families live below the poverty line. Families with 3 or 4 children have the highest poverty rate of 40.5%, comprising of 30 families. On the other hand, families with no children have the lowest poverty rate of 4.6%, which includes 34 families.
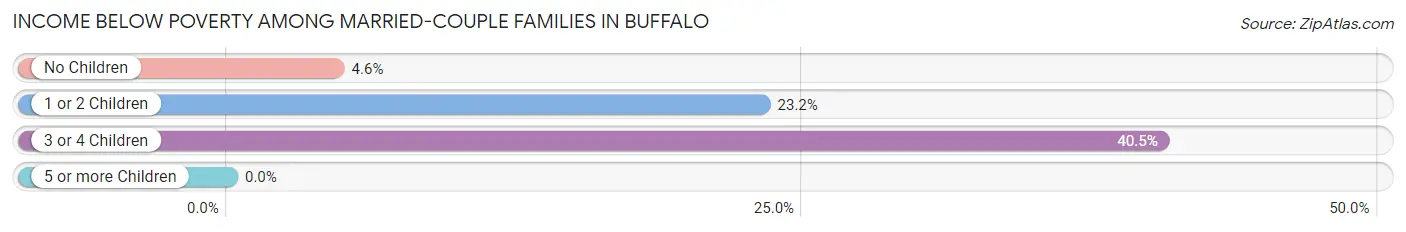
| Children | Above Poverty | Below Poverty |
| No Children | 699 (95.4%) | 34 (4.6%) |
| 1 or 2 Children | 169 (76.8%) | 51 (23.2%) |
| 3 or 4 Children | 44 (59.5%) | 30 (40.5%) |
| 5 or more Children | 0 (0.0%) | 0 (0.0%) |
| Total | 912 (88.8%) | 115 (11.2%) |
Income Below Poverty Among Single-Parent Households in Buffalo
| Children | Single Father | Single Mother |
| No Children | 0 (0.0%) | 0 (0.0%) |
| 1 or 2 Children | 0 (0.0%) | 0 (0.0%) |
| 3 or 4 Children | 0 (0.0%) | 0 (0.0%) |
| 5 or more Children | 0 (0.0%) | 0 (0.0%) |
| Total | 0 (0.0%) | 0 (0.0%) |
Income Below Poverty Among Married-Couple vs Single-Parent Households in Buffalo
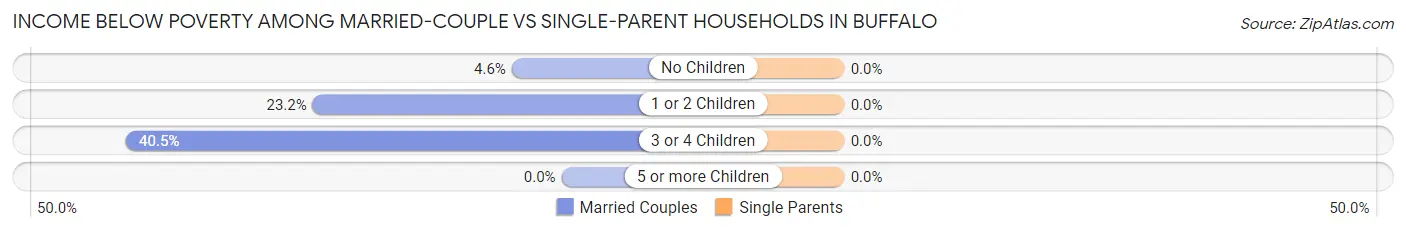
| Children | Married-Couple Families | Single-Parent Households |
| No Children | 34 (4.6%) | 0 (0.0%) |
| 1 or 2 Children | 51 (23.2%) | 0 (0.0%) |
| 3 or 4 Children | 30 (40.5%) | 0 (0.0%) |
| 5 or more Children | 0 (0.0%) | 0 (0.0%) |
| Total | 115 (11.2%) | 0 (0.0%) |
Race in Buffalo
The most populous races in Buffalo are White / Caucasian (4,185 | 93.5%), Hispanic or Latino (260 | 5.8%), and Some other Race (108 | 2.4%).
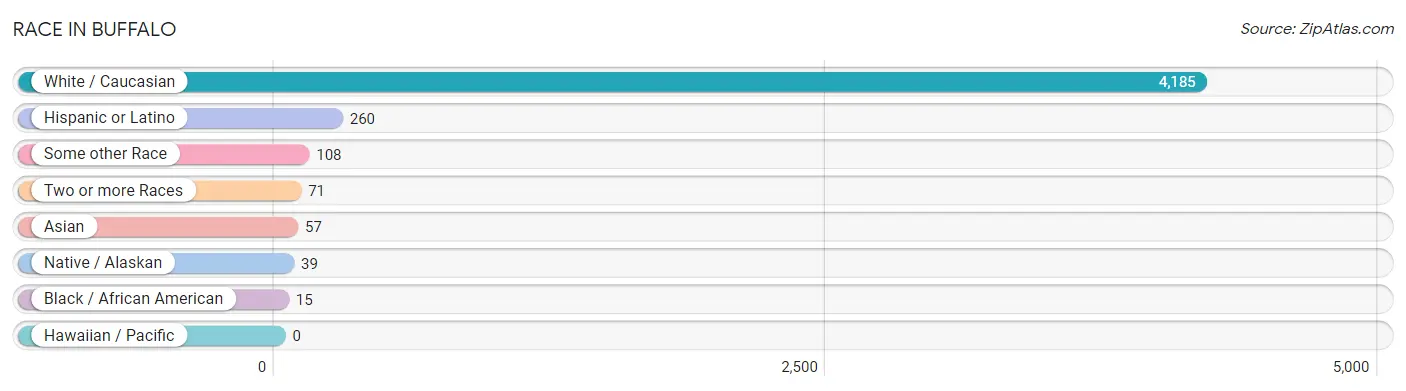
| Race | # Population | % Population |
| Asian | 57 | 1.3% |
| Black / African American | 15 | 0.3% |
| Hawaiian / Pacific | 0 | 0.0% |
| Hispanic or Latino | 260 | 5.8% |
| Native / Alaskan | 39 | 0.9% |
| White / Caucasian | 4,185 | 93.5% |
| Two or more Races | 71 | 1.6% |
| Some other Race | 108 | 2.4% |
| Total | 4,475 | 100.0% |
Ancestry in Buffalo
The most populous ancestries reported in Buffalo are German (1,479 | 33.1%), English (653 | 14.6%), Irish (541 | 12.1%), Swedish (271 | 6.1%), and American (227 | 5.1%), together accounting for 70.9% of all Buffalo residents.
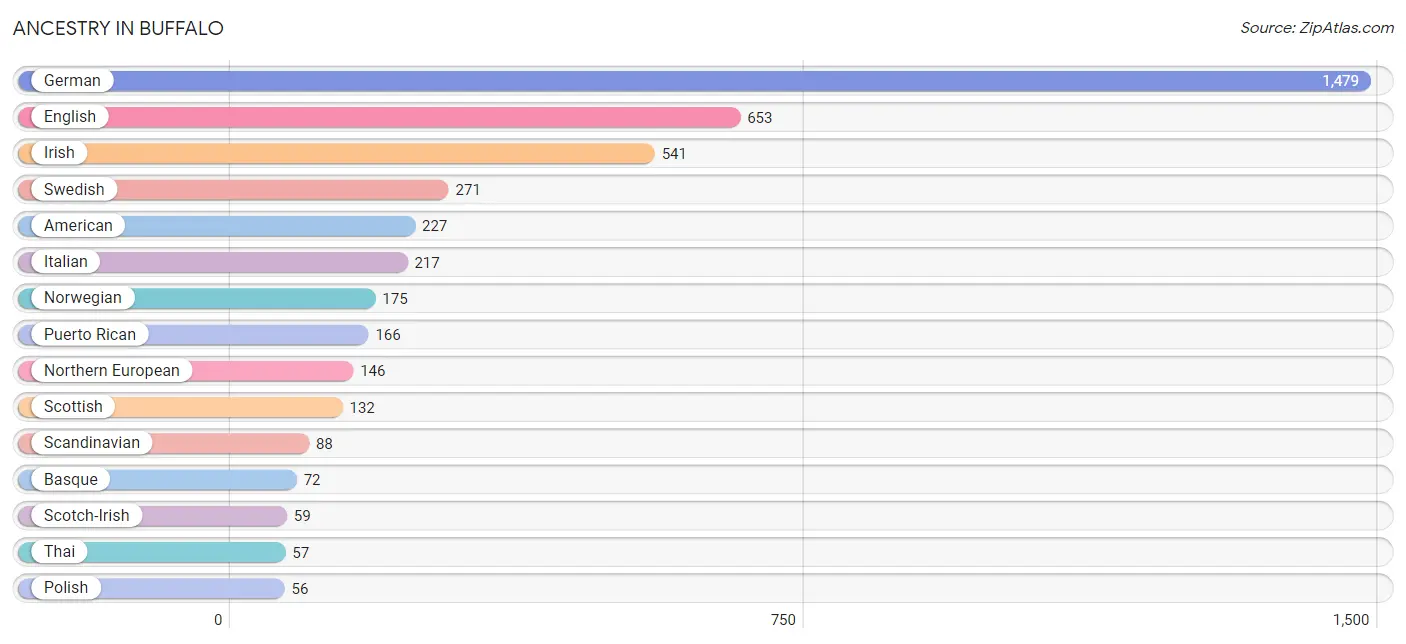
| Ancestry | # Population | % Population |
| African | 1 | 0.0% |
| American | 227 | 5.1% |
| Basque | 72 | 1.6% |
| Belgian | 43 | 1.0% |
| Bhutanese | 7 | 0.2% |
| British | 26 | 0.6% |
| Canadian | 40 | 0.9% |
| Cherokee | 49 | 1.1% |
| Cheyenne | 1 | 0.0% |
| Danish | 2 | 0.0% |
| Dutch | 35 | 0.8% |
| English | 653 | 14.6% |
| European | 44 | 1.0% |
| French | 45 | 1.0% |
| French Canadian | 18 | 0.4% |
| German | 1,479 | 33.1% |
| Hungarian | 12 | 0.3% |
| Irish | 541 | 12.1% |
| Italian | 217 | 4.9% |
| Mexican | 6 | 0.1% |
| Mongolian | 37 | 0.8% |
| Northern European | 146 | 3.3% |
| Norwegian | 175 | 3.9% |
| Polish | 56 | 1.3% |
| Puerto Rican | 166 | 3.7% |
| Scandinavian | 88 | 2.0% |
| Scotch-Irish | 59 | 1.3% |
| Scottish | 132 | 2.9% |
| Spanish | 39 | 0.9% |
| Subsaharan African | 1 | 0.0% |
| Swedish | 271 | 6.1% |
| Swiss | 32 | 0.7% |
| Thai | 57 | 1.3% |
| Welsh | 28 | 0.6% | View All 34 Rows |
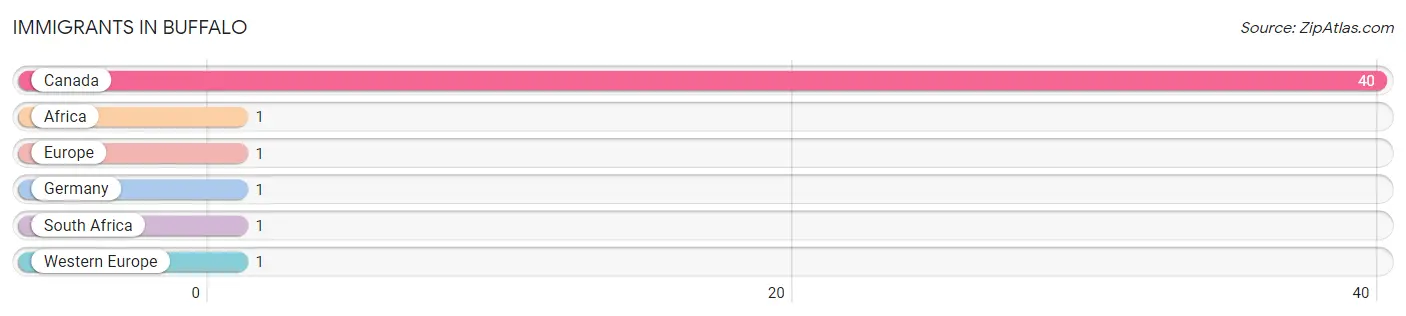
Immigrants in Buffalo
The most numerous immigrant groups reported in Buffalo came from Canada (40 | 0.9%), Africa (1 | 0.0%), Europe (1 | 0.0%), Germany (1 | 0.0%), and South Africa (1 | 0.0%), together accounting for 1.0% of all Buffalo residents.
| Immigration Origin | # Population | % Population |
| Africa | 1 | 0.0% |
| Canada | 40 | 0.9% |
| Europe | 1 | 0.0% |
| Germany | 1 | 0.0% |
| South Africa | 1 | 0.0% |
| Western Europe | 1 | 0.0% | View All 6 Rows |
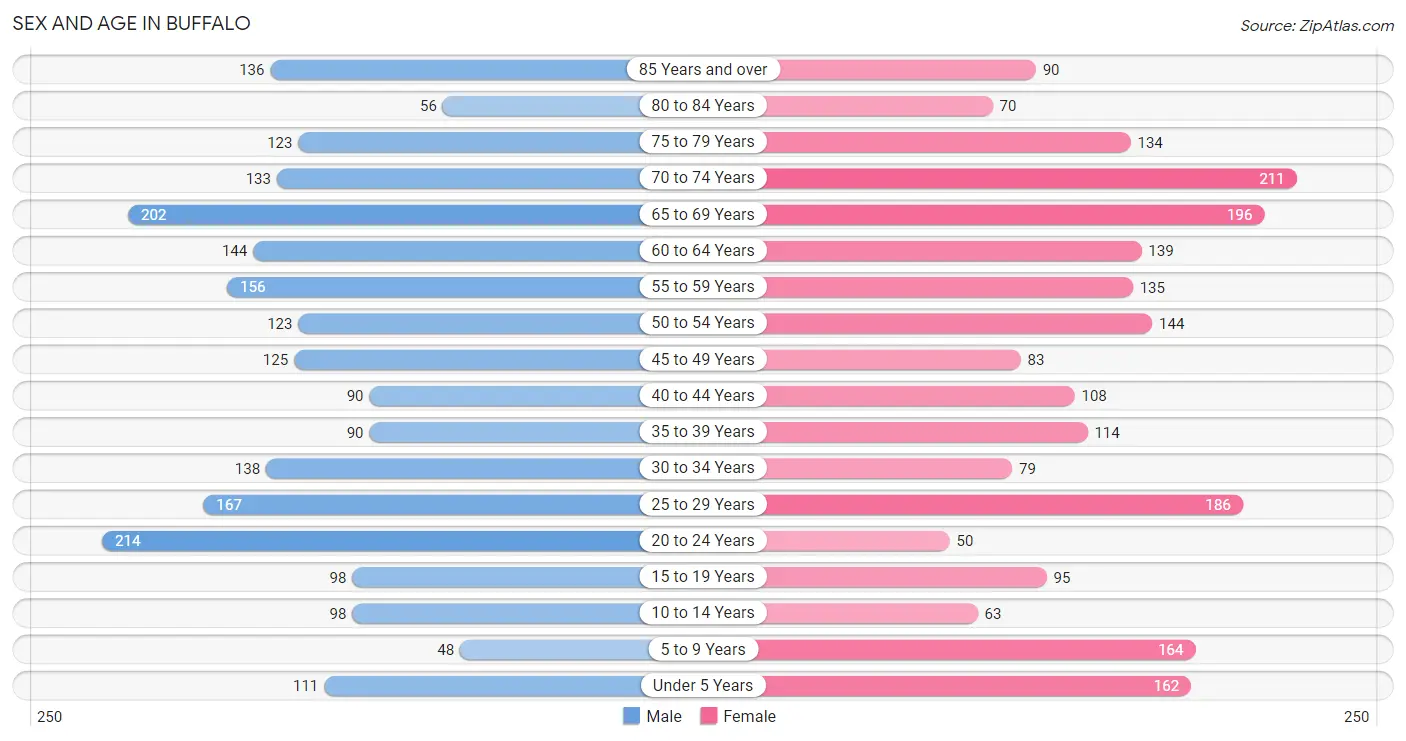
Sex and Age in Buffalo
Sex and Age in Buffalo
The most populous age groups in Buffalo are 20 to 24 Years (214 | 9.5%) for men and 70 to 74 Years (211 | 9.5%) for women.
| Age Bracket | Male | Female |
| Under 5 Years | 111 (4.9%) | 162 (7.3%) |
| 5 to 9 Years | 48 (2.1%) | 164 (7.4%) |
| 10 to 14 Years | 98 (4.3%) | 63 (2.8%) |
| 15 to 19 Years | 98 (4.3%) | 95 (4.3%) |
| 20 to 24 Years | 214 (9.5%) | 50 (2.2%) |
| 25 to 29 Years | 167 (7.4%) | 186 (8.4%) |
| 30 to 34 Years | 138 (6.1%) | 79 (3.5%) |
| 35 to 39 Years | 90 (4.0%) | 114 (5.1%) |
| 40 to 44 Years | 90 (4.0%) | 108 (4.9%) |
| 45 to 49 Years | 125 (5.6%) | 83 (3.7%) |
| 50 to 54 Years | 123 (5.5%) | 144 (6.5%) |
| 55 to 59 Years | 156 (6.9%) | 135 (6.1%) |
| 60 to 64 Years | 144 (6.4%) | 139 (6.2%) |
| 65 to 69 Years | 202 (9.0%) | 196 (8.8%) |
| 70 to 74 Years | 133 (5.9%) | 211 (9.5%) |
| 75 to 79 Years | 123 (5.5%) | 134 (6.0%) |
| 80 to 84 Years | 56 (2.5%) | 70 (3.2%) |
| 85 Years and over | 136 (6.0%) | 90 (4.1%) |
| Total | 2,252 (100.0%) | 2,223 (100.0%) |
Families and Households in Buffalo
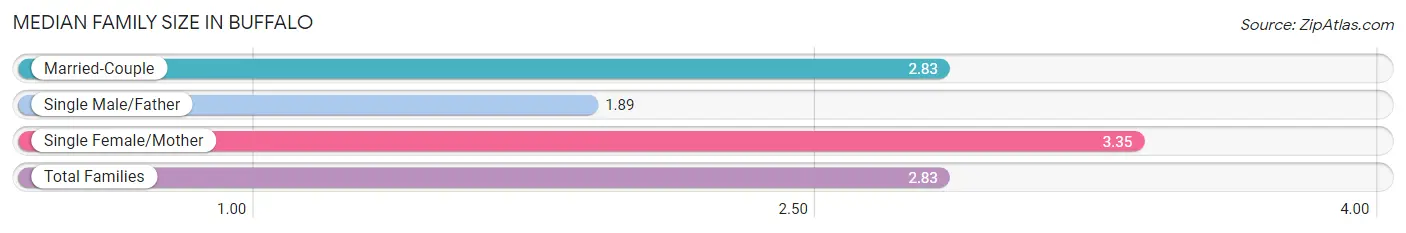
Median Family Size in Buffalo
The median family size in Buffalo is 2.83 persons per family, with single female/mother families (51 | 4.6%) accounting for the largest median family size of 3.35 persons per family. On the other hand, single male/father families (27 | 2.4%) represent the smallest median family size with 1.89 persons per family.
| Family Type | # Families | Family Size |
| Married-Couple | 1,027 (92.9%) | 2.83 |
| Single Male/Father | 27 (2.4%) | 1.89 |
| Single Female/Mother | 51 (4.6%) | 3.35 |
| Total Families | 1,105 (100.0%) | 2.83 |
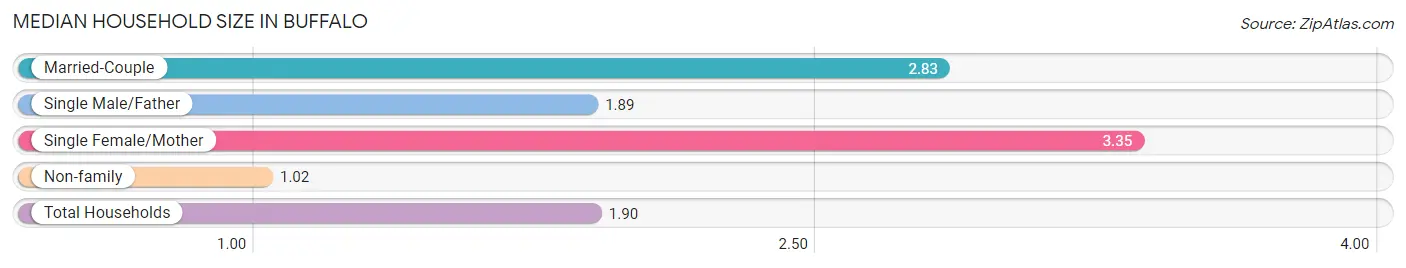
Median Household Size in Buffalo
The median household size in Buffalo is 1.90 persons per household, with single female/mother households (51 | 2.2%) accounting for the largest median household size of 3.35 persons per household. non-family households (1,178 | 51.6%) represent the smallest median household size with 1.02 persons per household.
| Household Type | # Households | Household Size |
| Married-Couple | 1,027 (45.0%) | 2.83 |
| Single Male/Father | 27 (1.2%) | 1.89 |
| Single Female/Mother | 51 (2.2%) | 3.35 |
| Non-family | 1,178 (51.6%) | 1.02 |
| Total Households | 2,283 (100.0%) | 1.90 |
Household Size by Marriage Status in Buffalo
Out of a total of 2,283 households in Buffalo, 1,105 (48.4%) are family households, while 1,178 (51.6%) are nonfamily households. The most numerous type of family households are 2-person households, comprising 715, and the most common type of nonfamily households are 1-person households, comprising 1,140.
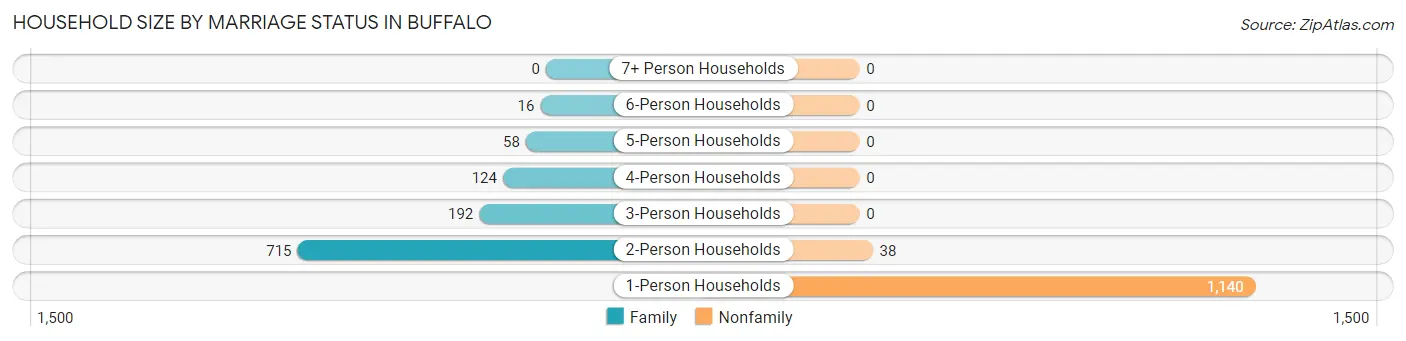
| Household Size | Family Households | Nonfamily Households |
| 1-Person Households | - | 1,140 (49.9%) |
| 2-Person Households | 715 (31.3%) | 38 (1.7%) |
| 3-Person Households | 192 (8.4%) | 0 (0.0%) |
| 4-Person Households | 124 (5.4%) | 0 (0.0%) |
| 5-Person Households | 58 (2.5%) | 0 (0.0%) |
| 6-Person Households | 16 (0.7%) | 0 (0.0%) |
| 7+ Person Households | 0 (0.0%) | 0 (0.0%) |
| Total | 1,105 (48.4%) | 1,178 (51.6%) |
Female Fertility in Buffalo
Fertility by Age in Buffalo
| Age Bracket | Women with Births | Births / 1,000 Women |
| 15 to 19 years | 0 (0.0%) | 0.0 |
| 20 to 34 years | 0 (0.0%) | 0.0 |
| 35 to 50 years | 0 (0.0%) | 0.0 |
| Total | 0 (0.0%) | 0.0 |
Fertility by Age by Marriage Status in Buffalo
| Age Bracket | Married | Unmarried |
| 15 to 19 years | 0 (0.0%) | 0 (0.0%) |
| 20 to 34 years | 0 (0.0%) | 0 (0.0%) |
| 35 to 50 years | 0 (0.0%) | 0 (0.0%) |
| Total | 0 (0.0%) | 0 (0.0%) |
Fertility by Education in Buffalo
| Educational Attainment | Women with Births | Births / 1,000 Women |
| Less than High School | 0 (0.0%) | 0.0 |
| High School Diploma | 0 (0.0%) | 0.0 |
| College or Associate's Degree | 0 (0.0%) | 0.0 |
| Bachelor's Degree | 0 (0.0%) | 0.0 |
| Graduate Degree | 0 (0.0%) | 0.0 |
| Total | 0 (0.0%) | 0.0 |
Fertility by Education by Marriage Status in Buffalo
| Educational Attainment | Married | Unmarried |
| Less than High School | 0 (0.0%) | 0 (0.0%) |
| High School Diploma | 0 (0.0%) | 0 (0.0%) |
| College or Associate's Degree | 0 (0.0%) | 0 (0.0%) |
| Bachelor's Degree | 0 (0.0%) | 0 (0.0%) |
| Graduate Degree | 0 (0.0%) | 0 (0.0%) |
| Total | 0 (0.0%) | 0 (0.0%) |
Employment Characteristics in Buffalo
Employment by Class of Employer in Buffalo
Among the 1,881 employed individuals in Buffalo, private company employees (1,099 | 58.4%), self-employed (not incorporated) (228 | 12.1%), and local government employees (165 | 8.8%) make up the most common classes of employment.
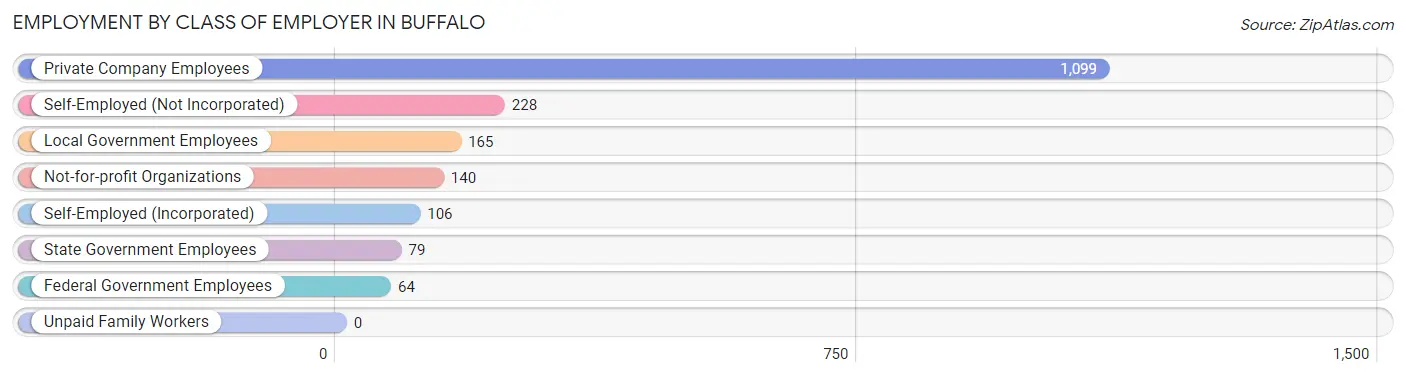
| Employer Class | # Employees | % Employees |
| Private Company Employees | 1,099 | 58.4% |
| Self-Employed (Incorporated) | 106 | 5.6% |
| Self-Employed (Not Incorporated) | 228 | 12.1% |
| Not-for-profit Organizations | 140 | 7.4% |
| Local Government Employees | 165 | 8.8% |
| State Government Employees | 79 | 4.2% |
| Federal Government Employees | 64 | 3.4% |
| Unpaid Family Workers | 0 | 0.0% |
| Total | 1,881 | 100.0% |
Employment Status by Age in Buffalo
According to the labor force statistics for Buffalo, out of the total population over 16 years of age (3,807), 52.7% or 2,006 individuals are in the labor force, with 4.0% or 80 of them unemployed. The age group with the highest labor force participation rate is 45 to 54 years, with 93.1% or 442 individuals in the labor force. Within the labor force, the 20 to 24 years age range has the highest percentage of unemployed individuals, with 19.0% or 15 of them being unemployed.
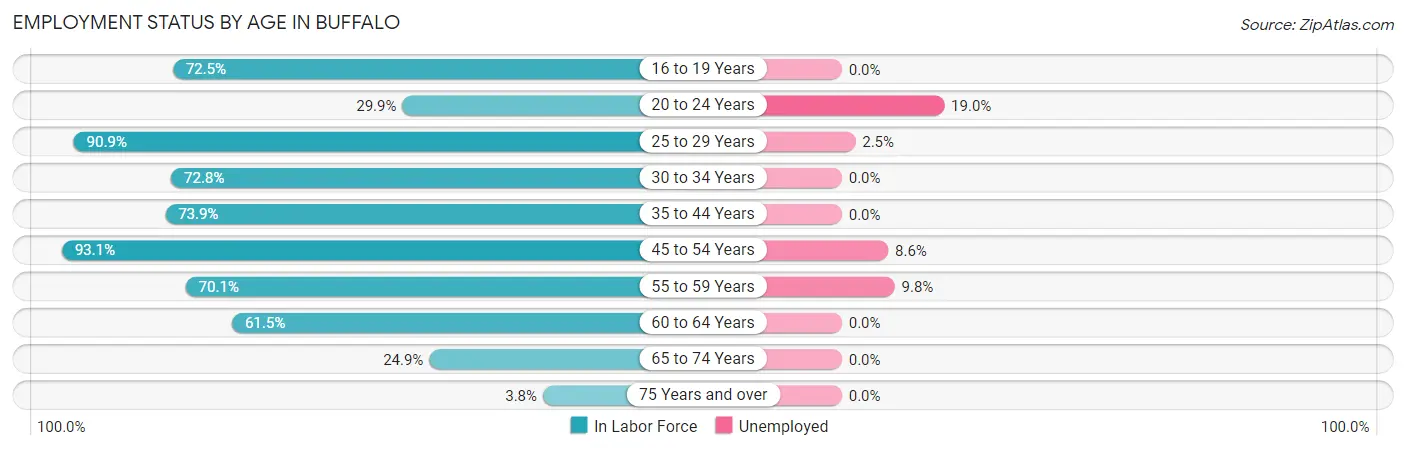
| Age Bracket | In Labor Force | Unemployed |
| 16 to 19 Years | 124 (72.5%) | 0 (0.0%) |
| 20 to 24 Years | 79 (29.9%) | 15 (19.0%) |
| 25 to 29 Years | 321 (90.9%) | 8 (2.5%) |
| 30 to 34 Years | 158 (72.8%) | 0 (0.0%) |
| 35 to 44 Years | 297 (73.9%) | 0 (0.0%) |
| 45 to 54 Years | 442 (93.1%) | 38 (8.6%) |
| 55 to 59 Years | 204 (70.1%) | 20 (9.8%) |
| 60 to 64 Years | 174 (61.5%) | 0 (0.0%) |
| 65 to 74 Years | 185 (24.9%) | 0 (0.0%) |
| 75 Years and over | 23 (3.8%) | 0 (0.0%) |
| Total | 2,006 (52.7%) | 80 (4.0%) |
Employment Status by Educational Attainment in Buffalo
According to labor force statistics for Buffalo, 79.0% of individuals (1,597) out of the total population between 25 and 64 years of age (2,021) are in the labor force, with 4.1% or 65 of them being unemployed. The group with the highest labor force participation rate are those with the educational attainment of college / associate degree, with 82.2% or 616 individuals in the labor force. Within the labor force, individuals with high school diploma education have the highest percentage of unemployment, with 13.9% or 46 of them being unemployed.
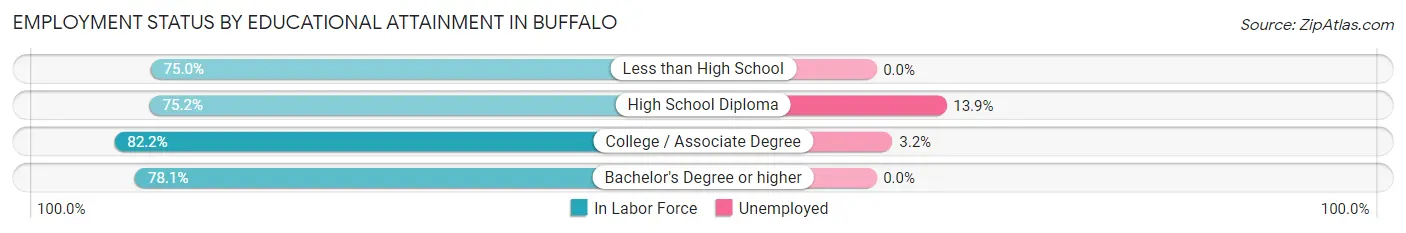
| Educational Attainment | In Labor Force | Unemployed |
| Less than High School | 15 (75.0%) | 0 (0.0%) |
| High School Diploma | 331 (75.2%) | 61 (13.9%) |
| College / Associate Degree | 616 (82.2%) | 24 (3.2%) |
| Bachelor's Degree or higher | 634 (78.1%) | 0 (0.0%) |
| Total | 1,597 (79.0%) | 83 (4.1%) |
Employment Occupations by Sex in Buffalo
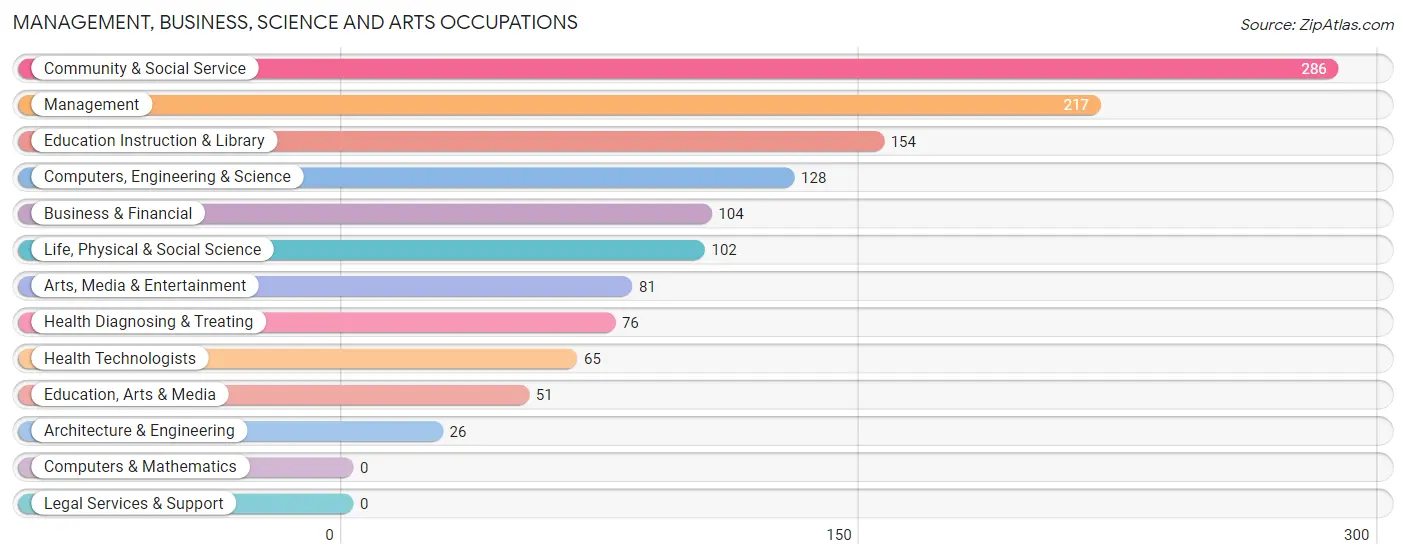
Management, Business, Science and Arts Occupations
The most common Management, Business, Science and Arts occupations in Buffalo are Community & Social Service (286 | 14.8%), Management (217 | 11.3%), Education Instruction & Library (154 | 8.0%), Computers, Engineering & Science (128 | 6.7%), and Business & Financial (104 | 5.4%).
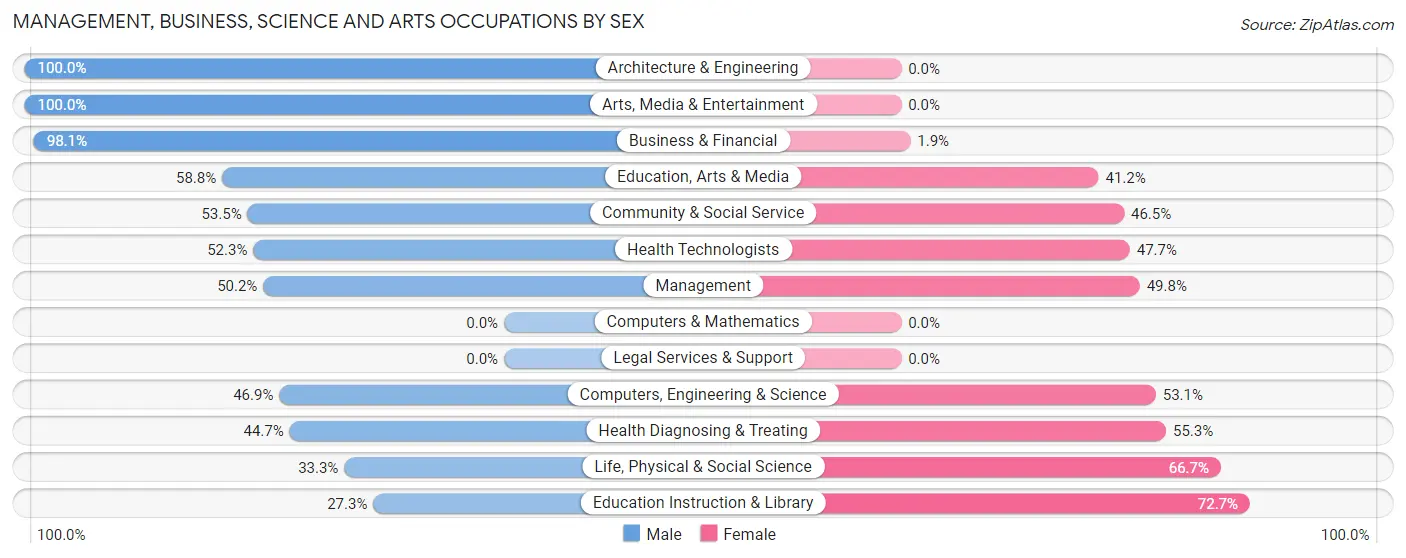
Management, Business, Science and Arts Occupations by Sex
Within the Management, Business, Science and Arts occupations in Buffalo, the most male-oriented occupations are Architecture & Engineering (100.0%), Arts, Media & Entertainment (100.0%), and Business & Financial (98.1%), while the most female-oriented occupations are Education Instruction & Library (72.7%), Life, Physical & Social Science (66.7%), and Health Diagnosing & Treating (55.3%).
| Occupation | Male | Female |
| Management | 109 (50.2%) | 108 (49.8%) |
| Business & Financial | 102 (98.1%) | 2 (1.9%) |
| Computers, Engineering & Science | 60 (46.9%) | 68 (53.1%) |
| Computers & Mathematics | 0 (0.0%) | 0 (0.0%) |
| Architecture & Engineering | 26 (100.0%) | 0 (0.0%) |
| Life, Physical & Social Science | 34 (33.3%) | 68 (66.7%) |
| Community & Social Service | 153 (53.5%) | 133 (46.5%) |
| Education, Arts & Media | 30 (58.8%) | 21 (41.2%) |
| Legal Services & Support | 0 (0.0%) | 0 (0.0%) |
| Education Instruction & Library | 42 (27.3%) | 112 (72.7%) |
| Arts, Media & Entertainment | 81 (100.0%) | 0 (0.0%) |
| Health Diagnosing & Treating | 34 (44.7%) | 42 (55.3%) |
| Health Technologists | 34 (52.3%) | 31 (47.7%) |
| Total (Category) | 458 (56.5%) | 353 (43.5%) |
| Total (Overall) | 1,075 (55.8%) | 851 (44.2%) |
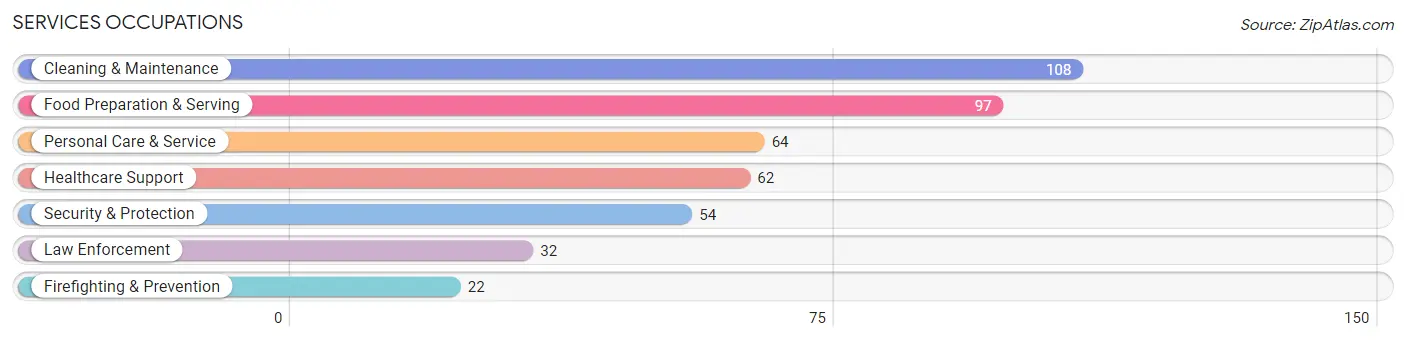
Services Occupations
The most common Services occupations in Buffalo are Cleaning & Maintenance (108 | 5.6%), Food Preparation & Serving (97 | 5.0%), Personal Care & Service (64 | 3.3%), Healthcare Support (62 | 3.2%), and Security & Protection (54 | 2.8%).
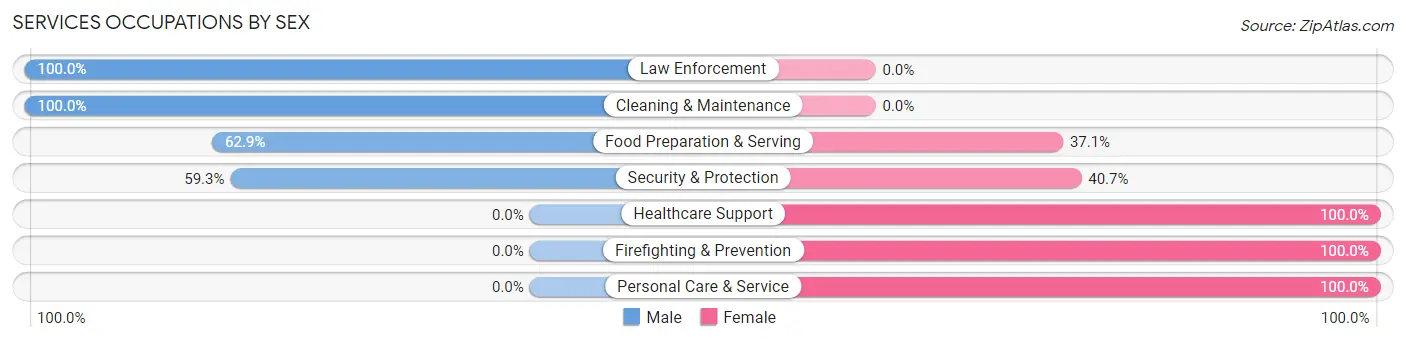
Services Occupations by Sex
Within the Services occupations in Buffalo, the most male-oriented occupations are Law Enforcement (100.0%), Cleaning & Maintenance (100.0%), and Food Preparation & Serving (62.9%), while the most female-oriented occupations are Healthcare Support (100.0%), Firefighting & Prevention (100.0%), and Personal Care & Service (100.0%).
| Occupation | Male | Female |
| Healthcare Support | 0 (0.0%) | 62 (100.0%) |
| Security & Protection | 32 (59.3%) | 22 (40.7%) |
| Firefighting & Prevention | 0 (0.0%) | 22 (100.0%) |
| Law Enforcement | 32 (100.0%) | 0 (0.0%) |
| Food Preparation & Serving | 61 (62.9%) | 36 (37.1%) |
| Cleaning & Maintenance | 108 (100.0%) | 0 (0.0%) |
| Personal Care & Service | 0 (0.0%) | 64 (100.0%) |
| Total (Category) | 201 (52.2%) | 184 (47.8%) |
| Total (Overall) | 1,075 (55.8%) | 851 (44.2%) |
Sales and Office Occupations
The most common Sales and Office occupations in Buffalo are Sales & Related (196 | 10.2%), and Office & Administration (189 | 9.8%).
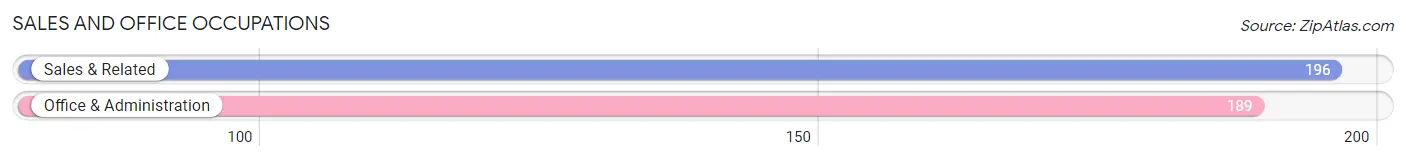
Sales and Office Occupations by Sex
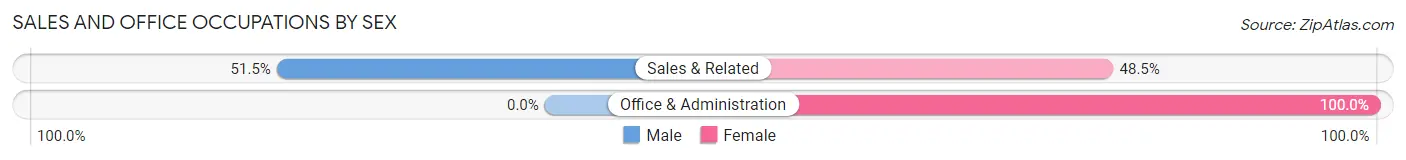
| Occupation | Male | Female |
| Sales & Related | 101 (51.5%) | 95 (48.5%) |
| Office & Administration | 0 (0.0%) | 189 (100.0%) |
| Total (Category) | 101 (26.2%) | 284 (73.8%) |
| Total (Overall) | 1,075 (55.8%) | 851 (44.2%) |
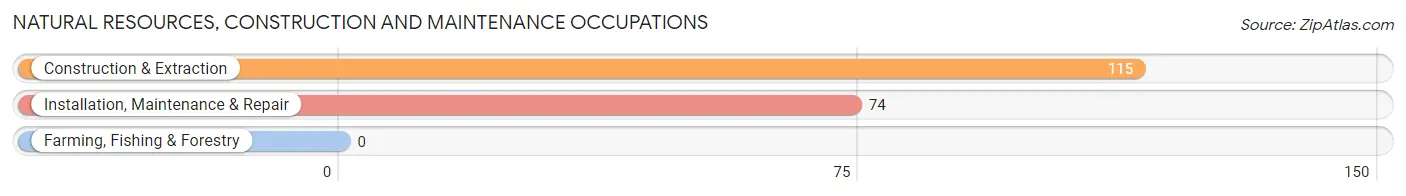
Natural Resources, Construction and Maintenance Occupations
The most common Natural Resources, Construction and Maintenance occupations in Buffalo are Construction & Extraction (115 | 6.0%), and Installation, Maintenance & Repair (74 | 3.8%).
Natural Resources, Construction and Maintenance Occupations by Sex
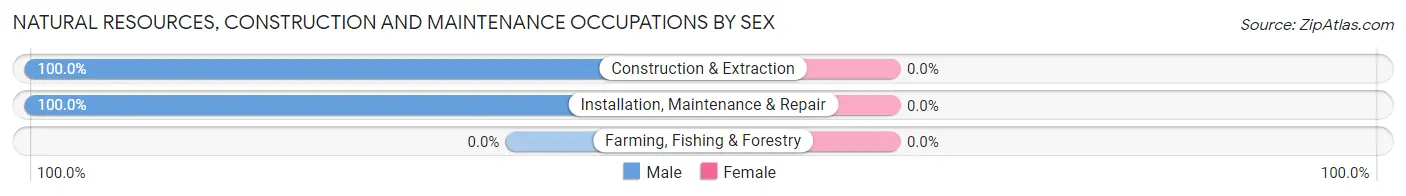
| Occupation | Male | Female |
| Farming, Fishing & Forestry | 0 (0.0%) | 0 (0.0%) |
| Construction & Extraction | 115 (100.0%) | 0 (0.0%) |
| Installation, Maintenance & Repair | 74 (100.0%) | 0 (0.0%) |
| Total (Category) | 189 (100.0%) | 0 (0.0%) |
| Total (Overall) | 1,075 (55.8%) | 851 (44.2%) |
Production, Transportation and Moving Occupations
The most common Production, Transportation and Moving occupations in Buffalo are Production (73 | 3.8%), Material Moving (48 | 2.5%), and Transportation (35 | 1.8%).
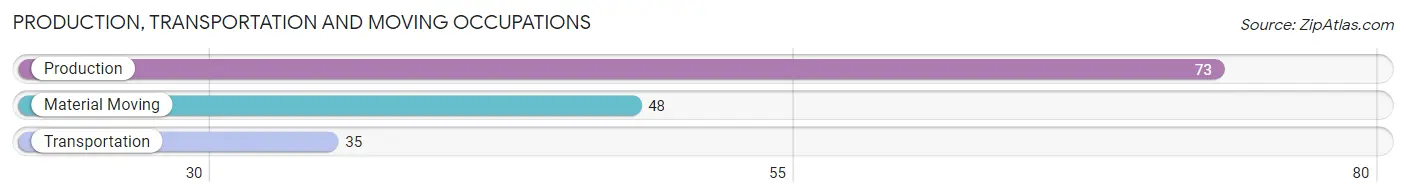
Production, Transportation and Moving Occupations by Sex
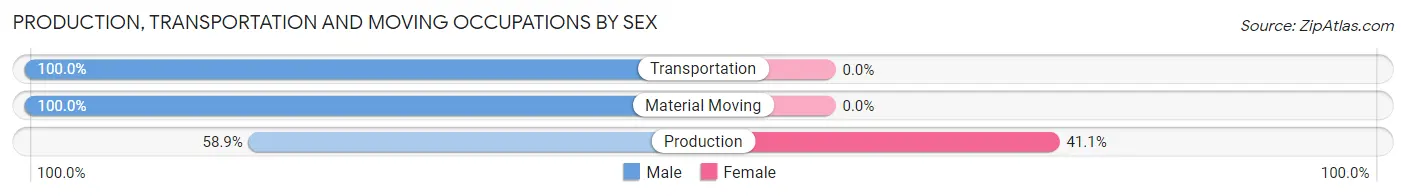
| Occupation | Male | Female |
| Production | 43 (58.9%) | 30 (41.1%) |
| Transportation | 35 (100.0%) | 0 (0.0%) |
| Material Moving | 48 (100.0%) | 0 (0.0%) |
| Total (Category) | 126 (80.8%) | 30 (19.2%) |
| Total (Overall) | 1,075 (55.8%) | 851 (44.2%) |
Employment Industries by Sex in Buffalo
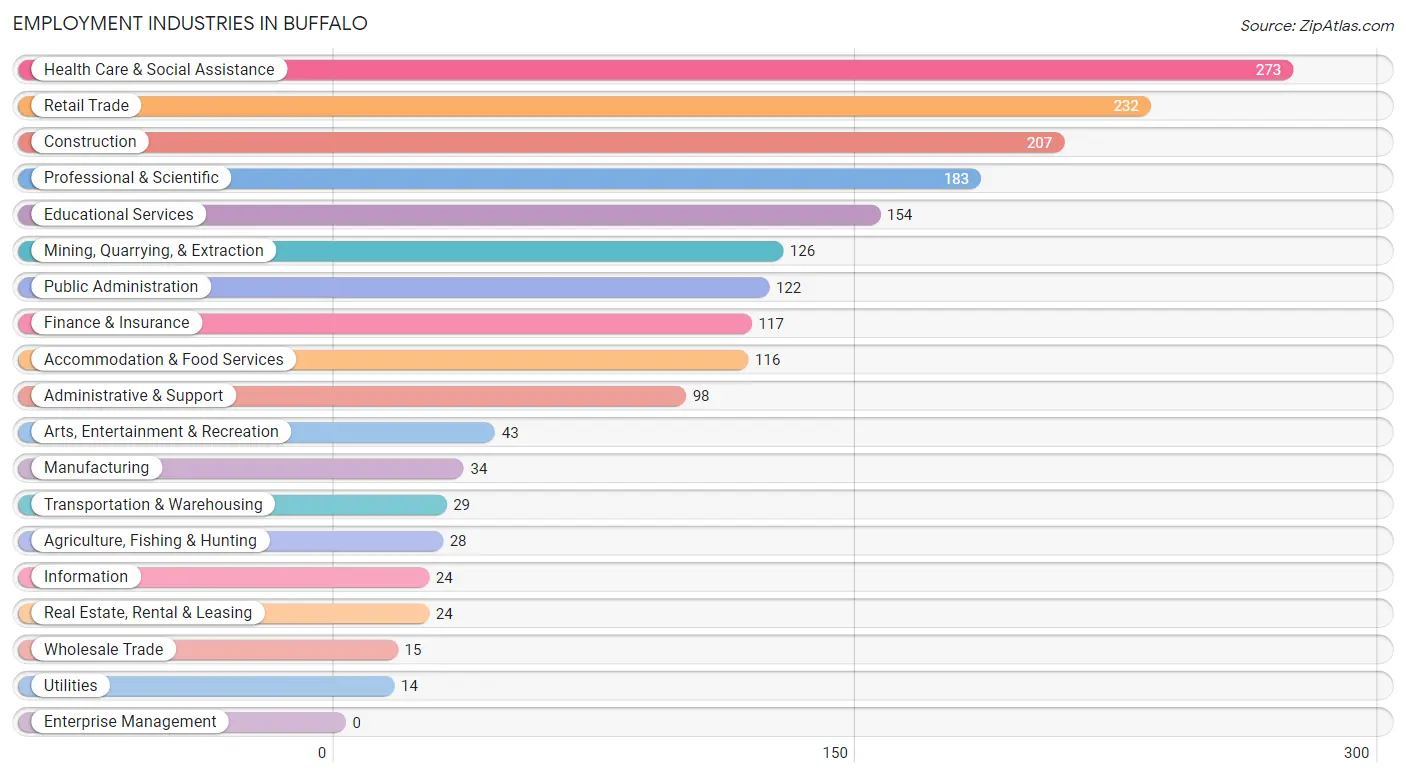
Employment Industries in Buffalo
The major employment industries in Buffalo include Health Care & Social Assistance (273 | 14.2%), Retail Trade (232 | 12.0%), Construction (207 | 10.7%), Professional & Scientific (183 | 9.5%), and Educational Services (154 | 8.0%).
Employment Industries by Sex in Buffalo
The Buffalo industries that see more men than women are Agriculture, Fishing & Hunting (100.0%), Mining, Quarrying, & Extraction (100.0%), and Utilities (100.0%), whereas the industries that tend to have a higher number of women are Wholesale Trade (100.0%), Professional & Scientific (88.5%), and Educational Services (72.7%).
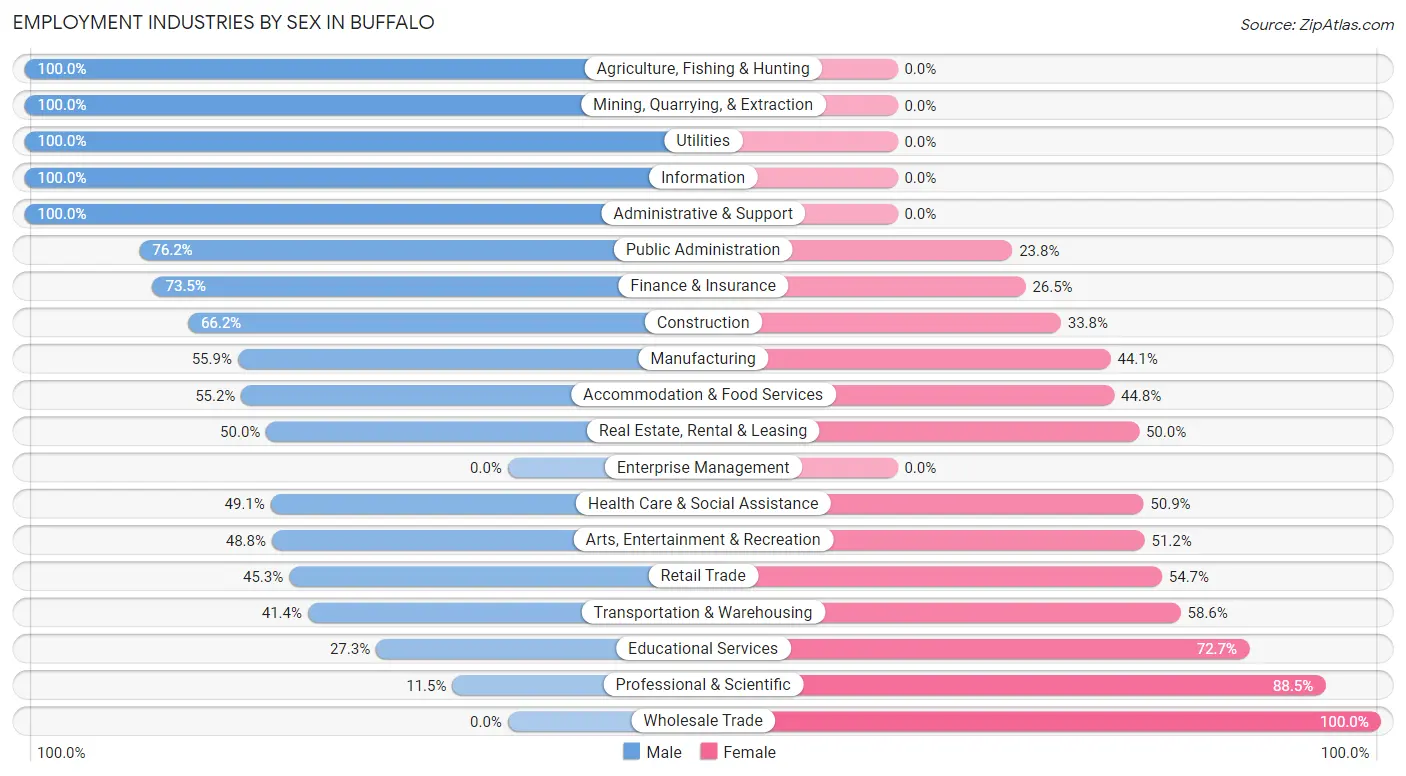
| Industry | Male | Female |
| Agriculture, Fishing & Hunting | 28 (100.0%) | 0 (0.0%) |
| Mining, Quarrying, & Extraction | 126 (100.0%) | 0 (0.0%) |
| Construction | 137 (66.2%) | 70 (33.8%) |
| Manufacturing | 19 (55.9%) | 15 (44.1%) |
| Wholesale Trade | 0 (0.0%) | 15 (100.0%) |
| Retail Trade | 105 (45.3%) | 127 (54.7%) |
| Transportation & Warehousing | 12 (41.4%) | 17 (58.6%) |
| Utilities | 14 (100.0%) | 0 (0.0%) |
| Information | 24 (100.0%) | 0 (0.0%) |
| Finance & Insurance | 86 (73.5%) | 31 (26.5%) |
| Real Estate, Rental & Leasing | 12 (50.0%) | 12 (50.0%) |
| Professional & Scientific | 21 (11.5%) | 162 (88.5%) |
| Enterprise Management | 0 (0.0%) | 0 (0.0%) |
| Administrative & Support | 98 (100.0%) | 0 (0.0%) |
| Educational Services | 42 (27.3%) | 112 (72.7%) |
| Health Care & Social Assistance | 134 (49.1%) | 139 (50.9%) |
| Arts, Entertainment & Recreation | 21 (48.8%) | 22 (51.2%) |
| Accommodation & Food Services | 64 (55.2%) | 52 (44.8%) |
| Public Administration | 93 (76.2%) | 29 (23.8%) |
| Total | 1,075 (55.8%) | 851 (44.2%) |
Education in Buffalo
School Enrollment in Buffalo
The most common levels of schooling among the 761 students in Buffalo are high school (204 | 26.8%), graduate / professional (163 | 21.4%), and elementary school (158 | 20.8%).
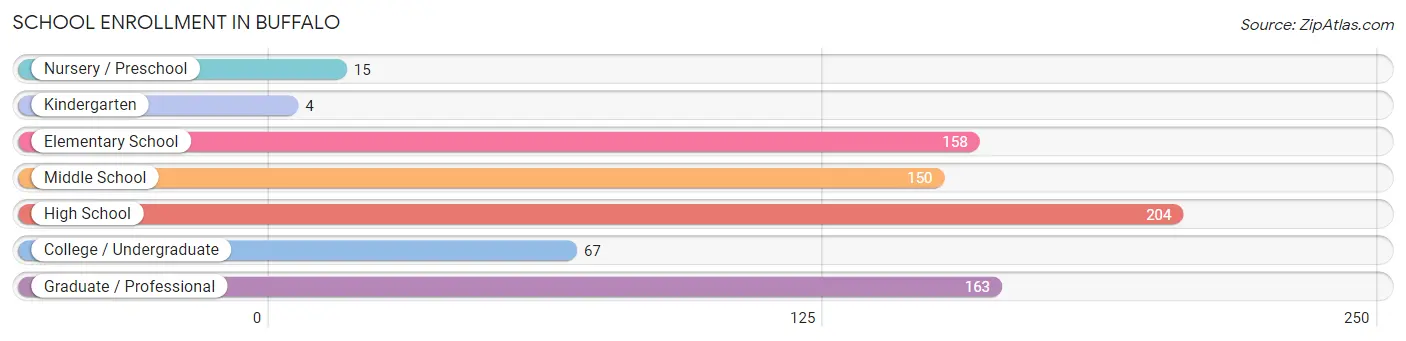
| School Level | # Students | % Students |
| Nursery / Preschool | 15 | 2.0% |
| Kindergarten | 4 | 0.5% |
| Elementary School | 158 | 20.8% |
| Middle School | 150 | 19.7% |
| High School | 204 | 26.8% |
| College / Undergraduate | 67 | 8.8% |
| Graduate / Professional | 163 | 21.4% |
| Total | 761 | 100.0% |
School Enrollment by Age by Funding Source in Buffalo
Out of a total of 761 students who are enrolled in schools in Buffalo, 172 (22.6%) attend a private institution, while the remaining 589 (77.4%) are enrolled in public schools. The age group of 5 to 9 year old has the highest likelihood of being enrolled in private schools, with 104 (58.8% in the age bracket) enrolled. Conversely, the age group of 15 to 17 year olds has the lowest likelihood of being enrolled in a private school, with 114 (100.0% in the age bracket) attending a public institution.
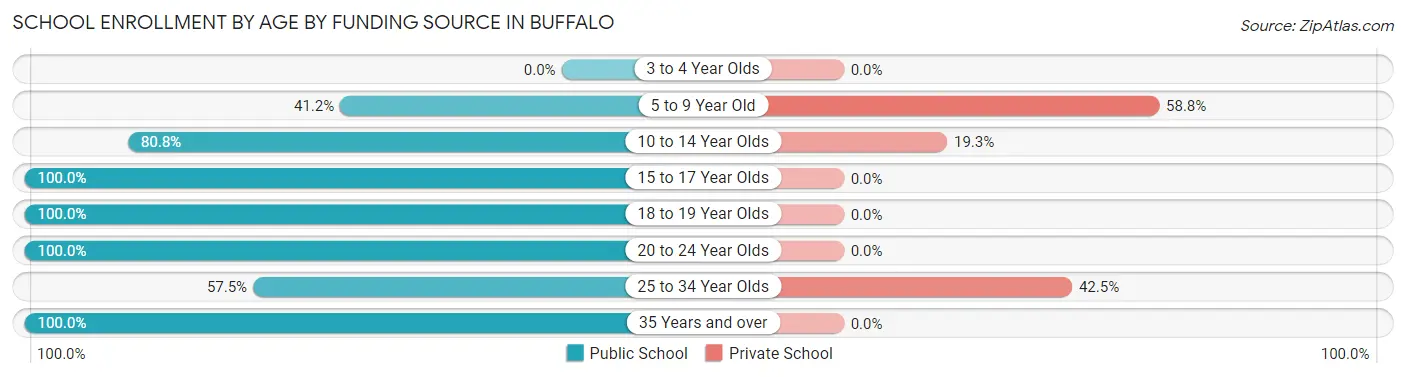
| Age Bracket | Public School | Private School |
| 3 to 4 Year Olds | 0 (0.0%) | 0 (0.0%) |
| 5 to 9 Year Old | 73 (41.2%) | 104 (58.8%) |
| 10 to 14 Year Olds | 130 (80.7%) | 31 (19.3%) |
| 15 to 17 Year Olds | 114 (100.0%) | 0 (0.0%) |
| 18 to 19 Year Olds | 79 (100.0%) | 0 (0.0%) |
| 20 to 24 Year Olds | 50 (100.0%) | 0 (0.0%) |
| 25 to 34 Year Olds | 50 (57.5%) | 37 (42.5%) |
| 35 Years and over | 93 (100.0%) | 0 (0.0%) |
| Total | 589 (77.4%) | 172 (22.6%) |
Educational Attainment by Field of Study in Buffalo
Education (518 | 39.9%), bio, nature & agricultural (216 | 16.6%), liberal arts & history (134 | 10.3%), social sciences (93 | 7.1%), and arts & humanities (83 | 6.4%) are the most common fields of study among 1,300 individuals in Buffalo who have obtained a bachelor's degree or higher.
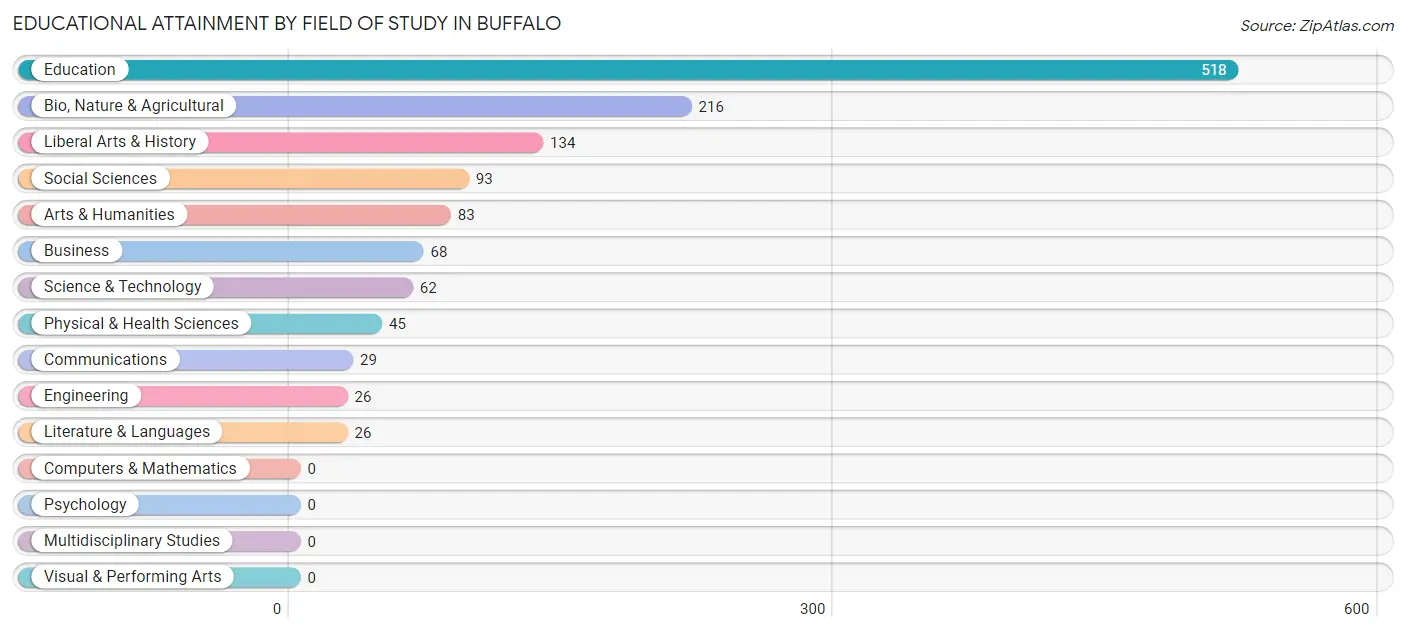
| Field of Study | # Graduates | % Graduates |
| Computers & Mathematics | 0 | 0.0% |
| Bio, Nature & Agricultural | 216 | 16.6% |
| Physical & Health Sciences | 45 | 3.5% |
| Psychology | 0 | 0.0% |
| Social Sciences | 93 | 7.1% |
| Engineering | 26 | 2.0% |
| Multidisciplinary Studies | 0 | 0.0% |
| Science & Technology | 62 | 4.8% |
| Business | 68 | 5.2% |
| Education | 518 | 39.9% |
| Literature & Languages | 26 | 2.0% |
| Liberal Arts & History | 134 | 10.3% |
| Visual & Performing Arts | 0 | 0.0% |
| Communications | 29 | 2.2% |
| Arts & Humanities | 83 | 6.4% |
| Total | 1,300 | 100.0% |
Transportation & Commute in Buffalo
Vehicle Availability by Sex in Buffalo
The most prevalent vehicle ownership categories in Buffalo are males with 2 vehicles (391, accounting for 36.4%) and females with 2 vehicles (273, making up 48.5%).
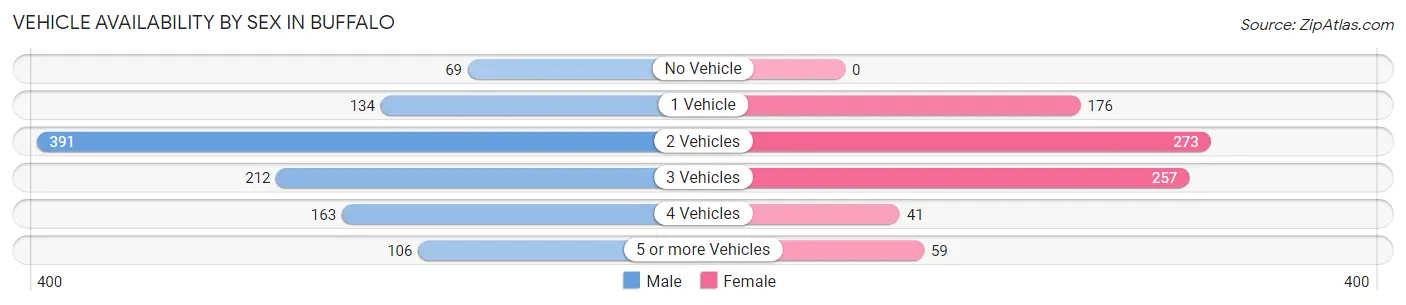
| Vehicles Available | Male | Female |
| No Vehicle | 69 (6.4%) | 0 (0.0%) |
| 1 Vehicle | 134 (12.5%) | 176 (21.8%) |
| 2 Vehicles | 391 (36.4%) | 273 (33.9%) |
| 3 Vehicles | 212 (19.7%) | 257 (31.9%) |
| 4 Vehicles | 163 (15.2%) | 41 (5.1%) |
| 5 or more Vehicles | 106 (9.9%) | 59 (7.3%) |
| Total | 1,075 (100.0%) | 806 (100.0%) |
Commute Time in Buffalo
The most frequently occuring commute durations in Buffalo are 5 to 9 minutes (703 commuters, 40.8%), 10 to 14 minutes (294 commuters, 17.1%), and less than 5 minutes (262 commuters, 15.2%).
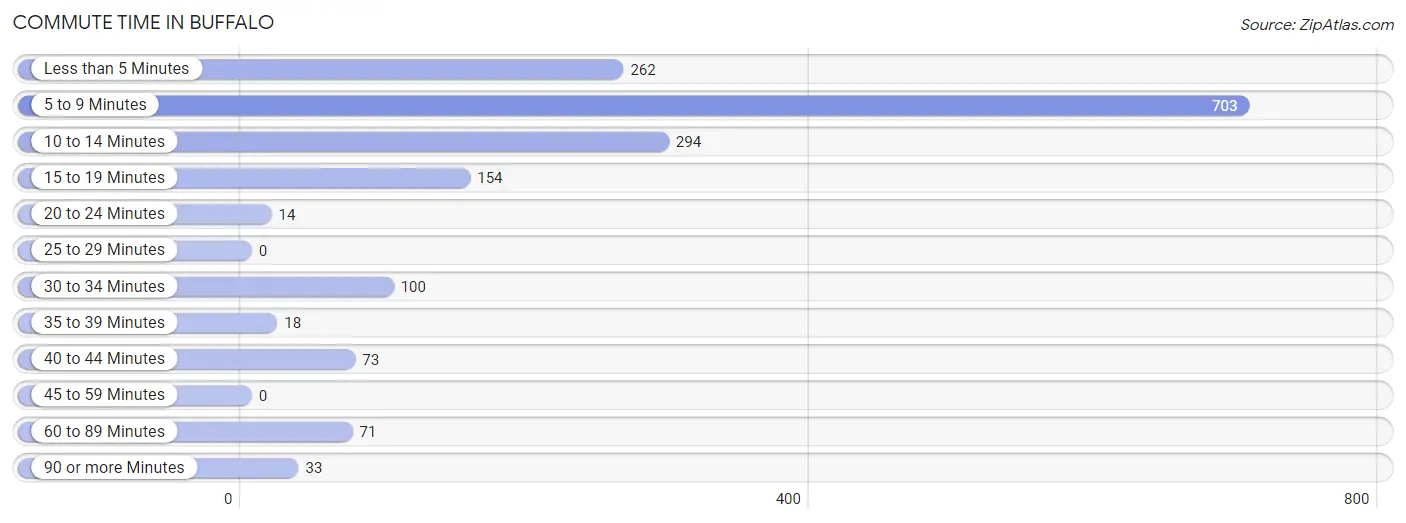
| Commute Time | # Commuters | % Commuters |
| Less than 5 Minutes | 262 | 15.2% |
| 5 to 9 Minutes | 703 | 40.8% |
| 10 to 14 Minutes | 294 | 17.1% |
| 15 to 19 Minutes | 154 | 8.9% |
| 20 to 24 Minutes | 14 | 0.8% |
| 25 to 29 Minutes | 0 | 0.0% |
| 30 to 34 Minutes | 100 | 5.8% |
| 35 to 39 Minutes | 18 | 1.1% |
| 40 to 44 Minutes | 73 | 4.2% |
| 45 to 59 Minutes | 0 | 0.0% |
| 60 to 89 Minutes | 71 | 4.1% |
| 90 or more Minutes | 33 | 1.9% |
Commute Time by Sex in Buffalo
The most common commute times in Buffalo are 5 to 9 minutes (363 commuters, 35.1%) for males and 5 to 9 minutes (340 commuters, 49.4%) for females.
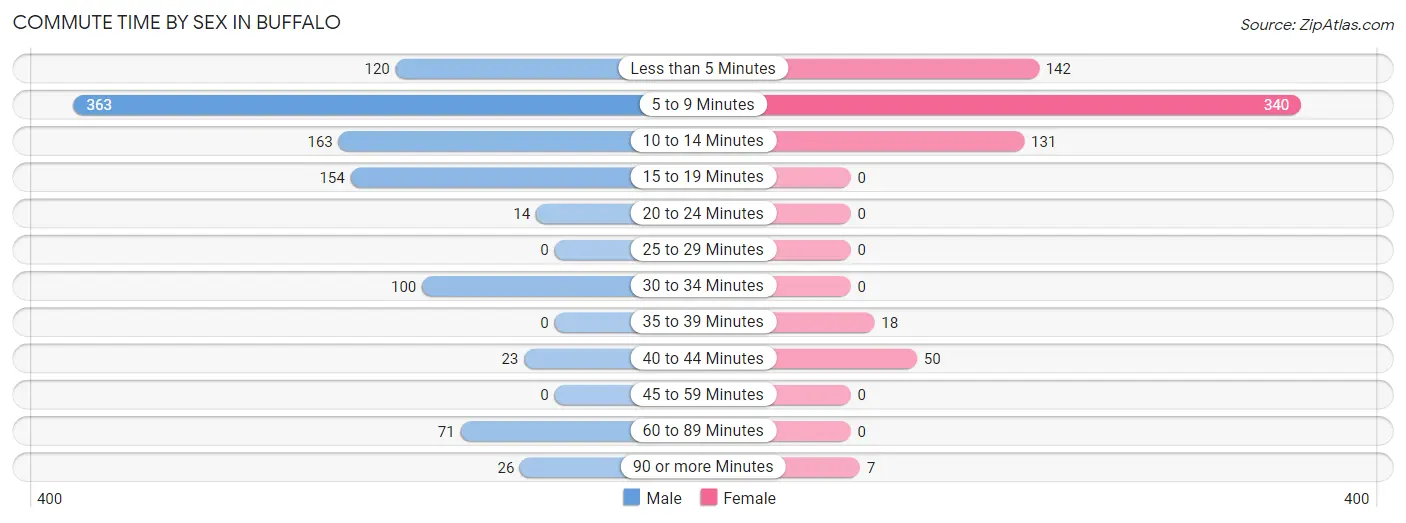
| Commute Time | Male | Female |
| Less than 5 Minutes | 120 (11.6%) | 142 (20.6%) |
| 5 to 9 Minutes | 363 (35.1%) | 340 (49.4%) |
| 10 to 14 Minutes | 163 (15.8%) | 131 (19.0%) |
| 15 to 19 Minutes | 154 (14.9%) | 0 (0.0%) |
| 20 to 24 Minutes | 14 (1.3%) | 0 (0.0%) |
| 25 to 29 Minutes | 0 (0.0%) | 0 (0.0%) |
| 30 to 34 Minutes | 100 (9.7%) | 0 (0.0%) |
| 35 to 39 Minutes | 0 (0.0%) | 18 (2.6%) |
| 40 to 44 Minutes | 23 (2.2%) | 50 (7.3%) |
| 45 to 59 Minutes | 0 (0.0%) | 0 (0.0%) |
| 60 to 89 Minutes | 71 (6.9%) | 0 (0.0%) |
| 90 or more Minutes | 26 (2.5%) | 7 (1.0%) |
Time of Departure to Work by Sex in Buffalo
The most frequent times of departure to work in Buffalo are 6:30 AM to 6:59 AM (248, 24.0%) for males and 7:00 AM to 7:29 AM (189, 27.5%) for females.
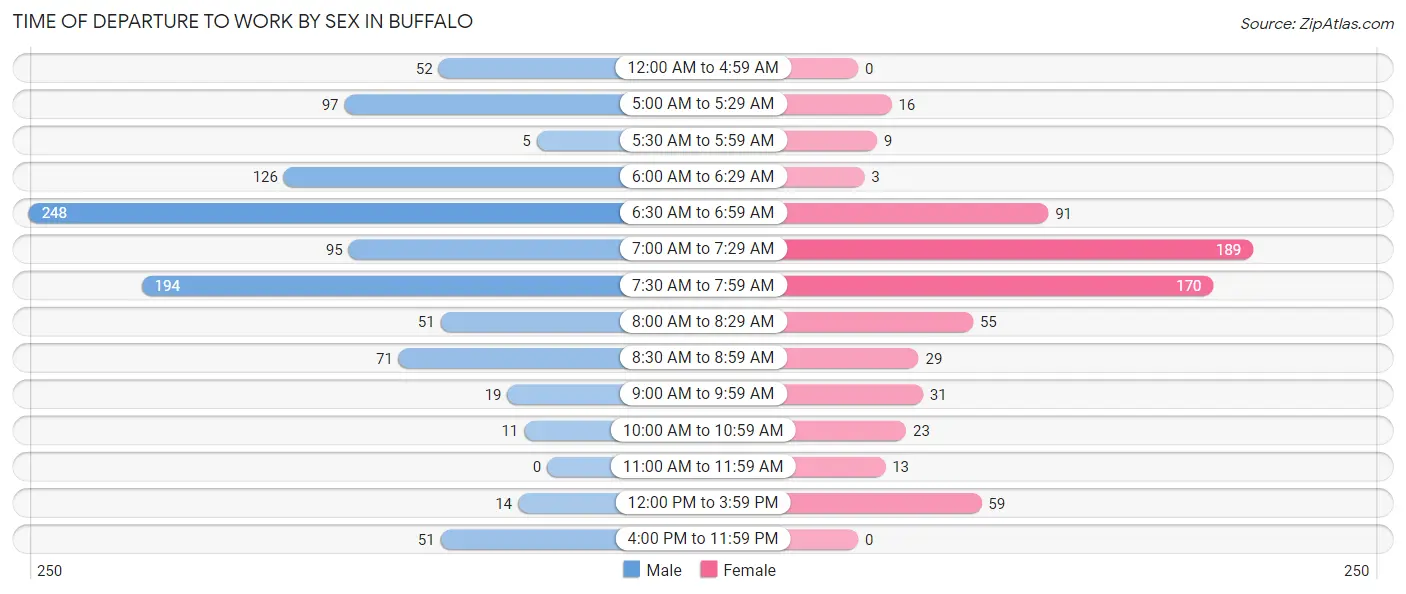
| Time of Departure | Male | Female |
| 12:00 AM to 4:59 AM | 52 (5.0%) | 0 (0.0%) |
| 5:00 AM to 5:29 AM | 97 (9.4%) | 16 (2.3%) |
| 5:30 AM to 5:59 AM | 5 (0.5%) | 9 (1.3%) |
| 6:00 AM to 6:29 AM | 126 (12.2%) | 3 (0.4%) |
| 6:30 AM to 6:59 AM | 248 (24.0%) | 91 (13.2%) |
| 7:00 AM to 7:29 AM | 95 (9.2%) | 189 (27.5%) |
| 7:30 AM to 7:59 AM | 194 (18.8%) | 170 (24.7%) |
| 8:00 AM to 8:29 AM | 51 (4.9%) | 55 (8.0%) |
| 8:30 AM to 8:59 AM | 71 (6.9%) | 29 (4.2%) |
| 9:00 AM to 9:59 AM | 19 (1.8%) | 31 (4.5%) |
| 10:00 AM to 10:59 AM | 11 (1.1%) | 23 (3.3%) |
| 11:00 AM to 11:59 AM | 0 (0.0%) | 13 (1.9%) |
| 12:00 PM to 3:59 PM | 14 (1.3%) | 59 (8.6%) |
| 4:00 PM to 11:59 PM | 51 (4.9%) | 0 (0.0%) |
| Total | 1,034 (100.0%) | 688 (100.0%) |
Housing Occupancy in Buffalo
Occupancy by Ownership in Buffalo
Of the total 2,283 dwellings in Buffalo, owner-occupied units account for 1,466 (64.2%), while renter-occupied units make up 817 (35.8%).
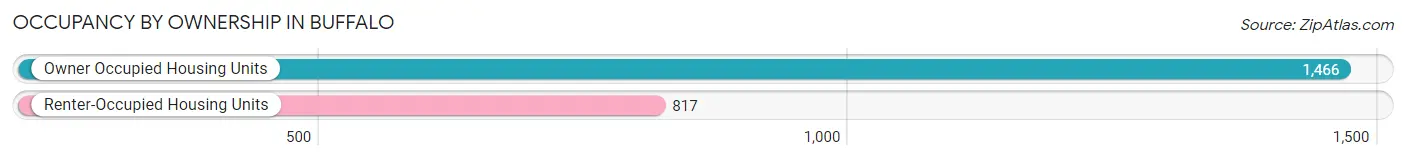
| Occupancy | # Housing Units | % Housing Units |
| Owner Occupied Housing Units | 1,466 | 64.2% |
| Renter-Occupied Housing Units | 817 | 35.8% |
| Total Occupied Housing Units | 2,283 | 100.0% |
Occupancy by Household Size in Buffalo
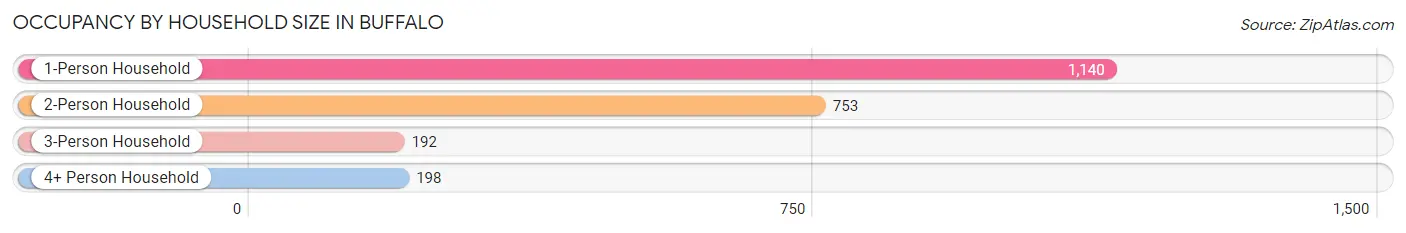
| Household Size | # Housing Units | % Housing Units |
| 1-Person Household | 1,140 | 49.9% |
| 2-Person Household | 753 | 33.0% |
| 3-Person Household | 192 | 8.4% |
| 4+ Person Household | 198 | 8.7% |
| Total Housing Units | 2,283 | 100.0% |
Occupancy by Ownership by Household Size in Buffalo
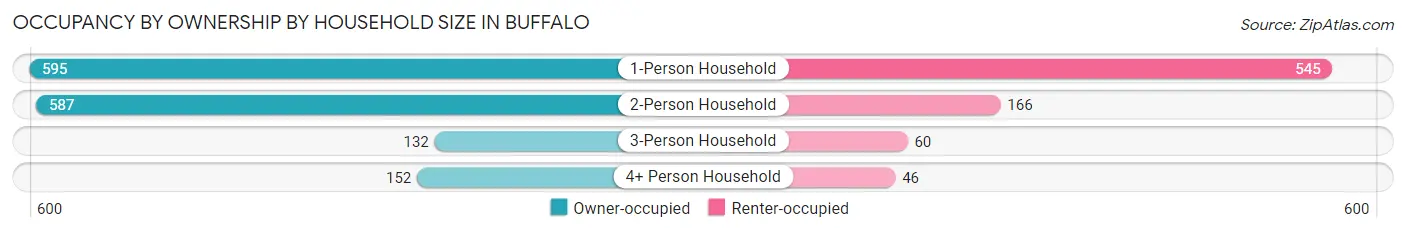
| Household Size | Owner-occupied | Renter-occupied |
| 1-Person Household | 595 (52.2%) | 545 (47.8%) |
| 2-Person Household | 587 (77.9%) | 166 (22.1%) |
| 3-Person Household | 132 (68.8%) | 60 (31.2%) |
| 4+ Person Household | 152 (76.8%) | 46 (23.2%) |
| Total Housing Units | 1,466 (64.2%) | 817 (35.8%) |
Occupancy by Educational Attainment in Buffalo
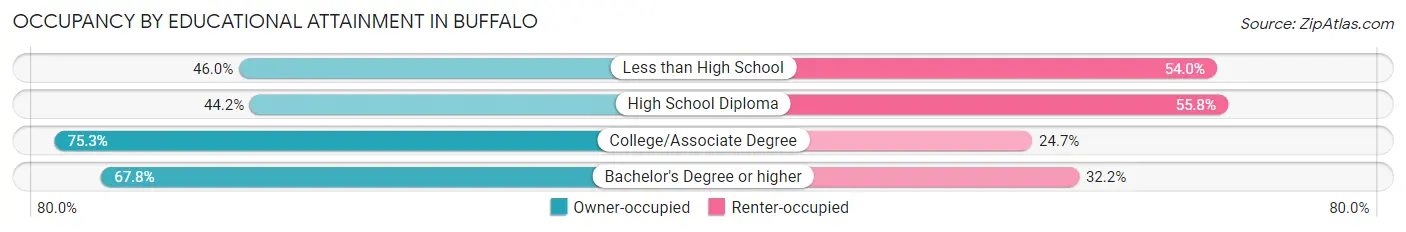
| Household Size | Owner-occupied | Renter-occupied |
| Less than High School | 40 (46.0%) | 47 (54.0%) |
| High School Diploma | 238 (44.2%) | 300 (55.8%) |
| College/Associate Degree | 642 (75.3%) | 211 (24.7%) |
| Bachelor's Degree or higher | 546 (67.8%) | 259 (32.2%) |
Occupancy by Age of Householder in Buffalo
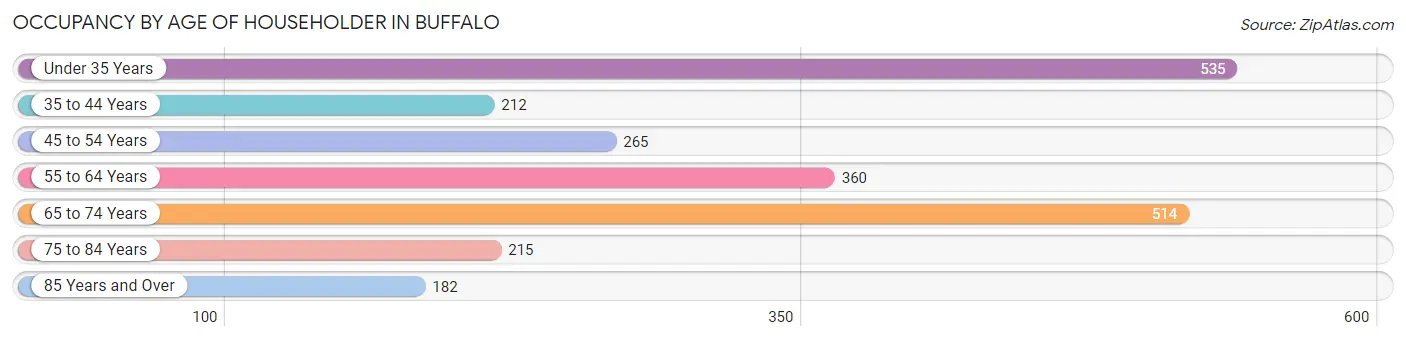
| Age Bracket | # Households | % Households |
| Under 35 Years | 535 | 23.4% |
| 35 to 44 Years | 212 | 9.3% |
| 45 to 54 Years | 265 | 11.6% |
| 55 to 64 Years | 360 | 15.8% |
| 65 to 74 Years | 514 | 22.5% |
| 75 to 84 Years | 215 | 9.4% |
| 85 Years and Over | 182 | 8.0% |
| Total | 2,283 | 100.0% |
Housing Finances in Buffalo
Median Income by Occupancy in Buffalo
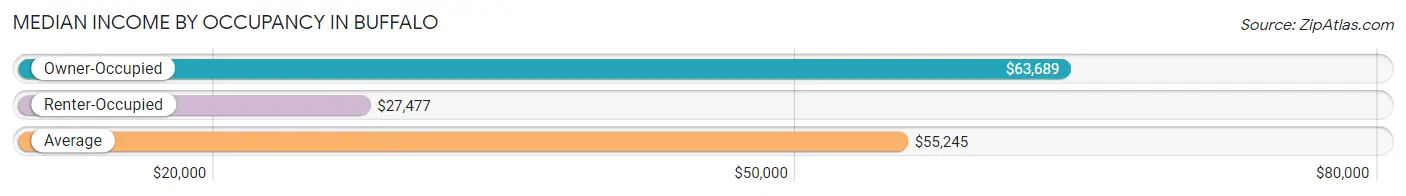
| Occupancy Type | # Households | Median Income |
| Owner-Occupied | 1,466 (64.2%) | $63,689 |
| Renter-Occupied | 817 (35.8%) | $27,477 |
| Average | 2,283 (100.0%) | $55,245 |
Occupancy by Householder Income Bracket in Buffalo
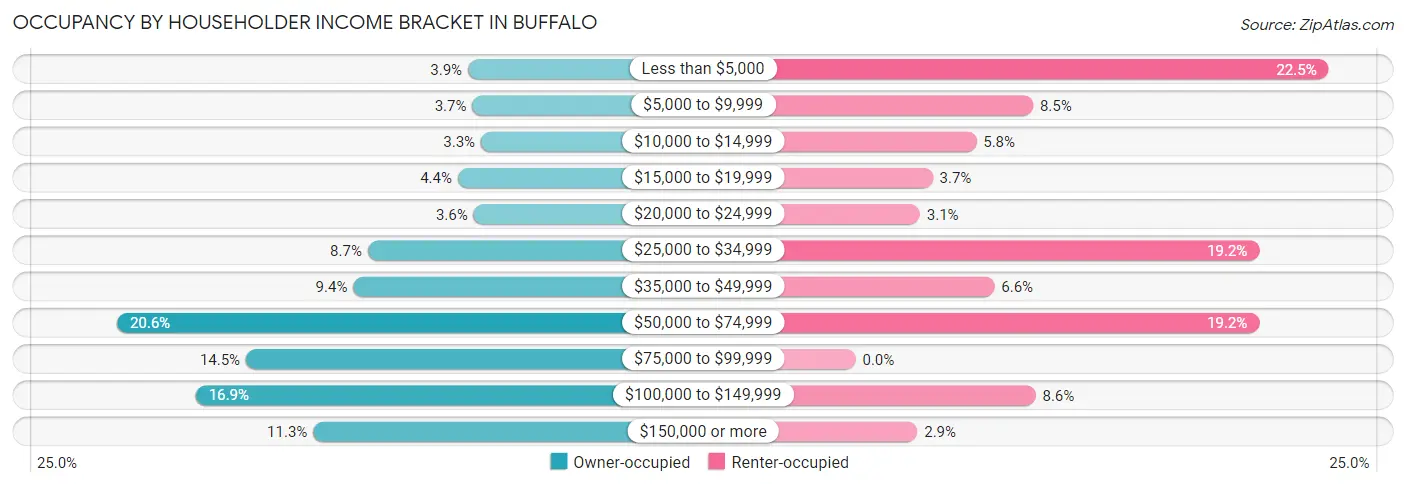
| Income Bracket | Owner-occupied | Renter-occupied |
| Less than $5,000 | 57 (3.9%) | 184 (22.5%) |
| $5,000 to $9,999 | 54 (3.7%) | 69 (8.5%) |
| $10,000 to $14,999 | 48 (3.3%) | 47 (5.8%) |
| $15,000 to $19,999 | 64 (4.4%) | 30 (3.7%) |
| $20,000 to $24,999 | 53 (3.6%) | 25 (3.1%) |
| $25,000 to $34,999 | 127 (8.7%) | 157 (19.2%) |
| $35,000 to $49,999 | 137 (9.3%) | 54 (6.6%) |
| $50,000 to $74,999 | 302 (20.6%) | 157 (19.2%) |
| $75,000 to $99,999 | 212 (14.5%) | 0 (0.0%) |
| $100,000 to $149,999 | 247 (16.9%) | 70 (8.6%) |
| $150,000 or more | 165 (11.3%) | 24 (2.9%) |
| Total | 1,466 (100.0%) | 817 (100.0%) |
Monthly Housing Cost Tiers in Buffalo
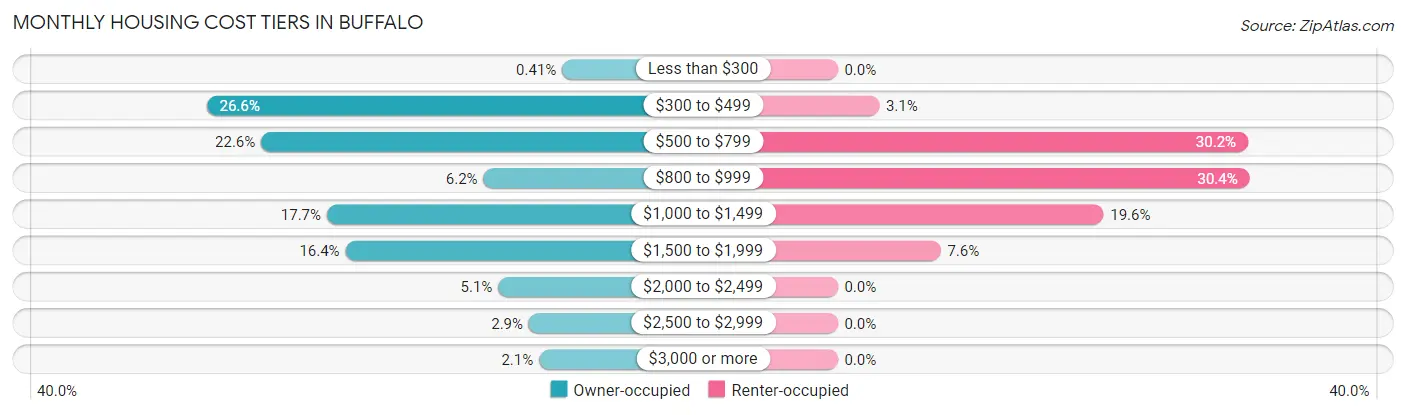
| Monthly Cost | Owner-occupied | Renter-occupied |
| Less than $300 | 6 (0.4%) | 0 (0.0%) |
| $300 to $499 | 390 (26.6%) | 25 (3.1%) |
| $500 to $799 | 331 (22.6%) | 247 (30.2%) |
| $800 to $999 | 91 (6.2%) | 248 (30.3%) |
| $1,000 to $1,499 | 260 (17.7%) | 160 (19.6%) |
| $1,500 to $1,999 | 240 (16.4%) | 62 (7.6%) |
| $2,000 to $2,499 | 75 (5.1%) | 0 (0.0%) |
| $2,500 to $2,999 | 42 (2.9%) | 0 (0.0%) |
| $3,000 or more | 31 (2.1%) | 0 (0.0%) |
| Total | 1,466 (100.0%) | 817 (100.0%) |
Physical Housing Characteristics in Buffalo
Housing Structures in Buffalo
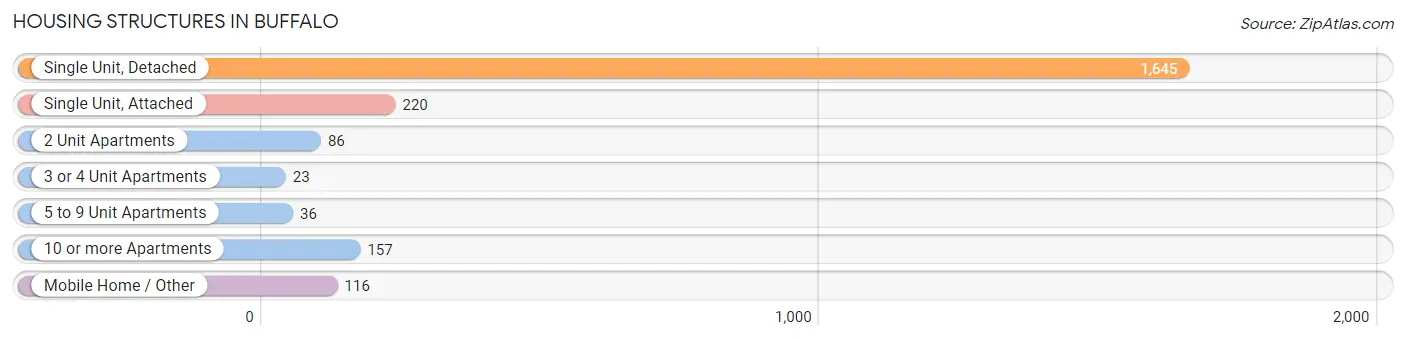
| Structure Type | # Housing Units | % Housing Units |
| Single Unit, Detached | 1,645 | 72.1% |
| Single Unit, Attached | 220 | 9.6% |
| 2 Unit Apartments | 86 | 3.8% |
| 3 or 4 Unit Apartments | 23 | 1.0% |
| 5 to 9 Unit Apartments | 36 | 1.6% |
| 10 or more Apartments | 157 | 6.9% |
| Mobile Home / Other | 116 | 5.1% |
| Total | 2,283 | 100.0% |
Housing Structures by Occupancy in Buffalo
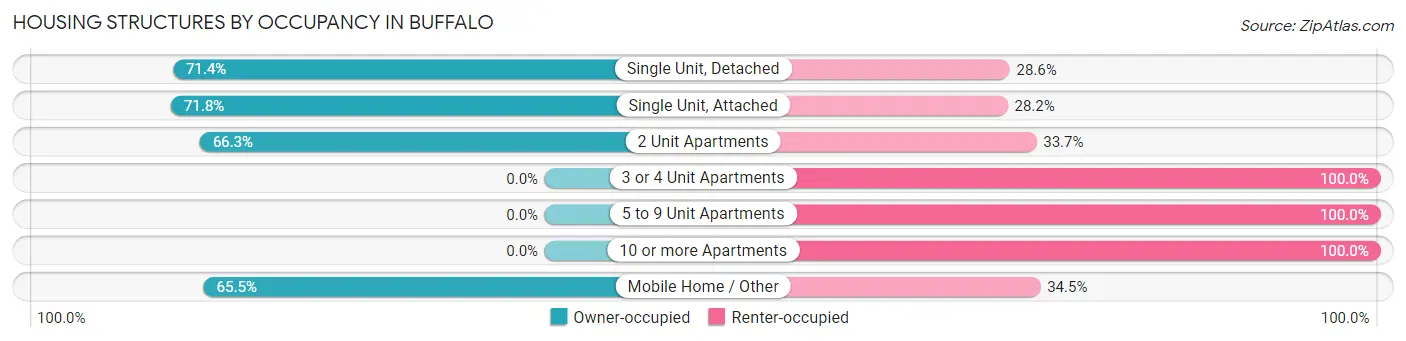
| Structure Type | Owner-occupied | Renter-occupied |
| Single Unit, Detached | 1,175 (71.4%) | 470 (28.6%) |
| Single Unit, Attached | 158 (71.8%) | 62 (28.2%) |
| 2 Unit Apartments | 57 (66.3%) | 29 (33.7%) |
| 3 or 4 Unit Apartments | 0 (0.0%) | 23 (100.0%) |
| 5 to 9 Unit Apartments | 0 (0.0%) | 36 (100.0%) |
| 10 or more Apartments | 0 (0.0%) | 157 (100.0%) |
| Mobile Home / Other | 76 (65.5%) | 40 (34.5%) |
| Total | 1,466 (64.2%) | 817 (35.8%) |
Housing Structures by Number of Rooms in Buffalo
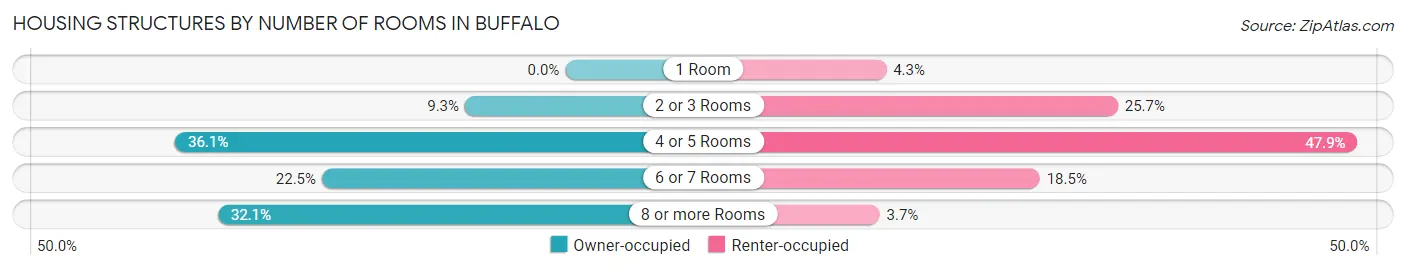
| Number of Rooms | Owner-occupied | Renter-occupied |
| 1 Room | 0 (0.0%) | 35 (4.3%) |
| 2 or 3 Rooms | 136 (9.3%) | 210 (25.7%) |
| 4 or 5 Rooms | 529 (36.1%) | 391 (47.9%) |
| 6 or 7 Rooms | 330 (22.5%) | 151 (18.5%) |
| 8 or more Rooms | 471 (32.1%) | 30 (3.7%) |
| Total | 1,466 (100.0%) | 817 (100.0%) |
Housing Structure by Heating Type in Buffalo
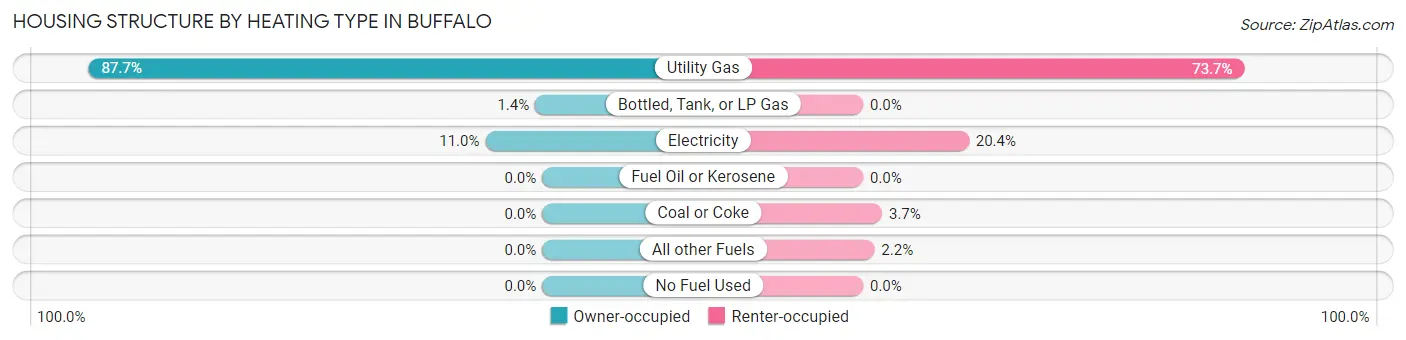
| Heating Type | Owner-occupied | Renter-occupied |
| Utility Gas | 1,285 (87.6%) | 602 (73.7%) |
| Bottled, Tank, or LP Gas | 20 (1.4%) | 0 (0.0%) |
| Electricity | 161 (11.0%) | 167 (20.4%) |
| Fuel Oil or Kerosene | 0 (0.0%) | 0 (0.0%) |
| Coal or Coke | 0 (0.0%) | 30 (3.7%) |
| All other Fuels | 0 (0.0%) | 18 (2.2%) |
| No Fuel Used | 0 (0.0%) | 0 (0.0%) |
| Total | 1,466 (100.0%) | 817 (100.0%) |
Household Vehicle Usage in Buffalo
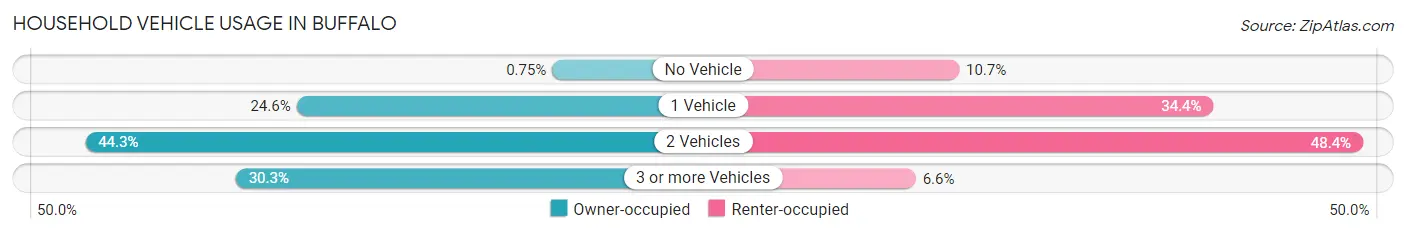
| Vehicles per Household | Owner-occupied | Renter-occupied |
| No Vehicle | 11 (0.7%) | 87 (10.6%) |
| 1 Vehicle | 361 (24.6%) | 281 (34.4%) |
| 2 Vehicles | 650 (44.3%) | 395 (48.3%) |
| 3 or more Vehicles | 444 (30.3%) | 54 (6.6%) |
| Total | 1,466 (100.0%) | 817 (100.0%) |
Real Estate & Mortgages in Buffalo
Real Estate and Mortgage Overview in Buffalo
| Characteristic | Without Mortgage | With Mortgage |
| Housing Units | 730 | 736 |
| Median Property Value | $269,200 | $263,000 |
| Median Household Income | $49,022 | $137 |
| Monthly Housing Costs | $488 | $31 |
| Real Estate Taxes | $1,701 | $21 |
Property Value by Mortgage Status in Buffalo
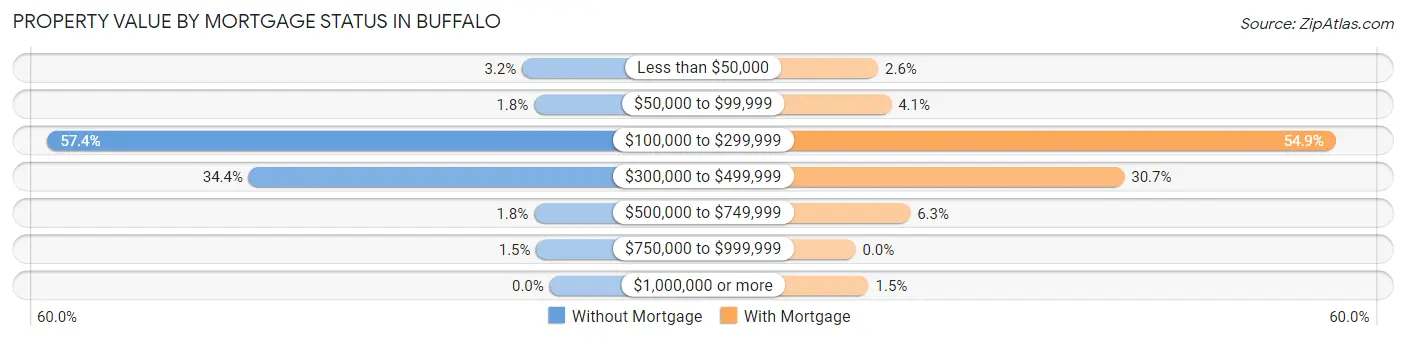
| Property Value | Without Mortgage | With Mortgage |
| Less than $50,000 | 23 (3.2%) | 19 (2.6%) |
| $50,000 to $99,999 | 13 (1.8%) | 30 (4.1%) |
| $100,000 to $299,999 | 419 (57.4%) | 404 (54.9%) |
| $300,000 to $499,999 | 251 (34.4%) | 226 (30.7%) |
| $500,000 to $749,999 | 13 (1.8%) | 46 (6.2%) |
| $750,000 to $999,999 | 11 (1.5%) | 0 (0.0%) |
| $1,000,000 or more | 0 (0.0%) | 11 (1.5%) |
| Total | 730 (100.0%) | 736 (100.0%) |
Household Income by Mortgage Status in Buffalo
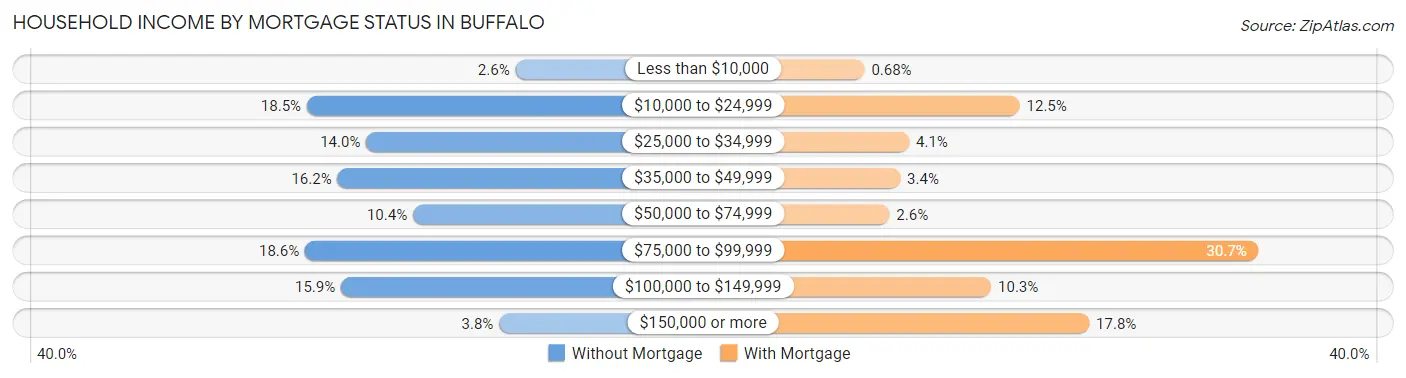
| Household Income | Without Mortgage | With Mortgage |
| Less than $10,000 | 19 (2.6%) | 5 (0.7%) |
| $10,000 to $24,999 | 135 (18.5%) | 92 (12.5%) |
| $25,000 to $34,999 | 102 (14.0%) | 30 (4.1%) |
| $35,000 to $49,999 | 118 (16.2%) | 25 (3.4%) |
| $50,000 to $74,999 | 76 (10.4%) | 19 (2.6%) |
| $75,000 to $99,999 | 136 (18.6%) | 226 (30.7%) |
| $100,000 to $149,999 | 116 (15.9%) | 76 (10.3%) |
| $150,000 or more | 28 (3.8%) | 131 (17.8%) |
| Total | 730 (100.0%) | 736 (100.0%) |
Property Value to Household Income Ratio in Buffalo
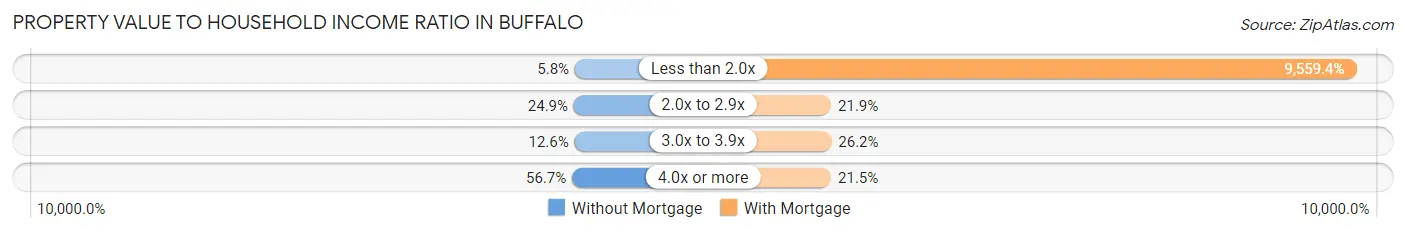
| Value-to-Income Ratio | Without Mortgage | With Mortgage |
| Less than 2.0x | 42 (5.8%) | 70,357 (9,559.4%) |
| 2.0x to 2.9x | 182 (24.9%) | 161 (21.9%) |
| 3.0x to 3.9x | 92 (12.6%) | 193 (26.2%) |
| 4.0x or more | 414 (56.7%) | 158 (21.5%) |
| Total | 730 (100.0%) | 736 (100.0%) |
Real Estate Taxes by Mortgage Status in Buffalo
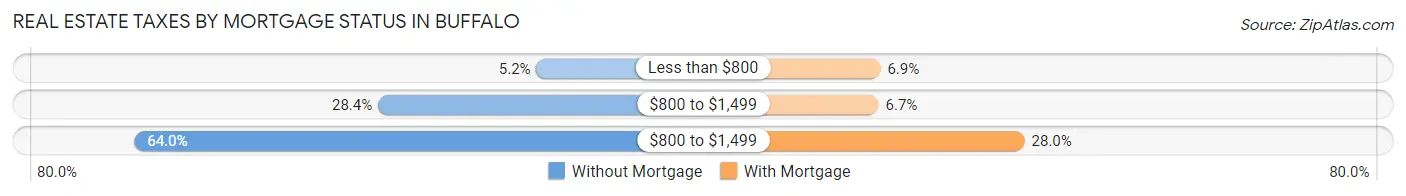
| Property Taxes | Without Mortgage | With Mortgage |
| Less than $800 | 38 (5.2%) | 51 (6.9%) |
| $800 to $1,499 | 207 (28.4%) | 49 (6.7%) |
| $800 to $1,499 | 467 (64.0%) | 206 (28.0%) |
| Total | 730 (100.0%) | 736 (100.0%) |
Health & Disability in Buffalo
Health Insurance Coverage by Age in Buffalo
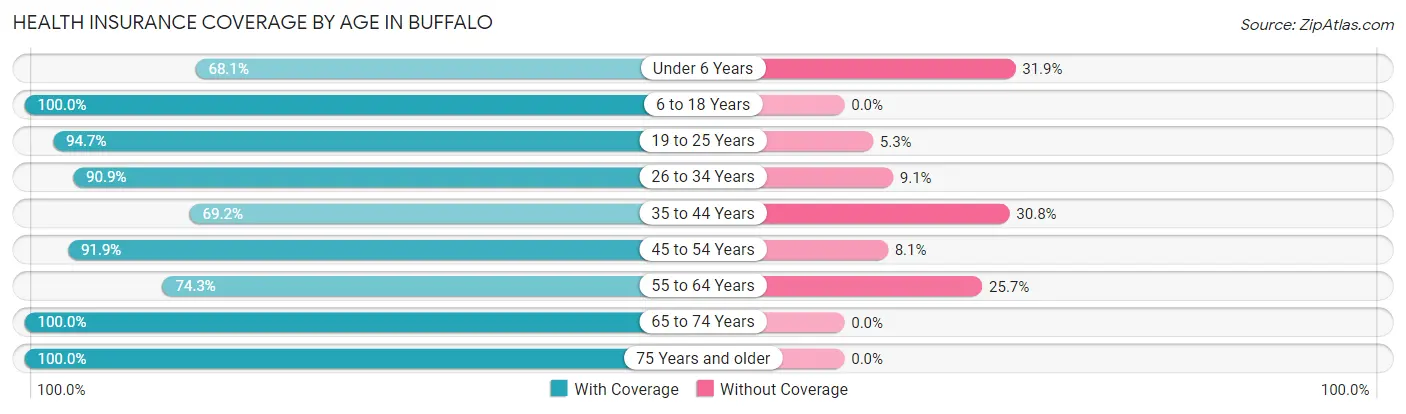
| Age Bracket | With Coverage | Without Coverage |
| Under 6 Years | 220 (68.1%) | 103 (31.9%) |
| 6 to 18 Years | 516 (100.0%) | 0 (0.0%) |
| 19 to 25 Years | 267 (94.7%) | 15 (5.3%) |
| 26 to 34 Years | 472 (90.9%) | 47 (9.1%) |
| 35 to 44 Years | 272 (69.2%) | 121 (30.8%) |
| 45 to 54 Years | 432 (91.9%) | 38 (8.1%) |
| 55 to 64 Years | 422 (74.3%) | 146 (25.7%) |
| 65 to 74 Years | 698 (100.0%) | 0 (0.0%) |
| 75 Years and older | 577 (100.0%) | 0 (0.0%) |
| Total | 3,876 (89.2%) | 470 (10.8%) |
Health Insurance Coverage by Citizenship Status in Buffalo
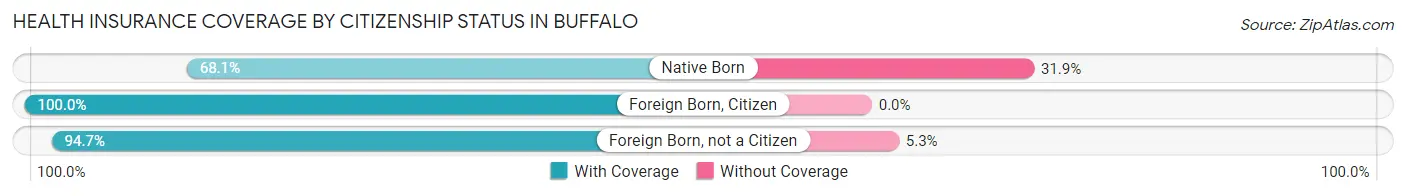
| Citizenship Status | With Coverage | Without Coverage |
| Native Born | 220 (68.1%) | 103 (31.9%) |
| Foreign Born, Citizen | 516 (100.0%) | 0 (0.0%) |
| Foreign Born, not a Citizen | 267 (94.7%) | 15 (5.3%) |
Health Insurance Coverage by Household Income in Buffalo
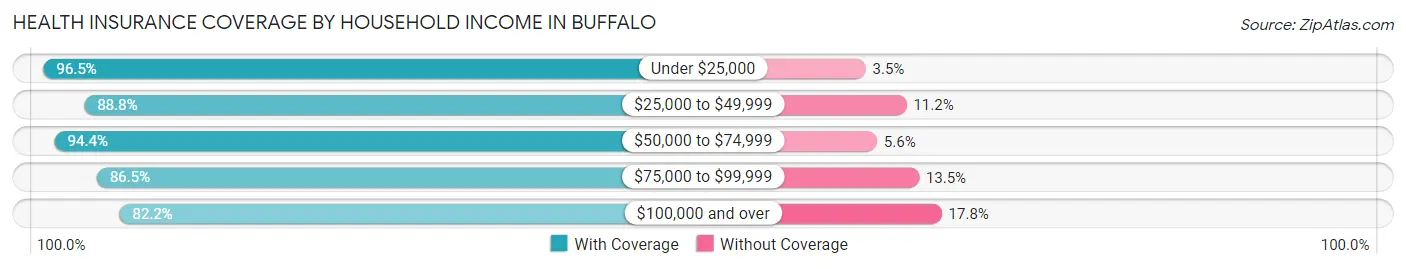
| Household Income | With Coverage | Without Coverage |
| Under $25,000 | 737 (96.5%) | 27 (3.5%) |
| $25,000 to $49,999 | 747 (88.8%) | 94 (11.2%) |
| $50,000 to $74,999 | 921 (94.4%) | 55 (5.6%) |
| $75,000 to $99,999 | 339 (86.5%) | 53 (13.5%) |
| $100,000 and over | 1,115 (82.2%) | 241 (17.8%) |
Public vs Private Health Insurance Coverage by Age in Buffalo
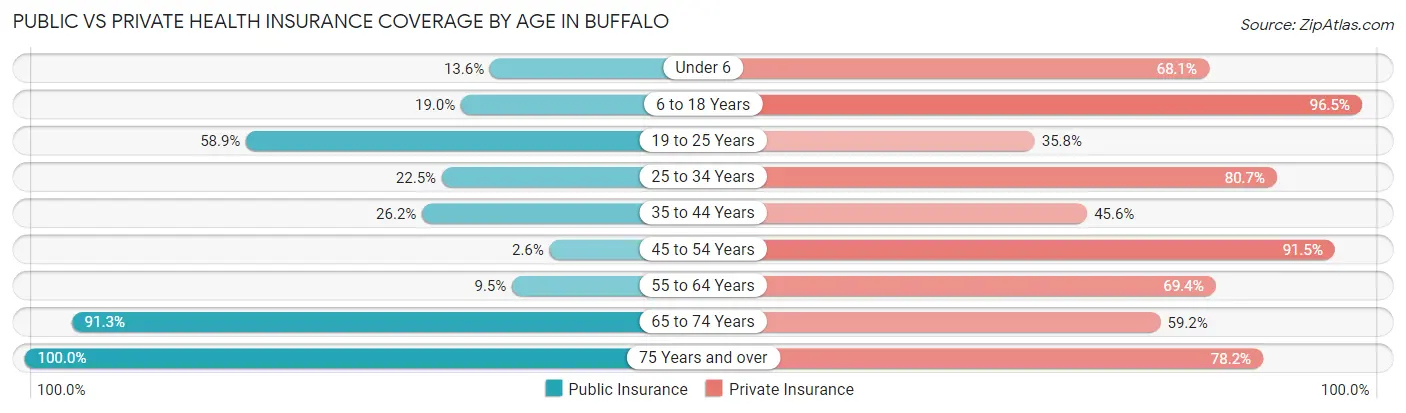
| Age Bracket | Public Insurance | Private Insurance |
| Under 6 | 44 (13.6%) | 220 (68.1%) |
| 6 to 18 Years | 98 (19.0%) | 498 (96.5%) |
| 19 to 25 Years | 166 (58.9%) | 101 (35.8%) |
| 25 to 34 Years | 117 (22.5%) | 419 (80.7%) |
| 35 to 44 Years | 103 (26.2%) | 179 (45.6%) |
| 45 to 54 Years | 12 (2.5%) | 430 (91.5%) |
| 55 to 64 Years | 54 (9.5%) | 394 (69.4%) |
| 65 to 74 Years | 637 (91.3%) | 413 (59.2%) |
| 75 Years and over | 577 (100.0%) | 451 (78.2%) |
| Total | 1,808 (41.6%) | 3,105 (71.5%) |
Disability Status by Sex by Age in Buffalo
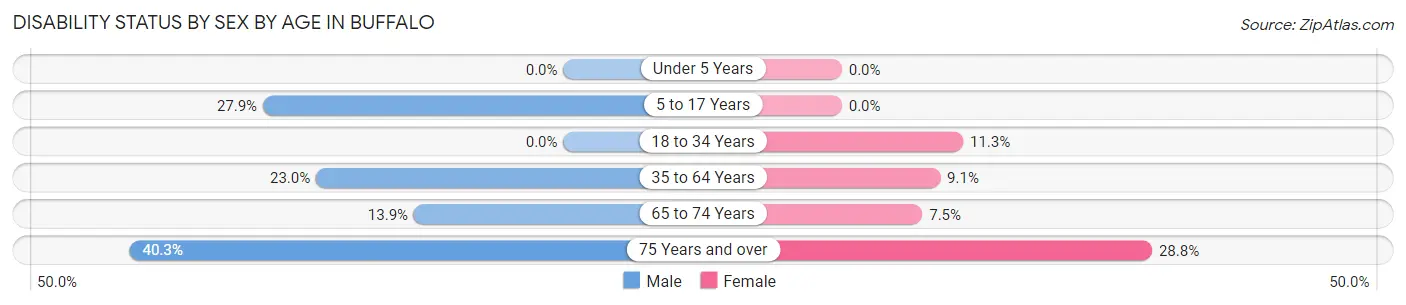
| Age Bracket | Male | Female |
| Under 5 Years | 0 (0.0%) | 0 (0.0%) |
| 5 to 17 Years | 46 (27.9%) | 0 (0.0%) |
| 18 to 34 Years | 0 (0.0%) | 35 (11.3%) |
| 35 to 64 Years | 165 (23.0%) | 65 (9.1%) |
| 65 to 74 Years | 43 (13.9%) | 29 (7.5%) |
| 75 Years and over | 126 (40.3%) | 76 (28.8%) |
Disability Class by Sex by Age in Buffalo
Disability Class: Hearing Difficulty
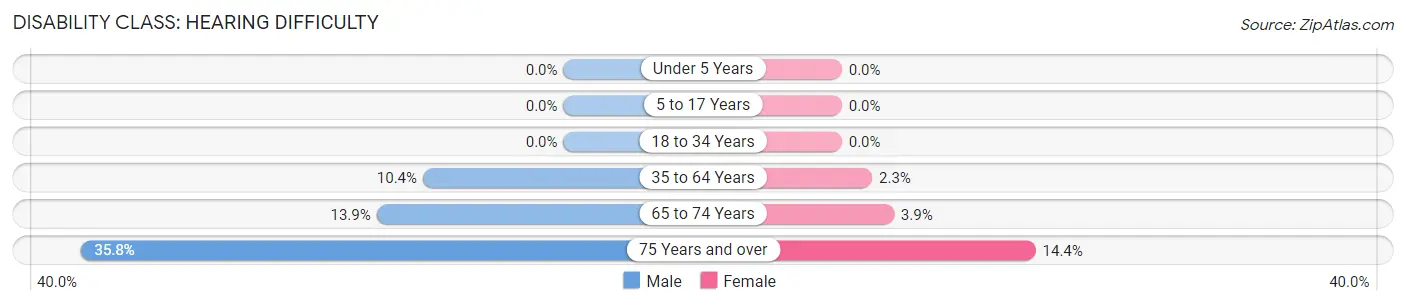
| Age Bracket | Male | Female |
| Under 5 Years | 0 (0.0%) | 0 (0.0%) |
| 5 to 17 Years | 0 (0.0%) | 0 (0.0%) |
| 18 to 34 Years | 0 (0.0%) | 0 (0.0%) |
| 35 to 64 Years | 75 (10.4%) | 16 (2.2%) |
| 65 to 74 Years | 43 (13.9%) | 15 (3.9%) |
| 75 Years and over | 112 (35.8%) | 38 (14.4%) |
Disability Class: Vision Difficulty
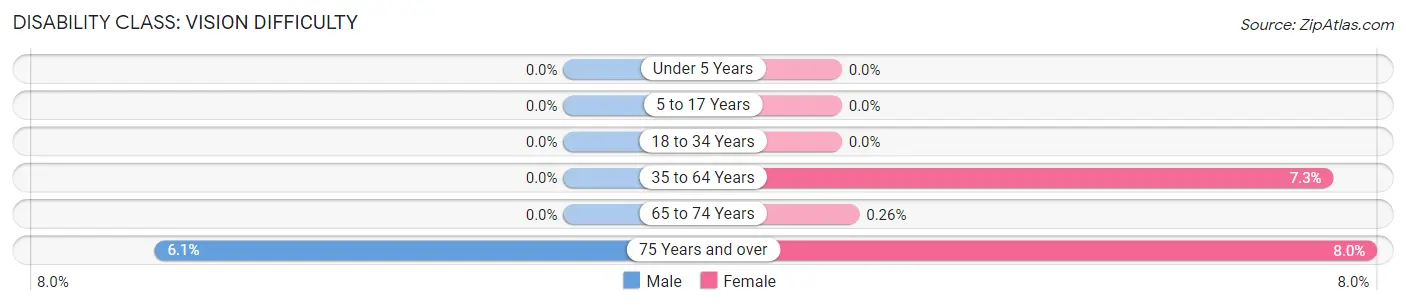
| Age Bracket | Male | Female |
| Under 5 Years | 0 (0.0%) | 0 (0.0%) |
| 5 to 17 Years | 0 (0.0%) | 0 (0.0%) |
| 18 to 34 Years | 0 (0.0%) | 0 (0.0%) |
| 35 to 64 Years | 0 (0.0%) | 52 (7.3%) |
| 65 to 74 Years | 0 (0.0%) | 1 (0.3%) |
| 75 Years and over | 19 (6.1%) | 21 (8.0%) |
Disability Class: Cognitive Difficulty
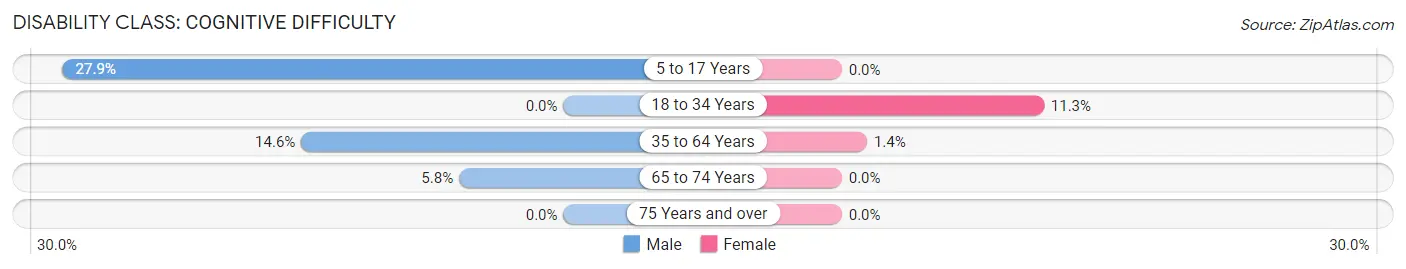
| Age Bracket | Male | Female |
| 5 to 17 Years | 46 (27.9%) | 0 (0.0%) |
| 18 to 34 Years | 0 (0.0%) | 35 (11.3%) |
| 35 to 64 Years | 105 (14.6%) | 10 (1.4%) |
| 65 to 74 Years | 18 (5.8%) | 0 (0.0%) |
| 75 Years and over | 0 (0.0%) | 0 (0.0%) |
Disability Class: Ambulatory Difficulty
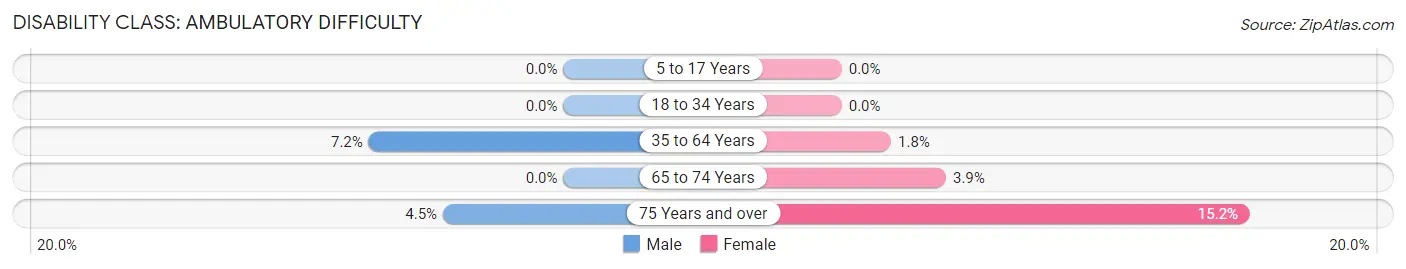
| Age Bracket | Male | Female |
| 5 to 17 Years | 0 (0.0%) | 0 (0.0%) |
| 18 to 34 Years | 0 (0.0%) | 0 (0.0%) |
| 35 to 64 Years | 52 (7.2%) | 13 (1.8%) |
| 65 to 74 Years | 0 (0.0%) | 15 (3.9%) |
| 75 Years and over | 14 (4.5%) | 40 (15.1%) |
Disability Class: Self-Care Difficulty
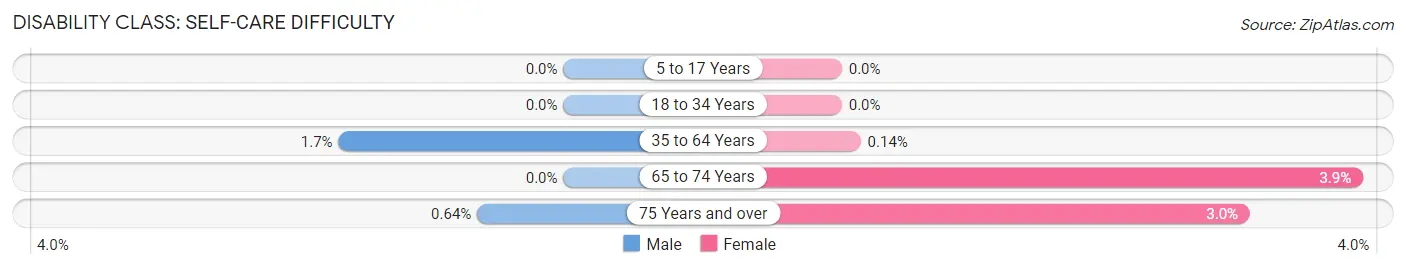
| Age Bracket | Male | Female |
| 5 to 17 Years | 0 (0.0%) | 0 (0.0%) |
| 18 to 34 Years | 0 (0.0%) | 0 (0.0%) |
| 35 to 64 Years | 12 (1.7%) | 1 (0.1%) |
| 65 to 74 Years | 0 (0.0%) | 15 (3.9%) |
| 75 Years and over | 2 (0.6%) | 8 (3.0%) |
Technology Access in Buffalo
Computing Device Access in Buffalo
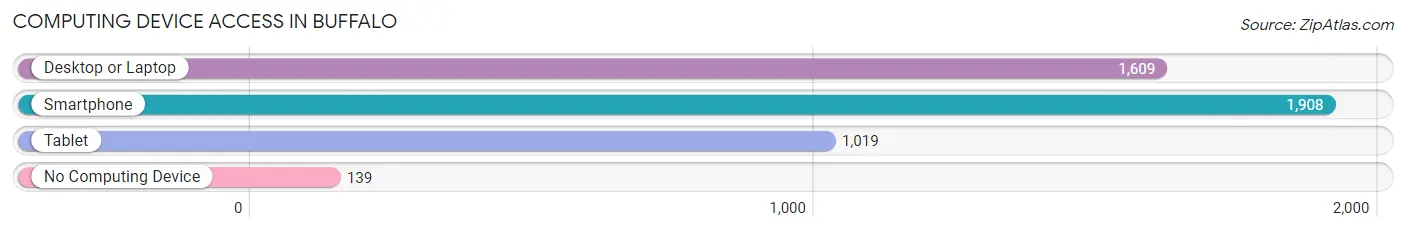
| Device Type | # Households | % Households |
| Desktop or Laptop | 1,609 | 70.5% |
| Smartphone | 1,908 | 83.6% |
| Tablet | 1,019 | 44.6% |
| No Computing Device | 139 | 6.1% |
| Total | 2,283 | 100.0% |
Internet Access in Buffalo
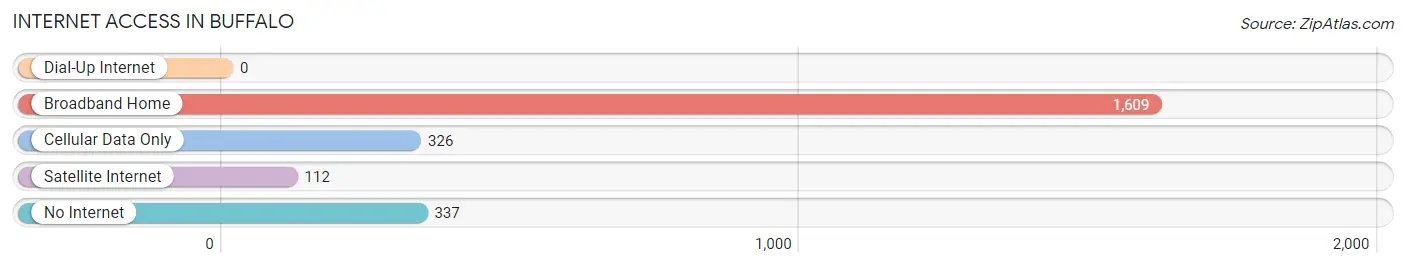
| Internet Type | # Households | % Households |
| Dial-Up Internet | 0 | 0.0% |
| Broadband Home | 1,609 | 70.5% |
| Cellular Data Only | 326 | 14.3% |
| Satellite Internet | 112 | 4.9% |
| No Internet | 337 | 14.8% |
| Total | 2,283 | 100.0% |
Buffalo Summary
Buffalo, Wyoming is a small town located in the northeastern corner of the state, in Johnson County. It is the county seat and the largest town in the county. The town was founded in 1879 and has a population of 4,585 as of the 2010 census.
Geography
Buffalo is located in the foothills of the Big Horn Mountains, at an elevation of 4,890 feet. The town is situated on the banks of Clear Creek, a tributary of the Powder River. The town is surrounded by rolling hills and grasslands, and is located in the heart of the Bighorn Basin. The climate is semi-arid, with hot summers and cold winters.
History
Buffalo was founded in 1879 by a group of settlers from the Midwest. The town was named after the nearby Buffalo Bill Reservoir, which was named after the famous frontiersman, Buffalo Bill Cody. The town quickly grew and became an important stop on the Union Pacific Railroad. In 1882, the town was incorporated and the first post office was established.
The town continued to grow and by the early 1900s, it had become an important center for the cattle industry. The town was also home to several large ranches, including the JA Ranch, which was owned by Charles Goodnight and Oliver Loving.
In the early 1900s, the town also became an important center for the oil and gas industry. The first oil well was drilled in the area in 1909, and by the 1920s, the town was home to several oil and gas companies.
Economy
The economy of Buffalo is largely based on agriculture and energy production. The town is home to several large ranches, and the surrounding area is used for cattle and sheep grazing. The town is also home to several oil and gas companies, and the area is an important center for oil and gas production.
The town is also home to several manufacturing companies, including a large furniture factory and a plastics factory. The town is also home to several retail stores, restaurants, and other businesses.
Demographics
As of the 2010 census, the population of Buffalo was 4,585. The racial makeup of the town was 95.3% White, 0.3% African American, 0.7% Native American, 0.3% Asian, 0.1% Pacific Islander, 1.2% from other races, and 2.2% from two or more races. Hispanic or Latino of any race were 4.2% of the population.
The median income for a household in the town was $37,917, and the median income for a family was $45,938. The per capita income for the town was $19,945. About 11.2% of families and 14.2% of the population were below the poverty line, including 18.2% of those under age 18 and 8.2% of those age 65 or over.
Conclusion
Buffalo, Wyoming is a small town located in the northeastern corner of the state, in Johnson County. It is the county seat and the largest town in the county. The town was founded in 1879 and has a population of 4,585 as of the 2010 census. The economy of Buffalo is largely based on agriculture and energy production, and the town is home to several large ranches, oil and gas companies, and manufacturing companies. The racial makeup of the town is predominantly white, with a small percentage of African American, Native American, Asian, and Pacific Islander residents. The median income for a household in the town was $37,917, and the median income for a family was $45,938.
Common Questions
What is Per Capita Income in Buffalo?
Per Capita income in Buffalo is $33,893.
What is the Median Family Income in Buffalo?
Median Family Income in Buffalo is $78,494.
What is the Median Household income in Buffalo?
Median Household Income in Buffalo is $55,245.
What is Income or Wage Gap in Buffalo?
Income or Wage Gap in Buffalo is 26.3%.
Women in Buffalo earn 73.7 cents for every dollar earned by a man.
What is Family Income Deficit in Buffalo?
Family Income Deficit in Buffalo is $10,776.
Families that are below poverty line in Buffalo earn $10,776 less on average than the poverty threshold level.
What is Inequality or Gini Index in Buffalo?
Inequality or Gini Index in Buffalo is 0.48.
What is the Total Population of Buffalo?
Total Population of Buffalo is 4,475.
What is the Total Male Population of Buffalo?
Total Male Population of Buffalo is 2,252.
What is the Total Female Population of Buffalo?
Total Female Population of Buffalo is 2,223.
What is the Ratio of Males per 100 Females in Buffalo?
There are 101.30 Males per 100 Females in Buffalo.
What is the Ratio of Females per 100 Males in Buffalo?
There are 98.71 Females per 100 Males in Buffalo.
What is the Median Population Age in Buffalo?
Median Population Age in Buffalo is 49.0 Years.
What is the Average Family Size in Buffalo
Average Family Size in Buffalo is 2.8 People.
What is the Average Household Size in Buffalo
Average Household Size in Buffalo is 1.9 People.
How Large is the Labor Force in Buffalo?
There are 2,006 People in the Labor Forcein in Buffalo.
What is the Percentage of People in the Labor Force in Buffalo?
52.7% of People are in the Labor Force in Buffalo.
What is the Unemployment Rate in Buffalo?
Unemployment Rate in Buffalo is 4.0%.