North Vandergrift, PA Map & Demographics
North Vandergrift Map
North Vandergrift Overview
$22,216
PER CAPITA INCOME
$43,438
AVG FAMILY INCOME
$29,643
AVG HOUSEHOLD INCOME
0.45
INEQUALITY / GINI INDEX
341
TOTAL POPULATION
190
MALE POPULATION
151
FEMALE POPULATION
125.83
MALES / 100 FEMALES
79.47
FEMALES / 100 MALES
39.7
MEDIAN AGE
2.9
AVG FAMILY SIZE
2.0
AVG HOUSEHOLD SIZE
144
LABOR FORCE [ PEOPLE ]
54.1%
PERCENT IN LABOR FORCE
25.7%
UNEMPLOYMENT RATE
Income in North Vandergrift
Income Overview in North Vandergrift
Per Capita Income in North Vandergrift is $22,216, while median incomes of families and households are $43,438 and $29,643 respectively.
| Characteristic | Number | Measure |
| Per Capita Income | 341 | $22,216 |
| Median Family Income | 69 | $43,438 |
| Mean Family Income | 69 | $51,748 |
| Median Household Income | 170 | $29,643 |
| Mean Household Income | 170 | $43,576 |
| Income Deficit | 69 | $0 |
| Wage / Income Gap (%) | 341 | 0.00% |
| Wage / Income Gap ($) | 341 | 100.00¢ per $1 |
| Gini / Inequality Index | 341 | 0.45 |
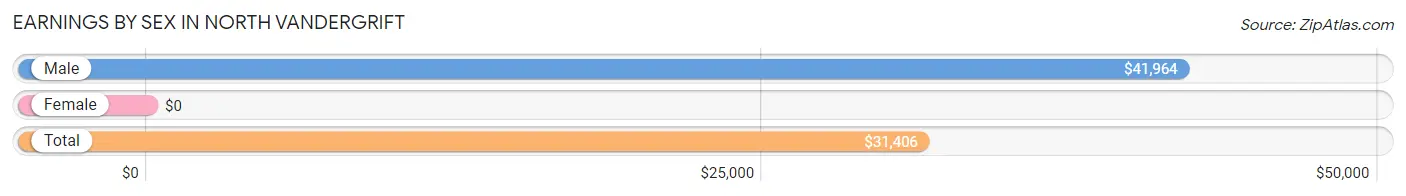
Earnings by Sex in North Vandergrift
| Sex | Number | Average Earnings |
| Male | 71 (49.3%) | $41,964 |
| Female | 73 (50.7%) | $0 |
| Total | 144 (100.0%) | $31,406 |
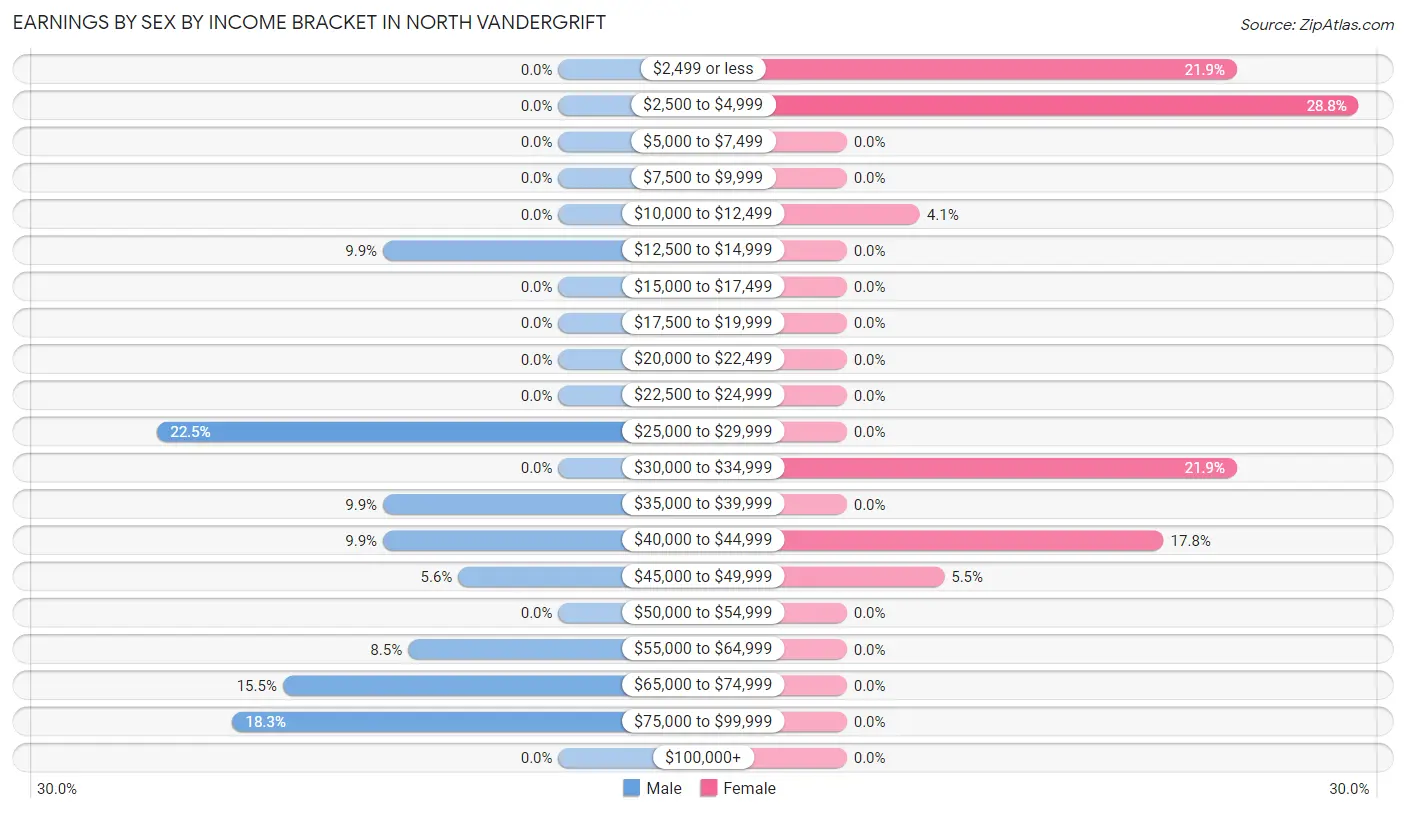
Earnings by Sex by Income Bracket in North Vandergrift
The most common earnings brackets in North Vandergrift are $25,000 to $29,999 for men (16 | 22.5%) and $2,500 to $4,999 for women (21 | 28.8%).
| Income | Male | Female |
| $2,499 or less | 0 (0.0%) | 16 (21.9%) |
| $2,500 to $4,999 | 0 (0.0%) | 21 (28.8%) |
| $5,000 to $7,499 | 0 (0.0%) | 0 (0.0%) |
| $7,500 to $9,999 | 0 (0.0%) | 0 (0.0%) |
| $10,000 to $12,499 | 0 (0.0%) | 3 (4.1%) |
| $12,500 to $14,999 | 7 (9.9%) | 0 (0.0%) |
| $15,000 to $17,499 | 0 (0.0%) | 0 (0.0%) |
| $17,500 to $19,999 | 0 (0.0%) | 0 (0.0%) |
| $20,000 to $22,499 | 0 (0.0%) | 0 (0.0%) |
| $22,500 to $24,999 | 0 (0.0%) | 0 (0.0%) |
| $25,000 to $29,999 | 16 (22.5%) | 0 (0.0%) |
| $30,000 to $34,999 | 0 (0.0%) | 16 (21.9%) |
| $35,000 to $39,999 | 7 (9.9%) | 0 (0.0%) |
| $40,000 to $44,999 | 7 (9.9%) | 13 (17.8%) |
| $45,000 to $49,999 | 4 (5.6%) | 4 (5.5%) |
| $50,000 to $54,999 | 0 (0.0%) | 0 (0.0%) |
| $55,000 to $64,999 | 6 (8.5%) | 0 (0.0%) |
| $65,000 to $74,999 | 11 (15.5%) | 0 (0.0%) |
| $75,000 to $99,999 | 13 (18.3%) | 0 (0.0%) |
| $100,000+ | 0 (0.0%) | 0 (0.0%) |
| Total | 71 (100.0%) | 73 (100.0%) |
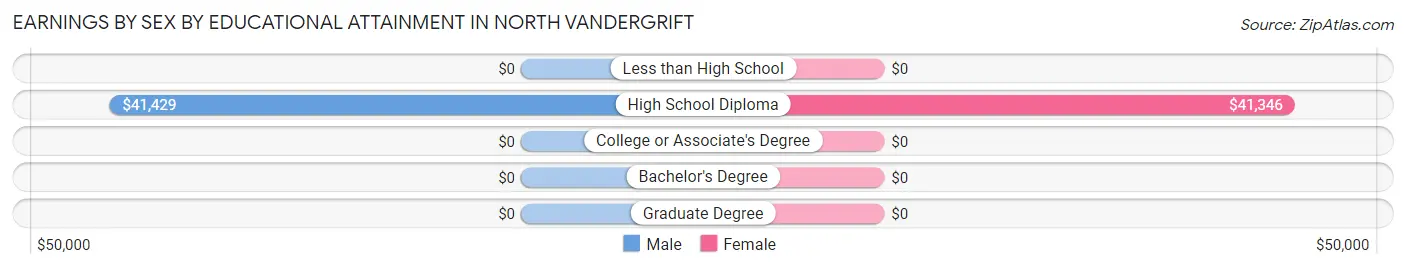
Earnings by Sex by Educational Attainment in North Vandergrift
| Educational Attainment | Male Income | Female Income |
| Less than High School | - | - |
| High School Diploma | $41,429 | $41,346 |
| College or Associate's Degree | - | - |
| Bachelor's Degree | - | - |
| Graduate Degree | - | - |
| Total | $40,893 | $0 |
Family Income in North Vandergrift
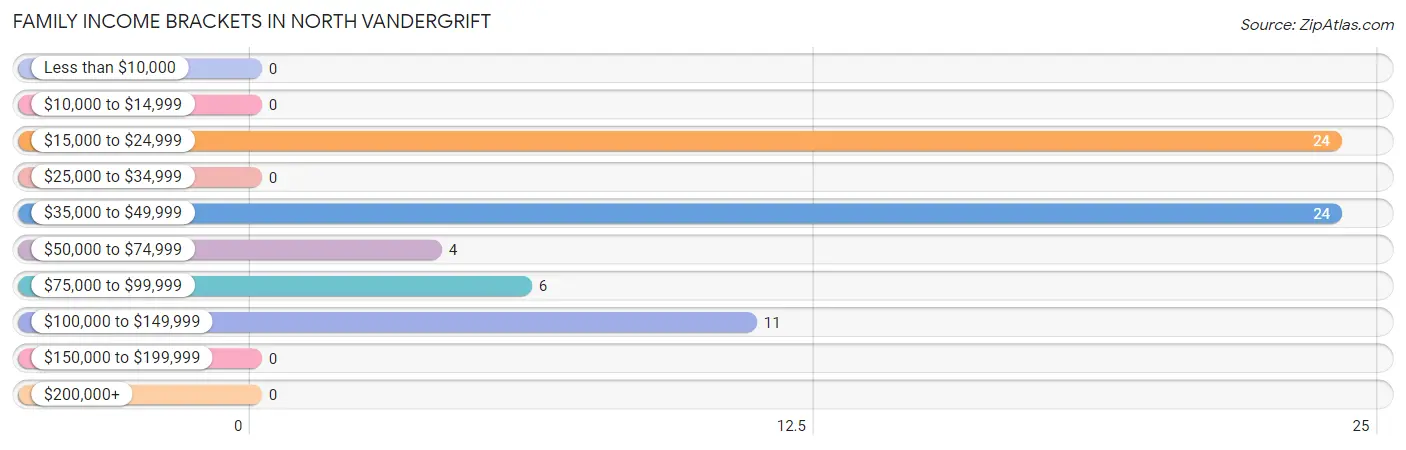
Family Income Brackets in North Vandergrift
According to the North Vandergrift family income data, there are 24 families falling into the $15,000 to $24,999 income range, which is the most common income bracket and makes up 34.8% of all families.
| Income Bracket | # Families | % Families |
| Less than $10,000 | 0 | 0.0% |
| $10,000 to $14,999 | 0 | 0.0% |
| $15,000 to $24,999 | 24 | 34.8% |
| $25,000 to $34,999 | 0 | 0.0% |
| $35,000 to $49,999 | 24 | 34.8% |
| $50,000 to $74,999 | 4 | 5.8% |
| $75,000 to $99,999 | 6 | 8.7% |
| $100,000 to $149,999 | 11 | 15.9% |
| $150,000 to $199,999 | 0 | 0.0% |
| $200,000+ | 0 | 0.0% |
Family Income by Famaliy Size in North Vandergrift
| Income Bracket | # Families | Median Income |
| 2-Person Families | 30 (43.5%) | $0 |
| 3-Person Families | 24 (34.8%) | $0 |
| 4-Person Families | 15 (21.7%) | $0 |
| 5-Person Families | 0 (0.0%) | $0 |
| 6-Person Families | 0 (0.0%) | $0 |
| 7+ Person Families | 0 (0.0%) | $0 |
| Total | 69 (100.0%) | $43,438 |
Family Income by Number of Earners in North Vandergrift
| Number of Earners | # Families | Median Income |
| No Earners | 11 (15.9%) | $0 |
| 1 Earner | 50 (72.5%) | $0 |
| 2 Earners | 8 (11.6%) | $0 |
| 3+ Earners | 0 (0.0%) | $0 |
| Total | 69 (100.0%) | $43,438 |
Household Income in North Vandergrift
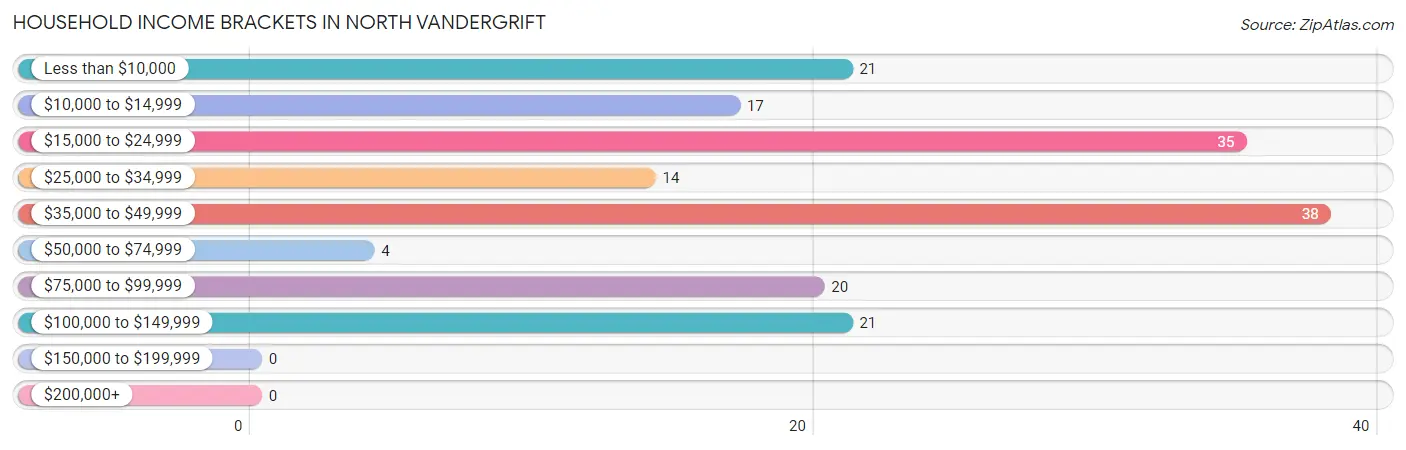
Household Income Brackets in North Vandergrift
With 38 households falling in the category, the $35,000 to $49,999 income range is the most frequent in North Vandergrift, accounting for 22.4% of all households.
| Income Bracket | # Households | % Households |
| Less than $10,000 | 21 | 12.4% |
| $10,000 to $14,999 | 17 | 10.0% |
| $15,000 to $24,999 | 35 | 20.6% |
| $25,000 to $34,999 | 14 | 8.2% |
| $35,000 to $49,999 | 38 | 22.4% |
| $50,000 to $74,999 | 4 | 2.4% |
| $75,000 to $99,999 | 20 | 11.8% |
| $100,000 to $149,999 | 21 | 12.4% |
| $150,000 to $199,999 | 0 | 0.0% |
| $200,000+ | 0 | 0.0% |
Household Income by Householder Age in North Vandergrift
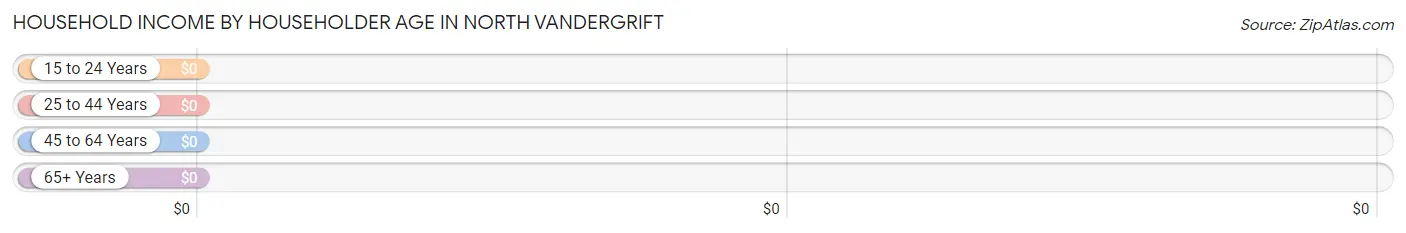
| Income Bracket | # Households | Median Income |
| 15 to 24 Years | 10 (5.9%) | $0 |
| 25 to 44 Years | 48 (28.2%) | $0 |
| 45 to 64 Years | 48 (28.2%) | $0 |
| 65+ Years | 64 (37.7%) | $0 |
| Total | 170 (100.0%) | $29,643 |
Poverty in North Vandergrift
Income Below Poverty by Sex and Age in North Vandergrift
With 30.0% poverty level for males and 35.8% for females among the residents of North Vandergrift, 5 year old males and 75 year old and over females are the most vulnerable to poverty, with 18 males (100.0%) and 17 females (63.0%) in their respective age groups living below the poverty level.
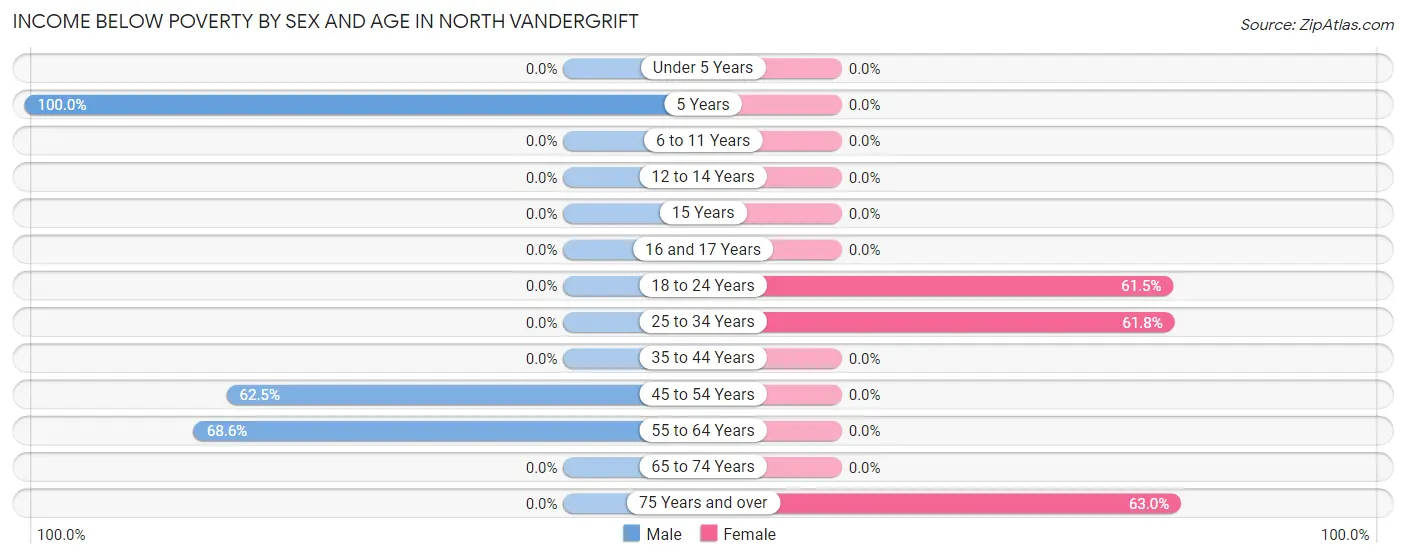
| Age Bracket | Male | Female |
| Under 5 Years | 0 (0.0%) | 0 (0.0%) |
| 5 Years | 18 (100.0%) | 0 (0.0%) |
| 6 to 11 Years | 0 (0.0%) | 0 (0.0%) |
| 12 to 14 Years | 0 (0.0%) | 0 (0.0%) |
| 15 Years | 0 (0.0%) | 0 (0.0%) |
| 16 and 17 Years | 0 (0.0%) | 0 (0.0%) |
| 18 to 24 Years | 0 (0.0%) | 16 (61.5%) |
| 25 to 34 Years | 0 (0.0%) | 21 (61.8%) |
| 35 to 44 Years | 0 (0.0%) | 0 (0.0%) |
| 45 to 54 Years | 15 (62.5%) | 0 (0.0%) |
| 55 to 64 Years | 24 (68.6%) | 0 (0.0%) |
| 65 to 74 Years | 0 (0.0%) | 0 (0.0%) |
| 75 Years and over | 0 (0.0%) | 17 (63.0%) |
| Total | 57 (30.0%) | 54 (35.8%) |
Income Above Poverty by Sex and Age in North Vandergrift
According to the poverty statistics in North Vandergrift, males aged under 5 years and females aged under 5 years are the age groups that are most secure financially, with 100.0% of males and 100.0% of females in these age groups living above the poverty line.
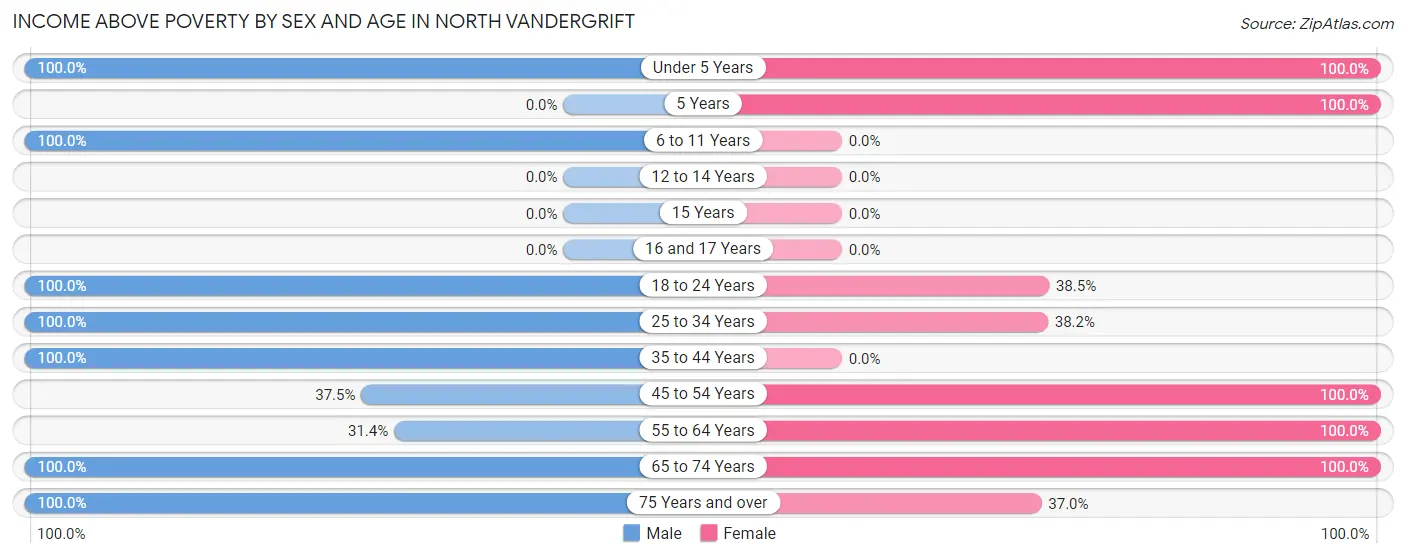
| Age Bracket | Male | Female |
| Under 5 Years | 6 (100.0%) | 13 (100.0%) |
| 5 Years | 0 (0.0%) | 7 (100.0%) |
| 6 to 11 Years | 31 (100.0%) | 0 (0.0%) |
| 12 to 14 Years | 0 (0.0%) | 0 (0.0%) |
| 15 Years | 0 (0.0%) | 0 (0.0%) |
| 16 and 17 Years | 0 (0.0%) | 0 (0.0%) |
| 18 to 24 Years | 20 (100.0%) | 10 (38.5%) |
| 25 to 34 Years | 6 (100.0%) | 13 (38.2%) |
| 35 to 44 Years | 14 (100.0%) | 0 (0.0%) |
| 45 to 54 Years | 9 (37.5%) | 7 (100.0%) |
| 55 to 64 Years | 11 (31.4%) | 24 (100.0%) |
| 65 to 74 Years | 29 (100.0%) | 13 (100.0%) |
| 75 Years and over | 7 (100.0%) | 10 (37.0%) |
| Total | 133 (70.0%) | 97 (64.2%) |
Income Below Poverty Among Married-Couple Families in North Vandergrift
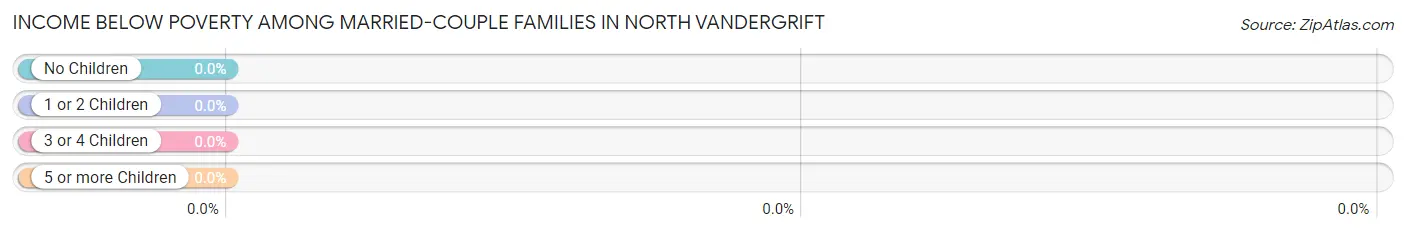
| Children | Above Poverty | Below Poverty |
| No Children | 26 (100.0%) | 0 (0.0%) |
| 1 or 2 Children | 8 (100.0%) | 0 (0.0%) |
| 3 or 4 Children | 0 (0.0%) | 0 (0.0%) |
| 5 or more Children | 0 (0.0%) | 0 (0.0%) |
| Total | 34 (100.0%) | 0 (0.0%) |
Income Below Poverty Among Single-Parent Households in North Vandergrift
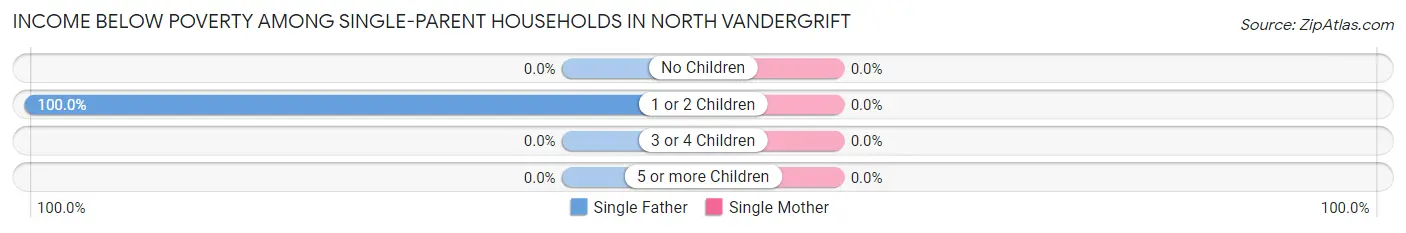
| Children | Single Father | Single Mother |
| No Children | 0 (0.0%) | 0 (0.0%) |
| 1 or 2 Children | 24 (100.0%) | 0 (0.0%) |
| 3 or 4 Children | 0 (0.0%) | 0 (0.0%) |
| 5 or more Children | 0 (0.0%) | 0 (0.0%) |
| Total | 24 (100.0%) | 0 (0.0%) |
Income Below Poverty Among Married-Couple vs Single-Parent Households in North Vandergrift
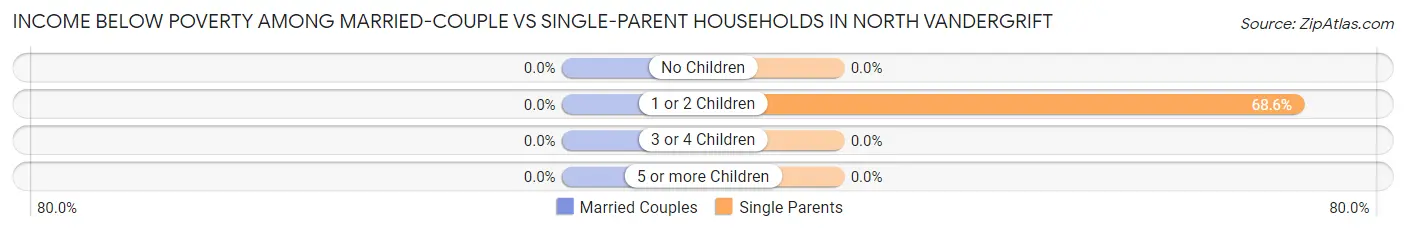
| Children | Married-Couple Families | Single-Parent Households |
| No Children | 0 (0.0%) | 0 (0.0%) |
| 1 or 2 Children | 0 (0.0%) | 24 (68.6%) |
| 3 or 4 Children | 0 (0.0%) | 0 (0.0%) |
| 5 or more Children | 0 (0.0%) | 0 (0.0%) |
| Total | 0 (0.0%) | 24 (68.6%) |
Race in North Vandergrift
The most populous races in North Vandergrift are White / Caucasian (299 | 87.7%), Asian (31 | 9.1%), and Black / African American (11 | 3.2%).
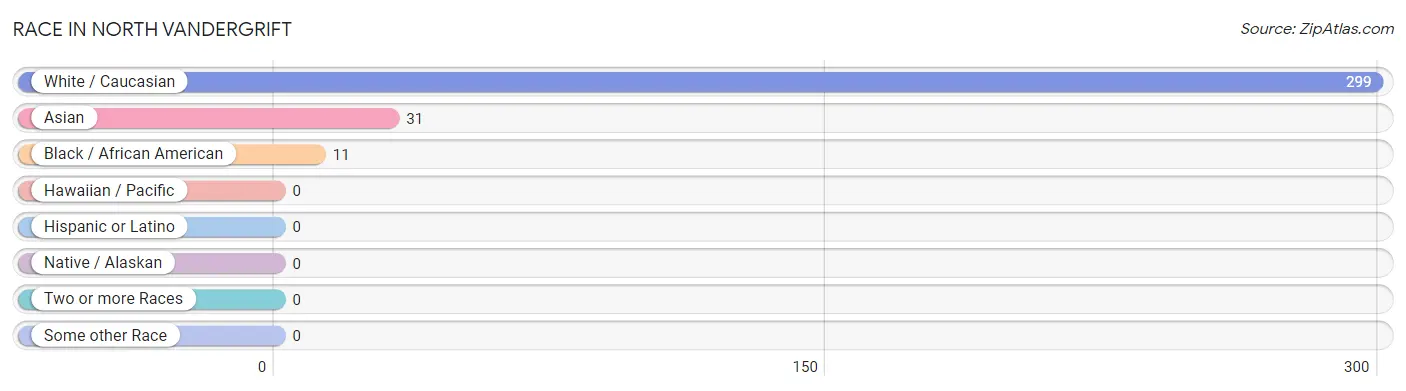
| Race | # Population | % Population |
| Asian | 31 | 9.1% |
| Black / African American | 11 | 3.2% |
| Hawaiian / Pacific | 0 | 0.0% |
| Hispanic or Latino | 0 | 0.0% |
| Native / Alaskan | 0 | 0.0% |
| White / Caucasian | 299 | 87.7% |
| Two or more Races | 0 | 0.0% |
| Some other Race | 0 | 0.0% |
| Total | 341 | 100.0% |
Ancestry in North Vandergrift
The most populous ancestries reported in North Vandergrift are German (156 | 45.8%), Scotch-Irish (59 | 17.3%), Irish (44 | 12.9%), Italian (43 | 12.6%), and Polish (41 | 12.0%), together accounting for 100.6% of all North Vandergrift residents.
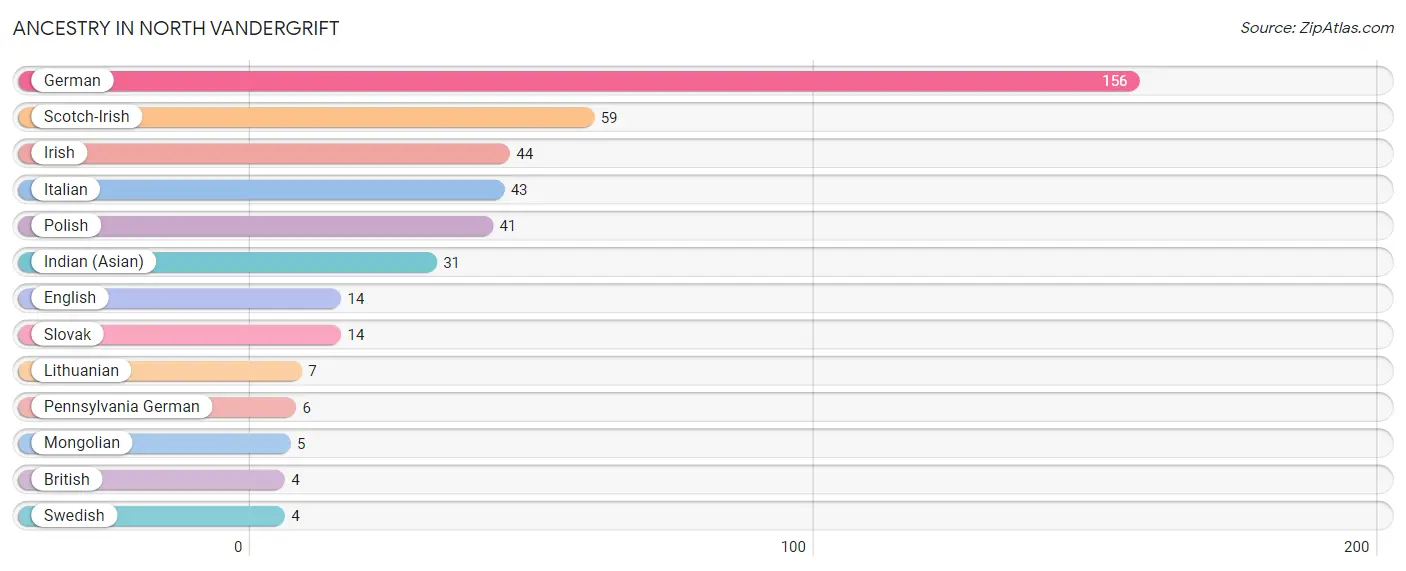
| Ancestry | # Population | % Population |
| British | 4 | 1.2% |
| English | 14 | 4.1% |
| German | 156 | 45.8% |
| Indian (Asian) | 31 | 9.1% |
| Irish | 44 | 12.9% |
| Italian | 43 | 12.6% |
| Lithuanian | 7 | 2.1% |
| Mongolian | 5 | 1.5% |
| Pennsylvania German | 6 | 1.8% |
| Polish | 41 | 12.0% |
| Scotch-Irish | 59 | 17.3% |
| Slovak | 14 | 4.1% |
| Swedish | 4 | 1.2% | View All 13 Rows |
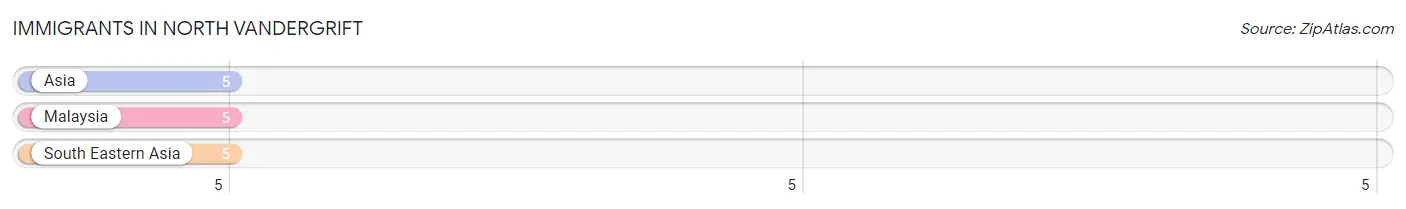
Immigrants in North Vandergrift
The most numerous immigrant groups reported in North Vandergrift came from Asia (5 | 1.5%), Malaysia (5 | 1.5%), and South Eastern Asia (5 | 1.5%), together accounting for 4.4% of all North Vandergrift residents.
| Immigration Origin | # Population | % Population |
| Asia | 5 | 1.5% |
| Malaysia | 5 | 1.5% |
| South Eastern Asia | 5 | 1.5% | View All 3 Rows |
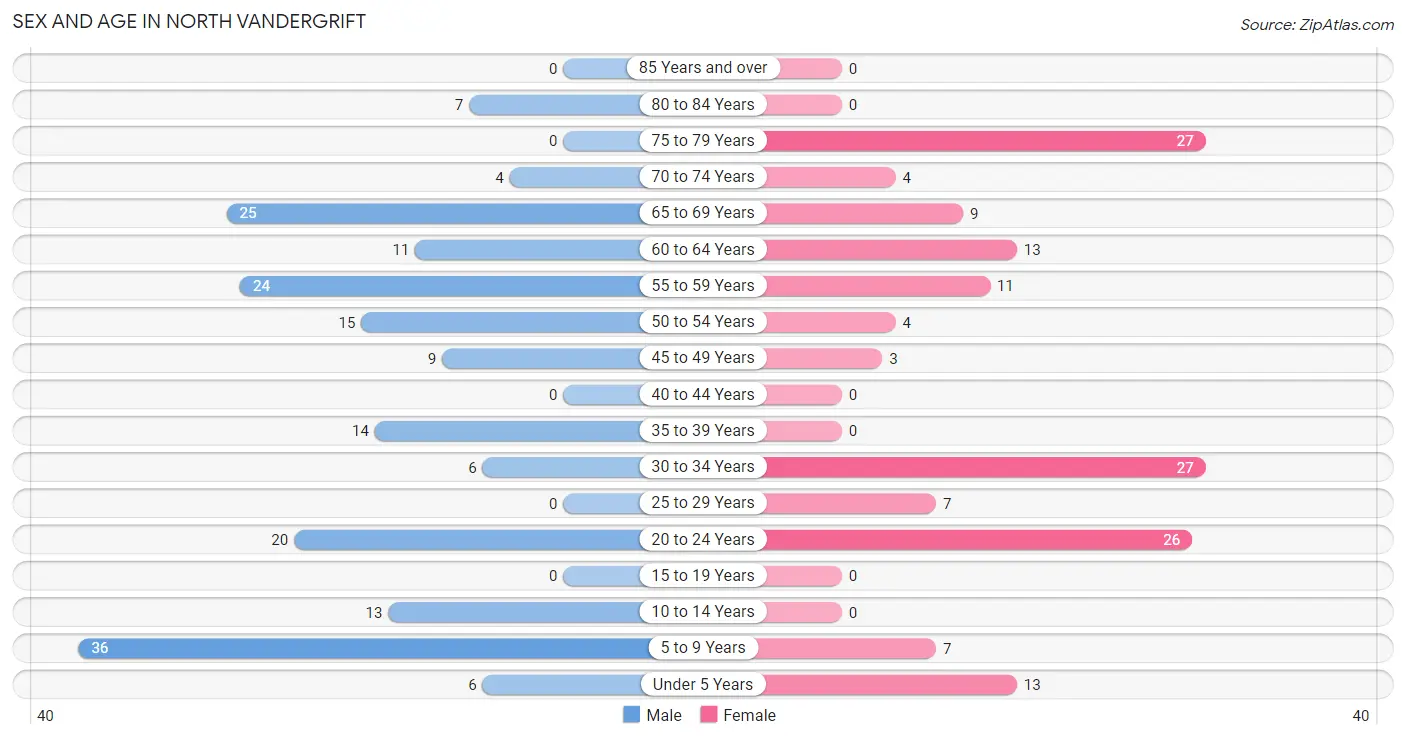
Sex and Age in North Vandergrift
Sex and Age in North Vandergrift
The most populous age groups in North Vandergrift are 5 to 9 Years (36 | 19.0%) for men and 30 to 34 Years (27 | 17.9%) for women.
| Age Bracket | Male | Female |
| Under 5 Years | 6 (3.2%) | 13 (8.6%) |
| 5 to 9 Years | 36 (19.0%) | 7 (4.6%) |
| 10 to 14 Years | 13 (6.8%) | 0 (0.0%) |
| 15 to 19 Years | 0 (0.0%) | 0 (0.0%) |
| 20 to 24 Years | 20 (10.5%) | 26 (17.2%) |
| 25 to 29 Years | 0 (0.0%) | 7 (4.6%) |
| 30 to 34 Years | 6 (3.2%) | 27 (17.9%) |
| 35 to 39 Years | 14 (7.4%) | 0 (0.0%) |
| 40 to 44 Years | 0 (0.0%) | 0 (0.0%) |
| 45 to 49 Years | 9 (4.7%) | 3 (2.0%) |
| 50 to 54 Years | 15 (7.9%) | 4 (2.6%) |
| 55 to 59 Years | 24 (12.6%) | 11 (7.3%) |
| 60 to 64 Years | 11 (5.8%) | 13 (8.6%) |
| 65 to 69 Years | 25 (13.2%) | 9 (6.0%) |
| 70 to 74 Years | 4 (2.1%) | 4 (2.6%) |
| 75 to 79 Years | 0 (0.0%) | 27 (17.9%) |
| 80 to 84 Years | 7 (3.7%) | 0 (0.0%) |
| 85 Years and over | 0 (0.0%) | 0 (0.0%) |
| Total | 190 (100.0%) | 151 (100.0%) |
Families and Households in North Vandergrift
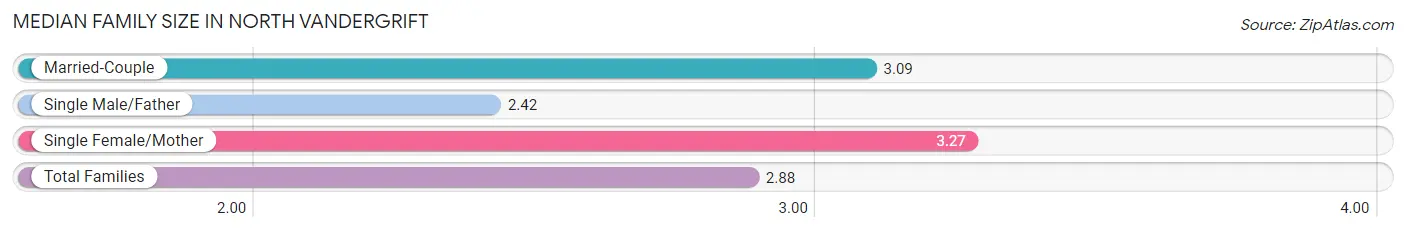
Median Family Size in North Vandergrift
The median family size in North Vandergrift is 2.88 persons per family, with single female/mother families (11 | 15.9%) accounting for the largest median family size of 3.27 persons per family. On the other hand, single male/father families (24 | 34.8%) represent the smallest median family size with 2.42 persons per family.
| Family Type | # Families | Family Size |
| Married-Couple | 34 (49.3%) | 3.09 |
| Single Male/Father | 24 (34.8%) | 2.42 |
| Single Female/Mother | 11 (15.9%) | 3.27 |
| Total Families | 69 (100.0%) | 2.88 |
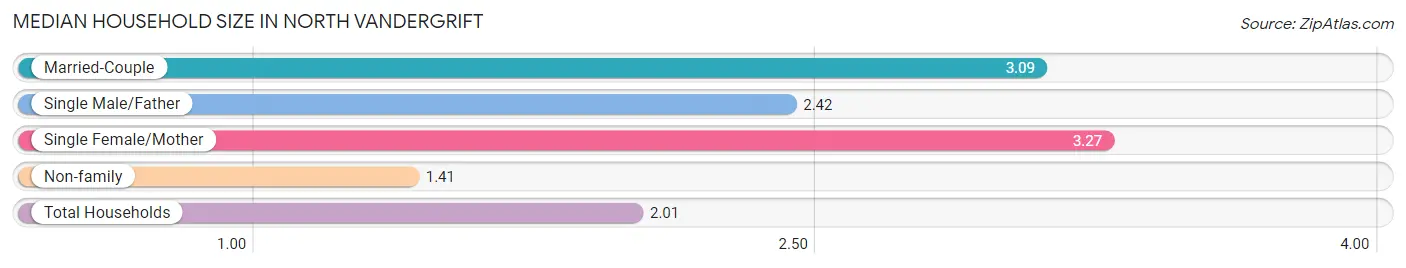
Median Household Size in North Vandergrift
The median household size in North Vandergrift is 2.01 persons per household, with single female/mother households (11 | 6.5%) accounting for the largest median household size of 3.27 persons per household. non-family households (101 | 59.4%) represent the smallest median household size with 1.41 persons per household.
| Household Type | # Households | Household Size |
| Married-Couple | 34 (20.0%) | 3.09 |
| Single Male/Father | 24 (14.1%) | 2.42 |
| Single Female/Mother | 11 (6.5%) | 3.27 |
| Non-family | 101 (59.4%) | 1.41 |
| Total Households | 170 (100.0%) | 2.01 |
Household Size by Marriage Status in North Vandergrift
Out of a total of 170 households in North Vandergrift, 69 (40.6%) are family households, while 101 (59.4%) are nonfamily households. The most numerous type of family households are 2-person households, comprising 30, and the most common type of nonfamily households are 1-person households, comprising 60.
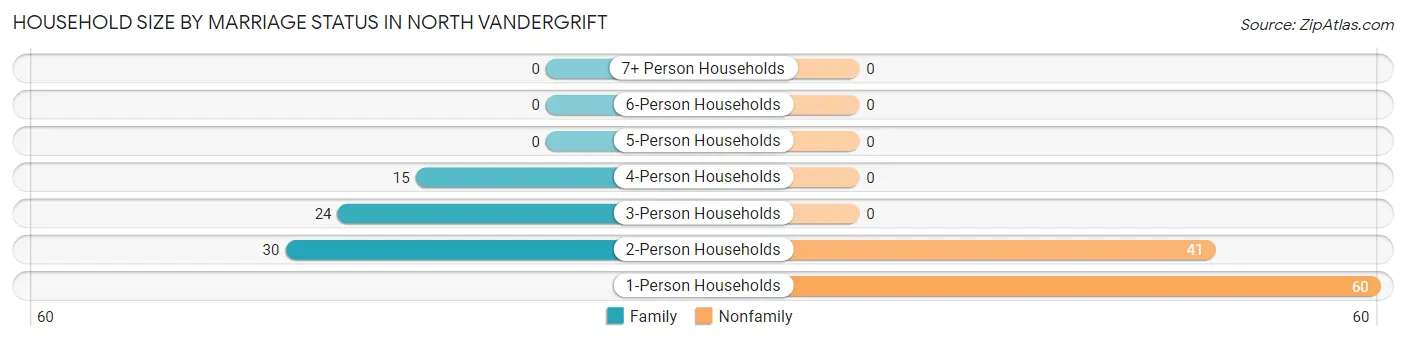
| Household Size | Family Households | Nonfamily Households |
| 1-Person Households | - | 60 (35.3%) |
| 2-Person Households | 30 (17.6%) | 41 (24.1%) |
| 3-Person Households | 24 (14.1%) | 0 (0.0%) |
| 4-Person Households | 15 (8.8%) | 0 (0.0%) |
| 5-Person Households | 0 (0.0%) | 0 (0.0%) |
| 6-Person Households | 0 (0.0%) | 0 (0.0%) |
| 7+ Person Households | 0 (0.0%) | 0 (0.0%) |
| Total | 69 (40.6%) | 101 (59.4%) |
Female Fertility in North Vandergrift
Fertility by Age in North Vandergrift
| Age Bracket | Women with Births | Births / 1,000 Women |
| 15 to 19 years | 0 (0.0%) | 0.0 |
| 20 to 34 years | 0 (0.0%) | 0.0 |
| 35 to 50 years | 0 (0.0%) | 0.0 |
| Total | 0 (0.0%) | 0.0 |
Fertility by Age by Marriage Status in North Vandergrift
| Age Bracket | Married | Unmarried |
| 15 to 19 years | 0 (0.0%) | 0 (0.0%) |
| 20 to 34 years | 0 (0.0%) | 0 (0.0%) |
| 35 to 50 years | 0 (0.0%) | 0 (0.0%) |
| Total | 0 (0.0%) | 0 (0.0%) |
Fertility by Education in North Vandergrift
| Educational Attainment | Women with Births | Births / 1,000 Women |
| Less than High School | 0 (0.0%) | 0.0 |
| High School Diploma | 0 (0.0%) | 0.0 |
| College or Associate's Degree | 0 (0.0%) | 0.0 |
| Bachelor's Degree | 0 (0.0%) | 0.0 |
| Graduate Degree | 0 (0.0%) | 0.0 |
| Total | 0 (0.0%) | 0.0 |
Fertility by Education by Marriage Status in North Vandergrift
| Educational Attainment | Married | Unmarried |
| Less than High School | 0 (0.0%) | 0 (0.0%) |
| High School Diploma | 0 (0.0%) | 0 (0.0%) |
| College or Associate's Degree | 0 (0.0%) | 0 (0.0%) |
| Bachelor's Degree | 0 (0.0%) | 0 (0.0%) |
| Graduate Degree | 0 (0.0%) | 0 (0.0%) |
| Total | 0 (0.0%) | 0 (0.0%) |
Employment Characteristics in North Vandergrift
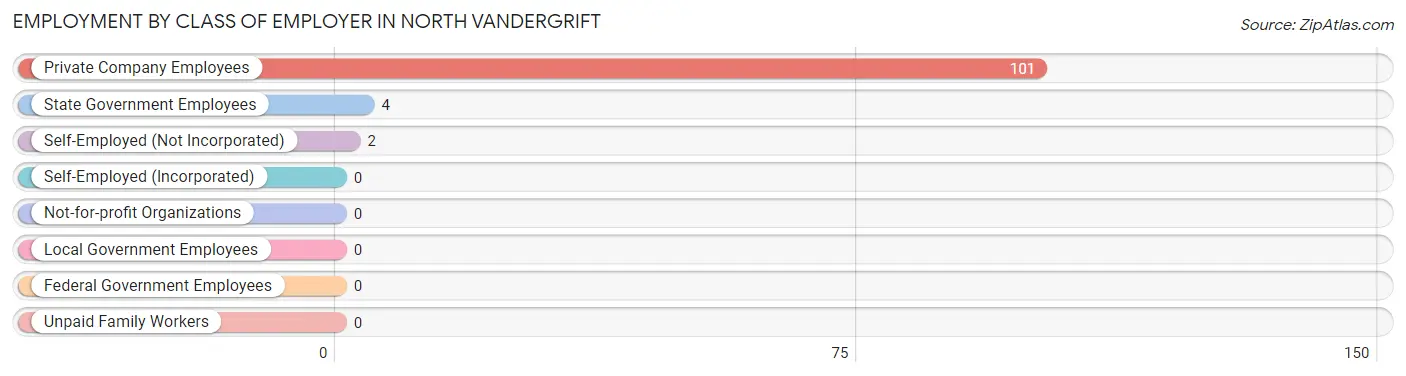
Employment by Class of Employer in North Vandergrift
Among the 107 employed individuals in North Vandergrift, private company employees (101 | 94.4%), state government employees (4 | 3.7%), and self-employed (not incorporated) (2 | 1.9%) make up the most common classes of employment.
| Employer Class | # Employees | % Employees |
| Private Company Employees | 101 | 94.4% |
| Self-Employed (Incorporated) | 0 | 0.0% |
| Self-Employed (Not Incorporated) | 2 | 1.9% |
| Not-for-profit Organizations | 0 | 0.0% |
| Local Government Employees | 0 | 0.0% |
| State Government Employees | 4 | 3.7% |
| Federal Government Employees | 0 | 0.0% |
| Unpaid Family Workers | 0 | 0.0% |
| Total | 107 | 100.0% |
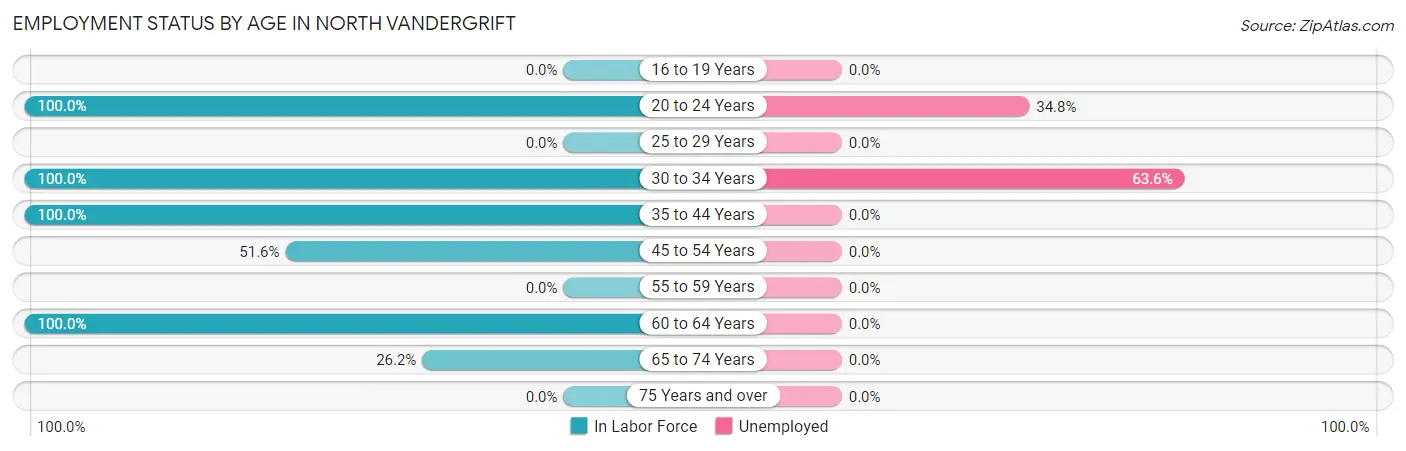
Employment Status by Age in North Vandergrift
According to the labor force statistics for North Vandergrift, out of the total population over 16 years of age (266), 54.1% or 144 individuals are in the labor force, with 25.7% or 37 of them unemployed. The age group with the highest labor force participation rate is 20 to 24 years, with 100.0% or 46 individuals in the labor force. Within the labor force, the 30 to 34 years age range has the highest percentage of unemployed individuals, with 63.6% or 21 of them being unemployed.
| Age Bracket | In Labor Force | Unemployed |
| 16 to 19 Years | 0 (0.0%) | 0 (0.0%) |
| 20 to 24 Years | 46 (100.0%) | 16 (34.8%) |
| 25 to 29 Years | 0 (0.0%) | 0 (0.0%) |
| 30 to 34 Years | 33 (100.0%) | 21 (63.6%) |
| 35 to 44 Years | 14 (100.0%) | 0 (0.0%) |
| 45 to 54 Years | 16 (51.6%) | 0 (0.0%) |
| 55 to 59 Years | 0 (0.0%) | 0 (0.0%) |
| 60 to 64 Years | 24 (100.0%) | 0 (0.0%) |
| 65 to 74 Years | 11 (26.2%) | 0 (0.0%) |
| 75 Years and over | 0 (0.0%) | 0 (0.0%) |
| Total | 144 (54.1%) | 37 (25.7%) |
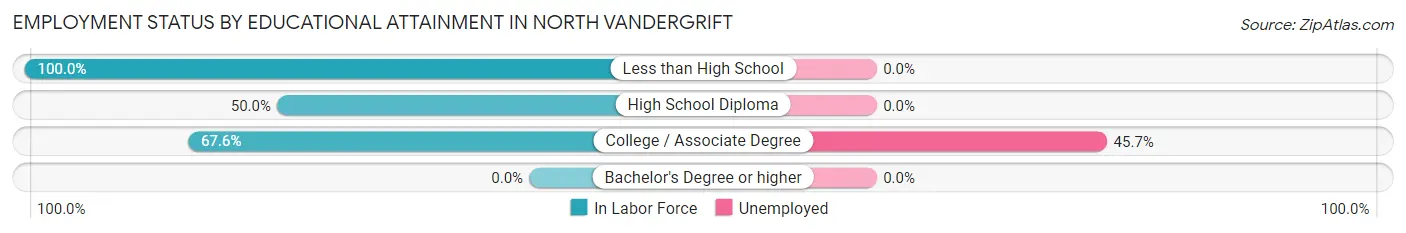
Employment Status by Educational Attainment in North Vandergrift
According to labor force statistics for North Vandergrift, 60.4% of individuals (87) out of the total population between 25 and 64 years of age (144) are in the labor force, with 24.1% or 21 of them being unemployed. The group with the highest labor force participation rate are those with the educational attainment of less than high school, with 100.0% or 6 individuals in the labor force. Within the labor force, individuals with college / associate degree education have the highest percentage of unemployment, with 45.7% or 21 of them being unemployed.
| Educational Attainment | In Labor Force | Unemployed |
| Less than High School | 6 (100.0%) | 0 (0.0%) |
| High School Diploma | 35 (50.0%) | 0 (0.0%) |
| College / Associate Degree | 46 (67.6%) | 31 (45.7%) |
| Bachelor's Degree or higher | 0 (0.0%) | 0 (0.0%) |
| Total | 87 (60.4%) | 35 (24.1%) |
Employment Occupations by Sex in North Vandergrift
Management, Business, Science and Arts Occupations
The most common Management, Business, Science and Arts occupations in North Vandergrift are , and Health Diagnosing & Treating (10 | 9.3%).
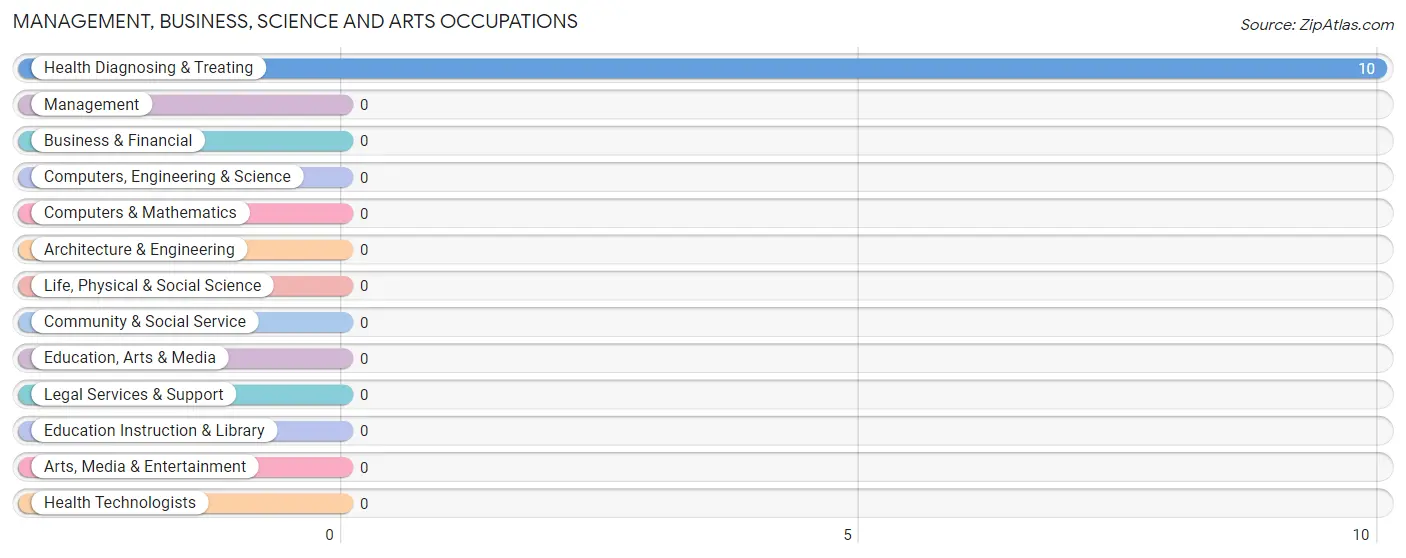
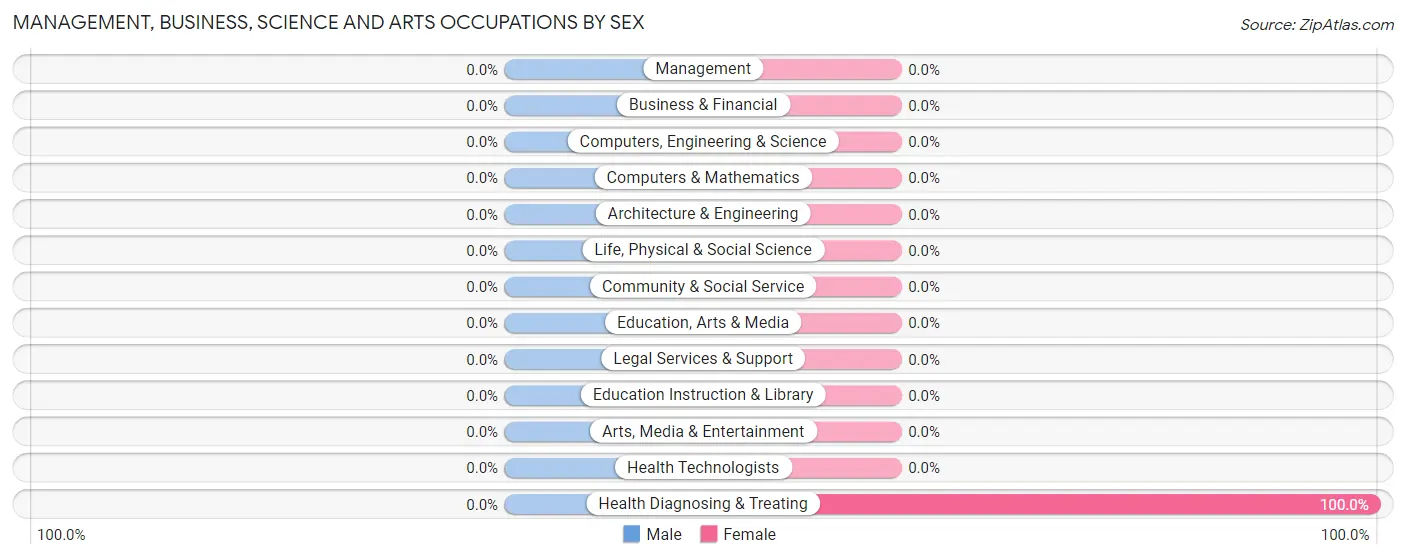
Management, Business, Science and Arts Occupations by Sex
| Occupation | Male | Female |
| Management | 0 (0.0%) | 0 (0.0%) |
| Business & Financial | 0 (0.0%) | 0 (0.0%) |
| Computers, Engineering & Science | 0 (0.0%) | 0 (0.0%) |
| Computers & Mathematics | 0 (0.0%) | 0 (0.0%) |
| Architecture & Engineering | 0 (0.0%) | 0 (0.0%) |
| Life, Physical & Social Science | 0 (0.0%) | 0 (0.0%) |
| Community & Social Service | 0 (0.0%) | 0 (0.0%) |
| Education, Arts & Media | 0 (0.0%) | 0 (0.0%) |
| Legal Services & Support | 0 (0.0%) | 0 (0.0%) |
| Education Instruction & Library | 0 (0.0%) | 0 (0.0%) |
| Arts, Media & Entertainment | 0 (0.0%) | 0 (0.0%) |
| Health Diagnosing & Treating | 0 (0.0%) | 10 (100.0%) |
| Health Technologists | 0 (0.0%) | 0 (0.0%) |
| Total (Category) | 0 (0.0%) | 10 (100.0%) |
| Total (Overall) | 71 (66.4%) | 36 (33.6%) |
Services Occupations
The most common Services occupations in North Vandergrift are Healthcare Support (4 | 3.7%), and Food Preparation & Serving (2 | 1.9%).
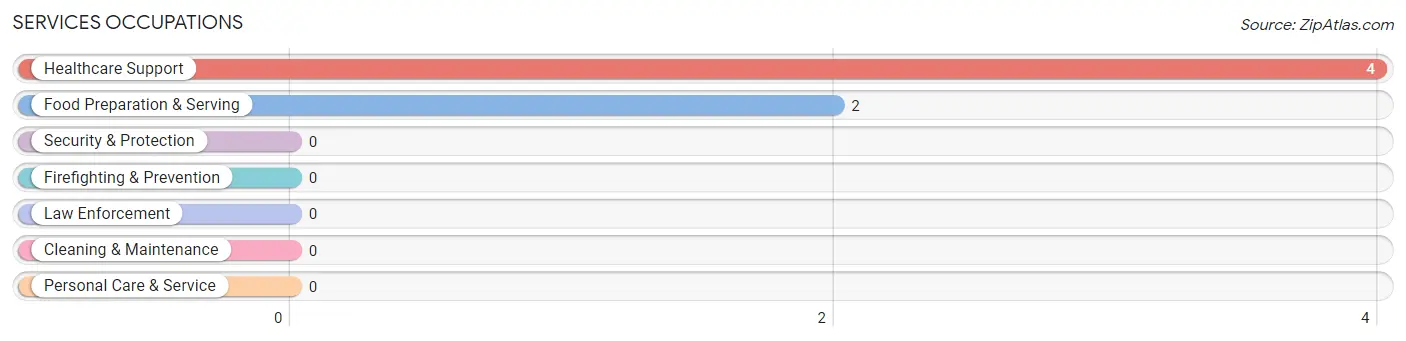
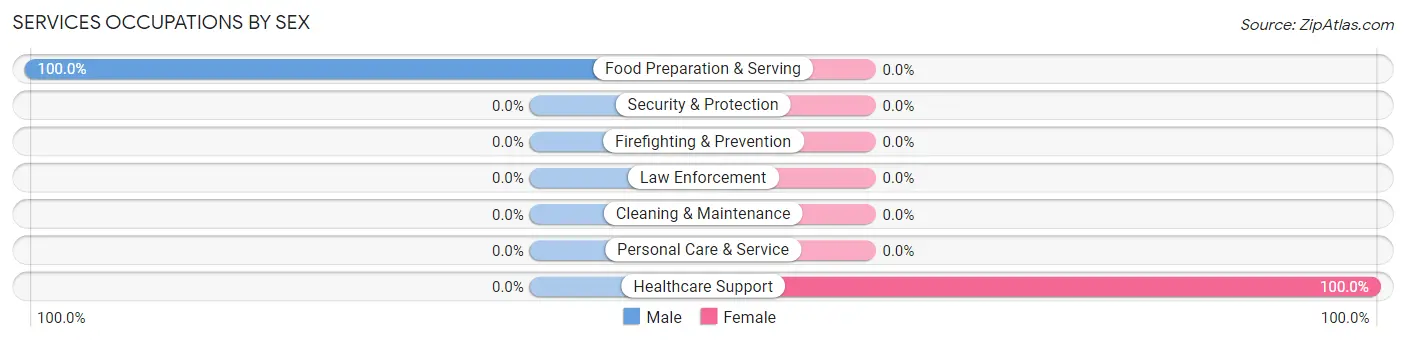
Services Occupations by Sex
| Occupation | Male | Female |
| Healthcare Support | 0 (0.0%) | 4 (100.0%) |
| Security & Protection | 0 (0.0%) | 0 (0.0%) |
| Firefighting & Prevention | 0 (0.0%) | 0 (0.0%) |
| Law Enforcement | 0 (0.0%) | 0 (0.0%) |
| Food Preparation & Serving | 2 (100.0%) | 0 (0.0%) |
| Cleaning & Maintenance | 0 (0.0%) | 0 (0.0%) |
| Personal Care & Service | 0 (0.0%) | 0 (0.0%) |
| Total (Category) | 2 (33.3%) | 4 (66.7%) |
| Total (Overall) | 71 (66.4%) | 36 (33.6%) |
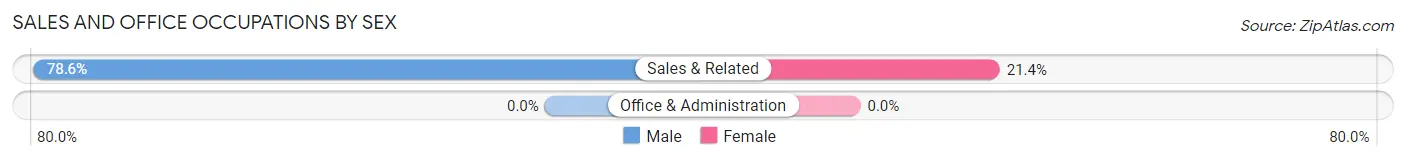
Sales and Office Occupations
The most common Sales and Office occupations in North Vandergrift are , and Sales & Related (14 | 13.1%).
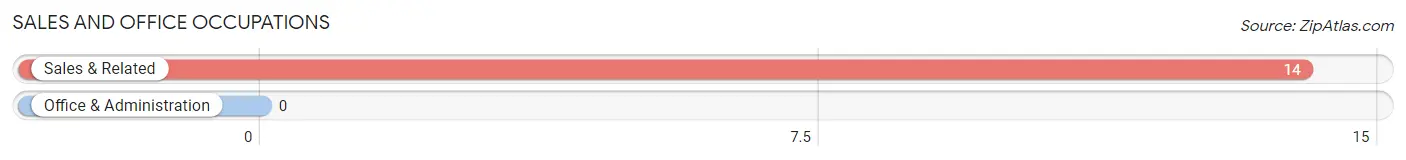
Sales and Office Occupations by Sex
| Occupation | Male | Female |
| Sales & Related | 11 (78.6%) | 3 (21.4%) |
| Office & Administration | 0 (0.0%) | 0 (0.0%) |
| Total (Category) | 11 (78.6%) | 3 (21.4%) |
| Total (Overall) | 71 (66.4%) | 36 (33.6%) |
Natural Resources, Construction and Maintenance Occupations
The most common Natural Resources, Construction and Maintenance occupations in North Vandergrift are , and Construction & Extraction (13 | 12.1%).
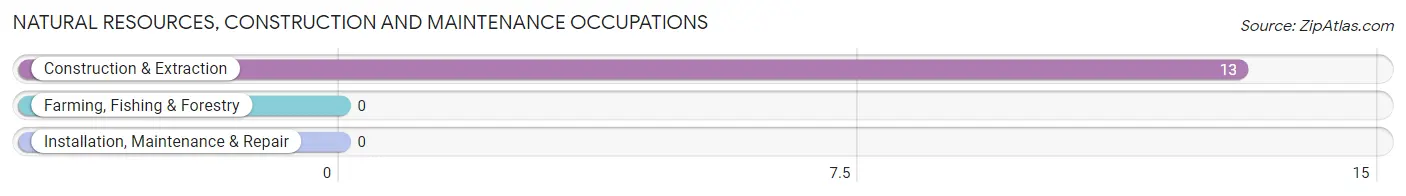
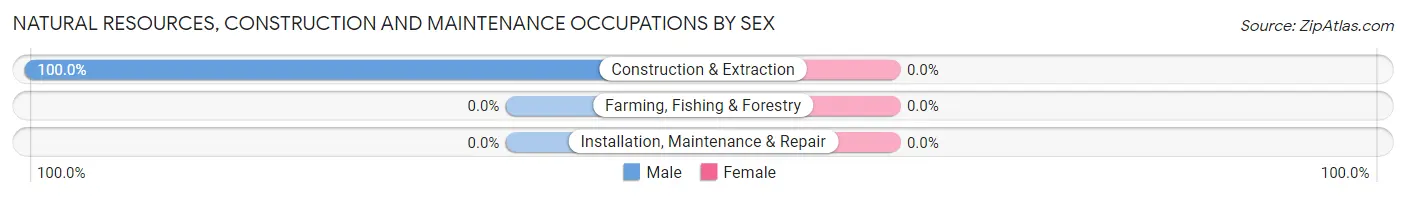
Natural Resources, Construction and Maintenance Occupations by Sex
| Occupation | Male | Female |
| Farming, Fishing & Forestry | 0 (0.0%) | 0 (0.0%) |
| Construction & Extraction | 13 (100.0%) | 0 (0.0%) |
| Installation, Maintenance & Repair | 0 (0.0%) | 0 (0.0%) |
| Total (Category) | 13 (100.0%) | 0 (0.0%) |
| Total (Overall) | 71 (66.4%) | 36 (33.6%) |
Production, Transportation and Moving Occupations
The most common Production, Transportation and Moving occupations in North Vandergrift are Production (53 | 49.5%), and Material Moving (11 | 10.3%).
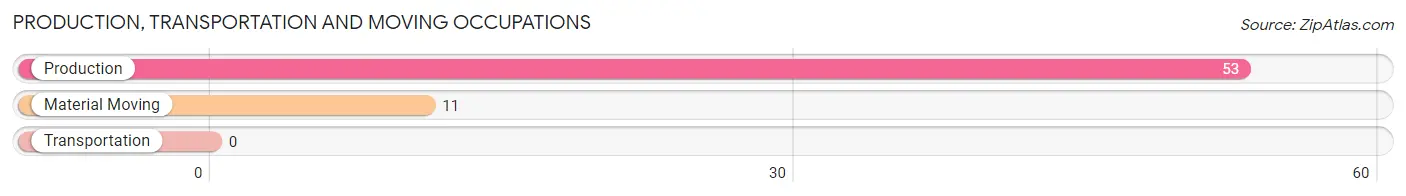
Production, Transportation and Moving Occupations by Sex
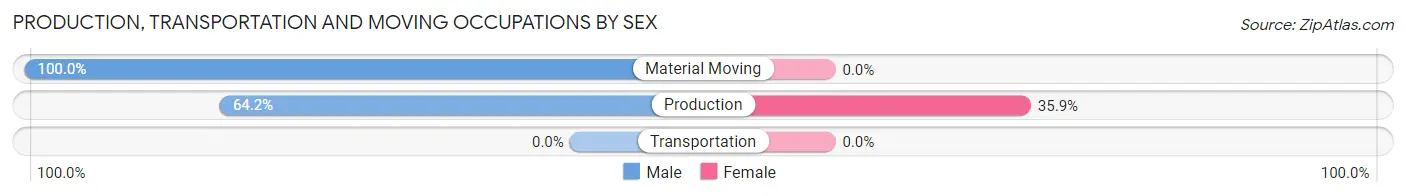
| Occupation | Male | Female |
| Production | 34 (64.1%) | 19 (35.8%) |
| Transportation | 0 (0.0%) | 0 (0.0%) |
| Material Moving | 11 (100.0%) | 0 (0.0%) |
| Total (Category) | 45 (70.3%) | 19 (29.7%) |
| Total (Overall) | 71 (66.4%) | 36 (33.6%) |
Employment Industries by Sex in North Vandergrift
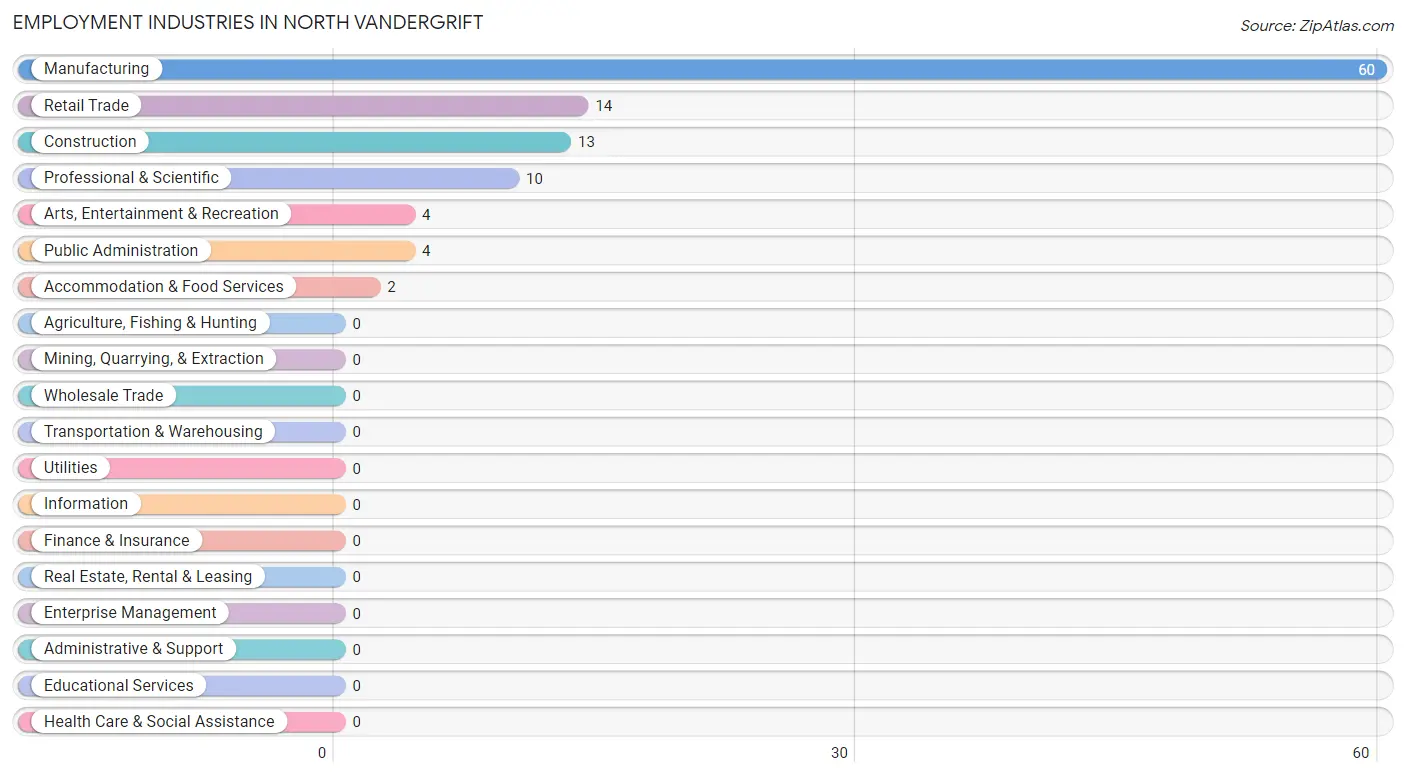
Employment Industries in North Vandergrift
The major employment industries in North Vandergrift include Manufacturing (60 | 56.1%), Retail Trade (14 | 13.1%), Construction (13 | 12.1%), Professional & Scientific (10 | 9.3%), and Arts, Entertainment & Recreation (4 | 3.7%).
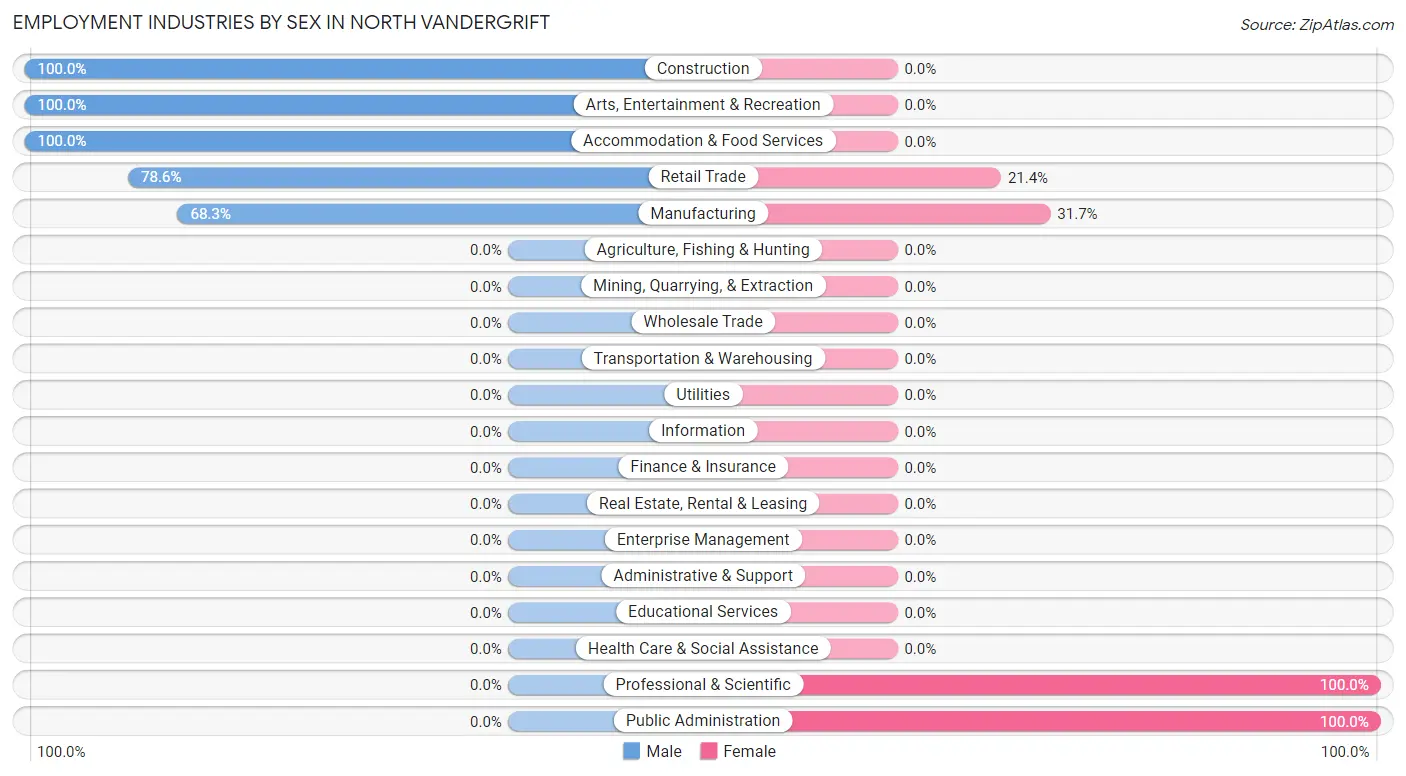
Employment Industries by Sex in North Vandergrift
The North Vandergrift industries that see more men than women are Construction (100.0%), Arts, Entertainment & Recreation (100.0%), and Accommodation & Food Services (100.0%), whereas the industries that tend to have a higher number of women are Professional & Scientific (100.0%), Public Administration (100.0%), and Manufacturing (31.7%).
| Industry | Male | Female |
| Agriculture, Fishing & Hunting | 0 (0.0%) | 0 (0.0%) |
| Mining, Quarrying, & Extraction | 0 (0.0%) | 0 (0.0%) |
| Construction | 13 (100.0%) | 0 (0.0%) |
| Manufacturing | 41 (68.3%) | 19 (31.7%) |
| Wholesale Trade | 0 (0.0%) | 0 (0.0%) |
| Retail Trade | 11 (78.6%) | 3 (21.4%) |
| Transportation & Warehousing | 0 (0.0%) | 0 (0.0%) |
| Utilities | 0 (0.0%) | 0 (0.0%) |
| Information | 0 (0.0%) | 0 (0.0%) |
| Finance & Insurance | 0 (0.0%) | 0 (0.0%) |
| Real Estate, Rental & Leasing | 0 (0.0%) | 0 (0.0%) |
| Professional & Scientific | 0 (0.0%) | 10 (100.0%) |
| Enterprise Management | 0 (0.0%) | 0 (0.0%) |
| Administrative & Support | 0 (0.0%) | 0 (0.0%) |
| Educational Services | 0 (0.0%) | 0 (0.0%) |
| Health Care & Social Assistance | 0 (0.0%) | 0 (0.0%) |
| Arts, Entertainment & Recreation | 4 (100.0%) | 0 (0.0%) |
| Accommodation & Food Services | 2 (100.0%) | 0 (0.0%) |
| Public Administration | 0 (0.0%) | 4 (100.0%) |
| Total | 71 (66.4%) | 36 (33.6%) |
Education in North Vandergrift
School Enrollment in North Vandergrift
The most common levels of schooling among the 62 students in North Vandergrift are kindergarten (21 | 33.9%), nursery / preschool (18 | 29.0%), and middle school (13 | 21.0%).
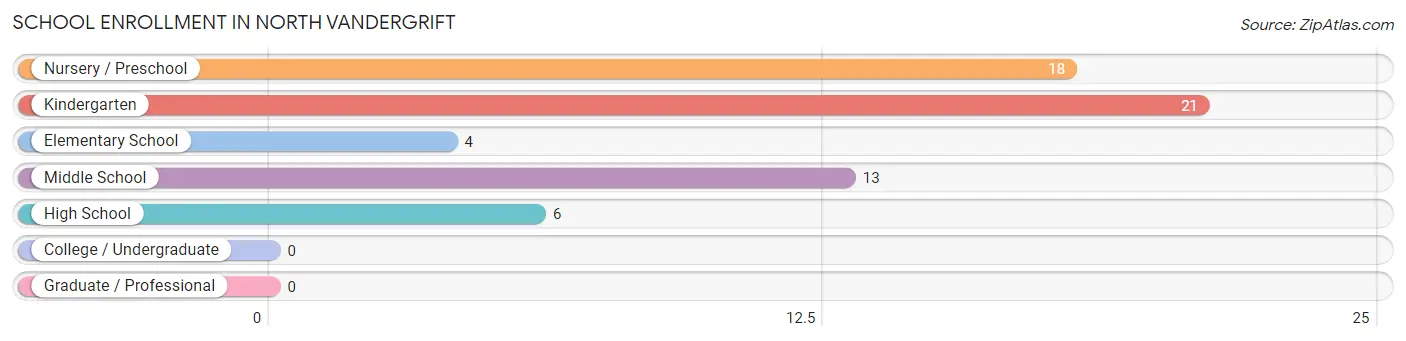
| School Level | # Students | % Students |
| Nursery / Preschool | 18 | 29.0% |
| Kindergarten | 21 | 33.9% |
| Elementary School | 4 | 6.5% |
| Middle School | 13 | 21.0% |
| High School | 6 | 9.7% |
| College / Undergraduate | 0 | 0.0% |
| Graduate / Professional | 0 | 0.0% |
| Total | 62 | 100.0% |
School Enrollment by Age by Funding Source in North Vandergrift
Out of a total of 62 students who are enrolled in schools in North Vandergrift, 24 (38.7%) attend a private institution, while the remaining 38 (61.3%) are enrolled in public schools. The age group of 25 to 34 year olds has the highest likelihood of being enrolled in private schools, with 6 (100.0% in the age bracket) enrolled. Conversely, the age group of 10 to 14 year olds has the lowest likelihood of being enrolled in a private school, with 13 (100.0% in the age bracket) attending a public institution.
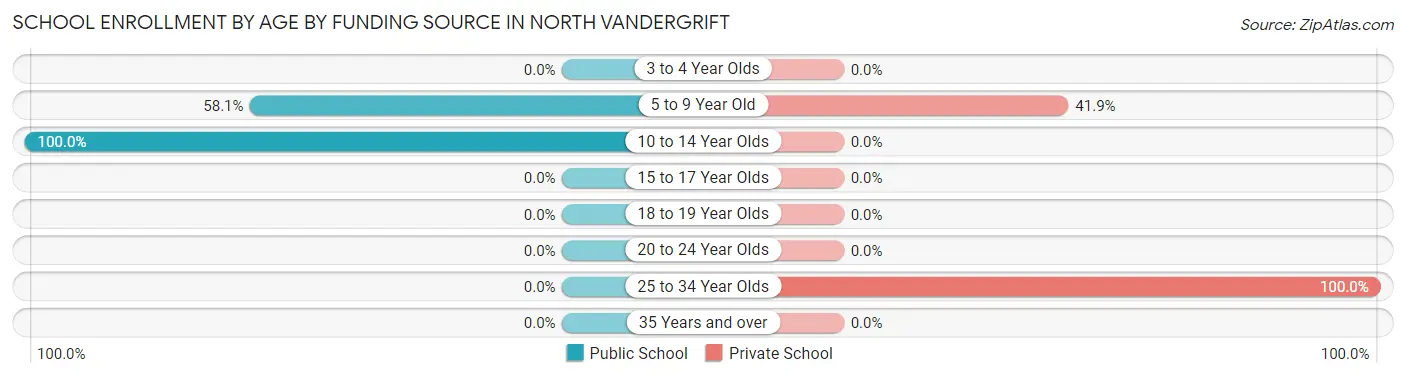
| Age Bracket | Public School | Private School |
| 3 to 4 Year Olds | 0 (0.0%) | 0 (0.0%) |
| 5 to 9 Year Old | 25 (58.1%) | 18 (41.9%) |
| 10 to 14 Year Olds | 13 (100.0%) | 0 (0.0%) |
| 15 to 17 Year Olds | 0 (0.0%) | 0 (0.0%) |
| 18 to 19 Year Olds | 0 (0.0%) | 0 (0.0%) |
| 20 to 24 Year Olds | 0 (0.0%) | 0 (0.0%) |
| 25 to 34 Year Olds | 0 (0.0%) | 6 (100.0%) |
| 35 Years and over | 0 (0.0%) | 0 (0.0%) |
| Total | 38 (61.3%) | 24 (38.7%) |
Educational Attainment by Field of Study in North Vandergrift
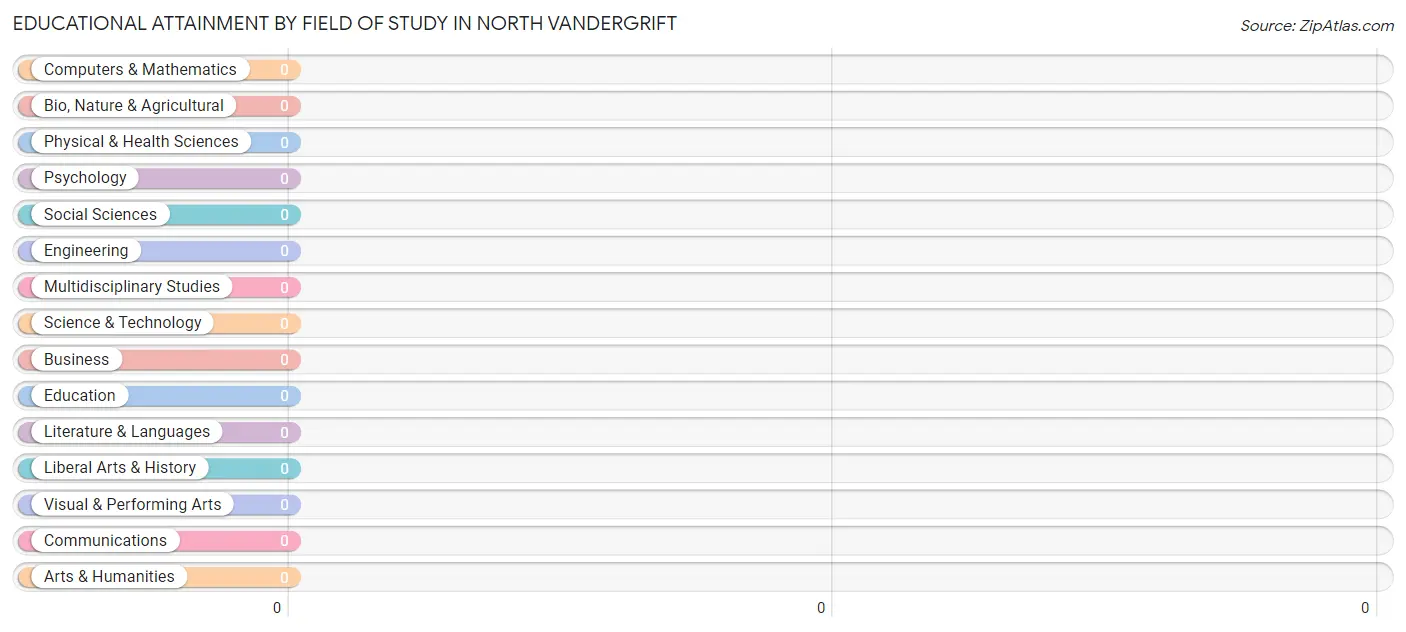
| Field of Study | # Graduates | % Graduates |
| Computers & Mathematics | 0 | 0.0% |
| Bio, Nature & Agricultural | 0 | 0.0% |
| Physical & Health Sciences | 0 | 0.0% |
| Psychology | 0 | 0.0% |
| Social Sciences | 0 | 0.0% |
| Engineering | 0 | 0.0% |
| Multidisciplinary Studies | 0 | 0.0% |
| Science & Technology | 0 | 0.0% |
| Business | 0 | 0.0% |
| Education | 0 | 0.0% |
| Literature & Languages | 0 | 0.0% |
| Liberal Arts & History | 0 | 0.0% |
| Visual & Performing Arts | 0 | 0.0% |
| Communications | 0 | 0.0% |
| Arts & Humanities | 0 | 0.0% |
| Total | 0 | 0.0% |
Transportation & Commute in North Vandergrift
Vehicle Availability by Sex in North Vandergrift
The most prevalent vehicle ownership categories in North Vandergrift are males with 2 vehicles (31, accounting for 43.7%) and females with 2 vehicles (23, making up 86.1%).
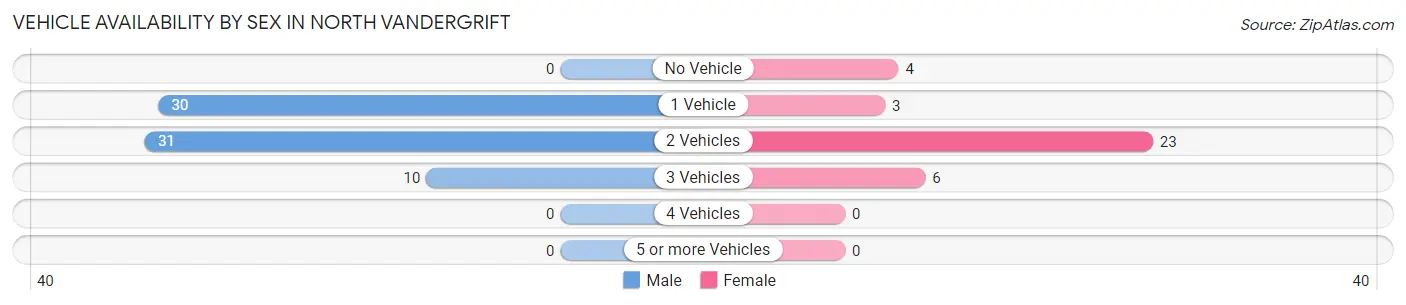
| Vehicles Available | Male | Female |
| No Vehicle | 0 (0.0%) | 4 (11.1%) |
| 1 Vehicle | 30 (42.2%) | 3 (8.3%) |
| 2 Vehicles | 31 (43.7%) | 23 (63.9%) |
| 3 Vehicles | 10 (14.1%) | 6 (16.7%) |
| 4 Vehicles | 0 (0.0%) | 0 (0.0%) |
| 5 or more Vehicles | 0 (0.0%) | 0 (0.0%) |
| Total | 71 (100.0%) | 36 (100.0%) |
Commute Time in North Vandergrift
The most frequently occuring commute durations in North Vandergrift are 20 to 24 minutes (27 commuters, 25.2%), 60 to 89 minutes (24 commuters, 22.4%), and 30 to 34 minutes (17 commuters, 15.9%).
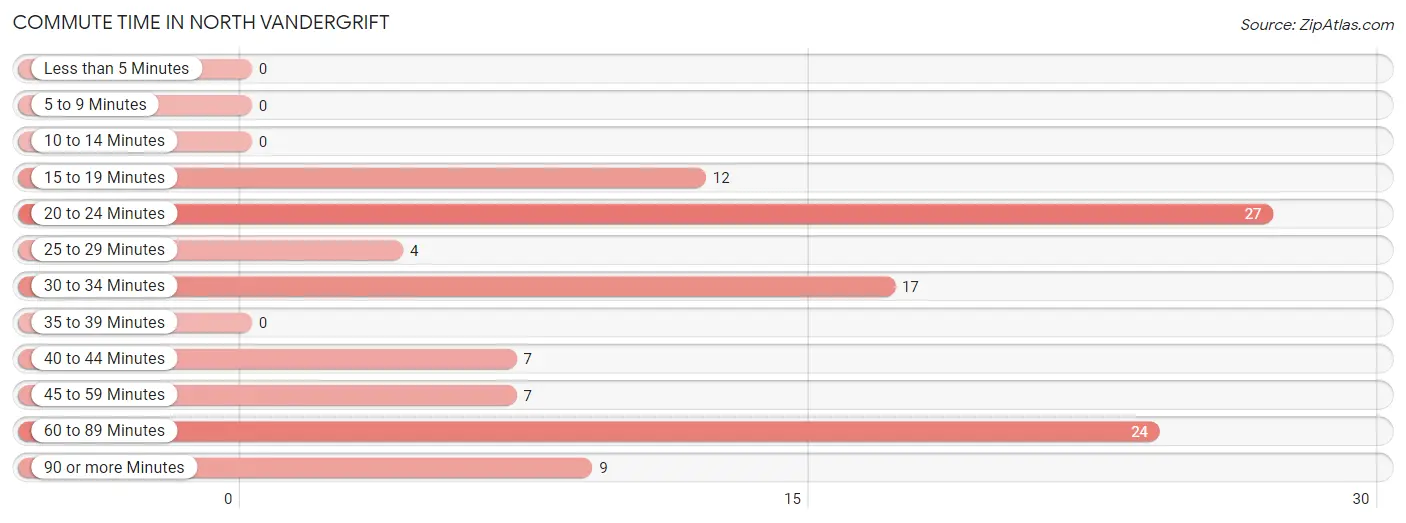
| Commute Time | # Commuters | % Commuters |
| Less than 5 Minutes | 0 | 0.0% |
| 5 to 9 Minutes | 0 | 0.0% |
| 10 to 14 Minutes | 0 | 0.0% |
| 15 to 19 Minutes | 12 | 11.2% |
| 20 to 24 Minutes | 27 | 25.2% |
| 25 to 29 Minutes | 4 | 3.7% |
| 30 to 34 Minutes | 17 | 15.9% |
| 35 to 39 Minutes | 0 | 0.0% |
| 40 to 44 Minutes | 7 | 6.5% |
| 45 to 59 Minutes | 7 | 6.5% |
| 60 to 89 Minutes | 24 | 22.4% |
| 90 or more Minutes | 9 | 8.4% |
Commute Time by Sex in North Vandergrift
The most common commute times in North Vandergrift are 60 to 89 minutes (24 commuters, 33.8%) for males and 20 to 24 minutes (13 commuters, 36.1%) for females.
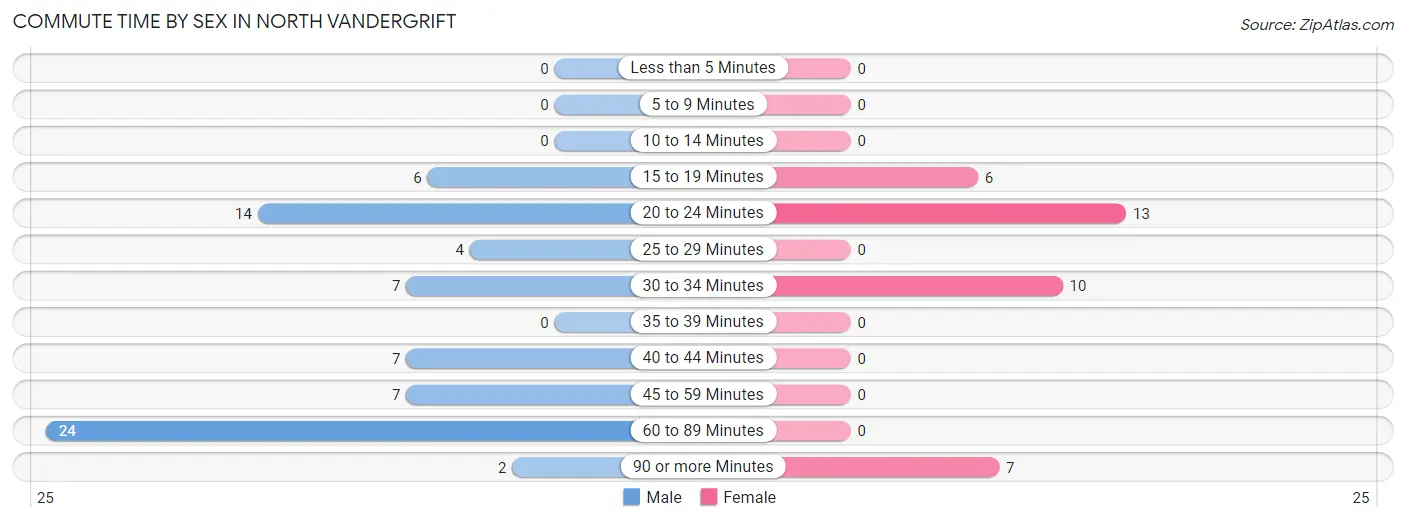
| Commute Time | Male | Female |
| Less than 5 Minutes | 0 (0.0%) | 0 (0.0%) |
| 5 to 9 Minutes | 0 (0.0%) | 0 (0.0%) |
| 10 to 14 Minutes | 0 (0.0%) | 0 (0.0%) |
| 15 to 19 Minutes | 6 (8.5%) | 6 (16.7%) |
| 20 to 24 Minutes | 14 (19.7%) | 13 (36.1%) |
| 25 to 29 Minutes | 4 (5.6%) | 0 (0.0%) |
| 30 to 34 Minutes | 7 (9.9%) | 10 (27.8%) |
| 35 to 39 Minutes | 0 (0.0%) | 0 (0.0%) |
| 40 to 44 Minutes | 7 (9.9%) | 0 (0.0%) |
| 45 to 59 Minutes | 7 (9.9%) | 0 (0.0%) |
| 60 to 89 Minutes | 24 (33.8%) | 0 (0.0%) |
| 90 or more Minutes | 2 (2.8%) | 7 (19.4%) |
Time of Departure to Work by Sex in North Vandergrift
The most frequent times of departure to work in North Vandergrift are 12:00 PM to 3:59 PM (16, 22.5%) for males and 12:00 AM to 4:59 AM (13, 36.1%) for females.
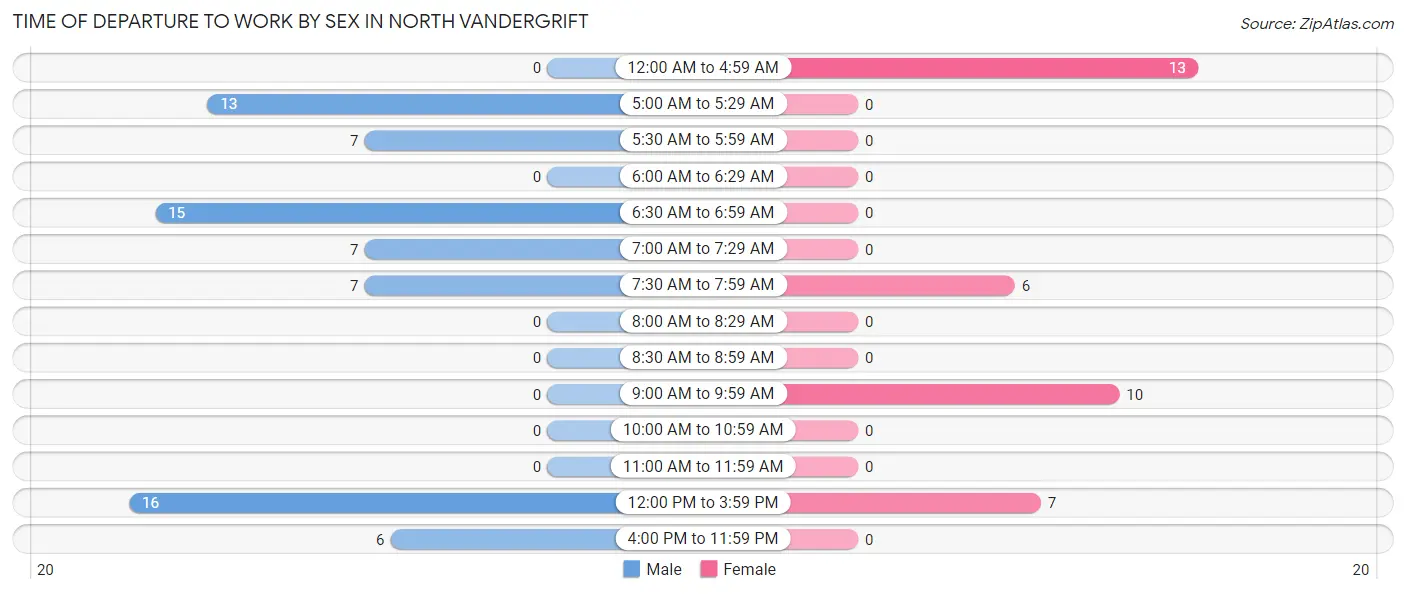
| Time of Departure | Male | Female |
| 12:00 AM to 4:59 AM | 0 (0.0%) | 13 (36.1%) |
| 5:00 AM to 5:29 AM | 13 (18.3%) | 0 (0.0%) |
| 5:30 AM to 5:59 AM | 7 (9.9%) | 0 (0.0%) |
| 6:00 AM to 6:29 AM | 0 (0.0%) | 0 (0.0%) |
| 6:30 AM to 6:59 AM | 15 (21.1%) | 0 (0.0%) |
| 7:00 AM to 7:29 AM | 7 (9.9%) | 0 (0.0%) |
| 7:30 AM to 7:59 AM | 7 (9.9%) | 6 (16.7%) |
| 8:00 AM to 8:29 AM | 0 (0.0%) | 0 (0.0%) |
| 8:30 AM to 8:59 AM | 0 (0.0%) | 0 (0.0%) |
| 9:00 AM to 9:59 AM | 0 (0.0%) | 10 (27.8%) |
| 10:00 AM to 10:59 AM | 0 (0.0%) | 0 (0.0%) |
| 11:00 AM to 11:59 AM | 0 (0.0%) | 0 (0.0%) |
| 12:00 PM to 3:59 PM | 16 (22.5%) | 7 (19.4%) |
| 4:00 PM to 11:59 PM | 6 (8.5%) | 0 (0.0%) |
| Total | 71 (100.0%) | 36 (100.0%) |
Housing Occupancy in North Vandergrift
Occupancy by Ownership in North Vandergrift
Of the total 170 dwellings in North Vandergrift, owner-occupied units account for 87 (51.2%), while renter-occupied units make up 83 (48.8%).
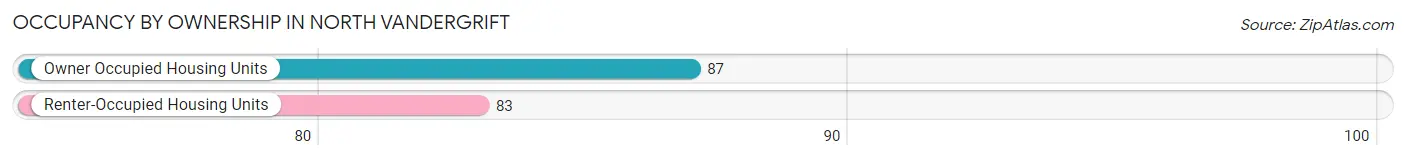
| Occupancy | # Housing Units | % Housing Units |
| Owner Occupied Housing Units | 87 | 51.2% |
| Renter-Occupied Housing Units | 83 | 48.8% |
| Total Occupied Housing Units | 170 | 100.0% |
Occupancy by Household Size in North Vandergrift
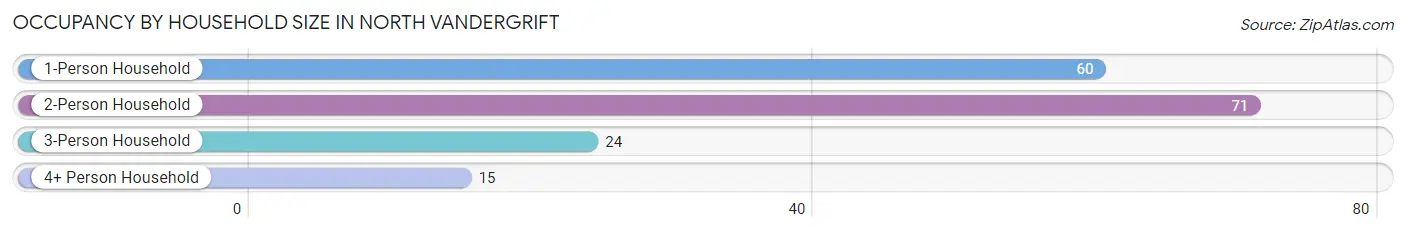
| Household Size | # Housing Units | % Housing Units |
| 1-Person Household | 60 | 35.3% |
| 2-Person Household | 71 | 41.8% |
| 3-Person Household | 24 | 14.1% |
| 4+ Person Household | 15 | 8.8% |
| Total Housing Units | 170 | 100.0% |
Occupancy by Ownership by Household Size in North Vandergrift
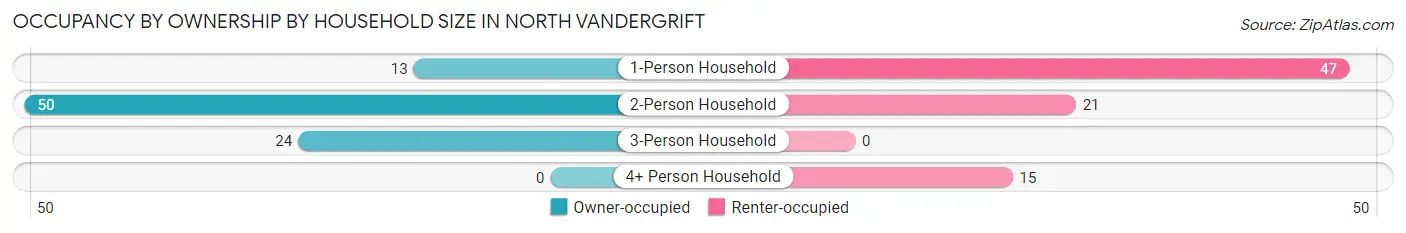
| Household Size | Owner-occupied | Renter-occupied |
| 1-Person Household | 13 (21.7%) | 47 (78.3%) |
| 2-Person Household | 50 (70.4%) | 21 (29.6%) |
| 3-Person Household | 24 (100.0%) | 0 (0.0%) |
| 4+ Person Household | 0 (0.0%) | 15 (100.0%) |
| Total Housing Units | 87 (51.2%) | 83 (48.8%) |
Occupancy by Educational Attainment in North Vandergrift
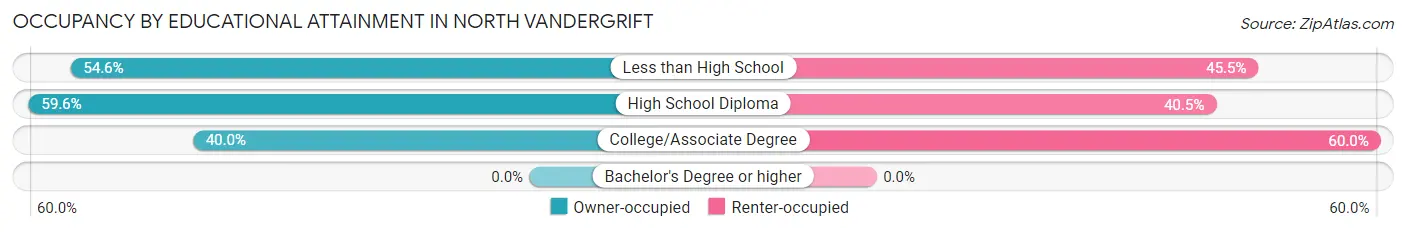
| Household Size | Owner-occupied | Renter-occupied |
| Less than High School | 6 (54.5%) | 5 (45.5%) |
| High School Diploma | 53 (59.6%) | 36 (40.5%) |
| College/Associate Degree | 28 (40.0%) | 42 (60.0%) |
| Bachelor's Degree or higher | 0 (0.0%) | 0 (0.0%) |
Occupancy by Age of Householder in North Vandergrift
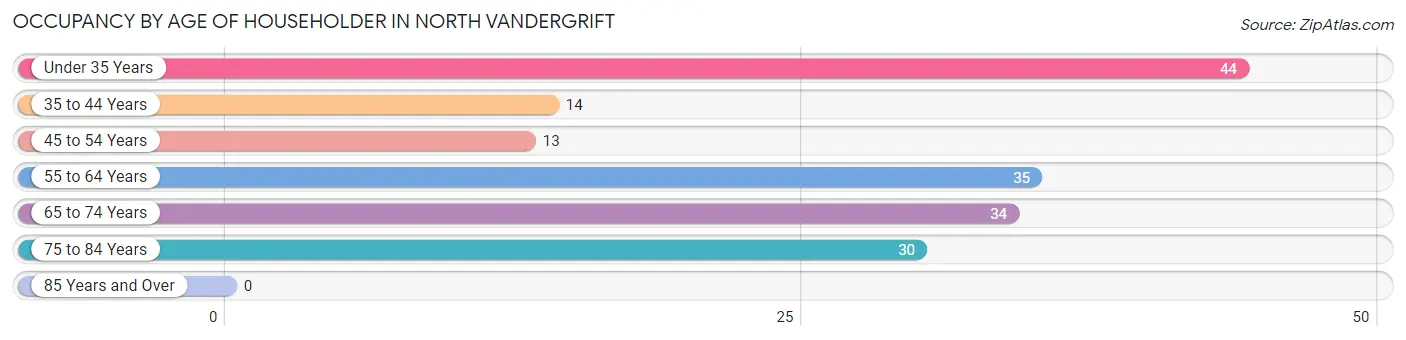
| Age Bracket | # Households | % Households |
| Under 35 Years | 44 | 25.9% |
| 35 to 44 Years | 14 | 8.2% |
| 45 to 54 Years | 13 | 7.6% |
| 55 to 64 Years | 35 | 20.6% |
| 65 to 74 Years | 34 | 20.0% |
| 75 to 84 Years | 30 | 17.6% |
| 85 Years and Over | 0 | 0.0% |
| Total | 170 | 100.0% |
Housing Finances in North Vandergrift
Median Income by Occupancy in North Vandergrift
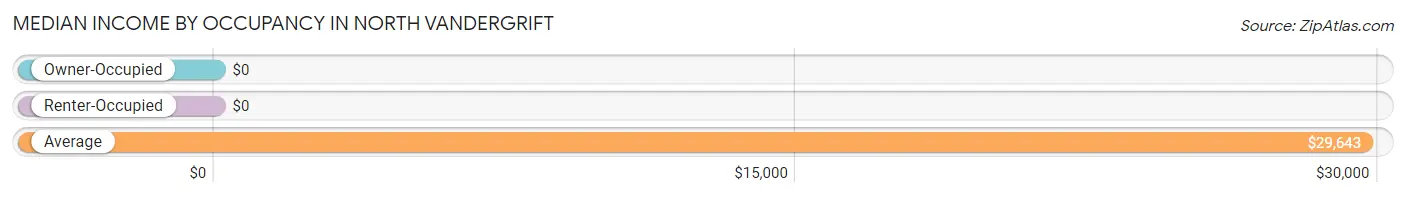
| Occupancy Type | # Households | Median Income |
| Owner-Occupied | 87 (51.2%) | $0 |
| Renter-Occupied | 83 (48.8%) | $0 |
| Average | 170 (100.0%) | $29,643 |
Occupancy by Householder Income Bracket in North Vandergrift
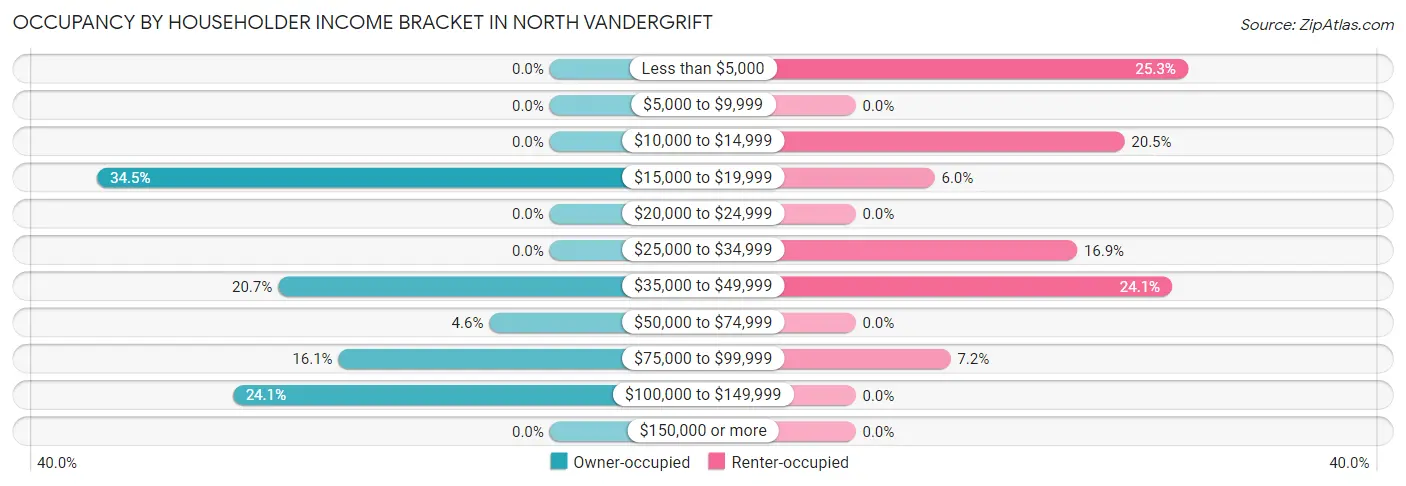
| Income Bracket | Owner-occupied | Renter-occupied |
| Less than $5,000 | 0 (0.0%) | 21 (25.3%) |
| $5,000 to $9,999 | 0 (0.0%) | 0 (0.0%) |
| $10,000 to $14,999 | 0 (0.0%) | 17 (20.5%) |
| $15,000 to $19,999 | 30 (34.5%) | 5 (6.0%) |
| $20,000 to $24,999 | 0 (0.0%) | 0 (0.0%) |
| $25,000 to $34,999 | 0 (0.0%) | 14 (16.9%) |
| $35,000 to $49,999 | 18 (20.7%) | 20 (24.1%) |
| $50,000 to $74,999 | 4 (4.6%) | 0 (0.0%) |
| $75,000 to $99,999 | 14 (16.1%) | 6 (7.2%) |
| $100,000 to $149,999 | 21 (24.1%) | 0 (0.0%) |
| $150,000 or more | 0 (0.0%) | 0 (0.0%) |
| Total | 87 (100.0%) | 83 (100.0%) |
Monthly Housing Cost Tiers in North Vandergrift
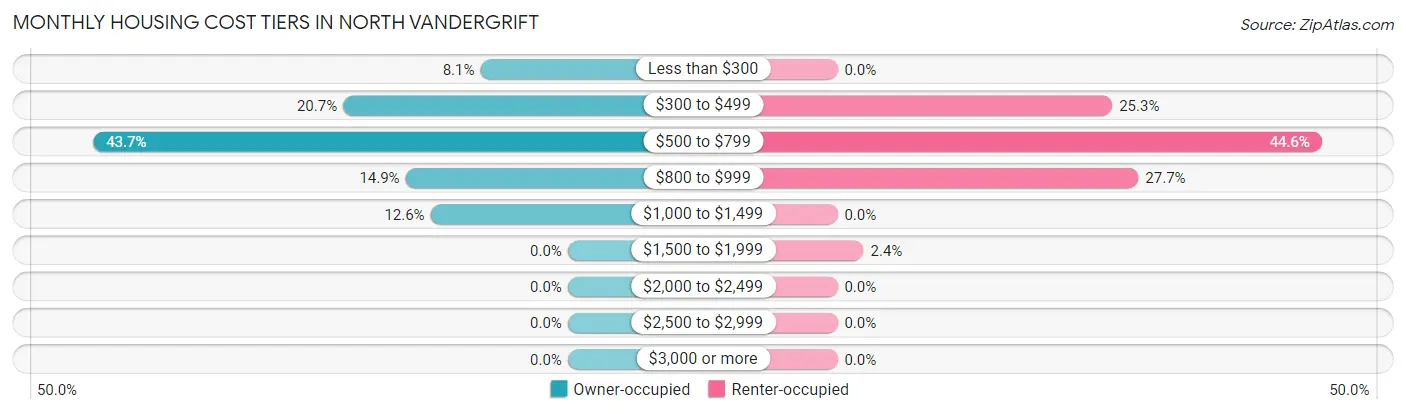
| Monthly Cost | Owner-occupied | Renter-occupied |
| Less than $300 | 7 (8.1%) | 0 (0.0%) |
| $300 to $499 | 18 (20.7%) | 21 (25.3%) |
| $500 to $799 | 38 (43.7%) | 37 (44.6%) |
| $800 to $999 | 13 (14.9%) | 23 (27.7%) |
| $1,000 to $1,499 | 11 (12.6%) | 0 (0.0%) |
| $1,500 to $1,999 | 0 (0.0%) | 2 (2.4%) |
| $2,000 to $2,499 | 0 (0.0%) | 0 (0.0%) |
| $2,500 to $2,999 | 0 (0.0%) | 0 (0.0%) |
| $3,000 or more | 0 (0.0%) | 0 (0.0%) |
| Total | 87 (100.0%) | 83 (100.0%) |
Physical Housing Characteristics in North Vandergrift
Housing Structures in North Vandergrift
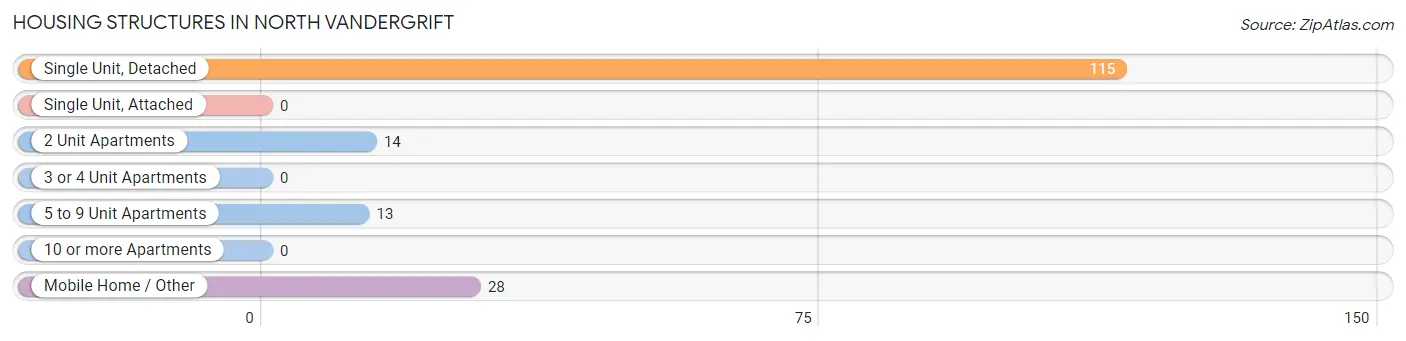
| Structure Type | # Housing Units | % Housing Units |
| Single Unit, Detached | 115 | 67.6% |
| Single Unit, Attached | 0 | 0.0% |
| 2 Unit Apartments | 14 | 8.2% |
| 3 or 4 Unit Apartments | 0 | 0.0% |
| 5 to 9 Unit Apartments | 13 | 7.6% |
| 10 or more Apartments | 0 | 0.0% |
| Mobile Home / Other | 28 | 16.5% |
| Total | 170 | 100.0% |
Housing Structures by Occupancy in North Vandergrift
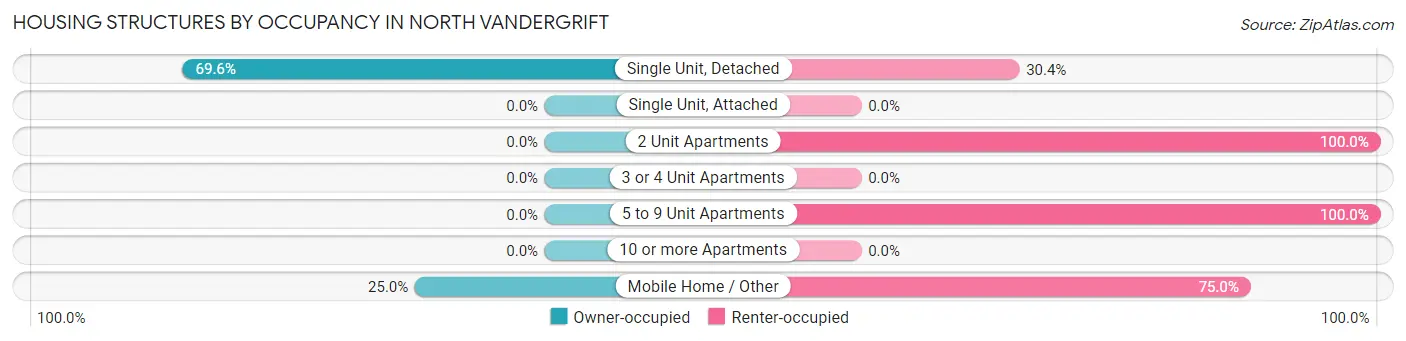
| Structure Type | Owner-occupied | Renter-occupied |
| Single Unit, Detached | 80 (69.6%) | 35 (30.4%) |
| Single Unit, Attached | 0 (0.0%) | 0 (0.0%) |
| 2 Unit Apartments | 0 (0.0%) | 14 (100.0%) |
| 3 or 4 Unit Apartments | 0 (0.0%) | 0 (0.0%) |
| 5 to 9 Unit Apartments | 0 (0.0%) | 13 (100.0%) |
| 10 or more Apartments | 0 (0.0%) | 0 (0.0%) |
| Mobile Home / Other | 7 (25.0%) | 21 (75.0%) |
| Total | 87 (51.2%) | 83 (48.8%) |
Housing Structures by Number of Rooms in North Vandergrift
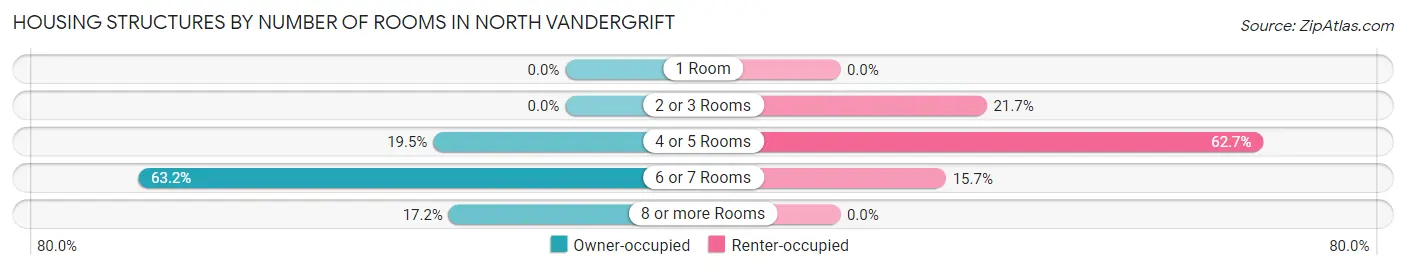
| Number of Rooms | Owner-occupied | Renter-occupied |
| 1 Room | 0 (0.0%) | 0 (0.0%) |
| 2 or 3 Rooms | 0 (0.0%) | 18 (21.7%) |
| 4 or 5 Rooms | 17 (19.5%) | 52 (62.6%) |
| 6 or 7 Rooms | 55 (63.2%) | 13 (15.7%) |
| 8 or more Rooms | 15 (17.2%) | 0 (0.0%) |
| Total | 87 (100.0%) | 83 (100.0%) |
Housing Structure by Heating Type in North Vandergrift
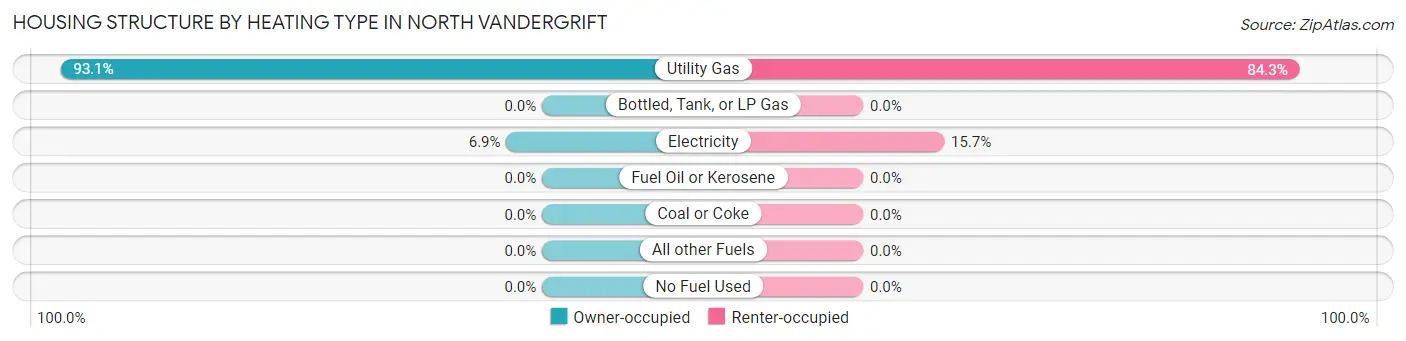
| Heating Type | Owner-occupied | Renter-occupied |
| Utility Gas | 81 (93.1%) | 70 (84.3%) |
| Bottled, Tank, or LP Gas | 0 (0.0%) | 0 (0.0%) |
| Electricity | 6 (6.9%) | 13 (15.7%) |
| Fuel Oil or Kerosene | 0 (0.0%) | 0 (0.0%) |
| Coal or Coke | 0 (0.0%) | 0 (0.0%) |
| All other Fuels | 0 (0.0%) | 0 (0.0%) |
| No Fuel Used | 0 (0.0%) | 0 (0.0%) |
| Total | 87 (100.0%) | 83 (100.0%) |
Household Vehicle Usage in North Vandergrift
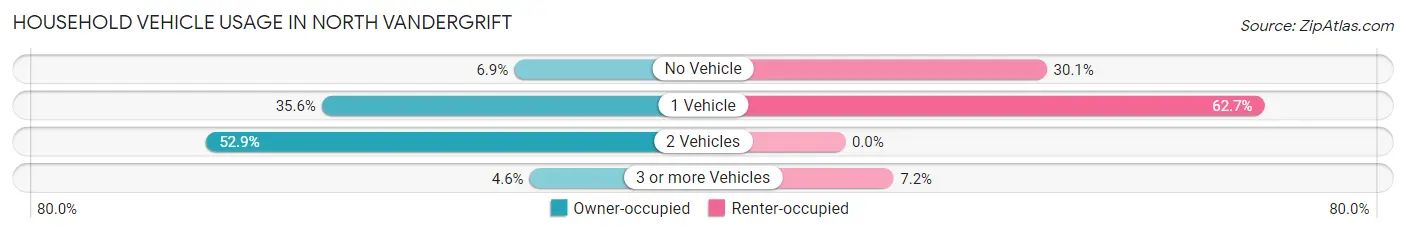
| Vehicles per Household | Owner-occupied | Renter-occupied |
| No Vehicle | 6 (6.9%) | 25 (30.1%) |
| 1 Vehicle | 31 (35.6%) | 52 (62.6%) |
| 2 Vehicles | 46 (52.9%) | 0 (0.0%) |
| 3 or more Vehicles | 4 (4.6%) | 6 (7.2%) |
| Total | 87 (100.0%) | 83 (100.0%) |
Real Estate & Mortgages in North Vandergrift
Real Estate and Mortgage Overview in North Vandergrift
| Characteristic | Without Mortgage | With Mortgage |
| Housing Units | 63 | 24 |
| Median Property Value | - | - |
| Median Household Income | - | - |
| Monthly Housing Costs | $517 | $0 |
| Real Estate Taxes | $854 | $0 |
Property Value by Mortgage Status in North Vandergrift

| Property Value | Without Mortgage | With Mortgage |
| Less than $50,000 | 35 (55.6%) | 17 (70.8%) |
| $50,000 to $99,999 | 18 (28.6%) | 7 (29.2%) |
| $100,000 to $299,999 | 10 (15.9%) | 0 (0.0%) |
| $300,000 to $499,999 | 0 (0.0%) | 0 (0.0%) |
| $500,000 to $749,999 | 0 (0.0%) | 0 (0.0%) |
| $750,000 to $999,999 | 0 (0.0%) | 0 (0.0%) |
| $1,000,000 or more | 0 (0.0%) | 0 (0.0%) |
| Total | 63 (100.0%) | 24 (100.0%) |
Household Income by Mortgage Status in North Vandergrift
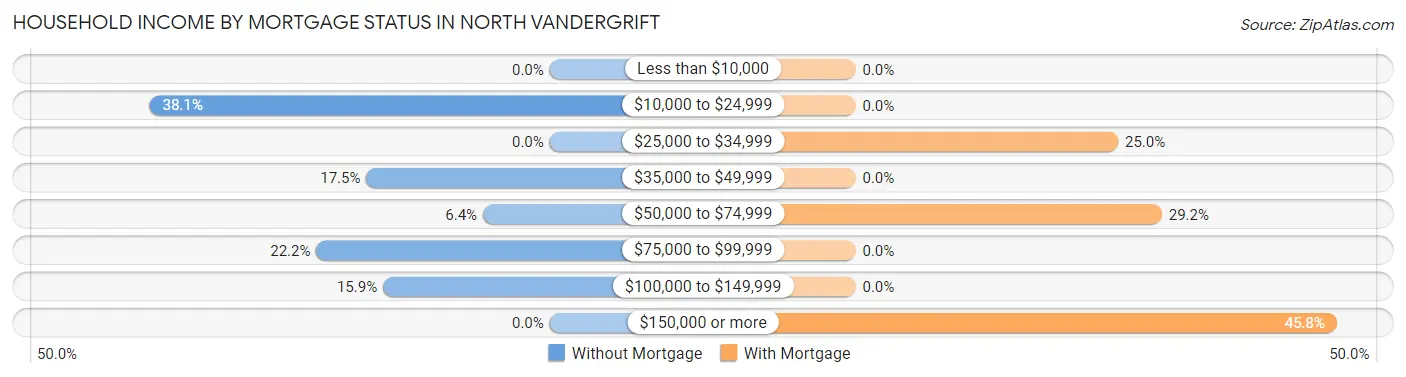
| Household Income | Without Mortgage | With Mortgage |
| Less than $10,000 | 0 (0.0%) | 0 (0.0%) |
| $10,000 to $24,999 | 24 (38.1%) | 0 (0.0%) |
| $25,000 to $34,999 | 0 (0.0%) | 6 (25.0%) |
| $35,000 to $49,999 | 11 (17.5%) | 0 (0.0%) |
| $50,000 to $74,999 | 4 (6.4%) | 7 (29.2%) |
| $75,000 to $99,999 | 14 (22.2%) | 0 (0.0%) |
| $100,000 to $149,999 | 10 (15.9%) | 0 (0.0%) |
| $150,000 or more | 0 (0.0%) | 11 (45.8%) |
| Total | 63 (100.0%) | 24 (100.0%) |
Property Value to Household Income Ratio in North Vandergrift
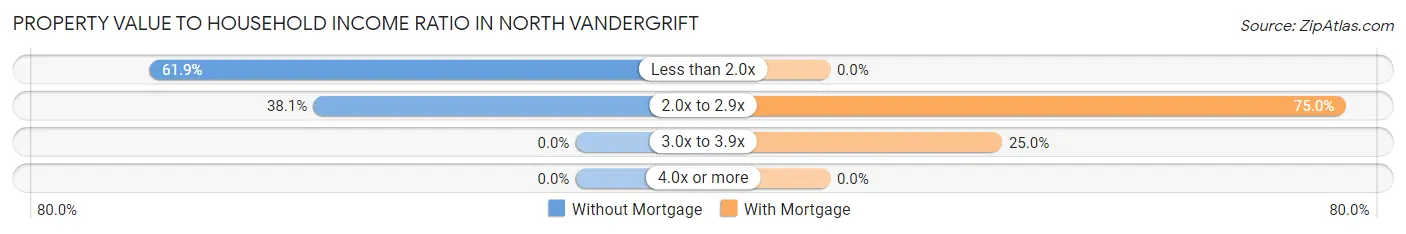
| Value-to-Income Ratio | Without Mortgage | With Mortgage |
| Less than 2.0x | 39 (61.9%) | 0 (0.0%) |
| 2.0x to 2.9x | 24 (38.1%) | 18 (75.0%) |
| 3.0x to 3.9x | 0 (0.0%) | 6 (25.0%) |
| 4.0x or more | 0 (0.0%) | 0 (0.0%) |
| Total | 63 (100.0%) | 24 (100.0%) |
Real Estate Taxes by Mortgage Status in North Vandergrift
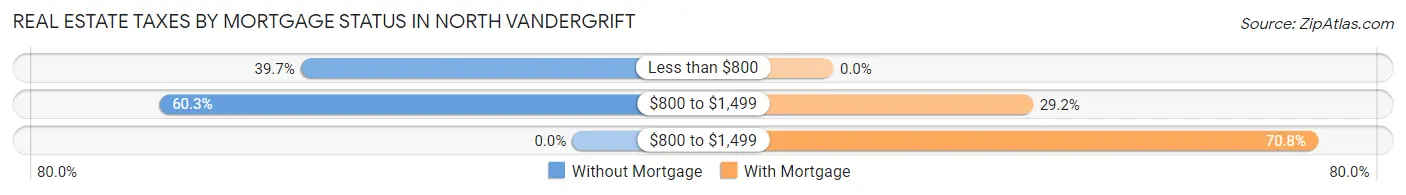
| Property Taxes | Without Mortgage | With Mortgage |
| Less than $800 | 25 (39.7%) | 0 (0.0%) |
| $800 to $1,499 | 38 (60.3%) | 7 (29.2%) |
| $800 to $1,499 | 0 (0.0%) | 17 (70.8%) |
| Total | 63 (100.0%) | 24 (100.0%) |
Health & Disability in North Vandergrift
Health Insurance Coverage by Age in North Vandergrift
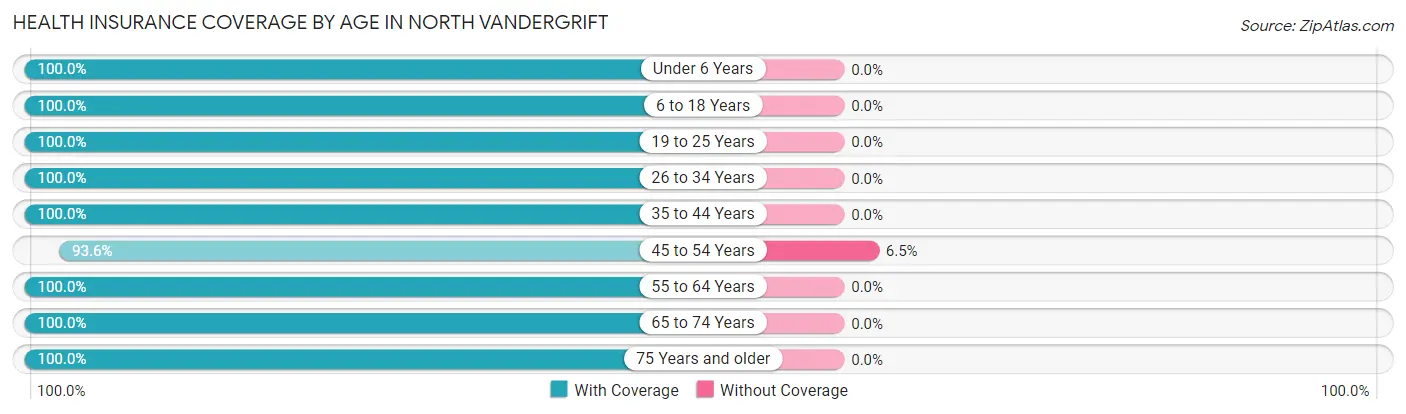
| Age Bracket | With Coverage | Without Coverage |
| Under 6 Years | 44 (100.0%) | 0 (0.0%) |
| 6 to 18 Years | 31 (100.0%) | 0 (0.0%) |
| 19 to 25 Years | 46 (100.0%) | 0 (0.0%) |
| 26 to 34 Years | 40 (100.0%) | 0 (0.0%) |
| 35 to 44 Years | 14 (100.0%) | 0 (0.0%) |
| 45 to 54 Years | 29 (93.5%) | 2 (6.5%) |
| 55 to 64 Years | 59 (100.0%) | 0 (0.0%) |
| 65 to 74 Years | 42 (100.0%) | 0 (0.0%) |
| 75 Years and older | 34 (100.0%) | 0 (0.0%) |
| Total | 339 (99.4%) | 2 (0.6%) |
Health Insurance Coverage by Citizenship Status in North Vandergrift
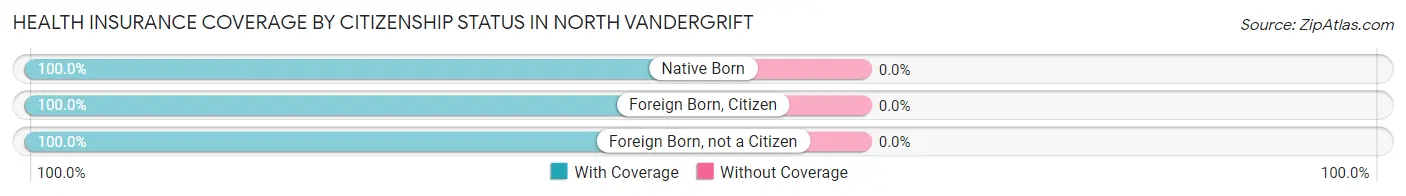
| Citizenship Status | With Coverage | Without Coverage |
| Native Born | 44 (100.0%) | 0 (0.0%) |
| Foreign Born, Citizen | 31 (100.0%) | 0 (0.0%) |
| Foreign Born, not a Citizen | 46 (100.0%) | 0 (0.0%) |
Health Insurance Coverage by Household Income in North Vandergrift
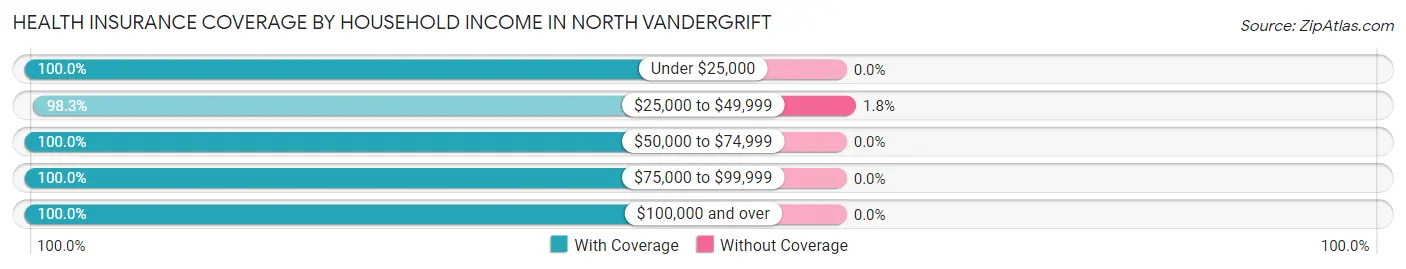
| Household Income | With Coverage | Without Coverage |
| Under $25,000 | 122 (100.0%) | 0 (0.0%) |
| $25,000 to $49,999 | 112 (98.3%) | 2 (1.8%) |
| $50,000 to $74,999 | 8 (100.0%) | 0 (0.0%) |
| $75,000 to $99,999 | 52 (100.0%) | 0 (0.0%) |
| $100,000 and over | 45 (100.0%) | 0 (0.0%) |
Public vs Private Health Insurance Coverage by Age in North Vandergrift
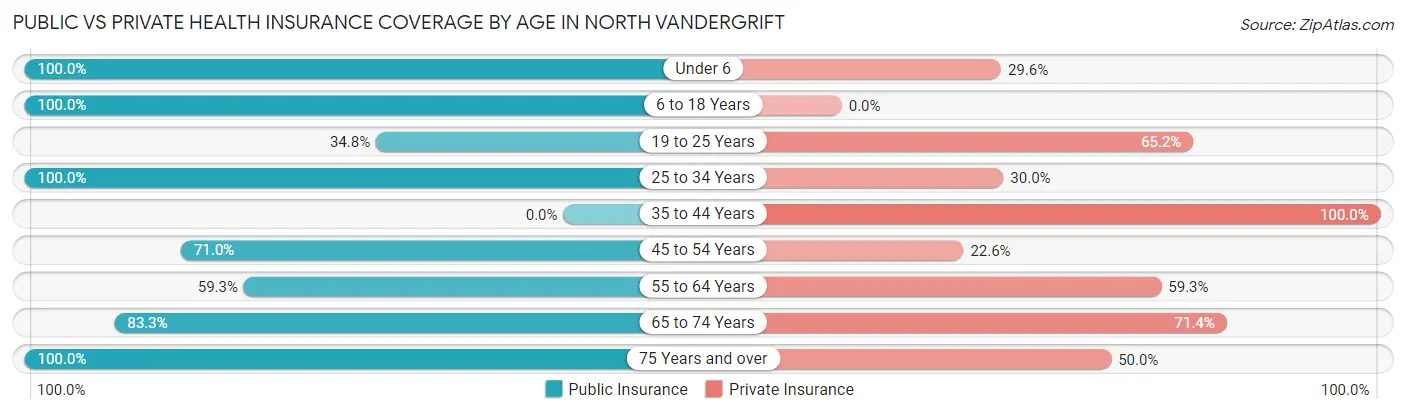
| Age Bracket | Public Insurance | Private Insurance |
| Under 6 | 44 (100.0%) | 13 (29.5%) |
| 6 to 18 Years | 31 (100.0%) | 0 (0.0%) |
| 19 to 25 Years | 16 (34.8%) | 30 (65.2%) |
| 25 to 34 Years | 40 (100.0%) | 12 (30.0%) |
| 35 to 44 Years | 0 (0.0%) | 14 (100.0%) |
| 45 to 54 Years | 22 (71.0%) | 7 (22.6%) |
| 55 to 64 Years | 35 (59.3%) | 35 (59.3%) |
| 65 to 74 Years | 35 (83.3%) | 30 (71.4%) |
| 75 Years and over | 34 (100.0%) | 17 (50.0%) |
| Total | 257 (75.4%) | 158 (46.3%) |
Disability Status by Sex by Age in North Vandergrift
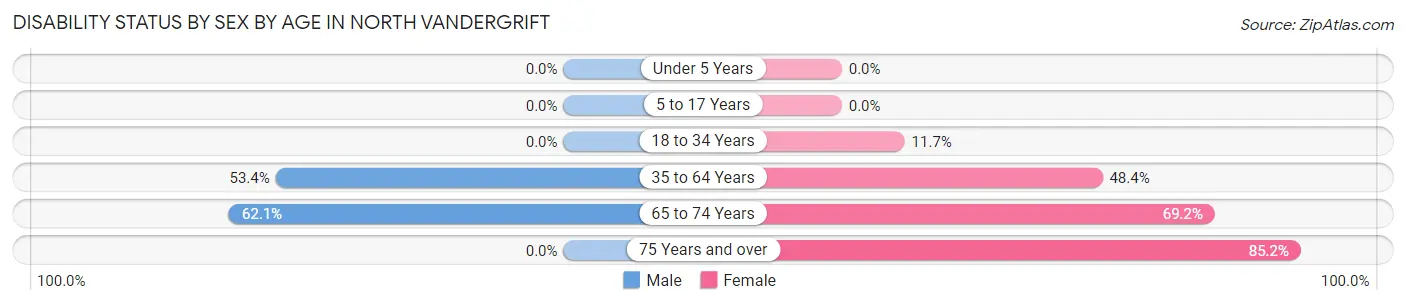
| Age Bracket | Male | Female |
| Under 5 Years | 0 (0.0%) | 0 (0.0%) |
| 5 to 17 Years | 0 (0.0%) | 0 (0.0%) |
| 18 to 34 Years | 0 (0.0%) | 7 (11.7%) |
| 35 to 64 Years | 39 (53.4%) | 15 (48.4%) |
| 65 to 74 Years | 18 (62.1%) | 9 (69.2%) |
| 75 Years and over | 0 (0.0%) | 23 (85.2%) |
Disability Class by Sex by Age in North Vandergrift
Disability Class: Hearing Difficulty
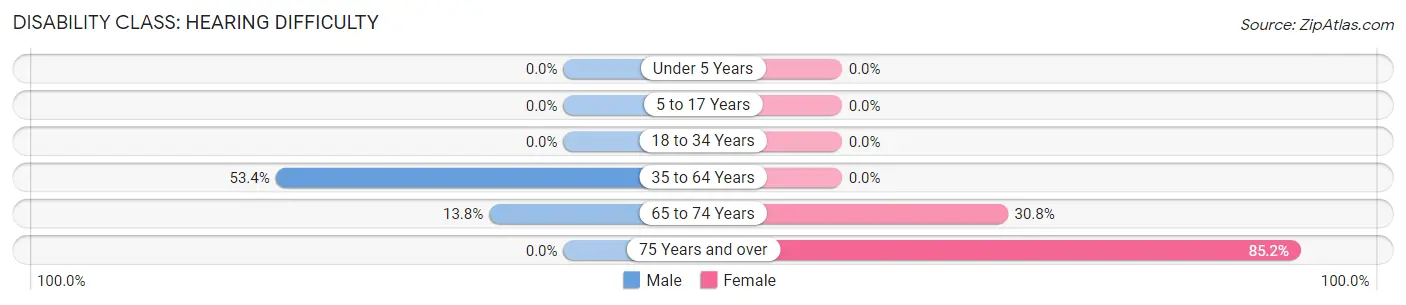
| Age Bracket | Male | Female |
| Under 5 Years | 0 (0.0%) | 0 (0.0%) |
| 5 to 17 Years | 0 (0.0%) | 0 (0.0%) |
| 18 to 34 Years | 0 (0.0%) | 0 (0.0%) |
| 35 to 64 Years | 39 (53.4%) | 0 (0.0%) |
| 65 to 74 Years | 4 (13.8%) | 4 (30.8%) |
| 75 Years and over | 0 (0.0%) | 23 (85.2%) |
Disability Class: Vision Difficulty
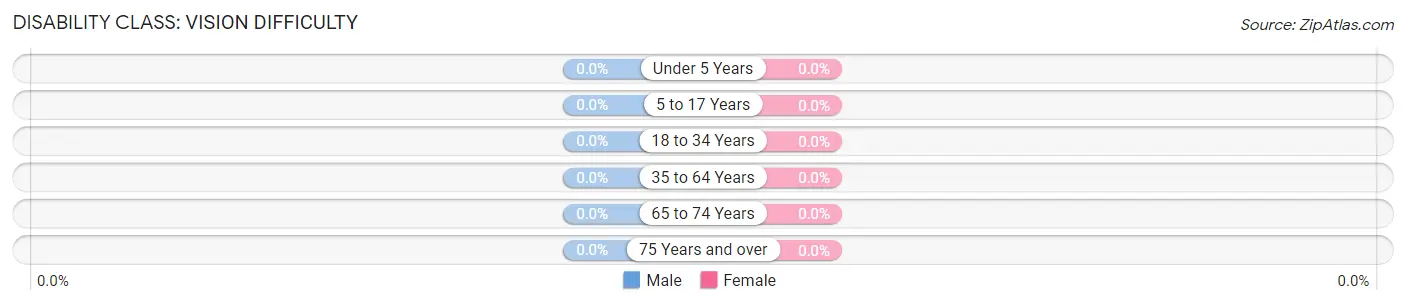
| Age Bracket | Male | Female |
| Under 5 Years | 0 (0.0%) | 0 (0.0%) |
| 5 to 17 Years | 0 (0.0%) | 0 (0.0%) |
| 18 to 34 Years | 0 (0.0%) | 0 (0.0%) |
| 35 to 64 Years | 0 (0.0%) | 0 (0.0%) |
| 65 to 74 Years | 0 (0.0%) | 0 (0.0%) |
| 75 Years and over | 0 (0.0%) | 0 (0.0%) |
Disability Class: Cognitive Difficulty
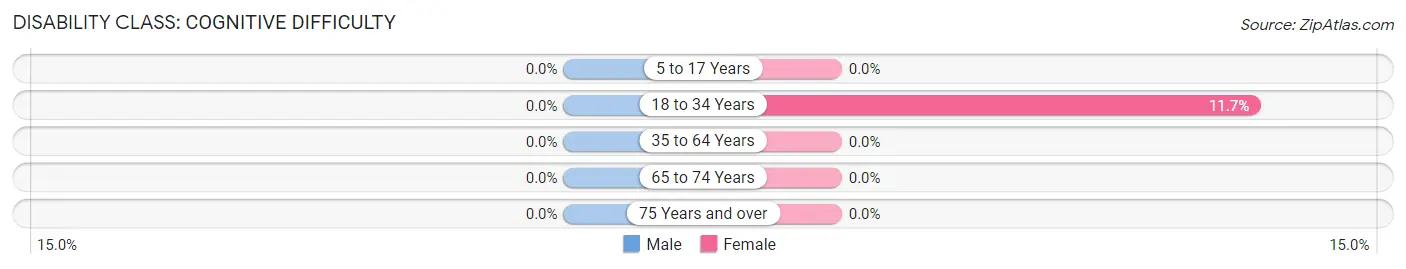
| Age Bracket | Male | Female |
| 5 to 17 Years | 0 (0.0%) | 0 (0.0%) |
| 18 to 34 Years | 0 (0.0%) | 7 (11.7%) |
| 35 to 64 Years | 0 (0.0%) | 0 (0.0%) |
| 65 to 74 Years | 0 (0.0%) | 0 (0.0%) |
| 75 Years and over | 0 (0.0%) | 0 (0.0%) |
Disability Class: Ambulatory Difficulty
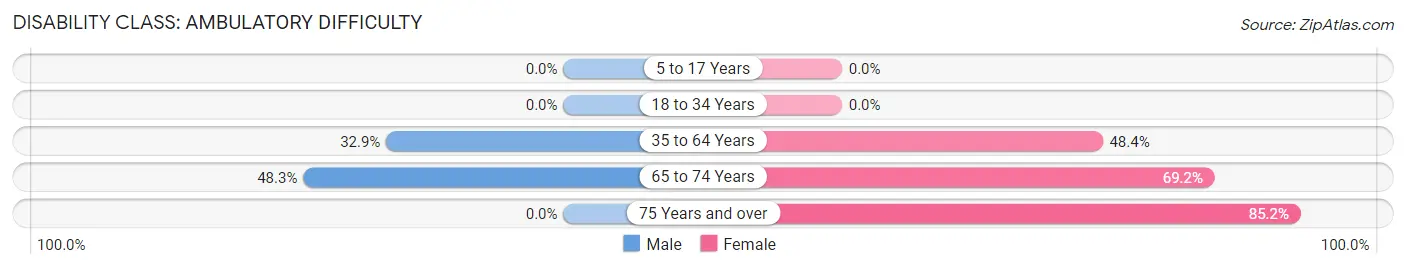
| Age Bracket | Male | Female |
| 5 to 17 Years | 0 (0.0%) | 0 (0.0%) |
| 18 to 34 Years | 0 (0.0%) | 0 (0.0%) |
| 35 to 64 Years | 24 (32.9%) | 15 (48.4%) |
| 65 to 74 Years | 14 (48.3%) | 9 (69.2%) |
| 75 Years and over | 0 (0.0%) | 23 (85.2%) |
Disability Class: Self-Care Difficulty
| Age Bracket | Male | Female |
| 5 to 17 Years | 0 (0.0%) | 0 (0.0%) |
| 18 to 34 Years | 0 (0.0%) | 0 (0.0%) |
| 35 to 64 Years | 0 (0.0%) | 0 (0.0%) |
| 65 to 74 Years | 0 (0.0%) | 0 (0.0%) |
| 75 Years and over | 0 (0.0%) | 0 (0.0%) |
Technology Access in North Vandergrift
Computing Device Access in North Vandergrift
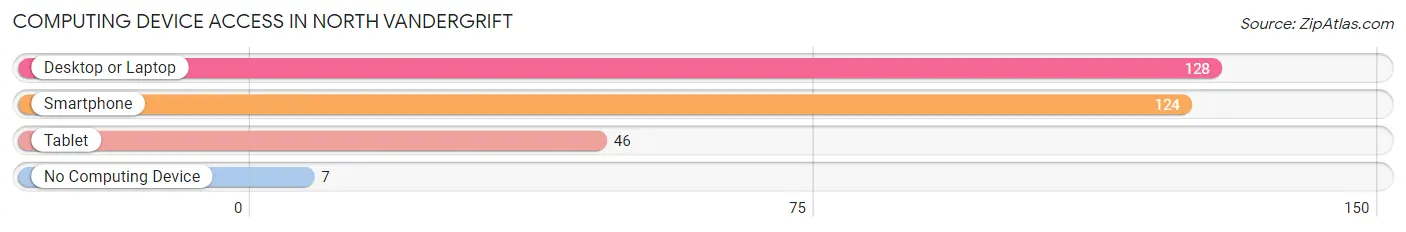
| Device Type | # Households | % Households |
| Desktop or Laptop | 128 | 75.3% |
| Smartphone | 124 | 72.9% |
| Tablet | 46 | 27.1% |
| No Computing Device | 7 | 4.1% |
| Total | 170 | 100.0% |
Internet Access in North Vandergrift
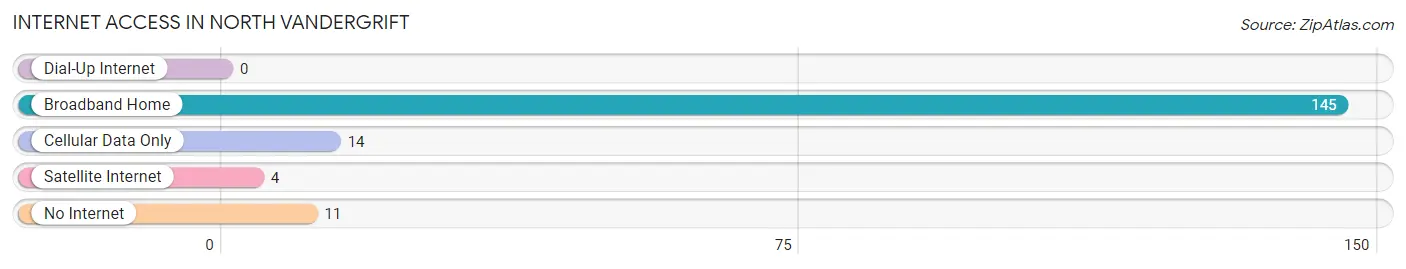
| Internet Type | # Households | % Households |
| Dial-Up Internet | 0 | 0.0% |
| Broadband Home | 145 | 85.3% |
| Cellular Data Only | 14 | 8.2% |
| Satellite Internet | 4 | 2.4% |
| No Internet | 11 | 6.5% |
| Total | 170 | 100.0% |
North Vandergrift Summary
History
North Vandergrift is a borough located in Westmoreland County, Pennsylvania. It is situated along the Allegheny River, approximately 30 miles northeast of Pittsburgh. The area was first settled in the late 1700s by German and Scotch-Irish immigrants. The town was officially incorporated in 1891 and was named after William Vandergrift, a local landowner.
In the early 1900s, North Vandergrift was a thriving industrial town. The town was home to several coal mines, steel mills, and other manufacturing plants. The town also had a large population of immigrants from Eastern Europe, including Poles, Slovaks, and Ukrainians. The town was also home to a large number of Italian immigrants.
The town experienced a period of decline in the mid-1900s as the steel and coal industries began to decline. The town’s population decreased significantly as many of the town’s residents moved away in search of better economic opportunities.
Geography
North Vandergrift is located in Westmoreland County, Pennsylvania. It is situated along the Allegheny River, approximately 30 miles northeast of Pittsburgh. The town is located in the Allegheny Plateau region of Pennsylvania and is surrounded by rolling hills and forests. The town is located at an elevation of 1,000 feet above sea level.
The town has a total area of 1.2 square miles, all of which is land. The town is located in the Eastern Standard Time Zone and observes Daylight Saving Time.
Economy
North Vandergrift’s economy is largely based on manufacturing and services. The town is home to several manufacturing plants, including a steel mill, a paper mill, and a plastics plant. The town is also home to several retail stores, restaurants, and other businesses.
The town is also home to a number of small businesses, including auto repair shops, beauty salons, and other service-oriented businesses. The town is also home to a number of small farms, which produce a variety of fruits and vegetables.
Demographics
As of the 2010 census, the population of North Vandergrift was 2,845. The population is largely white (94.3%), with a small percentage of African Americans (2.2%) and Hispanics (2.2%). The median household income is $37,917, and the median age is 43.
The town is home to a large number of immigrants from Eastern Europe, including Poles, Slovaks, and Ukrainians. The town is also home to a large number of Italian immigrants. The town has a large Catholic population, with a number of churches located in the area.
Conclusion
North Vandergrift is a small borough located in Westmoreland County, Pennsylvania. The town has a long history of industry and immigration, and is home to a diverse population. The town’s economy is largely based on manufacturing and services, and the town is home to a number of small businesses. The town has a median household income of $37,917 and a median age of 43.
Common Questions
What is Per Capita Income in North Vandergrift?
Per Capita income in North Vandergrift is $22,216.
What is the Median Family Income in North Vandergrift?
Median Family Income in North Vandergrift is $43,438.
What is the Median Household income in North Vandergrift?
Median Household Income in North Vandergrift is $29,643.
What is Inequality or Gini Index in North Vandergrift?
Inequality or Gini Index in North Vandergrift is 0.45.
What is the Total Population of North Vandergrift?
Total Population of North Vandergrift is 341.
What is the Total Male Population of North Vandergrift?
Total Male Population of North Vandergrift is 190.
What is the Total Female Population of North Vandergrift?
Total Female Population of North Vandergrift is 151.
What is the Ratio of Males per 100 Females in North Vandergrift?
There are 125.83 Males per 100 Females in North Vandergrift.
What is the Ratio of Females per 100 Males in North Vandergrift?
There are 79.47 Females per 100 Males in North Vandergrift.
What is the Median Population Age in North Vandergrift?
Median Population Age in North Vandergrift is 39.7 Years.
What is the Average Family Size in North Vandergrift
Average Family Size in North Vandergrift is 2.9 People.
What is the Average Household Size in North Vandergrift
Average Household Size in North Vandergrift is 2.0 People.
How Large is the Labor Force in North Vandergrift?
There are 144 People in the Labor Forcein in North Vandergrift.
What is the Percentage of People in the Labor Force in North Vandergrift?
54.1% of People are in the Labor Force in North Vandergrift.
What is the Unemployment Rate in North Vandergrift?
Unemployment Rate in North Vandergrift is 25.7%.