Monrovia, IN Map & Demographics
Monrovia Map
Monrovia Overview
$33,936
PER CAPITA INCOME
$82,222
AVG FAMILY INCOME
$84,688
AVG HOUSEHOLD INCOME
21.4%
WAGE / INCOME GAP [ % ]
78.6¢/ $1
WAGE / INCOME GAP [ $ ]
0.33
INEQUALITY / GINI INDEX
1,574
TOTAL POPULATION
726
MALE POPULATION
848
FEMALE POPULATION
85.61
MALES / 100 FEMALES
116.80
FEMALES / 100 MALES
30.2
MEDIAN AGE
2.9
AVG FAMILY SIZE
2.9
AVG HOUSEHOLD SIZE
881
LABOR FORCE [ PEOPLE ]
77.4%
PERCENT IN LABOR FORCE
2.2%
UNEMPLOYMENT RATE
Monrovia Zip Codes
Monrovia Area Codes
Income in Monrovia
Income Overview in Monrovia
Per Capita Income in Monrovia is $33,936, while median incomes of families and households are $82,222 and $84,688 respectively.
| Characteristic | Number | Measure |
| Per Capita Income | 1,574 | $33,936 |
| Median Family Income | 478 | $82,222 |
| Mean Family Income | 478 | $95,645 |
| Median Household Income | 553 | $84,688 |
| Mean Household Income | 553 | $96,982 |
| Income Deficit | 478 | $0 |
| Wage / Income Gap (%) | 1,574 | 21.42% |
| Wage / Income Gap ($) | 1,574 | 78.58¢ per $1 |
| Gini / Inequality Index | 1,574 | 0.33 |
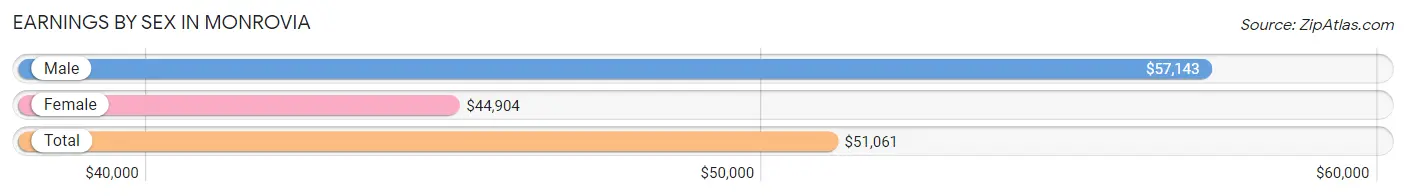
Earnings by Sex in Monrovia
Average Earnings in Monrovia are $51,061, $57,143 for men and $44,904 for women, a difference of 21.4%.
| Sex | Number | Average Earnings |
| Male | 480 (53.4%) | $57,143 |
| Female | 419 (46.6%) | $44,904 |
| Total | 899 (100.0%) | $51,061 |
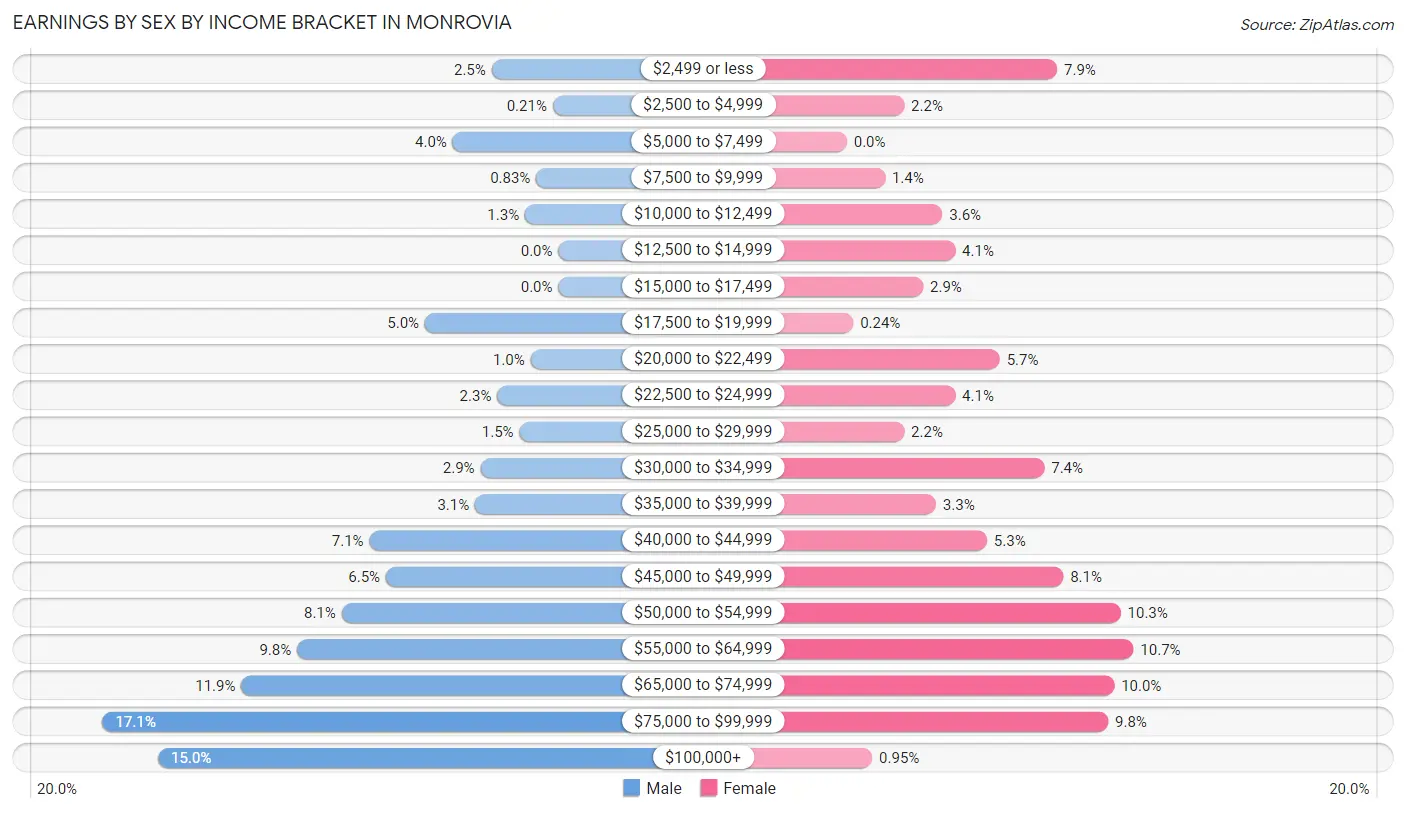
Earnings by Sex by Income Bracket in Monrovia
The most common earnings brackets in Monrovia are $75,000 to $99,999 for men (82 | 17.1%) and $55,000 to $64,999 for women (45 | 10.7%).
| Income | Male | Female |
| $2,499 or less | 12 (2.5%) | 33 (7.9%) |
| $2,500 to $4,999 | 1 (0.2%) | 9 (2.1%) |
| $5,000 to $7,499 | 19 (4.0%) | 0 (0.0%) |
| $7,500 to $9,999 | 4 (0.8%) | 6 (1.4%) |
| $10,000 to $12,499 | 6 (1.3%) | 15 (3.6%) |
| $12,500 to $14,999 | 0 (0.0%) | 17 (4.1%) |
| $15,000 to $17,499 | 0 (0.0%) | 12 (2.9%) |
| $17,500 to $19,999 | 24 (5.0%) | 1 (0.2%) |
| $20,000 to $22,499 | 5 (1.0%) | 24 (5.7%) |
| $22,500 to $24,999 | 11 (2.3%) | 17 (4.1%) |
| $25,000 to $29,999 | 7 (1.5%) | 9 (2.1%) |
| $30,000 to $34,999 | 14 (2.9%) | 31 (7.4%) |
| $35,000 to $39,999 | 15 (3.1%) | 14 (3.3%) |
| $40,000 to $44,999 | 34 (7.1%) | 22 (5.2%) |
| $45,000 to $49,999 | 31 (6.5%) | 34 (8.1%) |
| $50,000 to $54,999 | 39 (8.1%) | 43 (10.3%) |
| $55,000 to $64,999 | 47 (9.8%) | 45 (10.7%) |
| $65,000 to $74,999 | 57 (11.9%) | 42 (10.0%) |
| $75,000 to $99,999 | 82 (17.1%) | 41 (9.8%) |
| $100,000+ | 72 (15.0%) | 4 (0.9%) |
| Total | 480 (100.0%) | 419 (100.0%) |
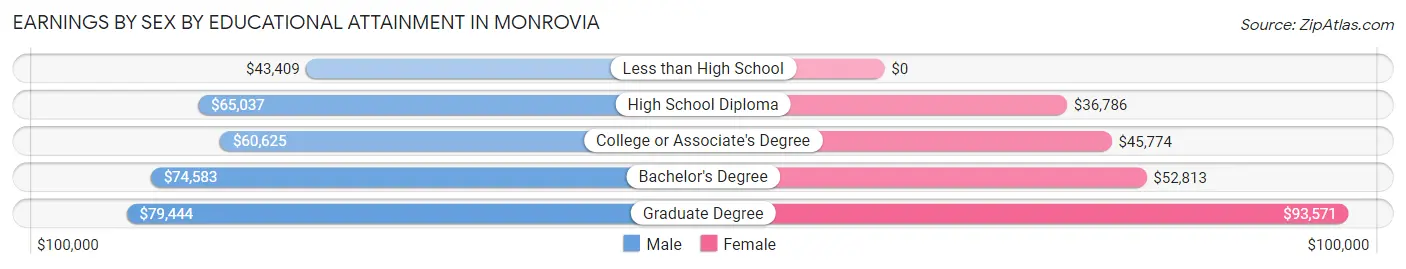
Earnings by Sex by Educational Attainment in Monrovia
Average earnings in Monrovia are $60,893 for men and $50,040 for women, a difference of 17.8%. Men with an educational attainment of graduate degree enjoy the highest average annual earnings of $79,444, while those with less than high school education earn the least with $43,409. Women with an educational attainment of graduate degree earn the most with the average annual earnings of $93,571, while those with high school diploma education have the smallest earnings of $36,786.
| Educational Attainment | Male Income | Female Income |
| Less than High School | $43,409 | $0 |
| High School Diploma | $65,037 | $36,786 |
| College or Associate's Degree | $60,625 | $45,774 |
| Bachelor's Degree | $74,583 | $52,813 |
| Graduate Degree | $79,444 | $93,571 |
| Total | $60,893 | $50,040 |
Family Income in Monrovia
Family Income Brackets in Monrovia
According to the Monrovia family income data, there are 131 families falling into the $50,000 to $74,999 income range, which is the most common income bracket and makes up 27.4% of all families. Conversely, the less than $10,000 income bracket is the least frequent group with only 5 families (1.1%) belonging to this category.
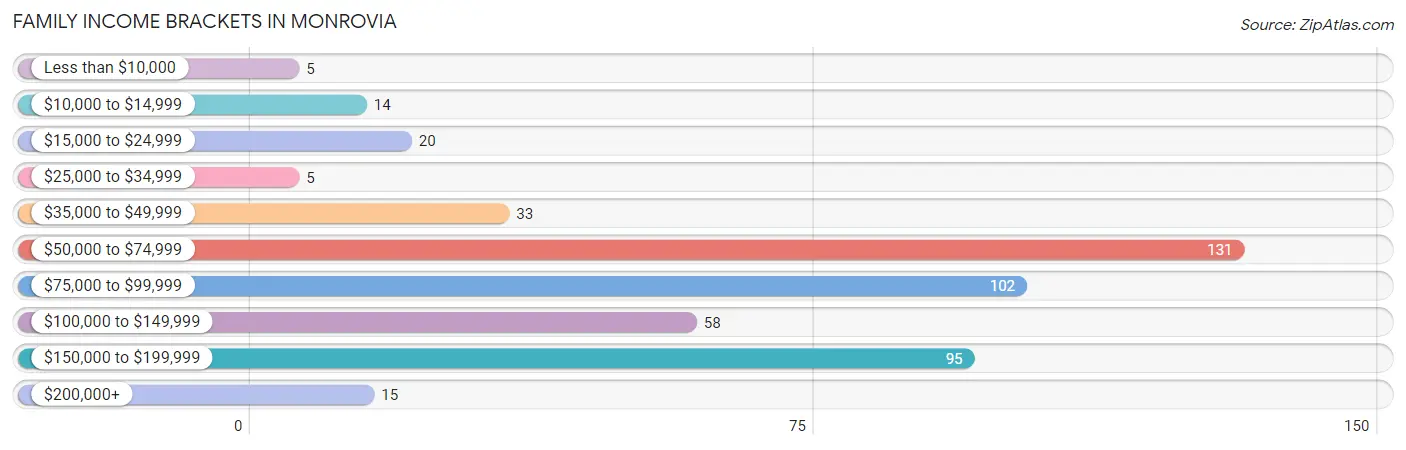
| Income Bracket | # Families | % Families |
| Less than $10,000 | 5 | 1.0% |
| $10,000 to $14,999 | 14 | 2.9% |
| $15,000 to $24,999 | 20 | 4.2% |
| $25,000 to $34,999 | 5 | 1.0% |
| $35,000 to $49,999 | 33 | 6.9% |
| $50,000 to $74,999 | 131 | 27.4% |
| $75,000 to $99,999 | 102 | 21.3% |
| $100,000 to $149,999 | 58 | 12.1% |
| $150,000 to $199,999 | 95 | 19.9% |
| $200,000+ | 15 | 3.1% |
Family Income by Famaliy Size in Monrovia
5-person families (16 | 3.4%) account for the highest median family income in Monrovia with $112,500 per family, while 2-person families (220 | 46.0%) have the highest median income of $37,656 per family member.
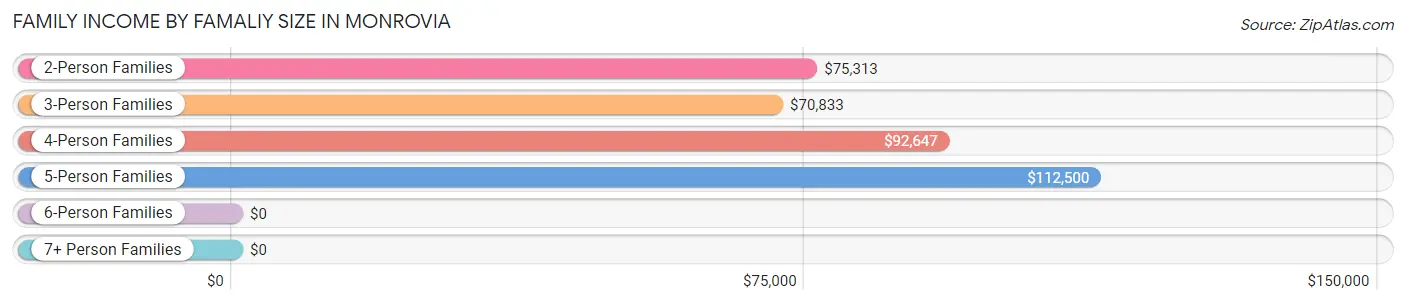
| Income Bracket | # Families | Median Income |
| 2-Person Families | 220 (46.0%) | $75,313 |
| 3-Person Families | 130 (27.2%) | $70,833 |
| 4-Person Families | 86 (18.0%) | $92,647 |
| 5-Person Families | 16 (3.4%) | $112,500 |
| 6-Person Families | 26 (5.4%) | $0 |
| 7+ Person Families | 0 (0.0%) | $0 |
| Total | 478 (100.0%) | $82,222 |
Family Income by Number of Earners in Monrovia
The median family income in Monrovia is $82,222, with families comprising 3+ earners (60) having the highest median family income of $180,278, while families with 1 earner (218) have the lowest median family income of $54,375, accounting for 12.6% and 45.6% of families, respectively.
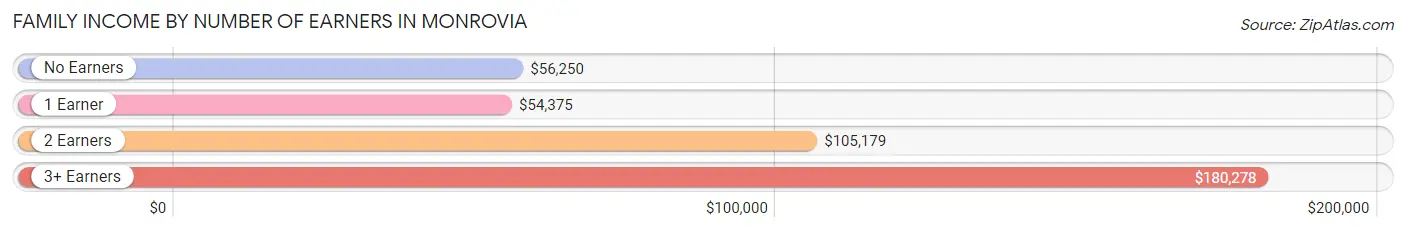
| Number of Earners | # Families | Median Income |
| No Earners | 23 (4.8%) | $56,250 |
| 1 Earner | 218 (45.6%) | $54,375 |
| 2 Earners | 177 (37.0%) | $105,179 |
| 3+ Earners | 60 (12.6%) | $180,278 |
| Total | 478 (100.0%) | $82,222 |
Household Income in Monrovia
Household Income Brackets in Monrovia
With 135 households falling in the category, the $50,000 to $74,999 income range is the most frequent in Monrovia, accounting for 24.4% of all households.
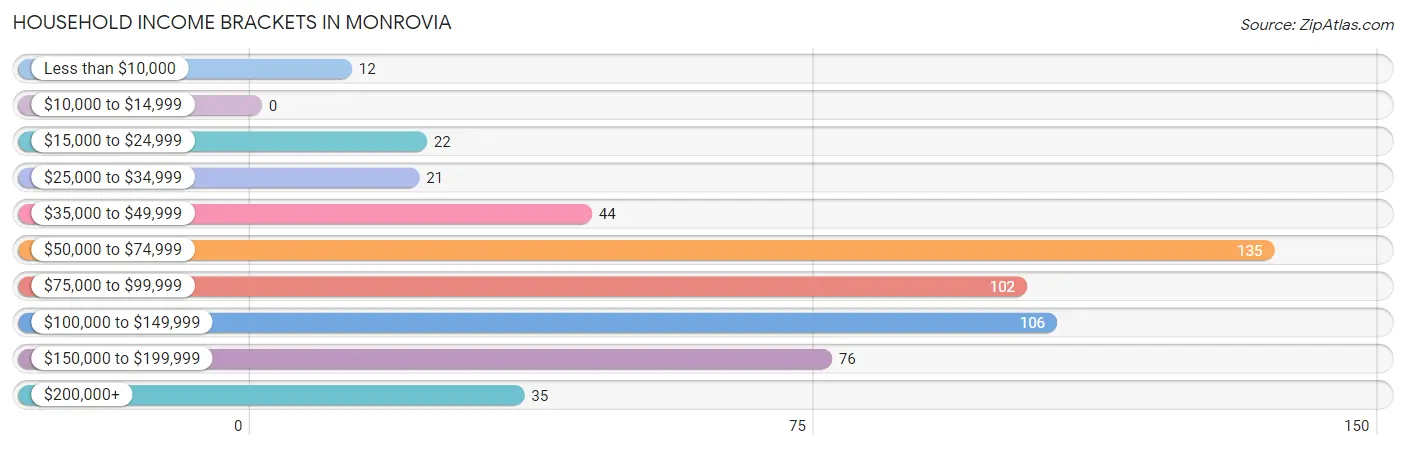
| Income Bracket | # Households | % Households |
| Less than $10,000 | 12 | 2.2% |
| $10,000 to $14,999 | 0 | 0.0% |
| $15,000 to $24,999 | 22 | 4.0% |
| $25,000 to $34,999 | 21 | 3.8% |
| $35,000 to $49,999 | 44 | 8.0% |
| $50,000 to $74,999 | 135 | 24.4% |
| $75,000 to $99,999 | 102 | 18.4% |
| $100,000 to $149,999 | 106 | 19.2% |
| $150,000 to $199,999 | 76 | 13.7% |
| $200,000+ | 35 | 6.3% |
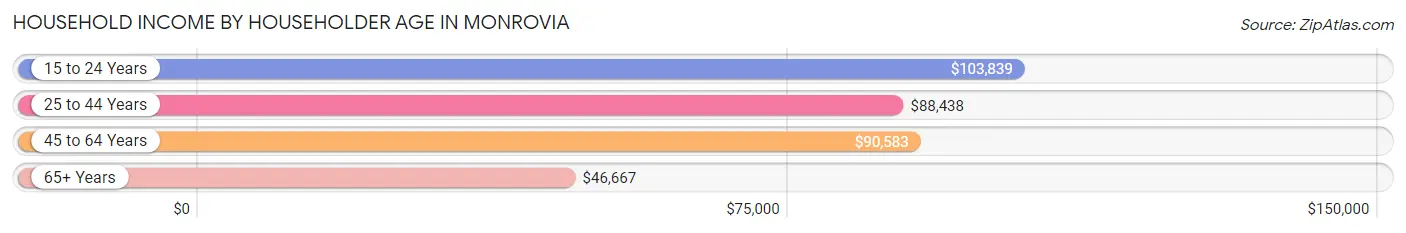
Household Income by Householder Age in Monrovia
The median household income in Monrovia is $84,688, with the highest median household income of $103,839 found in the 15 to 24 years age bracket for the primary householder. A total of 21 households (3.8%) fall into this category. Meanwhile, the 65+ years age bracket for the primary householder has the lowest median household income of $46,667, with 60 households (10.8%) in this group.
| Income Bracket | # Households | Median Income |
| 15 to 24 Years | 21 (3.8%) | $103,839 |
| 25 to 44 Years | 231 (41.8%) | $88,438 |
| 45 to 64 Years | 241 (43.6%) | $90,583 |
| 65+ Years | 60 (10.8%) | $46,667 |
| Total | 553 (100.0%) | $84,688 |
Poverty in Monrovia
Income Below Poverty by Sex and Age in Monrovia
With 3.4% poverty level for males and 11.4% for females among the residents of Monrovia, 45 to 54 year old males and 18 to 24 year old females are the most vulnerable to poverty, with 19 males (26.4%) and 25 females (29.8%) in their respective age groups living below the poverty level.
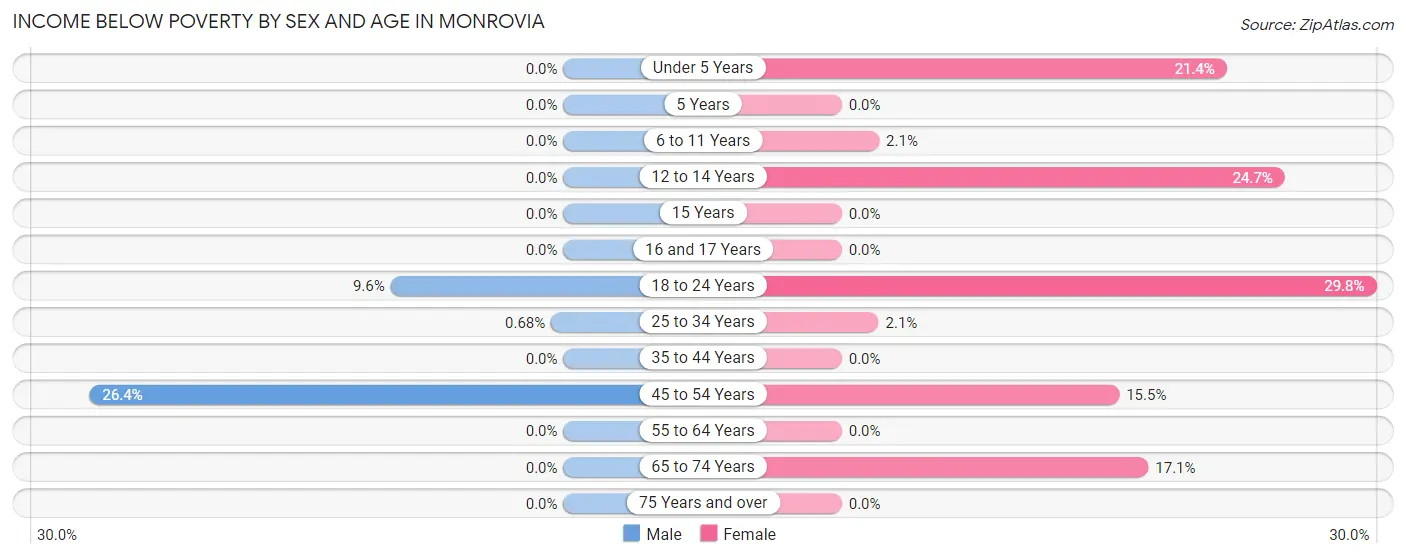
| Age Bracket | Male | Female |
| Under 5 Years | 0 (0.0%) | 24 (21.4%) |
| 5 Years | 0 (0.0%) | 0 (0.0%) |
| 6 to 11 Years | 0 (0.0%) | 1 (2.1%) |
| 12 to 14 Years | 0 (0.0%) | 18 (24.7%) |
| 15 Years | 0 (0.0%) | 0 (0.0%) |
| 16 and 17 Years | 0 (0.0%) | 0 (0.0%) |
| 18 to 24 Years | 5 (9.6%) | 25 (29.8%) |
| 25 to 34 Years | 1 (0.7%) | 3 (2.1%) |
| 35 to 44 Years | 0 (0.0%) | 0 (0.0%) |
| 45 to 54 Years | 19 (26.4%) | 19 (15.4%) |
| 55 to 64 Years | 0 (0.0%) | 0 (0.0%) |
| 65 to 74 Years | 0 (0.0%) | 7 (17.1%) |
| 75 Years and over | 0 (0.0%) | 0 (0.0%) |
| Total | 25 (3.4%) | 97 (11.4%) |
Income Above Poverty by Sex and Age in Monrovia
According to the poverty statistics in Monrovia, males aged under 5 years and females aged 5 years are the age groups that are most secure financially, with 100.0% of males and 100.0% of females in these age groups living above the poverty line.
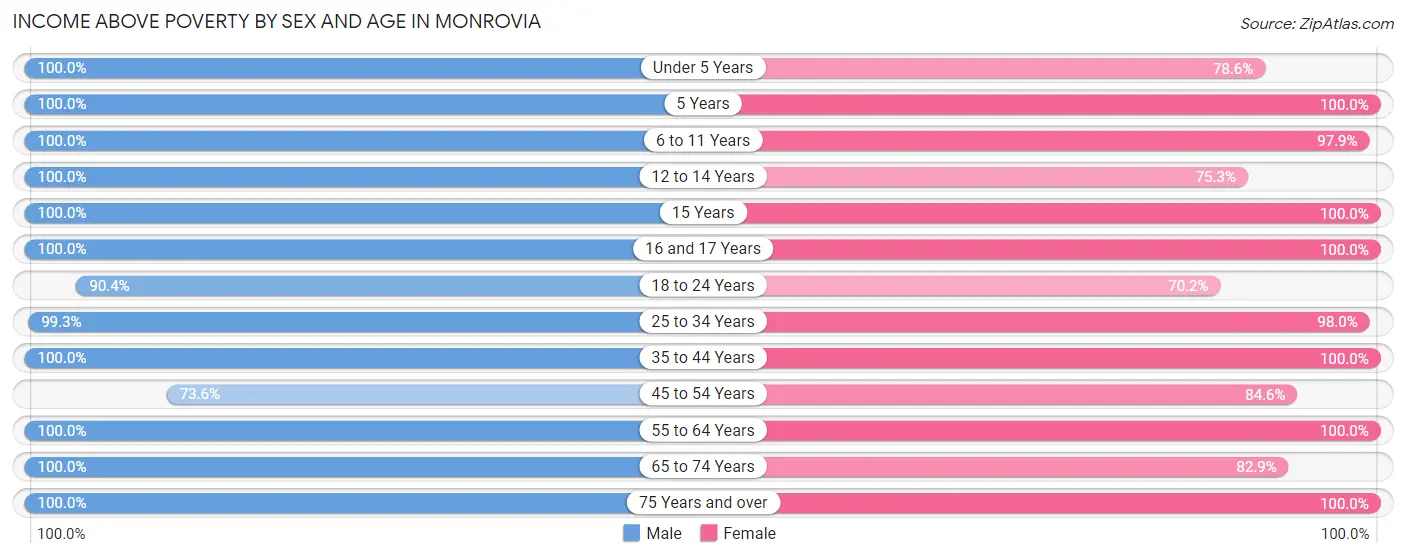
| Age Bracket | Male | Female |
| Under 5 Years | 92 (100.0%) | 88 (78.6%) |
| 5 Years | 27 (100.0%) | 12 (100.0%) |
| 6 to 11 Years | 16 (100.0%) | 47 (97.9%) |
| 12 to 14 Years | 28 (100.0%) | 55 (75.3%) |
| 15 Years | 14 (100.0%) | 14 (100.0%) |
| 16 and 17 Years | 23 (100.0%) | 5 (100.0%) |
| 18 to 24 Years | 47 (90.4%) | 59 (70.2%) |
| 25 to 34 Years | 147 (99.3%) | 143 (98.0%) |
| 35 to 44 Years | 59 (100.0%) | 80 (100.0%) |
| 45 to 54 Years | 53 (73.6%) | 104 (84.6%) |
| 55 to 64 Years | 153 (100.0%) | 98 (100.0%) |
| 65 to 74 Years | 38 (100.0%) | 34 (82.9%) |
| 75 Years and over | 4 (100.0%) | 12 (100.0%) |
| Total | 701 (96.6%) | 751 (88.6%) |
Income Below Poverty Among Married-Couple Families in Monrovia
The poverty statistics for married-couple families in Monrovia show that 0.4% or 1 of the total 287 families live below the poverty line. Families with 1 or 2 children have the highest poverty rate of 1.1%, comprising of 1 families. On the other hand, families with no children have the lowest poverty rate of 0.0%, which includes 0 families.
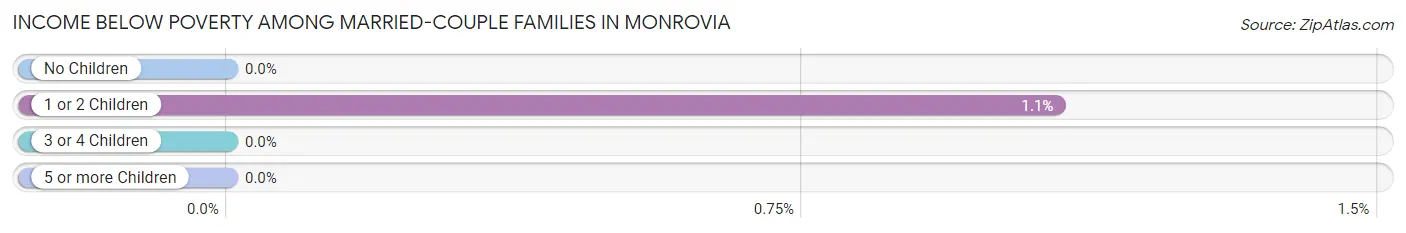
| Children | Above Poverty | Below Poverty |
| No Children | 157 (100.0%) | 0 (0.0%) |
| 1 or 2 Children | 92 (98.9%) | 1 (1.1%) |
| 3 or 4 Children | 37 (100.0%) | 0 (0.0%) |
| 5 or more Children | 0 (0.0%) | 0 (0.0%) |
| Total | 286 (99.7%) | 1 (0.4%) |
Income Below Poverty Among Single-Parent Households in Monrovia
According to the poverty data in Monrovia, 19.5% or 16 single-father households and 17.4% or 19 single-mother households are living below the poverty line. Among single-father households, those with 1 or 2 children have the highest poverty rate, with 16 households (29.1%) experiencing poverty. Likewise, among single-mother households, those with no children have the highest poverty rate, with 5 households (21.7%) falling below the poverty line.
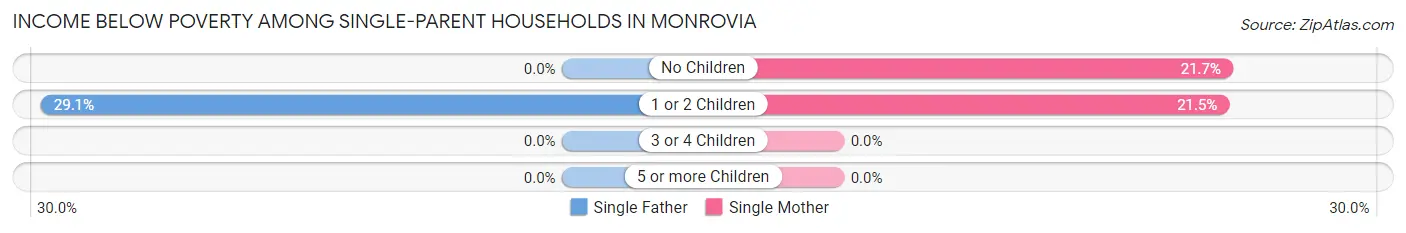
| Children | Single Father | Single Mother |
| No Children | 0 (0.0%) | 5 (21.7%) |
| 1 or 2 Children | 16 (29.1%) | 14 (21.5%) |
| 3 or 4 Children | 0 (0.0%) | 0 (0.0%) |
| 5 or more Children | 0 (0.0%) | 0 (0.0%) |
| Total | 16 (19.5%) | 19 (17.4%) |
Income Below Poverty Among Married-Couple vs Single-Parent Households in Monrovia
The poverty data for Monrovia shows that 1 of the married-couple family households (0.4%) and 35 of the single-parent households (18.3%) are living below the poverty level. Within the married-couple family households, those with 1 or 2 children have the highest poverty rate, with 1 households (1.1%) falling below the poverty line. Among the single-parent households, those with 1 or 2 children have the highest poverty rate, with 30 household (25.0%) living below poverty.
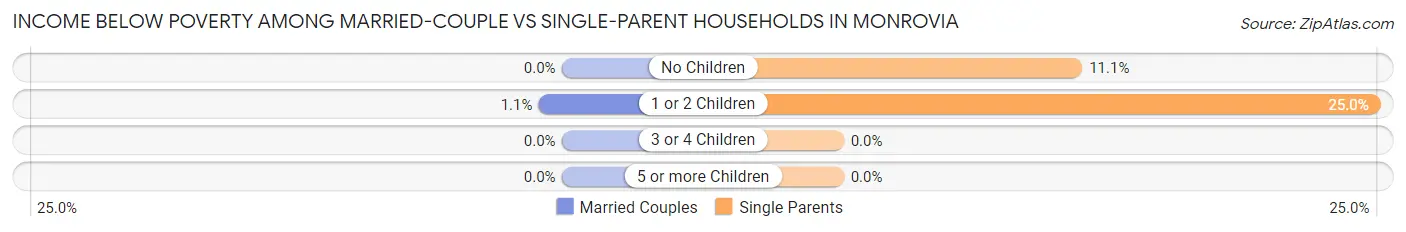
| Children | Married-Couple Families | Single-Parent Households |
| No Children | 0 (0.0%) | 5 (11.1%) |
| 1 or 2 Children | 1 (1.1%) | 30 (25.0%) |
| 3 or 4 Children | 0 (0.0%) | 0 (0.0%) |
| 5 or more Children | 0 (0.0%) | 0 (0.0%) |
| Total | 1 (0.4%) | 35 (18.3%) |
Race in Monrovia
The most populous races in Monrovia are White / Caucasian (1,358 | 86.3%), Two or more Races (136 | 8.6%), and Black / African American (52 | 3.3%).
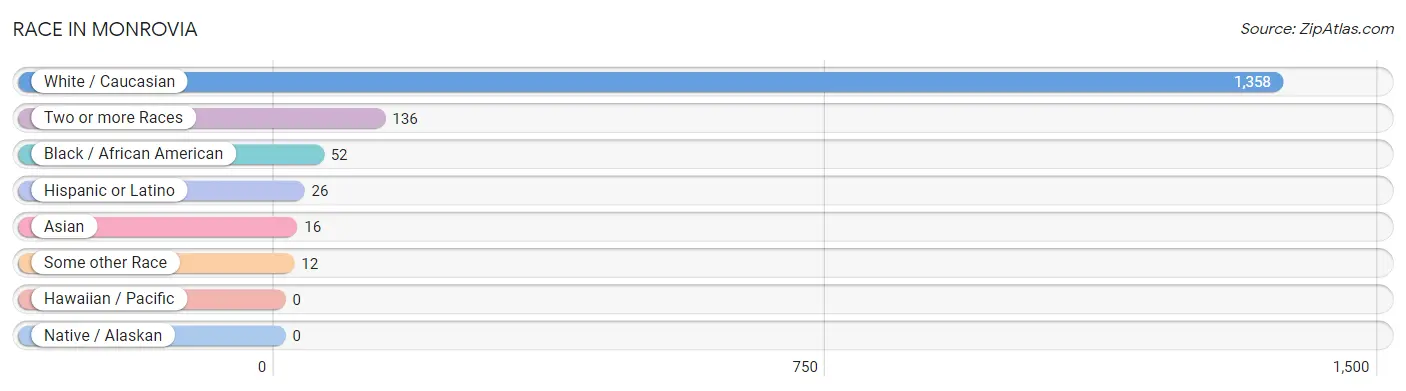
| Race | # Population | % Population |
| Asian | 16 | 1.0% |
| Black / African American | 52 | 3.3% |
| Hawaiian / Pacific | 0 | 0.0% |
| Hispanic or Latino | 26 | 1.7% |
| Native / Alaskan | 0 | 0.0% |
| White / Caucasian | 1,358 | 86.3% |
| Two or more Races | 136 | 8.6% |
| Some other Race | 12 | 0.8% |
| Total | 1,574 | 100.0% |
Ancestry in Monrovia
The most populous ancestries reported in Monrovia are American (237 | 15.1%), German (228 | 14.5%), English (171 | 10.9%), Irish (124 | 7.9%), and French (46 | 2.9%), together accounting for 51.2% of all Monrovia residents.
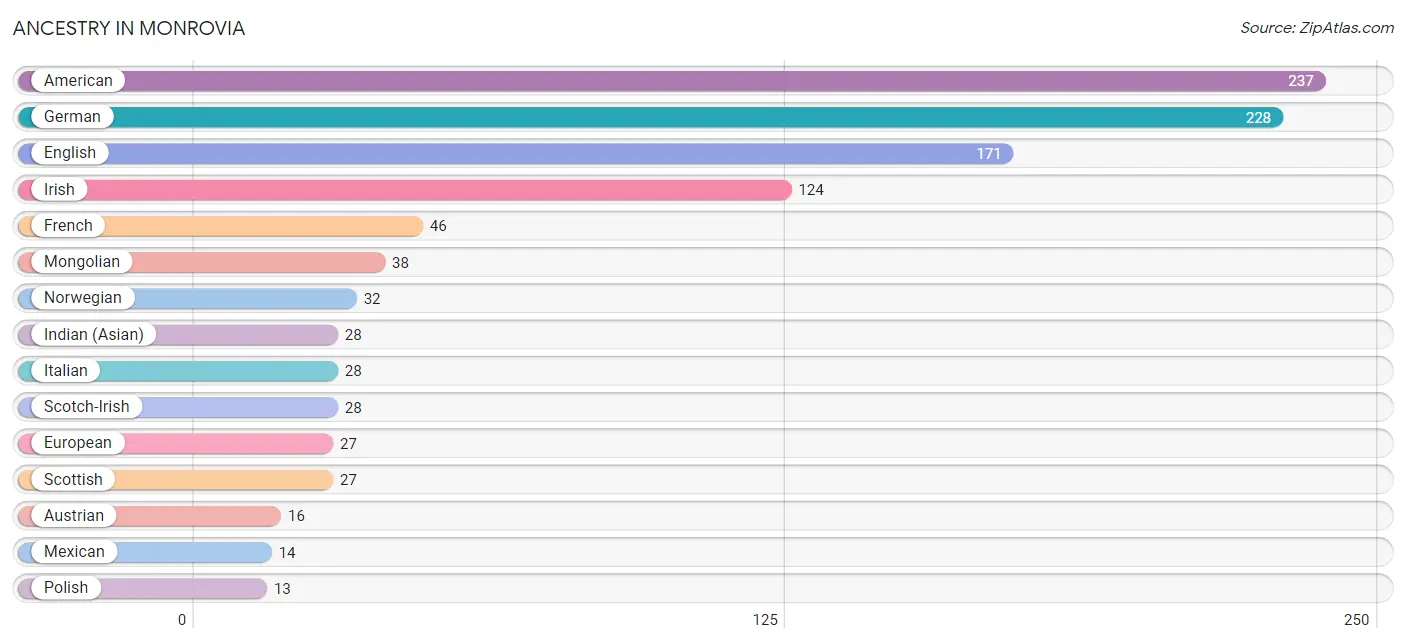
| Ancestry | # Population | % Population |
| American | 237 | 15.1% |
| Australian | 4 | 0.3% |
| Austrian | 16 | 1.0% |
| British | 2 | 0.1% |
| Burmese | 10 | 0.6% |
| Czech | 11 | 0.7% |
| Danish | 12 | 0.8% |
| Dutch | 8 | 0.5% |
| Eastern European | 4 | 0.3% |
| English | 171 | 10.9% |
| European | 27 | 1.7% |
| French | 46 | 2.9% |
| German | 228 | 14.5% |
| Indian (Asian) | 28 | 1.8% |
| Indonesian | 2 | 0.1% |
| Irish | 124 | 7.9% |
| Italian | 28 | 1.8% |
| Mexican | 14 | 0.9% |
| Mongolian | 38 | 2.4% |
| Norwegian | 32 | 2.0% |
| Polish | 13 | 0.8% |
| Puerto Rican | 12 | 0.8% |
| Romanian | 3 | 0.2% |
| Scandinavian | 7 | 0.4% |
| Scotch-Irish | 28 | 1.8% |
| Scottish | 27 | 1.7% |
| Slovene | 6 | 0.4% |
| Welsh | 10 | 0.6% | View All 28 Rows |
Immigrants in Monrovia
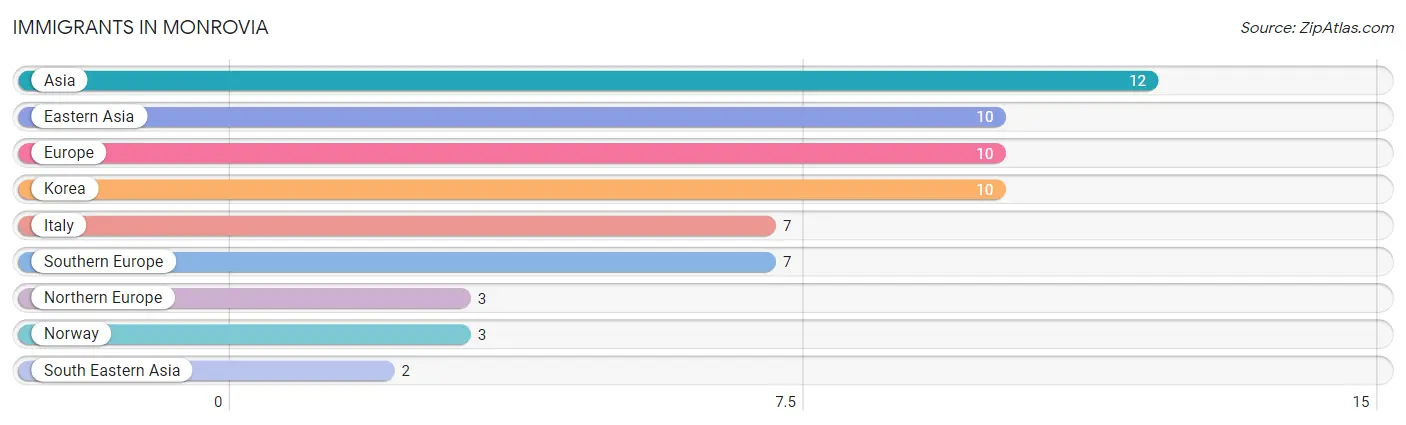
The most numerous immigrant groups reported in Monrovia came from Asia (12 | 0.8%), Eastern Asia (10 | 0.6%), Europe (10 | 0.6%), Korea (10 | 0.6%), and Italy (7 | 0.4%), together accounting for 3.1% of all Monrovia residents.
| Immigration Origin | # Population | % Population |
| Asia | 12 | 0.8% |
| Eastern Asia | 10 | 0.6% |
| Europe | 10 | 0.6% |
| Italy | 7 | 0.4% |
| Korea | 10 | 0.6% |
| Northern Europe | 3 | 0.2% |
| Norway | 3 | 0.2% |
| South Eastern Asia | 2 | 0.1% |
| Southern Europe | 7 | 0.4% | View All 9 Rows |
Sex and Age in Monrovia
Sex and Age in Monrovia
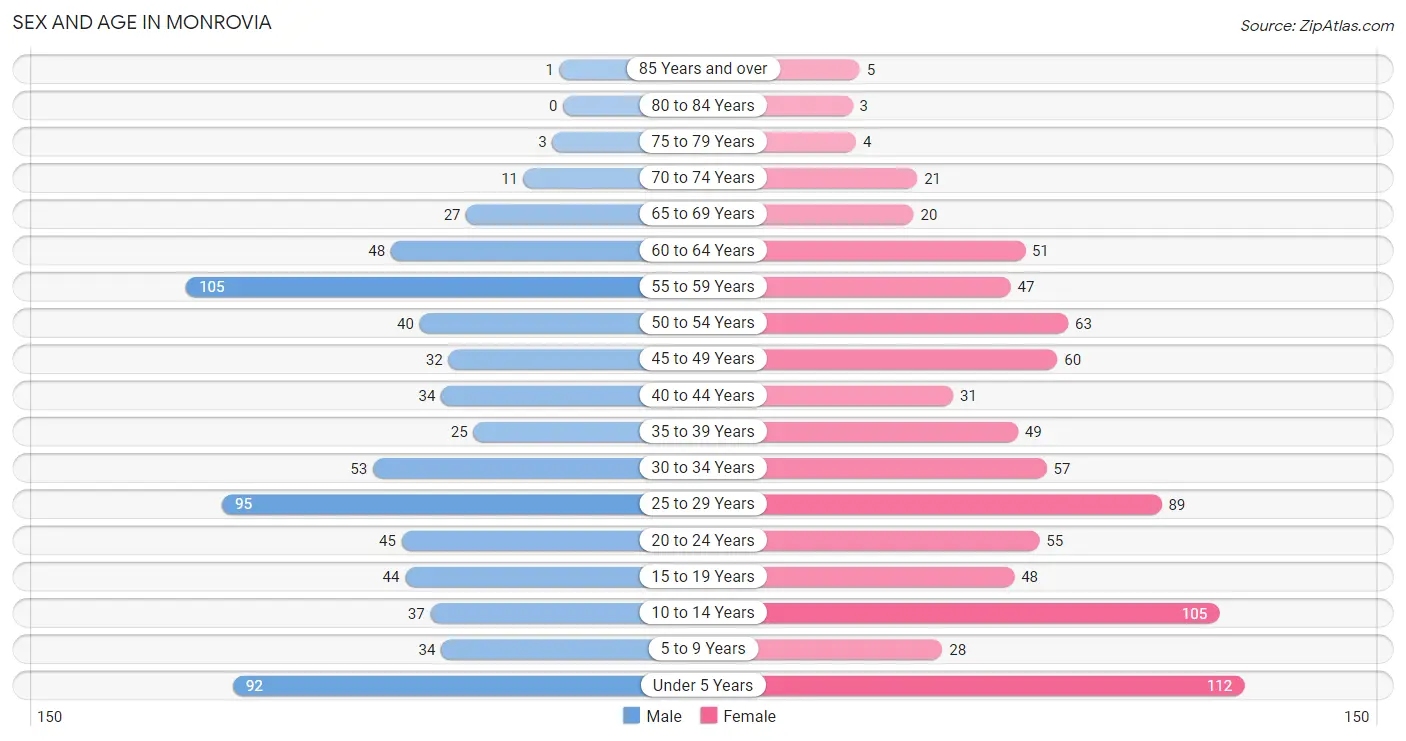
The most populous age groups in Monrovia are 55 to 59 Years (105 | 14.5%) for men and Under 5 Years (112 | 13.2%) for women.
| Age Bracket | Male | Female |
| Under 5 Years | 92 (12.7%) | 112 (13.2%) |
| 5 to 9 Years | 34 (4.7%) | 28 (3.3%) |
| 10 to 14 Years | 37 (5.1%) | 105 (12.4%) |
| 15 to 19 Years | 44 (6.1%) | 48 (5.7%) |
| 20 to 24 Years | 45 (6.2%) | 55 (6.5%) |
| 25 to 29 Years | 95 (13.1%) | 89 (10.5%) |
| 30 to 34 Years | 53 (7.3%) | 57 (6.7%) |
| 35 to 39 Years | 25 (3.4%) | 49 (5.8%) |
| 40 to 44 Years | 34 (4.7%) | 31 (3.7%) |
| 45 to 49 Years | 32 (4.4%) | 60 (7.1%) |
| 50 to 54 Years | 40 (5.5%) | 63 (7.4%) |
| 55 to 59 Years | 105 (14.5%) | 47 (5.5%) |
| 60 to 64 Years | 48 (6.6%) | 51 (6.0%) |
| 65 to 69 Years | 27 (3.7%) | 20 (2.4%) |
| 70 to 74 Years | 11 (1.5%) | 21 (2.5%) |
| 75 to 79 Years | 3 (0.4%) | 4 (0.5%) |
| 80 to 84 Years | 0 (0.0%) | 3 (0.4%) |
| 85 Years and over | 1 (0.1%) | 5 (0.6%) |
| Total | 726 (100.0%) | 848 (100.0%) |
Families and Households in Monrovia
Median Family Size in Monrovia
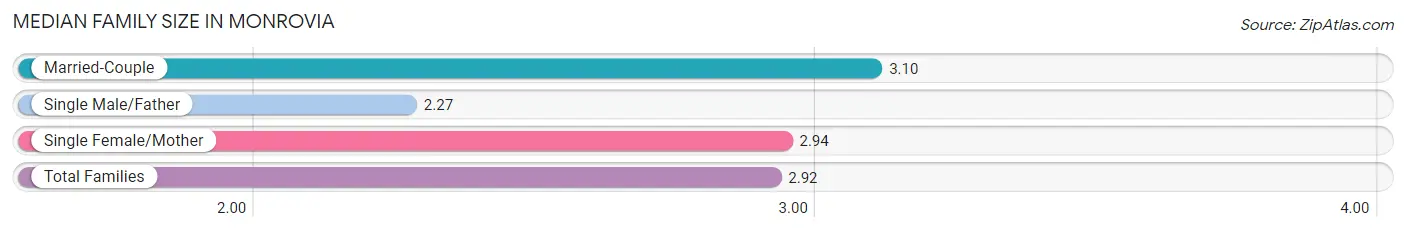
The median family size in Monrovia is 2.92 persons per family, with married-couple families (287 | 60.0%) accounting for the largest median family size of 3.1 persons per family. On the other hand, single male/father families (82 | 17.2%) represent the smallest median family size with 2.27 persons per family.
| Family Type | # Families | Family Size |
| Married-Couple | 287 (60.0%) | 3.10 |
| Single Male/Father | 82 (17.2%) | 2.27 |
| Single Female/Mother | 109 (22.8%) | 2.94 |
| Total Families | 478 (100.0%) | 2.92 |
Median Household Size in Monrovia
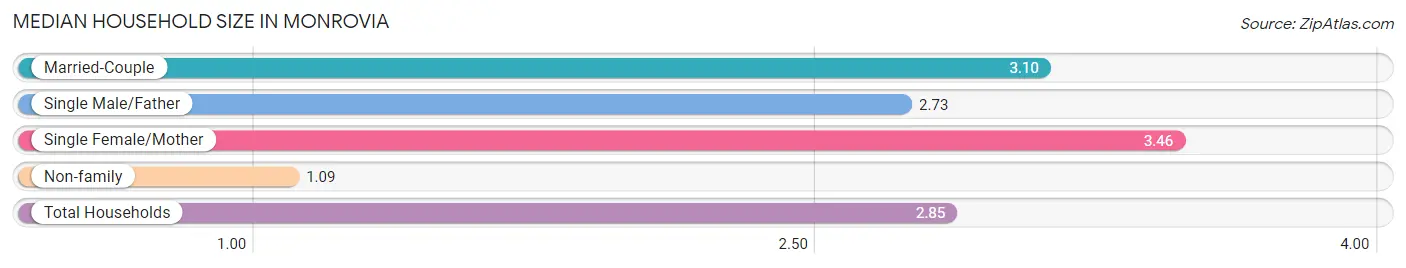
The median household size in Monrovia is 2.85 persons per household, with single female/mother households (109 | 19.7%) accounting for the largest median household size of 3.46 persons per household. non-family households (75 | 13.6%) represent the smallest median household size with 1.09 persons per household.
| Household Type | # Households | Household Size |
| Married-Couple | 287 (51.9%) | 3.10 |
| Single Male/Father | 82 (14.8%) | 2.73 |
| Single Female/Mother | 109 (19.7%) | 3.46 |
| Non-family | 75 (13.6%) | 1.09 |
| Total Households | 553 (100.0%) | 2.85 |
Household Size by Marriage Status in Monrovia
Out of a total of 553 households in Monrovia, 478 (86.4%) are family households, while 75 (13.6%) are nonfamily households. The most numerous type of family households are 2-person households, comprising 180, and the most common type of nonfamily households are 1-person households, comprising 70.
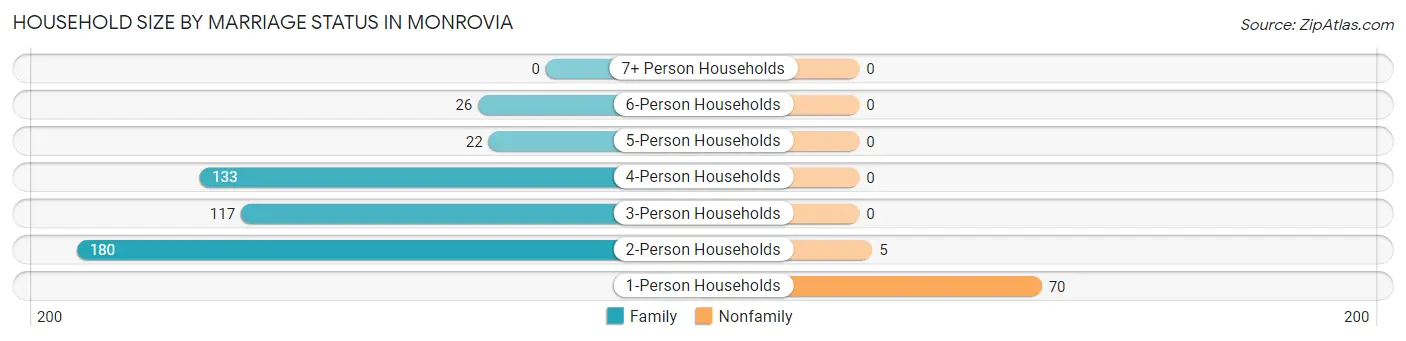
| Household Size | Family Households | Nonfamily Households |
| 1-Person Households | - | 70 (12.7%) |
| 2-Person Households | 180 (32.6%) | 5 (0.9%) |
| 3-Person Households | 117 (21.2%) | 0 (0.0%) |
| 4-Person Households | 133 (24.0%) | 0 (0.0%) |
| 5-Person Households | 22 (4.0%) | 0 (0.0%) |
| 6-Person Households | 26 (4.7%) | 0 (0.0%) |
| 7+ Person Households | 0 (0.0%) | 0 (0.0%) |
| Total | 478 (86.4%) | 75 (13.6%) |
Female Fertility in Monrovia
Fertility by Age in Monrovia
Average fertility rate in Monrovia is 106.0 births per 1,000 women. Women in the age bracket of 20 to 34 years have the highest fertility rate with 209.0 births per 1,000 women. Women in the age bracket of 20 to 34 years acount for 100.0% of all women with births.
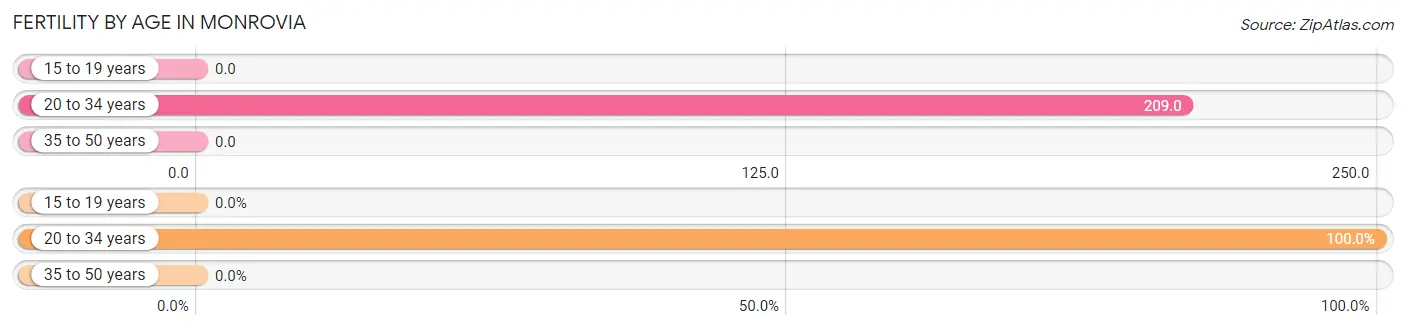
| Age Bracket | Women with Births | Births / 1,000 Women |
| 15 to 19 years | 0 (0.0%) | 0.0 |
| 20 to 34 years | 42 (100.0%) | 209.0 |
| 35 to 50 years | 0 (0.0%) | 0.0 |
| Total | 42 (100.0%) | 106.0 |
Fertility by Age by Marriage Status in Monrovia
57.1% of women with births (42) in Monrovia are married. The highest percentage of unmarried women with births falls into 20 to 34 years age bracket with 42.9% of them unmarried at the time of birth, while the lowest percentage of unmarried women with births belong to 20 to 34 years age bracket with 42.9% of them unmarried.
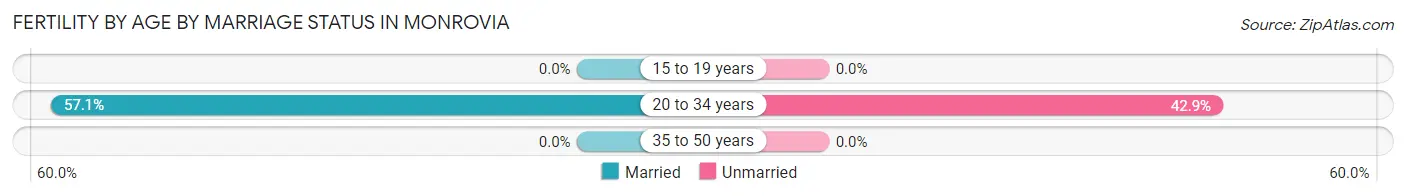
| Age Bracket | Married | Unmarried |
| 15 to 19 years | 0 (0.0%) | 0 (0.0%) |
| 20 to 34 years | 24 (57.1%) | 18 (42.9%) |
| 35 to 50 years | 0 (0.0%) | 0 (0.0%) |
| Total | 24 (57.1%) | 18 (42.9%) |
Fertility by Education in Monrovia
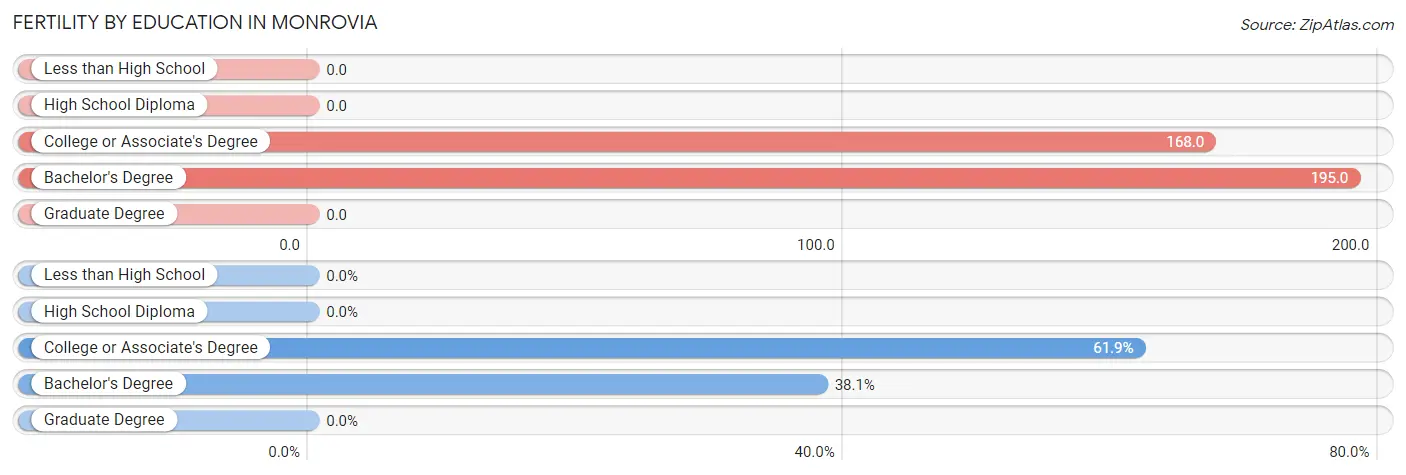
| Educational Attainment | Women with Births | Births / 1,000 Women |
| Less than High School | 0 (0.0%) | 0.0 |
| High School Diploma | 0 (0.0%) | 0.0 |
| College or Associate's Degree | 26 (61.9%) | 168.0 |
| Bachelor's Degree | 16 (38.1%) | 195.0 |
| Graduate Degree | 0 (0.0%) | 0.0 |
| Total | 42 (100.0%) | 106.0 |
Fertility by Education by Marriage Status in Monrovia
42.9% of women with births in Monrovia are unmarried. Women with the educational attainment of bachelor's degree are most likely to be married with 100.0% of them married at childbirth, while women with the educational attainment of college or associate's degree are least likely to be married with 69.2% of them unmarried at childbirth.
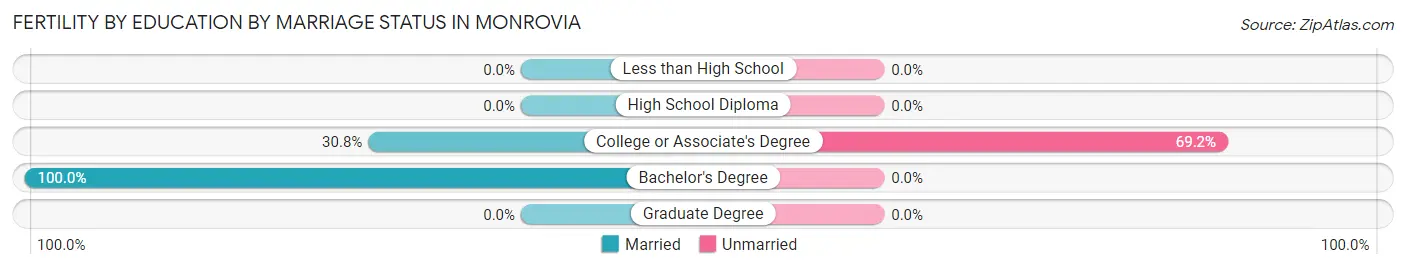
| Educational Attainment | Married | Unmarried |
| Less than High School | 0 (0.0%) | 0 (0.0%) |
| High School Diploma | 0 (0.0%) | 0 (0.0%) |
| College or Associate's Degree | 8 (30.8%) | 18 (69.2%) |
| Bachelor's Degree | 16 (100.0%) | 0 (0.0%) |
| Graduate Degree | 0 (0.0%) | 0 (0.0%) |
| Total | 24 (57.1%) | 18 (42.9%) |
Employment Characteristics in Monrovia
Employment by Class of Employer in Monrovia
Among the 839 employed individuals in Monrovia, private company employees (647 | 77.1%), not-for-profit organizations (88 | 10.5%), and local government employees (52 | 6.2%) make up the most common classes of employment.
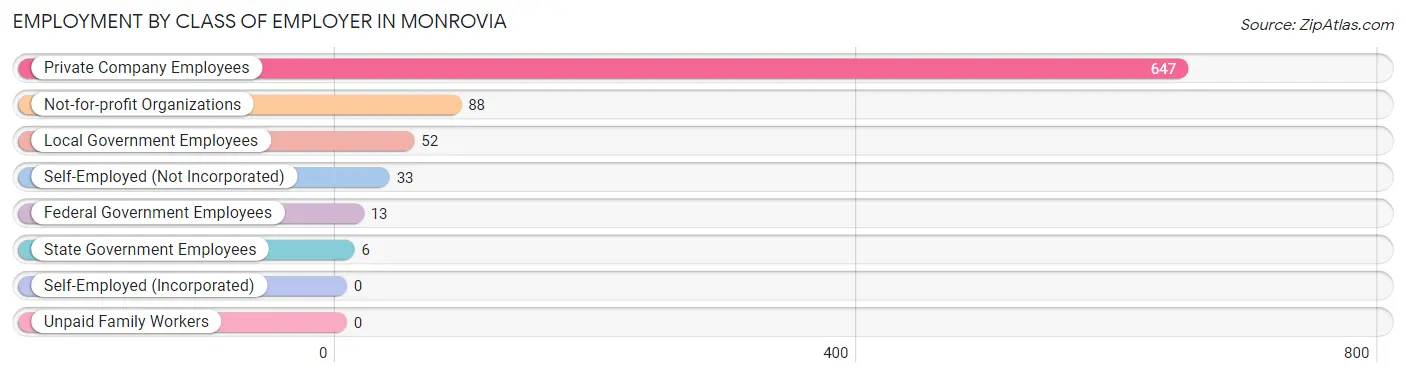
| Employer Class | # Employees | % Employees |
| Private Company Employees | 647 | 77.1% |
| Self-Employed (Incorporated) | 0 | 0.0% |
| Self-Employed (Not Incorporated) | 33 | 3.9% |
| Not-for-profit Organizations | 88 | 10.5% |
| Local Government Employees | 52 | 6.2% |
| State Government Employees | 6 | 0.7% |
| Federal Government Employees | 13 | 1.5% |
| Unpaid Family Workers | 0 | 0.0% |
| Total | 839 | 100.0% |
Employment Status by Age in Monrovia
According to the labor force statistics for Monrovia, out of the total population over 16 years of age (1,138), 77.4% or 881 individuals are in the labor force, with 2.2% or 19 of them unemployed. The age group with the highest labor force participation rate is 35 to 44 years, with 100.0% or 139 individuals in the labor force. Within the labor force, the 20 to 24 years age range has the highest percentage of unemployed individuals, with 5.6% or 5 of them being unemployed.
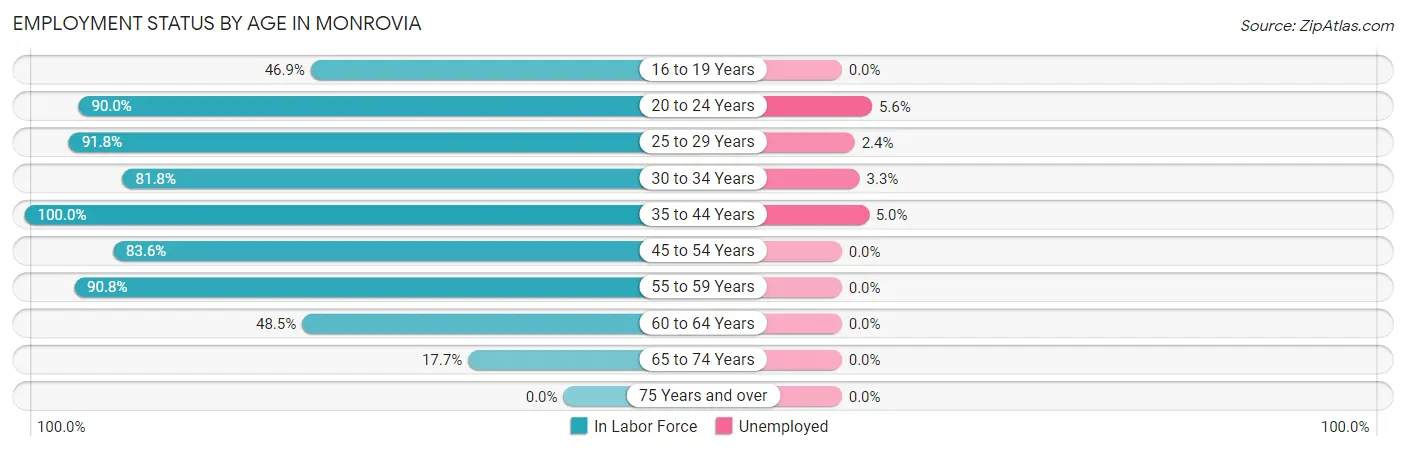
| Age Bracket | In Labor Force | Unemployed |
| 16 to 19 Years | 30 (46.9%) | 0 (0.0%) |
| 20 to 24 Years | 90 (90.0%) | 5 (5.6%) |
| 25 to 29 Years | 169 (91.8%) | 4 (2.4%) |
| 30 to 34 Years | 90 (81.8%) | 3 (3.3%) |
| 35 to 44 Years | 139 (100.0%) | 7 (5.0%) |
| 45 to 54 Years | 163 (83.6%) | 0 (0.0%) |
| 55 to 59 Years | 138 (90.8%) | 0 (0.0%) |
| 60 to 64 Years | 48 (48.5%) | 0 (0.0%) |
| 65 to 74 Years | 14 (17.7%) | 0 (0.0%) |
| 75 Years and over | 0 (0.0%) | 0 (0.0%) |
| Total | 881 (77.4%) | 19 (2.2%) |
Employment Status by Educational Attainment in Monrovia
According to labor force statistics for Monrovia, 85.0% of individuals (747) out of the total population between 25 and 64 years of age (879) are in the labor force, with 1.9% or 14 of them being unemployed. The group with the highest labor force participation rate are those with the educational attainment of bachelor's degree or higher, with 96.9% or 186 individuals in the labor force. Within the labor force, individuals with high school diploma education have the highest percentage of unemployment, with 4.3% or 11 of them being unemployed.
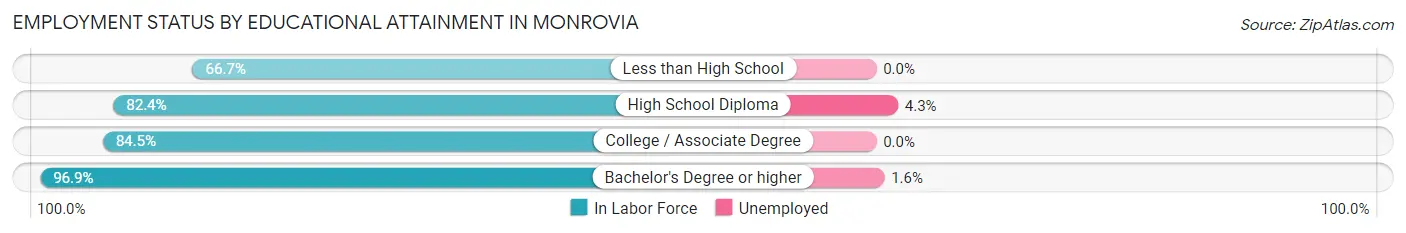
| Educational Attainment | In Labor Force | Unemployed |
| Less than High School | 48 (66.7%) | 0 (0.0%) |
| High School Diploma | 267 (82.4%) | 14 (4.3%) |
| College / Associate Degree | 246 (84.5%) | 0 (0.0%) |
| Bachelor's Degree or higher | 186 (96.9%) | 3 (1.6%) |
| Total | 747 (85.0%) | 17 (1.9%) |
Employment Occupations by Sex in Monrovia
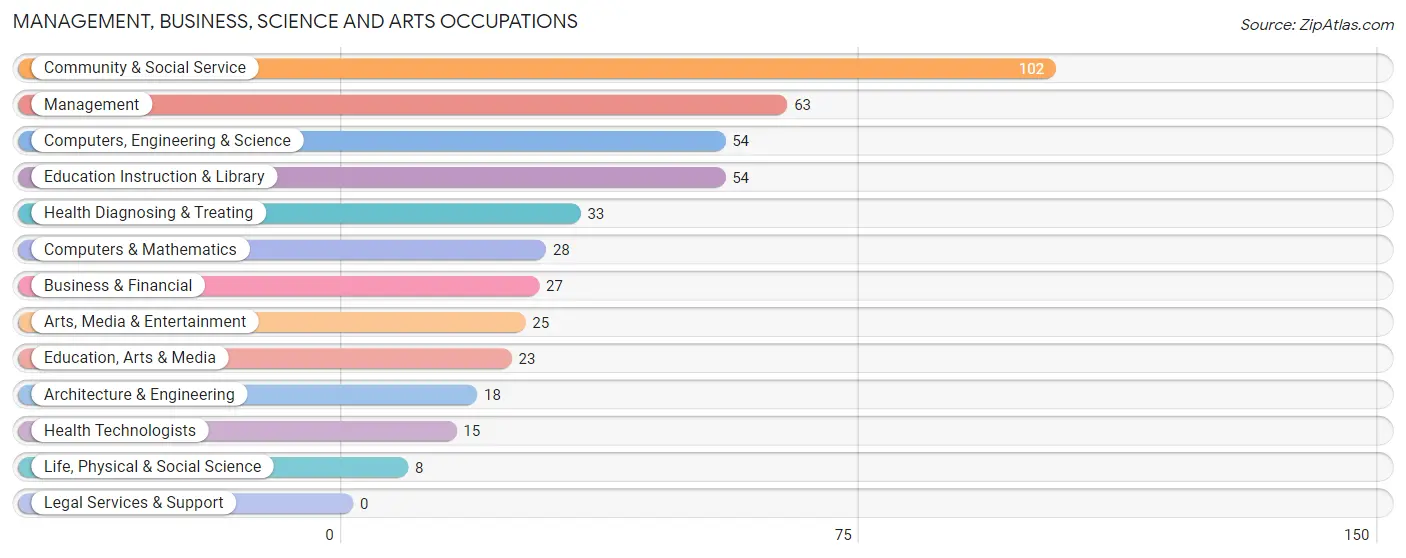
Management, Business, Science and Arts Occupations
The most common Management, Business, Science and Arts occupations in Monrovia are Community & Social Service (102 | 12.0%), Management (63 | 7.4%), Computers, Engineering & Science (54 | 6.3%), Education Instruction & Library (54 | 6.3%), and Health Diagnosing & Treating (33 | 3.9%).
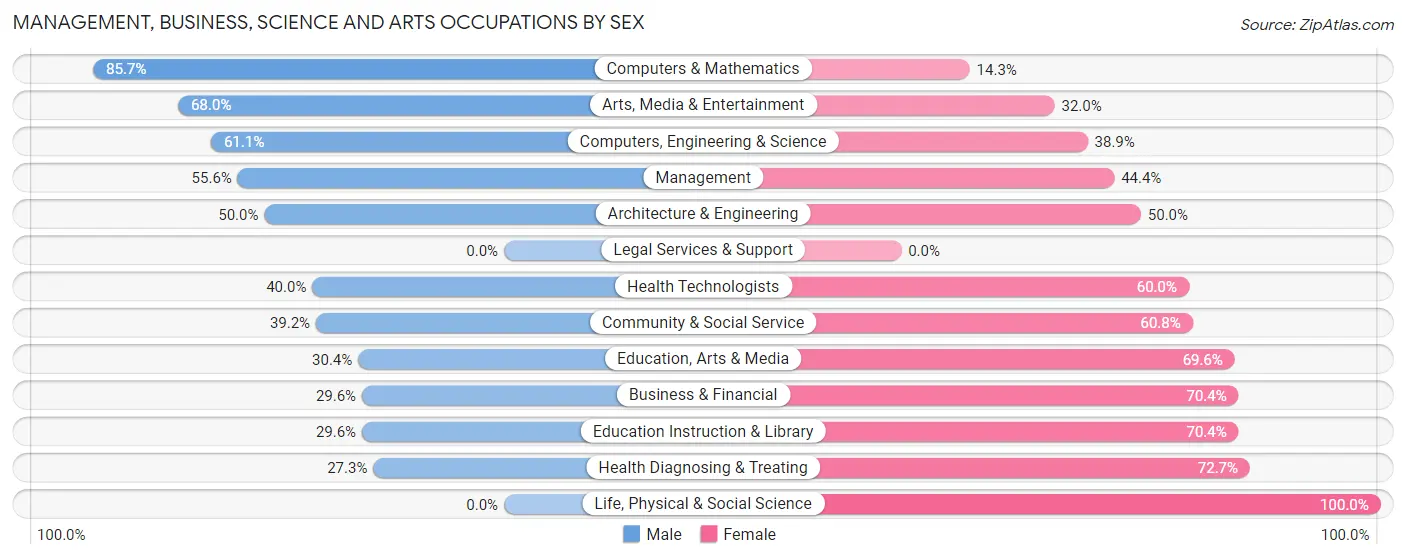
Management, Business, Science and Arts Occupations by Sex
Within the Management, Business, Science and Arts occupations in Monrovia, the most male-oriented occupations are Computers & Mathematics (85.7%), Arts, Media & Entertainment (68.0%), and Computers, Engineering & Science (61.1%), while the most female-oriented occupations are Life, Physical & Social Science (100.0%), Health Diagnosing & Treating (72.7%), and Business & Financial (70.4%).
| Occupation | Male | Female |
| Management | 35 (55.6%) | 28 (44.4%) |
| Business & Financial | 8 (29.6%) | 19 (70.4%) |
| Computers, Engineering & Science | 33 (61.1%) | 21 (38.9%) |
| Computers & Mathematics | 24 (85.7%) | 4 (14.3%) |
| Architecture & Engineering | 9 (50.0%) | 9 (50.0%) |
| Life, Physical & Social Science | 0 (0.0%) | 8 (100.0%) |
| Community & Social Service | 40 (39.2%) | 62 (60.8%) |
| Education, Arts & Media | 7 (30.4%) | 16 (69.6%) |
| Legal Services & Support | 0 (0.0%) | 0 (0.0%) |
| Education Instruction & Library | 16 (29.6%) | 38 (70.4%) |
| Arts, Media & Entertainment | 17 (68.0%) | 8 (32.0%) |
| Health Diagnosing & Treating | 9 (27.3%) | 24 (72.7%) |
| Health Technologists | 6 (40.0%) | 9 (60.0%) |
| Total (Category) | 125 (44.8%) | 154 (55.2%) |
| Total (Overall) | 441 (51.7%) | 412 (48.3%) |
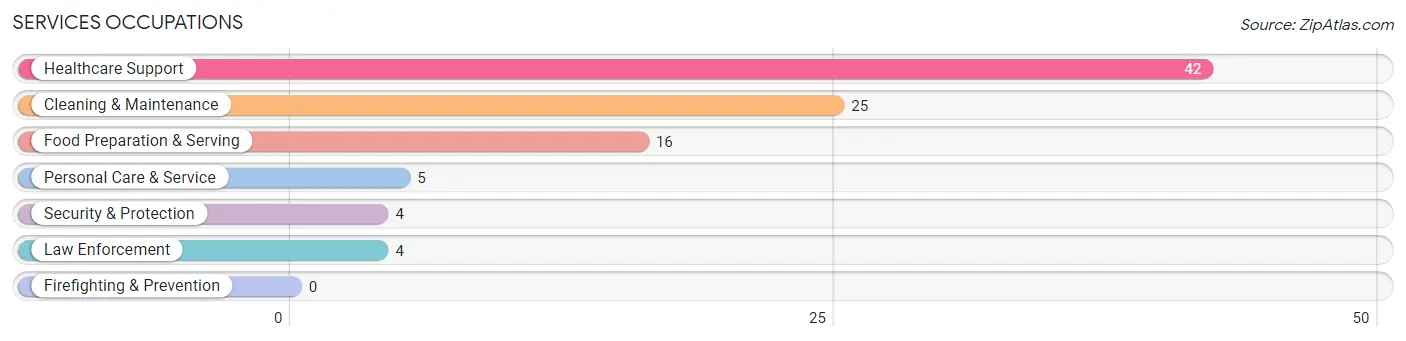
Services Occupations
The most common Services occupations in Monrovia are Healthcare Support (42 | 4.9%), Cleaning & Maintenance (25 | 2.9%), Food Preparation & Serving (16 | 1.9%), Personal Care & Service (5 | 0.6%), and Security & Protection (4 | 0.5%).
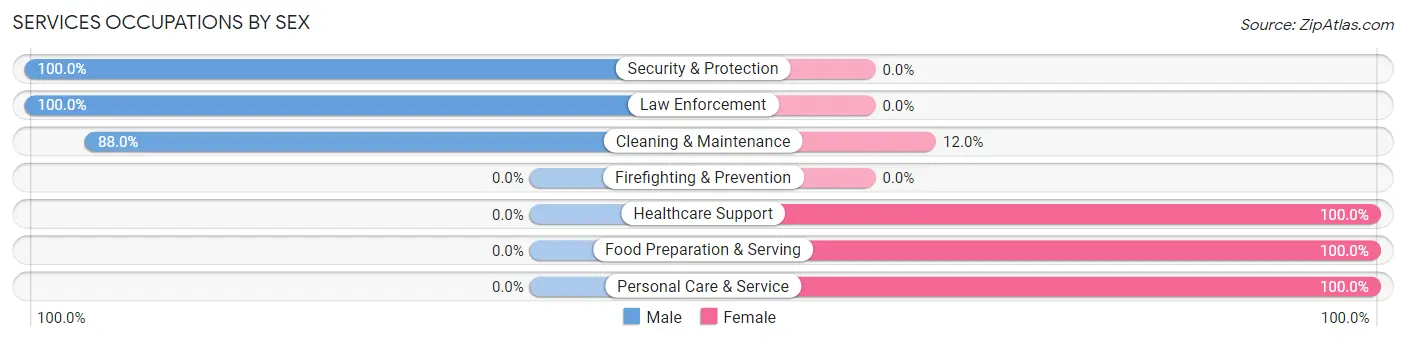
Services Occupations by Sex
Within the Services occupations in Monrovia, the most male-oriented occupations are Security & Protection (100.0%), Law Enforcement (100.0%), and Cleaning & Maintenance (88.0%), while the most female-oriented occupations are Healthcare Support (100.0%), Food Preparation & Serving (100.0%), and Personal Care & Service (100.0%).
| Occupation | Male | Female |
| Healthcare Support | 0 (0.0%) | 42 (100.0%) |
| Security & Protection | 4 (100.0%) | 0 (0.0%) |
| Firefighting & Prevention | 0 (0.0%) | 0 (0.0%) |
| Law Enforcement | 4 (100.0%) | 0 (0.0%) |
| Food Preparation & Serving | 0 (0.0%) | 16 (100.0%) |
| Cleaning & Maintenance | 22 (88.0%) | 3 (12.0%) |
| Personal Care & Service | 0 (0.0%) | 5 (100.0%) |
| Total (Category) | 26 (28.3%) | 66 (71.7%) |
| Total (Overall) | 441 (51.7%) | 412 (48.3%) |
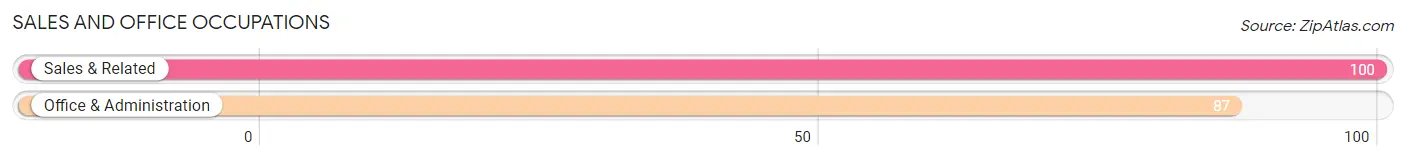
Sales and Office Occupations
The most common Sales and Office occupations in Monrovia are Sales & Related (100 | 11.7%), and Office & Administration (87 | 10.2%).
Sales and Office Occupations by Sex
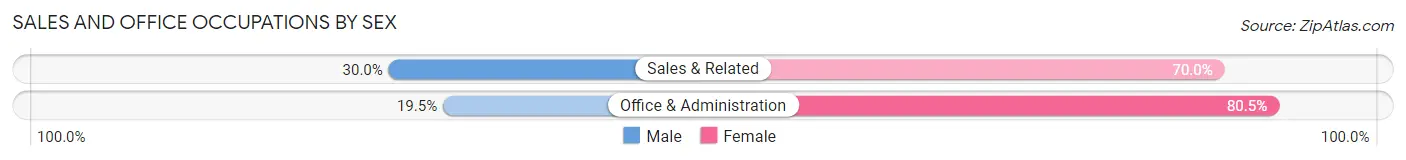
| Occupation | Male | Female |
| Sales & Related | 30 (30.0%) | 70 (70.0%) |
| Office & Administration | 17 (19.5%) | 70 (80.5%) |
| Total (Category) | 47 (25.1%) | 140 (74.9%) |
| Total (Overall) | 441 (51.7%) | 412 (48.3%) |
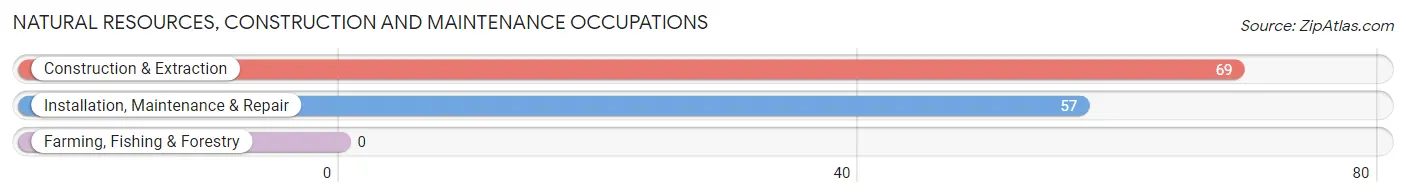
Natural Resources, Construction and Maintenance Occupations
The most common Natural Resources, Construction and Maintenance occupations in Monrovia are Construction & Extraction (69 | 8.1%), and Installation, Maintenance & Repair (57 | 6.7%).
Natural Resources, Construction and Maintenance Occupations by Sex
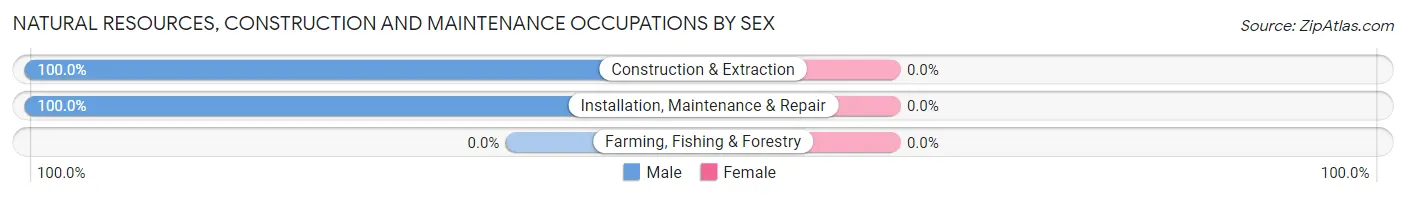
| Occupation | Male | Female |
| Farming, Fishing & Forestry | 0 (0.0%) | 0 (0.0%) |
| Construction & Extraction | 69 (100.0%) | 0 (0.0%) |
| Installation, Maintenance & Repair | 57 (100.0%) | 0 (0.0%) |
| Total (Category) | 126 (100.0%) | 0 (0.0%) |
| Total (Overall) | 441 (51.7%) | 412 (48.3%) |
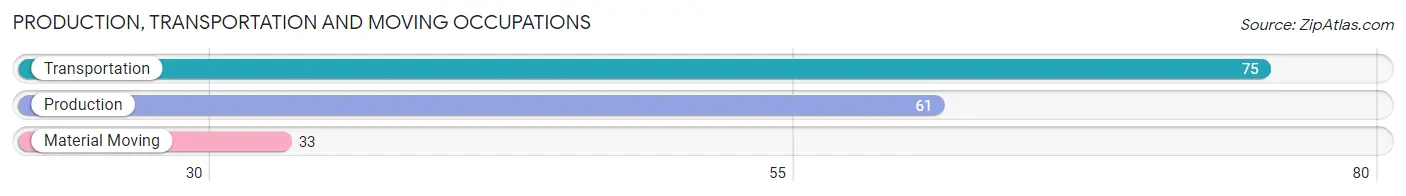
Production, Transportation and Moving Occupations
The most common Production, Transportation and Moving occupations in Monrovia are Transportation (75 | 8.8%), Production (61 | 7.1%), and Material Moving (33 | 3.9%).
Production, Transportation and Moving Occupations by Sex
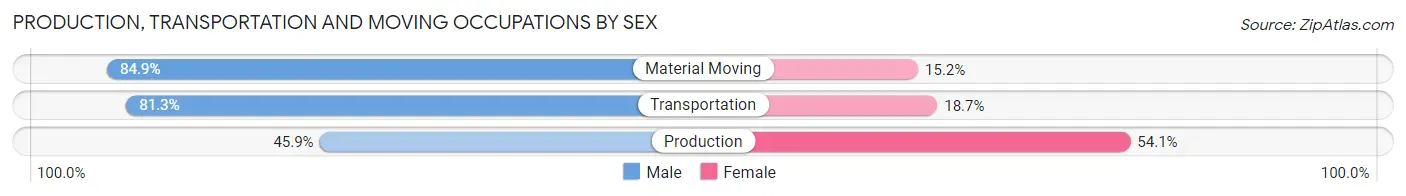
| Occupation | Male | Female |
| Production | 28 (45.9%) | 33 (54.1%) |
| Transportation | 61 (81.3%) | 14 (18.7%) |
| Material Moving | 28 (84.9%) | 5 (15.1%) |
| Total (Category) | 117 (69.2%) | 52 (30.8%) |
| Total (Overall) | 441 (51.7%) | 412 (48.3%) |
Employment Industries by Sex in Monrovia
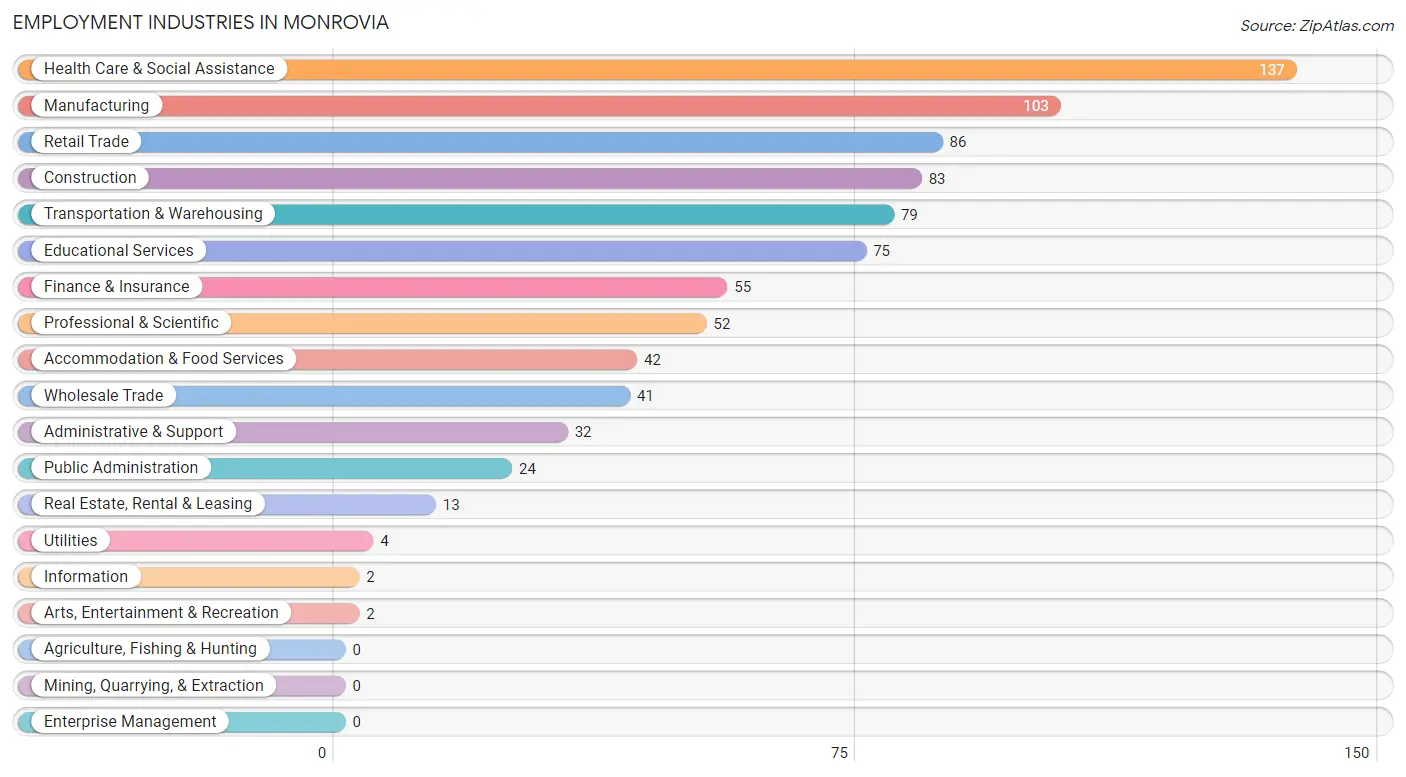
Employment Industries in Monrovia
The major employment industries in Monrovia include Health Care & Social Assistance (137 | 16.1%), Manufacturing (103 | 12.1%), Retail Trade (86 | 10.1%), Construction (83 | 9.7%), and Transportation & Warehousing (79 | 9.3%).
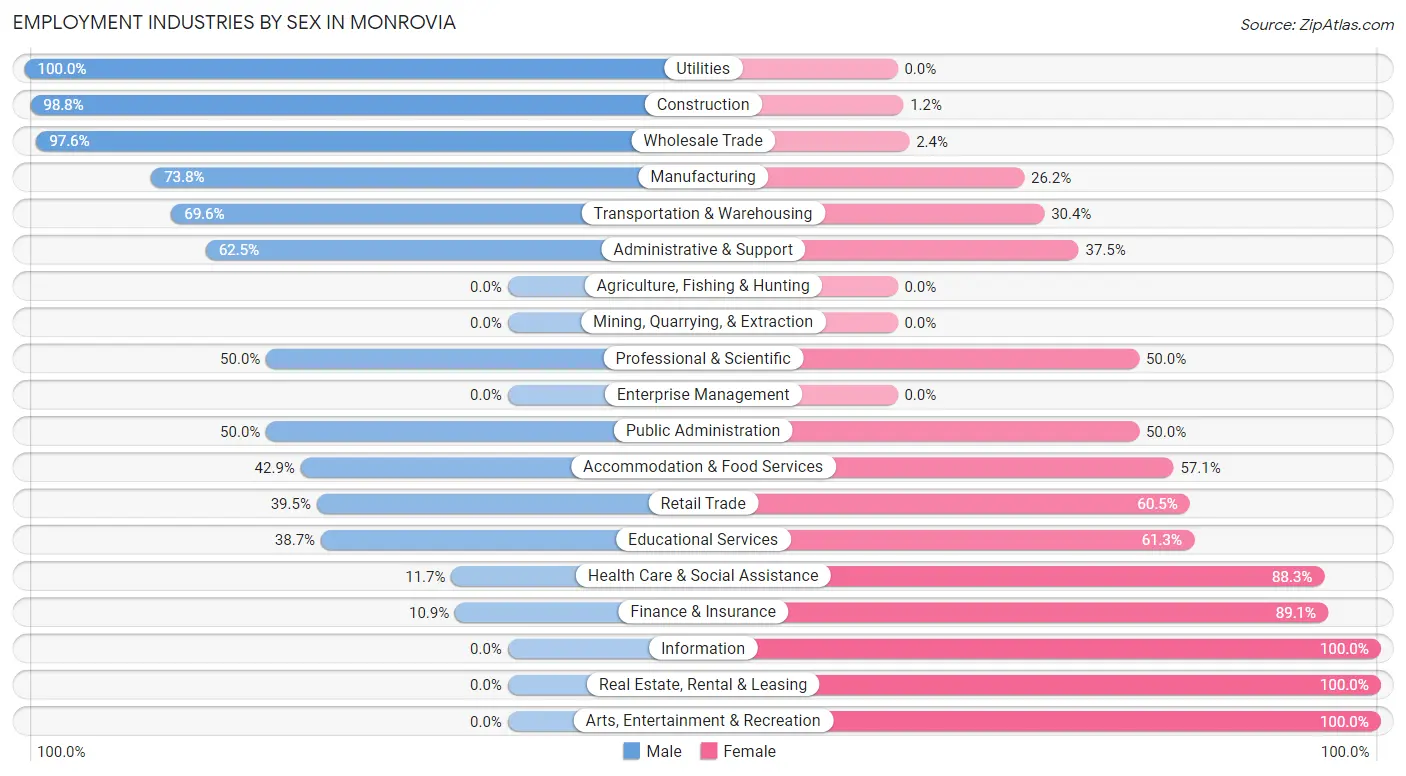
Employment Industries by Sex in Monrovia
The Monrovia industries that see more men than women are Utilities (100.0%), Construction (98.8%), and Wholesale Trade (97.6%), whereas the industries that tend to have a higher number of women are Information (100.0%), Real Estate, Rental & Leasing (100.0%), and Arts, Entertainment & Recreation (100.0%).
| Industry | Male | Female |
| Agriculture, Fishing & Hunting | 0 (0.0%) | 0 (0.0%) |
| Mining, Quarrying, & Extraction | 0 (0.0%) | 0 (0.0%) |
| Construction | 82 (98.8%) | 1 (1.2%) |
| Manufacturing | 76 (73.8%) | 27 (26.2%) |
| Wholesale Trade | 40 (97.6%) | 1 (2.4%) |
| Retail Trade | 34 (39.5%) | 52 (60.5%) |
| Transportation & Warehousing | 55 (69.6%) | 24 (30.4%) |
| Utilities | 4 (100.0%) | 0 (0.0%) |
| Information | 0 (0.0%) | 2 (100.0%) |
| Finance & Insurance | 6 (10.9%) | 49 (89.1%) |
| Real Estate, Rental & Leasing | 0 (0.0%) | 13 (100.0%) |
| Professional & Scientific | 26 (50.0%) | 26 (50.0%) |
| Enterprise Management | 0 (0.0%) | 0 (0.0%) |
| Administrative & Support | 20 (62.5%) | 12 (37.5%) |
| Educational Services | 29 (38.7%) | 46 (61.3%) |
| Health Care & Social Assistance | 16 (11.7%) | 121 (88.3%) |
| Arts, Entertainment & Recreation | 0 (0.0%) | 2 (100.0%) |
| Accommodation & Food Services | 18 (42.9%) | 24 (57.1%) |
| Public Administration | 12 (50.0%) | 12 (50.0%) |
| Total | 441 (51.7%) | 412 (48.3%) |
Education in Monrovia
School Enrollment in Monrovia
The most common levels of schooling among the 355 students in Monrovia are middle school (114 | 32.1%), college / undergraduate (83 | 23.4%), and high school (74 | 20.8%).
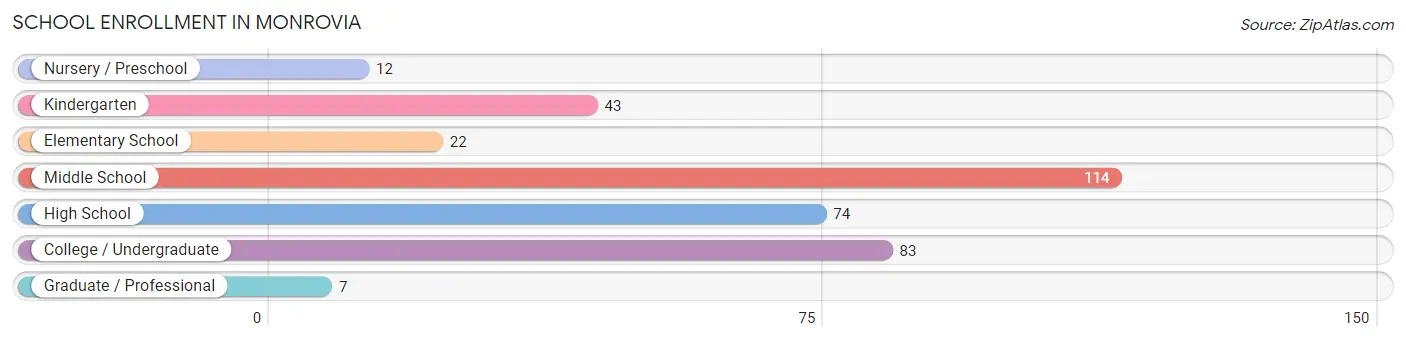
| School Level | # Students | % Students |
| Nursery / Preschool | 12 | 3.4% |
| Kindergarten | 43 | 12.1% |
| Elementary School | 22 | 6.2% |
| Middle School | 114 | 32.1% |
| High School | 74 | 20.8% |
| College / Undergraduate | 83 | 23.4% |
| Graduate / Professional | 7 | 2.0% |
| Total | 355 | 100.0% |
School Enrollment by Age by Funding Source in Monrovia
Out of a total of 355 students who are enrolled in schools in Monrovia, 31 (8.7%) attend a private institution, while the remaining 324 (91.3%) are enrolled in public schools. The age group of 3 to 4 year olds has the highest likelihood of being enrolled in private schools, with 4 (44.4% in the age bracket) enrolled. Conversely, the age group of 18 to 19 year olds has the lowest likelihood of being enrolled in a private school, with 16 (100.0% in the age bracket) attending a public institution.
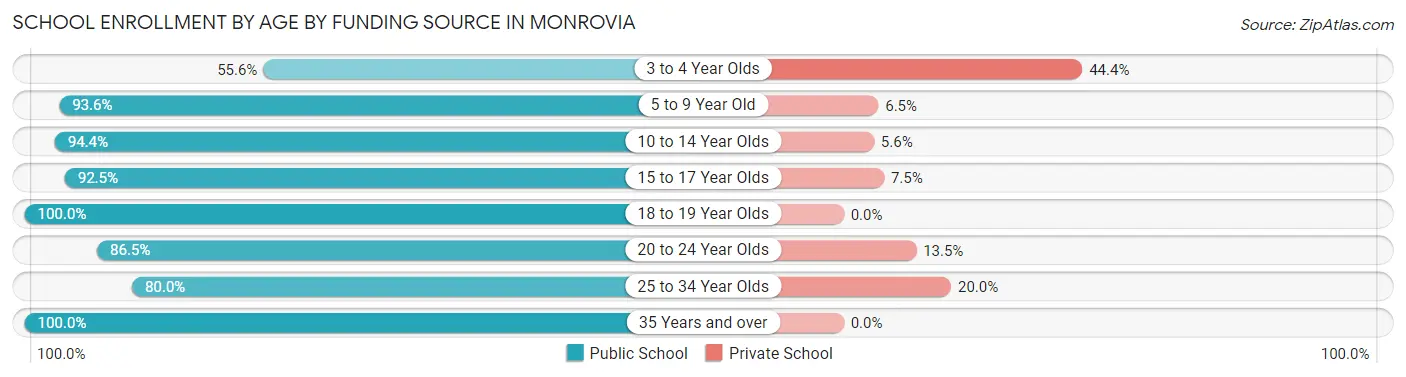
| Age Bracket | Public School | Private School |
| 3 to 4 Year Olds | 5 (55.6%) | 4 (44.4%) |
| 5 to 9 Year Old | 58 (93.5%) | 4 (6.5%) |
| 10 to 14 Year Olds | 134 (94.4%) | 8 (5.6%) |
| 15 to 17 Year Olds | 37 (92.5%) | 3 (7.5%) |
| 18 to 19 Year Olds | 16 (100.0%) | 0 (0.0%) |
| 20 to 24 Year Olds | 32 (86.5%) | 5 (13.5%) |
| 25 to 34 Year Olds | 28 (80.0%) | 7 (20.0%) |
| 35 Years and over | 14 (100.0%) | 0 (0.0%) |
| Total | 324 (91.3%) | 31 (8.7%) |
Educational Attainment by Field of Study in Monrovia
Business (49 | 23.7%), science & technology (41 | 19.8%), bio, nature & agricultural (23 | 11.1%), education (22 | 10.6%), and social sciences (20 | 9.7%) are the most common fields of study among 207 individuals in Monrovia who have obtained a bachelor's degree or higher.
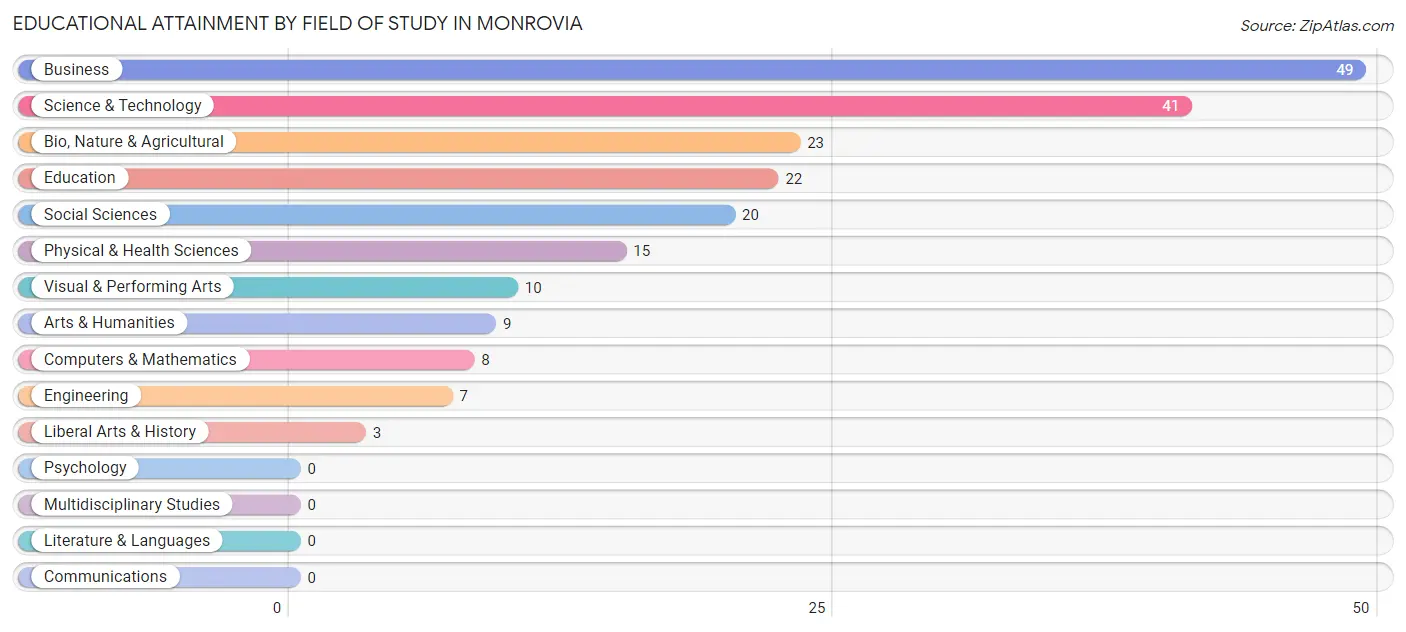
| Field of Study | # Graduates | % Graduates |
| Computers & Mathematics | 8 | 3.9% |
| Bio, Nature & Agricultural | 23 | 11.1% |
| Physical & Health Sciences | 15 | 7.2% |
| Psychology | 0 | 0.0% |
| Social Sciences | 20 | 9.7% |
| Engineering | 7 | 3.4% |
| Multidisciplinary Studies | 0 | 0.0% |
| Science & Technology | 41 | 19.8% |
| Business | 49 | 23.7% |
| Education | 22 | 10.6% |
| Literature & Languages | 0 | 0.0% |
| Liberal Arts & History | 3 | 1.5% |
| Visual & Performing Arts | 10 | 4.8% |
| Communications | 0 | 0.0% |
| Arts & Humanities | 9 | 4.3% |
| Total | 207 | 100.0% |
Transportation & Commute in Monrovia
Vehicle Availability by Sex in Monrovia
The most prevalent vehicle ownership categories in Monrovia are males with 2 vehicles (240, accounting for 53.3%) and females with 2 vehicles (163, making up 61.7%).
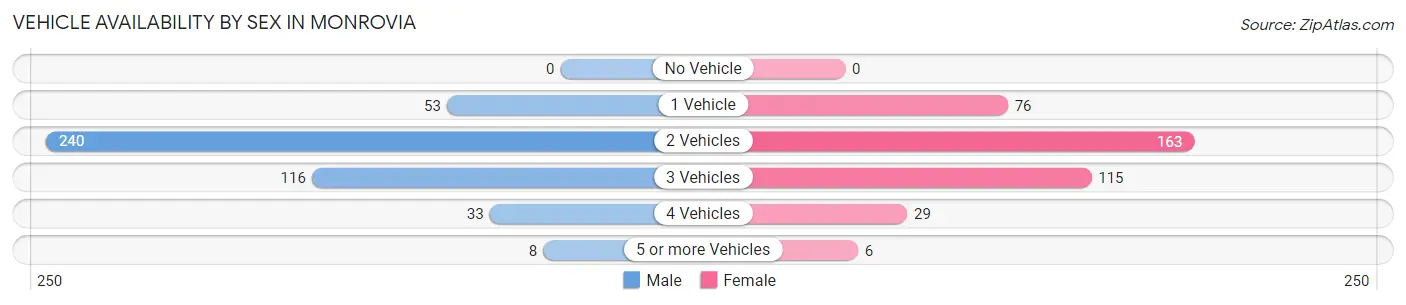
| Vehicles Available | Male | Female |
| No Vehicle | 0 (0.0%) | 0 (0.0%) |
| 1 Vehicle | 53 (11.8%) | 76 (19.5%) |
| 2 Vehicles | 240 (53.3%) | 163 (41.9%) |
| 3 Vehicles | 116 (25.8%) | 115 (29.6%) |
| 4 Vehicles | 33 (7.3%) | 29 (7.5%) |
| 5 or more Vehicles | 8 (1.8%) | 6 (1.5%) |
| Total | 450 (100.0%) | 389 (100.0%) |
Commute Time in Monrovia
The most frequently occuring commute durations in Monrovia are 30 to 34 minutes (185 commuters, 25.7%), 45 to 59 minutes (92 commuters, 12.8%), and 5 to 9 minutes (68 commuters, 9.5%).
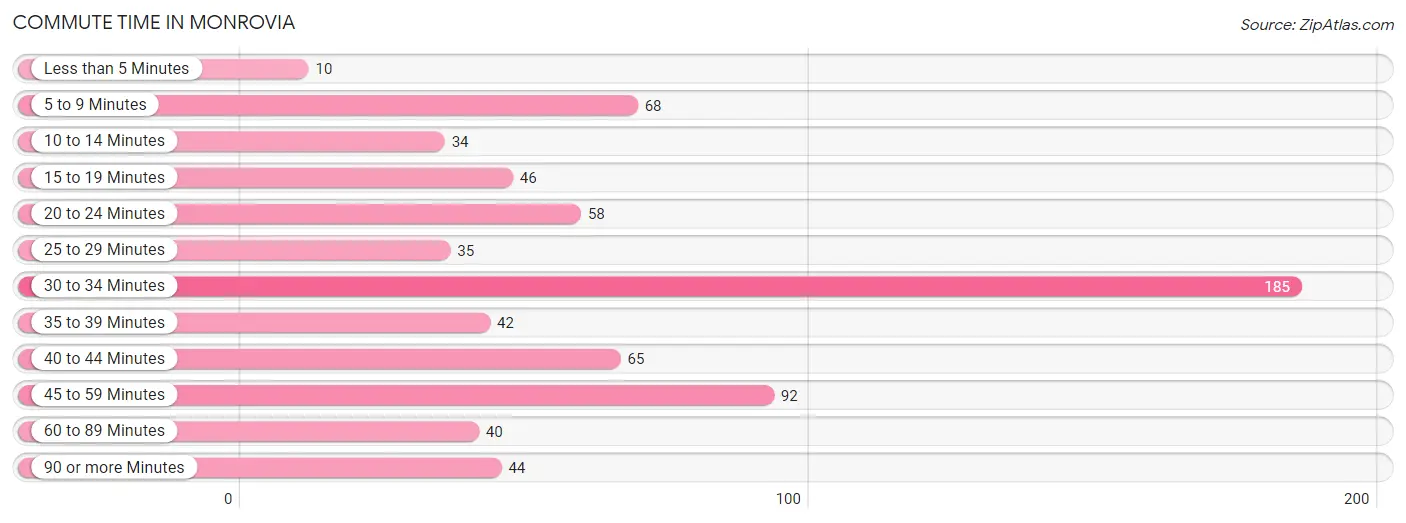
| Commute Time | # Commuters | % Commuters |
| Less than 5 Minutes | 10 | 1.4% |
| 5 to 9 Minutes | 68 | 9.5% |
| 10 to 14 Minutes | 34 | 4.7% |
| 15 to 19 Minutes | 46 | 6.4% |
| 20 to 24 Minutes | 58 | 8.1% |
| 25 to 29 Minutes | 35 | 4.9% |
| 30 to 34 Minutes | 185 | 25.7% |
| 35 to 39 Minutes | 42 | 5.8% |
| 40 to 44 Minutes | 65 | 9.0% |
| 45 to 59 Minutes | 92 | 12.8% |
| 60 to 89 Minutes | 40 | 5.6% |
| 90 or more Minutes | 44 | 6.1% |
Commute Time by Sex in Monrovia
The most common commute times in Monrovia are 30 to 34 minutes (116 commuters, 28.1%) for males and 30 to 34 minutes (69 commuters, 22.6%) for females.
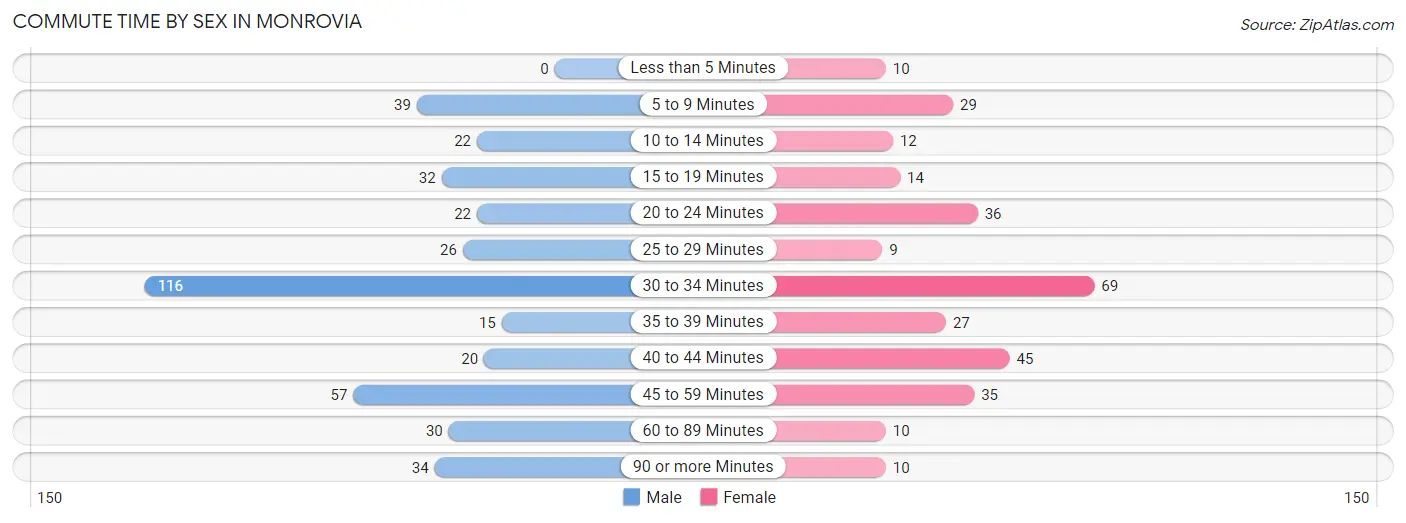
| Commute Time | Male | Female |
| Less than 5 Minutes | 0 (0.0%) | 10 (3.3%) |
| 5 to 9 Minutes | 39 (9.4%) | 29 (9.5%) |
| 10 to 14 Minutes | 22 (5.3%) | 12 (3.9%) |
| 15 to 19 Minutes | 32 (7.7%) | 14 (4.6%) |
| 20 to 24 Minutes | 22 (5.3%) | 36 (11.8%) |
| 25 to 29 Minutes | 26 (6.3%) | 9 (2.9%) |
| 30 to 34 Minutes | 116 (28.1%) | 69 (22.6%) |
| 35 to 39 Minutes | 15 (3.6%) | 27 (8.8%) |
| 40 to 44 Minutes | 20 (4.8%) | 45 (14.7%) |
| 45 to 59 Minutes | 57 (13.8%) | 35 (11.4%) |
| 60 to 89 Minutes | 30 (7.3%) | 10 (3.3%) |
| 90 or more Minutes | 34 (8.2%) | 10 (3.3%) |
Time of Departure to Work by Sex in Monrovia
The most frequent times of departure to work in Monrovia are 7:00 AM to 7:29 AM (84, 20.3%) for males and 7:00 AM to 7:29 AM (76, 24.8%) for females.
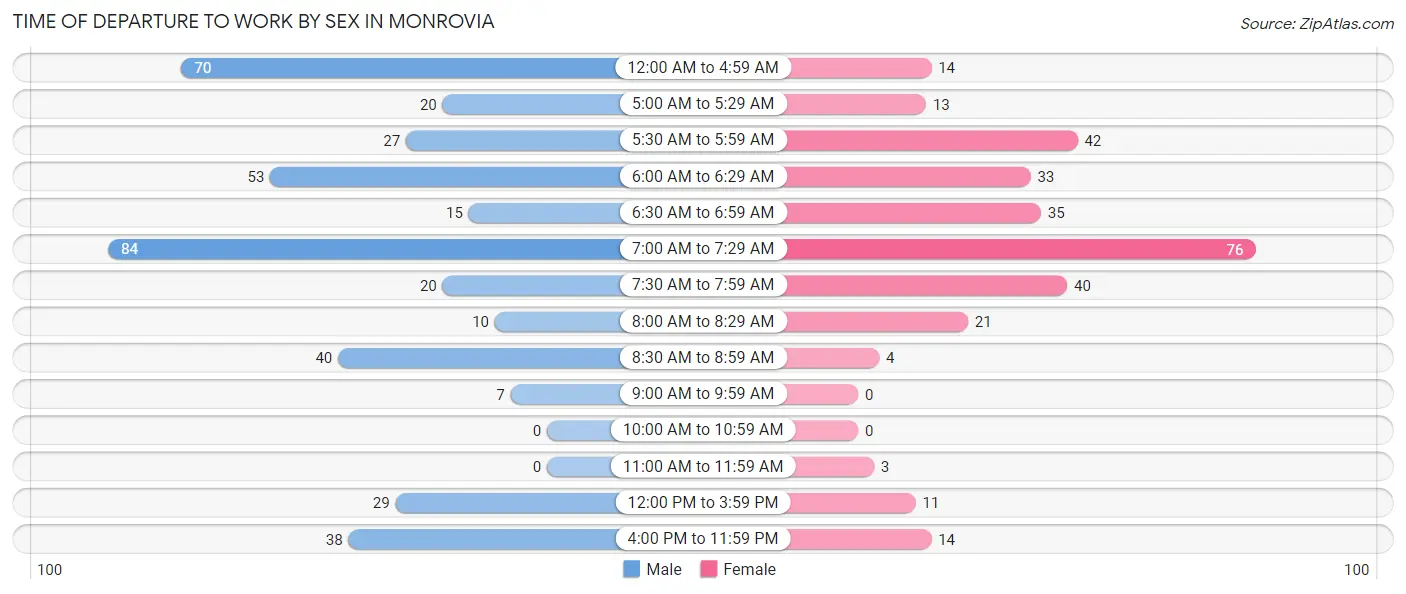
| Time of Departure | Male | Female |
| 12:00 AM to 4:59 AM | 70 (17.0%) | 14 (4.6%) |
| 5:00 AM to 5:29 AM | 20 (4.8%) | 13 (4.3%) |
| 5:30 AM to 5:59 AM | 27 (6.5%) | 42 (13.7%) |
| 6:00 AM to 6:29 AM | 53 (12.8%) | 33 (10.8%) |
| 6:30 AM to 6:59 AM | 15 (3.6%) | 35 (11.4%) |
| 7:00 AM to 7:29 AM | 84 (20.3%) | 76 (24.8%) |
| 7:30 AM to 7:59 AM | 20 (4.8%) | 40 (13.1%) |
| 8:00 AM to 8:29 AM | 10 (2.4%) | 21 (6.9%) |
| 8:30 AM to 8:59 AM | 40 (9.7%) | 4 (1.3%) |
| 9:00 AM to 9:59 AM | 7 (1.7%) | 0 (0.0%) |
| 10:00 AM to 10:59 AM | 0 (0.0%) | 0 (0.0%) |
| 11:00 AM to 11:59 AM | 0 (0.0%) | 3 (1.0%) |
| 12:00 PM to 3:59 PM | 29 (7.0%) | 11 (3.6%) |
| 4:00 PM to 11:59 PM | 38 (9.2%) | 14 (4.6%) |
| Total | 413 (100.0%) | 306 (100.0%) |
Housing Occupancy in Monrovia
Occupancy by Ownership in Monrovia
Of the total 553 dwellings in Monrovia, owner-occupied units account for 504 (91.1%), while renter-occupied units make up 49 (8.9%).
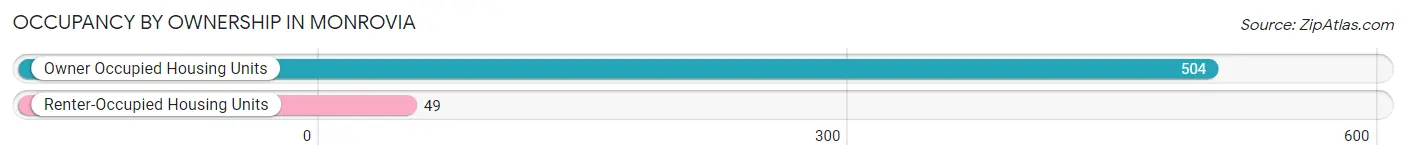
| Occupancy | # Housing Units | % Housing Units |
| Owner Occupied Housing Units | 504 | 91.1% |
| Renter-Occupied Housing Units | 49 | 8.9% |
| Total Occupied Housing Units | 553 | 100.0% |
Occupancy by Household Size in Monrovia
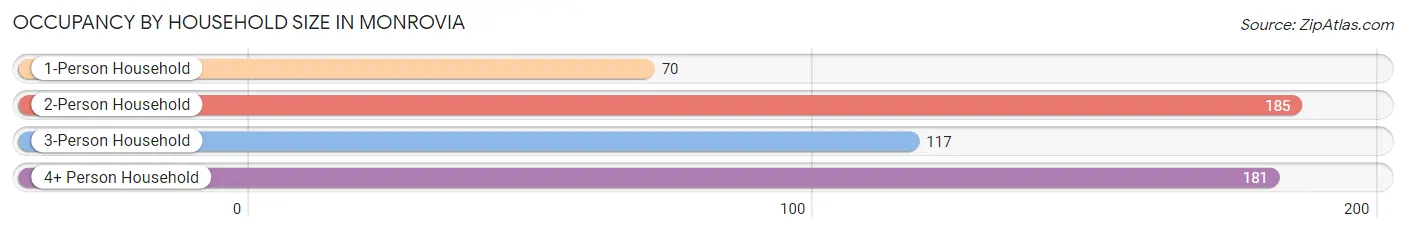
| Household Size | # Housing Units | % Housing Units |
| 1-Person Household | 70 | 12.7% |
| 2-Person Household | 185 | 33.5% |
| 3-Person Household | 117 | 21.2% |
| 4+ Person Household | 181 | 32.7% |
| Total Housing Units | 553 | 100.0% |
Occupancy by Ownership by Household Size in Monrovia
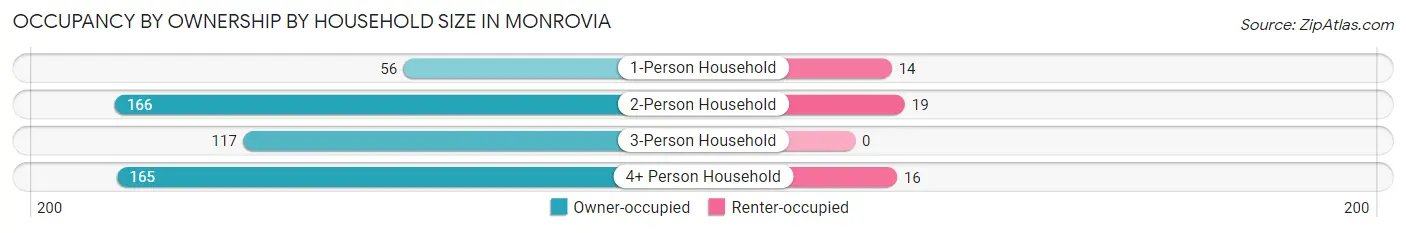
| Household Size | Owner-occupied | Renter-occupied |
| 1-Person Household | 56 (80.0%) | 14 (20.0%) |
| 2-Person Household | 166 (89.7%) | 19 (10.3%) |
| 3-Person Household | 117 (100.0%) | 0 (0.0%) |
| 4+ Person Household | 165 (91.2%) | 16 (8.8%) |
| Total Housing Units | 504 (91.1%) | 49 (8.9%) |
Occupancy by Educational Attainment in Monrovia
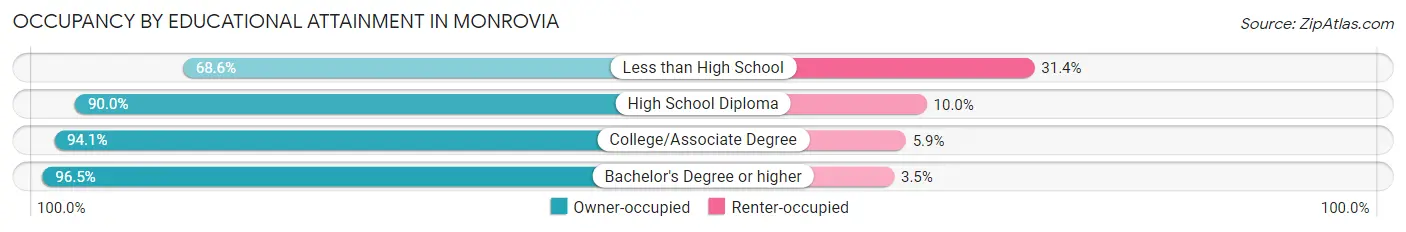
| Household Size | Owner-occupied | Renter-occupied |
| Less than High School | 35 (68.6%) | 16 (31.4%) |
| High School Diploma | 135 (90.0%) | 15 (10.0%) |
| College/Associate Degree | 225 (94.1%) | 14 (5.9%) |
| Bachelor's Degree or higher | 109 (96.5%) | 4 (3.5%) |
Occupancy by Age of Householder in Monrovia
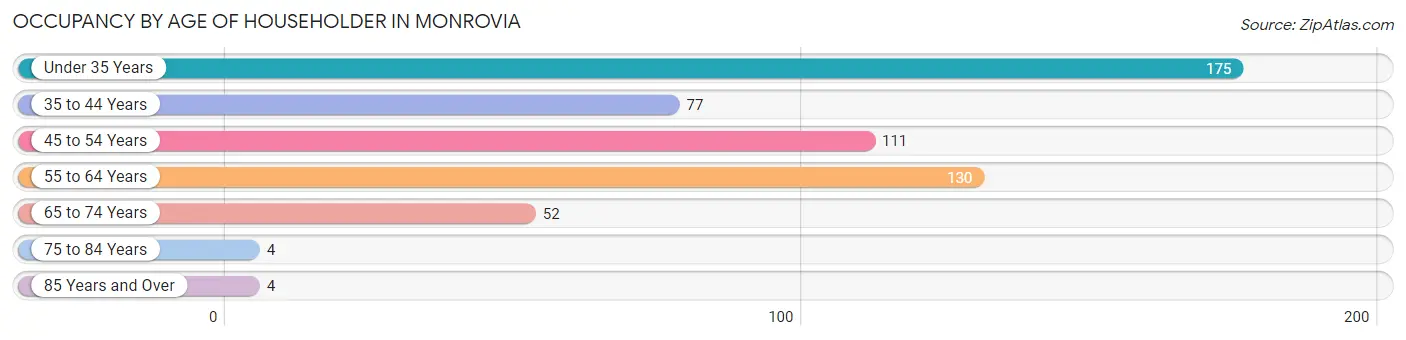
| Age Bracket | # Households | % Households |
| Under 35 Years | 175 | 31.7% |
| 35 to 44 Years | 77 | 13.9% |
| 45 to 54 Years | 111 | 20.1% |
| 55 to 64 Years | 130 | 23.5% |
| 65 to 74 Years | 52 | 9.4% |
| 75 to 84 Years | 4 | 0.7% |
| 85 Years and Over | 4 | 0.7% |
| Total | 553 | 100.0% |
Housing Finances in Monrovia
Median Income by Occupancy in Monrovia
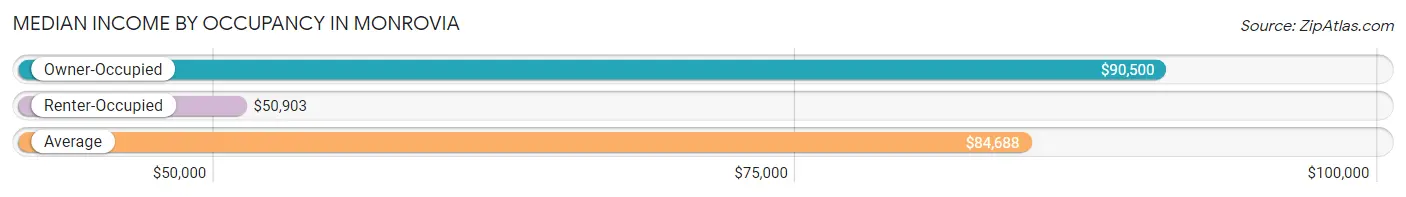
| Occupancy Type | # Households | Median Income |
| Owner-Occupied | 504 (91.1%) | $90,500 |
| Renter-Occupied | 49 (8.9%) | $50,903 |
| Average | 553 (100.0%) | $84,688 |
Occupancy by Householder Income Bracket in Monrovia
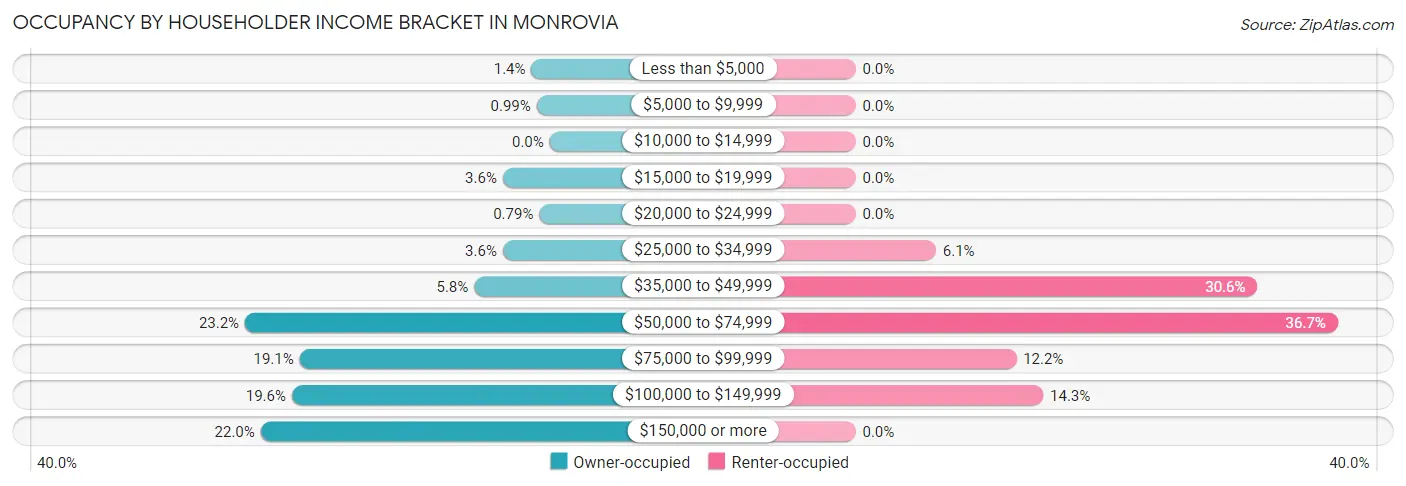
| Income Bracket | Owner-occupied | Renter-occupied |
| Less than $5,000 | 7 (1.4%) | 0 (0.0%) |
| $5,000 to $9,999 | 5 (1.0%) | 0 (0.0%) |
| $10,000 to $14,999 | 0 (0.0%) | 0 (0.0%) |
| $15,000 to $19,999 | 18 (3.6%) | 0 (0.0%) |
| $20,000 to $24,999 | 4 (0.8%) | 0 (0.0%) |
| $25,000 to $34,999 | 18 (3.6%) | 3 (6.1%) |
| $35,000 to $49,999 | 29 (5.8%) | 15 (30.6%) |
| $50,000 to $74,999 | 117 (23.2%) | 18 (36.7%) |
| $75,000 to $99,999 | 96 (19.1%) | 6 (12.2%) |
| $100,000 to $149,999 | 99 (19.6%) | 7 (14.3%) |
| $150,000 or more | 111 (22.0%) | 0 (0.0%) |
| Total | 504 (100.0%) | 49 (100.0%) |
Monthly Housing Cost Tiers in Monrovia
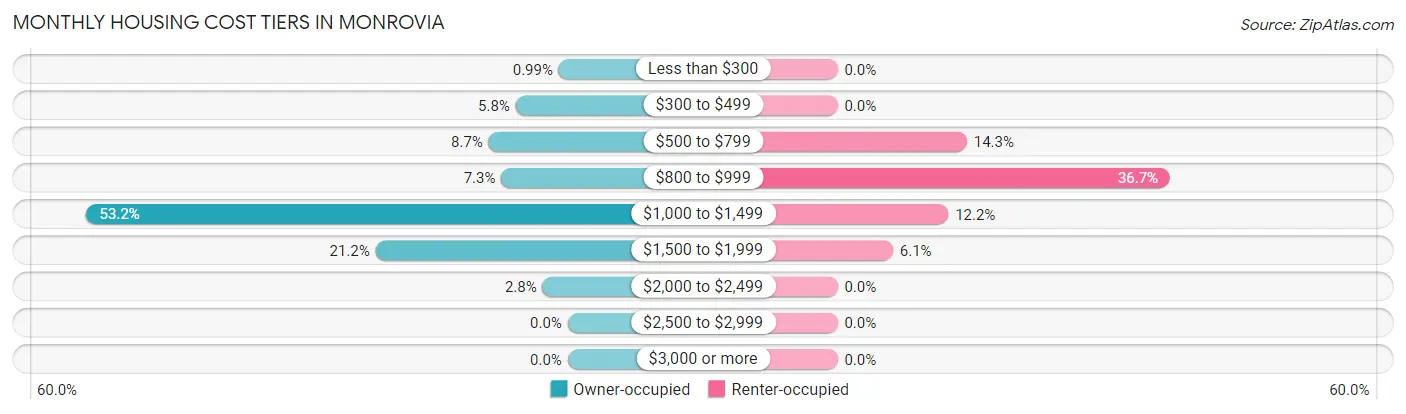
| Monthly Cost | Owner-occupied | Renter-occupied |
| Less than $300 | 5 (1.0%) | 0 (0.0%) |
| $300 to $499 | 29 (5.8%) | 0 (0.0%) |
| $500 to $799 | 44 (8.7%) | 7 (14.3%) |
| $800 to $999 | 37 (7.3%) | 18 (36.7%) |
| $1,000 to $1,499 | 268 (53.2%) | 6 (12.2%) |
| $1,500 to $1,999 | 107 (21.2%) | 3 (6.1%) |
| $2,000 to $2,499 | 14 (2.8%) | 0 (0.0%) |
| $2,500 to $2,999 | 0 (0.0%) | 0 (0.0%) |
| $3,000 or more | 0 (0.0%) | 0 (0.0%) |
| Total | 504 (100.0%) | 49 (100.0%) |
Physical Housing Characteristics in Monrovia
Housing Structures in Monrovia
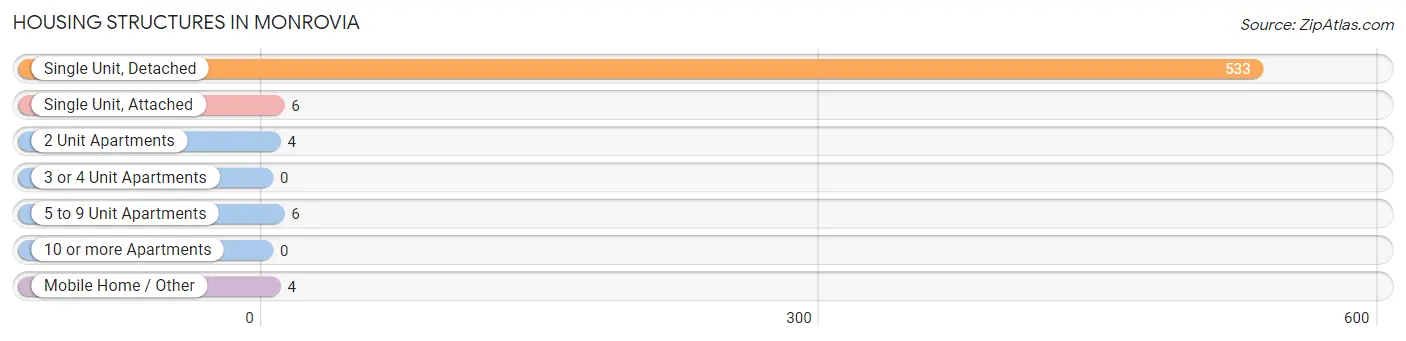
| Structure Type | # Housing Units | % Housing Units |
| Single Unit, Detached | 533 | 96.4% |
| Single Unit, Attached | 6 | 1.1% |
| 2 Unit Apartments | 4 | 0.7% |
| 3 or 4 Unit Apartments | 0 | 0.0% |
| 5 to 9 Unit Apartments | 6 | 1.1% |
| 10 or more Apartments | 0 | 0.0% |
| Mobile Home / Other | 4 | 0.7% |
| Total | 553 | 100.0% |
Housing Structures by Occupancy in Monrovia
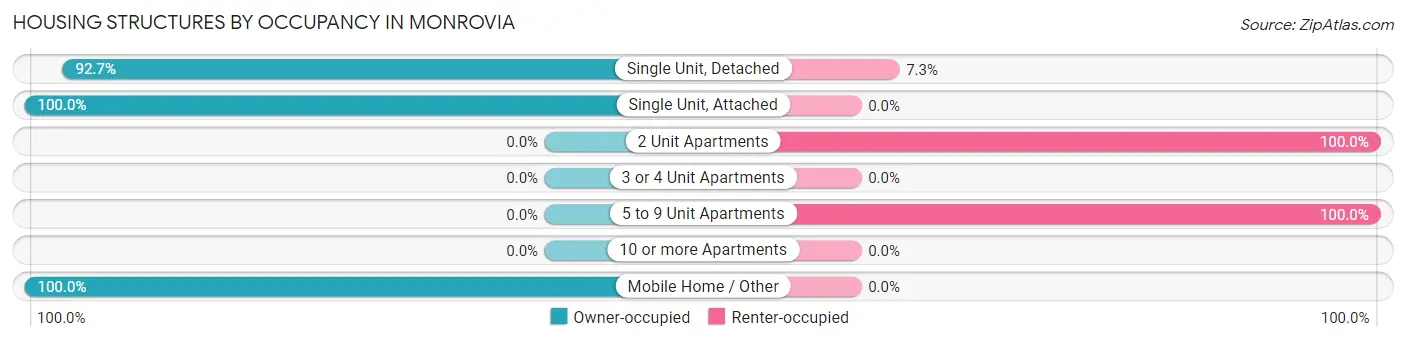
| Structure Type | Owner-occupied | Renter-occupied |
| Single Unit, Detached | 494 (92.7%) | 39 (7.3%) |
| Single Unit, Attached | 6 (100.0%) | 0 (0.0%) |
| 2 Unit Apartments | 0 (0.0%) | 4 (100.0%) |
| 3 or 4 Unit Apartments | 0 (0.0%) | 0 (0.0%) |
| 5 to 9 Unit Apartments | 0 (0.0%) | 6 (100.0%) |
| 10 or more Apartments | 0 (0.0%) | 0 (0.0%) |
| Mobile Home / Other | 4 (100.0%) | 0 (0.0%) |
| Total | 504 (91.1%) | 49 (8.9%) |
Housing Structures by Number of Rooms in Monrovia
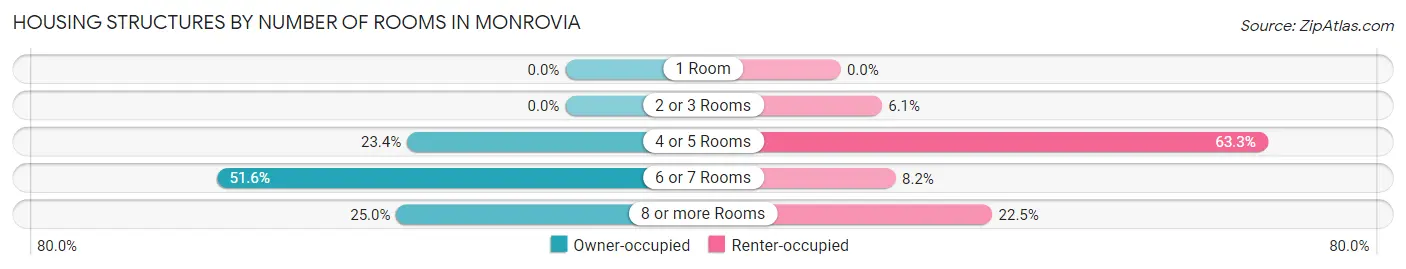
| Number of Rooms | Owner-occupied | Renter-occupied |
| 1 Room | 0 (0.0%) | 0 (0.0%) |
| 2 or 3 Rooms | 0 (0.0%) | 3 (6.1%) |
| 4 or 5 Rooms | 118 (23.4%) | 31 (63.3%) |
| 6 or 7 Rooms | 260 (51.6%) | 4 (8.2%) |
| 8 or more Rooms | 126 (25.0%) | 11 (22.5%) |
| Total | 504 (100.0%) | 49 (100.0%) |
Housing Structure by Heating Type in Monrovia
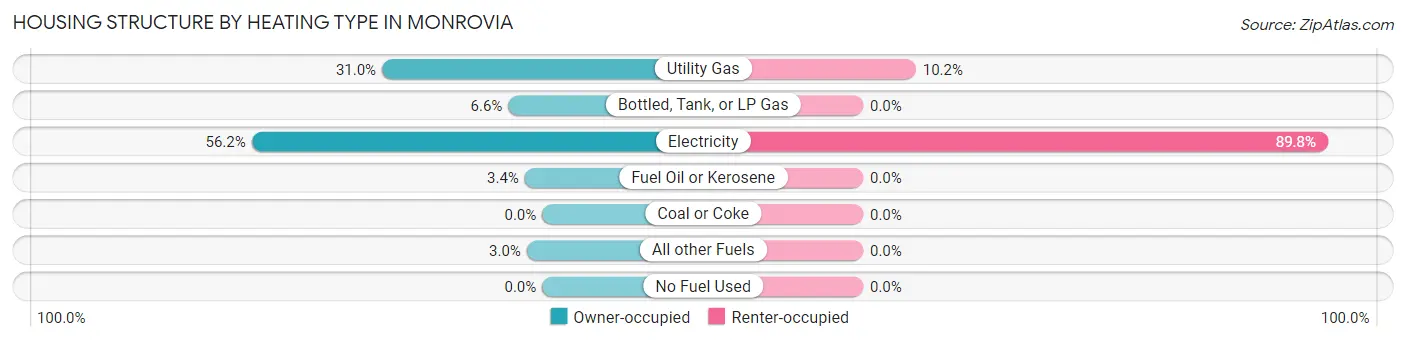
| Heating Type | Owner-occupied | Renter-occupied |
| Utility Gas | 156 (30.9%) | 5 (10.2%) |
| Bottled, Tank, or LP Gas | 33 (6.6%) | 0 (0.0%) |
| Electricity | 283 (56.1%) | 44 (89.8%) |
| Fuel Oil or Kerosene | 17 (3.4%) | 0 (0.0%) |
| Coal or Coke | 0 (0.0%) | 0 (0.0%) |
| All other Fuels | 15 (3.0%) | 0 (0.0%) |
| No Fuel Used | 0 (0.0%) | 0 (0.0%) |
| Total | 504 (100.0%) | 49 (100.0%) |
Household Vehicle Usage in Monrovia
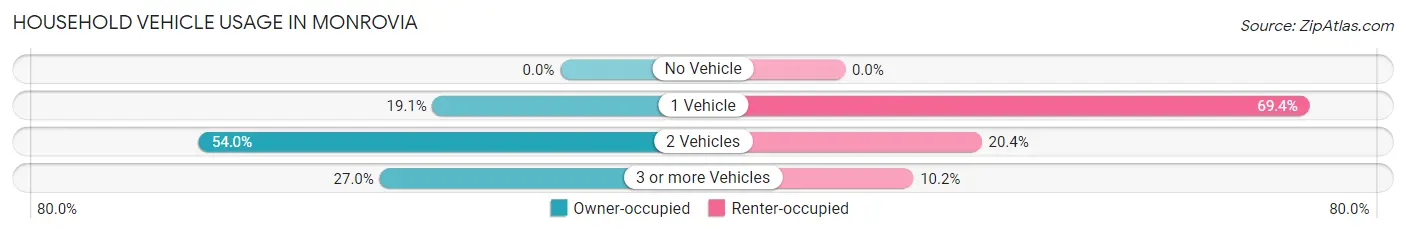
| Vehicles per Household | Owner-occupied | Renter-occupied |
| No Vehicle | 0 (0.0%) | 0 (0.0%) |
| 1 Vehicle | 96 (19.1%) | 34 (69.4%) |
| 2 Vehicles | 272 (54.0%) | 10 (20.4%) |
| 3 or more Vehicles | 136 (27.0%) | 5 (10.2%) |
| Total | 504 (100.0%) | 49 (100.0%) |
Real Estate & Mortgages in Monrovia
Real Estate and Mortgage Overview in Monrovia
| Characteristic | Without Mortgage | With Mortgage |
| Housing Units | 57 | 447 |
| Median Property Value | $213,100 | $188,500 |
| Median Household Income | $83,594 | $101 |
| Monthly Housing Costs | $472 | $0 |
| Real Estate Taxes | $1,036 | $27 |
Property Value by Mortgage Status in Monrovia
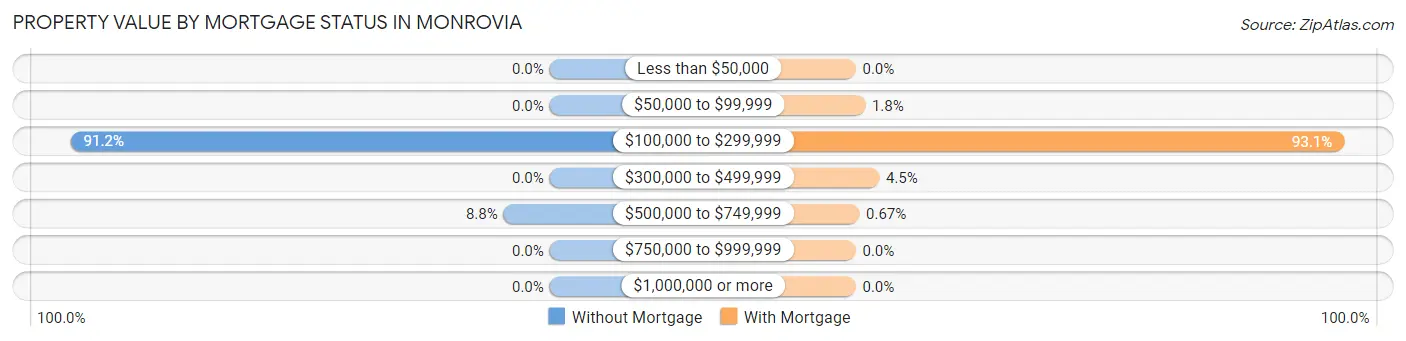
| Property Value | Without Mortgage | With Mortgage |
| Less than $50,000 | 0 (0.0%) | 0 (0.0%) |
| $50,000 to $99,999 | 0 (0.0%) | 8 (1.8%) |
| $100,000 to $299,999 | 52 (91.2%) | 416 (93.1%) |
| $300,000 to $499,999 | 0 (0.0%) | 20 (4.5%) |
| $500,000 to $749,999 | 5 (8.8%) | 3 (0.7%) |
| $750,000 to $999,999 | 0 (0.0%) | 0 (0.0%) |
| $1,000,000 or more | 0 (0.0%) | 0 (0.0%) |
| Total | 57 (100.0%) | 447 (100.0%) |
Household Income by Mortgage Status in Monrovia
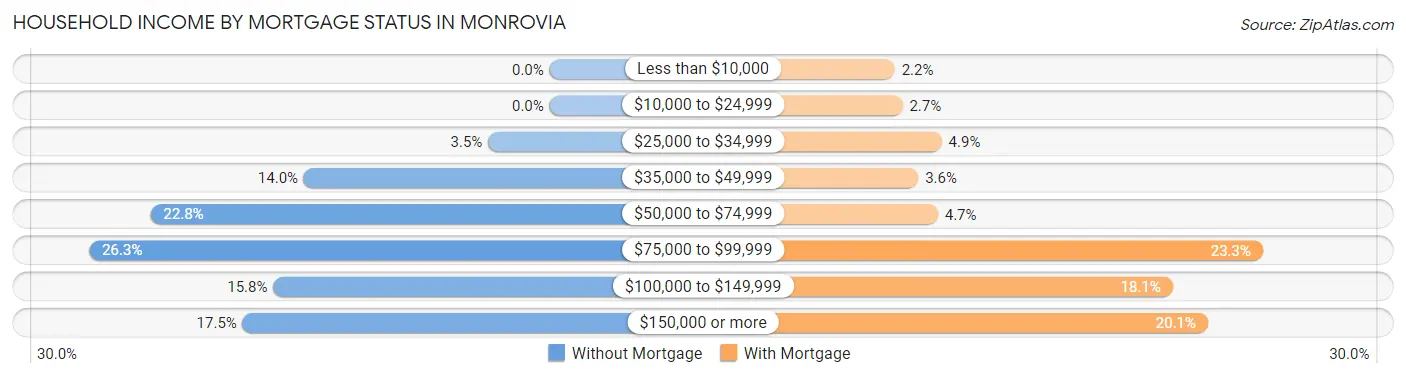
| Household Income | Without Mortgage | With Mortgage |
| Less than $10,000 | 0 (0.0%) | 10 (2.2%) |
| $10,000 to $24,999 | 0 (0.0%) | 12 (2.7%) |
| $25,000 to $34,999 | 2 (3.5%) | 22 (4.9%) |
| $35,000 to $49,999 | 8 (14.0%) | 16 (3.6%) |
| $50,000 to $74,999 | 13 (22.8%) | 21 (4.7%) |
| $75,000 to $99,999 | 15 (26.3%) | 104 (23.3%) |
| $100,000 to $149,999 | 9 (15.8%) | 81 (18.1%) |
| $150,000 or more | 10 (17.5%) | 90 (20.1%) |
| Total | 57 (100.0%) | 447 (100.0%) |
Property Value to Household Income Ratio in Monrovia
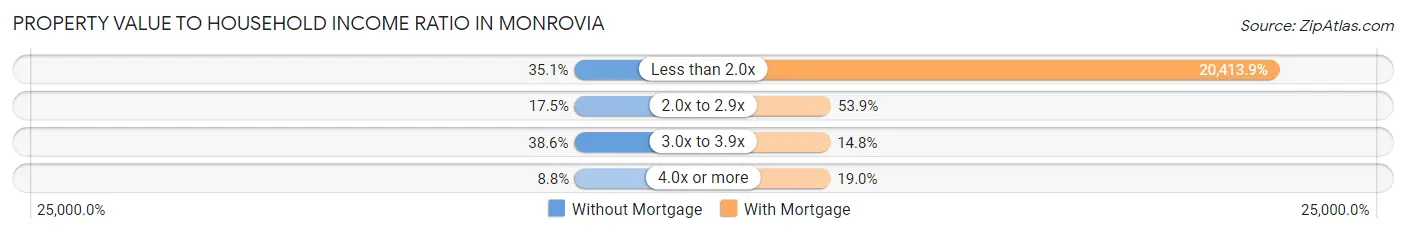
| Value-to-Income Ratio | Without Mortgage | With Mortgage |
| Less than 2.0x | 20 (35.1%) | 91,250 (20,413.9%) |
| 2.0x to 2.9x | 10 (17.5%) | 241 (53.9%) |
| 3.0x to 3.9x | 22 (38.6%) | 66 (14.8%) |
| 4.0x or more | 5 (8.8%) | 85 (19.0%) |
| Total | 57 (100.0%) | 447 (100.0%) |
Real Estate Taxes by Mortgage Status in Monrovia
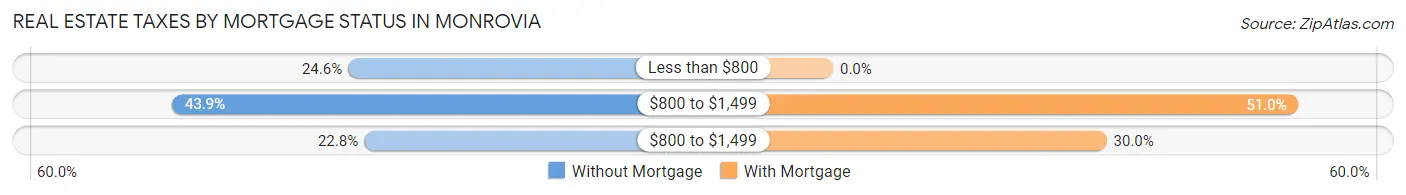
| Property Taxes | Without Mortgage | With Mortgage |
| Less than $800 | 14 (24.6%) | 0 (0.0%) |
| $800 to $1,499 | 25 (43.9%) | 228 (51.0%) |
| $800 to $1,499 | 13 (22.8%) | 134 (30.0%) |
| Total | 57 (100.0%) | 447 (100.0%) |
Health & Disability in Monrovia
Health Insurance Coverage by Age in Monrovia
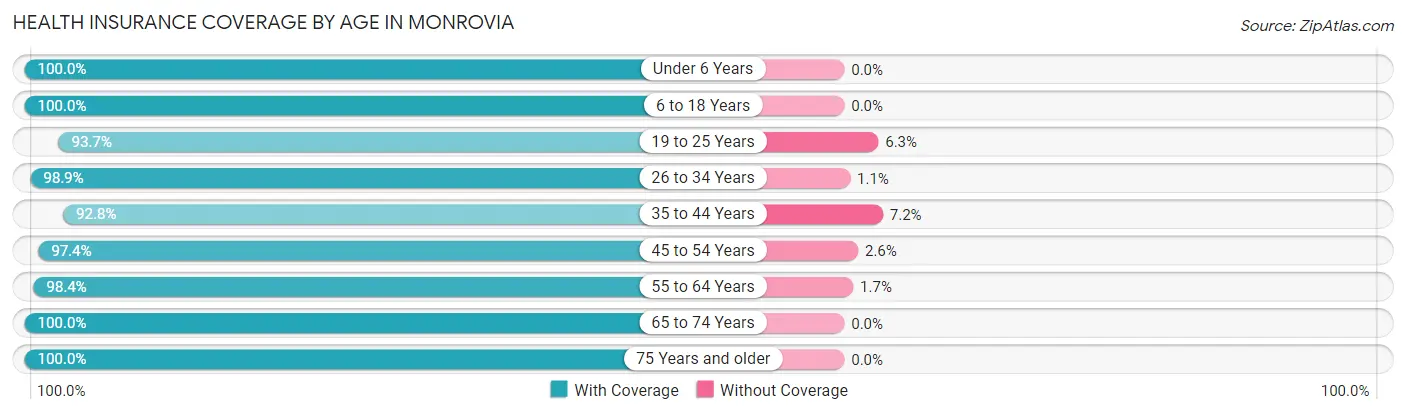
| Age Bracket | With Coverage | Without Coverage |
| Under 6 Years | 243 (100.0%) | 0 (0.0%) |
| 6 to 18 Years | 232 (100.0%) | 0 (0.0%) |
| 19 to 25 Years | 133 (93.7%) | 9 (6.3%) |
| 26 to 34 Years | 274 (98.9%) | 3 (1.1%) |
| 35 to 44 Years | 129 (92.8%) | 10 (7.2%) |
| 45 to 54 Years | 190 (97.4%) | 5 (2.6%) |
| 55 to 64 Years | 238 (98.4%) | 4 (1.7%) |
| 65 to 74 Years | 79 (100.0%) | 0 (0.0%) |
| 75 Years and older | 16 (100.0%) | 0 (0.0%) |
| Total | 1,534 (98.0%) | 31 (2.0%) |
Health Insurance Coverage by Citizenship Status in Monrovia
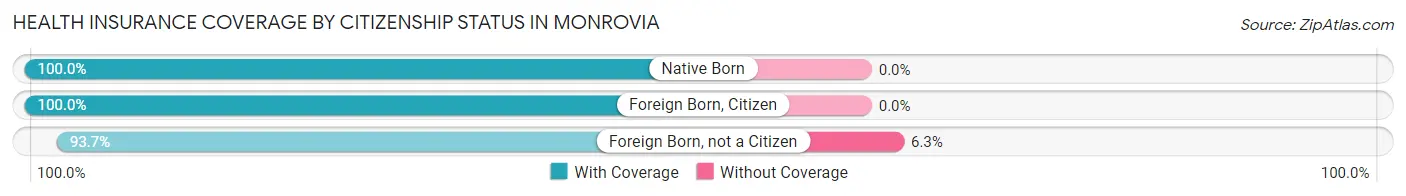
| Citizenship Status | With Coverage | Without Coverage |
| Native Born | 243 (100.0%) | 0 (0.0%) |
| Foreign Born, Citizen | 232 (100.0%) | 0 (0.0%) |
| Foreign Born, not a Citizen | 133 (93.7%) | 9 (6.3%) |
Health Insurance Coverage by Household Income in Monrovia
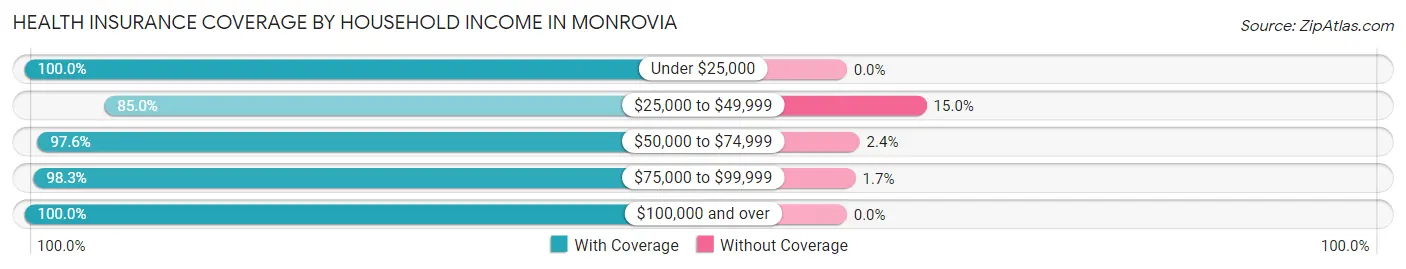
| Household Income | With Coverage | Without Coverage |
| Under $25,000 | 65 (100.0%) | 0 (0.0%) |
| $25,000 to $49,999 | 108 (85.0%) | 19 (15.0%) |
| $50,000 to $74,999 | 284 (97.6%) | 7 (2.4%) |
| $75,000 to $99,999 | 296 (98.3%) | 5 (1.7%) |
| $100,000 and over | 781 (100.0%) | 0 (0.0%) |
Public vs Private Health Insurance Coverage by Age in Monrovia
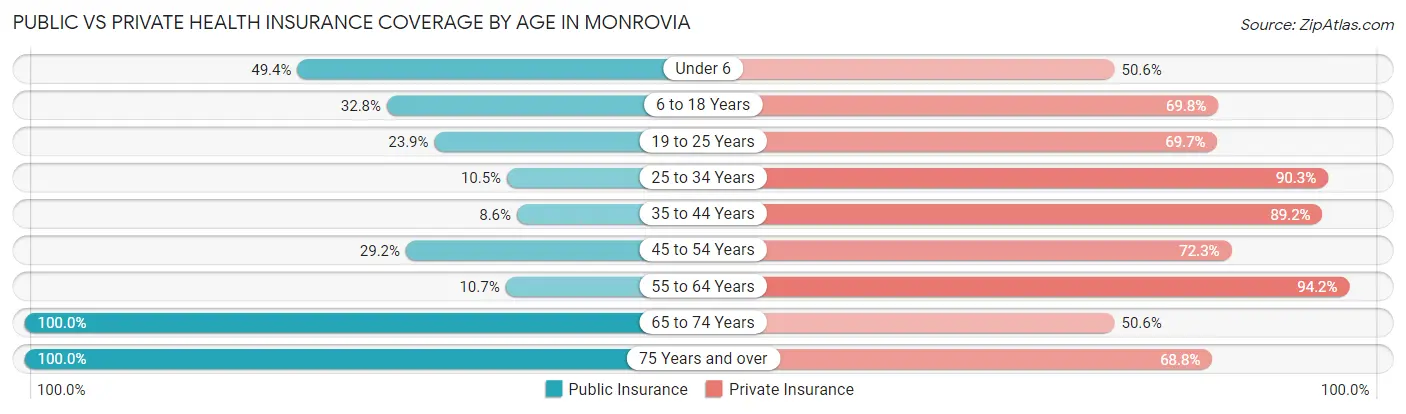
| Age Bracket | Public Insurance | Private Insurance |
| Under 6 | 120 (49.4%) | 123 (50.6%) |
| 6 to 18 Years | 76 (32.8%) | 162 (69.8%) |
| 19 to 25 Years | 34 (23.9%) | 99 (69.7%) |
| 25 to 34 Years | 29 (10.5%) | 250 (90.2%) |
| 35 to 44 Years | 12 (8.6%) | 124 (89.2%) |
| 45 to 54 Years | 57 (29.2%) | 141 (72.3%) |
| 55 to 64 Years | 26 (10.7%) | 228 (94.2%) |
| 65 to 74 Years | 79 (100.0%) | 40 (50.6%) |
| 75 Years and over | 16 (100.0%) | 11 (68.8%) |
| Total | 449 (28.7%) | 1,178 (75.3%) |
Disability Status by Sex by Age in Monrovia
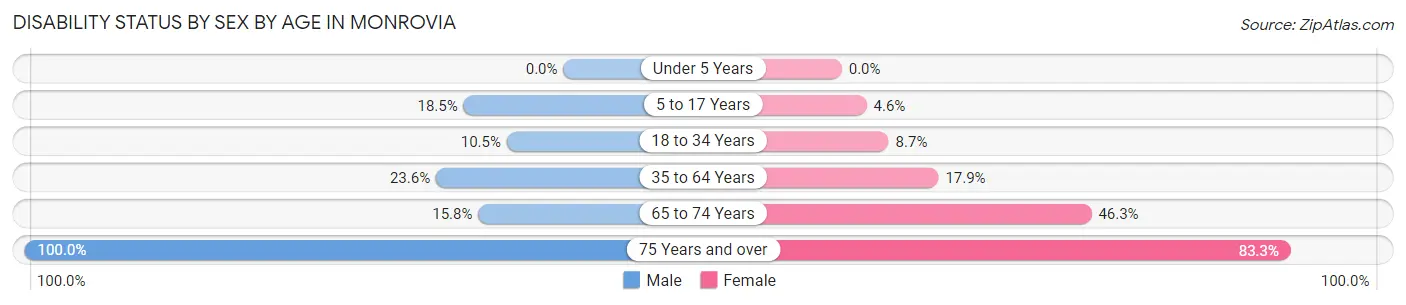
| Age Bracket | Male | Female |
| Under 5 Years | 0 (0.0%) | 0 (0.0%) |
| 5 to 17 Years | 20 (18.5%) | 7 (4.6%) |
| 18 to 34 Years | 21 (10.5%) | 20 (8.7%) |
| 35 to 64 Years | 65 (23.6%) | 54 (17.9%) |
| 65 to 74 Years | 6 (15.8%) | 19 (46.3%) |
| 75 Years and over | 4 (100.0%) | 10 (83.3%) |
Disability Class by Sex by Age in Monrovia
Disability Class: Hearing Difficulty
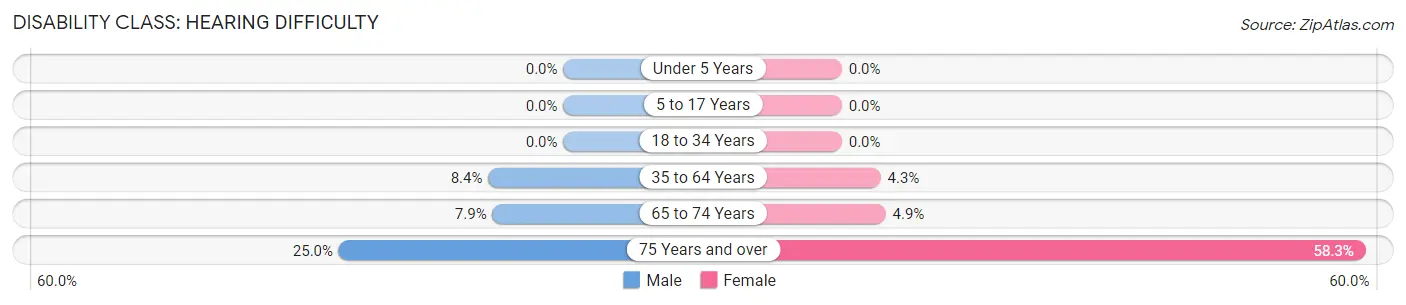
| Age Bracket | Male | Female |
| Under 5 Years | 0 (0.0%) | 0 (0.0%) |
| 5 to 17 Years | 0 (0.0%) | 0 (0.0%) |
| 18 to 34 Years | 0 (0.0%) | 0 (0.0%) |
| 35 to 64 Years | 23 (8.4%) | 13 (4.3%) |
| 65 to 74 Years | 3 (7.9%) | 2 (4.9%) |
| 75 Years and over | 1 (25.0%) | 7 (58.3%) |
Disability Class: Vision Difficulty
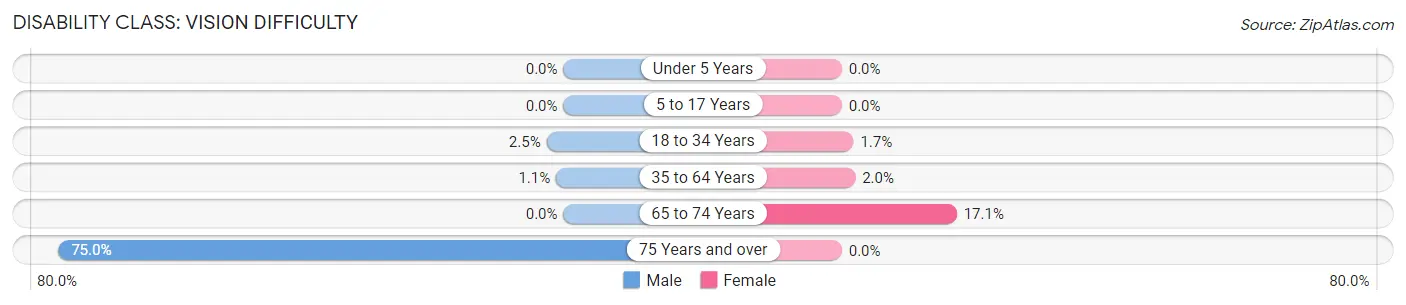
| Age Bracket | Male | Female |
| Under 5 Years | 0 (0.0%) | 0 (0.0%) |
| 5 to 17 Years | 0 (0.0%) | 0 (0.0%) |
| 18 to 34 Years | 5 (2.5%) | 4 (1.7%) |
| 35 to 64 Years | 3 (1.1%) | 6 (2.0%) |
| 65 to 74 Years | 0 (0.0%) | 7 (17.1%) |
| 75 Years and over | 3 (75.0%) | 0 (0.0%) |
Disability Class: Cognitive Difficulty
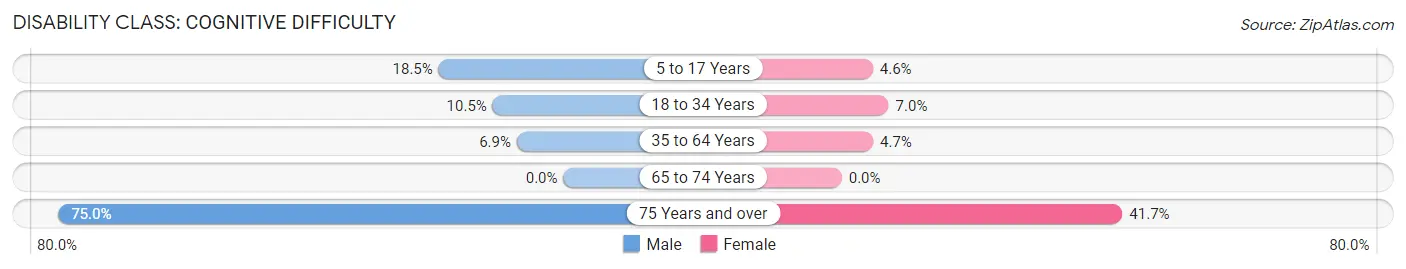
| Age Bracket | Male | Female |
| 5 to 17 Years | 20 (18.5%) | 7 (4.6%) |
| 18 to 34 Years | 21 (10.5%) | 16 (7.0%) |
| 35 to 64 Years | 19 (6.9%) | 14 (4.6%) |
| 65 to 74 Years | 0 (0.0%) | 0 (0.0%) |
| 75 Years and over | 3 (75.0%) | 5 (41.7%) |
Disability Class: Ambulatory Difficulty
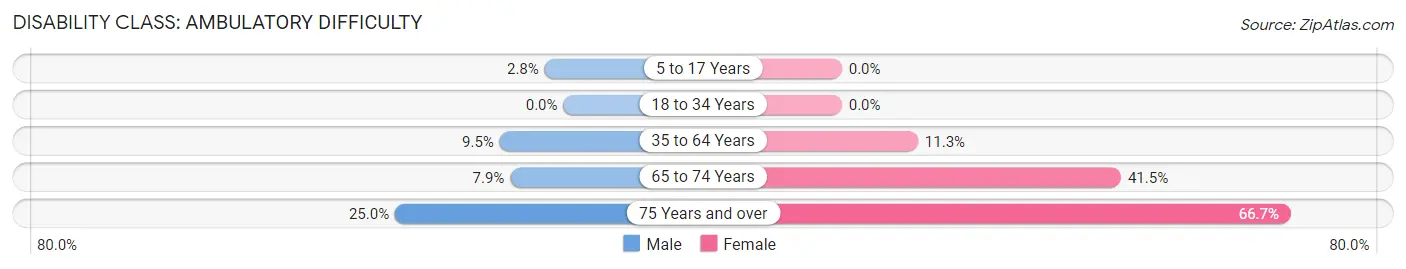
| Age Bracket | Male | Female |
| 5 to 17 Years | 3 (2.8%) | 0 (0.0%) |
| 18 to 34 Years | 0 (0.0%) | 0 (0.0%) |
| 35 to 64 Years | 26 (9.5%) | 34 (11.3%) |
| 65 to 74 Years | 3 (7.9%) | 17 (41.5%) |
| 75 Years and over | 1 (25.0%) | 8 (66.7%) |
Disability Class: Self-Care Difficulty
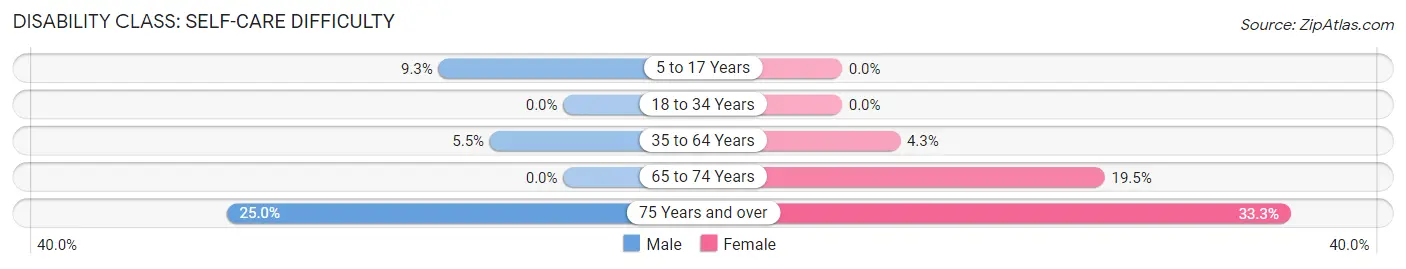
| Age Bracket | Male | Female |
| 5 to 17 Years | 10 (9.3%) | 0 (0.0%) |
| 18 to 34 Years | 0 (0.0%) | 0 (0.0%) |
| 35 to 64 Years | 15 (5.4%) | 13 (4.3%) |
| 65 to 74 Years | 0 (0.0%) | 8 (19.5%) |
| 75 Years and over | 1 (25.0%) | 4 (33.3%) |
Technology Access in Monrovia
Computing Device Access in Monrovia
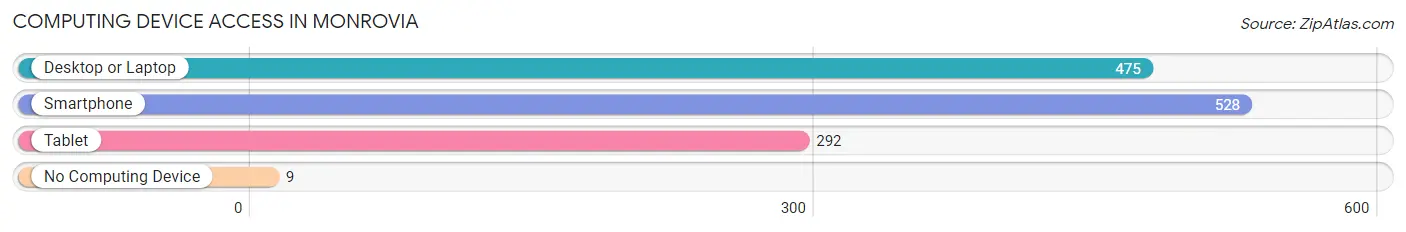
| Device Type | # Households | % Households |
| Desktop or Laptop | 475 | 85.9% |
| Smartphone | 528 | 95.5% |
| Tablet | 292 | 52.8% |
| No Computing Device | 9 | 1.6% |
| Total | 553 | 100.0% |
Internet Access in Monrovia
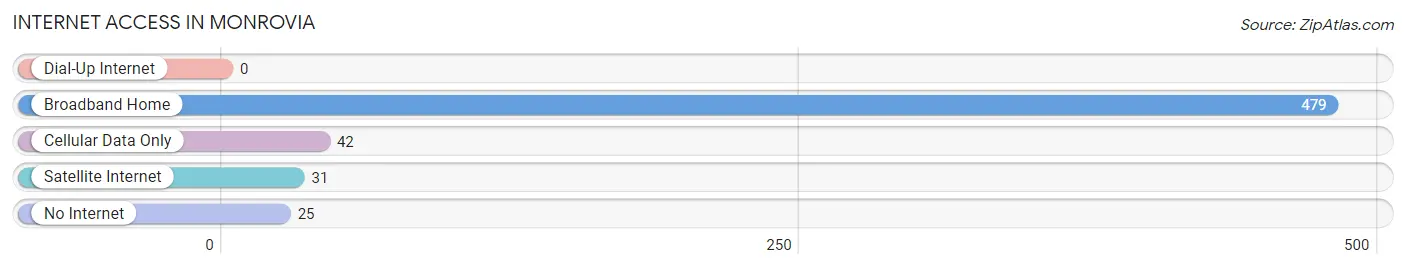
| Internet Type | # Households | % Households |
| Dial-Up Internet | 0 | 0.0% |
| Broadband Home | 479 | 86.6% |
| Cellular Data Only | 42 | 7.6% |
| Satellite Internet | 31 | 5.6% |
| No Internet | 25 | 4.5% |
| Total | 553 | 100.0% |
Monrovia Summary
Monrovia, Indiana is a small town located in Morgan County, Indiana, United States. It is situated approximately 30 miles south of Indianapolis and is part of the Indianapolis metropolitan area. The town was founded in 1834 and has a population of approximately 1,800 people.
Geography
Monrovia is located in the central part of Morgan County, Indiana. It is situated on the east side of the White River, which is a tributary of the Wabash River. The town is surrounded by rolling hills and farmland, and is located in the Central Till Plains region of Indiana. The town is located at an elevation of 830 feet above sea level.
The climate in Monrovia is classified as humid continental, with hot summers and cold winters. The average annual temperature is around 50 degrees Fahrenheit, with an average high of around 75 degrees in the summer and an average low of around 25 degrees in the winter. The average annual precipitation is around 40 inches.
Economy
Monrovia’s economy is largely based on agriculture and manufacturing. The town is home to several small businesses, including a feed mill, a lumber yard, a hardware store, and a few restaurants. The town also has a few small manufacturing plants, including a plastics factory and a metal fabrication plant.
The town is also home to a few small farms, which produce corn, soybeans, and hay. The town also has a few small wineries, which produce a variety of wines.
Demographics
As of the 2010 census, the population of Monrovia was 1,811. The racial makeup of the town was 97.3% White, 0.7% African American, 0.2% Native American, 0.3% Asian, 0.1% Pacific Islander, 0.3% from other races, and 1.3% from two or more races. Hispanic or Latino of any race were 1.3% of the population.
The median income for a household in Monrovia was $45,000, and the median income for a family was $50,000. The per capita income for the town was $20,000. About 8.3% of families and 10.2% of the population were below the poverty line, including 14.3% of those under age 18 and 8.2% of those age 65 or over.
History
Monrovia was founded in 1834 by a group of settlers from North Carolina. The town was named after James Monroe, the fifth President of the United States. The town was originally a farming community, and the first post office was established in 1837.
In the late 19th century, the town began to grow and develop. The first school was built in 1876, and the first bank was established in 1883. The town also had a newspaper, the Monrovia Herald, which was published from 1887 to 1895.
In the early 20th century, the town continued to grow and develop. The first telephone service was established in 1906, and the first electric service was established in 1910. The town also had a movie theater, which opened in 1915.
In the late 20th century, the town began to decline. The population decreased from 2,000 in 1960 to 1,800 in 2000. The town has since stabilized, and the population has remained relatively steady since then.
Common Questions
What is Per Capita Income in Monrovia?
Per Capita income in Monrovia is $33,936.
What is the Median Family Income in Monrovia?
Median Family Income in Monrovia is $82,222.
What is the Median Household income in Monrovia?
Median Household Income in Monrovia is $84,688.
What is Income or Wage Gap in Monrovia?
Income or Wage Gap in Monrovia is 21.4%.
Women in Monrovia earn 78.6 cents for every dollar earned by a man.
What is Inequality or Gini Index in Monrovia?
Inequality or Gini Index in Monrovia is 0.33.
What is the Total Population of Monrovia?
Total Population of Monrovia is 1,574.
What is the Total Male Population of Monrovia?
Total Male Population of Monrovia is 726.
What is the Total Female Population of Monrovia?
Total Female Population of Monrovia is 848.
What is the Ratio of Males per 100 Females in Monrovia?
There are 85.61 Males per 100 Females in Monrovia.
What is the Ratio of Females per 100 Males in Monrovia?
There are 116.80 Females per 100 Males in Monrovia.
What is the Median Population Age in Monrovia?
Median Population Age in Monrovia is 30.2 Years.
What is the Average Family Size in Monrovia
Average Family Size in Monrovia is 2.9 People.
What is the Average Household Size in Monrovia
Average Household Size in Monrovia is 2.9 People.
How Large is the Labor Force in Monrovia?
There are 881 People in the Labor Forcein in Monrovia.
What is the Percentage of People in the Labor Force in Monrovia?
77.4% of People are in the Labor Force in Monrovia.
What is the Unemployment Rate in Monrovia?
Unemployment Rate in Monrovia is 2.2%.