Makanda, IL Map & Demographics
Makanda Map
Makanda Overview
$58,568
PER CAPITA INCOME
$102,188
AVG FAMILY INCOME
$76,563
AVG HOUSEHOLD INCOME
12.5%
WAGE / INCOME GAP [ % ]
87.5¢/ $1
WAGE / INCOME GAP [ $ ]
0.56
INEQUALITY / GINI INDEX
500
TOTAL POPULATION
271
MALE POPULATION
229
FEMALE POPULATION
118.34
MALES / 100 FEMALES
84.50
FEMALES / 100 MALES
50.5
MEDIAN AGE
3.0
AVG FAMILY SIZE
2.5
AVG HOUSEHOLD SIZE
224
LABOR FORCE [ PEOPLE ]
53.5%
PERCENT IN LABOR FORCE
0.9%
UNEMPLOYMENT RATE
Makanda Zip Codes
Income in Makanda
Income Overview in Makanda
Per Capita Income in Makanda is $58,568, while median incomes of families and households are $102,188 and $76,563 respectively.
| Characteristic | Number | Measure |
| Per Capita Income | 500 | $58,568 |
| Median Family Income | 143 | $102,188 |
| Mean Family Income | 143 | $186,133 |
| Median Household Income | 201 | $76,563 |
| Mean Household Income | 201 | $147,906 |
| Income Deficit | 143 | $0 |
| Wage / Income Gap (%) | 500 | 12.47% |
| Wage / Income Gap ($) | 500 | 87.53¢ per $1 |
| Gini / Inequality Index | 500 | 0.56 |
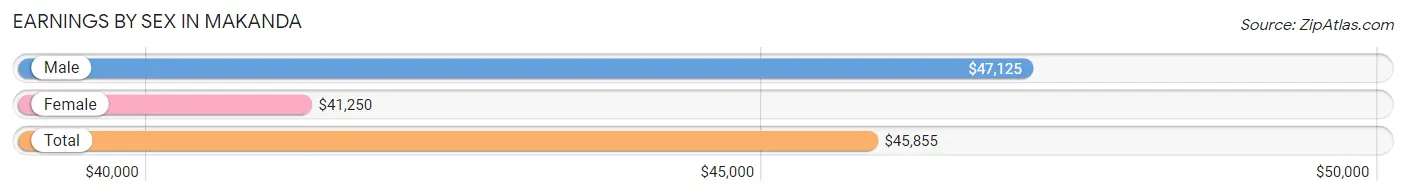
Earnings by Sex in Makanda
Average Earnings in Makanda are $45,855, $47,125 for men and $41,250 for women, a difference of 12.5%.
| Sex | Number | Average Earnings |
| Male | 131 (52.6%) | $47,125 |
| Female | 118 (47.4%) | $41,250 |
| Total | 249 (100.0%) | $45,855 |
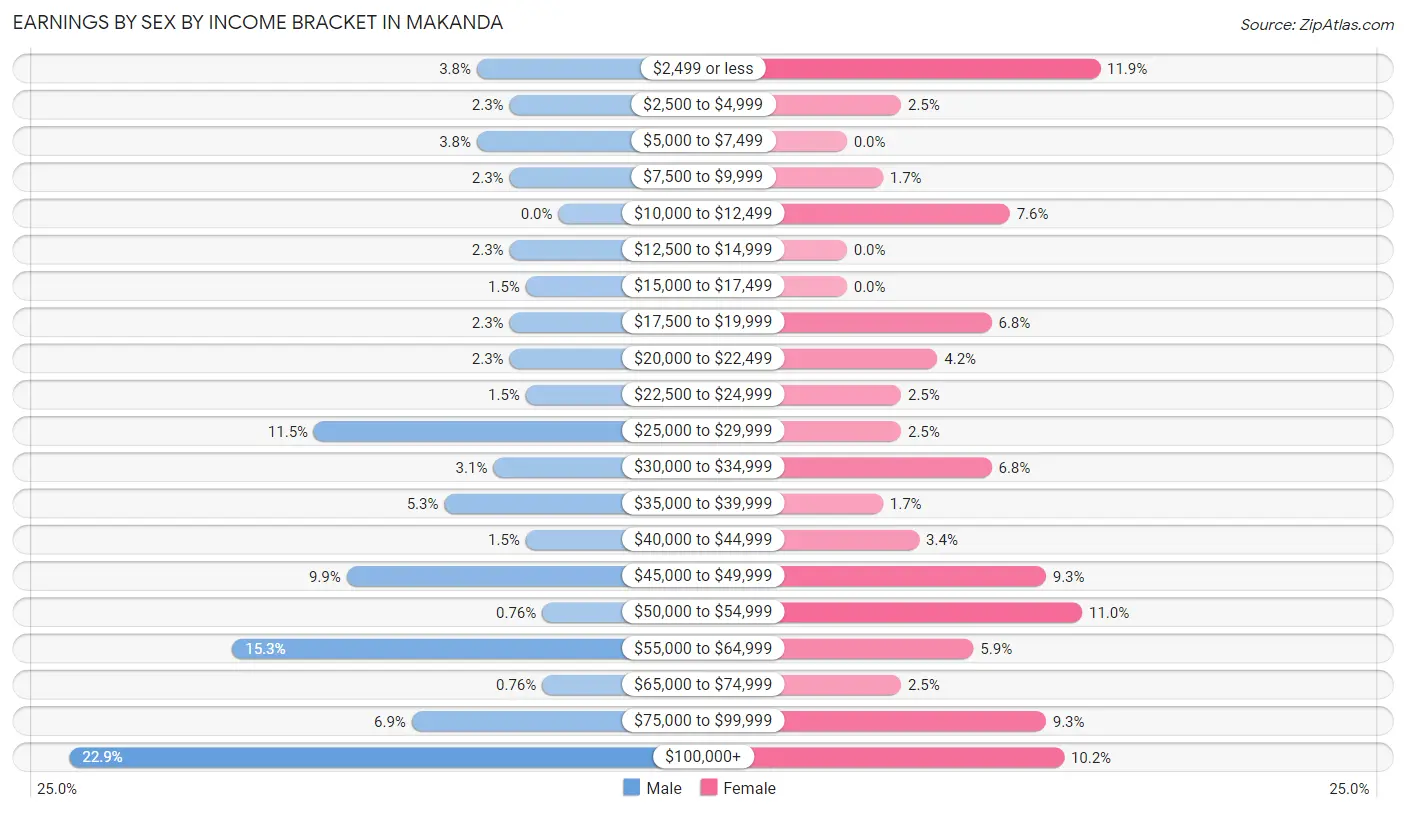
Earnings by Sex by Income Bracket in Makanda
The most common earnings brackets in Makanda are $100,000+ for men (30 | 22.9%) and $2,499 or less for women (14 | 11.9%).
| Income | Male | Female |
| $2,499 or less | 5 (3.8%) | 14 (11.9%) |
| $2,500 to $4,999 | 3 (2.3%) | 3 (2.5%) |
| $5,000 to $7,499 | 5 (3.8%) | 0 (0.0%) |
| $7,500 to $9,999 | 3 (2.3%) | 2 (1.7%) |
| $10,000 to $12,499 | 0 (0.0%) | 9 (7.6%) |
| $12,500 to $14,999 | 3 (2.3%) | 0 (0.0%) |
| $15,000 to $17,499 | 2 (1.5%) | 0 (0.0%) |
| $17,500 to $19,999 | 3 (2.3%) | 8 (6.8%) |
| $20,000 to $22,499 | 3 (2.3%) | 5 (4.2%) |
| $22,500 to $24,999 | 2 (1.5%) | 3 (2.5%) |
| $25,000 to $29,999 | 15 (11.5%) | 3 (2.5%) |
| $30,000 to $34,999 | 4 (3.0%) | 8 (6.8%) |
| $35,000 to $39,999 | 7 (5.3%) | 2 (1.7%) |
| $40,000 to $44,999 | 2 (1.5%) | 4 (3.4%) |
| $45,000 to $49,999 | 13 (9.9%) | 11 (9.3%) |
| $50,000 to $54,999 | 1 (0.8%) | 13 (11.0%) |
| $55,000 to $64,999 | 20 (15.3%) | 7 (5.9%) |
| $65,000 to $74,999 | 1 (0.8%) | 3 (2.5%) |
| $75,000 to $99,999 | 9 (6.9%) | 11 (9.3%) |
| $100,000+ | 30 (22.9%) | 12 (10.2%) |
| Total | 131 (100.0%) | 118 (100.0%) |
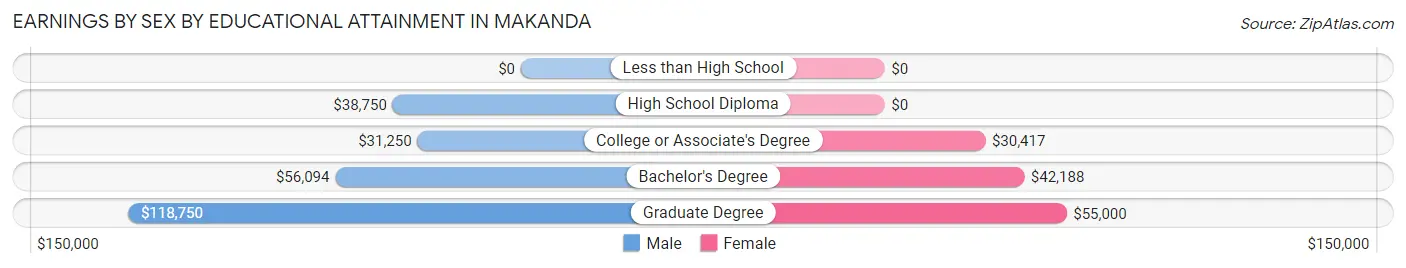
Earnings by Sex by Educational Attainment in Makanda
Average earnings in Makanda are $51,250 for men and $45,139 for women, a difference of 11.9%. Men with an educational attainment of graduate degree enjoy the highest average annual earnings of $118,750, while those with college or associate's degree education earn the least with $31,250. Women with an educational attainment of graduate degree earn the most with the average annual earnings of $55,000, while those with college or associate's degree education have the smallest earnings of $30,417.
| Educational Attainment | Male Income | Female Income |
| Less than High School | - | - |
| High School Diploma | $38,750 | $0 |
| College or Associate's Degree | $31,250 | $30,417 |
| Bachelor's Degree | $56,094 | $42,188 |
| Graduate Degree | $118,750 | $55,000 |
| Total | $51,250 | $45,139 |
Family Income in Makanda
Family Income Brackets in Makanda
According to the Makanda family income data, there are 40 families falling into the $200,000+ income range, which is the most common income bracket and makes up 28.0% of all families.
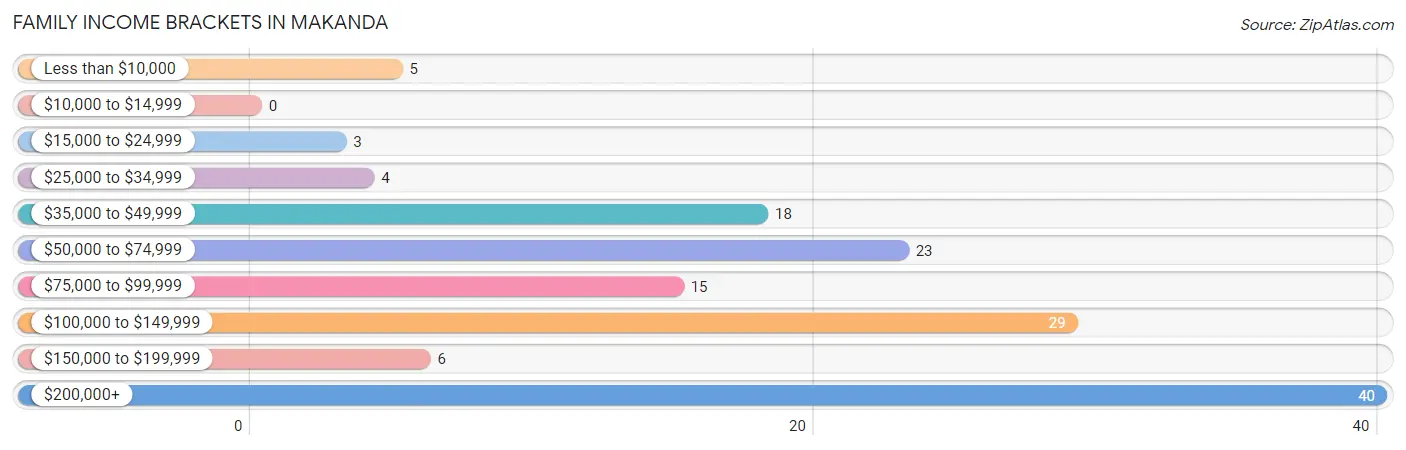
| Income Bracket | # Families | % Families |
| Less than $10,000 | 5 | 3.5% |
| $10,000 to $14,999 | 0 | 0.0% |
| $15,000 to $24,999 | 3 | 2.1% |
| $25,000 to $34,999 | 4 | 2.8% |
| $35,000 to $49,999 | 18 | 12.6% |
| $50,000 to $74,999 | 23 | 16.1% |
| $75,000 to $99,999 | 15 | 10.5% |
| $100,000 to $149,999 | 29 | 20.3% |
| $150,000 to $199,999 | 6 | 4.2% |
| $200,000+ | 40 | 28.0% |
Family Income by Famaliy Size in Makanda
4-person families (7 | 4.9%) account for the highest median family income in Makanda with $231,250 per family, while 4-person families (7 | 4.9%) have the highest median income of $57,812 per family member.
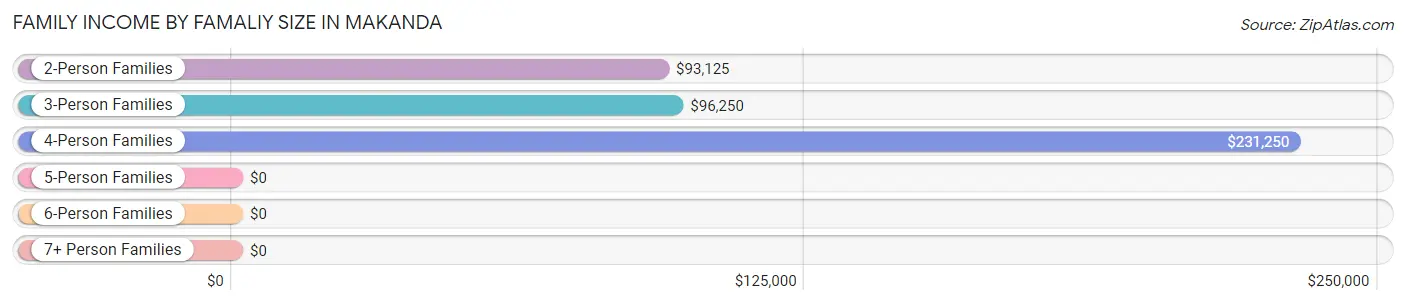
| Income Bracket | # Families | Median Income |
| 2-Person Families | 93 (65.0%) | $93,125 |
| 3-Person Families | 17 (11.9%) | $96,250 |
| 4-Person Families | 7 (4.9%) | $231,250 |
| 5-Person Families | 22 (15.4%) | $0 |
| 6-Person Families | 0 (0.0%) | $0 |
| 7+ Person Families | 4 (2.8%) | $0 |
| Total | 143 (100.0%) | $102,188 |
Family Income by Number of Earners in Makanda
The median family income in Makanda is $102,188, with families comprising 3+ earners (11) having the highest median family income of $250,001, while families with no earners (31) have the lowest median family income of $55,625, accounting for 7.7% and 21.7% of families, respectively.
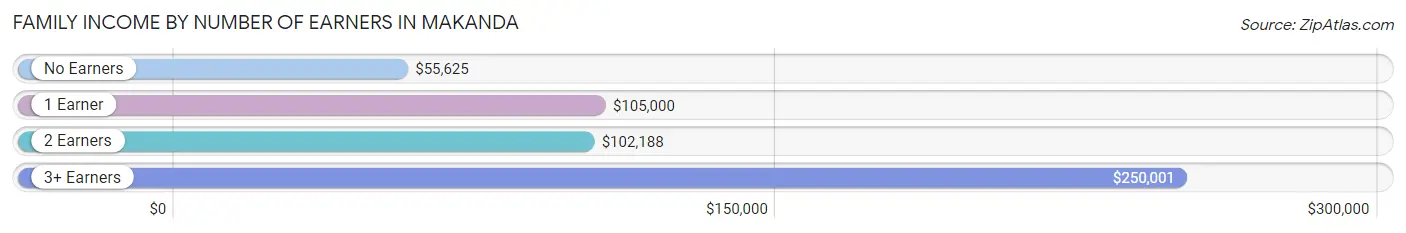
| Number of Earners | # Families | Median Income |
| No Earners | 31 (21.7%) | $55,625 |
| 1 Earner | 38 (26.6%) | $105,000 |
| 2 Earners | 63 (44.1%) | $102,188 |
| 3+ Earners | 11 (7.7%) | $250,001 |
| Total | 143 (100.0%) | $102,188 |
Household Income in Makanda
Household Income Brackets in Makanda
With 42 households falling in the category, the $50,000 to $74,999 income range is the most frequent in Makanda, accounting for 20.9% of all households.
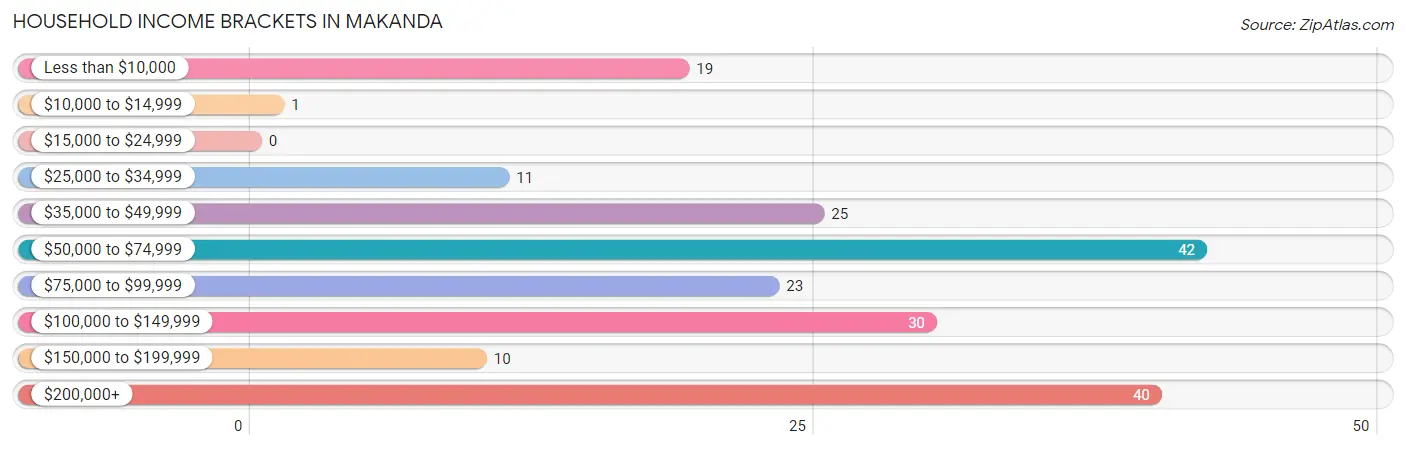
| Income Bracket | # Households | % Households |
| Less than $10,000 | 19 | 9.5% |
| $10,000 to $14,999 | 1 | 0.5% |
| $15,000 to $24,999 | 0 | 0.0% |
| $25,000 to $34,999 | 11 | 5.5% |
| $35,000 to $49,999 | 25 | 12.4% |
| $50,000 to $74,999 | 42 | 20.9% |
| $75,000 to $99,999 | 23 | 11.4% |
| $100,000 to $149,999 | 30 | 14.9% |
| $150,000 to $199,999 | 10 | 5.0% |
| $200,000+ | 40 | 19.9% |
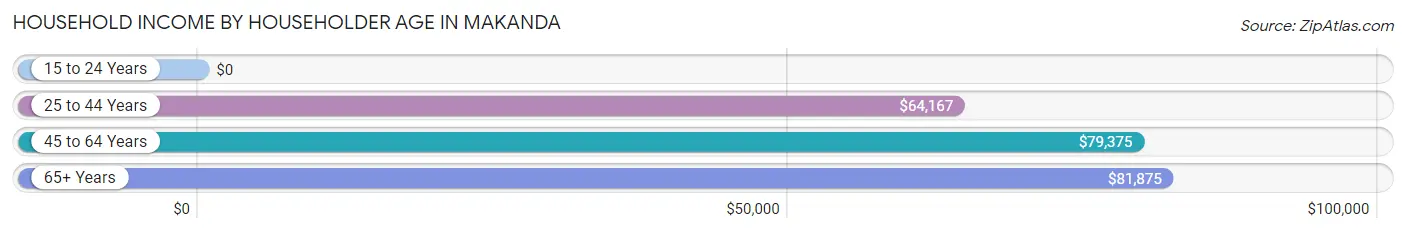
Household Income by Householder Age in Makanda
The median household income in Makanda is $76,563, with the highest median household income of $81,875 found in the 65+ years age bracket for the primary householder. A total of 71 households (35.3%) fall into this category. Meanwhile, the 15 to 24 years age bracket for the primary householder has the lowest median household income of $0, with 1 households (0.5%) in this group.
| Income Bracket | # Households | Median Income |
| 15 to 24 Years | 1 (0.5%) | $0 |
| 25 to 44 Years | 42 (20.9%) | $64,167 |
| 45 to 64 Years | 87 (43.3%) | $79,375 |
| 65+ Years | 71 (35.3%) | $81,875 |
| Total | 201 (100.0%) | $76,563 |
Poverty in Makanda
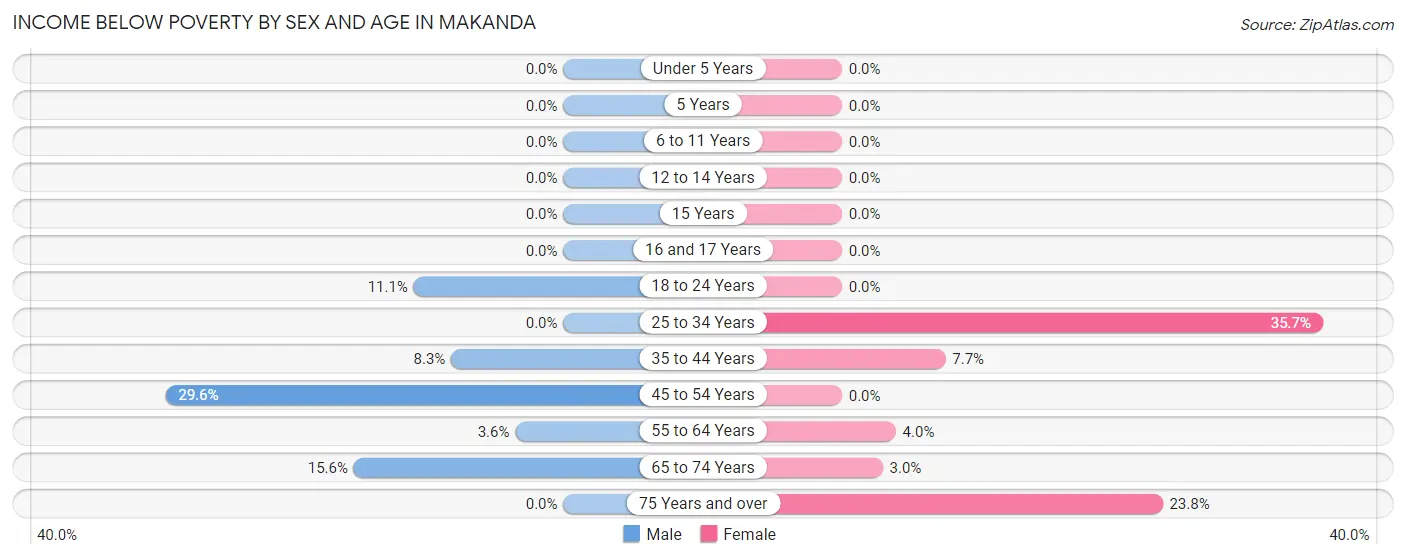
Income Below Poverty by Sex and Age in Makanda
With 13.7% poverty level for males and 6.6% for females among the residents of Makanda, 45 to 54 year old males and 25 to 34 year old females are the most vulnerable to poverty, with 26 males (29.5%) and 5 females (35.7%) in their respective age groups living below the poverty level.
| Age Bracket | Male | Female |
| Under 5 Years | 0 (0.0%) | 0 (0.0%) |
| 5 Years | 0 (0.0%) | 0 (0.0%) |
| 6 to 11 Years | 0 (0.0%) | 0 (0.0%) |
| 12 to 14 Years | 0 (0.0%) | 0 (0.0%) |
| 15 Years | 0 (0.0%) | 0 (0.0%) |
| 16 and 17 Years | 0 (0.0%) | 0 (0.0%) |
| 18 to 24 Years | 1 (11.1%) | 0 (0.0%) |
| 25 to 34 Years | 0 (0.0%) | 5 (35.7%) |
| 35 to 44 Years | 2 (8.3%) | 2 (7.7%) |
| 45 to 54 Years | 26 (29.5%) | 0 (0.0%) |
| 55 to 64 Years | 1 (3.6%) | 2 (4.0%) |
| 65 to 74 Years | 7 (15.6%) | 1 (3.0%) |
| 75 Years and over | 0 (0.0%) | 5 (23.8%) |
| Total | 37 (13.7%) | 15 (6.6%) |
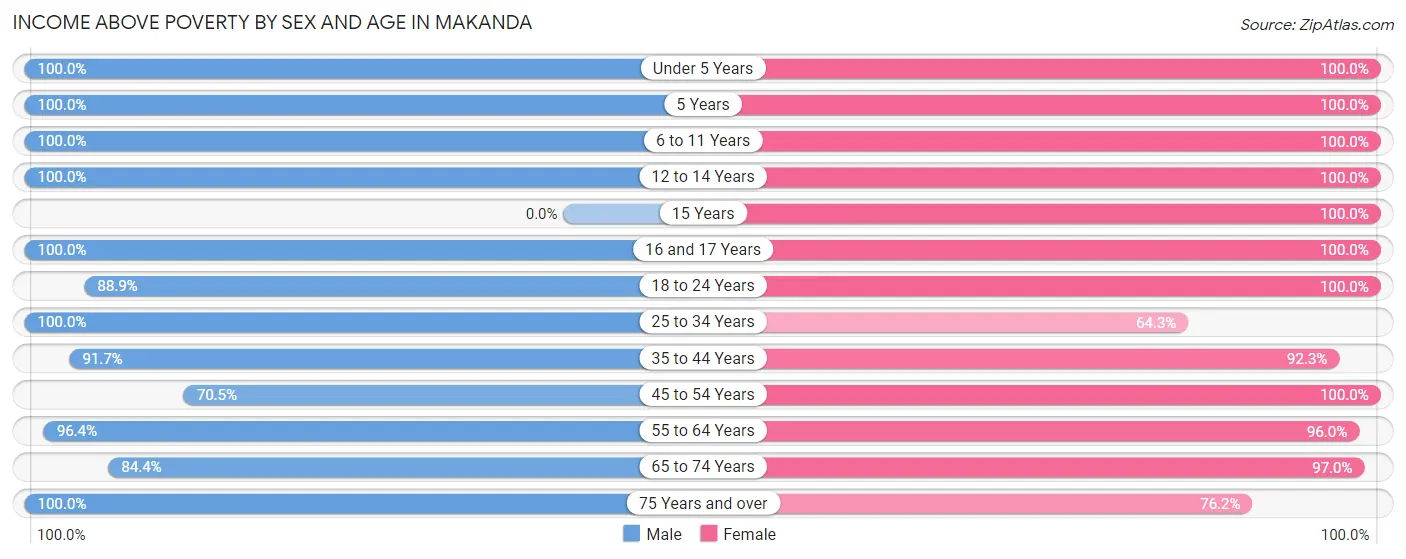
Income Above Poverty by Sex and Age in Makanda
According to the poverty statistics in Makanda, males aged under 5 years and females aged under 5 years are the age groups that are most secure financially, with 100.0% of males and 100.0% of females in these age groups living above the poverty line.
| Age Bracket | Male | Female |
| Under 5 Years | 2 (100.0%) | 14 (100.0%) |
| 5 Years | 6 (100.0%) | 4 (100.0%) |
| 6 to 11 Years | 9 (100.0%) | 22 (100.0%) |
| 12 to 14 Years | 19 (100.0%) | 3 (100.0%) |
| 15 Years | 0 (0.0%) | 2 (100.0%) |
| 16 and 17 Years | 12 (100.0%) | 8 (100.0%) |
| 18 to 24 Years | 8 (88.9%) | 3 (100.0%) |
| 25 to 34 Years | 11 (100.0%) | 9 (64.3%) |
| 35 to 44 Years | 22 (91.7%) | 24 (92.3%) |
| 45 to 54 Years | 62 (70.5%) | 29 (100.0%) |
| 55 to 64 Years | 27 (96.4%) | 48 (96.0%) |
| 65 to 74 Years | 38 (84.4%) | 32 (97.0%) |
| 75 Years and over | 18 (100.0%) | 16 (76.2%) |
| Total | 234 (86.4%) | 214 (93.4%) |
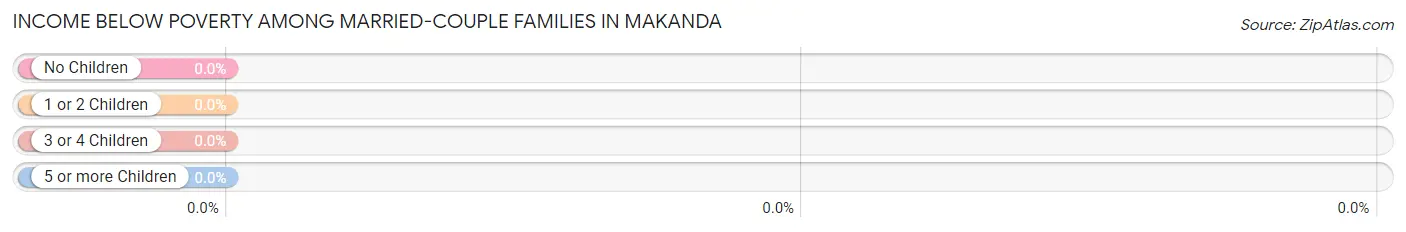
Income Below Poverty Among Married-Couple Families in Makanda
| Children | Above Poverty | Below Poverty |
| No Children | 86 (100.0%) | 0 (0.0%) |
| 1 or 2 Children | 20 (100.0%) | 0 (0.0%) |
| 3 or 4 Children | 17 (100.0%) | 0 (0.0%) |
| 5 or more Children | 0 (0.0%) | 0 (0.0%) |
| Total | 123 (100.0%) | 0 (0.0%) |
Income Below Poverty Among Single-Parent Households in Makanda
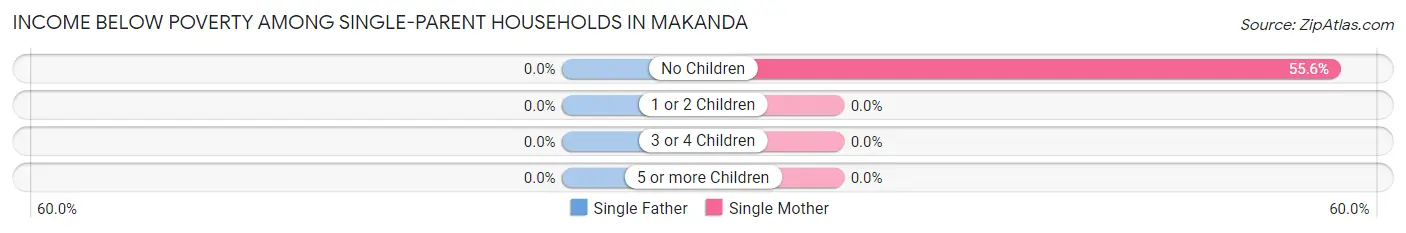
| Children | Single Father | Single Mother |
| No Children | 0 (0.0%) | 5 (55.6%) |
| 1 or 2 Children | 0 (0.0%) | 0 (0.0%) |
| 3 or 4 Children | 0 (0.0%) | 0 (0.0%) |
| 5 or more Children | 0 (0.0%) | 0 (0.0%) |
| Total | 0 (0.0%) | 5 (31.2%) |
Income Below Poverty Among Married-Couple vs Single-Parent Households in Makanda
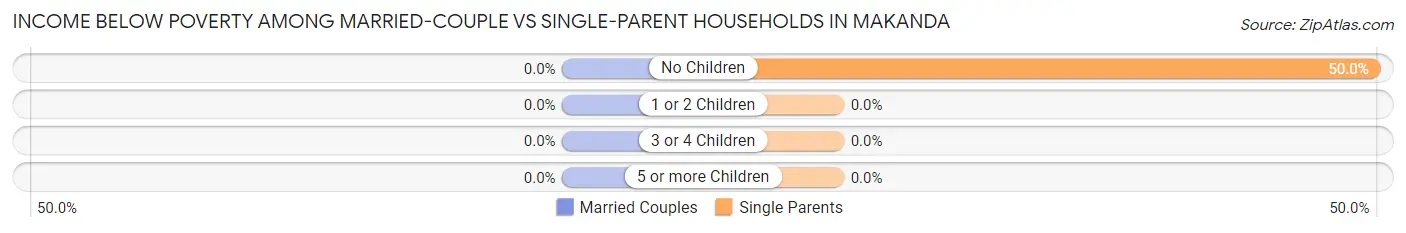
| Children | Married-Couple Families | Single-Parent Households |
| No Children | 0 (0.0%) | 5 (50.0%) |
| 1 or 2 Children | 0 (0.0%) | 0 (0.0%) |
| 3 or 4 Children | 0 (0.0%) | 0 (0.0%) |
| 5 or more Children | 0 (0.0%) | 0 (0.0%) |
| Total | 0 (0.0%) | 5 (25.0%) |
Race in Makanda
The most populous races in Makanda are White / Caucasian (421 | 84.2%), Asian (63 | 12.6%), and Two or more Races (10 | 2.0%).
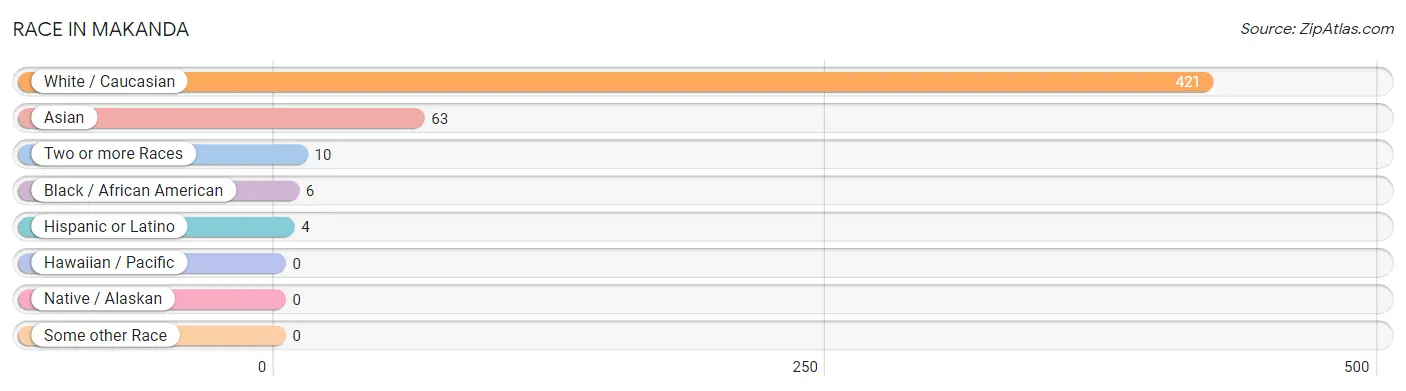
| Race | # Population | % Population |
| Asian | 63 | 12.6% |
| Black / African American | 6 | 1.2% |
| Hawaiian / Pacific | 0 | 0.0% |
| Hispanic or Latino | 4 | 0.8% |
| Native / Alaskan | 0 | 0.0% |
| White / Caucasian | 421 | 84.2% |
| Two or more Races | 10 | 2.0% |
| Some other Race | 0 | 0.0% |
| Total | 500 | 100.0% |
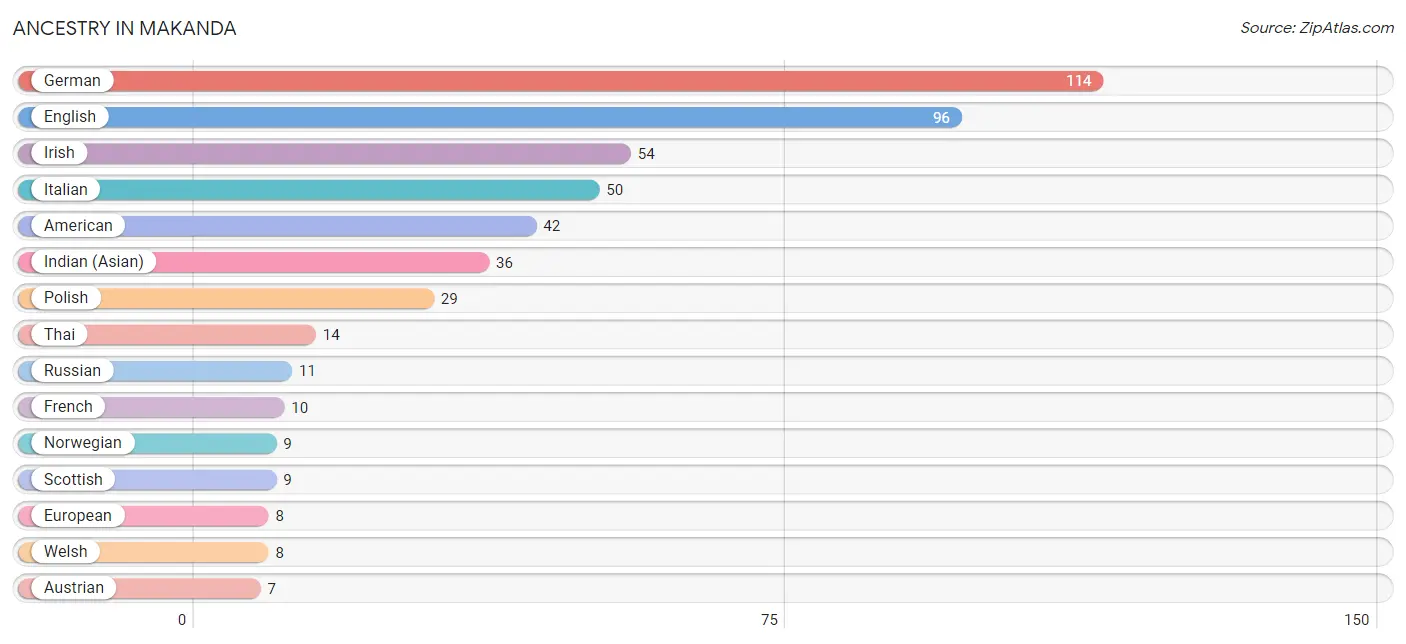
Ancestry in Makanda
The most populous ancestries reported in Makanda are German (114 | 22.8%), English (96 | 19.2%), Irish (54 | 10.8%), Italian (50 | 10.0%), and American (42 | 8.4%), together accounting for 71.2% of all Makanda residents.
| Ancestry | # Population | % Population |
| American | 42 | 8.4% |
| Austrian | 7 | 1.4% |
| Belgian | 2 | 0.4% |
| Choctaw | 2 | 0.4% |
| Croatian | 3 | 0.6% |
| Czech | 5 | 1.0% |
| Czechoslovakian | 2 | 0.4% |
| Danish | 5 | 1.0% |
| Dutch | 2 | 0.4% |
| English | 96 | 19.2% |
| European | 8 | 1.6% |
| Finnish | 1 | 0.2% |
| French | 10 | 2.0% |
| German | 114 | 22.8% |
| Hungarian | 2 | 0.4% |
| Indian (Asian) | 36 | 7.2% |
| Irish | 54 | 10.8% |
| Italian | 50 | 10.0% |
| Latvian | 2 | 0.4% |
| Lithuanian | 3 | 0.6% |
| Lumbee | 3 | 0.6% |
| Mexican | 2 | 0.4% |
| Mongolian | 7 | 1.4% |
| Norwegian | 9 | 1.8% |
| Pennsylvania German | 2 | 0.4% |
| Polish | 29 | 5.8% |
| Russian | 11 | 2.2% |
| Scandinavian | 4 | 0.8% |
| Scotch-Irish | 6 | 1.2% |
| Scottish | 9 | 1.8% |
| Spaniard | 2 | 0.4% |
| Subsaharan African | 2 | 0.4% |
| Swedish | 2 | 0.4% |
| Thai | 14 | 2.8% |
| Welsh | 8 | 1.6% | View All 35 Rows |
Immigrants in Makanda
The most numerous immigrant groups reported in Makanda came from Asia (44 | 8.8%), China (19 | 3.8%), Eastern Asia (19 | 3.8%), South Central Asia (16 | 3.2%), and India (10 | 2.0%), together accounting for 21.6% of all Makanda residents.
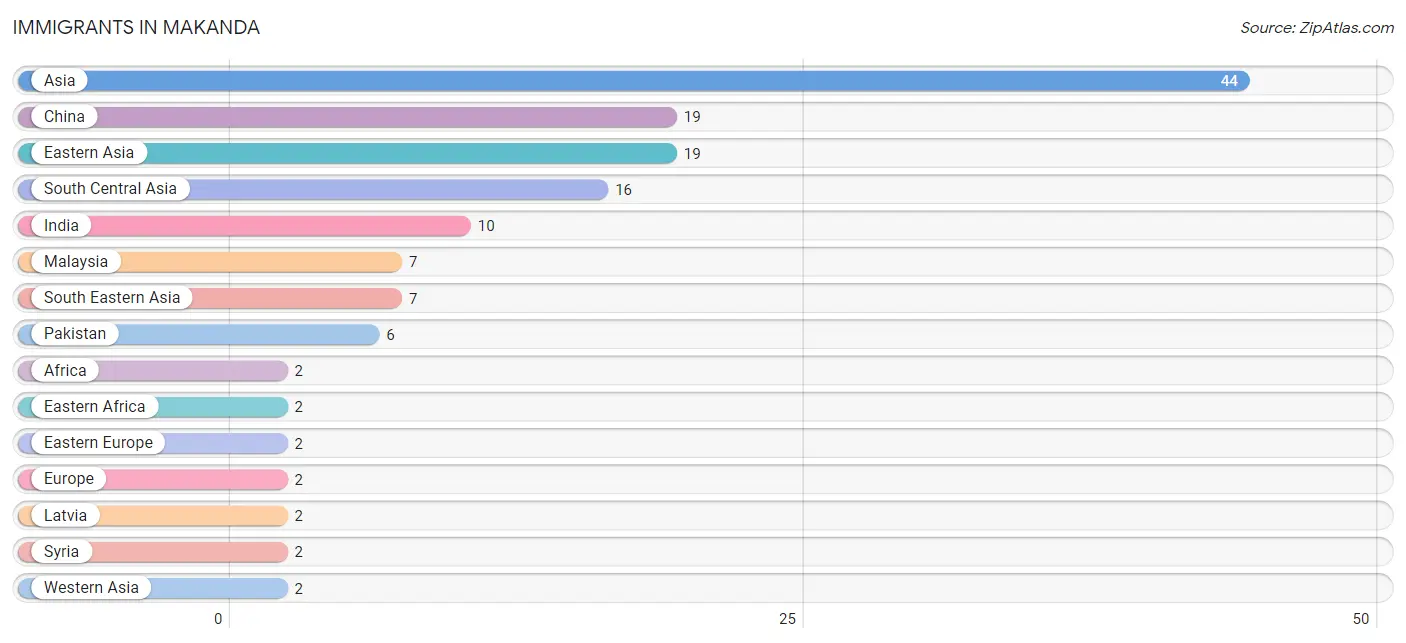
| Immigration Origin | # Population | % Population |
| Africa | 2 | 0.4% |
| Asia | 44 | 8.8% |
| China | 19 | 3.8% |
| Eastern Africa | 2 | 0.4% |
| Eastern Asia | 19 | 3.8% |
| Eastern Europe | 2 | 0.4% |
| Europe | 2 | 0.4% |
| India | 10 | 2.0% |
| Latvia | 2 | 0.4% |
| Malaysia | 7 | 1.4% |
| Pakistan | 6 | 1.2% |
| South Central Asia | 16 | 3.2% |
| South Eastern Asia | 7 | 1.4% |
| Syria | 2 | 0.4% |
| Western Asia | 2 | 0.4% |
| Zimbabwe | 1 | 0.2% | View All 16 Rows |
Sex and Age in Makanda
Sex and Age in Makanda
The most populous age groups in Makanda are 50 to 54 Years (58 | 21.4%) for men and 60 to 64 Years (35 | 15.3%) for women.
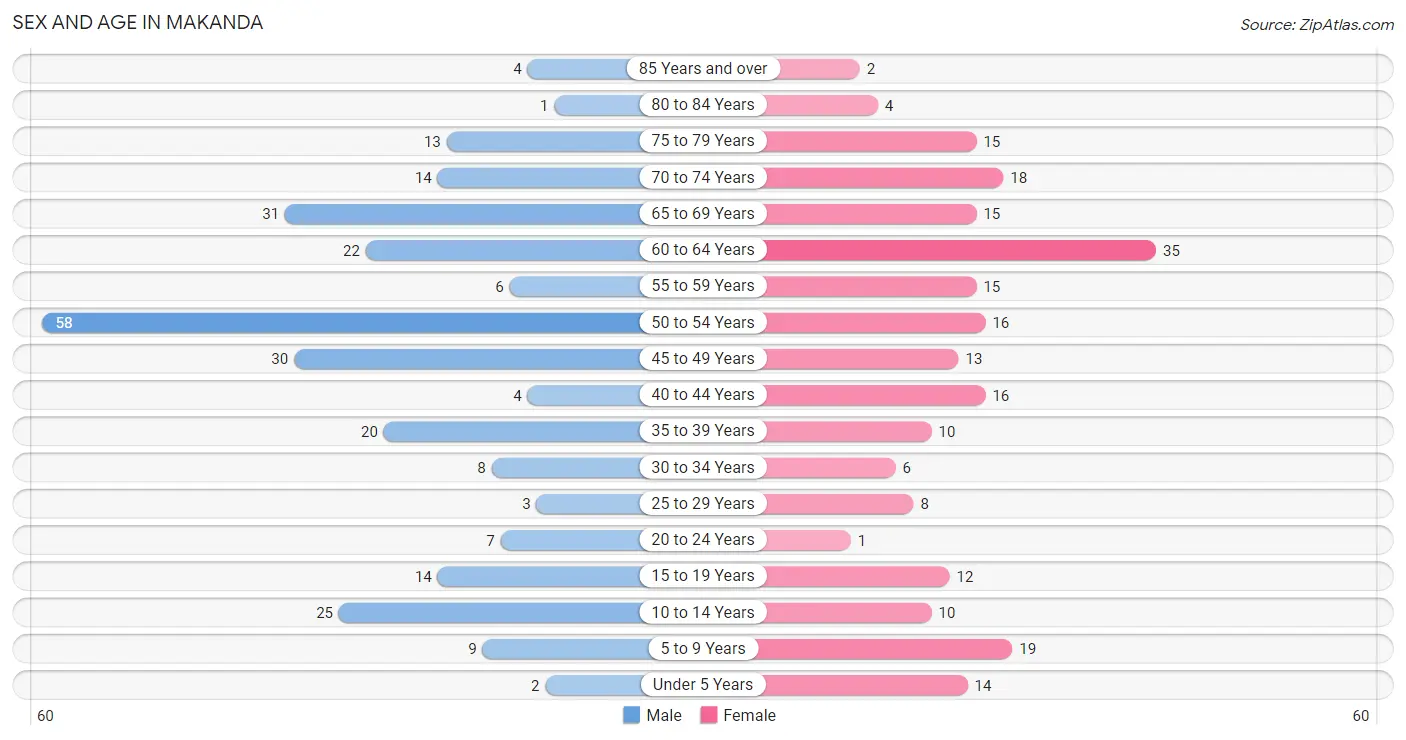
| Age Bracket | Male | Female |
| Under 5 Years | 2 (0.7%) | 14 (6.1%) |
| 5 to 9 Years | 9 (3.3%) | 19 (8.3%) |
| 10 to 14 Years | 25 (9.2%) | 10 (4.4%) |
| 15 to 19 Years | 14 (5.2%) | 12 (5.2%) |
| 20 to 24 Years | 7 (2.6%) | 1 (0.4%) |
| 25 to 29 Years | 3 (1.1%) | 8 (3.5%) |
| 30 to 34 Years | 8 (2.9%) | 6 (2.6%) |
| 35 to 39 Years | 20 (7.4%) | 10 (4.4%) |
| 40 to 44 Years | 4 (1.5%) | 16 (7.0%) |
| 45 to 49 Years | 30 (11.1%) | 13 (5.7%) |
| 50 to 54 Years | 58 (21.4%) | 16 (7.0%) |
| 55 to 59 Years | 6 (2.2%) | 15 (6.6%) |
| 60 to 64 Years | 22 (8.1%) | 35 (15.3%) |
| 65 to 69 Years | 31 (11.4%) | 15 (6.6%) |
| 70 to 74 Years | 14 (5.2%) | 18 (7.9%) |
| 75 to 79 Years | 13 (4.8%) | 15 (6.6%) |
| 80 to 84 Years | 1 (0.4%) | 4 (1.8%) |
| 85 Years and over | 4 (1.5%) | 2 (0.9%) |
| Total | 271 (100.0%) | 229 (100.0%) |
Families and Households in Makanda
Median Family Size in Makanda
The median family size in Makanda is 2.98 persons per family, with single female/mother families (16 | 11.2%) accounting for the largest median family size of 3.5 persons per family. On the other hand, single male/father families (4 | 2.8%) represent the smallest median family size with 2.50 persons per family.
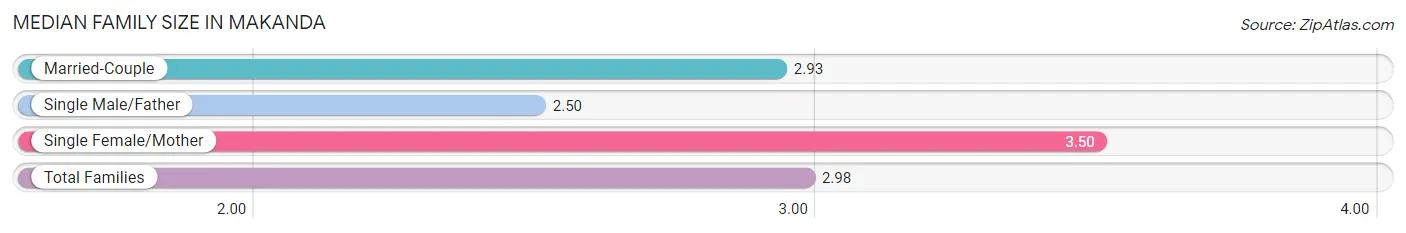
| Family Type | # Families | Family Size |
| Married-Couple | 123 (86.0%) | 2.93 |
| Single Male/Father | 4 (2.8%) | 2.50 |
| Single Female/Mother | 16 (11.2%) | 3.50 |
| Total Families | 143 (100.0%) | 2.98 |
Median Household Size in Makanda
The median household size in Makanda is 2.49 persons per household, with single female/mother households (16 | 8.0%) accounting for the largest median household size of 3.5 persons per household. non-family households (58 | 28.9%) represent the smallest median household size with 1.24 persons per household.
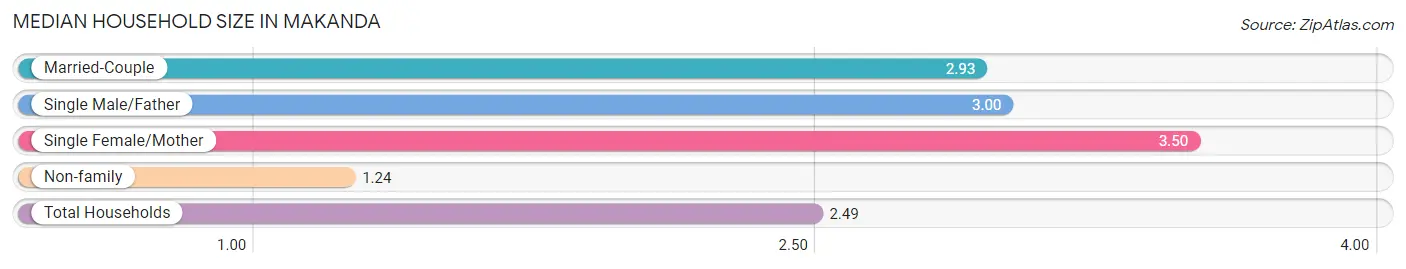
| Household Type | # Households | Household Size |
| Married-Couple | 123 (61.2%) | 2.93 |
| Single Male/Father | 4 (2.0%) | 3.00 |
| Single Female/Mother | 16 (8.0%) | 3.50 |
| Non-family | 58 (28.9%) | 1.24 |
| Total Households | 201 (100.0%) | 2.49 |
Household Size by Marriage Status in Makanda
Out of a total of 201 households in Makanda, 143 (71.1%) are family households, while 58 (28.9%) are nonfamily households. The most numerous type of family households are 2-person households, comprising 93, and the most common type of nonfamily households are 1-person households, comprising 45.

| Household Size | Family Households | Nonfamily Households |
| 1-Person Households | - | 45 (22.4%) |
| 2-Person Households | 93 (46.3%) | 13 (6.5%) |
| 3-Person Households | 14 (7.0%) | 0 (0.0%) |
| 4-Person Households | 10 (5.0%) | 0 (0.0%) |
| 5-Person Households | 22 (11.0%) | 0 (0.0%) |
| 6-Person Households | 0 (0.0%) | 0 (0.0%) |
| 7+ Person Households | 4 (2.0%) | 0 (0.0%) |
| Total | 143 (71.1%) | 58 (28.9%) |
Female Fertility in Makanda
Fertility by Age in Makanda
Average fertility rate in Makanda is 28.0 births per 1,000 women. Women in the age bracket of 35 to 50 years have the highest fertility rate with 44.0 births per 1,000 women. Women in the age bracket of 35 to 50 years acount for 100.0% of all women with births.
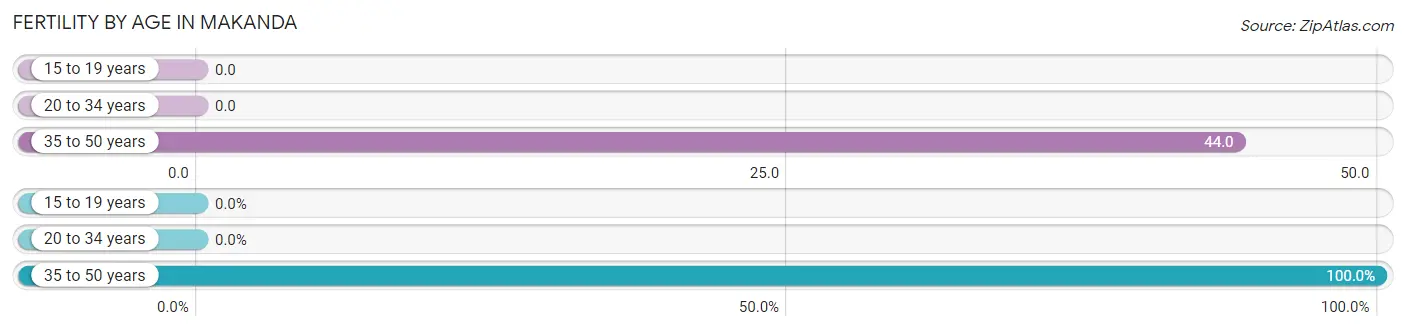
| Age Bracket | Women with Births | Births / 1,000 Women |
| 15 to 19 years | 0 (0.0%) | 0.0 |
| 20 to 34 years | 0 (0.0%) | 0.0 |
| 35 to 50 years | 2 (100.0%) | 44.0 |
| Total | 2 (100.0%) | 28.0 |
Fertility by Age by Marriage Status in Makanda
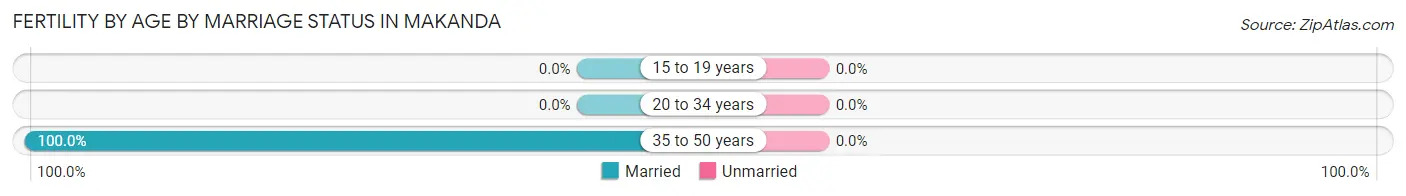
| Age Bracket | Married | Unmarried |
| 15 to 19 years | 0 (0.0%) | 0 (0.0%) |
| 20 to 34 years | 0 (0.0%) | 0 (0.0%) |
| 35 to 50 years | 2 (100.0%) | 0 (0.0%) |
| Total | 2 (100.0%) | 0 (0.0%) |
Fertility by Education in Makanda
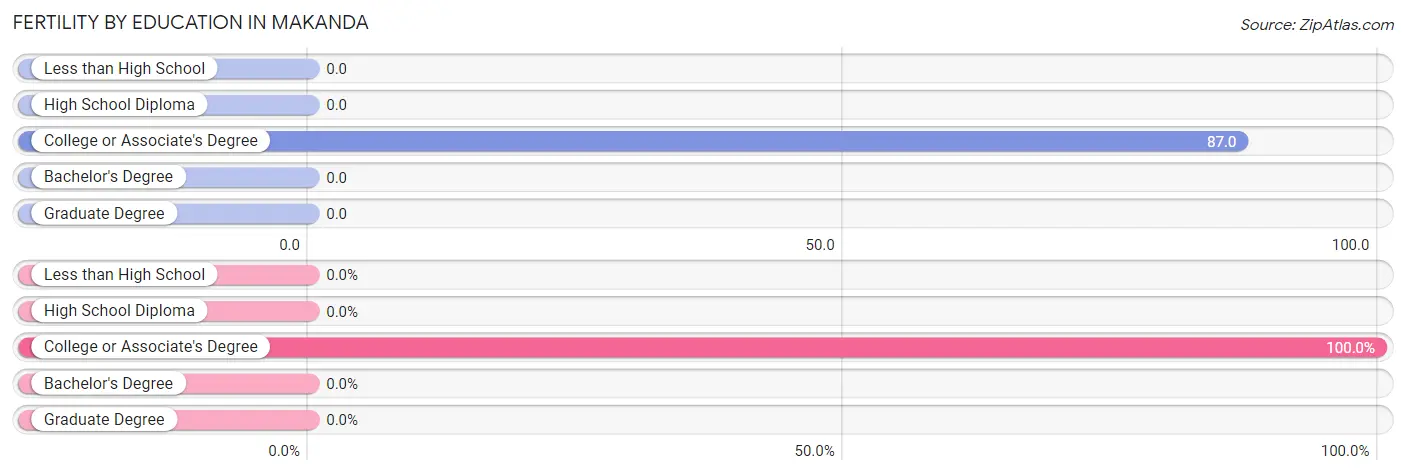
| Educational Attainment | Women with Births | Births / 1,000 Women |
| Less than High School | 0 (0.0%) | 0.0 |
| High School Diploma | 0 (0.0%) | 0.0 |
| College or Associate's Degree | 2 (100.0%) | 87.0 |
| Bachelor's Degree | 0 (0.0%) | 0.0 |
| Graduate Degree | 0 (0.0%) | 0.0 |
| Total | 2 (100.0%) | 28.0 |
Fertility by Education by Marriage Status in Makanda
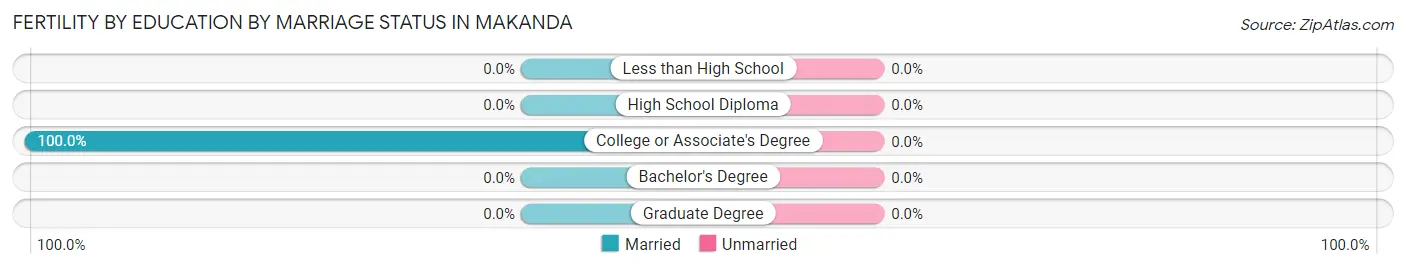
| Educational Attainment | Married | Unmarried |
| Less than High School | 0 (0.0%) | 0 (0.0%) |
| High School Diploma | 0 (0.0%) | 0 (0.0%) |
| College or Associate's Degree | 2 (100.0%) | 0 (0.0%) |
| Bachelor's Degree | 0 (0.0%) | 0 (0.0%) |
| Graduate Degree | 0 (0.0%) | 0 (0.0%) |
| Total | 2 (100.0%) | 0 (0.0%) |
Employment Characteristics in Makanda
Employment by Class of Employer in Makanda
Among the 213 employed individuals in Makanda, private company employees (97 | 45.5%), state government employees (33 | 15.5%), and not-for-profit organizations (26 | 12.2%) make up the most common classes of employment.
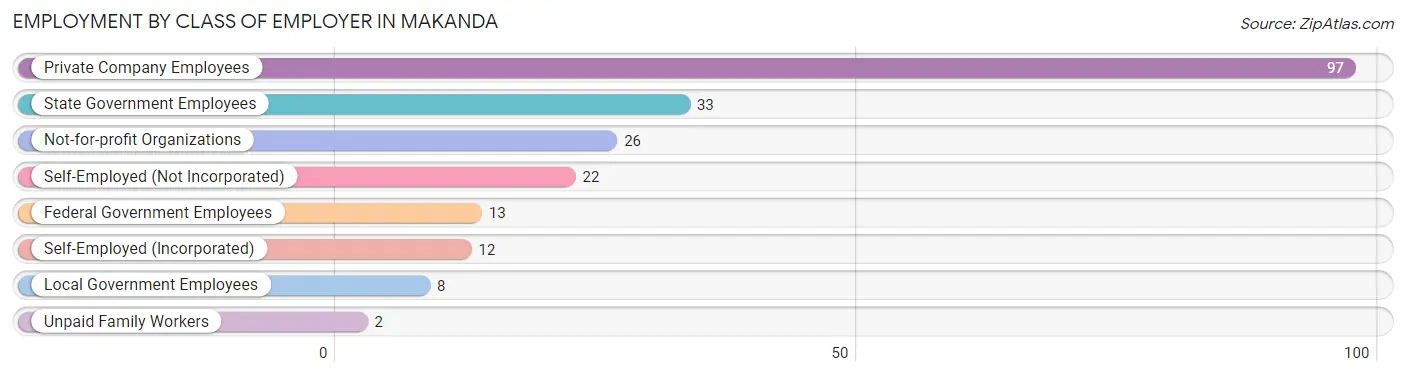
| Employer Class | # Employees | % Employees |
| Private Company Employees | 97 | 45.5% |
| Self-Employed (Incorporated) | 12 | 5.6% |
| Self-Employed (Not Incorporated) | 22 | 10.3% |
| Not-for-profit Organizations | 26 | 12.2% |
| Local Government Employees | 8 | 3.8% |
| State Government Employees | 33 | 15.5% |
| Federal Government Employees | 13 | 6.1% |
| Unpaid Family Workers | 2 | 0.9% |
| Total | 213 | 100.0% |
Employment Status by Age in Makanda
According to the labor force statistics for Makanda, out of the total population over 16 years of age (419), 53.5% or 224 individuals are in the labor force, with 0.9% or 2 of them unemployed. The age group with the highest labor force participation rate is 35 to 44 years, with 80.0% or 40 individuals in the labor force. Within the labor force, the 20 to 24 years age range has the highest percentage of unemployed individuals, with 16.7% or 1 of them being unemployed.
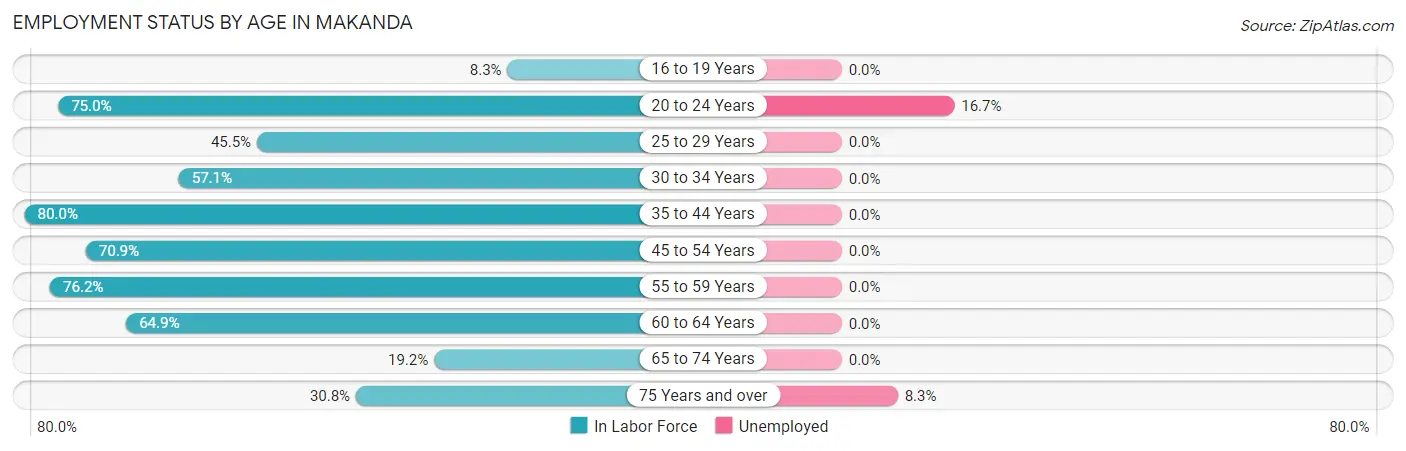
| Age Bracket | In Labor Force | Unemployed |
| 16 to 19 Years | 2 (8.3%) | 0 (0.0%) |
| 20 to 24 Years | 6 (75.0%) | 1 (16.7%) |
| 25 to 29 Years | 5 (45.5%) | 0 (0.0%) |
| 30 to 34 Years | 8 (57.1%) | 0 (0.0%) |
| 35 to 44 Years | 40 (80.0%) | 0 (0.0%) |
| 45 to 54 Years | 83 (70.9%) | 0 (0.0%) |
| 55 to 59 Years | 16 (76.2%) | 0 (0.0%) |
| 60 to 64 Years | 37 (64.9%) | 0 (0.0%) |
| 65 to 74 Years | 15 (19.2%) | 0 (0.0%) |
| 75 Years and over | 12 (30.8%) | 1 (8.3%) |
| Total | 224 (53.5%) | 2 (0.9%) |
Employment Status by Educational Attainment in Makanda
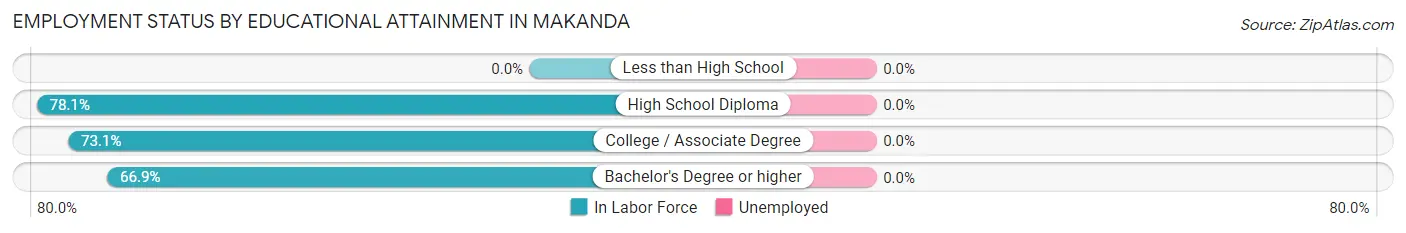
| Educational Attainment | In Labor Force | Unemployed |
| Less than High School | 0 (0.0%) | 0 (0.0%) |
| High School Diploma | 25 (78.1%) | 0 (0.0%) |
| College / Associate Degree | 57 (73.1%) | 0 (0.0%) |
| Bachelor's Degree or higher | 107 (66.9%) | 0 (0.0%) |
| Total | 189 (70.0%) | 0 (0.0%) |
Employment Occupations by Sex in Makanda
Management, Business, Science and Arts Occupations
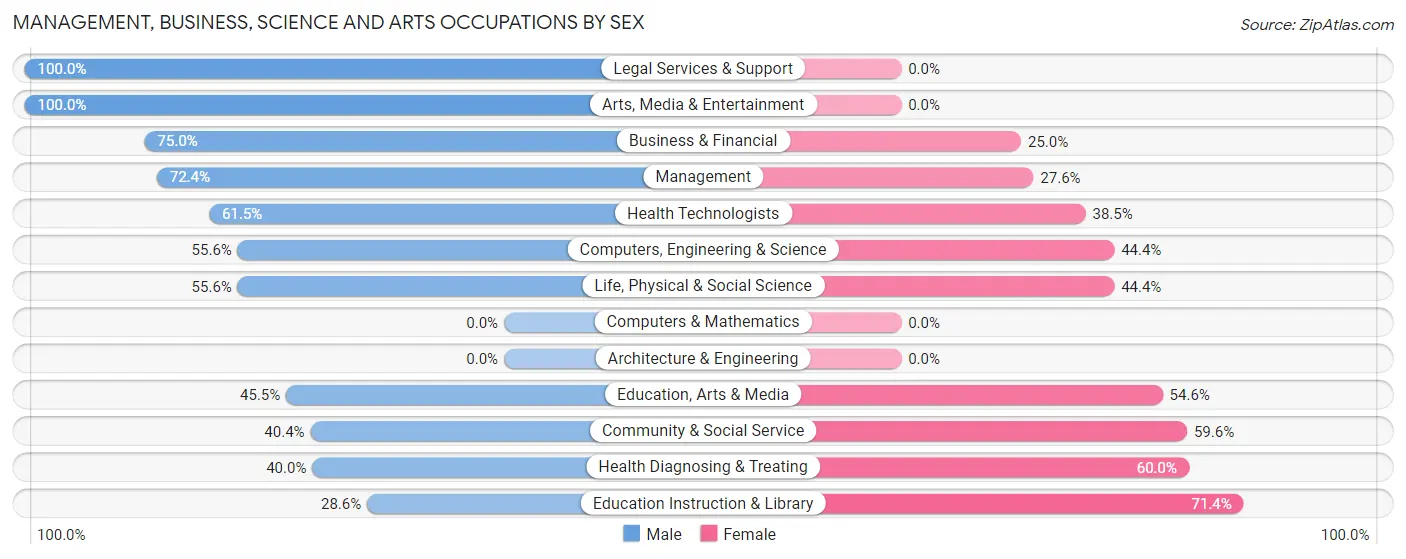
The most common Management, Business, Science and Arts occupations in Makanda are Community & Social Service (52 | 23.4%), Education Instruction & Library (35 | 15.8%), Management (29 | 13.1%), Health Diagnosing & Treating (20 | 9.0%), and Health Technologists (13 | 5.9%).
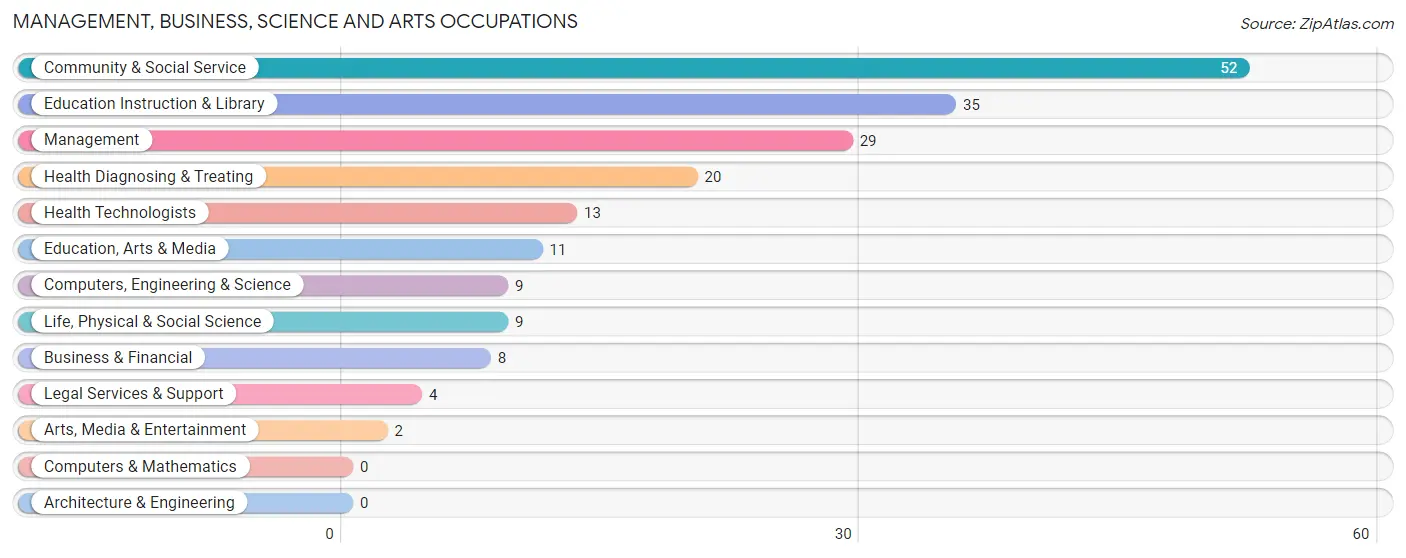
Management, Business, Science and Arts Occupations by Sex
Within the Management, Business, Science and Arts occupations in Makanda, the most male-oriented occupations are Legal Services & Support (100.0%), Arts, Media & Entertainment (100.0%), and Business & Financial (75.0%), while the most female-oriented occupations are Education Instruction & Library (71.4%), Health Diagnosing & Treating (60.0%), and Community & Social Service (59.6%).
| Occupation | Male | Female |
| Management | 21 (72.4%) | 8 (27.6%) |
| Business & Financial | 6 (75.0%) | 2 (25.0%) |
| Computers, Engineering & Science | 5 (55.6%) | 4 (44.4%) |
| Computers & Mathematics | 0 (0.0%) | 0 (0.0%) |
| Architecture & Engineering | 0 (0.0%) | 0 (0.0%) |
| Life, Physical & Social Science | 5 (55.6%) | 4 (44.4%) |
| Community & Social Service | 21 (40.4%) | 31 (59.6%) |
| Education, Arts & Media | 5 (45.5%) | 6 (54.5%) |
| Legal Services & Support | 4 (100.0%) | 0 (0.0%) |
| Education Instruction & Library | 10 (28.6%) | 25 (71.4%) |
| Arts, Media & Entertainment | 2 (100.0%) | 0 (0.0%) |
| Health Diagnosing & Treating | 8 (40.0%) | 12 (60.0%) |
| Health Technologists | 8 (61.5%) | 5 (38.5%) |
| Total (Category) | 61 (51.7%) | 57 (48.3%) |
| Total (Overall) | 118 (53.1%) | 104 (46.9%) |
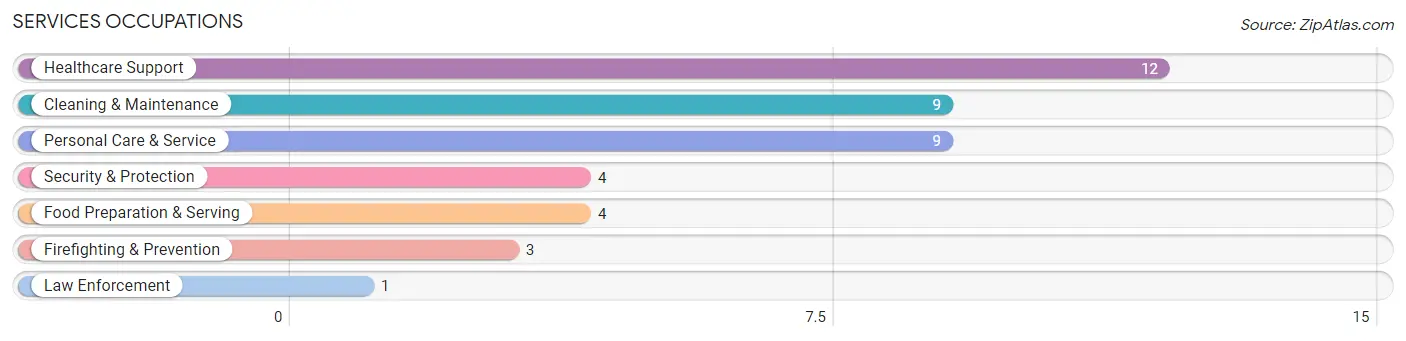
Services Occupations
The most common Services occupations in Makanda are Healthcare Support (12 | 5.4%), Cleaning & Maintenance (9 | 4.1%), Personal Care & Service (9 | 4.1%), Security & Protection (4 | 1.8%), and Food Preparation & Serving (4 | 1.8%).
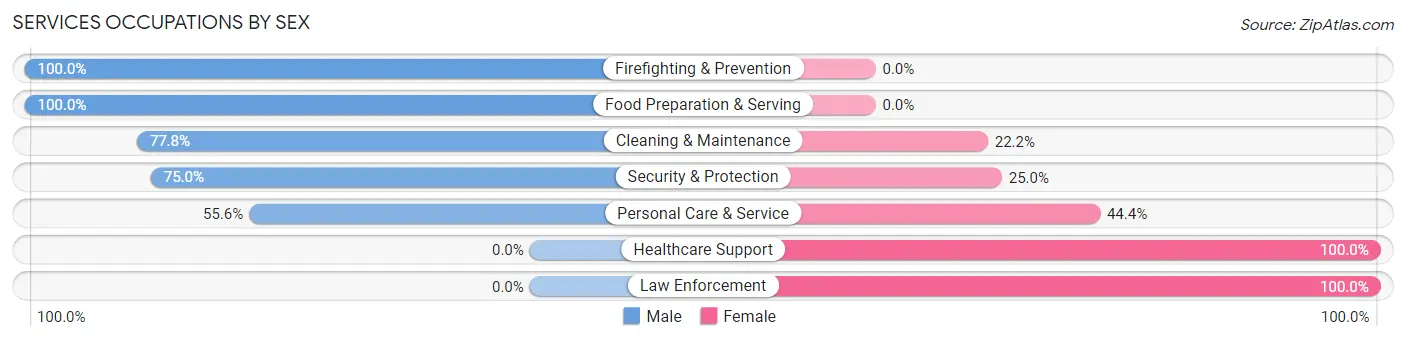
Services Occupations by Sex
Within the Services occupations in Makanda, the most male-oriented occupations are Firefighting & Prevention (100.0%), Food Preparation & Serving (100.0%), and Cleaning & Maintenance (77.8%), while the most female-oriented occupations are Healthcare Support (100.0%), Law Enforcement (100.0%), and Personal Care & Service (44.4%).
| Occupation | Male | Female |
| Healthcare Support | 0 (0.0%) | 12 (100.0%) |
| Security & Protection | 3 (75.0%) | 1 (25.0%) |
| Firefighting & Prevention | 3 (100.0%) | 0 (0.0%) |
| Law Enforcement | 0 (0.0%) | 1 (100.0%) |
| Food Preparation & Serving | 4 (100.0%) | 0 (0.0%) |
| Cleaning & Maintenance | 7 (77.8%) | 2 (22.2%) |
| Personal Care & Service | 5 (55.6%) | 4 (44.4%) |
| Total (Category) | 19 (50.0%) | 19 (50.0%) |
| Total (Overall) | 118 (53.1%) | 104 (46.9%) |
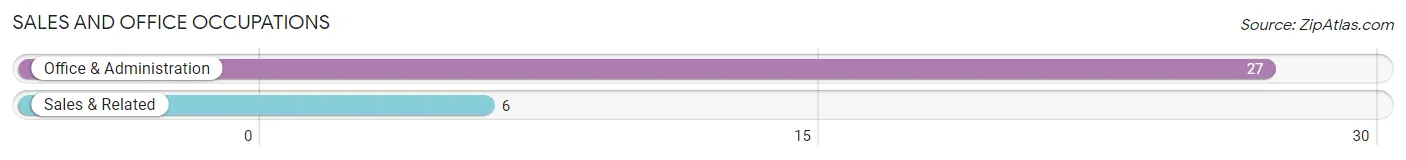
Sales and Office Occupations
The most common Sales and Office occupations in Makanda are Office & Administration (27 | 12.2%), and Sales & Related (6 | 2.7%).
Sales and Office Occupations by Sex
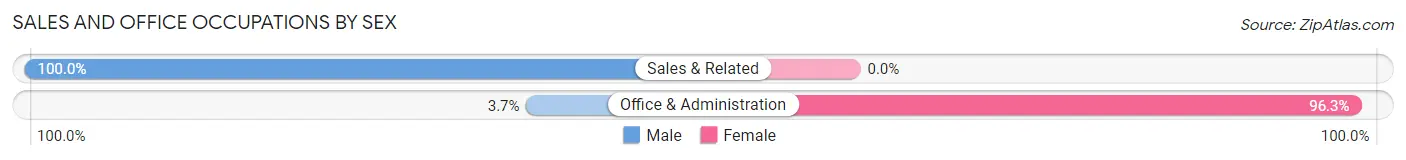
| Occupation | Male | Female |
| Sales & Related | 6 (100.0%) | 0 (0.0%) |
| Office & Administration | 1 (3.7%) | 26 (96.3%) |
| Total (Category) | 7 (21.2%) | 26 (78.8%) |
| Total (Overall) | 118 (53.1%) | 104 (46.9%) |
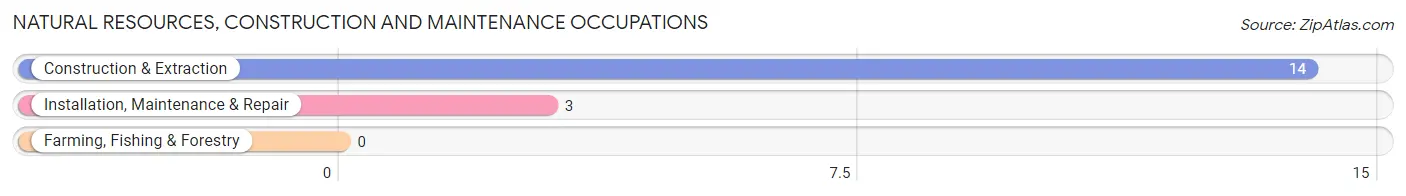
Natural Resources, Construction and Maintenance Occupations
The most common Natural Resources, Construction and Maintenance occupations in Makanda are Construction & Extraction (14 | 6.3%), and Installation, Maintenance & Repair (3 | 1.3%).
Natural Resources, Construction and Maintenance Occupations by Sex
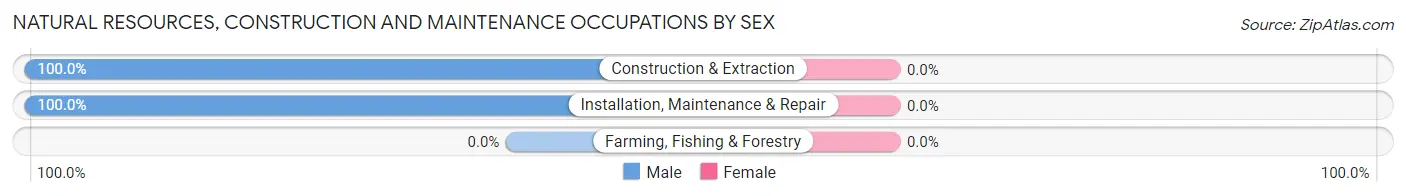
| Occupation | Male | Female |
| Farming, Fishing & Forestry | 0 (0.0%) | 0 (0.0%) |
| Construction & Extraction | 14 (100.0%) | 0 (0.0%) |
| Installation, Maintenance & Repair | 3 (100.0%) | 0 (0.0%) |
| Total (Category) | 17 (100.0%) | 0 (0.0%) |
| Total (Overall) | 118 (53.1%) | 104 (46.9%) |
Production, Transportation and Moving Occupations
The most common Production, Transportation and Moving occupations in Makanda are Transportation (9 | 4.1%), and Production (7 | 3.2%).
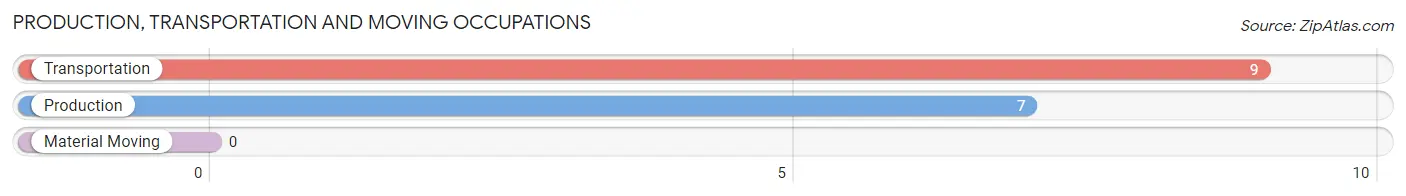
Production, Transportation and Moving Occupations by Sex
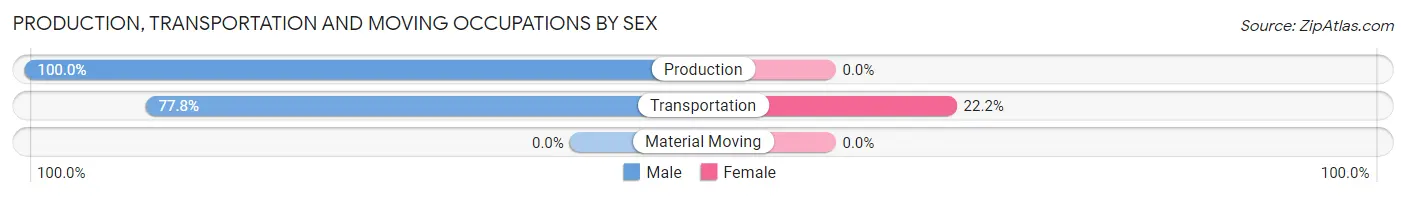
| Occupation | Male | Female |
| Production | 7 (100.0%) | 0 (0.0%) |
| Transportation | 7 (77.8%) | 2 (22.2%) |
| Material Moving | 0 (0.0%) | 0 (0.0%) |
| Total (Category) | 14 (87.5%) | 2 (12.5%) |
| Total (Overall) | 118 (53.1%) | 104 (46.9%) |
Employment Industries by Sex in Makanda
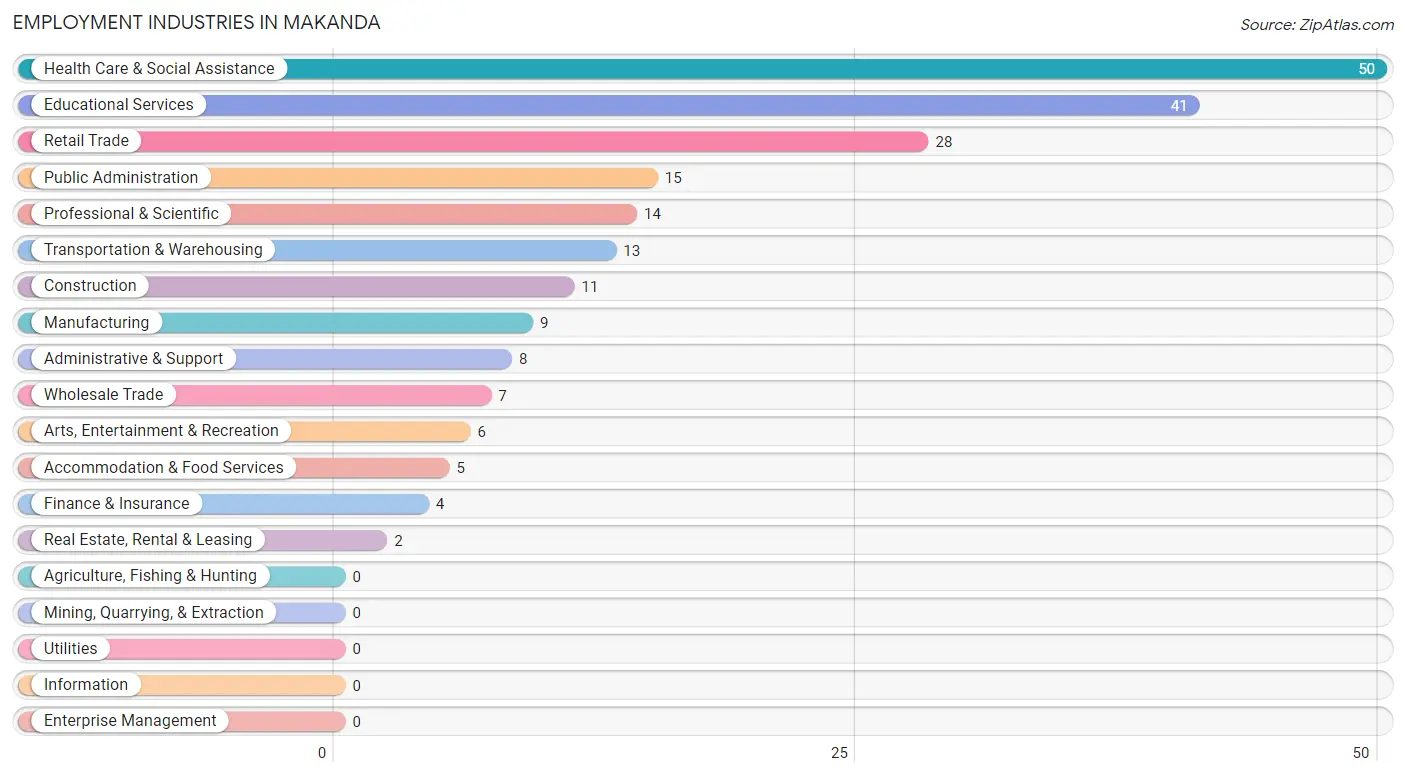
Employment Industries in Makanda
The major employment industries in Makanda include Health Care & Social Assistance (50 | 22.5%), Educational Services (41 | 18.5%), Retail Trade (28 | 12.6%), Public Administration (15 | 6.8%), and Professional & Scientific (14 | 6.3%).
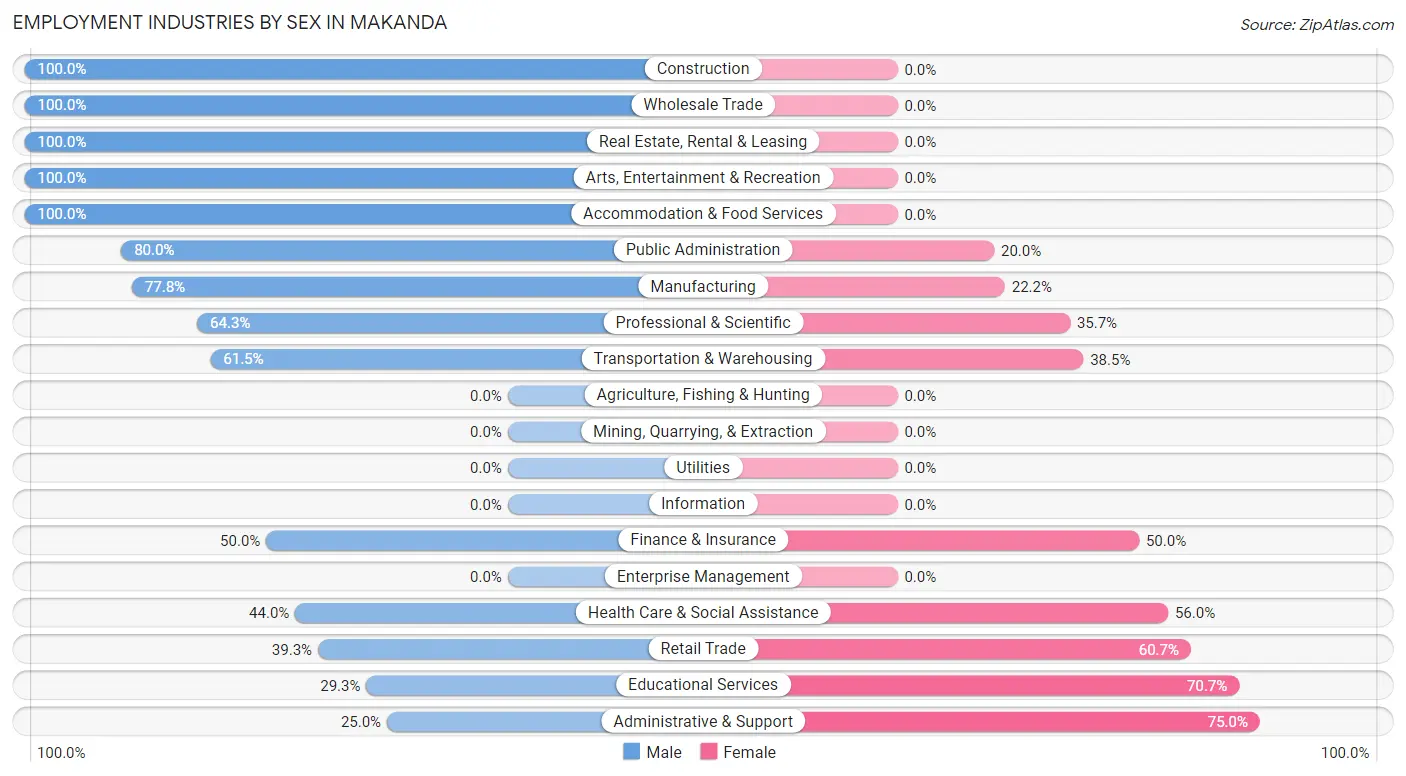
Employment Industries by Sex in Makanda
The Makanda industries that see more men than women are Construction (100.0%), Wholesale Trade (100.0%), and Real Estate, Rental & Leasing (100.0%), whereas the industries that tend to have a higher number of women are Administrative & Support (75.0%), Educational Services (70.7%), and Retail Trade (60.7%).
| Industry | Male | Female |
| Agriculture, Fishing & Hunting | 0 (0.0%) | 0 (0.0%) |
| Mining, Quarrying, & Extraction | 0 (0.0%) | 0 (0.0%) |
| Construction | 11 (100.0%) | 0 (0.0%) |
| Manufacturing | 7 (77.8%) | 2 (22.2%) |
| Wholesale Trade | 7 (100.0%) | 0 (0.0%) |
| Retail Trade | 11 (39.3%) | 17 (60.7%) |
| Transportation & Warehousing | 8 (61.5%) | 5 (38.5%) |
| Utilities | 0 (0.0%) | 0 (0.0%) |
| Information | 0 (0.0%) | 0 (0.0%) |
| Finance & Insurance | 2 (50.0%) | 2 (50.0%) |
| Real Estate, Rental & Leasing | 2 (100.0%) | 0 (0.0%) |
| Professional & Scientific | 9 (64.3%) | 5 (35.7%) |
| Enterprise Management | 0 (0.0%) | 0 (0.0%) |
| Administrative & Support | 2 (25.0%) | 6 (75.0%) |
| Educational Services | 12 (29.3%) | 29 (70.7%) |
| Health Care & Social Assistance | 22 (44.0%) | 28 (56.0%) |
| Arts, Entertainment & Recreation | 6 (100.0%) | 0 (0.0%) |
| Accommodation & Food Services | 5 (100.0%) | 0 (0.0%) |
| Public Administration | 12 (80.0%) | 3 (20.0%) |
| Total | 118 (53.1%) | 104 (46.9%) |
Education in Makanda
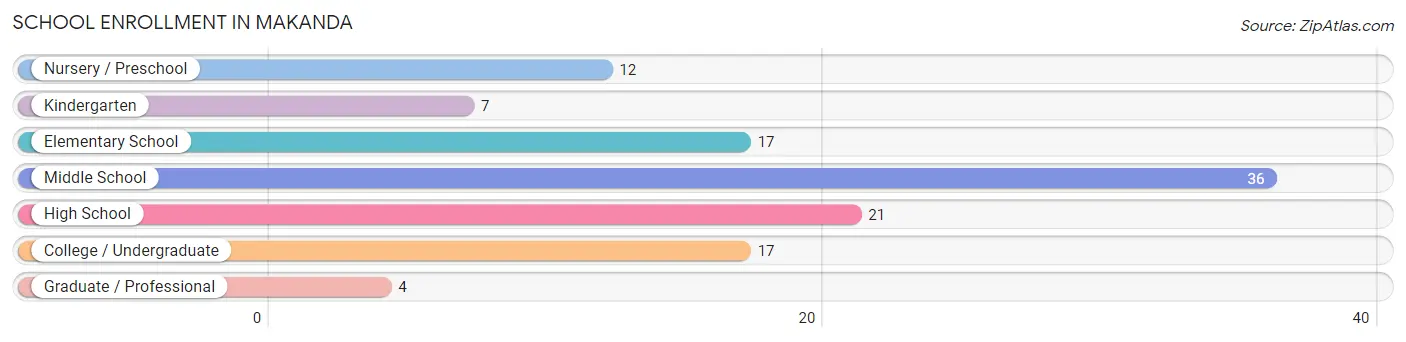
School Enrollment in Makanda
The most common levels of schooling among the 114 students in Makanda are middle school (36 | 31.6%), high school (21 | 18.4%), and elementary school (17 | 14.9%).
| School Level | # Students | % Students |
| Nursery / Preschool | 12 | 10.5% |
| Kindergarten | 7 | 6.1% |
| Elementary School | 17 | 14.9% |
| Middle School | 36 | 31.6% |
| High School | 21 | 18.4% |
| College / Undergraduate | 17 | 14.9% |
| Graduate / Professional | 4 | 3.5% |
| Total | 114 | 100.0% |
School Enrollment by Age by Funding Source in Makanda
Out of a total of 114 students who are enrolled in schools in Makanda, 15 (13.2%) attend a private institution, while the remaining 99 (86.8%) are enrolled in public schools. The age group of 18 to 19 year olds has the highest likelihood of being enrolled in private schools, with 2 (50.0% in the age bracket) enrolled. Conversely, the age group of 25 to 34 year olds has the lowest likelihood of being enrolled in a private school, with 9 (100.0% in the age bracket) attending a public institution.
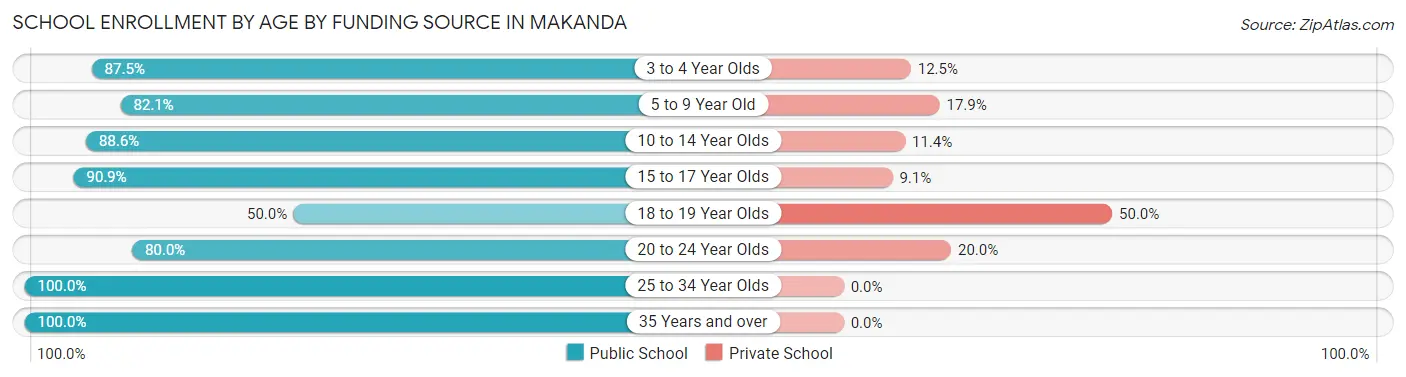
| Age Bracket | Public School | Private School |
| 3 to 4 Year Olds | 7 (87.5%) | 1 (12.5%) |
| 5 to 9 Year Old | 23 (82.1%) | 5 (17.9%) |
| 10 to 14 Year Olds | 31 (88.6%) | 4 (11.4%) |
| 15 to 17 Year Olds | 20 (90.9%) | 2 (9.1%) |
| 18 to 19 Year Olds | 2 (50.0%) | 2 (50.0%) |
| 20 to 24 Year Olds | 4 (80.0%) | 1 (20.0%) |
| 25 to 34 Year Olds | 9 (100.0%) | 0 (0.0%) |
| 35 Years and over | 3 (100.0%) | 0 (0.0%) |
| Total | 99 (86.8%) | 15 (13.2%) |
Educational Attainment by Field of Study in Makanda
Science & technology (45 | 16.0%), computers & mathematics (29 | 10.3%), bio, nature & agricultural (29 | 10.3%), arts & humanities (28 | 10.0%), and business (27 | 9.6%) are the most common fields of study among 281 individuals in Makanda who have obtained a bachelor's degree or higher.
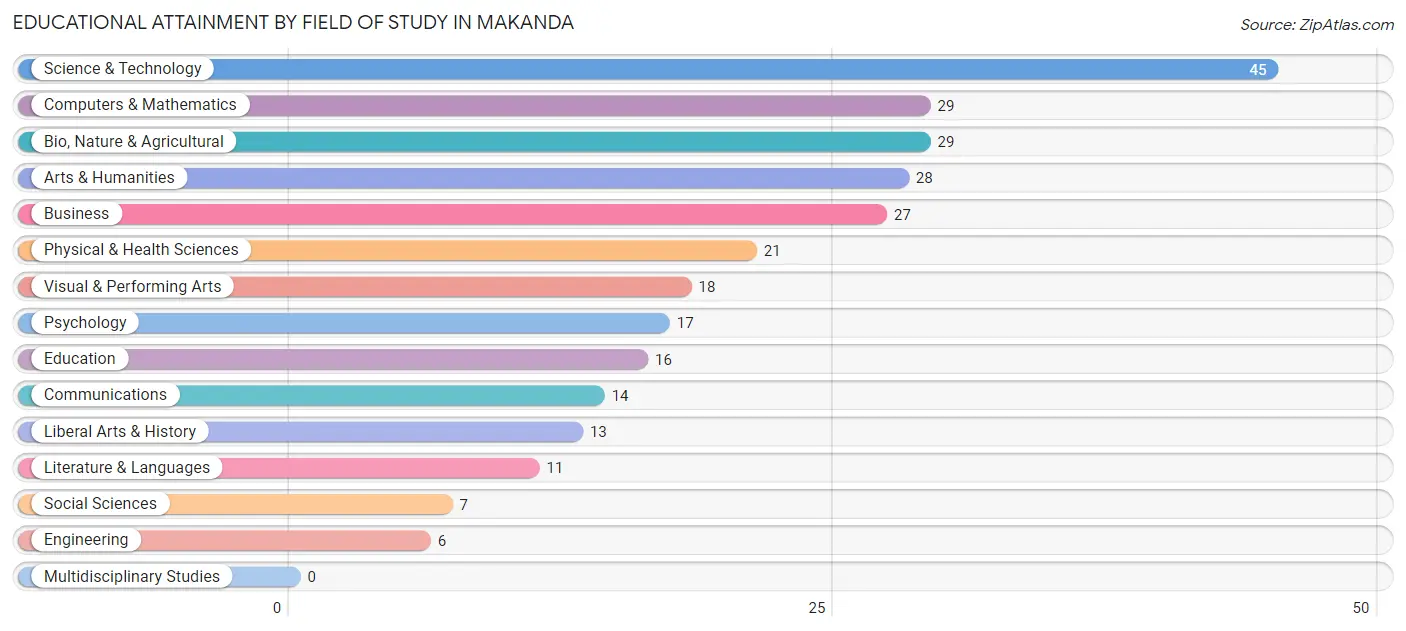
| Field of Study | # Graduates | % Graduates |
| Computers & Mathematics | 29 | 10.3% |
| Bio, Nature & Agricultural | 29 | 10.3% |
| Physical & Health Sciences | 21 | 7.5% |
| Psychology | 17 | 6.0% |
| Social Sciences | 7 | 2.5% |
| Engineering | 6 | 2.1% |
| Multidisciplinary Studies | 0 | 0.0% |
| Science & Technology | 45 | 16.0% |
| Business | 27 | 9.6% |
| Education | 16 | 5.7% |
| Literature & Languages | 11 | 3.9% |
| Liberal Arts & History | 13 | 4.6% |
| Visual & Performing Arts | 18 | 6.4% |
| Communications | 14 | 5.0% |
| Arts & Humanities | 28 | 10.0% |
| Total | 281 | 100.0% |
Transportation & Commute in Makanda
Vehicle Availability by Sex in Makanda
The most prevalent vehicle ownership categories in Makanda are males with 2 vehicles (59, accounting for 51.7%) and females with 2 vehicles (50, making up 59.6%).
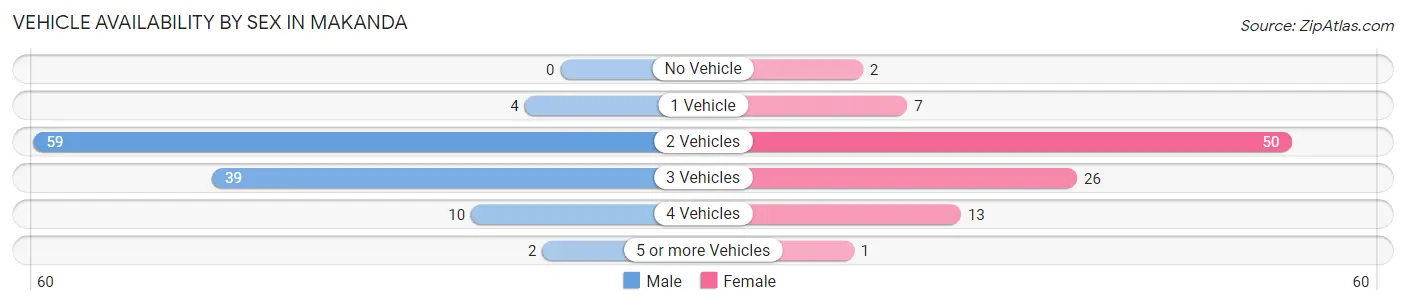
| Vehicles Available | Male | Female |
| No Vehicle | 0 (0.0%) | 2 (2.0%) |
| 1 Vehicle | 4 (3.5%) | 7 (7.1%) |
| 2 Vehicles | 59 (51.7%) | 50 (50.5%) |
| 3 Vehicles | 39 (34.2%) | 26 (26.3%) |
| 4 Vehicles | 10 (8.8%) | 13 (13.1%) |
| 5 or more Vehicles | 2 (1.8%) | 1 (1.0%) |
| Total | 114 (100.0%) | 99 (100.0%) |
Commute Time in Makanda
The most frequently occuring commute durations in Makanda are 15 to 19 minutes (42 commuters, 21.1%), 10 to 14 minutes (32 commuters, 16.1%), and 25 to 29 minutes (30 commuters, 15.1%).
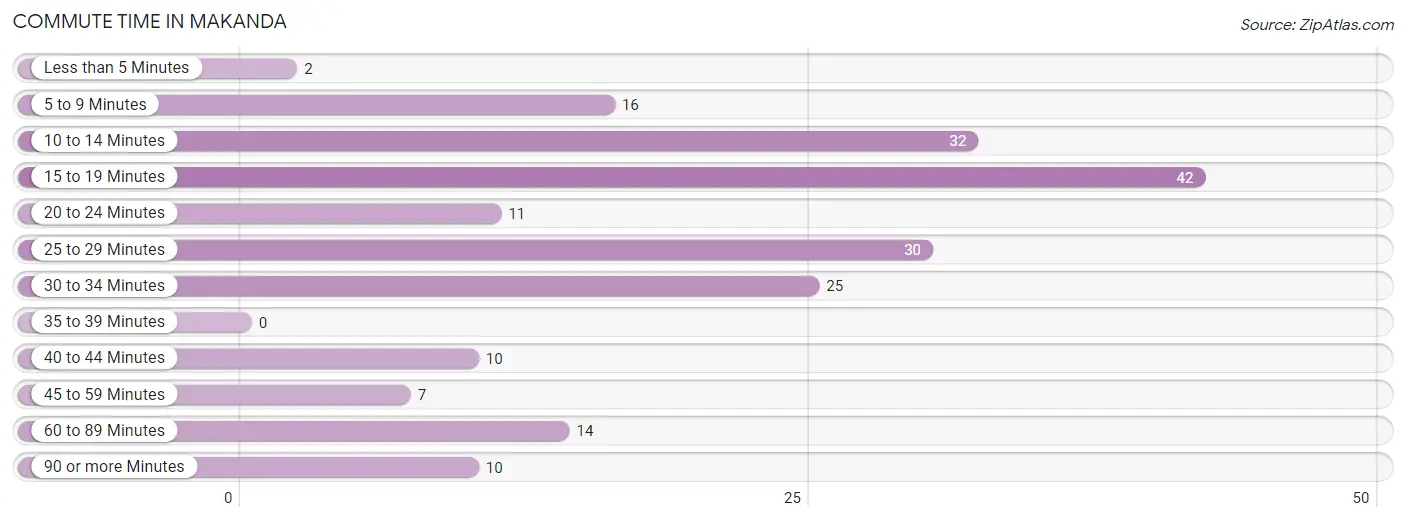
| Commute Time | # Commuters | % Commuters |
| Less than 5 Minutes | 2 | 1.0% |
| 5 to 9 Minutes | 16 | 8.0% |
| 10 to 14 Minutes | 32 | 16.1% |
| 15 to 19 Minutes | 42 | 21.1% |
| 20 to 24 Minutes | 11 | 5.5% |
| 25 to 29 Minutes | 30 | 15.1% |
| 30 to 34 Minutes | 25 | 12.6% |
| 35 to 39 Minutes | 0 | 0.0% |
| 40 to 44 Minutes | 10 | 5.0% |
| 45 to 59 Minutes | 7 | 3.5% |
| 60 to 89 Minutes | 14 | 7.0% |
| 90 or more Minutes | 10 | 5.0% |
Commute Time by Sex in Makanda
The most common commute times in Makanda are 15 to 19 minutes (29 commuters, 25.9%) for males and 10 to 14 minutes (23 commuters, 26.4%) for females.
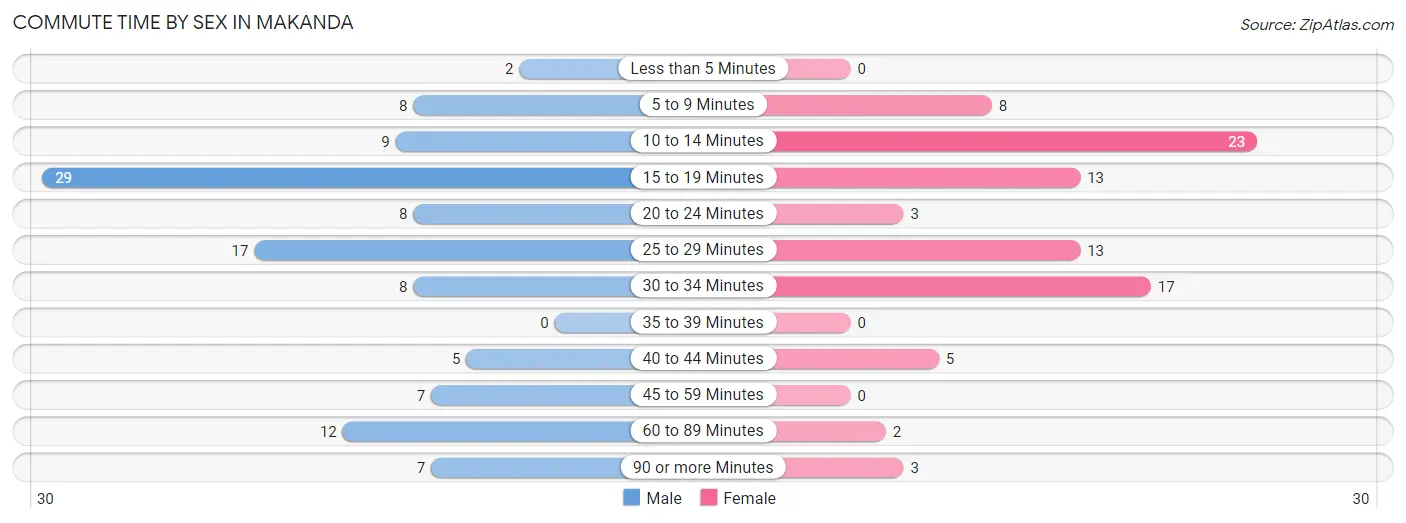
| Commute Time | Male | Female |
| Less than 5 Minutes | 2 (1.8%) | 0 (0.0%) |
| 5 to 9 Minutes | 8 (7.1%) | 8 (9.2%) |
| 10 to 14 Minutes | 9 (8.0%) | 23 (26.4%) |
| 15 to 19 Minutes | 29 (25.9%) | 13 (14.9%) |
| 20 to 24 Minutes | 8 (7.1%) | 3 (3.5%) |
| 25 to 29 Minutes | 17 (15.2%) | 13 (14.9%) |
| 30 to 34 Minutes | 8 (7.1%) | 17 (19.5%) |
| 35 to 39 Minutes | 0 (0.0%) | 0 (0.0%) |
| 40 to 44 Minutes | 5 (4.5%) | 5 (5.8%) |
| 45 to 59 Minutes | 7 (6.2%) | 0 (0.0%) |
| 60 to 89 Minutes | 12 (10.7%) | 2 (2.3%) |
| 90 or more Minutes | 7 (6.2%) | 3 (3.5%) |
Time of Departure to Work by Sex in Makanda
The most frequent times of departure to work in Makanda are 6:00 AM to 6:29 AM (21, 18.8%) for males and 7:30 AM to 7:59 AM (32, 36.8%) for females.
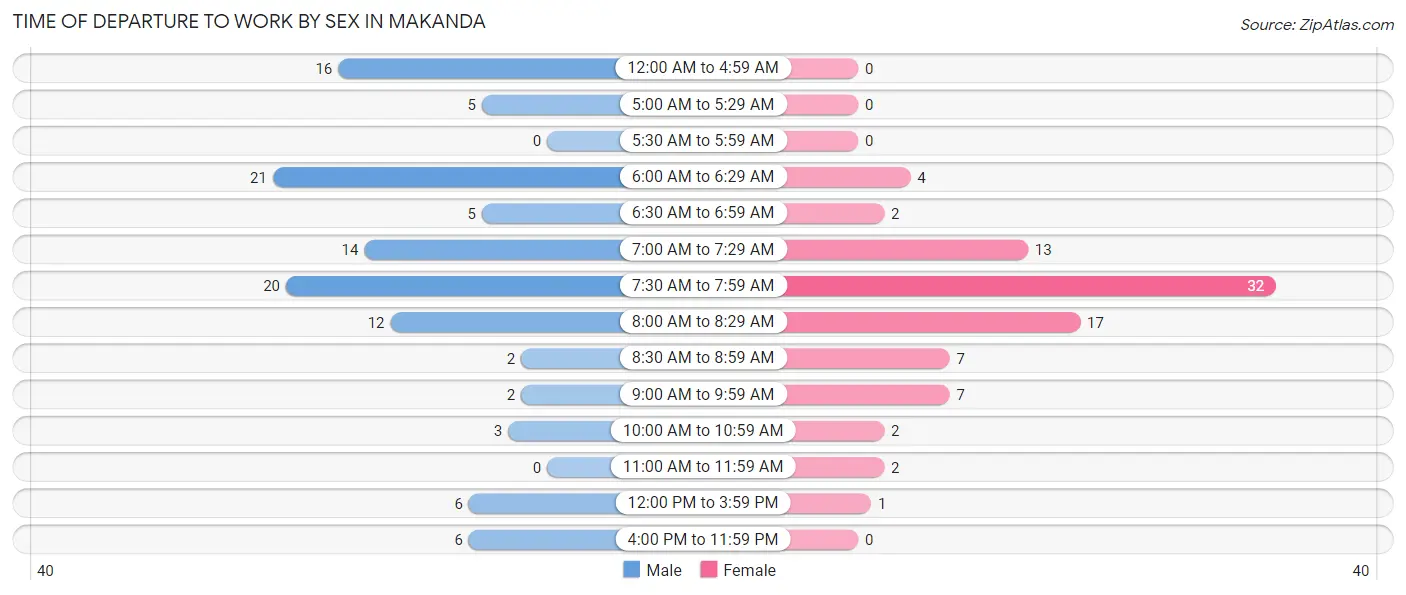
| Time of Departure | Male | Female |
| 12:00 AM to 4:59 AM | 16 (14.3%) | 0 (0.0%) |
| 5:00 AM to 5:29 AM | 5 (4.5%) | 0 (0.0%) |
| 5:30 AM to 5:59 AM | 0 (0.0%) | 0 (0.0%) |
| 6:00 AM to 6:29 AM | 21 (18.8%) | 4 (4.6%) |
| 6:30 AM to 6:59 AM | 5 (4.5%) | 2 (2.3%) |
| 7:00 AM to 7:29 AM | 14 (12.5%) | 13 (14.9%) |
| 7:30 AM to 7:59 AM | 20 (17.9%) | 32 (36.8%) |
| 8:00 AM to 8:29 AM | 12 (10.7%) | 17 (19.5%) |
| 8:30 AM to 8:59 AM | 2 (1.8%) | 7 (8.1%) |
| 9:00 AM to 9:59 AM | 2 (1.8%) | 7 (8.1%) |
| 10:00 AM to 10:59 AM | 3 (2.7%) | 2 (2.3%) |
| 11:00 AM to 11:59 AM | 0 (0.0%) | 2 (2.3%) |
| 12:00 PM to 3:59 PM | 6 (5.4%) | 1 (1.1%) |
| 4:00 PM to 11:59 PM | 6 (5.4%) | 0 (0.0%) |
| Total | 112 (100.0%) | 87 (100.0%) |
Housing Occupancy in Makanda
Occupancy by Ownership in Makanda
Of the total 201 dwellings in Makanda, owner-occupied units account for 149 (74.1%), while renter-occupied units make up 52 (25.9%).
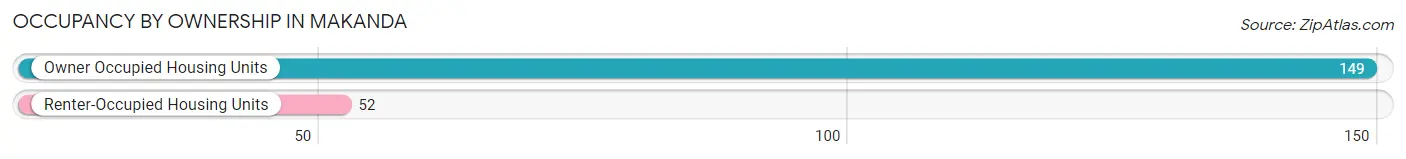
| Occupancy | # Housing Units | % Housing Units |
| Owner Occupied Housing Units | 149 | 74.1% |
| Renter-Occupied Housing Units | 52 | 25.9% |
| Total Occupied Housing Units | 201 | 100.0% |
Occupancy by Household Size in Makanda
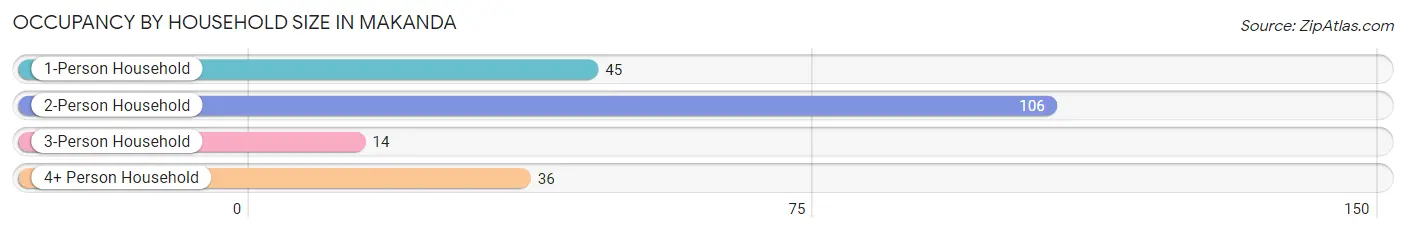
| Household Size | # Housing Units | % Housing Units |
| 1-Person Household | 45 | 22.4% |
| 2-Person Household | 106 | 52.7% |
| 3-Person Household | 14 | 7.0% |
| 4+ Person Household | 36 | 17.9% |
| Total Housing Units | 201 | 100.0% |
Occupancy by Ownership by Household Size in Makanda
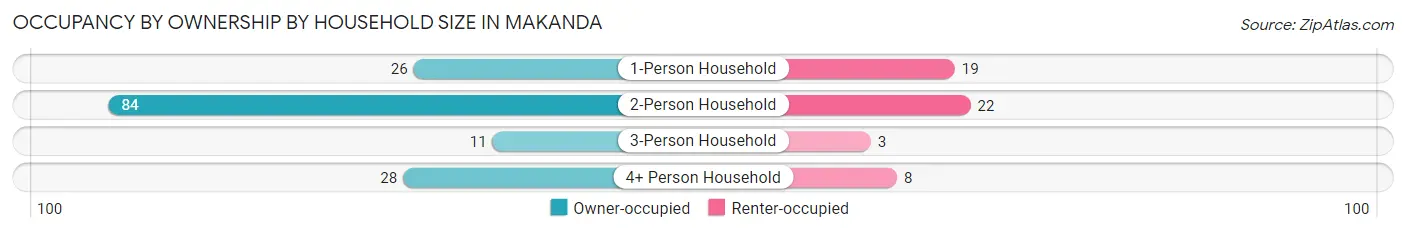
| Household Size | Owner-occupied | Renter-occupied |
| 1-Person Household | 26 (57.8%) | 19 (42.2%) |
| 2-Person Household | 84 (79.2%) | 22 (20.7%) |
| 3-Person Household | 11 (78.6%) | 3 (21.4%) |
| 4+ Person Household | 28 (77.8%) | 8 (22.2%) |
| Total Housing Units | 149 (74.1%) | 52 (25.9%) |
Occupancy by Educational Attainment in Makanda
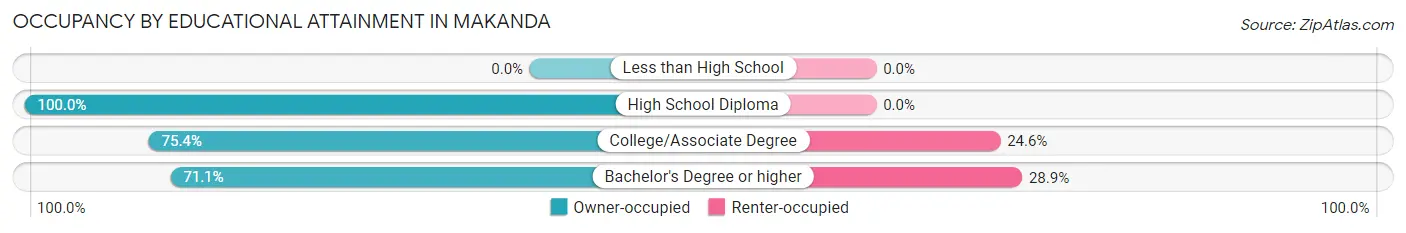
| Household Size | Owner-occupied | Renter-occupied |
| Less than High School | 0 (0.0%) | 0 (0.0%) |
| High School Diploma | 12 (100.0%) | 0 (0.0%) |
| College/Associate Degree | 46 (75.4%) | 15 (24.6%) |
| Bachelor's Degree or higher | 91 (71.1%) | 37 (28.9%) |
Occupancy by Age of Householder in Makanda
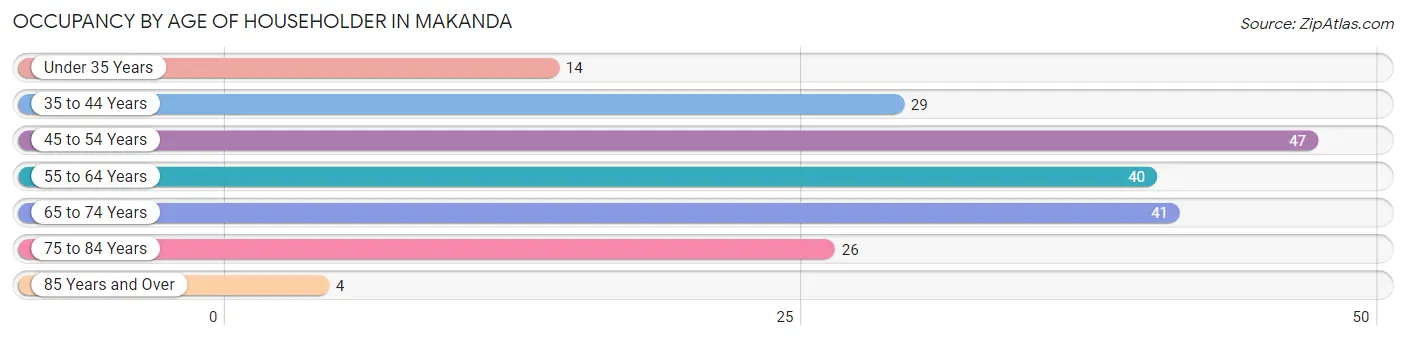
| Age Bracket | # Households | % Households |
| Under 35 Years | 14 | 7.0% |
| 35 to 44 Years | 29 | 14.4% |
| 45 to 54 Years | 47 | 23.4% |
| 55 to 64 Years | 40 | 19.9% |
| 65 to 74 Years | 41 | 20.4% |
| 75 to 84 Years | 26 | 12.9% |
| 85 Years and Over | 4 | 2.0% |
| Total | 201 | 100.0% |
Housing Finances in Makanda
Median Income by Occupancy in Makanda
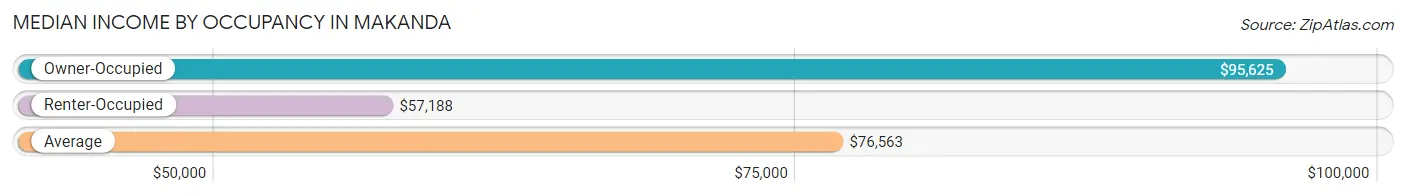
| Occupancy Type | # Households | Median Income |
| Owner-Occupied | 149 (74.1%) | $95,625 |
| Renter-Occupied | 52 (25.9%) | $57,188 |
| Average | 201 (100.0%) | $76,563 |
Occupancy by Householder Income Bracket in Makanda
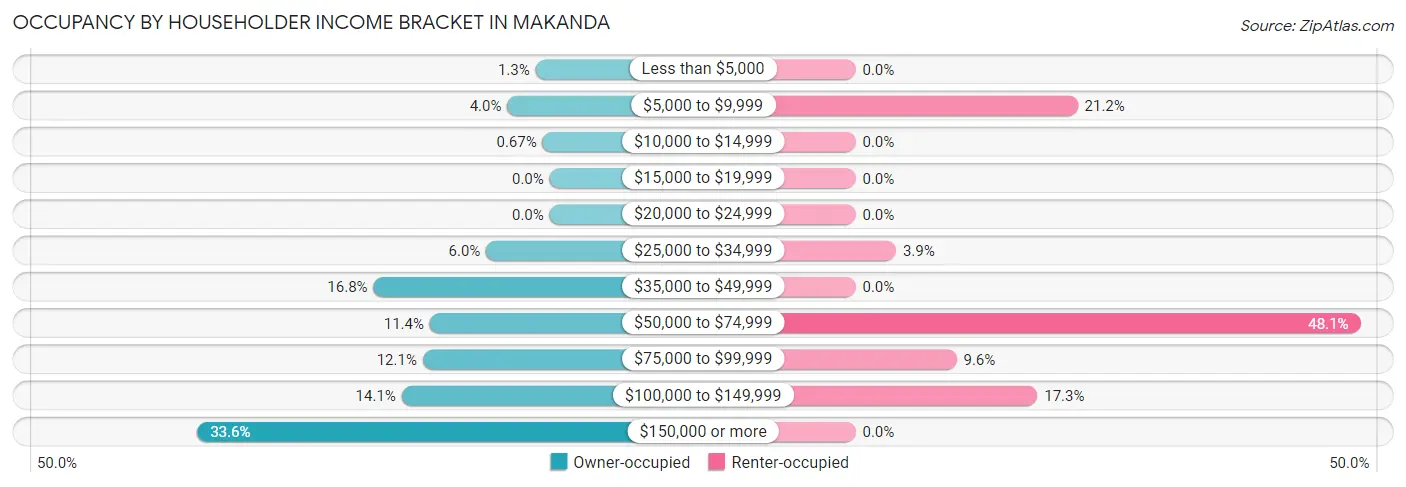
| Income Bracket | Owner-occupied | Renter-occupied |
| Less than $5,000 | 2 (1.3%) | 0 (0.0%) |
| $5,000 to $9,999 | 6 (4.0%) | 11 (21.1%) |
| $10,000 to $14,999 | 1 (0.7%) | 0 (0.0%) |
| $15,000 to $19,999 | 0 (0.0%) | 0 (0.0%) |
| $20,000 to $24,999 | 0 (0.0%) | 0 (0.0%) |
| $25,000 to $34,999 | 9 (6.0%) | 2 (3.8%) |
| $35,000 to $49,999 | 25 (16.8%) | 0 (0.0%) |
| $50,000 to $74,999 | 17 (11.4%) | 25 (48.1%) |
| $75,000 to $99,999 | 18 (12.1%) | 5 (9.6%) |
| $100,000 to $149,999 | 21 (14.1%) | 9 (17.3%) |
| $150,000 or more | 50 (33.6%) | 0 (0.0%) |
| Total | 149 (100.0%) | 52 (100.0%) |
Monthly Housing Cost Tiers in Makanda
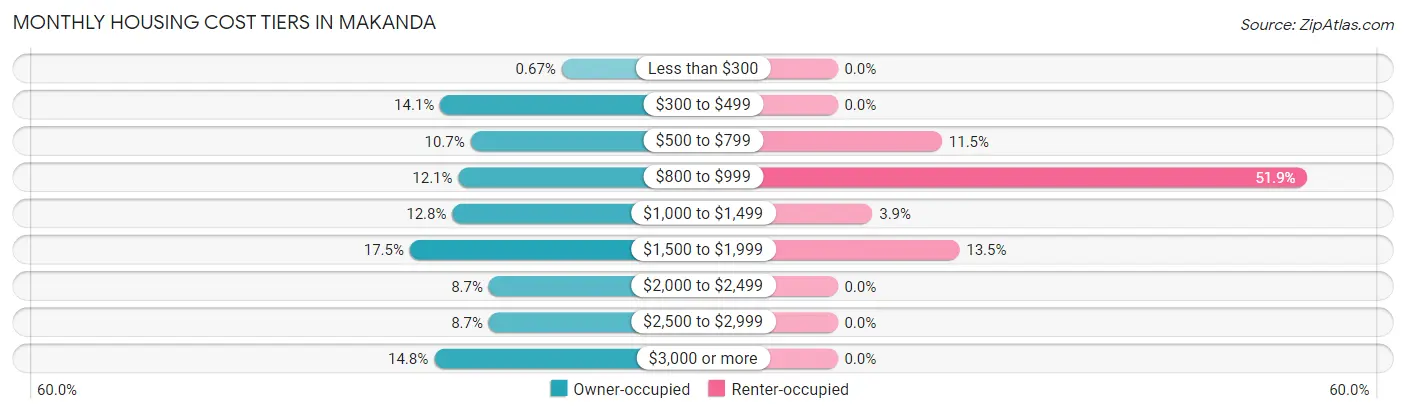
| Monthly Cost | Owner-occupied | Renter-occupied |
| Less than $300 | 1 (0.7%) | 0 (0.0%) |
| $300 to $499 | 21 (14.1%) | 0 (0.0%) |
| $500 to $799 | 16 (10.7%) | 6 (11.5%) |
| $800 to $999 | 18 (12.1%) | 27 (51.9%) |
| $1,000 to $1,499 | 19 (12.8%) | 2 (3.8%) |
| $1,500 to $1,999 | 26 (17.4%) | 7 (13.5%) |
| $2,000 to $2,499 | 13 (8.7%) | 0 (0.0%) |
| $2,500 to $2,999 | 13 (8.7%) | 0 (0.0%) |
| $3,000 or more | 22 (14.8%) | 0 (0.0%) |
| Total | 149 (100.0%) | 52 (100.0%) |
Physical Housing Characteristics in Makanda
Housing Structures in Makanda
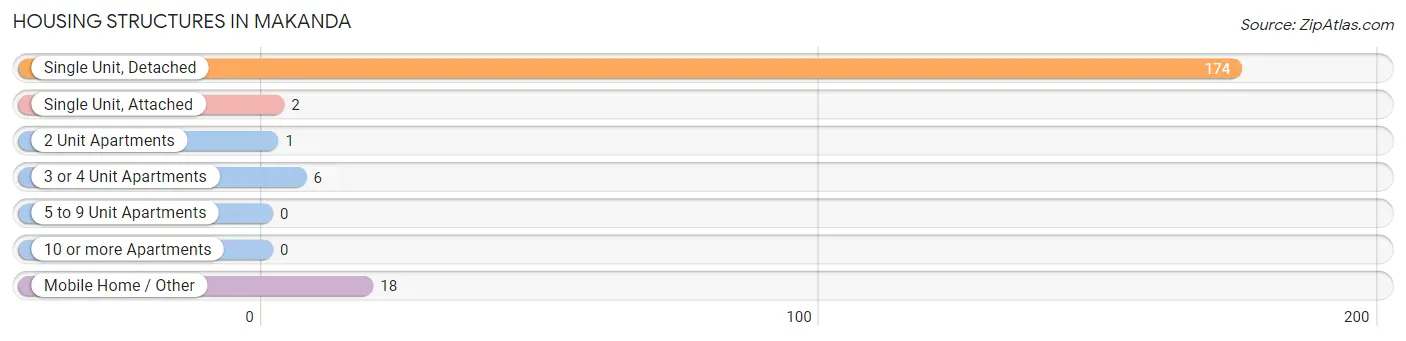
| Structure Type | # Housing Units | % Housing Units |
| Single Unit, Detached | 174 | 86.6% |
| Single Unit, Attached | 2 | 1.0% |
| 2 Unit Apartments | 1 | 0.5% |
| 3 or 4 Unit Apartments | 6 | 3.0% |
| 5 to 9 Unit Apartments | 0 | 0.0% |
| 10 or more Apartments | 0 | 0.0% |
| Mobile Home / Other | 18 | 9.0% |
| Total | 201 | 100.0% |
Housing Structures by Occupancy in Makanda
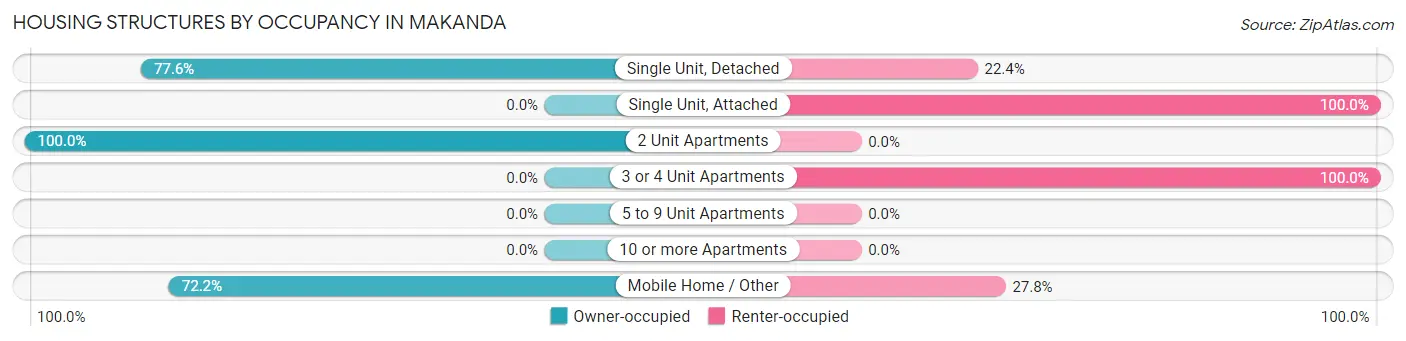
| Structure Type | Owner-occupied | Renter-occupied |
| Single Unit, Detached | 135 (77.6%) | 39 (22.4%) |
| Single Unit, Attached | 0 (0.0%) | 2 (100.0%) |
| 2 Unit Apartments | 1 (100.0%) | 0 (0.0%) |
| 3 or 4 Unit Apartments | 0 (0.0%) | 6 (100.0%) |
| 5 to 9 Unit Apartments | 0 (0.0%) | 0 (0.0%) |
| 10 or more Apartments | 0 (0.0%) | 0 (0.0%) |
| Mobile Home / Other | 13 (72.2%) | 5 (27.8%) |
| Total | 149 (74.1%) | 52 (25.9%) |
Housing Structures by Number of Rooms in Makanda
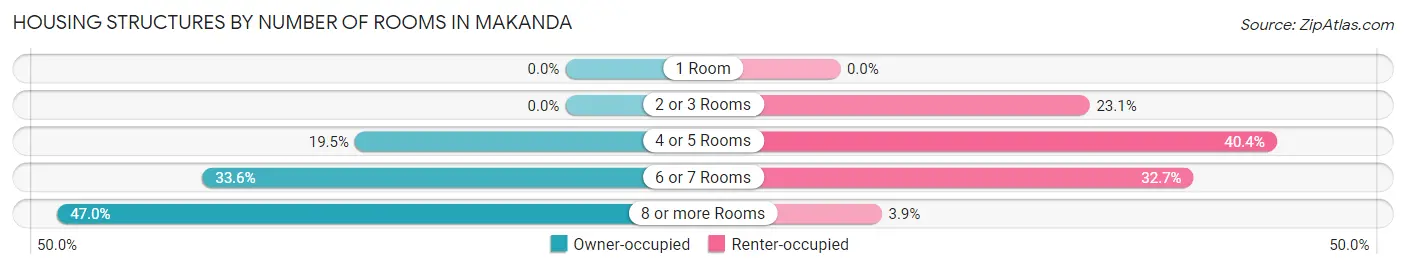
| Number of Rooms | Owner-occupied | Renter-occupied |
| 1 Room | 0 (0.0%) | 0 (0.0%) |
| 2 or 3 Rooms | 0 (0.0%) | 12 (23.1%) |
| 4 or 5 Rooms | 29 (19.5%) | 21 (40.4%) |
| 6 or 7 Rooms | 50 (33.6%) | 17 (32.7%) |
| 8 or more Rooms | 70 (47.0%) | 2 (3.8%) |
| Total | 149 (100.0%) | 52 (100.0%) |
Housing Structure by Heating Type in Makanda
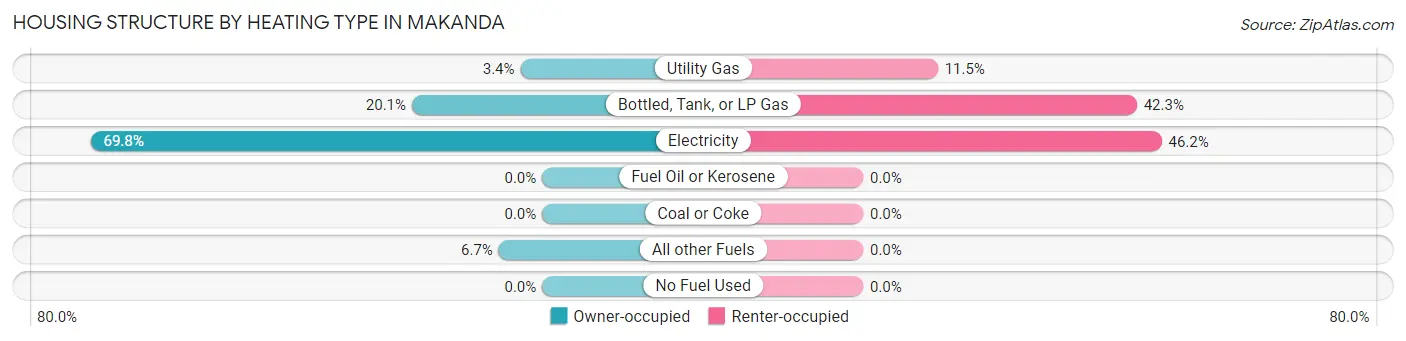
| Heating Type | Owner-occupied | Renter-occupied |
| Utility Gas | 5 (3.4%) | 6 (11.5%) |
| Bottled, Tank, or LP Gas | 30 (20.1%) | 22 (42.3%) |
| Electricity | 104 (69.8%) | 24 (46.2%) |
| Fuel Oil or Kerosene | 0 (0.0%) | 0 (0.0%) |
| Coal or Coke | 0 (0.0%) | 0 (0.0%) |
| All other Fuels | 10 (6.7%) | 0 (0.0%) |
| No Fuel Used | 0 (0.0%) | 0 (0.0%) |
| Total | 149 (100.0%) | 52 (100.0%) |
Household Vehicle Usage in Makanda
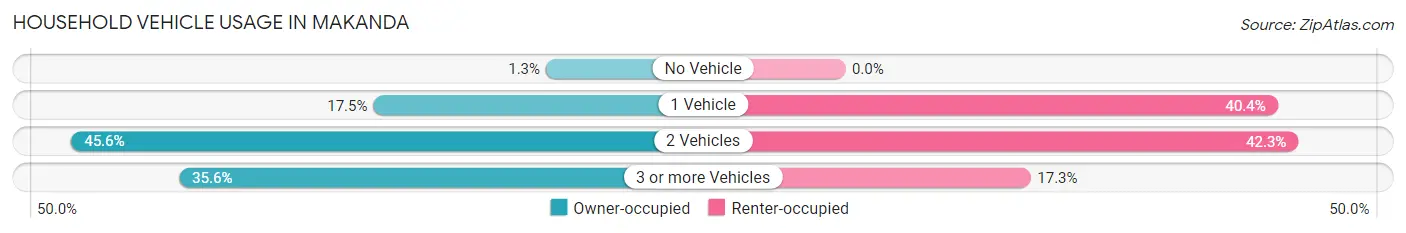
| Vehicles per Household | Owner-occupied | Renter-occupied |
| No Vehicle | 2 (1.3%) | 0 (0.0%) |
| 1 Vehicle | 26 (17.4%) | 21 (40.4%) |
| 2 Vehicles | 68 (45.6%) | 22 (42.3%) |
| 3 or more Vehicles | 53 (35.6%) | 9 (17.3%) |
| Total | 149 (100.0%) | 52 (100.0%) |
Real Estate & Mortgages in Makanda
Real Estate and Mortgage Overview in Makanda
| Characteristic | Without Mortgage | With Mortgage |
| Housing Units | 77 | 72 |
| Median Property Value | $213,900 | $285,000 |
| Median Household Income | $66,875 | $27 |
| Monthly Housing Costs | $804 | $22 |
| Real Estate Taxes | $3,950 | $0 |
Property Value by Mortgage Status in Makanda
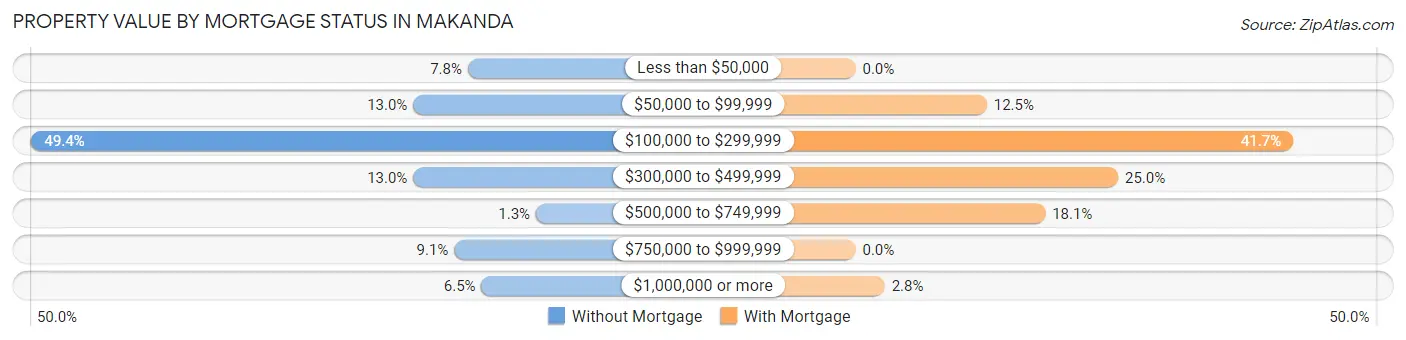
| Property Value | Without Mortgage | With Mortgage |
| Less than $50,000 | 6 (7.8%) | 0 (0.0%) |
| $50,000 to $99,999 | 10 (13.0%) | 9 (12.5%) |
| $100,000 to $299,999 | 38 (49.3%) | 30 (41.7%) |
| $300,000 to $499,999 | 10 (13.0%) | 18 (25.0%) |
| $500,000 to $749,999 | 1 (1.3%) | 13 (18.1%) |
| $750,000 to $999,999 | 7 (9.1%) | 0 (0.0%) |
| $1,000,000 or more | 5 (6.5%) | 2 (2.8%) |
| Total | 77 (100.0%) | 72 (100.0%) |
Household Income by Mortgage Status in Makanda
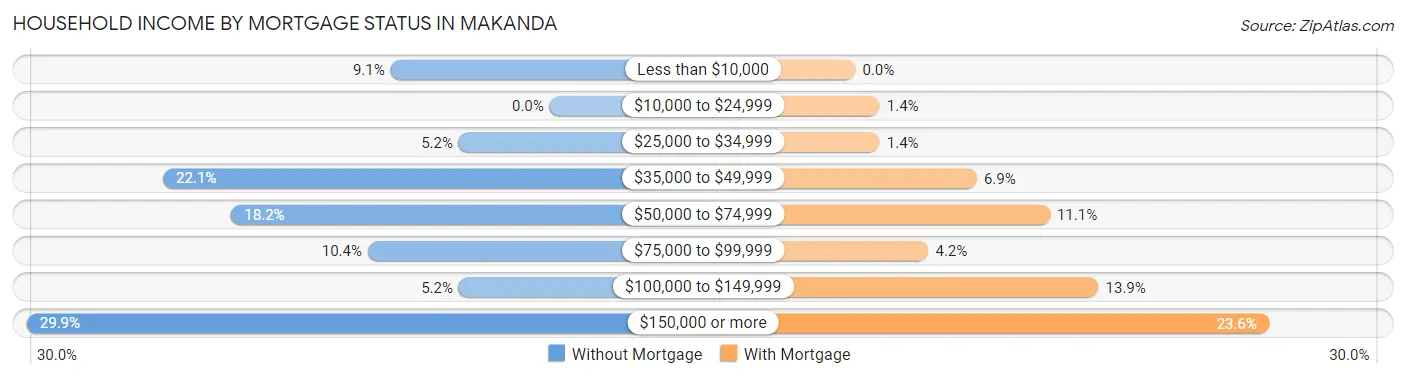
| Household Income | Without Mortgage | With Mortgage |
| Less than $10,000 | 7 (9.1%) | 0 (0.0%) |
| $10,000 to $24,999 | 0 (0.0%) | 1 (1.4%) |
| $25,000 to $34,999 | 4 (5.2%) | 1 (1.4%) |
| $35,000 to $49,999 | 17 (22.1%) | 5 (6.9%) |
| $50,000 to $74,999 | 14 (18.2%) | 8 (11.1%) |
| $75,000 to $99,999 | 8 (10.4%) | 3 (4.2%) |
| $100,000 to $149,999 | 4 (5.2%) | 10 (13.9%) |
| $150,000 or more | 23 (29.9%) | 17 (23.6%) |
| Total | 77 (100.0%) | 72 (100.0%) |
Property Value to Household Income Ratio in Makanda
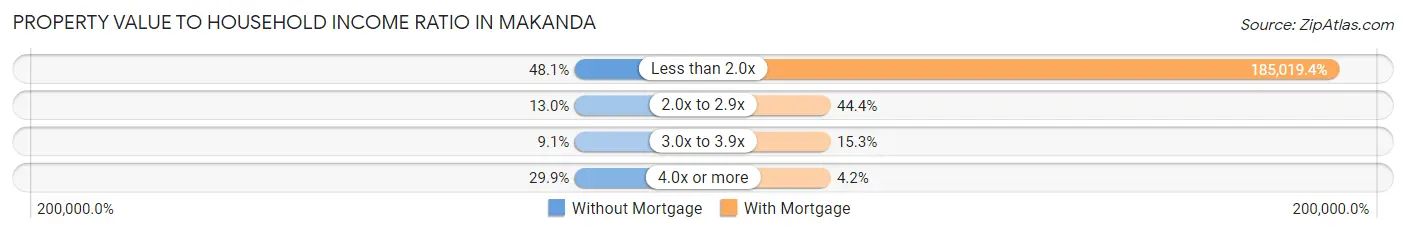
| Value-to-Income Ratio | Without Mortgage | With Mortgage |
| Less than 2.0x | 37 (48.0%) | 133,214 (185,019.4%) |
| 2.0x to 2.9x | 10 (13.0%) | 32 (44.4%) |
| 3.0x to 3.9x | 7 (9.1%) | 11 (15.3%) |
| 4.0x or more | 23 (29.9%) | 3 (4.2%) |
| Total | 77 (100.0%) | 72 (100.0%) |
Real Estate Taxes by Mortgage Status in Makanda
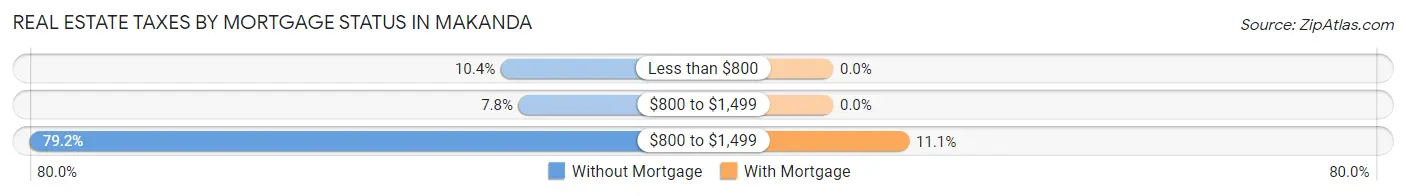
| Property Taxes | Without Mortgage | With Mortgage |
| Less than $800 | 8 (10.4%) | 0 (0.0%) |
| $800 to $1,499 | 6 (7.8%) | 0 (0.0%) |
| $800 to $1,499 | 61 (79.2%) | 8 (11.1%) |
| Total | 77 (100.0%) | 72 (100.0%) |
Health & Disability in Makanda
Health Insurance Coverage by Age in Makanda
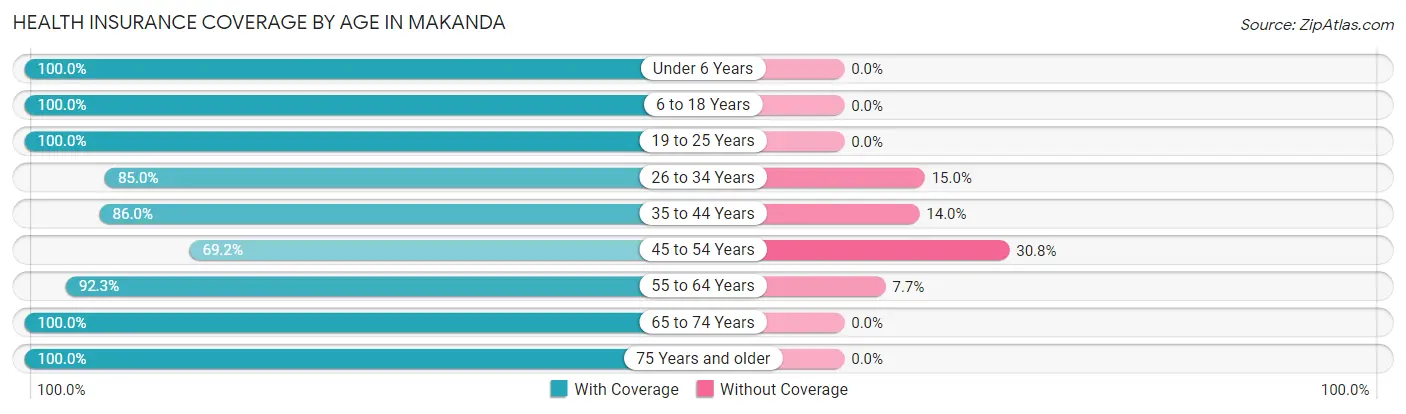
| Age Bracket | With Coverage | Without Coverage |
| Under 6 Years | 26 (100.0%) | 0 (0.0%) |
| 6 to 18 Years | 77 (100.0%) | 0 (0.0%) |
| 19 to 25 Years | 15 (100.0%) | 0 (0.0%) |
| 26 to 34 Years | 17 (85.0%) | 3 (15.0%) |
| 35 to 44 Years | 43 (86.0%) | 7 (14.0%) |
| 45 to 54 Years | 81 (69.2%) | 36 (30.8%) |
| 55 to 64 Years | 72 (92.3%) | 6 (7.7%) |
| 65 to 74 Years | 78 (100.0%) | 0 (0.0%) |
| 75 Years and older | 39 (100.0%) | 0 (0.0%) |
| Total | 448 (89.6%) | 52 (10.4%) |
Health Insurance Coverage by Citizenship Status in Makanda
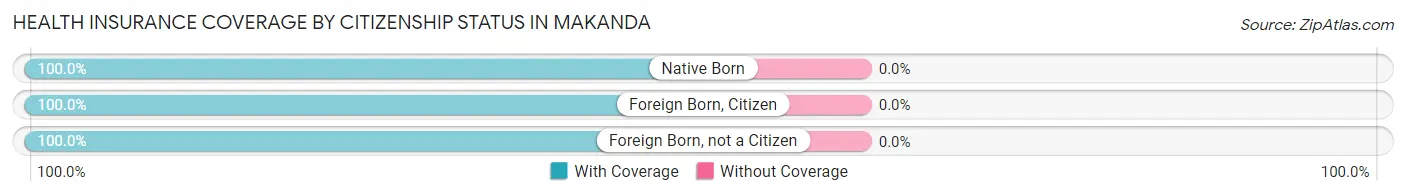
| Citizenship Status | With Coverage | Without Coverage |
| Native Born | 26 (100.0%) | 0 (0.0%) |
| Foreign Born, Citizen | 77 (100.0%) | 0 (0.0%) |
| Foreign Born, not a Citizen | 15 (100.0%) | 0 (0.0%) |
Health Insurance Coverage by Household Income in Makanda
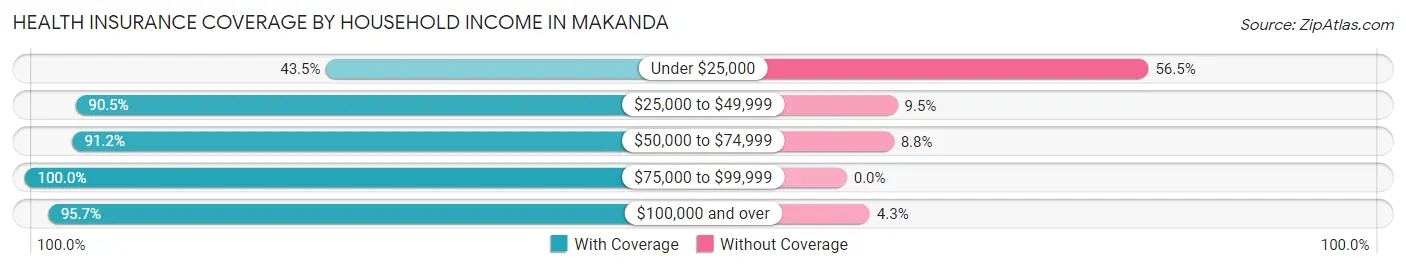
| Household Income | With Coverage | Without Coverage |
| Under $25,000 | 20 (43.5%) | 26 (56.5%) |
| $25,000 to $49,999 | 76 (90.5%) | 8 (9.5%) |
| $50,000 to $74,999 | 83 (91.2%) | 8 (8.8%) |
| $75,000 to $99,999 | 48 (100.0%) | 0 (0.0%) |
| $100,000 and over | 221 (95.7%) | 10 (4.3%) |
Public vs Private Health Insurance Coverage by Age in Makanda
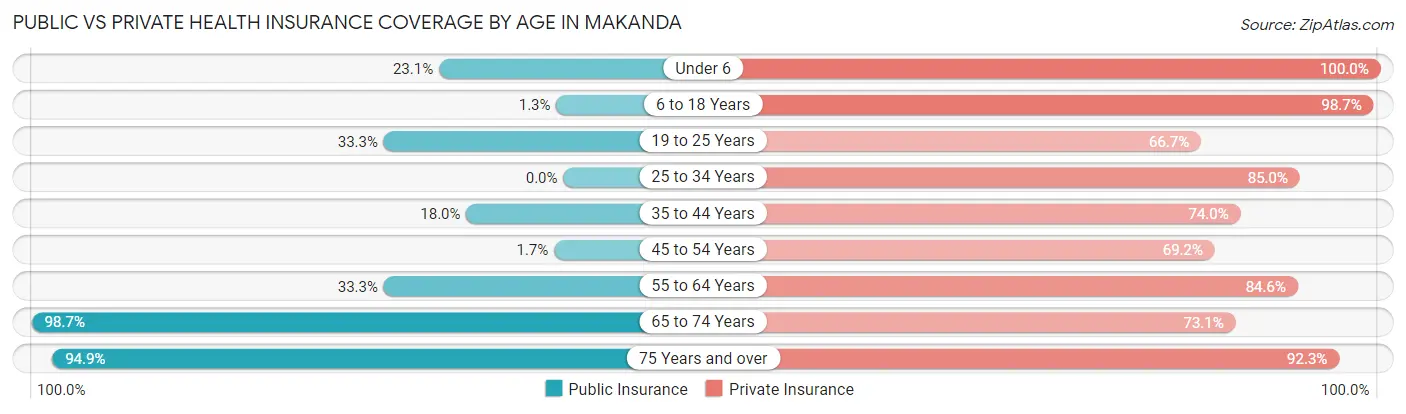
| Age Bracket | Public Insurance | Private Insurance |
| Under 6 | 6 (23.1%) | 26 (100.0%) |
| 6 to 18 Years | 1 (1.3%) | 76 (98.7%) |
| 19 to 25 Years | 5 (33.3%) | 10 (66.7%) |
| 25 to 34 Years | 0 (0.0%) | 17 (85.0%) |
| 35 to 44 Years | 9 (18.0%) | 37 (74.0%) |
| 45 to 54 Years | 2 (1.7%) | 81 (69.2%) |
| 55 to 64 Years | 26 (33.3%) | 66 (84.6%) |
| 65 to 74 Years | 77 (98.7%) | 57 (73.1%) |
| 75 Years and over | 37 (94.9%) | 36 (92.3%) |
| Total | 163 (32.6%) | 406 (81.2%) |
Disability Status by Sex by Age in Makanda
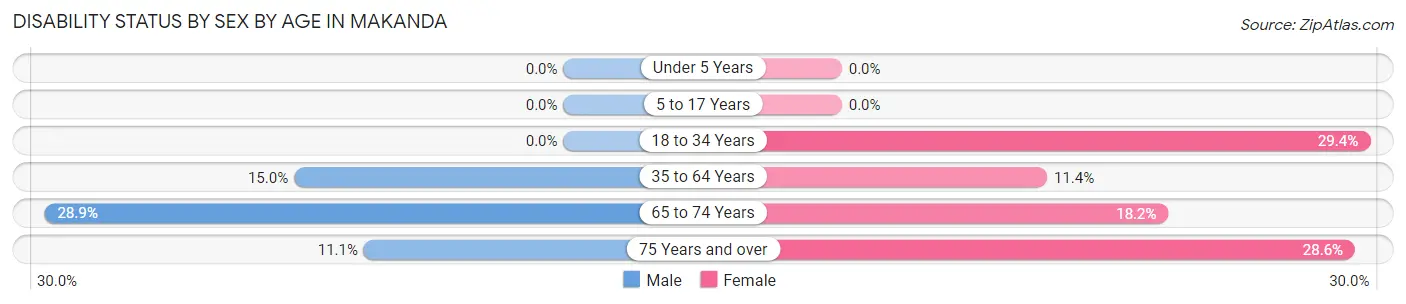
| Age Bracket | Male | Female |
| Under 5 Years | 0 (0.0%) | 0 (0.0%) |
| 5 to 17 Years | 0 (0.0%) | 0 (0.0%) |
| 18 to 34 Years | 0 (0.0%) | 5 (29.4%) |
| 35 to 64 Years | 21 (15.0%) | 12 (11.4%) |
| 65 to 74 Years | 13 (28.9%) | 6 (18.2%) |
| 75 Years and over | 2 (11.1%) | 6 (28.6%) |
Disability Class by Sex by Age in Makanda
Disability Class: Hearing Difficulty
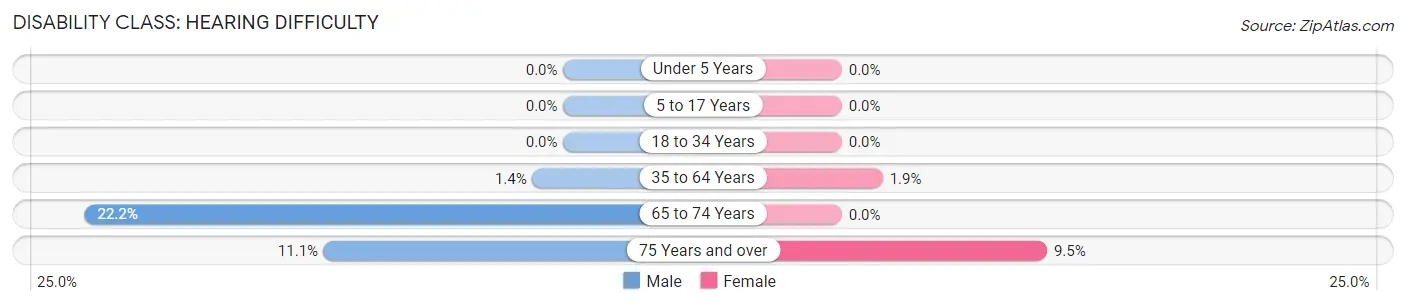
| Age Bracket | Male | Female |
| Under 5 Years | 0 (0.0%) | 0 (0.0%) |
| 5 to 17 Years | 0 (0.0%) | 0 (0.0%) |
| 18 to 34 Years | 0 (0.0%) | 0 (0.0%) |
| 35 to 64 Years | 2 (1.4%) | 2 (1.9%) |
| 65 to 74 Years | 10 (22.2%) | 0 (0.0%) |
| 75 Years and over | 2 (11.1%) | 2 (9.5%) |
Disability Class: Vision Difficulty
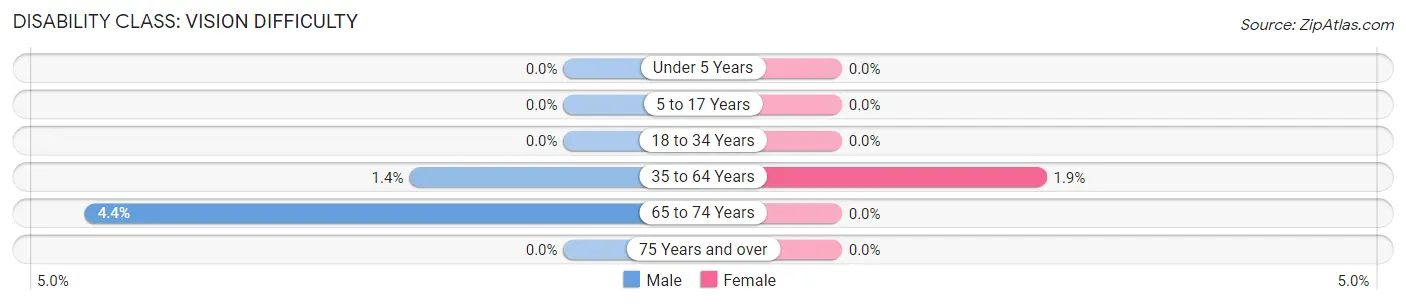
| Age Bracket | Male | Female |
| Under 5 Years | 0 (0.0%) | 0 (0.0%) |
| 5 to 17 Years | 0 (0.0%) | 0 (0.0%) |
| 18 to 34 Years | 0 (0.0%) | 0 (0.0%) |
| 35 to 64 Years | 2 (1.4%) | 2 (1.9%) |
| 65 to 74 Years | 2 (4.4%) | 0 (0.0%) |
| 75 Years and over | 0 (0.0%) | 0 (0.0%) |
Disability Class: Cognitive Difficulty
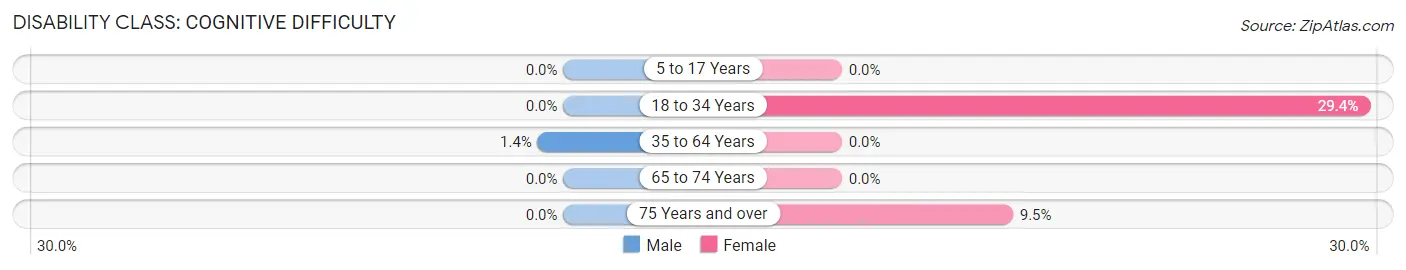
| Age Bracket | Male | Female |
| 5 to 17 Years | 0 (0.0%) | 0 (0.0%) |
| 18 to 34 Years | 0 (0.0%) | 5 (29.4%) |
| 35 to 64 Years | 2 (1.4%) | 0 (0.0%) |
| 65 to 74 Years | 0 (0.0%) | 0 (0.0%) |
| 75 Years and over | 0 (0.0%) | 2 (9.5%) |
Disability Class: Ambulatory Difficulty
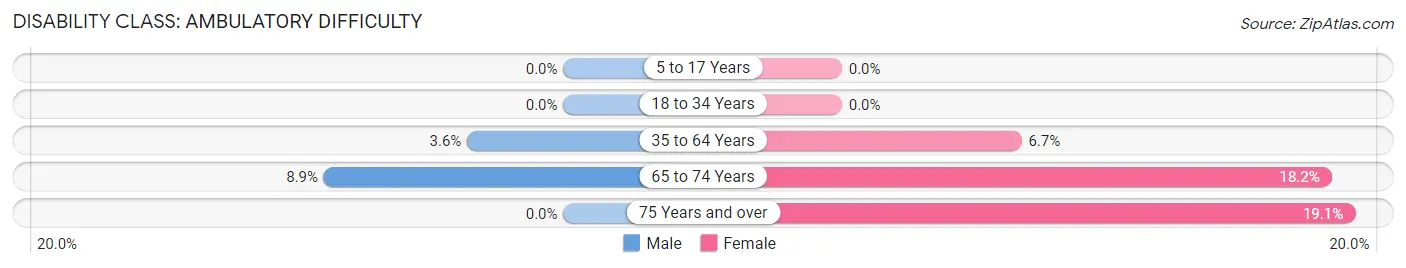
| Age Bracket | Male | Female |
| 5 to 17 Years | 0 (0.0%) | 0 (0.0%) |
| 18 to 34 Years | 0 (0.0%) | 0 (0.0%) |
| 35 to 64 Years | 5 (3.6%) | 7 (6.7%) |
| 65 to 74 Years | 4 (8.9%) | 6 (18.2%) |
| 75 Years and over | 0 (0.0%) | 4 (19.1%) |
Disability Class: Self-Care Difficulty
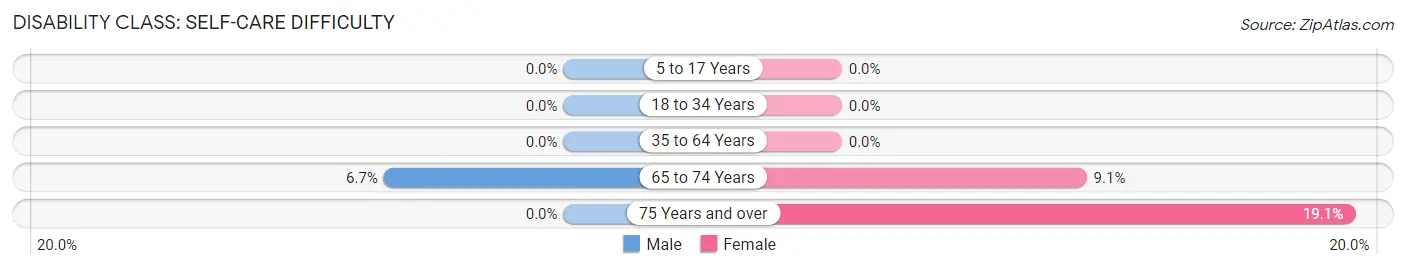
| Age Bracket | Male | Female |
| 5 to 17 Years | 0 (0.0%) | 0 (0.0%) |
| 18 to 34 Years | 0 (0.0%) | 0 (0.0%) |
| 35 to 64 Years | 0 (0.0%) | 0 (0.0%) |
| 65 to 74 Years | 3 (6.7%) | 3 (9.1%) |
| 75 Years and over | 0 (0.0%) | 4 (19.1%) |
Technology Access in Makanda
Computing Device Access in Makanda
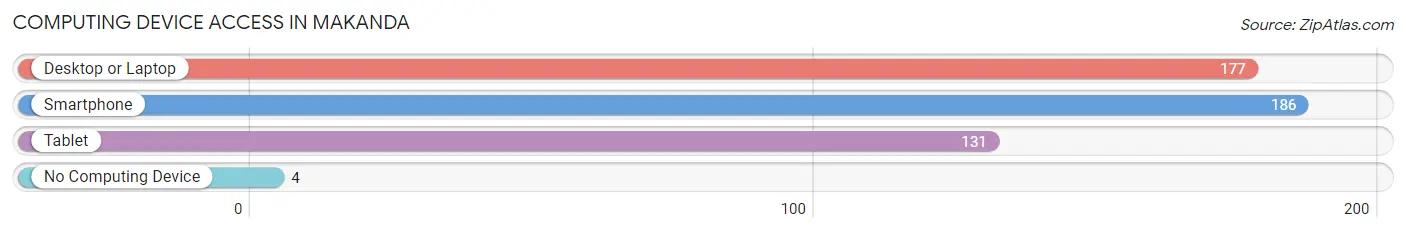
| Device Type | # Households | % Households |
| Desktop or Laptop | 177 | 88.1% |
| Smartphone | 186 | 92.5% |
| Tablet | 131 | 65.2% |
| No Computing Device | 4 | 2.0% |
| Total | 201 | 100.0% |
Internet Access in Makanda
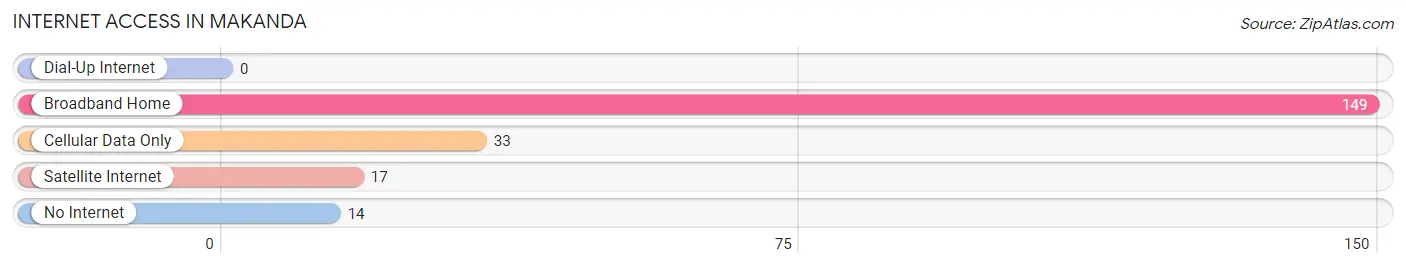
| Internet Type | # Households | % Households |
| Dial-Up Internet | 0 | 0.0% |
| Broadband Home | 149 | 74.1% |
| Cellular Data Only | 33 | 16.4% |
| Satellite Internet | 17 | 8.5% |
| No Internet | 14 | 7.0% |
| Total | 201 | 100.0% |
Makanda Summary
Makanda is a small village located in Jackson County, Illinois, United States. It is situated in the Shawnee National Forest, about 10 miles south of Carbondale. The population was 545 at the 2010 census.
History
Makanda was founded in 1858 by a group of settlers from Kentucky. The town was named after a Native American chief who lived in the area. The first post office was established in 1859.
In the late 19th century, Makanda was a thriving agricultural community. The town was home to several stores, a blacksmith shop, a hotel, and a school.
In the early 20th century, the town began to decline as the railroad bypassed it. The population decreased and many of the businesses closed.
Geography
Makanda is located at 37°45'25" North, 89°20'25" West (37.756944, -89.340278). The village is situated in the Shawnee National Forest, about 10 miles south of Carbondale.
The terrain is hilly and wooded, with several creeks and streams running through the area. The nearest major highway is Interstate 57, which is about 10 miles to the north.
Economy
Makanda's economy is largely based on tourism. The town is home to several bed and breakfasts, restaurants, and antique shops. The nearby Shawnee National Forest is a popular destination for hikers, campers, and other outdoor enthusiasts.
The town is also home to several small businesses, including a grocery store, a hardware store, and a gas station.
Demographics
As of the 2010 census, there were 545 people living in Makanda. The racial makeup of the town was 97.3% White, 0.2% African American, 0.2% Native American, 0.2% Asian, 0.4% from other races, and 1.5% from two or more races. Hispanic or Latino of any race were 1.1% of the population.
The median household income in Makanda was $37,500, and the median family income was $45,000. The per capita income was $19,000. About 10.3% of families and 13.2% of the population were below the poverty line, including 16.7% of those under age 18 and none of those age 65 or over.
Common Questions
What is Per Capita Income in Makanda?
Per Capita income in Makanda is $58,568.
What is the Median Family Income in Makanda?
Median Family Income in Makanda is $102,188.
What is the Median Household income in Makanda?
Median Household Income in Makanda is $76,563.
What is Income or Wage Gap in Makanda?
Income or Wage Gap in Makanda is 12.5%.
Women in Makanda earn 87.5 cents for every dollar earned by a man.
What is Inequality or Gini Index in Makanda?
Inequality or Gini Index in Makanda is 0.56.
What is the Total Population of Makanda?
Total Population of Makanda is 500.
What is the Total Male Population of Makanda?
Total Male Population of Makanda is 271.
What is the Total Female Population of Makanda?
Total Female Population of Makanda is 229.
What is the Ratio of Males per 100 Females in Makanda?
There are 118.34 Males per 100 Females in Makanda.
What is the Ratio of Females per 100 Males in Makanda?
There are 84.50 Females per 100 Males in Makanda.
What is the Median Population Age in Makanda?
Median Population Age in Makanda is 50.5 Years.
What is the Average Family Size in Makanda
Average Family Size in Makanda is 3.0 People.
What is the Average Household Size in Makanda
Average Household Size in Makanda is 2.5 People.
How Large is the Labor Force in Makanda?
There are 224 People in the Labor Forcein in Makanda.
What is the Percentage of People in the Labor Force in Makanda?
53.5% of People are in the Labor Force in Makanda.
What is the Unemployment Rate in Makanda?
Unemployment Rate in Makanda is 0.9%.