Laurel, MD Map & Demographics
Laurel Map
Laurel Overview
$45,887
PER CAPITA INCOME
$111,250
AVG FAMILY INCOME
$92,035
AVG HOUSEHOLD INCOME
6.7%
WAGE / INCOME GAP [ % ]
93.3¢/ $1
WAGE / INCOME GAP [ $ ]
0.41
INEQUALITY / GINI INDEX
29,581
TOTAL POPULATION
13,459
MALE POPULATION
16,122
FEMALE POPULATION
83.48
MALES / 100 FEMALES
119.79
FEMALES / 100 MALES
36.4
MEDIAN AGE
3.5
AVG FAMILY SIZE
2.5
AVG HOUSEHOLD SIZE
17,745
LABOR FORCE [ PEOPLE ]
76.8%
PERCENT IN LABOR FORCE
5.9%
UNEMPLOYMENT RATE
Income in Laurel
Income Overview in Laurel
Per Capita Income in Laurel is $45,887, while median incomes of families and households are $111,250 and $92,035 respectively.
| Characteristic | Number | Measure |
| Per Capita Income | 29,581 | $45,887 |
| Median Family Income | 6,624 | $111,250 |
| Mean Family Income | 6,624 | $134,727 |
| Median Household Income | 11,517 | $92,035 |
| Mean Household Income | 11,517 | $114,121 |
| Income Deficit | 6,624 | $0 |
| Wage / Income Gap (%) | 29,581 | 6.73% |
| Wage / Income Gap ($) | 29,581 | 93.27¢ per $1 |
| Gini / Inequality Index | 29,581 | 0.41 |
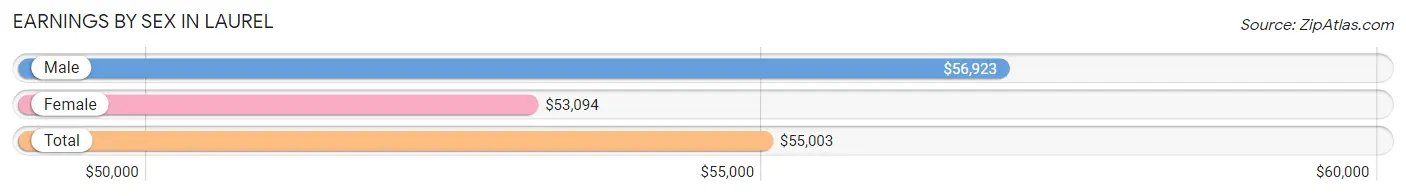
Earnings by Sex in Laurel
Average Earnings in Laurel are $55,003, $56,923 for men and $53,094 for women, a difference of 6.7%.
| Sex | Number | Average Earnings |
| Male | 8,485 (47.5%) | $56,923 |
| Female | 9,368 (52.5%) | $53,094 |
| Total | 17,853 (100.0%) | $55,003 |
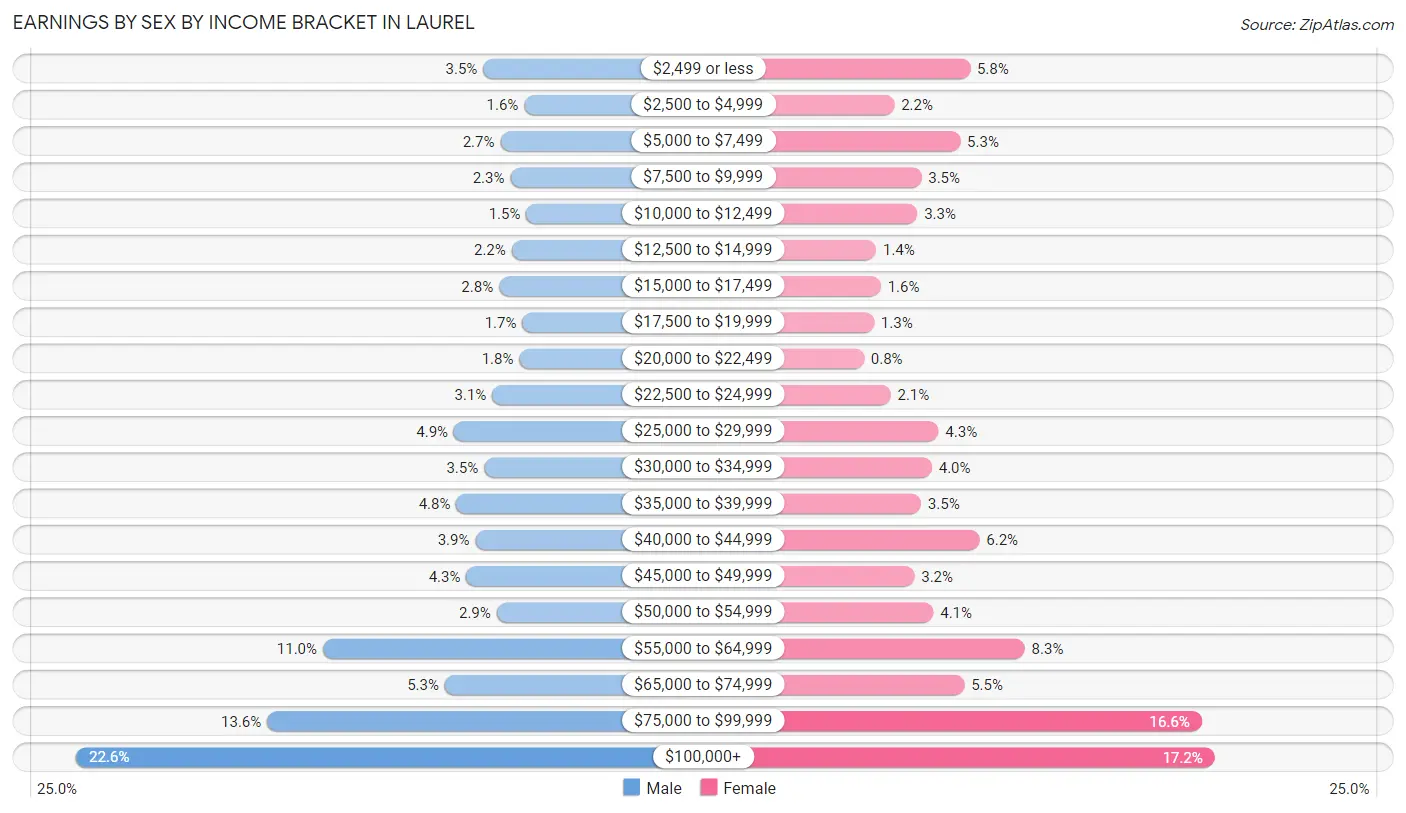
Earnings by Sex by Income Bracket in Laurel
The most common earnings brackets in Laurel are $100,000+ for men (1,917 | 22.6%) and $100,000+ for women (1,614 | 17.2%).
| Income | Male | Female |
| $2,499 or less | 299 (3.5%) | 541 (5.8%) |
| $2,500 to $4,999 | 136 (1.6%) | 208 (2.2%) |
| $5,000 to $7,499 | 231 (2.7%) | 497 (5.3%) |
| $7,500 to $9,999 | 191 (2.2%) | 327 (3.5%) |
| $10,000 to $12,499 | 127 (1.5%) | 309 (3.3%) |
| $12,500 to $14,999 | 186 (2.2%) | 128 (1.4%) |
| $15,000 to $17,499 | 236 (2.8%) | 149 (1.6%) |
| $17,500 to $19,999 | 143 (1.7%) | 119 (1.3%) |
| $20,000 to $22,499 | 155 (1.8%) | 75 (0.8%) |
| $22,500 to $24,999 | 263 (3.1%) | 192 (2.1%) |
| $25,000 to $29,999 | 415 (4.9%) | 402 (4.3%) |
| $30,000 to $34,999 | 295 (3.5%) | 373 (4.0%) |
| $35,000 to $39,999 | 406 (4.8%) | 325 (3.5%) |
| $40,000 to $44,999 | 330 (3.9%) | 582 (6.2%) |
| $45,000 to $49,999 | 366 (4.3%) | 296 (3.2%) |
| $50,000 to $54,999 | 245 (2.9%) | 379 (4.1%) |
| $55,000 to $64,999 | 936 (11.0%) | 780 (8.3%) |
| $65,000 to $74,999 | 451 (5.3%) | 515 (5.5%) |
| $75,000 to $99,999 | 1,157 (13.6%) | 1,557 (16.6%) |
| $100,000+ | 1,917 (22.6%) | 1,614 (17.2%) |
| Total | 8,485 (100.0%) | 9,368 (100.0%) |
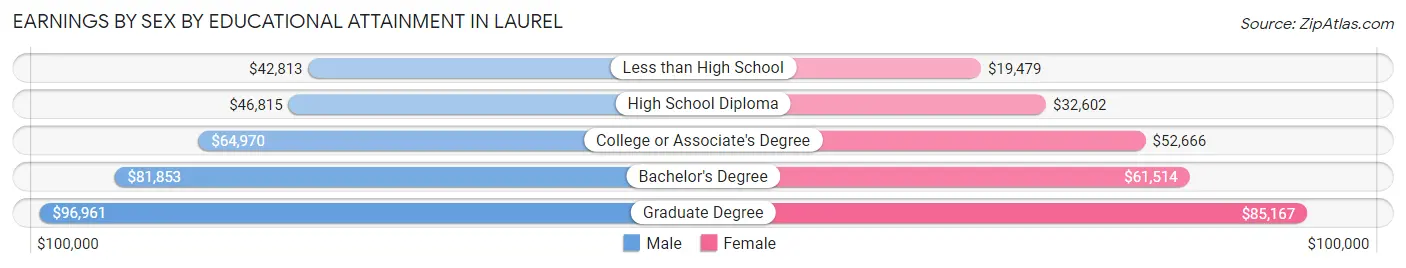
Earnings by Sex by Educational Attainment in Laurel
Average earnings in Laurel are $62,980 for men and $58,113 for women, a difference of 7.7%. Men with an educational attainment of graduate degree enjoy the highest average annual earnings of $96,961, while those with less than high school education earn the least with $42,813. Women with an educational attainment of graduate degree earn the most with the average annual earnings of $85,167, while those with less than high school education have the smallest earnings of $19,479.
| Educational Attainment | Male Income | Female Income |
| Less than High School | $42,813 | $19,479 |
| High School Diploma | $46,815 | $32,602 |
| College or Associate's Degree | $64,970 | $52,666 |
| Bachelor's Degree | $81,853 | $61,514 |
| Graduate Degree | $96,961 | $85,167 |
| Total | $62,980 | $58,113 |
Family Income in Laurel
Family Income Brackets in Laurel
According to the Laurel family income data, there are 1,272 families falling into the $100,000 to $149,999 income range, which is the most common income bracket and makes up 19.2% of all families.
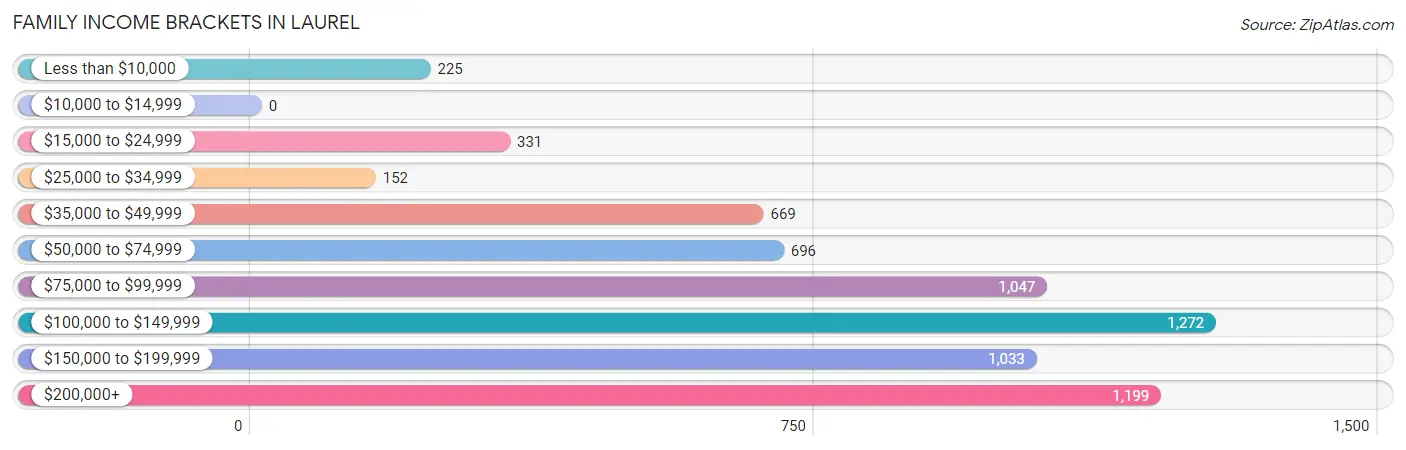
| Income Bracket | # Families | % Families |
| Less than $10,000 | 225 | 3.4% |
| $10,000 to $14,999 | 0 | 0.0% |
| $15,000 to $24,999 | 331 | 5.0% |
| $25,000 to $34,999 | 152 | 2.3% |
| $35,000 to $49,999 | 669 | 10.1% |
| $50,000 to $74,999 | 696 | 10.5% |
| $75,000 to $99,999 | 1,047 | 15.8% |
| $100,000 to $149,999 | 1,272 | 19.2% |
| $150,000 to $199,999 | 1,033 | 15.6% |
| $200,000+ | 1,199 | 18.1% |
Family Income by Famaliy Size in Laurel
6-person families (379 | 5.7%) account for the highest median family income in Laurel with $172,067 per family, while 2-person families (2,407 | 36.3%) have the highest median income of $45,188 per family member.
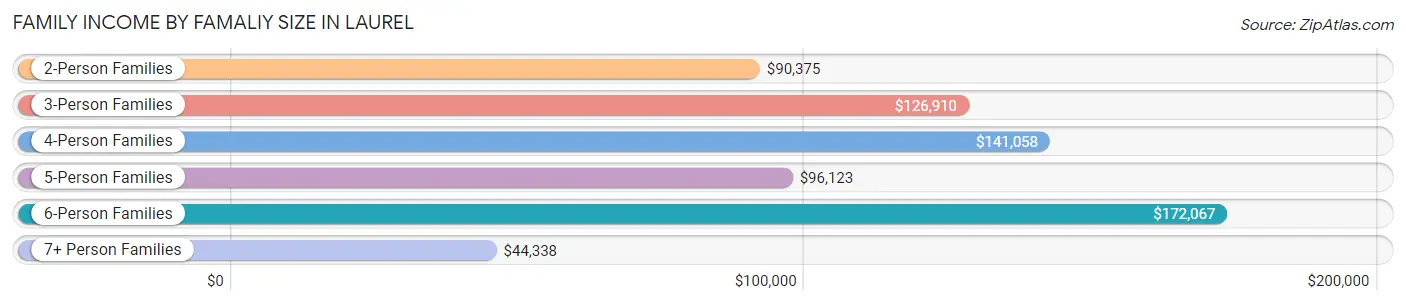
| Income Bracket | # Families | Median Income |
| 2-Person Families | 2,407 (36.3%) | $90,375 |
| 3-Person Families | 1,587 (24.0%) | $126,910 |
| 4-Person Families | 1,317 (19.9%) | $141,058 |
| 5-Person Families | 809 (12.2%) | $96,123 |
| 6-Person Families | 379 (5.7%) | $172,067 |
| 7+ Person Families | 125 (1.9%) | $44,338 |
| Total | 6,624 (100.0%) | $111,250 |
Family Income by Number of Earners in Laurel
The median family income in Laurel is $111,250, with families comprising 3+ earners (1,128) having the highest median family income of $163,088, while families with no earners (538) have the lowest median family income of $37,102, accounting for 17.0% and 8.1% of families, respectively.
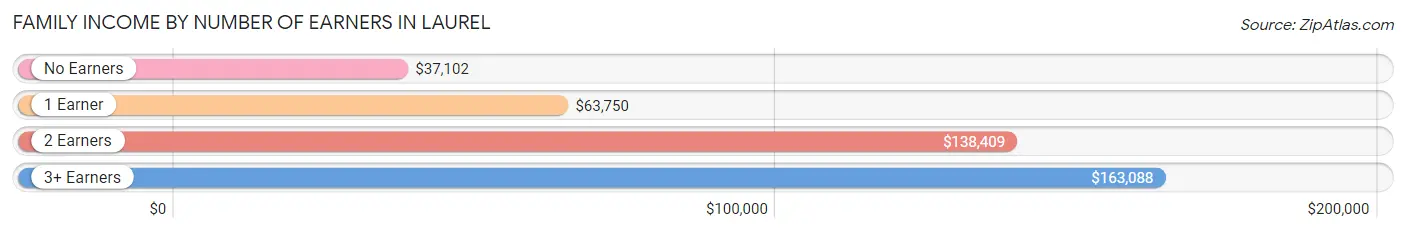
| Number of Earners | # Families | Median Income |
| No Earners | 538 (8.1%) | $37,102 |
| 1 Earner | 1,742 (26.3%) | $63,750 |
| 2 Earners | 3,216 (48.5%) | $138,409 |
| 3+ Earners | 1,128 (17.0%) | $163,088 |
| Total | 6,624 (100.0%) | $111,250 |
Household Income in Laurel
Household Income Brackets in Laurel
With 2,257 households falling in the category, the $100,000 to $149,999 income range is the most frequent in Laurel, accounting for 19.6% of all households. In contrast, only 69 households (0.6%) fall into the $10,000 to $14,999 income bracket, making it the least populous group.
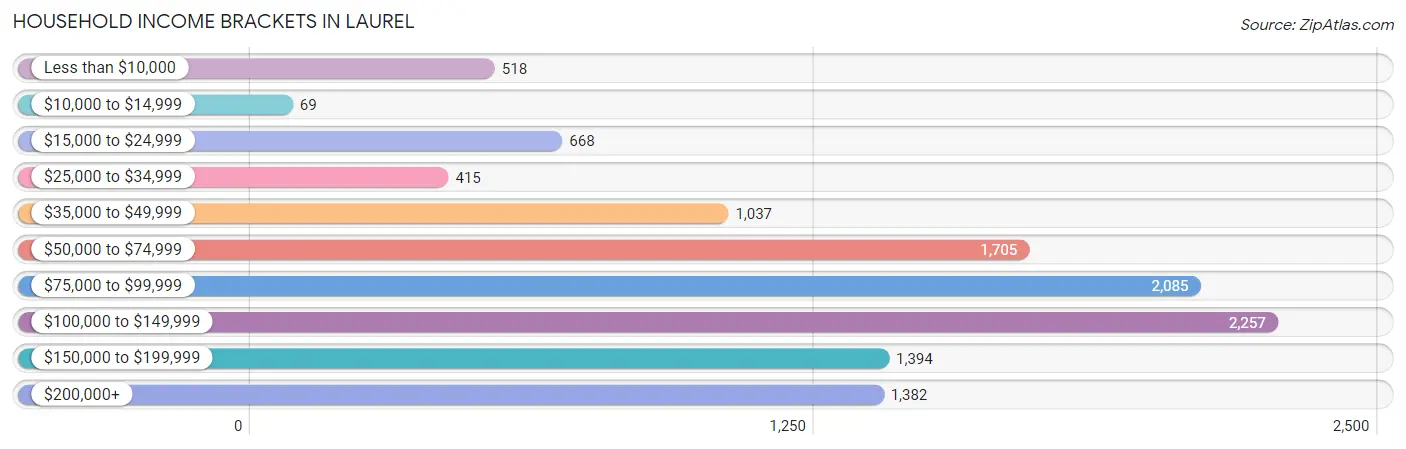
| Income Bracket | # Households | % Households |
| Less than $10,000 | 518 | 4.5% |
| $10,000 to $14,999 | 69 | 0.6% |
| $15,000 to $24,999 | 668 | 5.8% |
| $25,000 to $34,999 | 415 | 3.6% |
| $35,000 to $49,999 | 1,037 | 9.0% |
| $50,000 to $74,999 | 1,705 | 14.8% |
| $75,000 to $99,999 | 2,085 | 18.1% |
| $100,000 to $149,999 | 2,257 | 19.6% |
| $150,000 to $199,999 | 1,394 | 12.1% |
| $200,000+ | 1,382 | 12.0% |
Household Income by Householder Age in Laurel
The median household income in Laurel is $92,035, with the highest median household income of $98,654 found in the 45 to 64 years age bracket for the primary householder. A total of 4,578 households (39.8%) fall into this category. Meanwhile, the 65+ years age bracket for the primary householder has the lowest median household income of $62,065, with 1,817 households (15.8%) in this group.
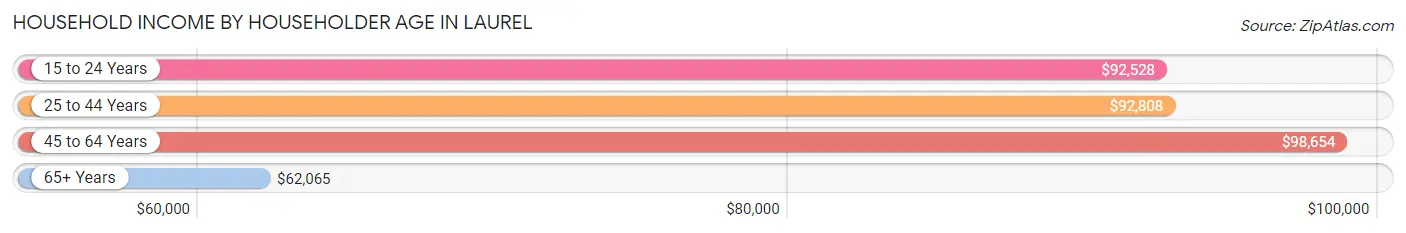
| Income Bracket | # Households | Median Income |
| 15 to 24 Years | 357 (3.1%) | $92,528 |
| 25 to 44 Years | 4,765 (41.4%) | $92,808 |
| 45 to 64 Years | 4,578 (39.8%) | $98,654 |
| 65+ Years | 1,817 (15.8%) | $62,065 |
| Total | 11,517 (100.0%) | $92,035 |
Poverty in Laurel
Income Below Poverty by Sex and Age in Laurel
With 8.8% poverty level for males and 12.1% for females among the residents of Laurel, 16 and 17 year old males and 6 to 11 year old females are the most vulnerable to poverty, with 65 males (28.3%) and 470 females (30.0%) in their respective age groups living below the poverty level.
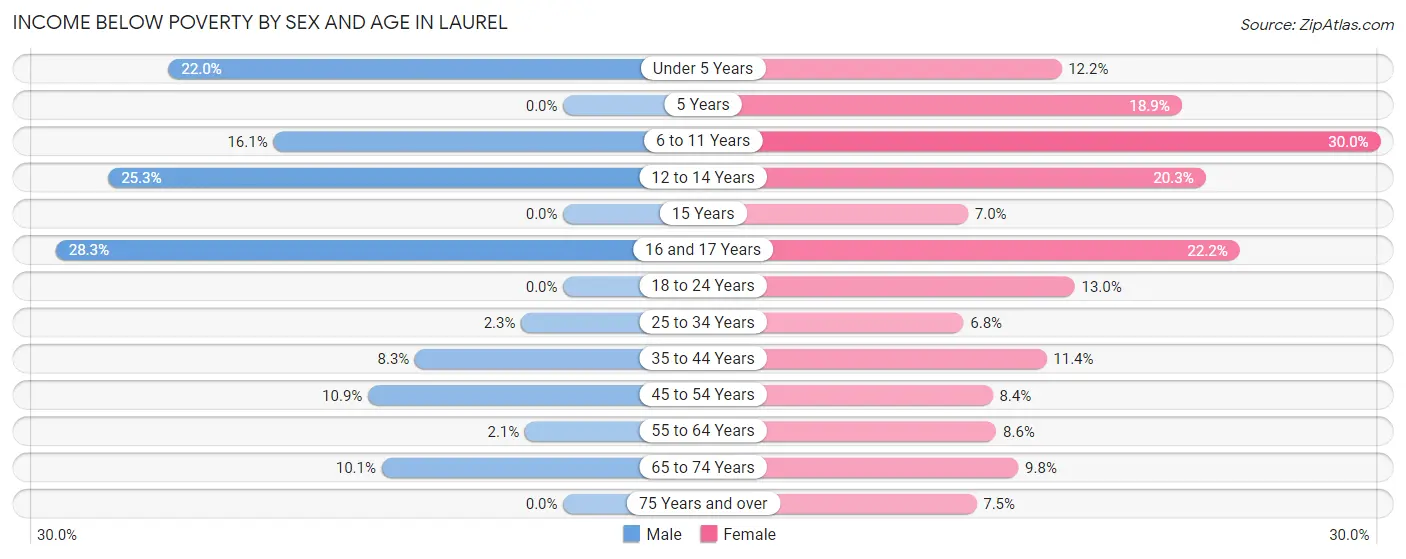
| Age Bracket | Male | Female |
| Under 5 Years | 239 (22.0%) | 119 (12.2%) |
| 5 Years | 0 (0.0%) | 28 (18.9%) |
| 6 to 11 Years | 138 (16.1%) | 470 (30.0%) |
| 12 to 14 Years | 167 (25.3%) | 114 (20.3%) |
| 15 Years | 0 (0.0%) | 16 (7.0%) |
| 16 and 17 Years | 65 (28.3%) | 66 (22.2%) |
| 18 to 24 Years | 0 (0.0%) | 159 (13.0%) |
| 25 to 34 Years | 49 (2.3%) | 184 (6.8%) |
| 35 to 44 Years | 159 (8.3%) | 283 (11.4%) |
| 45 to 54 Years | 225 (10.9%) | 186 (8.4%) |
| 55 to 64 Years | 29 (2.1%) | 156 (8.6%) |
| 65 to 74 Years | 95 (10.1%) | 111 (9.8%) |
| 75 Years and over | 0 (0.0%) | 50 (7.5%) |
| Total | 1,166 (8.8%) | 1,942 (12.1%) |
Income Above Poverty by Sex and Age in Laurel
According to the poverty statistics in Laurel, males aged 5 years and females aged 25 to 34 years are the age groups that are most secure financially, with 100.0% of males and 93.2% of females in these age groups living above the poverty line.
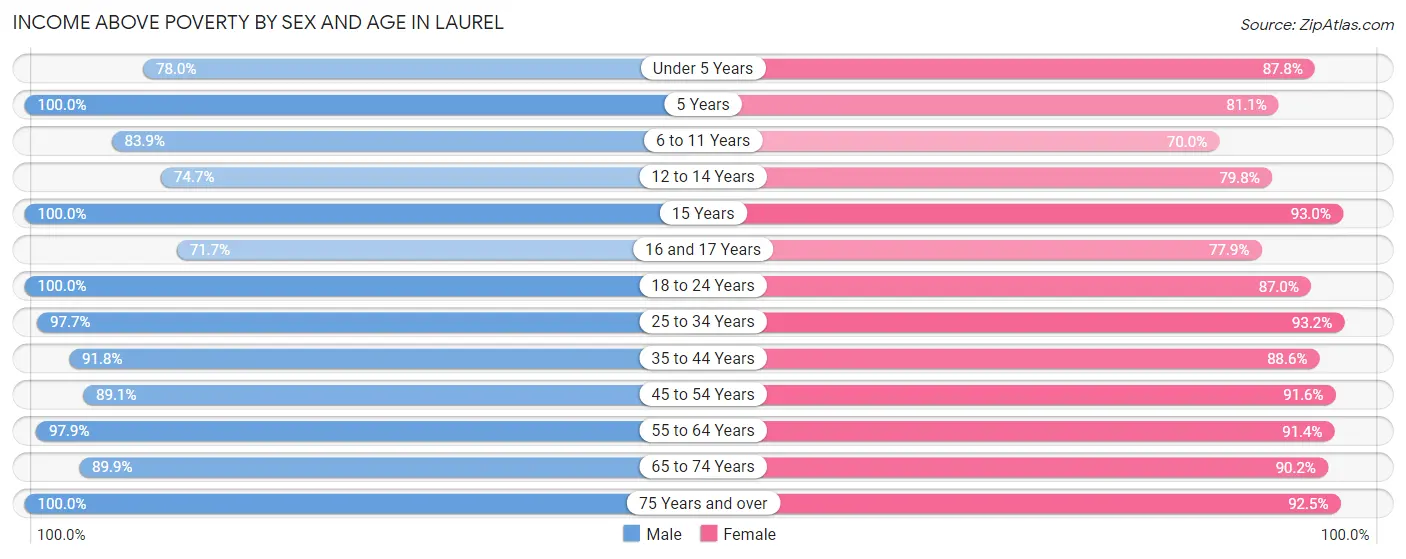
| Age Bracket | Male | Female |
| Under 5 Years | 848 (78.0%) | 855 (87.8%) |
| 5 Years | 173 (100.0%) | 120 (81.1%) |
| 6 to 11 Years | 717 (83.9%) | 1,097 (70.0%) |
| 12 to 14 Years | 492 (74.7%) | 449 (79.7%) |
| 15 Years | 130 (100.0%) | 212 (93.0%) |
| 16 and 17 Years | 165 (71.7%) | 232 (77.8%) |
| 18 to 24 Years | 1,320 (100.0%) | 1,068 (87.0%) |
| 25 to 34 Years | 2,042 (97.7%) | 2,532 (93.2%) |
| 35 to 44 Years | 1,769 (91.7%) | 2,201 (88.6%) |
| 45 to 54 Years | 1,844 (89.1%) | 2,030 (91.6%) |
| 55 to 64 Years | 1,334 (97.9%) | 1,661 (91.4%) |
| 65 to 74 Years | 845 (89.9%) | 1,019 (90.2%) |
| 75 Years and over | 454 (100.0%) | 618 (92.5%) |
| Total | 12,133 (91.2%) | 14,094 (87.9%) |
Income Below Poverty Among Married-Couple Families in Laurel
The poverty statistics for married-couple families in Laurel show that 4.6% or 190 of the total 4,163 families live below the poverty line. Families with 3 or 4 children have the highest poverty rate of 17.3%, comprising of 94 families. On the other hand, families with 1 or 2 children have the lowest poverty rate of 1.1%, which includes 17 families.
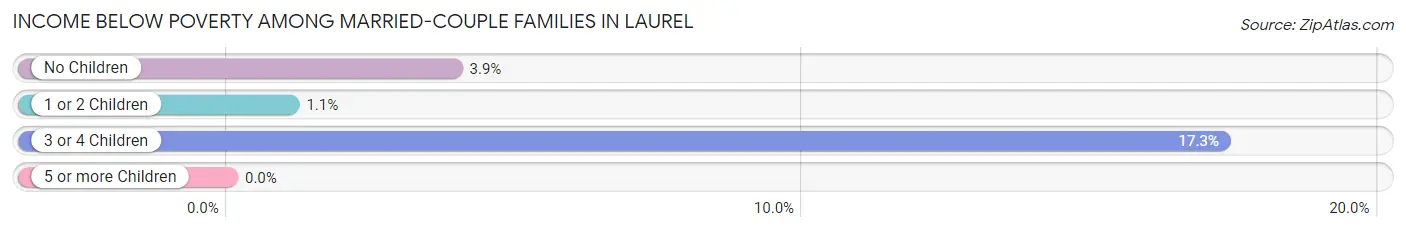
| Children | Above Poverty | Below Poverty |
| No Children | 1,944 (96.1%) | 79 (3.9%) |
| 1 or 2 Children | 1,579 (98.9%) | 17 (1.1%) |
| 3 or 4 Children | 450 (82.7%) | 94 (17.3%) |
| 5 or more Children | 0 (0.0%) | 0 (0.0%) |
| Total | 3,973 (95.4%) | 190 (4.6%) |
Income Below Poverty Among Single-Parent Households in Laurel
According to the poverty data in Laurel, 2.8% or 11 single-father households and 16.7% or 346 single-mother households are living below the poverty line. Among single-father households, those with 1 or 2 children have the highest poverty rate, with 11 households (7.1%) experiencing poverty. Likewise, among single-mother households, those with 5 or more children have the highest poverty rate, with 85 households (100.0%) falling below the poverty line.
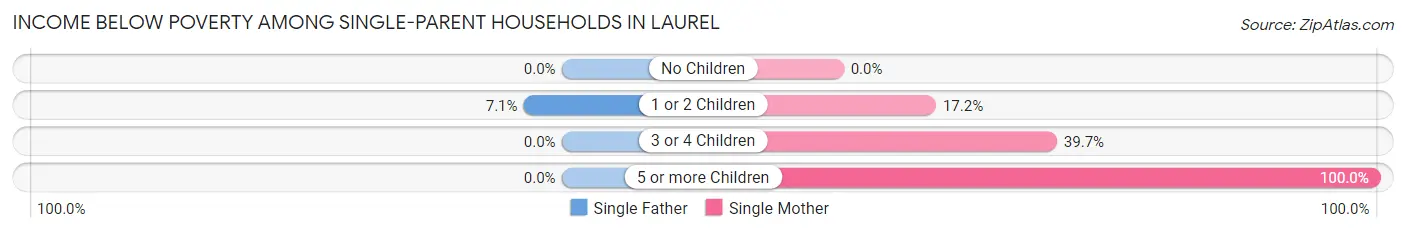
| Children | Single Father | Single Mother |
| No Children | 0 (0.0%) | 0 (0.0%) |
| 1 or 2 Children | 11 (7.1%) | 176 (17.2%) |
| 3 or 4 Children | 0 (0.0%) | 85 (39.7%) |
| 5 or more Children | 0 (0.0%) | 85 (100.0%) |
| Total | 11 (2.8%) | 346 (16.7%) |
Income Below Poverty Among Married-Couple vs Single-Parent Households in Laurel
The poverty data for Laurel shows that 190 of the married-couple family households (4.6%) and 357 of the single-parent households (14.5%) are living below the poverty level. Within the married-couple family households, those with 3 or 4 children have the highest poverty rate, with 94 households (17.3%) falling below the poverty line. Among the single-parent households, those with 5 or more children have the highest poverty rate, with 85 household (100.0%) living below poverty.
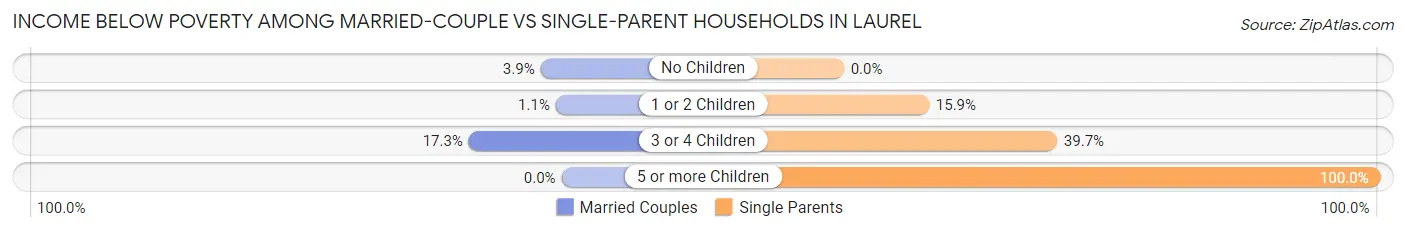
| Children | Married-Couple Families | Single-Parent Households |
| No Children | 79 (3.9%) | 0 (0.0%) |
| 1 or 2 Children | 17 (1.1%) | 187 (15.9%) |
| 3 or 4 Children | 94 (17.3%) | 85 (39.7%) |
| 5 or more Children | 0 (0.0%) | 85 (100.0%) |
| Total | 190 (4.6%) | 357 (14.5%) |
Race in Laurel
The most populous races in Laurel are Black / African American (15,205 | 51.4%), White / Caucasian (5,977 | 20.2%), and Hispanic or Latino (5,406 | 18.3%).
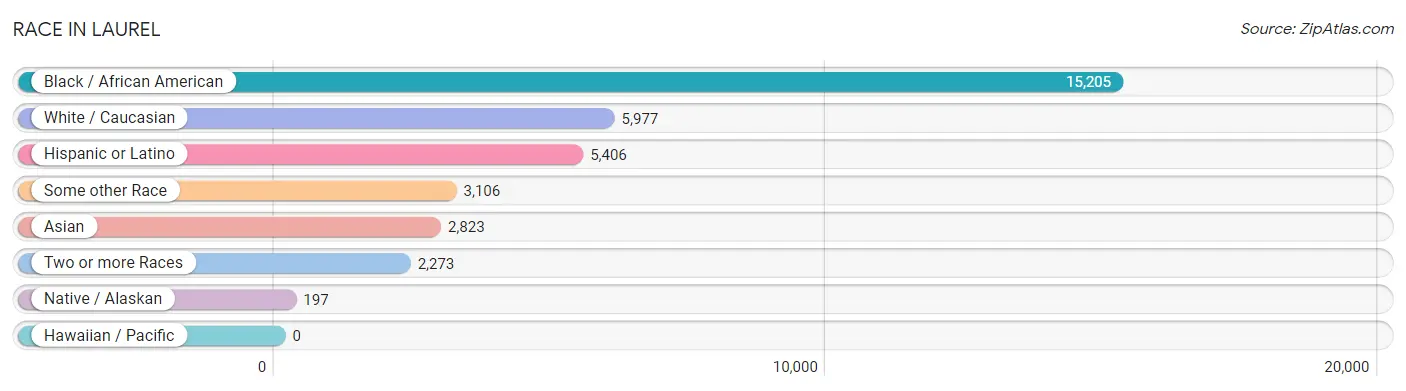
| Race | # Population | % Population |
| Asian | 2,823 | 9.5% |
| Black / African American | 15,205 | 51.4% |
| Hawaiian / Pacific | 0 | 0.0% |
| Hispanic or Latino | 5,406 | 18.3% |
| Native / Alaskan | 197 | 0.7% |
| White / Caucasian | 5,977 | 20.2% |
| Two or more Races | 2,273 | 7.7% |
| Some other Race | 3,106 | 10.5% |
| Total | 29,581 | 100.0% |
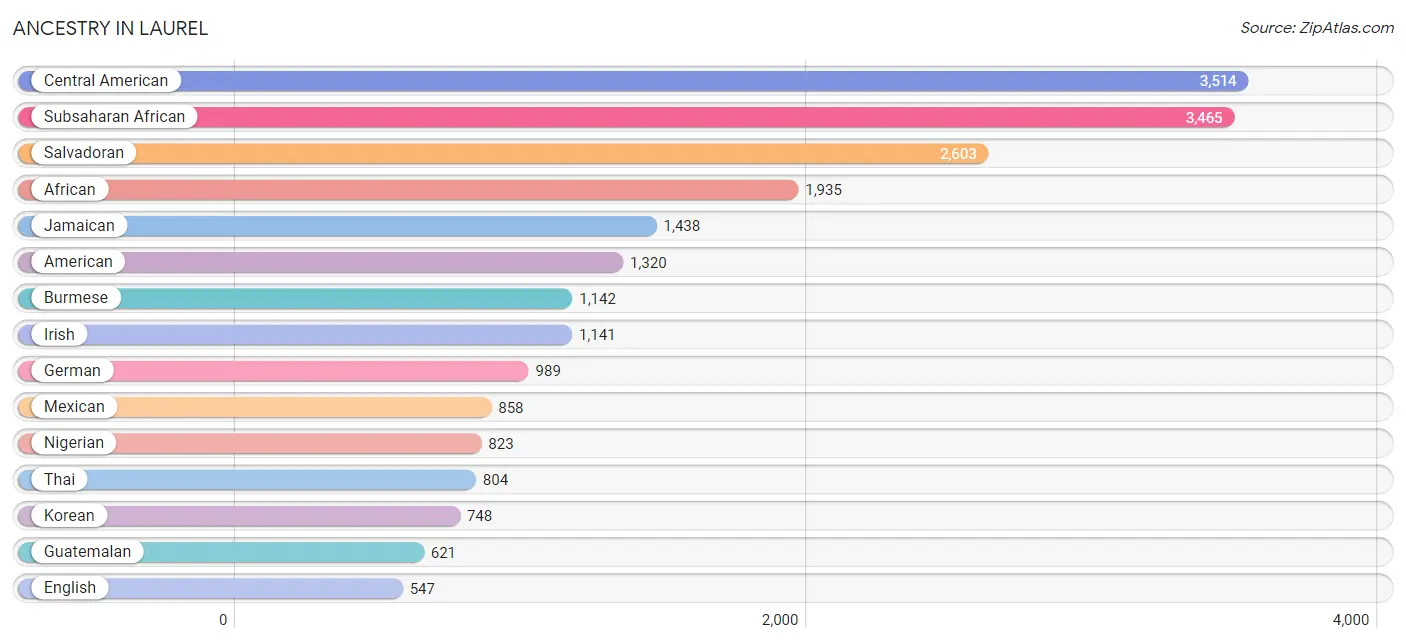
Ancestry in Laurel
The most populous ancestries reported in Laurel are Central American (3,514 | 11.9%), Subsaharan African (3,465 | 11.7%), Salvadoran (2,603 | 8.8%), African (1,935 | 6.5%), and Jamaican (1,438 | 4.9%), together accounting for 43.8% of all Laurel residents.
| Ancestry | # Population | % Population |
| African | 1,935 | 6.5% |
| American | 1,320 | 4.5% |
| Arab | 332 | 1.1% |
| Argentinean | 6 | 0.0% |
| Austrian | 6 | 0.0% |
| Barbadian | 24 | 0.1% |
| Bhutanese | 19 | 0.1% |
| Blackfeet | 58 | 0.2% |
| Bolivian | 20 | 0.1% |
| Brazilian | 136 | 0.5% |
| British | 43 | 0.2% |
| British West Indian | 66 | 0.2% |
| Burmese | 1,142 | 3.9% |
| Cajun | 8 | 0.0% |
| Canadian | 44 | 0.2% |
| Central American | 3,514 | 11.9% |
| Cherokee | 45 | 0.2% |
| Chilean | 20 | 0.1% |
| Colombian | 90 | 0.3% |
| Creek | 70 | 0.2% |
| Cuban | 44 | 0.2% |
| Danish | 27 | 0.1% |
| Dominican | 129 | 0.4% |
| Dutch | 80 | 0.3% |
| Eastern European | 13 | 0.0% |
| Egyptian | 268 | 0.9% |
| English | 547 | 1.8% |
| Ethiopian | 37 | 0.1% |
| European | 252 | 0.9% |
| French | 184 | 0.6% |
| French Canadian | 19 | 0.1% |
| German | 989 | 3.3% |
| Ghanaian | 306 | 1.0% |
| Greek | 61 | 0.2% |
| Guatemalan | 621 | 2.1% |
| Guyanese | 118 | 0.4% |
| Haitian | 130 | 0.4% |
| Honduran | 246 | 0.8% |
| Hungarian | 10 | 0.0% |
| Indian (Asian) | 267 | 0.9% |
| Iranian | 14 | 0.1% |
| Irish | 1,141 | 3.9% |
| Italian | 506 | 1.7% |
| Jamaican | 1,438 | 4.9% |
| Jordanian | 9 | 0.0% |
| Kenyan | 2 | 0.0% |
| Korean | 748 | 2.5% |
| Lebanese | 14 | 0.1% |
| Lithuanian | 6 | 0.0% |
| Macedonian | 12 | 0.0% |
| Mexican | 858 | 2.9% |
| New Zealander | 11 | 0.0% |
| Nicaraguan | 32 | 0.1% |
| Nigerian | 823 | 2.8% |
| Norwegian | 31 | 0.1% |
| Pakistani | 28 | 0.1% |
| Panamanian | 12 | 0.0% |
| Peruvian | 33 | 0.1% |
| Polish | 268 | 0.9% |
| Portuguese | 80 | 0.3% |
| Puerto Rican | 164 | 0.5% |
| Russian | 115 | 0.4% |
| Salvadoran | 2,603 | 8.8% |
| Scandinavian | 141 | 0.5% |
| Scotch-Irish | 51 | 0.2% |
| Scottish | 187 | 0.6% |
| Senegalese | 64 | 0.2% |
| Sierra Leonean | 23 | 0.1% |
| Slavic | 13 | 0.0% |
| Slovak | 21 | 0.1% |
| South American | 169 | 0.6% |
| Spaniard | 26 | 0.1% |
| Spanish | 18 | 0.1% |
| Sri Lankan | 233 | 0.8% |
| Subsaharan African | 3,465 | 11.7% |
| Swedish | 52 | 0.2% |
| Swiss | 63 | 0.2% |
| Syrian | 21 | 0.1% |
| Thai | 804 | 2.7% |
| Trinidadian and Tobagonian | 114 | 0.4% |
| Turkish | 28 | 0.1% |
| U.S. Virgin Islander | 33 | 0.1% |
| Ugandan | 12 | 0.0% |
| Ukrainian | 37 | 0.1% |
| Welsh | 81 | 0.3% |
| West Indian | 92 | 0.3% | View All 86 Rows |
Immigrants in Laurel
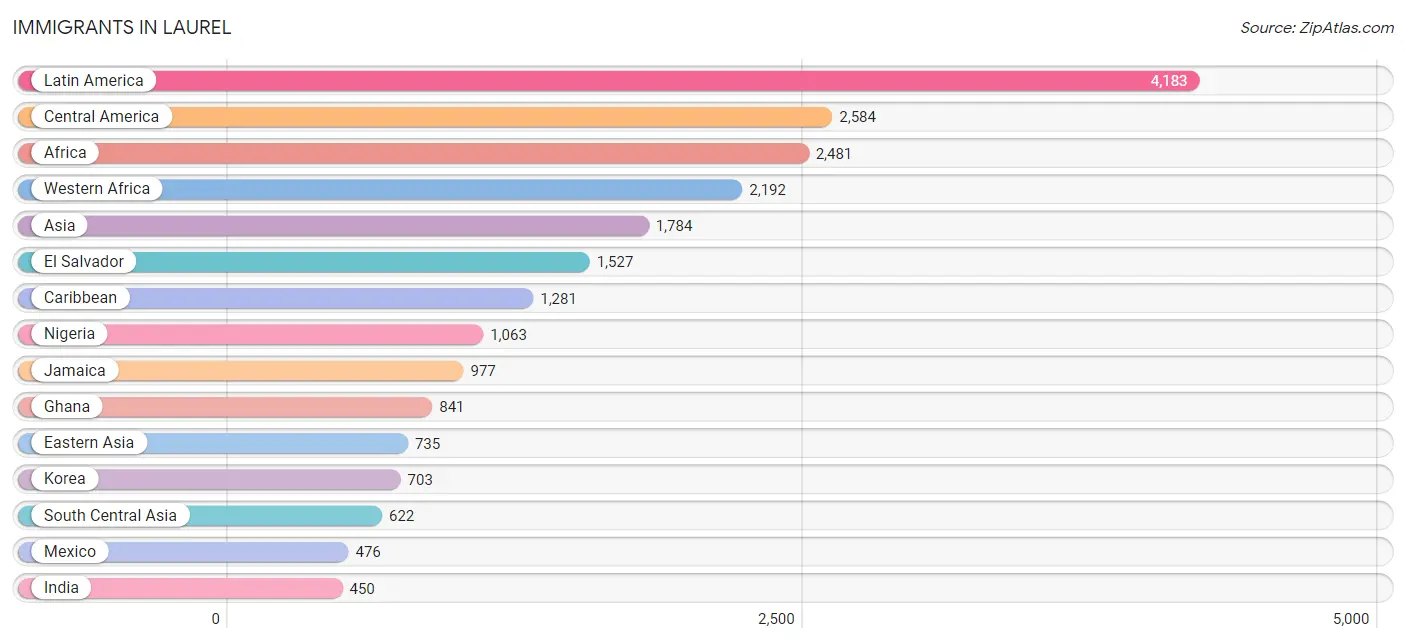
The most numerous immigrant groups reported in Laurel came from Latin America (4,183 | 14.1%), Central America (2,584 | 8.7%), Africa (2,481 | 8.4%), Western Africa (2,192 | 7.4%), and Asia (1,784 | 6.0%), together accounting for 44.7% of all Laurel residents.
| Immigration Origin | # Population | % Population |
| Africa | 2,481 | 8.4% |
| Argentina | 6 | 0.0% |
| Asia | 1,784 | 6.0% |
| Barbados | 10 | 0.0% |
| Bolivia | 20 | 0.1% |
| Brazil | 81 | 0.3% |
| Cambodia | 10 | 0.0% |
| Cameroon | 91 | 0.3% |
| Canada | 18 | 0.1% |
| Caribbean | 1,281 | 4.3% |
| Central America | 2,584 | 8.7% |
| Chile | 20 | 0.1% |
| China | 15 | 0.1% |
| Colombia | 88 | 0.3% |
| Denmark | 12 | 0.0% |
| Dominican Republic | 70 | 0.2% |
| Eastern Africa | 125 | 0.4% |
| Eastern Asia | 735 | 2.5% |
| Eastern Europe | 29 | 0.1% |
| El Salvador | 1,527 | 5.2% |
| Ethiopia | 38 | 0.1% |
| Europe | 87 | 0.3% |
| Germany | 5 | 0.0% |
| Ghana | 841 | 2.8% |
| Grenada | 28 | 0.1% |
| Guatemala | 350 | 1.2% |
| Guyana | 58 | 0.2% |
| Haiti | 61 | 0.2% |
| Honduras | 174 | 0.6% |
| India | 450 | 1.5% |
| Israel | 9 | 0.0% |
| Italy | 6 | 0.0% |
| Jamaica | 977 | 3.3% |
| Japan | 17 | 0.1% |
| Jordan | 2 | 0.0% |
| Kenya | 1 | 0.0% |
| Korea | 703 | 2.4% |
| Latin America | 4,183 | 14.1% |
| Liberia | 27 | 0.1% |
| Mexico | 476 | 1.6% |
| Middle Africa | 149 | 0.5% |
| Nicaragua | 32 | 0.1% |
| Nigeria | 1,063 | 3.6% |
| Northern Africa | 8 | 0.0% |
| Northern Europe | 30 | 0.1% |
| Oceania | 11 | 0.0% |
| Pakistan | 172 | 0.6% |
| Panama | 25 | 0.1% |
| Peru | 33 | 0.1% |
| Philippines | 279 | 0.9% |
| Poland | 9 | 0.0% |
| Russia | 20 | 0.1% |
| Senegal | 32 | 0.1% |
| Sierra Leone | 105 | 0.4% |
| South America | 318 | 1.1% |
| South Central Asia | 622 | 2.1% |
| South Eastern Asia | 401 | 1.4% |
| Southern Europe | 18 | 0.1% |
| Spain | 12 | 0.0% |
| Sudan | 8 | 0.0% |
| Sweden | 12 | 0.0% |
| Thailand | 9 | 0.0% |
| Trinidad and Tobago | 72 | 0.2% |
| Turkey | 15 | 0.1% |
| Venezuela | 12 | 0.0% |
| Vietnam | 103 | 0.4% |
| Western Africa | 2,192 | 7.4% |
| Western Asia | 26 | 0.1% |
| Western Europe | 5 | 0.0% |
| Zaire | 58 | 0.2% | View All 70 Rows |
Sex and Age in Laurel
Sex and Age in Laurel
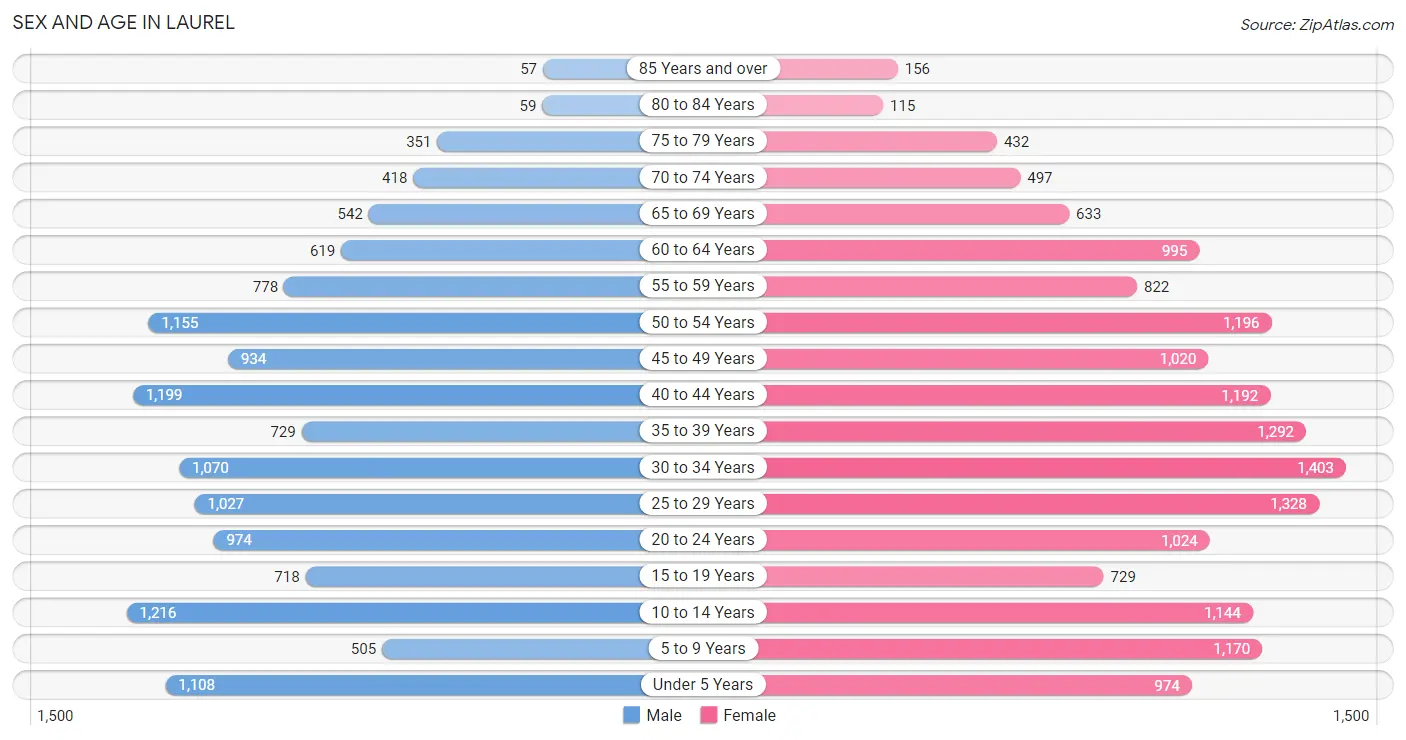
The most populous age groups in Laurel are 10 to 14 Years (1,216 | 9.0%) for men and 30 to 34 Years (1,403 | 8.7%) for women.
| Age Bracket | Male | Female |
| Under 5 Years | 1,108 (8.2%) | 974 (6.0%) |
| 5 to 9 Years | 505 (3.7%) | 1,170 (7.3%) |
| 10 to 14 Years | 1,216 (9.0%) | 1,144 (7.1%) |
| 15 to 19 Years | 718 (5.3%) | 729 (4.5%) |
| 20 to 24 Years | 974 (7.2%) | 1,024 (6.4%) |
| 25 to 29 Years | 1,027 (7.6%) | 1,328 (8.2%) |
| 30 to 34 Years | 1,070 (8.0%) | 1,403 (8.7%) |
| 35 to 39 Years | 729 (5.4%) | 1,292 (8.0%) |
| 40 to 44 Years | 1,199 (8.9%) | 1,192 (7.4%) |
| 45 to 49 Years | 934 (6.9%) | 1,020 (6.3%) |
| 50 to 54 Years | 1,155 (8.6%) | 1,196 (7.4%) |
| 55 to 59 Years | 778 (5.8%) | 822 (5.1%) |
| 60 to 64 Years | 619 (4.6%) | 995 (6.2%) |
| 65 to 69 Years | 542 (4.0%) | 633 (3.9%) |
| 70 to 74 Years | 418 (3.1%) | 497 (3.1%) |
| 75 to 79 Years | 351 (2.6%) | 432 (2.7%) |
| 80 to 84 Years | 59 (0.4%) | 115 (0.7%) |
| 85 Years and over | 57 (0.4%) | 156 (1.0%) |
| Total | 13,459 (100.0%) | 16,122 (100.0%) |
Families and Households in Laurel
Median Family Size in Laurel
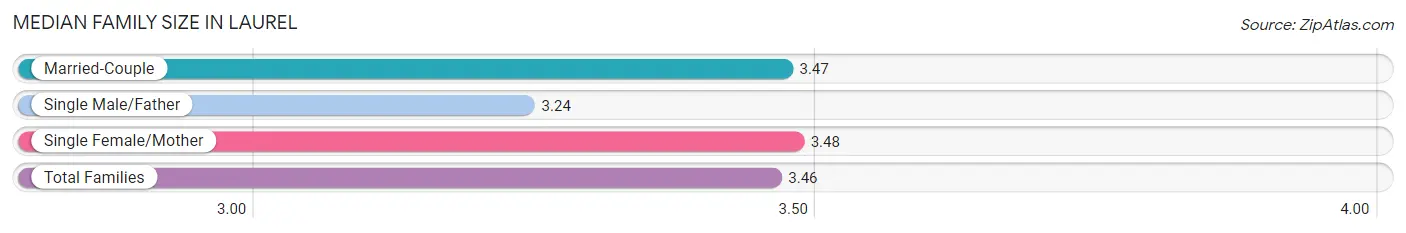
The median family size in Laurel is 3.46 persons per family, with single female/mother families (2,073 | 31.3%) accounting for the largest median family size of 3.48 persons per family. On the other hand, single male/father families (388 | 5.9%) represent the smallest median family size with 3.24 persons per family.
| Family Type | # Families | Family Size |
| Married-Couple | 4,163 (62.8%) | 3.47 |
| Single Male/Father | 388 (5.9%) | 3.24 |
| Single Female/Mother | 2,073 (31.3%) | 3.48 |
| Total Families | 6,624 (100.0%) | 3.46 |
Median Household Size in Laurel
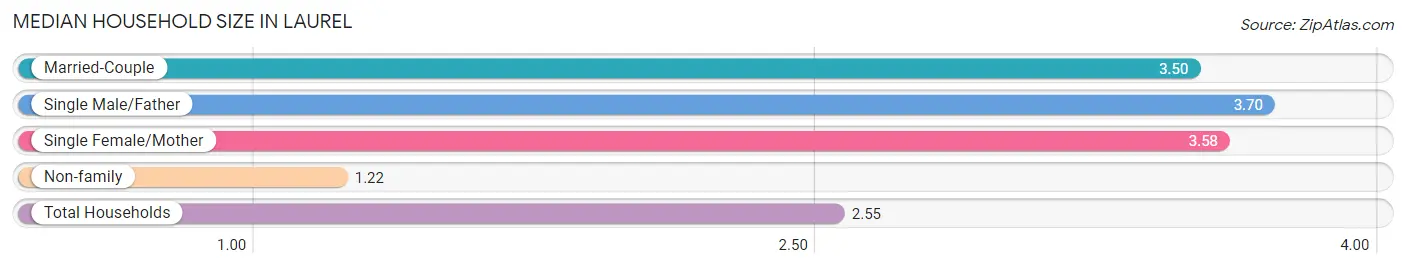
The median household size in Laurel is 2.55 persons per household, with single male/father households (388 | 3.4%) accounting for the largest median household size of 3.7 persons per household. non-family households (4,893 | 42.5%) represent the smallest median household size with 1.22 persons per household.
| Household Type | # Households | Household Size |
| Married-Couple | 4,163 (36.1%) | 3.50 |
| Single Male/Father | 388 (3.4%) | 3.70 |
| Single Female/Mother | 2,073 (18.0%) | 3.58 |
| Non-family | 4,893 (42.5%) | 1.22 |
| Total Households | 11,517 (100.0%) | 2.55 |
Household Size by Marriage Status in Laurel
Out of a total of 11,517 households in Laurel, 6,624 (57.5%) are family households, while 4,893 (42.5%) are nonfamily households. The most numerous type of family households are 2-person households, comprising 2,256, and the most common type of nonfamily households are 1-person households, comprising 4,122.
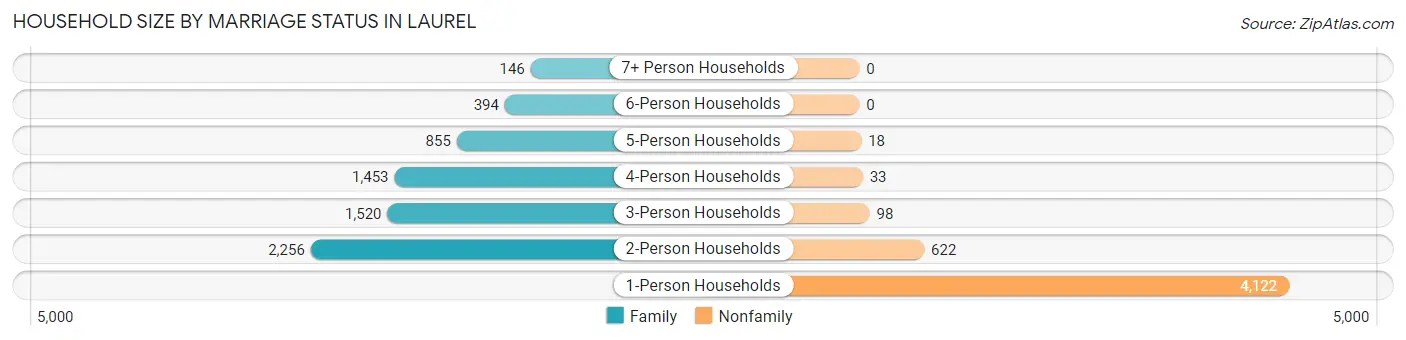
| Household Size | Family Households | Nonfamily Households |
| 1-Person Households | - | 4,122 (35.8%) |
| 2-Person Households | 2,256 (19.6%) | 622 (5.4%) |
| 3-Person Households | 1,520 (13.2%) | 98 (0.9%) |
| 4-Person Households | 1,453 (12.6%) | 33 (0.3%) |
| 5-Person Households | 855 (7.4%) | 18 (0.2%) |
| 6-Person Households | 394 (3.4%) | 0 (0.0%) |
| 7+ Person Households | 146 (1.3%) | 0 (0.0%) |
| Total | 6,624 (57.5%) | 4,893 (42.5%) |
Female Fertility in Laurel
Fertility by Age in Laurel
Average fertility rate in Laurel is 63.0 births per 1,000 women. Women in the age bracket of 20 to 34 years have the highest fertility rate with 73.0 births per 1,000 women. Women in the age bracket of 20 to 34 years acount for 52.4% of all women with births.
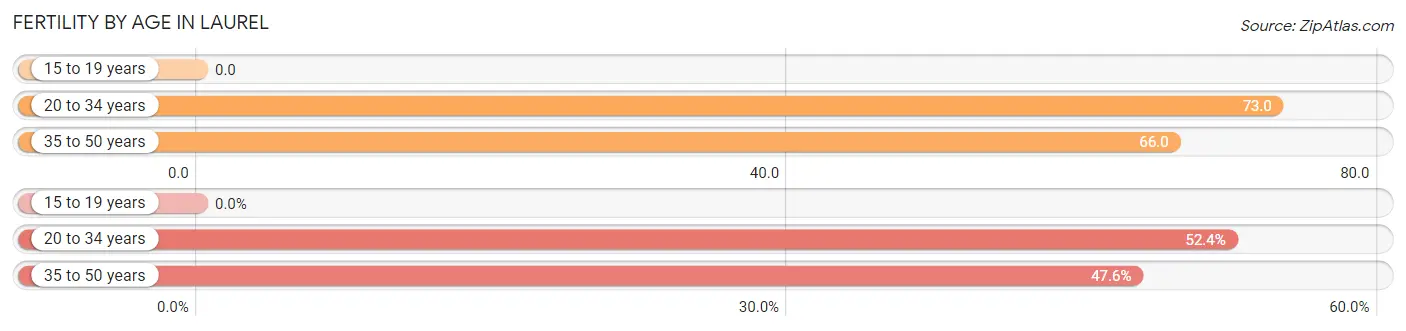
| Age Bracket | Women with Births | Births / 1,000 Women |
| 15 to 19 years | 0 (0.0%) | 0.0 |
| 20 to 34 years | 273 (52.4%) | 73.0 |
| 35 to 50 years | 248 (47.6%) | 66.0 |
| Total | 521 (100.0%) | 63.0 |
Fertility by Age by Marriage Status in Laurel
78.9% of women with births (521) in Laurel are married. The highest percentage of unmarried women with births falls into 20 to 34 years age bracket with 40.3% of them unmarried at the time of birth, while the lowest percentage of unmarried women with births belong to 35 to 50 years age bracket with 0.0% of them unmarried.

| Age Bracket | Married | Unmarried |
| 15 to 19 years | 0 (0.0%) | 0 (0.0%) |
| 20 to 34 years | 163 (59.7%) | 110 (40.3%) |
| 35 to 50 years | 248 (100.0%) | 0 (0.0%) |
| Total | 411 (78.9%) | 110 (21.1%) |
Fertility by Education in Laurel
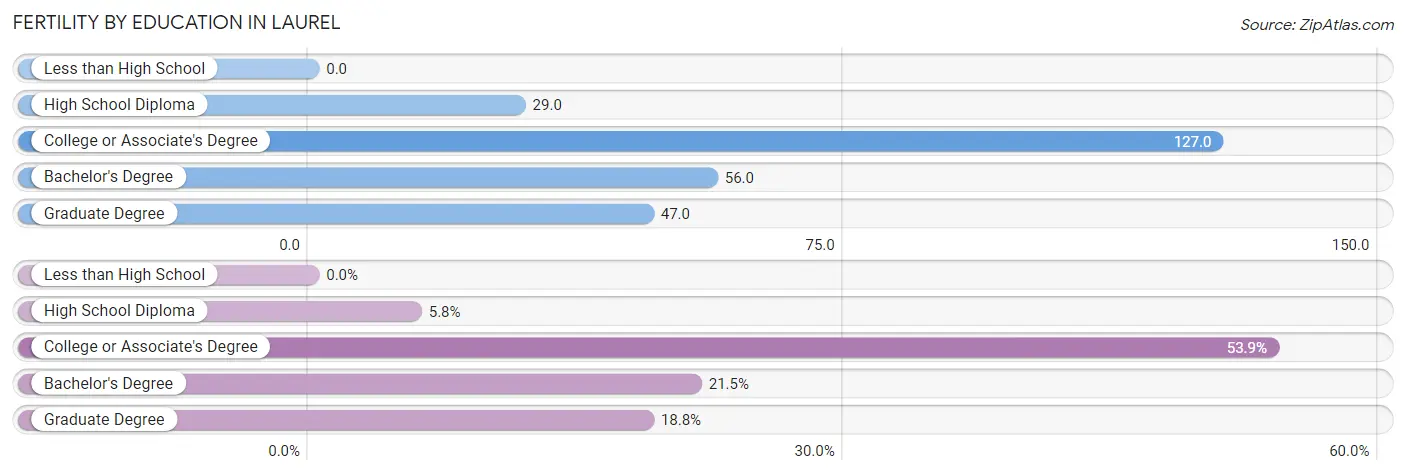
| Educational Attainment | Women with Births | Births / 1,000 Women |
| Less than High School | 0 (0.0%) | 0.0 |
| High School Diploma | 30 (5.8%) | 29.0 |
| College or Associate's Degree | 281 (53.9%) | 127.0 |
| Bachelor's Degree | 112 (21.5%) | 56.0 |
| Graduate Degree | 98 (18.8%) | 47.0 |
| Total | 521 (100.0%) | 63.0 |
Fertility by Education by Marriage Status in Laurel
21.1% of women with births in Laurel are unmarried. Women with the educational attainment of college or associate's degree are most likely to be married with 100.0% of them married at childbirth, while women with the educational attainment of high school diploma are least likely to be married with 100.0% of them unmarried at childbirth.
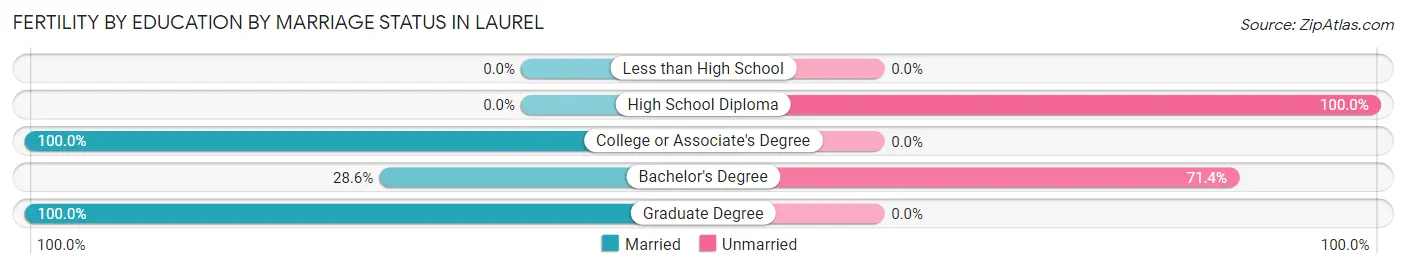
| Educational Attainment | Married | Unmarried |
| Less than High School | 0 (0.0%) | 0 (0.0%) |
| High School Diploma | 0 (0.0%) | 30 (100.0%) |
| College or Associate's Degree | 281 (100.0%) | 0 (0.0%) |
| Bachelor's Degree | 32 (28.6%) | 80 (71.4%) |
| Graduate Degree | 98 (100.0%) | 0 (0.0%) |
| Total | 411 (78.9%) | 110 (21.1%) |
Employment Characteristics in Laurel
Employment by Class of Employer in Laurel
Among the 16,556 employed individuals in Laurel, private company employees (9,580 | 57.9%), federal government employees (2,189 | 13.2%), and not-for-profit organizations (1,961 | 11.8%) make up the most common classes of employment.
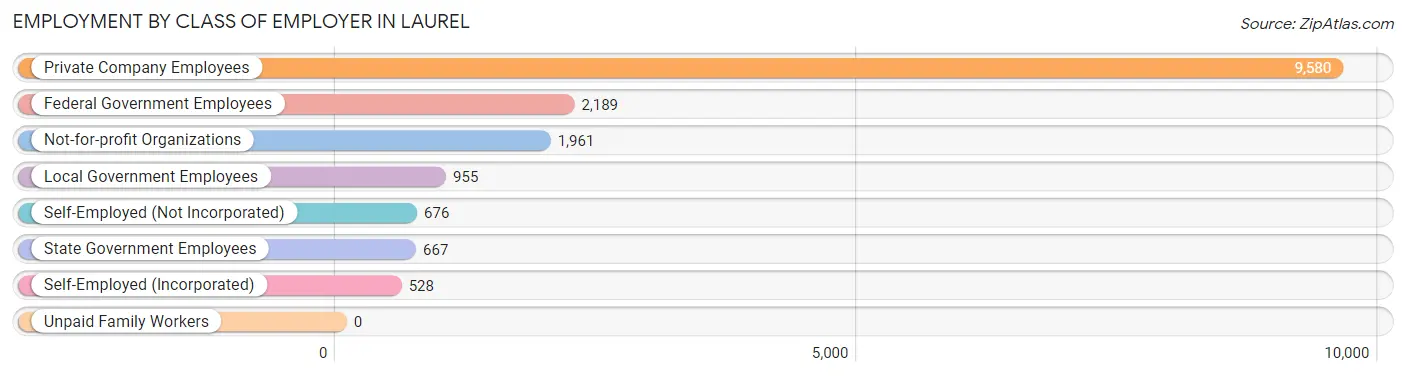
| Employer Class | # Employees | % Employees |
| Private Company Employees | 9,580 | 57.9% |
| Self-Employed (Incorporated) | 528 | 3.2% |
| Self-Employed (Not Incorporated) | 676 | 4.1% |
| Not-for-profit Organizations | 1,961 | 11.8% |
| Local Government Employees | 955 | 5.8% |
| State Government Employees | 667 | 4.0% |
| Federal Government Employees | 2,189 | 13.2% |
| Unpaid Family Workers | 0 | 0.0% |
| Total | 16,556 | 100.0% |
Employment Status by Age in Laurel
According to the labor force statistics for Laurel, out of the total population over 16 years of age (23,106), 76.8% or 17,745 individuals are in the labor force, with 5.9% or 1,047 of them unemployed. The age group with the highest labor force participation rate is 45 to 54 years, with 92.3% or 3,974 individuals in the labor force. Within the labor force, the 16 to 19 years age range has the highest percentage of unemployed individuals, with 17.6% or 77 of them being unemployed.
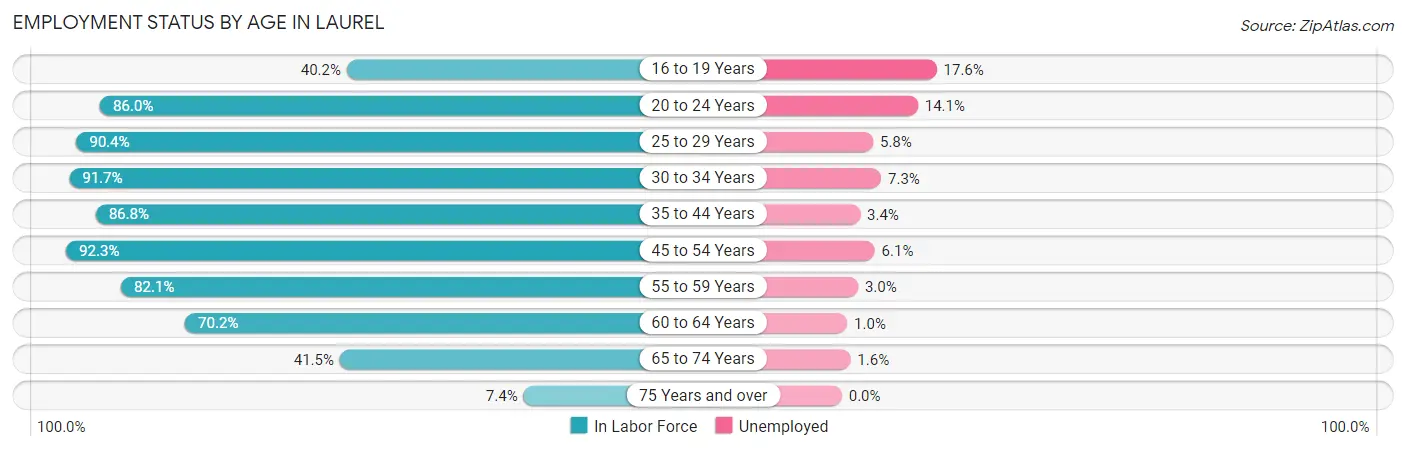
| Age Bracket | In Labor Force | Unemployed |
| 16 to 19 Years | 438 (40.2%) | 77 (17.6%) |
| 20 to 24 Years | 1,718 (86.0%) | 242 (14.1%) |
| 25 to 29 Years | 2,129 (90.4%) | 123 (5.8%) |
| 30 to 34 Years | 2,268 (91.7%) | 166 (7.3%) |
| 35 to 44 Years | 3,830 (86.8%) | 130 (3.4%) |
| 45 to 54 Years | 3,974 (92.3%) | 242 (6.1%) |
| 55 to 59 Years | 1,314 (82.1%) | 39 (3.0%) |
| 60 to 64 Years | 1,133 (70.2%) | 11 (1.0%) |
| 65 to 74 Years | 867 (41.5%) | 14 (1.6%) |
| 75 Years and over | 87 (7.4%) | 0 (0.0%) |
| Total | 17,745 (76.8%) | 1,047 (5.9%) |
Employment Status by Educational Attainment in Laurel
According to labor force statistics for Laurel, 87.4% of individuals (14,647) out of the total population between 25 and 64 years of age (16,759) are in the labor force, with 4.8% or 703 of them being unemployed. The group with the highest labor force participation rate are those with the educational attainment of bachelor's degree or higher, with 92.2% or 7,270 individuals in the labor force. Within the labor force, individuals with less than high school education have the highest percentage of unemployment, with 6.8% or 84 of them being unemployed.
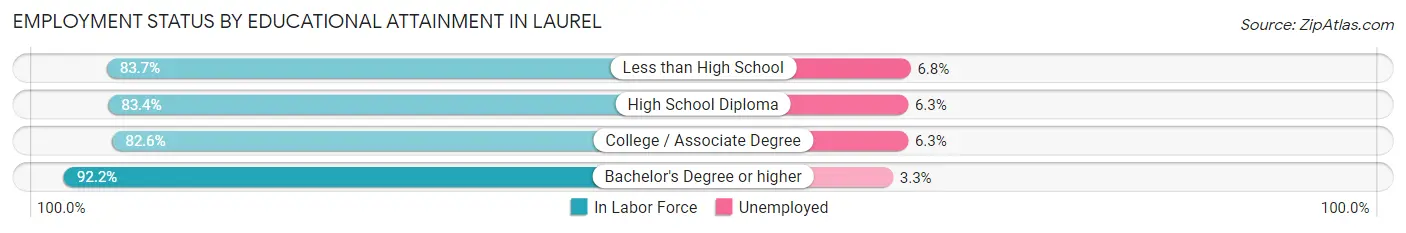
| Educational Attainment | In Labor Force | Unemployed |
| Less than High School | 1,241 (83.7%) | 101 (6.8%) |
| High School Diploma | 2,374 (83.4%) | 179 (6.3%) |
| College / Associate Degree | 3,754 (82.6%) | 286 (6.3%) |
| Bachelor's Degree or higher | 7,270 (92.2%) | 260 (3.3%) |
| Total | 14,647 (87.4%) | 804 (4.8%) |
Employment Occupations by Sex in Laurel
Management, Business, Science and Arts Occupations
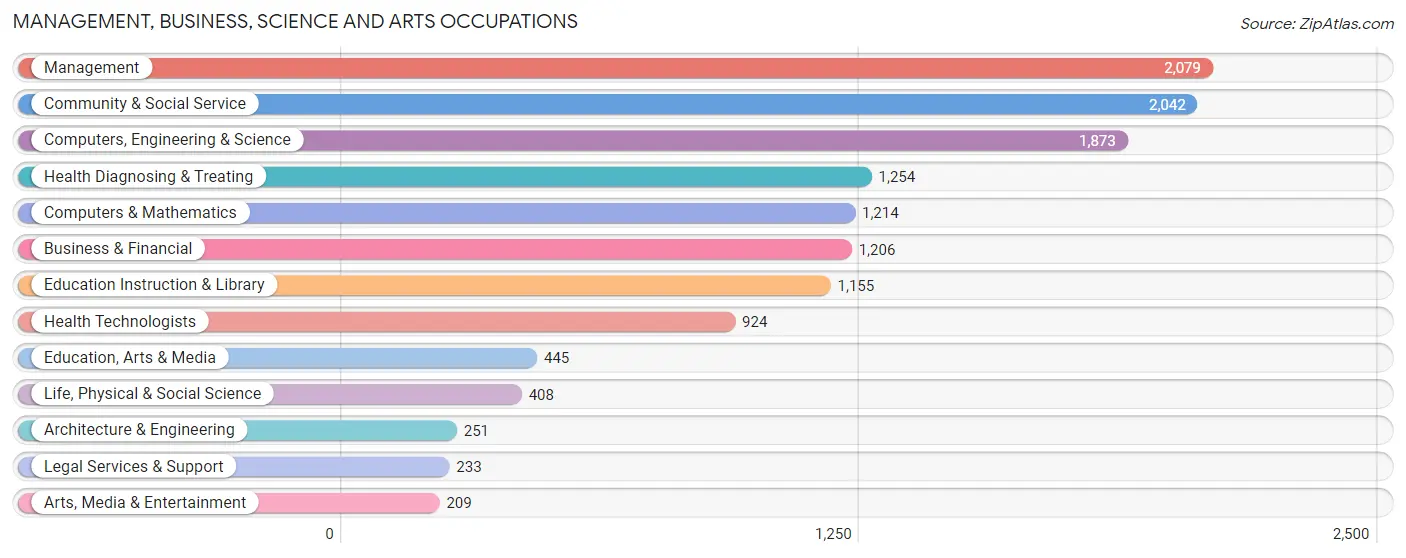
The most common Management, Business, Science and Arts occupations in Laurel are Management (2,079 | 12.6%), Community & Social Service (2,042 | 12.4%), Computers, Engineering & Science (1,873 | 11.4%), Health Diagnosing & Treating (1,254 | 7.6%), and Computers & Mathematics (1,214 | 7.4%).
Management, Business, Science and Arts Occupations by Sex
Within the Management, Business, Science and Arts occupations in Laurel, the most male-oriented occupations are Architecture & Engineering (90.4%), Legal Services & Support (70.0%), and Computers & Mathematics (66.4%), while the most female-oriented occupations are Health Diagnosing & Treating (81.4%), Health Technologists (77.2%), and Education Instruction & Library (71.8%).
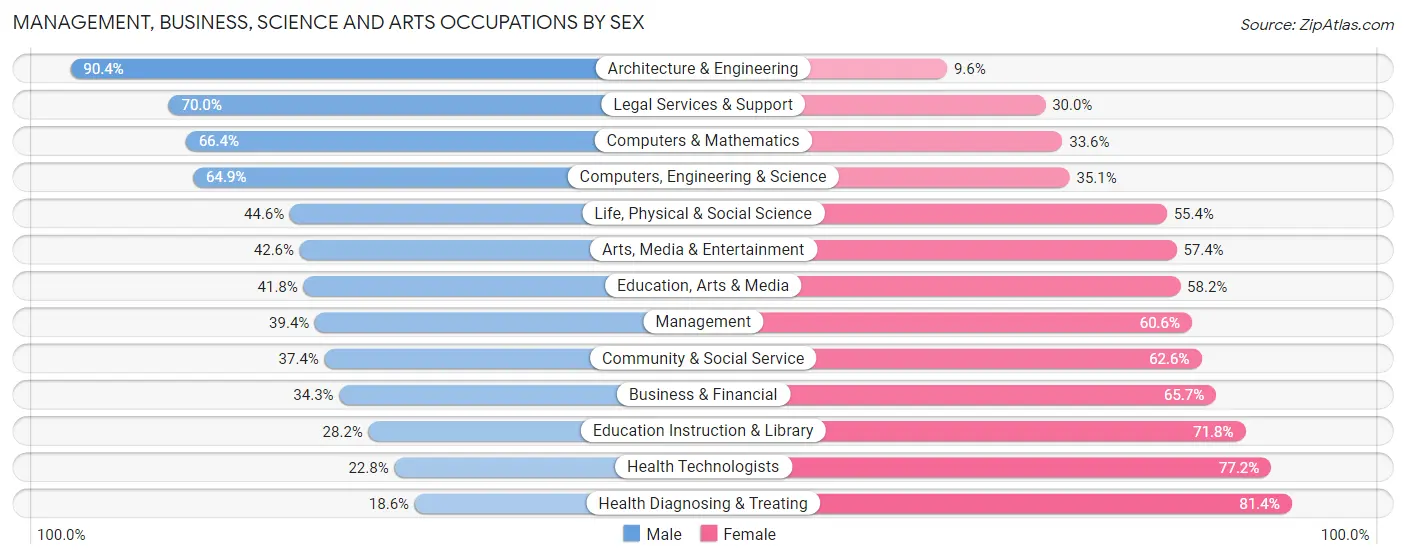
| Occupation | Male | Female |
| Management | 819 (39.4%) | 1,260 (60.6%) |
| Business & Financial | 414 (34.3%) | 792 (65.7%) |
| Computers, Engineering & Science | 1,215 (64.9%) | 658 (35.1%) |
| Computers & Mathematics | 806 (66.4%) | 408 (33.6%) |
| Architecture & Engineering | 227 (90.4%) | 24 (9.6%) |
| Life, Physical & Social Science | 182 (44.6%) | 226 (55.4%) |
| Community & Social Service | 764 (37.4%) | 1,278 (62.6%) |
| Education, Arts & Media | 186 (41.8%) | 259 (58.2%) |
| Legal Services & Support | 163 (70.0%) | 70 (30.0%) |
| Education Instruction & Library | 326 (28.2%) | 829 (71.8%) |
| Arts, Media & Entertainment | 89 (42.6%) | 120 (57.4%) |
| Health Diagnosing & Treating | 233 (18.6%) | 1,021 (81.4%) |
| Health Technologists | 211 (22.8%) | 713 (77.2%) |
| Total (Category) | 3,445 (40.7%) | 5,009 (59.3%) |
| Total (Overall) | 7,878 (47.8%) | 8,603 (52.2%) |
Services Occupations
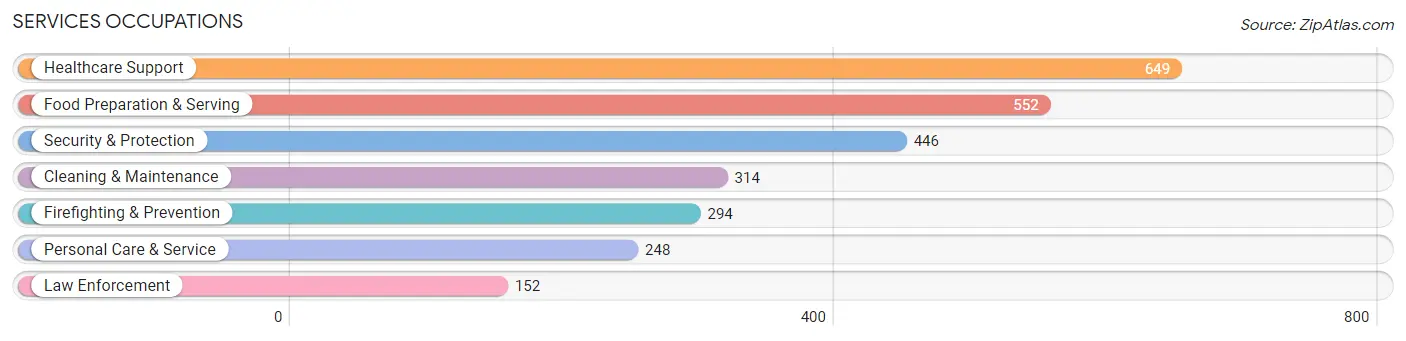
The most common Services occupations in Laurel are Healthcare Support (649 | 3.9%), Food Preparation & Serving (552 | 3.4%), Security & Protection (446 | 2.7%), Cleaning & Maintenance (314 | 1.9%), and Firefighting & Prevention (294 | 1.8%).
Services Occupations by Sex
Within the Services occupations in Laurel, the most male-oriented occupations are Law Enforcement (80.9%), Security & Protection (72.4%), and Firefighting & Prevention (68.0%), while the most female-oriented occupations are Healthcare Support (84.1%), Cleaning & Maintenance (69.4%), and Personal Care & Service (69.0%).
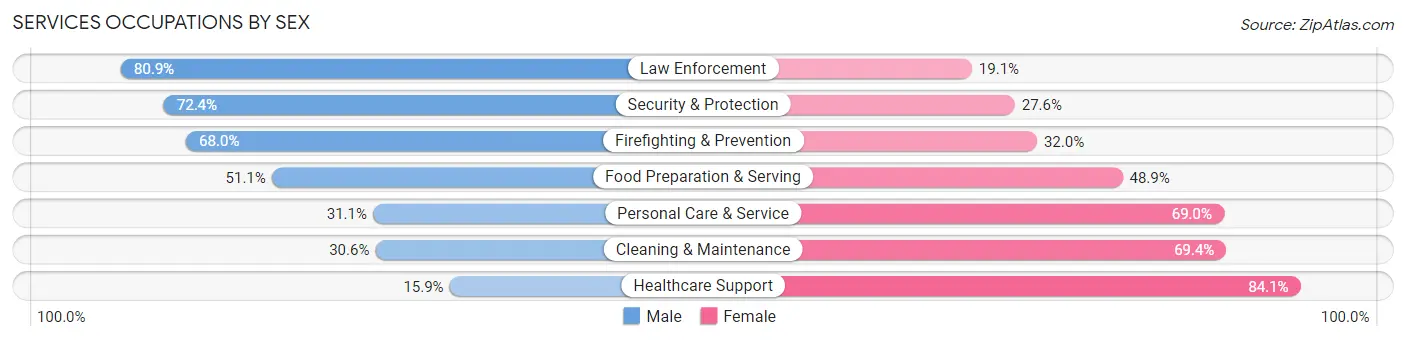
| Occupation | Male | Female |
| Healthcare Support | 103 (15.9%) | 546 (84.1%) |
| Security & Protection | 323 (72.4%) | 123 (27.6%) |
| Firefighting & Prevention | 200 (68.0%) | 94 (32.0%) |
| Law Enforcement | 123 (80.9%) | 29 (19.1%) |
| Food Preparation & Serving | 282 (51.1%) | 270 (48.9%) |
| Cleaning & Maintenance | 96 (30.6%) | 218 (69.4%) |
| Personal Care & Service | 77 (31.0%) | 171 (69.0%) |
| Total (Category) | 881 (39.9%) | 1,328 (60.1%) |
| Total (Overall) | 7,878 (47.8%) | 8,603 (52.2%) |
Sales and Office Occupations
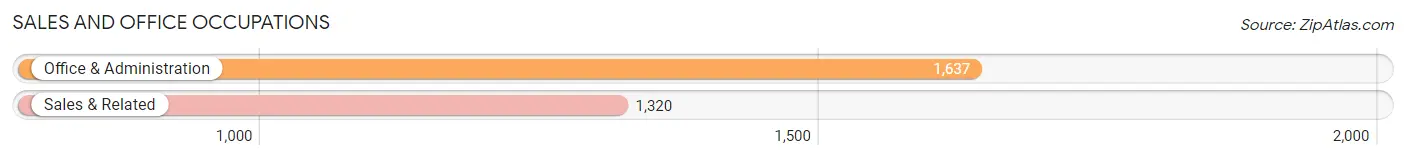
The most common Sales and Office occupations in Laurel are Office & Administration (1,637 | 9.9%), and Sales & Related (1,320 | 8.0%).
Sales and Office Occupations by Sex
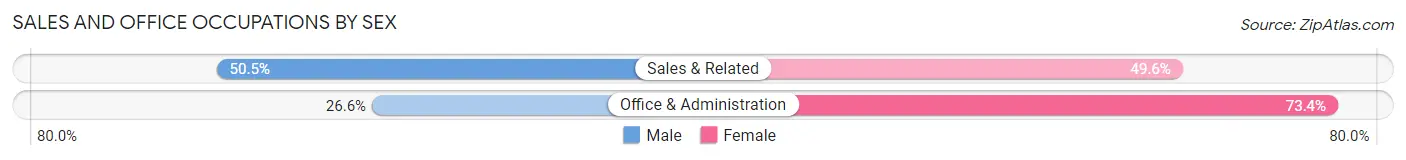
| Occupation | Male | Female |
| Sales & Related | 666 (50.4%) | 654 (49.5%) |
| Office & Administration | 435 (26.6%) | 1,202 (73.4%) |
| Total (Category) | 1,101 (37.2%) | 1,856 (62.8%) |
| Total (Overall) | 7,878 (47.8%) | 8,603 (52.2%) |
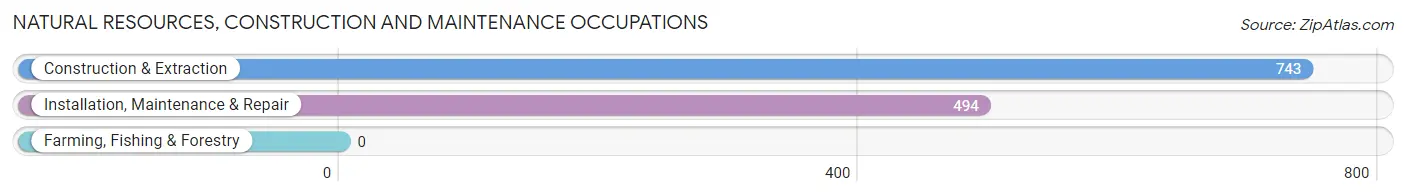
Natural Resources, Construction and Maintenance Occupations
The most common Natural Resources, Construction and Maintenance occupations in Laurel are Construction & Extraction (743 | 4.5%), and Installation, Maintenance & Repair (494 | 3.0%).
Natural Resources, Construction and Maintenance Occupations by Sex
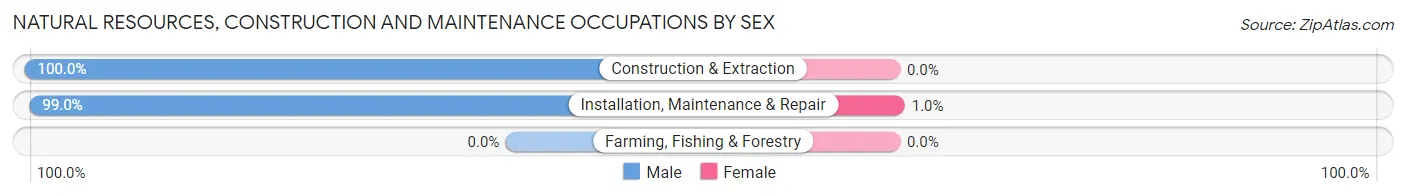
| Occupation | Male | Female |
| Farming, Fishing & Forestry | 0 (0.0%) | 0 (0.0%) |
| Construction & Extraction | 743 (100.0%) | 0 (0.0%) |
| Installation, Maintenance & Repair | 489 (99.0%) | 5 (1.0%) |
| Total (Category) | 1,232 (99.6%) | 5 (0.4%) |
| Total (Overall) | 7,878 (47.8%) | 8,603 (52.2%) |
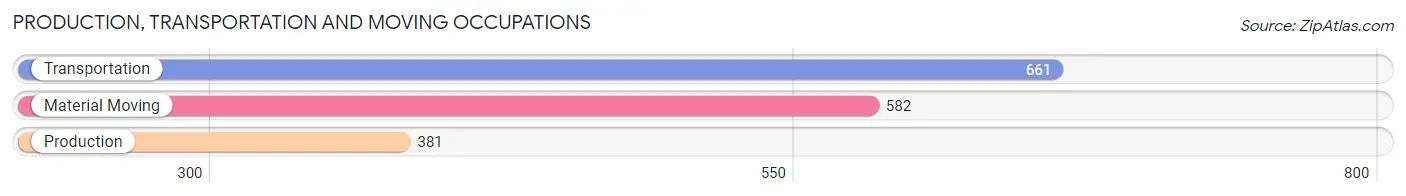
Production, Transportation and Moving Occupations
The most common Production, Transportation and Moving occupations in Laurel are Transportation (661 | 4.0%), Material Moving (582 | 3.5%), and Production (381 | 2.3%).
Production, Transportation and Moving Occupations by Sex
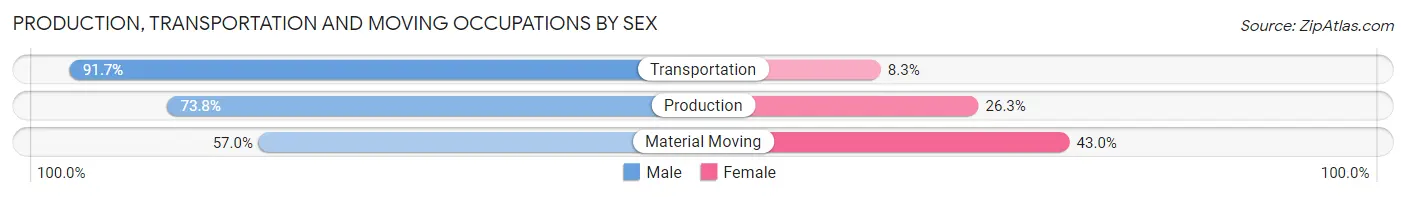
| Occupation | Male | Female |
| Production | 281 (73.8%) | 100 (26.3%) |
| Transportation | 606 (91.7%) | 55 (8.3%) |
| Material Moving | 332 (57.0%) | 250 (43.0%) |
| Total (Category) | 1,219 (75.1%) | 405 (24.9%) |
| Total (Overall) | 7,878 (47.8%) | 8,603 (52.2%) |
Employment Industries by Sex in Laurel
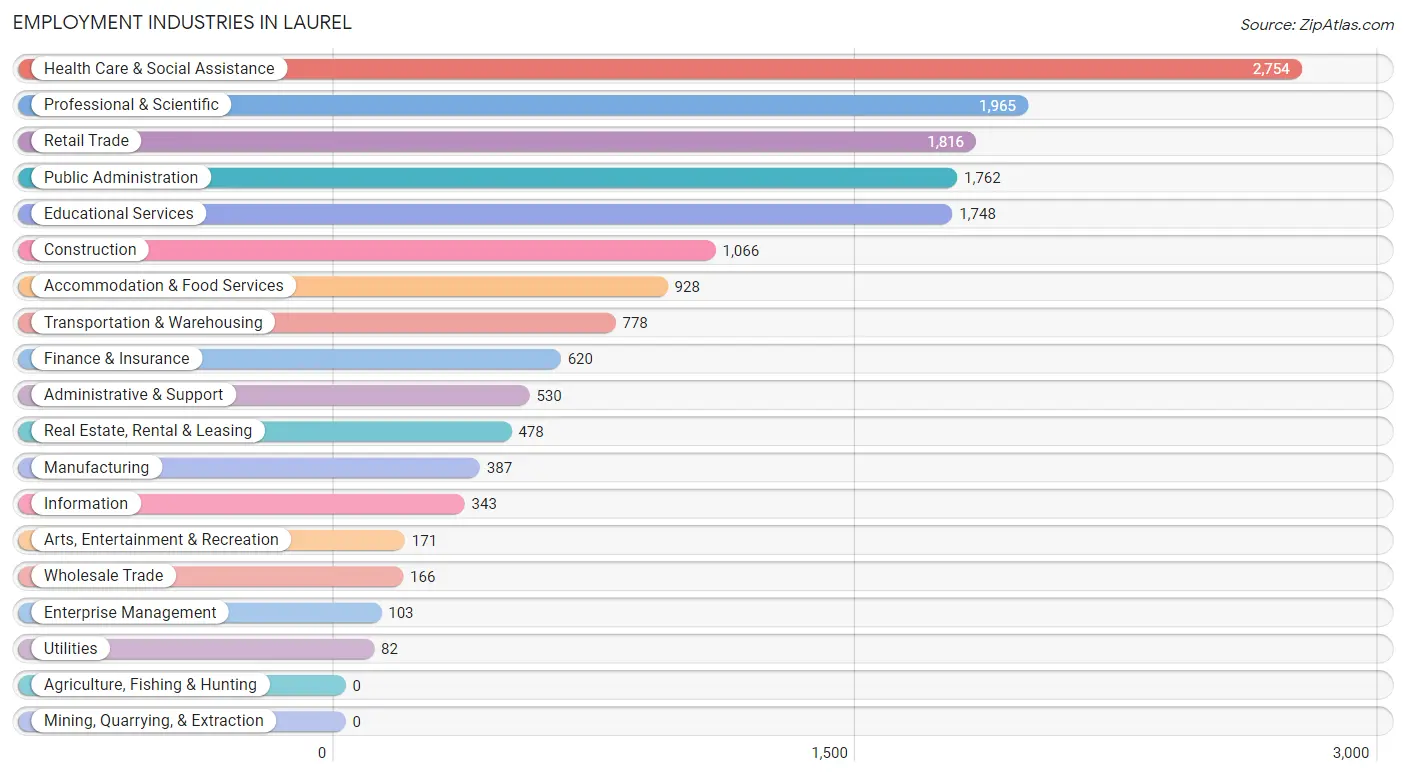
Employment Industries in Laurel
The major employment industries in Laurel include Health Care & Social Assistance (2,754 | 16.7%), Professional & Scientific (1,965 | 11.9%), Retail Trade (1,816 | 11.0%), Public Administration (1,762 | 10.7%), and Educational Services (1,748 | 10.6%).
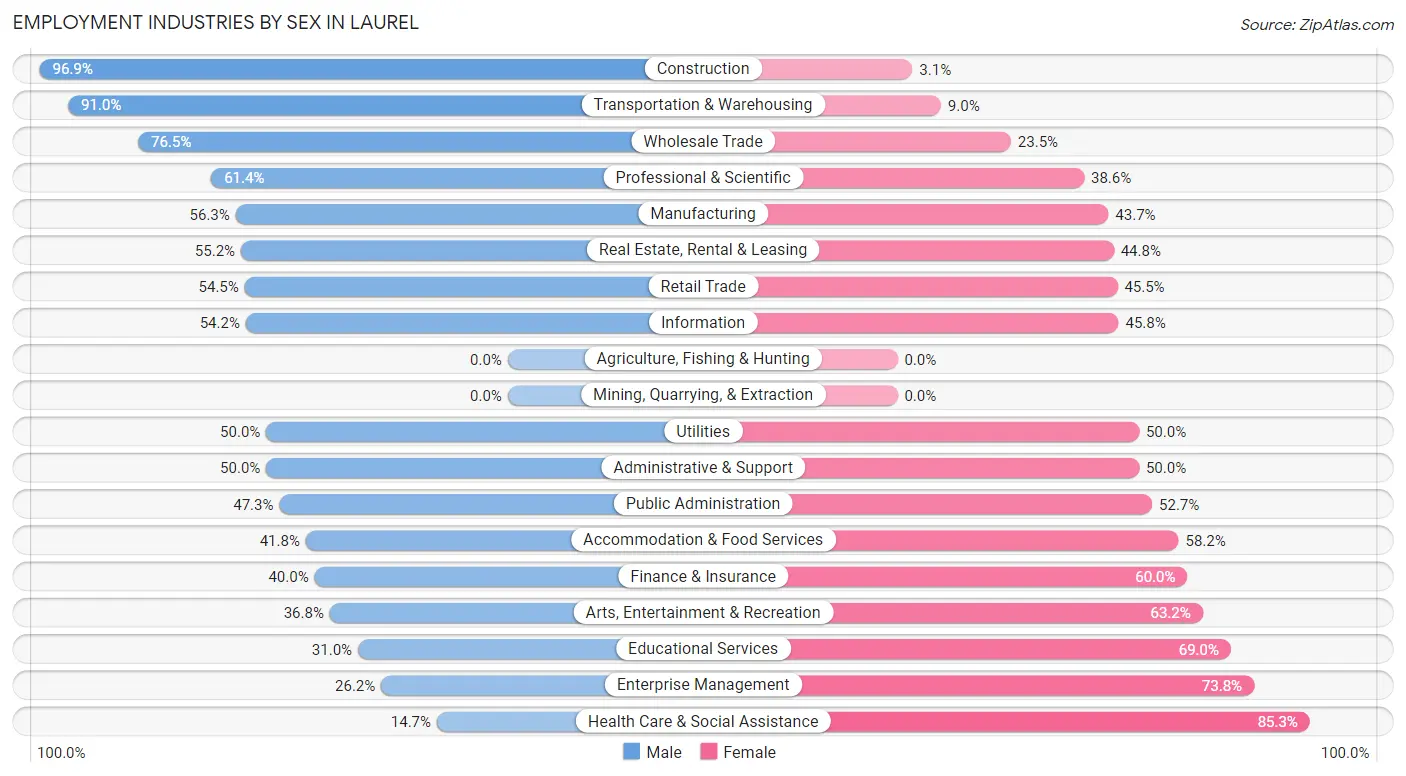
Employment Industries by Sex in Laurel
The Laurel industries that see more men than women are Construction (96.9%), Transportation & Warehousing (91.0%), and Wholesale Trade (76.5%), whereas the industries that tend to have a higher number of women are Health Care & Social Assistance (85.3%), Enterprise Management (73.8%), and Educational Services (69.0%).
| Industry | Male | Female |
| Agriculture, Fishing & Hunting | 0 (0.0%) | 0 (0.0%) |
| Mining, Quarrying, & Extraction | 0 (0.0%) | 0 (0.0%) |
| Construction | 1,033 (96.9%) | 33 (3.1%) |
| Manufacturing | 218 (56.3%) | 169 (43.7%) |
| Wholesale Trade | 127 (76.5%) | 39 (23.5%) |
| Retail Trade | 989 (54.5%) | 827 (45.5%) |
| Transportation & Warehousing | 708 (91.0%) | 70 (9.0%) |
| Utilities | 41 (50.0%) | 41 (50.0%) |
| Information | 186 (54.2%) | 157 (45.8%) |
| Finance & Insurance | 248 (40.0%) | 372 (60.0%) |
| Real Estate, Rental & Leasing | 264 (55.2%) | 214 (44.8%) |
| Professional & Scientific | 1,206 (61.4%) | 759 (38.6%) |
| Enterprise Management | 27 (26.2%) | 76 (73.8%) |
| Administrative & Support | 265 (50.0%) | 265 (50.0%) |
| Educational Services | 542 (31.0%) | 1,206 (69.0%) |
| Health Care & Social Assistance | 404 (14.7%) | 2,350 (85.3%) |
| Arts, Entertainment & Recreation | 63 (36.8%) | 108 (63.2%) |
| Accommodation & Food Services | 388 (41.8%) | 540 (58.2%) |
| Public Administration | 833 (47.3%) | 929 (52.7%) |
| Total | 7,878 (47.8%) | 8,603 (52.2%) |
Education in Laurel
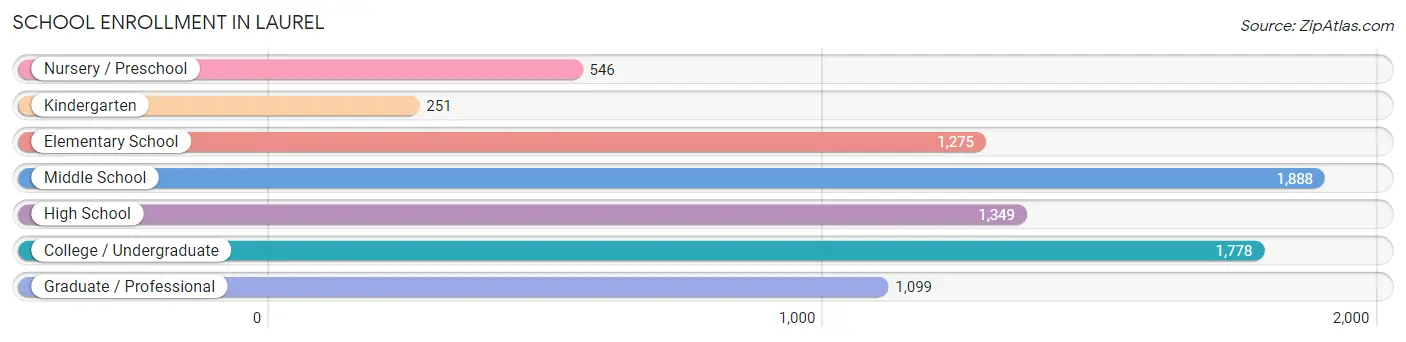
School Enrollment in Laurel
The most common levels of schooling among the 8,186 students in Laurel are middle school (1,888 | 23.1%), college / undergraduate (1,778 | 21.7%), and high school (1,349 | 16.5%).
| School Level | # Students | % Students |
| Nursery / Preschool | 546 | 6.7% |
| Kindergarten | 251 | 3.1% |
| Elementary School | 1,275 | 15.6% |
| Middle School | 1,888 | 23.1% |
| High School | 1,349 | 16.5% |
| College / Undergraduate | 1,778 | 21.7% |
| Graduate / Professional | 1,099 | 13.4% |
| Total | 8,186 | 100.0% |
School Enrollment by Age by Funding Source in Laurel
Out of a total of 8,186 students who are enrolled in schools in Laurel, 1,842 (22.5%) attend a private institution, while the remaining 6,344 (77.5%) are enrolled in public schools. The age group of 3 to 4 year olds has the highest likelihood of being enrolled in private schools, with 238 (49.7% in the age bracket) enrolled. Conversely, the age group of 15 to 17 year olds has the lowest likelihood of being enrolled in a private school, with 716 (84.5% in the age bracket) attending a public institution.
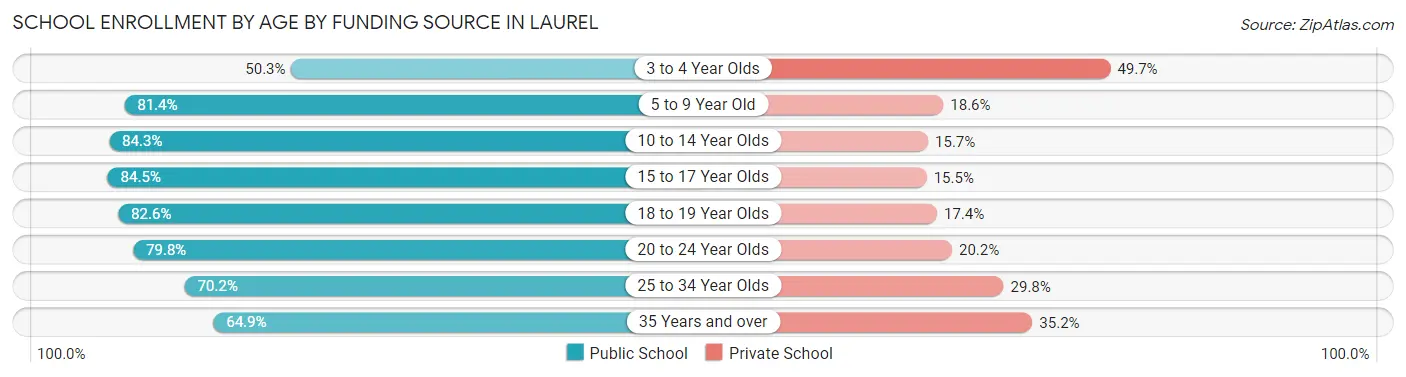
| Age Bracket | Public School | Private School |
| 3 to 4 Year Olds | 241 (50.3%) | 238 (49.7%) |
| 5 to 9 Year Old | 1,254 (81.4%) | 286 (18.6%) |
| 10 to 14 Year Olds | 1,886 (84.3%) | 352 (15.7%) |
| 15 to 17 Year Olds | 716 (84.5%) | 131 (15.5%) |
| 18 to 19 Year Olds | 356 (82.6%) | 75 (17.4%) |
| 20 to 24 Year Olds | 672 (79.8%) | 170 (20.2%) |
| 25 to 34 Year Olds | 561 (70.2%) | 238 (29.8%) |
| 35 Years and over | 655 (64.8%) | 355 (35.1%) |
| Total | 6,344 (77.5%) | 1,842 (22.5%) |
Educational Attainment by Field of Study in Laurel
Business (1,726 | 17.4%), social sciences (997 | 10.0%), computers & mathematics (829 | 8.4%), science & technology (822 | 8.3%), and engineering (768 | 7.7%) are the most common fields of study among 9,931 individuals in Laurel who have obtained a bachelor's degree or higher.
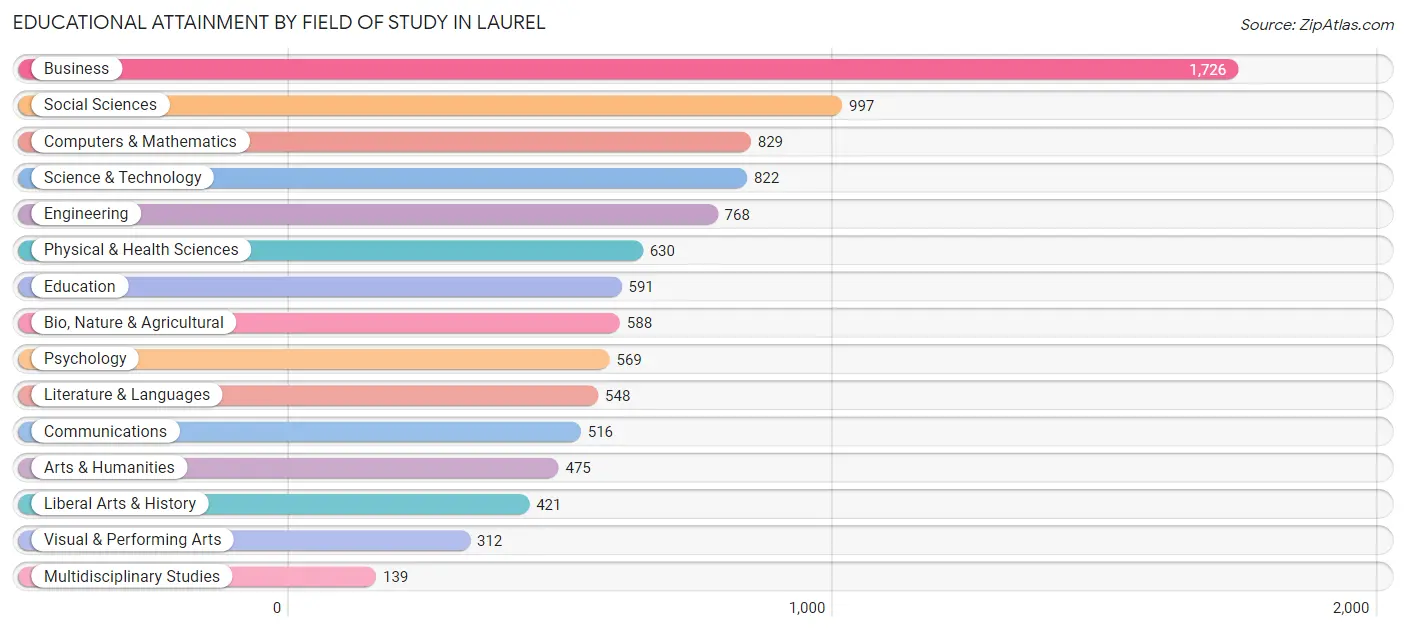
| Field of Study | # Graduates | % Graduates |
| Computers & Mathematics | 829 | 8.4% |
| Bio, Nature & Agricultural | 588 | 5.9% |
| Physical & Health Sciences | 630 | 6.3% |
| Psychology | 569 | 5.7% |
| Social Sciences | 997 | 10.0% |
| Engineering | 768 | 7.7% |
| Multidisciplinary Studies | 139 | 1.4% |
| Science & Technology | 822 | 8.3% |
| Business | 1,726 | 17.4% |
| Education | 591 | 5.9% |
| Literature & Languages | 548 | 5.5% |
| Liberal Arts & History | 421 | 4.2% |
| Visual & Performing Arts | 312 | 3.1% |
| Communications | 516 | 5.2% |
| Arts & Humanities | 475 | 4.8% |
| Total | 9,931 | 100.0% |
Transportation & Commute in Laurel
Vehicle Availability by Sex in Laurel
The most prevalent vehicle ownership categories in Laurel are males with 2 vehicles (2,930, accounting for 36.9%) and females with 2 vehicles (3,077, making up 34.1%).
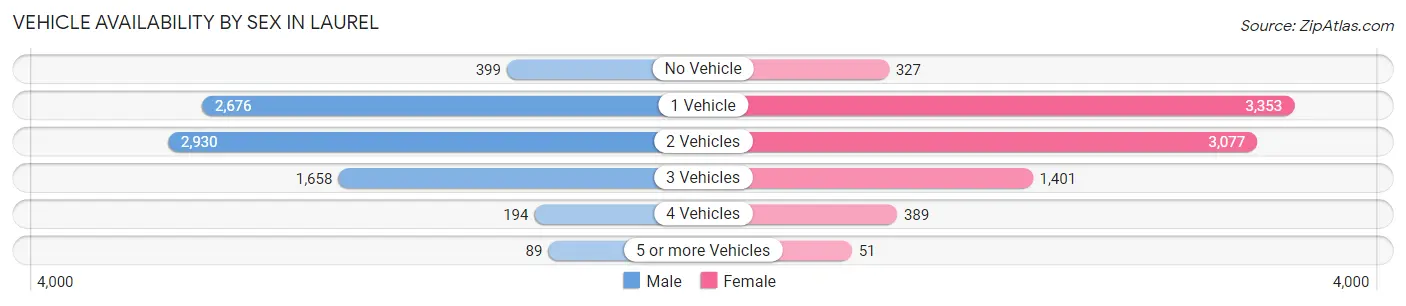
| Vehicles Available | Male | Female |
| No Vehicle | 399 (5.0%) | 327 (3.8%) |
| 1 Vehicle | 2,676 (33.7%) | 3,353 (39.0%) |
| 2 Vehicles | 2,930 (36.9%) | 3,077 (35.8%) |
| 3 Vehicles | 1,658 (20.9%) | 1,401 (16.3%) |
| 4 Vehicles | 194 (2.4%) | 389 (4.5%) |
| 5 or more Vehicles | 89 (1.1%) | 51 (0.6%) |
| Total | 7,946 (100.0%) | 8,598 (100.0%) |
Commute Time in Laurel
The most frequently occuring commute durations in Laurel are 45 to 59 minutes (2,296 commuters, 15.9%), 30 to 34 minutes (2,127 commuters, 14.7%), and 20 to 24 minutes (1,647 commuters, 11.4%).
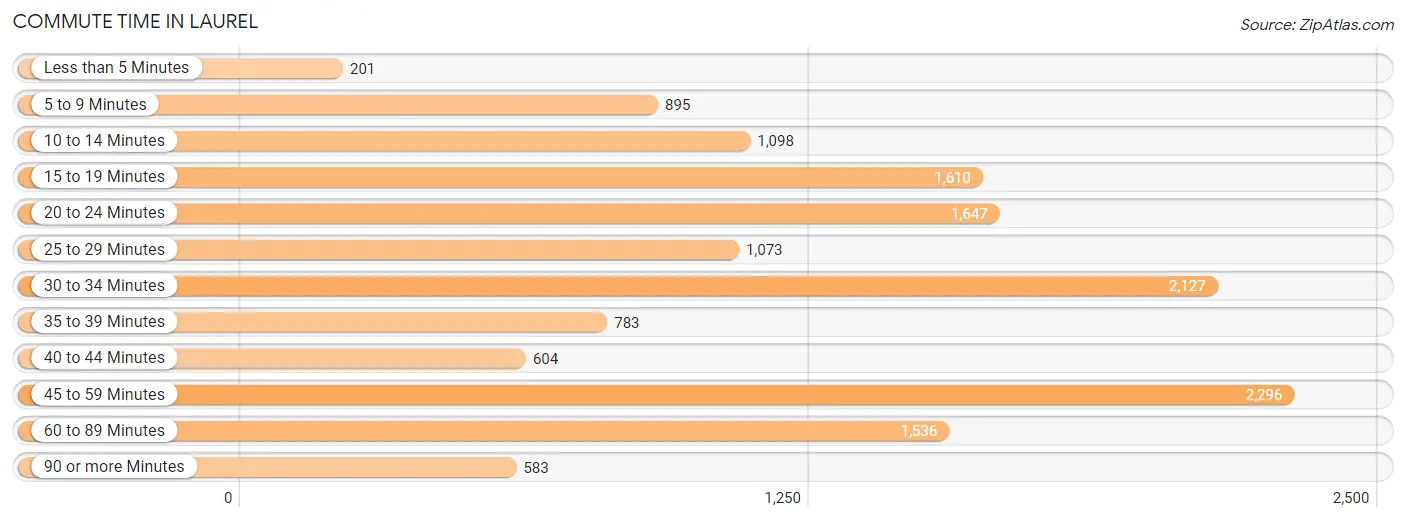
| Commute Time | # Commuters | % Commuters |
| Less than 5 Minutes | 201 | 1.4% |
| 5 to 9 Minutes | 895 | 6.2% |
| 10 to 14 Minutes | 1,098 | 7.6% |
| 15 to 19 Minutes | 1,610 | 11.1% |
| 20 to 24 Minutes | 1,647 | 11.4% |
| 25 to 29 Minutes | 1,073 | 7.4% |
| 30 to 34 Minutes | 2,127 | 14.7% |
| 35 to 39 Minutes | 783 | 5.4% |
| 40 to 44 Minutes | 604 | 4.2% |
| 45 to 59 Minutes | 2,296 | 15.9% |
| 60 to 89 Minutes | 1,536 | 10.6% |
| 90 or more Minutes | 583 | 4.0% |
Commute Time by Sex in Laurel
The most common commute times in Laurel are 45 to 59 minutes (1,069 commuters, 15.0%) for males and 30 to 34 minutes (1,299 commuters, 17.7%) for females.
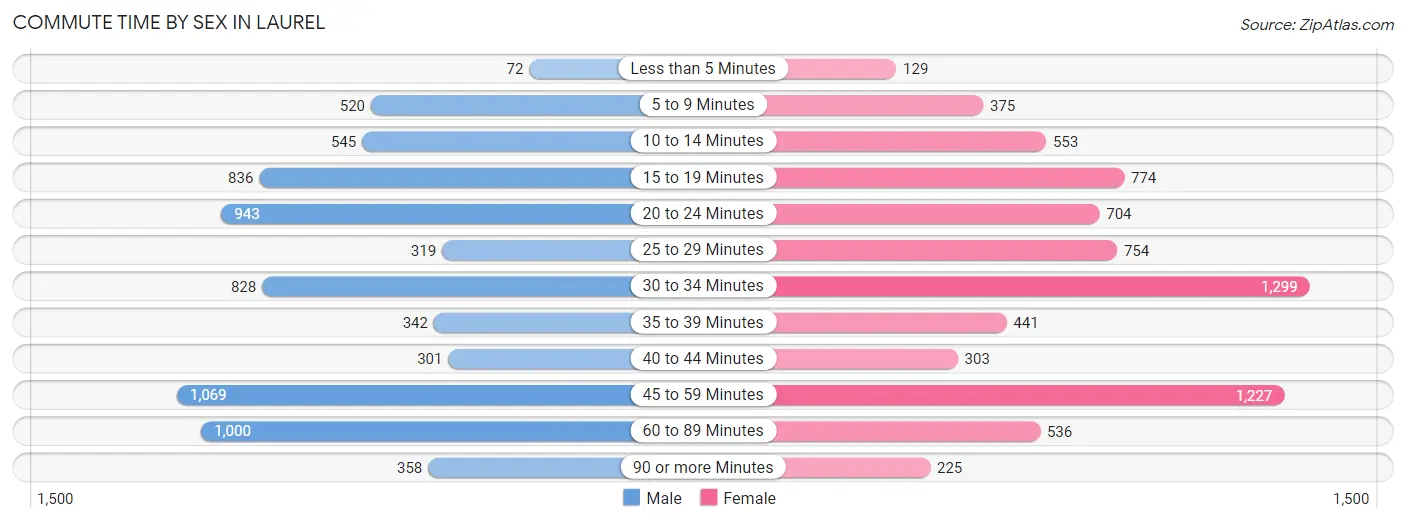
| Commute Time | Male | Female |
| Less than 5 Minutes | 72 (1.0%) | 129 (1.8%) |
| 5 to 9 Minutes | 520 (7.3%) | 375 (5.1%) |
| 10 to 14 Minutes | 545 (7.6%) | 553 (7.5%) |
| 15 to 19 Minutes | 836 (11.7%) | 774 (10.6%) |
| 20 to 24 Minutes | 943 (13.2%) | 704 (9.6%) |
| 25 to 29 Minutes | 319 (4.5%) | 754 (10.3%) |
| 30 to 34 Minutes | 828 (11.6%) | 1,299 (17.7%) |
| 35 to 39 Minutes | 342 (4.8%) | 441 (6.0%) |
| 40 to 44 Minutes | 301 (4.2%) | 303 (4.1%) |
| 45 to 59 Minutes | 1,069 (15.0%) | 1,227 (16.8%) |
| 60 to 89 Minutes | 1,000 (14.0%) | 536 (7.3%) |
| 90 or more Minutes | 358 (5.0%) | 225 (3.1%) |
Time of Departure to Work by Sex in Laurel
The most frequent times of departure to work in Laurel are 7:00 AM to 7:29 AM (859, 12.0%) for males and 7:30 AM to 7:59 AM (918, 12.5%) for females.
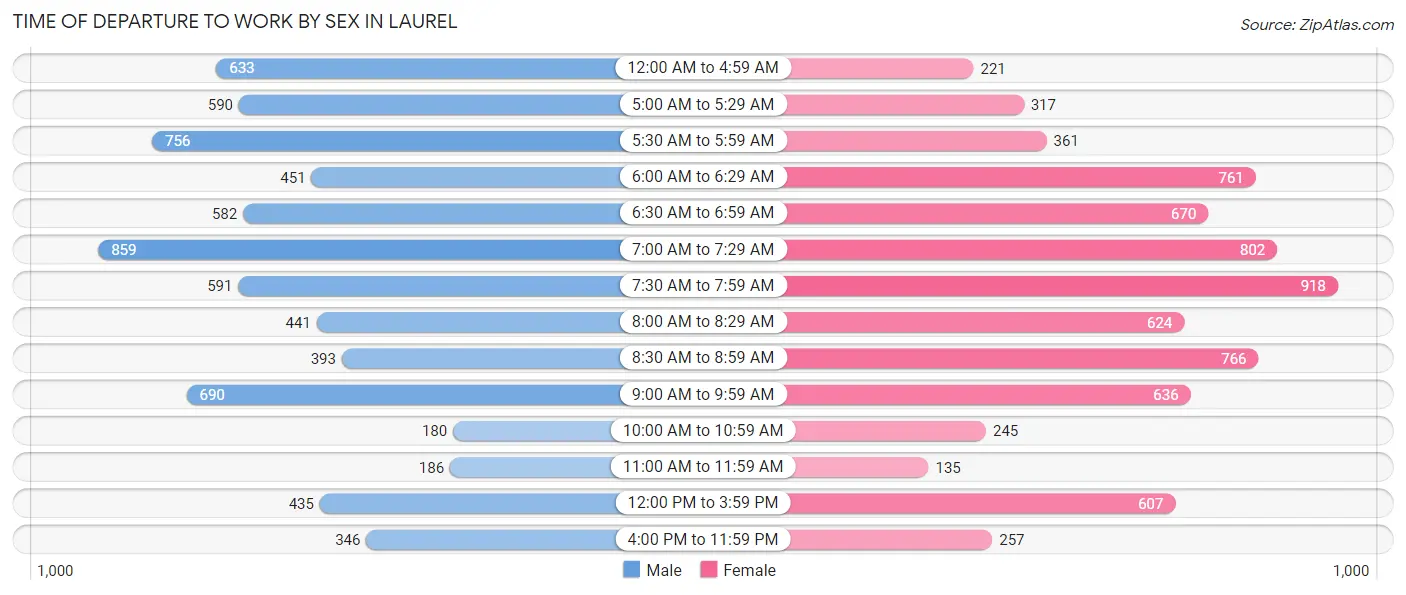
| Time of Departure | Male | Female |
| 12:00 AM to 4:59 AM | 633 (8.9%) | 221 (3.0%) |
| 5:00 AM to 5:29 AM | 590 (8.3%) | 317 (4.3%) |
| 5:30 AM to 5:59 AM | 756 (10.6%) | 361 (4.9%) |
| 6:00 AM to 6:29 AM | 451 (6.3%) | 761 (10.4%) |
| 6:30 AM to 6:59 AM | 582 (8.2%) | 670 (9.1%) |
| 7:00 AM to 7:29 AM | 859 (12.0%) | 802 (11.0%) |
| 7:30 AM to 7:59 AM | 591 (8.3%) | 918 (12.5%) |
| 8:00 AM to 8:29 AM | 441 (6.2%) | 624 (8.5%) |
| 8:30 AM to 8:59 AM | 393 (5.5%) | 766 (10.5%) |
| 9:00 AM to 9:59 AM | 690 (9.7%) | 636 (8.7%) |
| 10:00 AM to 10:59 AM | 180 (2.5%) | 245 (3.4%) |
| 11:00 AM to 11:59 AM | 186 (2.6%) | 135 (1.8%) |
| 12:00 PM to 3:59 PM | 435 (6.1%) | 607 (8.3%) |
| 4:00 PM to 11:59 PM | 346 (4.9%) | 257 (3.5%) |
| Total | 7,133 (100.0%) | 7,320 (100.0%) |
Housing Occupancy in Laurel
Occupancy by Ownership in Laurel
Of the total 11,517 dwellings in Laurel, owner-occupied units account for 5,107 (44.3%), while renter-occupied units make up 6,410 (55.7%).
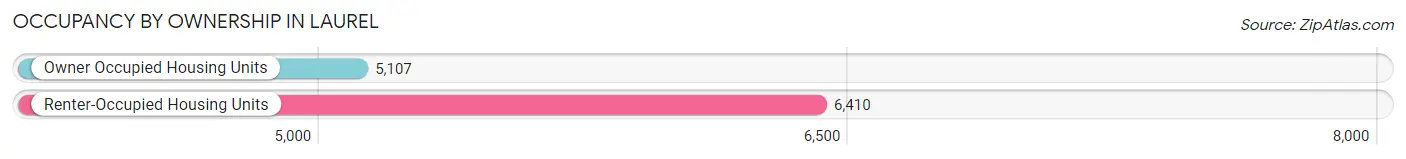
| Occupancy | # Housing Units | % Housing Units |
| Owner Occupied Housing Units | 5,107 | 44.3% |
| Renter-Occupied Housing Units | 6,410 | 55.7% |
| Total Occupied Housing Units | 11,517 | 100.0% |
Occupancy by Household Size in Laurel
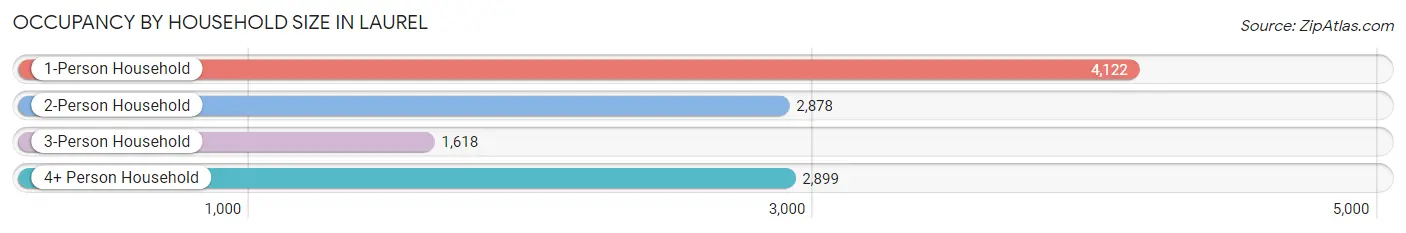
| Household Size | # Housing Units | % Housing Units |
| 1-Person Household | 4,122 | 35.8% |
| 2-Person Household | 2,878 | 25.0% |
| 3-Person Household | 1,618 | 14.1% |
| 4+ Person Household | 2,899 | 25.2% |
| Total Housing Units | 11,517 | 100.0% |
Occupancy by Ownership by Household Size in Laurel
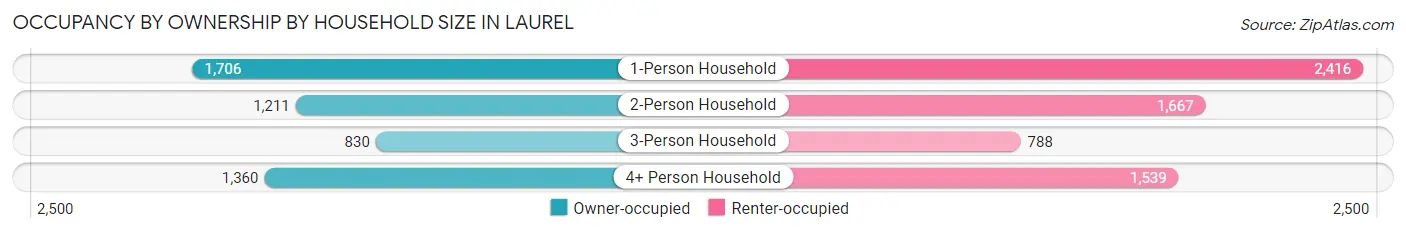
| Household Size | Owner-occupied | Renter-occupied |
| 1-Person Household | 1,706 (41.4%) | 2,416 (58.6%) |
| 2-Person Household | 1,211 (42.1%) | 1,667 (57.9%) |
| 3-Person Household | 830 (51.3%) | 788 (48.7%) |
| 4+ Person Household | 1,360 (46.9%) | 1,539 (53.1%) |
| Total Housing Units | 5,107 (44.3%) | 6,410 (55.7%) |
Occupancy by Educational Attainment in Laurel
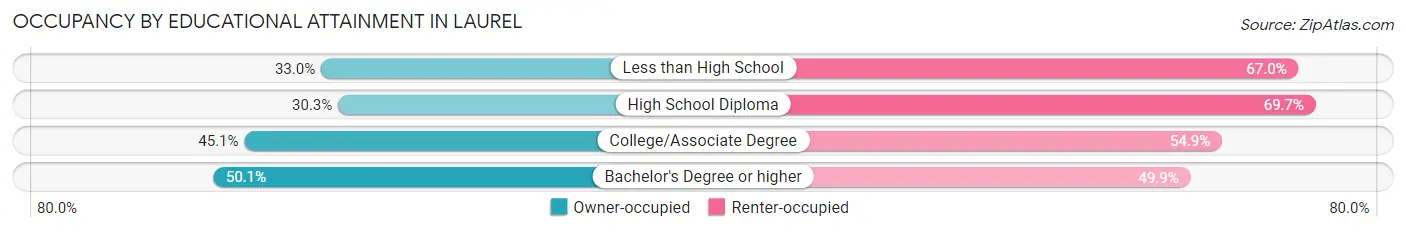
| Household Size | Owner-occupied | Renter-occupied |
| Less than High School | 319 (33.0%) | 648 (67.0%) |
| High School Diploma | 530 (30.3%) | 1,221 (69.7%) |
| College/Associate Degree | 1,389 (45.1%) | 1,688 (54.9%) |
| Bachelor's Degree or higher | 2,869 (50.1%) | 2,853 (49.9%) |
Occupancy by Age of Householder in Laurel
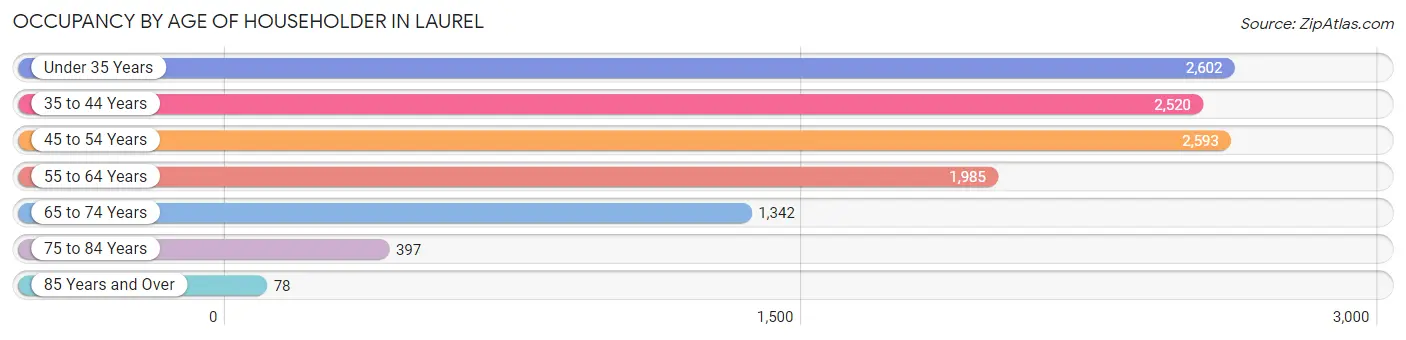
| Age Bracket | # Households | % Households |
| Under 35 Years | 2,602 | 22.6% |
| 35 to 44 Years | 2,520 | 21.9% |
| 45 to 54 Years | 2,593 | 22.5% |
| 55 to 64 Years | 1,985 | 17.2% |
| 65 to 74 Years | 1,342 | 11.7% |
| 75 to 84 Years | 397 | 3.5% |
| 85 Years and Over | 78 | 0.7% |
| Total | 11,517 | 100.0% |
Housing Finances in Laurel
Median Income by Occupancy in Laurel
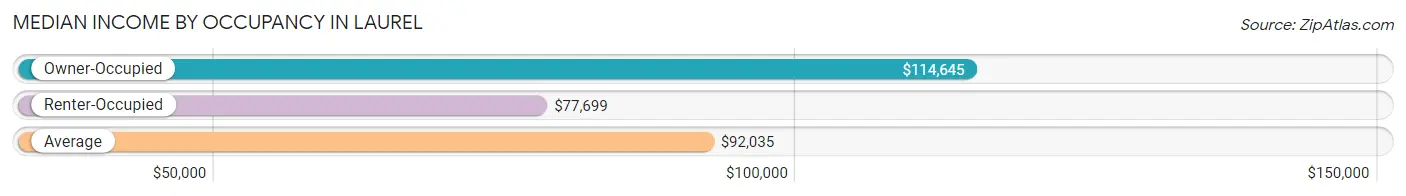
| Occupancy Type | # Households | Median Income |
| Owner-Occupied | 5,107 (44.3%) | $114,645 |
| Renter-Occupied | 6,410 (55.7%) | $77,699 |
| Average | 11,517 (100.0%) | $92,035 |
Occupancy by Householder Income Bracket in Laurel
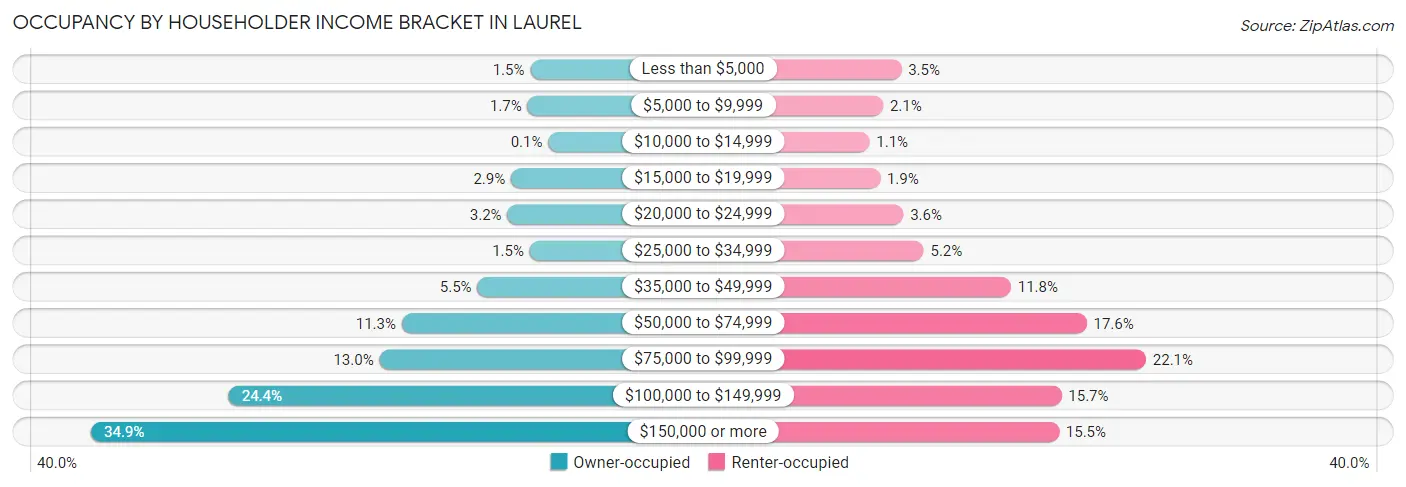
| Income Bracket | Owner-occupied | Renter-occupied |
| Less than $5,000 | 75 (1.5%) | 223 (3.5%) |
| $5,000 to $9,999 | 86 (1.7%) | 134 (2.1%) |
| $10,000 to $14,999 | 5 (0.1%) | 67 (1.1%) |
| $15,000 to $19,999 | 150 (2.9%) | 119 (1.9%) |
| $20,000 to $24,999 | 164 (3.2%) | 233 (3.6%) |
| $25,000 to $34,999 | 77 (1.5%) | 332 (5.2%) |
| $35,000 to $49,999 | 281 (5.5%) | 758 (11.8%) |
| $50,000 to $74,999 | 575 (11.3%) | 1,128 (17.6%) |
| $75,000 to $99,999 | 662 (13.0%) | 1,418 (22.1%) |
| $100,000 to $149,999 | 1,248 (24.4%) | 1,005 (15.7%) |
| $150,000 or more | 1,784 (34.9%) | 993 (15.5%) |
| Total | 5,107 (100.0%) | 6,410 (100.0%) |
Monthly Housing Cost Tiers in Laurel
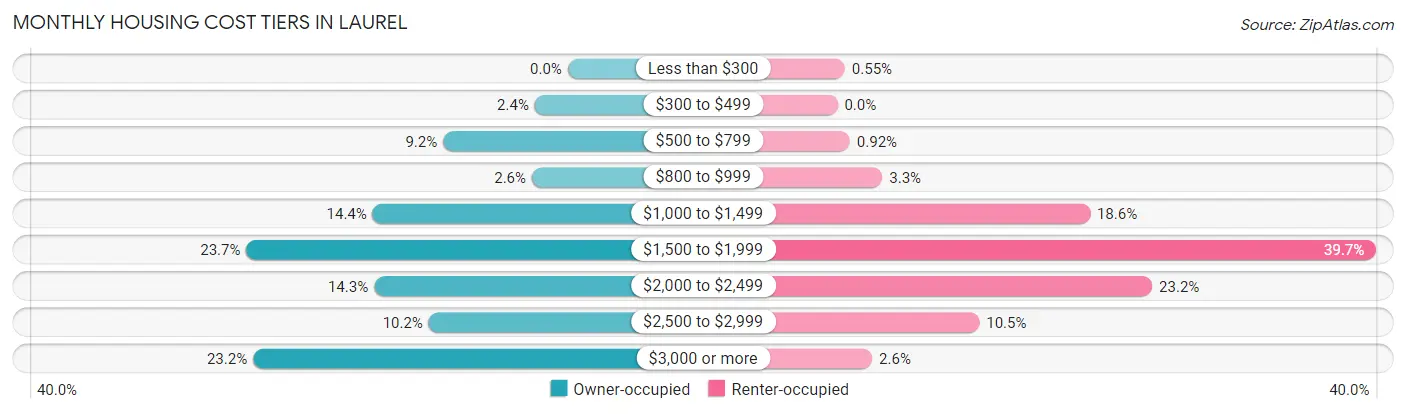
| Monthly Cost | Owner-occupied | Renter-occupied |
| Less than $300 | 0 (0.0%) | 35 (0.5%) |
| $300 to $499 | 124 (2.4%) | 0 (0.0%) |
| $500 to $799 | 469 (9.2%) | 59 (0.9%) |
| $800 to $999 | 135 (2.6%) | 212 (3.3%) |
| $1,000 to $1,499 | 734 (14.4%) | 1,192 (18.6%) |
| $1,500 to $1,999 | 1,209 (23.7%) | 2,543 (39.7%) |
| $2,000 to $2,499 | 729 (14.3%) | 1,486 (23.2%) |
| $2,500 to $2,999 | 523 (10.2%) | 670 (10.4%) |
| $3,000 or more | 1,184 (23.2%) | 164 (2.6%) |
| Total | 5,107 (100.0%) | 6,410 (100.0%) |
Physical Housing Characteristics in Laurel
Housing Structures in Laurel
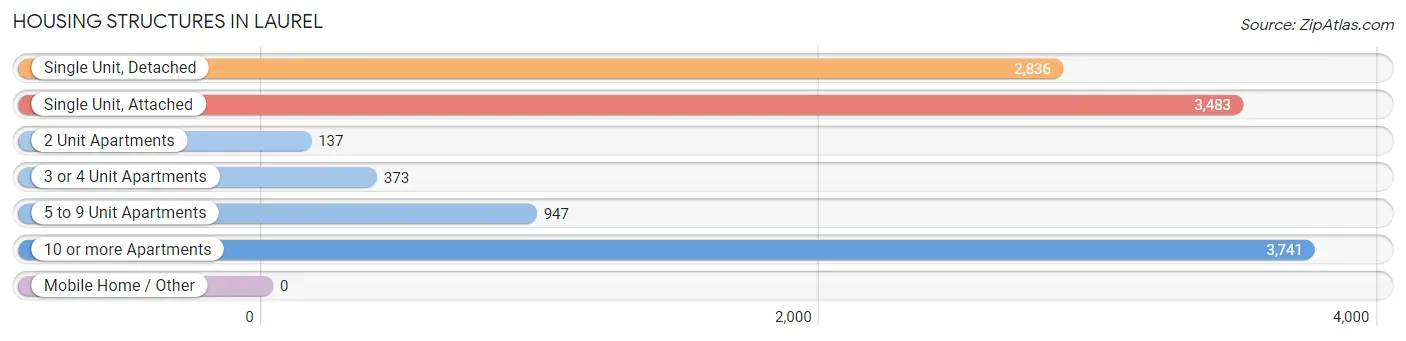
| Structure Type | # Housing Units | % Housing Units |
| Single Unit, Detached | 2,836 | 24.6% |
| Single Unit, Attached | 3,483 | 30.2% |
| 2 Unit Apartments | 137 | 1.2% |
| 3 or 4 Unit Apartments | 373 | 3.2% |
| 5 to 9 Unit Apartments | 947 | 8.2% |
| 10 or more Apartments | 3,741 | 32.5% |
| Mobile Home / Other | 0 | 0.0% |
| Total | 11,517 | 100.0% |
Housing Structures by Occupancy in Laurel
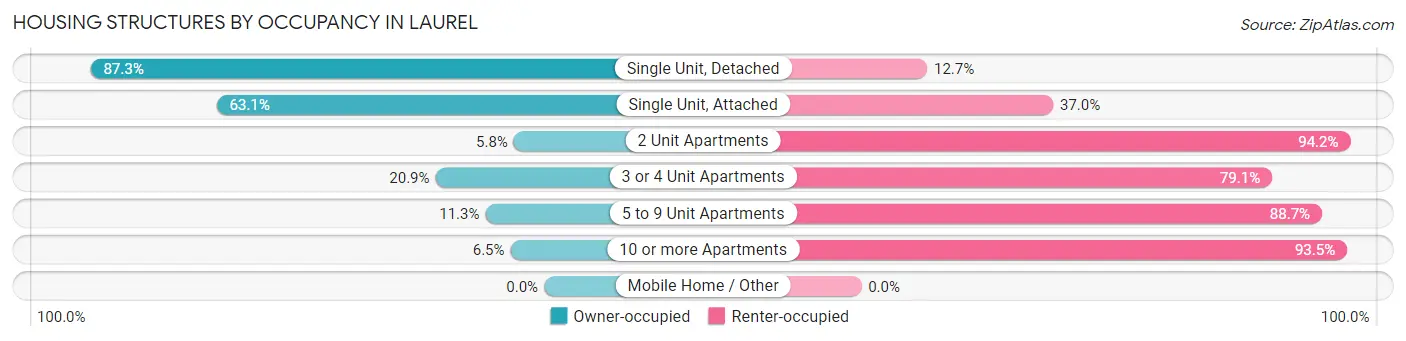
| Structure Type | Owner-occupied | Renter-occupied |
| Single Unit, Detached | 2,476 (87.3%) | 360 (12.7%) |
| Single Unit, Attached | 2,196 (63.0%) | 1,287 (36.9%) |
| 2 Unit Apartments | 8 (5.8%) | 129 (94.2%) |
| 3 or 4 Unit Apartments | 78 (20.9%) | 295 (79.1%) |
| 5 to 9 Unit Apartments | 107 (11.3%) | 840 (88.7%) |
| 10 or more Apartments | 242 (6.5%) | 3,499 (93.5%) |
| Mobile Home / Other | 0 (0.0%) | 0 (0.0%) |
| Total | 5,107 (44.3%) | 6,410 (55.7%) |
Housing Structures by Number of Rooms in Laurel
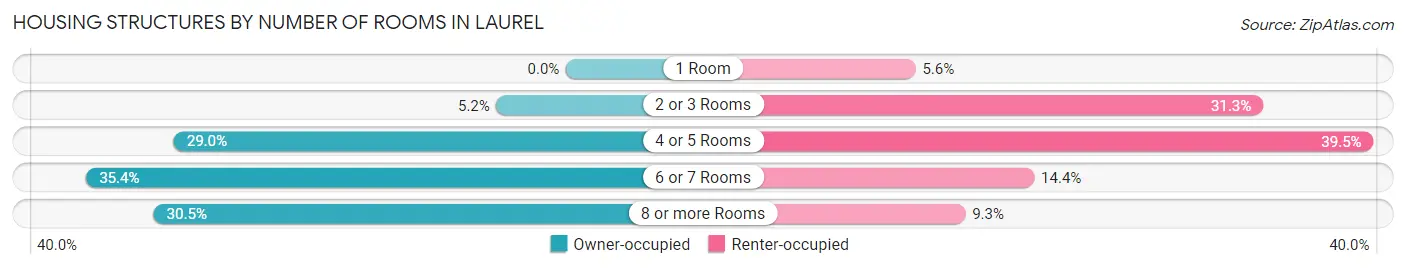
| Number of Rooms | Owner-occupied | Renter-occupied |
| 1 Room | 0 (0.0%) | 358 (5.6%) |
| 2 or 3 Rooms | 263 (5.1%) | 2,007 (31.3%) |
| 4 or 5 Rooms | 1,479 (29.0%) | 2,530 (39.5%) |
| 6 or 7 Rooms | 1,810 (35.4%) | 921 (14.4%) |
| 8 or more Rooms | 1,555 (30.4%) | 594 (9.3%) |
| Total | 5,107 (100.0%) | 6,410 (100.0%) |
Housing Structure by Heating Type in Laurel
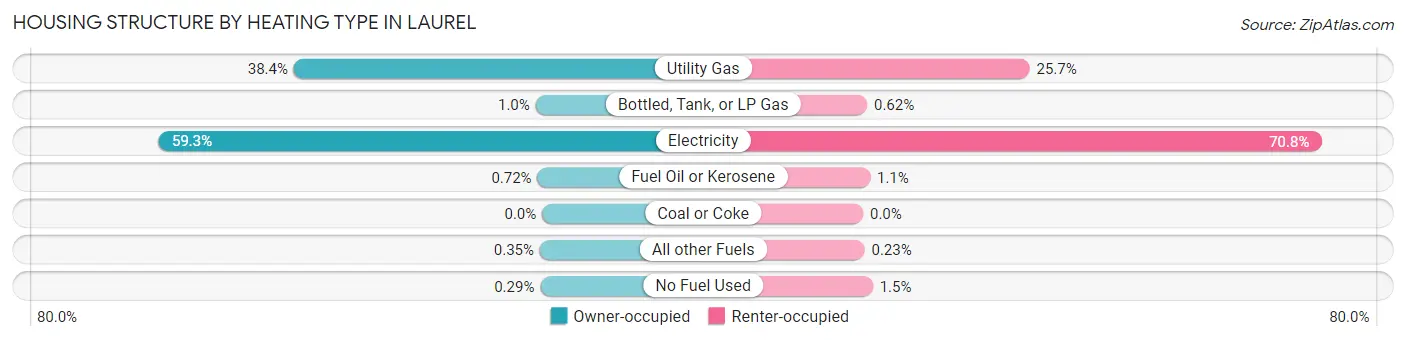
| Heating Type | Owner-occupied | Renter-occupied |
| Utility Gas | 1,960 (38.4%) | 1,650 (25.7%) |
| Bottled, Tank, or LP Gas | 51 (1.0%) | 40 (0.6%) |
| Electricity | 3,026 (59.3%) | 4,540 (70.8%) |
| Fuel Oil or Kerosene | 37 (0.7%) | 69 (1.1%) |
| Coal or Coke | 0 (0.0%) | 0 (0.0%) |
| All other Fuels | 18 (0.4%) | 15 (0.2%) |
| No Fuel Used | 15 (0.3%) | 96 (1.5%) |
| Total | 5,107 (100.0%) | 6,410 (100.0%) |
Household Vehicle Usage in Laurel
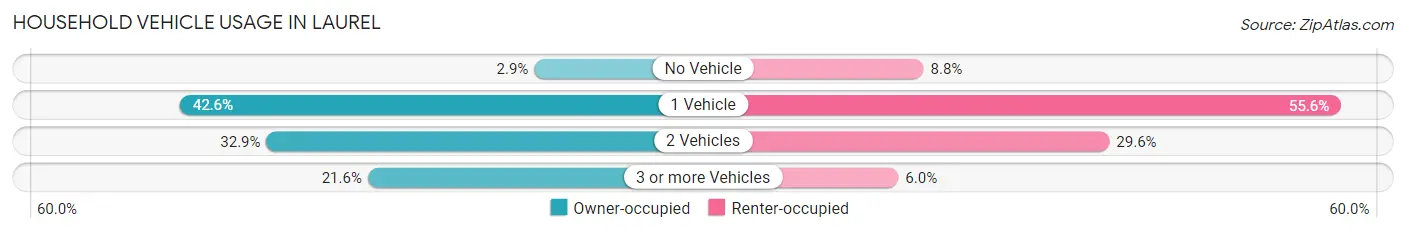
| Vehicles per Household | Owner-occupied | Renter-occupied |
| No Vehicle | 149 (2.9%) | 565 (8.8%) |
| 1 Vehicle | 2,176 (42.6%) | 3,562 (55.6%) |
| 2 Vehicles | 1,681 (32.9%) | 1,899 (29.6%) |
| 3 or more Vehicles | 1,101 (21.6%) | 384 (6.0%) |
| Total | 5,107 (100.0%) | 6,410 (100.0%) |
Real Estate & Mortgages in Laurel
Real Estate and Mortgage Overview in Laurel
| Characteristic | Without Mortgage | With Mortgage |
| Housing Units | 893 | 4,214 |
| Median Property Value | $352,700 | $354,900 |
| Median Household Income | $104,141 | $1,537 |
| Monthly Housing Costs | $691 | $1,166 |
| Real Estate Taxes | $4,562 | $156 |
Property Value by Mortgage Status in Laurel
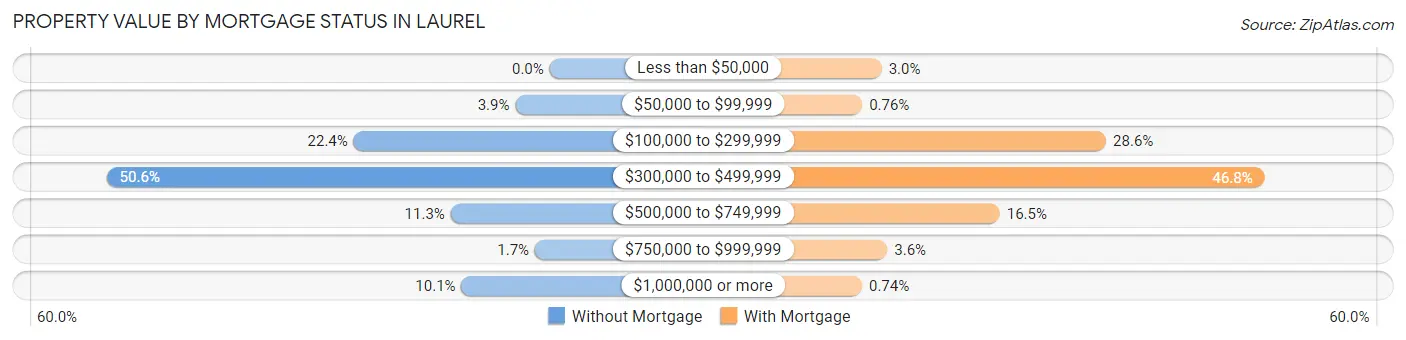
| Property Value | Without Mortgage | With Mortgage |
| Less than $50,000 | 0 (0.0%) | 126 (3.0%) |
| $50,000 to $99,999 | 35 (3.9%) | 32 (0.8%) |
| $100,000 to $299,999 | 200 (22.4%) | 1,207 (28.6%) |
| $300,000 to $499,999 | 452 (50.6%) | 1,970 (46.8%) |
| $500,000 to $749,999 | 101 (11.3%) | 695 (16.5%) |
| $750,000 to $999,999 | 15 (1.7%) | 153 (3.6%) |
| $1,000,000 or more | 90 (10.1%) | 31 (0.7%) |
| Total | 893 (100.0%) | 4,214 (100.0%) |
Household Income by Mortgage Status in Laurel
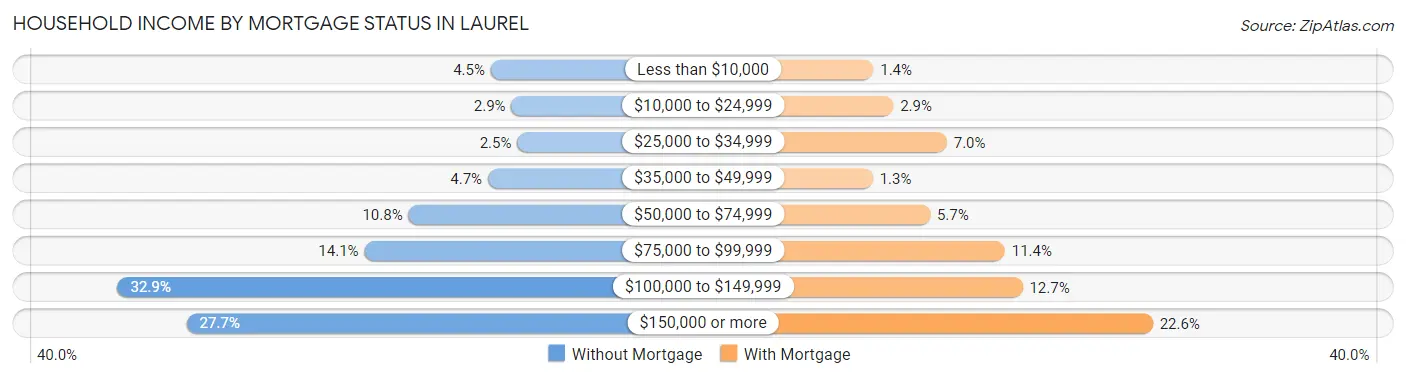
| Household Income | Without Mortgage | With Mortgage |
| Less than $10,000 | 40 (4.5%) | 57 (1.3%) |
| $10,000 to $24,999 | 26 (2.9%) | 121 (2.9%) |
| $25,000 to $34,999 | 22 (2.5%) | 293 (7.0%) |
| $35,000 to $49,999 | 42 (4.7%) | 55 (1.3%) |
| $50,000 to $74,999 | 96 (10.7%) | 239 (5.7%) |
| $75,000 to $99,999 | 126 (14.1%) | 479 (11.4%) |
| $100,000 to $149,999 | 294 (32.9%) | 536 (12.7%) |
| $150,000 or more | 247 (27.7%) | 954 (22.6%) |
| Total | 893 (100.0%) | 4,214 (100.0%) |
Property Value to Household Income Ratio in Laurel
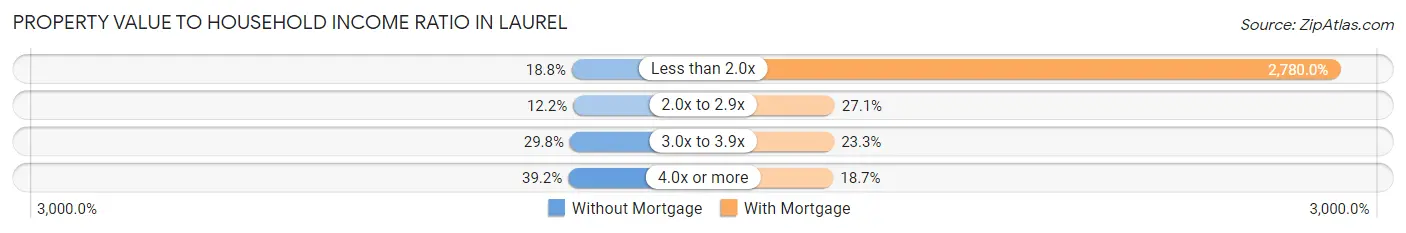
| Value-to-Income Ratio | Without Mortgage | With Mortgage |
| Less than 2.0x | 168 (18.8%) | 117,149 (2,780.0%) |
| 2.0x to 2.9x | 109 (12.2%) | 1,143 (27.1%) |
| 3.0x to 3.9x | 266 (29.8%) | 982 (23.3%) |
| 4.0x or more | 350 (39.2%) | 788 (18.7%) |
| Total | 893 (100.0%) | 4,214 (100.0%) |
Real Estate Taxes by Mortgage Status in Laurel
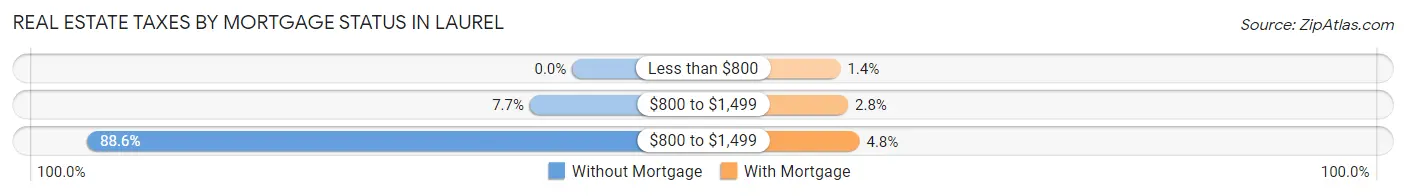
| Property Taxes | Without Mortgage | With Mortgage |
| Less than $800 | 0 (0.0%) | 57 (1.3%) |
| $800 to $1,499 | 69 (7.7%) | 116 (2.8%) |
| $800 to $1,499 | 791 (88.6%) | 204 (4.8%) |
| Total | 893 (100.0%) | 4,214 (100.0%) |
Health & Disability in Laurel
Health Insurance Coverage by Age in Laurel
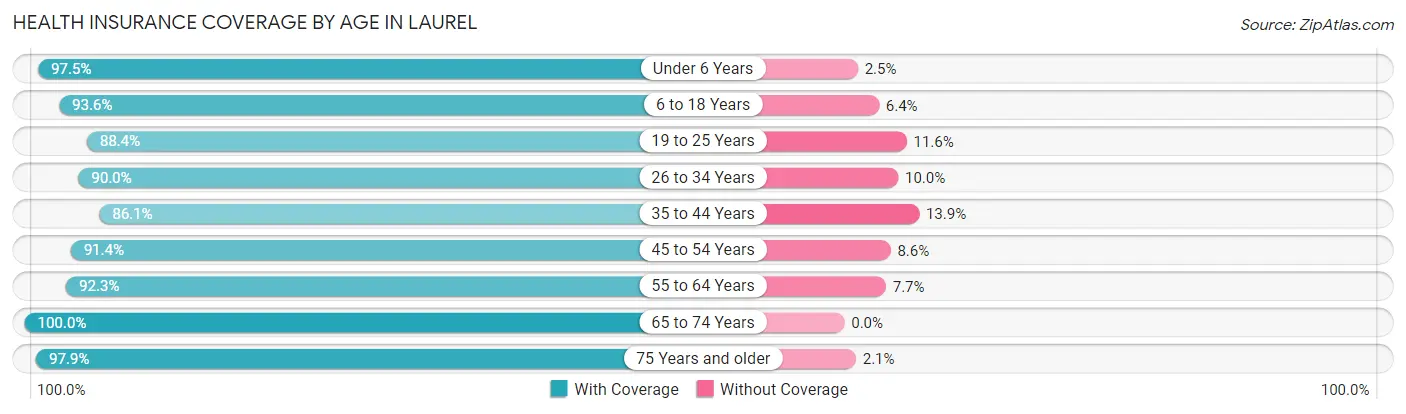
| Age Bracket | With Coverage | Without Coverage |
| Under 6 Years | 2,343 (97.5%) | 60 (2.5%) |
| 6 to 18 Years | 4,563 (93.6%) | 314 (6.4%) |
| 19 to 25 Years | 2,207 (88.4%) | 290 (11.6%) |
| 26 to 34 Years | 3,910 (90.0%) | 436 (10.0%) |
| 35 to 44 Years | 3,788 (86.1%) | 613 (13.9%) |
| 45 to 54 Years | 3,916 (91.4%) | 369 (8.6%) |
| 55 to 64 Years | 2,934 (92.3%) | 246 (7.7%) |
| 65 to 74 Years | 2,070 (100.0%) | 0 (0.0%) |
| 75 Years and older | 1,098 (97.9%) | 24 (2.1%) |
| Total | 26,829 (91.9%) | 2,352 (8.1%) |
Health Insurance Coverage by Citizenship Status in Laurel
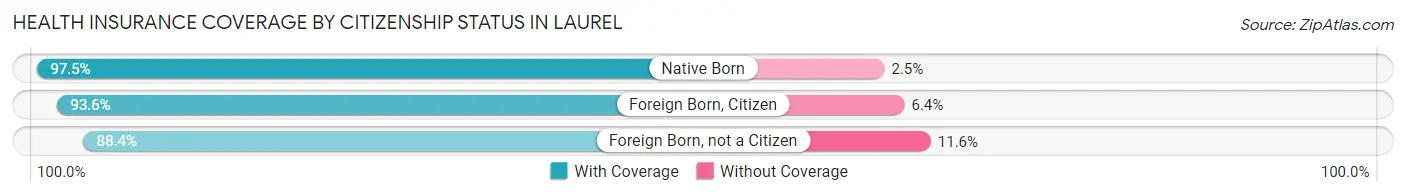
| Citizenship Status | With Coverage | Without Coverage |
| Native Born | 2,343 (97.5%) | 60 (2.5%) |
| Foreign Born, Citizen | 4,563 (93.6%) | 314 (6.4%) |
| Foreign Born, not a Citizen | 2,207 (88.4%) | 290 (11.6%) |
Health Insurance Coverage by Household Income in Laurel
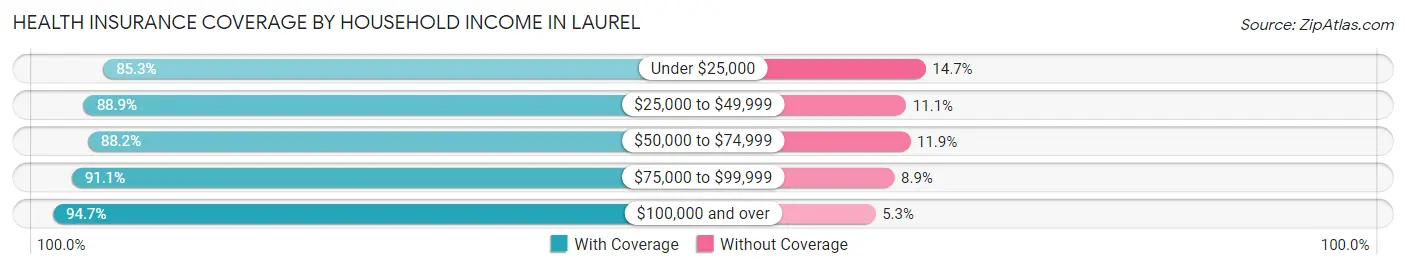
| Household Income | With Coverage | Without Coverage |
| Under $25,000 | 1,927 (85.3%) | 333 (14.7%) |
| $25,000 to $49,999 | 2,946 (88.9%) | 367 (11.1%) |
| $50,000 to $74,999 | 3,252 (88.1%) | 437 (11.8%) |
| $75,000 to $99,999 | 4,023 (91.1%) | 391 (8.9%) |
| $100,000 and over | 14,638 (94.7%) | 824 (5.3%) |
Public vs Private Health Insurance Coverage by Age in Laurel
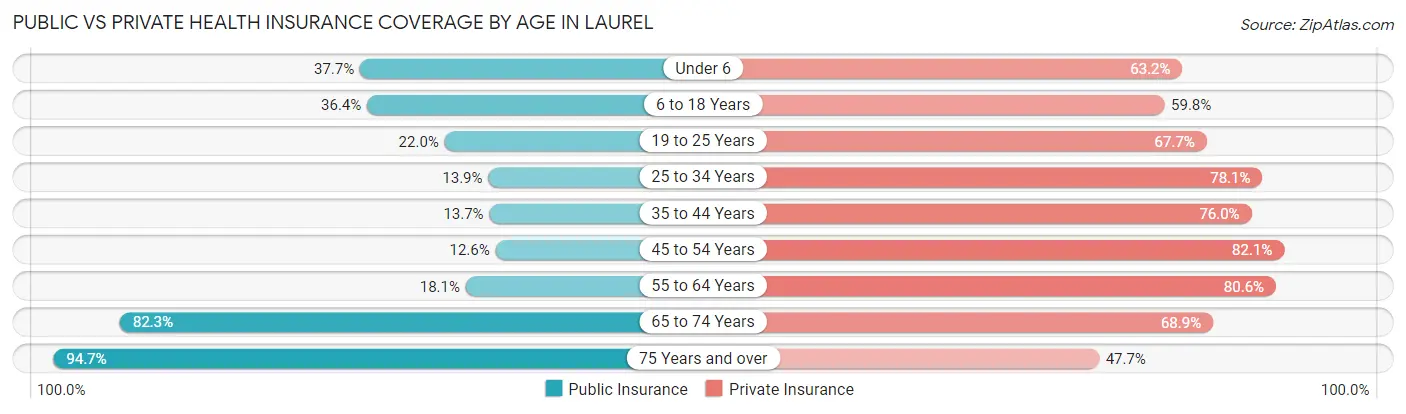
| Age Bracket | Public Insurance | Private Insurance |
| Under 6 | 907 (37.7%) | 1,519 (63.2%) |
| 6 to 18 Years | 1,776 (36.4%) | 2,918 (59.8%) |
| 19 to 25 Years | 550 (22.0%) | 1,691 (67.7%) |
| 25 to 34 Years | 605 (13.9%) | 3,392 (78.0%) |
| 35 to 44 Years | 604 (13.7%) | 3,346 (76.0%) |
| 45 to 54 Years | 539 (12.6%) | 3,518 (82.1%) |
| 55 to 64 Years | 576 (18.1%) | 2,562 (80.6%) |
| 65 to 74 Years | 1,704 (82.3%) | 1,426 (68.9%) |
| 75 Years and over | 1,062 (94.7%) | 535 (47.7%) |
| Total | 8,323 (28.5%) | 20,907 (71.7%) |
Disability Status by Sex by Age in Laurel
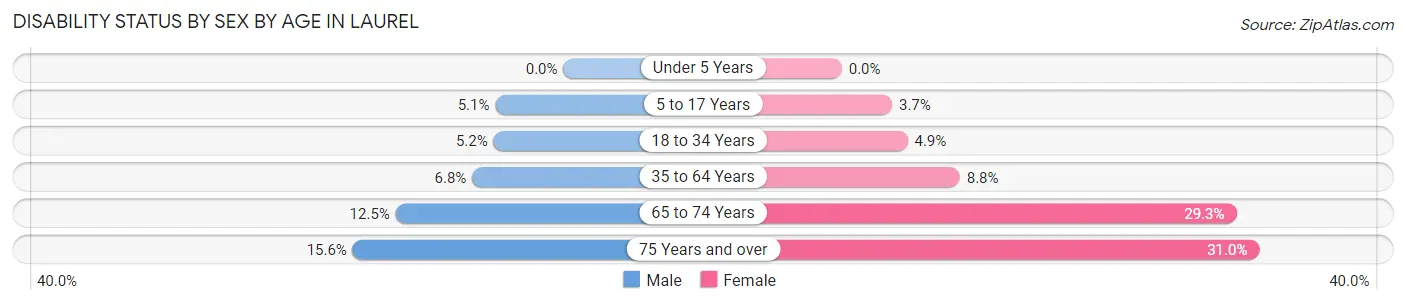
| Age Bracket | Male | Female |
| Under 5 Years | 0 (0.0%) | 0 (0.0%) |
| 5 to 17 Years | 105 (5.1%) | 106 (3.7%) |
| 18 to 34 Years | 169 (5.2%) | 188 (4.9%) |
| 35 to 64 Years | 363 (6.8%) | 570 (8.8%) |
| 65 to 74 Years | 117 (12.4%) | 331 (29.3%) |
| 75 Years and over | 71 (15.6%) | 207 (31.0%) |
Disability Class by Sex by Age in Laurel
Disability Class: Hearing Difficulty
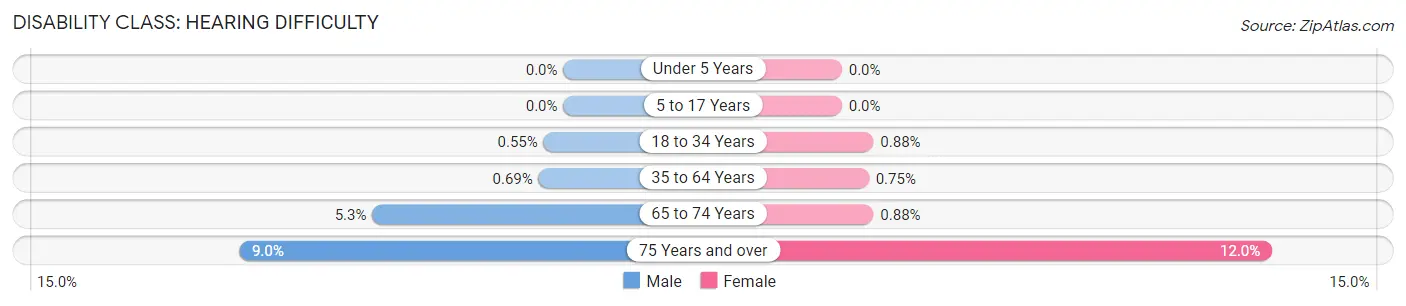
| Age Bracket | Male | Female |
| Under 5 Years | 0 (0.0%) | 0 (0.0%) |
| 5 to 17 Years | 0 (0.0%) | 0 (0.0%) |
| 18 to 34 Years | 18 (0.5%) | 34 (0.9%) |
| 35 to 64 Years | 37 (0.7%) | 49 (0.7%) |
| 65 to 74 Years | 50 (5.3%) | 10 (0.9%) |
| 75 Years and over | 41 (9.0%) | 80 (12.0%) |
Disability Class: Vision Difficulty
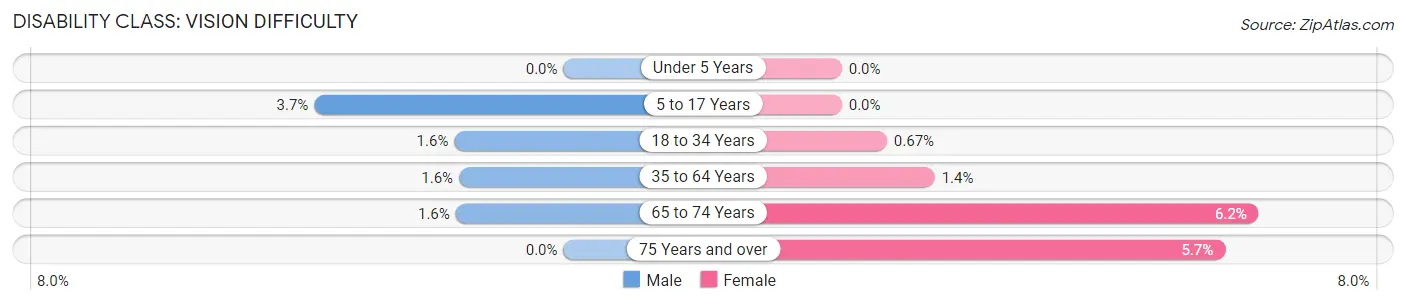
| Age Bracket | Male | Female |
| Under 5 Years | 0 (0.0%) | 0 (0.0%) |
| 5 to 17 Years | 77 (3.7%) | 0 (0.0%) |
| 18 to 34 Years | 53 (1.6%) | 26 (0.7%) |
| 35 to 64 Years | 83 (1.5%) | 90 (1.4%) |
| 65 to 74 Years | 15 (1.6%) | 70 (6.2%) |
| 75 Years and over | 0 (0.0%) | 38 (5.7%) |
Disability Class: Cognitive Difficulty
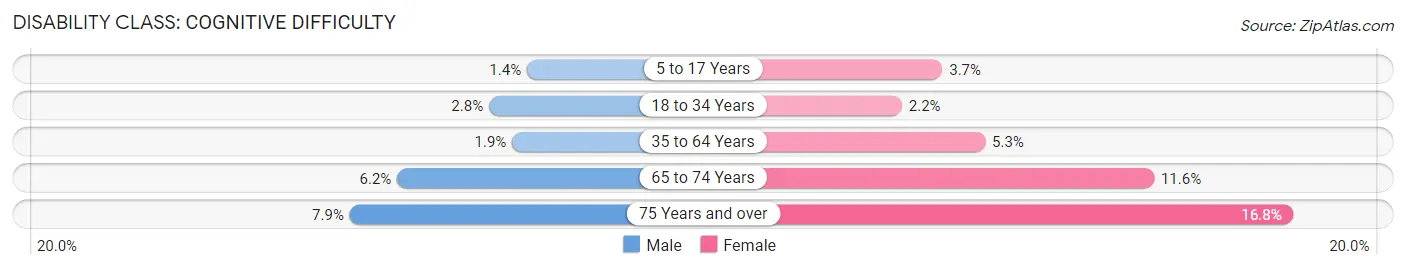
| Age Bracket | Male | Female |
| 5 to 17 Years | 28 (1.3%) | 106 (3.7%) |
| 18 to 34 Years | 90 (2.8%) | 86 (2.2%) |
| 35 to 64 Years | 102 (1.9%) | 346 (5.3%) |
| 65 to 74 Years | 58 (6.2%) | 131 (11.6%) |
| 75 Years and over | 36 (7.9%) | 112 (16.8%) |
Disability Class: Ambulatory Difficulty
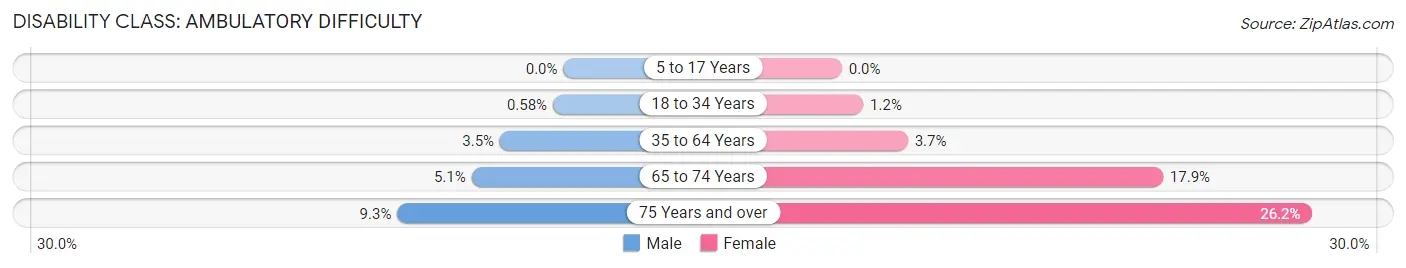
| Age Bracket | Male | Female |
| 5 to 17 Years | 0 (0.0%) | 0 (0.0%) |
| 18 to 34 Years | 19 (0.6%) | 46 (1.2%) |
| 35 to 64 Years | 189 (3.5%) | 239 (3.7%) |
| 65 to 74 Years | 48 (5.1%) | 202 (17.9%) |
| 75 Years and over | 42 (9.2%) | 175 (26.2%) |
Disability Class: Self-Care Difficulty
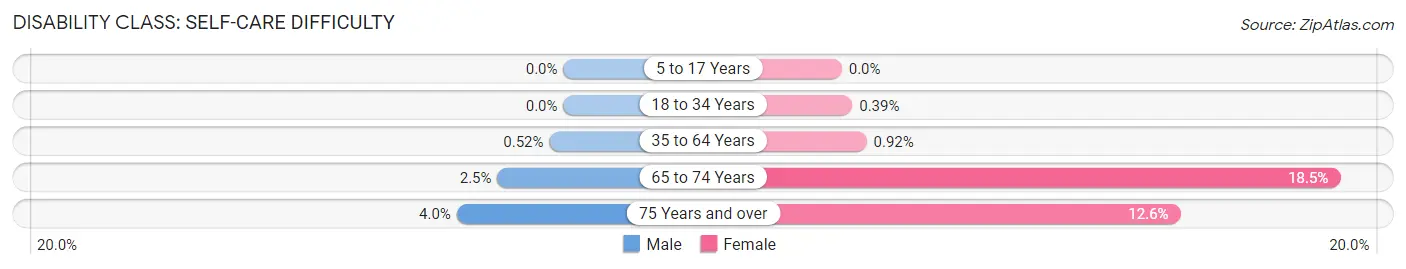
| Age Bracket | Male | Female |
| 5 to 17 Years | 0 (0.0%) | 0 (0.0%) |
| 18 to 34 Years | 0 (0.0%) | 15 (0.4%) |
| 35 to 64 Years | 28 (0.5%) | 60 (0.9%) |
| 65 to 74 Years | 23 (2.5%) | 209 (18.5%) |
| 75 Years and over | 18 (4.0%) | 84 (12.6%) |
Technology Access in Laurel
Computing Device Access in Laurel
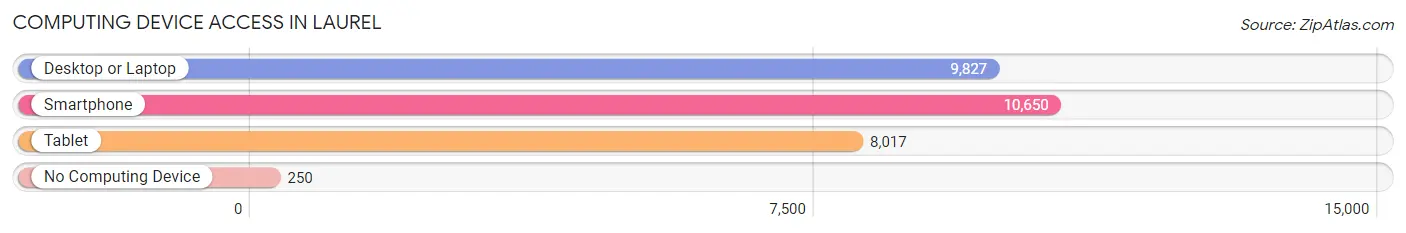
| Device Type | # Households | % Households |
| Desktop or Laptop | 9,827 | 85.3% |
| Smartphone | 10,650 | 92.5% |
| Tablet | 8,017 | 69.6% |
| No Computing Device | 250 | 2.2% |
| Total | 11,517 | 100.0% |
Internet Access in Laurel
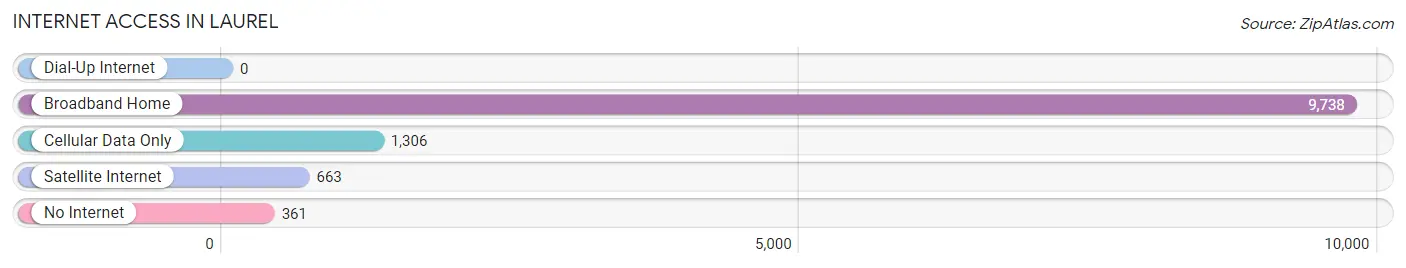
| Internet Type | # Households | % Households |
| Dial-Up Internet | 0 | 0.0% |
| Broadband Home | 9,738 | 84.6% |
| Cellular Data Only | 1,306 | 11.3% |
| Satellite Internet | 663 | 5.8% |
| No Internet | 361 | 3.1% |
| Total | 11,517 | 100.0% |
Laurel Summary
Laurel, Maryland is a city located in Prince George’s County, Maryland, United States. It is situated in the central part of the county, between Washington, D.C. and Baltimore. The city is located along the Patuxent River, and is a part of the Baltimore-Washington metropolitan area. As of the 2010 census, the population of Laurel was 25,115.
History
The area that is now Laurel was first settled in the early 1700s by English settlers. The town was originally known as “Laurel Town” and was incorporated in 1870. The town was named after the laurel trees that grew in the area.
In the late 1800s, the town began to grow rapidly due to the development of the Baltimore and Ohio Railroad. The railroad provided easy access to Washington, D.C. and Baltimore, and the town became a popular destination for commuters.
In the early 1900s, the town was home to several large industries, including a paper mill, a cannery, and a brickyard. The town also had a thriving agricultural industry, with many farms in the area.
In the 1950s, the town began to experience a population boom due to the growth of the Washington, D.C. suburbs. The population of Laurel increased from 4,000 in 1950 to 25,115 in 2010.
Geography
Laurel is located in central Prince George’s County, Maryland. It is situated along the Patuxent River, and is bordered by the cities of Beltsville, Burtonsville, and Columbia. The city has a total area of 8.3 square miles, of which 8.2 square miles is land and 0.1 square miles is water.
The city has a humid subtropical climate, with hot, humid summers and mild winters. The average annual temperature is 57.2°F, and the average annual precipitation is 43.3 inches.
Economy
The economy of Laurel is largely based on the service industry. The city is home to several large employers, including the Johns Hopkins Applied Physics Laboratory, the National Security Agency, and the U.S. Department of Agriculture.
The city also has a thriving retail sector, with several shopping centers and malls in the area. The city is also home to several large corporate headquarters, including the headquarters of the Giant Food grocery store chain.
Demographics
As of the 2010 census, the population of Laurel was 25,115. The racial makeup of the city was 54.3% White, 28.2% African American, 0.4% Native American, 8.3% Asian, 0.1% Pacific Islander, and 4.7% from other races. Hispanic or Latino of any race were 11.3% of the population.
The median household income in Laurel was $68,945, and the median family income was $77,845. The per capita income was $30,945. About 8.3% of the population was below the poverty line.
Common Questions
What is Per Capita Income in Laurel?
Per Capita income in Laurel is $45,887.
What is the Median Family Income in Laurel?
Median Family Income in Laurel is $111,250.
What is the Median Household income in Laurel?
Median Household Income in Laurel is $92,035.
What is Income or Wage Gap in Laurel?
Income or Wage Gap in Laurel is 6.7%.
Women in Laurel earn 93.3 cents for every dollar earned by a man.
What is Inequality or Gini Index in Laurel?
Inequality or Gini Index in Laurel is 0.41.
What is the Total Population of Laurel?
Total Population of Laurel is 29,581.
What is the Total Male Population of Laurel?
Total Male Population of Laurel is 13,459.
What is the Total Female Population of Laurel?
Total Female Population of Laurel is 16,122.
What is the Ratio of Males per 100 Females in Laurel?
There are 83.48 Males per 100 Females in Laurel.
What is the Ratio of Females per 100 Males in Laurel?
There are 119.79 Females per 100 Males in Laurel.
What is the Median Population Age in Laurel?
Median Population Age in Laurel is 36.4 Years.
What is the Average Family Size in Laurel
Average Family Size in Laurel is 3.5 People.
What is the Average Household Size in Laurel
Average Household Size in Laurel is 2.5 People.
How Large is the Labor Force in Laurel?
There are 17,745 People in the Labor Forcein in Laurel.
What is the Percentage of People in the Labor Force in Laurel?
76.8% of People are in the Labor Force in Laurel.
What is the Unemployment Rate in Laurel?
Unemployment Rate in Laurel is 5.9%.