Scituate, MA Map & Demographics
Scituate Map
Scituate Overview
$79,010
PER CAPITA INCOME
$135,217
AVG FAMILY INCOME
$108,194
AVG HOUSEHOLD INCOME
50.5%
WAGE / INCOME GAP [ % ]
49.5¢/ $1
WAGE / INCOME GAP [ $ ]
0.52
INEQUALITY / GINI INDEX
5,442
TOTAL POPULATION
2,108
MALE POPULATION
3,334
FEMALE POPULATION
63.23
MALES / 100 FEMALES
158.16
FEMALES / 100 MALES
52.0
MEDIAN AGE
2.8
AVG FAMILY SIZE
2.2
AVG HOUSEHOLD SIZE
2,517
LABOR FORCE [ PEOPLE ]
55.4%
PERCENT IN LABOR FORCE
2.1%
UNEMPLOYMENT RATE
Scituate Zip Codes
Income in Scituate
Income Overview in Scituate
Per Capita Income in Scituate is $79,010, while median incomes of families and households are $135,217 and $108,194 respectively.
| Characteristic | Number | Measure |
| Per Capita Income | 5,442 | $79,010 |
| Median Family Income | 1,511 | $135,217 |
| Mean Family Income | 1,511 | $192,545 |
| Median Household Income | 2,481 | $108,194 |
| Mean Household Income | 2,481 | $174,724 |
| Income Deficit | 1,511 | $0 |
| Wage / Income Gap (%) | 5,442 | 50.47% |
| Wage / Income Gap ($) | 5,442 | 49.53¢ per $1 |
| Gini / Inequality Index | 5,442 | 0.52 |
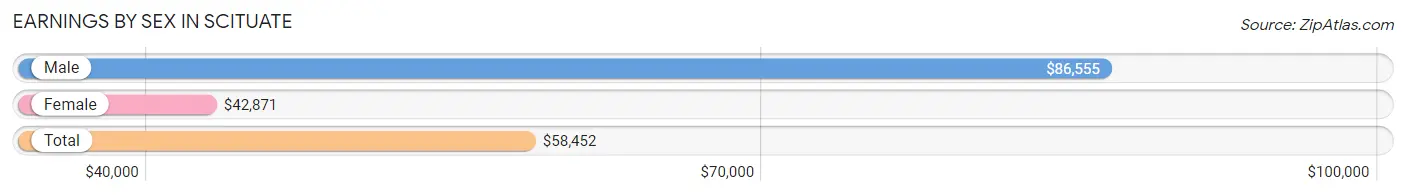
Earnings by Sex in Scituate
Average Earnings in Scituate are $58,452, $86,555 for men and $42,871 for women, a difference of 50.5%.
| Sex | Number | Average Earnings |
| Male | 1,269 (45.4%) | $86,555 |
| Female | 1,527 (54.6%) | $42,871 |
| Total | 2,796 (100.0%) | $58,452 |
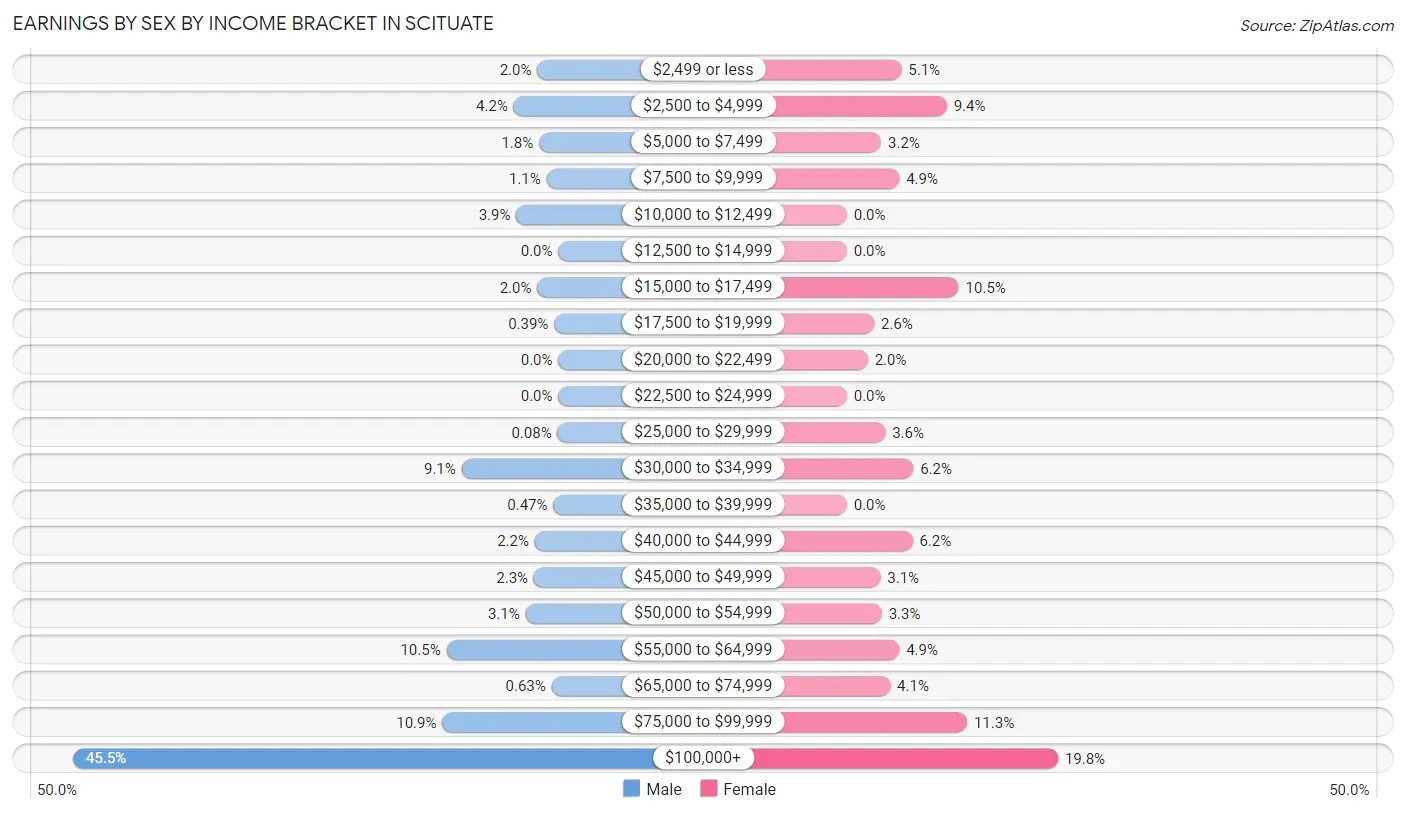
Earnings by Sex by Income Bracket in Scituate
The most common earnings brackets in Scituate are $100,000+ for men (577 | 45.5%) and $100,000+ for women (302 | 19.8%).
| Income | Male | Female |
| $2,499 or less | 25 (2.0%) | 78 (5.1%) |
| $2,500 to $4,999 | 53 (4.2%) | 143 (9.4%) |
| $5,000 to $7,499 | 23 (1.8%) | 49 (3.2%) |
| $7,500 to $9,999 | 14 (1.1%) | 75 (4.9%) |
| $10,000 to $12,499 | 50 (3.9%) | 0 (0.0%) |
| $12,500 to $14,999 | 0 (0.0%) | 0 (0.0%) |
| $15,000 to $17,499 | 25 (2.0%) | 160 (10.5%) |
| $17,500 to $19,999 | 5 (0.4%) | 39 (2.5%) |
| $20,000 to $22,499 | 0 (0.0%) | 30 (2.0%) |
| $22,500 to $24,999 | 0 (0.0%) | 0 (0.0%) |
| $25,000 to $29,999 | 1 (0.1%) | 55 (3.6%) |
| $30,000 to $34,999 | 115 (9.1%) | 95 (6.2%) |
| $35,000 to $39,999 | 6 (0.5%) | 0 (0.0%) |
| $40,000 to $44,999 | 28 (2.2%) | 94 (6.2%) |
| $45,000 to $49,999 | 29 (2.3%) | 48 (3.1%) |
| $50,000 to $54,999 | 39 (3.1%) | 50 (3.3%) |
| $55,000 to $64,999 | 133 (10.5%) | 75 (4.9%) |
| $65,000 to $74,999 | 8 (0.6%) | 62 (4.1%) |
| $75,000 to $99,999 | 138 (10.9%) | 172 (11.3%) |
| $100,000+ | 577 (45.5%) | 302 (19.8%) |
| Total | 1,269 (100.0%) | 1,527 (100.0%) |
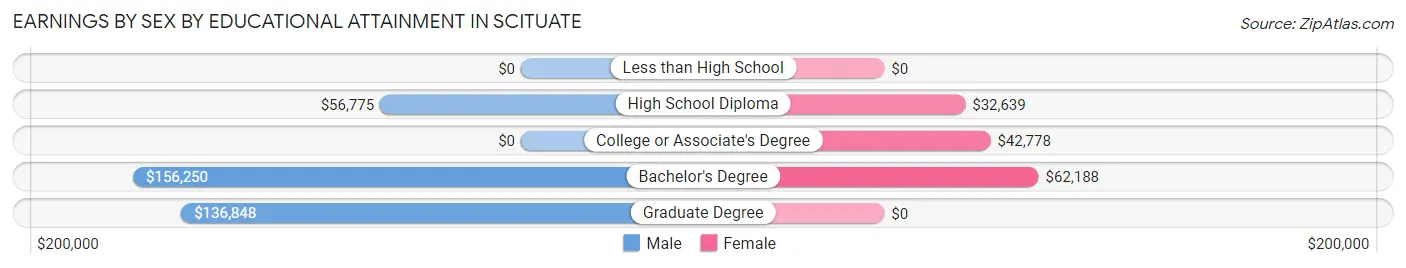
Earnings by Sex by Educational Attainment in Scituate
Average earnings in Scituate are $90,341 for men and $46,279 for women, a difference of 48.8%. Men with an educational attainment of bachelor's degree enjoy the highest average annual earnings of $156,250, while those with high school diploma education earn the least with $56,775. Women with an educational attainment of bachelor's degree earn the most with the average annual earnings of $62,188, while those with high school diploma education have the smallest earnings of $32,639.
| Educational Attainment | Male Income | Female Income |
| Less than High School | - | - |
| High School Diploma | $56,775 | $32,639 |
| College or Associate's Degree | - | - |
| Bachelor's Degree | $156,250 | $62,188 |
| Graduate Degree | $136,848 | $0 |
| Total | $90,341 | $46,279 |
Family Income in Scituate
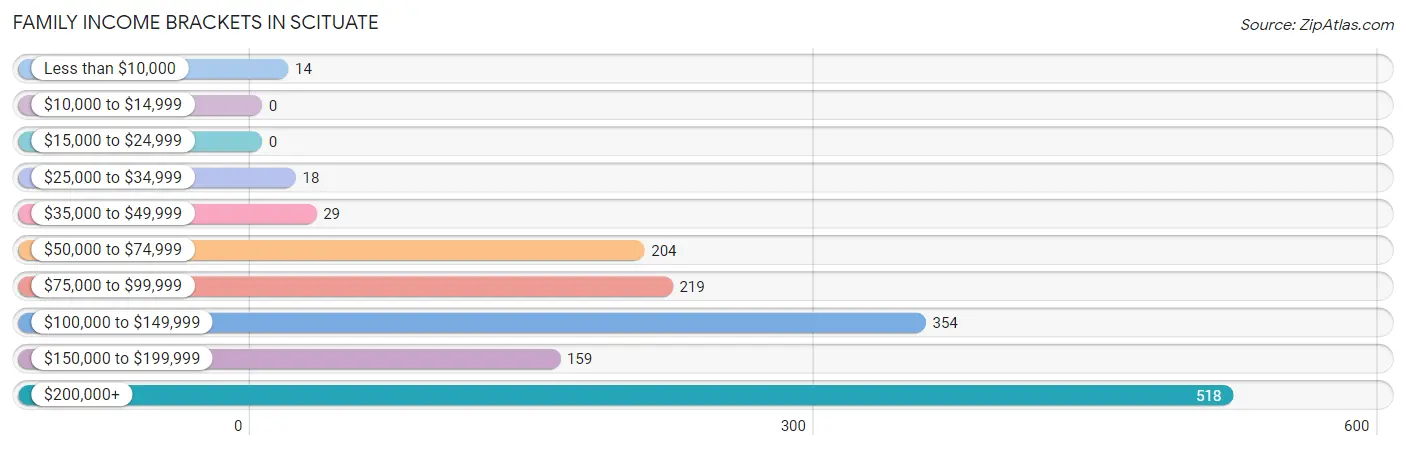
Family Income Brackets in Scituate
According to the Scituate family income data, there are 518 families falling into the $200,000+ income range, which is the most common income bracket and makes up 34.3% of all families.
| Income Bracket | # Families | % Families |
| Less than $10,000 | 14 | 0.9% |
| $10,000 to $14,999 | 0 | 0.0% |
| $15,000 to $24,999 | 0 | 0.0% |
| $25,000 to $34,999 | 18 | 1.2% |
| $35,000 to $49,999 | 29 | 1.9% |
| $50,000 to $74,999 | 204 | 13.5% |
| $75,000 to $99,999 | 219 | 14.5% |
| $100,000 to $149,999 | 354 | 23.4% |
| $150,000 to $199,999 | 159 | 10.5% |
| $200,000+ | 518 | 34.3% |
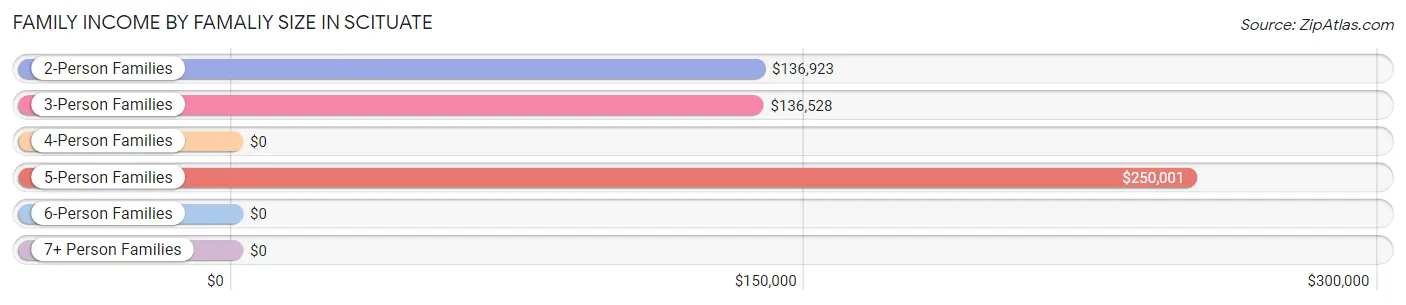
Family Income by Famaliy Size in Scituate
5-person families (106 | 7.0%) account for the highest median family income in Scituate with $250,001 per family, while 2-person families (674 | 44.6%) have the highest median income of $68,462 per family member.
| Income Bracket | # Families | Median Income |
| 2-Person Families | 674 (44.6%) | $136,923 |
| 3-Person Families | 298 (19.7%) | $136,528 |
| 4-Person Families | 385 (25.5%) | $0 |
| 5-Person Families | 106 (7.0%) | $250,001 |
| 6-Person Families | 48 (3.2%) | $0 |
| 7+ Person Families | 0 (0.0%) | $0 |
| Total | 1,511 (100.0%) | $135,217 |
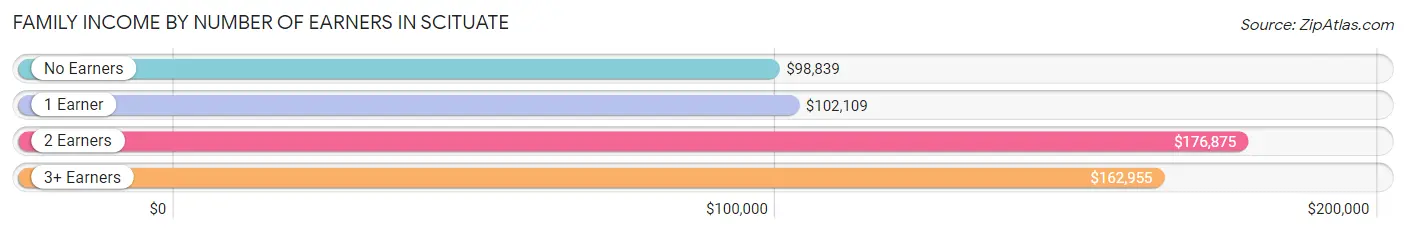
Family Income by Number of Earners in Scituate
The median family income in Scituate is $135,217, with families comprising 2 earners (829) having the highest median family income of $176,875, while families with no earners (231) have the lowest median family income of $98,839, accounting for 54.9% and 15.3% of families, respectively.
| Number of Earners | # Families | Median Income |
| No Earners | 231 (15.3%) | $98,839 |
| 1 Earner | 315 (20.8%) | $102,109 |
| 2 Earners | 829 (54.9%) | $176,875 |
| 3+ Earners | 136 (9.0%) | $162,955 |
| Total | 1,511 (100.0%) | $135,217 |
Household Income in Scituate
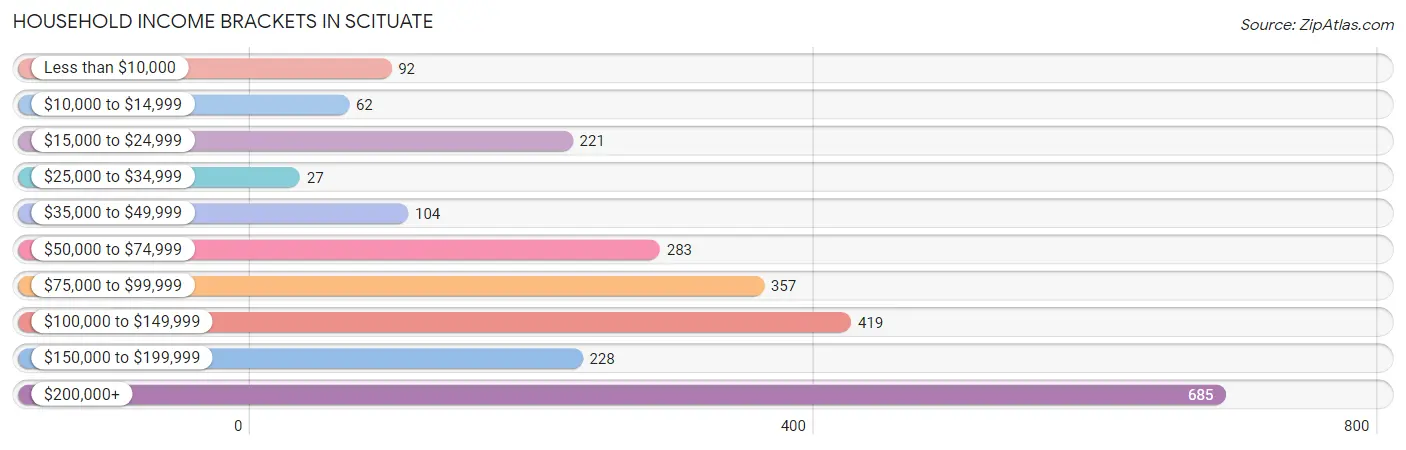
Household Income Brackets in Scituate
With 685 households falling in the category, the $200,000+ income range is the most frequent in Scituate, accounting for 27.6% of all households. In contrast, only 27 households (1.1%) fall into the $25,000 to $34,999 income bracket, making it the least populous group.
| Income Bracket | # Households | % Households |
| Less than $10,000 | 92 | 3.7% |
| $10,000 to $14,999 | 62 | 2.5% |
| $15,000 to $24,999 | 221 | 8.9% |
| $25,000 to $34,999 | 27 | 1.1% |
| $35,000 to $49,999 | 104 | 4.2% |
| $50,000 to $74,999 | 283 | 11.4% |
| $75,000 to $99,999 | 357 | 14.4% |
| $100,000 to $149,999 | 419 | 16.9% |
| $150,000 to $199,999 | 228 | 9.2% |
| $200,000+ | 685 | 27.6% |
Household Income by Householder Age in Scituate
The median household income in Scituate is $108,194, with the highest median household income of $137,614 found in the 45 to 64 years age bracket for the primary householder. A total of 1,021 households (41.1%) fall into this category. Meanwhile, the 15 to 24 years age bracket for the primary householder has the lowest median household income of $0, with 83 households (3.4%) in this group.
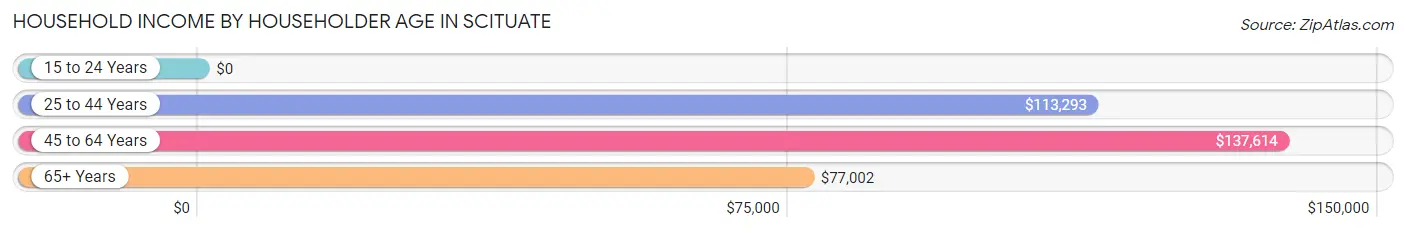
| Income Bracket | # Households | Median Income |
| 15 to 24 Years | 83 (3.4%) | $0 |
| 25 to 44 Years | 366 (14.7%) | $113,293 |
| 45 to 64 Years | 1,021 (41.1%) | $137,614 |
| 65+ Years | 1,011 (40.7%) | $77,002 |
| Total | 2,481 (100.0%) | $108,194 |
Poverty in Scituate
Income Below Poverty by Sex and Age in Scituate
With 1.4% poverty level for males and 5.6% for females among the residents of Scituate, 12 to 14 year old males and 12 to 14 year old females are the most vulnerable to poverty, with 14 males (9.0%) and 13 females (22.0%) in their respective age groups living below the poverty level.
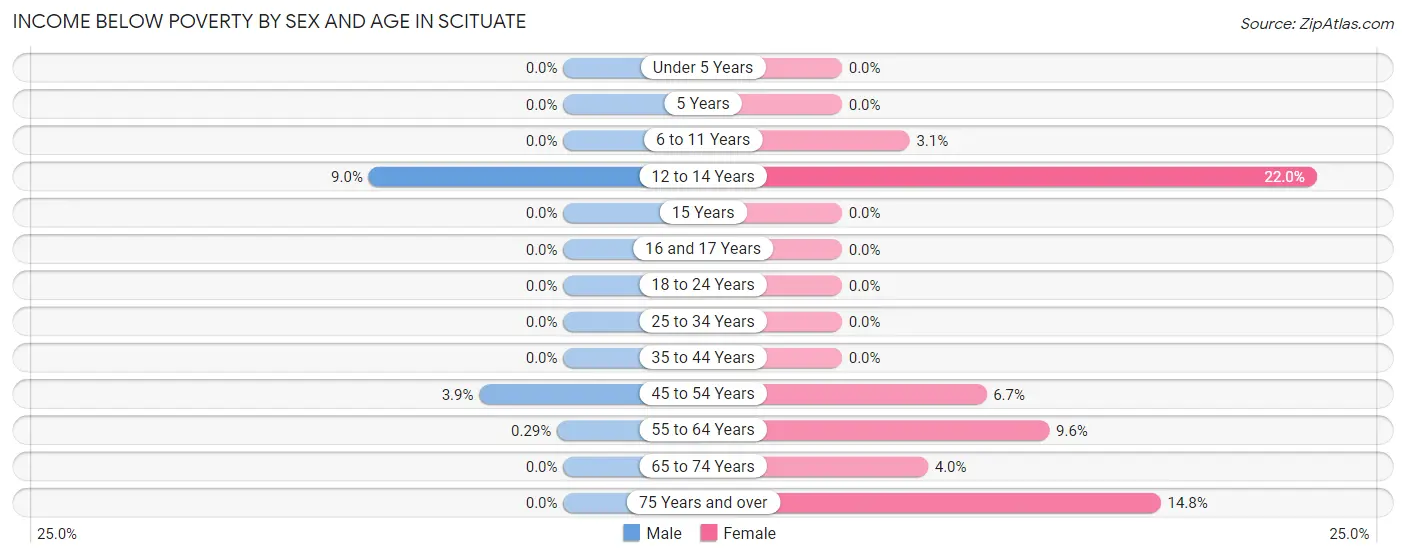
| Age Bracket | Male | Female |
| Under 5 Years | 0 (0.0%) | 0 (0.0%) |
| 5 Years | 0 (0.0%) | 0 (0.0%) |
| 6 to 11 Years | 0 (0.0%) | 13 (3.1%) |
| 12 to 14 Years | 14 (9.0%) | 13 (22.0%) |
| 15 Years | 0 (0.0%) | 0 (0.0%) |
| 16 and 17 Years | 0 (0.0%) | 0 (0.0%) |
| 18 to 24 Years | 0 (0.0%) | 0 (0.0%) |
| 25 to 34 Years | 0 (0.0%) | 0 (0.0%) |
| 35 to 44 Years | 0 (0.0%) | 0 (0.0%) |
| 45 to 54 Years | 14 (3.9%) | 27 (6.7%) |
| 55 to 64 Years | 1 (0.3%) | 56 (9.6%) |
| 65 to 74 Years | 0 (0.0%) | 22 (4.0%) |
| 75 Years and over | 0 (0.0%) | 54 (14.8%) |
| Total | 29 (1.4%) | 185 (5.6%) |
Income Above Poverty by Sex and Age in Scituate
According to the poverty statistics in Scituate, males aged under 5 years and females aged under 5 years are the age groups that are most secure financially, with 100.0% of males and 100.0% of females in these age groups living above the poverty line.
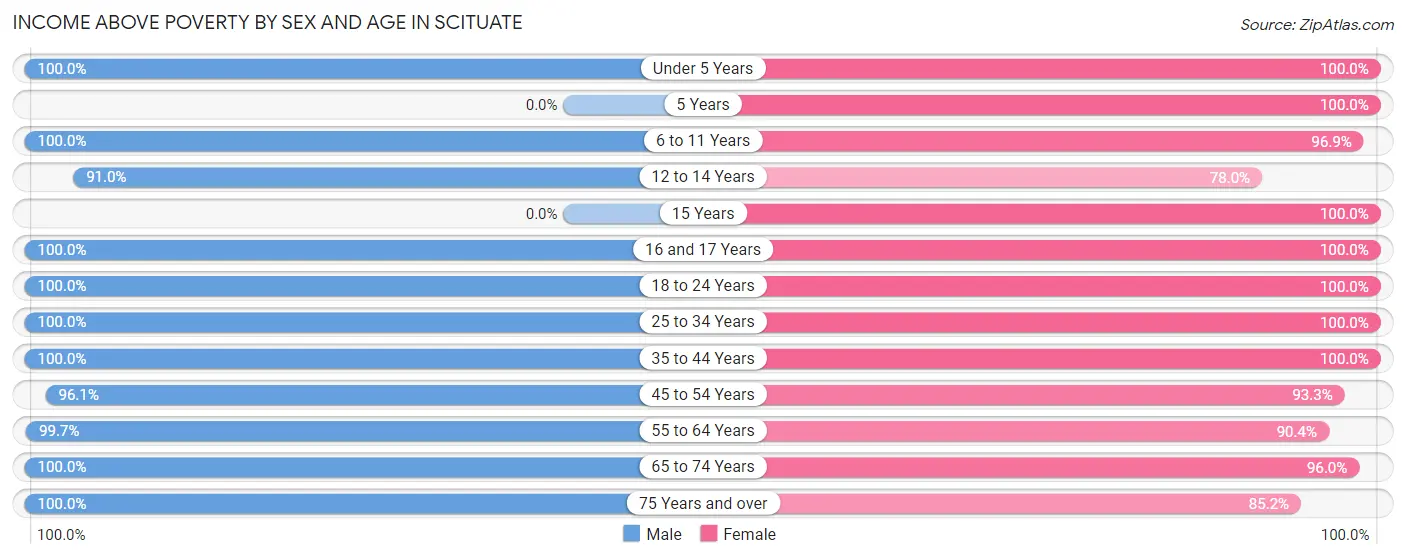
| Age Bracket | Male | Female |
| Under 5 Years | 15 (100.0%) | 6 (100.0%) |
| 5 Years | 0 (0.0%) | 52 (100.0%) |
| 6 to 11 Years | 120 (100.0%) | 401 (96.9%) |
| 12 to 14 Years | 141 (91.0%) | 46 (78.0%) |
| 15 Years | 0 (0.0%) | 61 (100.0%) |
| 16 and 17 Years | 78 (100.0%) | 139 (100.0%) |
| 18 to 24 Years | 84 (100.0%) | 199 (100.0%) |
| 25 to 34 Years | 159 (100.0%) | 185 (100.0%) |
| 35 to 44 Years | 206 (100.0%) | 275 (100.0%) |
| 45 to 54 Years | 345 (96.1%) | 376 (93.3%) |
| 55 to 64 Years | 348 (99.7%) | 526 (90.4%) |
| 65 to 74 Years | 303 (100.0%) | 530 (96.0%) |
| 75 Years and over | 251 (100.0%) | 311 (85.2%) |
| Total | 2,050 (98.6%) | 3,107 (94.4%) |
Income Below Poverty Among Married-Couple Families in Scituate
The poverty statistics for married-couple families in Scituate show that 1.1% or 13 of the total 1,145 families live below the poverty line. Families with 3 or 4 children have the highest poverty rate of 11.4%, comprising of 13 families. On the other hand, families with no children have the lowest poverty rate of 0.0%, which includes 0 families.
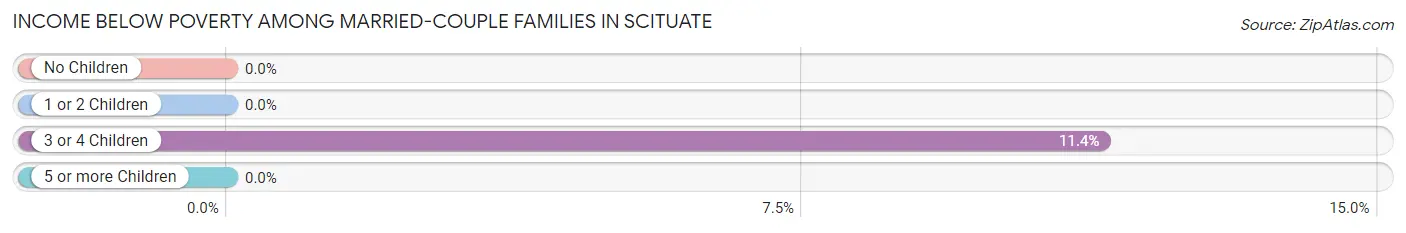
| Children | Above Poverty | Below Poverty |
| No Children | 694 (100.0%) | 0 (0.0%) |
| 1 or 2 Children | 337 (100.0%) | 0 (0.0%) |
| 3 or 4 Children | 101 (88.6%) | 13 (11.4%) |
| 5 or more Children | 0 (0.0%) | 0 (0.0%) |
| Total | 1,132 (98.9%) | 13 (1.1%) |
Income Below Poverty Among Single-Parent Households in Scituate
| Children | Single Father | Single Mother |
| No Children | 0 (0.0%) | 0 (0.0%) |
| 1 or 2 Children | 0 (0.0%) | 0 (0.0%) |
| 3 or 4 Children | 0 (0.0%) | 0 (0.0%) |
| 5 or more Children | 0 (0.0%) | 0 (0.0%) |
| Total | 0 (0.0%) | 0 (0.0%) |
Income Below Poverty Among Married-Couple vs Single-Parent Households in Scituate
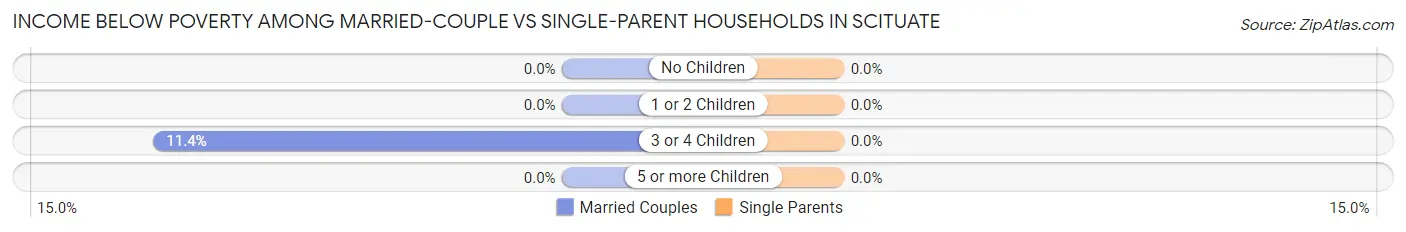
| Children | Married-Couple Families | Single-Parent Households |
| No Children | 0 (0.0%) | 0 (0.0%) |
| 1 or 2 Children | 0 (0.0%) | 0 (0.0%) |
| 3 or 4 Children | 13 (11.4%) | 0 (0.0%) |
| 5 or more Children | 0 (0.0%) | 0 (0.0%) |
| Total | 13 (1.1%) | 0 (0.0%) |
Race in Scituate
The most populous races in Scituate are White / Caucasian (4,599 | 84.5%), Two or more Races (472 | 8.7%), and Some other Race (371 | 6.8%).
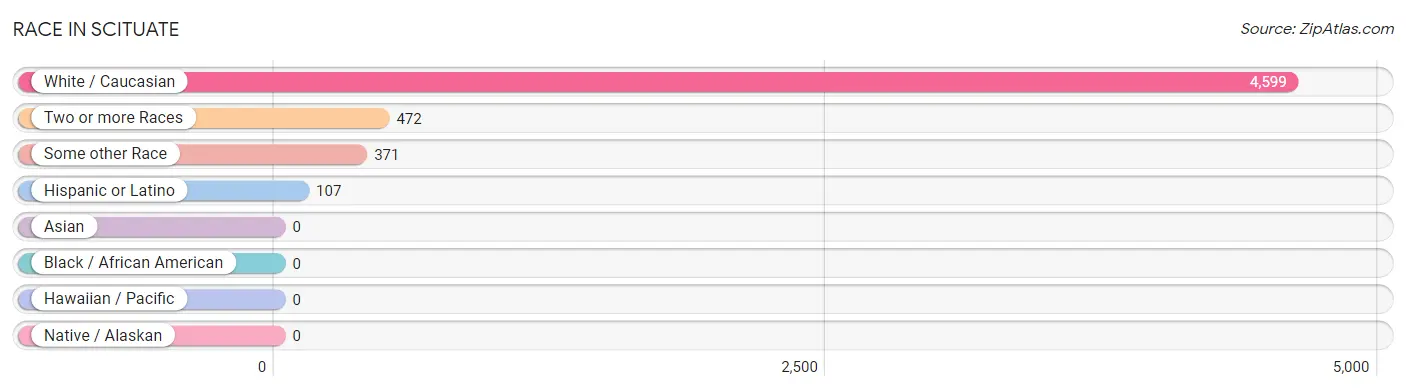
| Race | # Population | % Population |
| Asian | 0 | 0.0% |
| Black / African American | 0 | 0.0% |
| Hawaiian / Pacific | 0 | 0.0% |
| Hispanic or Latino | 107 | 2.0% |
| Native / Alaskan | 0 | 0.0% |
| White / Caucasian | 4,599 | 84.5% |
| Two or more Races | 472 | 8.7% |
| Some other Race | 371 | 6.8% |
| Total | 5,442 | 100.0% |
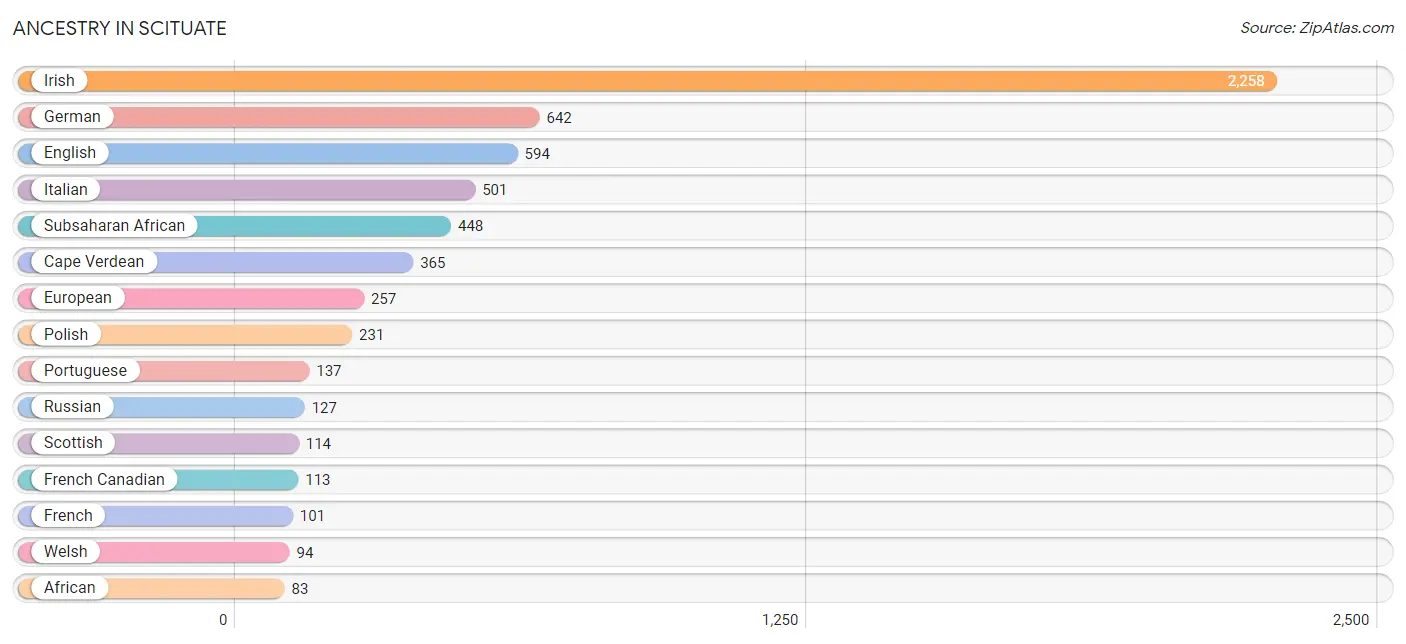
Ancestry in Scituate
The most populous ancestries reported in Scituate are Irish (2,258 | 41.5%), German (642 | 11.8%), English (594 | 10.9%), Italian (501 | 9.2%), and Subsaharan African (448 | 8.2%), together accounting for 81.6% of all Scituate residents.
| Ancestry | # Population | % Population |
| African | 83 | 1.5% |
| American | 57 | 1.1% |
| Arab | 71 | 1.3% |
| Armenian | 43 | 0.8% |
| Belgian | 13 | 0.2% |
| Canadian | 44 | 0.8% |
| Cape Verdean | 365 | 6.7% |
| Celtic | 15 | 0.3% |
| Czech | 26 | 0.5% |
| Dutch | 28 | 0.5% |
| English | 594 | 10.9% |
| European | 257 | 4.7% |
| French | 101 | 1.9% |
| French Canadian | 113 | 2.1% |
| German | 642 | 11.8% |
| Greek | 16 | 0.3% |
| Irish | 2,258 | 41.5% |
| Italian | 501 | 9.2% |
| Latvian | 23 | 0.4% |
| Lebanese | 71 | 1.3% |
| Lithuanian | 40 | 0.7% |
| Mexican | 25 | 0.5% |
| Northern European | 20 | 0.4% |
| Polish | 231 | 4.2% |
| Portuguese | 137 | 2.5% |
| Puerto Rican | 82 | 1.5% |
| Russian | 127 | 2.3% |
| Scandinavian | 26 | 0.5% |
| Scotch-Irish | 27 | 0.5% |
| Scottish | 114 | 2.1% |
| Slovak | 25 | 0.5% |
| Subsaharan African | 448 | 8.2% |
| Swedish | 48 | 0.9% |
| Ukrainian | 1 | 0.0% |
| Welsh | 94 | 1.7% | View All 35 Rows |
Immigrants in Scituate
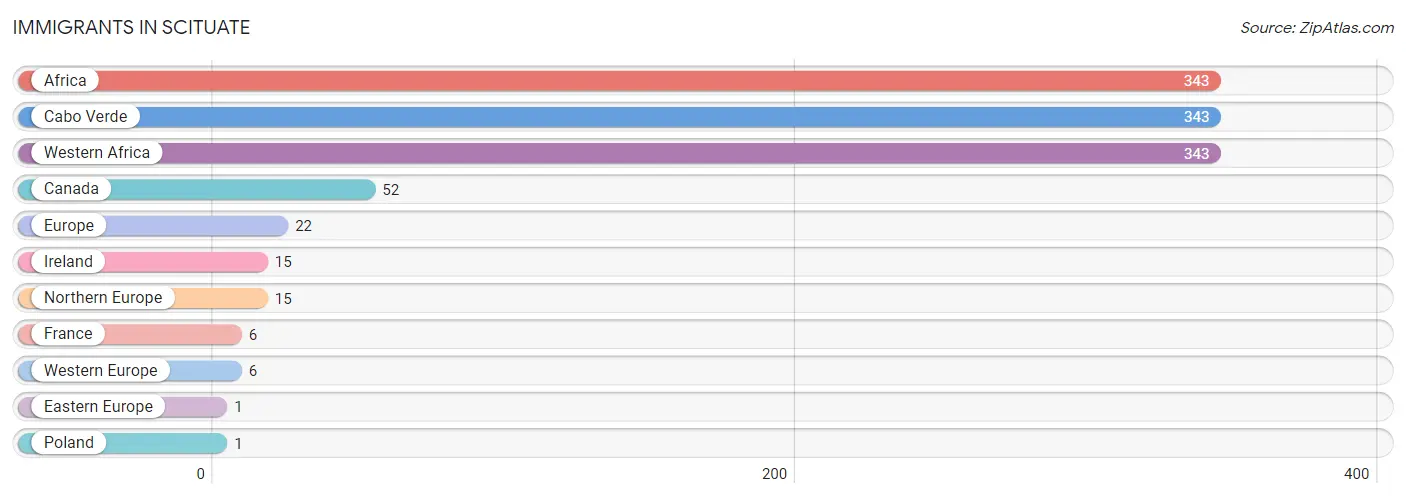
The most numerous immigrant groups reported in Scituate came from Africa (343 | 6.3%), Cabo Verde (343 | 6.3%), Western Africa (343 | 6.3%), Canada (52 | 1.0%), and Europe (22 | 0.4%), together accounting for 20.3% of all Scituate residents.
| Immigration Origin | # Population | % Population |
| Africa | 343 | 6.3% |
| Cabo Verde | 343 | 6.3% |
| Canada | 52 | 1.0% |
| Eastern Europe | 1 | 0.0% |
| Europe | 22 | 0.4% |
| France | 6 | 0.1% |
| Ireland | 15 | 0.3% |
| Northern Europe | 15 | 0.3% |
| Poland | 1 | 0.0% |
| Western Africa | 343 | 6.3% |
| Western Europe | 6 | 0.1% | View All 11 Rows |
Sex and Age in Scituate
Sex and Age in Scituate
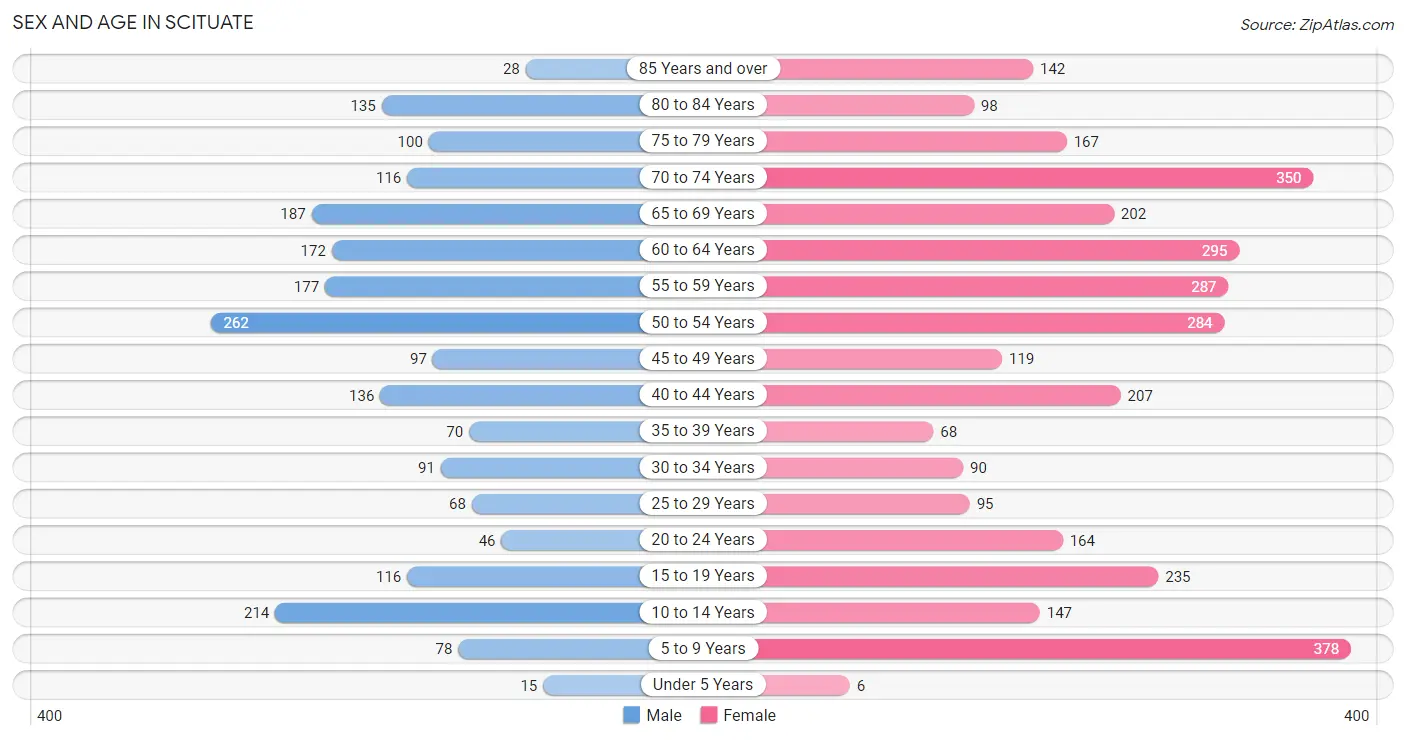
The most populous age groups in Scituate are 50 to 54 Years (262 | 12.4%) for men and 5 to 9 Years (378 | 11.3%) for women.
| Age Bracket | Male | Female |
| Under 5 Years | 15 (0.7%) | 6 (0.2%) |
| 5 to 9 Years | 78 (3.7%) | 378 (11.3%) |
| 10 to 14 Years | 214 (10.2%) | 147 (4.4%) |
| 15 to 19 Years | 116 (5.5%) | 235 (7.0%) |
| 20 to 24 Years | 46 (2.2%) | 164 (4.9%) |
| 25 to 29 Years | 68 (3.2%) | 95 (2.9%) |
| 30 to 34 Years | 91 (4.3%) | 90 (2.7%) |
| 35 to 39 Years | 70 (3.3%) | 68 (2.0%) |
| 40 to 44 Years | 136 (6.5%) | 207 (6.2%) |
| 45 to 49 Years | 97 (4.6%) | 119 (3.6%) |
| 50 to 54 Years | 262 (12.4%) | 284 (8.5%) |
| 55 to 59 Years | 177 (8.4%) | 287 (8.6%) |
| 60 to 64 Years | 172 (8.2%) | 295 (8.8%) |
| 65 to 69 Years | 187 (8.9%) | 202 (6.1%) |
| 70 to 74 Years | 116 (5.5%) | 350 (10.5%) |
| 75 to 79 Years | 100 (4.7%) | 167 (5.0%) |
| 80 to 84 Years | 135 (6.4%) | 98 (2.9%) |
| 85 Years and over | 28 (1.3%) | 142 (4.3%) |
| Total | 2,108 (100.0%) | 3,334 (100.0%) |
Families and Households in Scituate
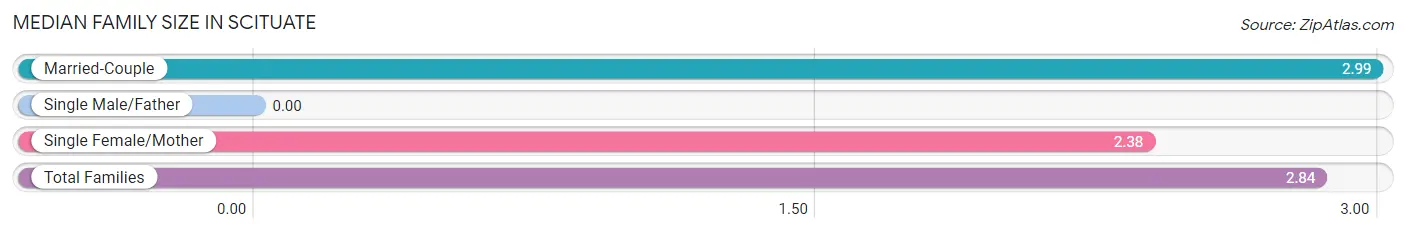
Median Family Size in Scituate
| Family Type | # Families | Family Size |
| Married-Couple | 1,145 (75.8%) | 2.99 |
| Single Male/Father | 0 (0.0%) | - |
| Single Female/Mother | 366 (24.2%) | 2.38 |
| Total Families | 1,511 (100.0%) | 2.84 |
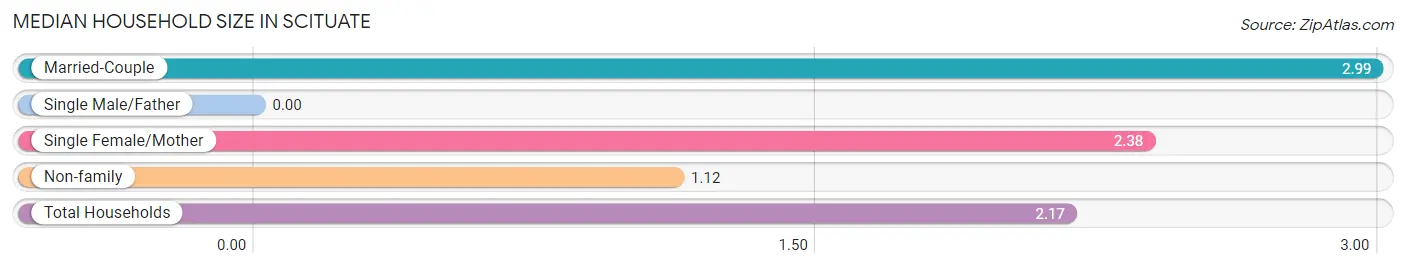
Median Household Size in Scituate
| Household Type | # Households | Household Size |
| Married-Couple | 1,145 (46.2%) | 2.99 |
| Single Male/Father | 0 (0.0%) | - |
| Single Female/Mother | 366 (14.7%) | 2.38 |
| Non-family | 970 (39.1%) | 1.12 |
| Total Households | 2,481 (100.0%) | 2.17 |
Household Size by Marriage Status in Scituate
Out of a total of 2,481 households in Scituate, 1,511 (60.9%) are family households, while 970 (39.1%) are nonfamily households. The most numerous type of family households are 2-person households, comprising 674, and the most common type of nonfamily households are 1-person households, comprising 890.
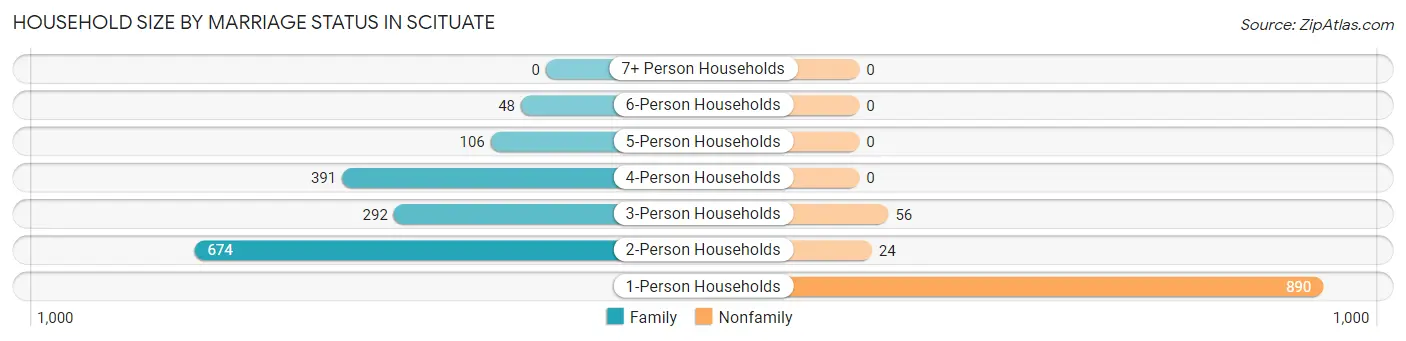
| Household Size | Family Households | Nonfamily Households |
| 1-Person Households | - | 890 (35.9%) |
| 2-Person Households | 674 (27.2%) | 24 (1.0%) |
| 3-Person Households | 292 (11.8%) | 56 (2.3%) |
| 4-Person Households | 391 (15.8%) | 0 (0.0%) |
| 5-Person Households | 106 (4.3%) | 0 (0.0%) |
| 6-Person Households | 48 (1.9%) | 0 (0.0%) |
| 7+ Person Households | 0 (0.0%) | 0 (0.0%) |
| Total | 1,511 (60.9%) | 970 (39.1%) |
Female Fertility in Scituate
Fertility by Age in Scituate
Average fertility rate in Scituate is 13.0 births per 1,000 women. Women in the age bracket of 20 to 34 years have the highest fertility rate with 40.0 births per 1,000 women. Women in the age bracket of 20 to 34 years acount for 100.0% of all women with births.
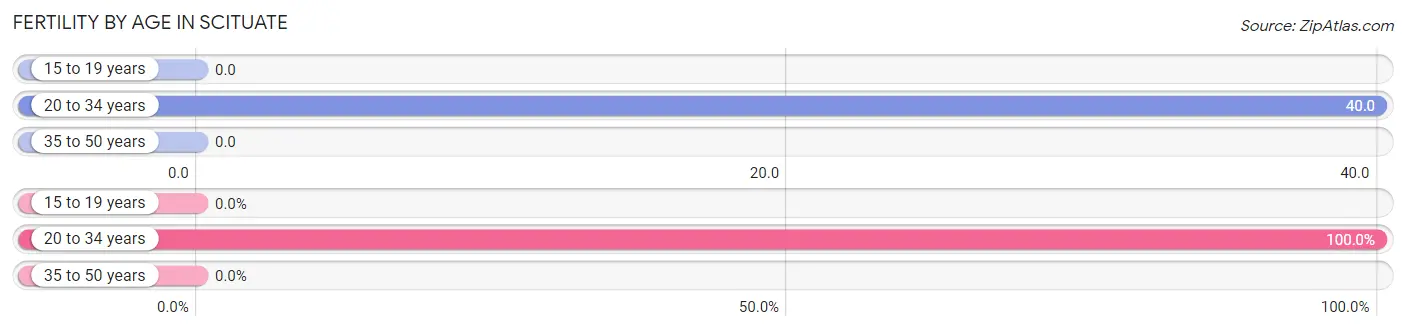
| Age Bracket | Women with Births | Births / 1,000 Women |
| 15 to 19 years | 0 (0.0%) | 0.0 |
| 20 to 34 years | 14 (100.0%) | 40.0 |
| 35 to 50 years | 0 (0.0%) | 0.0 |
| Total | 14 (100.0%) | 13.0 |
Fertility by Age by Marriage Status in Scituate
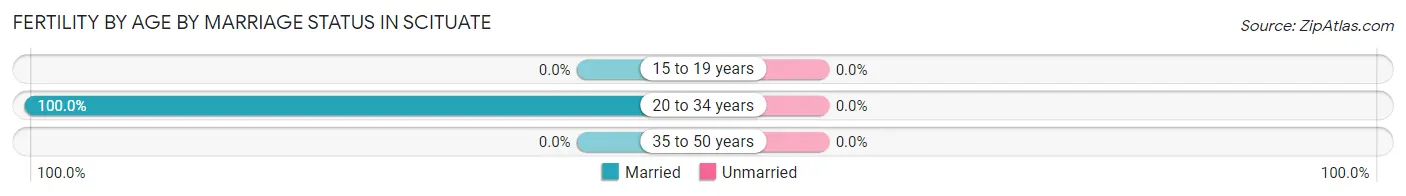
| Age Bracket | Married | Unmarried |
| 15 to 19 years | 0 (0.0%) | 0 (0.0%) |
| 20 to 34 years | 14 (100.0%) | 0 (0.0%) |
| 35 to 50 years | 0 (0.0%) | 0 (0.0%) |
| Total | 14 (100.0%) | 0 (0.0%) |
Fertility by Education in Scituate
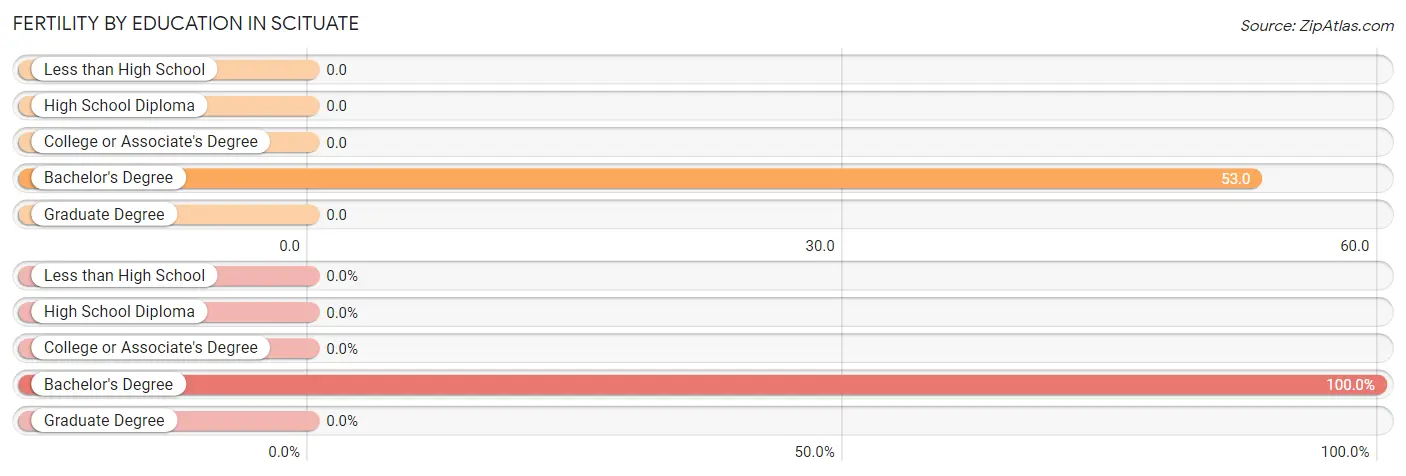
| Educational Attainment | Women with Births | Births / 1,000 Women |
| Less than High School | 0 (0.0%) | 0.0 |
| High School Diploma | 0 (0.0%) | 0.0 |
| College or Associate's Degree | 0 (0.0%) | 0.0 |
| Bachelor's Degree | 14 (100.0%) | 53.0 |
| Graduate Degree | 0 (0.0%) | 0.0 |
| Total | 14 (100.0%) | 13.0 |
Fertility by Education by Marriage Status in Scituate
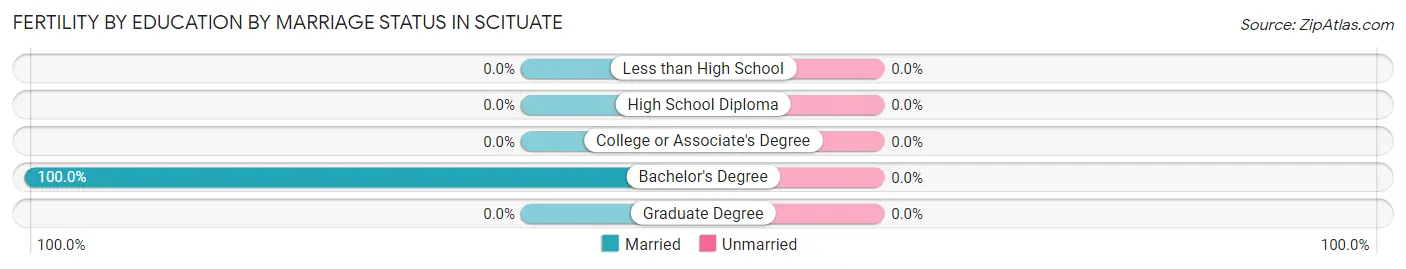
| Educational Attainment | Married | Unmarried |
| Less than High School | 0 (0.0%) | 0 (0.0%) |
| High School Diploma | 0 (0.0%) | 0 (0.0%) |
| College or Associate's Degree | 0 (0.0%) | 0 (0.0%) |
| Bachelor's Degree | 14 (100.0%) | 0 (0.0%) |
| Graduate Degree | 0 (0.0%) | 0 (0.0%) |
| Total | 14 (100.0%) | 0 (0.0%) |
Employment Characteristics in Scituate
Employment by Class of Employer in Scituate
Among the 2,436 employed individuals in Scituate, private company employees (1,533 | 62.9%), not-for-profit organizations (300 | 12.3%), and local government employees (222 | 9.1%) make up the most common classes of employment.
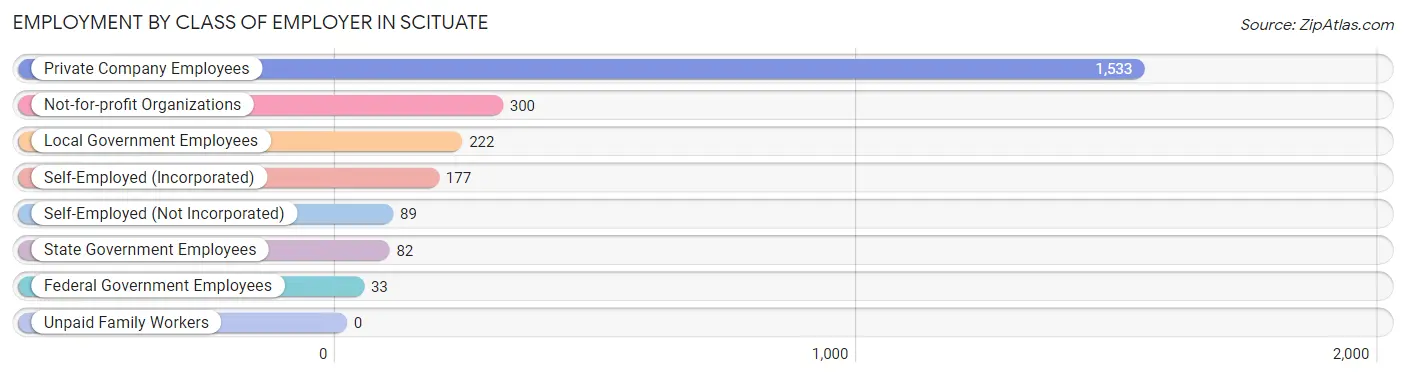
| Employer Class | # Employees | % Employees |
| Private Company Employees | 1,533 | 62.9% |
| Self-Employed (Incorporated) | 177 | 7.3% |
| Self-Employed (Not Incorporated) | 89 | 3.6% |
| Not-for-profit Organizations | 300 | 12.3% |
| Local Government Employees | 222 | 9.1% |
| State Government Employees | 82 | 3.4% |
| Federal Government Employees | 33 | 1.3% |
| Unpaid Family Workers | 0 | 0.0% |
| Total | 2,436 | 100.0% |
Employment Status by Age in Scituate
According to the labor force statistics for Scituate, out of the total population over 16 years of age (4,543), 55.4% or 2,517 individuals are in the labor force, with 2.1% or 53 of them unemployed. The age group with the highest labor force participation rate is 25 to 29 years, with 100.0% or 163 individuals in the labor force. Within the labor force, the 35 to 44 years age range has the highest percentage of unemployed individuals, with 4.5% or 18 of them being unemployed.
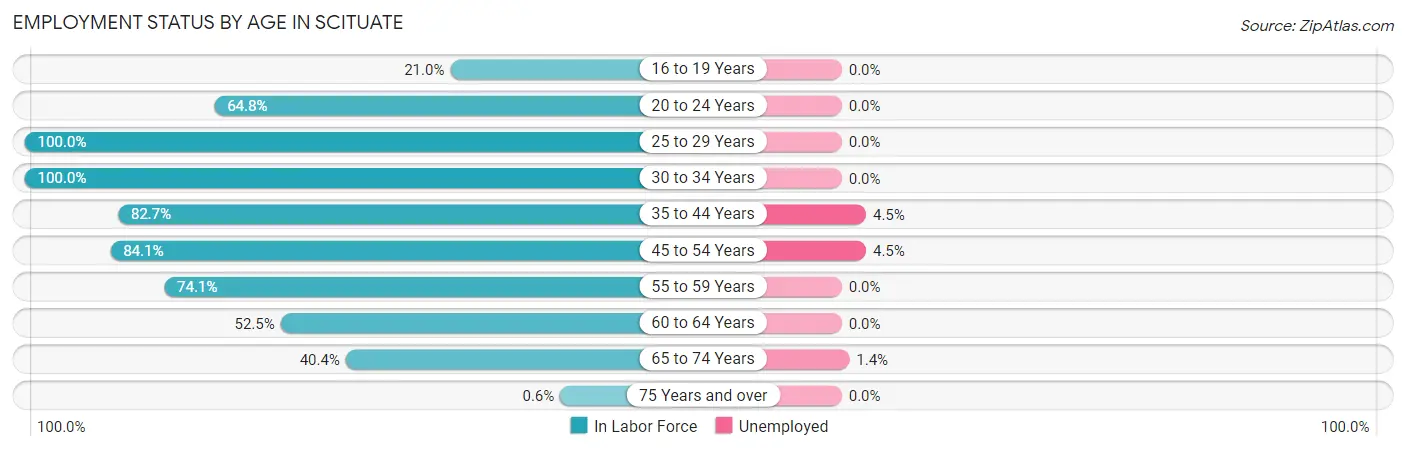
| Age Bracket | In Labor Force | Unemployed |
| 16 to 19 Years | 61 (21.0%) | 0 (0.0%) |
| 20 to 24 Years | 136 (64.8%) | 0 (0.0%) |
| 25 to 29 Years | 163 (100.0%) | 0 (0.0%) |
| 30 to 34 Years | 181 (100.0%) | 0 (0.0%) |
| 35 to 44 Years | 398 (82.7%) | 18 (4.5%) |
| 45 to 54 Years | 641 (84.1%) | 29 (4.5%) |
| 55 to 59 Years | 344 (74.1%) | 0 (0.0%) |
| 60 to 64 Years | 245 (52.5%) | 0 (0.0%) |
| 65 to 74 Years | 345 (40.4%) | 5 (1.4%) |
| 75 Years and over | 4 (0.6%) | 0 (0.0%) |
| Total | 2,517 (55.4%) | 53 (2.1%) |
Employment Status by Educational Attainment in Scituate
According to labor force statistics for Scituate, 78.3% of individuals (1,972) out of the total population between 25 and 64 years of age (2,518) are in the labor force, with 2.4% or 47 of them being unemployed. The group with the highest labor force participation rate are those with the educational attainment of less than high school, with 100.0% or 88 individuals in the labor force. Within the labor force, individuals with college / associate degree education have the highest percentage of unemployment, with 5.4% or 18 of them being unemployed.
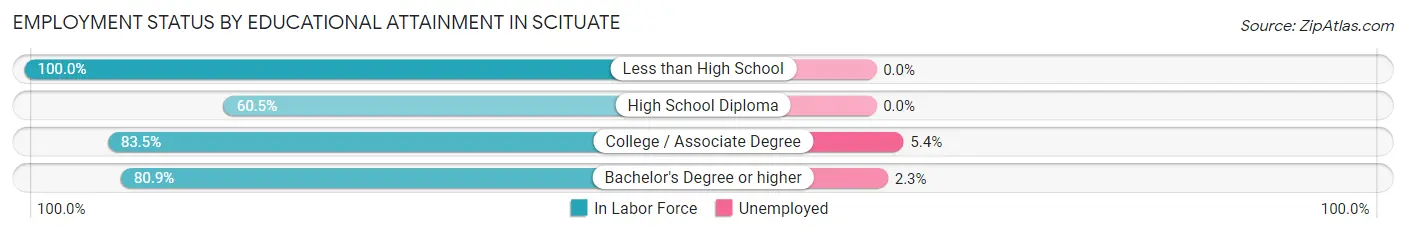
| Educational Attainment | In Labor Force | Unemployed |
| Less than High School | 88 (100.0%) | 0 (0.0%) |
| High School Diploma | 273 (60.5%) | 0 (0.0%) |
| College / Associate Degree | 335 (83.5%) | 22 (5.4%) |
| Bachelor's Degree or higher | 1,277 (80.9%) | 36 (2.3%) |
| Total | 1,972 (78.3%) | 60 (2.4%) |
Employment Occupations by Sex in Scituate
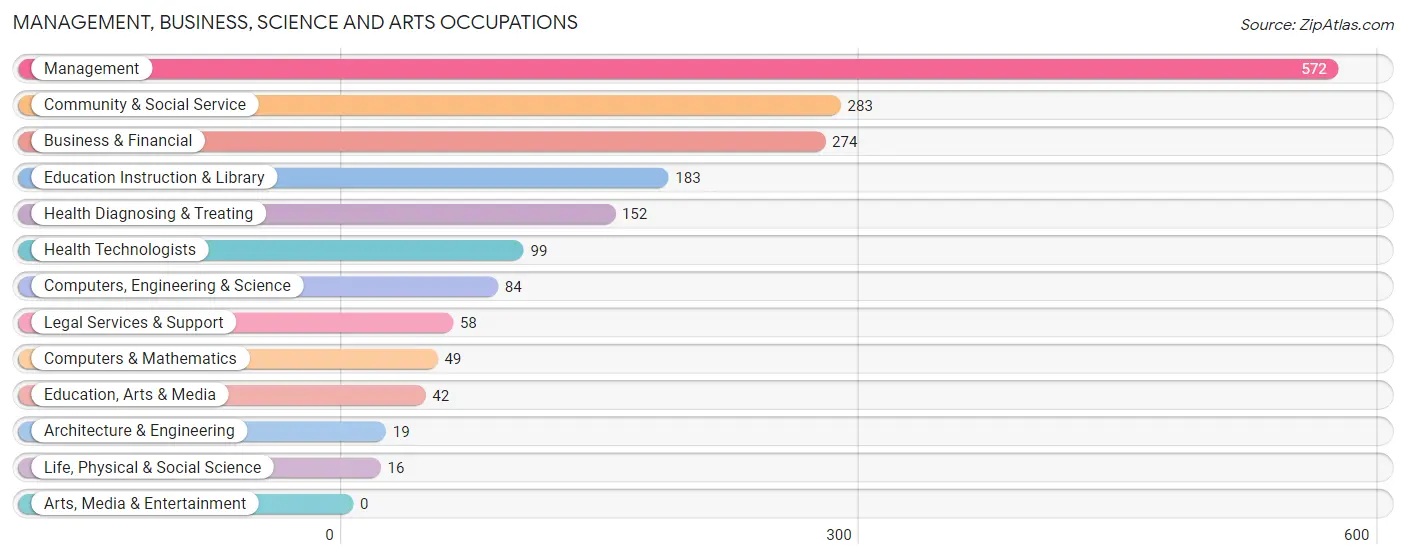
Management, Business, Science and Arts Occupations
The most common Management, Business, Science and Arts occupations in Scituate are Management (572 | 23.2%), Community & Social Service (283 | 11.5%), Business & Financial (274 | 11.1%), Education Instruction & Library (183 | 7.4%), and Health Diagnosing & Treating (152 | 6.2%).
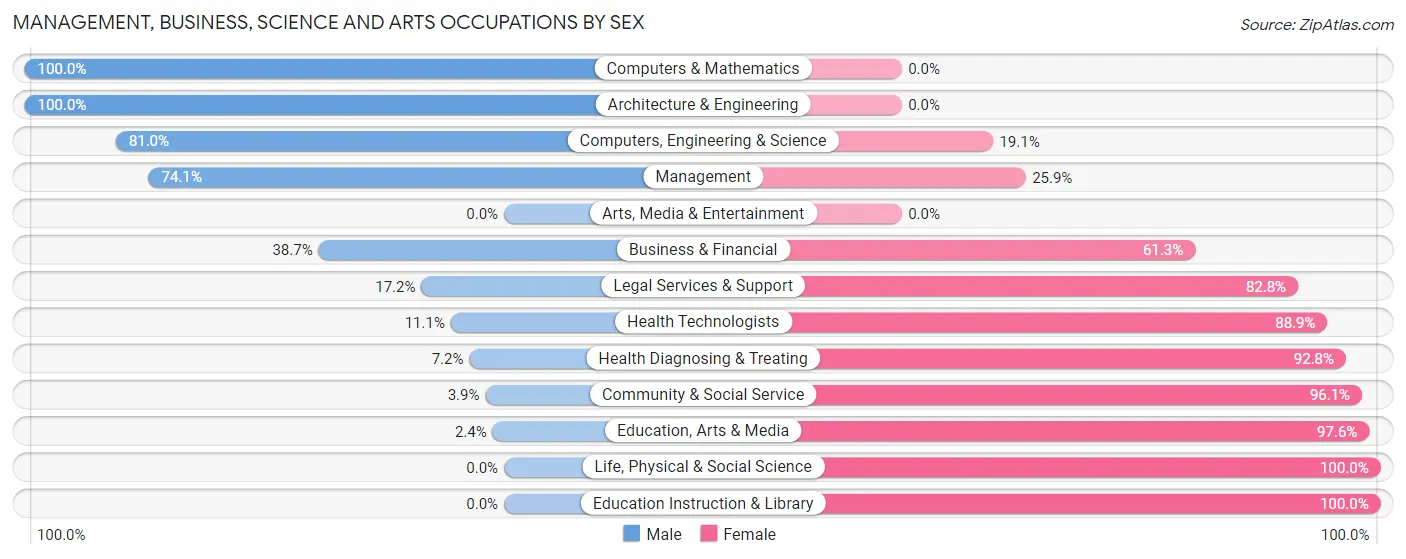
Management, Business, Science and Arts Occupations by Sex
Within the Management, Business, Science and Arts occupations in Scituate, the most male-oriented occupations are Computers & Mathematics (100.0%), Architecture & Engineering (100.0%), and Computers, Engineering & Science (80.9%), while the most female-oriented occupations are Life, Physical & Social Science (100.0%), Education Instruction & Library (100.0%), and Education, Arts & Media (97.6%).
| Occupation | Male | Female |
| Management | 424 (74.1%) | 148 (25.9%) |
| Business & Financial | 106 (38.7%) | 168 (61.3%) |
| Computers, Engineering & Science | 68 (80.9%) | 16 (19.1%) |
| Computers & Mathematics | 49 (100.0%) | 0 (0.0%) |
| Architecture & Engineering | 19 (100.0%) | 0 (0.0%) |
| Life, Physical & Social Science | 0 (0.0%) | 16 (100.0%) |
| Community & Social Service | 11 (3.9%) | 272 (96.1%) |
| Education, Arts & Media | 1 (2.4%) | 41 (97.6%) |
| Legal Services & Support | 10 (17.2%) | 48 (82.8%) |
| Education Instruction & Library | 0 (0.0%) | 183 (100.0%) |
| Arts, Media & Entertainment | 0 (0.0%) | 0 (0.0%) |
| Health Diagnosing & Treating | 11 (7.2%) | 141 (92.8%) |
| Health Technologists | 11 (11.1%) | 88 (88.9%) |
| Total (Category) | 620 (45.4%) | 745 (54.6%) |
| Total (Overall) | 1,226 (49.7%) | 1,240 (50.3%) |
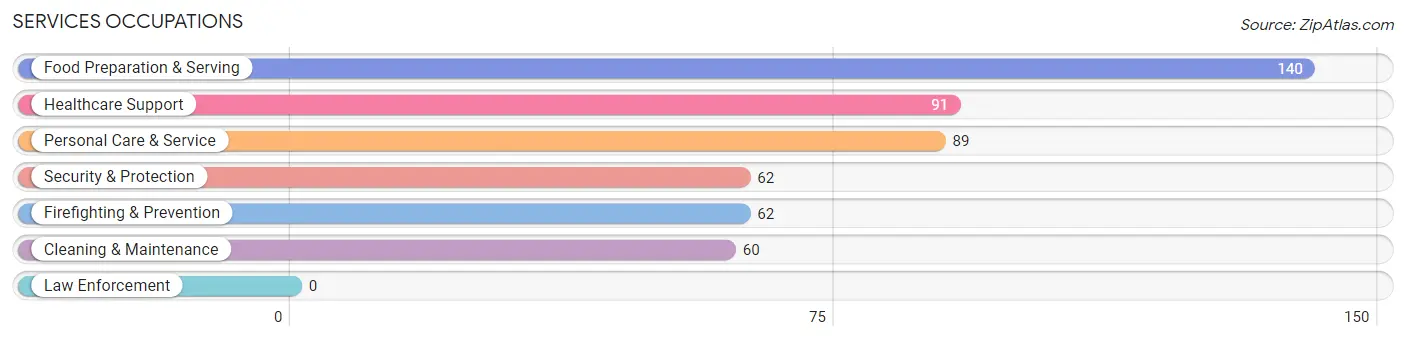
Services Occupations
The most common Services occupations in Scituate are Food Preparation & Serving (140 | 5.7%), Healthcare Support (91 | 3.7%), Personal Care & Service (89 | 3.6%), Security & Protection (62 | 2.5%), and Firefighting & Prevention (62 | 2.5%).
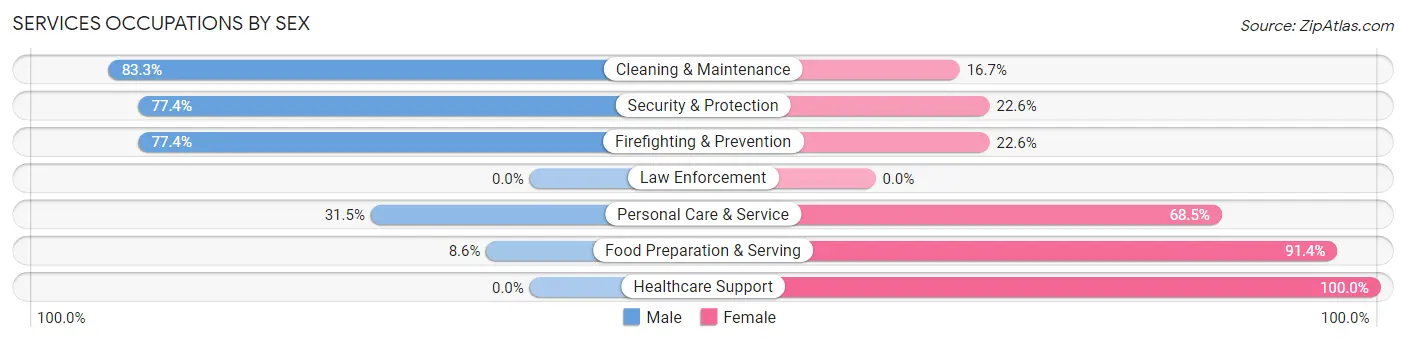
Services Occupations by Sex
Within the Services occupations in Scituate, the most male-oriented occupations are Cleaning & Maintenance (83.3%), Security & Protection (77.4%), and Firefighting & Prevention (77.4%), while the most female-oriented occupations are Healthcare Support (100.0%), Food Preparation & Serving (91.4%), and Personal Care & Service (68.5%).
| Occupation | Male | Female |
| Healthcare Support | 0 (0.0%) | 91 (100.0%) |
| Security & Protection | 48 (77.4%) | 14 (22.6%) |
| Firefighting & Prevention | 48 (77.4%) | 14 (22.6%) |
| Law Enforcement | 0 (0.0%) | 0 (0.0%) |
| Food Preparation & Serving | 12 (8.6%) | 128 (91.4%) |
| Cleaning & Maintenance | 50 (83.3%) | 10 (16.7%) |
| Personal Care & Service | 28 (31.5%) | 61 (68.5%) |
| Total (Category) | 138 (31.2%) | 304 (68.8%) |
| Total (Overall) | 1,226 (49.7%) | 1,240 (50.3%) |
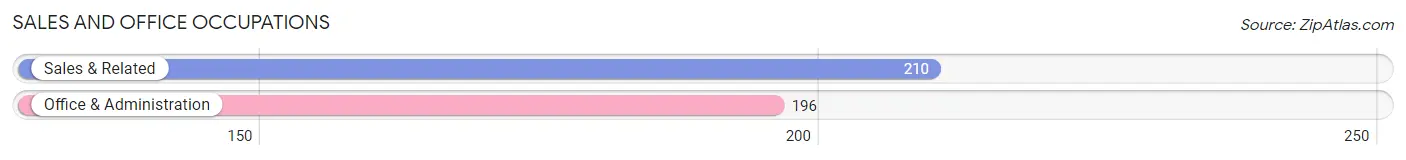
Sales and Office Occupations
The most common Sales and Office occupations in Scituate are Sales & Related (210 | 8.5%), and Office & Administration (196 | 8.0%).
Sales and Office Occupations by Sex
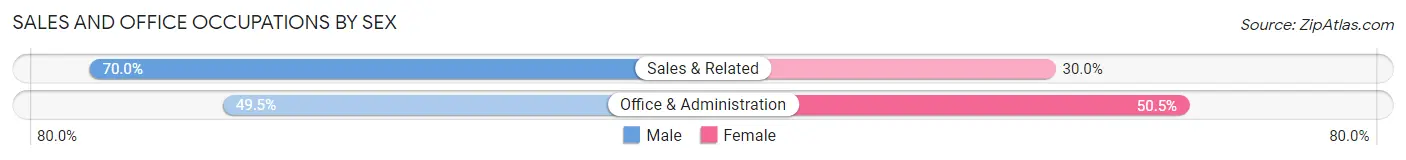
| Occupation | Male | Female |
| Sales & Related | 147 (70.0%) | 63 (30.0%) |
| Office & Administration | 97 (49.5%) | 99 (50.5%) |
| Total (Category) | 244 (60.1%) | 162 (39.9%) |
| Total (Overall) | 1,226 (49.7%) | 1,240 (50.3%) |
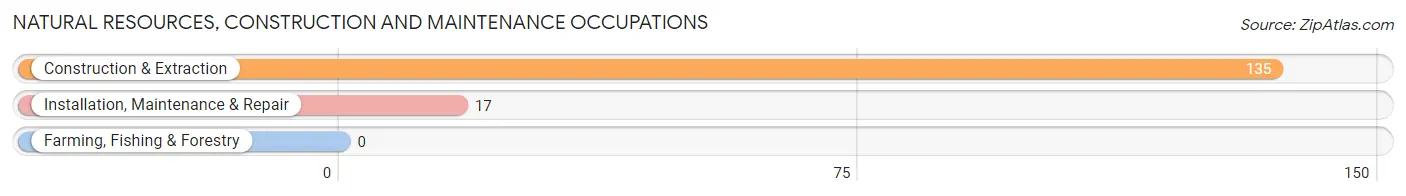
Natural Resources, Construction and Maintenance Occupations
The most common Natural Resources, Construction and Maintenance occupations in Scituate are Construction & Extraction (135 | 5.5%), and Installation, Maintenance & Repair (17 | 0.7%).
Natural Resources, Construction and Maintenance Occupations by Sex
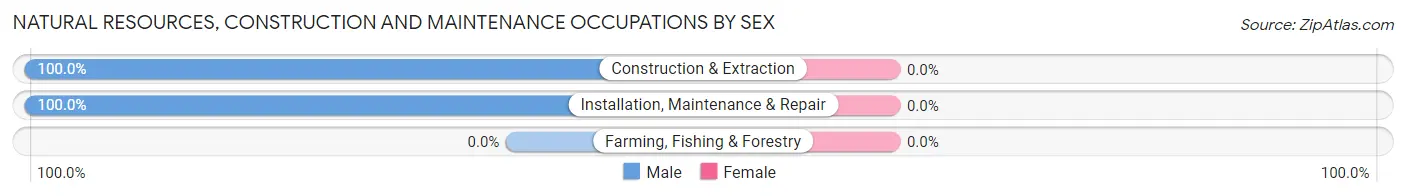
| Occupation | Male | Female |
| Farming, Fishing & Forestry | 0 (0.0%) | 0 (0.0%) |
| Construction & Extraction | 135 (100.0%) | 0 (0.0%) |
| Installation, Maintenance & Repair | 17 (100.0%) | 0 (0.0%) |
| Total (Category) | 152 (100.0%) | 0 (0.0%) |
| Total (Overall) | 1,226 (49.7%) | 1,240 (50.3%) |
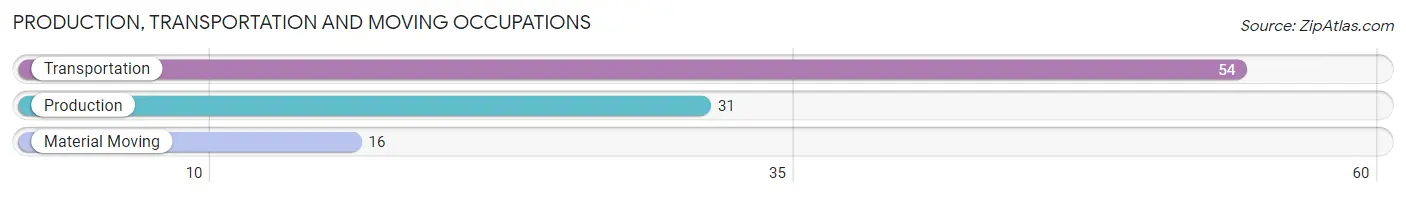
Production, Transportation and Moving Occupations
The most common Production, Transportation and Moving occupations in Scituate are Transportation (54 | 2.2%), Production (31 | 1.3%), and Material Moving (16 | 0.6%).
Production, Transportation and Moving Occupations by Sex
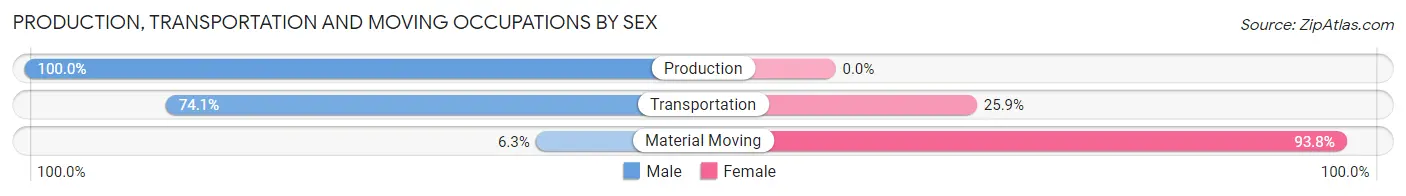
| Occupation | Male | Female |
| Production | 31 (100.0%) | 0 (0.0%) |
| Transportation | 40 (74.1%) | 14 (25.9%) |
| Material Moving | 1 (6.2%) | 15 (93.8%) |
| Total (Category) | 72 (71.3%) | 29 (28.7%) |
| Total (Overall) | 1,226 (49.7%) | 1,240 (50.3%) |
Employment Industries by Sex in Scituate
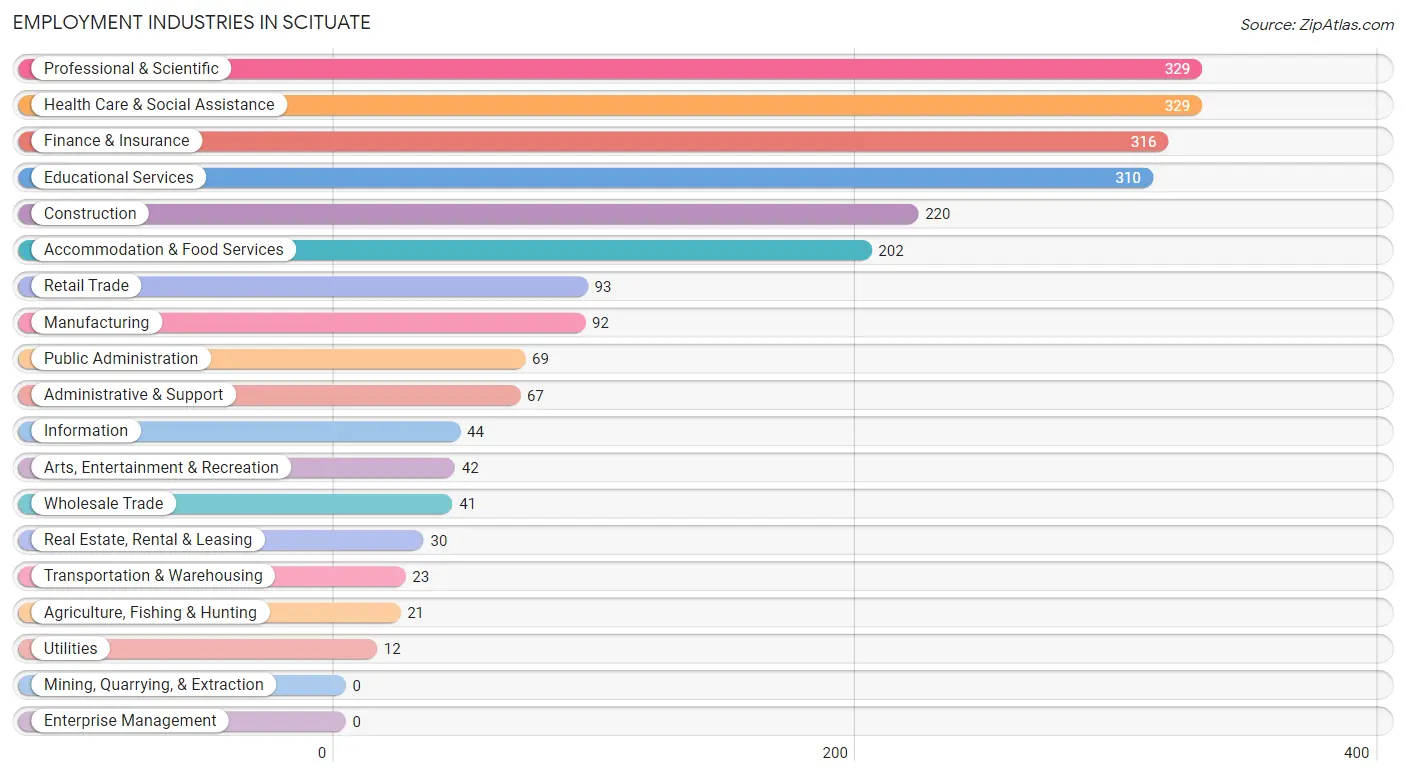
Employment Industries in Scituate
The major employment industries in Scituate include Professional & Scientific (329 | 13.3%), Health Care & Social Assistance (329 | 13.3%), Finance & Insurance (316 | 12.8%), Educational Services (310 | 12.6%), and Construction (220 | 8.9%).
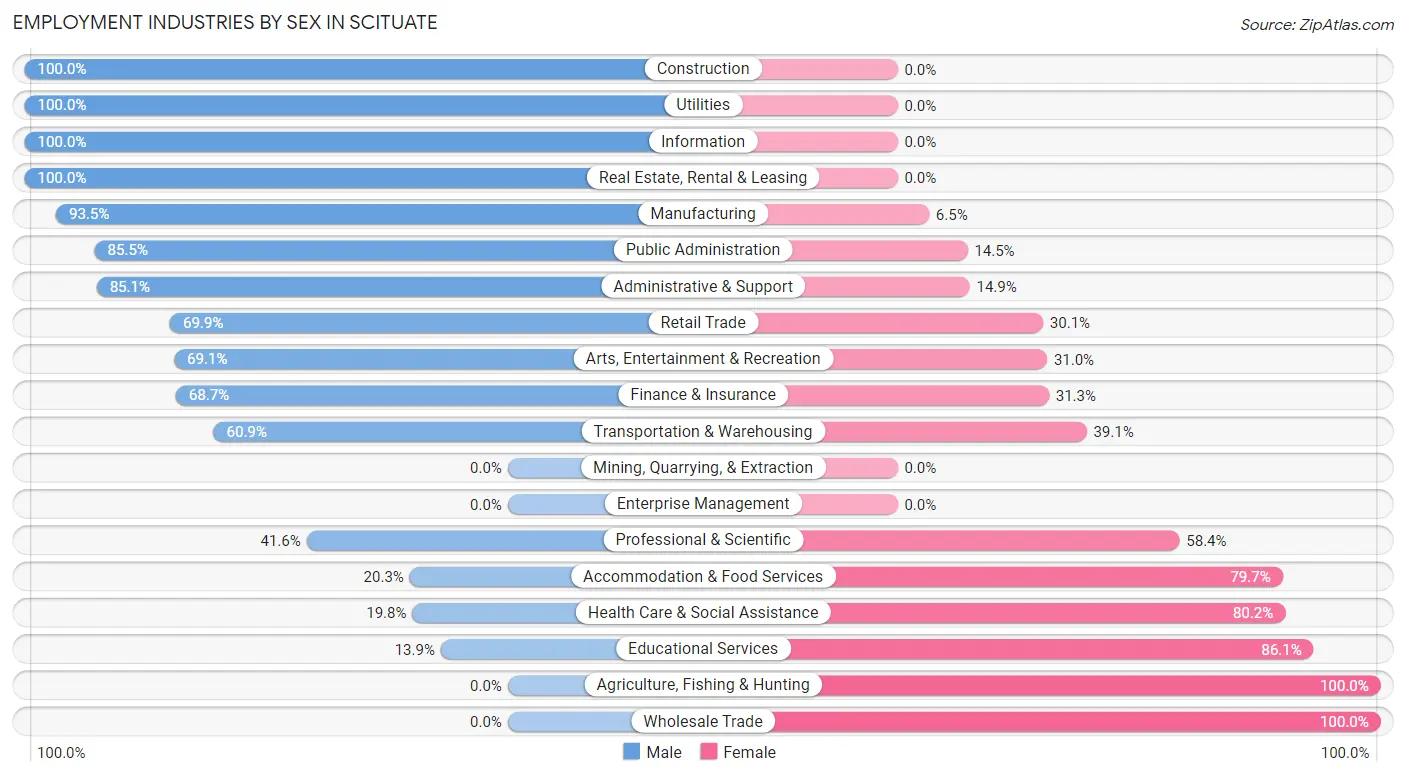
Employment Industries by Sex in Scituate
The Scituate industries that see more men than women are Construction (100.0%), Utilities (100.0%), and Information (100.0%), whereas the industries that tend to have a higher number of women are Agriculture, Fishing & Hunting (100.0%), Wholesale Trade (100.0%), and Educational Services (86.1%).
| Industry | Male | Female |
| Agriculture, Fishing & Hunting | 0 (0.0%) | 21 (100.0%) |
| Mining, Quarrying, & Extraction | 0 (0.0%) | 0 (0.0%) |
| Construction | 220 (100.0%) | 0 (0.0%) |
| Manufacturing | 86 (93.5%) | 6 (6.5%) |
| Wholesale Trade | 0 (0.0%) | 41 (100.0%) |
| Retail Trade | 65 (69.9%) | 28 (30.1%) |
| Transportation & Warehousing | 14 (60.9%) | 9 (39.1%) |
| Utilities | 12 (100.0%) | 0 (0.0%) |
| Information | 44 (100.0%) | 0 (0.0%) |
| Finance & Insurance | 217 (68.7%) | 99 (31.3%) |
| Real Estate, Rental & Leasing | 30 (100.0%) | 0 (0.0%) |
| Professional & Scientific | 137 (41.6%) | 192 (58.4%) |
| Enterprise Management | 0 (0.0%) | 0 (0.0%) |
| Administrative & Support | 57 (85.1%) | 10 (14.9%) |
| Educational Services | 43 (13.9%) | 267 (86.1%) |
| Health Care & Social Assistance | 65 (19.8%) | 264 (80.2%) |
| Arts, Entertainment & Recreation | 29 (69.1%) | 13 (30.9%) |
| Accommodation & Food Services | 41 (20.3%) | 161 (79.7%) |
| Public Administration | 59 (85.5%) | 10 (14.5%) |
| Total | 1,226 (49.7%) | 1,240 (50.3%) |
Education in Scituate
School Enrollment in Scituate
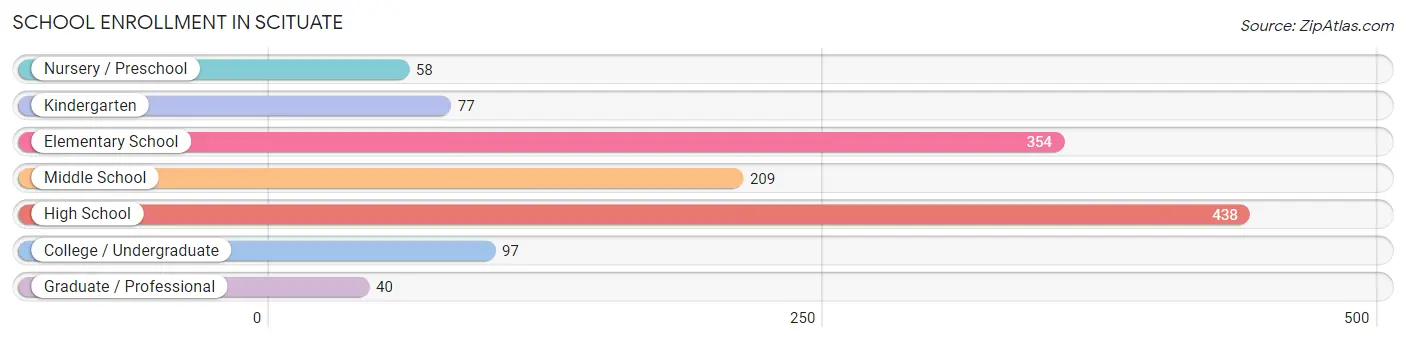
The most common levels of schooling among the 1,273 students in Scituate are high school (438 | 34.4%), elementary school (354 | 27.8%), and middle school (209 | 16.4%).
| School Level | # Students | % Students |
| Nursery / Preschool | 58 | 4.6% |
| Kindergarten | 77 | 6.0% |
| Elementary School | 354 | 27.8% |
| Middle School | 209 | 16.4% |
| High School | 438 | 34.4% |
| College / Undergraduate | 97 | 7.6% |
| Graduate / Professional | 40 | 3.1% |
| Total | 1,273 | 100.0% |
School Enrollment by Age by Funding Source in Scituate
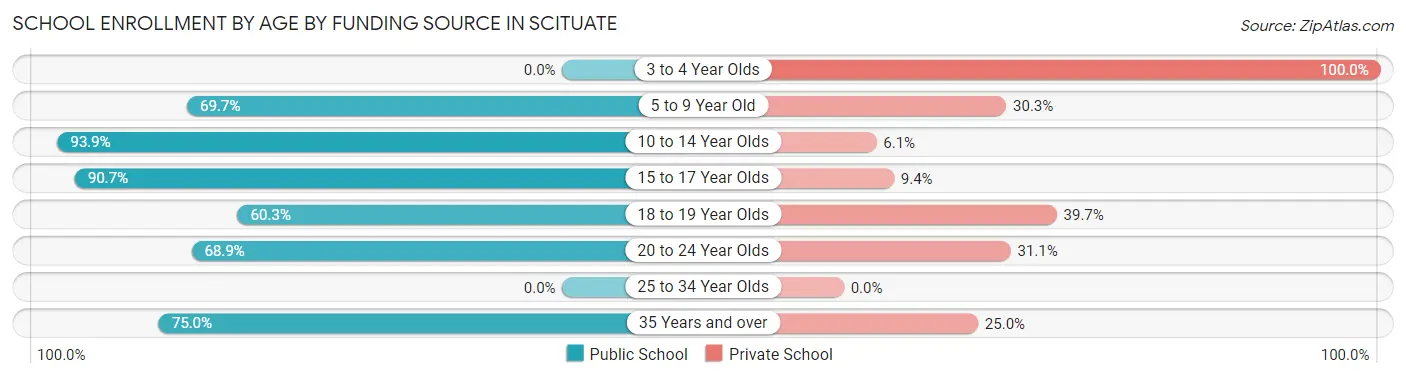
Out of a total of 1,273 students who are enrolled in schools in Scituate, 248 (19.5%) attend a private institution, while the remaining 1,025 (80.5%) are enrolled in public schools. The age group of 3 to 4 year olds has the highest likelihood of being enrolled in private schools, with 6 (100.0% in the age bracket) enrolled. Conversely, the age group of 10 to 14 year olds has the lowest likelihood of being enrolled in a private school, with 339 (93.9% in the age bracket) attending a public institution.
| Age Bracket | Public School | Private School |
| 3 to 4 Year Olds | 0 (0.0%) | 6 (100.0%) |
| 5 to 9 Year Old | 318 (69.7%) | 138 (30.3%) |
| 10 to 14 Year Olds | 339 (93.9%) | 22 (6.1%) |
| 15 to 17 Year Olds | 252 (90.6%) | 26 (9.3%) |
| 18 to 19 Year Olds | 35 (60.3%) | 23 (39.7%) |
| 20 to 24 Year Olds | 51 (68.9%) | 23 (31.1%) |
| 25 to 34 Year Olds | 0 (0.0%) | 0 (0.0%) |
| 35 Years and over | 30 (75.0%) | 10 (25.0%) |
| Total | 1,025 (80.5%) | 248 (19.5%) |
Educational Attainment by Field of Study in Scituate
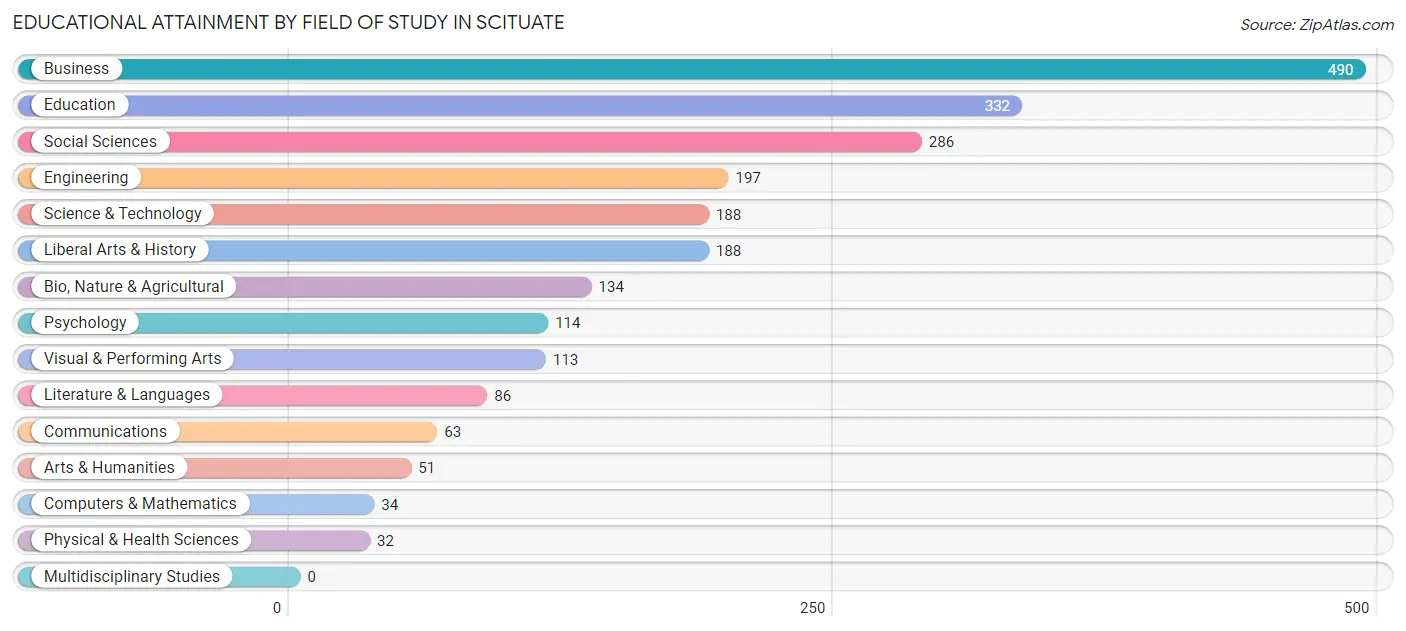
Business (490 | 21.2%), education (332 | 14.4%), social sciences (286 | 12.4%), engineering (197 | 8.5%), and science & technology (188 | 8.2%) are the most common fields of study among 2,308 individuals in Scituate who have obtained a bachelor's degree or higher.
| Field of Study | # Graduates | % Graduates |
| Computers & Mathematics | 34 | 1.5% |
| Bio, Nature & Agricultural | 134 | 5.8% |
| Physical & Health Sciences | 32 | 1.4% |
| Psychology | 114 | 4.9% |
| Social Sciences | 286 | 12.4% |
| Engineering | 197 | 8.5% |
| Multidisciplinary Studies | 0 | 0.0% |
| Science & Technology | 188 | 8.2% |
| Business | 490 | 21.2% |
| Education | 332 | 14.4% |
| Literature & Languages | 86 | 3.7% |
| Liberal Arts & History | 188 | 8.2% |
| Visual & Performing Arts | 113 | 4.9% |
| Communications | 63 | 2.7% |
| Arts & Humanities | 51 | 2.2% |
| Total | 2,308 | 100.0% |
Transportation & Commute in Scituate
Vehicle Availability by Sex in Scituate
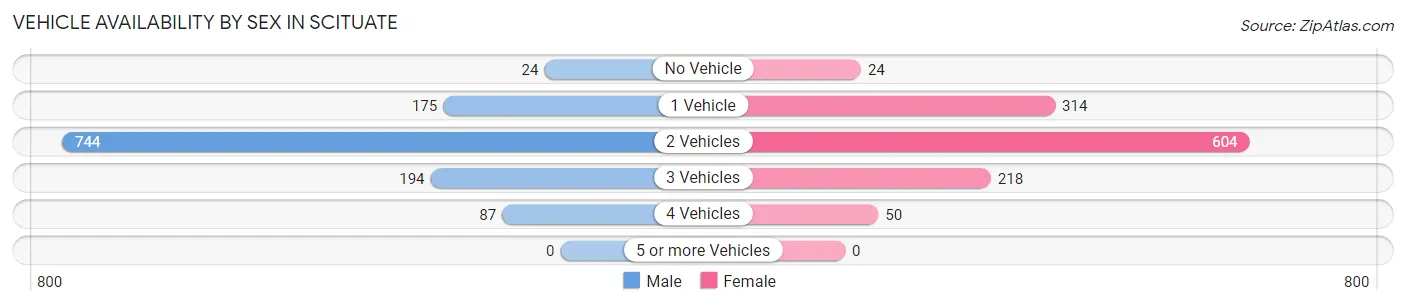
The most prevalent vehicle ownership categories in Scituate are males with 2 vehicles (744, accounting for 60.8%) and females with 2 vehicles (604, making up 61.5%).
| Vehicles Available | Male | Female |
| No Vehicle | 24 (2.0%) | 24 (2.0%) |
| 1 Vehicle | 175 (14.3%) | 314 (26.0%) |
| 2 Vehicles | 744 (60.8%) | 604 (49.9%) |
| 3 Vehicles | 194 (15.9%) | 218 (18.0%) |
| 4 Vehicles | 87 (7.1%) | 50 (4.1%) |
| 5 or more Vehicles | 0 (0.0%) | 0 (0.0%) |
| Total | 1,224 (100.0%) | 1,210 (100.0%) |
Commute Time in Scituate
The most frequently occuring commute durations in Scituate are 60 to 89 minutes (389 commuters, 19.3%), 20 to 24 minutes (290 commuters, 14.4%), and 45 to 59 minutes (290 commuters, 14.4%).
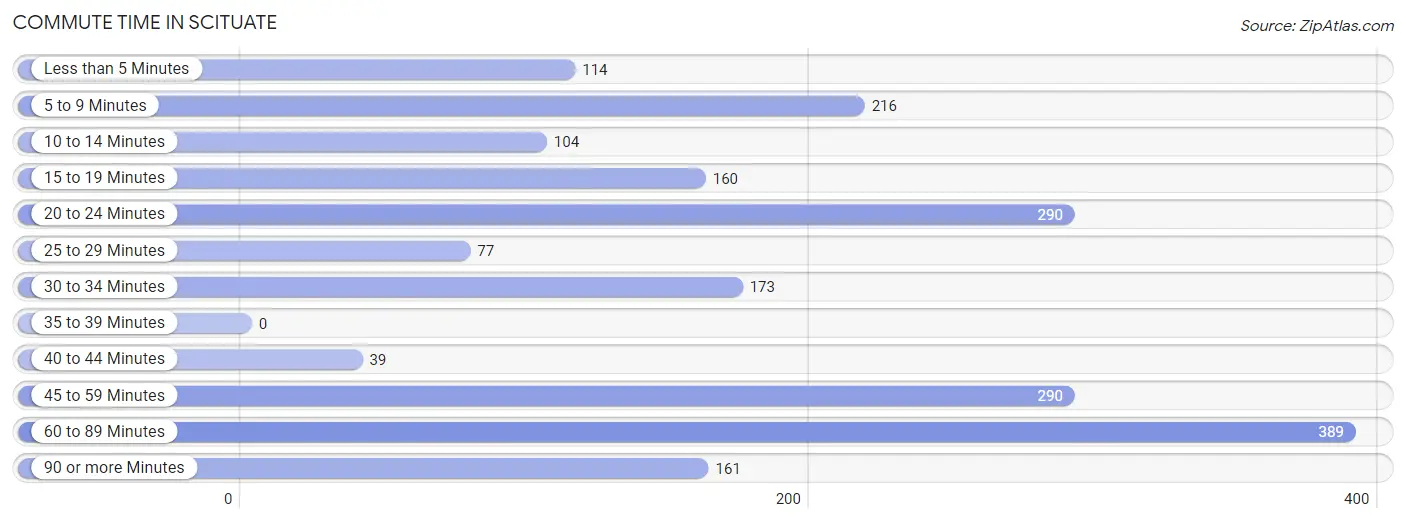
| Commute Time | # Commuters | % Commuters |
| Less than 5 Minutes | 114 | 5.7% |
| 5 to 9 Minutes | 216 | 10.7% |
| 10 to 14 Minutes | 104 | 5.2% |
| 15 to 19 Minutes | 160 | 8.0% |
| 20 to 24 Minutes | 290 | 14.4% |
| 25 to 29 Minutes | 77 | 3.8% |
| 30 to 34 Minutes | 173 | 8.6% |
| 35 to 39 Minutes | 0 | 0.0% |
| 40 to 44 Minutes | 39 | 1.9% |
| 45 to 59 Minutes | 290 | 14.4% |
| 60 to 89 Minutes | 389 | 19.3% |
| 90 or more Minutes | 161 | 8.0% |
Commute Time by Sex in Scituate
The most common commute times in Scituate are 60 to 89 minutes (267 commuters, 27.1%) for males and 5 to 9 minutes (175 commuters, 17.1%) for females.
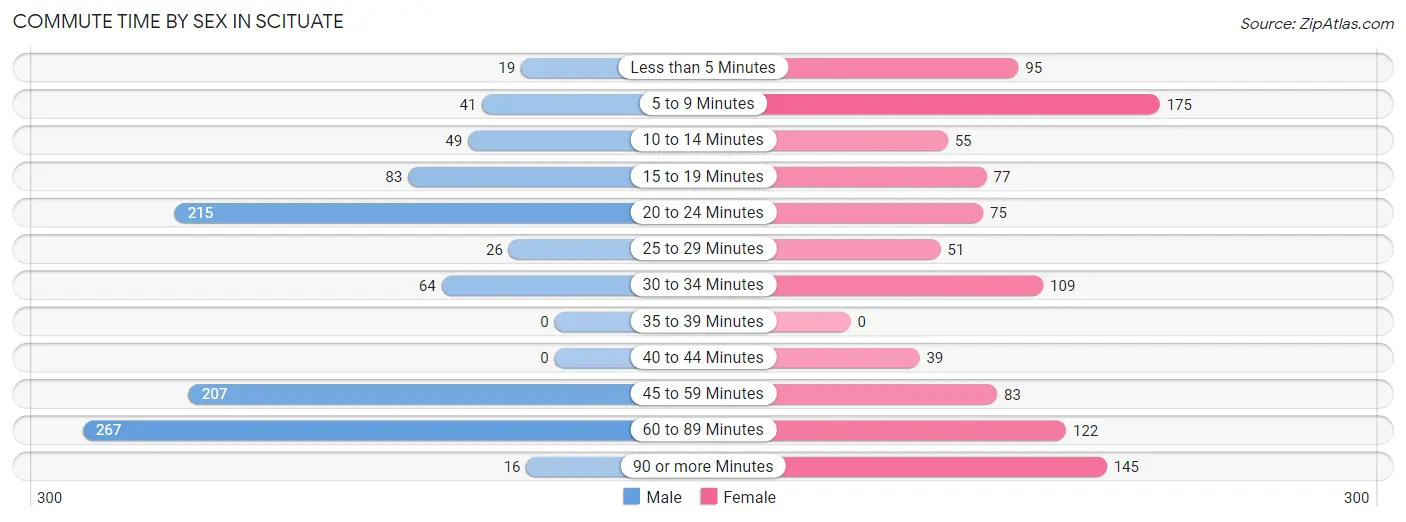
| Commute Time | Male | Female |
| Less than 5 Minutes | 19 (1.9%) | 95 (9.3%) |
| 5 to 9 Minutes | 41 (4.2%) | 175 (17.1%) |
| 10 to 14 Minutes | 49 (5.0%) | 55 (5.4%) |
| 15 to 19 Minutes | 83 (8.4%) | 77 (7.5%) |
| 20 to 24 Minutes | 215 (21.8%) | 75 (7.3%) |
| 25 to 29 Minutes | 26 (2.6%) | 51 (5.0%) |
| 30 to 34 Minutes | 64 (6.5%) | 109 (10.6%) |
| 35 to 39 Minutes | 0 (0.0%) | 0 (0.0%) |
| 40 to 44 Minutes | 0 (0.0%) | 39 (3.8%) |
| 45 to 59 Minutes | 207 (21.0%) | 83 (8.1%) |
| 60 to 89 Minutes | 267 (27.1%) | 122 (11.9%) |
| 90 or more Minutes | 16 (1.6%) | 145 (14.1%) |
Time of Departure to Work by Sex in Scituate
The most frequent times of departure to work in Scituate are 8:00 AM to 8:29 AM (182, 18.4%) for males and 7:30 AM to 7:59 AM (262, 25.5%) for females.
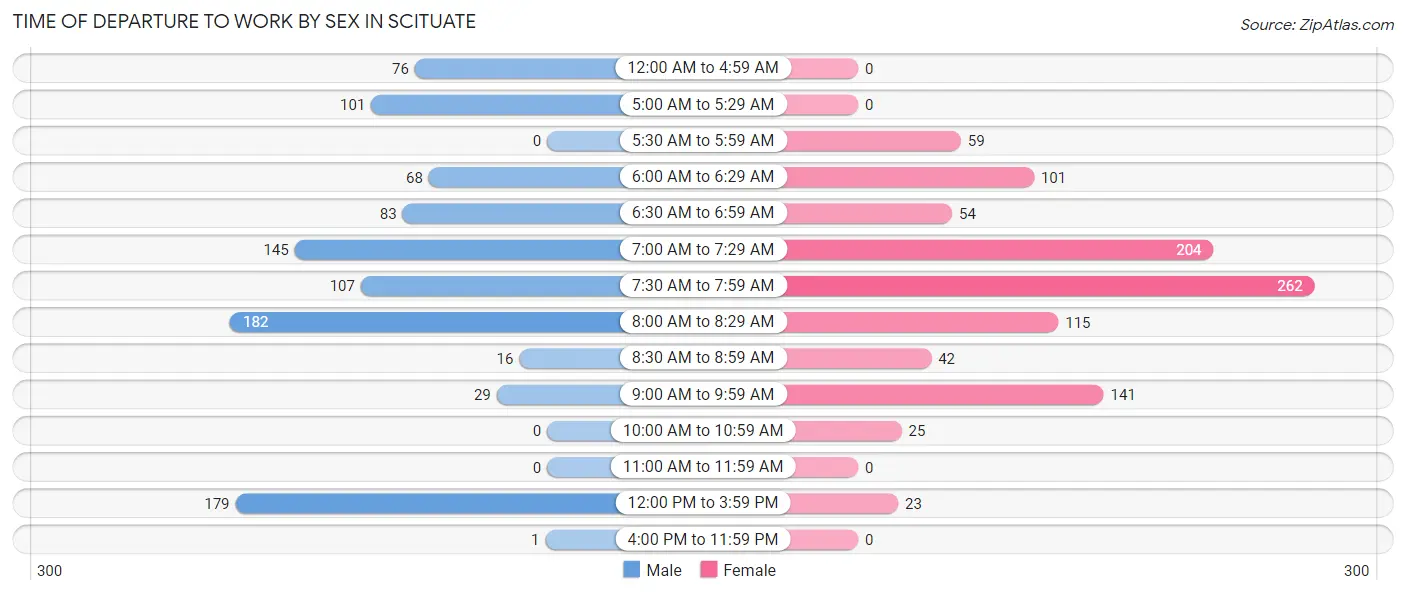
| Time of Departure | Male | Female |
| 12:00 AM to 4:59 AM | 76 (7.7%) | 0 (0.0%) |
| 5:00 AM to 5:29 AM | 101 (10.2%) | 0 (0.0%) |
| 5:30 AM to 5:59 AM | 0 (0.0%) | 59 (5.8%) |
| 6:00 AM to 6:29 AM | 68 (6.9%) | 101 (9.8%) |
| 6:30 AM to 6:59 AM | 83 (8.4%) | 54 (5.3%) |
| 7:00 AM to 7:29 AM | 145 (14.7%) | 204 (19.9%) |
| 7:30 AM to 7:59 AM | 107 (10.8%) | 262 (25.5%) |
| 8:00 AM to 8:29 AM | 182 (18.4%) | 115 (11.2%) |
| 8:30 AM to 8:59 AM | 16 (1.6%) | 42 (4.1%) |
| 9:00 AM to 9:59 AM | 29 (2.9%) | 141 (13.7%) |
| 10:00 AM to 10:59 AM | 0 (0.0%) | 25 (2.4%) |
| 11:00 AM to 11:59 AM | 0 (0.0%) | 0 (0.0%) |
| 12:00 PM to 3:59 PM | 179 (18.1%) | 23 (2.2%) |
| 4:00 PM to 11:59 PM | 1 (0.1%) | 0 (0.0%) |
| Total | 987 (100.0%) | 1,026 (100.0%) |
Housing Occupancy in Scituate
Occupancy by Ownership in Scituate
Of the total 2,481 dwellings in Scituate, owner-occupied units account for 2,063 (83.2%), while renter-occupied units make up 418 (16.9%).
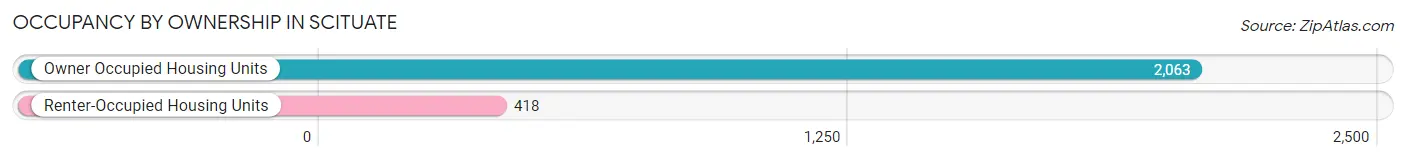
| Occupancy | # Housing Units | % Housing Units |
| Owner Occupied Housing Units | 2,063 | 83.2% |
| Renter-Occupied Housing Units | 418 | 16.9% |
| Total Occupied Housing Units | 2,481 | 100.0% |
Occupancy by Household Size in Scituate

| Household Size | # Housing Units | % Housing Units |
| 1-Person Household | 890 | 35.9% |
| 2-Person Household | 698 | 28.1% |
| 3-Person Household | 348 | 14.0% |
| 4+ Person Household | 545 | 22.0% |
| Total Housing Units | 2,481 | 100.0% |
Occupancy by Ownership by Household Size in Scituate
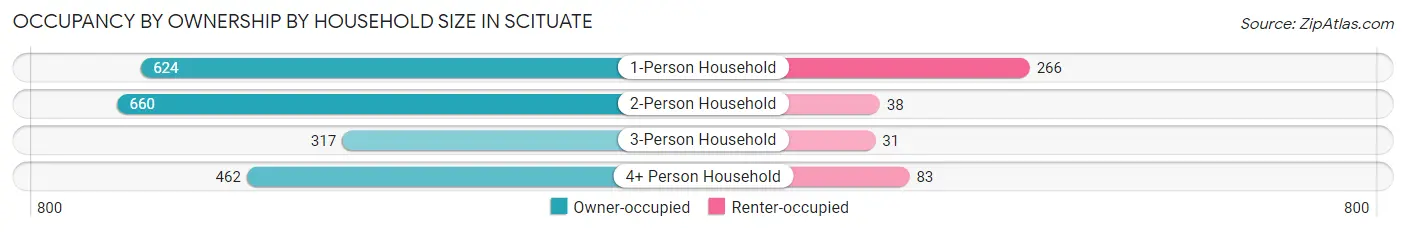
| Household Size | Owner-occupied | Renter-occupied |
| 1-Person Household | 624 (70.1%) | 266 (29.9%) |
| 2-Person Household | 660 (94.6%) | 38 (5.4%) |
| 3-Person Household | 317 (91.1%) | 31 (8.9%) |
| 4+ Person Household | 462 (84.8%) | 83 (15.2%) |
| Total Housing Units | 2,063 (83.2%) | 418 (16.9%) |
Occupancy by Educational Attainment in Scituate
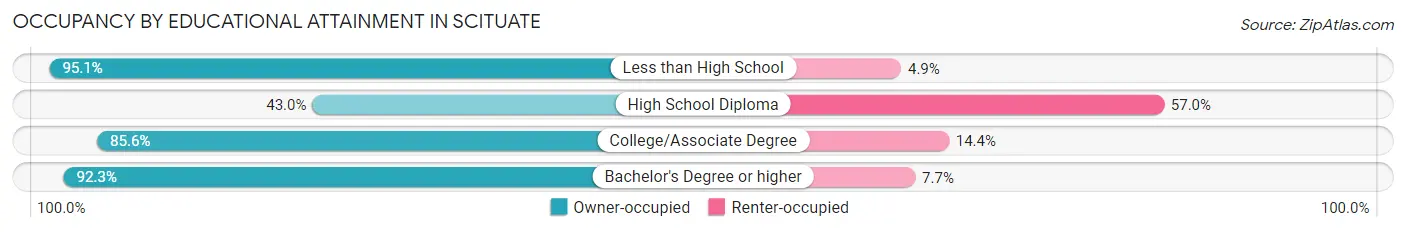
| Household Size | Owner-occupied | Renter-occupied |
| Less than High School | 193 (95.1%) | 10 (4.9%) |
| High School Diploma | 171 (43.0%) | 227 (57.0%) |
| College/Associate Degree | 458 (85.6%) | 77 (14.4%) |
| Bachelor's Degree or higher | 1,241 (92.3%) | 104 (7.7%) |
Occupancy by Age of Householder in Scituate
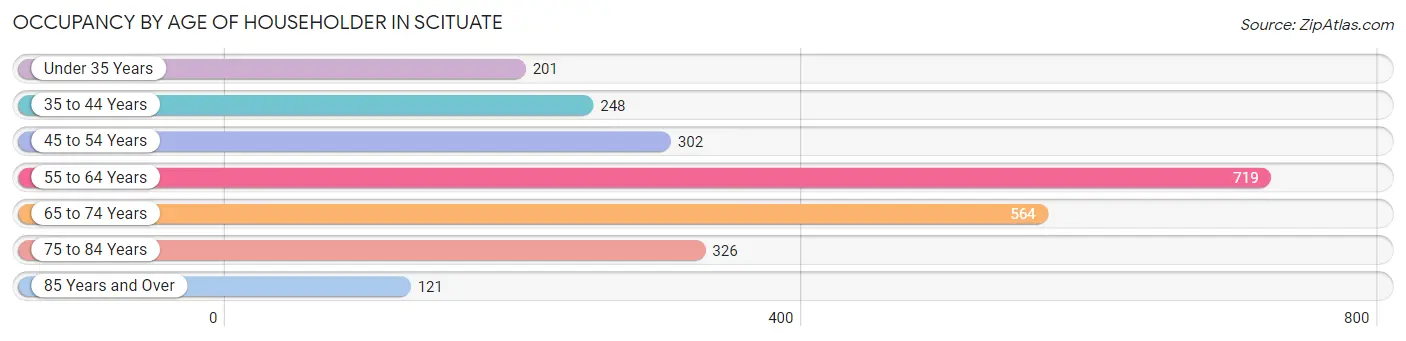
| Age Bracket | # Households | % Households |
| Under 35 Years | 201 | 8.1% |
| 35 to 44 Years | 248 | 10.0% |
| 45 to 54 Years | 302 | 12.2% |
| 55 to 64 Years | 719 | 29.0% |
| 65 to 74 Years | 564 | 22.7% |
| 75 to 84 Years | 326 | 13.1% |
| 85 Years and Over | 121 | 4.9% |
| Total | 2,481 | 100.0% |
Housing Finances in Scituate
Median Income by Occupancy in Scituate
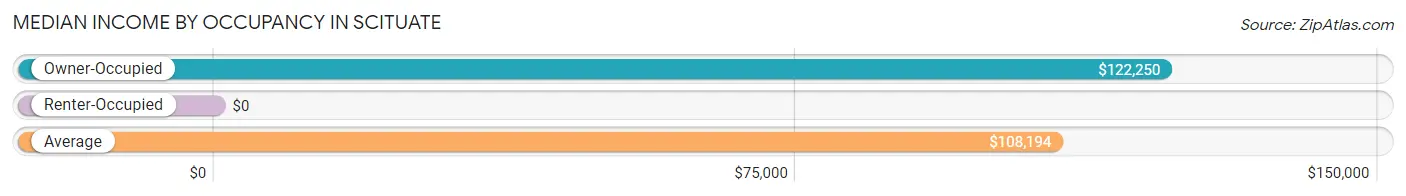
| Occupancy Type | # Households | Median Income |
| Owner-Occupied | 2,063 (83.2%) | $122,250 |
| Renter-Occupied | 418 (16.9%) | $0 |
| Average | 2,481 (100.0%) | $108,194 |
Occupancy by Householder Income Bracket in Scituate
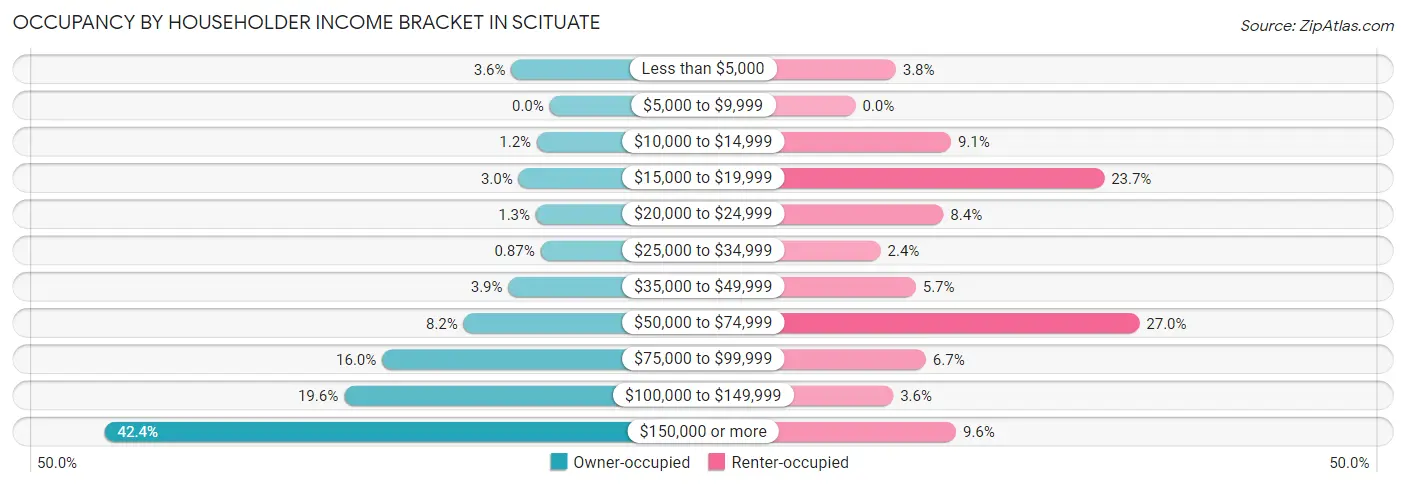
| Income Bracket | Owner-occupied | Renter-occupied |
| Less than $5,000 | 75 (3.6%) | 16 (3.8%) |
| $5,000 to $9,999 | 0 (0.0%) | 0 (0.0%) |
| $10,000 to $14,999 | 25 (1.2%) | 38 (9.1%) |
| $15,000 to $19,999 | 61 (3.0%) | 99 (23.7%) |
| $20,000 to $24,999 | 27 (1.3%) | 35 (8.4%) |
| $25,000 to $34,999 | 18 (0.9%) | 10 (2.4%) |
| $35,000 to $49,999 | 81 (3.9%) | 24 (5.7%) |
| $50,000 to $74,999 | 169 (8.2%) | 113 (27.0%) |
| $75,000 to $99,999 | 329 (16.0%) | 28 (6.7%) |
| $100,000 to $149,999 | 404 (19.6%) | 15 (3.6%) |
| $150,000 or more | 874 (42.4%) | 40 (9.6%) |
| Total | 2,063 (100.0%) | 418 (100.0%) |
Monthly Housing Cost Tiers in Scituate
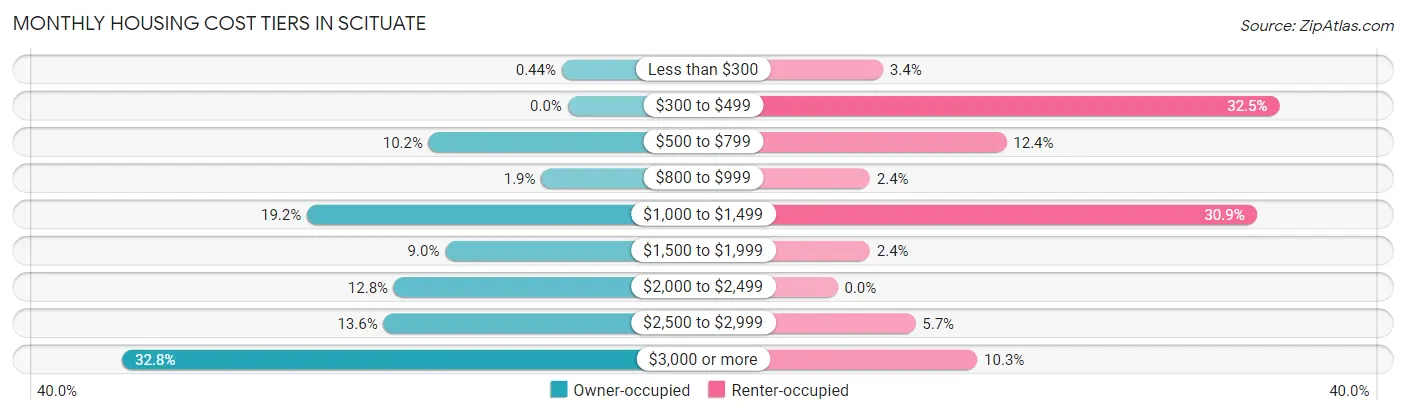
| Monthly Cost | Owner-occupied | Renter-occupied |
| Less than $300 | 9 (0.4%) | 14 (3.4%) |
| $300 to $499 | 0 (0.0%) | 136 (32.5%) |
| $500 to $799 | 211 (10.2%) | 52 (12.4%) |
| $800 to $999 | 40 (1.9%) | 10 (2.4%) |
| $1,000 to $1,499 | 396 (19.2%) | 129 (30.9%) |
| $1,500 to $1,999 | 186 (9.0%) | 10 (2.4%) |
| $2,000 to $2,499 | 264 (12.8%) | 0 (0.0%) |
| $2,500 to $2,999 | 280 (13.6%) | 24 (5.7%) |
| $3,000 or more | 677 (32.8%) | 43 (10.3%) |
| Total | 2,063 (100.0%) | 418 (100.0%) |
Physical Housing Characteristics in Scituate
Housing Structures in Scituate
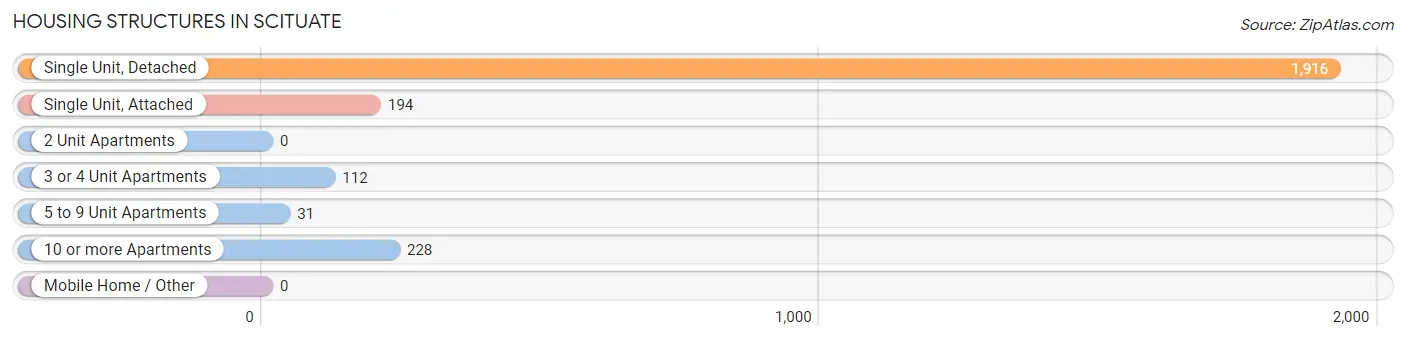
| Structure Type | # Housing Units | % Housing Units |
| Single Unit, Detached | 1,916 | 77.2% |
| Single Unit, Attached | 194 | 7.8% |
| 2 Unit Apartments | 0 | 0.0% |
| 3 or 4 Unit Apartments | 112 | 4.5% |
| 5 to 9 Unit Apartments | 31 | 1.3% |
| 10 or more Apartments | 228 | 9.2% |
| Mobile Home / Other | 0 | 0.0% |
| Total | 2,481 | 100.0% |
Housing Structures by Occupancy in Scituate
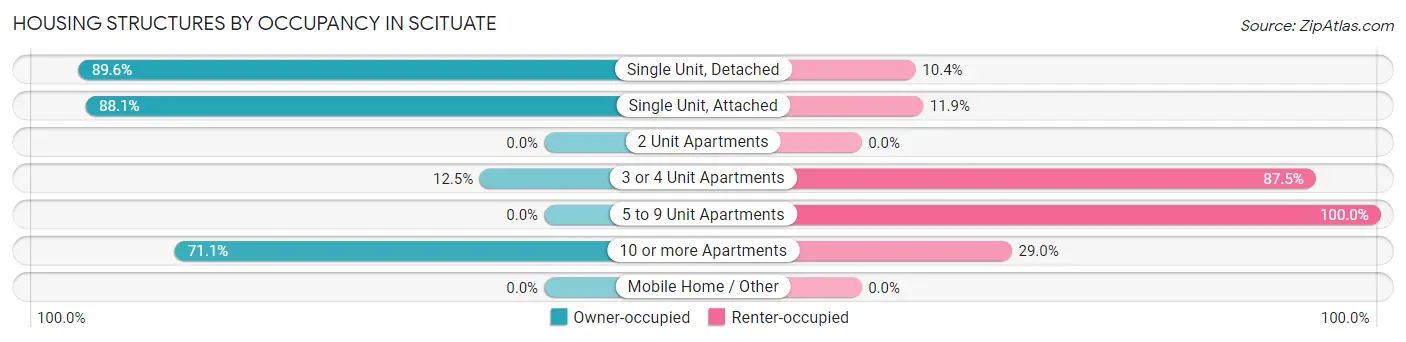
| Structure Type | Owner-occupied | Renter-occupied |
| Single Unit, Detached | 1,716 (89.6%) | 200 (10.4%) |
| Single Unit, Attached | 171 (88.1%) | 23 (11.9%) |
| 2 Unit Apartments | 0 (0.0%) | 0 (0.0%) |
| 3 or 4 Unit Apartments | 14 (12.5%) | 98 (87.5%) |
| 5 to 9 Unit Apartments | 0 (0.0%) | 31 (100.0%) |
| 10 or more Apartments | 162 (71.1%) | 66 (28.9%) |
| Mobile Home / Other | 0 (0.0%) | 0 (0.0%) |
| Total | 2,063 (83.2%) | 418 (16.9%) |
Housing Structures by Number of Rooms in Scituate
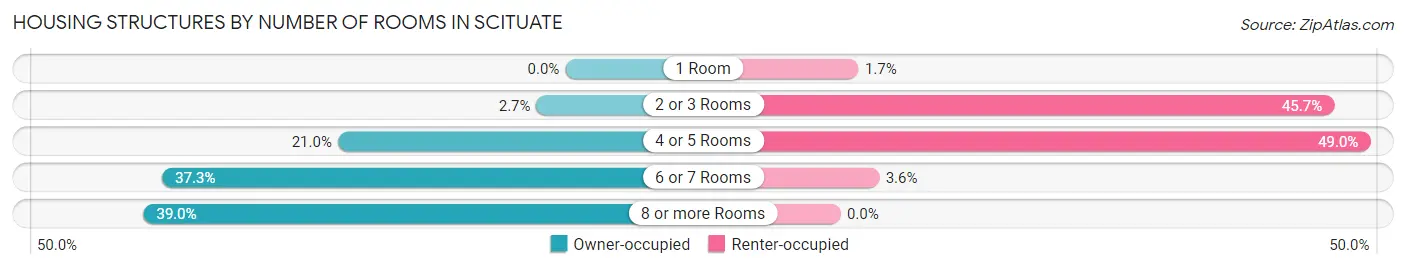
| Number of Rooms | Owner-occupied | Renter-occupied |
| 1 Room | 0 (0.0%) | 7 (1.7%) |
| 2 or 3 Rooms | 55 (2.7%) | 191 (45.7%) |
| 4 or 5 Rooms | 434 (21.0%) | 205 (49.0%) |
| 6 or 7 Rooms | 769 (37.3%) | 15 (3.6%) |
| 8 or more Rooms | 805 (39.0%) | 0 (0.0%) |
| Total | 2,063 (100.0%) | 418 (100.0%) |
Housing Structure by Heating Type in Scituate
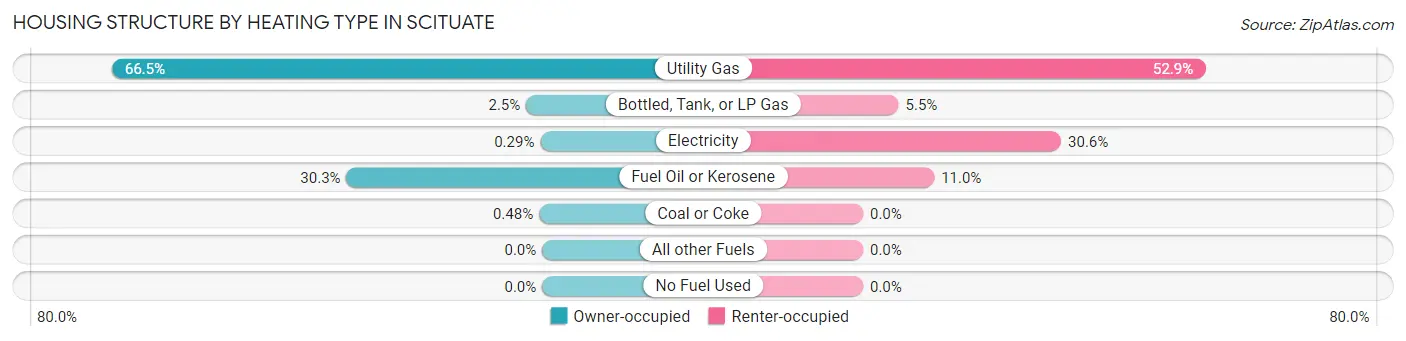
| Heating Type | Owner-occupied | Renter-occupied |
| Utility Gas | 1,372 (66.5%) | 221 (52.9%) |
| Bottled, Tank, or LP Gas | 51 (2.5%) | 23 (5.5%) |
| Electricity | 6 (0.3%) | 128 (30.6%) |
| Fuel Oil or Kerosene | 624 (30.2%) | 46 (11.0%) |
| Coal or Coke | 10 (0.5%) | 0 (0.0%) |
| All other Fuels | 0 (0.0%) | 0 (0.0%) |
| No Fuel Used | 0 (0.0%) | 0 (0.0%) |
| Total | 2,063 (100.0%) | 418 (100.0%) |
Household Vehicle Usage in Scituate
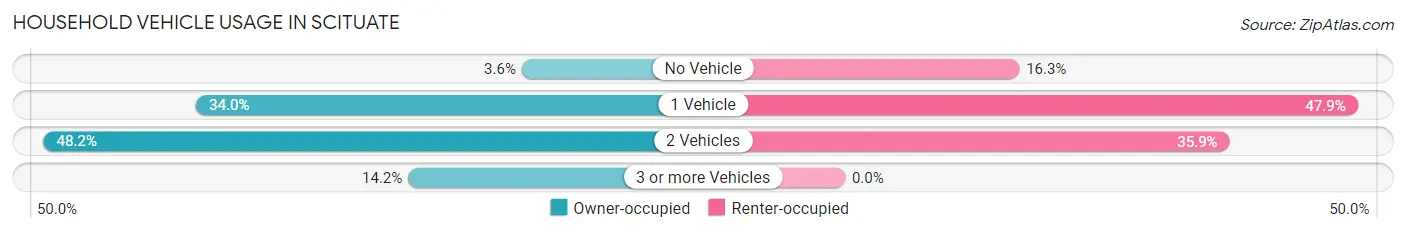
| Vehicles per Household | Owner-occupied | Renter-occupied |
| No Vehicle | 74 (3.6%) | 68 (16.3%) |
| 1 Vehicle | 701 (34.0%) | 200 (47.8%) |
| 2 Vehicles | 995 (48.2%) | 150 (35.9%) |
| 3 or more Vehicles | 293 (14.2%) | 0 (0.0%) |
| Total | 2,063 (100.0%) | 418 (100.0%) |
Real Estate & Mortgages in Scituate
Real Estate and Mortgage Overview in Scituate
| Characteristic | Without Mortgage | With Mortgage |
| Housing Units | 745 | 1,318 |
| Median Property Value | $617,400 | $677,500 |
| Median Household Income | $93,583 | $643 |
| Monthly Housing Costs | $1,098 | $657 |
| Real Estate Taxes | $7,233 | $0 |
Property Value by Mortgage Status in Scituate
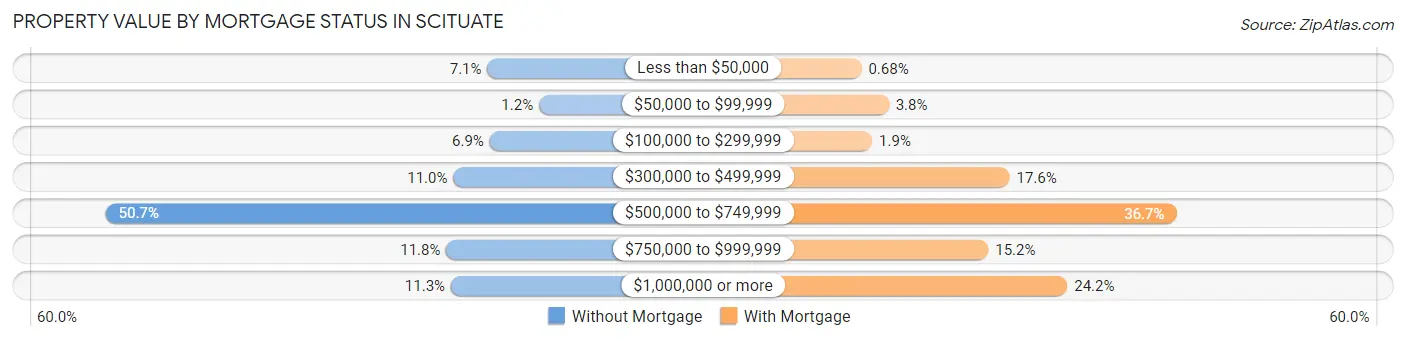
| Property Value | Without Mortgage | With Mortgage |
| Less than $50,000 | 53 (7.1%) | 9 (0.7%) |
| $50,000 to $99,999 | 9 (1.2%) | 50 (3.8%) |
| $100,000 to $299,999 | 51 (6.9%) | 25 (1.9%) |
| $300,000 to $499,999 | 82 (11.0%) | 232 (17.6%) |
| $500,000 to $749,999 | 378 (50.7%) | 483 (36.6%) |
| $750,000 to $999,999 | 88 (11.8%) | 200 (15.2%) |
| $1,000,000 or more | 84 (11.3%) | 319 (24.2%) |
| Total | 745 (100.0%) | 1,318 (100.0%) |
Household Income by Mortgage Status in Scituate
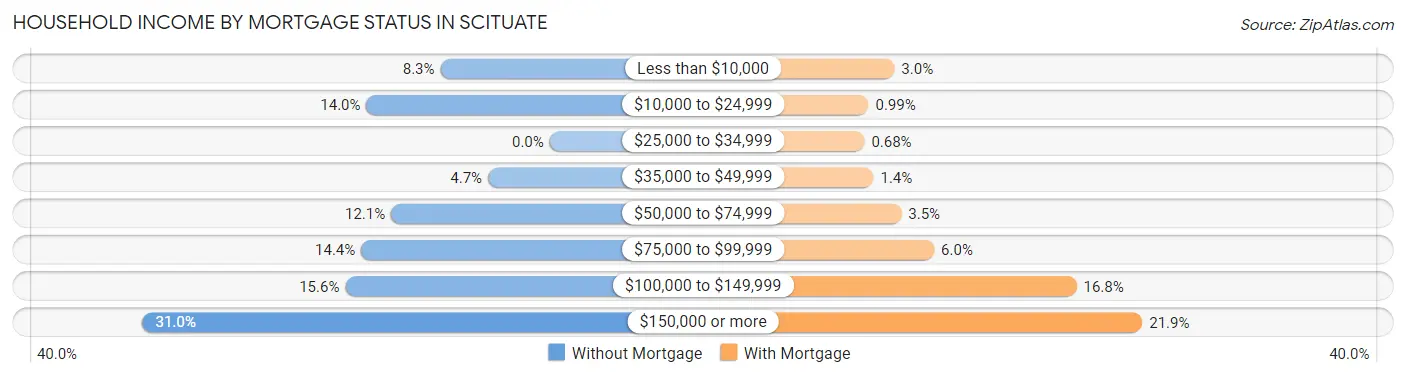
| Household Income | Without Mortgage | With Mortgage |
| Less than $10,000 | 62 (8.3%) | 39 (3.0%) |
| $10,000 to $24,999 | 104 (14.0%) | 13 (1.0%) |
| $25,000 to $34,999 | 0 (0.0%) | 9 (0.7%) |
| $35,000 to $49,999 | 35 (4.7%) | 18 (1.4%) |
| $50,000 to $74,999 | 90 (12.1%) | 46 (3.5%) |
| $75,000 to $99,999 | 107 (14.4%) | 79 (6.0%) |
| $100,000 to $149,999 | 116 (15.6%) | 222 (16.8%) |
| $150,000 or more | 231 (31.0%) | 288 (21.8%) |
| Total | 745 (100.0%) | 1,318 (100.0%) |
Property Value to Household Income Ratio in Scituate
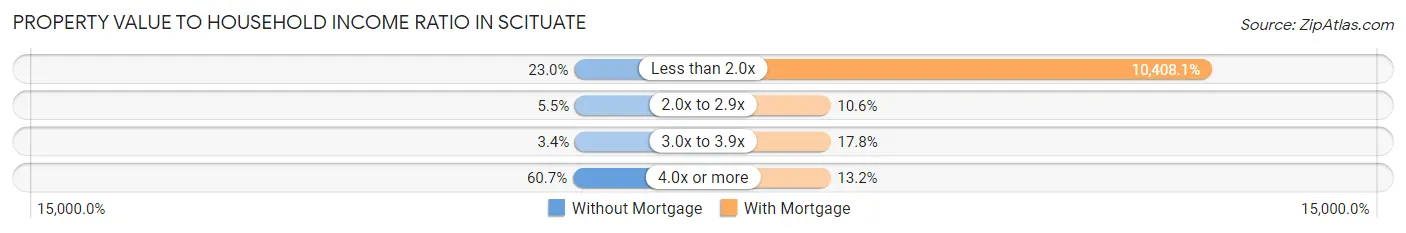
| Value-to-Income Ratio | Without Mortgage | With Mortgage |
| Less than 2.0x | 171 (23.0%) | 137,179 (10,408.1%) |
| 2.0x to 2.9x | 41 (5.5%) | 140 (10.6%) |
| 3.0x to 3.9x | 25 (3.4%) | 234 (17.7%) |
| 4.0x or more | 452 (60.7%) | 174 (13.2%) |
| Total | 745 (100.0%) | 1,318 (100.0%) |
Real Estate Taxes by Mortgage Status in Scituate
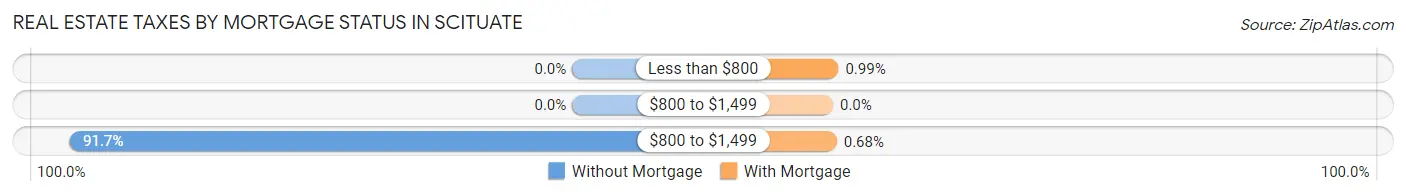
| Property Taxes | Without Mortgage | With Mortgage |
| Less than $800 | 0 (0.0%) | 13 (1.0%) |
| $800 to $1,499 | 0 (0.0%) | 0 (0.0%) |
| $800 to $1,499 | 683 (91.7%) | 9 (0.7%) |
| Total | 745 (100.0%) | 1,318 (100.0%) |
Health & Disability in Scituate
Health Insurance Coverage by Age in Scituate
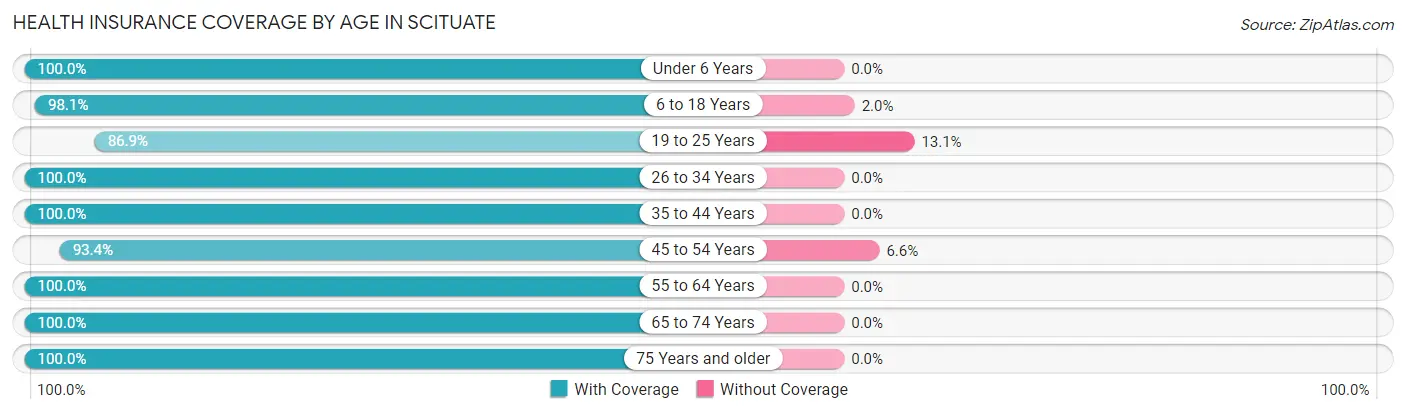
| Age Bracket | With Coverage | Without Coverage |
| Under 6 Years | 73 (100.0%) | 0 (0.0%) |
| 6 to 18 Years | 1,057 (98.1%) | 21 (1.9%) |
| 19 to 25 Years | 226 (86.9%) | 34 (13.1%) |
| 26 to 34 Years | 332 (100.0%) | 0 (0.0%) |
| 35 to 44 Years | 481 (100.0%) | 0 (0.0%) |
| 45 to 54 Years | 712 (93.4%) | 50 (6.6%) |
| 55 to 64 Years | 931 (100.0%) | 0 (0.0%) |
| 65 to 74 Years | 855 (100.0%) | 0 (0.0%) |
| 75 Years and older | 616 (100.0%) | 0 (0.0%) |
| Total | 5,283 (98.1%) | 105 (1.9%) |
Health Insurance Coverage by Citizenship Status in Scituate
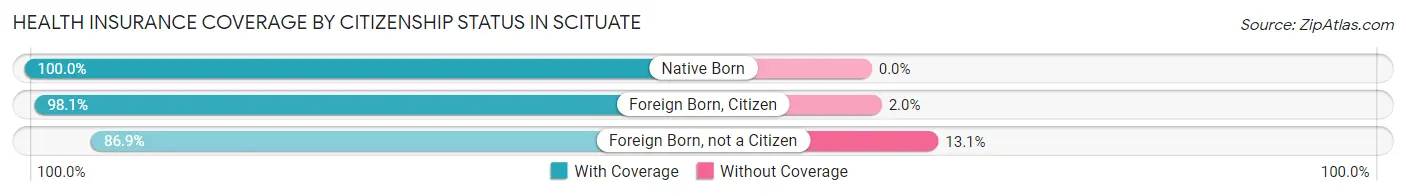
| Citizenship Status | With Coverage | Without Coverage |
| Native Born | 73 (100.0%) | 0 (0.0%) |
| Foreign Born, Citizen | 1,057 (98.1%) | 21 (1.9%) |
| Foreign Born, not a Citizen | 226 (86.9%) | 34 (13.1%) |
Health Insurance Coverage by Household Income in Scituate
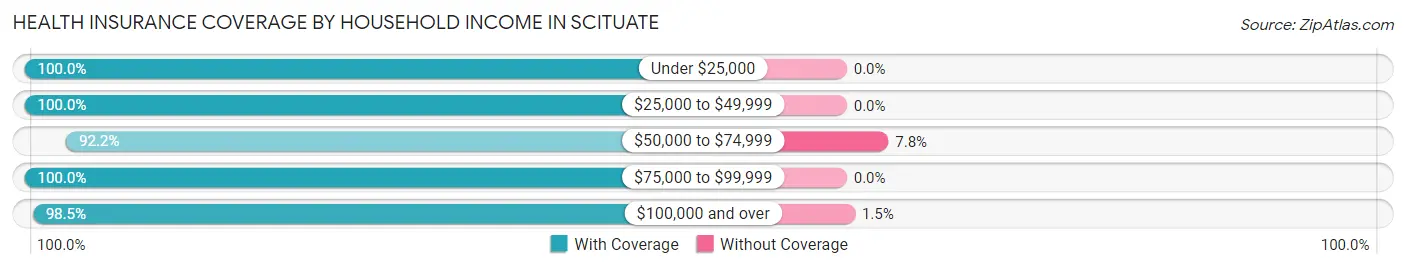
| Household Income | With Coverage | Without Coverage |
| Under $25,000 | 429 (100.0%) | 0 (0.0%) |
| $25,000 to $49,999 | 204 (100.0%) | 0 (0.0%) |
| $50,000 to $74,999 | 593 (92.2%) | 50 (7.8%) |
| $75,000 to $99,999 | 518 (100.0%) | 0 (0.0%) |
| $100,000 and over | 3,534 (98.5%) | 55 (1.5%) |
Public vs Private Health Insurance Coverage by Age in Scituate
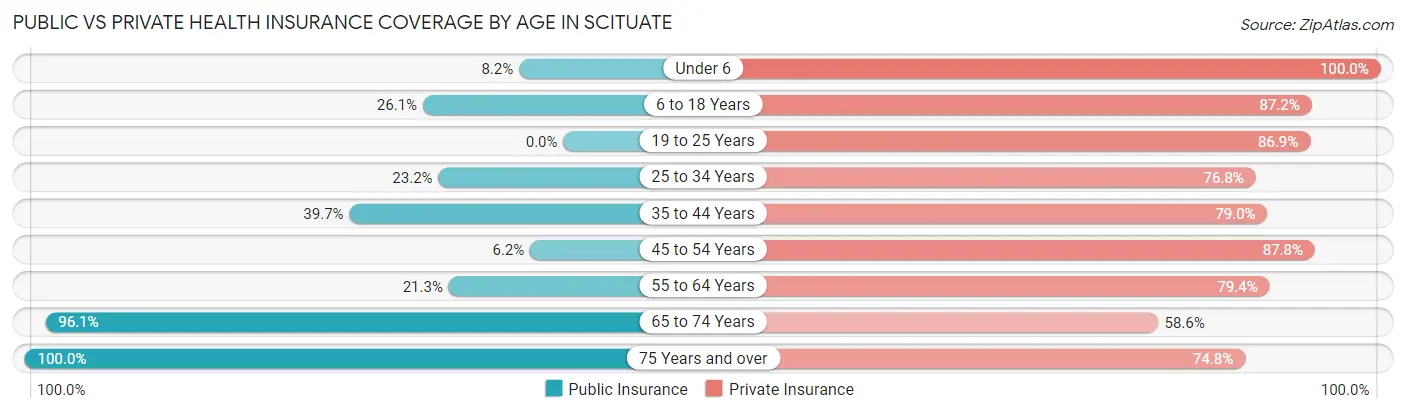
| Age Bracket | Public Insurance | Private Insurance |
| Under 6 | 6 (8.2%) | 73 (100.0%) |
| 6 to 18 Years | 281 (26.1%) | 940 (87.2%) |
| 19 to 25 Years | 0 (0.0%) | 226 (86.9%) |
| 25 to 34 Years | 77 (23.2%) | 255 (76.8%) |
| 35 to 44 Years | 191 (39.7%) | 380 (79.0%) |
| 45 to 54 Years | 47 (6.2%) | 669 (87.8%) |
| 55 to 64 Years | 198 (21.3%) | 739 (79.4%) |
| 65 to 74 Years | 822 (96.1%) | 501 (58.6%) |
| 75 Years and over | 616 (100.0%) | 461 (74.8%) |
| Total | 2,238 (41.5%) | 4,244 (78.8%) |
Disability Status by Sex by Age in Scituate
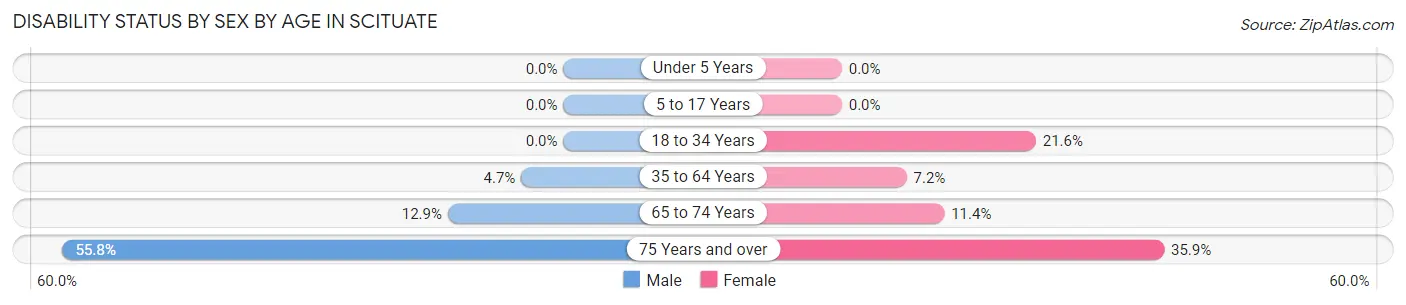
| Age Bracket | Male | Female |
| Under 5 Years | 0 (0.0%) | 0 (0.0%) |
| 5 to 17 Years | 0 (0.0%) | 0 (0.0%) |
| 18 to 34 Years | 0 (0.0%) | 83 (21.6%) |
| 35 to 64 Years | 43 (4.7%) | 91 (7.2%) |
| 65 to 74 Years | 39 (12.9%) | 63 (11.4%) |
| 75 Years and over | 140 (55.8%) | 131 (35.9%) |
Disability Class by Sex by Age in Scituate
Disability Class: Hearing Difficulty
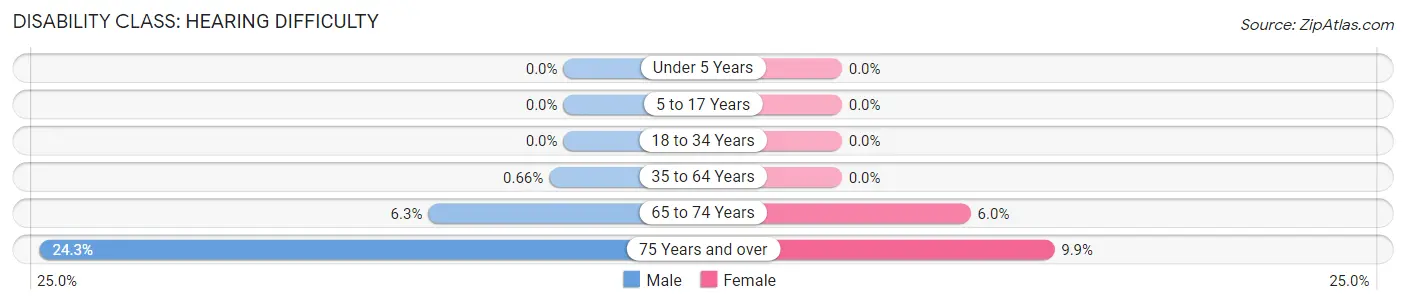
| Age Bracket | Male | Female |
| Under 5 Years | 0 (0.0%) | 0 (0.0%) |
| 5 to 17 Years | 0 (0.0%) | 0 (0.0%) |
| 18 to 34 Years | 0 (0.0%) | 0 (0.0%) |
| 35 to 64 Years | 6 (0.7%) | 0 (0.0%) |
| 65 to 74 Years | 19 (6.3%) | 33 (6.0%) |
| 75 Years and over | 61 (24.3%) | 36 (9.9%) |
Disability Class: Vision Difficulty
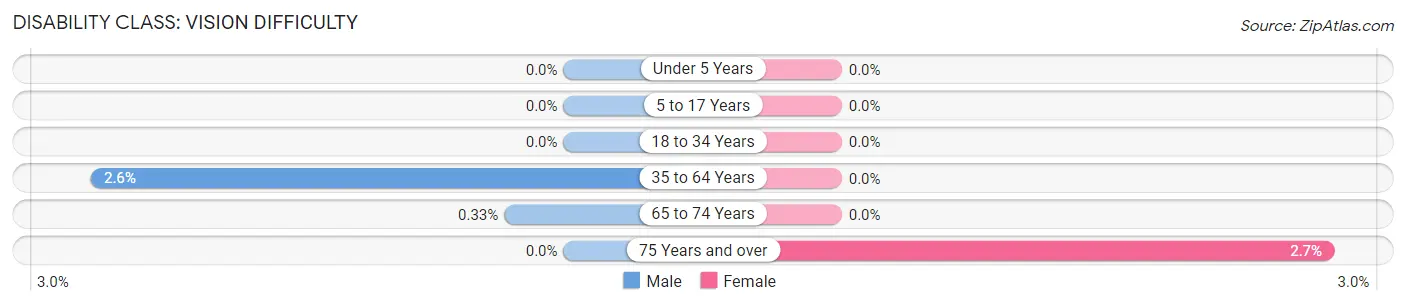
| Age Bracket | Male | Female |
| Under 5 Years | 0 (0.0%) | 0 (0.0%) |
| 5 to 17 Years | 0 (0.0%) | 0 (0.0%) |
| 18 to 34 Years | 0 (0.0%) | 0 (0.0%) |
| 35 to 64 Years | 24 (2.6%) | 0 (0.0%) |
| 65 to 74 Years | 1 (0.3%) | 0 (0.0%) |
| 75 Years and over | 0 (0.0%) | 10 (2.7%) |
Disability Class: Cognitive Difficulty
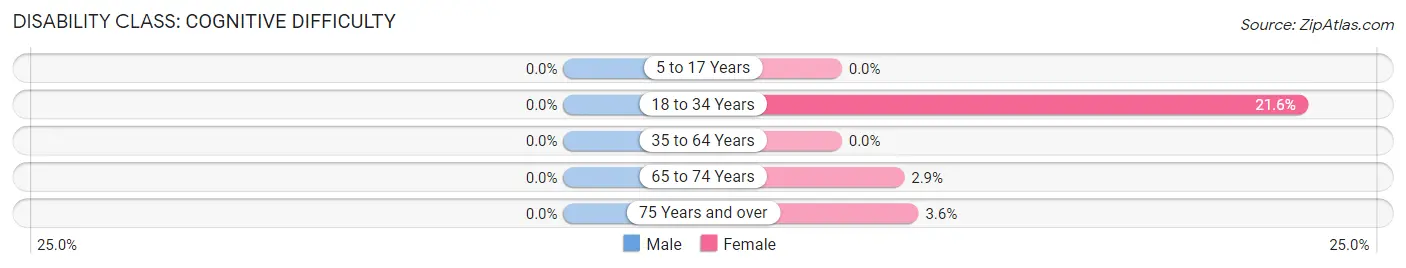
| Age Bracket | Male | Female |
| 5 to 17 Years | 0 (0.0%) | 0 (0.0%) |
| 18 to 34 Years | 0 (0.0%) | 83 (21.6%) |
| 35 to 64 Years | 0 (0.0%) | 0 (0.0%) |
| 65 to 74 Years | 0 (0.0%) | 16 (2.9%) |
| 75 Years and over | 0 (0.0%) | 13 (3.6%) |
Disability Class: Ambulatory Difficulty
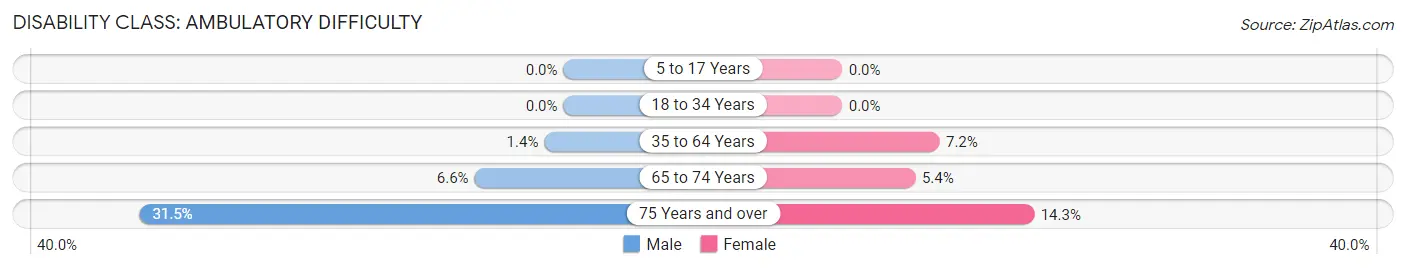
| Age Bracket | Male | Female |
| 5 to 17 Years | 0 (0.0%) | 0 (0.0%) |
| 18 to 34 Years | 0 (0.0%) | 0 (0.0%) |
| 35 to 64 Years | 13 (1.4%) | 91 (7.2%) |
| 65 to 74 Years | 20 (6.6%) | 30 (5.4%) |
| 75 Years and over | 79 (31.5%) | 52 (14.2%) |
Disability Class: Self-Care Difficulty
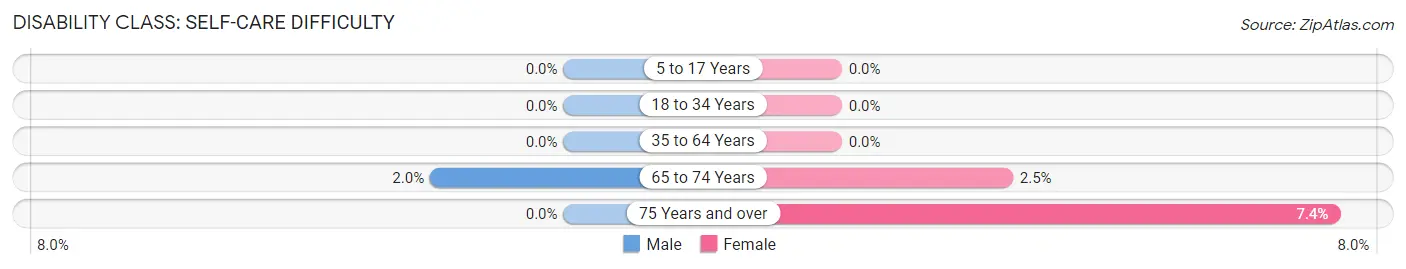
| Age Bracket | Male | Female |
| 5 to 17 Years | 0 (0.0%) | 0 (0.0%) |
| 18 to 34 Years | 0 (0.0%) | 0 (0.0%) |
| 35 to 64 Years | 0 (0.0%) | 0 (0.0%) |
| 65 to 74 Years | 6 (2.0%) | 14 (2.5%) |
| 75 Years and over | 0 (0.0%) | 27 (7.4%) |
Technology Access in Scituate
Computing Device Access in Scituate
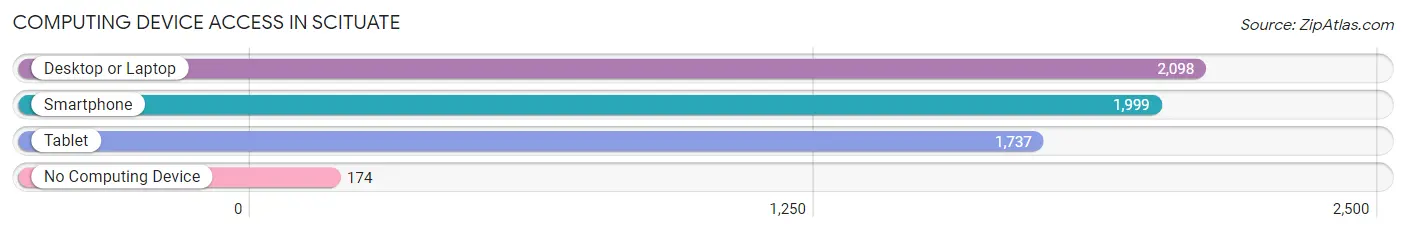
| Device Type | # Households | % Households |
| Desktop or Laptop | 2,098 | 84.6% |
| Smartphone | 1,999 | 80.6% |
| Tablet | 1,737 | 70.0% |
| No Computing Device | 174 | 7.0% |
| Total | 2,481 | 100.0% |
Internet Access in Scituate
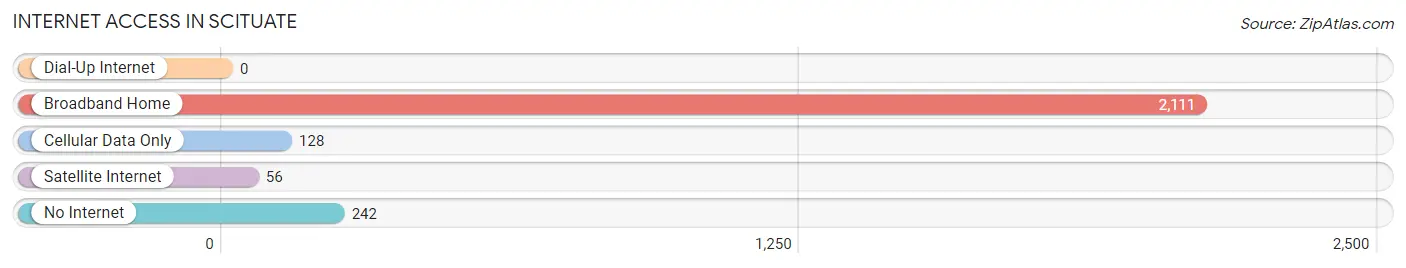
| Internet Type | # Households | % Households |
| Dial-Up Internet | 0 | 0.0% |
| Broadband Home | 2,111 | 85.1% |
| Cellular Data Only | 128 | 5.2% |
| Satellite Internet | 56 | 2.3% |
| No Internet | 242 | 9.8% |
| Total | 2,481 | 100.0% |
Scituate Summary
Scituate, Massachusetts is a coastal town located in Plymouth County, approximately 30 miles south of Boston. It is bordered by Marshfield to the east, Norwell to the west, Cohasset to the north, and the Atlantic Ocean to the south. The town is comprised of several villages, including North Scituate, Humarock, Greenbush, and Minot.
History
Scituate was first settled in 1627 by a group of English colonists led by William Vassall. The town was named after the Wampanoag word for “cold brook”, which referred to the area’s many freshwater streams. The town was officially incorporated in 1636, and quickly became a thriving fishing and farming community. In the late 19th century, the town began to develop as a summer resort destination, and many of the town’s historic homes and buildings were built during this period.
Geography
Scituate is located on the South Shore of Massachusetts, approximately 30 miles south of Boston. The town is bordered by Marshfield to the east, Norwell to the west, Cohasset to the north, and the Atlantic Ocean to the south. The town is comprised of several villages, including North Scituate, Humarock, Greenbush, and Minot. The town is located on a peninsula, with the North and South Rivers forming the northern and southern boundaries, respectively. The town is home to several beaches, including Egypt Beach, Humarock Beach, and Sand Hills Beach.
Economy
Scituate’s economy is largely based on tourism, fishing, and farming. The town is home to several marinas, which provide services to recreational and commercial fishermen. The town is also home to several farms, which produce a variety of fruits and vegetables. In addition, the town is home to several small businesses, including restaurants, retail stores, and art galleries.
Demographics
As of the 2010 census, Scituate had a population of 18,133. The median household income was $90,837, and the median age was 44. The town is predominantly white (94.3%), with small percentages of African American (1.3%), Asian (1.7%), and Hispanic (1.7%) residents. The town is also home to a large number of seasonal residents, who come to enjoy the town’s beaches and other attractions.
Scituate is a small town with a rich history and a vibrant economy. The town is home to a diverse population, and is a popular destination for tourists and seasonal residents. The town’s economy is largely based on tourism, fishing, and farming, and the town is home to several marinas, farms, and small businesses. Scituate is a great place to live, work, and play.
Common Questions
What is Per Capita Income in Scituate?
Per Capita income in Scituate is $79,010.
What is the Median Family Income in Scituate?
Median Family Income in Scituate is $135,217.
What is the Median Household income in Scituate?
Median Household Income in Scituate is $108,194.
What is Income or Wage Gap in Scituate?
Income or Wage Gap in Scituate is 50.5%.
Women in Scituate earn 49.5 cents for every dollar earned by a man.
What is Inequality or Gini Index in Scituate?
Inequality or Gini Index in Scituate is 0.52.
What is the Total Population of Scituate?
Total Population of Scituate is 5,442.
What is the Total Male Population of Scituate?
Total Male Population of Scituate is 2,108.
What is the Total Female Population of Scituate?
Total Female Population of Scituate is 3,334.
What is the Ratio of Males per 100 Females in Scituate?
There are 63.23 Males per 100 Females in Scituate.
What is the Ratio of Females per 100 Males in Scituate?
There are 158.16 Females per 100 Males in Scituate.
What is the Median Population Age in Scituate?
Median Population Age in Scituate is 52.0 Years.
What is the Average Family Size in Scituate
Average Family Size in Scituate is 2.8 People.
What is the Average Household Size in Scituate
Average Household Size in Scituate is 2.2 People.
How Large is the Labor Force in Scituate?
There are 2,517 People in the Labor Forcein in Scituate.
What is the Percentage of People in the Labor Force in Scituate?
55.4% of People are in the Labor Force in Scituate.
What is the Unemployment Rate in Scituate?
Unemployment Rate in Scituate is 2.1%.