Graniteville, VT Map & Demographics
Graniteville Map
Graniteville Overview
$60,586
PER CAPITA INCOME
$66,250
AVG FAMILY INCOME
$34,026
AVG HOUSEHOLD INCOME
9.2%
WAGE / INCOME GAP [ % ]
90.8¢/ $1
WAGE / INCOME GAP [ $ ]
0.62
INEQUALITY / GINI INDEX
487
TOTAL POPULATION
276
MALE POPULATION
211
FEMALE POPULATION
130.81
MALES / 100 FEMALES
76.45
FEMALES / 100 MALES
32.9
MEDIAN AGE
3.0
AVG FAMILY SIZE
1.4
AVG HOUSEHOLD SIZE
290
LABOR FORCE [ PEOPLE ]
73.6%
PERCENT IN LABOR FORCE
4.8%
UNEMPLOYMENT RATE
Graniteville Zip Codes
Graniteville Area Codes
Income in Graniteville
Income Overview in Graniteville
Per Capita Income in Graniteville is $60,586, while median incomes of families and households are $66,250 and $34,026 respectively.
| Characteristic | Number | Measure |
| Per Capita Income | 487 | $60,586 |
| Median Family Income | 70 | $66,250 |
| Mean Family Income | 70 | $68,007 |
| Median Household Income | 335 | $34,026 |
| Mean Household Income | 335 | $87,296 |
| Income Deficit | 70 | $0 |
| Wage / Income Gap (%) | 487 | 9.19% |
| Wage / Income Gap ($) | 487 | 90.81¢ per $1 |
| Gini / Inequality Index | 487 | 0.62 |
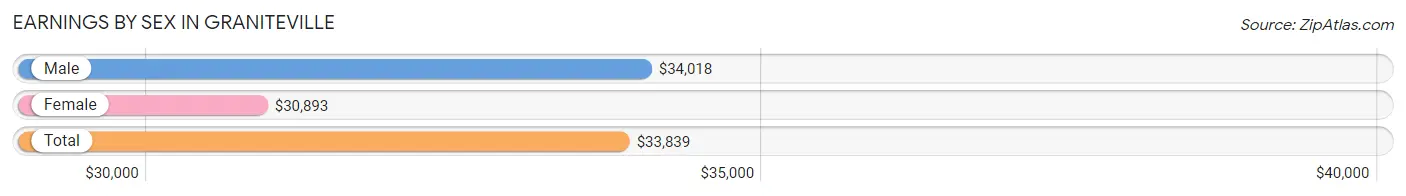
Earnings by Sex in Graniteville
Average Earnings in Graniteville are $33,839, $34,018 for men and $30,893 for women, a difference of 9.2%.
| Sex | Number | Average Earnings |
| Male | 222 (76.5%) | $34,018 |
| Female | 68 (23.4%) | $30,893 |
| Total | 290 (100.0%) | $33,839 |
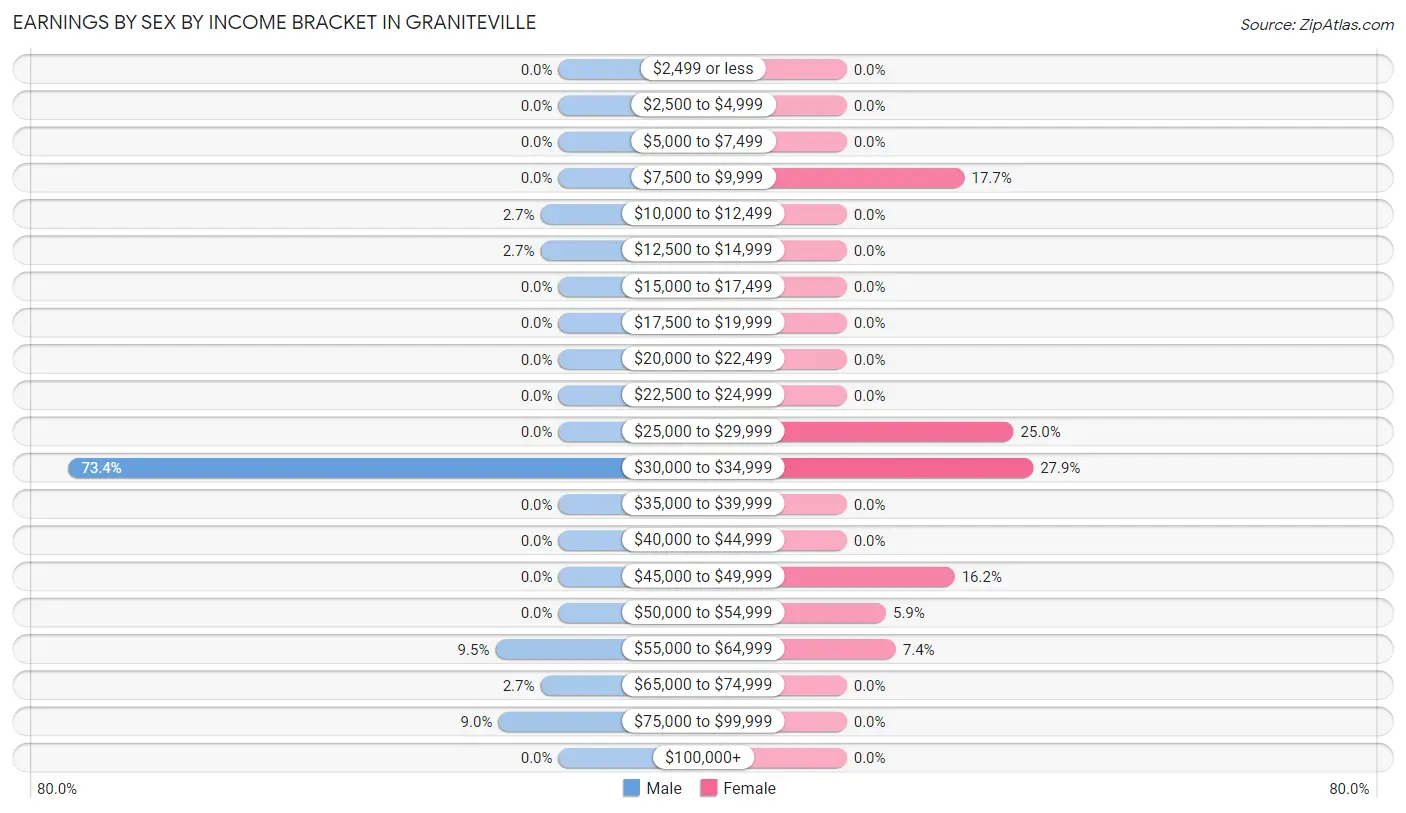
Earnings by Sex by Income Bracket in Graniteville
The most common earnings brackets in Graniteville are $30,000 to $34,999 for men (163 | 73.4%) and $30,000 to $34,999 for women (19 | 27.9%).
| Income | Male | Female |
| $2,499 or less | 0 (0.0%) | 0 (0.0%) |
| $2,500 to $4,999 | 0 (0.0%) | 0 (0.0%) |
| $5,000 to $7,499 | 0 (0.0%) | 0 (0.0%) |
| $7,500 to $9,999 | 0 (0.0%) | 12 (17.6%) |
| $10,000 to $12,499 | 6 (2.7%) | 0 (0.0%) |
| $12,500 to $14,999 | 6 (2.7%) | 0 (0.0%) |
| $15,000 to $17,499 | 0 (0.0%) | 0 (0.0%) |
| $17,500 to $19,999 | 0 (0.0%) | 0 (0.0%) |
| $20,000 to $22,499 | 0 (0.0%) | 0 (0.0%) |
| $22,500 to $24,999 | 0 (0.0%) | 0 (0.0%) |
| $25,000 to $29,999 | 0 (0.0%) | 17 (25.0%) |
| $30,000 to $34,999 | 163 (73.4%) | 19 (27.9%) |
| $35,000 to $39,999 | 0 (0.0%) | 0 (0.0%) |
| $40,000 to $44,999 | 0 (0.0%) | 0 (0.0%) |
| $45,000 to $49,999 | 0 (0.0%) | 11 (16.2%) |
| $50,000 to $54,999 | 0 (0.0%) | 4 (5.9%) |
| $55,000 to $64,999 | 21 (9.5%) | 5 (7.3%) |
| $65,000 to $74,999 | 6 (2.7%) | 0 (0.0%) |
| $75,000 to $99,999 | 20 (9.0%) | 0 (0.0%) |
| $100,000+ | 0 (0.0%) | 0 (0.0%) |
| Total | 222 (100.0%) | 68 (100.0%) |
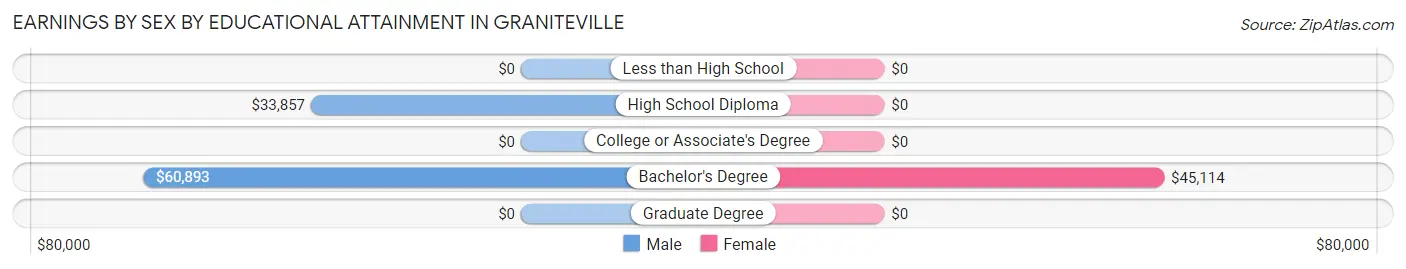
Earnings by Sex by Educational Attainment in Graniteville
Average earnings in Graniteville are $34,018 for men and $30,893 for women, a difference of 9.2%. Men with an educational attainment of bachelor's degree enjoy the highest average annual earnings of $60,893, while those with high school diploma education earn the least with $33,857. Women with an educational attainment of bachelor's degree earn the most with the average annual earnings of $45,114, while those with bachelor's degree education have the smallest earnings of $45,114.
| Educational Attainment | Male Income | Female Income |
| Less than High School | - | - |
| High School Diploma | $33,857 | $0 |
| College or Associate's Degree | - | - |
| Bachelor's Degree | $60,893 | $45,114 |
| Graduate Degree | - | - |
| Total | $34,018 | $30,893 |
Family Income in Graniteville
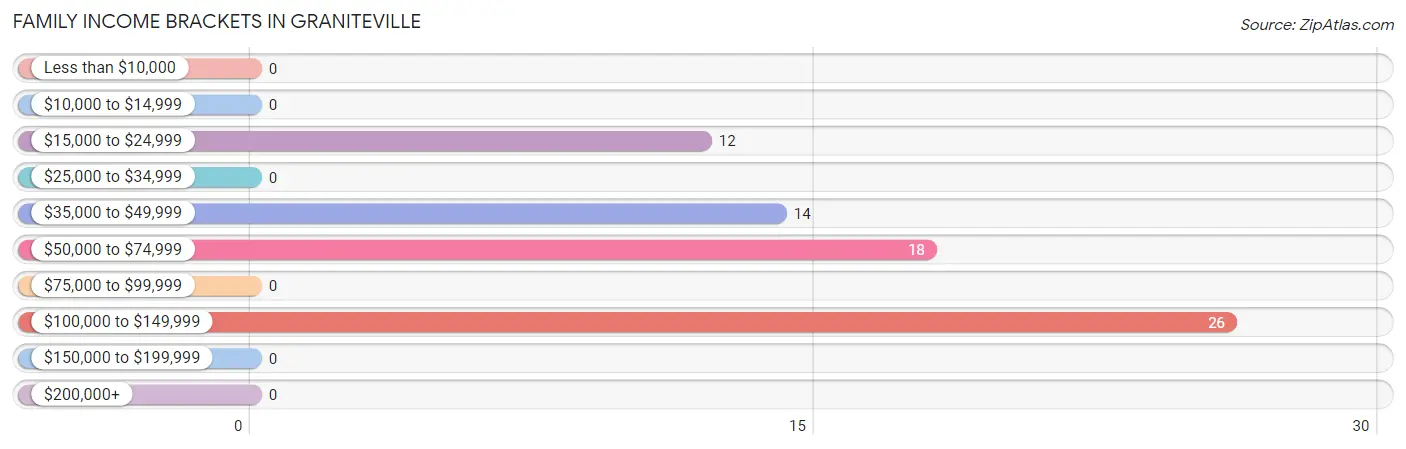
Family Income Brackets in Graniteville
According to the Graniteville family income data, there are 26 families falling into the $100,000 to $149,999 income range, which is the most common income bracket and makes up 37.1% of all families.
| Income Bracket | # Families | % Families |
| Less than $10,000 | 0 | 0.0% |
| $10,000 to $14,999 | 0 | 0.0% |
| $15,000 to $24,999 | 12 | 17.1% |
| $25,000 to $34,999 | 0 | 0.0% |
| $35,000 to $49,999 | 14 | 20.0% |
| $50,000 to $74,999 | 18 | 25.7% |
| $75,000 to $99,999 | 0 | 0.0% |
| $100,000 to $149,999 | 26 | 37.1% |
| $150,000 to $199,999 | 0 | 0.0% |
| $200,000+ | 0 | 0.0% |
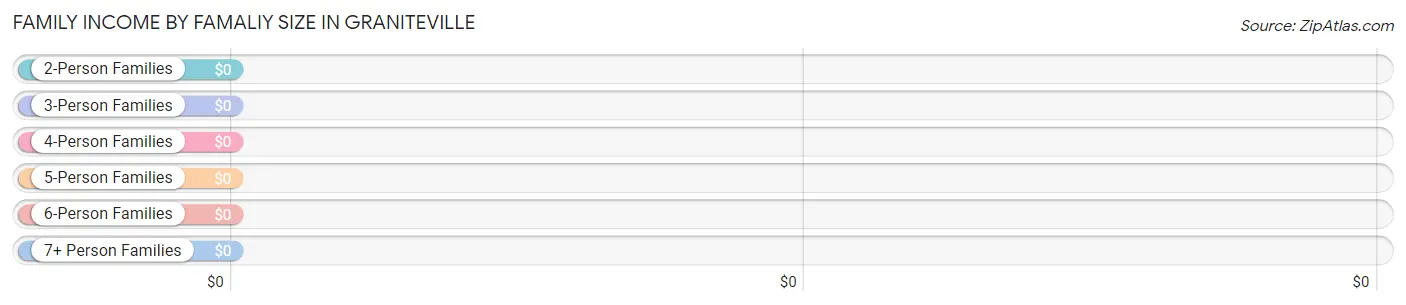
Family Income by Famaliy Size in Graniteville
| Income Bracket | # Families | Median Income |
| 2-Person Families | 45 (64.3%) | $0 |
| 3-Person Families | 11 (15.7%) | $0 |
| 4-Person Families | 0 (0.0%) | $0 |
| 5-Person Families | 14 (20.0%) | $0 |
| 6-Person Families | 0 (0.0%) | $0 |
| 7+ Person Families | 0 (0.0%) | $0 |
| Total | 70 (100.0%) | $66,250 |
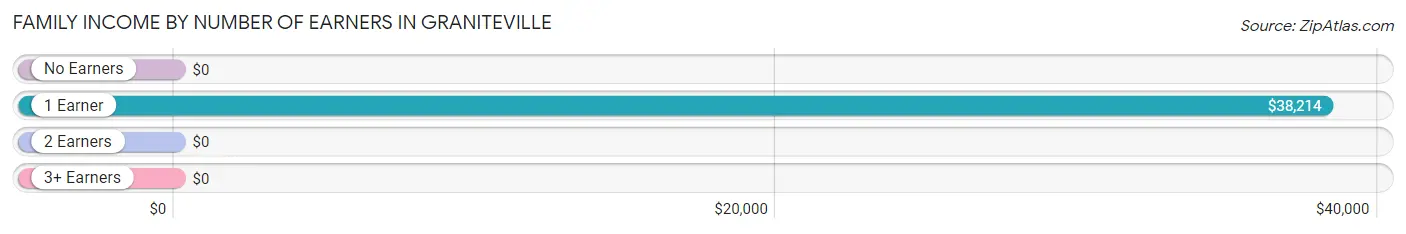
Family Income by Number of Earners in Graniteville
| Number of Earners | # Families | Median Income |
| No Earners | 12 (17.1%) | $0 |
| 1 Earner | 32 (45.7%) | $38,214 |
| 2 Earners | 21 (30.0%) | $0 |
| 3+ Earners | 5 (7.1%) | $0 |
| Total | 70 (100.0%) | $66,250 |
Household Income in Graniteville
Household Income Brackets in Graniteville
With 163 households falling in the category, the $25,000 to $34,999 income range is the most frequent in Graniteville, accounting for 48.7% of all households.
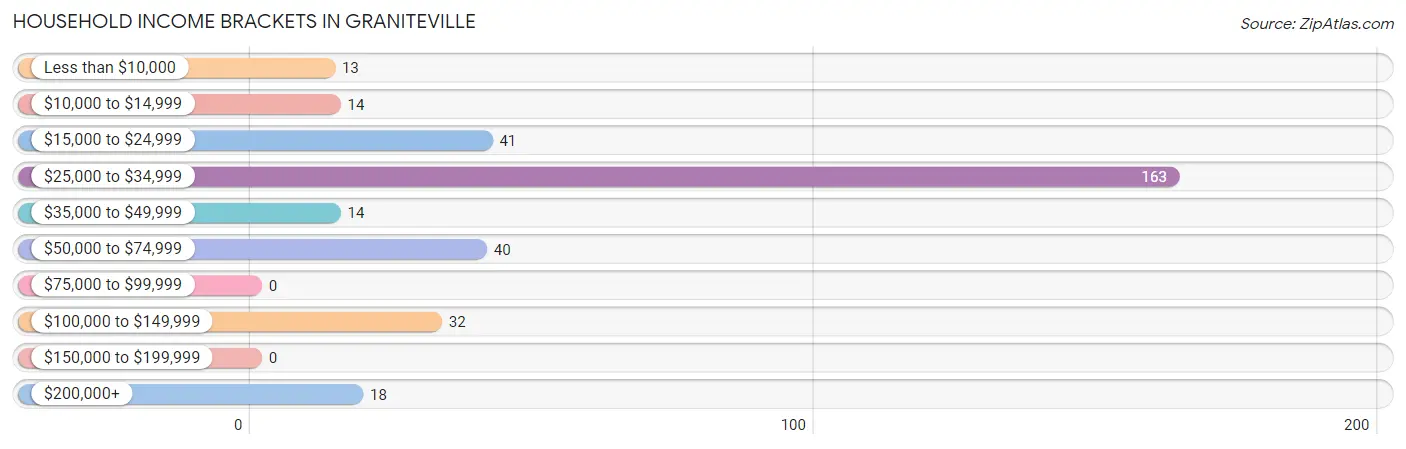
| Income Bracket | # Households | % Households |
| Less than $10,000 | 13 | 3.9% |
| $10,000 to $14,999 | 14 | 4.2% |
| $15,000 to $24,999 | 41 | 12.2% |
| $25,000 to $34,999 | 163 | 48.7% |
| $35,000 to $49,999 | 14 | 4.2% |
| $50,000 to $74,999 | 40 | 11.9% |
| $75,000 to $99,999 | 0 | 0.0% |
| $100,000 to $149,999 | 32 | 9.6% |
| $150,000 to $199,999 | 0 | 0.0% |
| $200,000+ | 18 | 5.4% |
Household Income by Householder Age in Graniteville
The median household income in Graniteville is $34,026, with the highest median household income of $33,842 found in the 25 to 44 years age bracket for the primary householder. A total of 199 households (59.4%) fall into this category.
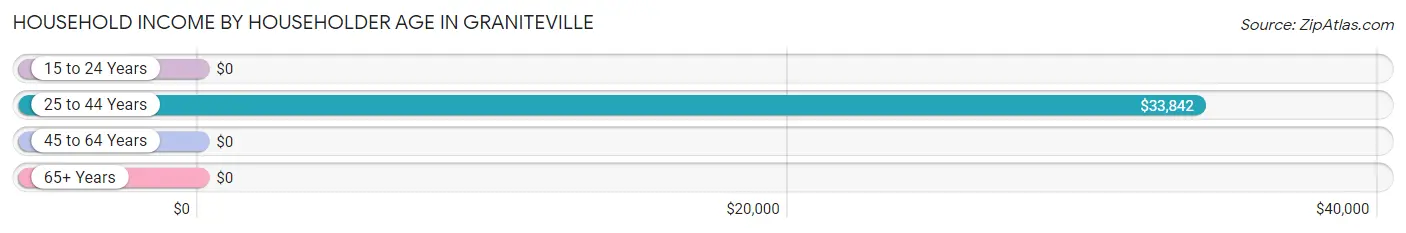
| Income Bracket | # Households | Median Income |
| 15 to 24 Years | 0 (0.0%) | $0 |
| 25 to 44 Years | 199 (59.4%) | $33,842 |
| 45 to 64 Years | 82 (24.5%) | $0 |
| 65+ Years | 54 (16.1%) | $0 |
| Total | 335 (100.0%) | $34,026 |
Poverty in Graniteville
Income Below Poverty by Sex and Age in Graniteville
With 1.5% poverty level for males and 12.8% for females among the residents of Graniteville, 55 to 64 year old males and 65 to 74 year old females are the most vulnerable to poverty, with 4 males (9.8%) and 13 females (54.2%) in their respective age groups living below the poverty level.
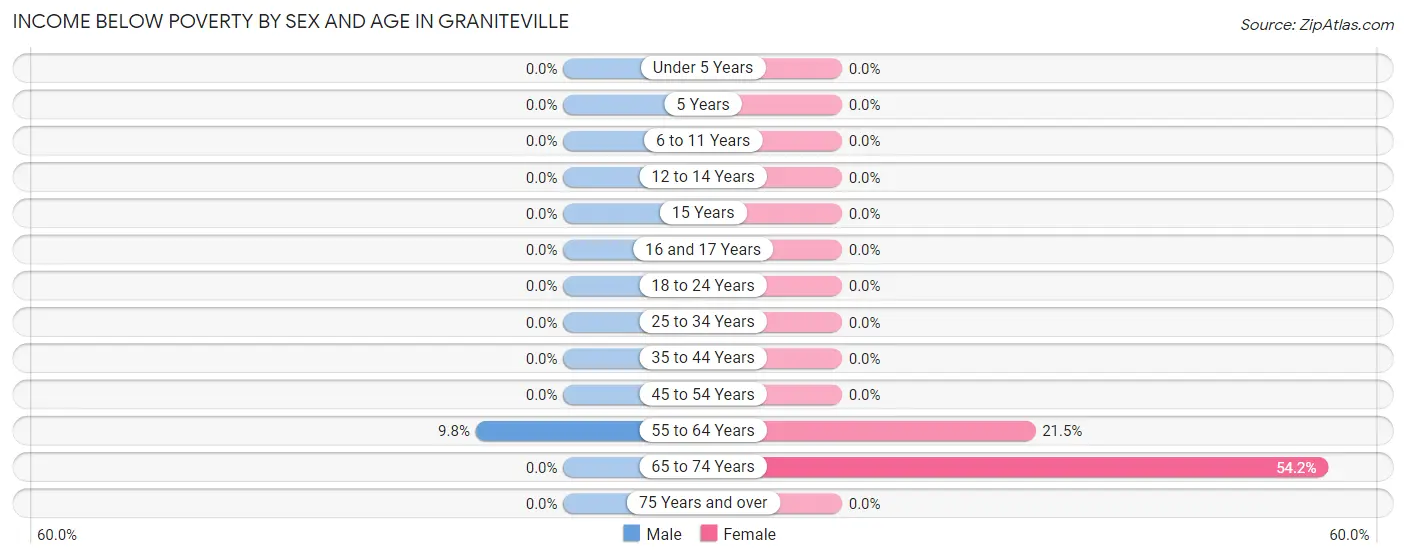
| Age Bracket | Male | Female |
| Under 5 Years | 0 (0.0%) | 0 (0.0%) |
| 5 Years | 0 (0.0%) | 0 (0.0%) |
| 6 to 11 Years | 0 (0.0%) | 0 (0.0%) |
| 12 to 14 Years | 0 (0.0%) | 0 (0.0%) |
| 15 Years | 0 (0.0%) | 0 (0.0%) |
| 16 and 17 Years | 0 (0.0%) | 0 (0.0%) |
| 18 to 24 Years | 0 (0.0%) | 0 (0.0%) |
| 25 to 34 Years | 0 (0.0%) | 0 (0.0%) |
| 35 to 44 Years | 0 (0.0%) | 0 (0.0%) |
| 45 to 54 Years | 0 (0.0%) | 0 (0.0%) |
| 55 to 64 Years | 4 (9.8%) | 14 (21.5%) |
| 65 to 74 Years | 0 (0.0%) | 13 (54.2%) |
| 75 Years and over | 0 (0.0%) | 0 (0.0%) |
| Total | 4 (1.5%) | 27 (12.8%) |
Income Above Poverty by Sex and Age in Graniteville
According to the poverty statistics in Graniteville, males aged 6 to 11 years and females aged under 5 years are the age groups that are most secure financially, with 100.0% of males and 100.0% of females in these age groups living above the poverty line.
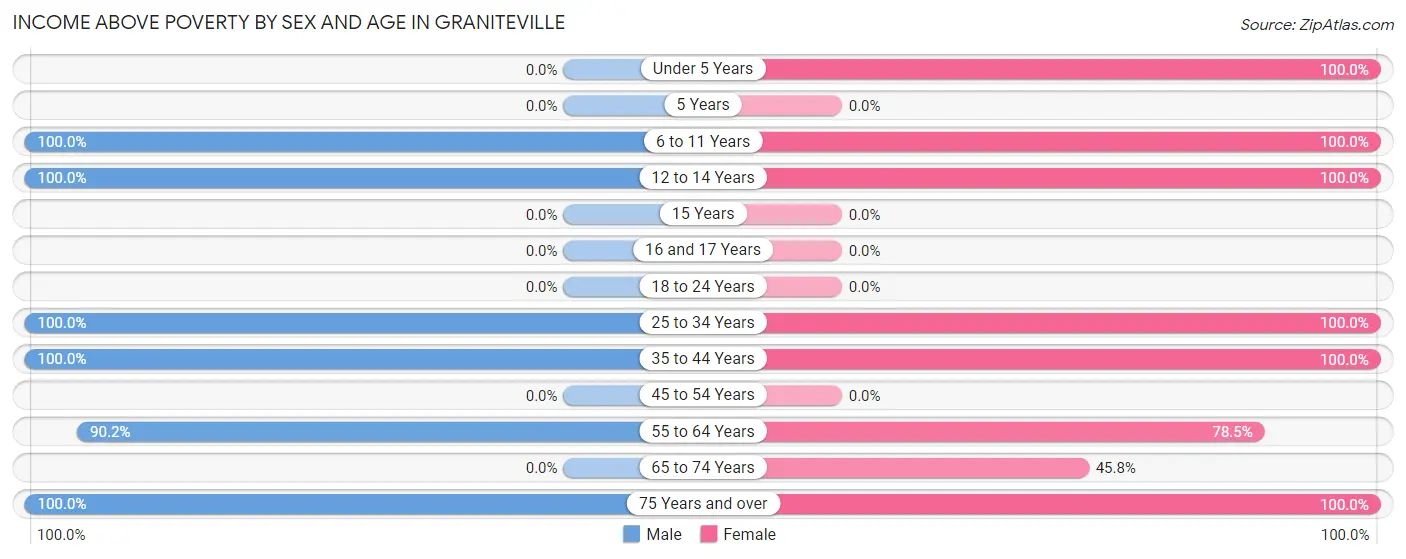
| Age Bracket | Male | Female |
| Under 5 Years | 0 (0.0%) | 16 (100.0%) |
| 5 Years | 0 (0.0%) | 0 (0.0%) |
| 6 to 11 Years | 16 (100.0%) | 16 (100.0%) |
| 12 to 14 Years | 22 (100.0%) | 23 (100.0%) |
| 15 Years | 0 (0.0%) | 0 (0.0%) |
| 16 and 17 Years | 0 (0.0%) | 0 (0.0%) |
| 18 to 24 Years | 0 (0.0%) | 0 (0.0%) |
| 25 to 34 Years | 173 (100.0%) | 4 (100.0%) |
| 35 to 44 Years | 12 (100.0%) | 31 (100.0%) |
| 45 to 54 Years | 0 (0.0%) | 0 (0.0%) |
| 55 to 64 Years | 37 (90.2%) | 51 (78.5%) |
| 65 to 74 Years | 0 (0.0%) | 11 (45.8%) |
| 75 Years and over | 12 (100.0%) | 32 (100.0%) |
| Total | 272 (98.6%) | 184 (87.2%) |
Income Below Poverty Among Married-Couple Families in Graniteville
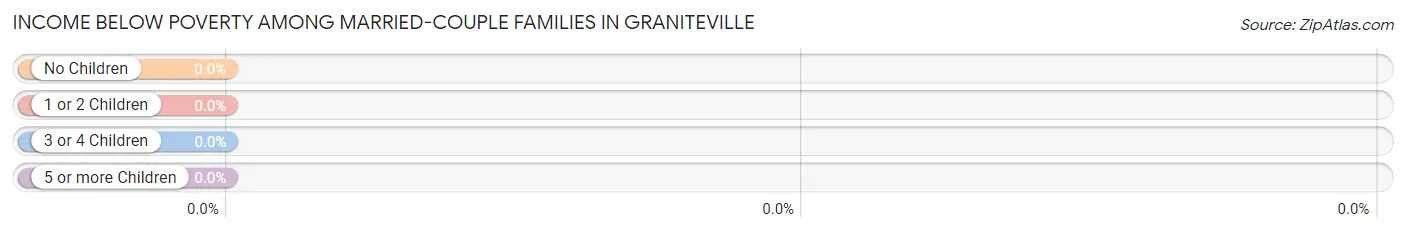
| Children | Above Poverty | Below Poverty |
| No Children | 33 (100.0%) | 0 (0.0%) |
| 1 or 2 Children | 0 (0.0%) | 0 (0.0%) |
| 3 or 4 Children | 0 (0.0%) | 0 (0.0%) |
| 5 or more Children | 0 (0.0%) | 0 (0.0%) |
| Total | 33 (100.0%) | 0 (0.0%) |
Income Below Poverty Among Single-Parent Households in Graniteville
| Children | Single Father | Single Mother |
| No Children | 0 (0.0%) | 0 (0.0%) |
| 1 or 2 Children | 0 (0.0%) | 0 (0.0%) |
| 3 or 4 Children | 0 (0.0%) | 0 (0.0%) |
| 5 or more Children | 0 (0.0%) | 0 (0.0%) |
| Total | 0 (0.0%) | 0 (0.0%) |
Income Below Poverty Among Married-Couple vs Single-Parent Households in Graniteville
| Children | Married-Couple Families | Single-Parent Households |
| No Children | 0 (0.0%) | 0 (0.0%) |
| 1 or 2 Children | 0 (0.0%) | 0 (0.0%) |
| 3 or 4 Children | 0 (0.0%) | 0 (0.0%) |
| 5 or more Children | 0 (0.0%) | 0 (0.0%) |
| Total | 0 (0.0%) | 0 (0.0%) |
Race in Graniteville
The most populous races in Graniteville are White / Caucasian (324 | 66.5%), and Black / African American (163 | 33.5%).
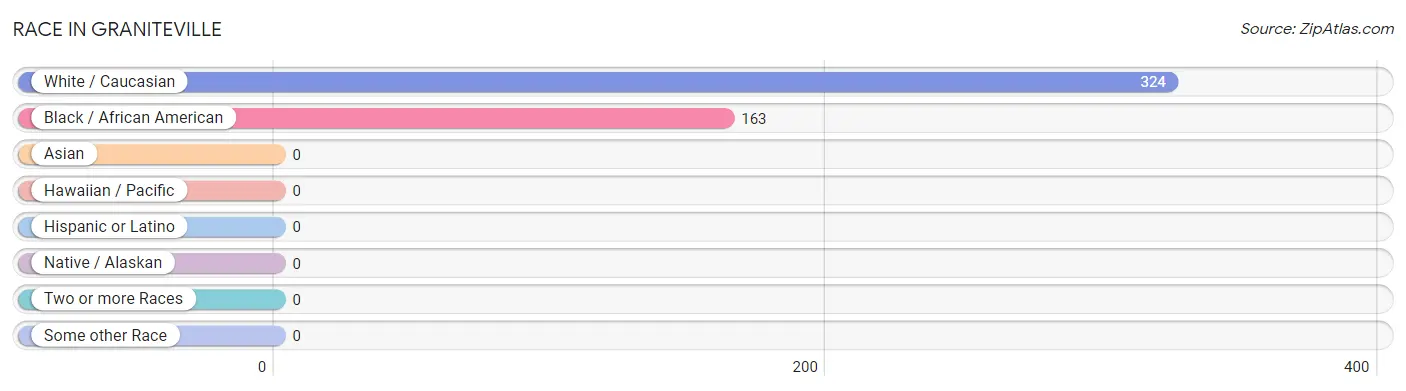
| Race | # Population | % Population |
| Asian | 0 | 0.0% |
| Black / African American | 163 | 33.5% |
| Hawaiian / Pacific | 0 | 0.0% |
| Hispanic or Latino | 0 | 0.0% |
| Native / Alaskan | 0 | 0.0% |
| White / Caucasian | 324 | 66.5% |
| Two or more Races | 0 | 0.0% |
| Some other Race | 0 | 0.0% |
| Total | 487 | 100.0% |
Ancestry in Graniteville
The most populous ancestries reported in Graniteville are French Canadian (74 | 15.2%), Scottish (65 | 13.4%), Irish (60 | 12.3%), American (43 | 8.8%), and English (32 | 6.6%), together accounting for 56.3% of all Graniteville residents.
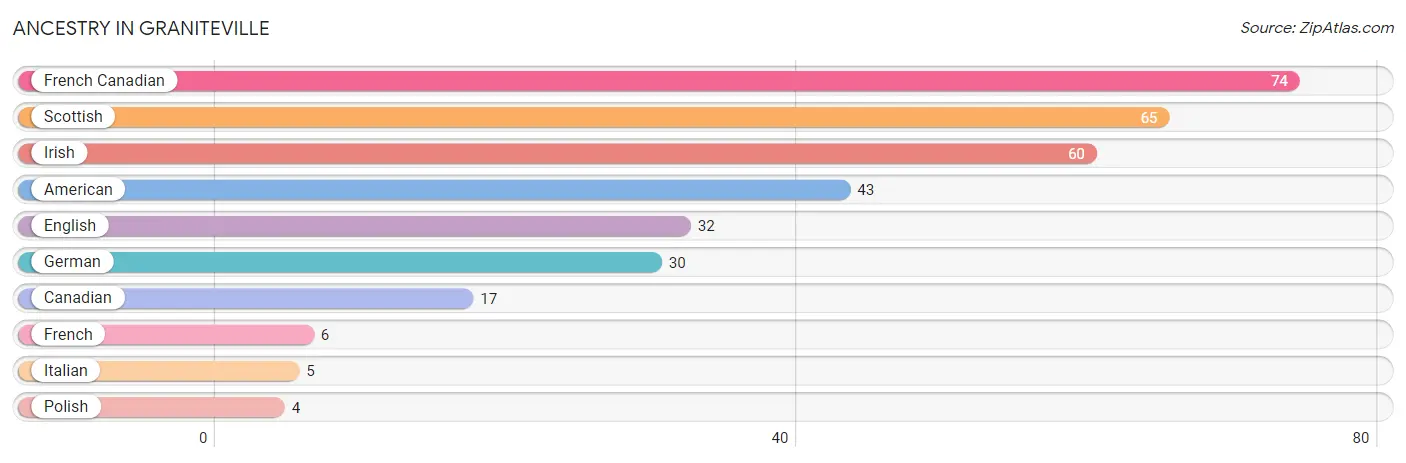
| Ancestry | # Population | % Population |
| American | 43 | 8.8% |
| Canadian | 17 | 3.5% |
| English | 32 | 6.6% |
| French | 6 | 1.2% |
| French Canadian | 74 | 15.2% |
| German | 30 | 6.2% |
| Irish | 60 | 12.3% |
| Italian | 5 | 1.0% |
| Polish | 4 | 0.8% |
| Scottish | 65 | 13.4% | View All 10 Rows |
Immigrants in Graniteville
The most numerous immigrant groups reported in Graniteville came from Africa (163 | 33.5%), and Western Africa (163 | 33.5%), together accounting for 66.9% of all Graniteville residents.
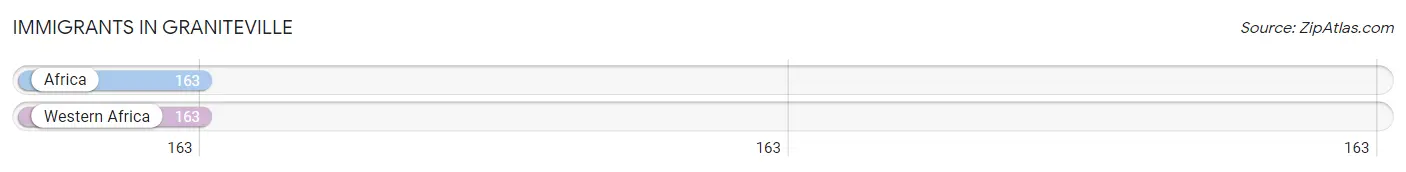
| Immigration Origin | # Population | % Population |
| Africa | 163 | 33.5% |
| Western Africa | 163 | 33.5% | View All 2 Rows |
Sex and Age in Graniteville
Sex and Age in Graniteville
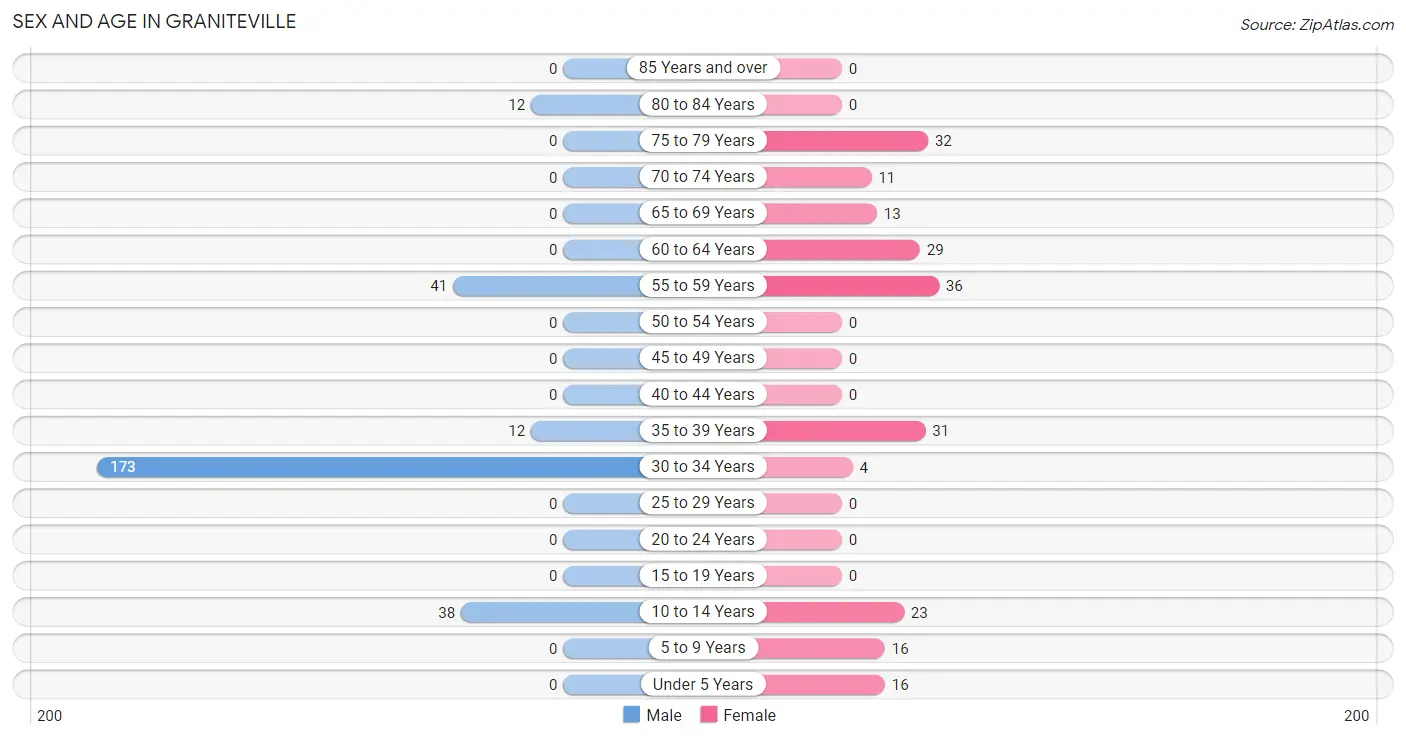
The most populous age groups in Graniteville are 30 to 34 Years (173 | 62.7%) for men and 55 to 59 Years (36 | 17.1%) for women.
| Age Bracket | Male | Female |
| Under 5 Years | 0 (0.0%) | 16 (7.6%) |
| 5 to 9 Years | 0 (0.0%) | 16 (7.6%) |
| 10 to 14 Years | 38 (13.8%) | 23 (10.9%) |
| 15 to 19 Years | 0 (0.0%) | 0 (0.0%) |
| 20 to 24 Years | 0 (0.0%) | 0 (0.0%) |
| 25 to 29 Years | 0 (0.0%) | 0 (0.0%) |
| 30 to 34 Years | 173 (62.7%) | 4 (1.9%) |
| 35 to 39 Years | 12 (4.3%) | 31 (14.7%) |
| 40 to 44 Years | 0 (0.0%) | 0 (0.0%) |
| 45 to 49 Years | 0 (0.0%) | 0 (0.0%) |
| 50 to 54 Years | 0 (0.0%) | 0 (0.0%) |
| 55 to 59 Years | 41 (14.9%) | 36 (17.1%) |
| 60 to 64 Years | 0 (0.0%) | 29 (13.7%) |
| 65 to 69 Years | 0 (0.0%) | 13 (6.2%) |
| 70 to 74 Years | 0 (0.0%) | 11 (5.2%) |
| 75 to 79 Years | 0 (0.0%) | 32 (15.2%) |
| 80 to 84 Years | 12 (4.3%) | 0 (0.0%) |
| 85 Years and over | 0 (0.0%) | 0 (0.0%) |
| Total | 276 (100.0%) | 211 (100.0%) |
Families and Households in Graniteville
Median Family Size in Graniteville
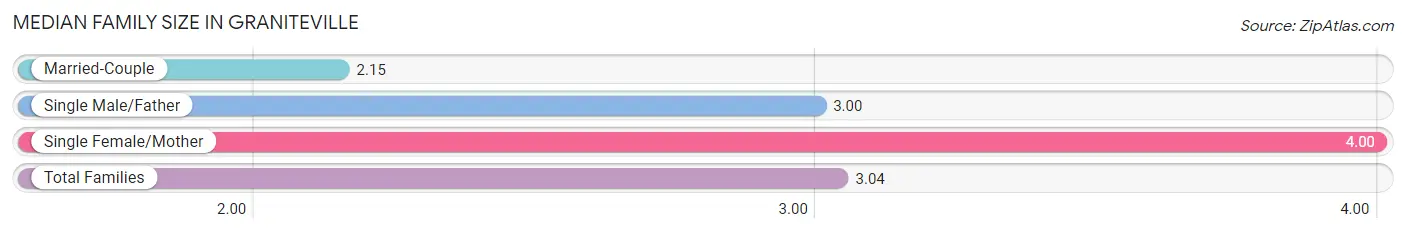
The median family size in Graniteville is 3.04 persons per family, with single female/mother families (31 | 44.3%) accounting for the largest median family size of 4 persons per family. On the other hand, married-couple families (33 | 47.1%) represent the smallest median family size with 2.15 persons per family.
| Family Type | # Families | Family Size |
| Married-Couple | 33 (47.1%) | 2.15 |
| Single Male/Father | 6 (8.6%) | 3.00 |
| Single Female/Mother | 31 (44.3%) | 4.00 |
| Total Families | 70 (100.0%) | 3.04 |
Median Household Size in Graniteville
| Household Type | # Households | Household Size |
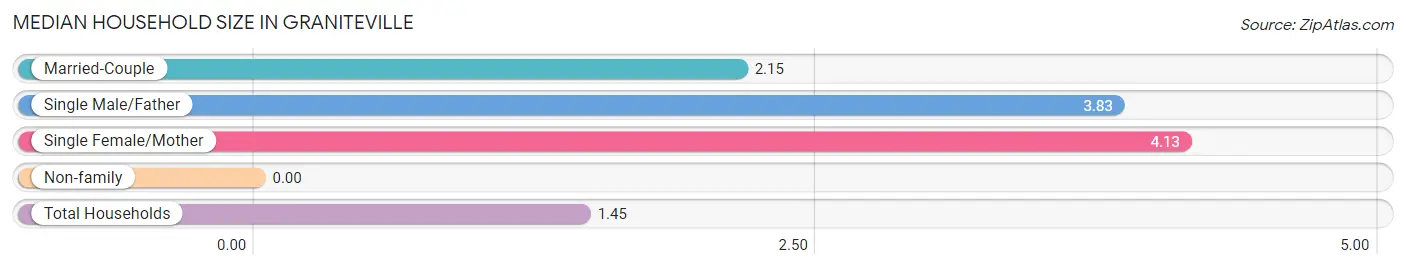
| Married-Couple | 33 (9.9%) | 2.15 |
| Single Male/Father | 6 (1.8%) | 3.83 |
| Single Female/Mother | 31 (9.2%) | 4.13 |
| Non-family | 265 (79.1%) | - |
| Total Households | 335 (100.0%) | 1.45 |
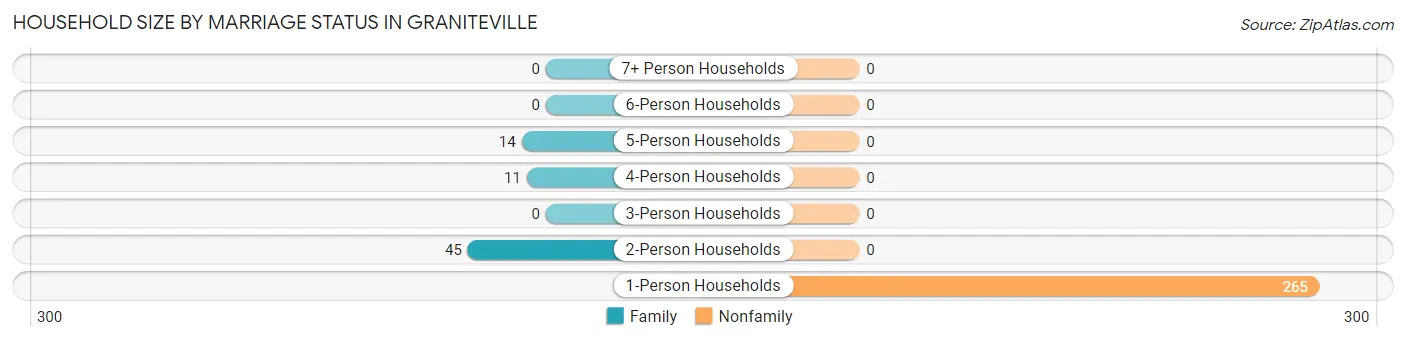
Household Size by Marriage Status in Graniteville
Out of a total of 335 households in Graniteville, 70 (20.9%) are family households, while 265 (79.1%) are nonfamily households. The most numerous type of family households are 2-person households, comprising 45, and the most common type of nonfamily households are 1-person households, comprising 265.
| Household Size | Family Households | Nonfamily Households |
| 1-Person Households | - | 265 (79.1%) |
| 2-Person Households | 45 (13.4%) | 0 (0.0%) |
| 3-Person Households | 0 (0.0%) | 0 (0.0%) |
| 4-Person Households | 11 (3.3%) | 0 (0.0%) |
| 5-Person Households | 14 (4.2%) | 0 (0.0%) |
| 6-Person Households | 0 (0.0%) | 0 (0.0%) |
| 7+ Person Households | 0 (0.0%) | 0 (0.0%) |
| Total | 70 (20.9%) | 265 (79.1%) |
Female Fertility in Graniteville
Fertility by Age in Graniteville
| Age Bracket | Women with Births | Births / 1,000 Women |
| 15 to 19 years | 0 (0.0%) | 0.0 |
| 20 to 34 years | 0 (0.0%) | 0.0 |
| 35 to 50 years | 0 (0.0%) | 0.0 |
| Total | 0 (0.0%) | 0.0 |
Fertility by Age by Marriage Status in Graniteville
| Age Bracket | Married | Unmarried |
| 15 to 19 years | 0 (0.0%) | 0 (0.0%) |
| 20 to 34 years | 0 (0.0%) | 0 (0.0%) |
| 35 to 50 years | 0 (0.0%) | 0 (0.0%) |
| Total | 0 (0.0%) | 0 (0.0%) |
Fertility by Education in Graniteville
| Educational Attainment | Women with Births | Births / 1,000 Women |
| Less than High School | 0 (0.0%) | 0.0 |
| High School Diploma | 0 (0.0%) | 0.0 |
| College or Associate's Degree | 0 (0.0%) | 0.0 |
| Bachelor's Degree | 0 (0.0%) | 0.0 |
| Graduate Degree | 0 (0.0%) | 0.0 |
| Total | 0 (0.0%) | 0.0 |
Fertility by Education by Marriage Status in Graniteville
| Educational Attainment | Married | Unmarried |
| Less than High School | 0 (0.0%) | 0 (0.0%) |
| High School Diploma | 0 (0.0%) | 0 (0.0%) |
| College or Associate's Degree | 0 (0.0%) | 0 (0.0%) |
| Bachelor's Degree | 0 (0.0%) | 0 (0.0%) |
| Graduate Degree | 0 (0.0%) | 0 (0.0%) |
| Total | 0 (0.0%) | 0 (0.0%) |
Employment Characteristics in Graniteville
Employment by Class of Employer in Graniteville
Among the 276 employed individuals in Graniteville, private company employees (221 | 80.1%), not-for-profit organizations (40 | 14.5%), and state government employees (10 | 3.6%) make up the most common classes of employment.
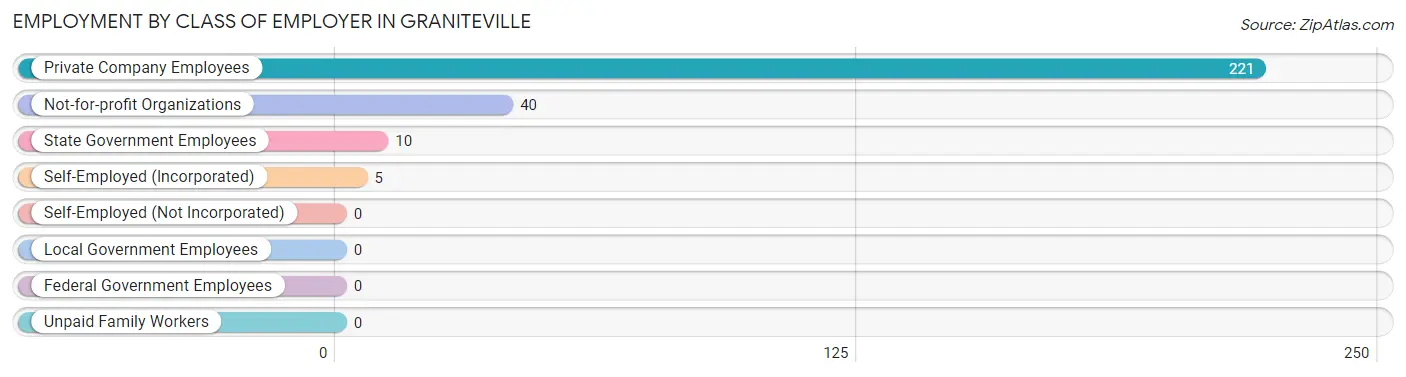
| Employer Class | # Employees | % Employees |
| Private Company Employees | 221 | 80.1% |
| Self-Employed (Incorporated) | 5 | 1.8% |
| Self-Employed (Not Incorporated) | 0 | 0.0% |
| Not-for-profit Organizations | 40 | 14.5% |
| Local Government Employees | 0 | 0.0% |
| State Government Employees | 10 | 3.6% |
| Federal Government Employees | 0 | 0.0% |
| Unpaid Family Workers | 0 | 0.0% |
| Total | 276 | 100.0% |
Employment Status by Age in Graniteville
According to the labor force statistics for Graniteville, out of the total population over 16 years of age (394), 73.6% or 290 individuals are in the labor force, with 4.8% or 14 of them unemployed. The age group with the highest labor force participation rate is 30 to 34 years, with 100.0% or 177 individuals in the labor force. Within the labor force, the 35 to 44 years age range has the highest percentage of unemployed individuals, with 32.6% or 14 of them being unemployed.
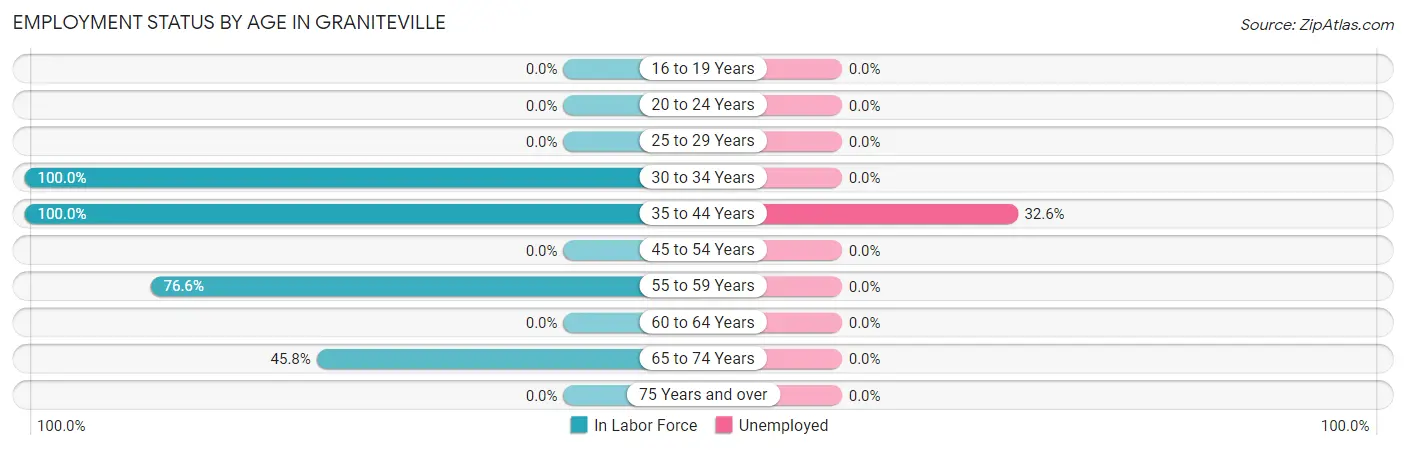
| Age Bracket | In Labor Force | Unemployed |
| 16 to 19 Years | 0 (0.0%) | 0 (0.0%) |
| 20 to 24 Years | 0 (0.0%) | 0 (0.0%) |
| 25 to 29 Years | 0 (0.0%) | 0 (0.0%) |
| 30 to 34 Years | 177 (100.0%) | 0 (0.0%) |
| 35 to 44 Years | 43 (100.0%) | 14 (32.6%) |
| 45 to 54 Years | 0 (0.0%) | 0 (0.0%) |
| 55 to 59 Years | 59 (76.6%) | 0 (0.0%) |
| 60 to 64 Years | 0 (0.0%) | 0 (0.0%) |
| 65 to 74 Years | 11 (45.8%) | 0 (0.0%) |
| 75 Years and over | 0 (0.0%) | 0 (0.0%) |
| Total | 290 (73.6%) | 14 (4.8%) |
Employment Status by Educational Attainment in Graniteville
According to labor force statistics for Graniteville, 85.6% of individuals (279) out of the total population between 25 and 64 years of age (326) are in the labor force, with 5.0% or 14 of them being unemployed. The group with the highest labor force participation rate are those with the educational attainment of less than high school, with 100.0% or 6 individuals in the labor force. Within the labor force, individuals with bachelor's degree or higher education have the highest percentage of unemployment, with 31.1% or 14 of them being unemployed.
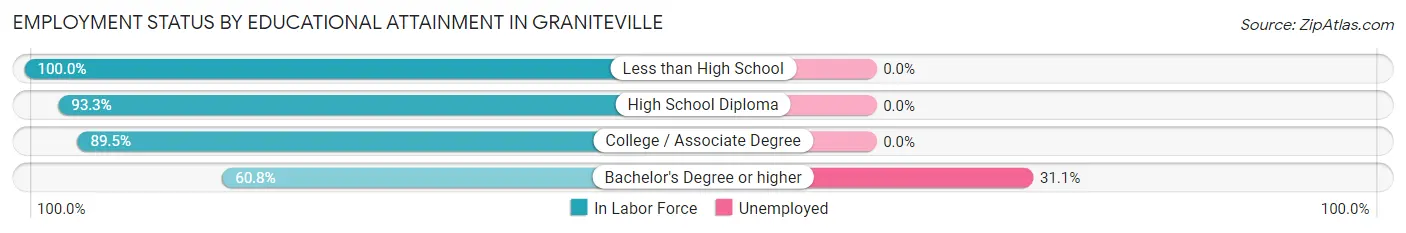
| Educational Attainment | In Labor Force | Unemployed |
| Less than High School | 6 (100.0%) | 0 (0.0%) |
| High School Diploma | 194 (93.3%) | 0 (0.0%) |
| College / Associate Degree | 34 (89.5%) | 0 (0.0%) |
| Bachelor's Degree or higher | 45 (60.8%) | 23 (31.1%) |
| Total | 279 (85.6%) | 16 (5.0%) |
Employment Occupations by Sex in Graniteville
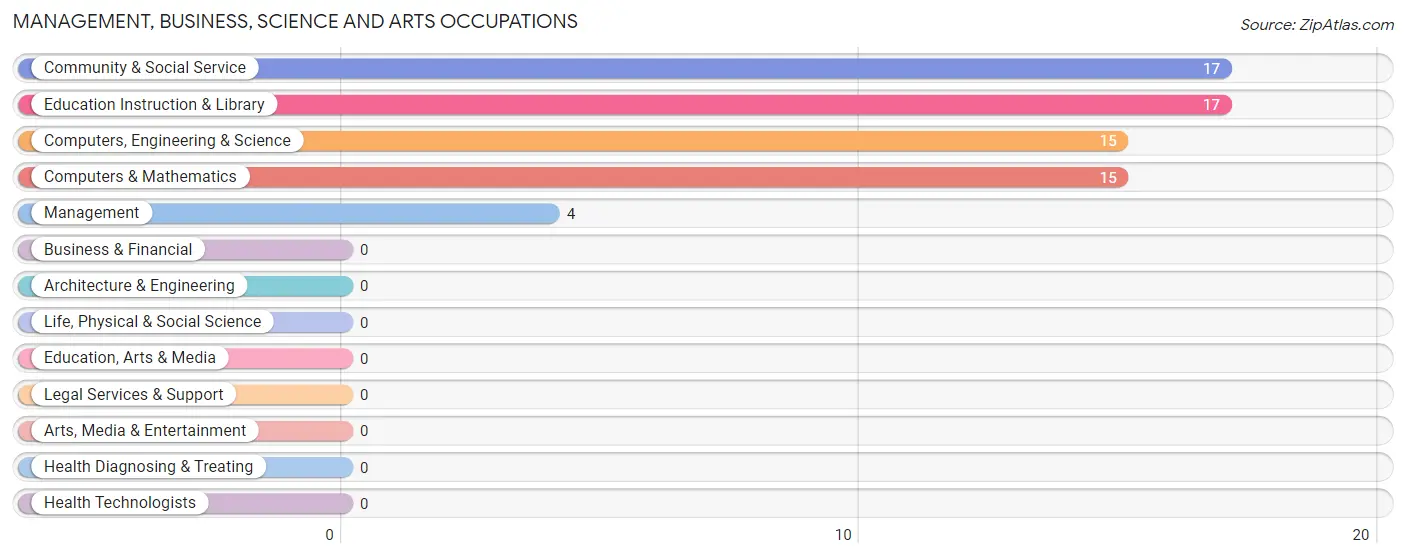
Management, Business, Science and Arts Occupations
The most common Management, Business, Science and Arts occupations in Graniteville are Community & Social Service (17 | 6.2%), Education Instruction & Library (17 | 6.2%), Computers, Engineering & Science (15 | 5.4%), Computers & Mathematics (15 | 5.4%), and Management (4 | 1.5%).
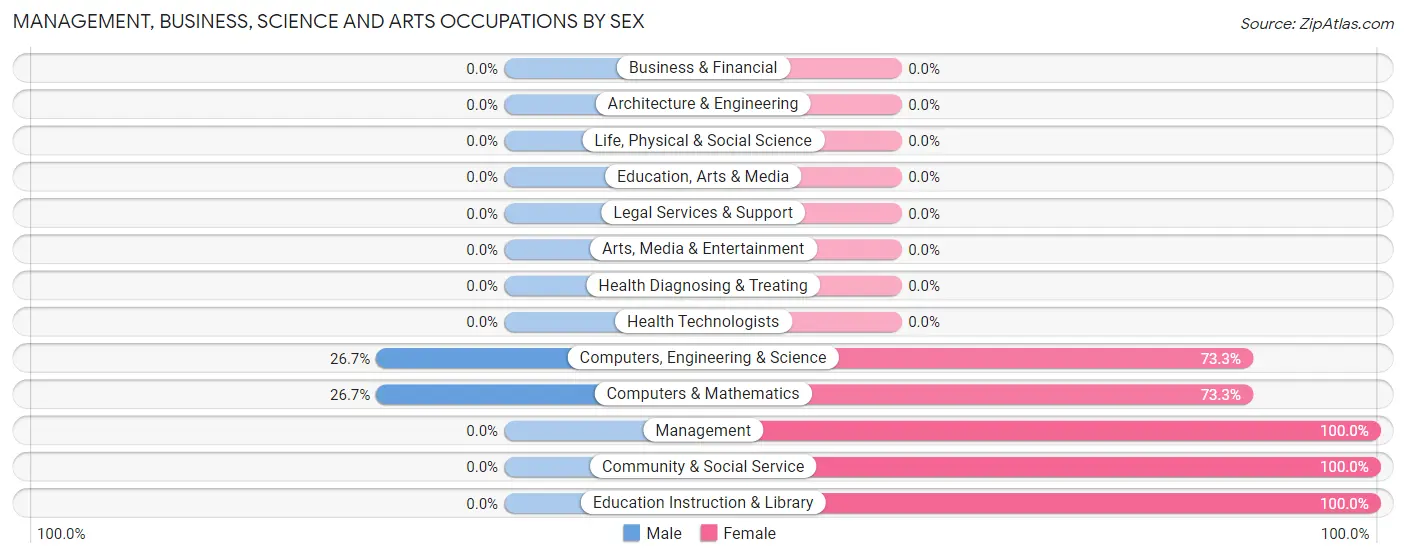
Management, Business, Science and Arts Occupations by Sex
Within the Management, Business, Science and Arts occupations in Graniteville, the most male-oriented occupations are Computers, Engineering & Science (26.7%), and Computers & Mathematics (26.7%), while the most female-oriented occupations are Management (100.0%), Community & Social Service (100.0%), and Education Instruction & Library (100.0%).
| Occupation | Male | Female |
| Management | 0 (0.0%) | 4 (100.0%) |
| Business & Financial | 0 (0.0%) | 0 (0.0%) |
| Computers, Engineering & Science | 4 (26.7%) | 11 (73.3%) |
| Computers & Mathematics | 4 (26.7%) | 11 (73.3%) |
| Architecture & Engineering | 0 (0.0%) | 0 (0.0%) |
| Life, Physical & Social Science | 0 (0.0%) | 0 (0.0%) |
| Community & Social Service | 0 (0.0%) | 17 (100.0%) |
| Education, Arts & Media | 0 (0.0%) | 0 (0.0%) |
| Legal Services & Support | 0 (0.0%) | 0 (0.0%) |
| Education Instruction & Library | 0 (0.0%) | 17 (100.0%) |
| Arts, Media & Entertainment | 0 (0.0%) | 0 (0.0%) |
| Health Diagnosing & Treating | 0 (0.0%) | 0 (0.0%) |
| Health Technologists | 0 (0.0%) | 0 (0.0%) |
| Total (Category) | 4 (11.1%) | 32 (88.9%) |
| Total (Overall) | 222 (80.4%) | 54 (19.6%) |
Services Occupations
Services Occupations by Sex
| Occupation | Male | Female |
| Healthcare Support | 0 (0.0%) | 0 (0.0%) |
| Security & Protection | 0 (0.0%) | 0 (0.0%) |
| Firefighting & Prevention | 0 (0.0%) | 0 (0.0%) |
| Law Enforcement | 0 (0.0%) | 0 (0.0%) |
| Food Preparation & Serving | 0 (0.0%) | 0 (0.0%) |
| Cleaning & Maintenance | 0 (0.0%) | 0 (0.0%) |
| Personal Care & Service | 0 (0.0%) | 0 (0.0%) |
| Total (Category) | 0 (0.0%) | 0 (0.0%) |
| Total (Overall) | 222 (80.4%) | 54 (19.6%) |
Sales and Office Occupations
The most common Sales and Office occupations in Graniteville are Office & Administration (34 | 12.3%), and Sales & Related (11 | 4.0%).
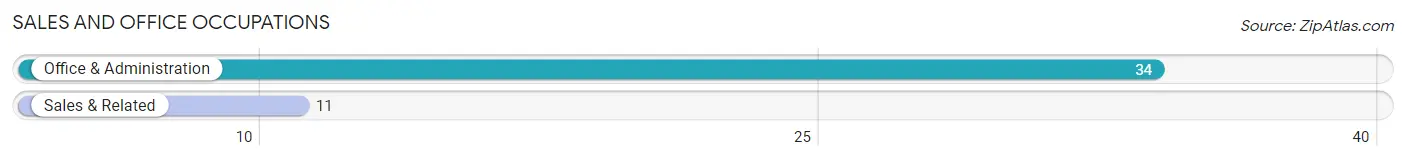
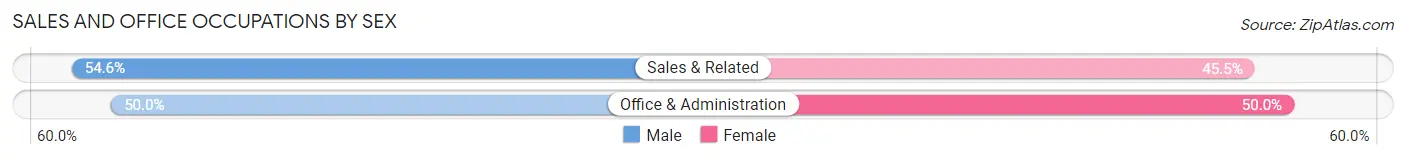
Sales and Office Occupations by Sex
| Occupation | Male | Female |
| Sales & Related | 6 (54.5%) | 5 (45.5%) |
| Office & Administration | 17 (50.0%) | 17 (50.0%) |
| Total (Category) | 23 (51.1%) | 22 (48.9%) |
| Total (Overall) | 222 (80.4%) | 54 (19.6%) |
Natural Resources, Construction and Maintenance Occupations
The most common Natural Resources, Construction and Maintenance occupations in Graniteville are , and Construction & Extraction (6 | 2.2%).
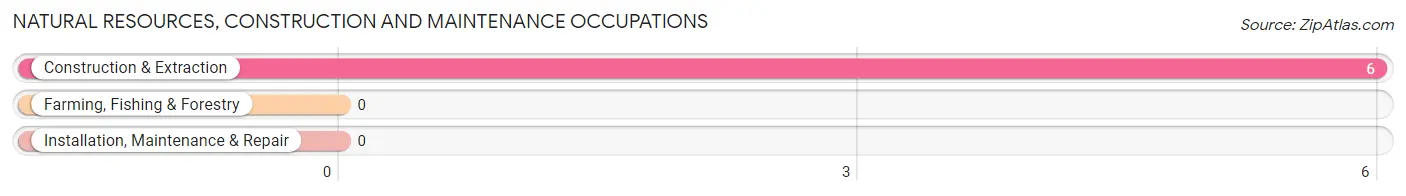
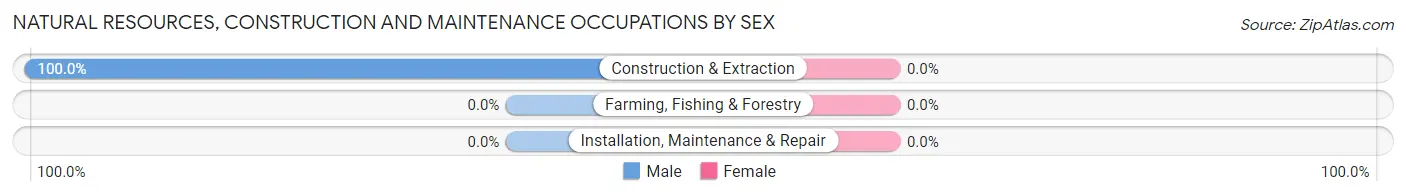
Natural Resources, Construction and Maintenance Occupations by Sex
| Occupation | Male | Female |
| Farming, Fishing & Forestry | 0 (0.0%) | 0 (0.0%) |
| Construction & Extraction | 6 (100.0%) | 0 (0.0%) |
| Installation, Maintenance & Repair | 0 (0.0%) | 0 (0.0%) |
| Total (Category) | 6 (100.0%) | 0 (0.0%) |
| Total (Overall) | 222 (80.4%) | 54 (19.6%) |
Production, Transportation and Moving Occupations
The most common Production, Transportation and Moving occupations in Graniteville are Production (183 | 66.3%), and Material Moving (6 | 2.2%).
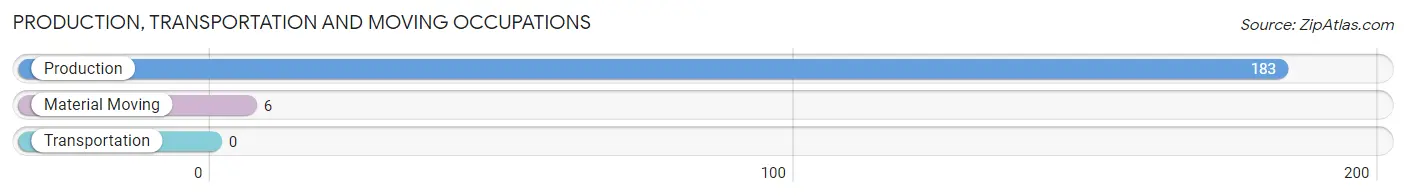
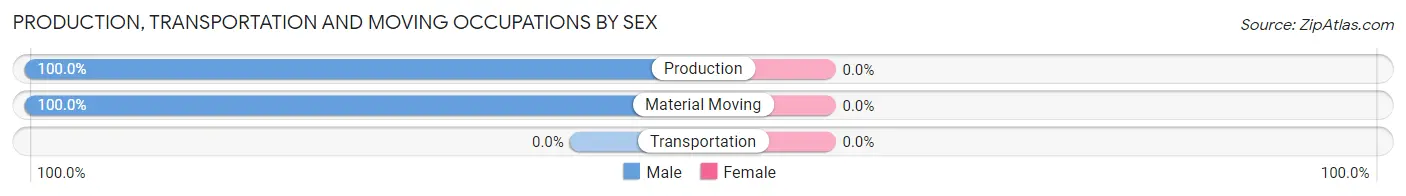
Production, Transportation and Moving Occupations by Sex
| Occupation | Male | Female |
| Production | 183 (100.0%) | 0 (0.0%) |
| Transportation | 0 (0.0%) | 0 (0.0%) |
| Material Moving | 6 (100.0%) | 0 (0.0%) |
| Total (Category) | 189 (100.0%) | 0 (0.0%) |
| Total (Overall) | 222 (80.4%) | 54 (19.6%) |
Employment Industries by Sex in Graniteville
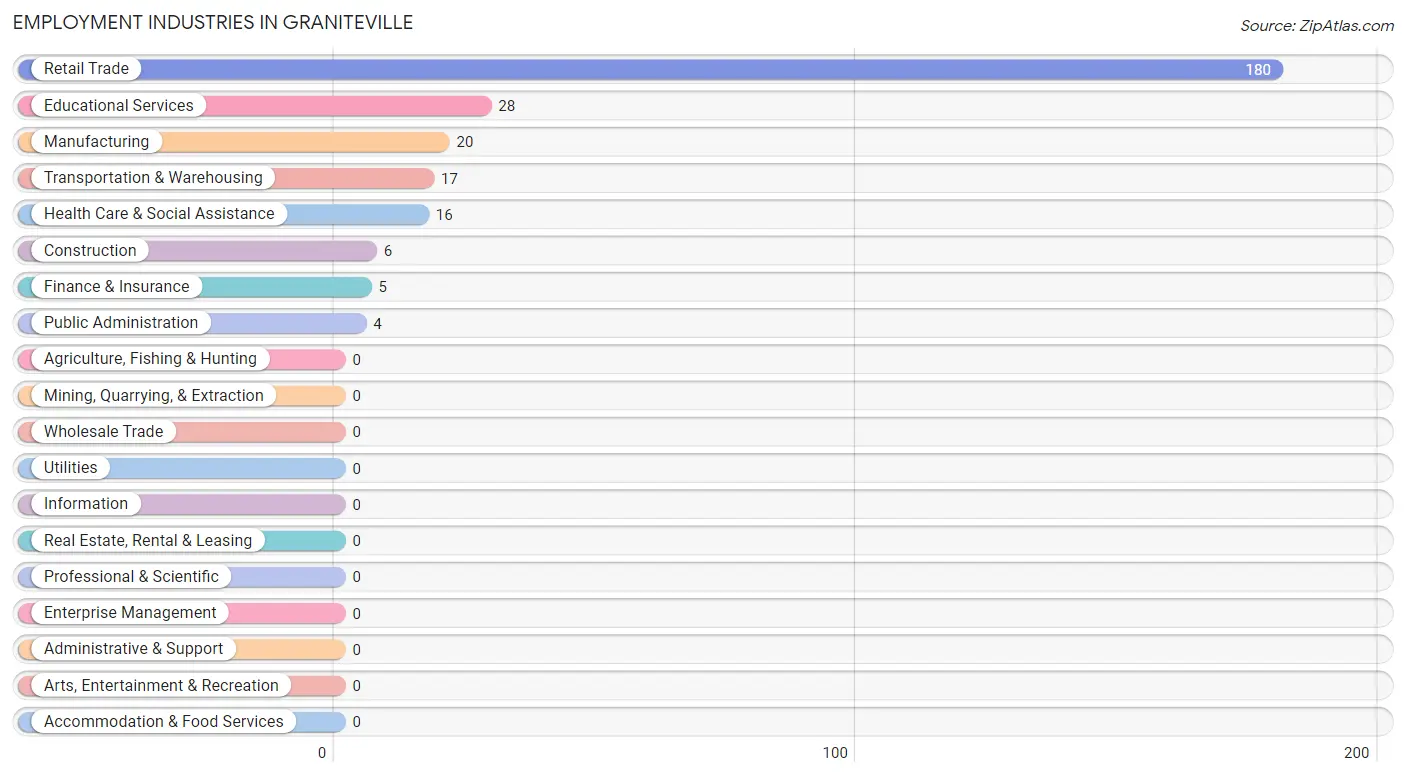
Employment Industries in Graniteville
The major employment industries in Graniteville include Retail Trade (180 | 65.2%), Educational Services (28 | 10.1%), Manufacturing (20 | 7.2%), Transportation & Warehousing (17 | 6.2%), and Health Care & Social Assistance (16 | 5.8%).
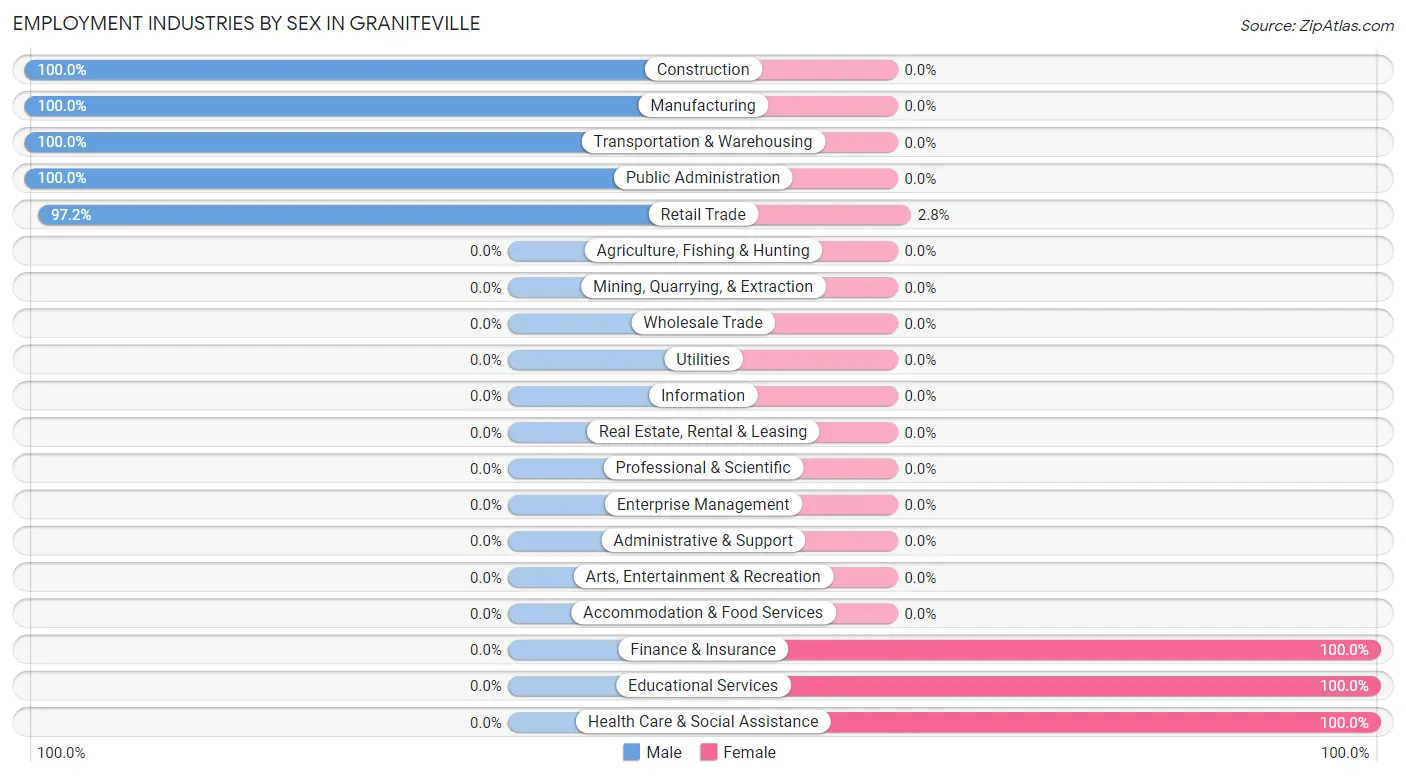
Employment Industries by Sex in Graniteville
The Graniteville industries that see more men than women are Construction (100.0%), Manufacturing (100.0%), and Transportation & Warehousing (100.0%), whereas the industries that tend to have a higher number of women are Finance & Insurance (100.0%), Educational Services (100.0%), and Health Care & Social Assistance (100.0%).
| Industry | Male | Female |
| Agriculture, Fishing & Hunting | 0 (0.0%) | 0 (0.0%) |
| Mining, Quarrying, & Extraction | 0 (0.0%) | 0 (0.0%) |
| Construction | 6 (100.0%) | 0 (0.0%) |
| Manufacturing | 20 (100.0%) | 0 (0.0%) |
| Wholesale Trade | 0 (0.0%) | 0 (0.0%) |
| Retail Trade | 175 (97.2%) | 5 (2.8%) |
| Transportation & Warehousing | 17 (100.0%) | 0 (0.0%) |
| Utilities | 0 (0.0%) | 0 (0.0%) |
| Information | 0 (0.0%) | 0 (0.0%) |
| Finance & Insurance | 0 (0.0%) | 5 (100.0%) |
| Real Estate, Rental & Leasing | 0 (0.0%) | 0 (0.0%) |
| Professional & Scientific | 0 (0.0%) | 0 (0.0%) |
| Enterprise Management | 0 (0.0%) | 0 (0.0%) |
| Administrative & Support | 0 (0.0%) | 0 (0.0%) |
| Educational Services | 0 (0.0%) | 28 (100.0%) |
| Health Care & Social Assistance | 0 (0.0%) | 16 (100.0%) |
| Arts, Entertainment & Recreation | 0 (0.0%) | 0 (0.0%) |
| Accommodation & Food Services | 0 (0.0%) | 0 (0.0%) |
| Public Administration | 4 (100.0%) | 0 (0.0%) |
| Total | 222 (80.4%) | 54 (19.6%) |
Education in Graniteville
School Enrollment in Graniteville
The most common levels of schooling among the 77 students in Graniteville are middle school (61 | 79.2%), and elementary school (16 | 20.8%).
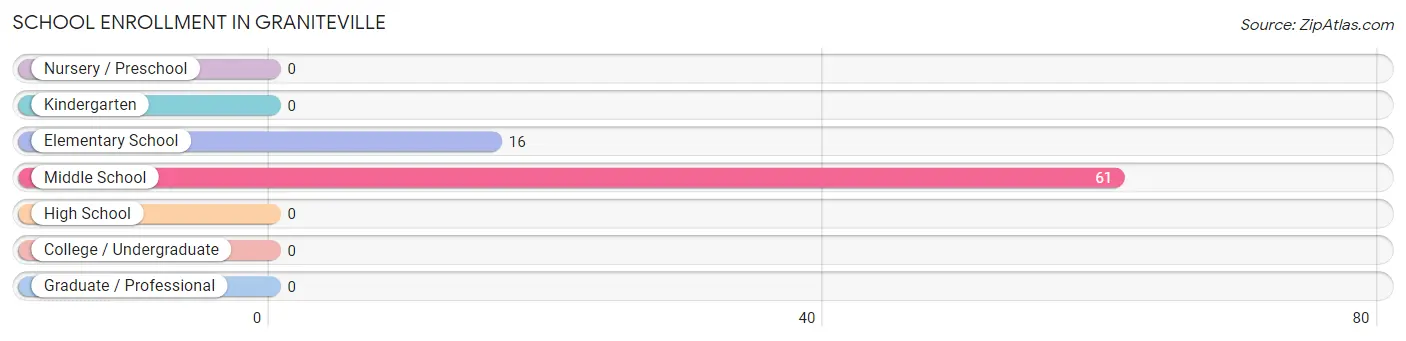
| School Level | # Students | % Students |
| Nursery / Preschool | 0 | 0.0% |
| Kindergarten | 0 | 0.0% |
| Elementary School | 16 | 20.8% |
| Middle School | 61 | 79.2% |
| High School | 0 | 0.0% |
| College / Undergraduate | 0 | 0.0% |
| Graduate / Professional | 0 | 0.0% |
| Total | 77 | 100.0% |
School Enrollment by Age by Funding Source in Graniteville
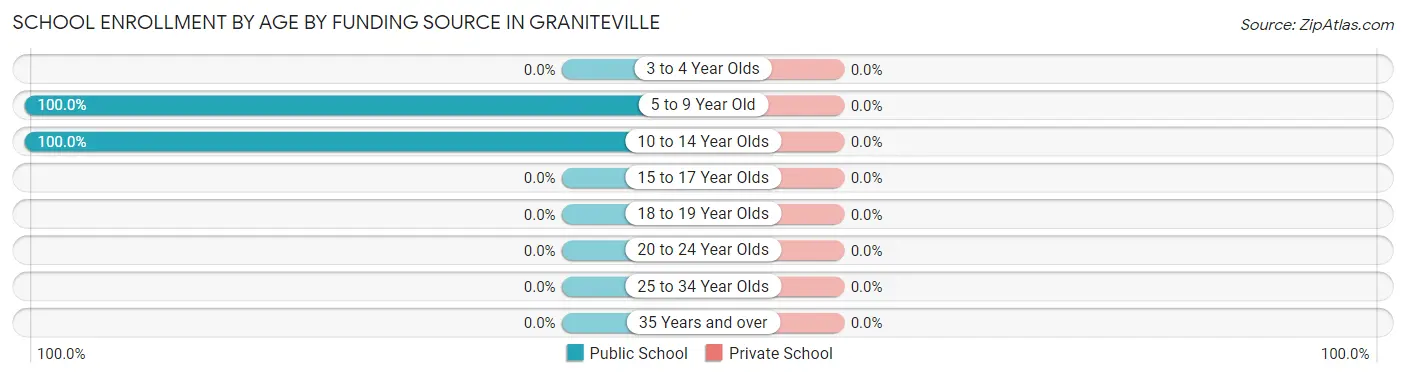
| Age Bracket | Public School | Private School |
| 3 to 4 Year Olds | 0 (0.0%) | 0 (0.0%) |
| 5 to 9 Year Old | 16 (100.0%) | 0 (0.0%) |
| 10 to 14 Year Olds | 61 (100.0%) | 0 (0.0%) |
| 15 to 17 Year Olds | 0 (0.0%) | 0 (0.0%) |
| 18 to 19 Year Olds | 0 (0.0%) | 0 (0.0%) |
| 20 to 24 Year Olds | 0 (0.0%) | 0 (0.0%) |
| 25 to 34 Year Olds | 0 (0.0%) | 0 (0.0%) |
| 35 Years and over | 0 (0.0%) | 0 (0.0%) |
| Total | 77 (100.0%) | 0 (0.0%) |
Educational Attainment by Field of Study in Graniteville
Literature & languages (29 | 21.0%), science & technology (25 | 18.1%), liberal arts & history (18 | 13.0%), visual & performing arts (17 | 12.3%), and education (14 | 10.1%) are the most common fields of study among 138 individuals in Graniteville who have obtained a bachelor's degree or higher.
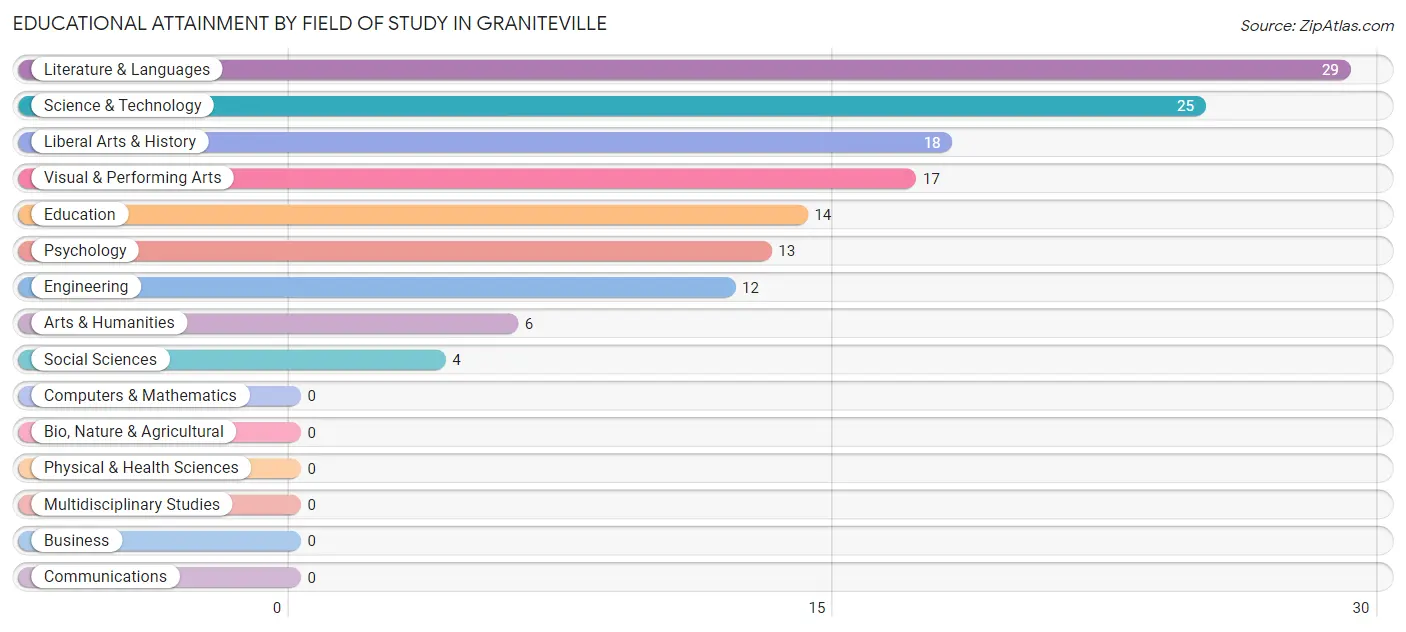
| Field of Study | # Graduates | % Graduates |
| Computers & Mathematics | 0 | 0.0% |
| Bio, Nature & Agricultural | 0 | 0.0% |
| Physical & Health Sciences | 0 | 0.0% |
| Psychology | 13 | 9.4% |
| Social Sciences | 4 | 2.9% |
| Engineering | 12 | 8.7% |
| Multidisciplinary Studies | 0 | 0.0% |
| Science & Technology | 25 | 18.1% |
| Business | 0 | 0.0% |
| Education | 14 | 10.1% |
| Literature & Languages | 29 | 21.0% |
| Liberal Arts & History | 18 | 13.0% |
| Visual & Performing Arts | 17 | 12.3% |
| Communications | 0 | 0.0% |
| Arts & Humanities | 6 | 4.3% |
| Total | 138 | 100.0% |
Transportation & Commute in Graniteville
Vehicle Availability by Sex in Graniteville
The most prevalent vehicle ownership categories in Graniteville are males with 1 vehicle (163, accounting for 73.4%) and females with 1 vehicle (11, making up 301.8%).
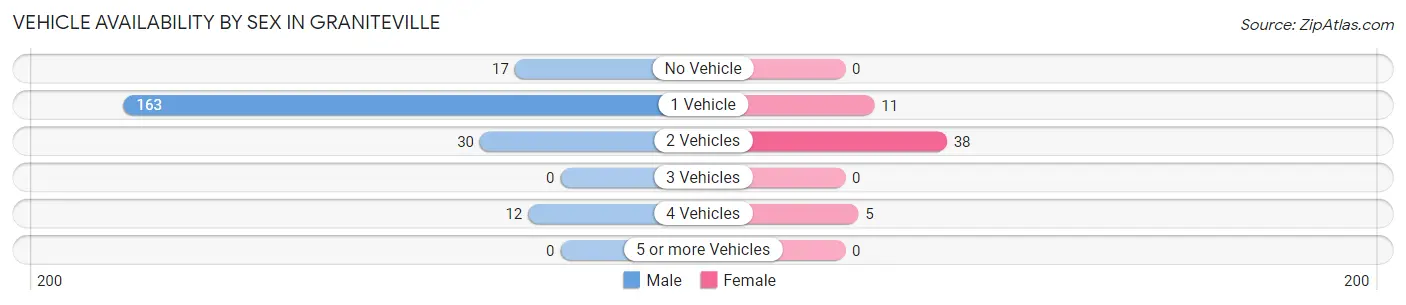
| Vehicles Available | Male | Female |
| No Vehicle | 17 (7.7%) | 0 (0.0%) |
| 1 Vehicle | 163 (73.4%) | 11 (20.4%) |
| 2 Vehicles | 30 (13.5%) | 38 (70.4%) |
| 3 Vehicles | 0 (0.0%) | 0 (0.0%) |
| 4 Vehicles | 12 (5.4%) | 5 (9.3%) |
| 5 or more Vehicles | 0 (0.0%) | 0 (0.0%) |
| Total | 222 (100.0%) | 54 (100.0%) |
Commute Time in Graniteville
The most frequently occuring commute durations in Graniteville are 10 to 14 minutes (168 commuters, 60.9%), 5 to 9 minutes (37 commuters, 13.4%), and 45 to 59 minutes (18 commuters, 6.5%).
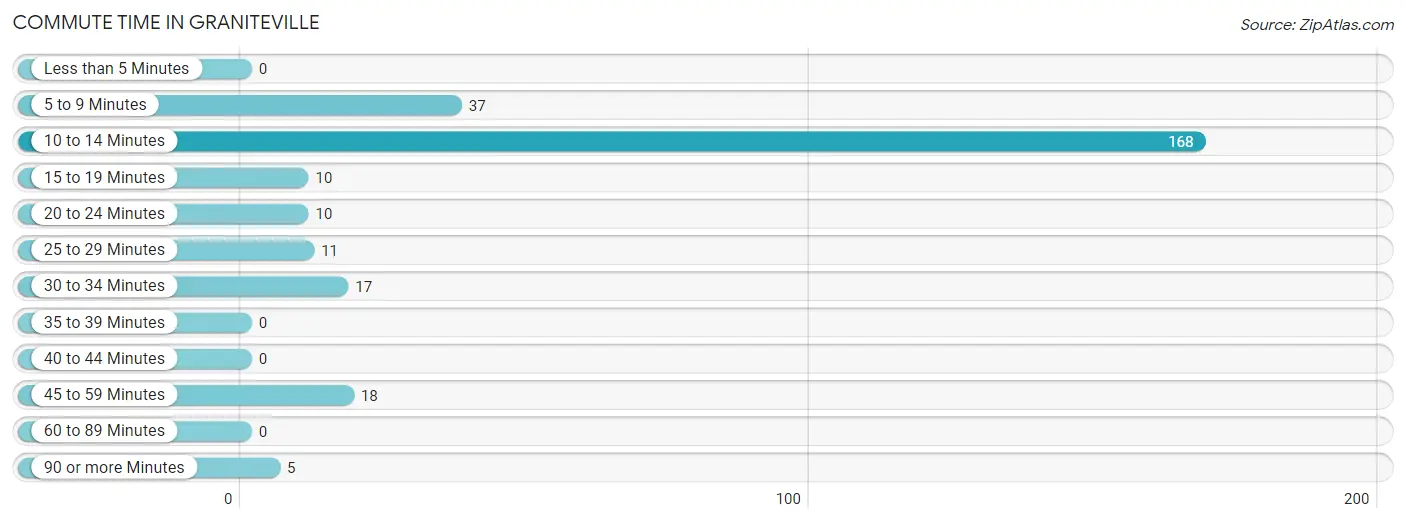
| Commute Time | # Commuters | % Commuters |
| Less than 5 Minutes | 0 | 0.0% |
| 5 to 9 Minutes | 37 | 13.4% |
| 10 to 14 Minutes | 168 | 60.9% |
| 15 to 19 Minutes | 10 | 3.6% |
| 20 to 24 Minutes | 10 | 3.6% |
| 25 to 29 Minutes | 11 | 4.0% |
| 30 to 34 Minutes | 17 | 6.2% |
| 35 to 39 Minutes | 0 | 0.0% |
| 40 to 44 Minutes | 0 | 0.0% |
| 45 to 59 Minutes | 18 | 6.5% |
| 60 to 89 Minutes | 0 | 0.0% |
| 90 or more Minutes | 5 | 1.8% |
Commute Time by Sex in Graniteville
The most common commute times in Graniteville are 10 to 14 minutes (163 commuters, 73.4%) for males and 5 to 9 minutes (17 commuters, 31.5%) for females.
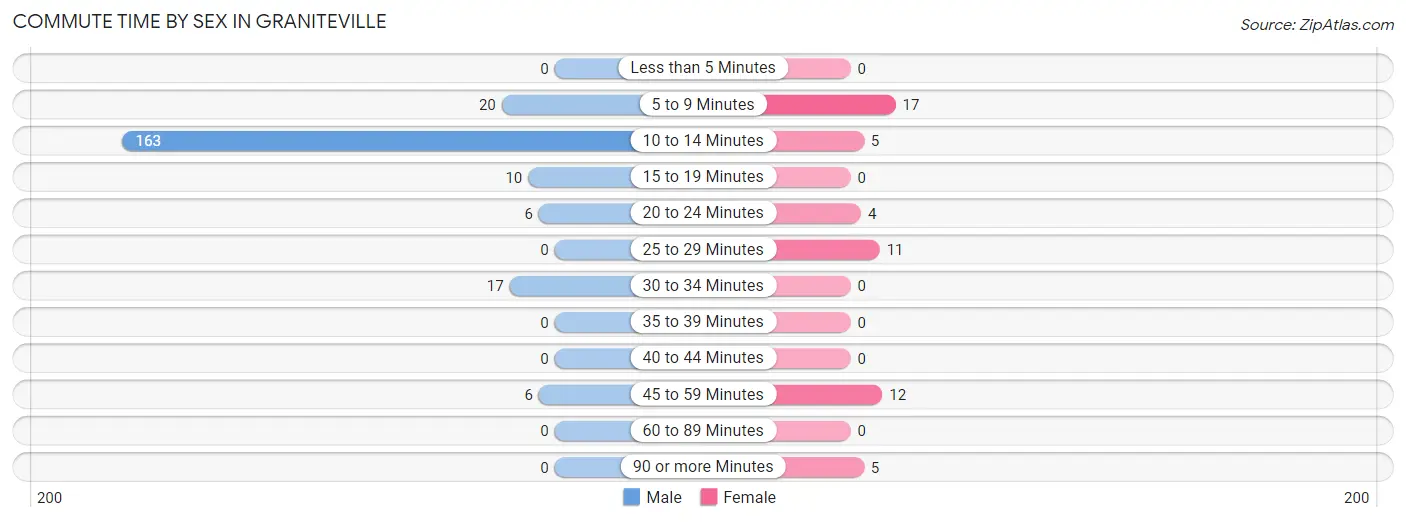
| Commute Time | Male | Female |
| Less than 5 Minutes | 0 (0.0%) | 0 (0.0%) |
| 5 to 9 Minutes | 20 (9.0%) | 17 (31.5%) |
| 10 to 14 Minutes | 163 (73.4%) | 5 (9.3%) |
| 15 to 19 Minutes | 10 (4.5%) | 0 (0.0%) |
| 20 to 24 Minutes | 6 (2.7%) | 4 (7.4%) |
| 25 to 29 Minutes | 0 (0.0%) | 11 (20.4%) |
| 30 to 34 Minutes | 17 (7.7%) | 0 (0.0%) |
| 35 to 39 Minutes | 0 (0.0%) | 0 (0.0%) |
| 40 to 44 Minutes | 0 (0.0%) | 0 (0.0%) |
| 45 to 59 Minutes | 6 (2.7%) | 12 (22.2%) |
| 60 to 89 Minutes | 0 (0.0%) | 0 (0.0%) |
| 90 or more Minutes | 0 (0.0%) | 5 (9.3%) |
Time of Departure to Work by Sex in Graniteville
The most frequent times of departure to work in Graniteville are 8:00 AM to 8:29 AM (163, 73.4%) for males and 7:00 AM to 7:29 AM (21, 38.9%) for females.
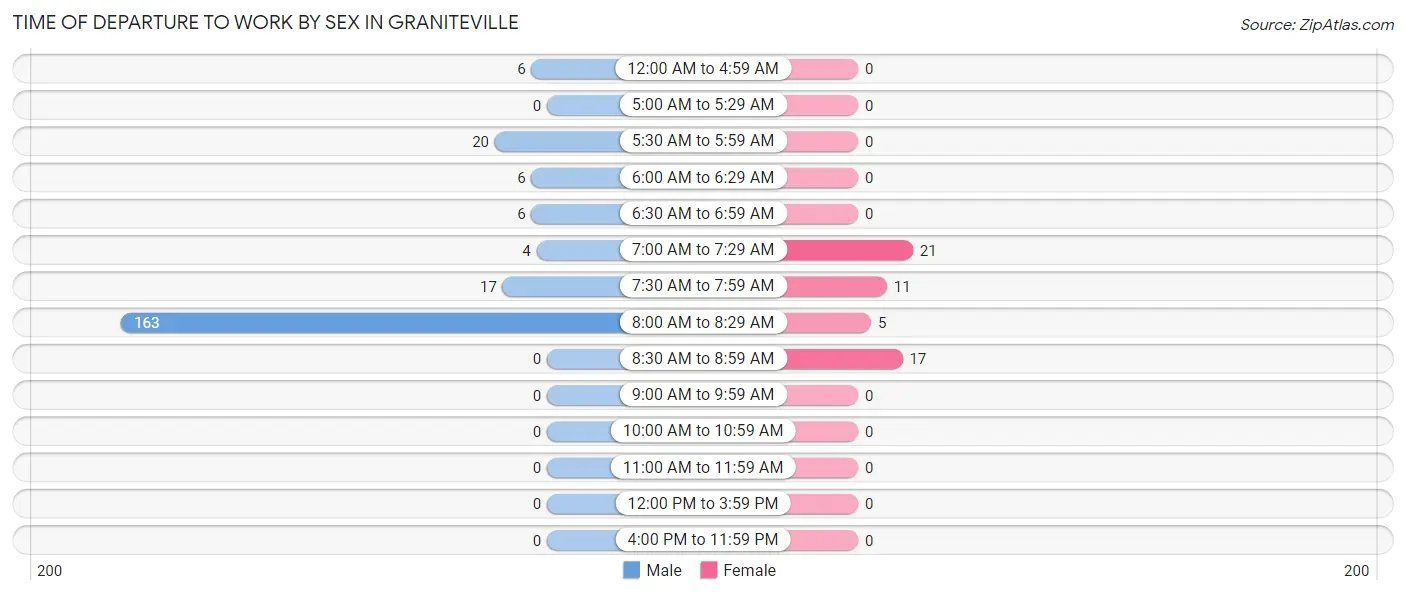
| Time of Departure | Male | Female |
| 12:00 AM to 4:59 AM | 6 (2.7%) | 0 (0.0%) |
| 5:00 AM to 5:29 AM | 0 (0.0%) | 0 (0.0%) |
| 5:30 AM to 5:59 AM | 20 (9.0%) | 0 (0.0%) |
| 6:00 AM to 6:29 AM | 6 (2.7%) | 0 (0.0%) |
| 6:30 AM to 6:59 AM | 6 (2.7%) | 0 (0.0%) |
| 7:00 AM to 7:29 AM | 4 (1.8%) | 21 (38.9%) |
| 7:30 AM to 7:59 AM | 17 (7.7%) | 11 (20.4%) |
| 8:00 AM to 8:29 AM | 163 (73.4%) | 5 (9.3%) |
| 8:30 AM to 8:59 AM | 0 (0.0%) | 17 (31.5%) |
| 9:00 AM to 9:59 AM | 0 (0.0%) | 0 (0.0%) |
| 10:00 AM to 10:59 AM | 0 (0.0%) | 0 (0.0%) |
| 11:00 AM to 11:59 AM | 0 (0.0%) | 0 (0.0%) |
| 12:00 PM to 3:59 PM | 0 (0.0%) | 0 (0.0%) |
| 4:00 PM to 11:59 PM | 0 (0.0%) | 0 (0.0%) |
| Total | 222 (100.0%) | 54 (100.0%) |
Housing Occupancy in Graniteville
Occupancy by Ownership in Graniteville
Of the total 335 dwellings in Graniteville, owner-occupied units account for 80 (23.9%), while renter-occupied units make up 255 (76.1%).
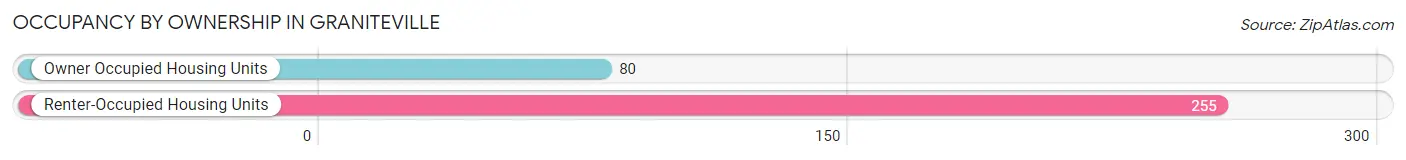
| Occupancy | # Housing Units | % Housing Units |
| Owner Occupied Housing Units | 80 | 23.9% |
| Renter-Occupied Housing Units | 255 | 76.1% |
| Total Occupied Housing Units | 335 | 100.0% |
Occupancy by Household Size in Graniteville
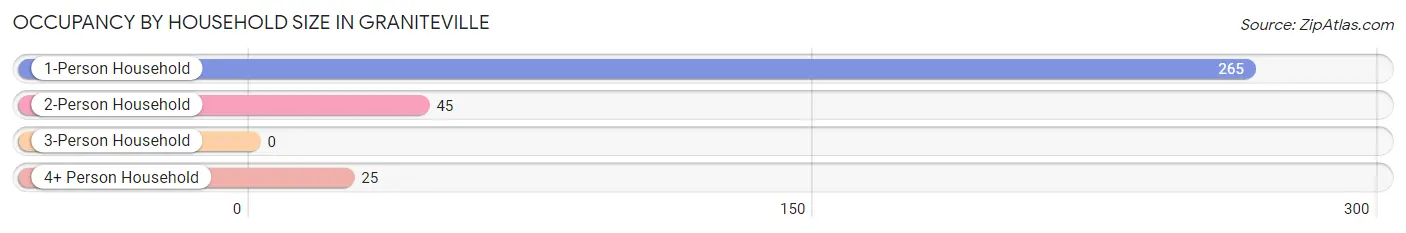
| Household Size | # Housing Units | % Housing Units |
| 1-Person Household | 265 | 79.1% |
| 2-Person Household | 45 | 13.4% |
| 3-Person Household | 0 | 0.0% |
| 4+ Person Household | 25 | 7.5% |
| Total Housing Units | 335 | 100.0% |
Occupancy by Ownership by Household Size in Graniteville
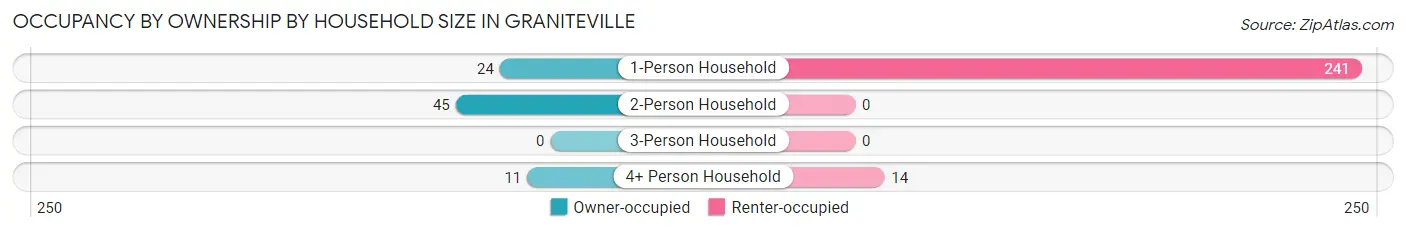
| Household Size | Owner-occupied | Renter-occupied |
| 1-Person Household | 24 (9.1%) | 241 (90.9%) |
| 2-Person Household | 45 (100.0%) | 0 (0.0%) |
| 3-Person Household | 0 (0.0%) | 0 (0.0%) |
| 4+ Person Household | 11 (44.0%) | 14 (56.0%) |
| Total Housing Units | 80 (23.9%) | 255 (76.1%) |
Occupancy by Educational Attainment in Graniteville
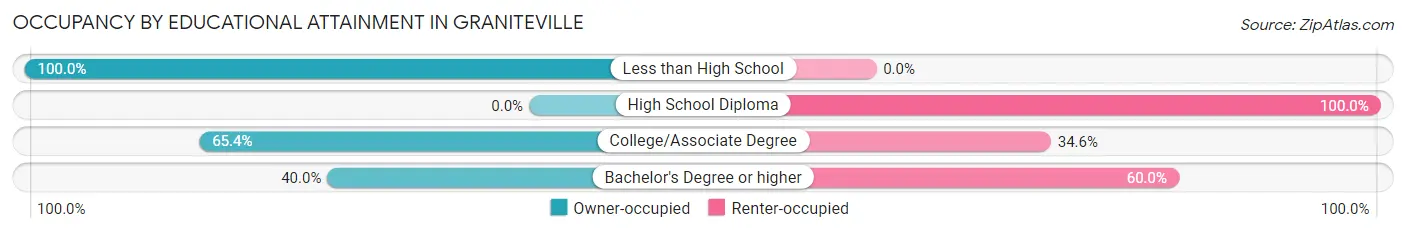
| Household Size | Owner-occupied | Renter-occupied |
| Less than High School | 6 (100.0%) | 0 (0.0%) |
| High School Diploma | 0 (0.0%) | 177 (100.0%) |
| College/Associate Degree | 34 (65.4%) | 18 (34.6%) |
| Bachelor's Degree or higher | 40 (40.0%) | 60 (60.0%) |
Occupancy by Age of Householder in Graniteville
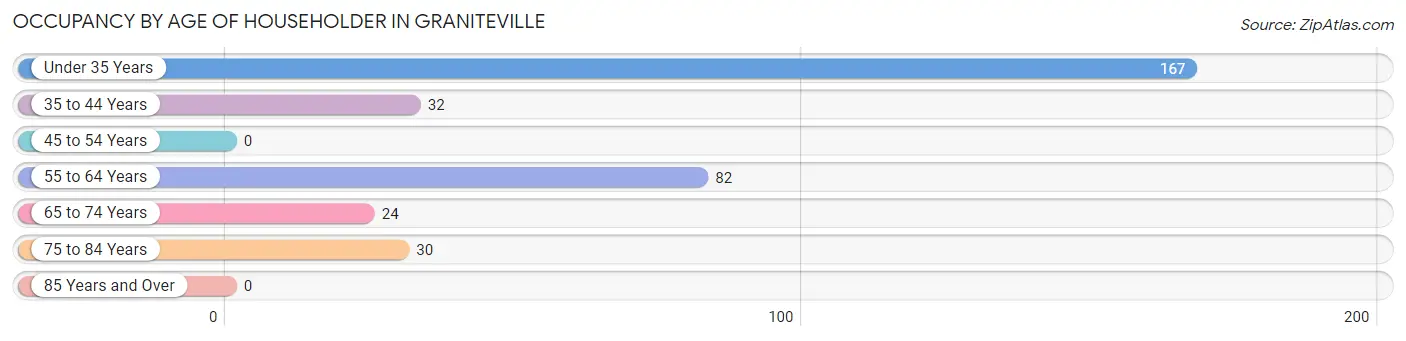
| Age Bracket | # Households | % Households |
| Under 35 Years | 167 | 49.8% |
| 35 to 44 Years | 32 | 9.6% |
| 45 to 54 Years | 0 | 0.0% |
| 55 to 64 Years | 82 | 24.5% |
| 65 to 74 Years | 24 | 7.2% |
| 75 to 84 Years | 30 | 9.0% |
| 85 Years and Over | 0 | 0.0% |
| Total | 335 | 100.0% |
Housing Finances in Graniteville
Median Income by Occupancy in Graniteville
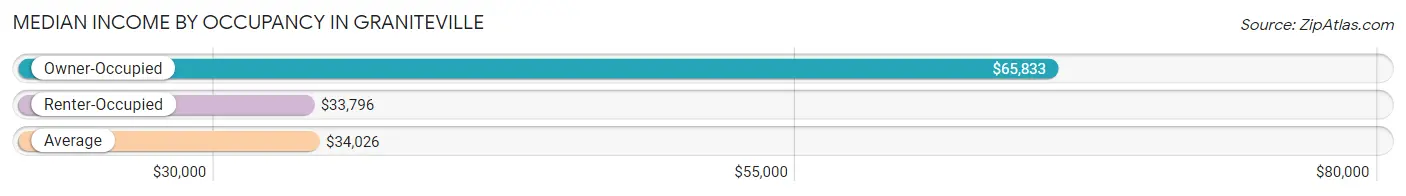
| Occupancy Type | # Households | Median Income |
| Owner-Occupied | 80 (23.9%) | $65,833 |
| Renter-Occupied | 255 (76.1%) | $33,796 |
| Average | 335 (100.0%) | $34,026 |
Occupancy by Householder Income Bracket in Graniteville
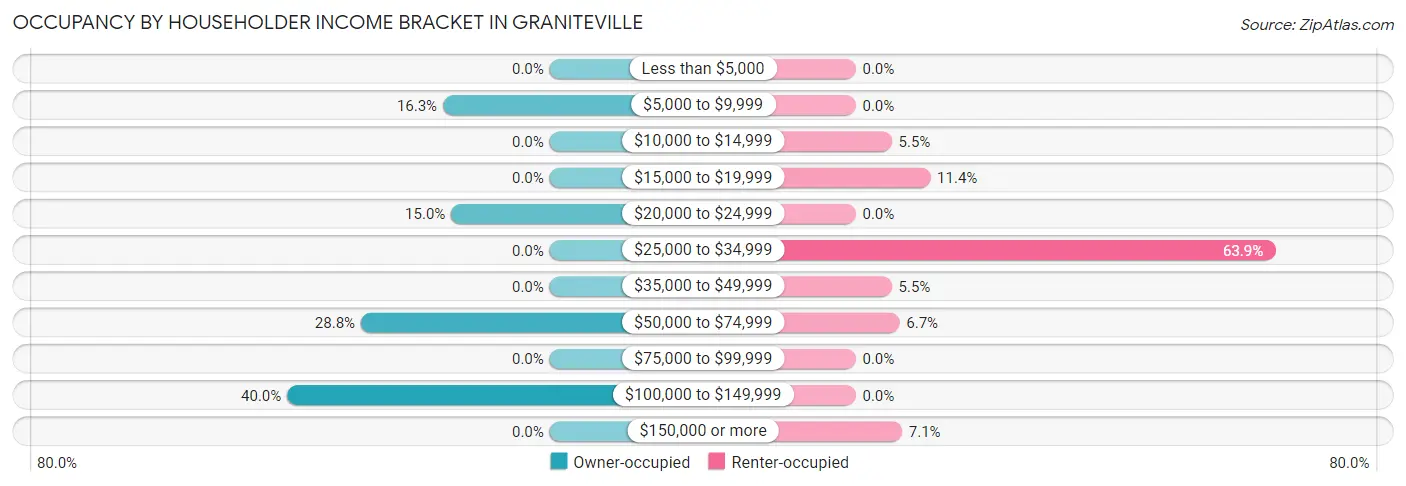
| Income Bracket | Owner-occupied | Renter-occupied |
| Less than $5,000 | 0 (0.0%) | 0 (0.0%) |
| $5,000 to $9,999 | 13 (16.3%) | 0 (0.0%) |
| $10,000 to $14,999 | 0 (0.0%) | 14 (5.5%) |
| $15,000 to $19,999 | 0 (0.0%) | 29 (11.4%) |
| $20,000 to $24,999 | 12 (15.0%) | 0 (0.0%) |
| $25,000 to $34,999 | 0 (0.0%) | 163 (63.9%) |
| $35,000 to $49,999 | 0 (0.0%) | 14 (5.5%) |
| $50,000 to $74,999 | 23 (28.7%) | 17 (6.7%) |
| $75,000 to $99,999 | 0 (0.0%) | 0 (0.0%) |
| $100,000 to $149,999 | 32 (40.0%) | 0 (0.0%) |
| $150,000 or more | 0 (0.0%) | 18 (7.1%) |
| Total | 80 (100.0%) | 255 (100.0%) |
Monthly Housing Cost Tiers in Graniteville
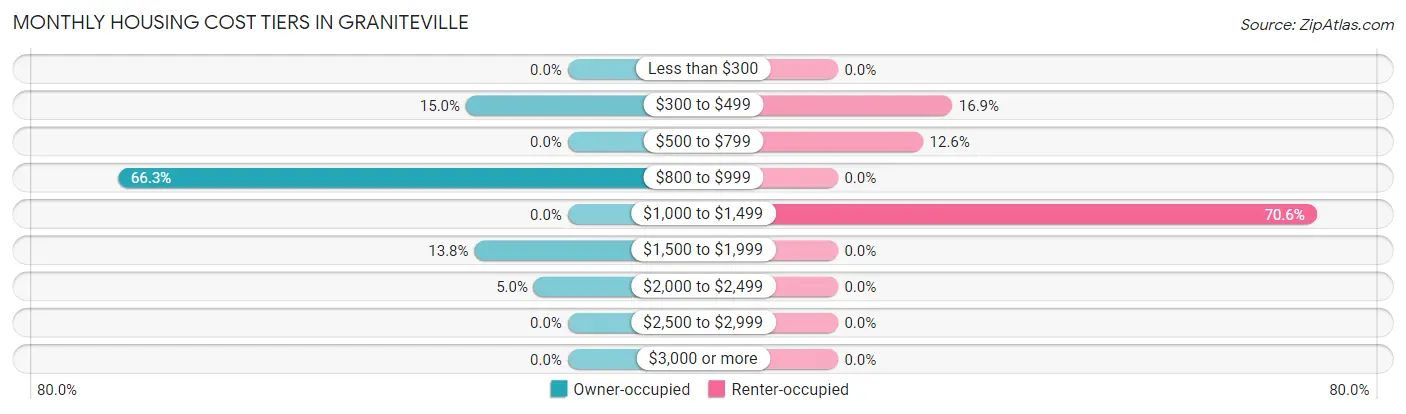
| Monthly Cost | Owner-occupied | Renter-occupied |
| Less than $300 | 0 (0.0%) | 0 (0.0%) |
| $300 to $499 | 12 (15.0%) | 43 (16.9%) |
| $500 to $799 | 0 (0.0%) | 32 (12.6%) |
| $800 to $999 | 53 (66.2%) | 0 (0.0%) |
| $1,000 to $1,499 | 0 (0.0%) | 180 (70.6%) |
| $1,500 to $1,999 | 11 (13.8%) | 0 (0.0%) |
| $2,000 to $2,499 | 4 (5.0%) | 0 (0.0%) |
| $2,500 to $2,999 | 0 (0.0%) | 0 (0.0%) |
| $3,000 or more | 0 (0.0%) | 0 (0.0%) |
| Total | 80 (100.0%) | 255 (100.0%) |
Physical Housing Characteristics in Graniteville
Housing Structures in Graniteville
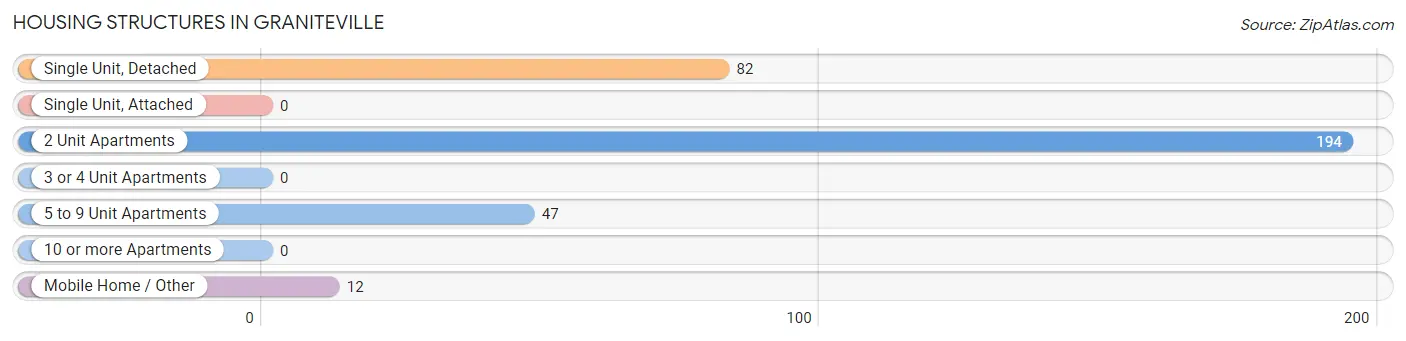
| Structure Type | # Housing Units | % Housing Units |
| Single Unit, Detached | 82 | 24.5% |
| Single Unit, Attached | 0 | 0.0% |
| 2 Unit Apartments | 194 | 57.9% |
| 3 or 4 Unit Apartments | 0 | 0.0% |
| 5 to 9 Unit Apartments | 47 | 14.0% |
| 10 or more Apartments | 0 | 0.0% |
| Mobile Home / Other | 12 | 3.6% |
| Total | 335 | 100.0% |
Housing Structures by Occupancy in Graniteville
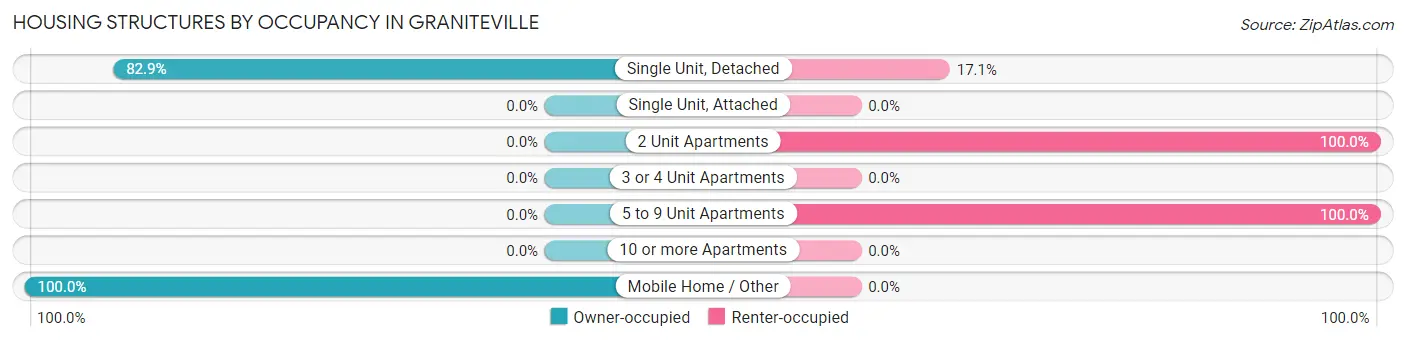
| Structure Type | Owner-occupied | Renter-occupied |
| Single Unit, Detached | 68 (82.9%) | 14 (17.1%) |
| Single Unit, Attached | 0 (0.0%) | 0 (0.0%) |
| 2 Unit Apartments | 0 (0.0%) | 194 (100.0%) |
| 3 or 4 Unit Apartments | 0 (0.0%) | 0 (0.0%) |
| 5 to 9 Unit Apartments | 0 (0.0%) | 47 (100.0%) |
| 10 or more Apartments | 0 (0.0%) | 0 (0.0%) |
| Mobile Home / Other | 12 (100.0%) | 0 (0.0%) |
| Total | 80 (23.9%) | 255 (76.1%) |
Housing Structures by Number of Rooms in Graniteville
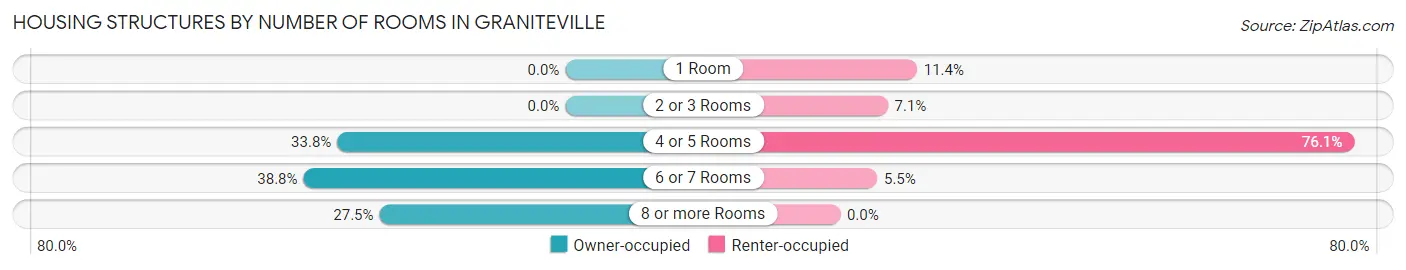
| Number of Rooms | Owner-occupied | Renter-occupied |
| 1 Room | 0 (0.0%) | 29 (11.4%) |
| 2 or 3 Rooms | 0 (0.0%) | 18 (7.1%) |
| 4 or 5 Rooms | 27 (33.8%) | 194 (76.1%) |
| 6 or 7 Rooms | 31 (38.8%) | 14 (5.5%) |
| 8 or more Rooms | 22 (27.5%) | 0 (0.0%) |
| Total | 80 (100.0%) | 255 (100.0%) |
Housing Structure by Heating Type in Graniteville
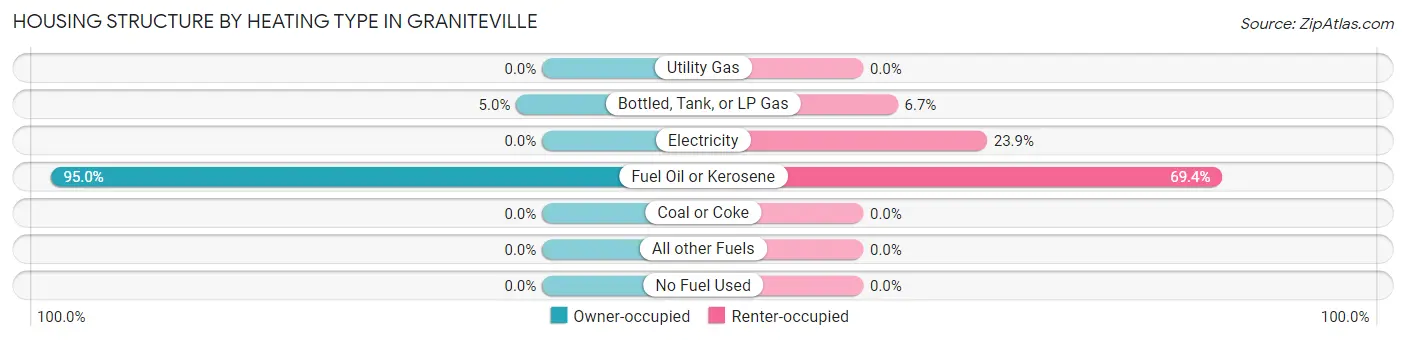
| Heating Type | Owner-occupied | Renter-occupied |
| Utility Gas | 0 (0.0%) | 0 (0.0%) |
| Bottled, Tank, or LP Gas | 4 (5.0%) | 17 (6.7%) |
| Electricity | 0 (0.0%) | 61 (23.9%) |
| Fuel Oil or Kerosene | 76 (95.0%) | 177 (69.4%) |
| Coal or Coke | 0 (0.0%) | 0 (0.0%) |
| All other Fuels | 0 (0.0%) | 0 (0.0%) |
| No Fuel Used | 0 (0.0%) | 0 (0.0%) |
| Total | 80 (100.0%) | 255 (100.0%) |
Household Vehicle Usage in Graniteville
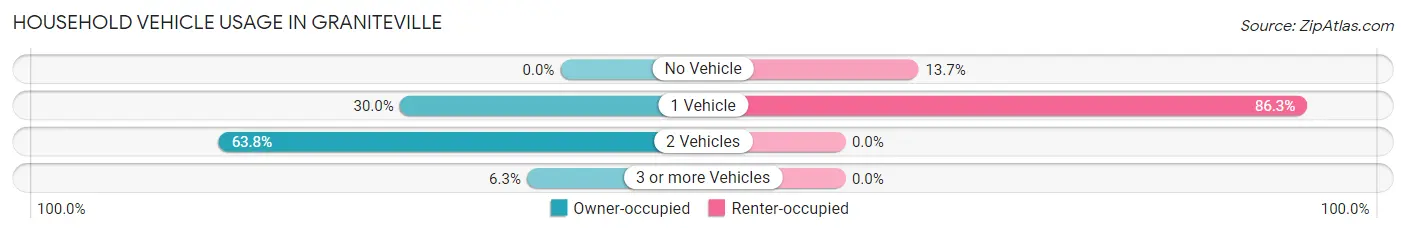
| Vehicles per Household | Owner-occupied | Renter-occupied |
| No Vehicle | 0 (0.0%) | 35 (13.7%) |
| 1 Vehicle | 24 (30.0%) | 220 (86.3%) |
| 2 Vehicles | 51 (63.7%) | 0 (0.0%) |
| 3 or more Vehicles | 5 (6.2%) | 0 (0.0%) |
| Total | 80 (100.0%) | 255 (100.0%) |
Real Estate & Mortgages in Graniteville
Real Estate and Mortgage Overview in Graniteville
| Characteristic | Without Mortgage | With Mortgage |
| Housing Units | 24 | 56 |
| Median Property Value | - | - |
| Median Household Income | - | - |
| Monthly Housing Costs | - | - |
| Real Estate Taxes | - | - |
Property Value by Mortgage Status in Graniteville
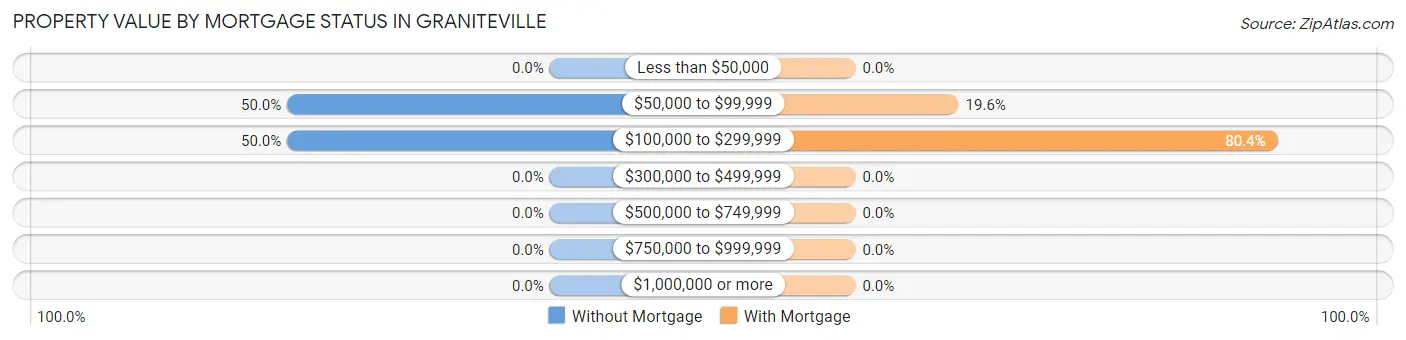
| Property Value | Without Mortgage | With Mortgage |
| Less than $50,000 | 0 (0.0%) | 0 (0.0%) |
| $50,000 to $99,999 | 12 (50.0%) | 11 (19.6%) |
| $100,000 to $299,999 | 12 (50.0%) | 45 (80.4%) |
| $300,000 to $499,999 | 0 (0.0%) | 0 (0.0%) |
| $500,000 to $749,999 | 0 (0.0%) | 0 (0.0%) |
| $750,000 to $999,999 | 0 (0.0%) | 0 (0.0%) |
| $1,000,000 or more | 0 (0.0%) | 0 (0.0%) |
| Total | 24 (100.0%) | 56 (100.0%) |
Household Income by Mortgage Status in Graniteville
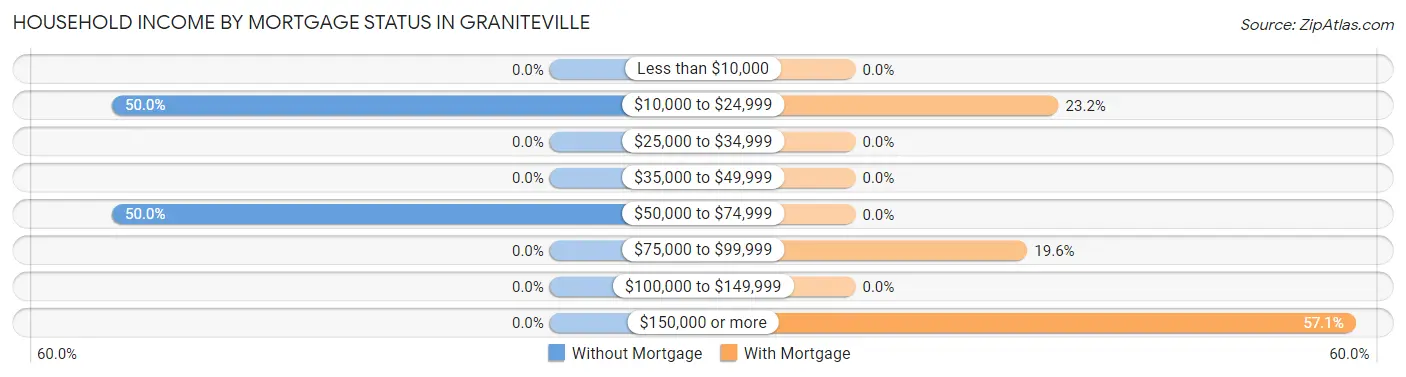
| Household Income | Without Mortgage | With Mortgage |
| Less than $10,000 | 0 (0.0%) | 0 (0.0%) |
| $10,000 to $24,999 | 12 (50.0%) | 13 (23.2%) |
| $25,000 to $34,999 | 0 (0.0%) | 0 (0.0%) |
| $35,000 to $49,999 | 0 (0.0%) | 0 (0.0%) |
| $50,000 to $74,999 | 12 (50.0%) | 0 (0.0%) |
| $75,000 to $99,999 | 0 (0.0%) | 11 (19.6%) |
| $100,000 to $149,999 | 0 (0.0%) | 0 (0.0%) |
| $150,000 or more | 0 (0.0%) | 32 (57.1%) |
| Total | 24 (100.0%) | 56 (100.0%) |
Property Value to Household Income Ratio in Graniteville
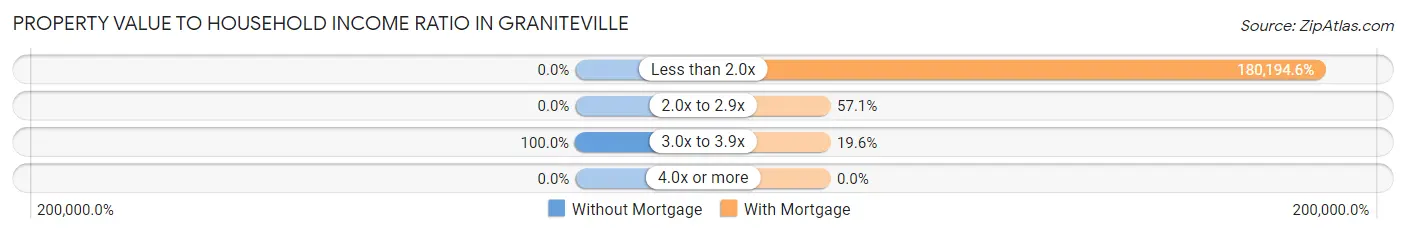
| Value-to-Income Ratio | Without Mortgage | With Mortgage |
| Less than 2.0x | 0 (0.0%) | 100,909 (180,194.6%) |
| 2.0x to 2.9x | 0 (0.0%) | 32 (57.1%) |
| 3.0x to 3.9x | 24 (100.0%) | 11 (19.6%) |
| 4.0x or more | 0 (0.0%) | 0 (0.0%) |
| Total | 24 (100.0%) | 56 (100.0%) |
Real Estate Taxes by Mortgage Status in Graniteville
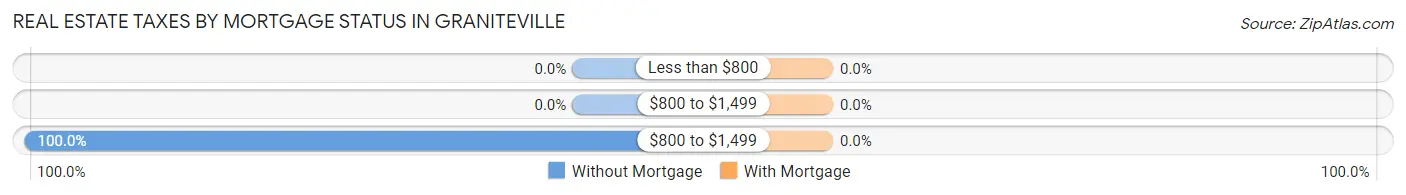
| Property Taxes | Without Mortgage | With Mortgage |
| Less than $800 | 0 (0.0%) | 0 (0.0%) |
| $800 to $1,499 | 0 (0.0%) | 0 (0.0%) |
| $800 to $1,499 | 24 (100.0%) | 0 (0.0%) |
| Total | 24 (100.0%) | 56 (100.0%) |
Health & Disability in Graniteville
Health Insurance Coverage by Age in Graniteville
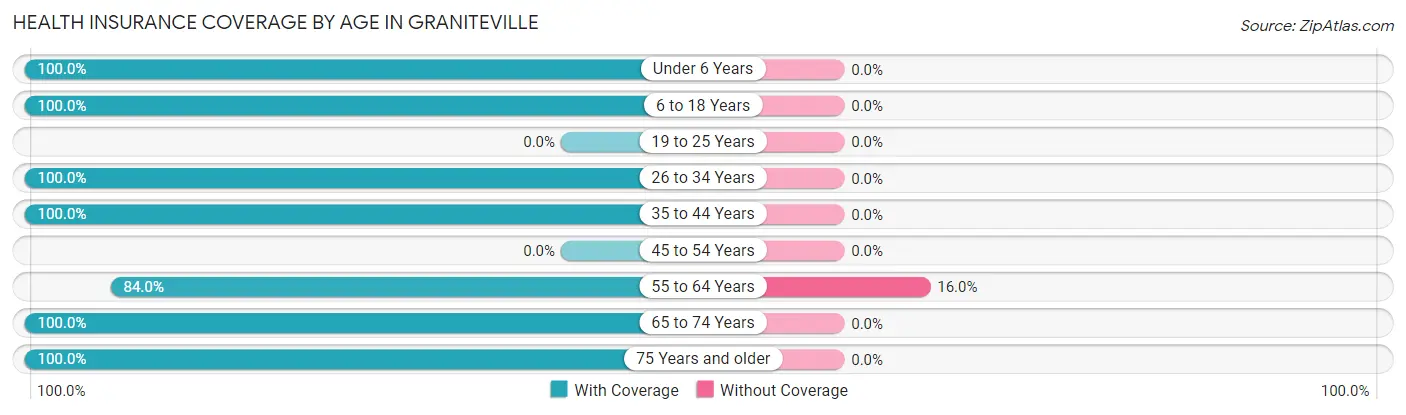
| Age Bracket | With Coverage | Without Coverage |
| Under 6 Years | 16 (100.0%) | 0 (0.0%) |
| 6 to 18 Years | 77 (100.0%) | 0 (0.0%) |
| 19 to 25 Years | 0 (0.0%) | 0 (0.0%) |
| 26 to 34 Years | 177 (100.0%) | 0 (0.0%) |
| 35 to 44 Years | 43 (100.0%) | 0 (0.0%) |
| 45 to 54 Years | 0 (0.0%) | 0 (0.0%) |
| 55 to 64 Years | 89 (84.0%) | 17 (16.0%) |
| 65 to 74 Years | 24 (100.0%) | 0 (0.0%) |
| 75 Years and older | 44 (100.0%) | 0 (0.0%) |
| Total | 470 (96.5%) | 17 (3.5%) |
Health Insurance Coverage by Citizenship Status in Graniteville
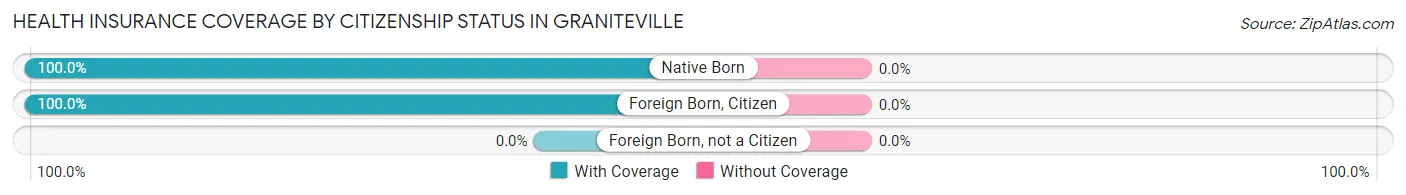
| Citizenship Status | With Coverage | Without Coverage |
| Native Born | 16 (100.0%) | 0 (0.0%) |
| Foreign Born, Citizen | 77 (100.0%) | 0 (0.0%) |
| Foreign Born, not a Citizen | 0 (0.0%) | 0 (0.0%) |
Health Insurance Coverage by Household Income in Graniteville
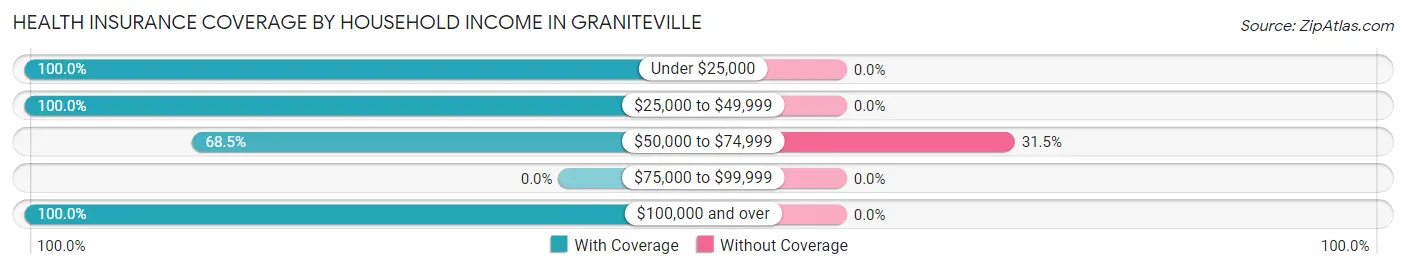
| Household Income | With Coverage | Without Coverage |
| Under $25,000 | 84 (100.0%) | 0 (0.0%) |
| $25,000 to $49,999 | 242 (100.0%) | 0 (0.0%) |
| $50,000 to $74,999 | 37 (68.5%) | 17 (31.5%) |
| $75,000 to $99,999 | 0 (0.0%) | 0 (0.0%) |
| $100,000 and over | 107 (100.0%) | 0 (0.0%) |
Public vs Private Health Insurance Coverage by Age in Graniteville
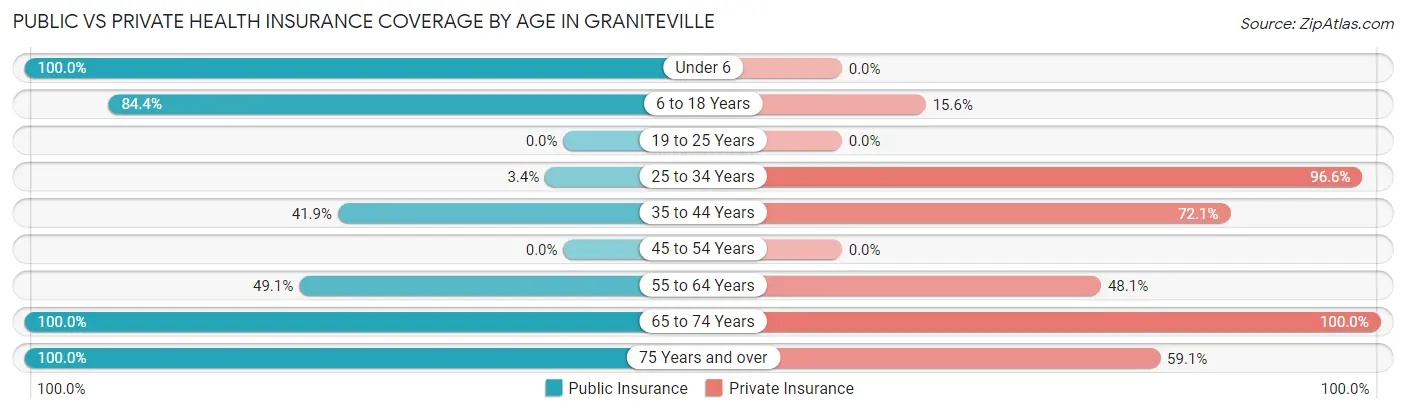
| Age Bracket | Public Insurance | Private Insurance |
| Under 6 | 16 (100.0%) | 0 (0.0%) |
| 6 to 18 Years | 65 (84.4%) | 12 (15.6%) |
| 19 to 25 Years | 0 (0.0%) | 0 (0.0%) |
| 25 to 34 Years | 6 (3.4%) | 171 (96.6%) |
| 35 to 44 Years | 18 (41.9%) | 31 (72.1%) |
| 45 to 54 Years | 0 (0.0%) | 0 (0.0%) |
| 55 to 64 Years | 52 (49.1%) | 51 (48.1%) |
| 65 to 74 Years | 24 (100.0%) | 24 (100.0%) |
| 75 Years and over | 44 (100.0%) | 26 (59.1%) |
| Total | 225 (46.2%) | 315 (64.7%) |
Disability Status by Sex by Age in Graniteville
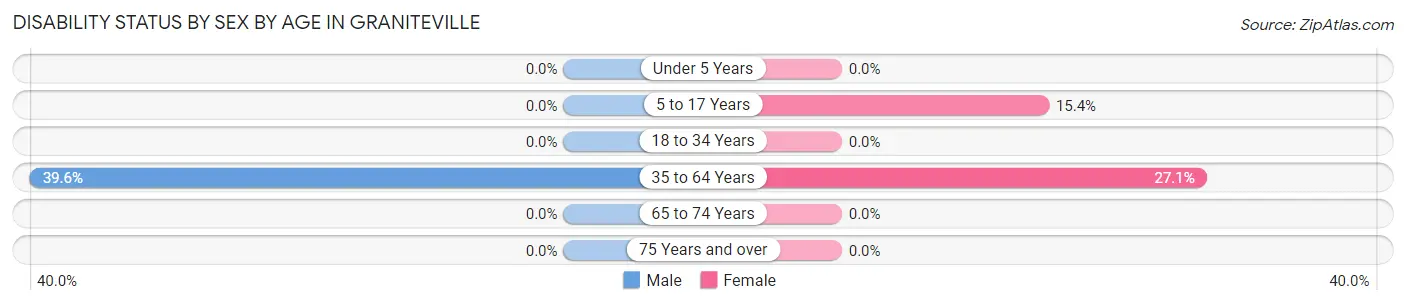
| Age Bracket | Male | Female |
| Under 5 Years | 0 (0.0%) | 0 (0.0%) |
| 5 to 17 Years | 0 (0.0%) | 6 (15.4%) |
| 18 to 34 Years | 0 (0.0%) | 0 (0.0%) |
| 35 to 64 Years | 21 (39.6%) | 26 (27.1%) |
| 65 to 74 Years | 0 (0.0%) | 0 (0.0%) |
| 75 Years and over | 0 (0.0%) | 0 (0.0%) |
Disability Class by Sex by Age in Graniteville
Disability Class: Hearing Difficulty
| Age Bracket | Male | Female |
| Under 5 Years | 0 (0.0%) | 0 (0.0%) |
| 5 to 17 Years | 0 (0.0%) | 0 (0.0%) |
| 18 to 34 Years | 0 (0.0%) | 0 (0.0%) |
| 35 to 64 Years | 0 (0.0%) | 0 (0.0%) |
| 65 to 74 Years | 0 (0.0%) | 0 (0.0%) |
| 75 Years and over | 0 (0.0%) | 0 (0.0%) |
Disability Class: Vision Difficulty
| Age Bracket | Male | Female |
| Under 5 Years | 0 (0.0%) | 0 (0.0%) |
| 5 to 17 Years | 0 (0.0%) | 0 (0.0%) |
| 18 to 34 Years | 0 (0.0%) | 0 (0.0%) |
| 35 to 64 Years | 0 (0.0%) | 0 (0.0%) |
| 65 to 74 Years | 0 (0.0%) | 0 (0.0%) |
| 75 Years and over | 0 (0.0%) | 0 (0.0%) |
Disability Class: Cognitive Difficulty
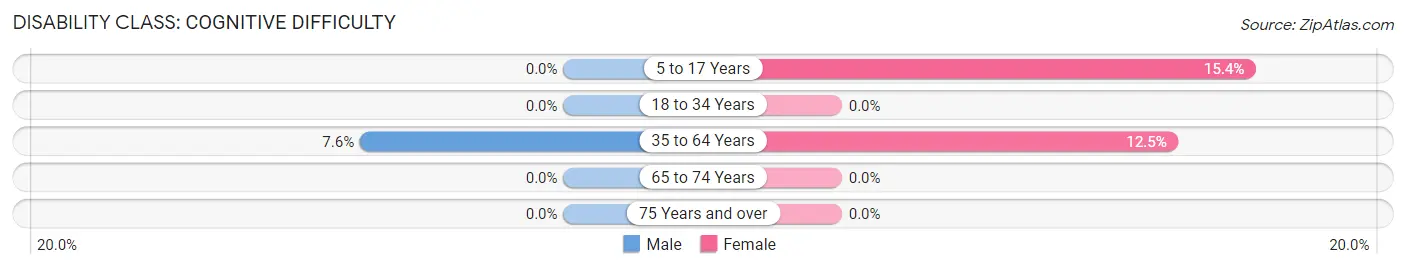
| Age Bracket | Male | Female |
| 5 to 17 Years | 0 (0.0%) | 6 (15.4%) |
| 18 to 34 Years | 0 (0.0%) | 0 (0.0%) |
| 35 to 64 Years | 4 (7.5%) | 12 (12.5%) |
| 65 to 74 Years | 0 (0.0%) | 0 (0.0%) |
| 75 Years and over | 0 (0.0%) | 0 (0.0%) |
Disability Class: Ambulatory Difficulty
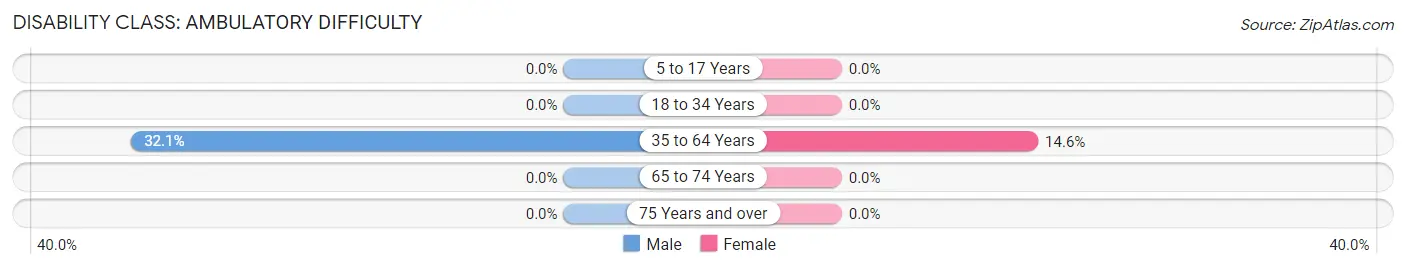
| Age Bracket | Male | Female |
| 5 to 17 Years | 0 (0.0%) | 0 (0.0%) |
| 18 to 34 Years | 0 (0.0%) | 0 (0.0%) |
| 35 to 64 Years | 17 (32.1%) | 14 (14.6%) |
| 65 to 74 Years | 0 (0.0%) | 0 (0.0%) |
| 75 Years and over | 0 (0.0%) | 0 (0.0%) |
Disability Class: Self-Care Difficulty
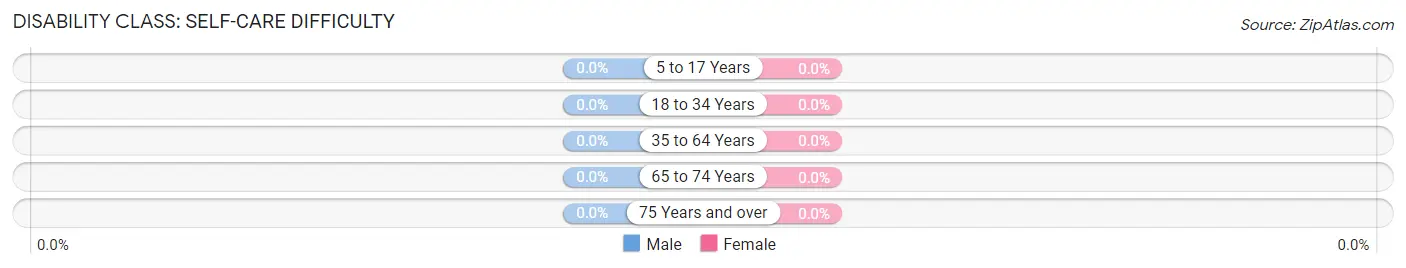
| Age Bracket | Male | Female |
| 5 to 17 Years | 0 (0.0%) | 0 (0.0%) |
| 18 to 34 Years | 0 (0.0%) | 0 (0.0%) |
| 35 to 64 Years | 0 (0.0%) | 0 (0.0%) |
| 65 to 74 Years | 0 (0.0%) | 0 (0.0%) |
| 75 Years and over | 0 (0.0%) | 0 (0.0%) |
Technology Access in Graniteville
Computing Device Access in Graniteville
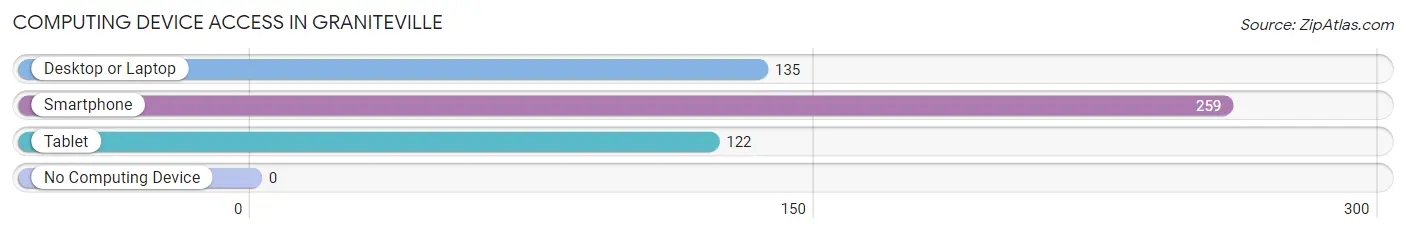
| Device Type | # Households | % Households |
| Desktop or Laptop | 135 | 40.3% |
| Smartphone | 259 | 77.3% |
| Tablet | 122 | 36.4% |
| No Computing Device | 0 | 0.0% |
| Total | 335 | 100.0% |
Internet Access in Graniteville
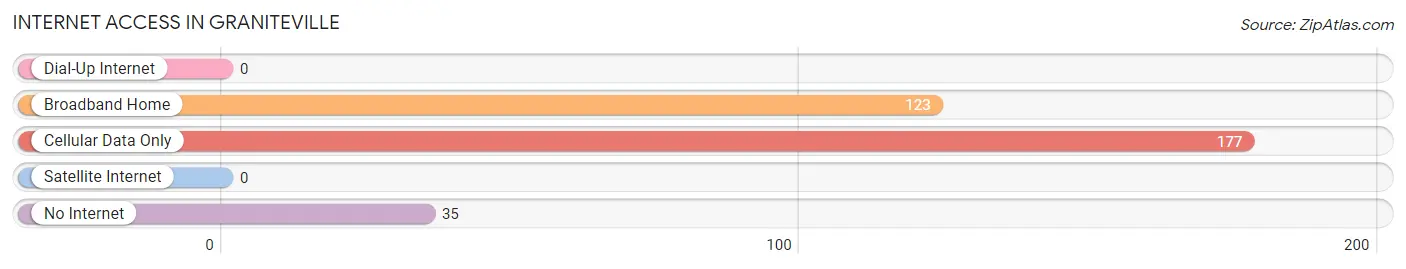
| Internet Type | # Households | % Households |
| Dial-Up Internet | 0 | 0.0% |
| Broadband Home | 123 | 36.7% |
| Cellular Data Only | 177 | 52.8% |
| Satellite Internet | 0 | 0.0% |
| No Internet | 35 | 10.4% |
| Total | 335 | 100.0% |
Graniteville Summary
Graniteville, Vermont is a small town located in the northwestern corner of the state. It is situated in the Green Mountains, and is surrounded by the towns of Barre, Montpelier, and Waterbury. The town has a population of approximately 1,500 people, and is home to a variety of businesses, including a ski resort, a golf course, and a number of small shops and restaurants.
History
Graniteville was first settled in 1790 by a group of settlers from Massachusetts. The town was originally known as “Graniteville” due to the abundance of granite in the area. The town was incorporated in 1802, and the first post office was established in 1803.
In the early 19th century, Graniteville was a thriving agricultural community. The town was home to a number of farms, and the local economy was largely based on the production of dairy products, wool, and other agricultural products.
In the late 19th century, the town began to experience a shift in its economy. The railroad arrived in Graniteville in 1875, and the town quickly became a center for the production of granite. The granite industry was a major source of employment for the town, and it continued to be a major part of the local economy until the mid-20th century.
Geography
Graniteville is located in the northwestern corner of Vermont, in the Green Mountains. The town is situated at an elevation of 1,400 feet, and is surrounded by the towns of Barre, Montpelier, and Waterbury. The town is located approximately 25 miles from the state capital of Montpelier.
The town is home to a variety of natural features, including the Graniteville Gorge, a deep ravine that runs through the center of town. The gorge is home to a variety of wildlife, including deer, foxes, and a variety of birds.
Economy
Graniteville’s economy is largely based on tourism. The town is home to a number of attractions, including a ski resort, a golf course, and a number of small shops and restaurants. The town is also home to a number of small businesses, including a brewery, a winery, and a number of art galleries.
The town is also home to a number of manufacturing businesses, including a granite quarry and a number of small machine shops. The town is also home to a number of small farms, which produce a variety of agricultural products, including dairy products, wool, and other agricultural products.
Demographics
As of the 2010 census, Graniteville had a population of 1,500 people. The town is predominantly white, with approximately 95% of the population identifying as white. The town is also home to a small Hispanic population, with approximately 4% of the population identifying as Hispanic or Latino.
The median household income in Graniteville is approximately $50,000, and the median home value is approximately $200,000. The town has a low unemployment rate, with approximately 4% of the population unemployed. The town also has a low poverty rate, with approximately 5% of the population living below the poverty line.
Common Questions
What is Per Capita Income in Graniteville?
Per Capita income in Graniteville is $60,586.
What is the Median Family Income in Graniteville?
Median Family Income in Graniteville is $66,250.
What is the Median Household income in Graniteville?
Median Household Income in Graniteville is $34,026.
What is Income or Wage Gap in Graniteville?
Income or Wage Gap in Graniteville is 9.2%.
Women in Graniteville earn 90.8 cents for every dollar earned by a man.
What is Inequality or Gini Index in Graniteville?
Inequality or Gini Index in Graniteville is 0.62.
What is the Total Population of Graniteville?
Total Population of Graniteville is 487.
What is the Total Male Population of Graniteville?
Total Male Population of Graniteville is 276.
What is the Total Female Population of Graniteville?
Total Female Population of Graniteville is 211.
What is the Ratio of Males per 100 Females in Graniteville?
There are 130.81 Males per 100 Females in Graniteville.
What is the Ratio of Females per 100 Males in Graniteville?
There are 76.45 Females per 100 Males in Graniteville.
What is the Median Population Age in Graniteville?
Median Population Age in Graniteville is 32.9 Years.
What is the Average Family Size in Graniteville
Average Family Size in Graniteville is 3.0 People.
What is the Average Household Size in Graniteville
Average Household Size in Graniteville is 1.4 People.
How Large is the Labor Force in Graniteville?
There are 290 People in the Labor Forcein in Graniteville.
What is the Percentage of People in the Labor Force in Graniteville?
73.6% of People are in the Labor Force in Graniteville.
What is the Unemployment Rate in Graniteville?
Unemployment Rate in Graniteville is 4.8%.