Elkridge, MD Map & Demographics
Elkridge Map
Elkridge Overview
$51,008
PER CAPITA INCOME
$136,952
AVG FAMILY INCOME
$127,027
AVG HOUSEHOLD INCOME
33.8%
WAGE / INCOME GAP [ % ]
66.2¢/ $1
WAGE / INCOME GAP [ $ ]
0.37
INEQUALITY / GINI INDEX
25,251
TOTAL POPULATION
12,135
MALE POPULATION
13,116
FEMALE POPULATION
92.52
MALES / 100 FEMALES
108.08
FEMALES / 100 MALES
34.3
MEDIAN AGE
3.2
AVG FAMILY SIZE
2.8
AVG HOUSEHOLD SIZE
14,274
LABOR FORCE [ PEOPLE ]
75.1%
PERCENT IN LABOR FORCE
5.3%
UNEMPLOYMENT RATE
Elkridge Zip Codes
Income in Elkridge
Income Overview in Elkridge
Per Capita Income in Elkridge is $51,008, while median incomes of families and households are $136,952 and $127,027 respectively.
| Characteristic | Number | Measure |
| Per Capita Income | 25,251 | $51,008 |
| Median Family Income | 6,473 | $136,952 |
| Mean Family Income | 6,473 | $151,964 |
| Median Household Income | 8,942 | $127,027 |
| Mean Household Income | 8,942 | $141,413 |
| Income Deficit | 6,473 | $0 |
| Wage / Income Gap (%) | 25,251 | 33.81% |
| Wage / Income Gap ($) | 25,251 | 66.19¢ per $1 |
| Gini / Inequality Index | 25,251 | 0.37 |
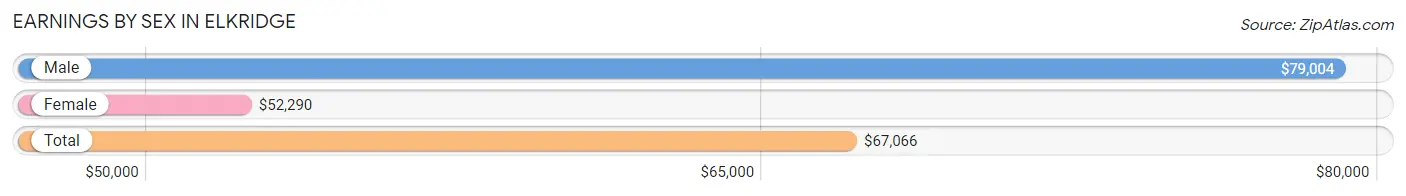
Earnings by Sex in Elkridge
Average Earnings in Elkridge are $67,066, $79,004 for men and $52,290 for women, a difference of 33.8%.
| Sex | Number | Average Earnings |
| Male | 7,339 (49.7%) | $79,004 |
| Female | 7,429 (50.3%) | $52,290 |
| Total | 14,768 (100.0%) | $67,066 |
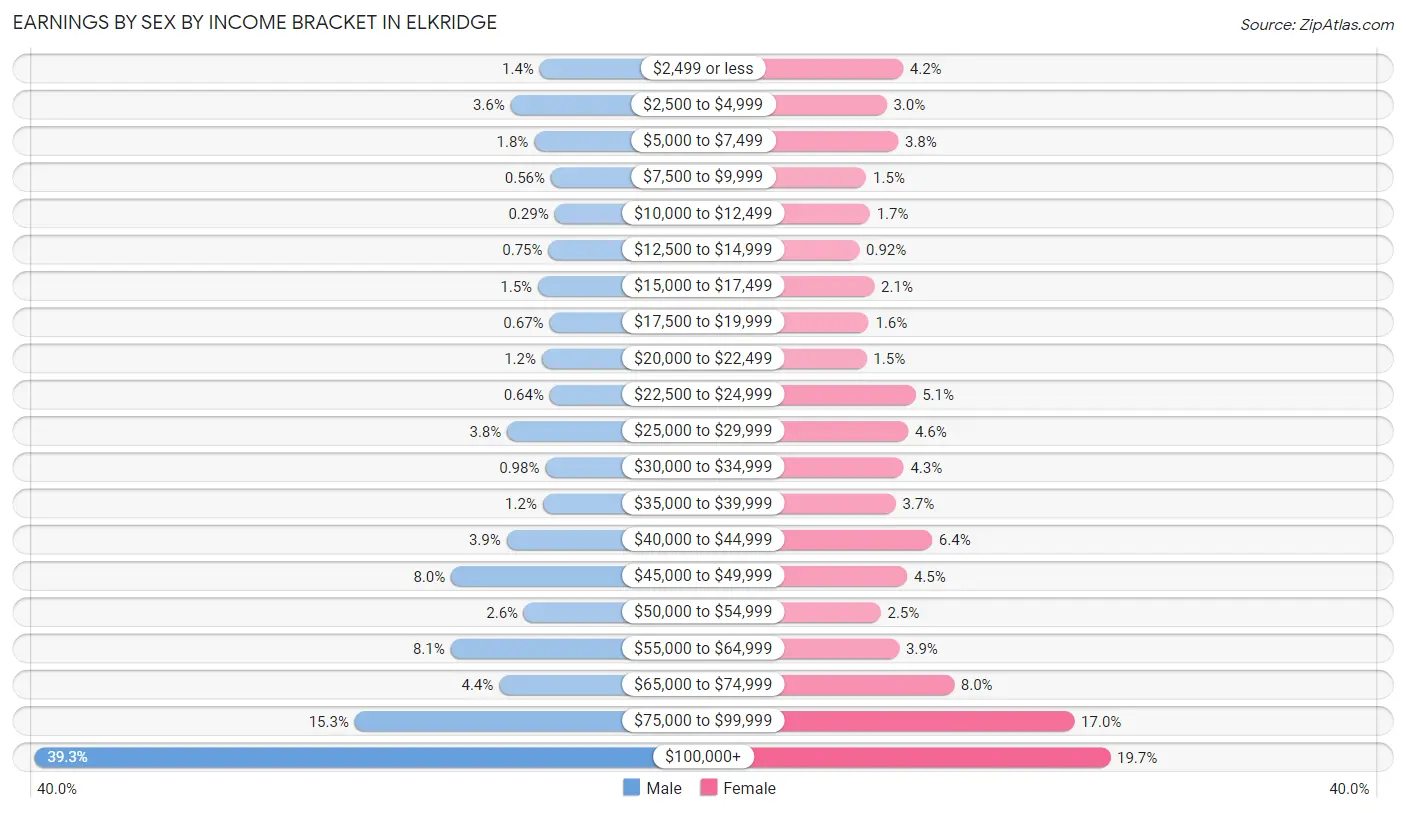
Earnings by Sex by Income Bracket in Elkridge
The most common earnings brackets in Elkridge are $100,000+ for men (2,881 | 39.3%) and $100,000+ for women (1,466 | 19.7%).
| Income | Male | Female |
| $2,499 or less | 103 (1.4%) | 312 (4.2%) |
| $2,500 to $4,999 | 263 (3.6%) | 221 (3.0%) |
| $5,000 to $7,499 | 133 (1.8%) | 285 (3.8%) |
| $7,500 to $9,999 | 41 (0.6%) | 108 (1.5%) |
| $10,000 to $12,499 | 21 (0.3%) | 128 (1.7%) |
| $12,500 to $14,999 | 55 (0.7%) | 68 (0.9%) |
| $15,000 to $17,499 | 112 (1.5%) | 152 (2.1%) |
| $17,500 to $19,999 | 49 (0.7%) | 121 (1.6%) |
| $20,000 to $22,499 | 91 (1.2%) | 109 (1.5%) |
| $22,500 to $24,999 | 47 (0.6%) | 381 (5.1%) |
| $25,000 to $29,999 | 282 (3.8%) | 341 (4.6%) |
| $30,000 to $34,999 | 72 (1.0%) | 316 (4.3%) |
| $35,000 to $39,999 | 86 (1.2%) | 271 (3.6%) |
| $40,000 to $44,999 | 285 (3.9%) | 474 (6.4%) |
| $45,000 to $49,999 | 590 (8.0%) | 335 (4.5%) |
| $50,000 to $54,999 | 189 (2.6%) | 188 (2.5%) |
| $55,000 to $64,999 | 593 (8.1%) | 291 (3.9%) |
| $65,000 to $74,999 | 326 (4.4%) | 596 (8.0%) |
| $75,000 to $99,999 | 1,120 (15.3%) | 1,266 (17.0%) |
| $100,000+ | 2,881 (39.3%) | 1,466 (19.7%) |
| Total | 7,339 (100.0%) | 7,429 (100.0%) |
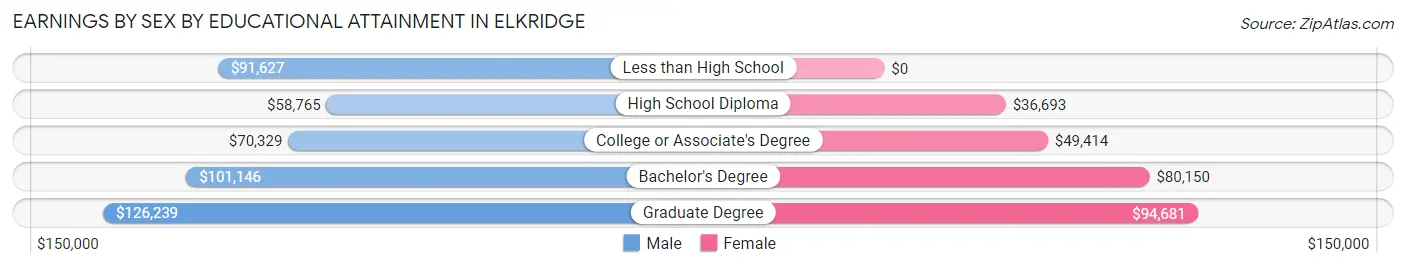
Earnings by Sex by Educational Attainment in Elkridge
Average earnings in Elkridge are $89,891 for men and $65,562 for women, a difference of 27.1%. Men with an educational attainment of graduate degree enjoy the highest average annual earnings of $126,239, while those with high school diploma education earn the least with $58,765. Women with an educational attainment of graduate degree earn the most with the average annual earnings of $94,681, while those with high school diploma education have the smallest earnings of $36,693.
| Educational Attainment | Male Income | Female Income |
| Less than High School | $91,627 | $0 |
| High School Diploma | $58,765 | $36,693 |
| College or Associate's Degree | $70,329 | $49,414 |
| Bachelor's Degree | $101,146 | $80,150 |
| Graduate Degree | $126,239 | $94,681 |
| Total | $89,891 | $65,562 |
Family Income in Elkridge
Family Income Brackets in Elkridge
According to the Elkridge family income data, there are 1,910 families falling into the $200,000+ income range, which is the most common income bracket and makes up 29.5% of all families. Conversely, the $10,000 to $14,999 income bracket is the least frequent group with only 19 families (0.3%) belonging to this category.
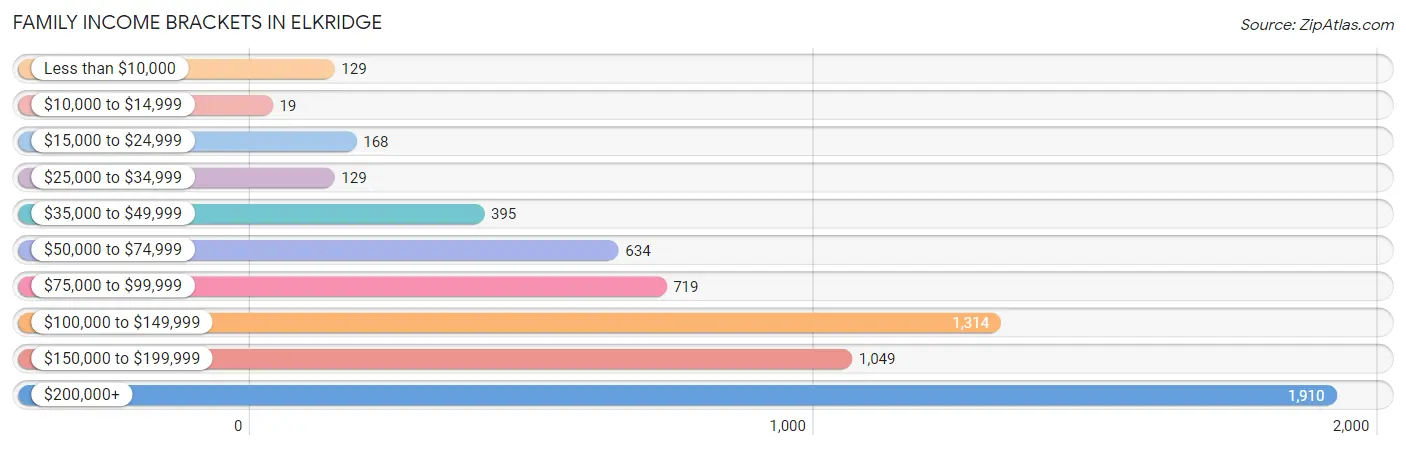
| Income Bracket | # Families | % Families |
| Less than $10,000 | 129 | 2.0% |
| $10,000 to $14,999 | 19 | 0.3% |
| $15,000 to $24,999 | 168 | 2.6% |
| $25,000 to $34,999 | 129 | 2.0% |
| $35,000 to $49,999 | 395 | 6.1% |
| $50,000 to $74,999 | 634 | 9.8% |
| $75,000 to $99,999 | 719 | 11.1% |
| $100,000 to $149,999 | 1,314 | 20.3% |
| $150,000 to $199,999 | 1,049 | 16.2% |
| $200,000+ | 1,910 | 29.5% |
Family Income by Famaliy Size in Elkridge
4-person families (1,571 | 24.3%) account for the highest median family income in Elkridge with $191,781 per family, while 2-person families (2,316 | 35.8%) have the highest median income of $60,736 per family member.
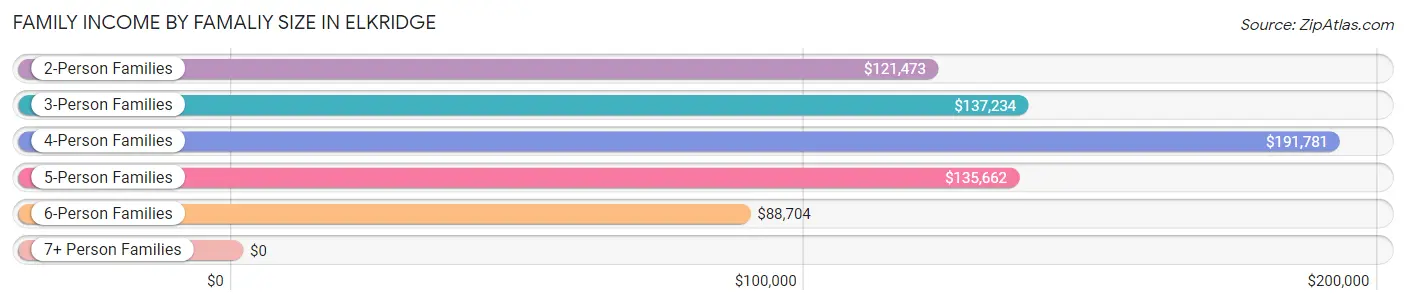
| Income Bracket | # Families | Median Income |
| 2-Person Families | 2,316 (35.8%) | $121,473 |
| 3-Person Families | 1,730 (26.7%) | $137,234 |
| 4-Person Families | 1,571 (24.3%) | $191,781 |
| 5-Person Families | 563 (8.7%) | $135,662 |
| 6-Person Families | 210 (3.2%) | $88,704 |
| 7+ Person Families | 83 (1.3%) | $0 |
| Total | 6,473 (100.0%) | $136,952 |
Family Income by Number of Earners in Elkridge
The median family income in Elkridge is $136,952, with families comprising 3+ earners (1,136) having the highest median family income of $213,184, while families with no earners (324) have the lowest median family income of $68,000, accounting for 17.5% and 5.0% of families, respectively.
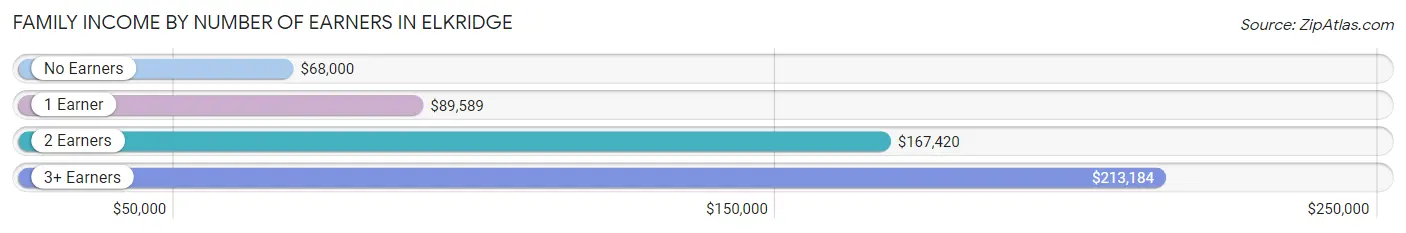
| Number of Earners | # Families | Median Income |
| No Earners | 324 (5.0%) | $68,000 |
| 1 Earner | 2,178 (33.7%) | $89,589 |
| 2 Earners | 2,835 (43.8%) | $167,420 |
| 3+ Earners | 1,136 (17.5%) | $213,184 |
| Total | 6,473 (100.0%) | $136,952 |
Household Income in Elkridge
Household Income Brackets in Elkridge
With 2,191 households falling in the category, the $200,000+ income range is the most frequent in Elkridge, accounting for 24.5% of all households. In contrast, only 54 households (0.6%) fall into the $10,000 to $14,999 income bracket, making it the least populous group.
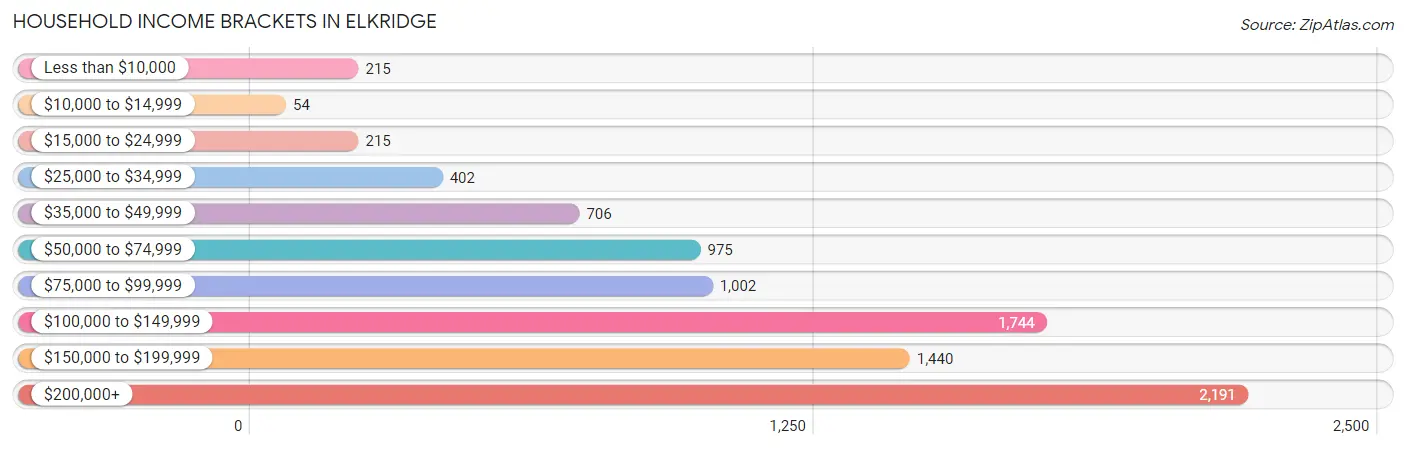
| Income Bracket | # Households | % Households |
| Less than $10,000 | 215 | 2.4% |
| $10,000 to $14,999 | 54 | 0.6% |
| $15,000 to $24,999 | 215 | 2.4% |
| $25,000 to $34,999 | 402 | 4.5% |
| $35,000 to $49,999 | 706 | 7.9% |
| $50,000 to $74,999 | 975 | 10.9% |
| $75,000 to $99,999 | 1,002 | 11.2% |
| $100,000 to $149,999 | 1,744 | 19.5% |
| $150,000 to $199,999 | 1,440 | 16.1% |
| $200,000+ | 2,191 | 24.5% |
Household Income by Householder Age in Elkridge
The median household income in Elkridge is $127,027, with the highest median household income of $136,726 found in the 45 to 64 years age bracket for the primary householder. A total of 3,224 households (36.0%) fall into this category. Meanwhile, the 15 to 24 years age bracket for the primary householder has the lowest median household income of $57,750, with 374 households (4.2%) in this group.
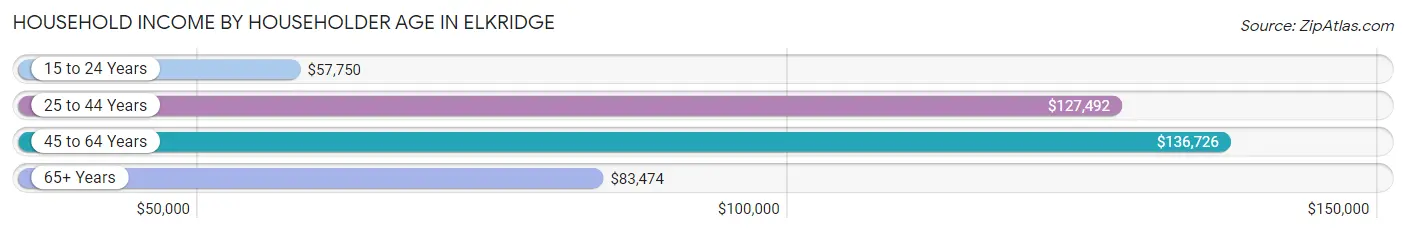
| Income Bracket | # Households | Median Income |
| 15 to 24 Years | 374 (4.2%) | $57,750 |
| 25 to 44 Years | 4,153 (46.4%) | $127,492 |
| 45 to 64 Years | 3,224 (36.0%) | $136,726 |
| 65+ Years | 1,191 (13.3%) | $83,474 |
| Total | 8,942 (100.0%) | $127,027 |
Poverty in Elkridge
Income Below Poverty by Sex and Age in Elkridge
With 7.6% poverty level for males and 8.1% for females among the residents of Elkridge, 16 and 17 year old males and 15 year old females are the most vulnerable to poverty, with 67 males (27.7%) and 96 females (64.9%) in their respective age groups living below the poverty level.
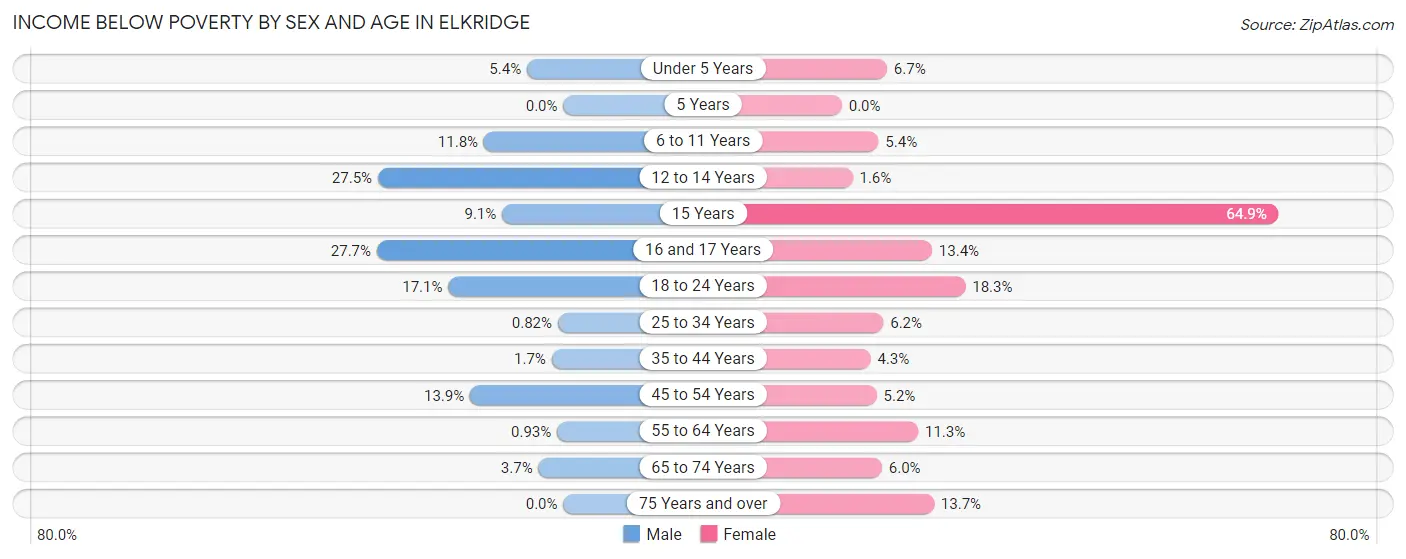
| Age Bracket | Male | Female |
| Under 5 Years | 57 (5.4%) | 50 (6.7%) |
| 5 Years | 0 (0.0%) | 0 (0.0%) |
| 6 to 11 Years | 135 (11.8%) | 45 (5.4%) |
| 12 to 14 Years | 157 (27.5%) | 11 (1.6%) |
| 15 Years | 7 (9.1%) | 96 (64.9%) |
| 16 and 17 Years | 67 (27.7%) | 42 (13.4%) |
| 18 to 24 Years | 182 (17.1%) | 197 (18.3%) |
| 25 to 34 Years | 16 (0.8%) | 127 (6.2%) |
| 35 to 44 Years | 34 (1.7%) | 103 (4.3%) |
| 45 to 54 Years | 227 (13.9%) | 77 (5.2%) |
| 55 to 64 Years | 11 (0.9%) | 171 (11.3%) |
| 65 to 74 Years | 31 (3.7%) | 34 (5.9%) |
| 75 Years and over | 0 (0.0%) | 64 (13.7%) |
| Total | 924 (7.6%) | 1,017 (8.1%) |
Income Above Poverty by Sex and Age in Elkridge
According to the poverty statistics in Elkridge, males aged 5 years and females aged 5 years are the age groups that are most secure financially, with 100.0% of males and 100.0% of females in these age groups living above the poverty line.
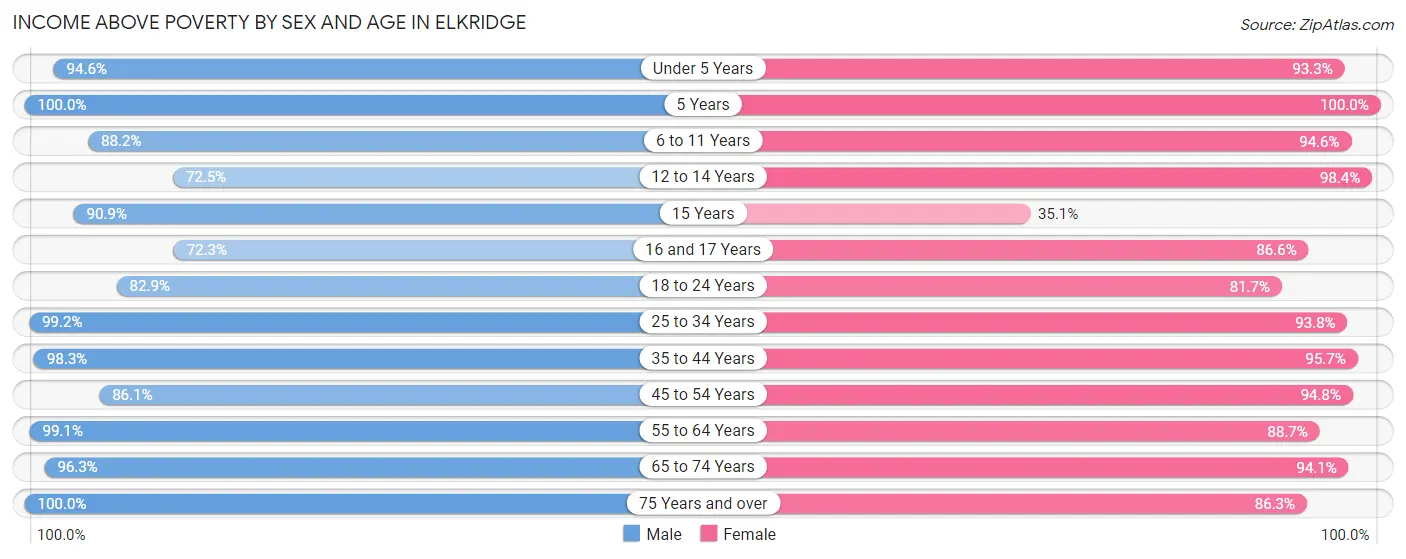
| Age Bracket | Male | Female |
| Under 5 Years | 999 (94.6%) | 696 (93.3%) |
| 5 Years | 211 (100.0%) | 189 (100.0%) |
| 6 to 11 Years | 1,009 (88.2%) | 782 (94.6%) |
| 12 to 14 Years | 413 (72.5%) | 682 (98.4%) |
| 15 Years | 70 (90.9%) | 52 (35.1%) |
| 16 and 17 Years | 175 (72.3%) | 272 (86.6%) |
| 18 to 24 Years | 883 (82.9%) | 877 (81.7%) |
| 25 to 34 Years | 1,947 (99.2%) | 1,936 (93.8%) |
| 35 to 44 Years | 1,934 (98.3%) | 2,312 (95.7%) |
| 45 to 54 Years | 1,411 (86.1%) | 1,413 (94.8%) |
| 55 to 64 Years | 1,170 (99.1%) | 1,340 (88.7%) |
| 65 to 74 Years | 810 (96.3%) | 537 (94.1%) |
| 75 Years and over | 170 (100.0%) | 404 (86.3%) |
| Total | 11,202 (92.4%) | 11,492 (91.9%) |
Income Below Poverty Among Married-Couple Families in Elkridge
The poverty statistics for married-couple families in Elkridge show that 2.9% or 132 of the total 4,589 families live below the poverty line. Families with 1 or 2 children have the highest poverty rate of 5.8%, comprising of 121 families. On the other hand, families with 3 or 4 children have the lowest poverty rate of 0.0%, which includes 0 families.
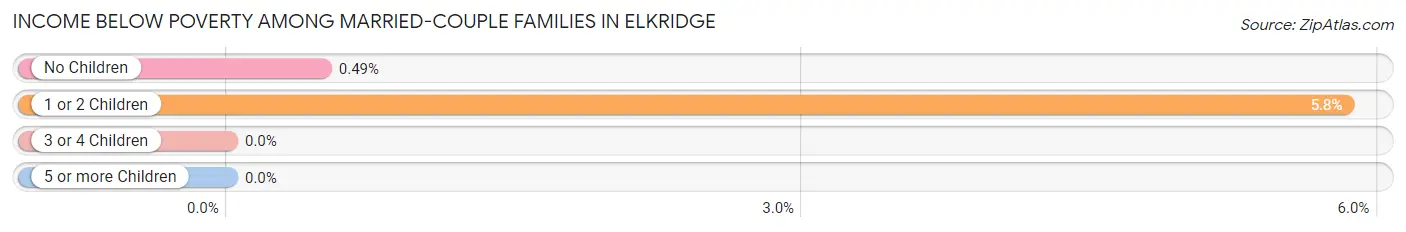
| Children | Above Poverty | Below Poverty |
| No Children | 2,249 (99.5%) | 11 (0.5%) |
| 1 or 2 Children | 1,956 (94.2%) | 121 (5.8%) |
| 3 or 4 Children | 252 (100.0%) | 0 (0.0%) |
| 5 or more Children | 0 (0.0%) | 0 (0.0%) |
| Total | 4,457 (97.1%) | 132 (2.9%) |
Income Below Poverty Among Single-Parent Households in Elkridge
According to the poverty data in Elkridge, 10.2% or 61 single-father households and 16.0% or 206 single-mother households are living below the poverty line. Among single-father households, those with 3 or 4 children have the highest poverty rate, with 61 households (48.0%) experiencing poverty. Likewise, among single-mother households, those with 3 or 4 children have the highest poverty rate, with 74 households (38.1%) falling below the poverty line.
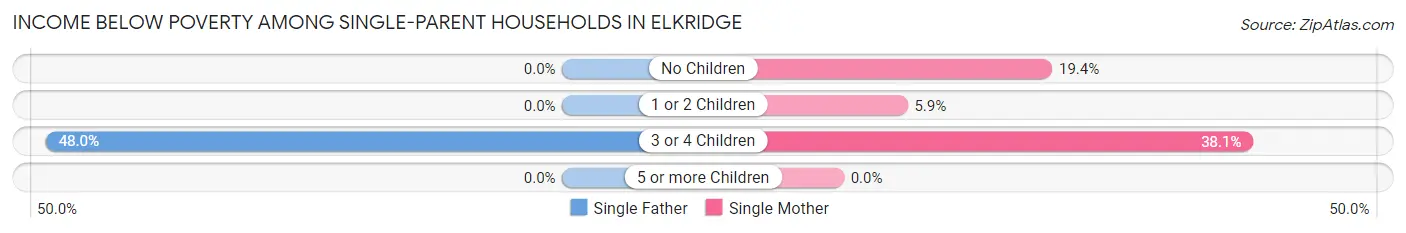
| Children | Single Father | Single Mother |
| No Children | 0 (0.0%) | 99 (19.4%) |
| 1 or 2 Children | 0 (0.0%) | 33 (5.9%) |
| 3 or 4 Children | 61 (48.0%) | 74 (38.1%) |
| 5 or more Children | 0 (0.0%) | 0 (0.0%) |
| Total | 61 (10.2%) | 206 (16.0%) |
Income Below Poverty Among Married-Couple vs Single-Parent Households in Elkridge
The poverty data for Elkridge shows that 132 of the married-couple family households (2.9%) and 267 of the single-parent households (14.2%) are living below the poverty level. Within the married-couple family households, those with 1 or 2 children have the highest poverty rate, with 121 households (5.8%) falling below the poverty line. Among the single-parent households, those with 3 or 4 children have the highest poverty rate, with 135 household (42.1%) living below poverty.
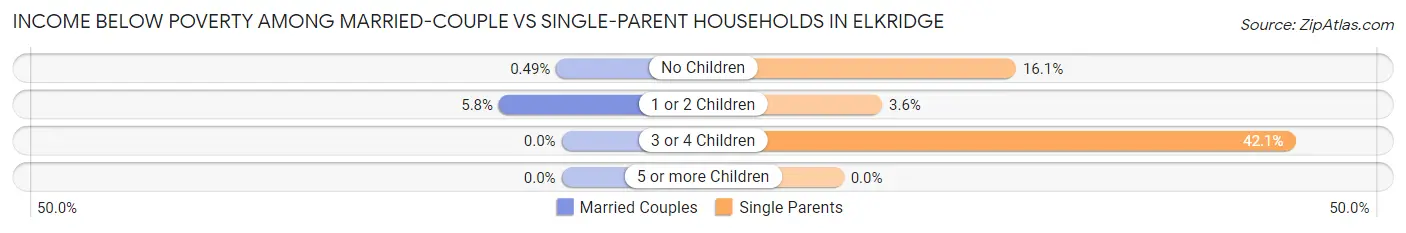
| Children | Married-Couple Families | Single-Parent Households |
| No Children | 11 (0.5%) | 99 (16.1%) |
| 1 or 2 Children | 121 (5.8%) | 33 (3.6%) |
| 3 or 4 Children | 0 (0.0%) | 135 (42.1%) |
| 5 or more Children | 0 (0.0%) | 0 (0.0%) |
| Total | 132 (2.9%) | 267 (14.2%) |
Race in Elkridge
The most populous races in Elkridge are White / Caucasian (9,987 | 39.6%), Black / African American (8,325 | 33.0%), and Asian (4,915 | 19.5%).
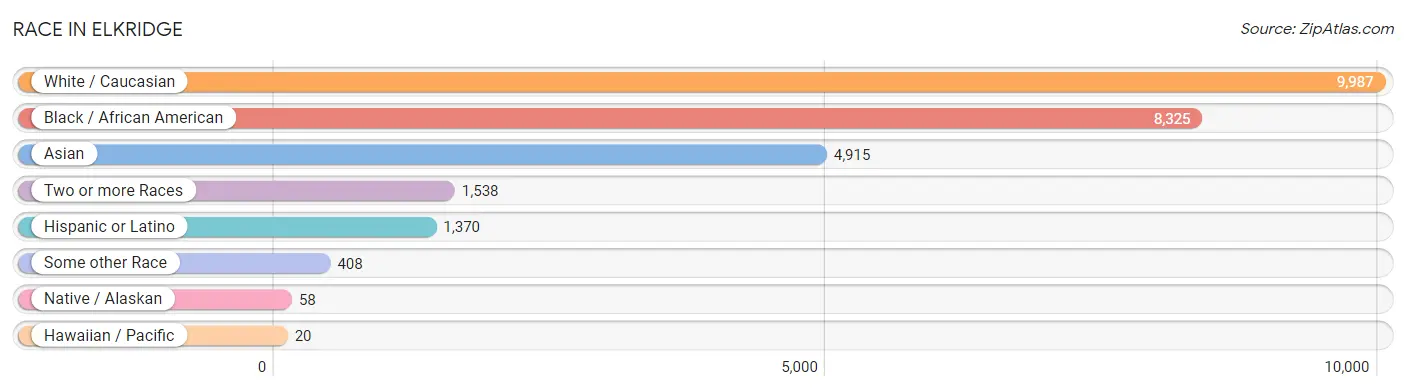
| Race | # Population | % Population |
| Asian | 4,915 | 19.5% |
| Black / African American | 8,325 | 33.0% |
| Hawaiian / Pacific | 20 | 0.1% |
| Hispanic or Latino | 1,370 | 5.4% |
| Native / Alaskan | 58 | 0.2% |
| White / Caucasian | 9,987 | 39.6% |
| Two or more Races | 1,538 | 6.1% |
| Some other Race | 408 | 1.6% |
| Total | 25,251 | 100.0% |
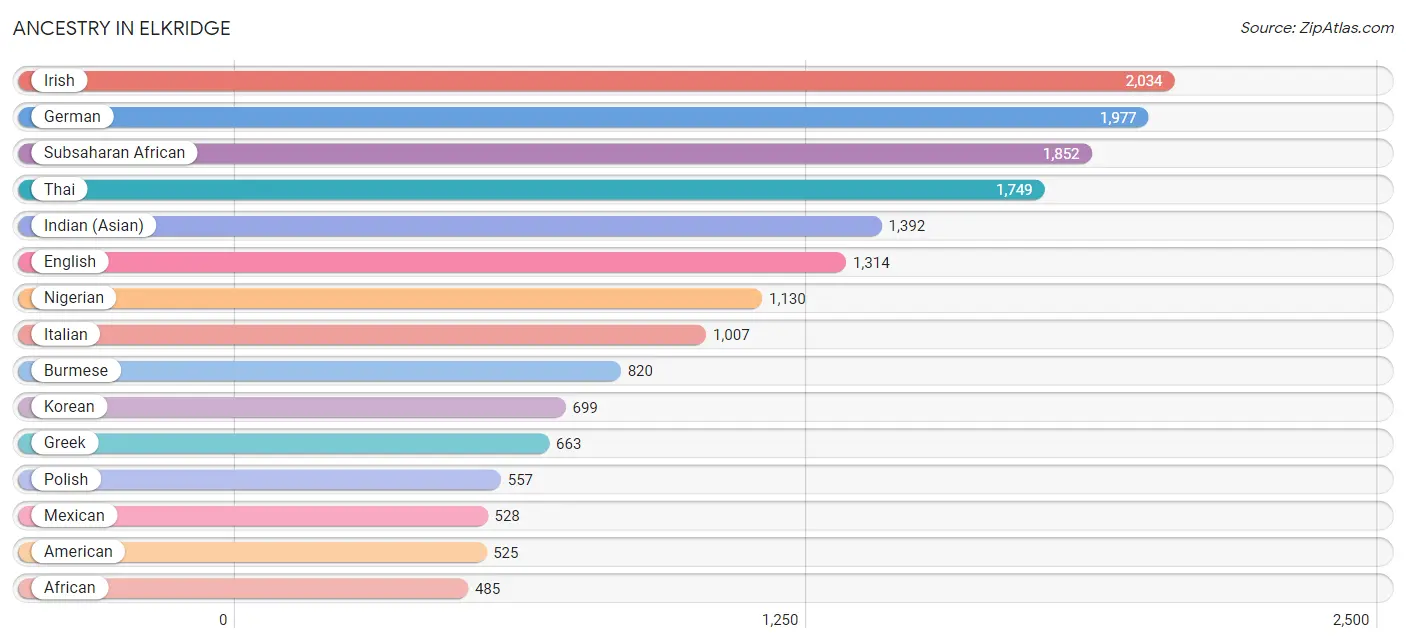
Ancestry in Elkridge
The most populous ancestries reported in Elkridge are Irish (2,034 | 8.1%), German (1,977 | 7.8%), Subsaharan African (1,852 | 7.3%), Thai (1,749 | 6.9%), and Indian (Asian) (1,392 | 5.5%), together accounting for 35.7% of all Elkridge residents.
| Ancestry | # Population | % Population |
| African | 485 | 1.9% |
| Albanian | 61 | 0.2% |
| American | 525 | 2.1% |
| Arab | 214 | 0.9% |
| Armenian | 81 | 0.3% |
| Austrian | 15 | 0.1% |
| Bahamian | 107 | 0.4% |
| Bangladeshi | 20 | 0.1% |
| Bhutanese | 141 | 0.6% |
| Brazilian | 100 | 0.4% |
| British | 216 | 0.9% |
| Burmese | 820 | 3.3% |
| Cape Verdean | 12 | 0.1% |
| Central American | 272 | 1.1% |
| Central American Indian | 10 | 0.0% |
| Cherokee | 42 | 0.2% |
| Choctaw | 48 | 0.2% |
| Colombian | 176 | 0.7% |
| Creek | 48 | 0.2% |
| Croatian | 19 | 0.1% |
| Czech | 183 | 0.7% |
| Czechoslovakian | 36 | 0.1% |
| Dominican | 32 | 0.1% |
| Eastern European | 71 | 0.3% |
| Ecuadorian | 22 | 0.1% |
| English | 1,314 | 5.2% |
| Ethiopian | 173 | 0.7% |
| European | 137 | 0.5% |
| Finnish | 41 | 0.2% |
| French | 221 | 0.9% |
| French Canadian | 51 | 0.2% |
| German | 1,977 | 7.8% |
| Ghanaian | 83 | 0.3% |
| Greek | 663 | 2.6% |
| Guatemalan | 52 | 0.2% |
| Honduran | 207 | 0.8% |
| Hungarian | 205 | 0.8% |
| Indian (Asian) | 1,392 | 5.5% |
| Indonesian | 123 | 0.5% |
| Irish | 2,034 | 8.1% |
| Italian | 1,007 | 4.0% |
| Jamaican | 332 | 1.3% |
| Korean | 699 | 2.8% |
| Lebanese | 83 | 0.3% |
| Mexican | 528 | 2.1% |
| Mexican American Indian | 22 | 0.1% |
| Moroccan | 35 | 0.1% |
| Native Hawaiian | 20 | 0.1% |
| Nigerian | 1,130 | 4.5% |
| Norwegian | 166 | 0.7% |
| Okinawan | 14 | 0.1% |
| Pakistani | 47 | 0.2% |
| Palestinian | 34 | 0.1% |
| Polish | 557 | 2.2% |
| Portuguese | 47 | 0.2% |
| Puerto Rican | 285 | 1.1% |
| Romanian | 13 | 0.1% |
| Russian | 161 | 0.6% |
| Salvadoran | 13 | 0.1% |
| Scandinavian | 48 | 0.2% |
| Scotch-Irish | 128 | 0.5% |
| Scottish | 181 | 0.7% |
| Slavic | 21 | 0.1% |
| Slovak | 42 | 0.2% |
| South American | 229 | 0.9% |
| Sri Lankan | 313 | 1.2% |
| Subsaharan African | 1,852 | 7.3% |
| Swedish | 28 | 0.1% |
| Swiss | 15 | 0.1% |
| Thai | 1,749 | 6.9% |
| Trinidadian and Tobagonian | 54 | 0.2% |
| Turkish | 163 | 0.6% |
| Ukrainian | 30 | 0.1% |
| Uruguayan | 31 | 0.1% |
| Vietnamese | 35 | 0.1% |
| Welsh | 155 | 0.6% |
| Yugoslavian | 8 | 0.0% | View All 77 Rows |
Immigrants in Elkridge
The most numerous immigrant groups reported in Elkridge came from Asia (3,402 | 13.5%), Africa (1,531 | 6.1%), South Central Asia (1,385 | 5.5%), Eastern Asia (1,303 | 5.2%), and Western Africa (1,281 | 5.1%), together accounting for 35.2% of all Elkridge residents.
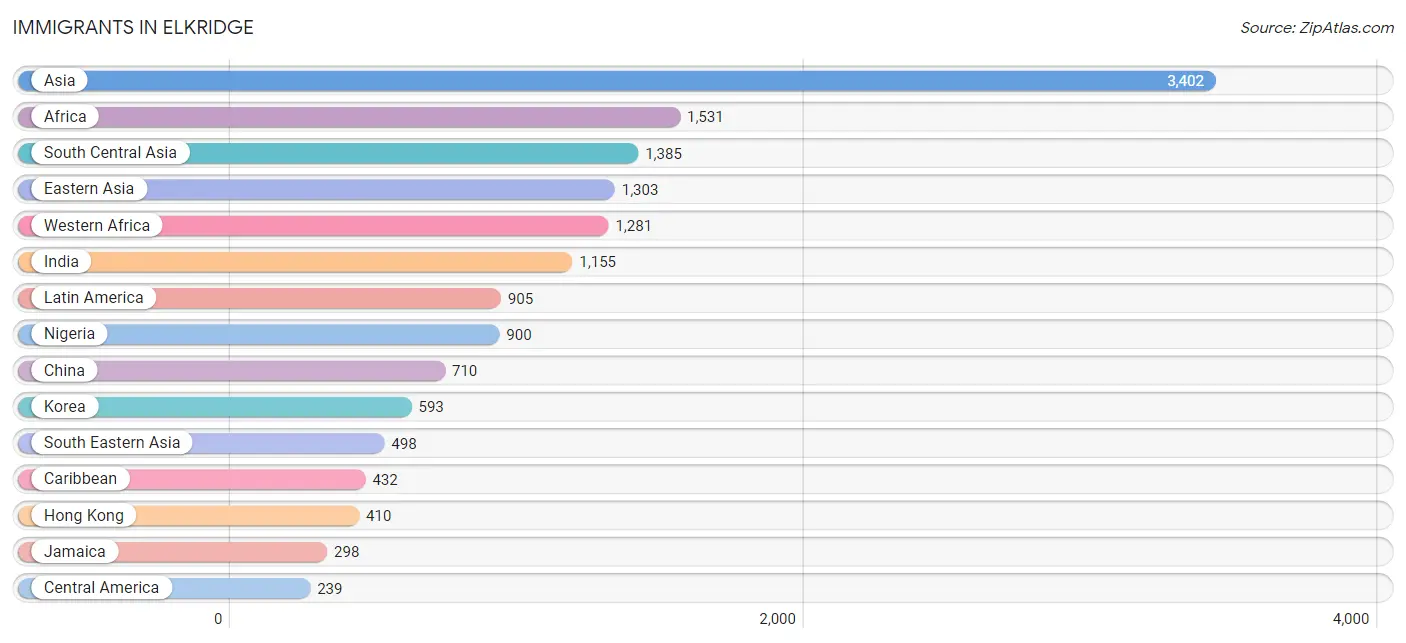
| Immigration Origin | # Population | % Population |
| Africa | 1,531 | 6.1% |
| Asia | 3,402 | 13.5% |
| Bahamas | 51 | 0.2% |
| Bangladesh | 68 | 0.3% |
| Brazil | 128 | 0.5% |
| Caribbean | 432 | 1.7% |
| Central America | 239 | 0.9% |
| China | 710 | 2.8% |
| Colombia | 69 | 0.3% |
| Eastern Africa | 235 | 0.9% |
| Eastern Asia | 1,303 | 5.2% |
| Eastern Europe | 38 | 0.2% |
| Ecuador | 22 | 0.1% |
| El Salvador | 13 | 0.1% |
| England | 54 | 0.2% |
| Eritrea | 47 | 0.2% |
| Ethiopia | 184 | 0.7% |
| Europe | 225 | 0.9% |
| Germany | 20 | 0.1% |
| Ghana | 73 | 0.3% |
| Guatemala | 10 | 0.0% |
| Haiti | 9 | 0.0% |
| Honduras | 116 | 0.5% |
| Hong Kong | 410 | 1.6% |
| India | 1,155 | 4.6% |
| Italy | 78 | 0.3% |
| Jamaica | 298 | 1.2% |
| Korea | 593 | 2.4% |
| Latin America | 905 | 3.6% |
| Liberia | 160 | 0.6% |
| Malaysia | 24 | 0.1% |
| Mexico | 100 | 0.4% |
| Morocco | 15 | 0.1% |
| Nigeria | 900 | 3.6% |
| Northern Africa | 15 | 0.1% |
| Northern Europe | 89 | 0.4% |
| Oceania | 13 | 0.1% |
| Pakistan | 140 | 0.5% |
| Philippines | 230 | 0.9% |
| Russia | 22 | 0.1% |
| Sierra Leone | 104 | 0.4% |
| Singapore | 14 | 0.1% |
| South America | 234 | 0.9% |
| South Central Asia | 1,385 | 5.5% |
| South Eastern Asia | 498 | 2.0% |
| Southern Europe | 78 | 0.3% |
| Sri Lanka | 22 | 0.1% |
| Taiwan | 15 | 0.1% |
| Trinidad and Tobago | 74 | 0.3% |
| Turkey | 185 | 0.7% |
| Uruguay | 15 | 0.1% |
| Vietnam | 128 | 0.5% |
| Western Africa | 1,281 | 5.1% |
| Western Asia | 216 | 0.9% |
| Western Europe | 20 | 0.1% | View All 55 Rows |
Sex and Age in Elkridge
Sex and Age in Elkridge
The most populous age groups in Elkridge are 10 to 14 Years (1,114 | 9.2%) for men and 10 to 14 Years (1,310 | 10.0%) for women.
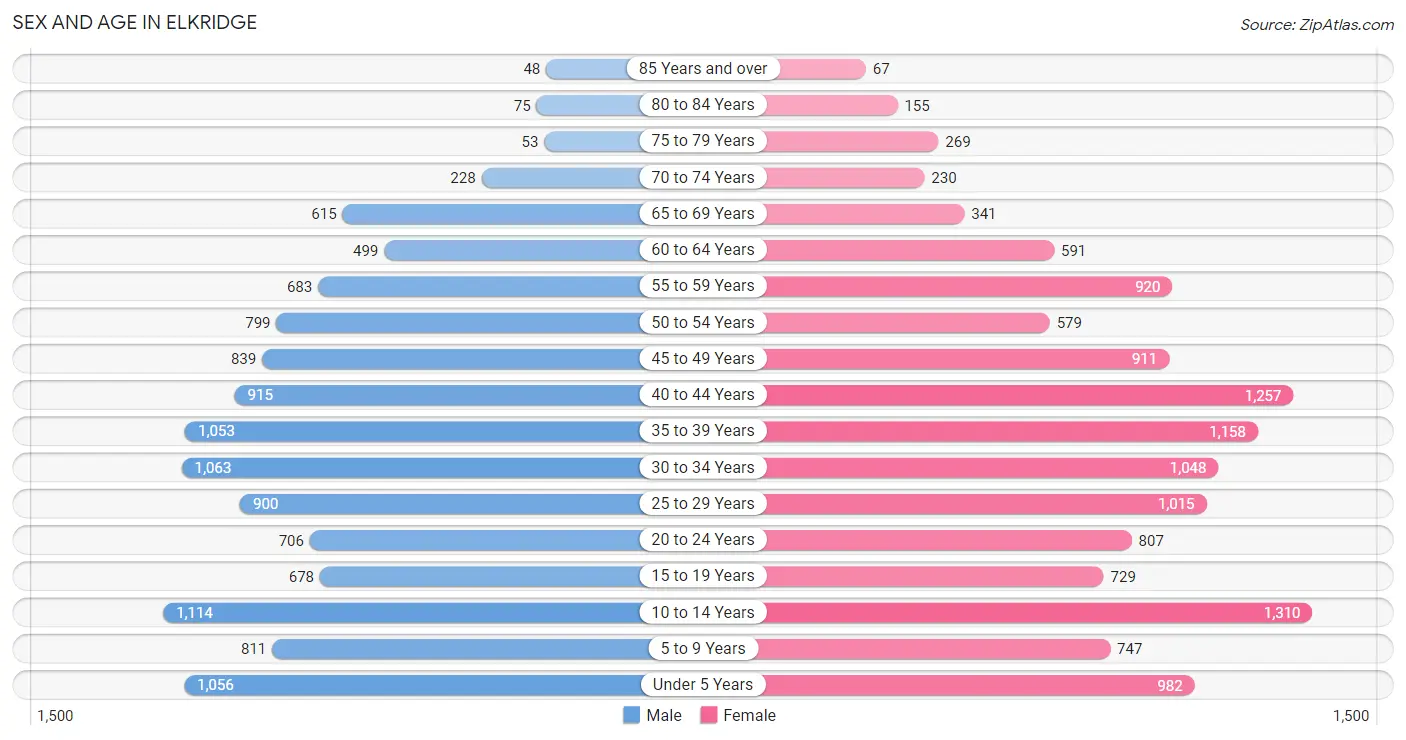
| Age Bracket | Male | Female |
| Under 5 Years | 1,056 (8.7%) | 982 (7.5%) |
| 5 to 9 Years | 811 (6.7%) | 747 (5.7%) |
| 10 to 14 Years | 1,114 (9.2%) | 1,310 (10.0%) |
| 15 to 19 Years | 678 (5.6%) | 729 (5.6%) |
| 20 to 24 Years | 706 (5.8%) | 807 (6.1%) |
| 25 to 29 Years | 900 (7.4%) | 1,015 (7.7%) |
| 30 to 34 Years | 1,063 (8.8%) | 1,048 (8.0%) |
| 35 to 39 Years | 1,053 (8.7%) | 1,158 (8.8%) |
| 40 to 44 Years | 915 (7.5%) | 1,257 (9.6%) |
| 45 to 49 Years | 839 (6.9%) | 911 (7.0%) |
| 50 to 54 Years | 799 (6.6%) | 579 (4.4%) |
| 55 to 59 Years | 683 (5.6%) | 920 (7.0%) |
| 60 to 64 Years | 499 (4.1%) | 591 (4.5%) |
| 65 to 69 Years | 615 (5.1%) | 341 (2.6%) |
| 70 to 74 Years | 228 (1.9%) | 230 (1.8%) |
| 75 to 79 Years | 53 (0.4%) | 269 (2.1%) |
| 80 to 84 Years | 75 (0.6%) | 155 (1.2%) |
| 85 Years and over | 48 (0.4%) | 67 (0.5%) |
| Total | 12,135 (100.0%) | 13,116 (100.0%) |
Families and Households in Elkridge
Median Family Size in Elkridge
The median family size in Elkridge is 3.24 persons per family, with married-couple families (4,589 | 70.9%) accounting for the largest median family size of 3.32 persons per family. On the other hand, single female/mother families (1,285 | 19.9%) represent the smallest median family size with 3.04 persons per family.
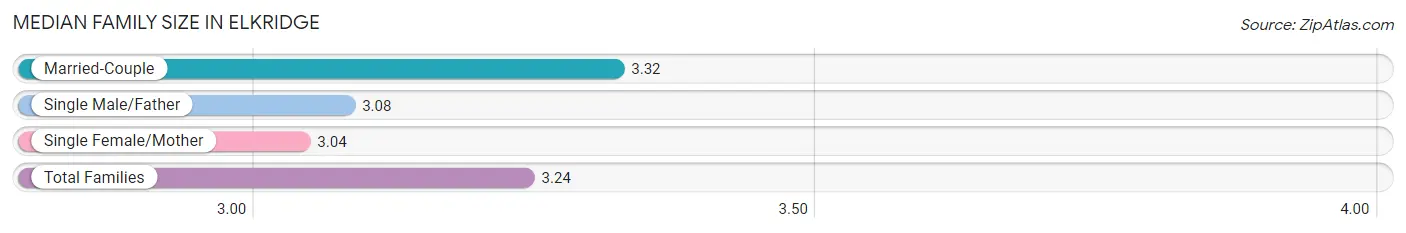
| Family Type | # Families | Family Size |
| Married-Couple | 4,589 (70.9%) | 3.32 |
| Single Male/Father | 599 (9.2%) | 3.08 |
| Single Female/Mother | 1,285 (19.9%) | 3.04 |
| Total Families | 6,473 (100.0%) | 3.24 |
Median Household Size in Elkridge
The median household size in Elkridge is 2.82 persons per household, with married-couple households (4,589 | 51.3%) accounting for the largest median household size of 3.33 persons per household. non-family households (2,469 | 27.6%) represent the smallest median household size with 1.52 persons per household.
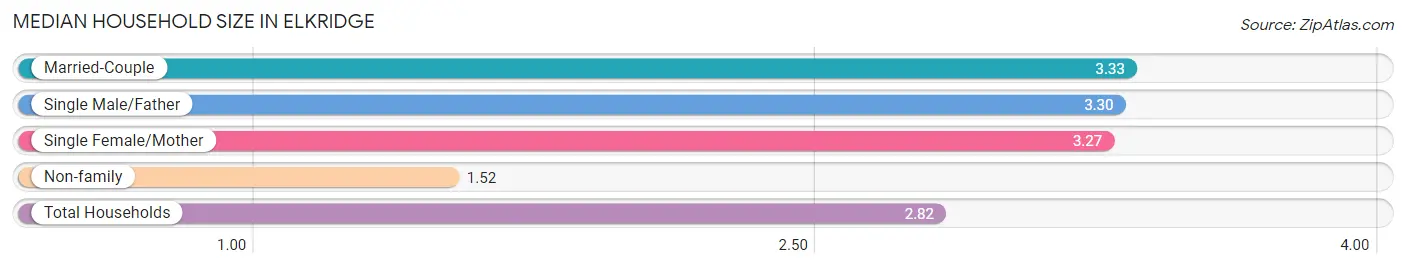
| Household Type | # Households | Household Size |
| Married-Couple | 4,589 (51.3%) | 3.33 |
| Single Male/Father | 599 (6.7%) | 3.30 |
| Single Female/Mother | 1,285 (14.4%) | 3.27 |
| Non-family | 2,469 (27.6%) | 1.52 |
| Total Households | 8,942 (100.0%) | 2.82 |
Household Size by Marriage Status in Elkridge
Out of a total of 8,942 households in Elkridge, 6,473 (72.4%) are family households, while 2,469 (27.6%) are nonfamily households. The most numerous type of family households are 2-person households, comprising 2,093, and the most common type of nonfamily households are 1-person households, comprising 1,961.
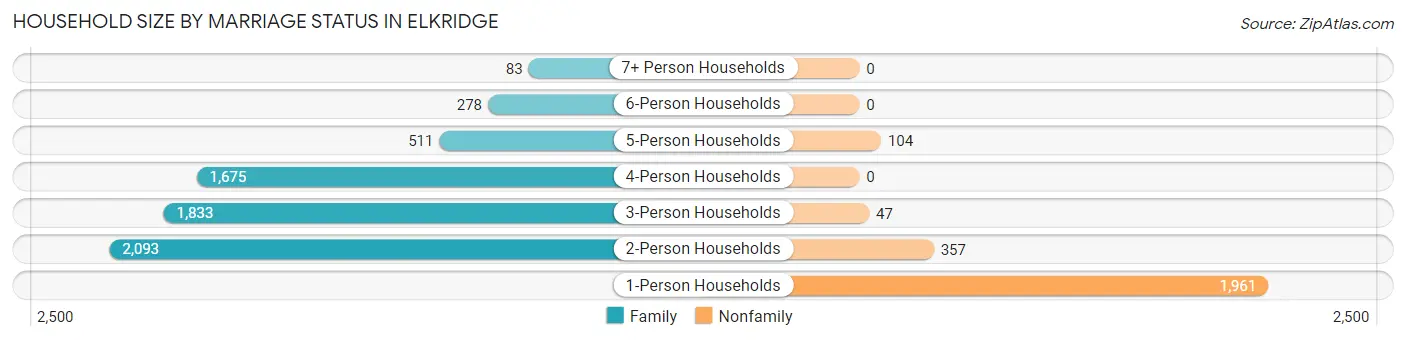
| Household Size | Family Households | Nonfamily Households |
| 1-Person Households | - | 1,961 (21.9%) |
| 2-Person Households | 2,093 (23.4%) | 357 (4.0%) |
| 3-Person Households | 1,833 (20.5%) | 47 (0.5%) |
| 4-Person Households | 1,675 (18.7%) | 0 (0.0%) |
| 5-Person Households | 511 (5.7%) | 104 (1.2%) |
| 6-Person Households | 278 (3.1%) | 0 (0.0%) |
| 7+ Person Households | 83 (0.9%) | 0 (0.0%) |
| Total | 6,473 (72.4%) | 2,469 (27.6%) |
Female Fertility in Elkridge
Fertility by Age in Elkridge
Average fertility rate in Elkridge is 64.0 births per 1,000 women. Women in the age bracket of 20 to 34 years have the highest fertility rate with 91.0 births per 1,000 women. Women in the age bracket of 20 to 34 years acount for 57.9% of all women with births.
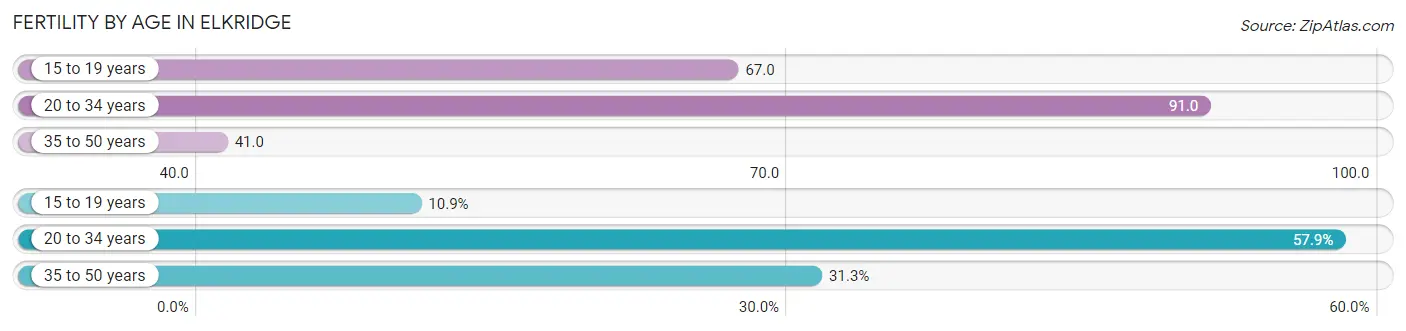
| Age Bracket | Women with Births | Births / 1,000 Women |
| 15 to 19 years | 49 (10.9%) | 67.0 |
| 20 to 34 years | 261 (57.9%) | 91.0 |
| 35 to 50 years | 141 (31.3%) | 41.0 |
| Total | 451 (100.0%) | 64.0 |
Fertility by Age by Marriage Status in Elkridge
74.1% of women with births (451) in Elkridge are married. The highest percentage of unmarried women with births falls into 15 to 19 years age bracket with 100.0% of them unmarried at the time of birth, while the lowest percentage of unmarried women with births belong to 35 to 50 years age bracket with 0.0% of them unmarried.
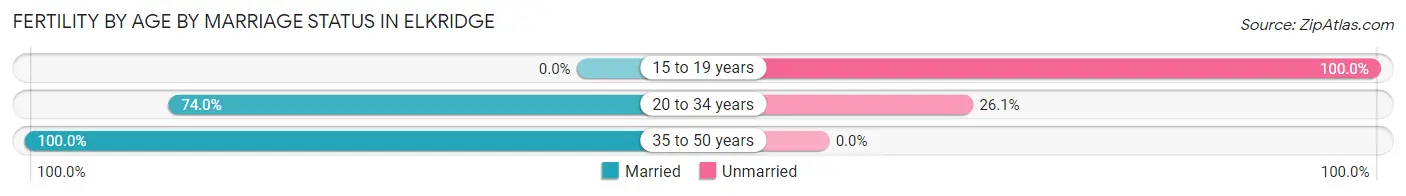
| Age Bracket | Married | Unmarried |
| 15 to 19 years | 0 (0.0%) | 49 (100.0%) |
| 20 to 34 years | 193 (74.0%) | 68 (26.1%) |
| 35 to 50 years | 141 (100.0%) | 0 (0.0%) |
| Total | 334 (74.1%) | 117 (25.9%) |
Fertility by Education in Elkridge
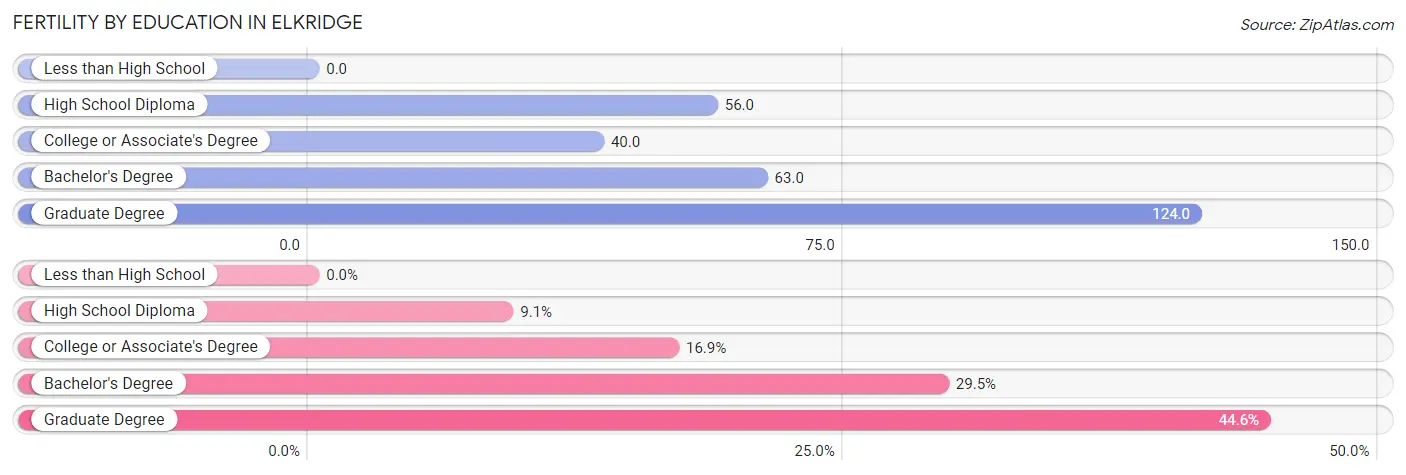
| Educational Attainment | Women with Births | Births / 1,000 Women |
| Less than High School | 0 (0.0%) | 0.0 |
| High School Diploma | 41 (9.1%) | 56.0 |
| College or Associate's Degree | 76 (16.9%) | 40.0 |
| Bachelor's Degree | 133 (29.5%) | 63.0 |
| Graduate Degree | 201 (44.6%) | 124.0 |
| Total | 451 (100.0%) | 64.0 |
Fertility by Education by Marriage Status in Elkridge
25.9% of women with births in Elkridge are unmarried. Women with the educational attainment of graduate degree are most likely to be married with 90.5% of them married at childbirth, while women with the educational attainment of college or associate's degree are least likely to be married with 82.9% of them unmarried at childbirth.
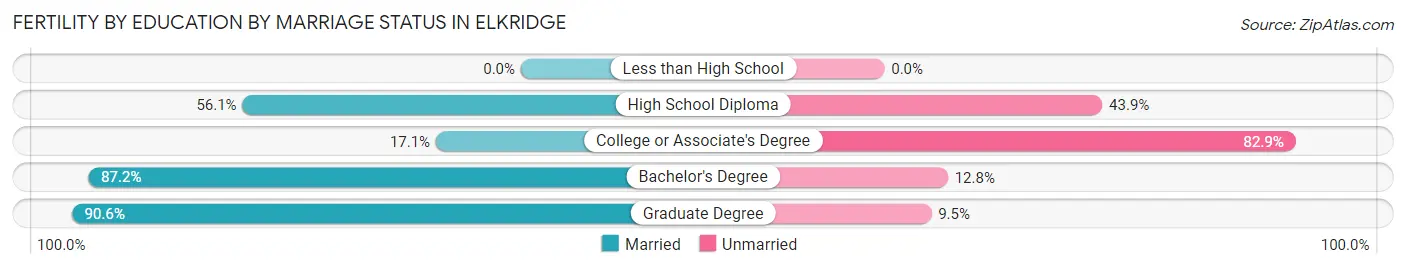
| Educational Attainment | Married | Unmarried |
| Less than High School | 0 (0.0%) | 0 (0.0%) |
| High School Diploma | 23 (56.1%) | 18 (43.9%) |
| College or Associate's Degree | 13 (17.1%) | 63 (82.9%) |
| Bachelor's Degree | 116 (87.2%) | 17 (12.8%) |
| Graduate Degree | 182 (90.5%) | 19 (9.5%) |
| Total | 334 (74.1%) | 117 (25.9%) |
Employment Characteristics in Elkridge
Employment by Class of Employer in Elkridge
Among the 13,208 employed individuals in Elkridge, private company employees (8,071 | 61.1%), federal government employees (1,845 | 14.0%), and not-for-profit organizations (1,065 | 8.1%) make up the most common classes of employment.
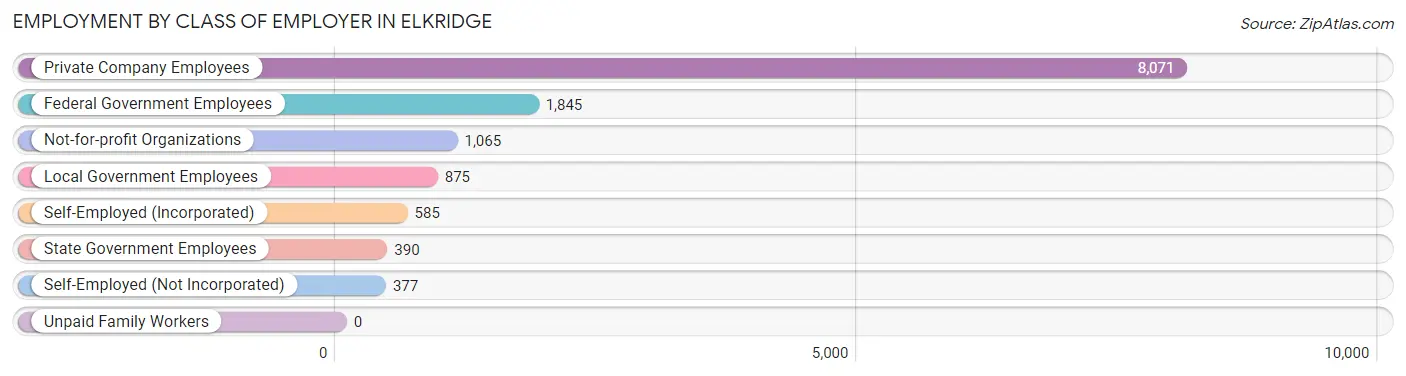
| Employer Class | # Employees | % Employees |
| Private Company Employees | 8,071 | 61.1% |
| Self-Employed (Incorporated) | 585 | 4.4% |
| Self-Employed (Not Incorporated) | 377 | 2.9% |
| Not-for-profit Organizations | 1,065 | 8.1% |
| Local Government Employees | 875 | 6.6% |
| State Government Employees | 390 | 2.9% |
| Federal Government Employees | 1,845 | 14.0% |
| Unpaid Family Workers | 0 | 0.0% |
| Total | 13,208 | 100.0% |
Employment Status by Age in Elkridge
According to the labor force statistics for Elkridge, out of the total population over 16 years of age (19,006), 75.1% or 14,274 individuals are in the labor force, with 5.3% or 757 of them unemployed. The age group with the highest labor force participation rate is 30 to 34 years, with 94.1% or 1,986 individuals in the labor force. Within the labor force, the 16 to 19 years age range has the highest percentage of unemployed individuals, with 20.4% or 94 of them being unemployed.
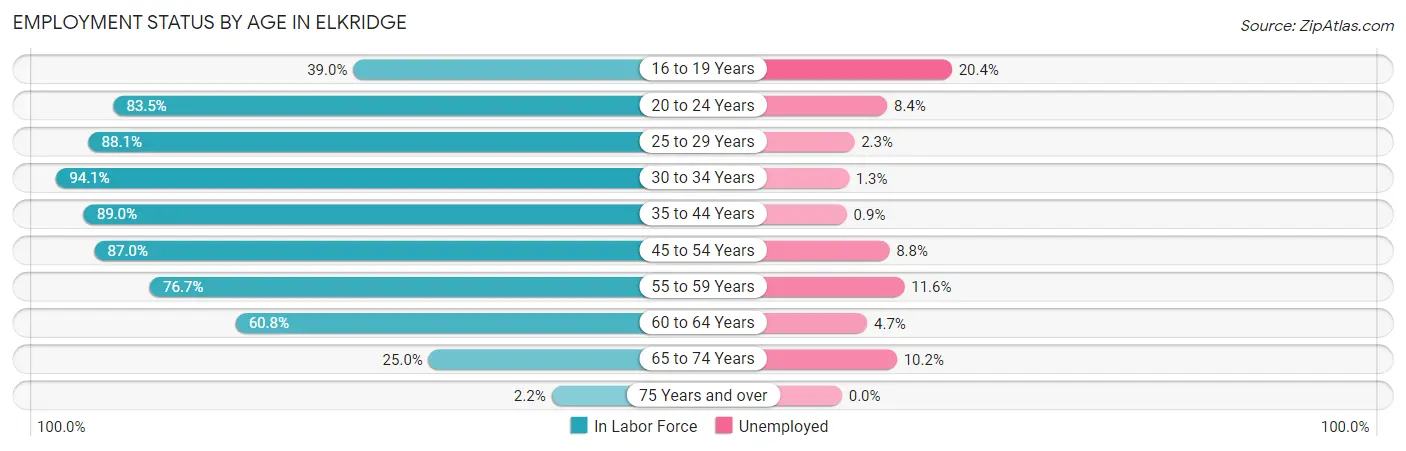
| Age Bracket | In Labor Force | Unemployed |
| 16 to 19 Years | 461 (39.0%) | 94 (20.4%) |
| 20 to 24 Years | 1,263 (83.5%) | 106 (8.4%) |
| 25 to 29 Years | 1,687 (88.1%) | 39 (2.3%) |
| 30 to 34 Years | 1,986 (94.1%) | 26 (1.3%) |
| 35 to 44 Years | 3,901 (89.0%) | 35 (0.9%) |
| 45 to 54 Years | 2,721 (87.0%) | 239 (8.8%) |
| 55 to 59 Years | 1,230 (76.7%) | 143 (11.6%) |
| 60 to 64 Years | 663 (60.8%) | 31 (4.7%) |
| 65 to 74 Years | 354 (25.0%) | 36 (10.2%) |
| 75 Years and over | 15 (2.2%) | 0 (0.0%) |
| Total | 14,274 (75.1%) | 757 (5.3%) |
Employment Status by Educational Attainment in Elkridge
According to labor force statistics for Elkridge, 85.7% of individuals (12,195) out of the total population between 25 and 64 years of age (14,230) are in the labor force, with 4.3% or 524 of them being unemployed. The group with the highest labor force participation rate are those with the educational attainment of bachelor's degree or higher, with 91.7% or 7,260 individuals in the labor force. Within the labor force, individuals with high school diploma education have the highest percentage of unemployment, with 17.3% or 271 of them being unemployed.
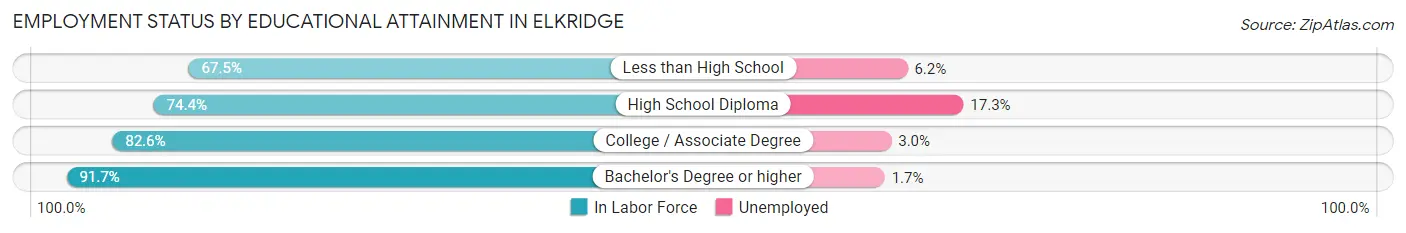
| Educational Attainment | In Labor Force | Unemployed |
| Less than High School | 514 (67.5%) | 47 (6.2%) |
| High School Diploma | 1,564 (74.4%) | 364 (17.3%) |
| College / Associate Degree | 2,850 (82.6%) | 104 (3.0%) |
| Bachelor's Degree or higher | 7,260 (91.7%) | 135 (1.7%) |
| Total | 12,195 (85.7%) | 612 (4.3%) |
Employment Occupations by Sex in Elkridge
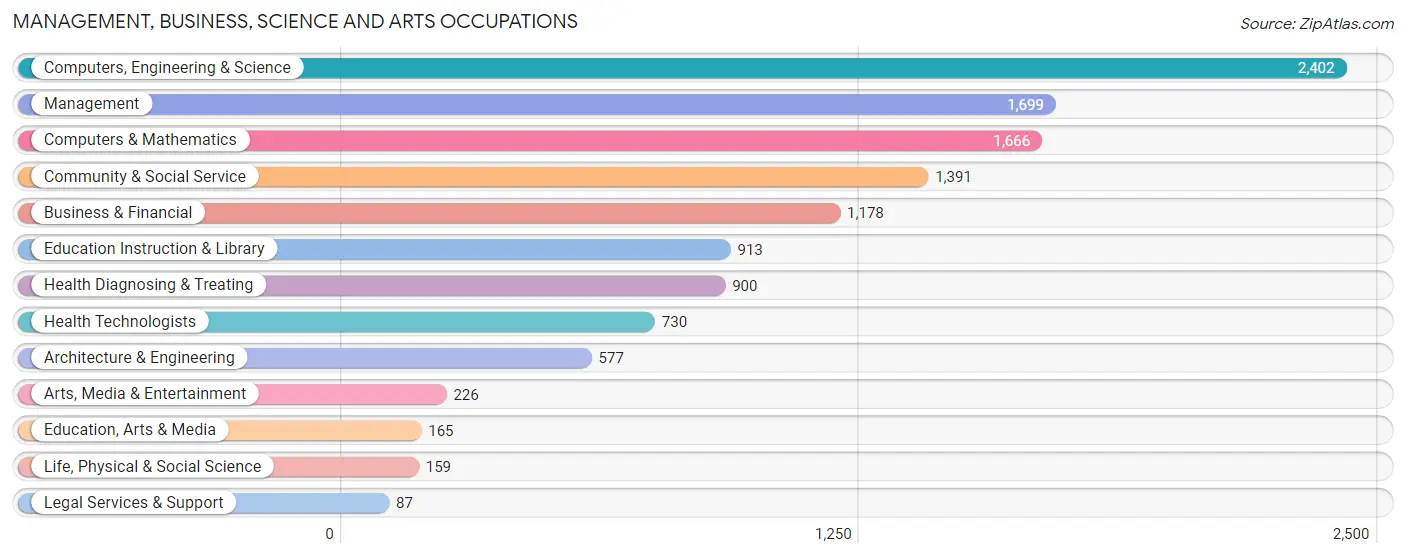
Management, Business, Science and Arts Occupations
The most common Management, Business, Science and Arts occupations in Elkridge are Computers, Engineering & Science (2,402 | 18.3%), Management (1,699 | 12.9%), Computers & Mathematics (1,666 | 12.7%), Community & Social Service (1,391 | 10.6%), and Business & Financial (1,178 | 9.0%).
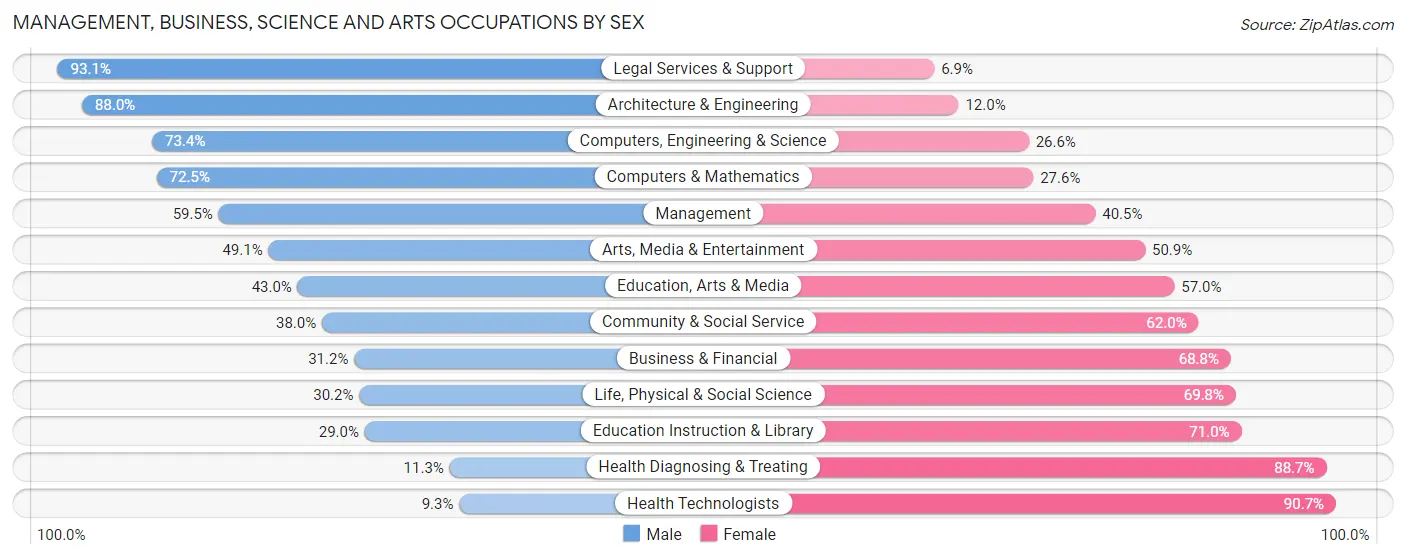
Management, Business, Science and Arts Occupations by Sex
Within the Management, Business, Science and Arts occupations in Elkridge, the most male-oriented occupations are Legal Services & Support (93.1%), Architecture & Engineering (88.0%), and Computers, Engineering & Science (73.4%), while the most female-oriented occupations are Health Technologists (90.7%), Health Diagnosing & Treating (88.7%), and Education Instruction & Library (71.0%).
| Occupation | Male | Female |
| Management | 1,011 (59.5%) | 688 (40.5%) |
| Business & Financial | 368 (31.2%) | 810 (68.8%) |
| Computers, Engineering & Science | 1,763 (73.4%) | 639 (26.6%) |
| Computers & Mathematics | 1,207 (72.5%) | 459 (27.6%) |
| Architecture & Engineering | 508 (88.0%) | 69 (12.0%) |
| Life, Physical & Social Science | 48 (30.2%) | 111 (69.8%) |
| Community & Social Service | 528 (38.0%) | 863 (62.0%) |
| Education, Arts & Media | 71 (43.0%) | 94 (57.0%) |
| Legal Services & Support | 81 (93.1%) | 6 (6.9%) |
| Education Instruction & Library | 265 (29.0%) | 648 (71.0%) |
| Arts, Media & Entertainment | 111 (49.1%) | 115 (50.9%) |
| Health Diagnosing & Treating | 102 (11.3%) | 798 (88.7%) |
| Health Technologists | 68 (9.3%) | 662 (90.7%) |
| Total (Category) | 3,772 (49.8%) | 3,798 (50.2%) |
| Total (Overall) | 6,502 (49.5%) | 6,632 (50.5%) |
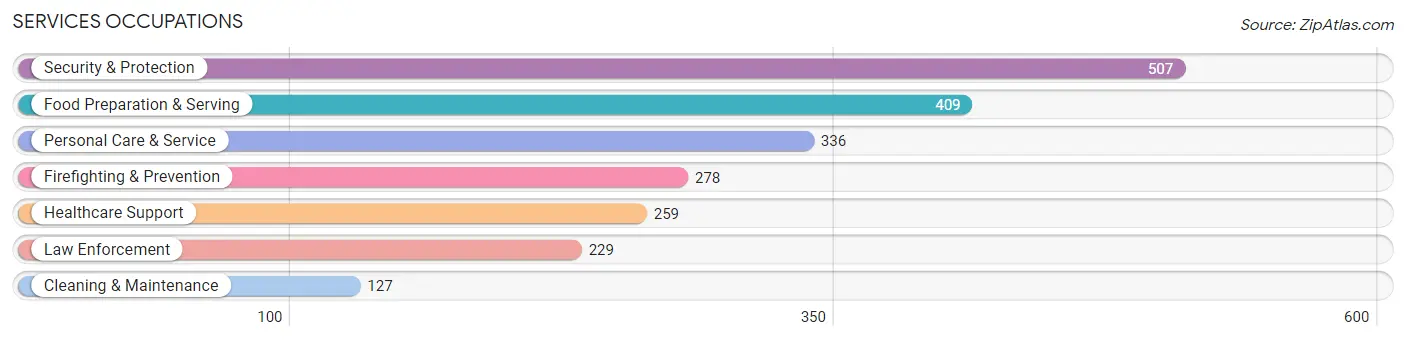
Services Occupations
The most common Services occupations in Elkridge are Security & Protection (507 | 3.9%), Food Preparation & Serving (409 | 3.1%), Personal Care & Service (336 | 2.6%), Firefighting & Prevention (278 | 2.1%), and Healthcare Support (259 | 2.0%).
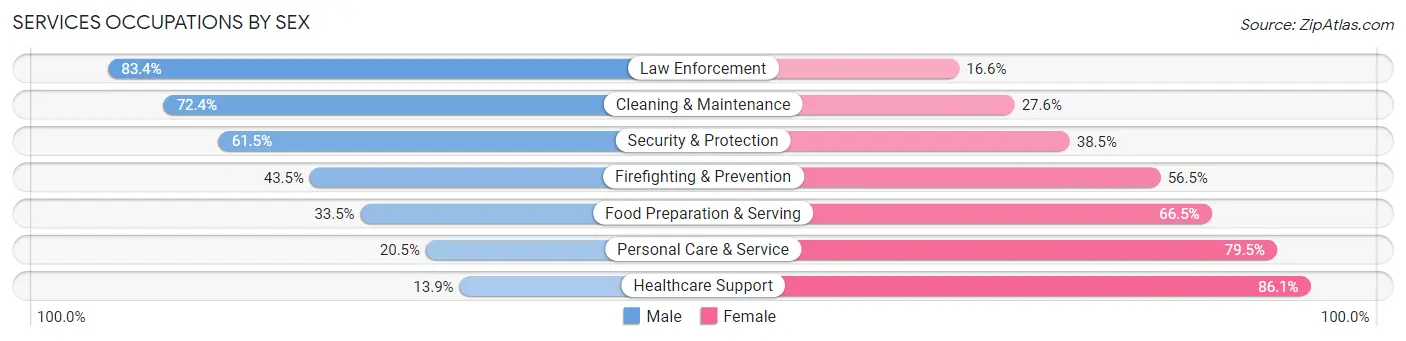
Services Occupations by Sex
Within the Services occupations in Elkridge, the most male-oriented occupations are Law Enforcement (83.4%), Cleaning & Maintenance (72.4%), and Security & Protection (61.5%), while the most female-oriented occupations are Healthcare Support (86.1%), Personal Care & Service (79.5%), and Food Preparation & Serving (66.5%).
| Occupation | Male | Female |
| Healthcare Support | 36 (13.9%) | 223 (86.1%) |
| Security & Protection | 312 (61.5%) | 195 (38.5%) |
| Firefighting & Prevention | 121 (43.5%) | 157 (56.5%) |
| Law Enforcement | 191 (83.4%) | 38 (16.6%) |
| Food Preparation & Serving | 137 (33.5%) | 272 (66.5%) |
| Cleaning & Maintenance | 92 (72.4%) | 35 (27.6%) |
| Personal Care & Service | 69 (20.5%) | 267 (79.5%) |
| Total (Category) | 646 (39.4%) | 992 (60.6%) |
| Total (Overall) | 6,502 (49.5%) | 6,632 (50.5%) |
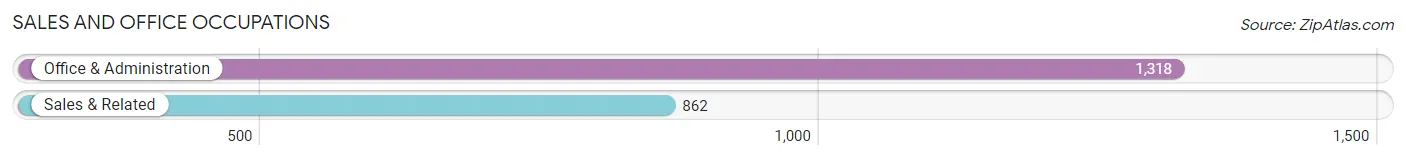
Sales and Office Occupations
The most common Sales and Office occupations in Elkridge are Office & Administration (1,318 | 10.0%), and Sales & Related (862 | 6.6%).
Sales and Office Occupations by Sex
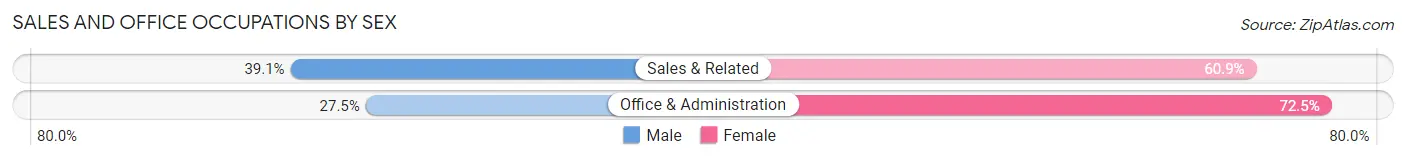
| Occupation | Male | Female |
| Sales & Related | 337 (39.1%) | 525 (60.9%) |
| Office & Administration | 363 (27.5%) | 955 (72.5%) |
| Total (Category) | 700 (32.1%) | 1,480 (67.9%) |
| Total (Overall) | 6,502 (49.5%) | 6,632 (50.5%) |
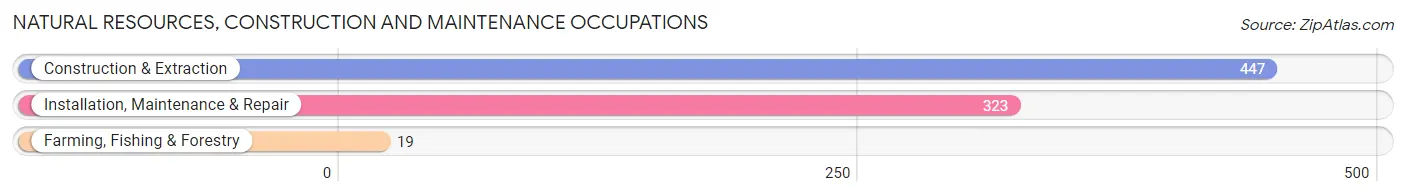
Natural Resources, Construction and Maintenance Occupations
The most common Natural Resources, Construction and Maintenance occupations in Elkridge are Construction & Extraction (447 | 3.4%), Installation, Maintenance & Repair (323 | 2.5%), and Farming, Fishing & Forestry (19 | 0.1%).
Natural Resources, Construction and Maintenance Occupations by Sex
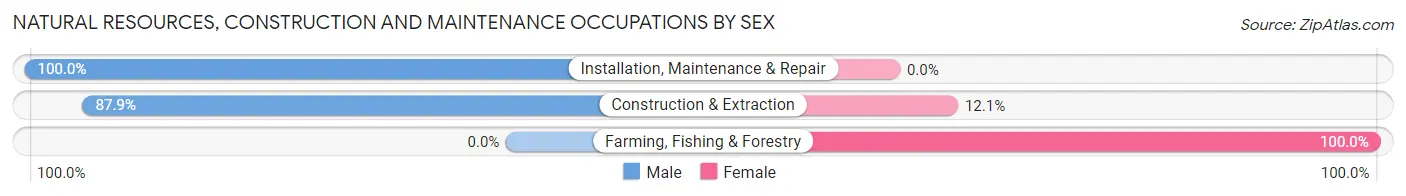
| Occupation | Male | Female |
| Farming, Fishing & Forestry | 0 (0.0%) | 19 (100.0%) |
| Construction & Extraction | 393 (87.9%) | 54 (12.1%) |
| Installation, Maintenance & Repair | 323 (100.0%) | 0 (0.0%) |
| Total (Category) | 716 (90.7%) | 73 (9.2%) |
| Total (Overall) | 6,502 (49.5%) | 6,632 (50.5%) |
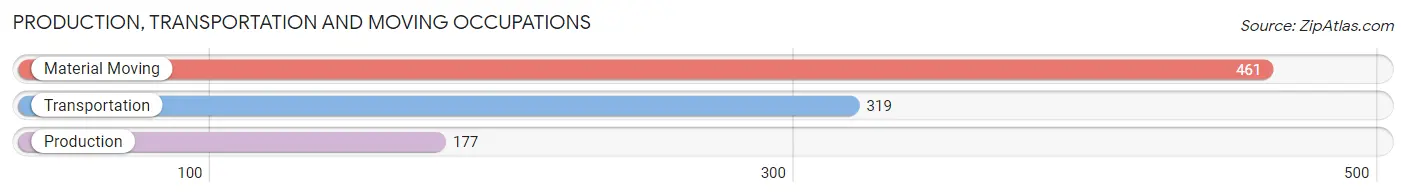
Production, Transportation and Moving Occupations
The most common Production, Transportation and Moving occupations in Elkridge are Material Moving (461 | 3.5%), Transportation (319 | 2.4%), and Production (177 | 1.3%).
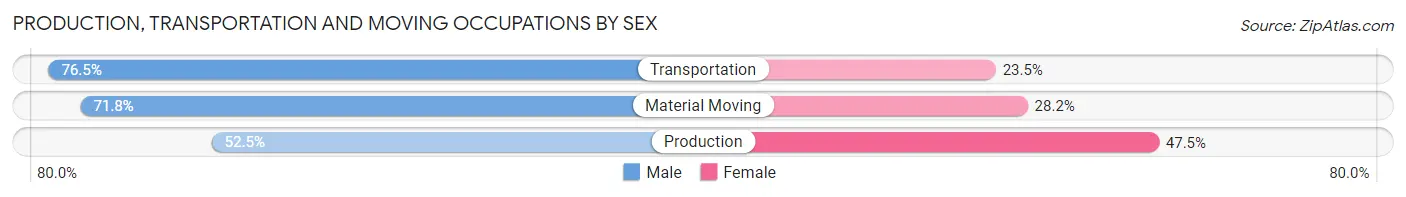
Production, Transportation and Moving Occupations by Sex
| Occupation | Male | Female |
| Production | 93 (52.5%) | 84 (47.5%) |
| Transportation | 244 (76.5%) | 75 (23.5%) |
| Material Moving | 331 (71.8%) | 130 (28.2%) |
| Total (Category) | 668 (69.8%) | 289 (30.2%) |
| Total (Overall) | 6,502 (49.5%) | 6,632 (50.5%) |
Employment Industries by Sex in Elkridge
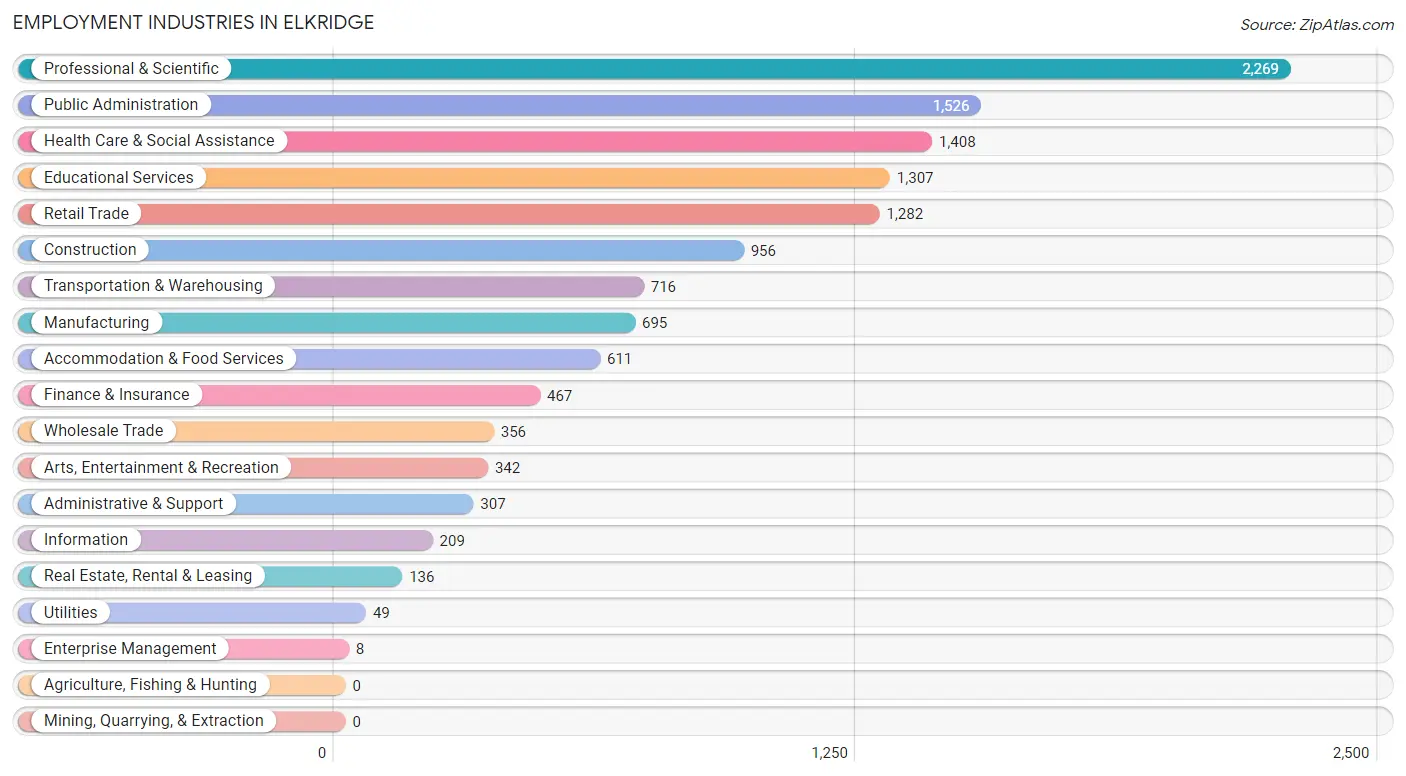
Employment Industries in Elkridge
The major employment industries in Elkridge include Professional & Scientific (2,269 | 17.3%), Public Administration (1,526 | 11.6%), Health Care & Social Assistance (1,408 | 10.7%), Educational Services (1,307 | 10.0%), and Retail Trade (1,282 | 9.8%).
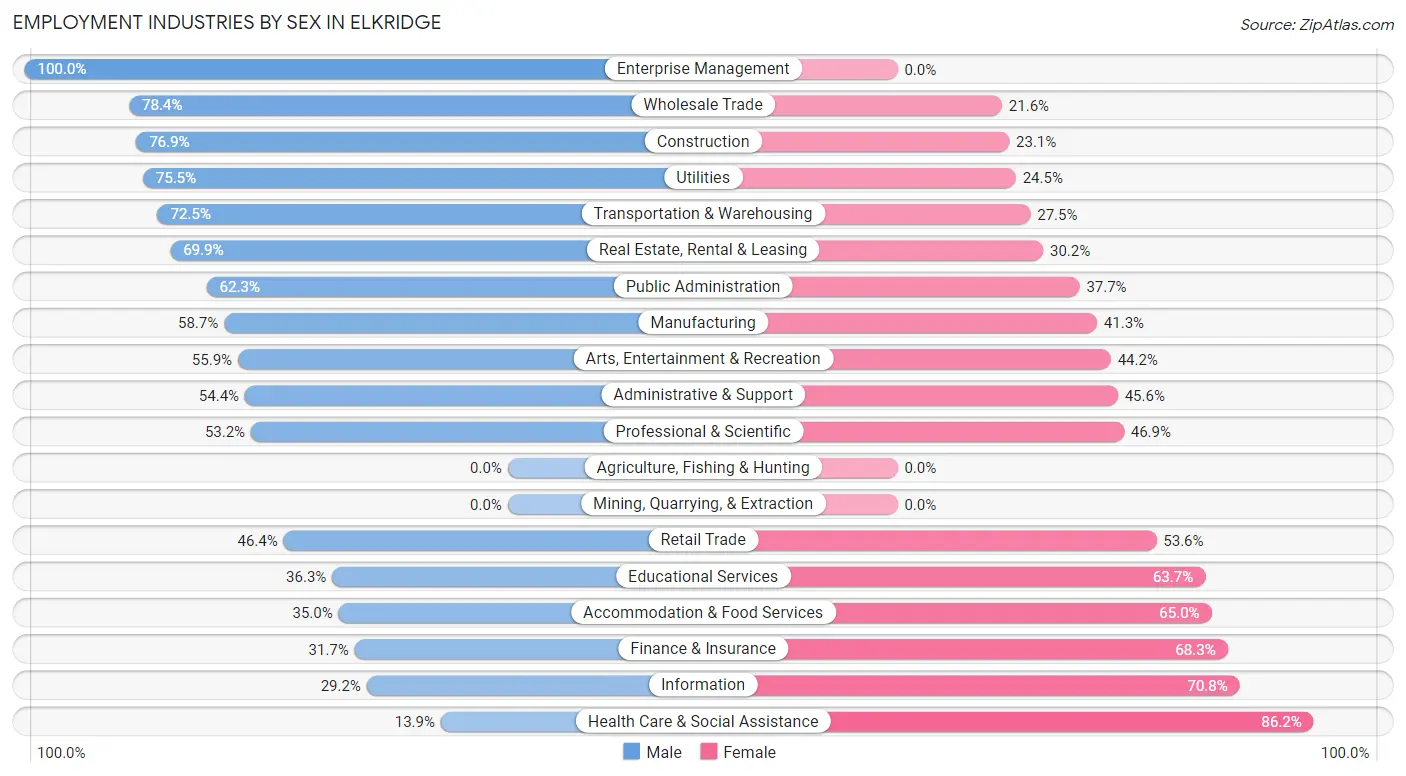
Employment Industries by Sex in Elkridge
The Elkridge industries that see more men than women are Enterprise Management (100.0%), Wholesale Trade (78.4%), and Construction (76.9%), whereas the industries that tend to have a higher number of women are Health Care & Social Assistance (86.2%), Information (70.8%), and Finance & Insurance (68.3%).
| Industry | Male | Female |
| Agriculture, Fishing & Hunting | 0 (0.0%) | 0 (0.0%) |
| Mining, Quarrying, & Extraction | 0 (0.0%) | 0 (0.0%) |
| Construction | 735 (76.9%) | 221 (23.1%) |
| Manufacturing | 408 (58.7%) | 287 (41.3%) |
| Wholesale Trade | 279 (78.4%) | 77 (21.6%) |
| Retail Trade | 595 (46.4%) | 687 (53.6%) |
| Transportation & Warehousing | 519 (72.5%) | 197 (27.5%) |
| Utilities | 37 (75.5%) | 12 (24.5%) |
| Information | 61 (29.2%) | 148 (70.8%) |
| Finance & Insurance | 148 (31.7%) | 319 (68.3%) |
| Real Estate, Rental & Leasing | 95 (69.9%) | 41 (30.1%) |
| Professional & Scientific | 1,206 (53.1%) | 1,063 (46.9%) |
| Enterprise Management | 8 (100.0%) | 0 (0.0%) |
| Administrative & Support | 167 (54.4%) | 140 (45.6%) |
| Educational Services | 475 (36.3%) | 832 (63.7%) |
| Health Care & Social Assistance | 195 (13.9%) | 1,213 (86.2%) |
| Arts, Entertainment & Recreation | 191 (55.8%) | 151 (44.2%) |
| Accommodation & Food Services | 214 (35.0%) | 397 (65.0%) |
| Public Administration | 951 (62.3%) | 575 (37.7%) |
| Total | 6,502 (49.5%) | 6,632 (50.5%) |
Education in Elkridge
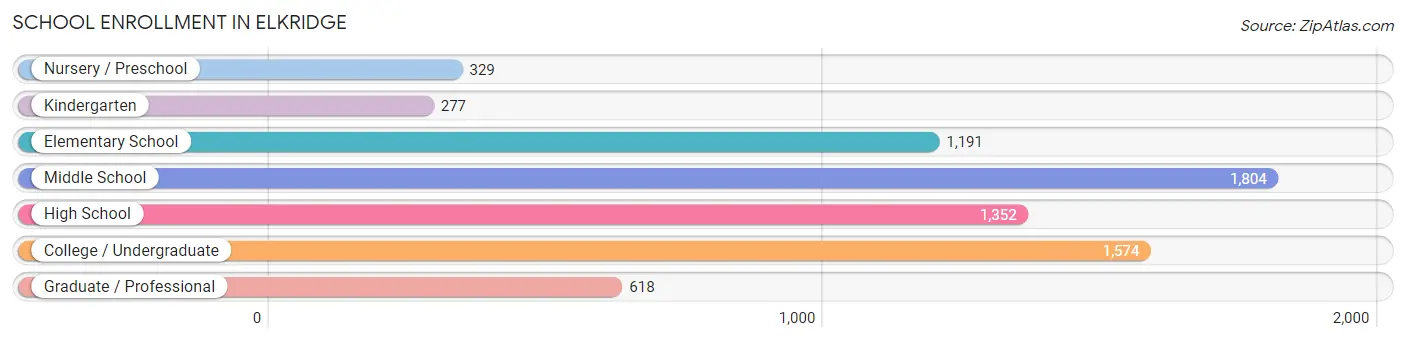
School Enrollment in Elkridge
The most common levels of schooling among the 7,145 students in Elkridge are middle school (1,804 | 25.3%), college / undergraduate (1,574 | 22.0%), and high school (1,352 | 18.9%).
| School Level | # Students | % Students |
| Nursery / Preschool | 329 | 4.6% |
| Kindergarten | 277 | 3.9% |
| Elementary School | 1,191 | 16.7% |
| Middle School | 1,804 | 25.3% |
| High School | 1,352 | 18.9% |
| College / Undergraduate | 1,574 | 22.0% |
| Graduate / Professional | 618 | 8.6% |
| Total | 7,145 | 100.0% |
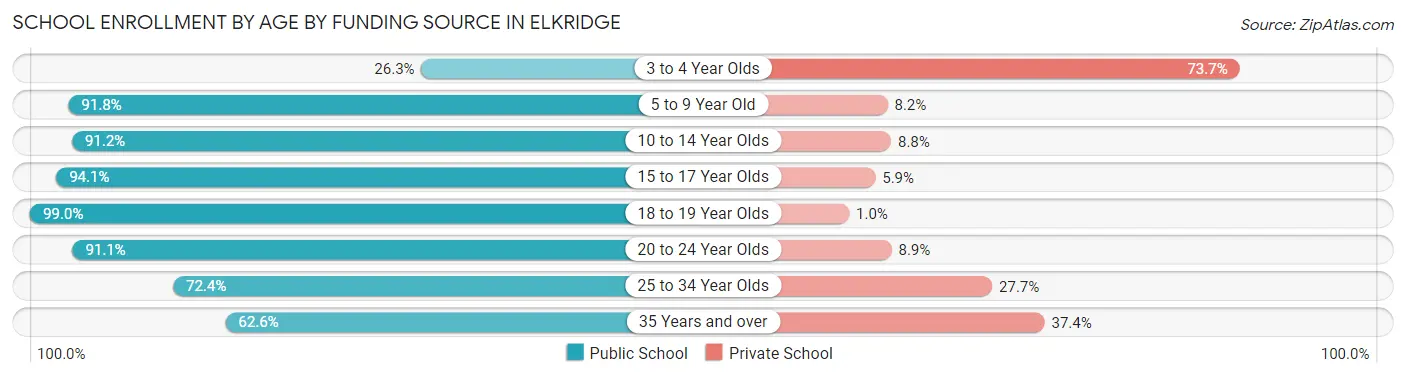
School Enrollment by Age by Funding Source in Elkridge
Out of a total of 7,145 students who are enrolled in schools in Elkridge, 936 (13.1%) attend a private institution, while the remaining 6,209 (86.9%) are enrolled in public schools. The age group of 3 to 4 year olds has the highest likelihood of being enrolled in private schools, with 115 (73.7% in the age bracket) enrolled. Conversely, the age group of 18 to 19 year olds has the lowest likelihood of being enrolled in a private school, with 492 (99.0% in the age bracket) attending a public institution.
| Age Bracket | Public School | Private School |
| 3 to 4 Year Olds | 41 (26.3%) | 115 (73.7%) |
| 5 to 9 Year Old | 1,383 (91.8%) | 123 (8.2%) |
| 10 to 14 Year Olds | 2,048 (91.2%) | 198 (8.8%) |
| 15 to 17 Year Olds | 735 (94.1%) | 46 (5.9%) |
| 18 to 19 Year Olds | 492 (99.0%) | 5 (1.0%) |
| 20 to 24 Year Olds | 715 (91.1%) | 70 (8.9%) |
| 25 to 34 Year Olds | 424 (72.4%) | 162 (27.7%) |
| 35 Years and over | 368 (62.6%) | 220 (37.4%) |
| Total | 6,209 (86.9%) | 936 (13.1%) |
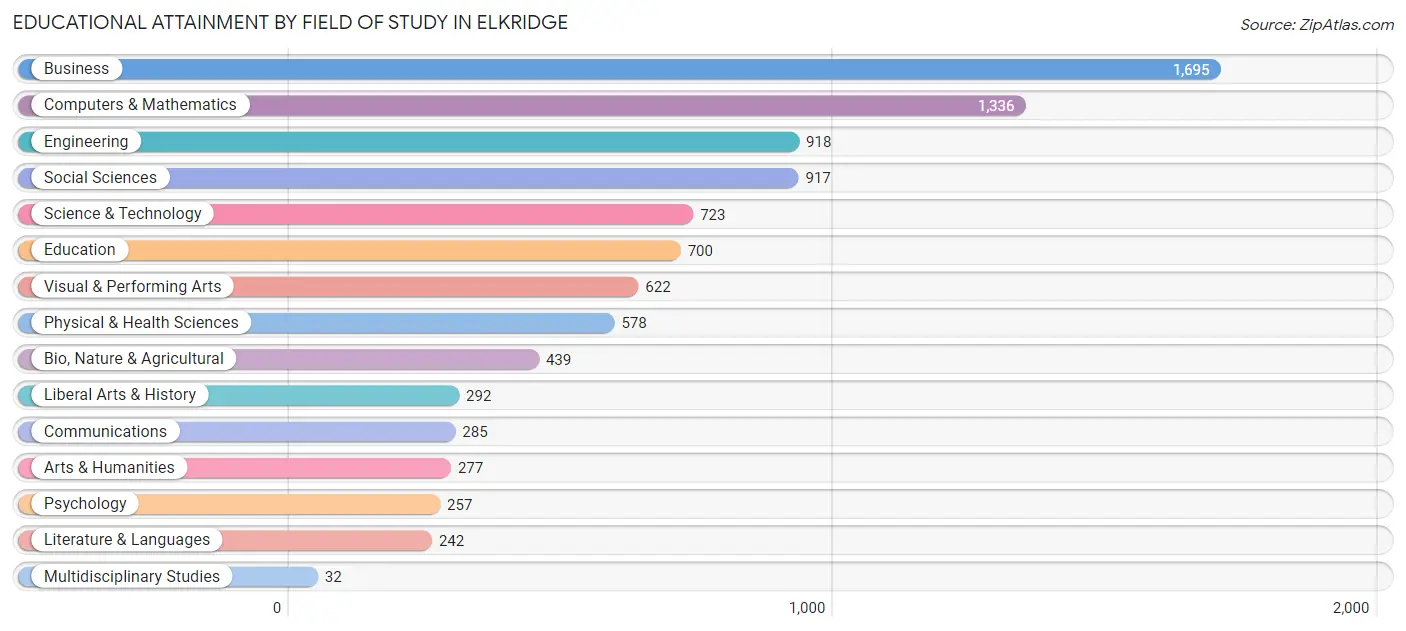
Educational Attainment by Field of Study in Elkridge
Business (1,695 | 18.2%), computers & mathematics (1,336 | 14.3%), engineering (918 | 9.9%), social sciences (917 | 9.9%), and science & technology (723 | 7.8%) are the most common fields of study among 9,313 individuals in Elkridge who have obtained a bachelor's degree or higher.
| Field of Study | # Graduates | % Graduates |
| Computers & Mathematics | 1,336 | 14.3% |
| Bio, Nature & Agricultural | 439 | 4.7% |
| Physical & Health Sciences | 578 | 6.2% |
| Psychology | 257 | 2.8% |
| Social Sciences | 917 | 9.9% |
| Engineering | 918 | 9.9% |
| Multidisciplinary Studies | 32 | 0.3% |
| Science & Technology | 723 | 7.8% |
| Business | 1,695 | 18.2% |
| Education | 700 | 7.5% |
| Literature & Languages | 242 | 2.6% |
| Liberal Arts & History | 292 | 3.1% |
| Visual & Performing Arts | 622 | 6.7% |
| Communications | 285 | 3.1% |
| Arts & Humanities | 277 | 3.0% |
| Total | 9,313 | 100.0% |
Transportation & Commute in Elkridge
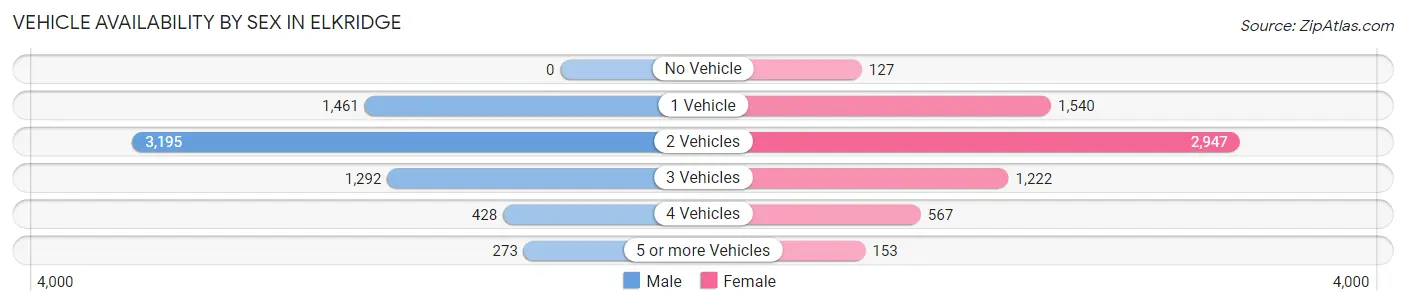
Vehicle Availability by Sex in Elkridge
The most prevalent vehicle ownership categories in Elkridge are males with 2 vehicles (3,195, accounting for 48.0%) and females with 2 vehicles (2,947, making up 48.7%).
| Vehicles Available | Male | Female |
| No Vehicle | 0 (0.0%) | 127 (1.9%) |
| 1 Vehicle | 1,461 (22.0%) | 1,540 (23.5%) |
| 2 Vehicles | 3,195 (48.0%) | 2,947 (45.0%) |
| 3 Vehicles | 1,292 (19.4%) | 1,222 (18.6%) |
| 4 Vehicles | 428 (6.4%) | 567 (8.6%) |
| 5 or more Vehicles | 273 (4.1%) | 153 (2.3%) |
| Total | 6,649 (100.0%) | 6,556 (100.0%) |
Commute Time in Elkridge
The most frequently occuring commute durations in Elkridge are 20 to 24 minutes (2,199 commuters, 19.8%), 30 to 34 minutes (1,852 commuters, 16.7%), and 15 to 19 minutes (1,782 commuters, 16.1%).
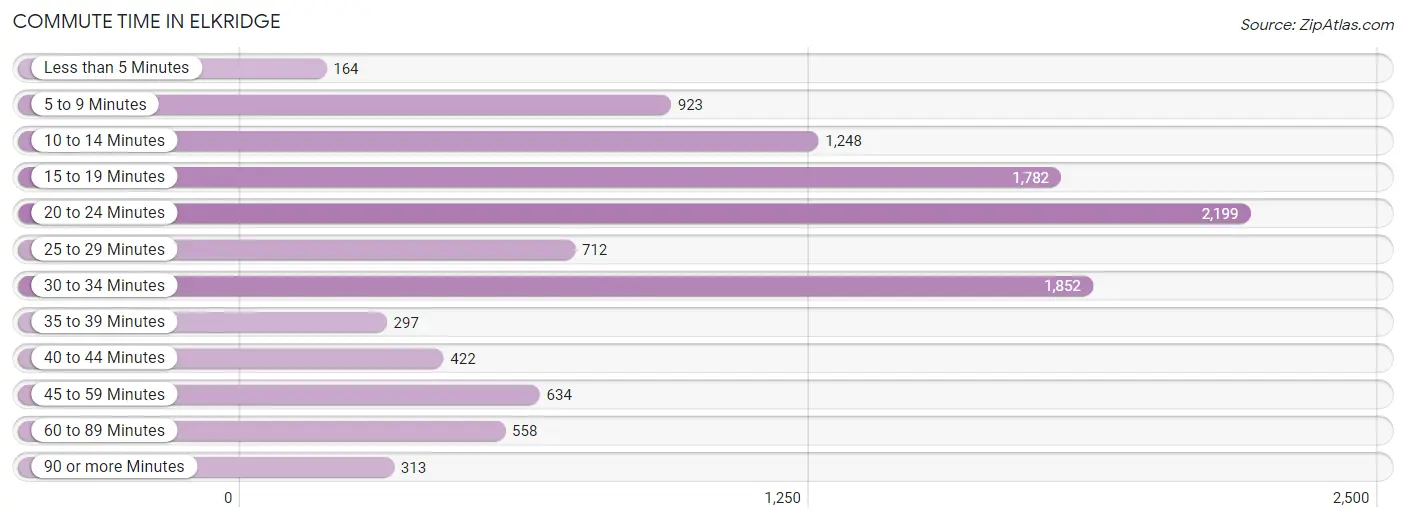
| Commute Time | # Commuters | % Commuters |
| Less than 5 Minutes | 164 | 1.5% |
| 5 to 9 Minutes | 923 | 8.3% |
| 10 to 14 Minutes | 1,248 | 11.2% |
| 15 to 19 Minutes | 1,782 | 16.1% |
| 20 to 24 Minutes | 2,199 | 19.8% |
| 25 to 29 Minutes | 712 | 6.4% |
| 30 to 34 Minutes | 1,852 | 16.7% |
| 35 to 39 Minutes | 297 | 2.7% |
| 40 to 44 Minutes | 422 | 3.8% |
| 45 to 59 Minutes | 634 | 5.7% |
| 60 to 89 Minutes | 558 | 5.0% |
| 90 or more Minutes | 313 | 2.8% |
Commute Time by Sex in Elkridge
The most common commute times in Elkridge are 20 to 24 minutes (992 commuters, 17.9%) for males and 20 to 24 minutes (1,207 commuters, 21.6%) for females.
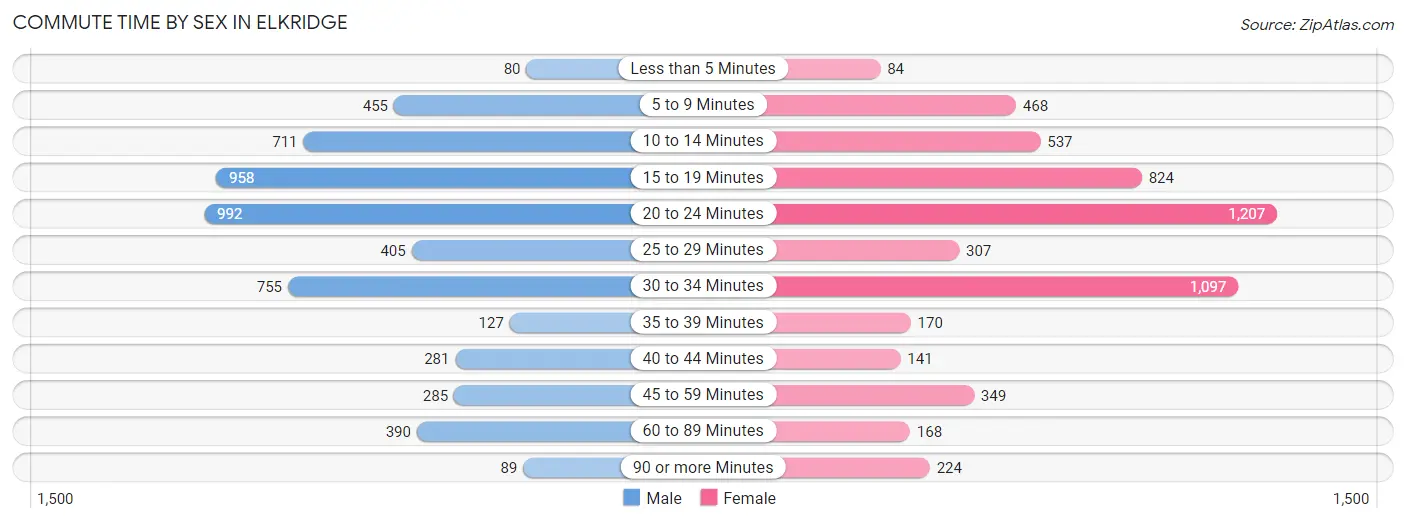
| Commute Time | Male | Female |
| Less than 5 Minutes | 80 (1.5%) | 84 (1.5%) |
| 5 to 9 Minutes | 455 (8.2%) | 468 (8.4%) |
| 10 to 14 Minutes | 711 (12.9%) | 537 (9.6%) |
| 15 to 19 Minutes | 958 (17.3%) | 824 (14.8%) |
| 20 to 24 Minutes | 992 (17.9%) | 1,207 (21.6%) |
| 25 to 29 Minutes | 405 (7.3%) | 307 (5.5%) |
| 30 to 34 Minutes | 755 (13.7%) | 1,097 (19.7%) |
| 35 to 39 Minutes | 127 (2.3%) | 170 (3.0%) |
| 40 to 44 Minutes | 281 (5.1%) | 141 (2.5%) |
| 45 to 59 Minutes | 285 (5.2%) | 349 (6.3%) |
| 60 to 89 Minutes | 390 (7.0%) | 168 (3.0%) |
| 90 or more Minutes | 89 (1.6%) | 224 (4.0%) |
Time of Departure to Work by Sex in Elkridge
The most frequent times of departure to work in Elkridge are 8:00 AM to 8:29 AM (1,107, 20.0%) for males and 7:00 AM to 7:29 AM (946, 17.0%) for females.
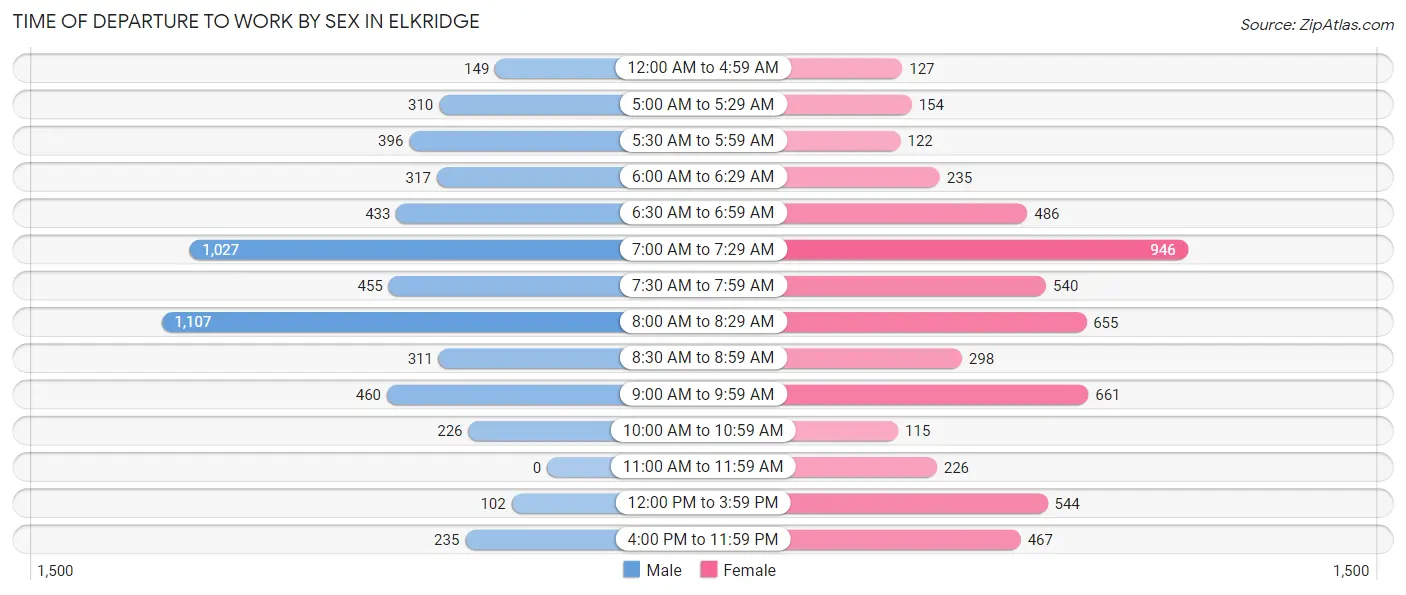
| Time of Departure | Male | Female |
| 12:00 AM to 4:59 AM | 149 (2.7%) | 127 (2.3%) |
| 5:00 AM to 5:29 AM | 310 (5.6%) | 154 (2.8%) |
| 5:30 AM to 5:59 AM | 396 (7.2%) | 122 (2.2%) |
| 6:00 AM to 6:29 AM | 317 (5.7%) | 235 (4.2%) |
| 6:30 AM to 6:59 AM | 433 (7.8%) | 486 (8.7%) |
| 7:00 AM to 7:29 AM | 1,027 (18.6%) | 946 (17.0%) |
| 7:30 AM to 7:59 AM | 455 (8.2%) | 540 (9.7%) |
| 8:00 AM to 8:29 AM | 1,107 (20.0%) | 655 (11.7%) |
| 8:30 AM to 8:59 AM | 311 (5.6%) | 298 (5.3%) |
| 9:00 AM to 9:59 AM | 460 (8.3%) | 661 (11.8%) |
| 10:00 AM to 10:59 AM | 226 (4.1%) | 115 (2.1%) |
| 11:00 AM to 11:59 AM | 0 (0.0%) | 226 (4.1%) |
| 12:00 PM to 3:59 PM | 102 (1.8%) | 544 (9.8%) |
| 4:00 PM to 11:59 PM | 235 (4.3%) | 467 (8.4%) |
| Total | 5,528 (100.0%) | 5,576 (100.0%) |
Housing Occupancy in Elkridge
Occupancy by Ownership in Elkridge
Of the total 8,942 dwellings in Elkridge, owner-occupied units account for 5,653 (63.2%), while renter-occupied units make up 3,289 (36.8%).
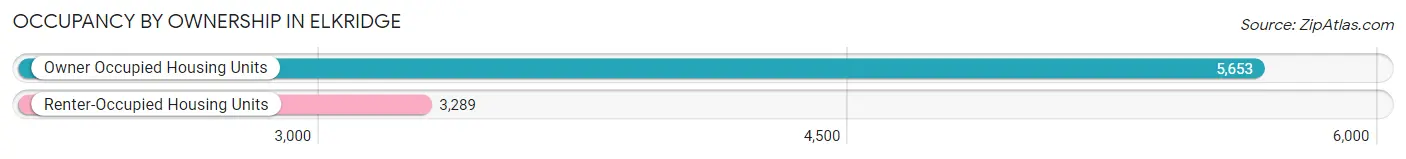
| Occupancy | # Housing Units | % Housing Units |
| Owner Occupied Housing Units | 5,653 | 63.2% |
| Renter-Occupied Housing Units | 3,289 | 36.8% |
| Total Occupied Housing Units | 8,942 | 100.0% |
Occupancy by Household Size in Elkridge
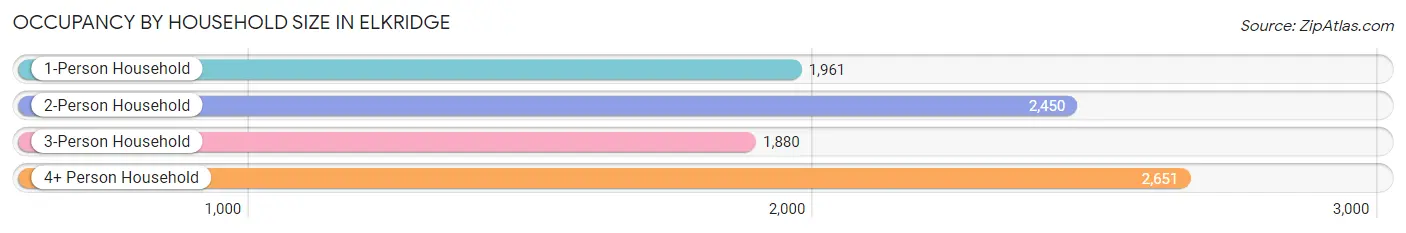
| Household Size | # Housing Units | % Housing Units |
| 1-Person Household | 1,961 | 21.9% |
| 2-Person Household | 2,450 | 27.4% |
| 3-Person Household | 1,880 | 21.0% |
| 4+ Person Household | 2,651 | 29.6% |
| Total Housing Units | 8,942 | 100.0% |
Occupancy by Ownership by Household Size in Elkridge
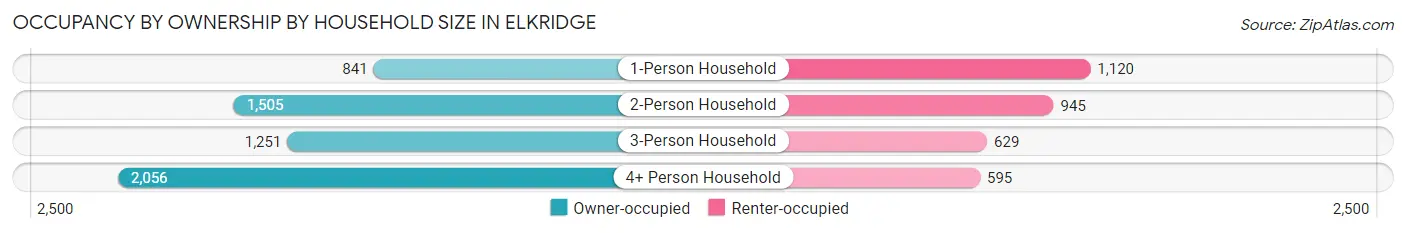
| Household Size | Owner-occupied | Renter-occupied |
| 1-Person Household | 841 (42.9%) | 1,120 (57.1%) |
| 2-Person Household | 1,505 (61.4%) | 945 (38.6%) |
| 3-Person Household | 1,251 (66.5%) | 629 (33.5%) |
| 4+ Person Household | 2,056 (77.6%) | 595 (22.4%) |
| Total Housing Units | 5,653 (63.2%) | 3,289 (36.8%) |
Occupancy by Educational Attainment in Elkridge
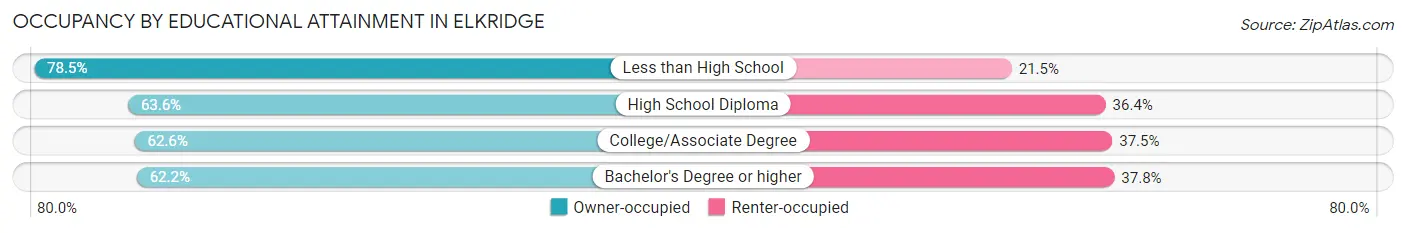
| Household Size | Owner-occupied | Renter-occupied |
| Less than High School | 332 (78.5%) | 91 (21.5%) |
| High School Diploma | 615 (63.6%) | 352 (36.4%) |
| College/Associate Degree | 1,450 (62.5%) | 868 (37.4%) |
| Bachelor's Degree or higher | 3,256 (62.2%) | 1,978 (37.8%) |
Occupancy by Age of Householder in Elkridge
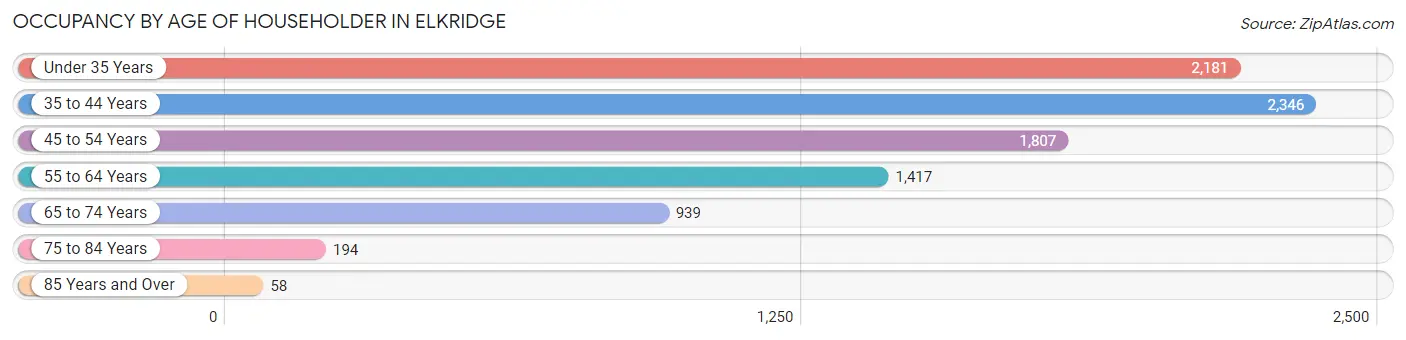
| Age Bracket | # Households | % Households |
| Under 35 Years | 2,181 | 24.4% |
| 35 to 44 Years | 2,346 | 26.2% |
| 45 to 54 Years | 1,807 | 20.2% |
| 55 to 64 Years | 1,417 | 15.9% |
| 65 to 74 Years | 939 | 10.5% |
| 75 to 84 Years | 194 | 2.2% |
| 85 Years and Over | 58 | 0.6% |
| Total | 8,942 | 100.0% |
Housing Finances in Elkridge
Median Income by Occupancy in Elkridge
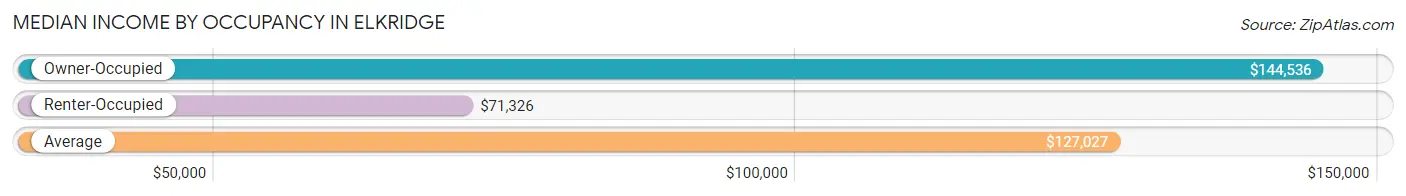
| Occupancy Type | # Households | Median Income |
| Owner-Occupied | 5,653 (63.2%) | $144,536 |
| Renter-Occupied | 3,289 (36.8%) | $71,326 |
| Average | 8,942 (100.0%) | $127,027 |
Occupancy by Householder Income Bracket in Elkridge
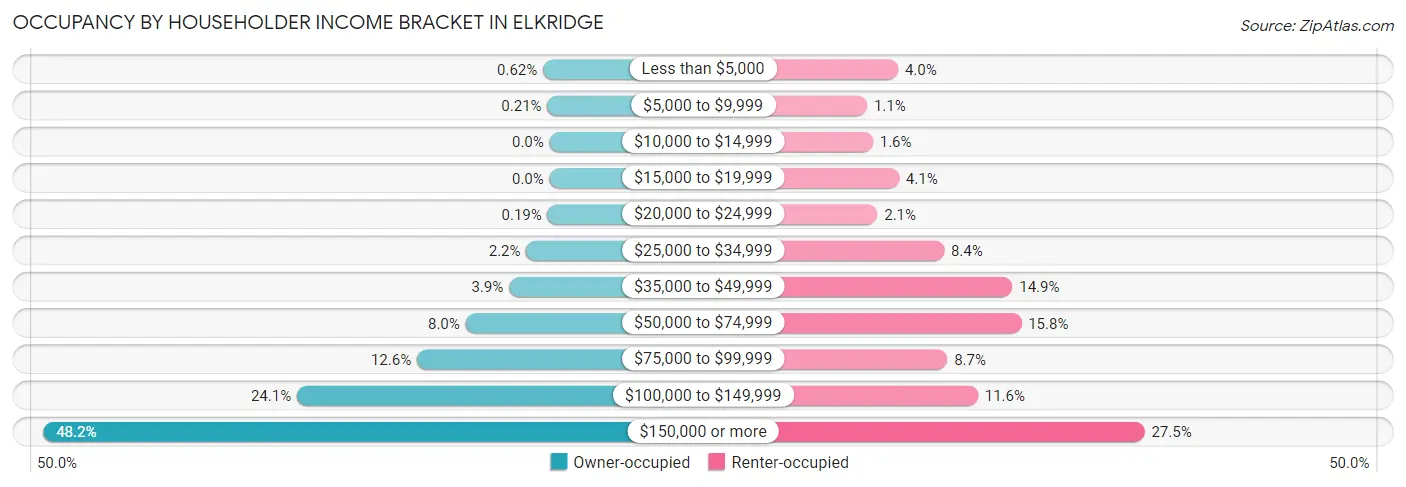
| Income Bracket | Owner-occupied | Renter-occupied |
| Less than $5,000 | 35 (0.6%) | 133 (4.0%) |
| $5,000 to $9,999 | 12 (0.2%) | 36 (1.1%) |
| $10,000 to $14,999 | 0 (0.0%) | 54 (1.6%) |
| $15,000 to $19,999 | 0 (0.0%) | 136 (4.1%) |
| $20,000 to $24,999 | 11 (0.2%) | 68 (2.1%) |
| $25,000 to $34,999 | 125 (2.2%) | 277 (8.4%) |
| $35,000 to $49,999 | 218 (3.9%) | 491 (14.9%) |
| $50,000 to $74,999 | 452 (8.0%) | 519 (15.8%) |
| $75,000 to $99,999 | 714 (12.6%) | 287 (8.7%) |
| $100,000 to $149,999 | 1,360 (24.1%) | 383 (11.6%) |
| $150,000 or more | 2,726 (48.2%) | 905 (27.5%) |
| Total | 5,653 (100.0%) | 3,289 (100.0%) |
Monthly Housing Cost Tiers in Elkridge
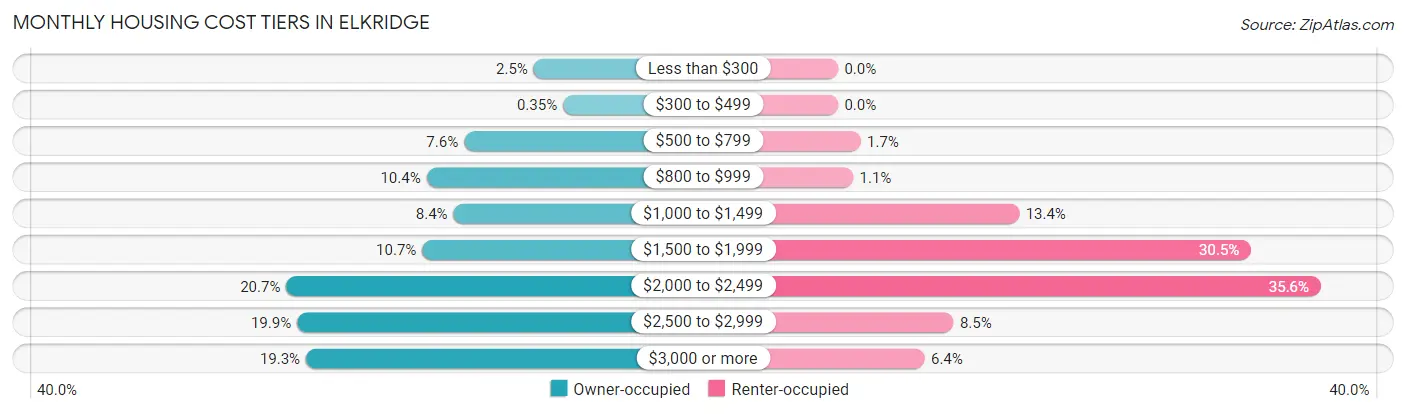
| Monthly Cost | Owner-occupied | Renter-occupied |
| Less than $300 | 142 (2.5%) | 0 (0.0%) |
| $300 to $499 | 20 (0.4%) | 0 (0.0%) |
| $500 to $799 | 432 (7.6%) | 55 (1.7%) |
| $800 to $999 | 588 (10.4%) | 37 (1.1%) |
| $1,000 to $1,499 | 476 (8.4%) | 439 (13.4%) |
| $1,500 to $1,999 | 606 (10.7%) | 1,002 (30.5%) |
| $2,000 to $2,499 | 1,172 (20.7%) | 1,171 (35.6%) |
| $2,500 to $2,999 | 1,127 (19.9%) | 280 (8.5%) |
| $3,000 or more | 1,090 (19.3%) | 210 (6.4%) |
| Total | 5,653 (100.0%) | 3,289 (100.0%) |
Physical Housing Characteristics in Elkridge
Housing Structures in Elkridge
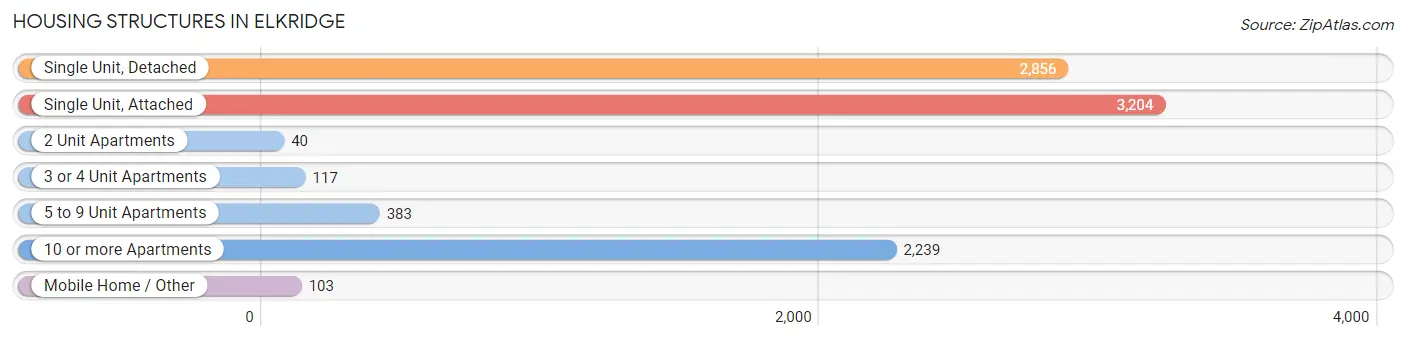
| Structure Type | # Housing Units | % Housing Units |
| Single Unit, Detached | 2,856 | 31.9% |
| Single Unit, Attached | 3,204 | 35.8% |
| 2 Unit Apartments | 40 | 0.4% |
| 3 or 4 Unit Apartments | 117 | 1.3% |
| 5 to 9 Unit Apartments | 383 | 4.3% |
| 10 or more Apartments | 2,239 | 25.0% |
| Mobile Home / Other | 103 | 1.1% |
| Total | 8,942 | 100.0% |
Housing Structures by Occupancy in Elkridge
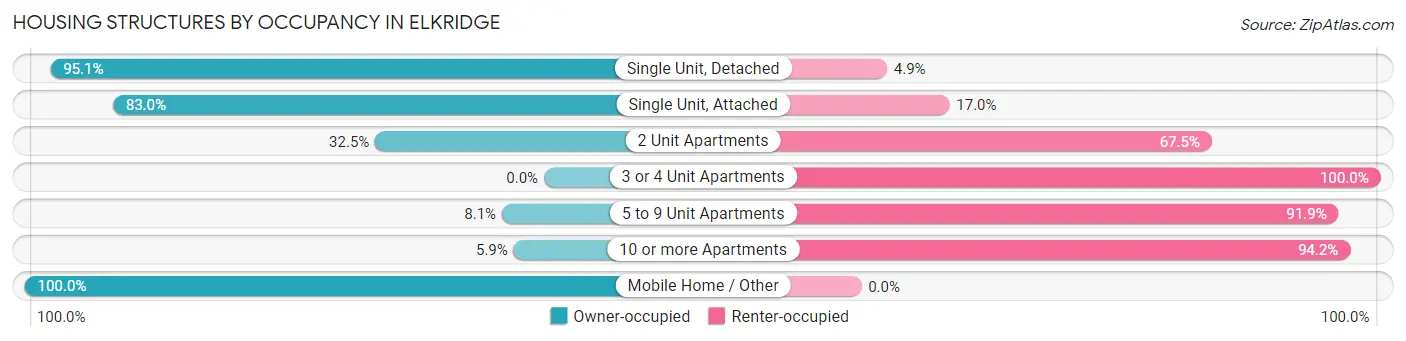
| Structure Type | Owner-occupied | Renter-occupied |
| Single Unit, Detached | 2,715 (95.1%) | 141 (4.9%) |
| Single Unit, Attached | 2,660 (83.0%) | 544 (17.0%) |
| 2 Unit Apartments | 13 (32.5%) | 27 (67.5%) |
| 3 or 4 Unit Apartments | 0 (0.0%) | 117 (100.0%) |
| 5 to 9 Unit Apartments | 31 (8.1%) | 352 (91.9%) |
| 10 or more Apartments | 131 (5.9%) | 2,108 (94.2%) |
| Mobile Home / Other | 103 (100.0%) | 0 (0.0%) |
| Total | 5,653 (63.2%) | 3,289 (36.8%) |
Housing Structures by Number of Rooms in Elkridge
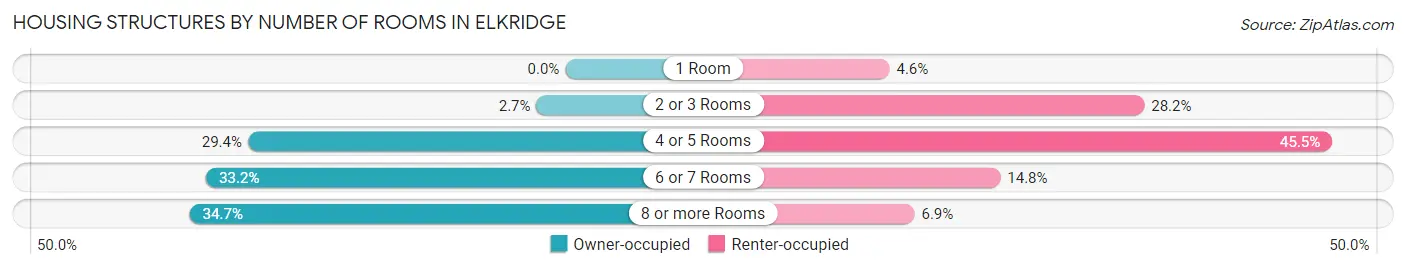
| Number of Rooms | Owner-occupied | Renter-occupied |
| 1 Room | 0 (0.0%) | 151 (4.6%) |
| 2 or 3 Rooms | 151 (2.7%) | 926 (28.1%) |
| 4 or 5 Rooms | 1,660 (29.4%) | 1,497 (45.5%) |
| 6 or 7 Rooms | 1,878 (33.2%) | 488 (14.8%) |
| 8 or more Rooms | 1,964 (34.7%) | 227 (6.9%) |
| Total | 5,653 (100.0%) | 3,289 (100.0%) |
Housing Structure by Heating Type in Elkridge
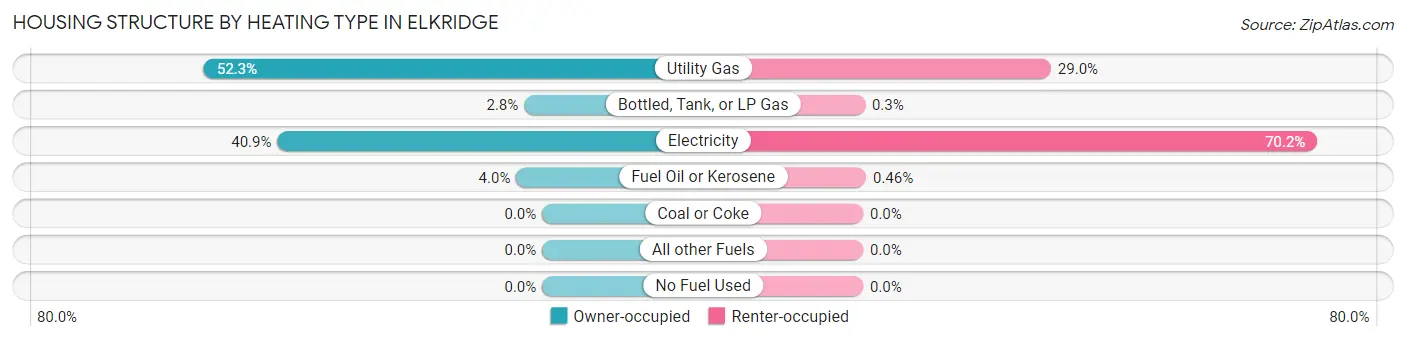
| Heating Type | Owner-occupied | Renter-occupied |
| Utility Gas | 2,956 (52.3%) | 955 (29.0%) |
| Bottled, Tank, or LP Gas | 157 (2.8%) | 10 (0.3%) |
| Electricity | 2,314 (40.9%) | 2,309 (70.2%) |
| Fuel Oil or Kerosene | 226 (4.0%) | 15 (0.5%) |
| Coal or Coke | 0 (0.0%) | 0 (0.0%) |
| All other Fuels | 0 (0.0%) | 0 (0.0%) |
| No Fuel Used | 0 (0.0%) | 0 (0.0%) |
| Total | 5,653 (100.0%) | 3,289 (100.0%) |
Household Vehicle Usage in Elkridge
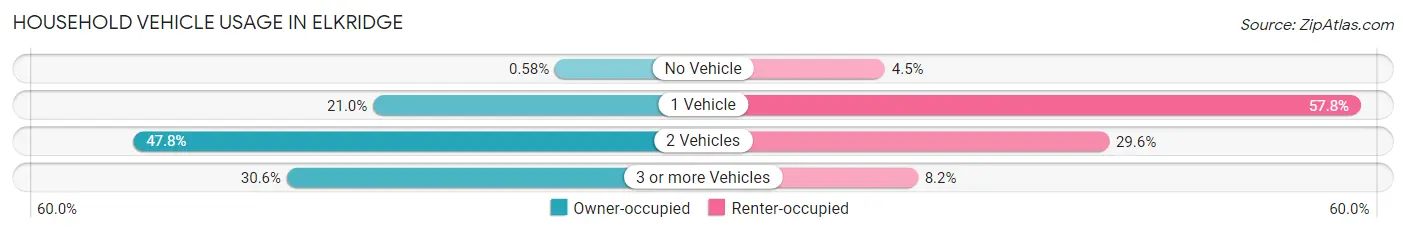
| Vehicles per Household | Owner-occupied | Renter-occupied |
| No Vehicle | 33 (0.6%) | 147 (4.5%) |
| 1 Vehicle | 1,185 (21.0%) | 1,901 (57.8%) |
| 2 Vehicles | 2,704 (47.8%) | 973 (29.6%) |
| 3 or more Vehicles | 1,731 (30.6%) | 268 (8.2%) |
| Total | 5,653 (100.0%) | 3,289 (100.0%) |
Real Estate & Mortgages in Elkridge
Real Estate and Mortgage Overview in Elkridge
| Characteristic | Without Mortgage | With Mortgage |
| Housing Units | 1,279 | 4,374 |
| Median Property Value | $366,000 | $430,700 |
| Median Household Income | $136,228 | $2,205 |
| Monthly Housing Costs | $821 | $1,077 |
| Real Estate Taxes | $4,367 | $123 |
Property Value by Mortgage Status in Elkridge
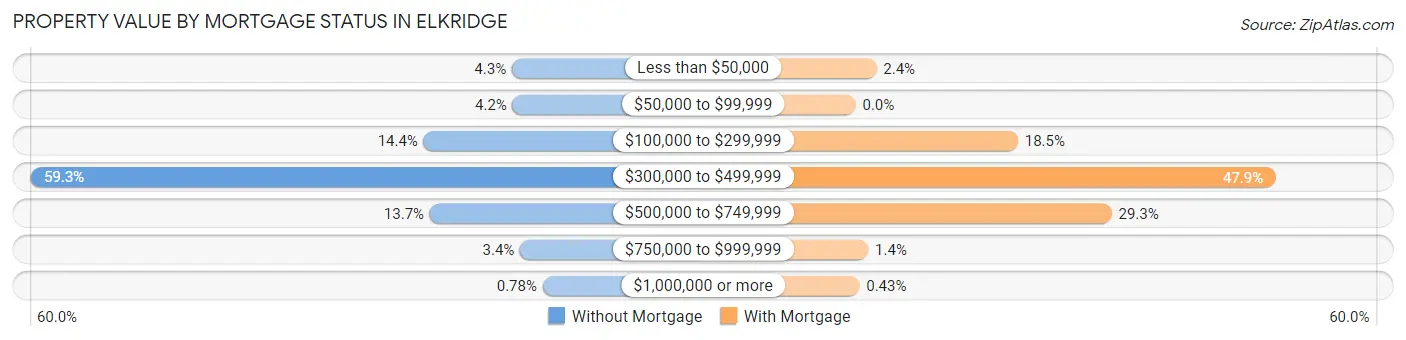
| Property Value | Without Mortgage | With Mortgage |
| Less than $50,000 | 55 (4.3%) | 104 (2.4%) |
| $50,000 to $99,999 | 54 (4.2%) | 0 (0.0%) |
| $100,000 to $299,999 | 184 (14.4%) | 811 (18.5%) |
| $300,000 to $499,999 | 758 (59.3%) | 2,097 (47.9%) |
| $500,000 to $749,999 | 175 (13.7%) | 1,280 (29.3%) |
| $750,000 to $999,999 | 43 (3.4%) | 63 (1.4%) |
| $1,000,000 or more | 10 (0.8%) | 19 (0.4%) |
| Total | 1,279 (100.0%) | 4,374 (100.0%) |
Household Income by Mortgage Status in Elkridge
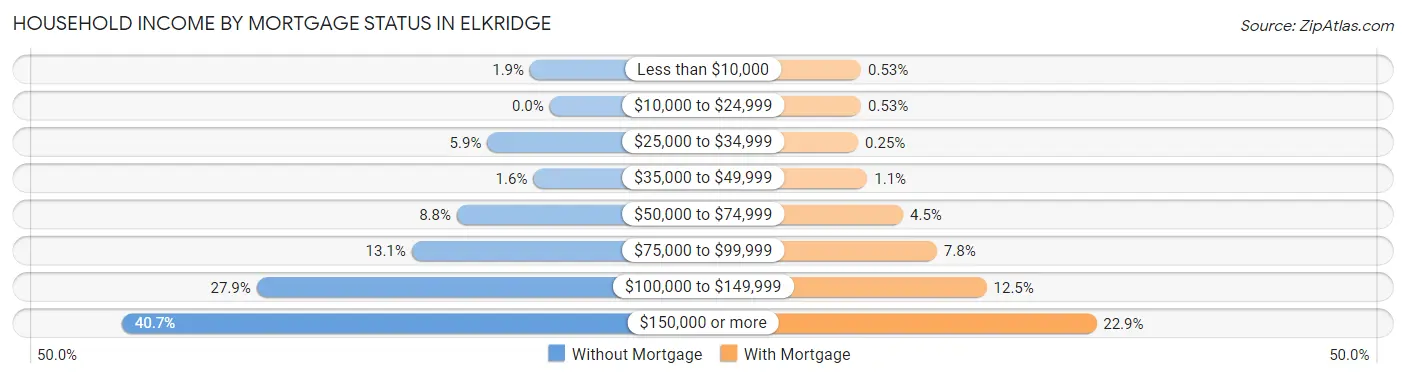
| Household Income | Without Mortgage | With Mortgage |
| Less than $10,000 | 24 (1.9%) | 23 (0.5%) |
| $10,000 to $24,999 | 0 (0.0%) | 23 (0.5%) |
| $25,000 to $34,999 | 76 (5.9%) | 11 (0.3%) |
| $35,000 to $49,999 | 20 (1.6%) | 49 (1.1%) |
| $50,000 to $74,999 | 113 (8.8%) | 198 (4.5%) |
| $75,000 to $99,999 | 168 (13.1%) | 339 (7.7%) |
| $100,000 to $149,999 | 357 (27.9%) | 546 (12.5%) |
| $150,000 or more | 521 (40.7%) | 1,003 (22.9%) |
| Total | 1,279 (100.0%) | 4,374 (100.0%) |
Property Value to Household Income Ratio in Elkridge
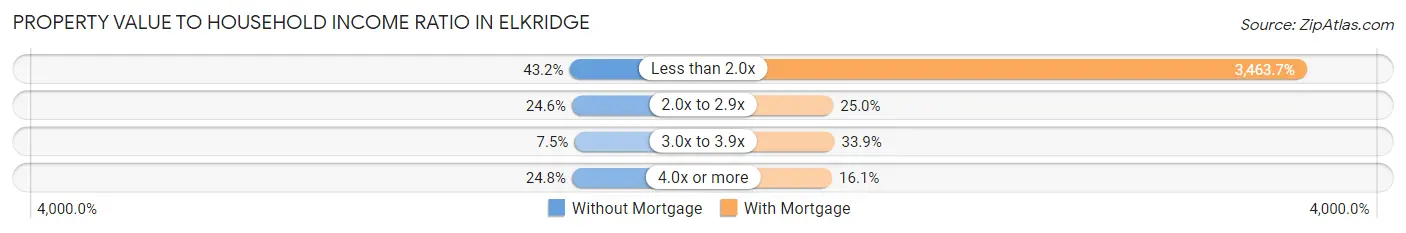
| Value-to-Income Ratio | Without Mortgage | With Mortgage |
| Less than 2.0x | 552 (43.2%) | 151,500 (3,463.6%) |
| 2.0x to 2.9x | 314 (24.5%) | 1,095 (25.0%) |
| 3.0x to 3.9x | 96 (7.5%) | 1,481 (33.9%) |
| 4.0x or more | 317 (24.8%) | 703 (16.1%) |
| Total | 1,279 (100.0%) | 4,374 (100.0%) |
Real Estate Taxes by Mortgage Status in Elkridge
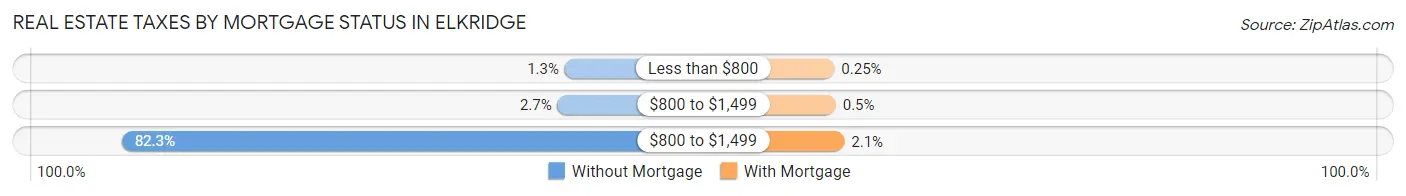
| Property Taxes | Without Mortgage | With Mortgage |
| Less than $800 | 17 (1.3%) | 11 (0.3%) |
| $800 to $1,499 | 34 (2.7%) | 22 (0.5%) |
| $800 to $1,499 | 1,052 (82.3%) | 90 (2.1%) |
| Total | 1,279 (100.0%) | 4,374 (100.0%) |
Health & Disability in Elkridge
Health Insurance Coverage by Age in Elkridge
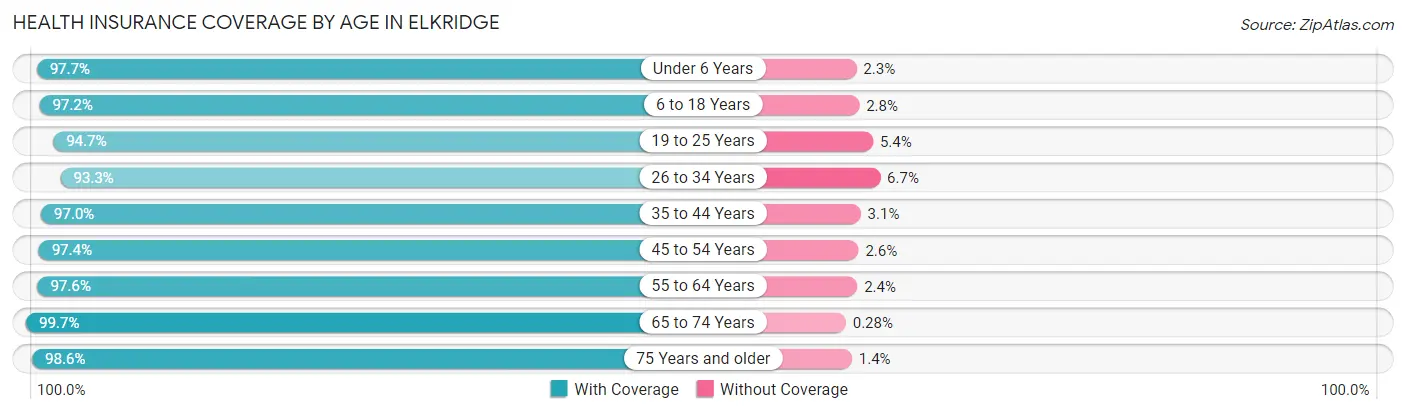
| Age Bracket | With Coverage | Without Coverage |
| Under 6 Years | 2,383 (97.7%) | 55 (2.3%) |
| 6 to 18 Years | 4,644 (97.2%) | 133 (2.8%) |
| 19 to 25 Years | 1,644 (94.7%) | 93 (5.3%) |
| 26 to 34 Years | 3,457 (93.3%) | 248 (6.7%) |
| 35 to 44 Years | 4,166 (97.0%) | 131 (3.0%) |
| 45 to 54 Years | 3,022 (97.4%) | 82 (2.6%) |
| 55 to 64 Years | 2,627 (97.6%) | 65 (2.4%) |
| 65 to 74 Years | 1,408 (99.7%) | 4 (0.3%) |
| 75 Years and older | 629 (98.6%) | 9 (1.4%) |
| Total | 23,980 (96.7%) | 820 (3.3%) |
Health Insurance Coverage by Citizenship Status in Elkridge
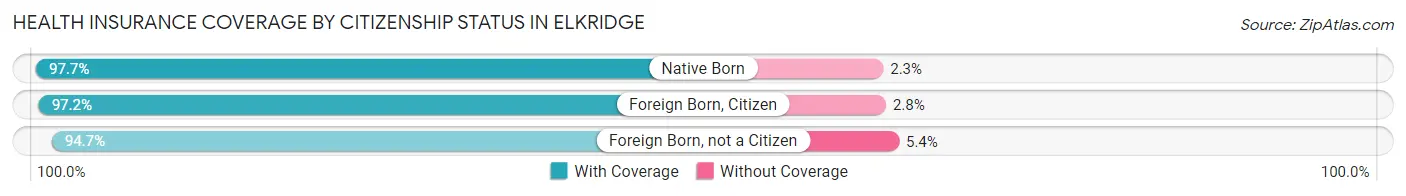
| Citizenship Status | With Coverage | Without Coverage |
| Native Born | 2,383 (97.7%) | 55 (2.3%) |
| Foreign Born, Citizen | 4,644 (97.2%) | 133 (2.8%) |
| Foreign Born, not a Citizen | 1,644 (94.7%) | 93 (5.3%) |
Health Insurance Coverage by Household Income in Elkridge
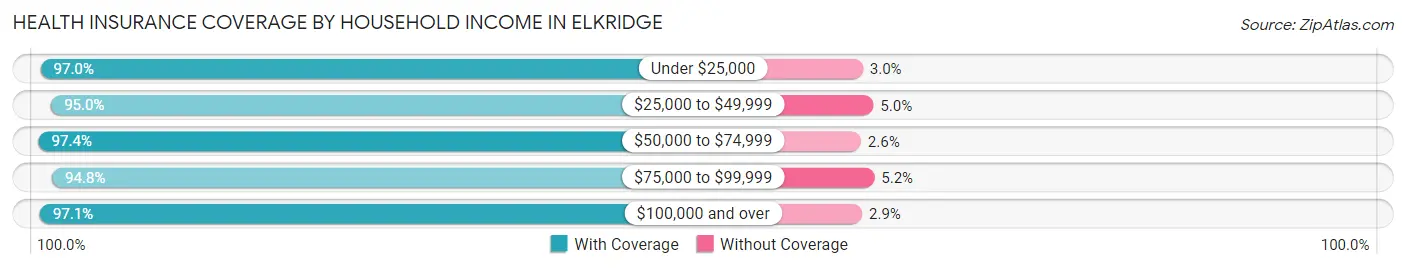
| Household Income | With Coverage | Without Coverage |
| Under $25,000 | 1,226 (97.0%) | 38 (3.0%) |
| $25,000 to $49,999 | 2,399 (95.0%) | 126 (5.0%) |
| $50,000 to $74,999 | 1,919 (97.4%) | 52 (2.6%) |
| $75,000 to $99,999 | 2,427 (94.8%) | 132 (5.2%) |
| $100,000 and over | 15,995 (97.1%) | 472 (2.9%) |
Public vs Private Health Insurance Coverage by Age in Elkridge
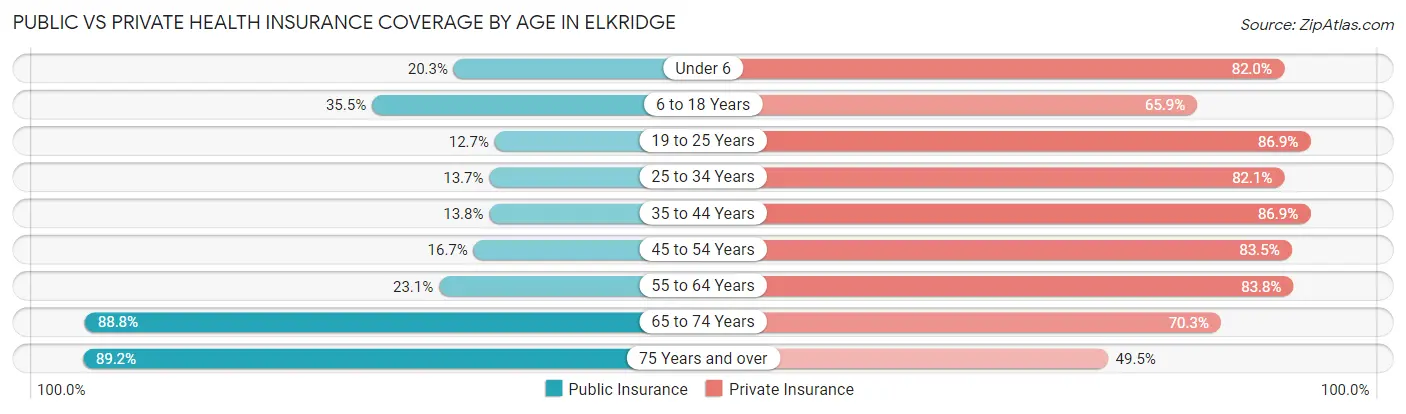
| Age Bracket | Public Insurance | Private Insurance |
| Under 6 | 496 (20.3%) | 2,000 (82.0%) |
| 6 to 18 Years | 1,697 (35.5%) | 3,150 (65.9%) |
| 19 to 25 Years | 221 (12.7%) | 1,510 (86.9%) |
| 25 to 34 Years | 509 (13.7%) | 3,042 (82.1%) |
| 35 to 44 Years | 591 (13.8%) | 3,734 (86.9%) |
| 45 to 54 Years | 517 (16.7%) | 2,591 (83.5%) |
| 55 to 64 Years | 621 (23.1%) | 2,256 (83.8%) |
| 65 to 74 Years | 1,254 (88.8%) | 993 (70.3%) |
| 75 Years and over | 569 (89.2%) | 316 (49.5%) |
| Total | 6,475 (26.1%) | 19,592 (79.0%) |
Disability Status by Sex by Age in Elkridge
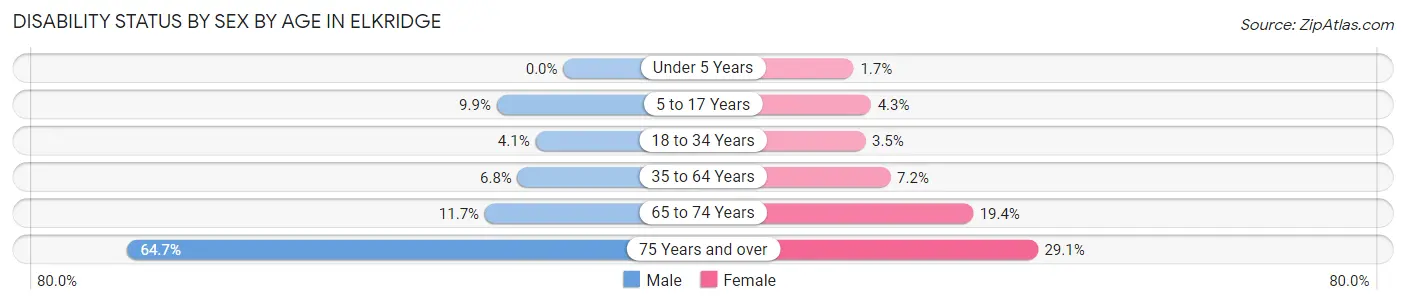
| Age Bracket | Male | Female |
| Under 5 Years | 0 (0.0%) | 17 (1.7%) |
| 5 to 17 Years | 222 (9.9%) | 108 (4.3%) |
| 18 to 34 Years | 119 (4.1%) | 103 (3.5%) |
| 35 to 64 Years | 317 (6.8%) | 389 (7.2%) |
| 65 to 74 Years | 98 (11.7%) | 111 (19.4%) |
| 75 Years and over | 110 (64.7%) | 136 (29.1%) |
Disability Class by Sex by Age in Elkridge
Disability Class: Hearing Difficulty
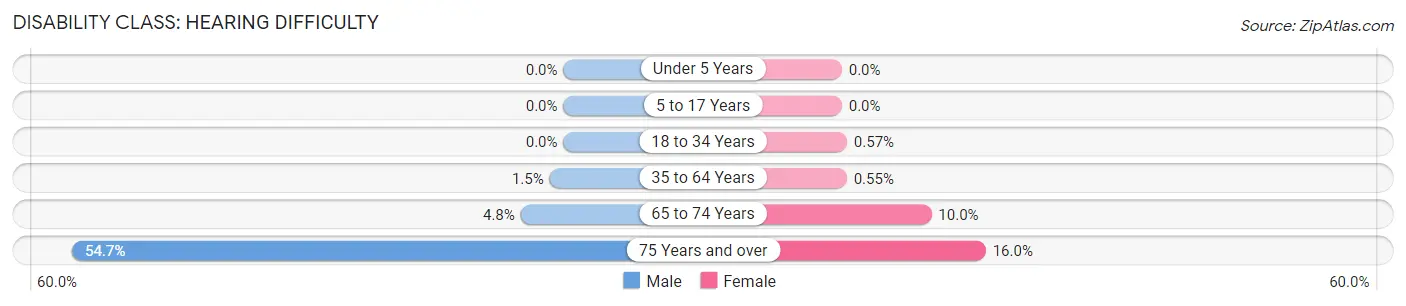
| Age Bracket | Male | Female |
| Under 5 Years | 0 (0.0%) | 0 (0.0%) |
| 5 to 17 Years | 0 (0.0%) | 0 (0.0%) |
| 18 to 34 Years | 0 (0.0%) | 17 (0.6%) |
| 35 to 64 Years | 72 (1.5%) | 30 (0.5%) |
| 65 to 74 Years | 40 (4.8%) | 57 (10.0%) |
| 75 Years and over | 93 (54.7%) | 75 (16.0%) |
Disability Class: Vision Difficulty
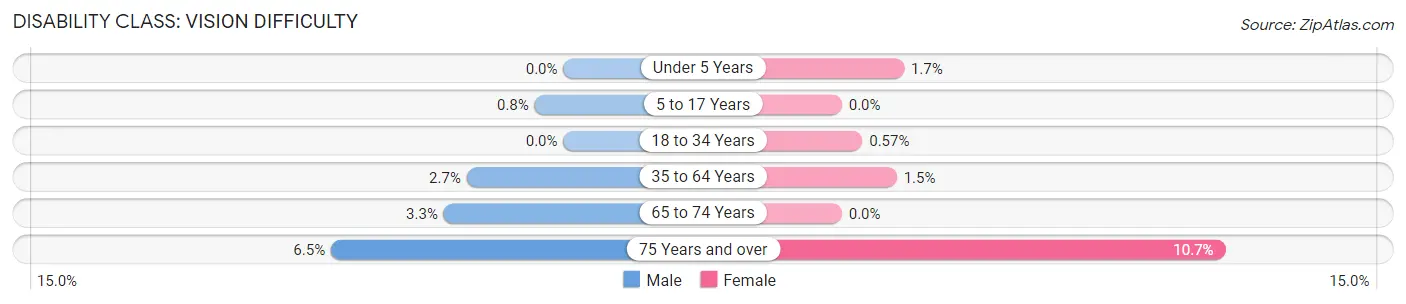
| Age Bracket | Male | Female |
| Under 5 Years | 0 (0.0%) | 17 (1.7%) |
| 5 to 17 Years | 18 (0.8%) | 0 (0.0%) |
| 18 to 34 Years | 0 (0.0%) | 17 (0.6%) |
| 35 to 64 Years | 126 (2.7%) | 83 (1.5%) |
| 65 to 74 Years | 28 (3.3%) | 0 (0.0%) |
| 75 Years and over | 11 (6.5%) | 50 (10.7%) |
Disability Class: Cognitive Difficulty
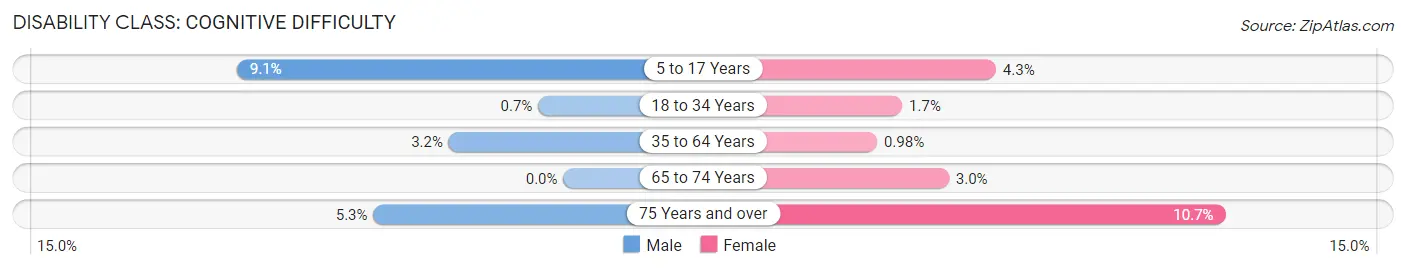
| Age Bracket | Male | Female |
| 5 to 17 Years | 204 (9.1%) | 108 (4.3%) |
| 18 to 34 Years | 20 (0.7%) | 50 (1.7%) |
| 35 to 64 Years | 149 (3.2%) | 53 (1.0%) |
| 65 to 74 Years | 0 (0.0%) | 17 (3.0%) |
| 75 Years and over | 9 (5.3%) | 50 (10.7%) |
Disability Class: Ambulatory Difficulty
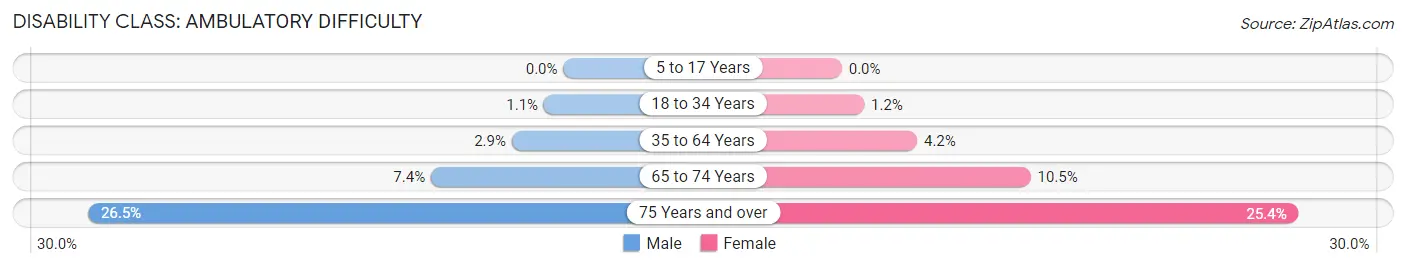
| Age Bracket | Male | Female |
| 5 to 17 Years | 0 (0.0%) | 0 (0.0%) |
| 18 to 34 Years | 31 (1.1%) | 37 (1.2%) |
| 35 to 64 Years | 134 (2.9%) | 227 (4.2%) |
| 65 to 74 Years | 62 (7.4%) | 60 (10.5%) |
| 75 Years and over | 45 (26.5%) | 119 (25.4%) |
Disability Class: Self-Care Difficulty
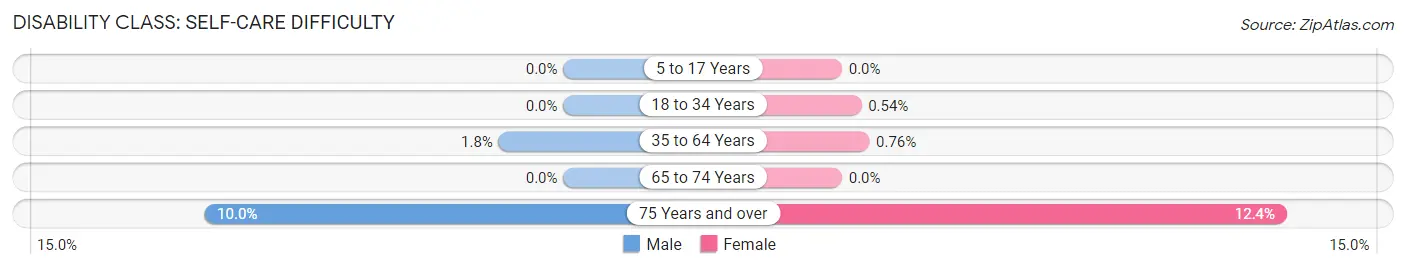
| Age Bracket | Male | Female |
| 5 to 17 Years | 0 (0.0%) | 0 (0.0%) |
| 18 to 34 Years | 0 (0.0%) | 16 (0.5%) |
| 35 to 64 Years | 84 (1.8%) | 41 (0.8%) |
| 65 to 74 Years | 0 (0.0%) | 0 (0.0%) |
| 75 Years and over | 17 (10.0%) | 58 (12.4%) |
Technology Access in Elkridge
Computing Device Access in Elkridge
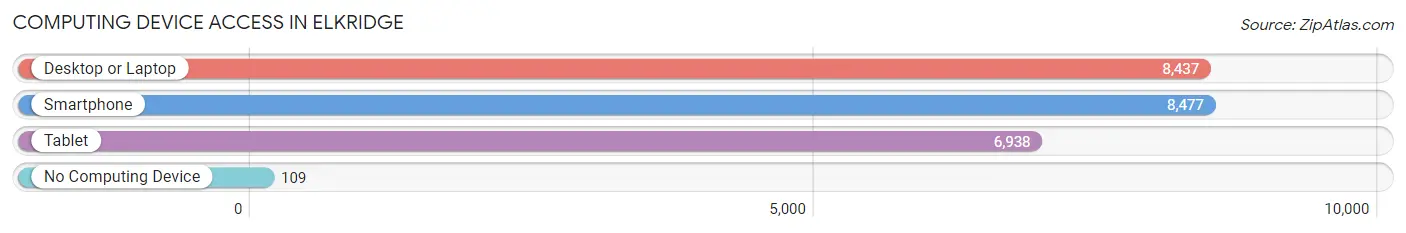
| Device Type | # Households | % Households |
| Desktop or Laptop | 8,437 | 94.4% |
| Smartphone | 8,477 | 94.8% |
| Tablet | 6,938 | 77.6% |
| No Computing Device | 109 | 1.2% |
| Total | 8,942 | 100.0% |
Internet Access in Elkridge
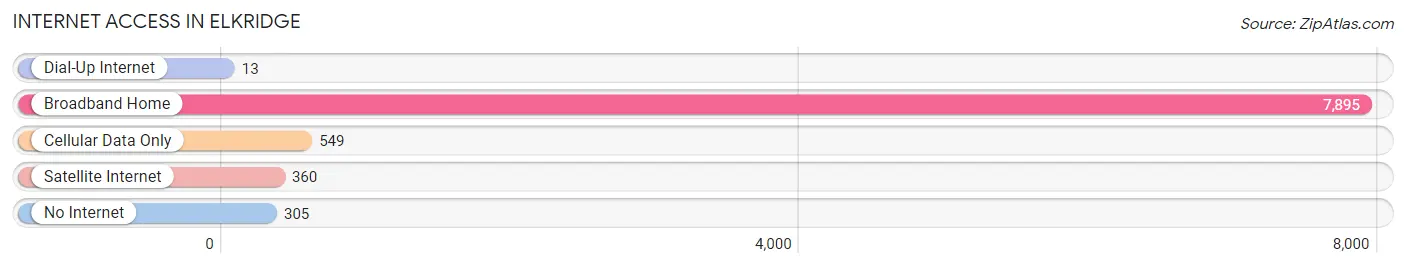
| Internet Type | # Households | % Households |
| Dial-Up Internet | 13 | 0.2% |
| Broadband Home | 7,895 | 88.3% |
| Cellular Data Only | 549 | 6.1% |
| Satellite Internet | 360 | 4.0% |
| No Internet | 305 | 3.4% |
| Total | 8,942 | 100.0% |
Elkridge Summary
Elkridge is a census-designated place (CDP) located in Howard County, Maryland, United States. It is situated in the Baltimore-Washington metropolitan area, and is located approximately 15 miles southwest of Baltimore and 25 miles northeast of Washington, D.C. As of the 2010 census, the population of Elkridge was 15,593.
History
The area now known as Elkridge was first settled in 1694 by Richard Snowden and his family. The Snowden family was one of the first families to settle in the area, and their homestead was located on the Patapsco River. The area was known as Snowden's Manor, and was part of Anne Arundel County until Howard County was formed in 1851.
The area was originally known as "Ho-Ho-Kus," which was an Indian term meaning "place of the friendly people." The area was later renamed Elkridge Landing, and was a popular stop for travelers on the National Road. The area was also home to a number of mills, including the Elkridge Furnace, which was built in 1744 and was the first iron furnace in the United States.
Geography
Elkridge is located at 39°14′N 76°45′W (39.23, -76.75). According to the United States Census Bureau, the CDP has a total area of 8.2 square miles (21.2 km2), of which 8.1 square miles (21.0 km2) is land and 0.1 square miles (0.2 km2) (1.17%) is water.
The Patapsco River forms the northern border of Elkridge, and the area is bordered by Ellicott City to the east, Columbia to the south, and Catonsville to the west.
Economy
Elkridge is home to a number of businesses, including the Elkridge Furnace Inn, which is a popular restaurant and inn. The area is also home to a number of technology companies, including Northrop Grumman, Lockheed Martin, and Raytheon.
Demographics
As of the 2010 census, there were 15,593 people, 5,945 households, and 4,072 families residing in the CDP. The population density was 1,921.3 people per square mile (741.2/km2). There were 6,220 housing units at an average density of 767.2 per square mile (296.3/km2). The racial makeup of the CDP was 68.2% White, 18.3% African American, 0.3% Native American, 8.2% Asian, 0.1% Pacific Islander, 2.3% from other races, and 2.7% from two or more races. Hispanic or Latino of any race were 6.2% of the population.
There were 5,945 households, out of which 33.2% had children under the age of 18 living with them, 53.2% were married couples living together, 11.2% had a female householder with no husband present, and 30.7% were non-families. 24.2% of all households were made up of individuals, and 8.2% had someone living alone who was 65 years of age or older. The average household size was 2.60 and the average family size was 3.10.
In the CDP, the population was spread out, with 24.2% under the age of 18, 7.2% from 18 to 24, 32.2% from 25 to 44, 24.2% from 45 to 64, and 12.2% who were 65 years of age or older. The median age was 37 years. For every 100 females, there were 94.2 males. For every 100 females age 18 and over, there were 91.2 males.
The median income for a household in the CDP was $68,944, and the median income for a family was $77,898. Males had a median income of $50,865 versus $41,921 for females. The per capita income for the CDP was $30,912. About 3.2% of families and 4.7% of the population were below the poverty line, including 5.2% of those under age 18 and 4.2% of those age 65 or over.
Common Questions
What is Per Capita Income in Elkridge?
Per Capita income in Elkridge is $51,008.
What is the Median Family Income in Elkridge?
Median Family Income in Elkridge is $136,952.
What is the Median Household income in Elkridge?
Median Household Income in Elkridge is $127,027.
What is Income or Wage Gap in Elkridge?
Income or Wage Gap in Elkridge is 33.8%.
Women in Elkridge earn 66.2 cents for every dollar earned by a man.
What is Inequality or Gini Index in Elkridge?
Inequality or Gini Index in Elkridge is 0.37.
What is the Total Population of Elkridge?
Total Population of Elkridge is 25,251.
What is the Total Male Population of Elkridge?
Total Male Population of Elkridge is 12,135.
What is the Total Female Population of Elkridge?
Total Female Population of Elkridge is 13,116.
What is the Ratio of Males per 100 Females in Elkridge?
There are 92.52 Males per 100 Females in Elkridge.
What is the Ratio of Females per 100 Males in Elkridge?
There are 108.08 Females per 100 Males in Elkridge.
What is the Median Population Age in Elkridge?
Median Population Age in Elkridge is 34.3 Years.
What is the Average Family Size in Elkridge
Average Family Size in Elkridge is 3.2 People.
What is the Average Household Size in Elkridge
Average Household Size in Elkridge is 2.8 People.
How Large is the Labor Force in Elkridge?
There are 14,274 People in the Labor Forcein in Elkridge.
What is the Percentage of People in the Labor Force in Elkridge?
75.1% of People are in the Labor Force in Elkridge.
What is the Unemployment Rate in Elkridge?
Unemployment Rate in Elkridge is 5.3%.