Cities with the Highest Percentage of Immigrants from Western Africa in North Carolina
RELATED REPORTS & OPTIONS
Western Africa
North Carolina
Compare Cities
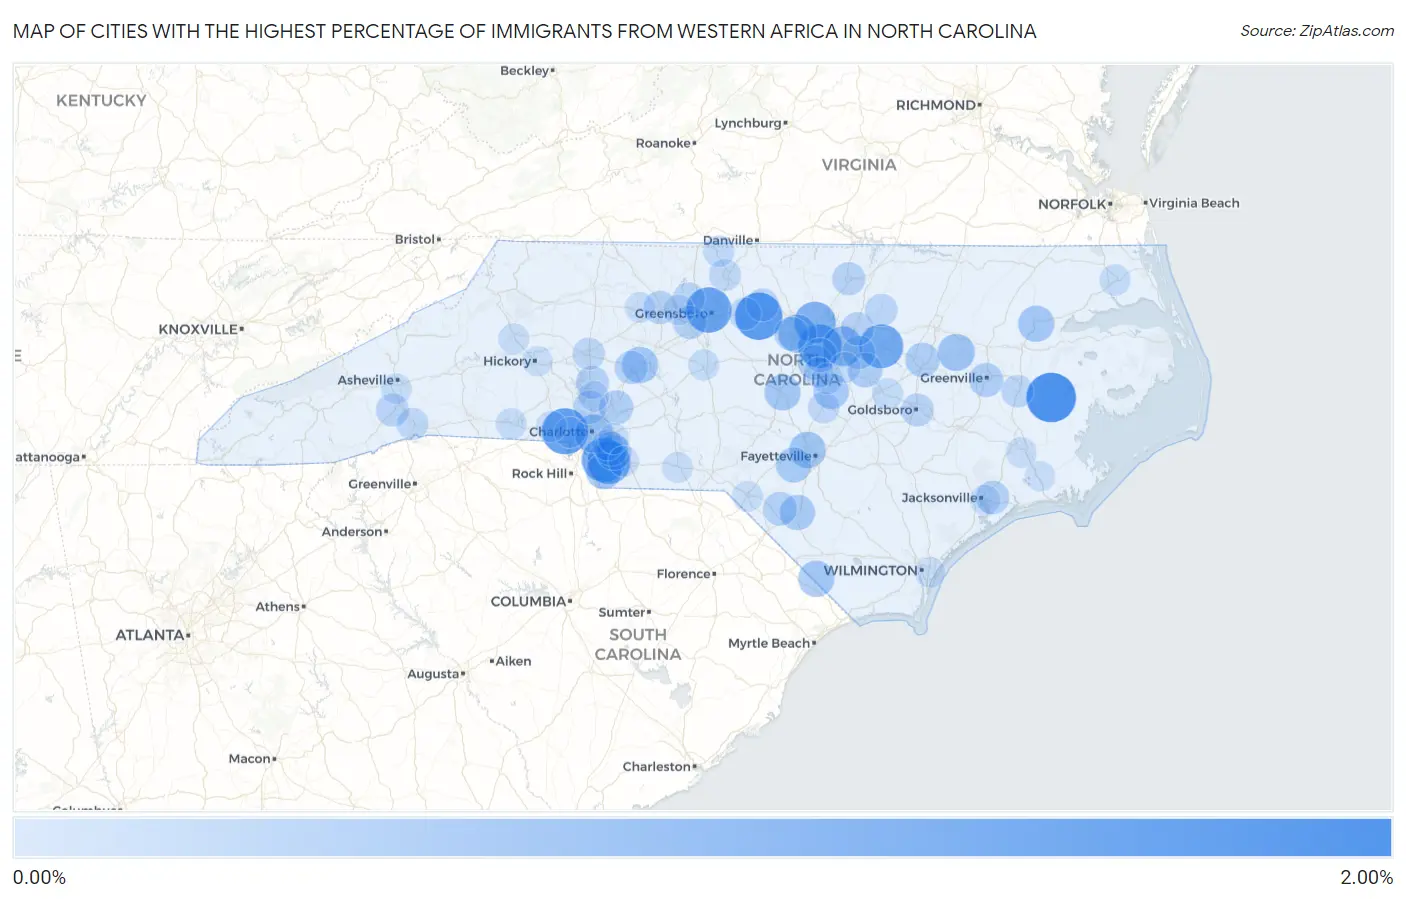
Map of Cities with the Highest Percentage of Immigrants from Western Africa in North Carolina
0.00%
2.00%
Cities with the Highest Percentage of Immigrants from Western Africa in North Carolina
| City | Western Africa | vs State | vs National | |
| 1. | Bath | 1.69% | 0.24%(+1.45)#-1 | 0.30%(+1.40)#0 |
| 2. | Graham | 1.49% | 0.24%(+1.25)#0 | 0.30%(+1.20)#1 |
| 3. | Cramerton | 1.40% | 0.24%(+1.16)#1 | 0.30%(+1.10)#2 |
| 4. | Greensboro | 1.34% | 0.24%(+1.10)#17 | 0.30%(+1.04)#823 |
| 5. | Weddington | 1.21% | 0.24%(+0.964)#18 | 0.30%(+0.909)#824 |
| 6. | Zebulon | 1.20% | 0.24%(+0.957)#19 | 0.30%(+0.902)#825 |
| 7. | Morrisville | 1.15% | 0.24%(+0.907)#20 | 0.30%(+0.852)#826 |
| 8. | Wesley Chapel | 1.14% | 0.24%(+0.899)#21 | 0.30%(+0.843)#827 |
| 9. | Durham | 0.98% | 0.24%(+0.739)#22 | 0.30%(+0.684)#828 |
| 10. | Raleigh | 0.83% | 0.24%(+0.587)#23 | 0.30%(+0.532)#829 |
| 11. | Chapel Hill | 0.70% | 0.24%(+0.457)#24 | 0.30%(+0.402)#830 |
| 12. | Charlotte | 0.69% | 0.24%(+0.450)#25 | 0.30%(+0.395)#831 |
| 13. | Pinetops | 0.58% | 0.24%(+0.340)#26 | 0.30%(+0.285)#832 |
| 14. | Fayetteville | 0.53% | 0.24%(+0.288)#27 | 0.30%(+0.233)#967 |
| 15. | Spencer | 0.52% | 0.24%(+0.273)#28 | 0.30%(+0.218)#968 |
| 16. | Windsor | 0.52% | 0.24%(+0.273)#29 | 0.30%(+0.218)#969 |
| 17. | Tabor City | 0.51% | 0.24%(+0.270)#30 | 0.30%(+0.215)#970 |
| 18. | Sanford | 0.50% | 0.24%(+0.258)#31 | 0.30%(+0.203)#971 |
| 19. | Waxhaw | 0.47% | 0.24%(+0.232)#32 | 0.30%(+0.177)#972 |
| 20. | Angier | 0.45% | 0.24%(+0.206)#33 | 0.30%(+0.151)#973 |
| 21. | Lumberton | 0.43% | 0.24%(+0.192)#34 | 0.30%(+0.137)#974 |
| 22. | Indian Trail | 0.42% | 0.24%(+0.181)#35 | 0.30%(+0.126)#975 |
| 23. | Rockfish | 0.42% | 0.24%(+0.178)#36 | 0.30%(+0.123)#976 |
| 24. | Clayton | 0.40% | 0.24%(+0.156)#37 | 0.30%(+0.101)#977 |
| 25. | Apex | 0.38% | 0.24%(+0.137)#38 | 0.30%(+0.082)#978 |
| 26. | Wilson | 0.36% | 0.24%(+0.113)#39 | 0.30%(+0.058)#979 |
| 27. | Concord | 0.35% | 0.24%(+0.104)#40 | 0.30%(+0.049)#980 |
| 28. | Greenville | 0.33% | 0.24%(+0.087)#41 | 0.30%(+0.032)#981 |
| 29. | Stallings | 0.32% | 0.24%(+0.079)#42 | 0.30%(+0.023)#982 |
| 30. | Pembroke | 0.32% | 0.24%(+0.075)#43 | 0.30%(+0.020)#983 |
| 31. | Carrboro | 0.32% | 0.24%(+0.073)#44 | 0.30%(+0.018)#984 |
| 32. | Cary | 0.31% | 0.24%(+0.063)#45 | 0.30%(+0.008)#985 |
| 33. | Anderson Creek | 0.30% | 0.24%(+0.055)#46 | 0.30%(-0.000)#986 |
| 34. | Piney Green | 0.29% | 0.24%(+0.049)#47 | 0.30%(-0.006)#987 |
| 35. | Knightdale | 0.28% | 0.24%(+0.034)#48 | 0.30%(-0.021)#988 |
| 36. | High Point | 0.27% | 0.24%(+0.028)#49 | 0.30%(-0.027)#1,140 |
| 37. | Salisbury | 0.26% | 0.24%(+0.020)#50 | 0.30%(-0.035)#1,141 |
| 38. | Winston Salem | 0.26% | 0.24%(+0.017)#51 | 0.30%(-0.038)#1,164 |
| 39. | Huntersville | 0.26% | 0.24%(+0.014)#52 | 0.30%(-0.041)#1,165 |
| 40. | Wake Forest | 0.26% | 0.24%(+0.013)#53 | 0.30%(-0.042)#1,166 |
| 41. | Oxford | 0.25% | 0.24%(+0.011)#54 | 0.30%(-0.044)#1,167 |
| 42. | Mooresville | 0.25% | 0.24%(+0.005)#55 | 0.30%(-0.050)#1,168 |
| 43. | Mills River | 0.24% | 0.24%(-0.003)#56 | 0.30%(-0.058)#1,169 |
| 44. | Goldsboro | 0.23% | 0.24%(-0.013)#57 | 0.30%(-0.068)#1,170 |
| 45. | Green Level | 0.23% | 0.24%(-0.018)#58 | 0.30%(-0.073)#1,171 |
| 46. | Oak Ridge | 0.21% | 0.24%(-0.033)#59 | 0.30%(-0.088)#1,172 |
| 47. | Louisburg | 0.19% | 0.24%(-0.049)#60 | 0.30%(-0.104)#1,173 |
| 48. | Chocowinity | 0.19% | 0.24%(-0.054)#61 | 0.30%(-0.109)#1,174 |
| 49. | Burlington | 0.18% | 0.24%(-0.064)#62 | 0.30%(-0.119)#1,175 |
| 50. | Statesville | 0.17% | 0.24%(-0.068)#63 | 0.30%(-0.123)#1,176 |
| 51. | Spout Springs | 0.17% | 0.24%(-0.069)#64 | 0.30%(-0.124)#1,177 |
| 52. | East Flat Rock | 0.15% | 0.24%(-0.091)#65 | 0.30%(-0.146)#1,178 |
| 53. | Reidsville | 0.14% | 0.24%(-0.098)#66 | 0.30%(-0.153)#1,179 |
| 54. | Lillington | 0.13% | 0.24%(-0.111)#67 | 0.30%(-0.166)#1,180 |
| 55. | Eden | 0.11% | 0.24%(-0.132)#68 | 0.30%(-0.187)#1,181 |
| 56. | Pine Level | 0.095% | 0.24%(-0.148)#69 | 0.30%(-0.203)#1,182 |
| 57. | Elizabeth City | 0.092% | 0.24%(-0.151)#70 | 0.30%(-0.206)#1,183 |
| 58. | Fuquay Varina | 0.082% | 0.24%(-0.161)#71 | 0.30%(-0.216)#1,184 |
| 59. | Asheboro | 0.081% | 0.24%(-0.161)#72 | 0.30%(-0.217)#1,185 |
| 60. | Shelby | 0.074% | 0.24%(-0.169)#73 | 0.30%(-0.224)#1,186 |
| 61. | Matthews | 0.068% | 0.24%(-0.175)#74 | 0.30%(-0.230)#1,187 |
| 62. | Belmont | 0.067% | 0.24%(-0.175)#75 | 0.30%(-0.230)#1,188 |
| 63. | Mint Hill | 0.060% | 0.24%(-0.182)#76 | 0.30%(-0.237)#1,189 |
| 64. | Wadesboro | 0.060% | 0.24%(-0.183)#77 | 0.30%(-0.238)#1,190 |
| 65. | Kernersville | 0.059% | 0.24%(-0.184)#78 | 0.30%(-0.239)#1,191 |
| 66. | Gastonia | 0.057% | 0.24%(-0.186)#79 | 0.30%(-0.241)#1,192 |
| 67. | Laurinburg | 0.053% | 0.24%(-0.189)#80 | 0.30%(-0.244)#1,193 |
| 68. | Garner | 0.050% | 0.24%(-0.192)#81 | 0.30%(-0.247)#1,194 |
| 69. | Lenoir | 0.049% | 0.24%(-0.193)#82 | 0.30%(-0.248)#1,195 |
| 70. | New Bern | 0.048% | 0.24%(-0.195)#83 | 0.30%(-0.250)#1,196 |
| 71. | Lewisville | 0.044% | 0.24%(-0.198)#84 | 0.30%(-0.253)#1,197 |
| 72. | Asheville | 0.044% | 0.24%(-0.199)#85 | 0.30%(-0.254)#1,198 |
| 73. | Monroe | 0.040% | 0.24%(-0.202)#86 | 0.30%(-0.258)#1,199 |
| 74. | Davidson | 0.039% | 0.24%(-0.203)#87 | 0.30%(-0.258)#1,200 |
| 75. | Jacksonville | 0.026% | 0.24%(-0.216)#88 | 0.30%(-0.271)#1,201 |
| 76. | Wilmington | 0.020% | 0.24%(-0.223)#89 | 0.30%(-0.278)#1,202 |
| 77. | Havelock | 0.018% | 0.24%(-0.225)#90 | 0.30%(-0.280)#1,203 |
| 78. | Holly Springs | 0.017% | 0.24%(-0.226)#91 | 0.30%(-0.281)#1,204 |
| 79. | Hickory | 0.016% | 0.24%(-0.226)#92 | 0.30%(-0.282)#1,205 |
Common Questions
What are the Top 10 Cities with the Highest Percentage of Immigrants from Western Africa in North Carolina?
Top 10 Cities with the Highest Percentage of Immigrants from Western Africa in North Carolina are:
#1
1.69%
#2
1.49%
#3
1.40%
#4
1.34%
#5
1.21%
#6
1.20%
#7
1.15%
#8
1.14%
#9
0.98%
#10
0.83%
What city has the Highest Percentage of Immigrants from Western Africa in North Carolina?
Bath has the Highest Percentage of Immigrants from Western Africa in North Carolina with 1.69%.
What is the Percentage of Immigrants from Western Africa in the State of North Carolina?
Percentage of Immigrants from Western Africa in North Carolina is 0.24%.
What is the Percentage of Immigrants from Western Africa in the United States?
Percentage of Immigrants from Western Africa in the United States is 0.30%.