Ticonderoga, NY Map & Demographics
Ticonderoga Map
Ticonderoga Overview
$31,196
PER CAPITA INCOME
$67,581
AVG FAMILY INCOME
$49,215
AVG HOUSEHOLD INCOME
0.1%
WAGE / INCOME GAP [ % ]
99.9¢/ $1
WAGE / INCOME GAP [ $ ]
0.46
INEQUALITY / GINI INDEX
3,399
TOTAL POPULATION
1,715
MALE POPULATION
1,684
FEMALE POPULATION
101.84
MALES / 100 FEMALES
98.19
FEMALES / 100 MALES
43.3
MEDIAN AGE
3.0
AVG FAMILY SIZE
2.5
AVG HOUSEHOLD SIZE
1,572
LABOR FORCE [ PEOPLE ]
55.5%
PERCENT IN LABOR FORCE
6.7%
UNEMPLOYMENT RATE
Ticonderoga Zip Codes
Ticonderoga Area Codes
Income in Ticonderoga
Income Overview in Ticonderoga
Per Capita Income in Ticonderoga is $31,196, while median incomes of families and households are $67,581 and $49,215 respectively.
| Characteristic | Number | Measure |
| Per Capita Income | 3,399 | $31,196 |
| Median Family Income | 836 | $67,581 |
| Mean Family Income | 836 | $87,452 |
| Median Household Income | 1,339 | $49,215 |
| Mean Household Income | 1,339 | $73,730 |
| Income Deficit | 836 | $0 |
| Wage / Income Gap (%) | 3,399 | 0.09% |
| Wage / Income Gap ($) | 3,399 | 99.91¢ per $1 |
| Gini / Inequality Index | 3,399 | 0.46 |
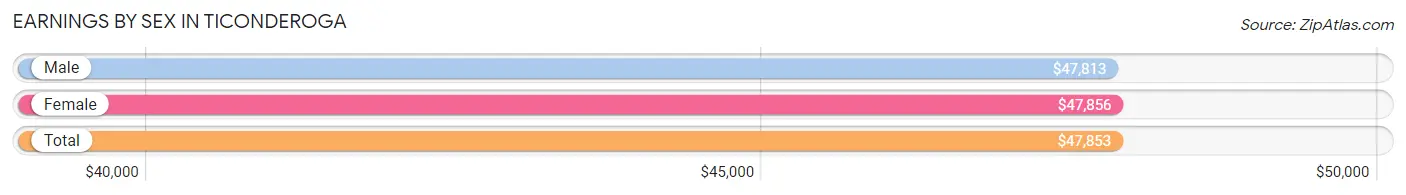
Earnings by Sex in Ticonderoga
Average Earnings in Ticonderoga are $47,853, $47,813 for men and $47,856 for women, a difference of 0.1%.
| Sex | Number | Average Earnings |
| Male | 910 (55.6%) | $47,813 |
| Female | 727 (44.4%) | $47,856 |
| Total | 1,637 (100.0%) | $47,853 |
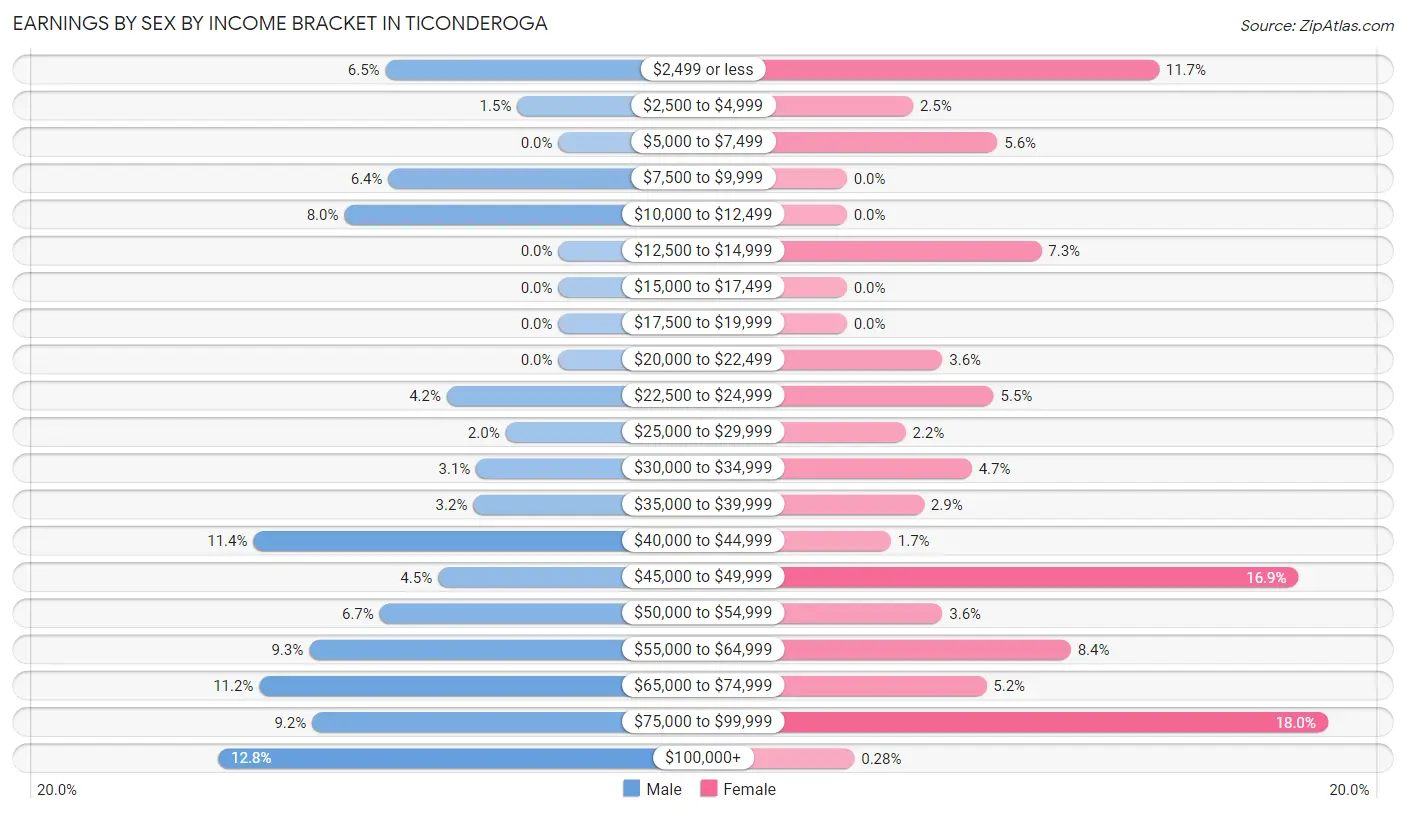
Earnings by Sex by Income Bracket in Ticonderoga
The most common earnings brackets in Ticonderoga are $100,000+ for men (116 | 12.8%) and $75,000 to $99,999 for women (131 | 18.0%).
| Income | Male | Female |
| $2,499 or less | 59 (6.5%) | 85 (11.7%) |
| $2,500 to $4,999 | 14 (1.5%) | 18 (2.5%) |
| $5,000 to $7,499 | 0 (0.0%) | 41 (5.6%) |
| $7,500 to $9,999 | 58 (6.4%) | 0 (0.0%) |
| $10,000 to $12,499 | 73 (8.0%) | 0 (0.0%) |
| $12,500 to $14,999 | 0 (0.0%) | 53 (7.3%) |
| $15,000 to $17,499 | 0 (0.0%) | 0 (0.0%) |
| $17,500 to $19,999 | 0 (0.0%) | 0 (0.0%) |
| $20,000 to $22,499 | 0 (0.0%) | 26 (3.6%) |
| $22,500 to $24,999 | 38 (4.2%) | 40 (5.5%) |
| $25,000 to $29,999 | 18 (2.0%) | 16 (2.2%) |
| $30,000 to $34,999 | 28 (3.1%) | 34 (4.7%) |
| $35,000 to $39,999 | 29 (3.2%) | 21 (2.9%) |
| $40,000 to $44,999 | 104 (11.4%) | 12 (1.7%) |
| $45,000 to $49,999 | 41 (4.5%) | 123 (16.9%) |
| $50,000 to $54,999 | 61 (6.7%) | 26 (3.6%) |
| $55,000 to $64,999 | 85 (9.3%) | 61 (8.4%) |
| $65,000 to $74,999 | 102 (11.2%) | 38 (5.2%) |
| $75,000 to $99,999 | 84 (9.2%) | 131 (18.0%) |
| $100,000+ | 116 (12.8%) | 2 (0.3%) |
| Total | 910 (100.0%) | 727 (100.0%) |
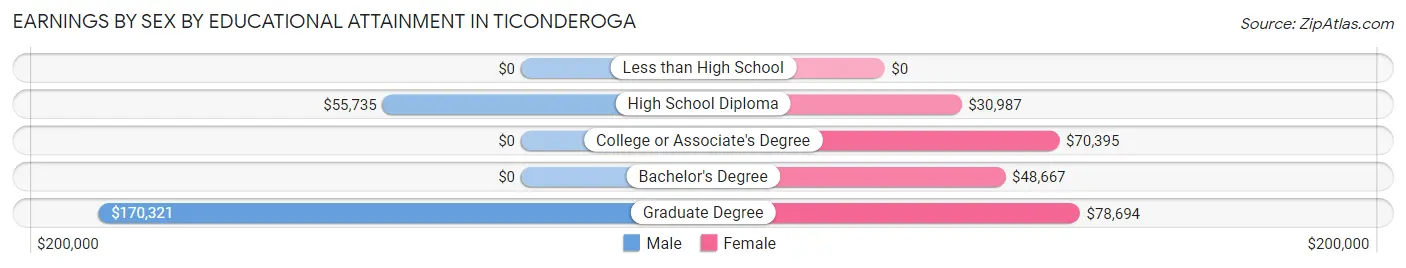
Earnings by Sex by Educational Attainment in Ticonderoga
Average earnings in Ticonderoga are $51,759 for men and $49,014 for women, a difference of 5.3%. Men with an educational attainment of graduate degree enjoy the highest average annual earnings of $170,321, while those with high school diploma education earn the least with $55,735. Women with an educational attainment of graduate degree earn the most with the average annual earnings of $78,694, while those with high school diploma education have the smallest earnings of $30,987.
| Educational Attainment | Male Income | Female Income |
| Less than High School | - | - |
| High School Diploma | $55,735 | $30,987 |
| College or Associate's Degree | - | - |
| Bachelor's Degree | - | - |
| Graduate Degree | $170,321 | $78,694 |
| Total | $51,759 | $49,014 |
Family Income in Ticonderoga
Family Income Brackets in Ticonderoga
According to the Ticonderoga family income data, there are 183 families falling into the $35,000 to $49,999 income range, which is the most common income bracket and makes up 21.9% of all families. Conversely, the less than $10,000 income bracket is the least frequent group with only 38 families (4.5%) belonging to this category.
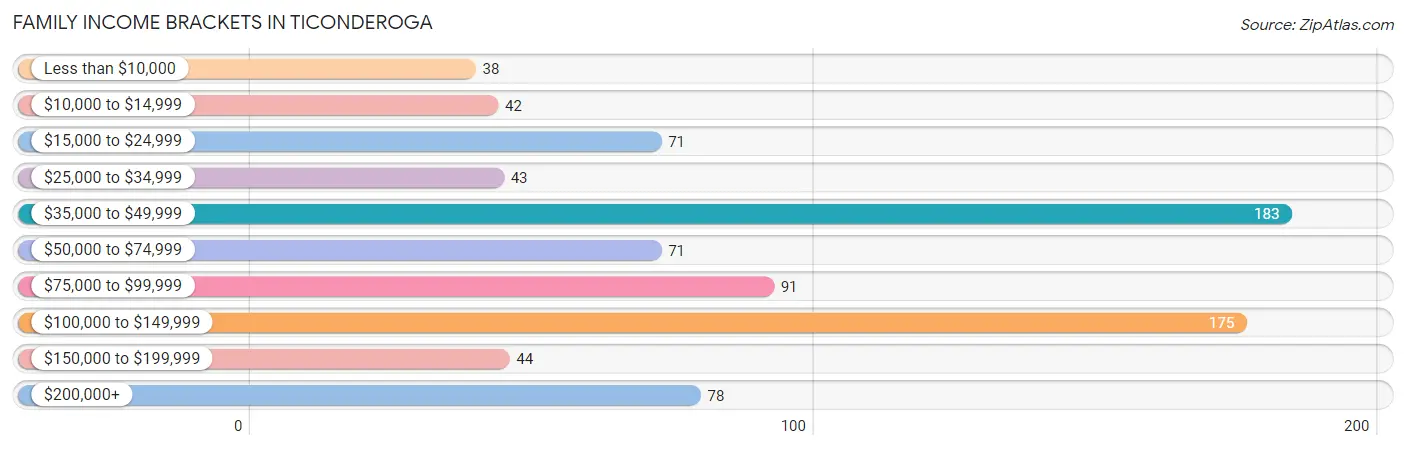
| Income Bracket | # Families | % Families |
| Less than $10,000 | 38 | 4.5% |
| $10,000 to $14,999 | 42 | 5.0% |
| $15,000 to $24,999 | 71 | 8.5% |
| $25,000 to $34,999 | 43 | 5.1% |
| $35,000 to $49,999 | 183 | 21.9% |
| $50,000 to $74,999 | 71 | 8.5% |
| $75,000 to $99,999 | 91 | 10.9% |
| $100,000 to $149,999 | 175 | 20.9% |
| $150,000 to $199,999 | 44 | 5.3% |
| $200,000+ | 78 | 9.3% |
Family Income by Famaliy Size in Ticonderoga
3-person families (308 | 36.8%) account for the highest median family income in Ticonderoga with $121,792 per family, while 3-person families (308 | 36.8%) have the highest median income of $40,597 per family member.
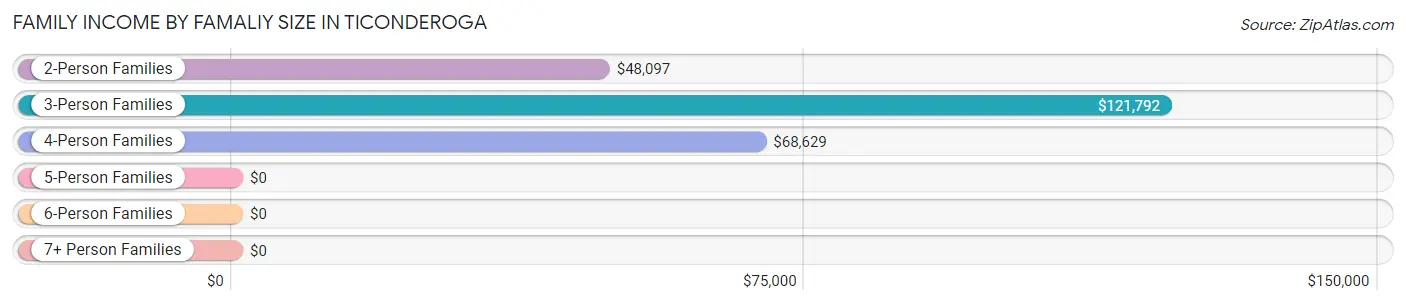
| Income Bracket | # Families | Median Income |
| 2-Person Families | 329 (39.4%) | $48,097 |
| 3-Person Families | 308 (36.8%) | $121,792 |
| 4-Person Families | 144 (17.2%) | $68,629 |
| 5-Person Families | 15 (1.8%) | $0 |
| 6-Person Families | 40 (4.8%) | $0 |
| 7+ Person Families | 0 (0.0%) | $0 |
| Total | 836 (100.0%) | $67,581 |
Family Income by Number of Earners in Ticonderoga
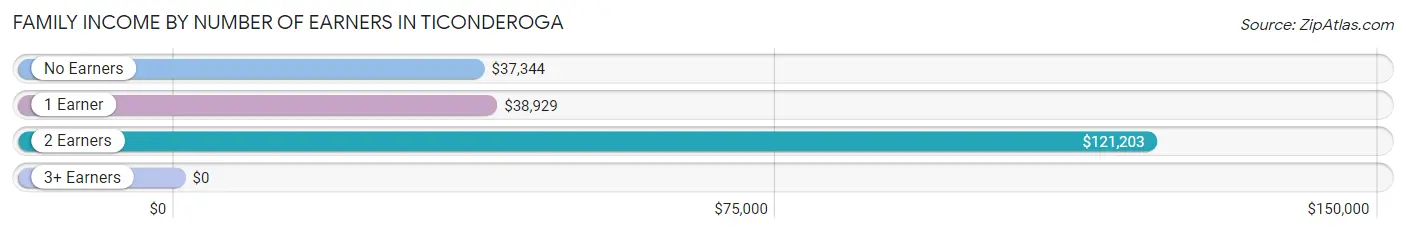
| Number of Earners | # Families | Median Income |
| No Earners | 160 (19.1%) | $37,344 |
| 1 Earner | 296 (35.4%) | $38,929 |
| 2 Earners | 193 (23.1%) | $121,203 |
| 3+ Earners | 187 (22.4%) | $0 |
| Total | 836 (100.0%) | $67,581 |
Household Income in Ticonderoga
Household Income Brackets in Ticonderoga
With 273 households falling in the category, the $35,000 to $49,999 income range is the most frequent in Ticonderoga, accounting for 20.4% of all households. In contrast, only 44 households (3.3%) fall into the $150,000 to $199,999 income bracket, making it the least populous group.
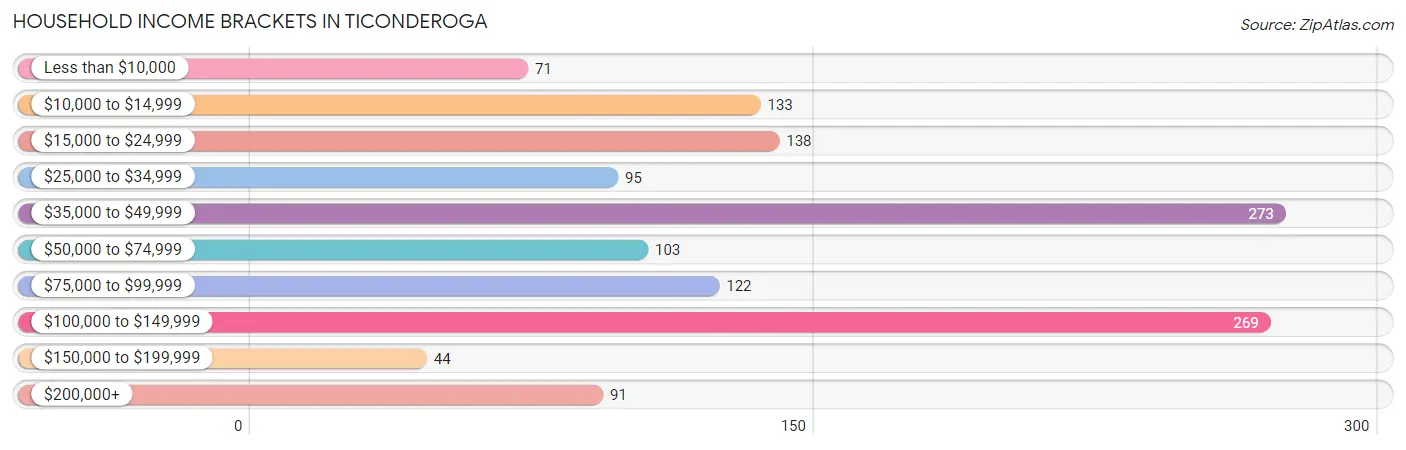
| Income Bracket | # Households | % Households |
| Less than $10,000 | 71 | 5.3% |
| $10,000 to $14,999 | 133 | 9.9% |
| $15,000 to $24,999 | 138 | 10.3% |
| $25,000 to $34,999 | 95 | 7.1% |
| $35,000 to $49,999 | 273 | 20.4% |
| $50,000 to $74,999 | 103 | 7.7% |
| $75,000 to $99,999 | 122 | 9.1% |
| $100,000 to $149,999 | 269 | 20.1% |
| $150,000 to $199,999 | 44 | 3.3% |
| $200,000+ | 91 | 6.8% |
Household Income by Householder Age in Ticonderoga
The median household income in Ticonderoga is $49,215, with the highest median household income of $105,033 found in the 45 to 64 years age bracket for the primary householder. A total of 491 households (36.7%) fall into this category.
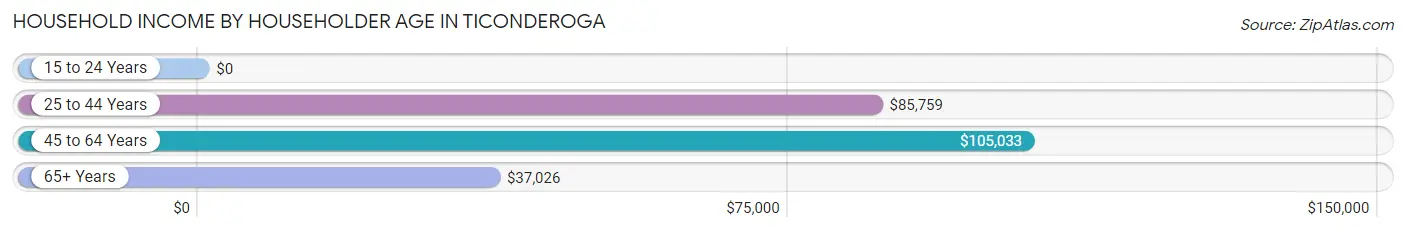
| Income Bracket | # Households | Median Income |
| 15 to 24 Years | 0 (0.0%) | $0 |
| 25 to 44 Years | 267 (19.9%) | $85,759 |
| 45 to 64 Years | 491 (36.7%) | $105,033 |
| 65+ Years | 581 (43.4%) | $37,026 |
| Total | 1,339 (100.0%) | $49,215 |
Poverty in Ticonderoga
Income Below Poverty by Sex and Age in Ticonderoga
With 15.1% poverty level for males and 19.5% for females among the residents of Ticonderoga, 18 to 24 year old males and under 5 year old females are the most vulnerable to poverty, with 34 males (33.0%) and 85 females (59.9%) in their respective age groups living below the poverty level.
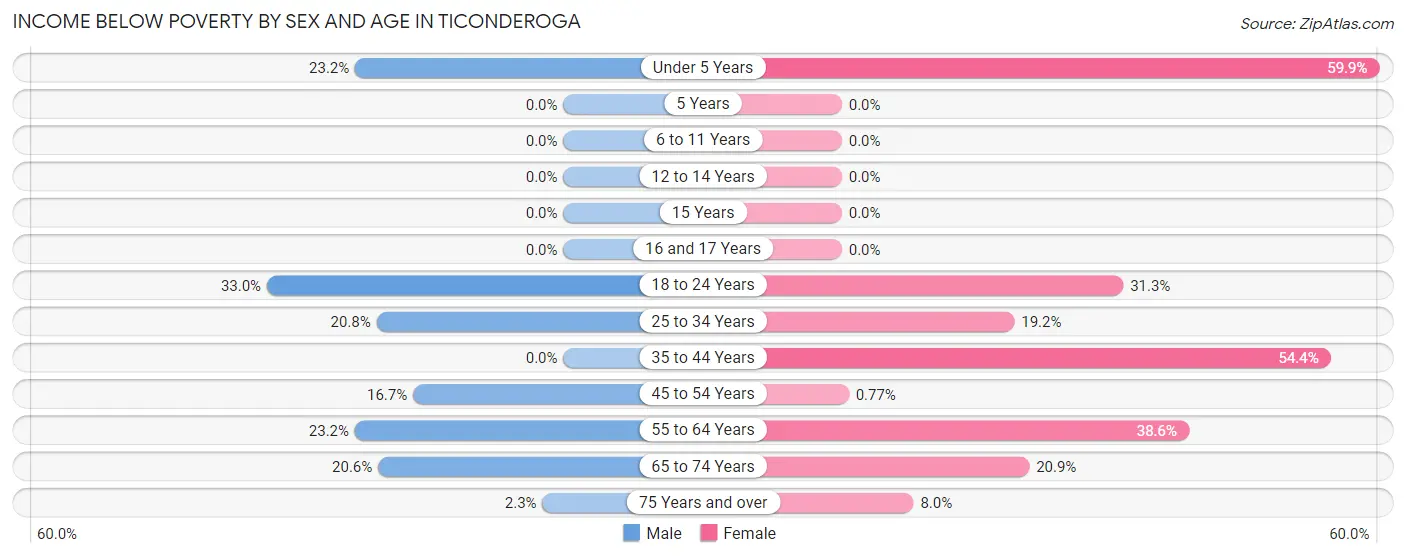
| Age Bracket | Male | Female |
| Under 5 Years | 32 (23.2%) | 85 (59.9%) |
| 5 Years | 0 (0.0%) | 0 (0.0%) |
| 6 to 11 Years | 0 (0.0%) | 0 (0.0%) |
| 12 to 14 Years | 0 (0.0%) | 0 (0.0%) |
| 15 Years | 0 (0.0%) | 0 (0.0%) |
| 16 and 17 Years | 0 (0.0%) | 0 (0.0%) |
| 18 to 24 Years | 34 (33.0%) | 21 (31.3%) |
| 25 to 34 Years | 47 (20.8%) | 58 (19.2%) |
| 35 to 44 Years | 0 (0.0%) | 43 (54.4%) |
| 45 to 54 Years | 39 (16.7%) | 2 (0.8%) |
| 55 to 64 Years | 49 (23.2%) | 51 (38.6%) |
| 65 to 74 Years | 46 (20.6%) | 43 (20.9%) |
| 75 Years and over | 3 (2.3%) | 15 (8.0%) |
| Total | 250 (15.1%) | 318 (19.5%) |
Income Above Poverty by Sex and Age in Ticonderoga
According to the poverty statistics in Ticonderoga, males aged 6 to 11 years and females aged 5 years are the age groups that are most secure financially, with 100.0% of males and 100.0% of females in these age groups living above the poverty line.
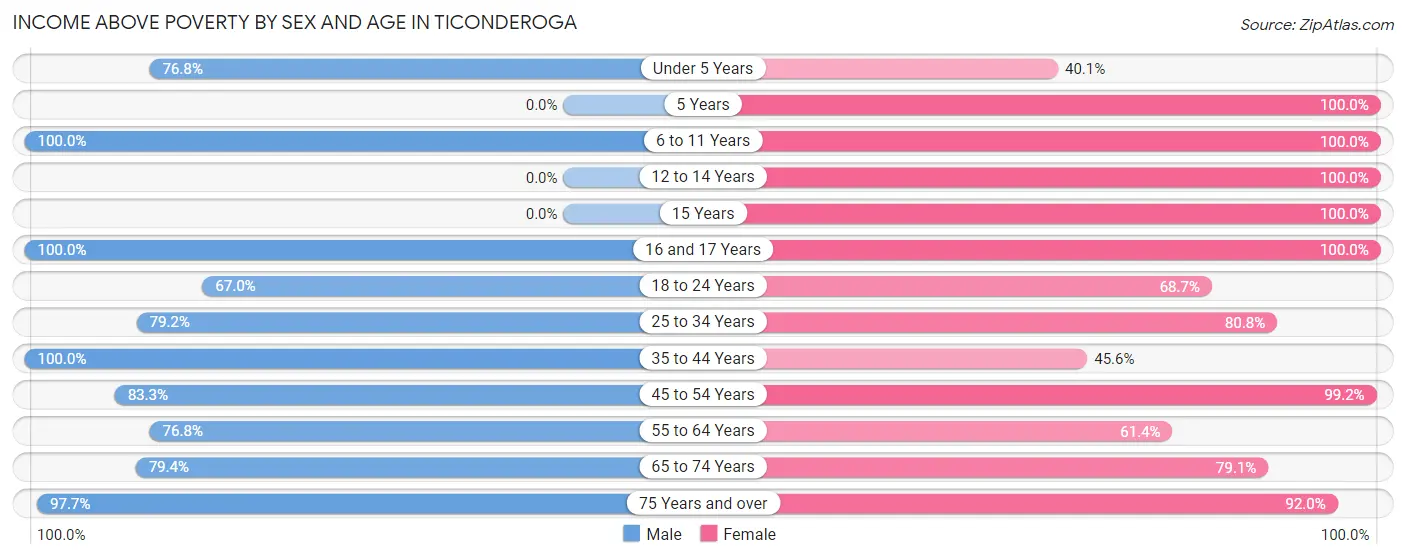
| Age Bracket | Male | Female |
| Under 5 Years | 106 (76.8%) | 57 (40.1%) |
| 5 Years | 0 (0.0%) | 28 (100.0%) |
| 6 to 11 Years | 28 (100.0%) | 62 (100.0%) |
| 12 to 14 Years | 0 (0.0%) | 73 (100.0%) |
| 15 Years | 0 (0.0%) | 46 (100.0%) |
| 16 and 17 Years | 96 (100.0%) | 47 (100.0%) |
| 18 to 24 Years | 69 (67.0%) | 46 (68.7%) |
| 25 to 34 Years | 179 (79.2%) | 244 (80.8%) |
| 35 to 44 Years | 265 (100.0%) | 36 (45.6%) |
| 45 to 54 Years | 194 (83.3%) | 259 (99.2%) |
| 55 to 64 Years | 162 (76.8%) | 81 (61.4%) |
| 65 to 74 Years | 177 (79.4%) | 163 (79.1%) |
| 75 Years and over | 126 (97.7%) | 173 (92.0%) |
| Total | 1,402 (84.9%) | 1,315 (80.5%) |
Income Below Poverty Among Married-Couple Families in Ticonderoga
The poverty statistics for married-couple families in Ticonderoga show that 16.8% or 91 of the total 543 families live below the poverty line. Families with 1 or 2 children have the highest poverty rate of 19.6%, comprising of 60 families. On the other hand, families with 3 or 4 children have the lowest poverty rate of 0.0%, which includes 0 families.
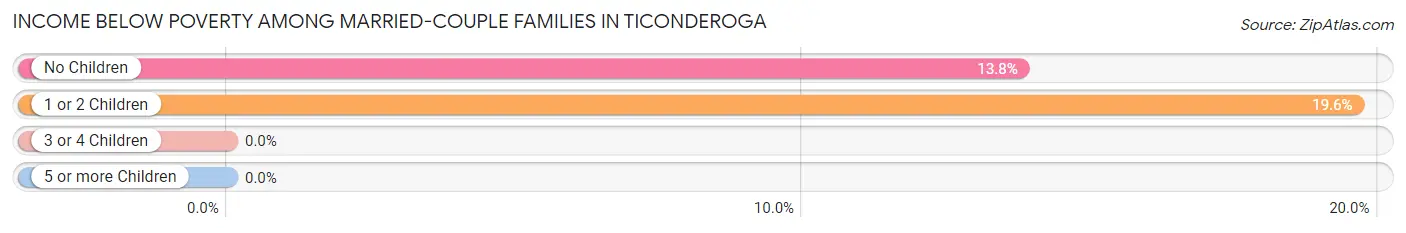
| Children | Above Poverty | Below Poverty |
| No Children | 194 (86.2%) | 31 (13.8%) |
| 1 or 2 Children | 246 (80.4%) | 60 (19.6%) |
| 3 or 4 Children | 12 (100.0%) | 0 (0.0%) |
| 5 or more Children | 0 (0.0%) | 0 (0.0%) |
| Total | 452 (83.2%) | 91 (16.8%) |
Income Below Poverty Among Single-Parent Households in Ticonderoga
According to the poverty data in Ticonderoga, 15.2% or 18 single-father households and 1.1% or 2 single-mother households are living below the poverty line. Among single-father households, those with 1 or 2 children have the highest poverty rate, with 18 households (18.0%) experiencing poverty. Likewise, among single-mother households, those with no children have the highest poverty rate, with 2 households (4.1%) falling below the poverty line.
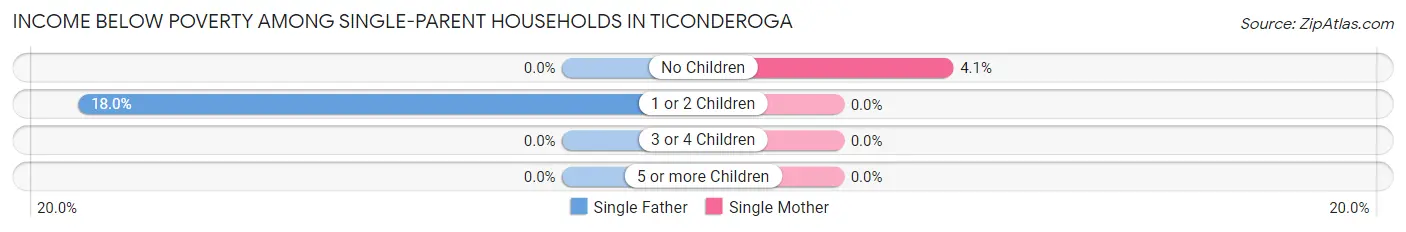
| Children | Single Father | Single Mother |
| No Children | 0 (0.0%) | 2 (4.1%) |
| 1 or 2 Children | 18 (18.0%) | 0 (0.0%) |
| 3 or 4 Children | 0 (0.0%) | 0 (0.0%) |
| 5 or more Children | 0 (0.0%) | 0 (0.0%) |
| Total | 18 (15.2%) | 2 (1.1%) |
Income Below Poverty Among Married-Couple vs Single-Parent Households in Ticonderoga
The poverty data for Ticonderoga shows that 91 of the married-couple family households (16.8%) and 20 of the single-parent households (6.8%) are living below the poverty level. Within the married-couple family households, those with 1 or 2 children have the highest poverty rate, with 60 households (19.6%) falling below the poverty line. Among the single-parent households, those with 1 or 2 children have the highest poverty rate, with 18 household (8.0%) living below poverty.
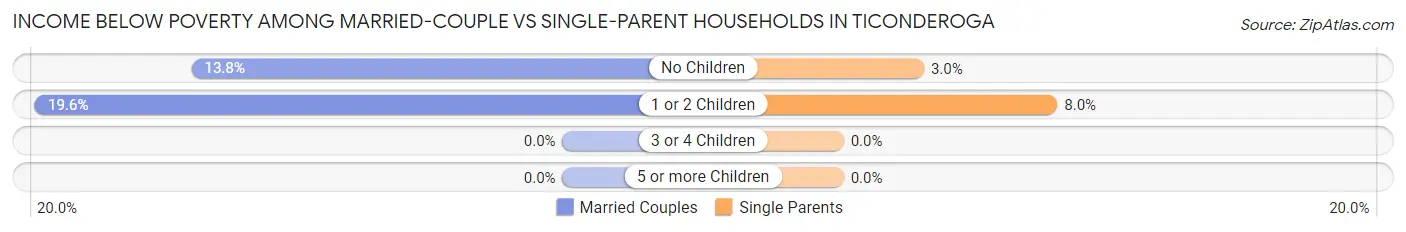
| Children | Married-Couple Families | Single-Parent Households |
| No Children | 31 (13.8%) | 2 (3.0%) |
| 1 or 2 Children | 60 (19.6%) | 18 (8.0%) |
| 3 or 4 Children | 0 (0.0%) | 0 (0.0%) |
| 5 or more Children | 0 (0.0%) | 0 (0.0%) |
| Total | 91 (16.8%) | 20 (6.8%) |
Race in Ticonderoga
The most populous races in Ticonderoga are White / Caucasian (3,351 | 98.6%), Two or more Races (38 | 1.1%), and Hispanic or Latino (10 | 0.3%).
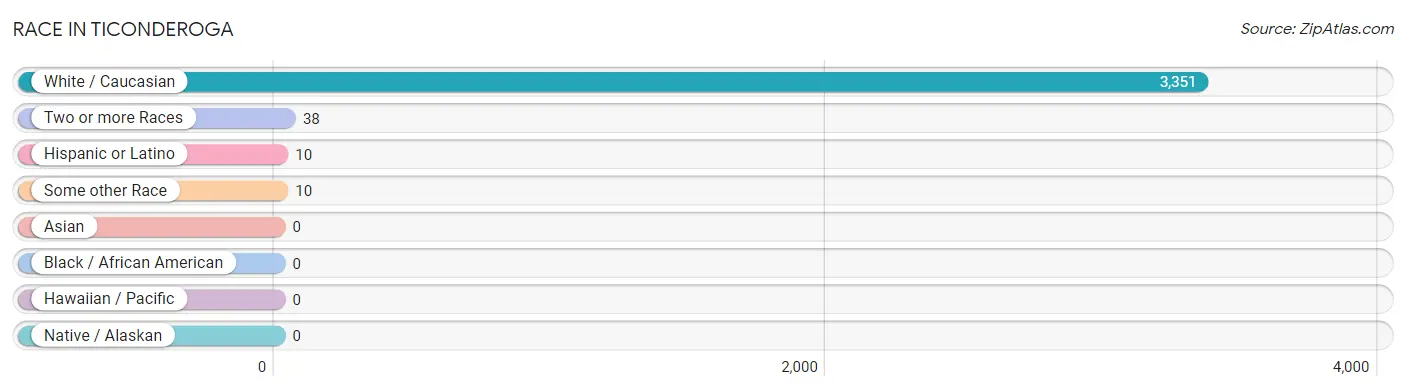
| Race | # Population | % Population |
| Asian | 0 | 0.0% |
| Black / African American | 0 | 0.0% |
| Hawaiian / Pacific | 0 | 0.0% |
| Hispanic or Latino | 10 | 0.3% |
| Native / Alaskan | 0 | 0.0% |
| White / Caucasian | 3,351 | 98.6% |
| Two or more Races | 38 | 1.1% |
| Some other Race | 10 | 0.3% |
| Total | 3,399 | 100.0% |
Ancestry in Ticonderoga
The most populous ancestries reported in Ticonderoga are French (619 | 18.2%), English (588 | 17.3%), Irish (524 | 15.4%), American (509 | 15.0%), and German (328 | 9.7%), together accounting for 75.6% of all Ticonderoga residents.
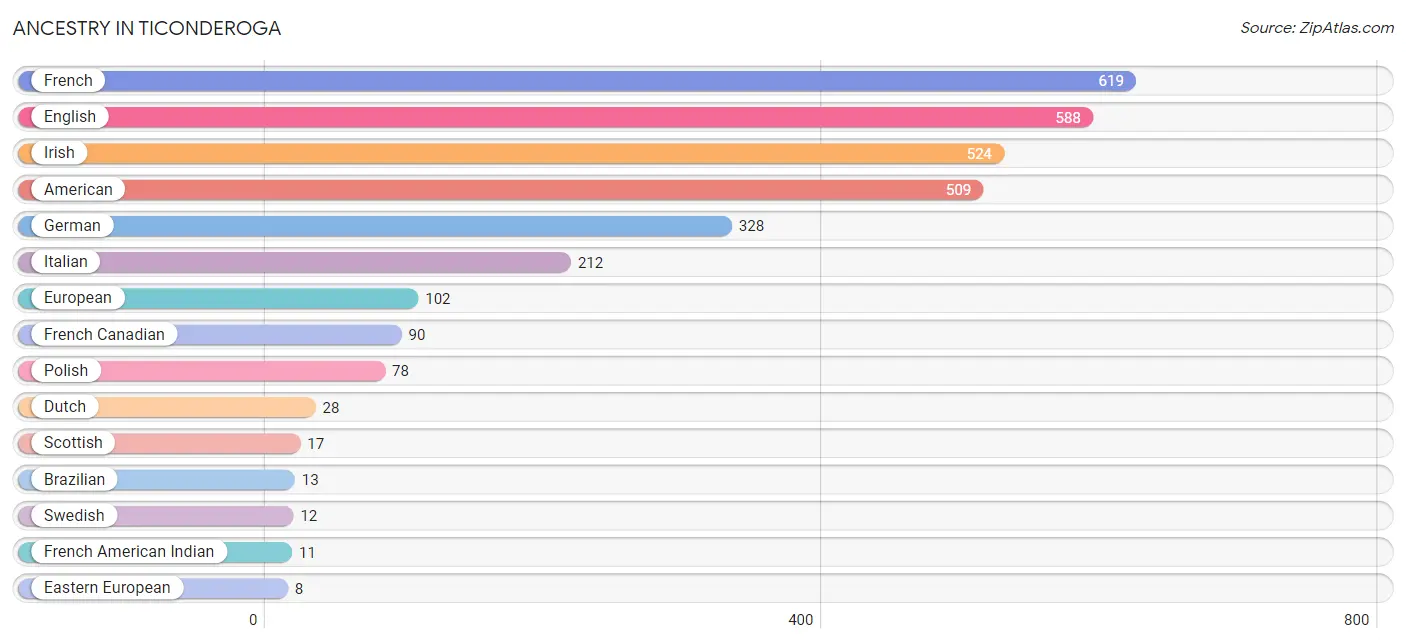
| Ancestry | # Population | % Population |
| American | 509 | 15.0% |
| Brazilian | 13 | 0.4% |
| Danish | 1 | 0.0% |
| Dutch | 28 | 0.8% |
| Eastern European | 8 | 0.2% |
| English | 588 | 17.3% |
| European | 102 | 3.0% |
| French | 619 | 18.2% |
| French American Indian | 11 | 0.3% |
| French Canadian | 90 | 2.6% |
| German | 328 | 9.7% |
| Irish | 524 | 15.4% |
| Italian | 212 | 6.2% |
| Lithuanian | 3 | 0.1% |
| Polish | 78 | 2.3% |
| Puerto Rican | 3 | 0.1% |
| Scottish | 17 | 0.5% |
| Swedish | 12 | 0.4% | View All 18 Rows |
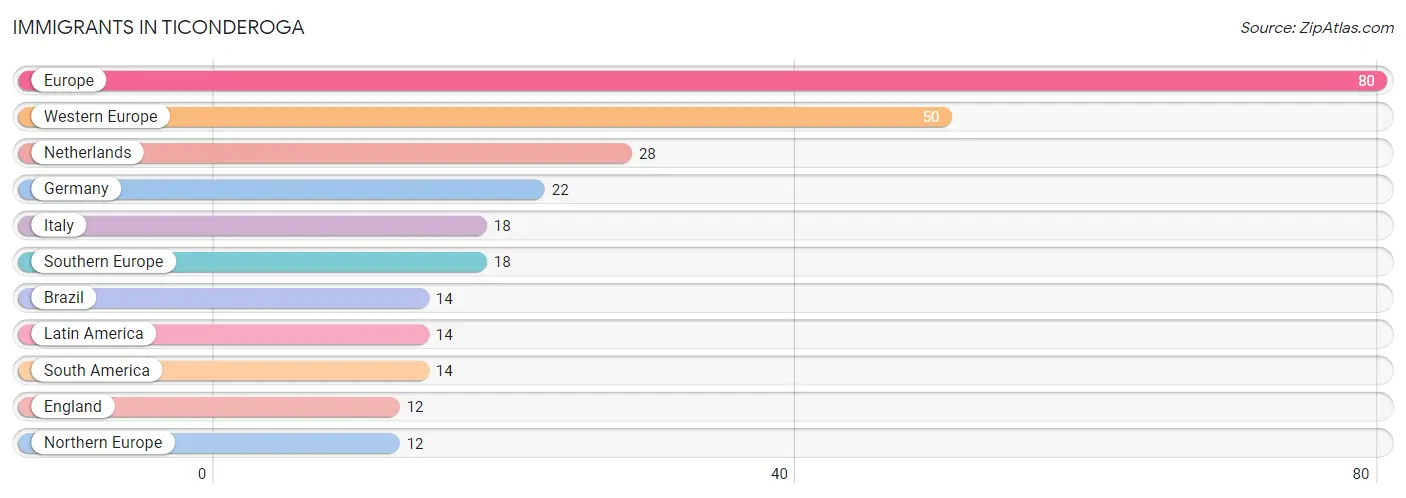
Immigrants in Ticonderoga
The most numerous immigrant groups reported in Ticonderoga came from Europe (80 | 2.4%), Western Europe (50 | 1.5%), Netherlands (28 | 0.8%), Germany (22 | 0.6%), and Italy (18 | 0.5%), together accounting for 5.8% of all Ticonderoga residents.
| Immigration Origin | # Population | % Population |
| Brazil | 14 | 0.4% |
| England | 12 | 0.4% |
| Europe | 80 | 2.4% |
| Germany | 22 | 0.6% |
| Italy | 18 | 0.5% |
| Latin America | 14 | 0.4% |
| Netherlands | 28 | 0.8% |
| Northern Europe | 12 | 0.4% |
| South America | 14 | 0.4% |
| Southern Europe | 18 | 0.5% |
| Western Europe | 50 | 1.5% | View All 11 Rows |
Sex and Age in Ticonderoga
Sex and Age in Ticonderoga
The most populous age groups in Ticonderoga are Under 5 Years (187 | 10.9%) for men and 45 to 49 Years (243 | 14.4%) for women.
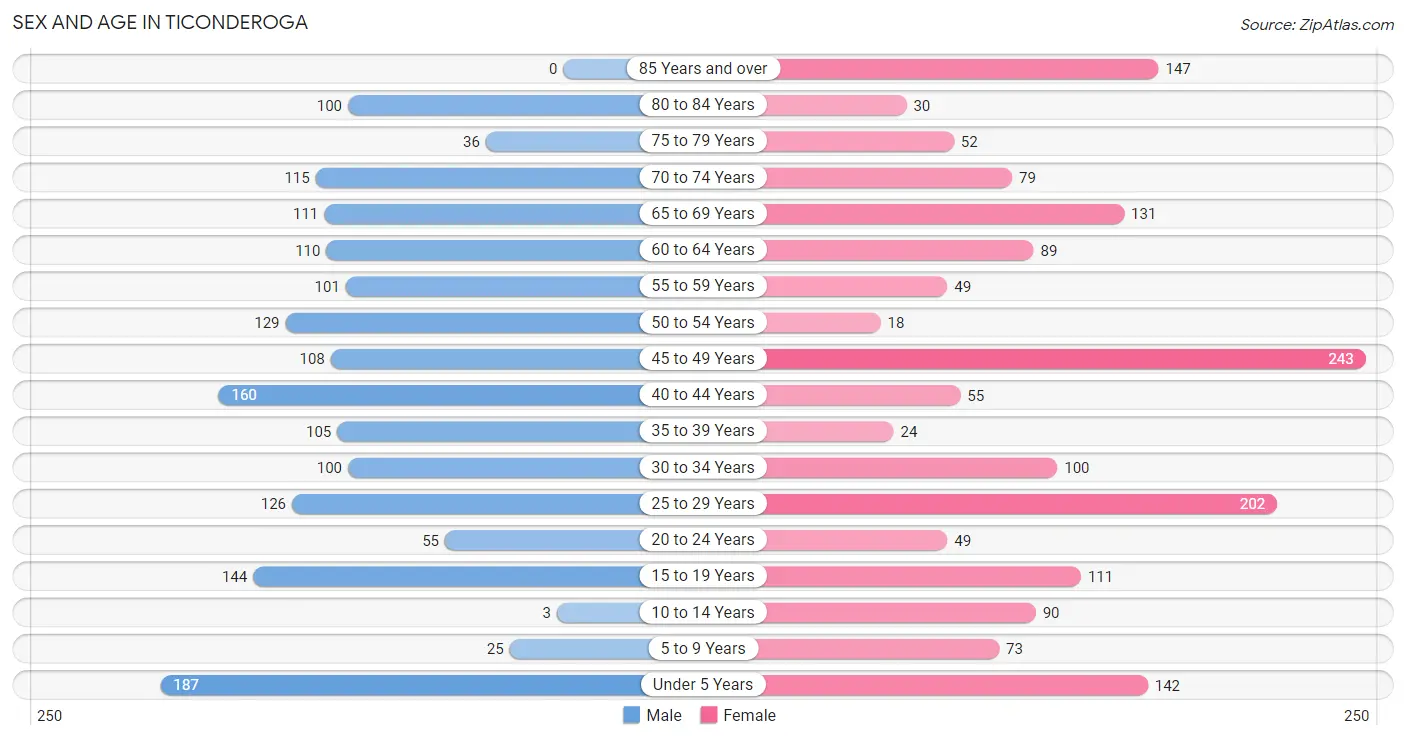
| Age Bracket | Male | Female |
| Under 5 Years | 187 (10.9%) | 142 (8.4%) |
| 5 to 9 Years | 25 (1.5%) | 73 (4.3%) |
| 10 to 14 Years | 3 (0.2%) | 90 (5.3%) |
| 15 to 19 Years | 144 (8.4%) | 111 (6.6%) |
| 20 to 24 Years | 55 (3.2%) | 49 (2.9%) |
| 25 to 29 Years | 126 (7.3%) | 202 (12.0%) |
| 30 to 34 Years | 100 (5.8%) | 100 (5.9%) |
| 35 to 39 Years | 105 (6.1%) | 24 (1.4%) |
| 40 to 44 Years | 160 (9.3%) | 55 (3.3%) |
| 45 to 49 Years | 108 (6.3%) | 243 (14.4%) |
| 50 to 54 Years | 129 (7.5%) | 18 (1.1%) |
| 55 to 59 Years | 101 (5.9%) | 49 (2.9%) |
| 60 to 64 Years | 110 (6.4%) | 89 (5.3%) |
| 65 to 69 Years | 111 (6.5%) | 131 (7.8%) |
| 70 to 74 Years | 115 (6.7%) | 79 (4.7%) |
| 75 to 79 Years | 36 (2.1%) | 52 (3.1%) |
| 80 to 84 Years | 100 (5.8%) | 30 (1.8%) |
| 85 Years and over | 0 (0.0%) | 147 (8.7%) |
| Total | 1,715 (100.0%) | 1,684 (100.0%) |
Families and Households in Ticonderoga
Median Family Size in Ticonderoga
The median family size in Ticonderoga is 3.01 persons per family, with single male/father families (118 | 14.1%) accounting for the largest median family size of 3.91 persons per family. On the other hand, single female/mother families (175 | 20.9%) represent the smallest median family size with 2.73 persons per family.
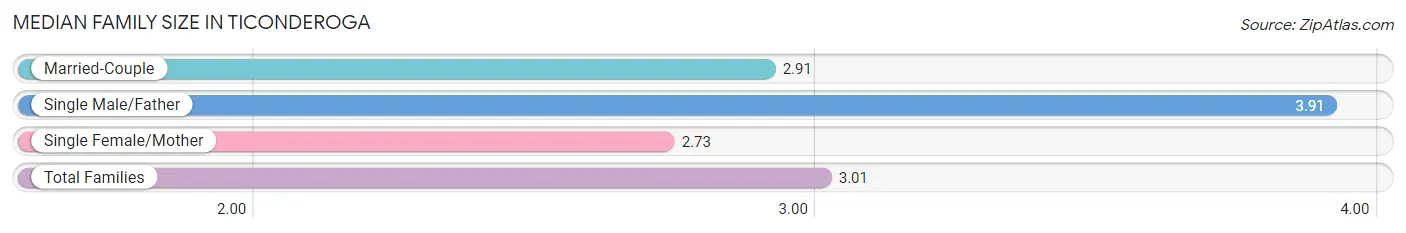
| Family Type | # Families | Family Size |
| Married-Couple | 543 (64.9%) | 2.91 |
| Single Male/Father | 118 (14.1%) | 3.91 |
| Single Female/Mother | 175 (20.9%) | 2.73 |
| Total Families | 836 (100.0%) | 3.01 |
Median Household Size in Ticonderoga
The median household size in Ticonderoga is 2.47 persons per household, with single male/father households (118 | 8.8%) accounting for the largest median household size of 4.73 persons per household. non-family households (503 | 37.6%) represent the smallest median household size with 1.16 persons per household.
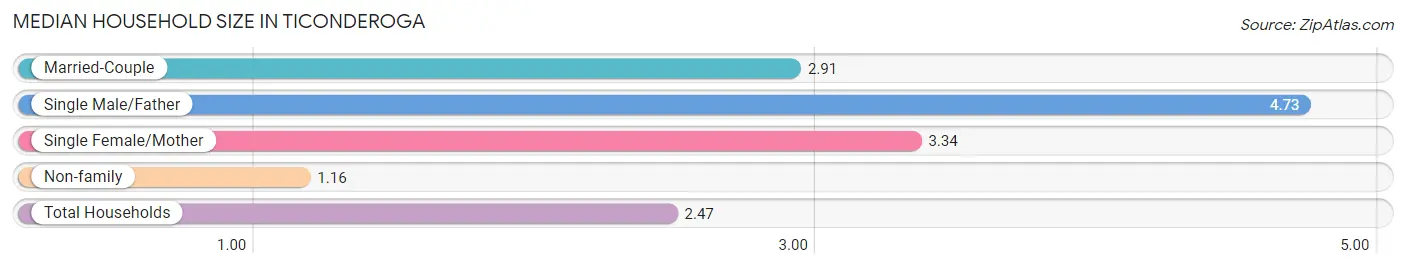
| Household Type | # Households | Household Size |
| Married-Couple | 543 (40.6%) | 2.91 |
| Single Male/Father | 118 (8.8%) | 4.73 |
| Single Female/Mother | 175 (13.1%) | 3.34 |
| Non-family | 503 (37.6%) | 1.16 |
| Total Households | 1,339 (100.0%) | 2.47 |
Household Size by Marriage Status in Ticonderoga
Out of a total of 1,339 households in Ticonderoga, 836 (62.4%) are family households, while 503 (37.6%) are nonfamily households. The most numerous type of family households are 3-person households, comprising 320, and the most common type of nonfamily households are 1-person households, comprising 448.
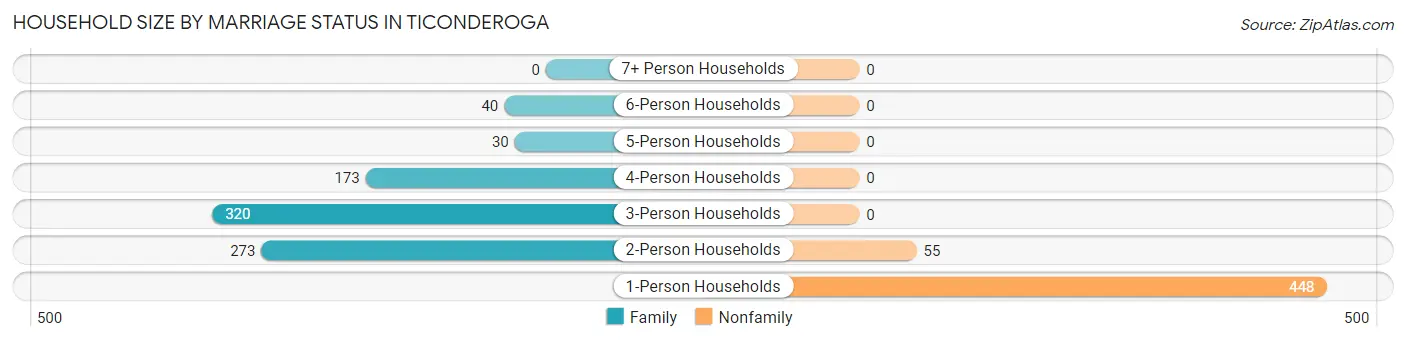
| Household Size | Family Households | Nonfamily Households |
| 1-Person Households | - | 448 (33.5%) |
| 2-Person Households | 273 (20.4%) | 55 (4.1%) |
| 3-Person Households | 320 (23.9%) | 0 (0.0%) |
| 4-Person Households | 173 (12.9%) | 0 (0.0%) |
| 5-Person Households | 30 (2.2%) | 0 (0.0%) |
| 6-Person Households | 40 (3.0%) | 0 (0.0%) |
| 7+ Person Households | 0 (0.0%) | 0 (0.0%) |
| Total | 836 (62.4%) | 503 (37.6%) |
Female Fertility in Ticonderoga
Fertility by Age in Ticonderoga
Average fertility rate in Ticonderoga is 105.0 births per 1,000 women. Women in the age bracket of 20 to 34 years have the highest fertility rate with 208.0 births per 1,000 women. Women in the age bracket of 20 to 34 years acount for 89.0% of all women with births.
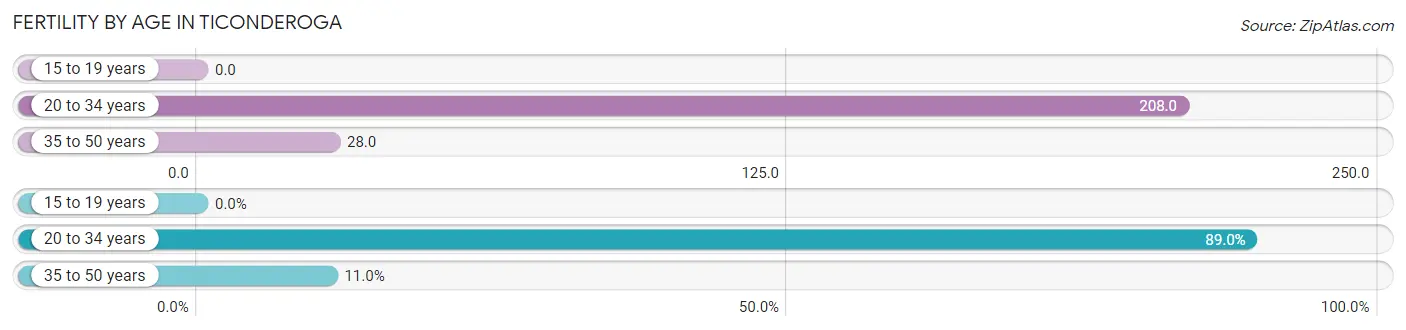
| Age Bracket | Women with Births | Births / 1,000 Women |
| 15 to 19 years | 0 (0.0%) | 0.0 |
| 20 to 34 years | 73 (89.0%) | 208.0 |
| 35 to 50 years | 9 (11.0%) | 28.0 |
| Total | 82 (100.0%) | 105.0 |
Fertility by Age by Marriage Status in Ticonderoga
48.8% of women with births (82) in Ticonderoga are married. The highest percentage of unmarried women with births falls into 35 to 50 years age bracket with 100.0% of them unmarried at the time of birth, while the lowest percentage of unmarried women with births belong to 20 to 34 years age bracket with 45.2% of them unmarried.
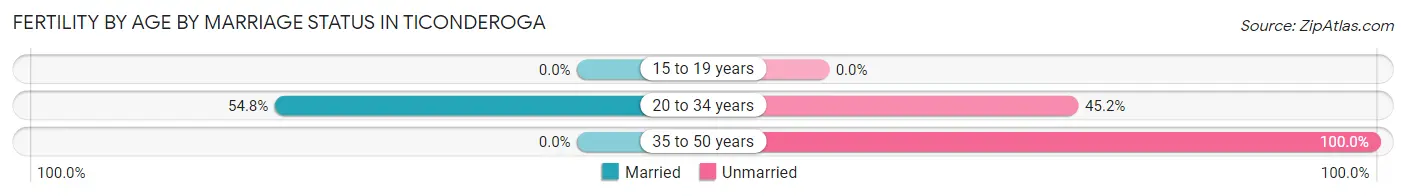
| Age Bracket | Married | Unmarried |
| 15 to 19 years | 0 (0.0%) | 0 (0.0%) |
| 20 to 34 years | 40 (54.8%) | 33 (45.2%) |
| 35 to 50 years | 0 (0.0%) | 9 (100.0%) |
| Total | 40 (48.8%) | 42 (51.2%) |
Fertility by Education in Ticonderoga
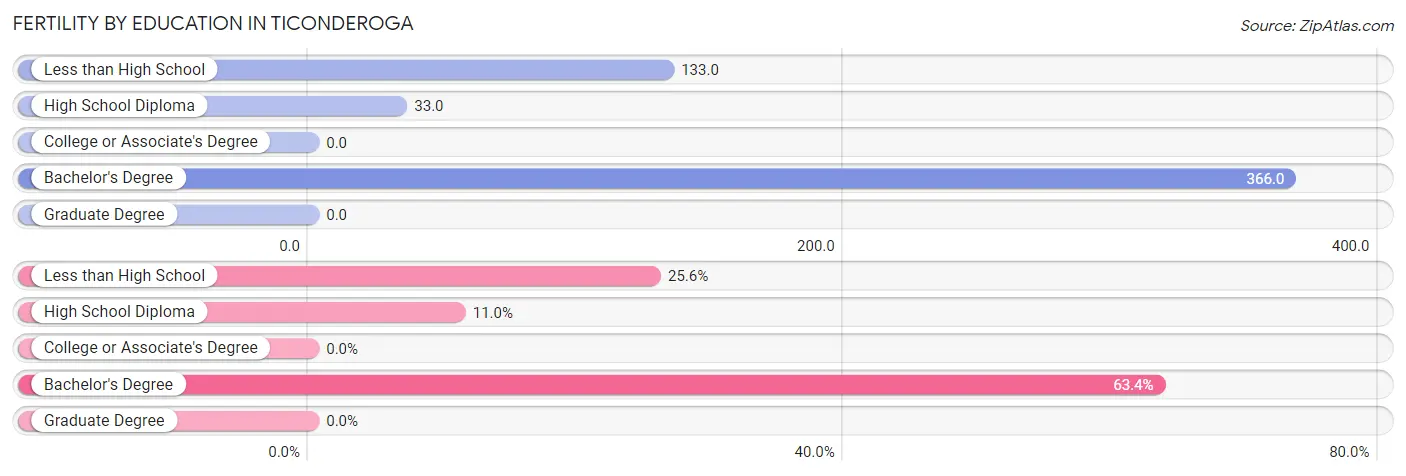
| Educational Attainment | Women with Births | Births / 1,000 Women |
| Less than High School | 21 (25.6%) | 133.0 |
| High School Diploma | 9 (11.0%) | 33.0 |
| College or Associate's Degree | 0 (0.0%) | 0.0 |
| Bachelor's Degree | 52 (63.4%) | 366.0 |
| Graduate Degree | 0 (0.0%) | 0.0 |
| Total | 82 (100.0%) | 105.0 |
Fertility by Education by Marriage Status in Ticonderoga
51.2% of women with births in Ticonderoga are unmarried. Women with the educational attainment of bachelor's degree are most likely to be married with 76.9% of them married at childbirth, while women with the educational attainment of less than high school are least likely to be married with 100.0% of them unmarried at childbirth.
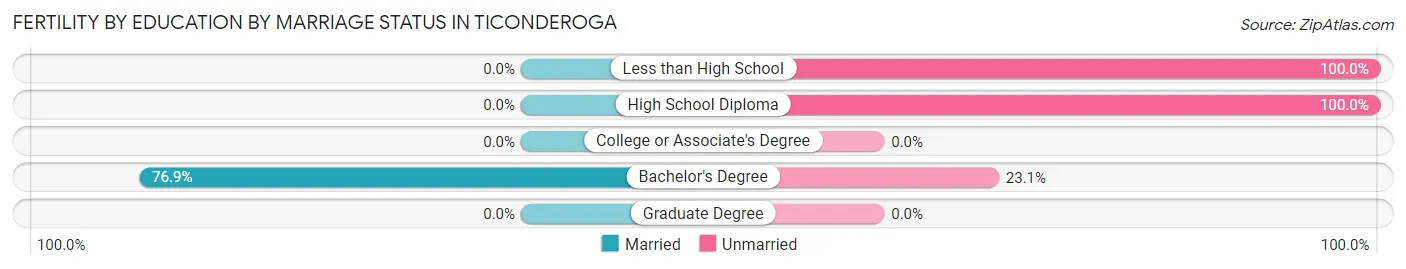
| Educational Attainment | Married | Unmarried |
| Less than High School | 0 (0.0%) | 21 (100.0%) |
| High School Diploma | 0 (0.0%) | 9 (100.0%) |
| College or Associate's Degree | 0 (0.0%) | 0 (0.0%) |
| Bachelor's Degree | 40 (76.9%) | 12 (23.1%) |
| Graduate Degree | 0 (0.0%) | 0 (0.0%) |
| Total | 40 (48.8%) | 42 (51.2%) |
Employment Characteristics in Ticonderoga
Employment by Class of Employer in Ticonderoga
Among the 1,454 employed individuals in Ticonderoga, private company employees (811 | 55.8%), not-for-profit organizations (253 | 17.4%), and local government employees (156 | 10.7%) make up the most common classes of employment.
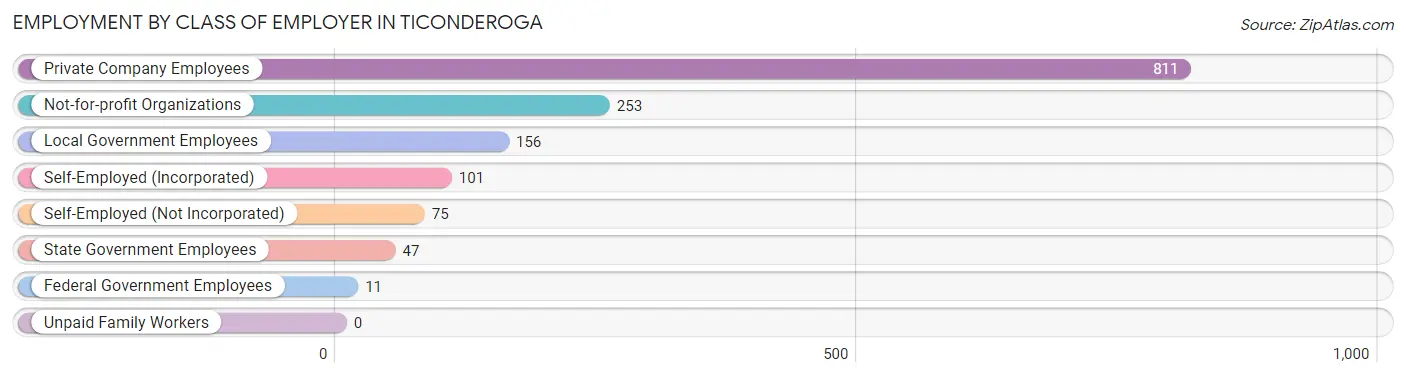
| Employer Class | # Employees | % Employees |
| Private Company Employees | 811 | 55.8% |
| Self-Employed (Incorporated) | 101 | 7.0% |
| Self-Employed (Not Incorporated) | 75 | 5.2% |
| Not-for-profit Organizations | 253 | 17.4% |
| Local Government Employees | 156 | 10.7% |
| State Government Employees | 47 | 3.2% |
| Federal Government Employees | 11 | 0.8% |
| Unpaid Family Workers | 0 | 0.0% |
| Total | 1,454 | 100.0% |
Employment Status by Age in Ticonderoga
According to the labor force statistics for Ticonderoga, out of the total population over 16 years of age (2,833), 55.5% or 1,572 individuals are in the labor force, with 6.7% or 105 of them unemployed. The age group with the highest labor force participation rate is 45 to 54 years, with 98.6% or 491 individuals in the labor force. Within the labor force, the 45 to 54 years age range has the highest percentage of unemployed individuals, with 11.4% or 56 of them being unemployed.
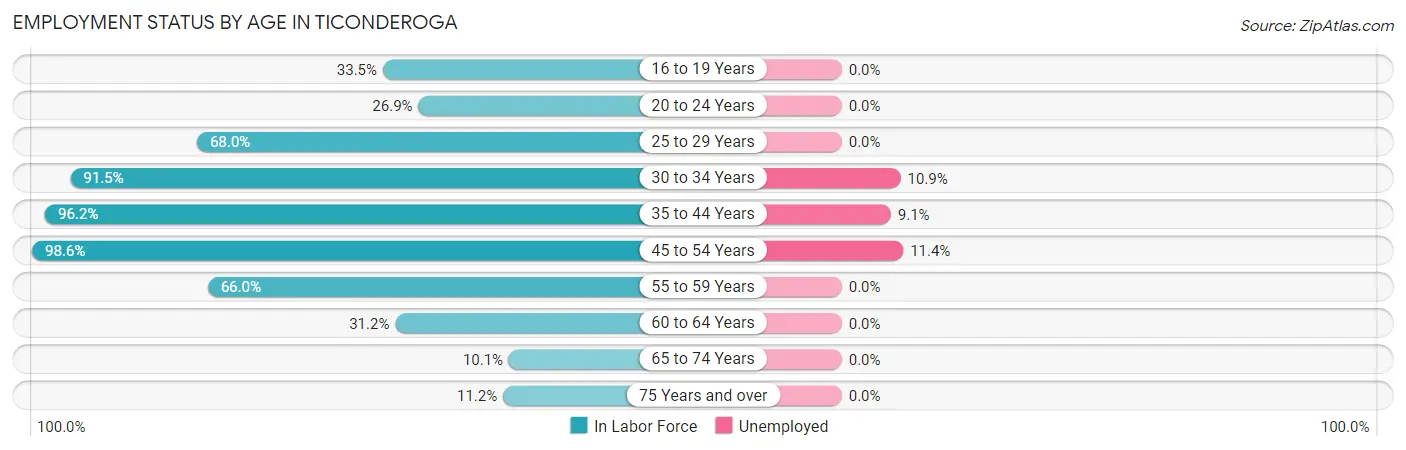
| Age Bracket | In Labor Force | Unemployed |
| 16 to 19 Years | 70 (33.5%) | 0 (0.0%) |
| 20 to 24 Years | 28 (26.9%) | 0 (0.0%) |
| 25 to 29 Years | 223 (68.0%) | 0 (0.0%) |
| 30 to 34 Years | 183 (91.5%) | 20 (10.9%) |
| 35 to 44 Years | 331 (96.2%) | 30 (9.1%) |
| 45 to 54 Years | 491 (98.6%) | 56 (11.4%) |
| 55 to 59 Years | 99 (66.0%) | 0 (0.0%) |
| 60 to 64 Years | 62 (31.2%) | 0 (0.0%) |
| 65 to 74 Years | 44 (10.1%) | 0 (0.0%) |
| 75 Years and over | 41 (11.2%) | 0 (0.0%) |
| Total | 1,572 (55.5%) | 105 (6.7%) |
Employment Status by Educational Attainment in Ticonderoga
According to labor force statistics for Ticonderoga, 80.8% of individuals (1,389) out of the total population between 25 and 64 years of age (1,719) are in the labor force, with 7.6% or 106 of them being unemployed. The group with the highest labor force participation rate are those with the educational attainment of college / associate degree, with 87.9% or 311 individuals in the labor force. Within the labor force, individuals with college / associate degree education have the highest percentage of unemployment, with 19.0% or 59 of them being unemployed.
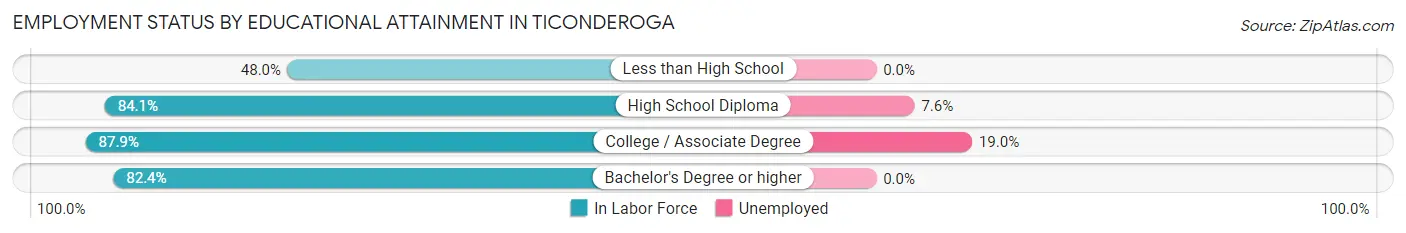
| Educational Attainment | In Labor Force | Unemployed |
| Less than High School | 83 (48.0%) | 0 (0.0%) |
| High School Diploma | 615 (84.1%) | 56 (7.6%) |
| College / Associate Degree | 311 (87.9%) | 67 (19.0%) |
| Bachelor's Degree or higher | 380 (82.4%) | 0 (0.0%) |
| Total | 1,389 (80.8%) | 131 (7.6%) |
Employment Occupations by Sex in Ticonderoga
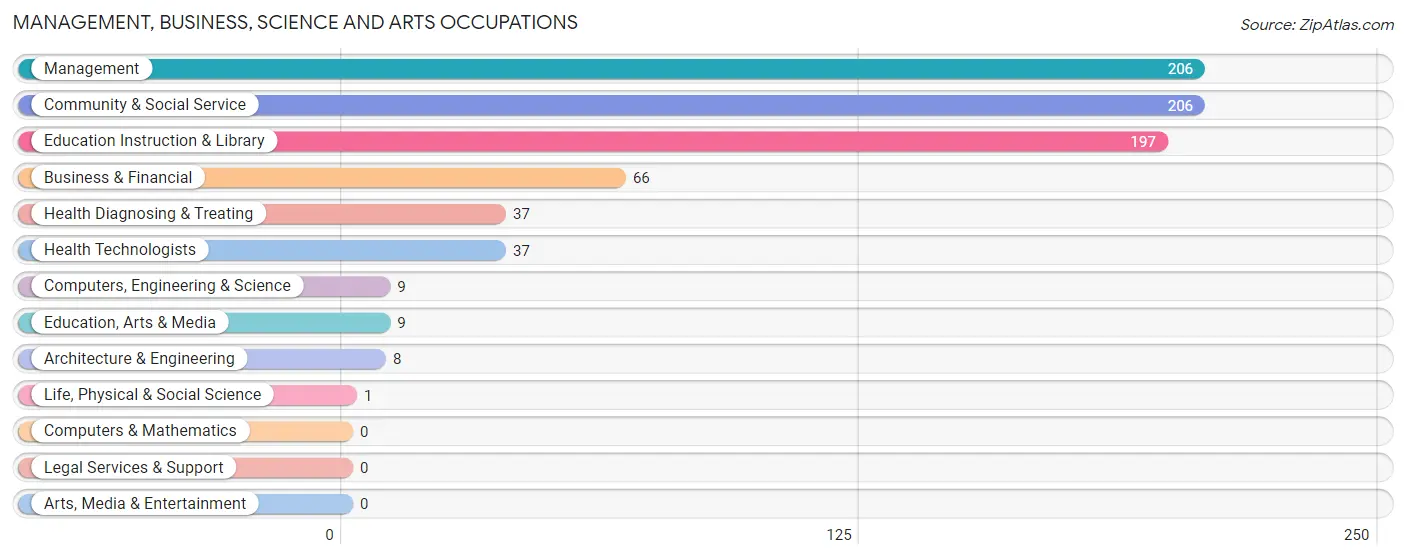
Management, Business, Science and Arts Occupations
The most common Management, Business, Science and Arts occupations in Ticonderoga are Management (206 | 14.1%), Community & Social Service (206 | 14.1%), Education Instruction & Library (197 | 13.4%), Business & Financial (66 | 4.5%), and Health Diagnosing & Treating (37 | 2.5%).
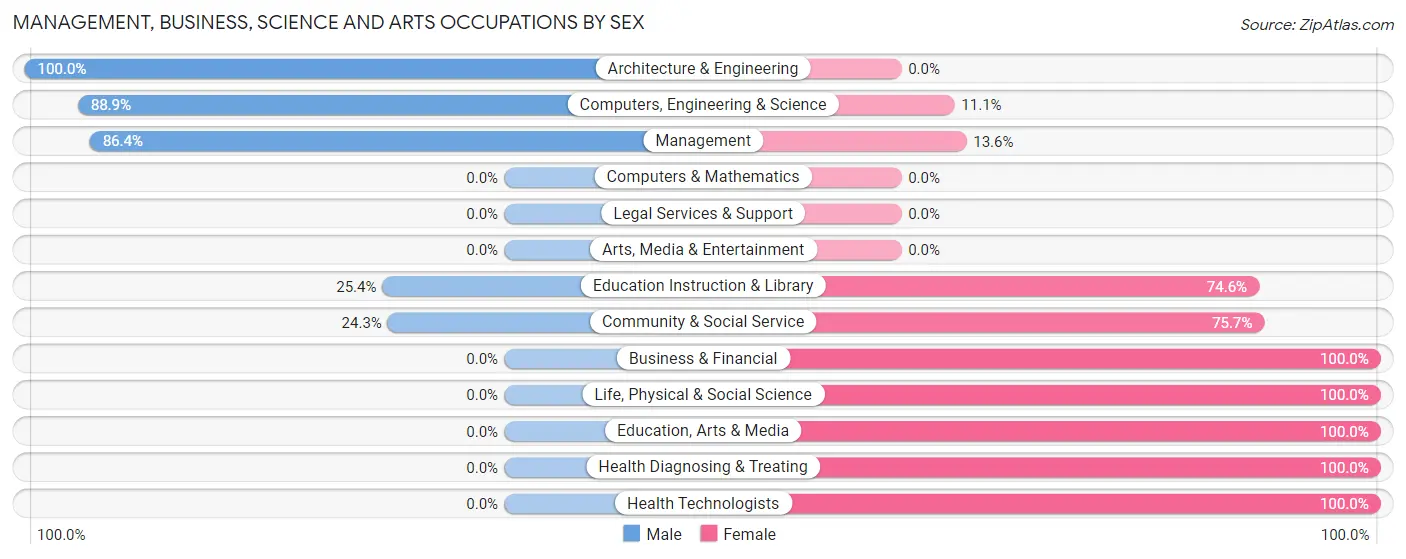
Management, Business, Science and Arts Occupations by Sex
Within the Management, Business, Science and Arts occupations in Ticonderoga, the most male-oriented occupations are Architecture & Engineering (100.0%), Computers, Engineering & Science (88.9%), and Management (86.4%), while the most female-oriented occupations are Business & Financial (100.0%), Life, Physical & Social Science (100.0%), and Education, Arts & Media (100.0%).
| Occupation | Male | Female |
| Management | 178 (86.4%) | 28 (13.6%) |
| Business & Financial | 0 (0.0%) | 66 (100.0%) |
| Computers, Engineering & Science | 8 (88.9%) | 1 (11.1%) |
| Computers & Mathematics | 0 (0.0%) | 0 (0.0%) |
| Architecture & Engineering | 8 (100.0%) | 0 (0.0%) |
| Life, Physical & Social Science | 0 (0.0%) | 1 (100.0%) |
| Community & Social Service | 50 (24.3%) | 156 (75.7%) |
| Education, Arts & Media | 0 (0.0%) | 9 (100.0%) |
| Legal Services & Support | 0 (0.0%) | 0 (0.0%) |
| Education Instruction & Library | 50 (25.4%) | 147 (74.6%) |
| Arts, Media & Entertainment | 0 (0.0%) | 0 (0.0%) |
| Health Diagnosing & Treating | 0 (0.0%) | 37 (100.0%) |
| Health Technologists | 0 (0.0%) | 37 (100.0%) |
| Total (Category) | 236 (45.0%) | 288 (55.0%) |
| Total (Overall) | 879 (60.0%) | 587 (40.0%) |
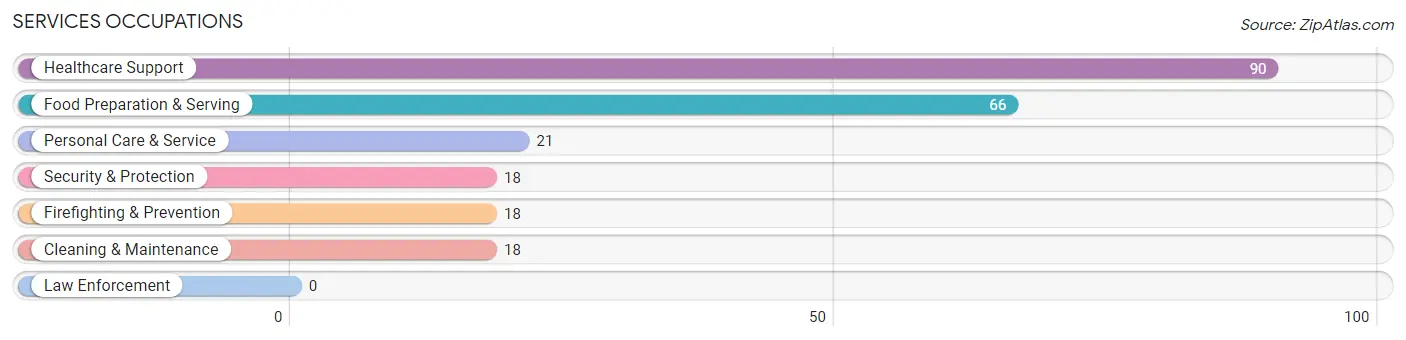
Services Occupations
The most common Services occupations in Ticonderoga are Healthcare Support (90 | 6.1%), Food Preparation & Serving (66 | 4.5%), Personal Care & Service (21 | 1.4%), Security & Protection (18 | 1.2%), and Firefighting & Prevention (18 | 1.2%).
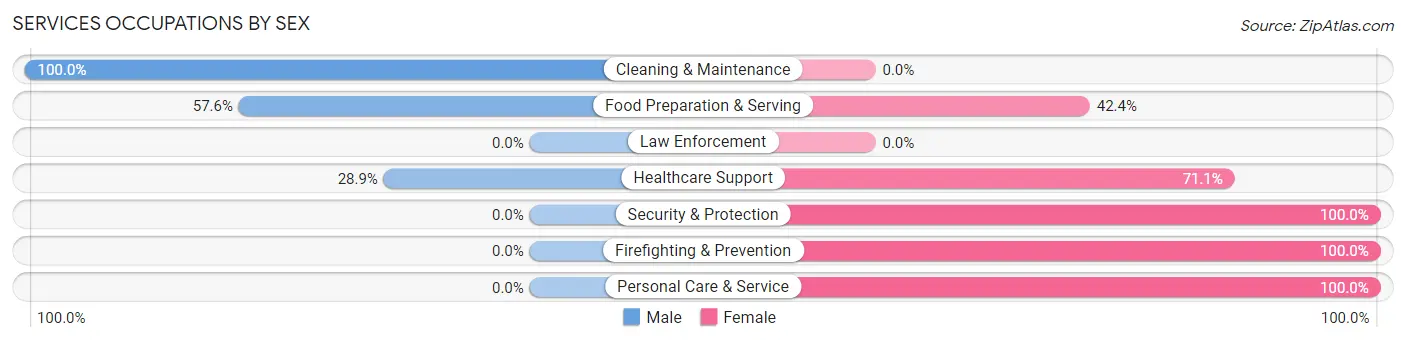
Services Occupations by Sex
Within the Services occupations in Ticonderoga, the most male-oriented occupations are Cleaning & Maintenance (100.0%), Food Preparation & Serving (57.6%), and Healthcare Support (28.9%), while the most female-oriented occupations are Security & Protection (100.0%), Firefighting & Prevention (100.0%), and Personal Care & Service (100.0%).
| Occupation | Male | Female |
| Healthcare Support | 26 (28.9%) | 64 (71.1%) |
| Security & Protection | 0 (0.0%) | 18 (100.0%) |
| Firefighting & Prevention | 0 (0.0%) | 18 (100.0%) |
| Law Enforcement | 0 (0.0%) | 0 (0.0%) |
| Food Preparation & Serving | 38 (57.6%) | 28 (42.4%) |
| Cleaning & Maintenance | 18 (100.0%) | 0 (0.0%) |
| Personal Care & Service | 0 (0.0%) | 21 (100.0%) |
| Total (Category) | 82 (38.5%) | 131 (61.5%) |
| Total (Overall) | 879 (60.0%) | 587 (40.0%) |
Sales and Office Occupations
The most common Sales and Office occupations in Ticonderoga are Sales & Related (135 | 9.2%), and Office & Administration (117 | 8.0%).

Sales and Office Occupations by Sex

| Occupation | Male | Female |
| Sales & Related | 85 (63.0%) | 50 (37.0%) |
| Office & Administration | 62 (53.0%) | 55 (47.0%) |
| Total (Category) | 147 (58.3%) | 105 (41.7%) |
| Total (Overall) | 879 (60.0%) | 587 (40.0%) |
Natural Resources, Construction and Maintenance Occupations
The most common Natural Resources, Construction and Maintenance occupations in Ticonderoga are Installation, Maintenance & Repair (160 | 10.9%), Construction & Extraction (20 | 1.4%), and Farming, Fishing & Forestry (10 | 0.7%).
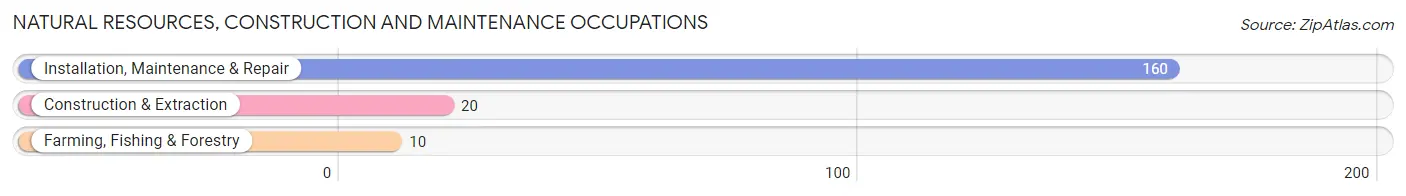
Natural Resources, Construction and Maintenance Occupations by Sex

| Occupation | Male | Female |
| Farming, Fishing & Forestry | 10 (100.0%) | 0 (0.0%) |
| Construction & Extraction | 20 (100.0%) | 0 (0.0%) |
| Installation, Maintenance & Repair | 160 (100.0%) | 0 (0.0%) |
| Total (Category) | 190 (100.0%) | 0 (0.0%) |
| Total (Overall) | 879 (60.0%) | 587 (40.0%) |
Production, Transportation and Moving Occupations
The most common Production, Transportation and Moving occupations in Ticonderoga are Production (166 | 11.3%), Transportation (99 | 6.8%), and Material Moving (22 | 1.5%).
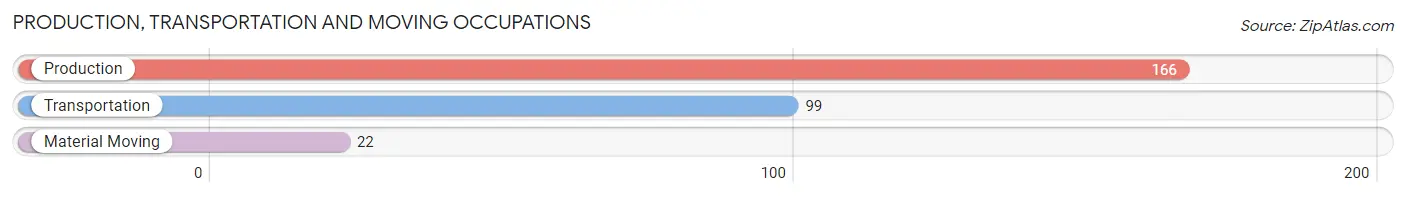
Production, Transportation and Moving Occupations by Sex
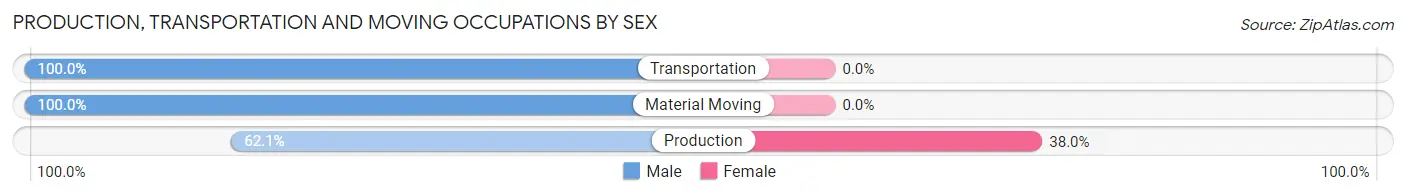
| Occupation | Male | Female |
| Production | 103 (62.1%) | 63 (38.0%) |
| Transportation | 99 (100.0%) | 0 (0.0%) |
| Material Moving | 22 (100.0%) | 0 (0.0%) |
| Total (Category) | 224 (78.0%) | 63 (22.0%) |
| Total (Overall) | 879 (60.0%) | 587 (40.0%) |
Employment Industries by Sex in Ticonderoga
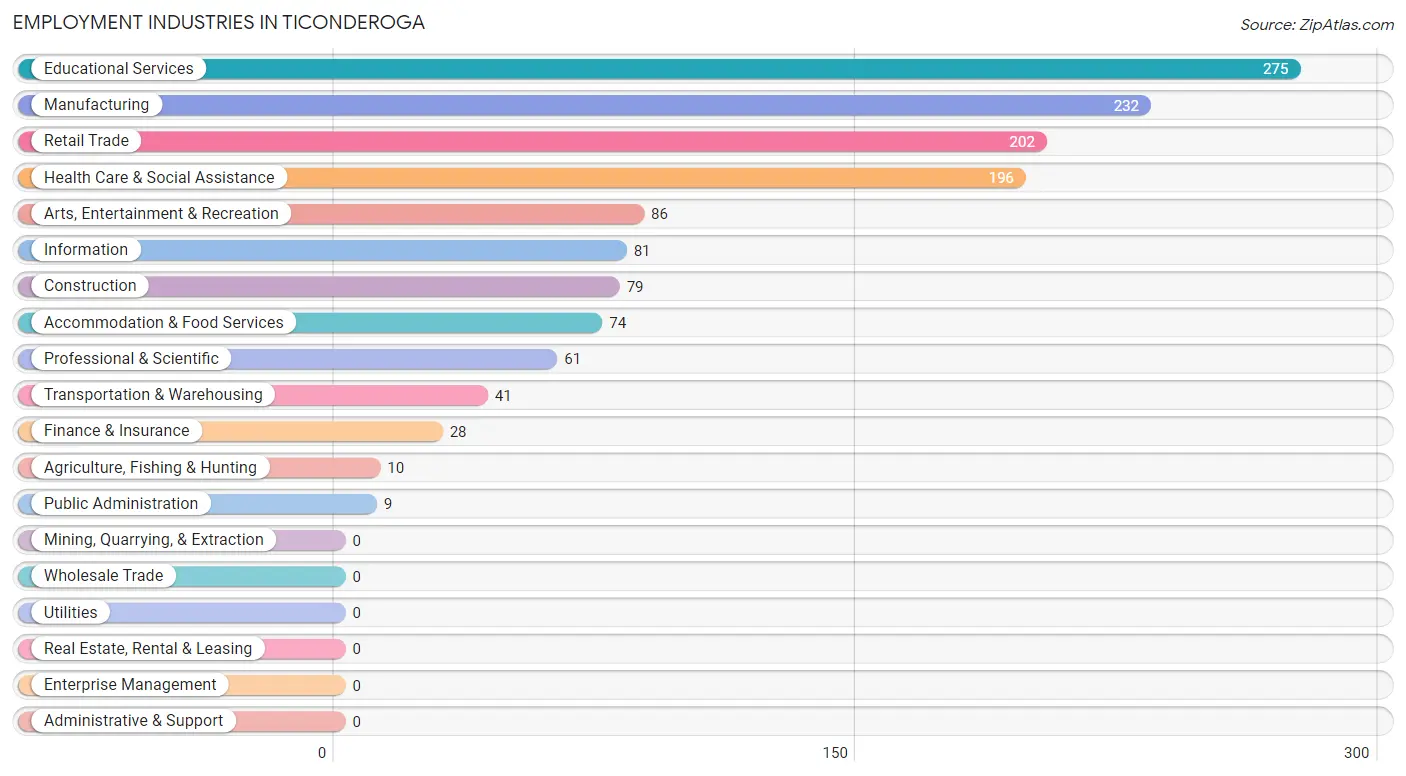
Employment Industries in Ticonderoga
The major employment industries in Ticonderoga include Educational Services (275 | 18.8%), Manufacturing (232 | 15.8%), Retail Trade (202 | 13.8%), Health Care & Social Assistance (196 | 13.4%), and Arts, Entertainment & Recreation (86 | 5.9%).
Employment Industries by Sex in Ticonderoga
The Ticonderoga industries that see more men than women are Agriculture, Fishing & Hunting (100.0%), Construction (100.0%), and Transportation & Warehousing (100.0%), whereas the industries that tend to have a higher number of women are Finance & Insurance (100.0%), Public Administration (100.0%), and Professional & Scientific (86.9%).
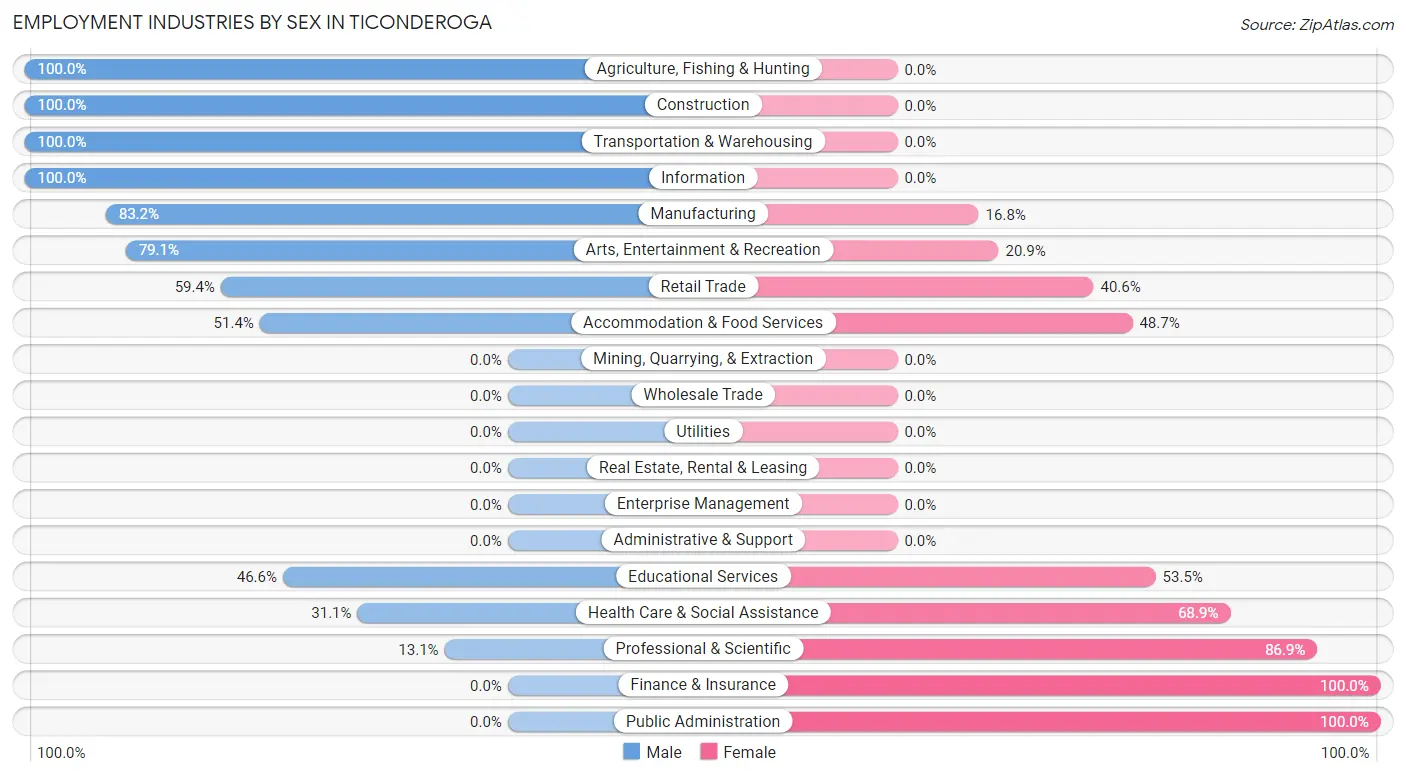
| Industry | Male | Female |
| Agriculture, Fishing & Hunting | 10 (100.0%) | 0 (0.0%) |
| Mining, Quarrying, & Extraction | 0 (0.0%) | 0 (0.0%) |
| Construction | 79 (100.0%) | 0 (0.0%) |
| Manufacturing | 193 (83.2%) | 39 (16.8%) |
| Wholesale Trade | 0 (0.0%) | 0 (0.0%) |
| Retail Trade | 120 (59.4%) | 82 (40.6%) |
| Transportation & Warehousing | 41 (100.0%) | 0 (0.0%) |
| Utilities | 0 (0.0%) | 0 (0.0%) |
| Information | 81 (100.0%) | 0 (0.0%) |
| Finance & Insurance | 0 (0.0%) | 28 (100.0%) |
| Real Estate, Rental & Leasing | 0 (0.0%) | 0 (0.0%) |
| Professional & Scientific | 8 (13.1%) | 53 (86.9%) |
| Enterprise Management | 0 (0.0%) | 0 (0.0%) |
| Administrative & Support | 0 (0.0%) | 0 (0.0%) |
| Educational Services | 128 (46.6%) | 147 (53.4%) |
| Health Care & Social Assistance | 61 (31.1%) | 135 (68.9%) |
| Arts, Entertainment & Recreation | 68 (79.1%) | 18 (20.9%) |
| Accommodation & Food Services | 38 (51.3%) | 36 (48.6%) |
| Public Administration | 0 (0.0%) | 9 (100.0%) |
| Total | 879 (60.0%) | 587 (40.0%) |
Education in Ticonderoga
School Enrollment in Ticonderoga
The most common levels of schooling among the 638 students in Ticonderoga are high school (229 | 35.9%), college / undergraduate (162 | 25.4%), and middle school (85 | 13.3%).
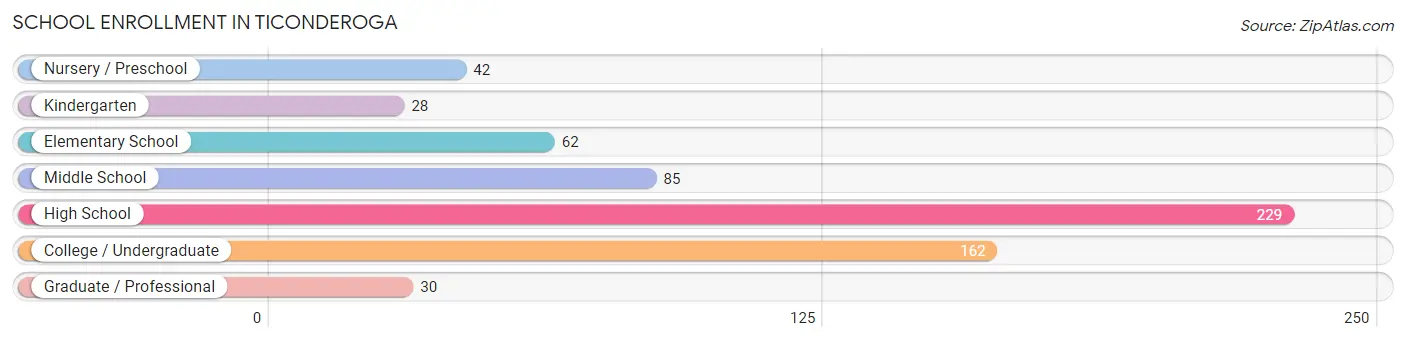
| School Level | # Students | % Students |
| Nursery / Preschool | 42 | 6.6% |
| Kindergarten | 28 | 4.4% |
| Elementary School | 62 | 9.7% |
| Middle School | 85 | 13.3% |
| High School | 229 | 35.9% |
| College / Undergraduate | 162 | 25.4% |
| Graduate / Professional | 30 | 4.7% |
| Total | 638 | 100.0% |
School Enrollment by Age by Funding Source in Ticonderoga
Out of a total of 638 students who are enrolled in schools in Ticonderoga, 125 (19.6%) attend a private institution, while the remaining 513 (80.4%) are enrolled in public schools. The age group of 35 years and over has the highest likelihood of being enrolled in private schools, with 54 (90.0% in the age bracket) enrolled. Conversely, the age group of 3 to 4 year olds has the lowest likelihood of being enrolled in a private school, with 42 (100.0% in the age bracket) attending a public institution.
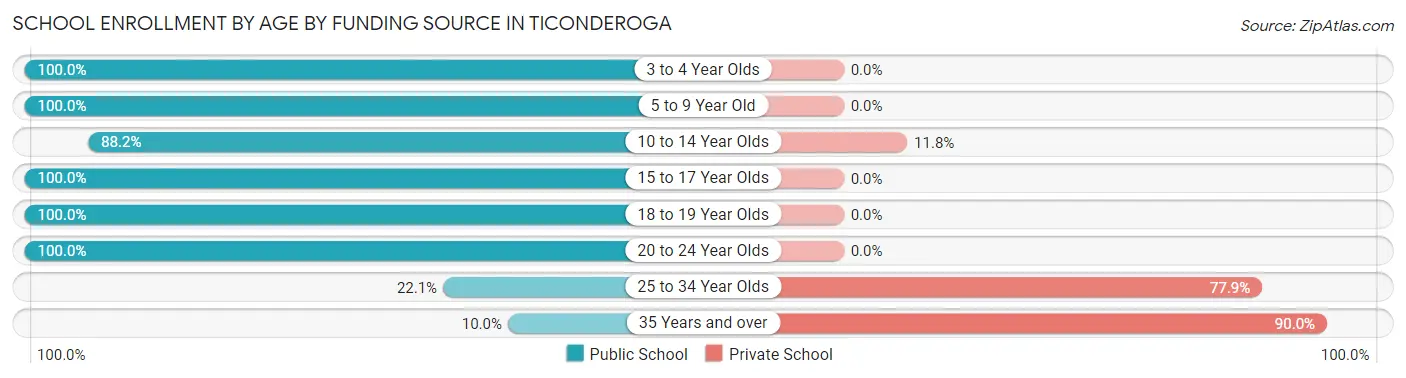
| Age Bracket | Public School | Private School |
| 3 to 4 Year Olds | 42 (100.0%) | 0 (0.0%) |
| 5 to 9 Year Old | 90 (100.0%) | 0 (0.0%) |
| 10 to 14 Year Olds | 82 (88.2%) | 11 (11.8%) |
| 15 to 17 Year Olds | 189 (100.0%) | 0 (0.0%) |
| 18 to 19 Year Olds | 32 (100.0%) | 0 (0.0%) |
| 20 to 24 Year Olds | 55 (100.0%) | 0 (0.0%) |
| 25 to 34 Year Olds | 17 (22.1%) | 60 (77.9%) |
| 35 Years and over | 6 (10.0%) | 54 (90.0%) |
| Total | 513 (80.4%) | 125 (19.6%) |
Educational Attainment by Field of Study in Ticonderoga
Liberal arts & history (118 | 22.1%), social sciences (90 | 16.9%), education (75 | 14.0%), business (44 | 8.2%), and communications (44 | 8.2%) are the most common fields of study among 534 individuals in Ticonderoga who have obtained a bachelor's degree or higher.
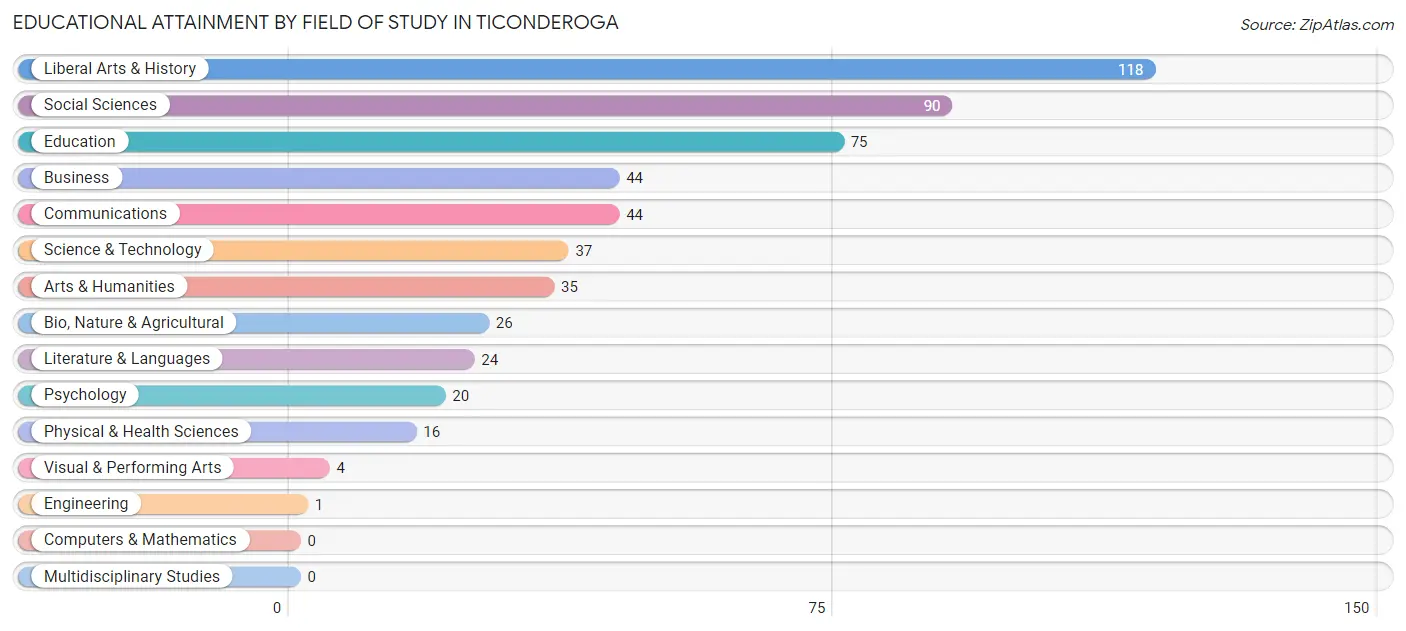
| Field of Study | # Graduates | % Graduates |
| Computers & Mathematics | 0 | 0.0% |
| Bio, Nature & Agricultural | 26 | 4.9% |
| Physical & Health Sciences | 16 | 3.0% |
| Psychology | 20 | 3.7% |
| Social Sciences | 90 | 16.9% |
| Engineering | 1 | 0.2% |
| Multidisciplinary Studies | 0 | 0.0% |
| Science & Technology | 37 | 6.9% |
| Business | 44 | 8.2% |
| Education | 75 | 14.0% |
| Literature & Languages | 24 | 4.5% |
| Liberal Arts & History | 118 | 22.1% |
| Visual & Performing Arts | 4 | 0.7% |
| Communications | 44 | 8.2% |
| Arts & Humanities | 35 | 6.6% |
| Total | 534 | 100.0% |
Transportation & Commute in Ticonderoga
Vehicle Availability by Sex in Ticonderoga
The most prevalent vehicle ownership categories in Ticonderoga are males with 2 vehicles (513, accounting for 58.4%) and females with 2 vehicles (390, making up 89.2%).
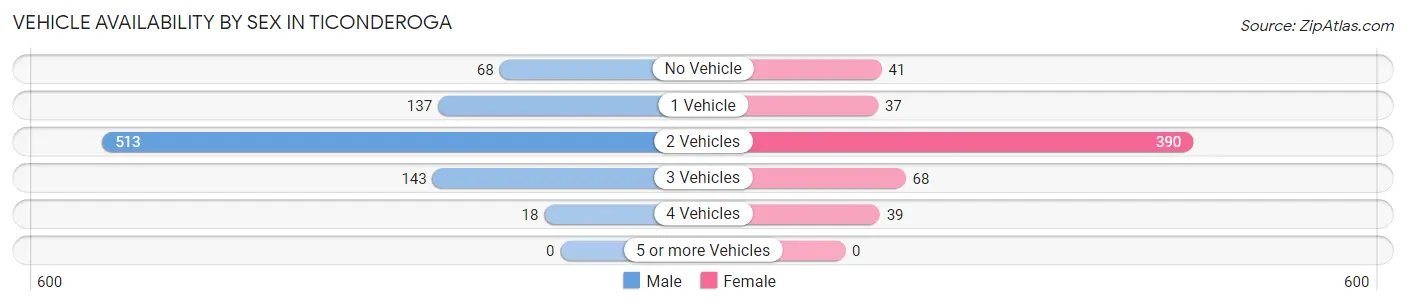
| Vehicles Available | Male | Female |
| No Vehicle | 68 (7.7%) | 41 (7.1%) |
| 1 Vehicle | 137 (15.6%) | 37 (6.4%) |
| 2 Vehicles | 513 (58.4%) | 390 (67.8%) |
| 3 Vehicles | 143 (16.3%) | 68 (11.8%) |
| 4 Vehicles | 18 (2.1%) | 39 (6.8%) |
| 5 or more Vehicles | 0 (0.0%) | 0 (0.0%) |
| Total | 879 (100.0%) | 575 (100.0%) |
Commute Time in Ticonderoga
The most frequently occuring commute durations in Ticonderoga are 10 to 14 minutes (383 commuters, 29.5%), 5 to 9 minutes (315 commuters, 24.2%), and less than 5 minutes (225 commuters, 17.3%).
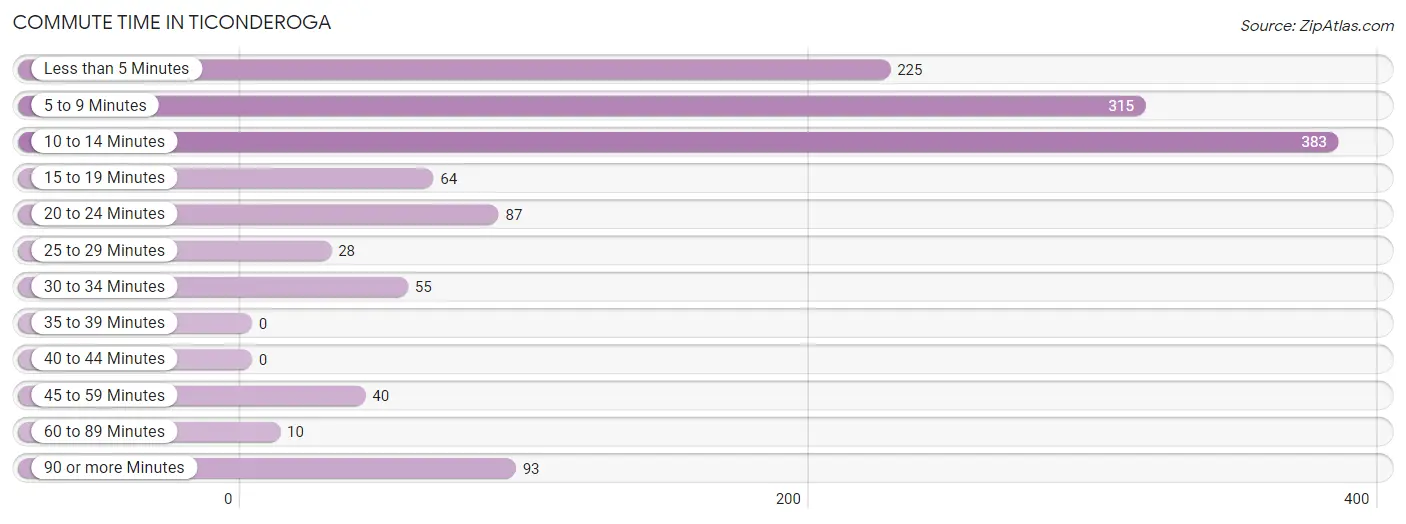
| Commute Time | # Commuters | % Commuters |
| Less than 5 Minutes | 225 | 17.3% |
| 5 to 9 Minutes | 315 | 24.2% |
| 10 to 14 Minutes | 383 | 29.5% |
| 15 to 19 Minutes | 64 | 4.9% |
| 20 to 24 Minutes | 87 | 6.7% |
| 25 to 29 Minutes | 28 | 2.1% |
| 30 to 34 Minutes | 55 | 4.2% |
| 35 to 39 Minutes | 0 | 0.0% |
| 40 to 44 Minutes | 0 | 0.0% |
| 45 to 59 Minutes | 40 | 3.1% |
| 60 to 89 Minutes | 10 | 0.8% |
| 90 or more Minutes | 93 | 7.1% |
Commute Time by Sex in Ticonderoga
The most common commute times in Ticonderoga are 5 to 9 minutes (249 commuters, 30.0%) for males and 10 to 14 minutes (209 commuters, 44.6%) for females.
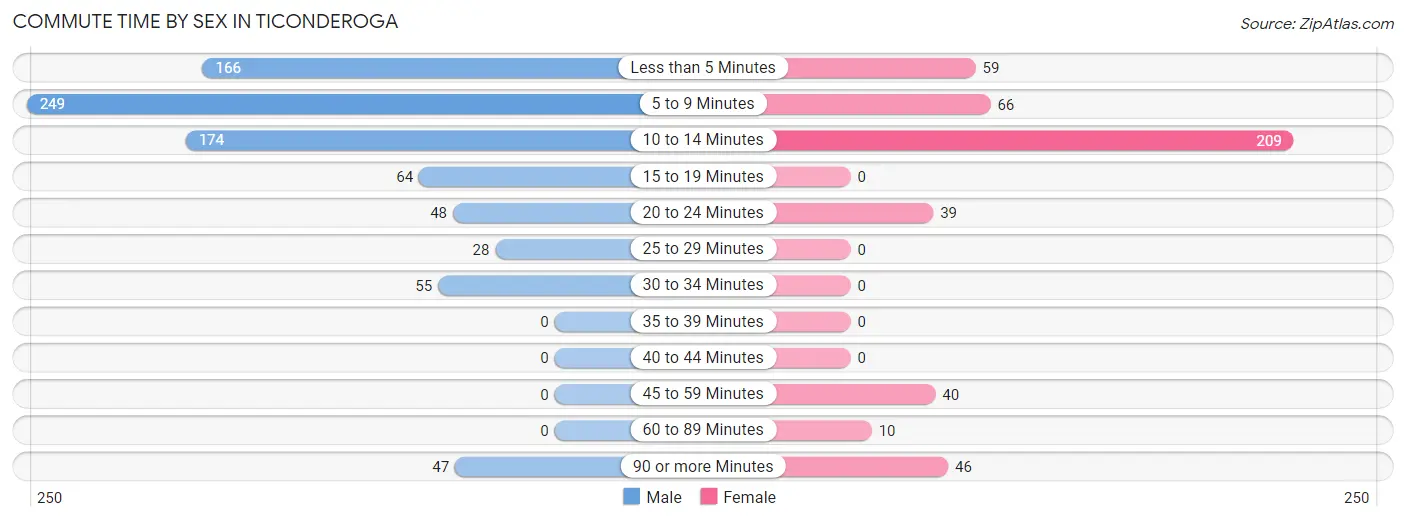
| Commute Time | Male | Female |
| Less than 5 Minutes | 166 (20.0%) | 59 (12.6%) |
| 5 to 9 Minutes | 249 (30.0%) | 66 (14.1%) |
| 10 to 14 Minutes | 174 (20.9%) | 209 (44.6%) |
| 15 to 19 Minutes | 64 (7.7%) | 0 (0.0%) |
| 20 to 24 Minutes | 48 (5.8%) | 39 (8.3%) |
| 25 to 29 Minutes | 28 (3.4%) | 0 (0.0%) |
| 30 to 34 Minutes | 55 (6.6%) | 0 (0.0%) |
| 35 to 39 Minutes | 0 (0.0%) | 0 (0.0%) |
| 40 to 44 Minutes | 0 (0.0%) | 0 (0.0%) |
| 45 to 59 Minutes | 0 (0.0%) | 40 (8.5%) |
| 60 to 89 Minutes | 0 (0.0%) | 10 (2.1%) |
| 90 or more Minutes | 47 (5.7%) | 46 (9.8%) |
Time of Departure to Work by Sex in Ticonderoga
The most frequent times of departure to work in Ticonderoga are 6:00 AM to 6:29 AM (140, 16.9%) for males and 7:30 AM to 7:59 AM (123, 26.2%) for females.
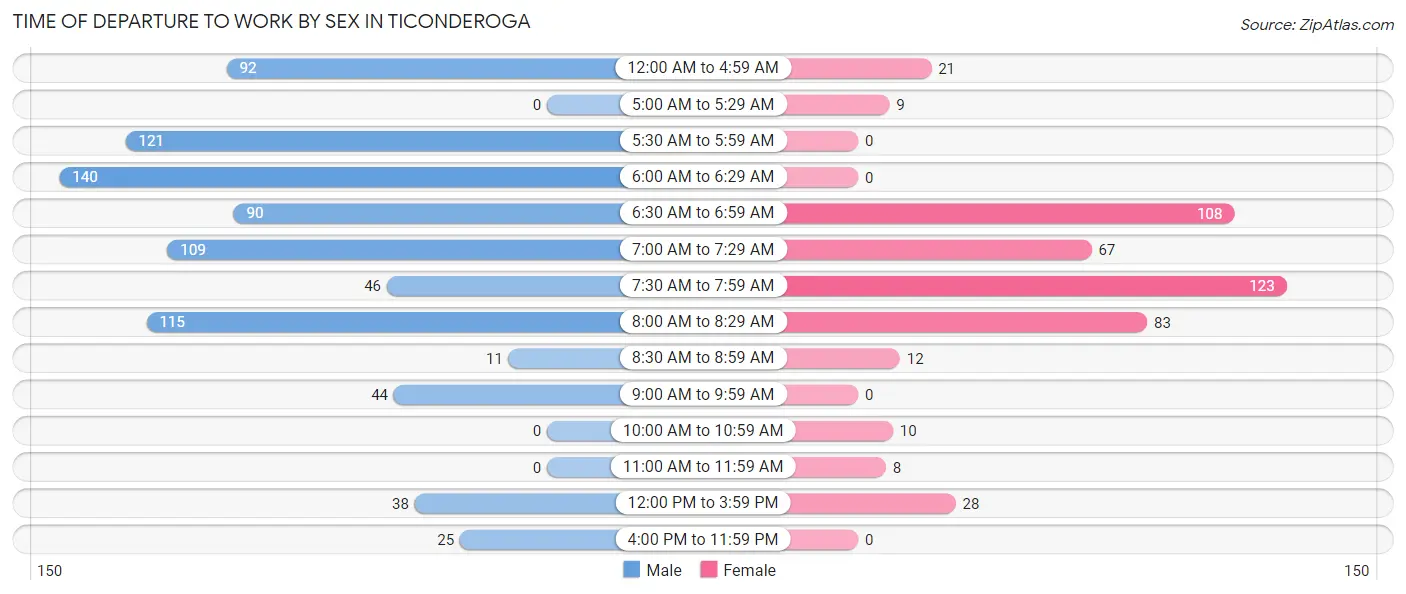
| Time of Departure | Male | Female |
| 12:00 AM to 4:59 AM | 92 (11.1%) | 21 (4.5%) |
| 5:00 AM to 5:29 AM | 0 (0.0%) | 9 (1.9%) |
| 5:30 AM to 5:59 AM | 121 (14.6%) | 0 (0.0%) |
| 6:00 AM to 6:29 AM | 140 (16.9%) | 0 (0.0%) |
| 6:30 AM to 6:59 AM | 90 (10.8%) | 108 (23.0%) |
| 7:00 AM to 7:29 AM | 109 (13.1%) | 67 (14.3%) |
| 7:30 AM to 7:59 AM | 46 (5.5%) | 123 (26.2%) |
| 8:00 AM to 8:29 AM | 115 (13.8%) | 83 (17.7%) |
| 8:30 AM to 8:59 AM | 11 (1.3%) | 12 (2.6%) |
| 9:00 AM to 9:59 AM | 44 (5.3%) | 0 (0.0%) |
| 10:00 AM to 10:59 AM | 0 (0.0%) | 10 (2.1%) |
| 11:00 AM to 11:59 AM | 0 (0.0%) | 8 (1.7%) |
| 12:00 PM to 3:59 PM | 38 (4.6%) | 28 (6.0%) |
| 4:00 PM to 11:59 PM | 25 (3.0%) | 0 (0.0%) |
| Total | 831 (100.0%) | 469 (100.0%) |
Housing Occupancy in Ticonderoga
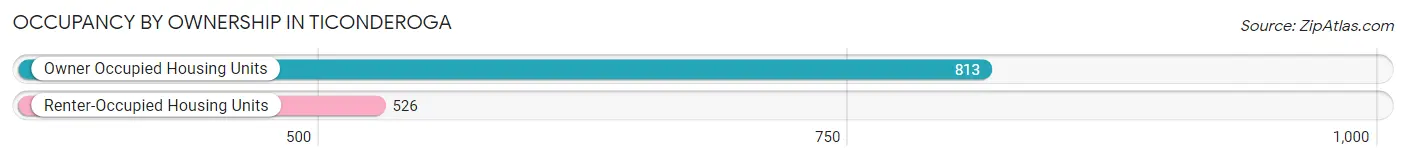
Occupancy by Ownership in Ticonderoga
Of the total 1,339 dwellings in Ticonderoga, owner-occupied units account for 813 (60.7%), while renter-occupied units make up 526 (39.3%).
| Occupancy | # Housing Units | % Housing Units |
| Owner Occupied Housing Units | 813 | 60.7% |
| Renter-Occupied Housing Units | 526 | 39.3% |
| Total Occupied Housing Units | 1,339 | 100.0% |
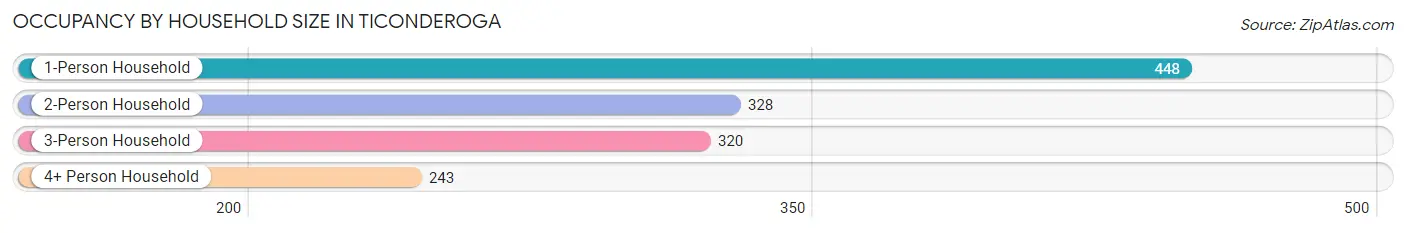
Occupancy by Household Size in Ticonderoga
| Household Size | # Housing Units | % Housing Units |
| 1-Person Household | 448 | 33.5% |
| 2-Person Household | 328 | 24.5% |
| 3-Person Household | 320 | 23.9% |
| 4+ Person Household | 243 | 18.1% |
| Total Housing Units | 1,339 | 100.0% |
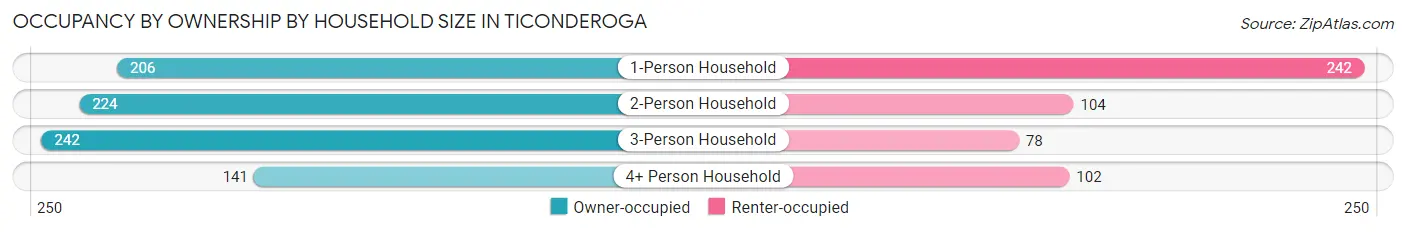
Occupancy by Ownership by Household Size in Ticonderoga
| Household Size | Owner-occupied | Renter-occupied |
| 1-Person Household | 206 (46.0%) | 242 (54.0%) |
| 2-Person Household | 224 (68.3%) | 104 (31.7%) |
| 3-Person Household | 242 (75.6%) | 78 (24.4%) |
| 4+ Person Household | 141 (58.0%) | 102 (42.0%) |
| Total Housing Units | 813 (60.7%) | 526 (39.3%) |
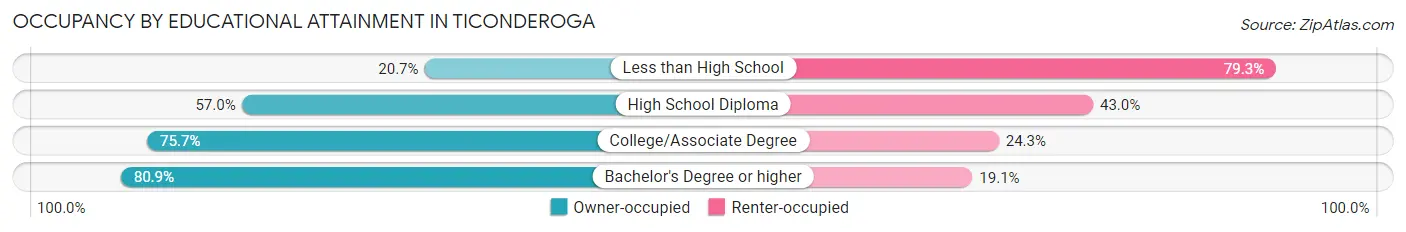
Occupancy by Educational Attainment in Ticonderoga
| Household Size | Owner-occupied | Renter-occupied |
| Less than High School | 45 (20.7%) | 172 (79.3%) |
| High School Diploma | 293 (57.0%) | 221 (43.0%) |
| College/Associate Degree | 246 (75.7%) | 79 (24.3%) |
| Bachelor's Degree or higher | 229 (80.9%) | 54 (19.1%) |
Occupancy by Age of Householder in Ticonderoga
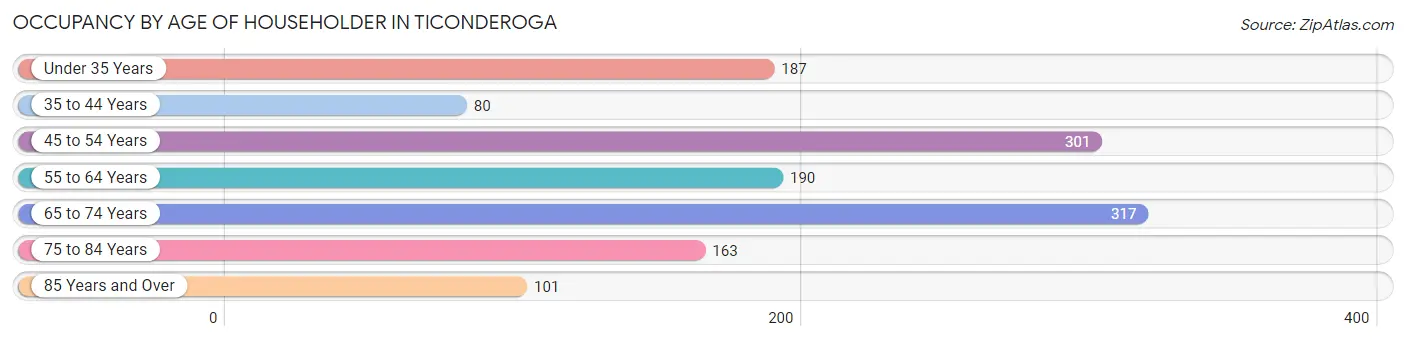
| Age Bracket | # Households | % Households |
| Under 35 Years | 187 | 14.0% |
| 35 to 44 Years | 80 | 6.0% |
| 45 to 54 Years | 301 | 22.5% |
| 55 to 64 Years | 190 | 14.2% |
| 65 to 74 Years | 317 | 23.7% |
| 75 to 84 Years | 163 | 12.2% |
| 85 Years and Over | 101 | 7.5% |
| Total | 1,339 | 100.0% |
Housing Finances in Ticonderoga
Median Income by Occupancy in Ticonderoga
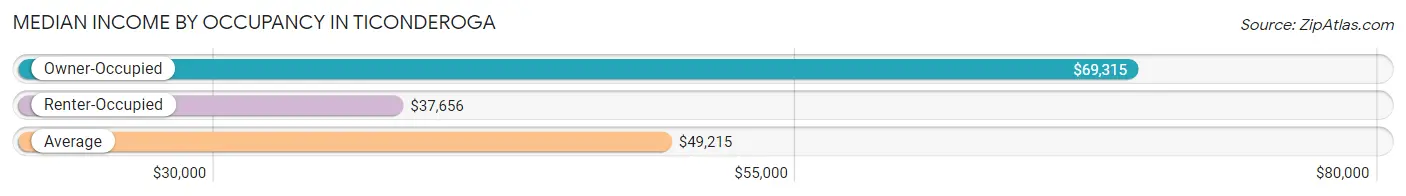
| Occupancy Type | # Households | Median Income |
| Owner-Occupied | 813 (60.7%) | $69,315 |
| Renter-Occupied | 526 (39.3%) | $37,656 |
| Average | 1,339 (100.0%) | $49,215 |
Occupancy by Householder Income Bracket in Ticonderoga
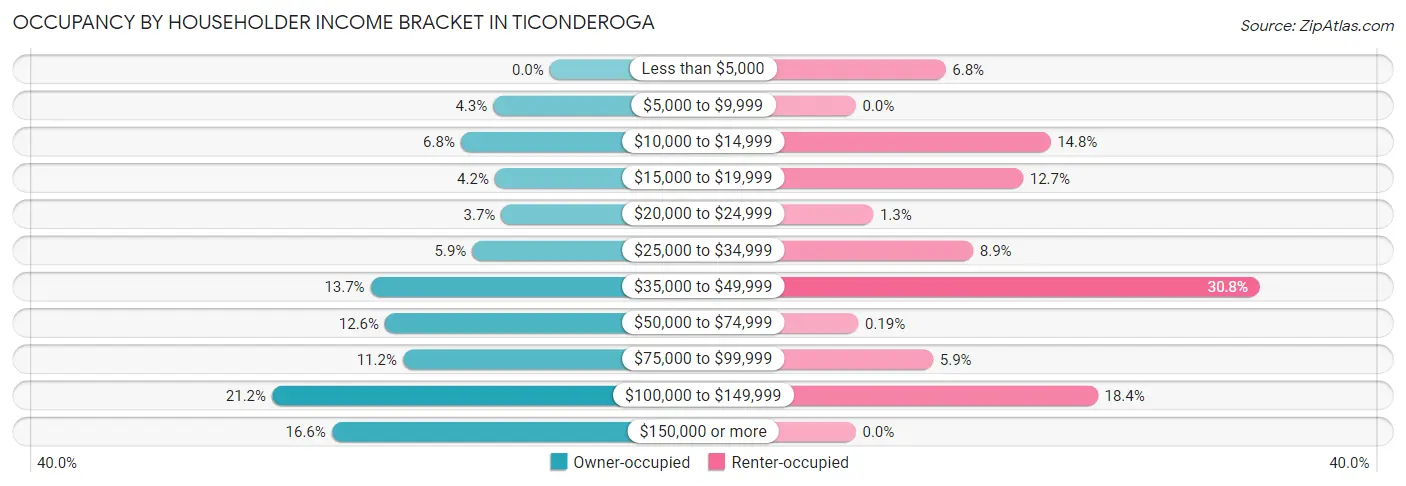
| Income Bracket | Owner-occupied | Renter-occupied |
| Less than $5,000 | 0 (0.0%) | 36 (6.8%) |
| $5,000 to $9,999 | 35 (4.3%) | 0 (0.0%) |
| $10,000 to $14,999 | 55 (6.8%) | 78 (14.8%) |
| $15,000 to $19,999 | 34 (4.2%) | 67 (12.7%) |
| $20,000 to $24,999 | 30 (3.7%) | 7 (1.3%) |
| $25,000 to $34,999 | 48 (5.9%) | 47 (8.9%) |
| $35,000 to $49,999 | 111 (13.7%) | 162 (30.8%) |
| $50,000 to $74,999 | 102 (12.6%) | 1 (0.2%) |
| $75,000 to $99,999 | 91 (11.2%) | 31 (5.9%) |
| $100,000 to $149,999 | 172 (21.2%) | 97 (18.4%) |
| $150,000 or more | 135 (16.6%) | 0 (0.0%) |
| Total | 813 (100.0%) | 526 (100.0%) |
Monthly Housing Cost Tiers in Ticonderoga
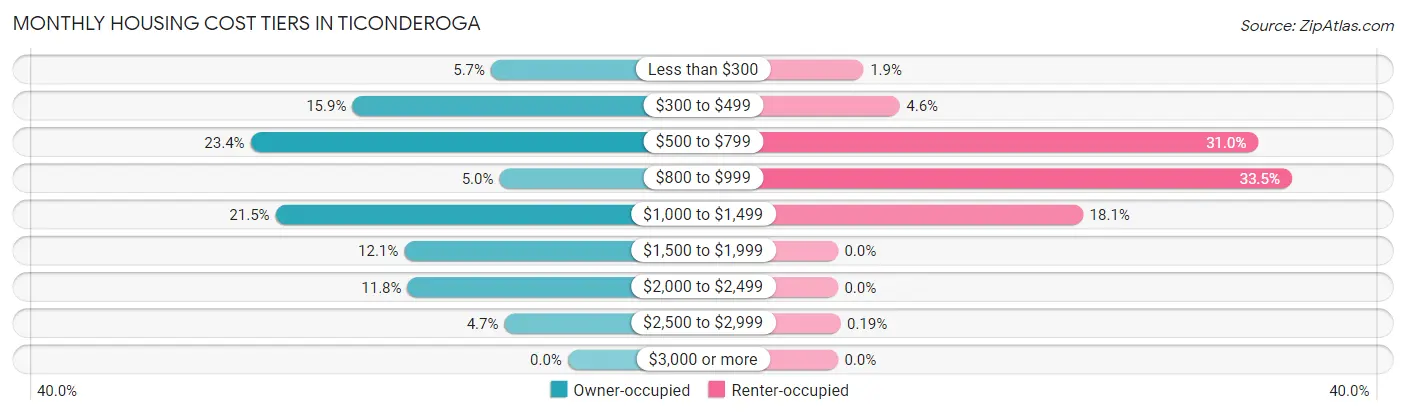
| Monthly Cost | Owner-occupied | Renter-occupied |
| Less than $300 | 46 (5.7%) | 10 (1.9%) |
| $300 to $499 | 129 (15.9%) | 24 (4.6%) |
| $500 to $799 | 190 (23.4%) | 163 (31.0%) |
| $800 to $999 | 41 (5.0%) | 176 (33.5%) |
| $1,000 to $1,499 | 175 (21.5%) | 95 (18.1%) |
| $1,500 to $1,999 | 98 (12.0%) | 0 (0.0%) |
| $2,000 to $2,499 | 96 (11.8%) | 0 (0.0%) |
| $2,500 to $2,999 | 38 (4.7%) | 1 (0.2%) |
| $3,000 or more | 0 (0.0%) | 0 (0.0%) |
| Total | 813 (100.0%) | 526 (100.0%) |
Physical Housing Characteristics in Ticonderoga
Housing Structures in Ticonderoga
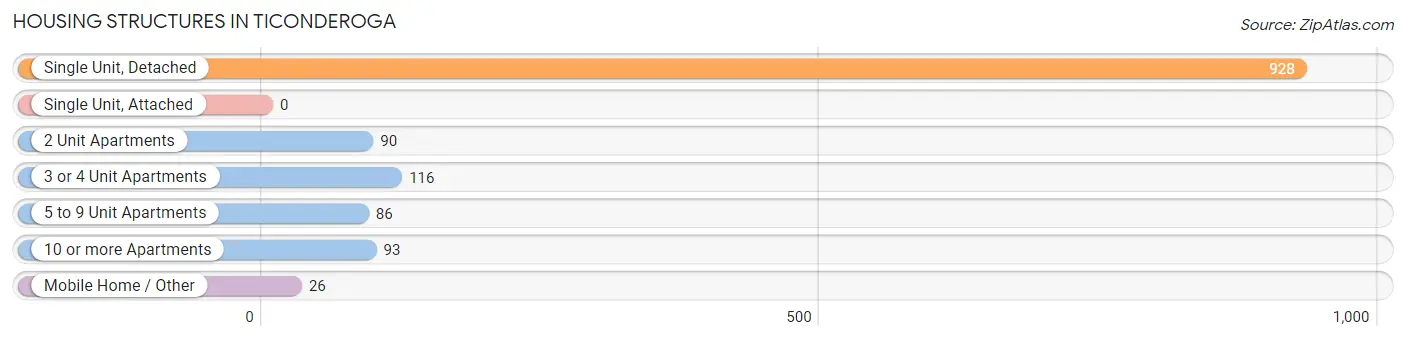
| Structure Type | # Housing Units | % Housing Units |
| Single Unit, Detached | 928 | 69.3% |
| Single Unit, Attached | 0 | 0.0% |
| 2 Unit Apartments | 90 | 6.7% |
| 3 or 4 Unit Apartments | 116 | 8.7% |
| 5 to 9 Unit Apartments | 86 | 6.4% |
| 10 or more Apartments | 93 | 7.0% |
| Mobile Home / Other | 26 | 1.9% |
| Total | 1,339 | 100.0% |
Housing Structures by Occupancy in Ticonderoga
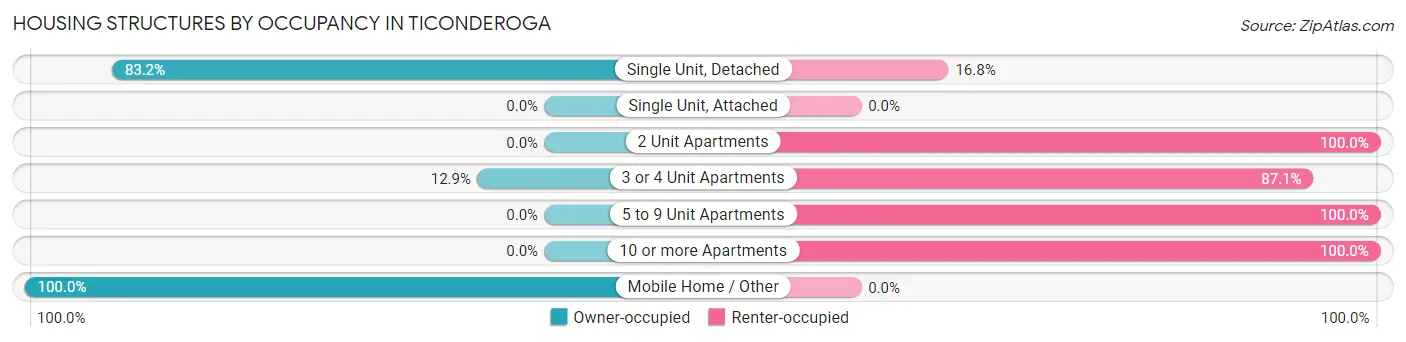
| Structure Type | Owner-occupied | Renter-occupied |
| Single Unit, Detached | 772 (83.2%) | 156 (16.8%) |
| Single Unit, Attached | 0 (0.0%) | 0 (0.0%) |
| 2 Unit Apartments | 0 (0.0%) | 90 (100.0%) |
| 3 or 4 Unit Apartments | 15 (12.9%) | 101 (87.1%) |
| 5 to 9 Unit Apartments | 0 (0.0%) | 86 (100.0%) |
| 10 or more Apartments | 0 (0.0%) | 93 (100.0%) |
| Mobile Home / Other | 26 (100.0%) | 0 (0.0%) |
| Total | 813 (60.7%) | 526 (39.3%) |
Housing Structures by Number of Rooms in Ticonderoga
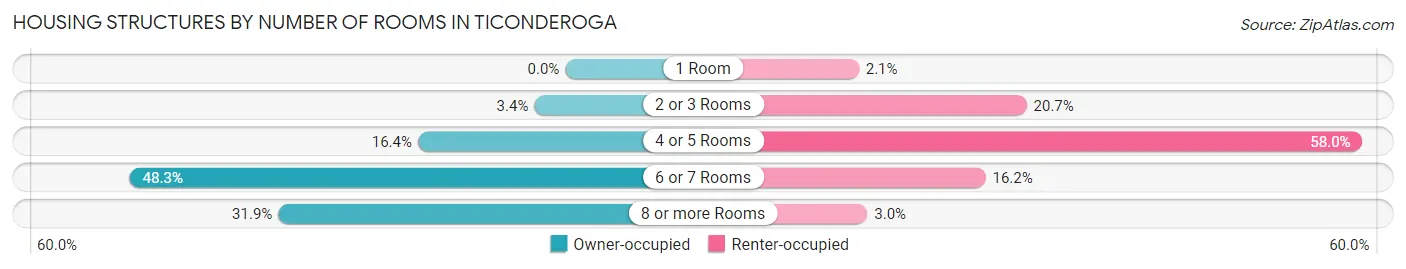
| Number of Rooms | Owner-occupied | Renter-occupied |
| 1 Room | 0 (0.0%) | 11 (2.1%) |
| 2 or 3 Rooms | 28 (3.4%) | 109 (20.7%) |
| 4 or 5 Rooms | 133 (16.4%) | 305 (58.0%) |
| 6 or 7 Rooms | 393 (48.3%) | 85 (16.2%) |
| 8 or more Rooms | 259 (31.9%) | 16 (3.0%) |
| Total | 813 (100.0%) | 526 (100.0%) |
Housing Structure by Heating Type in Ticonderoga
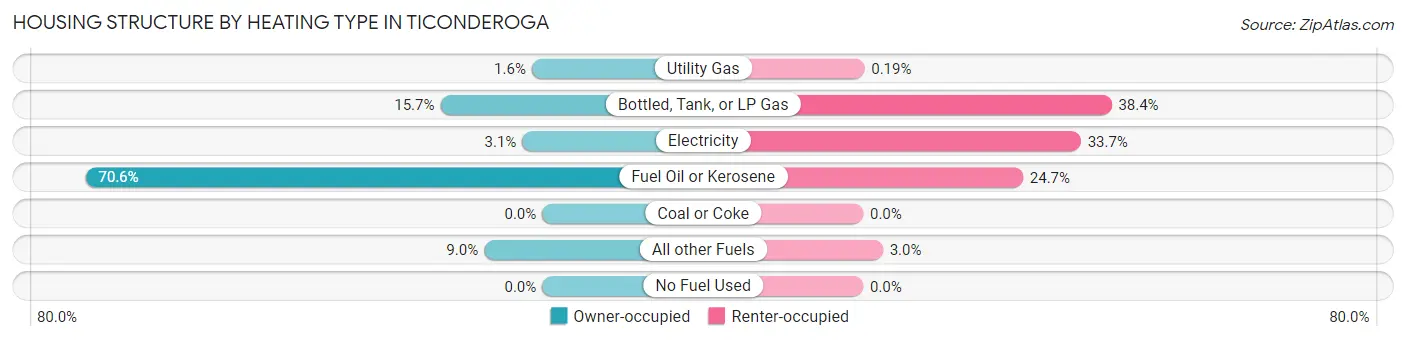
| Heating Type | Owner-occupied | Renter-occupied |
| Utility Gas | 13 (1.6%) | 1 (0.2%) |
| Bottled, Tank, or LP Gas | 128 (15.7%) | 202 (38.4%) |
| Electricity | 25 (3.1%) | 177 (33.7%) |
| Fuel Oil or Kerosene | 574 (70.6%) | 130 (24.7%) |
| Coal or Coke | 0 (0.0%) | 0 (0.0%) |
| All other Fuels | 73 (9.0%) | 16 (3.0%) |
| No Fuel Used | 0 (0.0%) | 0 (0.0%) |
| Total | 813 (100.0%) | 526 (100.0%) |
Household Vehicle Usage in Ticonderoga
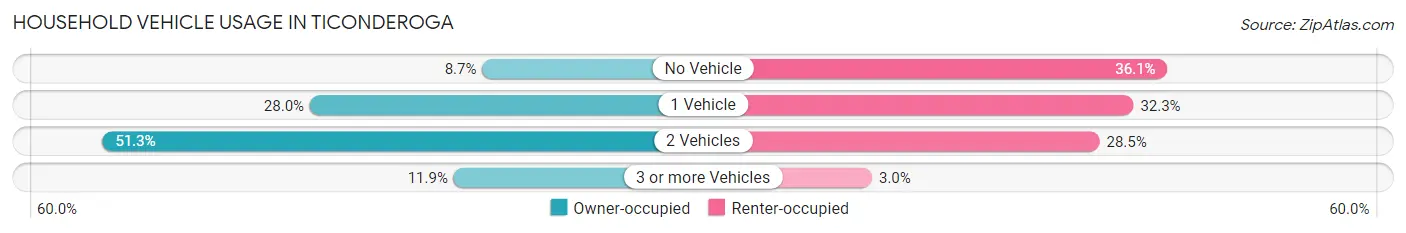
| Vehicles per Household | Owner-occupied | Renter-occupied |
| No Vehicle | 71 (8.7%) | 190 (36.1%) |
| 1 Vehicle | 228 (28.0%) | 170 (32.3%) |
| 2 Vehicles | 417 (51.3%) | 150 (28.5%) |
| 3 or more Vehicles | 97 (11.9%) | 16 (3.0%) |
| Total | 813 (100.0%) | 526 (100.0%) |
Real Estate & Mortgages in Ticonderoga
Real Estate and Mortgage Overview in Ticonderoga
| Characteristic | Without Mortgage | With Mortgage |
| Housing Units | 353 | 460 |
| Median Property Value | $128,200 | $168,200 |
| Median Household Income | $48,586 | $122 |
| Monthly Housing Costs | $524 | $0 |
| Real Estate Taxes | $1,691 | $0 |
Property Value by Mortgage Status in Ticonderoga
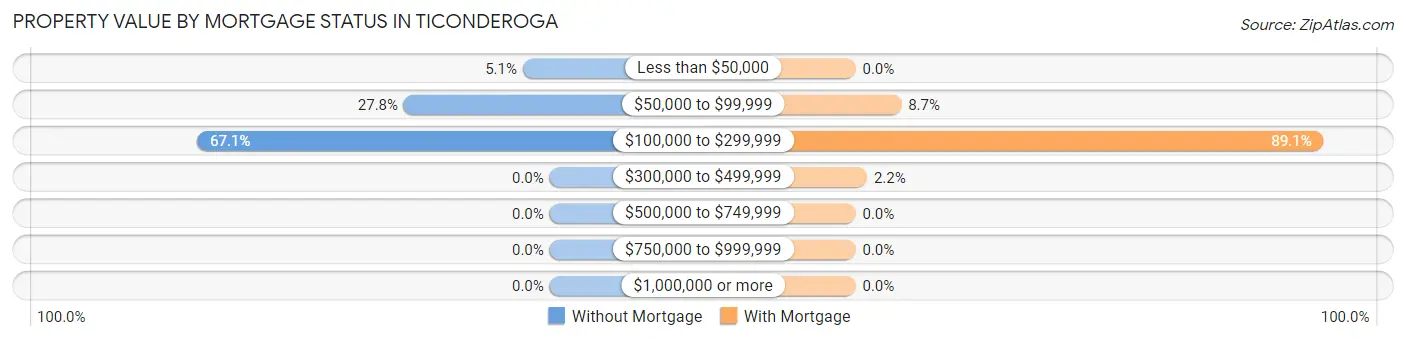
| Property Value | Without Mortgage | With Mortgage |
| Less than $50,000 | 18 (5.1%) | 0 (0.0%) |
| $50,000 to $99,999 | 98 (27.8%) | 40 (8.7%) |
| $100,000 to $299,999 | 237 (67.1%) | 410 (89.1%) |
| $300,000 to $499,999 | 0 (0.0%) | 10 (2.2%) |
| $500,000 to $749,999 | 0 (0.0%) | 0 (0.0%) |
| $750,000 to $999,999 | 0 (0.0%) | 0 (0.0%) |
| $1,000,000 or more | 0 (0.0%) | 0 (0.0%) |
| Total | 353 (100.0%) | 460 (100.0%) |
Household Income by Mortgage Status in Ticonderoga
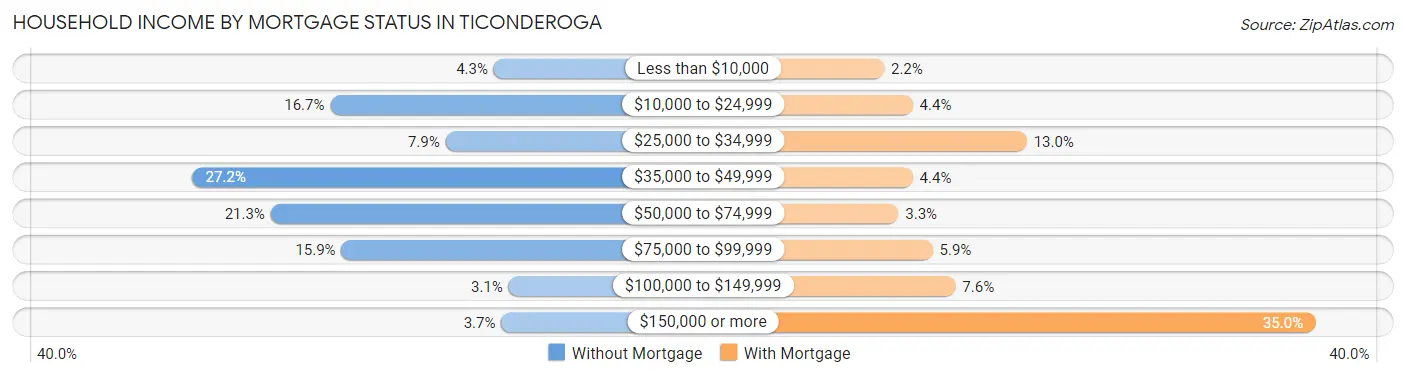
| Household Income | Without Mortgage | With Mortgage |
| Less than $10,000 | 15 (4.3%) | 10 (2.2%) |
| $10,000 to $24,999 | 59 (16.7%) | 20 (4.3%) |
| $25,000 to $34,999 | 28 (7.9%) | 60 (13.0%) |
| $35,000 to $49,999 | 96 (27.2%) | 20 (4.3%) |
| $50,000 to $74,999 | 75 (21.2%) | 15 (3.3%) |
| $75,000 to $99,999 | 56 (15.9%) | 27 (5.9%) |
| $100,000 to $149,999 | 11 (3.1%) | 35 (7.6%) |
| $150,000 or more | 13 (3.7%) | 161 (35.0%) |
| Total | 353 (100.0%) | 460 (100.0%) |
Property Value to Household Income Ratio in Ticonderoga
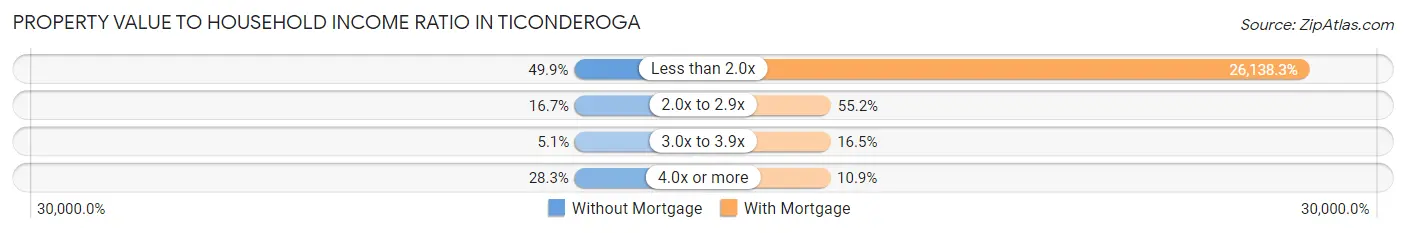
| Value-to-Income Ratio | Without Mortgage | With Mortgage |
| Less than 2.0x | 176 (49.9%) | 120,236 (26,138.3%) |
| 2.0x to 2.9x | 59 (16.7%) | 254 (55.2%) |
| 3.0x to 3.9x | 18 (5.1%) | 76 (16.5%) |
| 4.0x or more | 100 (28.3%) | 50 (10.9%) |
| Total | 353 (100.0%) | 460 (100.0%) |
Real Estate Taxes by Mortgage Status in Ticonderoga
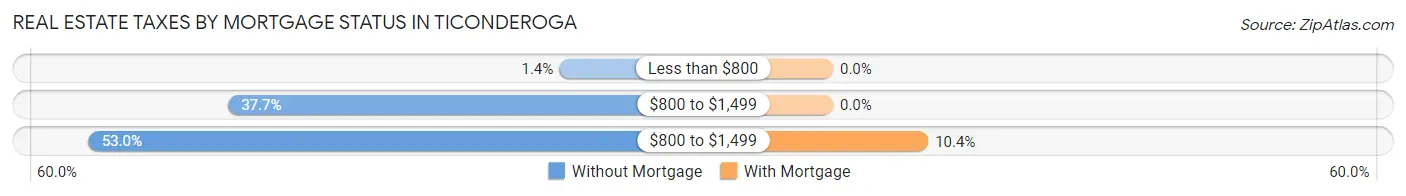
| Property Taxes | Without Mortgage | With Mortgage |
| Less than $800 | 5 (1.4%) | 0 (0.0%) |
| $800 to $1,499 | 133 (37.7%) | 0 (0.0%) |
| $800 to $1,499 | 187 (53.0%) | 48 (10.4%) |
| Total | 353 (100.0%) | 460 (100.0%) |
Health & Disability in Ticonderoga
Health Insurance Coverage by Age in Ticonderoga
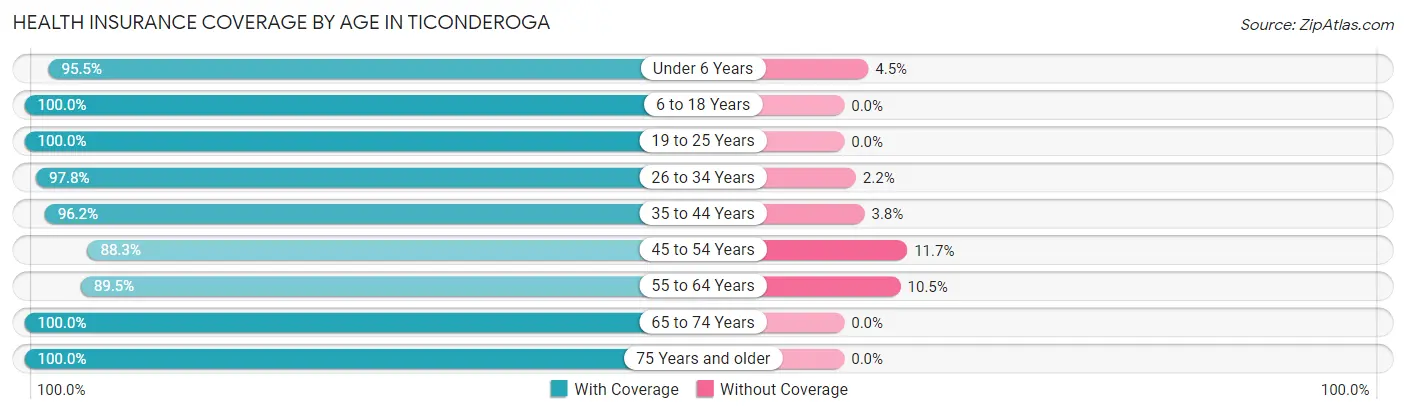
| Age Bracket | With Coverage | Without Coverage |
| Under 6 Years | 341 (95.5%) | 16 (4.5%) |
| 6 to 18 Years | 384 (100.0%) | 0 (0.0%) |
| 19 to 25 Years | 156 (100.0%) | 0 (0.0%) |
| 26 to 34 Years | 499 (97.8%) | 11 (2.2%) |
| 35 to 44 Years | 331 (96.2%) | 13 (3.8%) |
| 45 to 54 Years | 436 (88.3%) | 58 (11.7%) |
| 55 to 64 Years | 307 (89.5%) | 36 (10.5%) |
| 65 to 74 Years | 429 (100.0%) | 0 (0.0%) |
| 75 Years and older | 317 (100.0%) | 0 (0.0%) |
| Total | 3,200 (96.0%) | 134 (4.0%) |
Health Insurance Coverage by Citizenship Status in Ticonderoga

| Citizenship Status | With Coverage | Without Coverage |
| Native Born | 341 (95.5%) | 16 (4.5%) |
| Foreign Born, Citizen | 384 (100.0%) | 0 (0.0%) |
| Foreign Born, not a Citizen | 156 (100.0%) | 0 (0.0%) |
Health Insurance Coverage by Household Income in Ticonderoga
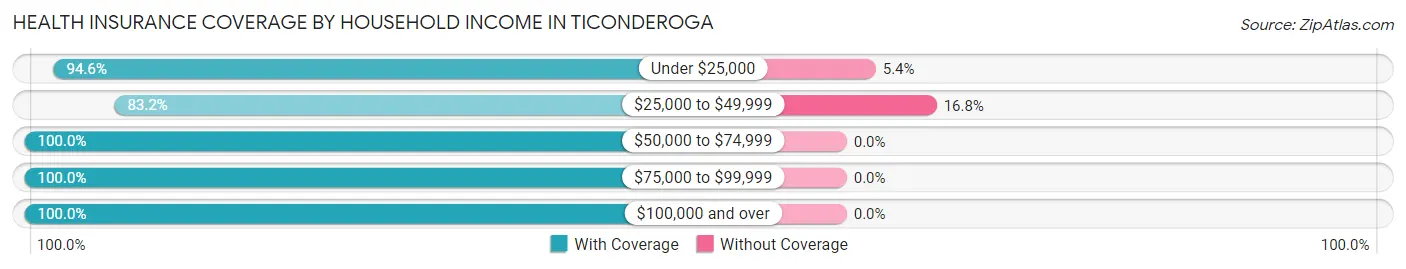
| Household Income | With Coverage | Without Coverage |
| Under $25,000 | 592 (94.6%) | 34 (5.4%) |
| $25,000 to $49,999 | 494 (83.2%) | 100 (16.8%) |
| $50,000 to $74,999 | 302 (100.0%) | 0 (0.0%) |
| $75,000 to $99,999 | 445 (100.0%) | 0 (0.0%) |
| $100,000 and over | 1,337 (100.0%) | 0 (0.0%) |
Public vs Private Health Insurance Coverage by Age in Ticonderoga
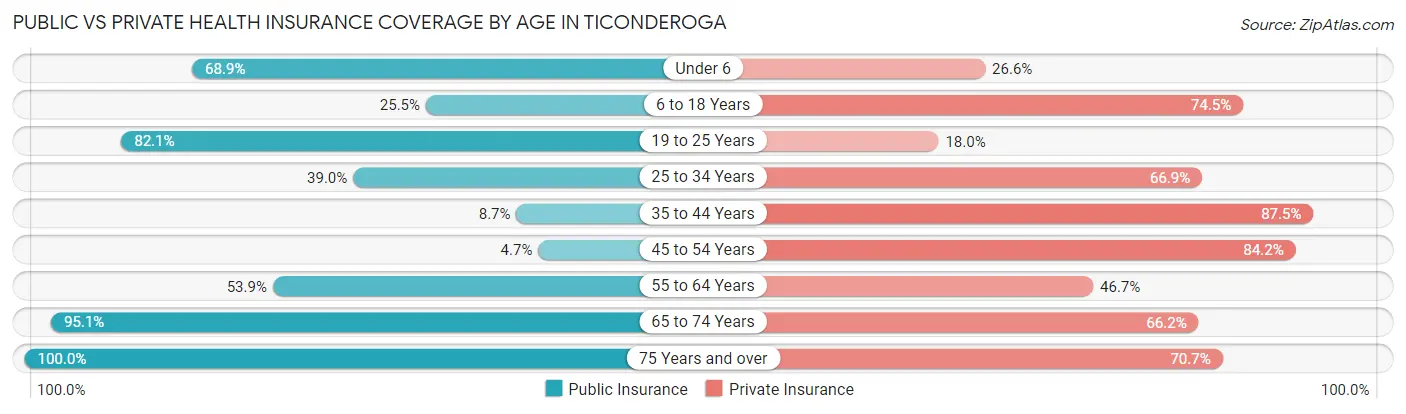
| Age Bracket | Public Insurance | Private Insurance |
| Under 6 | 246 (68.9%) | 95 (26.6%) |
| 6 to 18 Years | 98 (25.5%) | 286 (74.5%) |
| 19 to 25 Years | 128 (82.1%) | 28 (17.9%) |
| 25 to 34 Years | 199 (39.0%) | 341 (66.9%) |
| 35 to 44 Years | 30 (8.7%) | 301 (87.5%) |
| 45 to 54 Years | 23 (4.7%) | 416 (84.2%) |
| 55 to 64 Years | 185 (53.9%) | 160 (46.7%) |
| 65 to 74 Years | 408 (95.1%) | 284 (66.2%) |
| 75 Years and over | 317 (100.0%) | 224 (70.7%) |
| Total | 1,634 (49.0%) | 2,135 (64.0%) |
Disability Status by Sex by Age in Ticonderoga
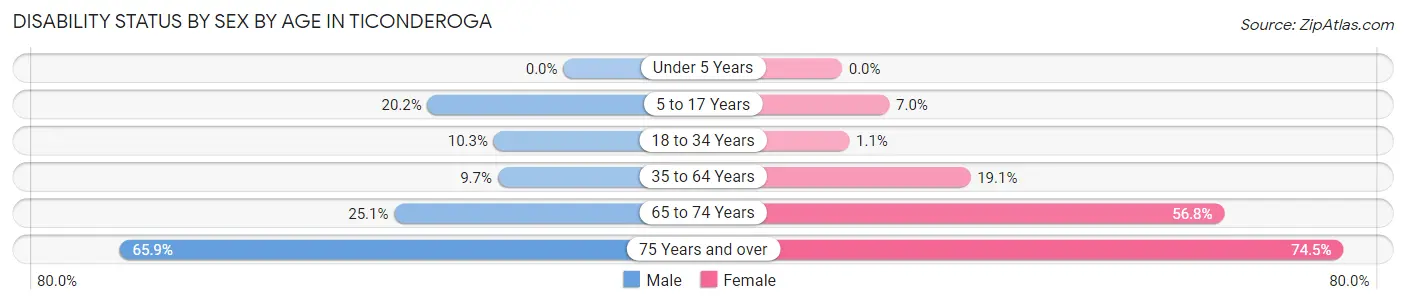
| Age Bracket | Male | Female |
| Under 5 Years | 0 (0.0%) | 0 (0.0%) |
| 5 to 17 Years | 25 (20.2%) | 18 (7.0%) |
| 18 to 34 Years | 34 (10.3%) | 4 (1.1%) |
| 35 to 64 Years | 69 (9.7%) | 90 (19.1%) |
| 65 to 74 Years | 56 (25.1%) | 117 (56.8%) |
| 75 Years and over | 85 (65.9%) | 140 (74.5%) |
Disability Class by Sex by Age in Ticonderoga
Disability Class: Hearing Difficulty
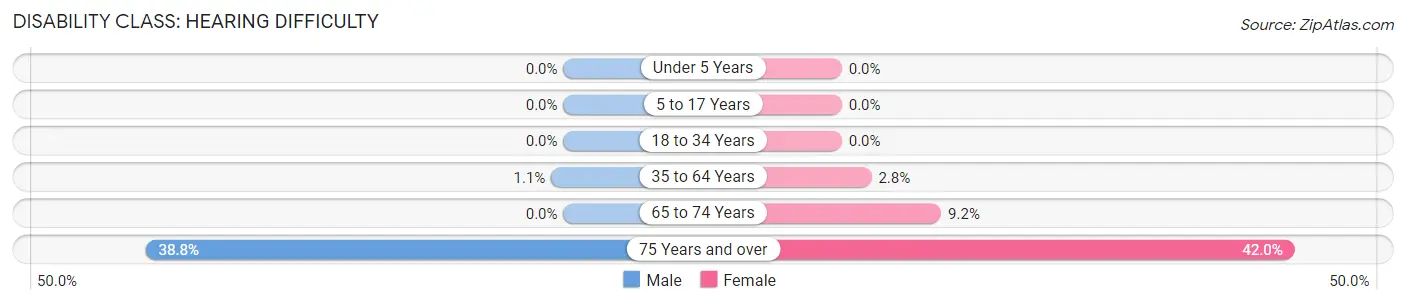
| Age Bracket | Male | Female |
| Under 5 Years | 0 (0.0%) | 0 (0.0%) |
| 5 to 17 Years | 0 (0.0%) | 0 (0.0%) |
| 18 to 34 Years | 0 (0.0%) | 0 (0.0%) |
| 35 to 64 Years | 8 (1.1%) | 13 (2.8%) |
| 65 to 74 Years | 0 (0.0%) | 19 (9.2%) |
| 75 Years and over | 50 (38.8%) | 79 (42.0%) |
Disability Class: Vision Difficulty
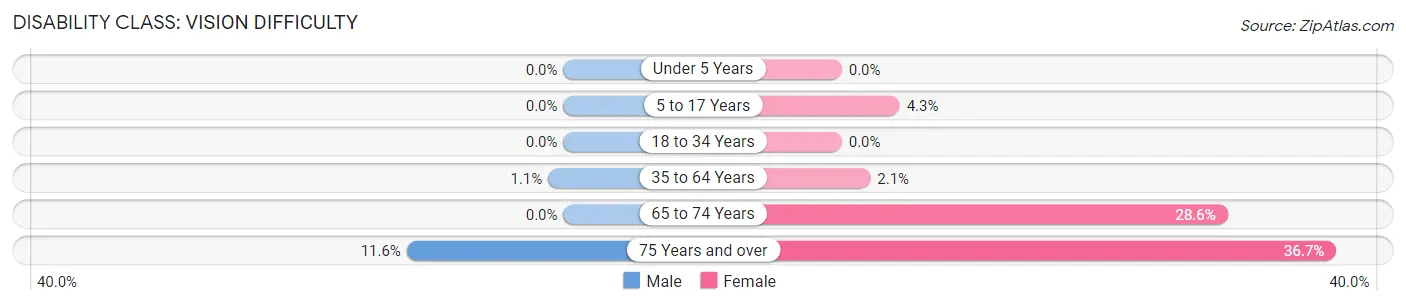
| Age Bracket | Male | Female |
| Under 5 Years | 0 (0.0%) | 0 (0.0%) |
| 5 to 17 Years | 0 (0.0%) | 11 (4.3%) |
| 18 to 34 Years | 0 (0.0%) | 0 (0.0%) |
| 35 to 64 Years | 8 (1.1%) | 10 (2.1%) |
| 65 to 74 Years | 0 (0.0%) | 59 (28.6%) |
| 75 Years and over | 15 (11.6%) | 69 (36.7%) |
Disability Class: Cognitive Difficulty
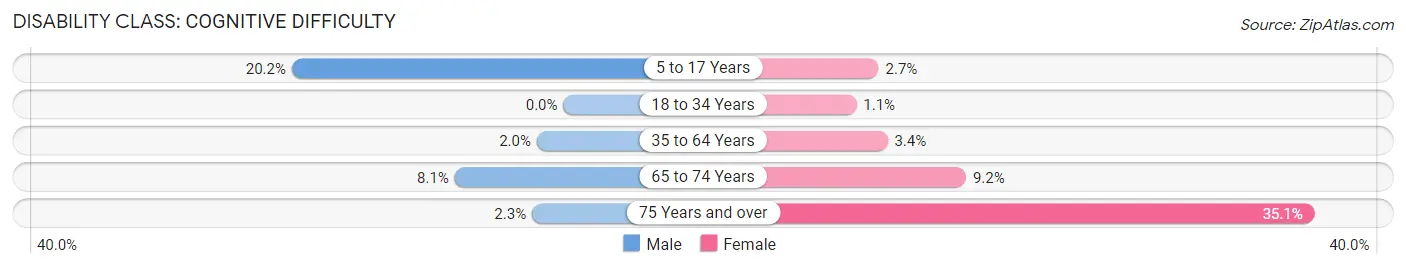
| Age Bracket | Male | Female |
| 5 to 17 Years | 25 (20.2%) | 7 (2.7%) |
| 18 to 34 Years | 0 (0.0%) | 4 (1.1%) |
| 35 to 64 Years | 14 (2.0%) | 16 (3.4%) |
| 65 to 74 Years | 18 (8.1%) | 19 (9.2%) |
| 75 Years and over | 3 (2.3%) | 66 (35.1%) |
Disability Class: Ambulatory Difficulty
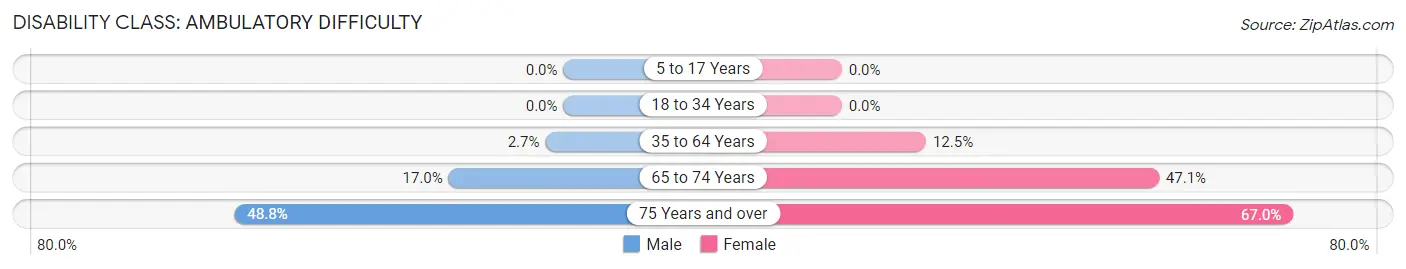
| Age Bracket | Male | Female |
| 5 to 17 Years | 0 (0.0%) | 0 (0.0%) |
| 18 to 34 Years | 0 (0.0%) | 0 (0.0%) |
| 35 to 64 Years | 19 (2.7%) | 59 (12.5%) |
| 65 to 74 Years | 38 (17.0%) | 97 (47.1%) |
| 75 Years and over | 63 (48.8%) | 126 (67.0%) |
Disability Class: Self-Care Difficulty
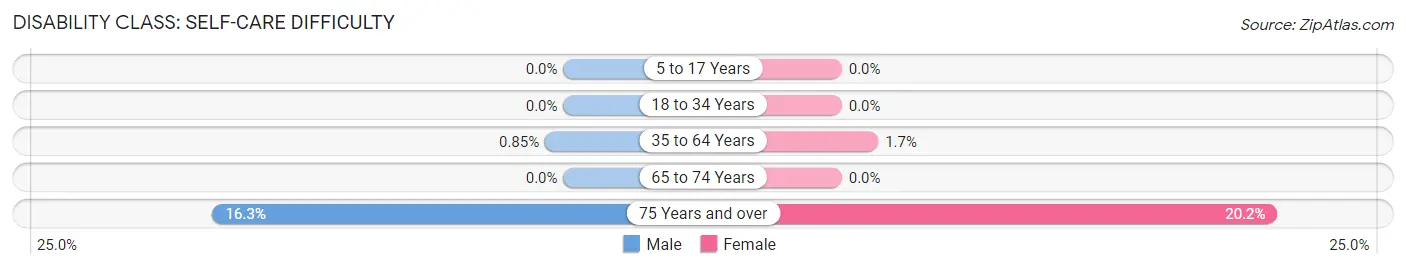
| Age Bracket | Male | Female |
| 5 to 17 Years | 0 (0.0%) | 0 (0.0%) |
| 18 to 34 Years | 0 (0.0%) | 0 (0.0%) |
| 35 to 64 Years | 6 (0.9%) | 8 (1.7%) |
| 65 to 74 Years | 0 (0.0%) | 0 (0.0%) |
| 75 Years and over | 21 (16.3%) | 38 (20.2%) |
Technology Access in Ticonderoga
Computing Device Access in Ticonderoga
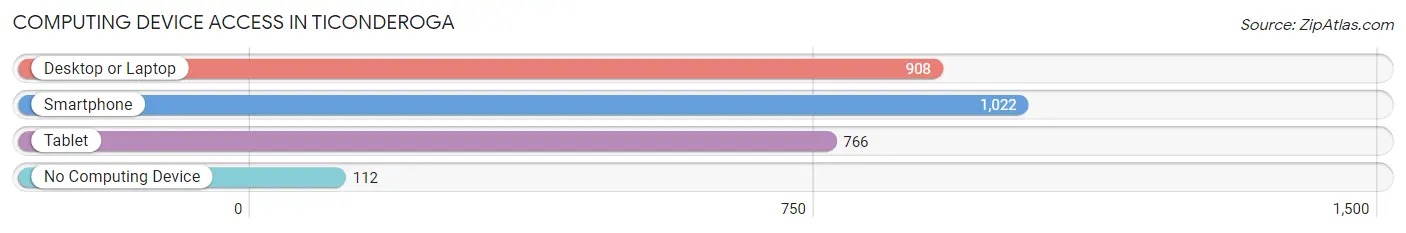
| Device Type | # Households | % Households |
| Desktop or Laptop | 908 | 67.8% |
| Smartphone | 1,022 | 76.3% |
| Tablet | 766 | 57.2% |
| No Computing Device | 112 | 8.4% |
| Total | 1,339 | 100.0% |
Internet Access in Ticonderoga
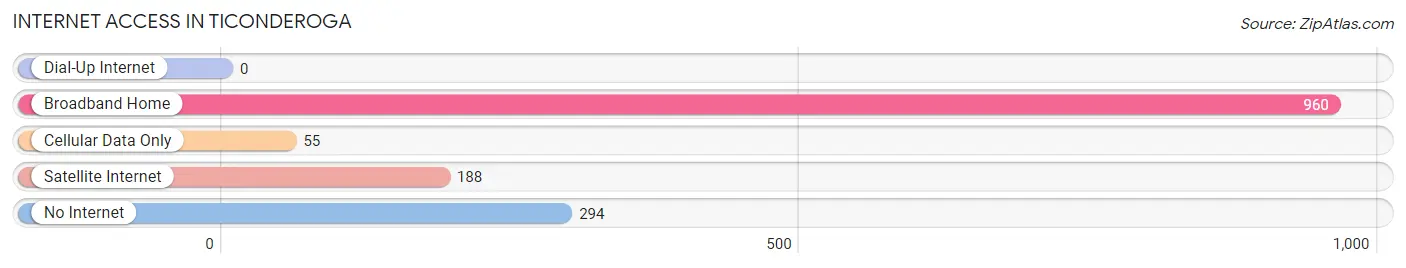
| Internet Type | # Households | % Households |
| Dial-Up Internet | 0 | 0.0% |
| Broadband Home | 960 | 71.7% |
| Cellular Data Only | 55 | 4.1% |
| Satellite Internet | 188 | 14.0% |
| No Internet | 294 | 22.0% |
| Total | 1,339 | 100.0% |
Ticonderoga Summary
Ticonderoga, New York is a small town located in the Adirondack Mountains of Essex County. It is situated on the western shore of Lake Champlain, near the border of Vermont. The town was first settled in 1759 by French and British forces during the French and Indian War. The town was named after the nearby fort, Fort Ticonderoga, which was built by the British in 1755.
History
The area that is now Ticonderoga was originally inhabited by the Iroquois and Algonquin tribes. The first Europeans to settle in the area were French fur traders in the late 1600s. The French built Fort Carillon (later renamed Fort Ticonderoga) in 1755 to protect their trading interests in the area. The fort was captured by the British in 1759 during the French and Indian War.
The town of Ticonderoga was officially established in 1764. The town was named after the nearby fort and was initially a farming community. In the late 1700s, the town began to develop into an industrial center, with the construction of several mills and factories. The town was also a major port on Lake Champlain, with ships carrying goods to and from Montreal and New York City.
In the early 1800s, Ticonderoga was a major producer of iron ore and charcoal. The town was also home to several paper mills, which produced paper for newspapers and books. The town was also a major producer of lumber, with several sawmills located in the area.
In the late 1800s, the town began to decline as the iron ore and charcoal industries moved away. The paper mills and sawmills also began to close. The town was revitalized in the early 1900s with the construction of a hydroelectric plant on the La Chute River. The plant provided electricity to the town and surrounding area.
Geography
Ticonderoga is located in the Adirondack Mountains of Essex County, New York. The town is situated on the western shore of Lake Champlain, near the border of Vermont. The town is bordered by the towns of Hague to the north, Putnam to the east, and Crown Point to the south. The town covers an area of approximately 11.5 square miles and has a population of approximately 5,000 people.
The town is located in a mountainous region, with several peaks reaching over 2,000 feet in elevation. The highest peak in the area is Mount Defiance, which rises to an elevation of 3,898 feet. The town is also home to several lakes, including Lake George, Lake Champlain, and Lake Ticonderoga.
Economy
The economy of Ticonderoga is largely based on tourism. The town is home to several attractions, including Fort Ticonderoga, the Ticonderoga Historical Society, and the Ticonderoga Heritage Museum. The town is also home to several outdoor recreation areas, including the Ticonderoga State Park and the La Chute River.
The town is also home to several manufacturing companies, including Ticonderoga Paper Products, which produces paper products for the printing industry. The town is also home to several retail stores, restaurants, and other businesses.
Demographics
As of the 2010 census, the population of Ticonderoga was 5,042. The racial makeup of the town was 95.3% White, 0.7% African American, 0.3% Native American, 0.7% Asian, 0.1% Pacific Islander, 1.2% from other races, and 1.9% from two or more races. Hispanic or Latino of any race were 3.2% of the population.
The median household income in Ticonderoga was $41,944, and the median family income was $50,917. The per capita income for the town was $20,945. About 11.2% of families and 14.2% of the population were below the poverty line, including 19.2% of those under age 18 and 8.2% of those age 65 or over.
Common Questions
What is Per Capita Income in Ticonderoga?
Per Capita income in Ticonderoga is $31,196.
What is the Median Family Income in Ticonderoga?
Median Family Income in Ticonderoga is $67,581.
What is the Median Household income in Ticonderoga?
Median Household Income in Ticonderoga is $49,215.
What is Income or Wage Gap in Ticonderoga?
Income or Wage Gap in Ticonderoga is 0.1%.
Women in Ticonderoga earn 99.9 cents for every dollar earned by a man.
What is Inequality or Gini Index in Ticonderoga?
Inequality or Gini Index in Ticonderoga is 0.46.
What is the Total Population of Ticonderoga?
Total Population of Ticonderoga is 3,399.
What is the Total Male Population of Ticonderoga?
Total Male Population of Ticonderoga is 1,715.
What is the Total Female Population of Ticonderoga?
Total Female Population of Ticonderoga is 1,684.
What is the Ratio of Males per 100 Females in Ticonderoga?
There are 101.84 Males per 100 Females in Ticonderoga.
What is the Ratio of Females per 100 Males in Ticonderoga?
There are 98.19 Females per 100 Males in Ticonderoga.
What is the Median Population Age in Ticonderoga?
Median Population Age in Ticonderoga is 43.3 Years.
What is the Average Family Size in Ticonderoga
Average Family Size in Ticonderoga is 3.0 People.
What is the Average Household Size in Ticonderoga
Average Household Size in Ticonderoga is 2.5 People.
How Large is the Labor Force in Ticonderoga?
There are 1,572 People in the Labor Forcein in Ticonderoga.
What is the Percentage of People in the Labor Force in Ticonderoga?
55.5% of People are in the Labor Force in Ticonderoga.
What is the Unemployment Rate in Ticonderoga?
Unemployment Rate in Ticonderoga is 6.7%.