Newport, NC Map & Demographics
Newport Map
Newport Overview
$39,819
PER CAPITA INCOME
$91,343
AVG FAMILY INCOME
$79,109
AVG HOUSEHOLD INCOME
50.0%
WAGE / INCOME GAP [ % ]
50.0¢/ $1
WAGE / INCOME GAP [ $ ]
0.47
INEQUALITY / GINI INDEX
4,407
TOTAL POPULATION
2,211
MALE POPULATION
2,196
FEMALE POPULATION
100.68
MALES / 100 FEMALES
99.32
FEMALES / 100 MALES
43.7
MEDIAN AGE
3.0
AVG FAMILY SIZE
2.4
AVG HOUSEHOLD SIZE
2,282
LABOR FORCE [ PEOPLE ]
59.2%
PERCENT IN LABOR FORCE
10.0%
UNEMPLOYMENT RATE
Newport Zip Codes
Newport Area Codes
Income in Newport
Income Overview in Newport
Per Capita Income in Newport is $39,819, while median incomes of families and households are $91,343 and $79,109 respectively.
| Characteristic | Number | Measure |
| Per Capita Income | 4,407 | $39,819 |
| Median Family Income | 1,122 | $91,343 |
| Mean Family Income | 1,122 | $122,316 |
| Median Household Income | 1,640 | $79,109 |
| Mean Household Income | 1,640 | $97,792 |
| Income Deficit | 1,122 | $0 |
| Wage / Income Gap (%) | 4,407 | 49.97% |
| Wage / Income Gap ($) | 4,407 | 50.03¢ per $1 |
| Gini / Inequality Index | 4,407 | 0.47 |
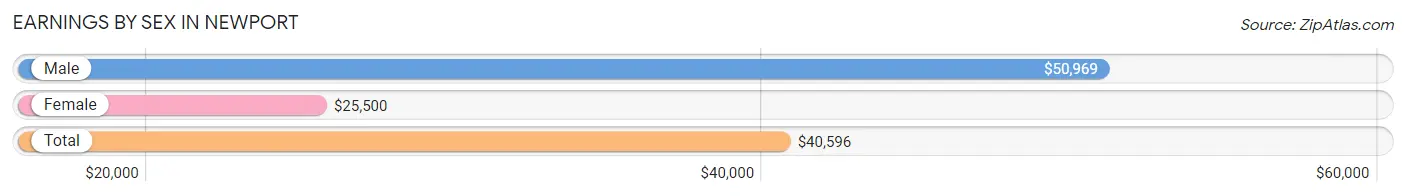
Earnings by Sex in Newport
Average Earnings in Newport are $40,596, $50,969 for men and $25,500 for women, a difference of 50.0%.
| Sex | Number | Average Earnings |
| Male | 1,296 (52.8%) | $50,969 |
| Female | 1,156 (47.1%) | $25,500 |
| Total | 2,452 (100.0%) | $40,596 |
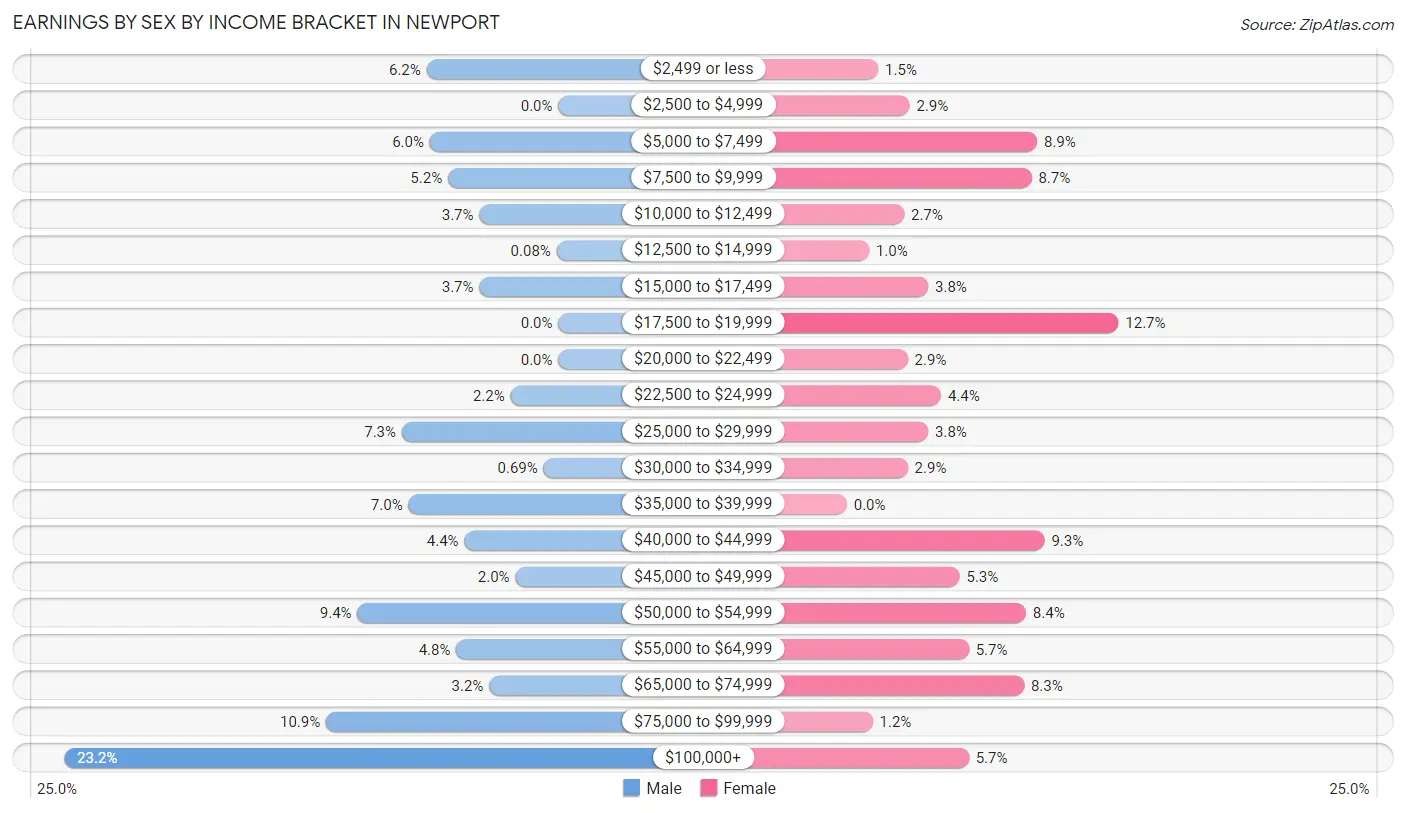
Earnings by Sex by Income Bracket in Newport
The most common earnings brackets in Newport are $100,000+ for men (300 | 23.2%) and $17,500 to $19,999 for women (147 | 12.7%).
| Income | Male | Female |
| $2,499 or less | 80 (6.2%) | 17 (1.5%) |
| $2,500 to $4,999 | 0 (0.0%) | 34 (2.9%) |
| $5,000 to $7,499 | 78 (6.0%) | 103 (8.9%) |
| $7,500 to $9,999 | 67 (5.2%) | 100 (8.6%) |
| $10,000 to $12,499 | 48 (3.7%) | 31 (2.7%) |
| $12,500 to $14,999 | 1 (0.1%) | 12 (1.0%) |
| $15,000 to $17,499 | 48 (3.7%) | 44 (3.8%) |
| $17,500 to $19,999 | 0 (0.0%) | 147 (12.7%) |
| $20,000 to $22,499 | 0 (0.0%) | 33 (2.9%) |
| $22,500 to $24,999 | 29 (2.2%) | 51 (4.4%) |
| $25,000 to $29,999 | 95 (7.3%) | 44 (3.8%) |
| $30,000 to $34,999 | 9 (0.7%) | 33 (2.9%) |
| $35,000 to $39,999 | 91 (7.0%) | 0 (0.0%) |
| $40,000 to $44,999 | 57 (4.4%) | 107 (9.3%) |
| $45,000 to $49,999 | 26 (2.0%) | 61 (5.3%) |
| $50,000 to $54,999 | 122 (9.4%) | 97 (8.4%) |
| $55,000 to $64,999 | 62 (4.8%) | 66 (5.7%) |
| $65,000 to $74,999 | 42 (3.2%) | 96 (8.3%) |
| $75,000 to $99,999 | 141 (10.9%) | 14 (1.2%) |
| $100,000+ | 300 (23.2%) | 66 (5.7%) |
| Total | 1,296 (100.0%) | 1,156 (100.0%) |
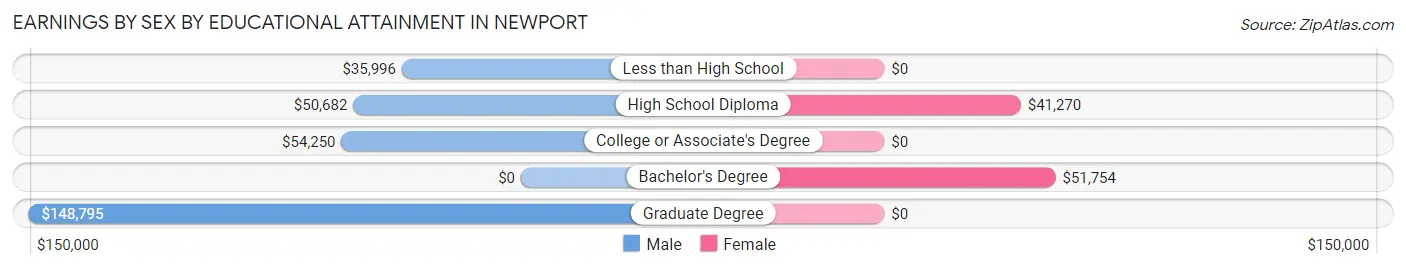
Earnings by Sex by Educational Attainment in Newport
Average earnings in Newport are $53,767 for men and $40,900 for women, a difference of 23.9%. Men with an educational attainment of graduate degree enjoy the highest average annual earnings of $148,795, while those with less than high school education earn the least with $35,996. Women with an educational attainment of bachelor's degree earn the most with the average annual earnings of $51,754, while those with high school diploma education have the smallest earnings of $41,270.
| Educational Attainment | Male Income | Female Income |
| Less than High School | $35,996 | $0 |
| High School Diploma | $50,682 | $41,270 |
| College or Associate's Degree | $54,250 | $0 |
| Bachelor's Degree | - | - |
| Graduate Degree | $148,795 | $0 |
| Total | $53,767 | $40,900 |
Family Income in Newport
Family Income Brackets in Newport
According to the Newport family income data, there are 289 families falling into the $150,000 to $199,999 income range, which is the most common income bracket and makes up 25.8% of all families.
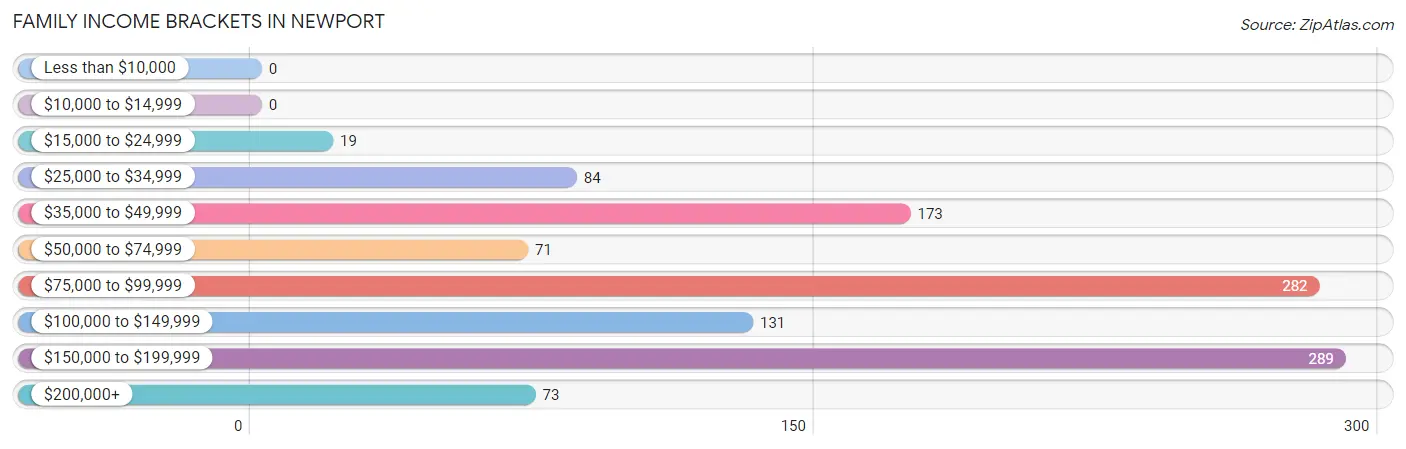
| Income Bracket | # Families | % Families |
| Less than $10,000 | 0 | 0.0% |
| $10,000 to $14,999 | 0 | 0.0% |
| $15,000 to $24,999 | 19 | 1.7% |
| $25,000 to $34,999 | 84 | 7.5% |
| $35,000 to $49,999 | 173 | 15.4% |
| $50,000 to $74,999 | 71 | 6.3% |
| $75,000 to $99,999 | 282 | 25.1% |
| $100,000 to $149,999 | 131 | 11.7% |
| $150,000 to $199,999 | 289 | 25.8% |
| $200,000+ | 73 | 6.5% |
Family Income by Famaliy Size in Newport
4-person families (205 | 18.3%) account for the highest median family income in Newport with $168,750 per family, while 4-person families (205 | 18.3%) have the highest median income of $42,188 per family member.
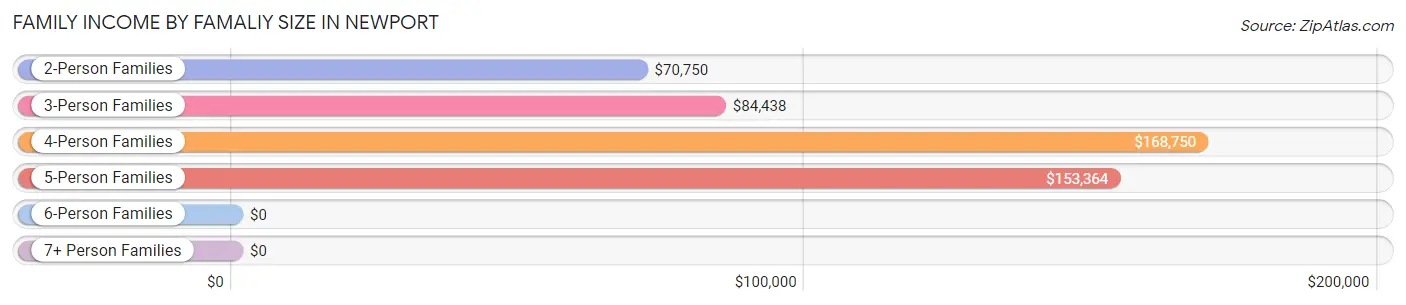
| Income Bracket | # Families | Median Income |
| 2-Person Families | 565 (50.4%) | $70,750 |
| 3-Person Families | 245 (21.8%) | $84,438 |
| 4-Person Families | 205 (18.3%) | $168,750 |
| 5-Person Families | 72 (6.4%) | $153,364 |
| 6-Person Families | 35 (3.1%) | $0 |
| 7+ Person Families | 0 (0.0%) | $0 |
| Total | 1,122 (100.0%) | $91,343 |
Family Income by Number of Earners in Newport
The median family income in Newport is $91,343, with families comprising 3+ earners (219) having the highest median family income of $134,083, while families with no earners (218) have the lowest median family income of $38,864, accounting for 19.5% and 19.4% of families, respectively.
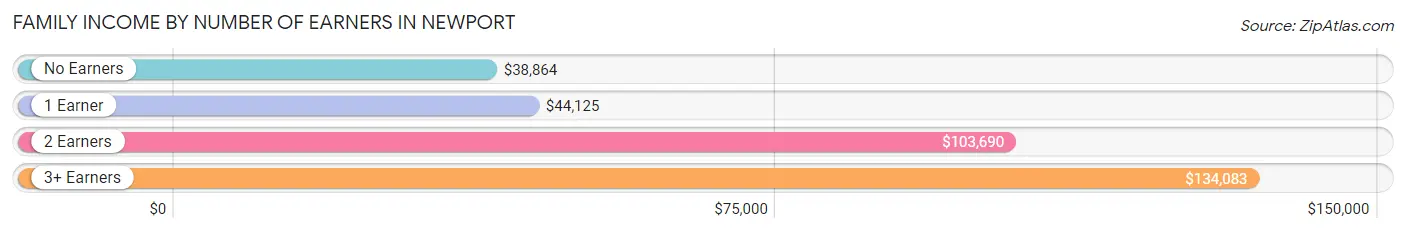
| Number of Earners | # Families | Median Income |
| No Earners | 218 (19.4%) | $38,864 |
| 1 Earner | 119 (10.6%) | $44,125 |
| 2 Earners | 566 (50.4%) | $103,690 |
| 3+ Earners | 219 (19.5%) | $134,083 |
| Total | 1,122 (100.0%) | $91,343 |
Household Income in Newport
Household Income Brackets in Newport
With 335 households falling in the category, the $75,000 to $99,999 income range is the most frequent in Newport, accounting for 20.4% of all households. In contrast, only 64 households (3.9%) fall into the $10,000 to $14,999 income bracket, making it the least populous group.
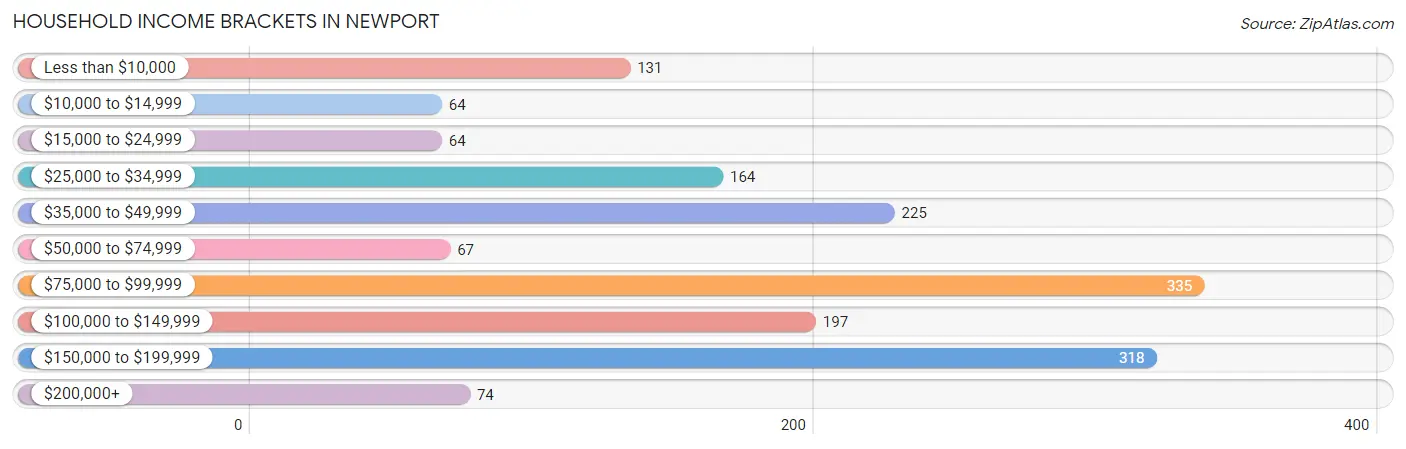
| Income Bracket | # Households | % Households |
| Less than $10,000 | 131 | 8.0% |
| $10,000 to $14,999 | 64 | 3.9% |
| $15,000 to $24,999 | 64 | 3.9% |
| $25,000 to $34,999 | 164 | 10.0% |
| $35,000 to $49,999 | 225 | 13.7% |
| $50,000 to $74,999 | 67 | 4.1% |
| $75,000 to $99,999 | 335 | 20.4% |
| $100,000 to $149,999 | 197 | 12.0% |
| $150,000 to $199,999 | 318 | 19.4% |
| $200,000+ | 74 | 4.5% |
Household Income by Householder Age in Newport
The median household income in Newport is $79,109, with the highest median household income of $102,419 found in the 25 to 44 years age bracket for the primary householder. A total of 594 households (36.2%) fall into this category. Meanwhile, the 15 to 24 years age bracket for the primary householder has the lowest median household income of $0, with 8 households (0.5%) in this group.
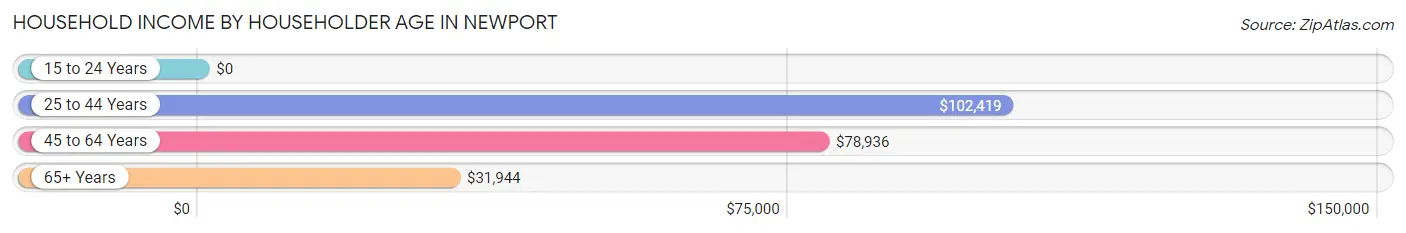
| Income Bracket | # Households | Median Income |
| 15 to 24 Years | 8 (0.5%) | $0 |
| 25 to 44 Years | 594 (36.2%) | $102,419 |
| 45 to 64 Years | 624 (38.1%) | $78,936 |
| 65+ Years | 414 (25.2%) | $31,944 |
| Total | 1,640 (100.0%) | $79,109 |
Poverty in Newport
Income Below Poverty by Sex and Age in Newport
With 3.9% poverty level for males and 7.9% for females among the residents of Newport, 45 to 54 year old males and 55 to 64 year old females are the most vulnerable to poverty, with 58 males (24.9%) and 64 females (20.4%) in their respective age groups living below the poverty level.
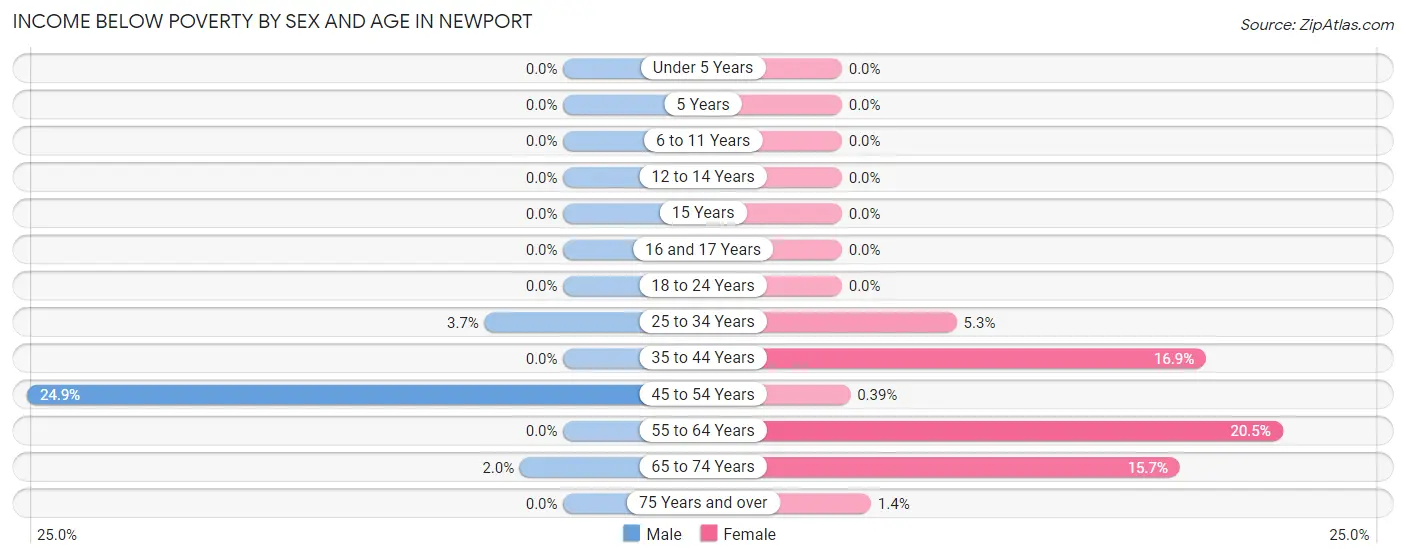
| Age Bracket | Male | Female |
| Under 5 Years | 0 (0.0%) | 0 (0.0%) |
| 5 Years | 0 (0.0%) | 0 (0.0%) |
| 6 to 11 Years | 0 (0.0%) | 0 (0.0%) |
| 12 to 14 Years | 0 (0.0%) | 0 (0.0%) |
| 15 Years | 0 (0.0%) | 0 (0.0%) |
| 16 and 17 Years | 0 (0.0%) | 0 (0.0%) |
| 18 to 24 Years | 0 (0.0%) | 0 (0.0%) |
| 25 to 34 Years | 10 (3.6%) | 13 (5.3%) |
| 35 to 44 Years | 0 (0.0%) | 60 (16.9%) |
| 45 to 54 Years | 58 (24.9%) | 1 (0.4%) |
| 55 to 64 Years | 0 (0.0%) | 64 (20.4%) |
| 65 to 74 Years | 3 (2.0%) | 29 (15.7%) |
| 75 Years and over | 0 (0.0%) | 2 (1.3%) |
| Total | 71 (3.9%) | 169 (7.9%) |
Income Above Poverty by Sex and Age in Newport
According to the poverty statistics in Newport, males aged under 5 years and females aged under 5 years are the age groups that are most secure financially, with 100.0% of males and 100.0% of females in these age groups living above the poverty line.
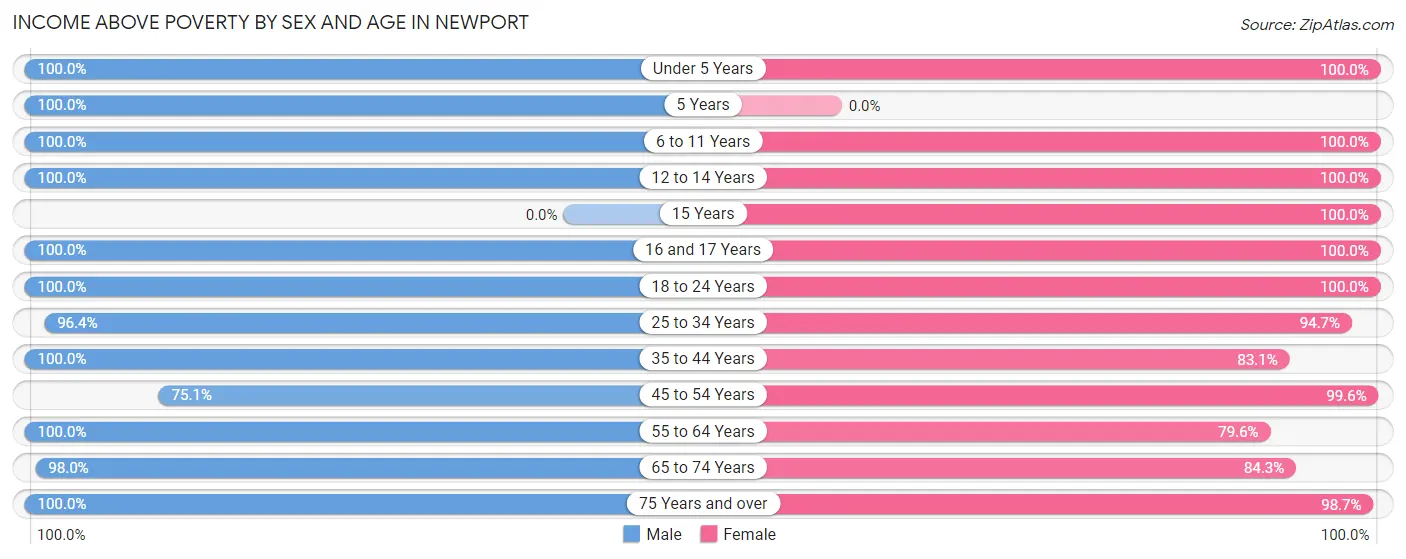
| Age Bracket | Male | Female |
| Under 5 Years | 39 (100.0%) | 12 (100.0%) |
| 5 Years | 17 (100.0%) | 0 (0.0%) |
| 6 to 11 Years | 43 (100.0%) | 187 (100.0%) |
| 12 to 14 Years | 107 (100.0%) | 97 (100.0%) |
| 15 Years | 0 (0.0%) | 50 (100.0%) |
| 16 and 17 Years | 74 (100.0%) | 94 (100.0%) |
| 18 to 24 Years | 174 (100.0%) | 194 (100.0%) |
| 25 to 34 Years | 264 (96.4%) | 231 (94.7%) |
| 35 to 44 Years | 323 (100.0%) | 295 (83.1%) |
| 45 to 54 Years | 175 (75.1%) | 256 (99.6%) |
| 55 to 64 Years | 280 (100.0%) | 249 (79.5%) |
| 65 to 74 Years | 146 (98.0%) | 156 (84.3%) |
| 75 Years and over | 119 (100.0%) | 146 (98.7%) |
| Total | 1,761 (96.1%) | 1,967 (92.1%) |
Income Below Poverty Among Married-Couple Families in Newport
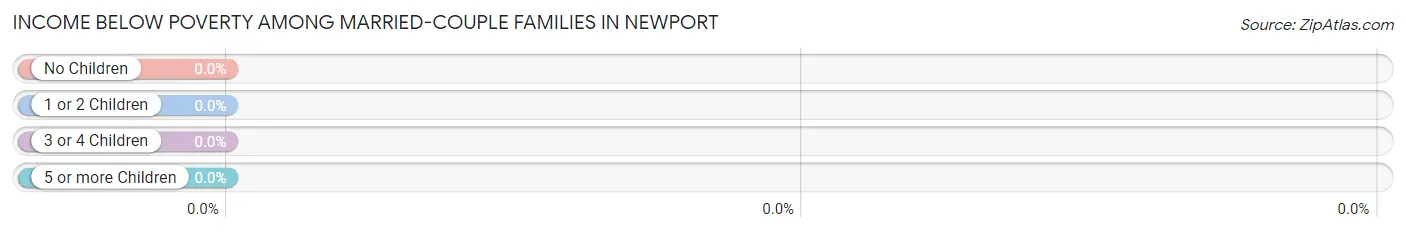
| Children | Above Poverty | Below Poverty |
| No Children | 576 (100.0%) | 0 (0.0%) |
| 1 or 2 Children | 323 (100.0%) | 0 (0.0%) |
| 3 or 4 Children | 46 (100.0%) | 0 (0.0%) |
| 5 or more Children | 0 (0.0%) | 0 (0.0%) |
| Total | 945 (100.0%) | 0 (0.0%) |
Income Below Poverty Among Single-Parent Households in Newport
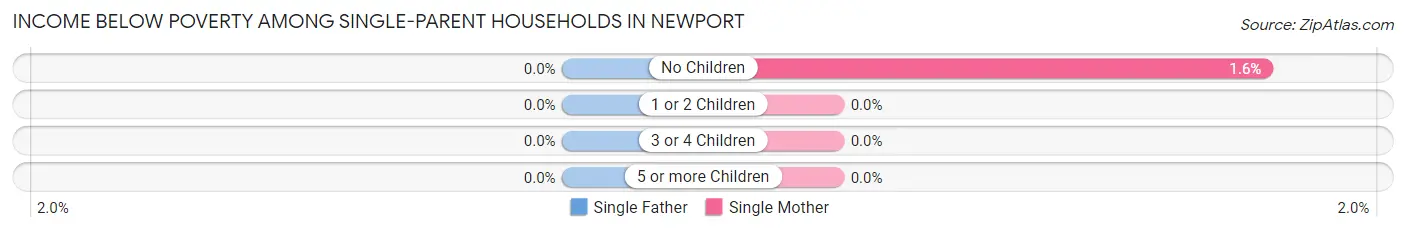
| Children | Single Father | Single Mother |
| No Children | 0 (0.0%) | 2 (1.6%) |
| 1 or 2 Children | 0 (0.0%) | 0 (0.0%) |
| 3 or 4 Children | 0 (0.0%) | 0 (0.0%) |
| 5 or more Children | 0 (0.0%) | 0 (0.0%) |
| Total | 0 (0.0%) | 2 (1.3%) |
Income Below Poverty Among Married-Couple vs Single-Parent Households in Newport
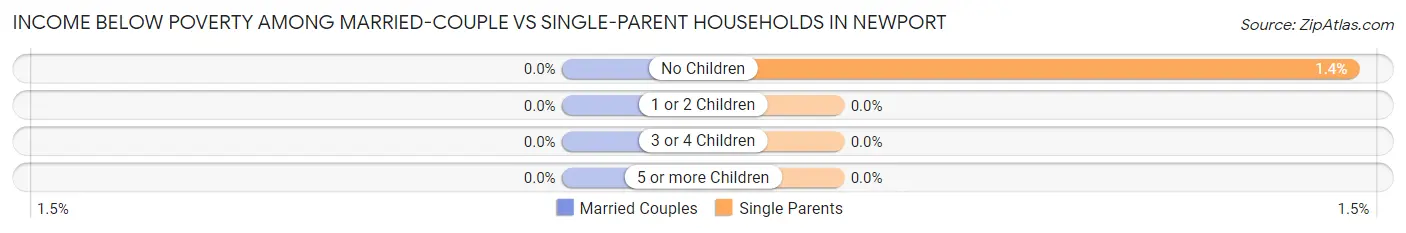
| Children | Married-Couple Families | Single-Parent Households |
| No Children | 0 (0.0%) | 2 (1.4%) |
| 1 or 2 Children | 0 (0.0%) | 0 (0.0%) |
| 3 or 4 Children | 0 (0.0%) | 0 (0.0%) |
| 5 or more Children | 0 (0.0%) | 0 (0.0%) |
| Total | 0 (0.0%) | 2 (1.1%) |
Race in Newport
The most populous races in Newport are White / Caucasian (3,808 | 86.4%), Hispanic or Latino (306 | 6.9%), and Black / African American (289 | 6.6%).
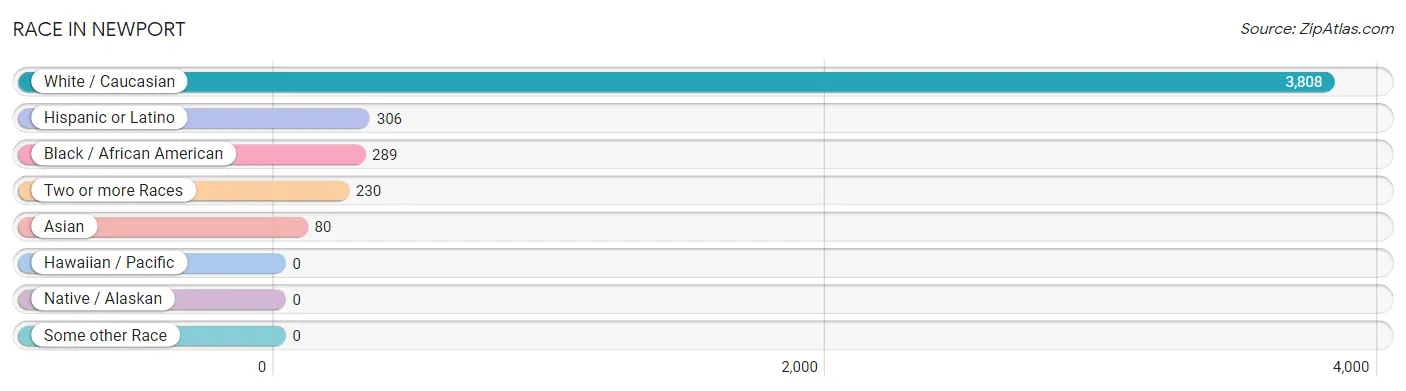
| Race | # Population | % Population |
| Asian | 80 | 1.8% |
| Black / African American | 289 | 6.6% |
| Hawaiian / Pacific | 0 | 0.0% |
| Hispanic or Latino | 306 | 6.9% |
| Native / Alaskan | 0 | 0.0% |
| White / Caucasian | 3,808 | 86.4% |
| Two or more Races | 230 | 5.2% |
| Some other Race | 0 | 0.0% |
| Total | 4,407 | 100.0% |
Ancestry in Newport
The most populous ancestries reported in Newport are English (938 | 21.3%), Irish (891 | 20.2%), German (826 | 18.7%), Polish (335 | 7.6%), and American (214 | 4.9%), together accounting for 72.7% of all Newport residents.
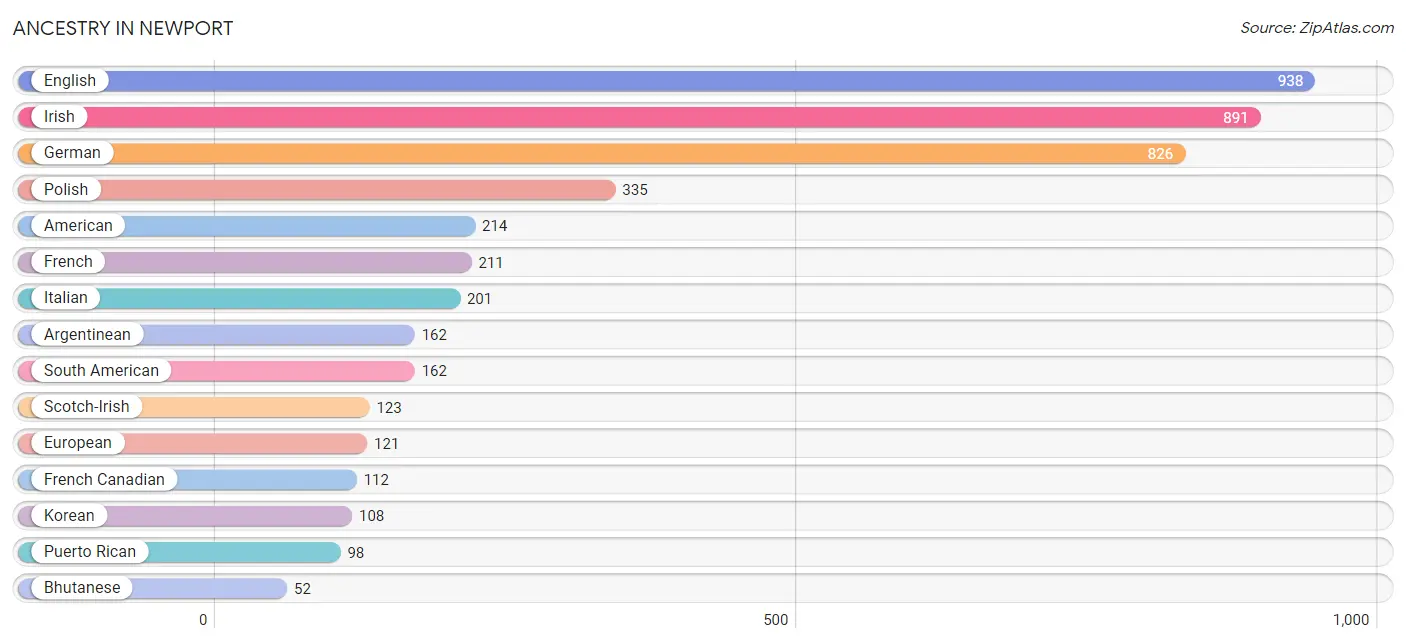
| Ancestry | # Population | % Population |
| African | 3 | 0.1% |
| American | 214 | 4.9% |
| Apache | 10 | 0.2% |
| Arab | 4 | 0.1% |
| Argentinean | 162 | 3.7% |
| Bhutanese | 52 | 1.2% |
| British | 1 | 0.0% |
| Central American | 16 | 0.4% |
| Cherokee | 18 | 0.4% |
| Cuban | 8 | 0.2% |
| Czech | 4 | 0.1% |
| Eastern European | 29 | 0.7% |
| English | 938 | 21.3% |
| European | 121 | 2.8% |
| French | 211 | 4.8% |
| French Canadian | 112 | 2.5% |
| German | 826 | 18.7% |
| Greek | 37 | 0.8% |
| Haitian | 35 | 0.8% |
| Irish | 891 | 20.2% |
| Italian | 201 | 4.6% |
| Jamaican | 1 | 0.0% |
| Korean | 108 | 2.5% |
| Panamanian | 1 | 0.0% |
| Polish | 335 | 7.6% |
| Portuguese | 5 | 0.1% |
| Puerto Rican | 98 | 2.2% |
| Romanian | 1 | 0.0% |
| Russian | 14 | 0.3% |
| Salvadoran | 15 | 0.3% |
| Scotch-Irish | 123 | 2.8% |
| Scottish | 37 | 0.8% |
| Slavic | 46 | 1.0% |
| Slovak | 14 | 0.3% |
| South American | 162 | 3.7% |
| Subsaharan African | 3 | 0.1% | View All 36 Rows |
Immigrants in Newport
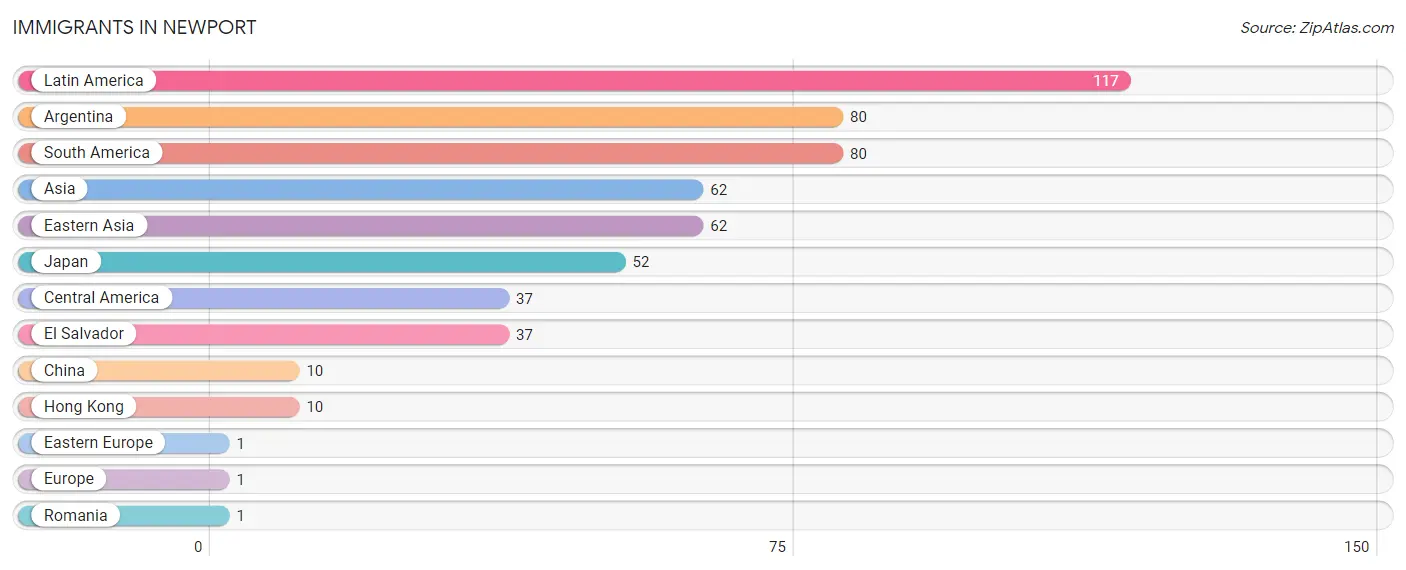
The most numerous immigrant groups reported in Newport came from Latin America (117 | 2.6%), Argentina (80 | 1.8%), South America (80 | 1.8%), Asia (62 | 1.4%), and Eastern Asia (62 | 1.4%), together accounting for 9.1% of all Newport residents.
| Immigration Origin | # Population | % Population |
| Argentina | 80 | 1.8% |
| Asia | 62 | 1.4% |
| Central America | 37 | 0.8% |
| China | 10 | 0.2% |
| Eastern Asia | 62 | 1.4% |
| Eastern Europe | 1 | 0.0% |
| El Salvador | 37 | 0.8% |
| Europe | 1 | 0.0% |
| Hong Kong | 10 | 0.2% |
| Japan | 52 | 1.2% |
| Latin America | 117 | 2.6% |
| Romania | 1 | 0.0% |
| South America | 80 | 1.8% | View All 13 Rows |
Sex and Age in Newport
Sex and Age in Newport
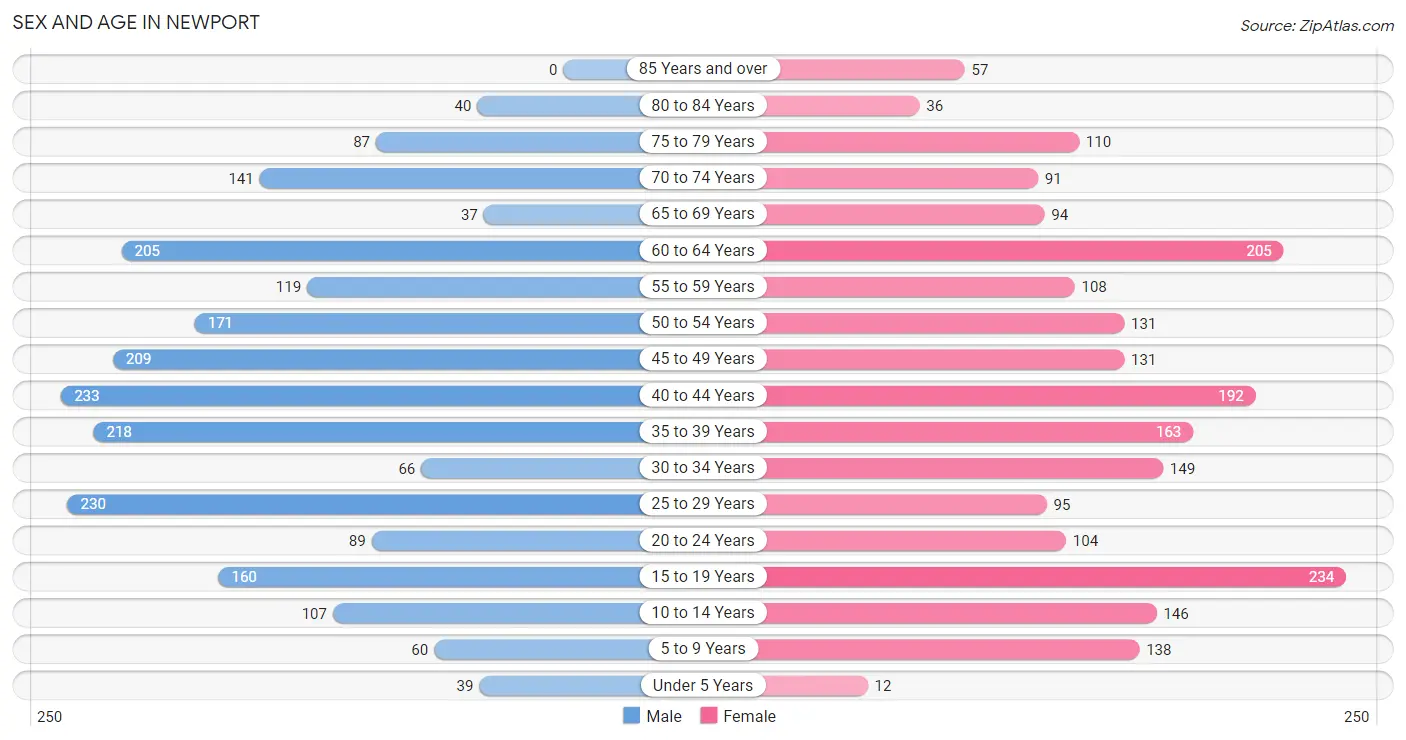
The most populous age groups in Newport are 40 to 44 Years (233 | 10.5%) for men and 15 to 19 Years (234 | 10.7%) for women.
| Age Bracket | Male | Female |
| Under 5 Years | 39 (1.8%) | 12 (0.5%) |
| 5 to 9 Years | 60 (2.7%) | 138 (6.3%) |
| 10 to 14 Years | 107 (4.8%) | 146 (6.7%) |
| 15 to 19 Years | 160 (7.2%) | 234 (10.7%) |
| 20 to 24 Years | 89 (4.0%) | 104 (4.7%) |
| 25 to 29 Years | 230 (10.4%) | 95 (4.3%) |
| 30 to 34 Years | 66 (3.0%) | 149 (6.8%) |
| 35 to 39 Years | 218 (9.9%) | 163 (7.4%) |
| 40 to 44 Years | 233 (10.5%) | 192 (8.7%) |
| 45 to 49 Years | 209 (9.5%) | 131 (6.0%) |
| 50 to 54 Years | 171 (7.7%) | 131 (6.0%) |
| 55 to 59 Years | 119 (5.4%) | 108 (4.9%) |
| 60 to 64 Years | 205 (9.3%) | 205 (9.3%) |
| 65 to 69 Years | 37 (1.7%) | 94 (4.3%) |
| 70 to 74 Years | 141 (6.4%) | 91 (4.1%) |
| 75 to 79 Years | 87 (3.9%) | 110 (5.0%) |
| 80 to 84 Years | 40 (1.8%) | 36 (1.6%) |
| 85 Years and over | 0 (0.0%) | 57 (2.6%) |
| Total | 2,211 (100.0%) | 2,196 (100.0%) |
Families and Households in Newport
Median Family Size in Newport
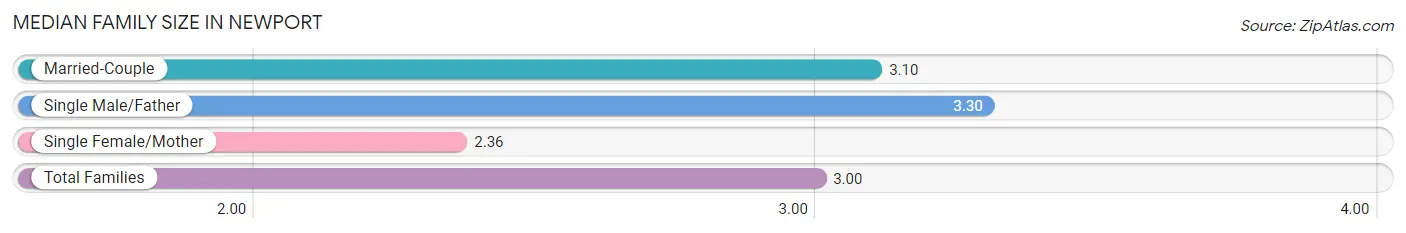
The median family size in Newport is 3.00 persons per family, with single male/father families (20 | 1.8%) accounting for the largest median family size of 3.3 persons per family. On the other hand, single female/mother families (157 | 14.0%) represent the smallest median family size with 2.36 persons per family.
| Family Type | # Families | Family Size |
| Married-Couple | 945 (84.2%) | 3.10 |
| Single Male/Father | 20 (1.8%) | 3.30 |
| Single Female/Mother | 157 (14.0%) | 2.36 |
| Total Families | 1,122 (100.0%) | 3.00 |
Median Household Size in Newport
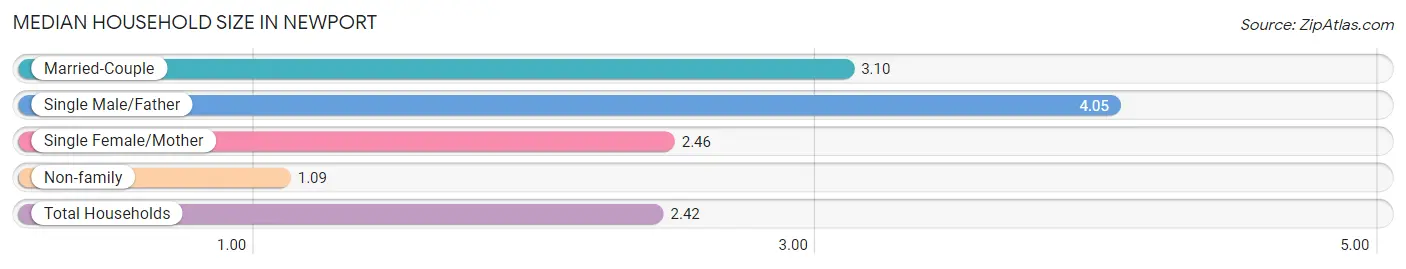
The median household size in Newport is 2.42 persons per household, with single male/father households (20 | 1.2%) accounting for the largest median household size of 4.05 persons per household. non-family households (518 | 31.6%) represent the smallest median household size with 1.09 persons per household.
| Household Type | # Households | Household Size |
| Married-Couple | 945 (57.6%) | 3.10 |
| Single Male/Father | 20 (1.2%) | 4.05 |
| Single Female/Mother | 157 (9.6%) | 2.46 |
| Non-family | 518 (31.6%) | 1.09 |
| Total Households | 1,640 (100.0%) | 2.42 |
Household Size by Marriage Status in Newport
Out of a total of 1,640 households in Newport, 1,122 (68.4%) are family households, while 518 (31.6%) are nonfamily households. The most numerous type of family households are 2-person households, comprising 534, and the most common type of nonfamily households are 1-person households, comprising 477.
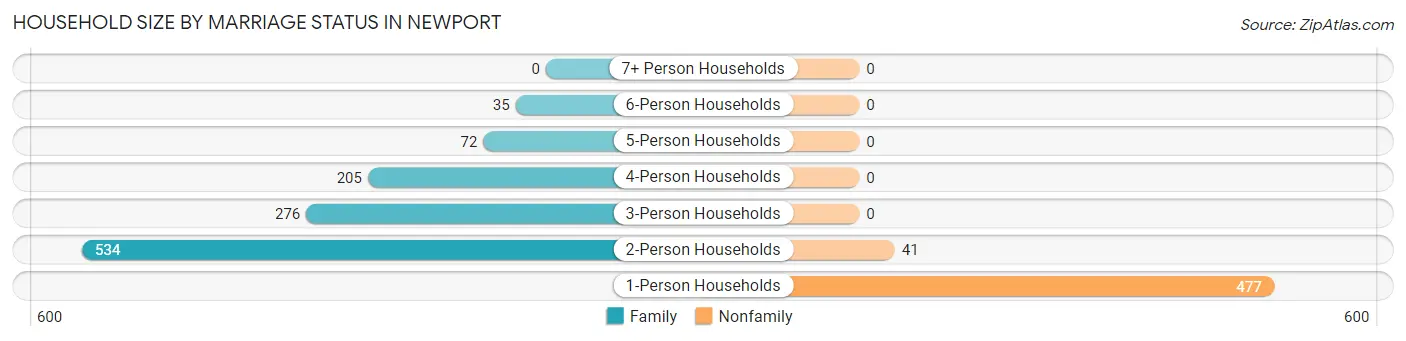
| Household Size | Family Households | Nonfamily Households |
| 1-Person Households | - | 477 (29.1%) |
| 2-Person Households | 534 (32.6%) | 41 (2.5%) |
| 3-Person Households | 276 (16.8%) | 0 (0.0%) |
| 4-Person Households | 205 (12.5%) | 0 (0.0%) |
| 5-Person Households | 72 (4.4%) | 0 (0.0%) |
| 6-Person Households | 35 (2.1%) | 0 (0.0%) |
| 7+ Person Households | 0 (0.0%) | 0 (0.0%) |
| Total | 1,122 (68.4%) | 518 (31.6%) |
Female Fertility in Newport
Fertility by Age in Newport
Average fertility rate in Newport is 20.0 births per 1,000 women. Women in the age bracket of 20 to 34 years have the highest fertility rate with 63.0 births per 1,000 women. Women in the age bracket of 20 to 34 years acount for 100.0% of all women with births.
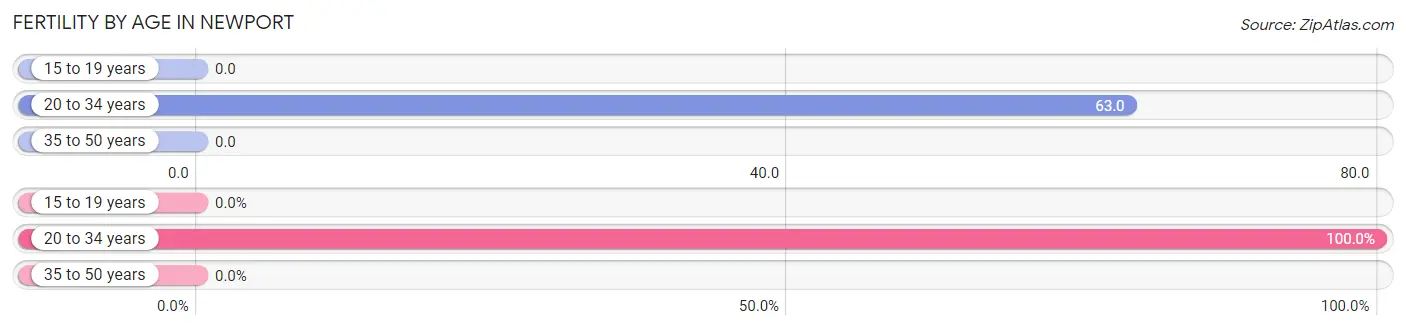
| Age Bracket | Women with Births | Births / 1,000 Women |
| 15 to 19 years | 0 (0.0%) | 0.0 |
| 20 to 34 years | 22 (100.0%) | 63.0 |
| 35 to 50 years | 0 (0.0%) | 0.0 |
| Total | 22 (100.0%) | 20.0 |
Fertility by Age by Marriage Status in Newport
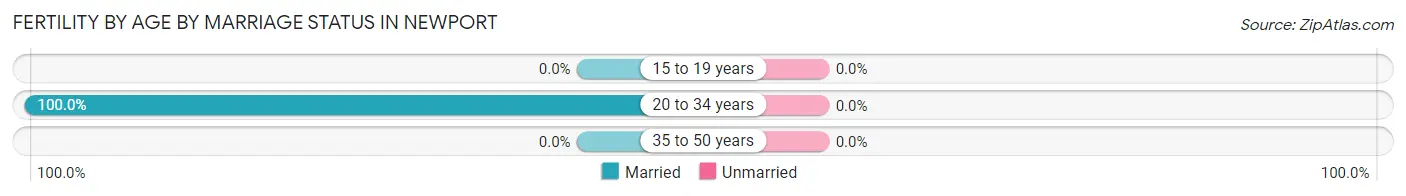
| Age Bracket | Married | Unmarried |
| 15 to 19 years | 0 (0.0%) | 0 (0.0%) |
| 20 to 34 years | 22 (100.0%) | 0 (0.0%) |
| 35 to 50 years | 0 (0.0%) | 0 (0.0%) |
| Total | 22 (100.0%) | 0 (0.0%) |
Fertility by Education in Newport
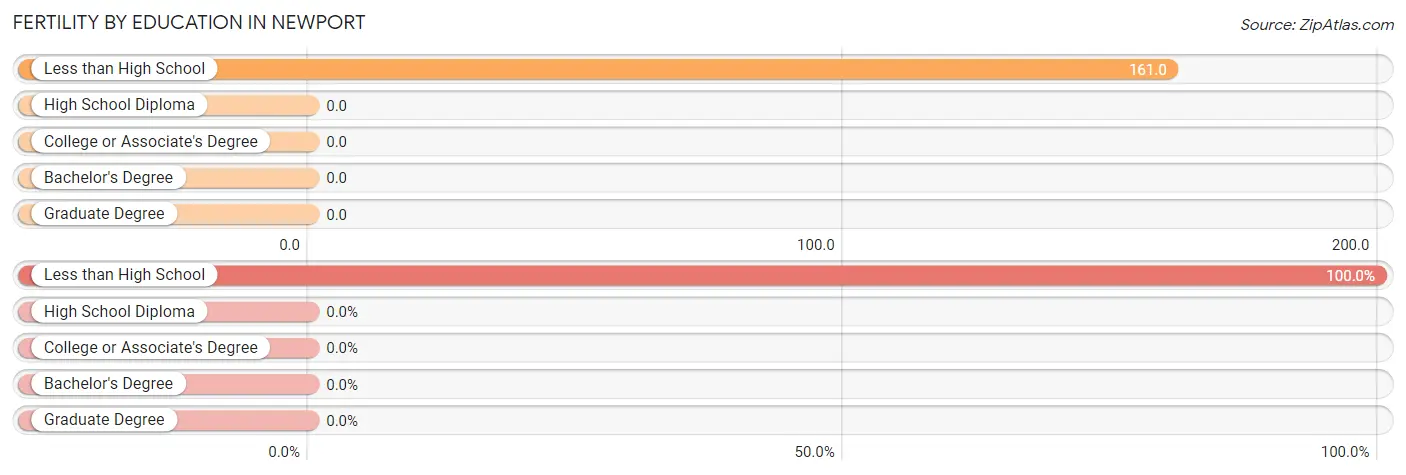
| Educational Attainment | Women with Births | Births / 1,000 Women |
| Less than High School | 22 (100.0%) | 161.0 |
| High School Diploma | 0 (0.0%) | 0.0 |
| College or Associate's Degree | 0 (0.0%) | 0.0 |
| Bachelor's Degree | 0 (0.0%) | 0.0 |
| Graduate Degree | 0 (0.0%) | 0.0 |
| Total | 22 (100.0%) | 20.0 |
Fertility by Education by Marriage Status in Newport
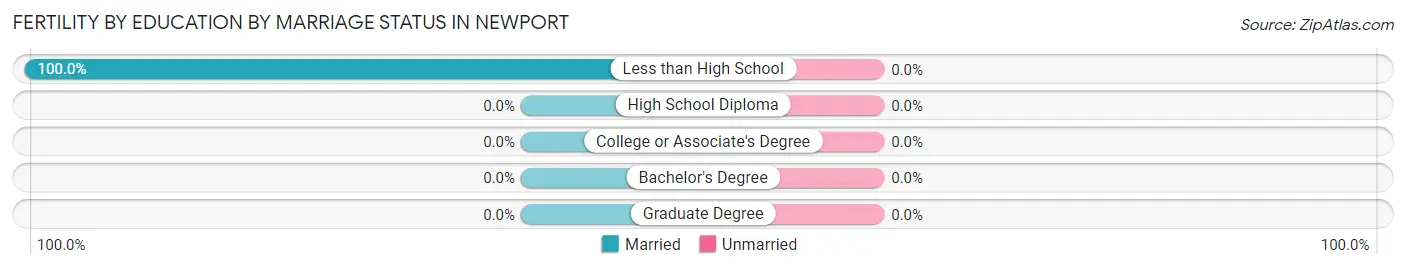
| Educational Attainment | Married | Unmarried |
| Less than High School | 22 (100.0%) | 0 (0.0%) |
| High School Diploma | 0 (0.0%) | 0 (0.0%) |
| College or Associate's Degree | 0 (0.0%) | 0 (0.0%) |
| Bachelor's Degree | 0 (0.0%) | 0 (0.0%) |
| Graduate Degree | 0 (0.0%) | 0 (0.0%) |
| Total | 22 (100.0%) | 0 (0.0%) |
Employment Characteristics in Newport
Employment by Class of Employer in Newport
Among the 2,055 employed individuals in Newport, private company employees (1,007 | 49.0%), federal government employees (418 | 20.3%), and local government employees (203 | 9.9%) make up the most common classes of employment.
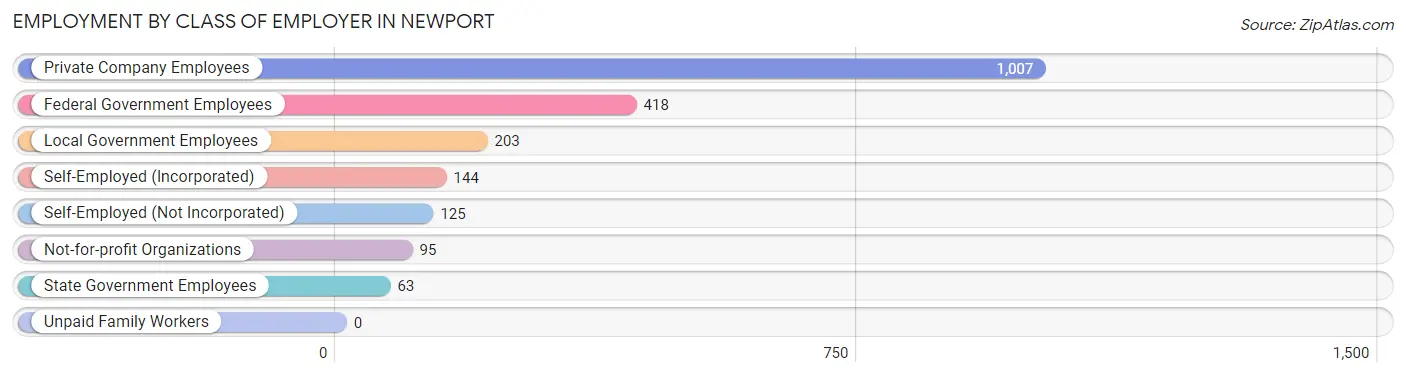
| Employer Class | # Employees | % Employees |
| Private Company Employees | 1,007 | 49.0% |
| Self-Employed (Incorporated) | 144 | 7.0% |
| Self-Employed (Not Incorporated) | 125 | 6.1% |
| Not-for-profit Organizations | 95 | 4.6% |
| Local Government Employees | 203 | 9.9% |
| State Government Employees | 63 | 3.1% |
| Federal Government Employees | 418 | 20.3% |
| Unpaid Family Workers | 0 | 0.0% |
| Total | 2,055 | 100.0% |
Employment Status by Age in Newport
According to the labor force statistics for Newport, out of the total population over 16 years of age (3,855), 59.2% or 2,282 individuals are in the labor force, with 10.0% or 228 of them unemployed. The age group with the highest labor force participation rate is 20 to 24 years, with 95.3% or 184 individuals in the labor force. Within the labor force, the 75 years and over age range has the highest percentage of unemployed individuals, with 100.0% or 10 of them being unemployed.
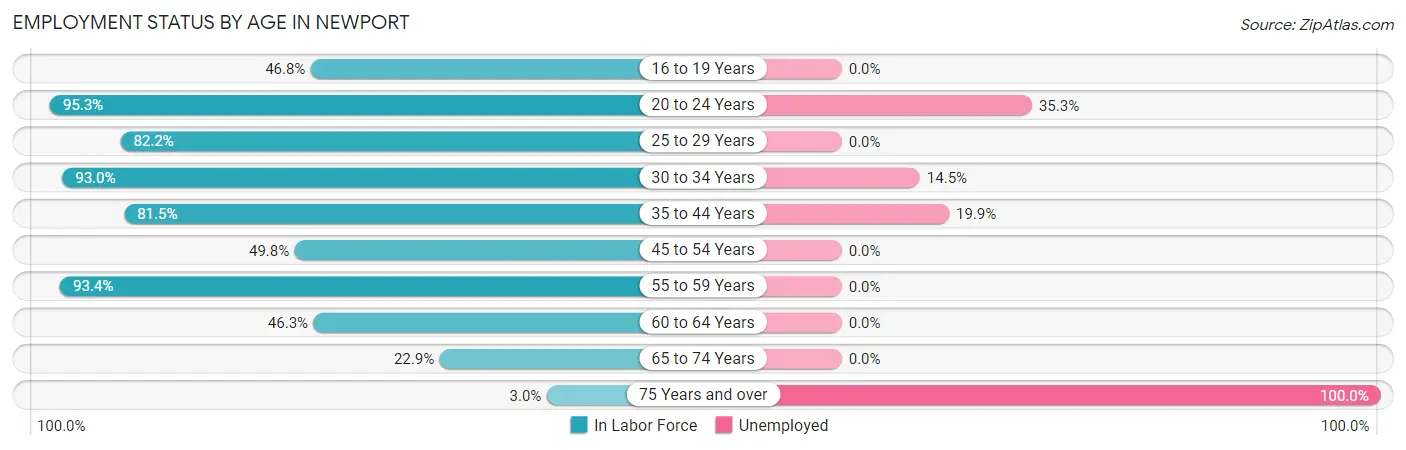
| Age Bracket | In Labor Force | Unemployed |
| 16 to 19 Years | 161 (46.8%) | 0 (0.0%) |
| 20 to 24 Years | 184 (95.3%) | 65 (35.3%) |
| 25 to 29 Years | 267 (82.2%) | 0 (0.0%) |
| 30 to 34 Years | 200 (93.0%) | 29 (14.5%) |
| 35 to 44 Years | 657 (81.5%) | 131 (19.9%) |
| 45 to 54 Years | 320 (49.8%) | 0 (0.0%) |
| 55 to 59 Years | 212 (93.4%) | 0 (0.0%) |
| 60 to 64 Years | 190 (46.3%) | 0 (0.0%) |
| 65 to 74 Years | 83 (22.9%) | 0 (0.0%) |
| 75 Years and over | 10 (3.0%) | 10 (100.0%) |
| Total | 2,282 (59.2%) | 228 (10.0%) |
Employment Status by Educational Attainment in Newport
According to labor force statistics for Newport, 70.3% of individuals (1,845) out of the total population between 25 and 64 years of age (2,625) are in the labor force, with 8.2% or 151 of them being unemployed. The group with the highest labor force participation rate are those with the educational attainment of bachelor's degree or higher, with 84.2% or 579 individuals in the labor force. Within the labor force, individuals with bachelor's degree or higher education have the highest percentage of unemployment, with 10.7% or 62 of them being unemployed.
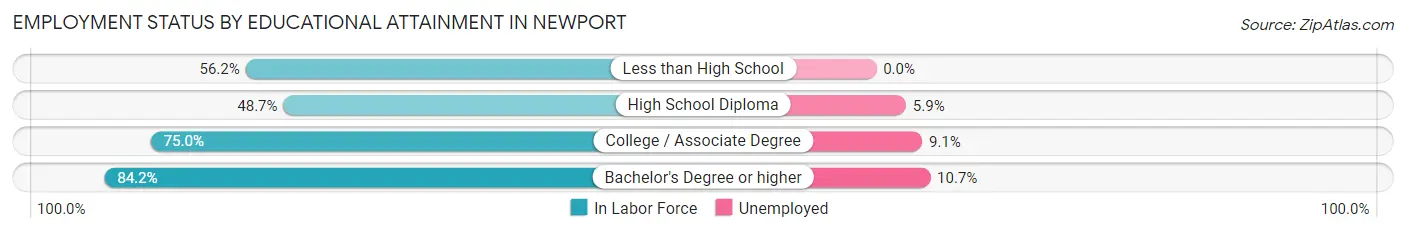
| Educational Attainment | In Labor Force | Unemployed |
| Less than High School | 186 (56.2%) | 0 (0.0%) |
| High School Diploma | 228 (48.7%) | 28 (5.9%) |
| College / Associate Degree | 854 (75.0%) | 104 (9.1%) |
| Bachelor's Degree or higher | 579 (84.2%) | 74 (10.7%) |
| Total | 1,845 (70.3%) | 215 (8.2%) |
Employment Occupations by Sex in Newport
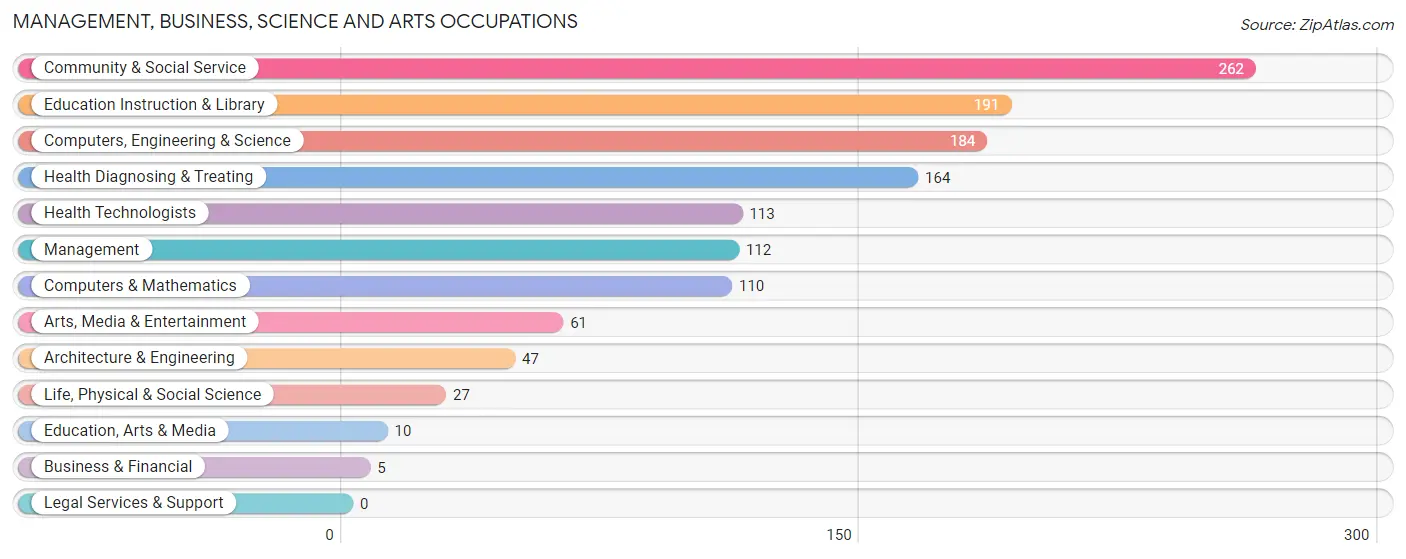
Management, Business, Science and Arts Occupations
The most common Management, Business, Science and Arts occupations in Newport are Community & Social Service (262 | 13.2%), Education Instruction & Library (191 | 9.6%), Computers, Engineering & Science (184 | 9.3%), Health Diagnosing & Treating (164 | 8.3%), and Health Technologists (113 | 5.7%).
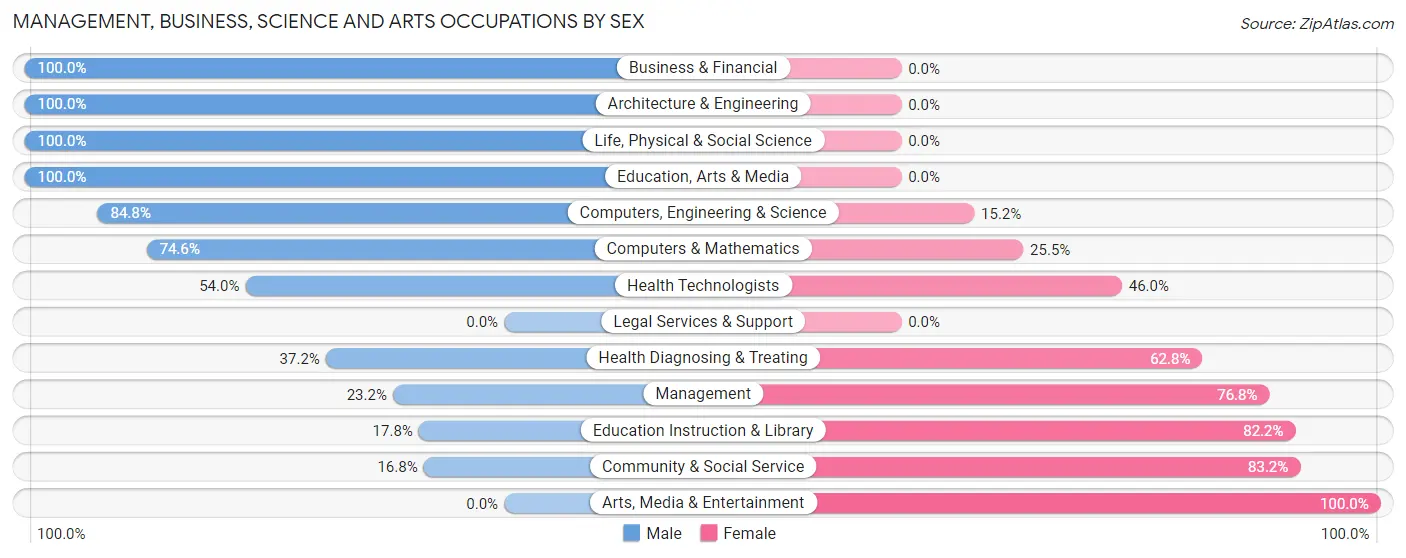
Management, Business, Science and Arts Occupations by Sex
Within the Management, Business, Science and Arts occupations in Newport, the most male-oriented occupations are Business & Financial (100.0%), Architecture & Engineering (100.0%), and Life, Physical & Social Science (100.0%), while the most female-oriented occupations are Arts, Media & Entertainment (100.0%), Community & Social Service (83.2%), and Education Instruction & Library (82.2%).
| Occupation | Male | Female |
| Management | 26 (23.2%) | 86 (76.8%) |
| Business & Financial | 5 (100.0%) | 0 (0.0%) |
| Computers, Engineering & Science | 156 (84.8%) | 28 (15.2%) |
| Computers & Mathematics | 82 (74.6%) | 28 (25.5%) |
| Architecture & Engineering | 47 (100.0%) | 0 (0.0%) |
| Life, Physical & Social Science | 27 (100.0%) | 0 (0.0%) |
| Community & Social Service | 44 (16.8%) | 218 (83.2%) |
| Education, Arts & Media | 10 (100.0%) | 0 (0.0%) |
| Legal Services & Support | 0 (0.0%) | 0 (0.0%) |
| Education Instruction & Library | 34 (17.8%) | 157 (82.2%) |
| Arts, Media & Entertainment | 0 (0.0%) | 61 (100.0%) |
| Health Diagnosing & Treating | 61 (37.2%) | 103 (62.8%) |
| Health Technologists | 61 (54.0%) | 52 (46.0%) |
| Total (Category) | 292 (40.2%) | 435 (59.8%) |
| Total (Overall) | 982 (49.5%) | 1,001 (50.5%) |
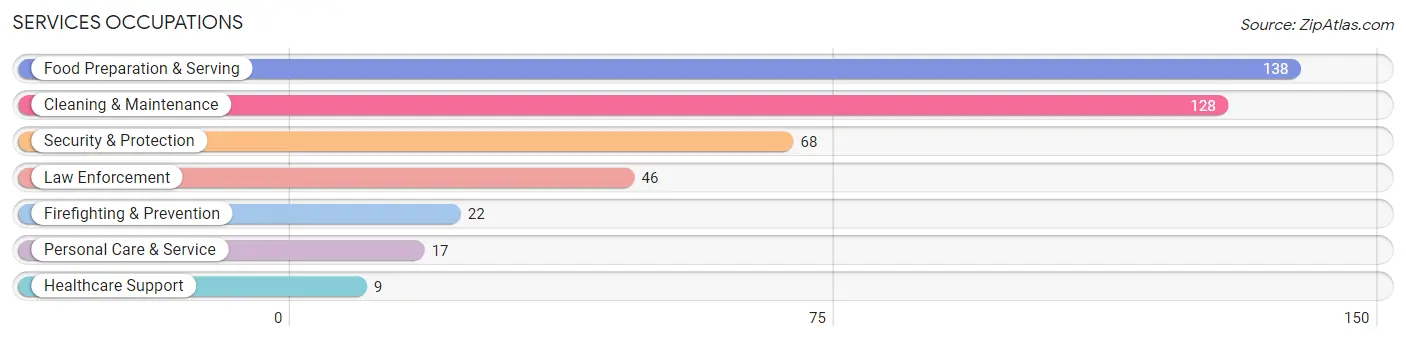
Services Occupations
The most common Services occupations in Newport are Food Preparation & Serving (138 | 7.0%), Cleaning & Maintenance (128 | 6.5%), Security & Protection (68 | 3.4%), Law Enforcement (46 | 2.3%), and Firefighting & Prevention (22 | 1.1%).
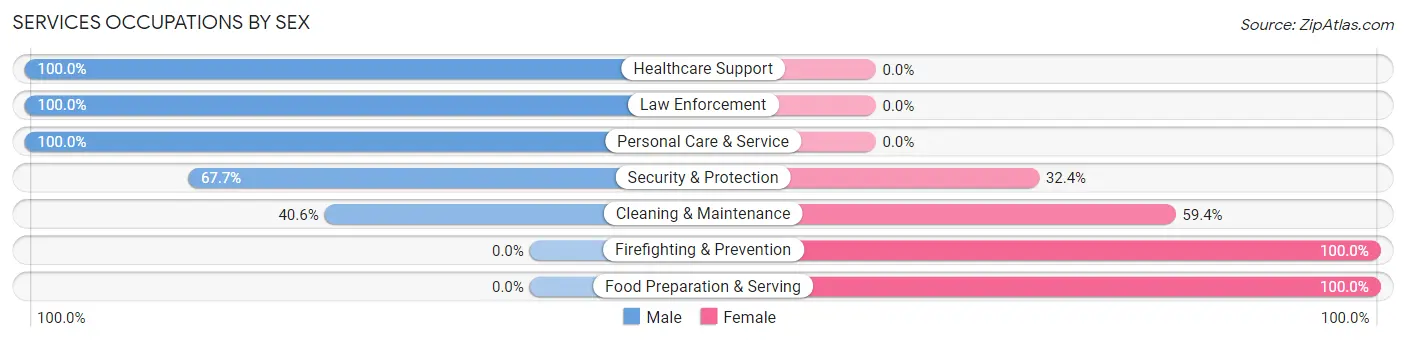
Services Occupations by Sex
Within the Services occupations in Newport, the most male-oriented occupations are Healthcare Support (100.0%), Law Enforcement (100.0%), and Personal Care & Service (100.0%), while the most female-oriented occupations are Firefighting & Prevention (100.0%), Food Preparation & Serving (100.0%), and Cleaning & Maintenance (59.4%).
| Occupation | Male | Female |
| Healthcare Support | 9 (100.0%) | 0 (0.0%) |
| Security & Protection | 46 (67.6%) | 22 (32.4%) |
| Firefighting & Prevention | 0 (0.0%) | 22 (100.0%) |
| Law Enforcement | 46 (100.0%) | 0 (0.0%) |
| Food Preparation & Serving | 0 (0.0%) | 138 (100.0%) |
| Cleaning & Maintenance | 52 (40.6%) | 76 (59.4%) |
| Personal Care & Service | 17 (100.0%) | 0 (0.0%) |
| Total (Category) | 124 (34.4%) | 236 (65.6%) |
| Total (Overall) | 982 (49.5%) | 1,001 (50.5%) |
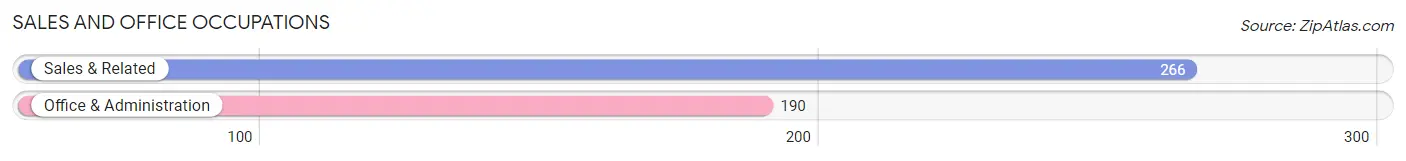
Sales and Office Occupations
The most common Sales and Office occupations in Newport are Sales & Related (266 | 13.4%), and Office & Administration (190 | 9.6%).
Sales and Office Occupations by Sex
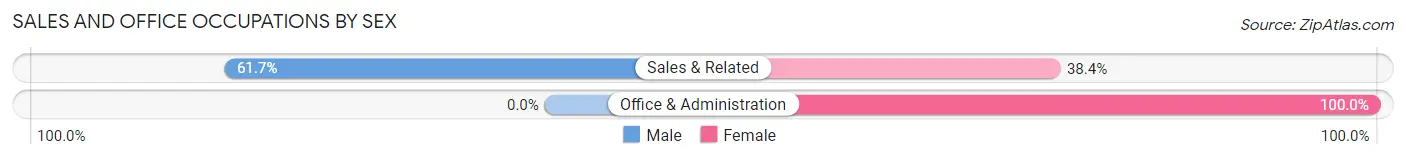
| Occupation | Male | Female |
| Sales & Related | 164 (61.7%) | 102 (38.4%) |
| Office & Administration | 0 (0.0%) | 190 (100.0%) |
| Total (Category) | 164 (36.0%) | 292 (64.0%) |
| Total (Overall) | 982 (49.5%) | 1,001 (50.5%) |
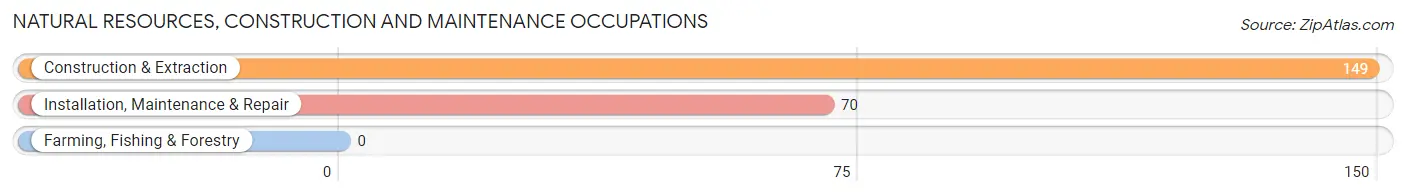
Natural Resources, Construction and Maintenance Occupations
The most common Natural Resources, Construction and Maintenance occupations in Newport are Construction & Extraction (149 | 7.5%), and Installation, Maintenance & Repair (70 | 3.5%).
Natural Resources, Construction and Maintenance Occupations by Sex
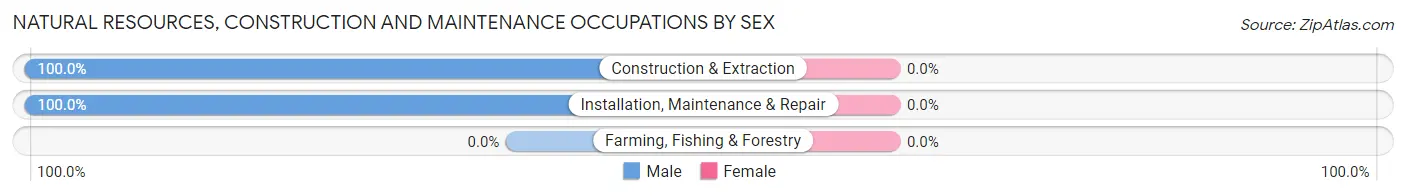
| Occupation | Male | Female |
| Farming, Fishing & Forestry | 0 (0.0%) | 0 (0.0%) |
| Construction & Extraction | 149 (100.0%) | 0 (0.0%) |
| Installation, Maintenance & Repair | 70 (100.0%) | 0 (0.0%) |
| Total (Category) | 219 (100.0%) | 0 (0.0%) |
| Total (Overall) | 982 (49.5%) | 1,001 (50.5%) |
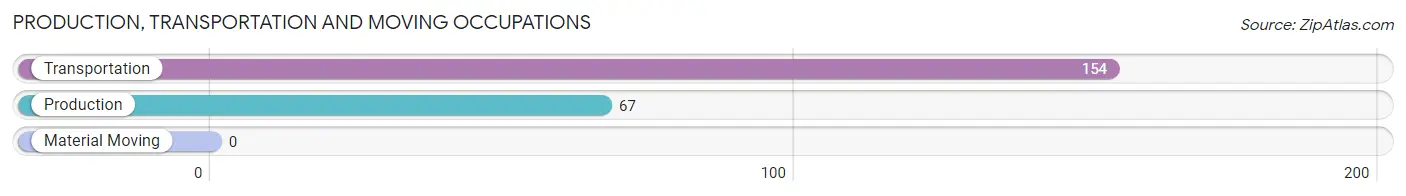
Production, Transportation and Moving Occupations
The most common Production, Transportation and Moving occupations in Newport are Transportation (154 | 7.8%), and Production (67 | 3.4%).
Production, Transportation and Moving Occupations by Sex
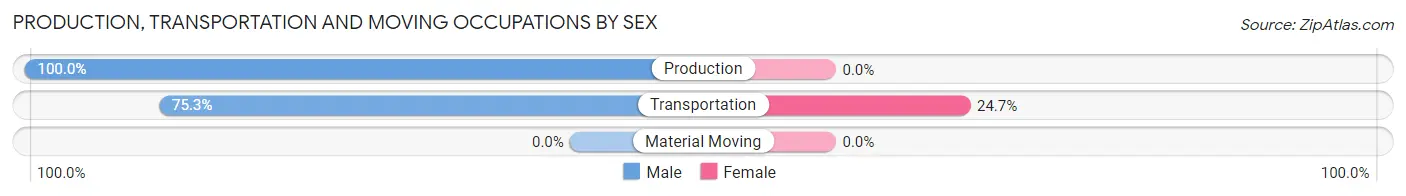
| Occupation | Male | Female |
| Production | 67 (100.0%) | 0 (0.0%) |
| Transportation | 116 (75.3%) | 38 (24.7%) |
| Material Moving | 0 (0.0%) | 0 (0.0%) |
| Total (Category) | 183 (82.8%) | 38 (17.2%) |
| Total (Overall) | 982 (49.5%) | 1,001 (50.5%) |
Employment Industries by Sex in Newport
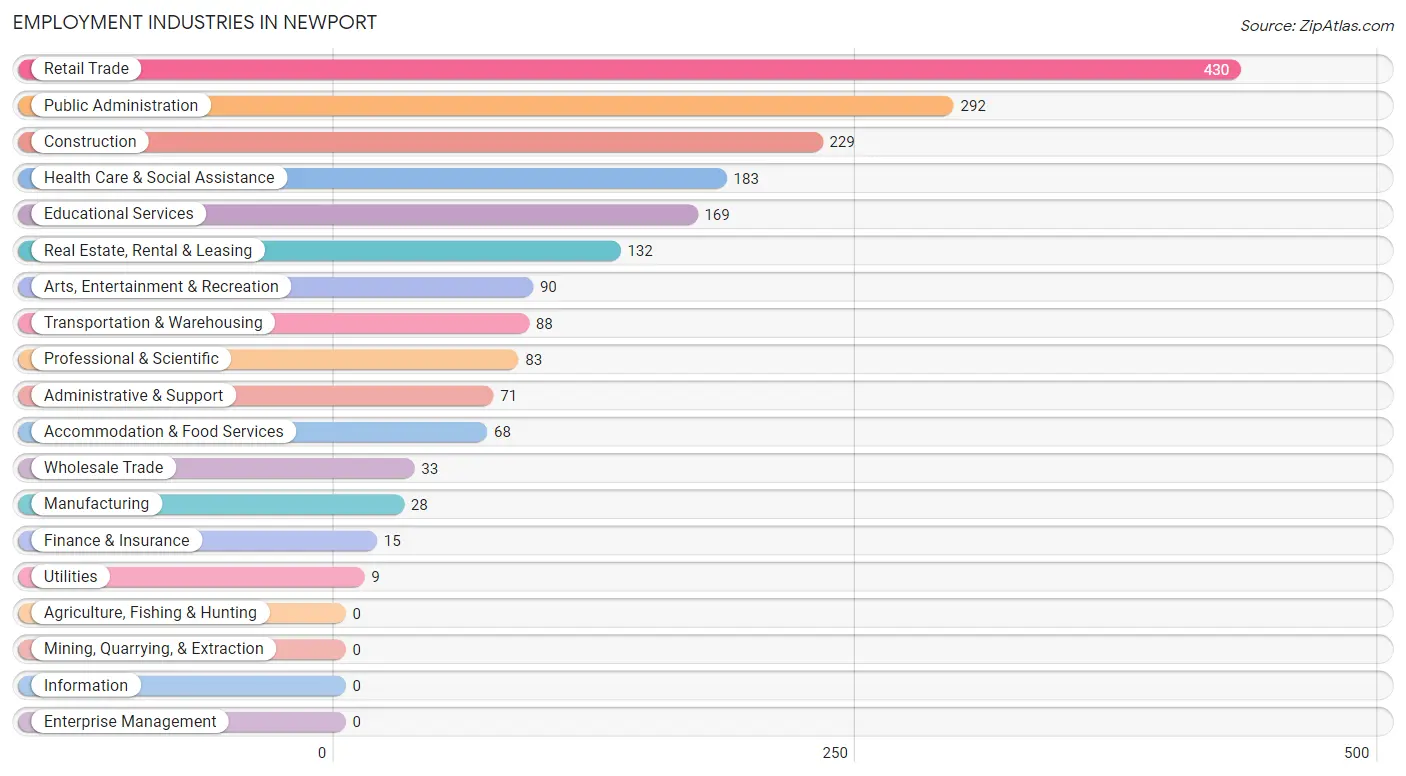
Employment Industries in Newport
The major employment industries in Newport include Retail Trade (430 | 21.7%), Public Administration (292 | 14.7%), Construction (229 | 11.6%), Health Care & Social Assistance (183 | 9.2%), and Educational Services (169 | 8.5%).
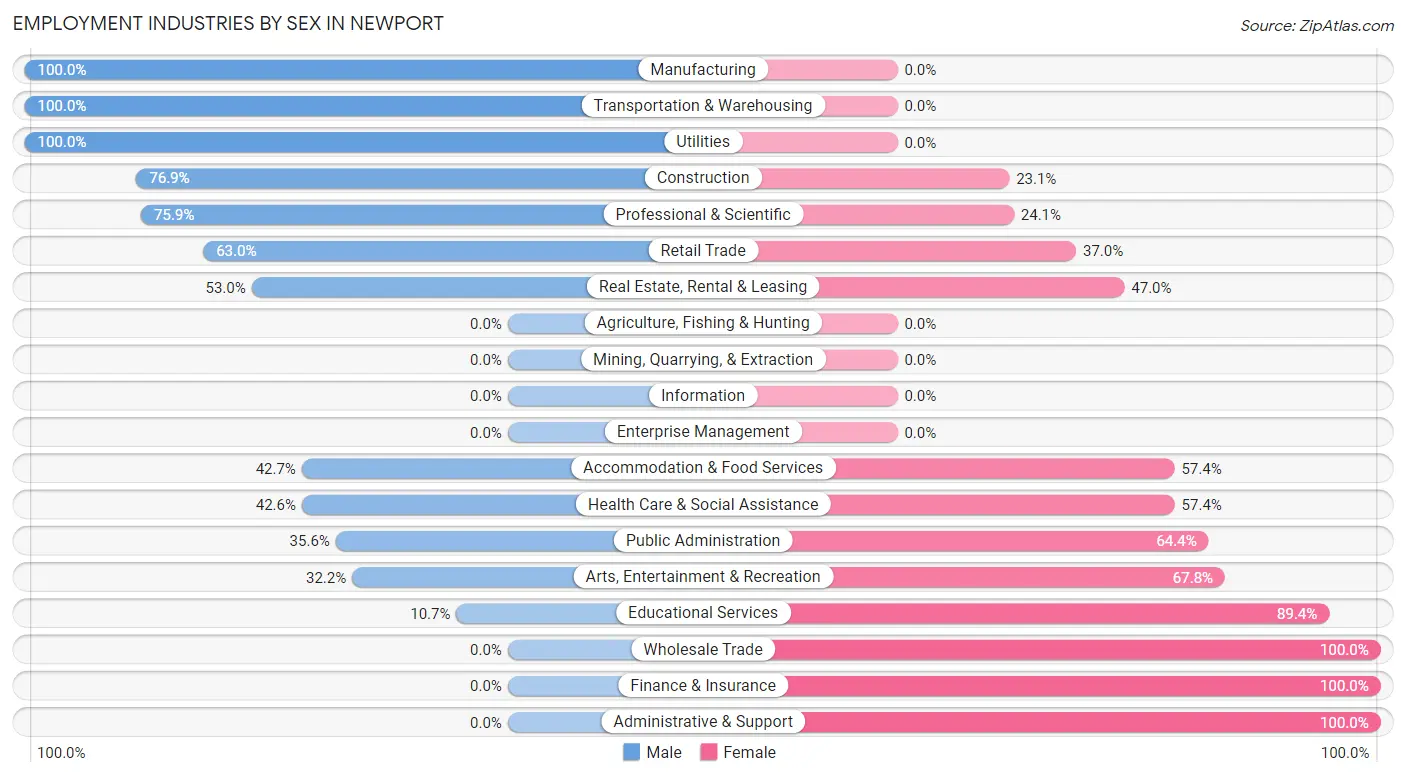
Employment Industries by Sex in Newport
The Newport industries that see more men than women are Manufacturing (100.0%), Transportation & Warehousing (100.0%), and Utilities (100.0%), whereas the industries that tend to have a higher number of women are Wholesale Trade (100.0%), Finance & Insurance (100.0%), and Administrative & Support (100.0%).
| Industry | Male | Female |
| Agriculture, Fishing & Hunting | 0 (0.0%) | 0 (0.0%) |
| Mining, Quarrying, & Extraction | 0 (0.0%) | 0 (0.0%) |
| Construction | 176 (76.9%) | 53 (23.1%) |
| Manufacturing | 28 (100.0%) | 0 (0.0%) |
| Wholesale Trade | 0 (0.0%) | 33 (100.0%) |
| Retail Trade | 271 (63.0%) | 159 (37.0%) |
| Transportation & Warehousing | 88 (100.0%) | 0 (0.0%) |
| Utilities | 9 (100.0%) | 0 (0.0%) |
| Information | 0 (0.0%) | 0 (0.0%) |
| Finance & Insurance | 0 (0.0%) | 15 (100.0%) |
| Real Estate, Rental & Leasing | 70 (53.0%) | 62 (47.0%) |
| Professional & Scientific | 63 (75.9%) | 20 (24.1%) |
| Enterprise Management | 0 (0.0%) | 0 (0.0%) |
| Administrative & Support | 0 (0.0%) | 71 (100.0%) |
| Educational Services | 18 (10.6%) | 151 (89.3%) |
| Health Care & Social Assistance | 78 (42.6%) | 105 (57.4%) |
| Arts, Entertainment & Recreation | 29 (32.2%) | 61 (67.8%) |
| Accommodation & Food Services | 29 (42.6%) | 39 (57.4%) |
| Public Administration | 104 (35.6%) | 188 (64.4%) |
| Total | 982 (49.5%) | 1,001 (50.5%) |
Education in Newport
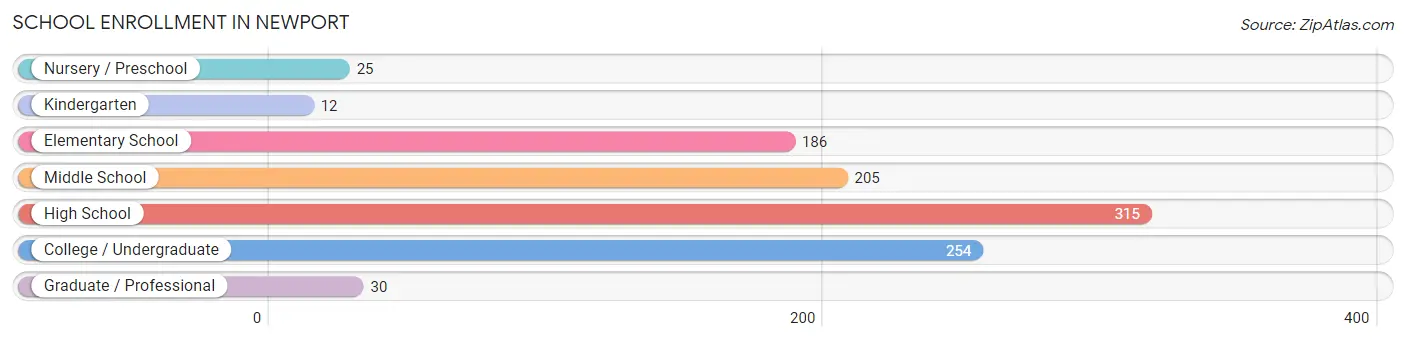
School Enrollment in Newport
The most common levels of schooling among the 1,027 students in Newport are high school (315 | 30.7%), college / undergraduate (254 | 24.7%), and middle school (205 | 20.0%).
| School Level | # Students | % Students |
| Nursery / Preschool | 25 | 2.4% |
| Kindergarten | 12 | 1.2% |
| Elementary School | 186 | 18.1% |
| Middle School | 205 | 20.0% |
| High School | 315 | 30.7% |
| College / Undergraduate | 254 | 24.7% |
| Graduate / Professional | 30 | 2.9% |
| Total | 1,027 | 100.0% |
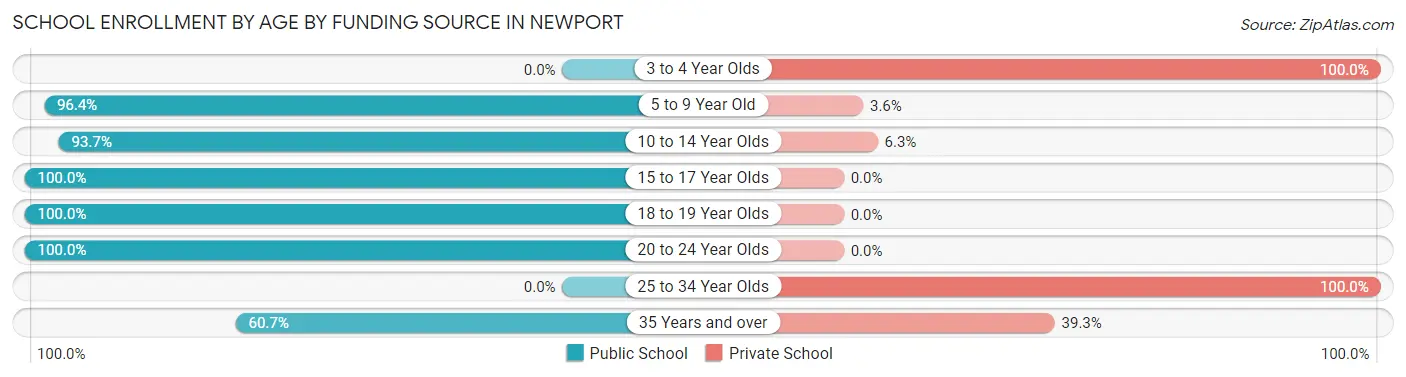
School Enrollment by Age by Funding Source in Newport
Out of a total of 1,027 students who are enrolled in schools in Newport, 147 (14.3%) attend a private institution, while the remaining 880 (85.7%) are enrolled in public schools. The age group of 3 to 4 year olds has the highest likelihood of being enrolled in private schools, with 19 (100.0% in the age bracket) enrolled. Conversely, the age group of 15 to 17 year olds has the lowest likelihood of being enrolled in a private school, with 206 (100.0% in the age bracket) attending a public institution.
| Age Bracket | Public School | Private School |
| 3 to 4 Year Olds | 0 (0.0%) | 19 (100.0%) |
| 5 to 9 Year Old | 160 (96.4%) | 6 (3.6%) |
| 10 to 14 Year Olds | 237 (93.7%) | 16 (6.3%) |
| 15 to 17 Year Olds | 206 (100.0%) | 0 (0.0%) |
| 18 to 19 Year Olds | 176 (100.0%) | 0 (0.0%) |
| 20 to 24 Year Olds | 50 (100.0%) | 0 (0.0%) |
| 25 to 34 Year Olds | 0 (0.0%) | 73 (100.0%) |
| 35 Years and over | 51 (60.7%) | 33 (39.3%) |
| Total | 880 (85.7%) | 147 (14.3%) |
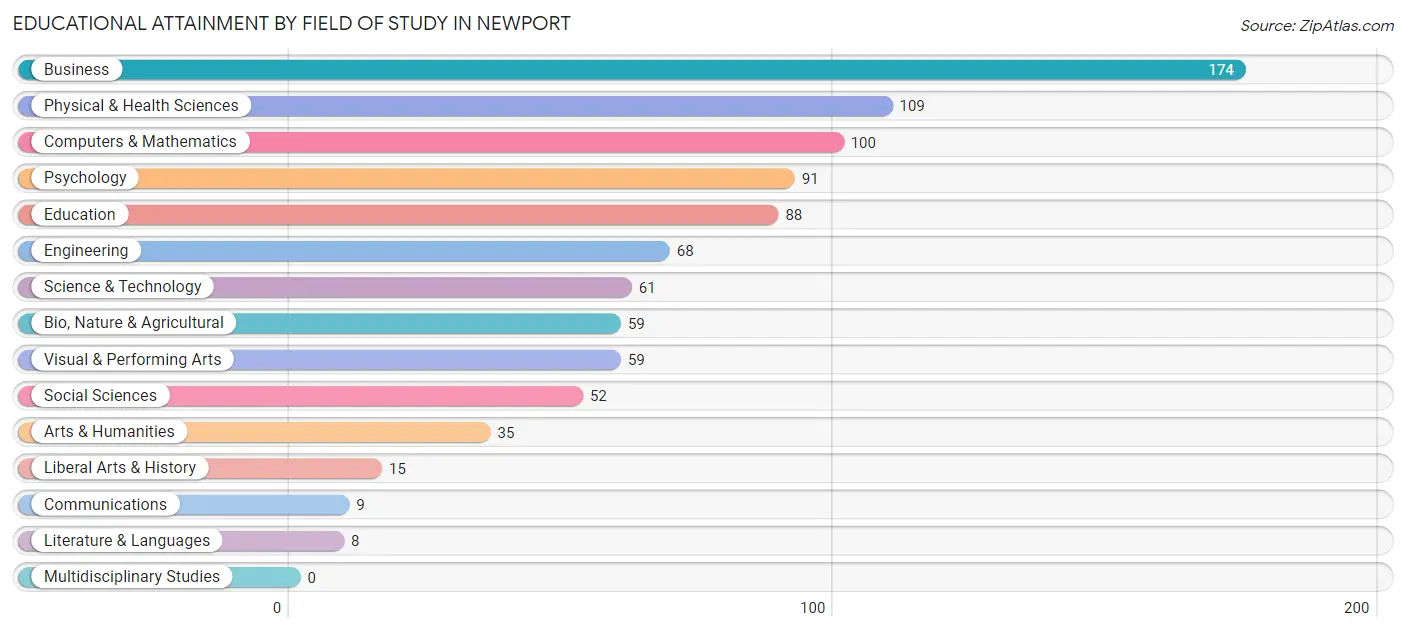
Educational Attainment by Field of Study in Newport
Business (174 | 18.8%), physical & health sciences (109 | 11.7%), computers & mathematics (100 | 10.8%), psychology (91 | 9.8%), and education (88 | 9.5%) are the most common fields of study among 928 individuals in Newport who have obtained a bachelor's degree or higher.
| Field of Study | # Graduates | % Graduates |
| Computers & Mathematics | 100 | 10.8% |
| Bio, Nature & Agricultural | 59 | 6.4% |
| Physical & Health Sciences | 109 | 11.7% |
| Psychology | 91 | 9.8% |
| Social Sciences | 52 | 5.6% |
| Engineering | 68 | 7.3% |
| Multidisciplinary Studies | 0 | 0.0% |
| Science & Technology | 61 | 6.6% |
| Business | 174 | 18.8% |
| Education | 88 | 9.5% |
| Literature & Languages | 8 | 0.9% |
| Liberal Arts & History | 15 | 1.6% |
| Visual & Performing Arts | 59 | 6.4% |
| Communications | 9 | 1.0% |
| Arts & Humanities | 35 | 3.8% |
| Total | 928 | 100.0% |
Transportation & Commute in Newport
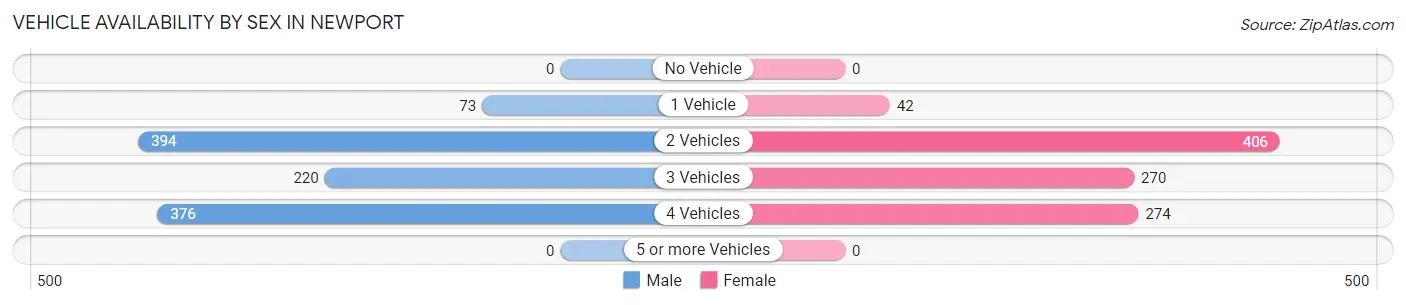
Vehicle Availability by Sex in Newport
The most prevalent vehicle ownership categories in Newport are males with 2 vehicles (394, accounting for 37.1%) and females with 2 vehicles (406, making up 39.7%).
| Vehicles Available | Male | Female |
| No Vehicle | 0 (0.0%) | 0 (0.0%) |
| 1 Vehicle | 73 (6.9%) | 42 (4.2%) |
| 2 Vehicles | 394 (37.1%) | 406 (40.9%) |
| 3 Vehicles | 220 (20.7%) | 270 (27.2%) |
| 4 Vehicles | 376 (35.4%) | 274 (27.6%) |
| 5 or more Vehicles | 0 (0.0%) | 0 (0.0%) |
| Total | 1,063 (100.0%) | 992 (100.0%) |
Commute Time in Newport
The most frequently occuring commute durations in Newport are 15 to 19 minutes (555 commuters, 29.7%), 20 to 24 minutes (375 commuters, 20.1%), and 10 to 14 minutes (220 commuters, 11.8%).
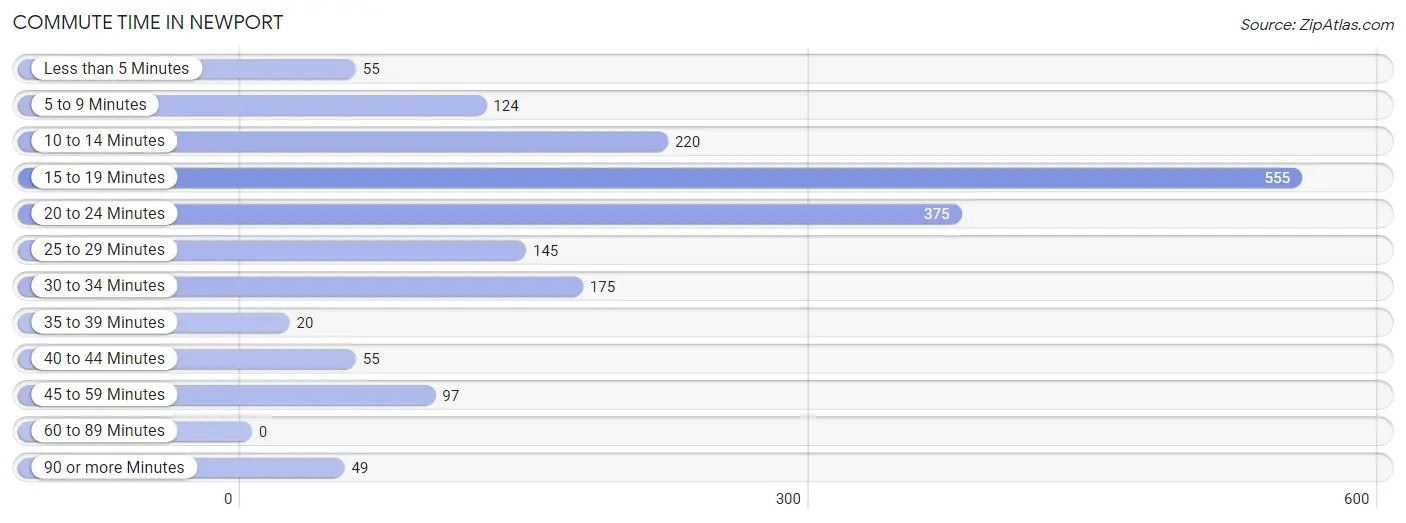
| Commute Time | # Commuters | % Commuters |
| Less than 5 Minutes | 55 | 2.9% |
| 5 to 9 Minutes | 124 | 6.6% |
| 10 to 14 Minutes | 220 | 11.8% |
| 15 to 19 Minutes | 555 | 29.7% |
| 20 to 24 Minutes | 375 | 20.1% |
| 25 to 29 Minutes | 145 | 7.7% |
| 30 to 34 Minutes | 175 | 9.4% |
| 35 to 39 Minutes | 20 | 1.1% |
| 40 to 44 Minutes | 55 | 2.9% |
| 45 to 59 Minutes | 97 | 5.2% |
| 60 to 89 Minutes | 0 | 0.0% |
| 90 or more Minutes | 49 | 2.6% |
Commute Time by Sex in Newport
The most common commute times in Newport are 15 to 19 minutes (430 commuters, 43.6%) for males and 20 to 24 minutes (225 commuters, 25.5%) for females.
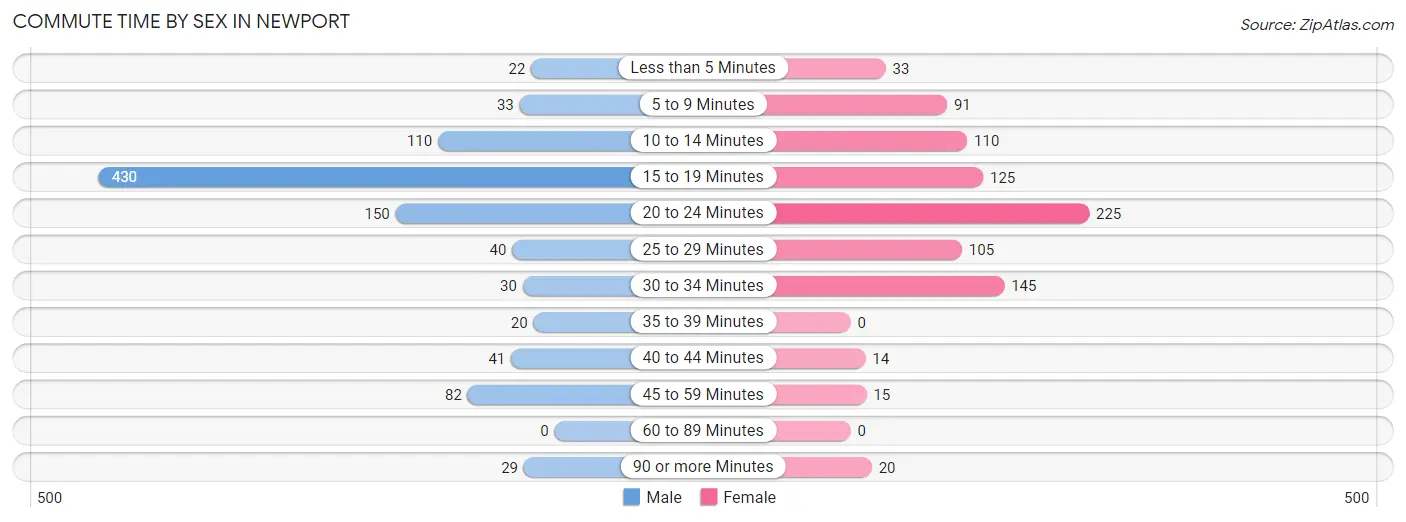
| Commute Time | Male | Female |
| Less than 5 Minutes | 22 (2.2%) | 33 (3.7%) |
| 5 to 9 Minutes | 33 (3.3%) | 91 (10.3%) |
| 10 to 14 Minutes | 110 (11.1%) | 110 (12.5%) |
| 15 to 19 Minutes | 430 (43.6%) | 125 (14.2%) |
| 20 to 24 Minutes | 150 (15.2%) | 225 (25.5%) |
| 25 to 29 Minutes | 40 (4.1%) | 105 (11.9%) |
| 30 to 34 Minutes | 30 (3.0%) | 145 (16.4%) |
| 35 to 39 Minutes | 20 (2.0%) | 0 (0.0%) |
| 40 to 44 Minutes | 41 (4.2%) | 14 (1.6%) |
| 45 to 59 Minutes | 82 (8.3%) | 15 (1.7%) |
| 60 to 89 Minutes | 0 (0.0%) | 0 (0.0%) |
| 90 or more Minutes | 29 (2.9%) | 20 (2.3%) |
Time of Departure to Work by Sex in Newport
The most frequent times of departure to work in Newport are 6:00 AM to 6:29 AM (147, 14.9%) for males and 7:00 AM to 7:29 AM (191, 21.6%) for females.
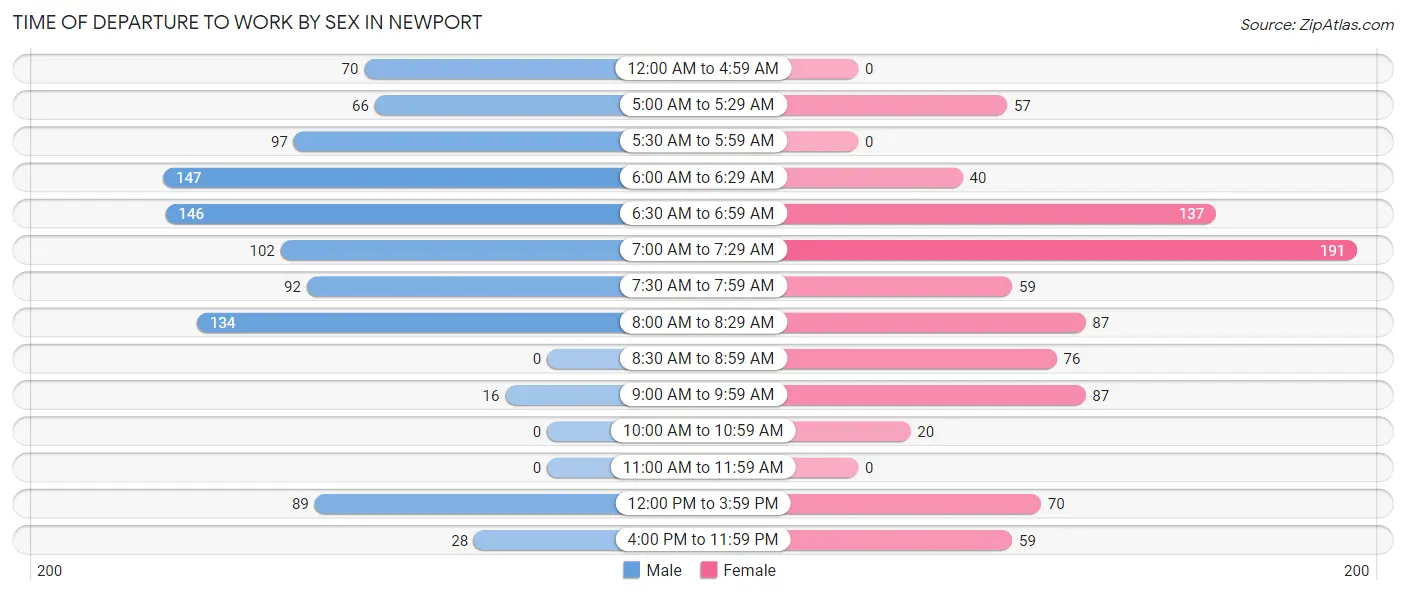
| Time of Departure | Male | Female |
| 12:00 AM to 4:59 AM | 70 (7.1%) | 0 (0.0%) |
| 5:00 AM to 5:29 AM | 66 (6.7%) | 57 (6.5%) |
| 5:30 AM to 5:59 AM | 97 (9.8%) | 0 (0.0%) |
| 6:00 AM to 6:29 AM | 147 (14.9%) | 40 (4.5%) |
| 6:30 AM to 6:59 AM | 146 (14.8%) | 137 (15.5%) |
| 7:00 AM to 7:29 AM | 102 (10.3%) | 191 (21.6%) |
| 7:30 AM to 7:59 AM | 92 (9.3%) | 59 (6.7%) |
| 8:00 AM to 8:29 AM | 134 (13.6%) | 87 (9.9%) |
| 8:30 AM to 8:59 AM | 0 (0.0%) | 76 (8.6%) |
| 9:00 AM to 9:59 AM | 16 (1.6%) | 87 (9.9%) |
| 10:00 AM to 10:59 AM | 0 (0.0%) | 20 (2.3%) |
| 11:00 AM to 11:59 AM | 0 (0.0%) | 0 (0.0%) |
| 12:00 PM to 3:59 PM | 89 (9.0%) | 70 (7.9%) |
| 4:00 PM to 11:59 PM | 28 (2.8%) | 59 (6.7%) |
| Total | 987 (100.0%) | 883 (100.0%) |
Housing Occupancy in Newport
Occupancy by Ownership in Newport
Of the total 1,640 dwellings in Newport, owner-occupied units account for 1,039 (63.3%), while renter-occupied units make up 601 (36.6%).
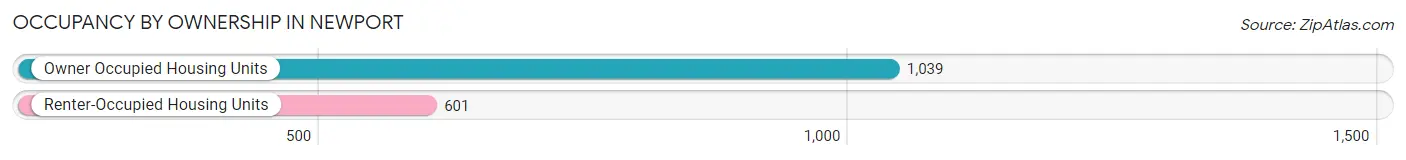
| Occupancy | # Housing Units | % Housing Units |
| Owner Occupied Housing Units | 1,039 | 63.3% |
| Renter-Occupied Housing Units | 601 | 36.6% |
| Total Occupied Housing Units | 1,640 | 100.0% |
Occupancy by Household Size in Newport
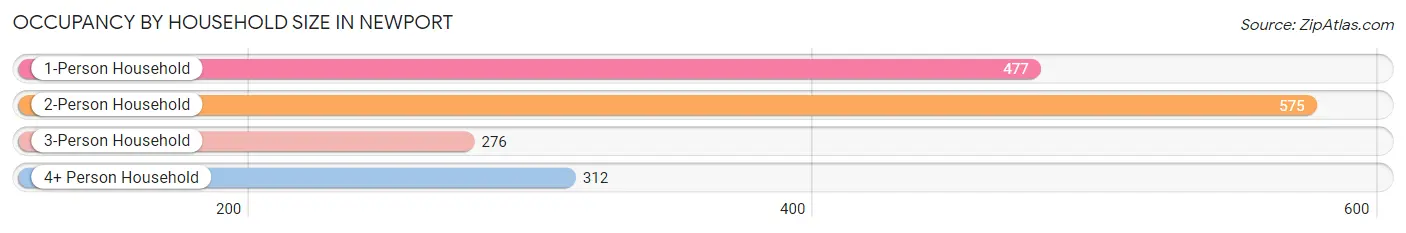
| Household Size | # Housing Units | % Housing Units |
| 1-Person Household | 477 | 29.1% |
| 2-Person Household | 575 | 35.1% |
| 3-Person Household | 276 | 16.8% |
| 4+ Person Household | 312 | 19.0% |
| Total Housing Units | 1,640 | 100.0% |
Occupancy by Ownership by Household Size in Newport
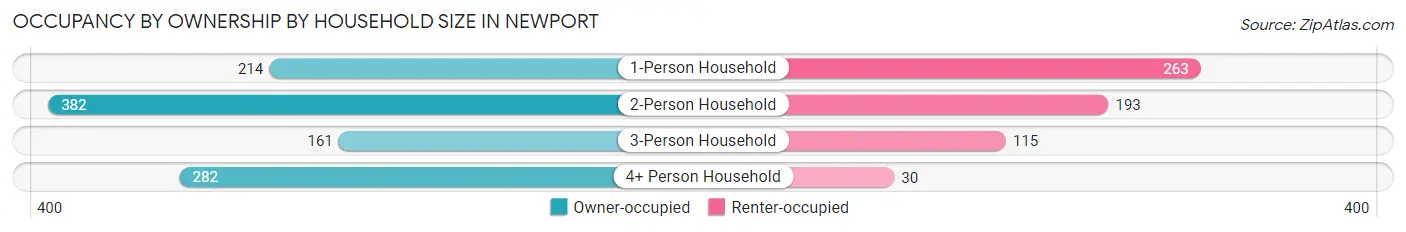
| Household Size | Owner-occupied | Renter-occupied |
| 1-Person Household | 214 (44.9%) | 263 (55.1%) |
| 2-Person Household | 382 (66.4%) | 193 (33.6%) |
| 3-Person Household | 161 (58.3%) | 115 (41.7%) |
| 4+ Person Household | 282 (90.4%) | 30 (9.6%) |
| Total Housing Units | 1,039 (63.3%) | 601 (36.6%) |
Occupancy by Educational Attainment in Newport
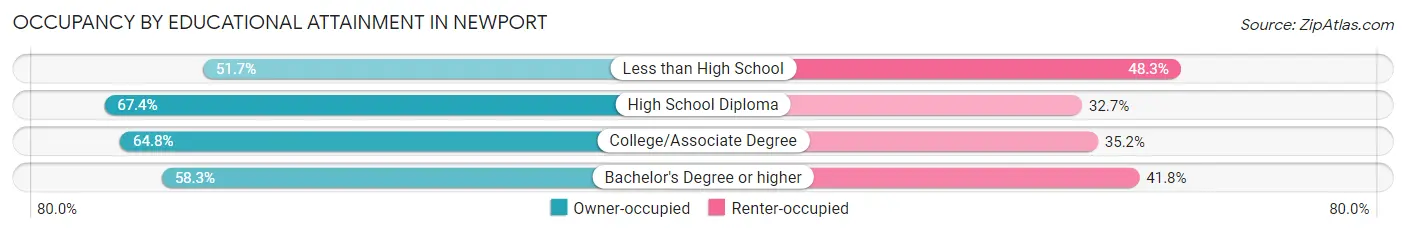
| Household Size | Owner-occupied | Renter-occupied |
| Less than High School | 15 (51.7%) | 14 (48.3%) |
| High School Diploma | 196 (67.3%) | 95 (32.7%) |
| College/Associate Degree | 581 (64.8%) | 315 (35.2%) |
| Bachelor's Degree or higher | 247 (58.3%) | 177 (41.7%) |
Occupancy by Age of Householder in Newport
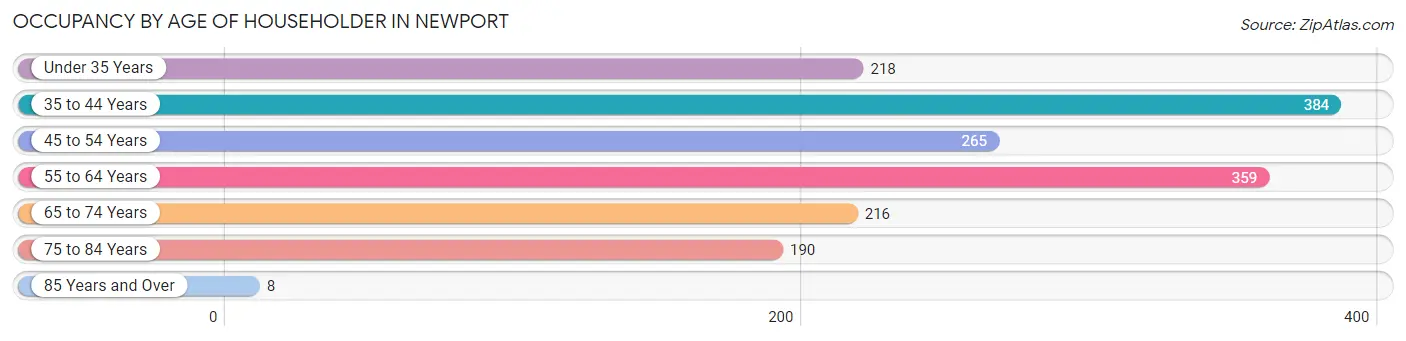
| Age Bracket | # Households | % Households |
| Under 35 Years | 218 | 13.3% |
| 35 to 44 Years | 384 | 23.4% |
| 45 to 54 Years | 265 | 16.2% |
| 55 to 64 Years | 359 | 21.9% |
| 65 to 74 Years | 216 | 13.2% |
| 75 to 84 Years | 190 | 11.6% |
| 85 Years and Over | 8 | 0.5% |
| Total | 1,640 | 100.0% |
Housing Finances in Newport
Median Income by Occupancy in Newport
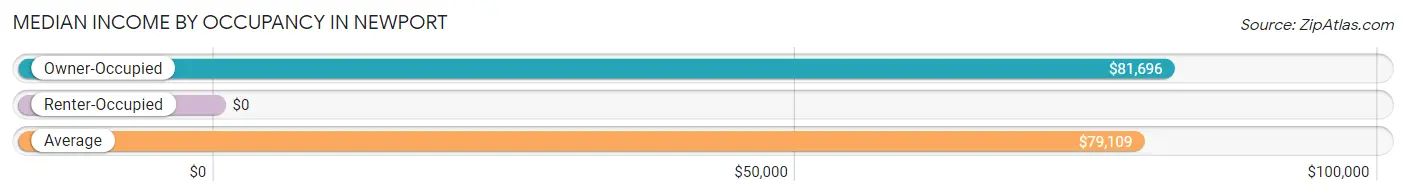
| Occupancy Type | # Households | Median Income |
| Owner-Occupied | 1,039 (63.3%) | $81,696 |
| Renter-Occupied | 601 (36.6%) | $0 |
| Average | 1,640 (100.0%) | $79,109 |
Occupancy by Householder Income Bracket in Newport
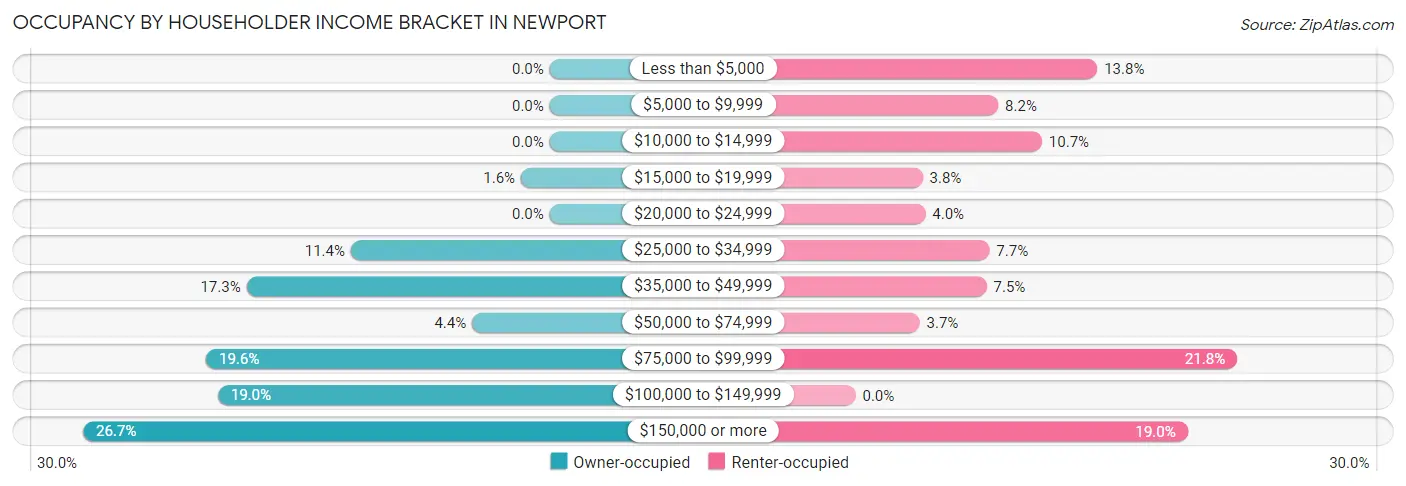
| Income Bracket | Owner-occupied | Renter-occupied |
| Less than $5,000 | 0 (0.0%) | 83 (13.8%) |
| $5,000 to $9,999 | 0 (0.0%) | 49 (8.2%) |
| $10,000 to $14,999 | 0 (0.0%) | 64 (10.6%) |
| $15,000 to $19,999 | 17 (1.6%) | 23 (3.8%) |
| $20,000 to $24,999 | 0 (0.0%) | 24 (4.0%) |
| $25,000 to $34,999 | 118 (11.4%) | 46 (7.6%) |
| $35,000 to $49,999 | 180 (17.3%) | 45 (7.5%) |
| $50,000 to $74,999 | 46 (4.4%) | 22 (3.7%) |
| $75,000 to $99,999 | 204 (19.6%) | 131 (21.8%) |
| $100,000 to $149,999 | 197 (19.0%) | 0 (0.0%) |
| $150,000 or more | 277 (26.7%) | 114 (19.0%) |
| Total | 1,039 (100.0%) | 601 (100.0%) |
Monthly Housing Cost Tiers in Newport
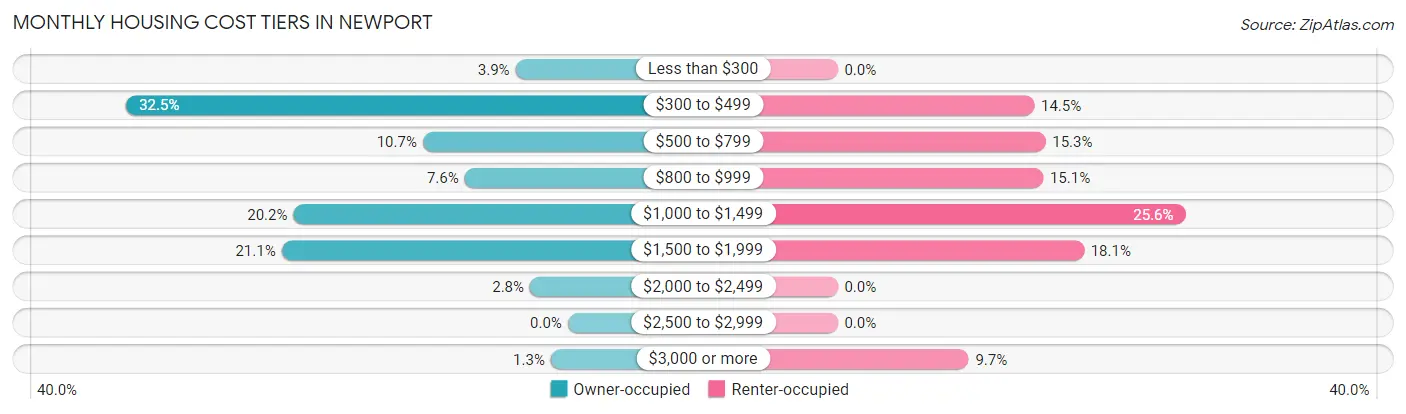
| Monthly Cost | Owner-occupied | Renter-occupied |
| Less than $300 | 40 (3.8%) | 0 (0.0%) |
| $300 to $499 | 338 (32.5%) | 87 (14.5%) |
| $500 to $799 | 111 (10.7%) | 92 (15.3%) |
| $800 to $999 | 79 (7.6%) | 91 (15.1%) |
| $1,000 to $1,499 | 210 (20.2%) | 154 (25.6%) |
| $1,500 to $1,999 | 219 (21.1%) | 109 (18.1%) |
| $2,000 to $2,499 | 29 (2.8%) | 0 (0.0%) |
| $2,500 to $2,999 | 0 (0.0%) | 0 (0.0%) |
| $3,000 or more | 13 (1.3%) | 58 (9.7%) |
| Total | 1,039 (100.0%) | 601 (100.0%) |
Physical Housing Characteristics in Newport
Housing Structures in Newport
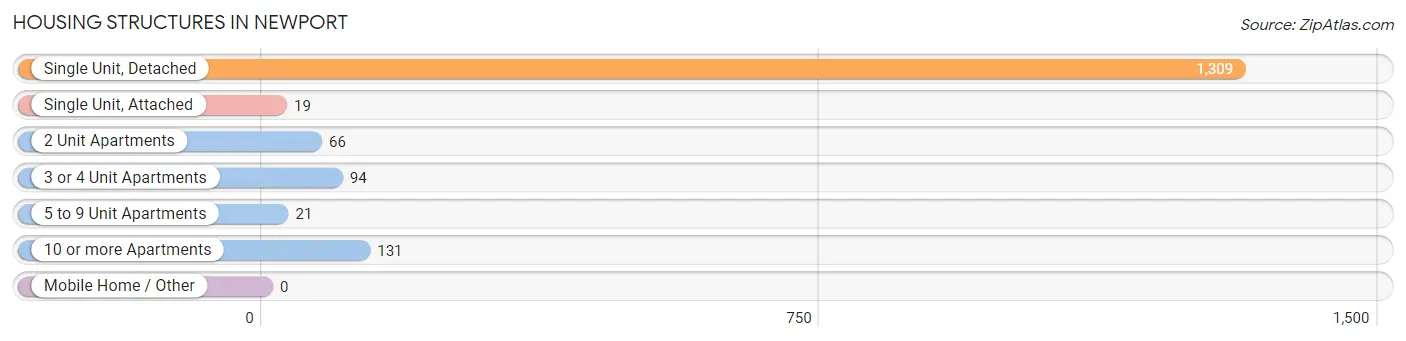
| Structure Type | # Housing Units | % Housing Units |
| Single Unit, Detached | 1,309 | 79.8% |
| Single Unit, Attached | 19 | 1.2% |
| 2 Unit Apartments | 66 | 4.0% |
| 3 or 4 Unit Apartments | 94 | 5.7% |
| 5 to 9 Unit Apartments | 21 | 1.3% |
| 10 or more Apartments | 131 | 8.0% |
| Mobile Home / Other | 0 | 0.0% |
| Total | 1,640 | 100.0% |
Housing Structures by Occupancy in Newport
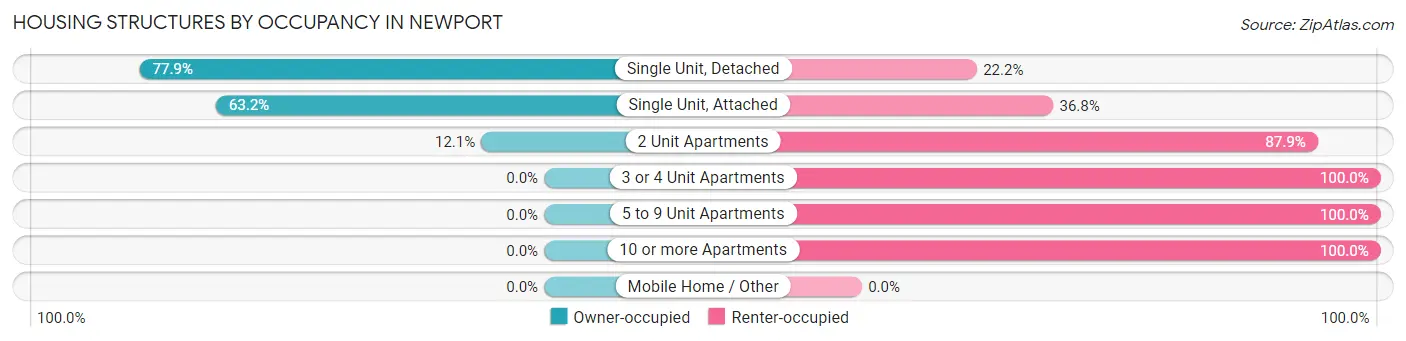
| Structure Type | Owner-occupied | Renter-occupied |
| Single Unit, Detached | 1,019 (77.8%) | 290 (22.2%) |
| Single Unit, Attached | 12 (63.2%) | 7 (36.8%) |
| 2 Unit Apartments | 8 (12.1%) | 58 (87.9%) |
| 3 or 4 Unit Apartments | 0 (0.0%) | 94 (100.0%) |
| 5 to 9 Unit Apartments | 0 (0.0%) | 21 (100.0%) |
| 10 or more Apartments | 0 (0.0%) | 131 (100.0%) |
| Mobile Home / Other | 0 (0.0%) | 0 (0.0%) |
| Total | 1,039 (63.3%) | 601 (36.6%) |
Housing Structures by Number of Rooms in Newport
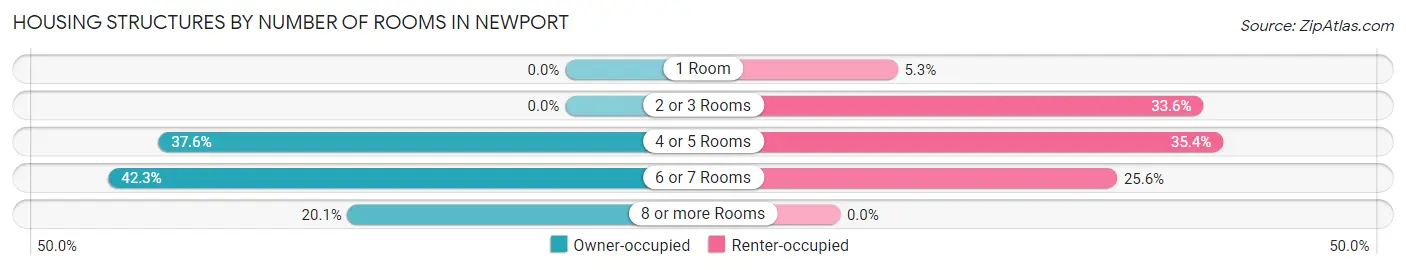
| Number of Rooms | Owner-occupied | Renter-occupied |
| 1 Room | 0 (0.0%) | 32 (5.3%) |
| 2 or 3 Rooms | 0 (0.0%) | 202 (33.6%) |
| 4 or 5 Rooms | 391 (37.6%) | 213 (35.4%) |
| 6 or 7 Rooms | 439 (42.2%) | 154 (25.6%) |
| 8 or more Rooms | 209 (20.1%) | 0 (0.0%) |
| Total | 1,039 (100.0%) | 601 (100.0%) |
Housing Structure by Heating Type in Newport
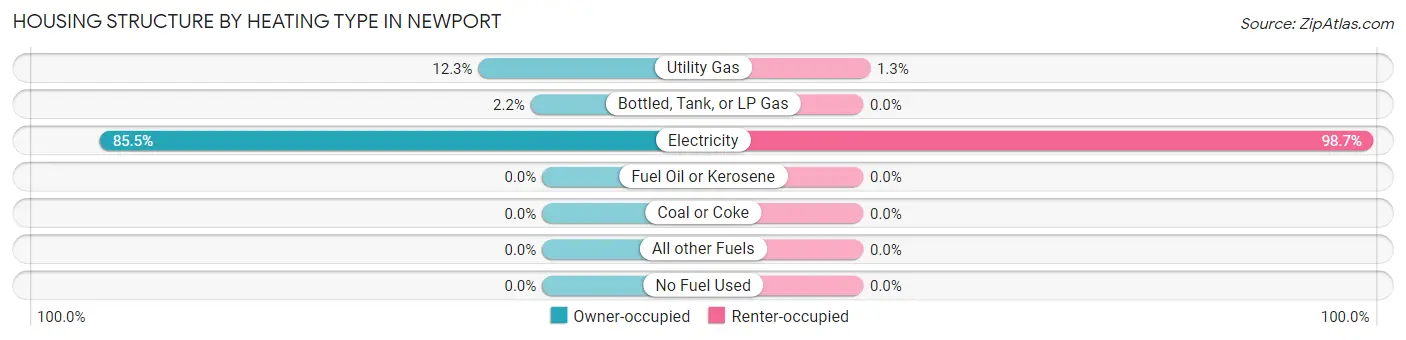
| Heating Type | Owner-occupied | Renter-occupied |
| Utility Gas | 128 (12.3%) | 8 (1.3%) |
| Bottled, Tank, or LP Gas | 23 (2.2%) | 0 (0.0%) |
| Electricity | 888 (85.5%) | 593 (98.7%) |
| Fuel Oil or Kerosene | 0 (0.0%) | 0 (0.0%) |
| Coal or Coke | 0 (0.0%) | 0 (0.0%) |
| All other Fuels | 0 (0.0%) | 0 (0.0%) |
| No Fuel Used | 0 (0.0%) | 0 (0.0%) |
| Total | 1,039 (100.0%) | 601 (100.0%) |
Household Vehicle Usage in Newport
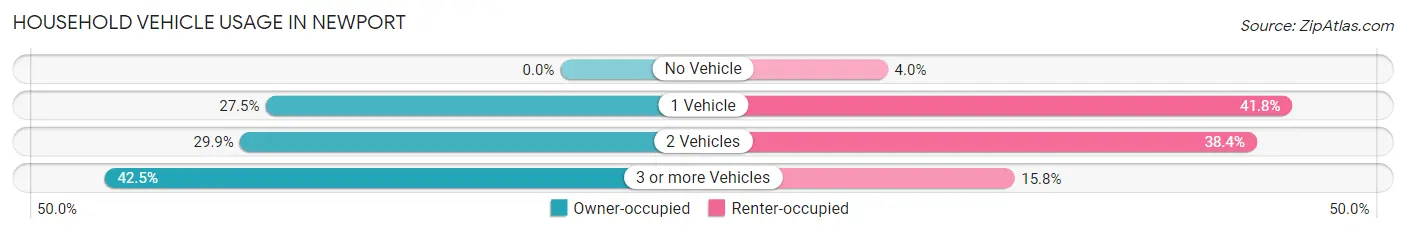
| Vehicles per Household | Owner-occupied | Renter-occupied |
| No Vehicle | 0 (0.0%) | 24 (4.0%) |
| 1 Vehicle | 286 (27.5%) | 251 (41.8%) |
| 2 Vehicles | 311 (29.9%) | 231 (38.4%) |
| 3 or more Vehicles | 442 (42.5%) | 95 (15.8%) |
| Total | 1,039 (100.0%) | 601 (100.0%) |
Real Estate & Mortgages in Newport
Real Estate and Mortgage Overview in Newport
| Characteristic | Without Mortgage | With Mortgage |
| Housing Units | 454 | 585 |
| Median Property Value | $157,000 | $200,300 |
| Median Household Income | $78,067 | $254 |
| Monthly Housing Costs | $395 | $13 |
| Real Estate Taxes | $1,196 | $14 |
Property Value by Mortgage Status in Newport
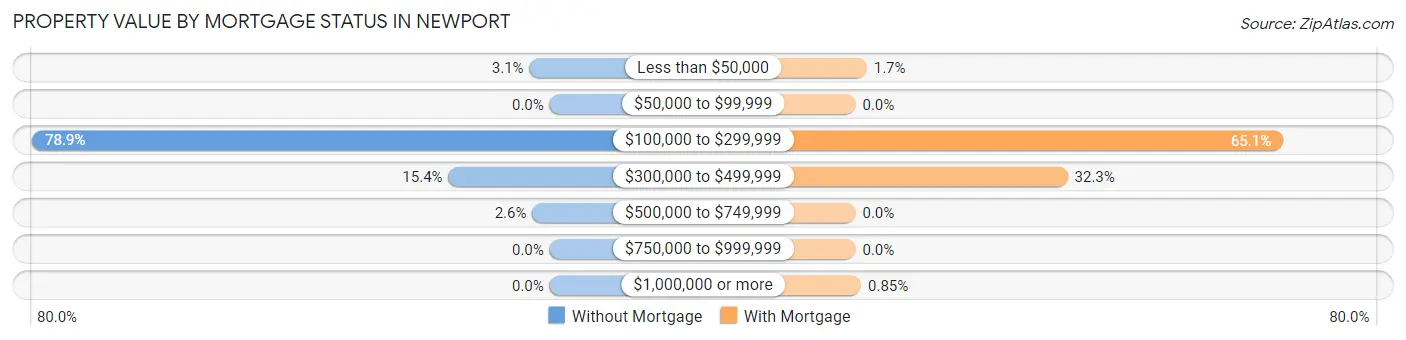
| Property Value | Without Mortgage | With Mortgage |
| Less than $50,000 | 14 (3.1%) | 10 (1.7%) |
| $50,000 to $99,999 | 0 (0.0%) | 0 (0.0%) |
| $100,000 to $299,999 | 358 (78.8%) | 381 (65.1%) |
| $300,000 to $499,999 | 70 (15.4%) | 189 (32.3%) |
| $500,000 to $749,999 | 12 (2.6%) | 0 (0.0%) |
| $750,000 to $999,999 | 0 (0.0%) | 0 (0.0%) |
| $1,000,000 or more | 0 (0.0%) | 5 (0.9%) |
| Total | 454 (100.0%) | 585 (100.0%) |
Household Income by Mortgage Status in Newport
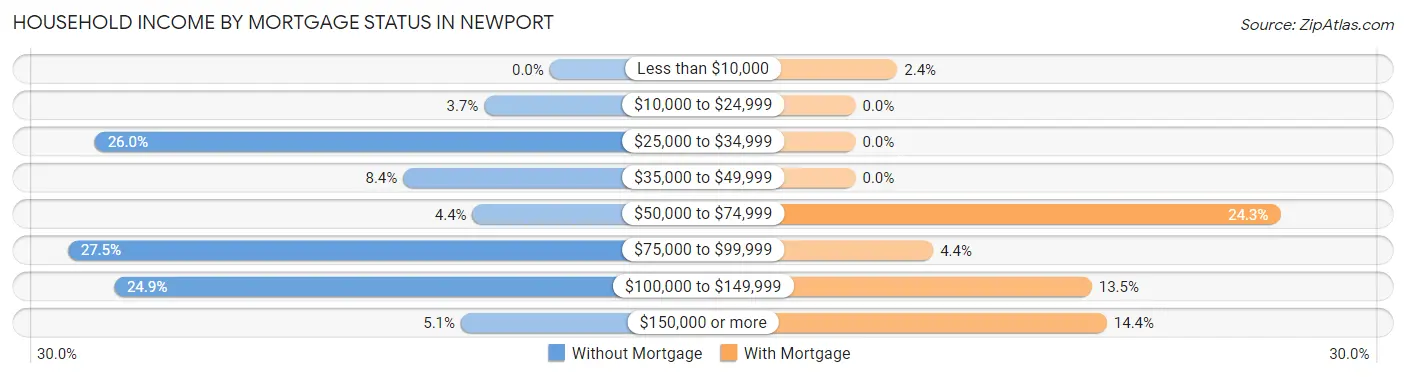
| Household Income | Without Mortgage | With Mortgage |
| Less than $10,000 | 0 (0.0%) | 14 (2.4%) |
| $10,000 to $24,999 | 17 (3.7%) | 0 (0.0%) |
| $25,000 to $34,999 | 118 (26.0%) | 0 (0.0%) |
| $35,000 to $49,999 | 38 (8.4%) | 0 (0.0%) |
| $50,000 to $74,999 | 20 (4.4%) | 142 (24.3%) |
| $75,000 to $99,999 | 125 (27.5%) | 26 (4.4%) |
| $100,000 to $149,999 | 113 (24.9%) | 79 (13.5%) |
| $150,000 or more | 23 (5.1%) | 84 (14.4%) |
| Total | 454 (100.0%) | 585 (100.0%) |
Property Value to Household Income Ratio in Newport
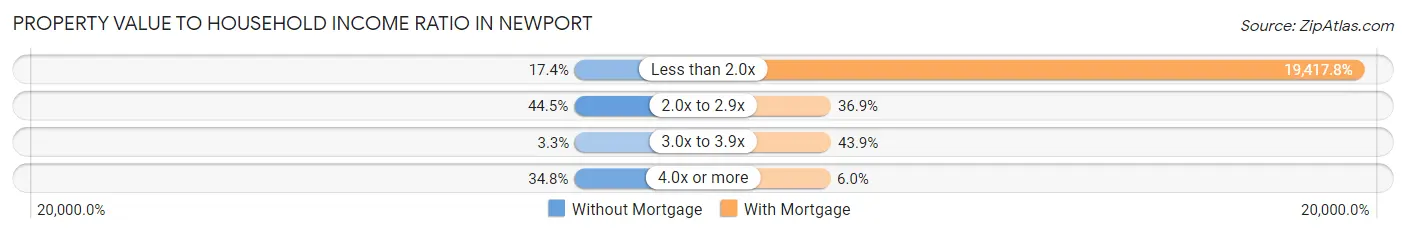
| Value-to-Income Ratio | Without Mortgage | With Mortgage |
| Less than 2.0x | 79 (17.4%) | 113,594 (19,417.8%) |
| 2.0x to 2.9x | 202 (44.5%) | 216 (36.9%) |
| 3.0x to 3.9x | 15 (3.3%) | 257 (43.9%) |
| 4.0x or more | 158 (34.8%) | 35 (6.0%) |
| Total | 454 (100.0%) | 585 (100.0%) |
Real Estate Taxes by Mortgage Status in Newport
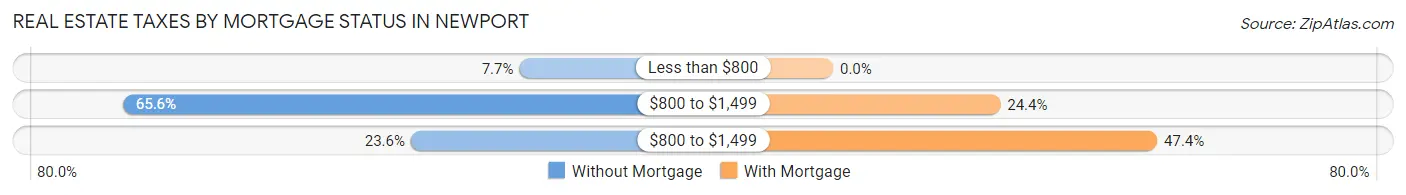
| Property Taxes | Without Mortgage | With Mortgage |
| Less than $800 | 35 (7.7%) | 0 (0.0%) |
| $800 to $1,499 | 298 (65.6%) | 143 (24.4%) |
| $800 to $1,499 | 107 (23.6%) | 277 (47.3%) |
| Total | 454 (100.0%) | 585 (100.0%) |
Health & Disability in Newport
Health Insurance Coverage by Age in Newport
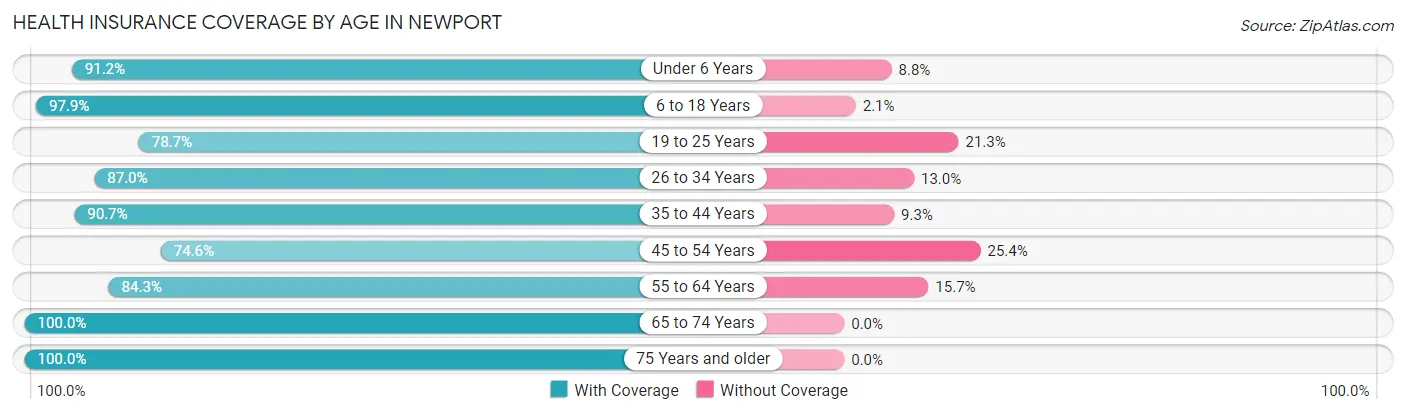
| Age Bracket | With Coverage | Without Coverage |
| Under 6 Years | 62 (91.2%) | 6 (8.8%) |
| 6 to 18 Years | 778 (97.9%) | 17 (2.1%) |
| 19 to 25 Years | 240 (78.7%) | 65 (21.3%) |
| 26 to 34 Years | 381 (87.0%) | 57 (13.0%) |
| 35 to 44 Years | 547 (90.7%) | 56 (9.3%) |
| 45 to 54 Years | 361 (74.6%) | 123 (25.4%) |
| 55 to 64 Years | 500 (84.3%) | 93 (15.7%) |
| 65 to 74 Years | 334 (100.0%) | 0 (0.0%) |
| 75 Years and older | 267 (100.0%) | 0 (0.0%) |
| Total | 3,470 (89.3%) | 417 (10.7%) |
Health Insurance Coverage by Citizenship Status in Newport
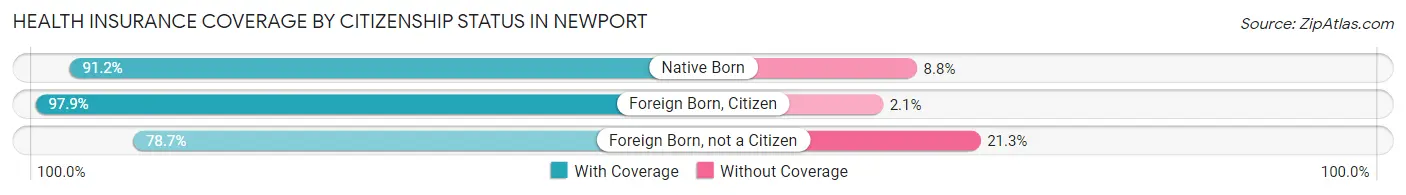
| Citizenship Status | With Coverage | Without Coverage |
| Native Born | 62 (91.2%) | 6 (8.8%) |
| Foreign Born, Citizen | 778 (97.9%) | 17 (2.1%) |
| Foreign Born, not a Citizen | 240 (78.7%) | 65 (21.3%) |
Health Insurance Coverage by Household Income in Newport
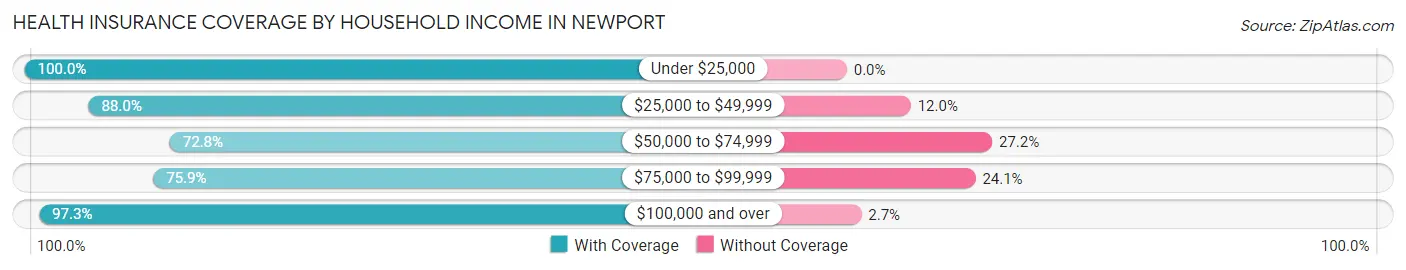
| Household Income | With Coverage | Without Coverage |
| Under $25,000 | 281 (100.0%) | 0 (0.0%) |
| $25,000 to $49,999 | 639 (88.0%) | 87 (12.0%) |
| $50,000 to $74,999 | 107 (72.8%) | 40 (27.2%) |
| $75,000 to $99,999 | 762 (75.9%) | 242 (24.1%) |
| $100,000 and over | 1,675 (97.3%) | 47 (2.7%) |
Public vs Private Health Insurance Coverage by Age in Newport
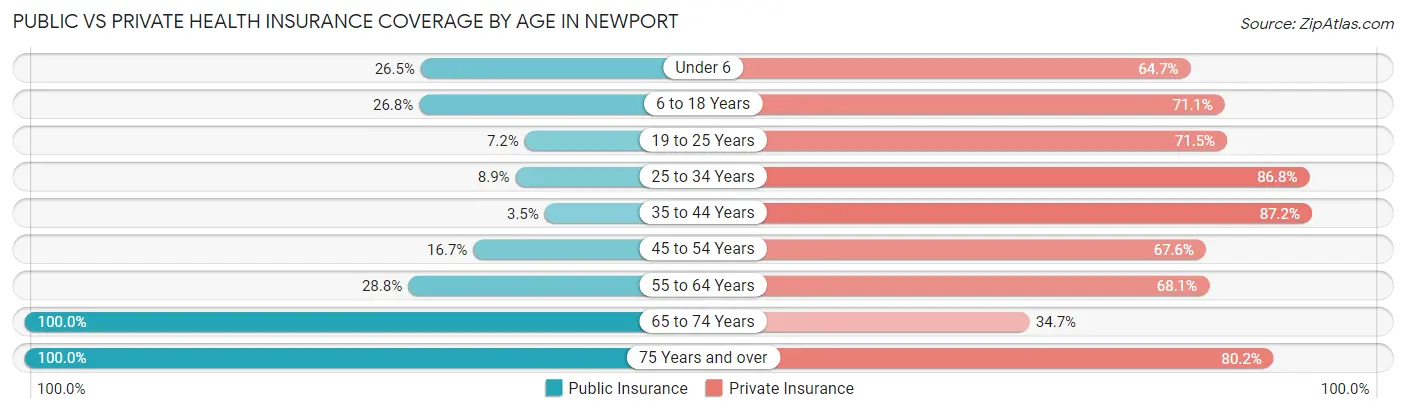
| Age Bracket | Public Insurance | Private Insurance |
| Under 6 | 18 (26.5%) | 44 (64.7%) |
| 6 to 18 Years | 213 (26.8%) | 565 (71.1%) |
| 19 to 25 Years | 22 (7.2%) | 218 (71.5%) |
| 25 to 34 Years | 39 (8.9%) | 380 (86.8%) |
| 35 to 44 Years | 21 (3.5%) | 526 (87.2%) |
| 45 to 54 Years | 81 (16.7%) | 327 (67.6%) |
| 55 to 64 Years | 171 (28.8%) | 404 (68.1%) |
| 65 to 74 Years | 334 (100.0%) | 116 (34.7%) |
| 75 Years and over | 267 (100.0%) | 214 (80.1%) |
| Total | 1,166 (30.0%) | 2,794 (71.9%) |
Disability Status by Sex by Age in Newport
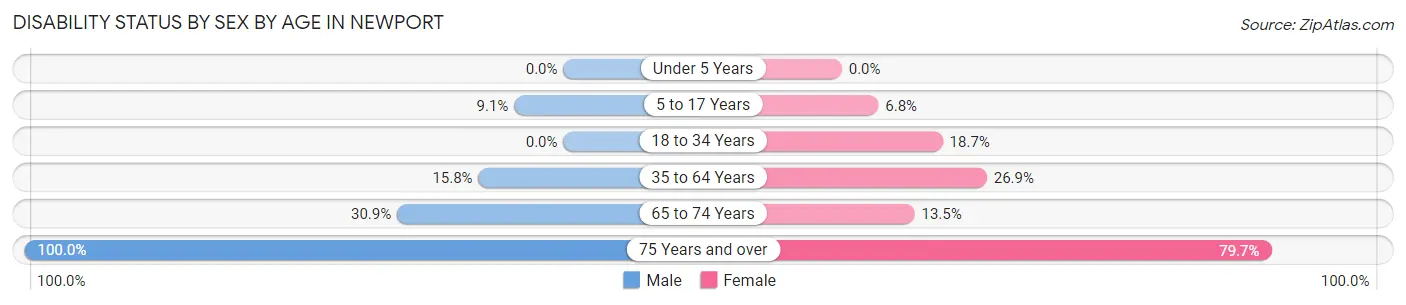
| Age Bracket | Male | Female |
| Under 5 Years | 0 (0.0%) | 0 (0.0%) |
| 5 to 17 Years | 22 (9.1%) | 29 (6.8%) |
| 18 to 34 Years | 0 (0.0%) | 82 (18.7%) |
| 35 to 64 Years | 119 (15.8%) | 249 (26.9%) |
| 65 to 74 Years | 46 (30.9%) | 25 (13.5%) |
| 75 Years and over | 119 (100.0%) | 118 (79.7%) |
Disability Class by Sex by Age in Newport
Disability Class: Hearing Difficulty
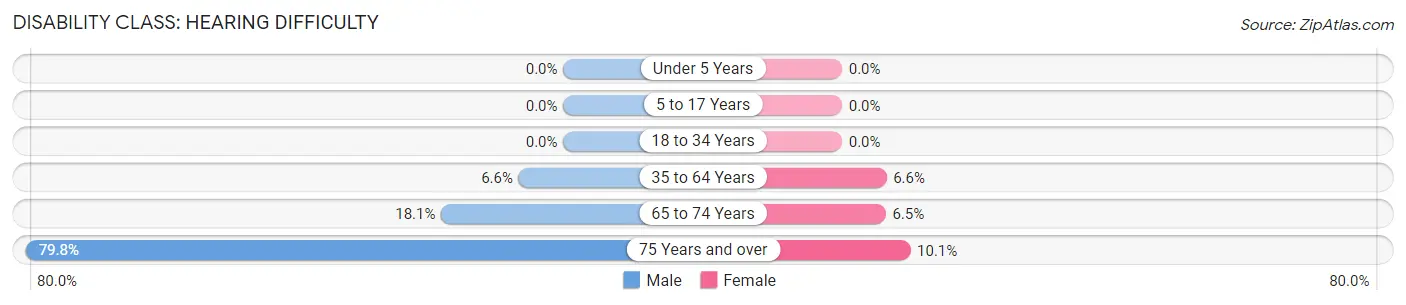
| Age Bracket | Male | Female |
| Under 5 Years | 0 (0.0%) | 0 (0.0%) |
| 5 to 17 Years | 0 (0.0%) | 0 (0.0%) |
| 18 to 34 Years | 0 (0.0%) | 0 (0.0%) |
| 35 to 64 Years | 50 (6.6%) | 61 (6.6%) |
| 65 to 74 Years | 27 (18.1%) | 12 (6.5%) |
| 75 Years and over | 95 (79.8%) | 15 (10.1%) |
Disability Class: Vision Difficulty
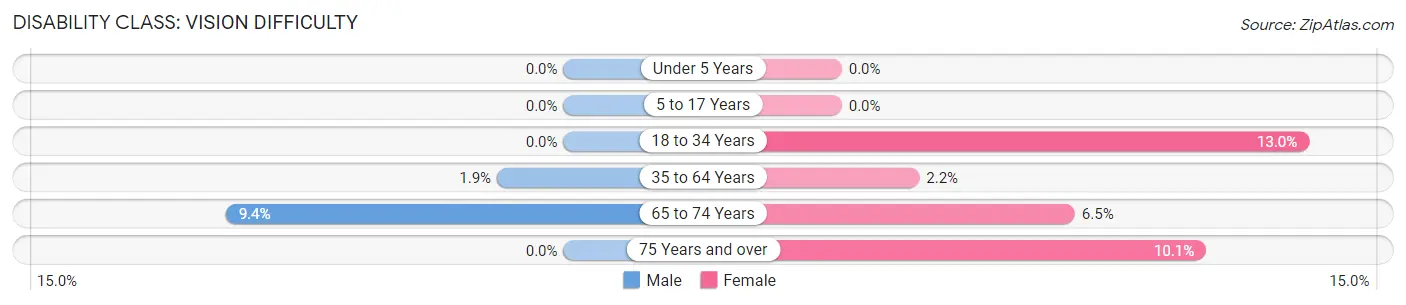
| Age Bracket | Male | Female |
| Under 5 Years | 0 (0.0%) | 0 (0.0%) |
| 5 to 17 Years | 0 (0.0%) | 0 (0.0%) |
| 18 to 34 Years | 0 (0.0%) | 57 (13.0%) |
| 35 to 64 Years | 14 (1.8%) | 20 (2.2%) |
| 65 to 74 Years | 14 (9.4%) | 12 (6.5%) |
| 75 Years and over | 0 (0.0%) | 15 (10.1%) |
Disability Class: Cognitive Difficulty
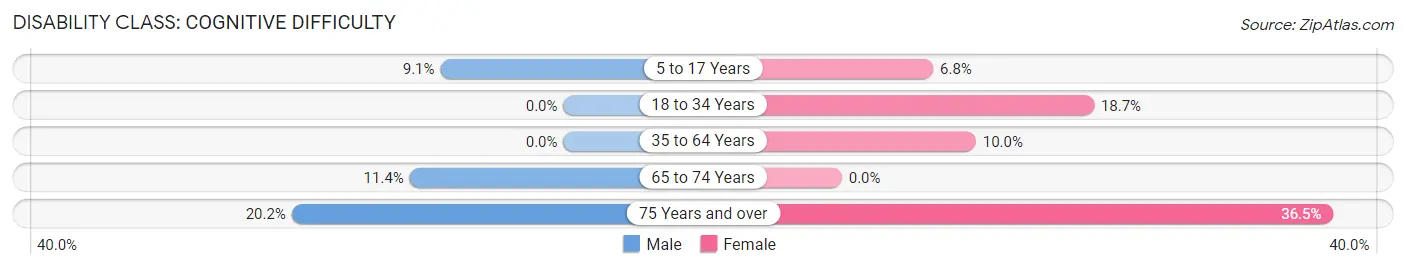
| Age Bracket | Male | Female |
| 5 to 17 Years | 22 (9.1%) | 29 (6.8%) |
| 18 to 34 Years | 0 (0.0%) | 82 (18.7%) |
| 35 to 64 Years | 0 (0.0%) | 92 (10.0%) |
| 65 to 74 Years | 17 (11.4%) | 0 (0.0%) |
| 75 Years and over | 24 (20.2%) | 54 (36.5%) |
Disability Class: Ambulatory Difficulty
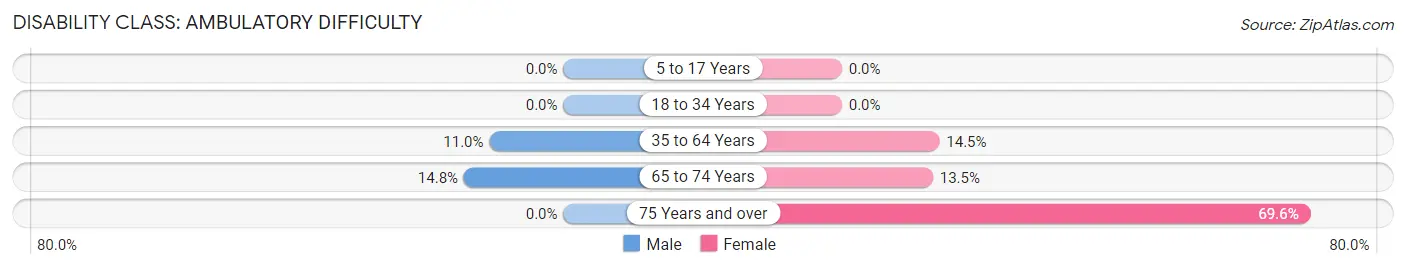
| Age Bracket | Male | Female |
| 5 to 17 Years | 0 (0.0%) | 0 (0.0%) |
| 18 to 34 Years | 0 (0.0%) | 0 (0.0%) |
| 35 to 64 Years | 83 (11.0%) | 134 (14.5%) |
| 65 to 74 Years | 22 (14.8%) | 25 (13.5%) |
| 75 Years and over | 0 (0.0%) | 103 (69.6%) |
Disability Class: Self-Care Difficulty
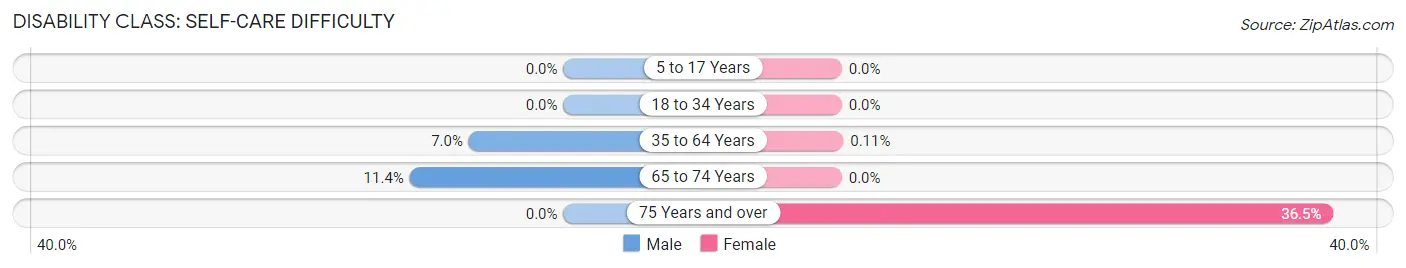
| Age Bracket | Male | Female |
| 5 to 17 Years | 0 (0.0%) | 0 (0.0%) |
| 18 to 34 Years | 0 (0.0%) | 0 (0.0%) |
| 35 to 64 Years | 53 (7.0%) | 1 (0.1%) |
| 65 to 74 Years | 17 (11.4%) | 0 (0.0%) |
| 75 Years and over | 0 (0.0%) | 54 (36.5%) |
Technology Access in Newport
Computing Device Access in Newport
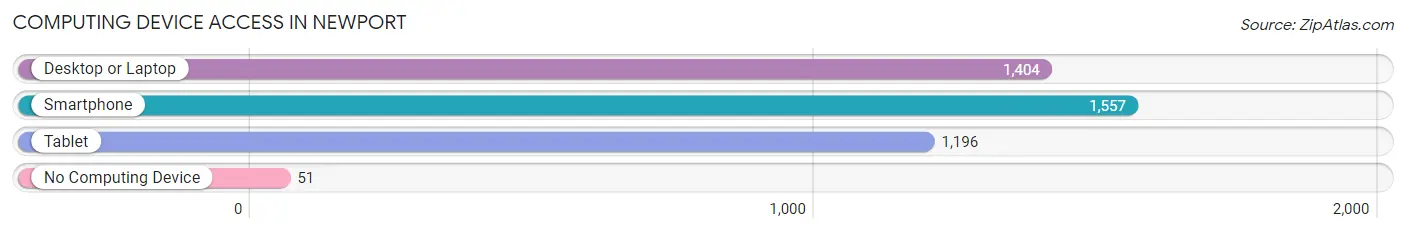
| Device Type | # Households | % Households |
| Desktop or Laptop | 1,404 | 85.6% |
| Smartphone | 1,557 | 94.9% |
| Tablet | 1,196 | 72.9% |
| No Computing Device | 51 | 3.1% |
| Total | 1,640 | 100.0% |
Internet Access in Newport
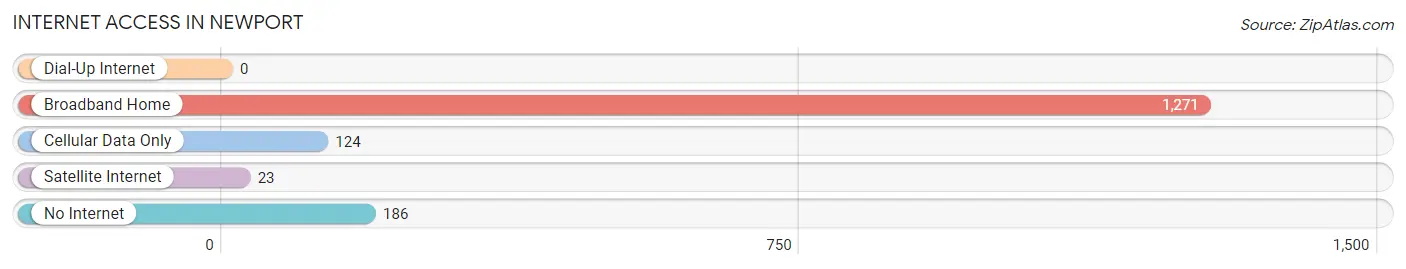
| Internet Type | # Households | % Households |
| Dial-Up Internet | 0 | 0.0% |
| Broadband Home | 1,271 | 77.5% |
| Cellular Data Only | 124 | 7.6% |
| Satellite Internet | 23 | 1.4% |
| No Internet | 186 | 11.3% |
| Total | 1,640 | 100.0% |
Newport Summary
Newport is a small town located in Carteret County, North Carolina. It is situated on the Newport River, which is part of the Intracoastal Waterway. The town is located approximately 30 miles east of Morehead City and approximately 40 miles west of Beaufort. The population of Newport was 2,837 at the 2010 census.
Geography
Newport is located at 34°45'25" North, 76°51'25" West (34.7569, -76.8569). According to the United States Census Bureau, the town has a total area of 2.2 square miles, all of it land.
History
Newport was first settled in 1709 by a group of English settlers from the Albemarle region of North Carolina. The town was originally known as Shepards Point, but was later renamed Newport in 1722. The town was incorporated in 1723 and was the first town in Carteret County.
In the early 19th century, Newport was a major port of entry for immigrants from Europe. The town was also a major center for the production of naval stores, such as tar, pitch, and turpentine.
During the Civil War, Newport was occupied by Union forces in 1862. The town was the site of a major battle in 1864, when Confederate forces attempted to retake the town. The Union forces were successful in defending the town and the Confederate forces were forced to retreat.
Economy
Newport’s economy is largely based on tourism and fishing. The town is home to several marinas, which attract visitors from all over the region. The town is also home to several seafood restaurants, which serve fresh seafood caught in the nearby waters.
The town is also home to several small businesses, including a grocery store, a hardware store, and a few antique shops.
Demographics
As of the 2010 census, there were 2,837 people, 1,093 households, and 745 families residing in the town. The population density was 1,279.2 people per square mile. The racial makeup of the town was 79.2% White, 15.3% African American, 0.4% Native American, 0.7% Asian, 0.1% Pacific Islander, 2.2% from other races, and 2.2% from two or more races. Hispanic or Latino of any race were 4.2% of the population.
The median income for a household in the town was $37,917, and the median income for a family was $45,938. The per capita income for the town was $19,945. About 14.2% of families and 17.2% of the population were below the poverty line, including 24.2% of those under age 18 and 11.2% of those age 65 or over.
Conclusion
Newport is a small town located in Carteret County, North Carolina. It is situated on the Newport River, which is part of the Intracoastal Waterway. The town was first settled in 1709 and was incorporated in 1723. The town’s economy is largely based on tourism and fishing. The population of Newport was 2,837 at the 2010 census. The town has a diverse population, with 79.2% of the population being White, 15.3% African American, 0.4% Native American, 0.7% Asian, 0.1% Pacific Islander, 2.2% from other races, and 2.2% from two or more races. The median income for a household in the town was $37,917, and the median income for a family was $45,938.
Common Questions
What is Per Capita Income in Newport?
Per Capita income in Newport is $39,819.
What is the Median Family Income in Newport?
Median Family Income in Newport is $91,343.
What is the Median Household income in Newport?
Median Household Income in Newport is $79,109.
What is Income or Wage Gap in Newport?
Income or Wage Gap in Newport is 50.0%.
Women in Newport earn 50.0 cents for every dollar earned by a man.
What is Inequality or Gini Index in Newport?
Inequality or Gini Index in Newport is 0.47.
What is the Total Population of Newport?
Total Population of Newport is 4,407.
What is the Total Male Population of Newport?
Total Male Population of Newport is 2,211.
What is the Total Female Population of Newport?
Total Female Population of Newport is 2,196.
What is the Ratio of Males per 100 Females in Newport?
There are 100.68 Males per 100 Females in Newport.
What is the Ratio of Females per 100 Males in Newport?
There are 99.32 Females per 100 Males in Newport.
What is the Median Population Age in Newport?
Median Population Age in Newport is 43.7 Years.
What is the Average Family Size in Newport
Average Family Size in Newport is 3.0 People.
What is the Average Household Size in Newport
Average Household Size in Newport is 2.4 People.
How Large is the Labor Force in Newport?
There are 2,282 People in the Labor Forcein in Newport.
What is the Percentage of People in the Labor Force in Newport?
59.2% of People are in the Labor Force in Newport.
What is the Unemployment Rate in Newport?
Unemployment Rate in Newport is 10.0%.