Bellevue borough, PA Map & Demographics
Bellevue borough Overview
$45,551
PER CAPITA INCOME
$97,622
AVG FAMILY INCOME
$60,778
AVG HOUSEHOLD INCOME
9.4%
WAGE / INCOME GAP [ % ]
90.6¢/ $1
WAGE / INCOME GAP [ $ ]
0.46
INEQUALITY / GINI INDEX
8,236
TOTAL POPULATION
3,916
MALE POPULATION
4,320
FEMALE POPULATION
90.65
MALES / 100 FEMALES
110.32
FEMALES / 100 MALES
37.0
MEDIAN AGE
2.8
AVG FAMILY SIZE
1.9
AVG HOUSEHOLD SIZE
5,403
LABOR FORCE [ PEOPLE ]
75.7%
PERCENT IN LABOR FORCE
3.7%
UNEMPLOYMENT RATE
Income in Bellevue borough
Income Overview in Bellevue borough
Per Capita Income in Bellevue borough is $45,551, while median incomes of families and households are $97,622 and $60,778 respectively.
| Characteristic | Number | Measure |
| Per Capita Income | 8,236 | $45,551 |
| Median Family Income | 1,734 | $97,622 |
| Mean Family Income | 1,734 | $121,890 |
| Median Household Income | 4,322 | $60,778 |
| Mean Household Income | 4,322 | $84,147 |
| Income Deficit | 1,734 | $0 |
| Wage / Income Gap (%) | 8,236 | 9.39% |
| Wage / Income Gap ($) | 8,236 | 90.61¢ per $1 |
| Gini / Inequality Index | 8,236 | 0.46 |
Earnings by Sex in Bellevue borough
Average Earnings in Bellevue borough are $47,054, $48,549 for men and $43,988 for women, a difference of 9.4%.
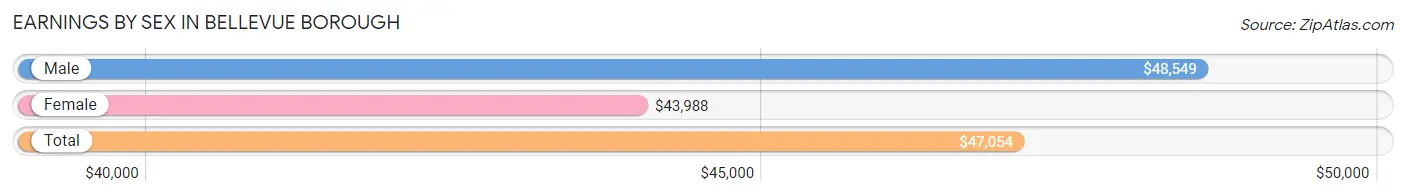
| Sex | Number | Average Earnings |
| Male | 2,616 (48.0%) | $48,549 |
| Female | 2,839 (52.0%) | $43,988 |
| Total | 5,455 (100.0%) | $47,054 |
Earnings by Sex by Income Bracket in Bellevue borough
The most common earnings brackets in Bellevue borough are $100,000+ for men (360 | 13.8%) and $55,000 to $64,999 for women (516 | 18.2%).
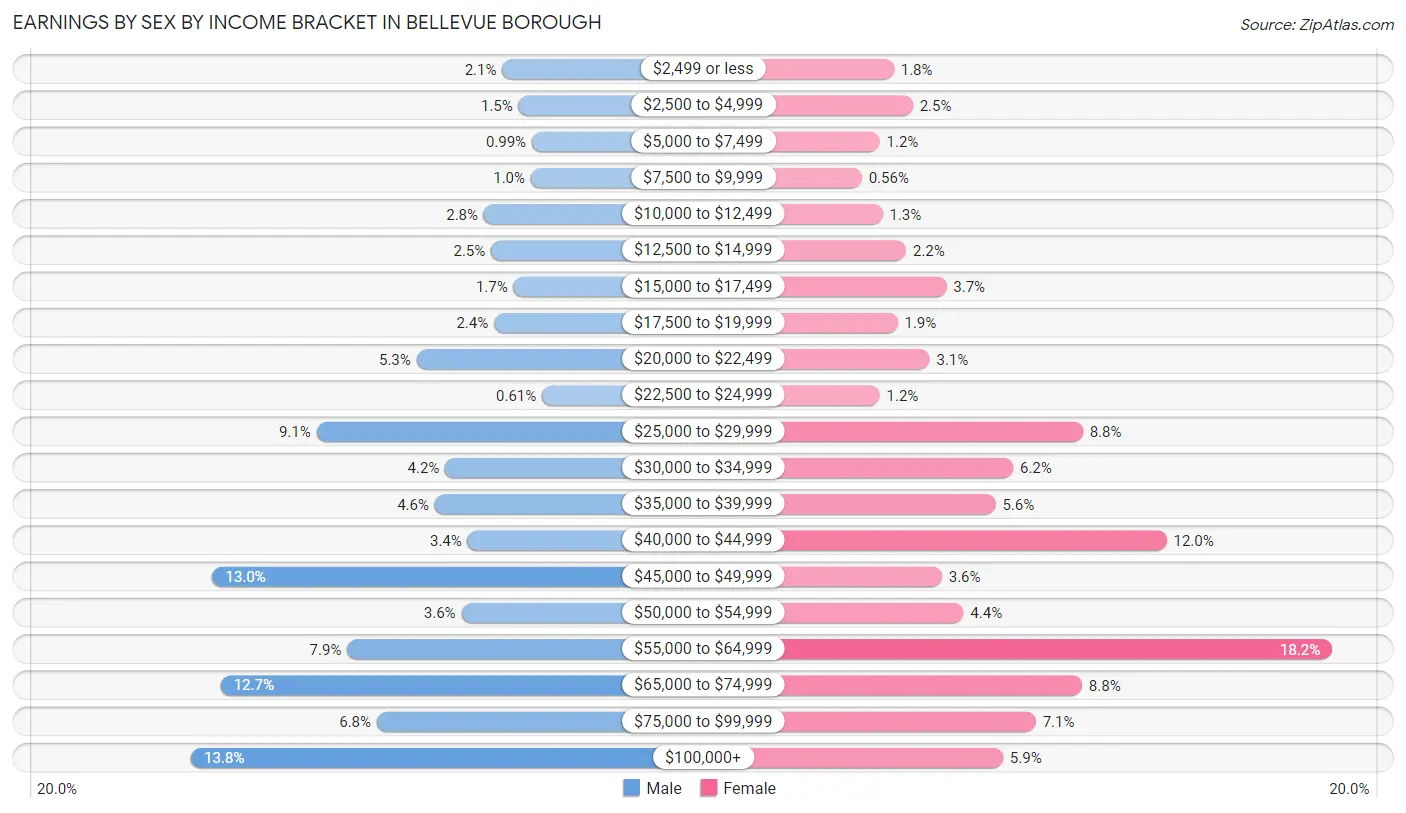
| Income | Male | Female |
| $2,499 or less | 55 (2.1%) | 50 (1.8%) |
| $2,500 to $4,999 | 39 (1.5%) | 70 (2.5%) |
| $5,000 to $7,499 | 26 (1.0%) | 35 (1.2%) |
| $7,500 to $9,999 | 27 (1.0%) | 16 (0.6%) |
| $10,000 to $12,499 | 73 (2.8%) | 38 (1.3%) |
| $12,500 to $14,999 | 66 (2.5%) | 63 (2.2%) |
| $15,000 to $17,499 | 44 (1.7%) | 106 (3.7%) |
| $17,500 to $19,999 | 63 (2.4%) | 54 (1.9%) |
| $20,000 to $22,499 | 139 (5.3%) | 88 (3.1%) |
| $22,500 to $24,999 | 16 (0.6%) | 35 (1.2%) |
| $25,000 to $29,999 | 237 (9.1%) | 251 (8.8%) |
| $30,000 to $34,999 | 111 (4.2%) | 177 (6.2%) |
| $35,000 to $39,999 | 121 (4.6%) | 158 (5.6%) |
| $40,000 to $44,999 | 89 (3.4%) | 340 (12.0%) |
| $45,000 to $49,999 | 339 (13.0%) | 101 (3.6%) |
| $50,000 to $54,999 | 95 (3.6%) | 124 (4.4%) |
| $55,000 to $64,999 | 207 (7.9%) | 516 (18.2%) |
| $65,000 to $74,999 | 331 (12.7%) | 250 (8.8%) |
| $75,000 to $99,999 | 178 (6.8%) | 201 (7.1%) |
| $100,000+ | 360 (13.8%) | 166 (5.9%) |
| Total | 2,616 (100.0%) | 2,839 (100.0%) |
Earnings by Sex by Educational Attainment in Bellevue borough
Average earnings in Bellevue borough are $49,396 for men and $47,604 for women, a difference of 3.6%. Men with an educational attainment of graduate degree enjoy the highest average annual earnings of $92,917, while those with less than high school education earn the least with $21,923. Women with an educational attainment of graduate degree earn the most with the average annual earnings of $64,009, while those with high school diploma education have the smallest earnings of $28,621.
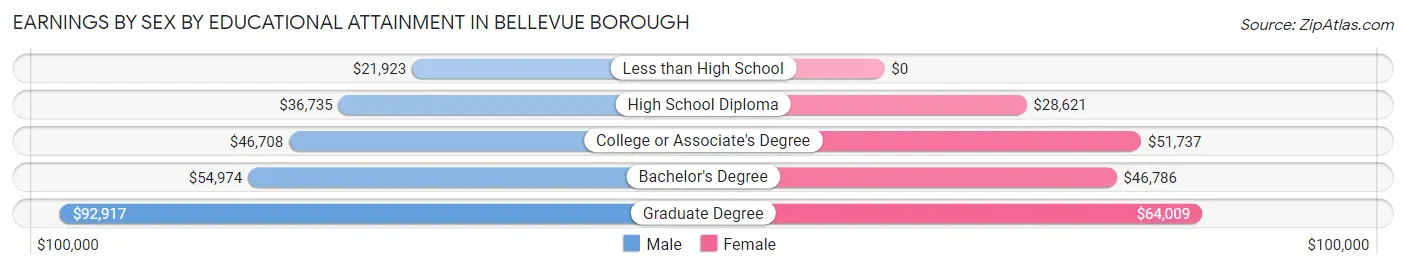
| Educational Attainment | Male Income | Female Income |
| Less than High School | $21,923 | $0 |
| High School Diploma | $36,735 | $28,621 |
| College or Associate's Degree | $46,708 | $51,737 |
| Bachelor's Degree | $54,974 | $46,786 |
| Graduate Degree | $92,917 | $64,009 |
| Total | $49,396 | $47,604 |
Family Income in Bellevue borough
Family Income Brackets in Bellevue borough
According to the Bellevue borough family income data, there are 407 families falling into the $100,000 to $149,999 income range, which is the most common income bracket and makes up 23.5% of all families.
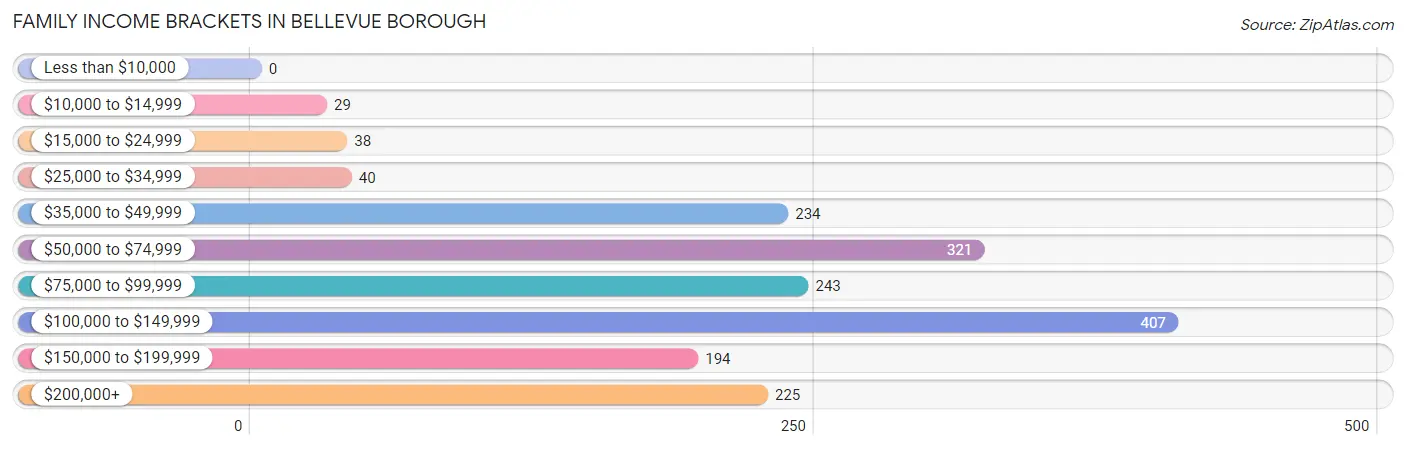
| Income Bracket | # Families | % Families |
| Less than $10,000 | 0 | 0.0% |
| $10,000 to $14,999 | 29 | 1.7% |
| $15,000 to $24,999 | 38 | 2.2% |
| $25,000 to $34,999 | 40 | 2.3% |
| $35,000 to $49,999 | 234 | 13.5% |
| $50,000 to $74,999 | 321 | 18.5% |
| $75,000 to $99,999 | 243 | 14.0% |
| $100,000 to $149,999 | 407 | 23.5% |
| $150,000 to $199,999 | 194 | 11.2% |
| $200,000+ | 225 | 13.0% |
Family Income by Famaliy Size in Bellevue borough
5-person families (62 | 3.6%) account for the highest median family income in Bellevue borough with $123,750 per family, while 2-person families (1,072 | 61.8%) have the highest median income of $44,244 per family member.
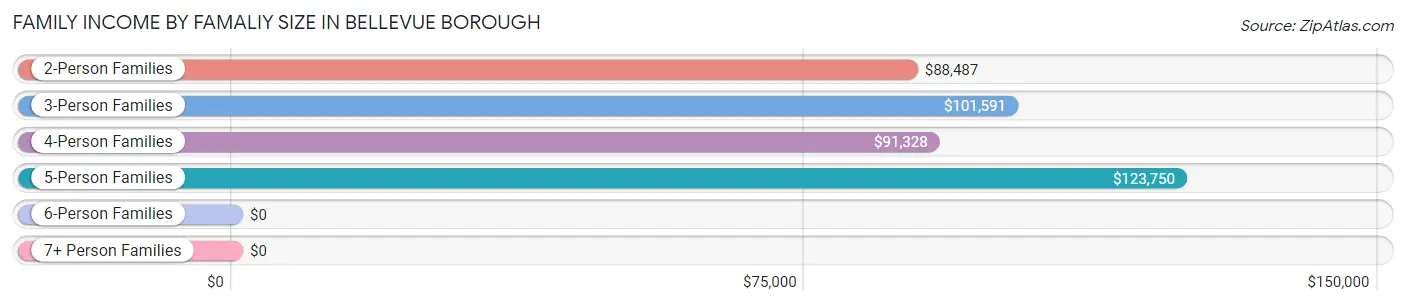
| Income Bracket | # Families | Median Income |
| 2-Person Families | 1,072 (61.8%) | $88,487 |
| 3-Person Families | 290 (16.7%) | $101,591 |
| 4-Person Families | 265 (15.3%) | $91,328 |
| 5-Person Families | 62 (3.6%) | $123,750 |
| 6-Person Families | 33 (1.9%) | $0 |
| 7+ Person Families | 12 (0.7%) | $0 |
| Total | 1,734 (100.0%) | $97,622 |
Family Income by Number of Earners in Bellevue borough
The median family income in Bellevue borough is $97,622, with families comprising 2 earners (1,005) having the highest median family income of $123,542, while families with 1 earner (484) have the lowest median family income of $58,333, accounting for 58.0% and 27.9% of families, respectively.
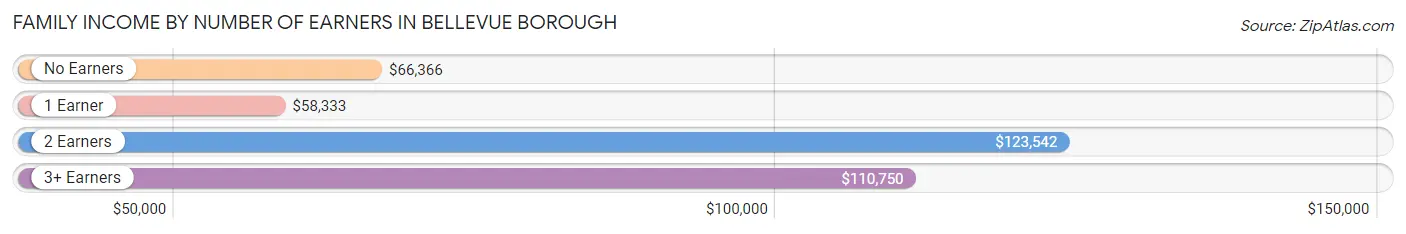
| Number of Earners | # Families | Median Income |
| No Earners | 151 (8.7%) | $66,366 |
| 1 Earner | 484 (27.9%) | $58,333 |
| 2 Earners | 1,005 (58.0%) | $123,542 |
| 3+ Earners | 94 (5.4%) | $110,750 |
| Total | 1,734 (100.0%) | $97,622 |
Household Income in Bellevue borough
Household Income Brackets in Bellevue borough
With 947 households falling in the category, the $50,000 to $74,999 income range is the most frequent in Bellevue borough, accounting for 21.9% of all households. In contrast, only 121 households (2.8%) fall into the less than $10,000 income bracket, making it the least populous group.
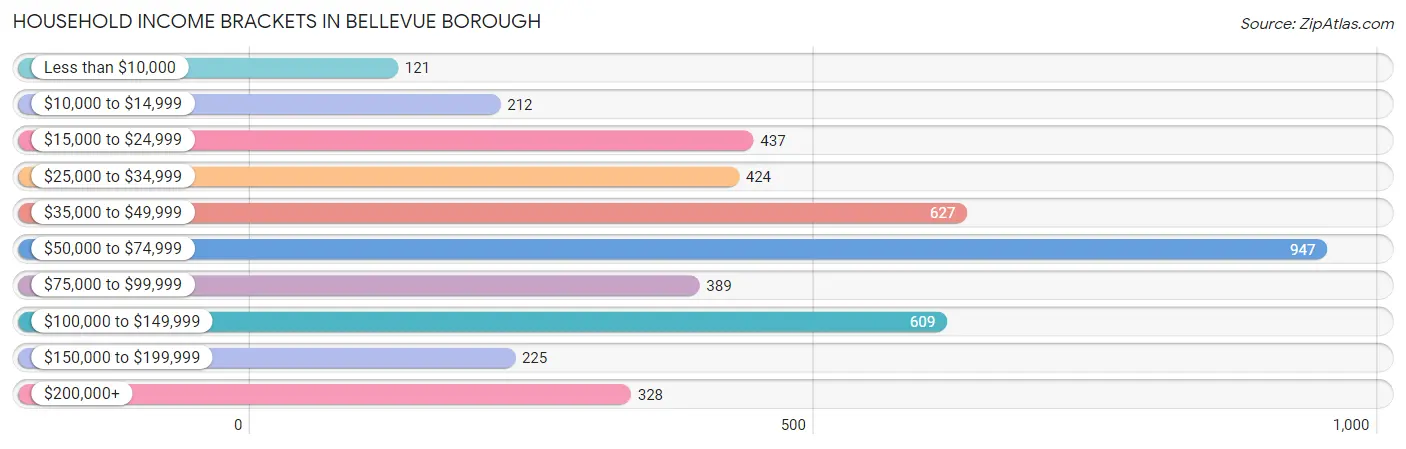
| Income Bracket | # Households | % Households |
| Less than $10,000 | 121 | 2.8% |
| $10,000 to $14,999 | 212 | 4.9% |
| $15,000 to $24,999 | 437 | 10.1% |
| $25,000 to $34,999 | 424 | 9.8% |
| $35,000 to $49,999 | 627 | 14.5% |
| $50,000 to $74,999 | 947 | 21.9% |
| $75,000 to $99,999 | 389 | 9.0% |
| $100,000 to $149,999 | 609 | 14.1% |
| $150,000 to $199,999 | 225 | 5.2% |
| $200,000+ | 328 | 7.6% |
Household Income by Householder Age in Bellevue borough
The median household income in Bellevue borough is $60,778, with the highest median household income of $76,250 found in the 25 to 44 years age bracket for the primary householder. A total of 1,923 households (44.5%) fall into this category. Meanwhile, the 65+ years age bracket for the primary householder has the lowest median household income of $32,391, with 958 households (22.2%) in this group.
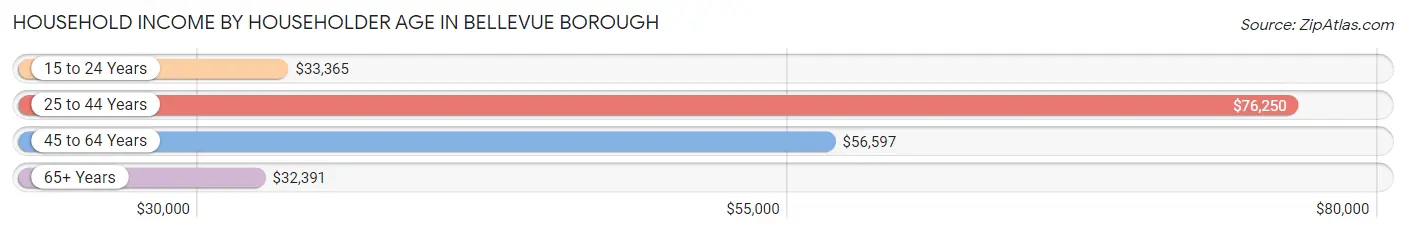
| Income Bracket | # Households | Median Income |
| 15 to 24 Years | 217 (5.0%) | $33,365 |
| 25 to 44 Years | 1,923 (44.5%) | $76,250 |
| 45 to 64 Years | 1,224 (28.3%) | $56,597 |
| 65+ Years | 958 (22.2%) | $32,391 |
| Total | 4,322 (100.0%) | $60,778 |
Poverty in Bellevue borough
Income Below Poverty by Sex and Age in Bellevue borough
With 9.5% poverty level for males and 5.6% for females among the residents of Bellevue borough, 18 to 24 year old males and 18 to 24 year old females are the most vulnerable to poverty, with 65 males (33.5%) and 46 females (15.0%) in their respective age groups living below the poverty level.
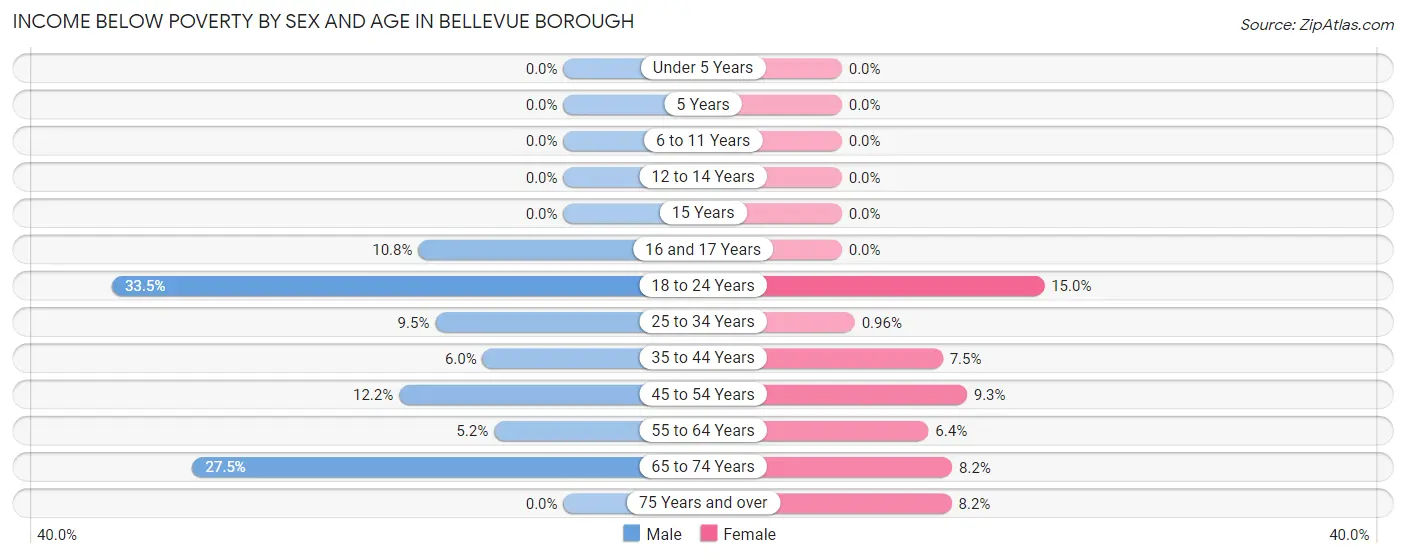
| Age Bracket | Male | Female |
| Under 5 Years | 0 (0.0%) | 0 (0.0%) |
| 5 Years | 0 (0.0%) | 0 (0.0%) |
| 6 to 11 Years | 0 (0.0%) | 0 (0.0%) |
| 12 to 14 Years | 0 (0.0%) | 0 (0.0%) |
| 15 Years | 0 (0.0%) | 0 (0.0%) |
| 16 and 17 Years | 7 (10.8%) | 0 (0.0%) |
| 18 to 24 Years | 65 (33.5%) | 46 (15.0%) |
| 25 to 34 Years | 108 (9.5%) | 10 (1.0%) |
| 35 to 44 Years | 38 (6.0%) | 42 (7.5%) |
| 45 to 54 Years | 35 (12.2%) | 40 (9.3%) |
| 55 to 64 Years | 28 (5.1%) | 38 (6.4%) |
| 65 to 74 Years | 92 (27.5%) | 37 (8.2%) |
| 75 Years and over | 0 (0.0%) | 30 (8.2%) |
| Total | 373 (9.5%) | 243 (5.6%) |
Income Above Poverty by Sex and Age in Bellevue borough
According to the poverty statistics in Bellevue borough, males aged under 5 years and females aged under 5 years are the age groups that are most secure financially, with 100.0% of males and 100.0% of females in these age groups living above the poverty line.
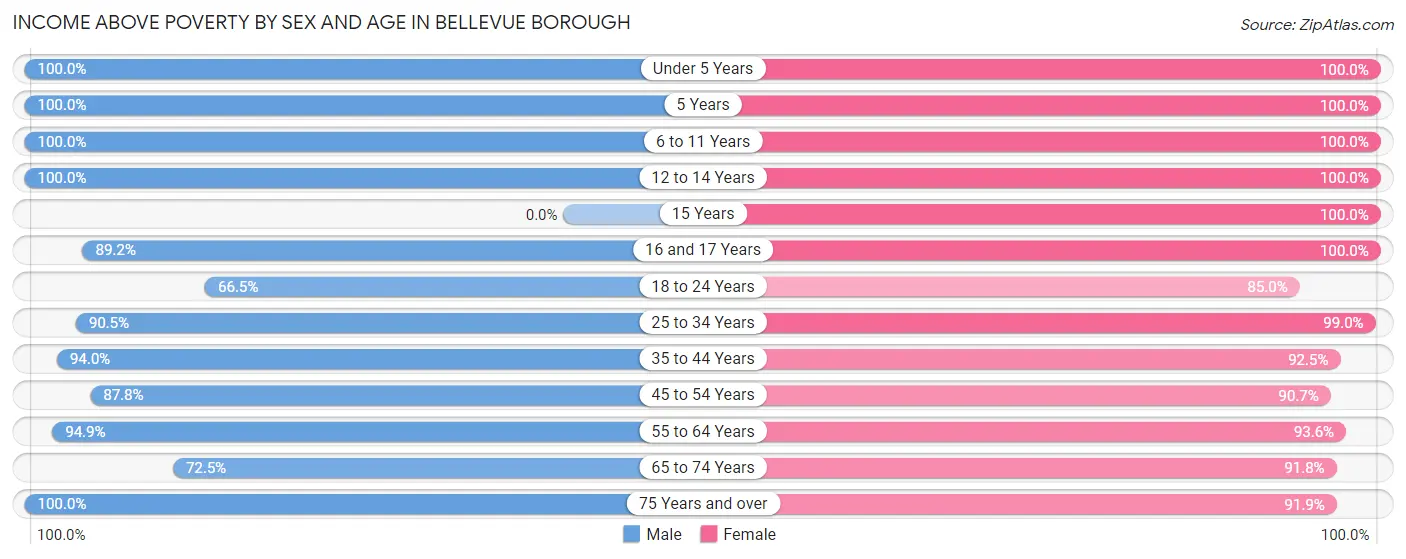
| Age Bracket | Male | Female |
| Under 5 Years | 272 (100.0%) | 189 (100.0%) |
| 5 Years | 26 (100.0%) | 57 (100.0%) |
| 6 to 11 Years | 197 (100.0%) | 128 (100.0%) |
| 12 to 14 Years | 81 (100.0%) | 102 (100.0%) |
| 15 Years | 0 (0.0%) | 35 (100.0%) |
| 16 and 17 Years | 58 (89.2%) | 41 (100.0%) |
| 18 to 24 Years | 129 (66.5%) | 260 (85.0%) |
| 25 to 34 Years | 1,028 (90.5%) | 1,037 (99.0%) |
| 35 to 44 Years | 595 (94.0%) | 519 (92.5%) |
| 45 to 54 Years | 252 (87.8%) | 391 (90.7%) |
| 55 to 64 Years | 516 (94.9%) | 553 (93.6%) |
| 65 to 74 Years | 242 (72.5%) | 415 (91.8%) |
| 75 Years and over | 147 (100.0%) | 338 (91.8%) |
| Total | 3,543 (90.5%) | 4,065 (94.4%) |
Income Below Poverty Among Married-Couple Families in Bellevue borough
The poverty statistics for married-couple families in Bellevue borough show that 2.4% or 30 of the total 1,246 families live below the poverty line. Families with no children have the highest poverty rate of 3.6%, comprising of 30 families. On the other hand, families with 1 or 2 children have the lowest poverty rate of 0.0%, which includes 0 families.
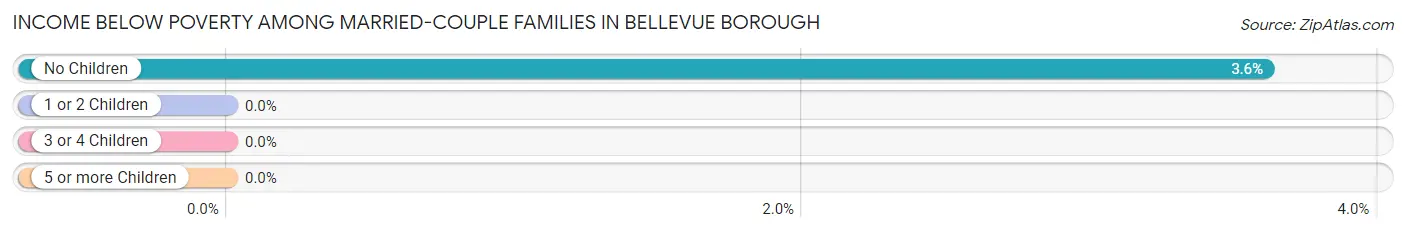
| Children | Above Poverty | Below Poverty |
| No Children | 802 (96.4%) | 30 (3.6%) |
| 1 or 2 Children | 334 (100.0%) | 0 (0.0%) |
| 3 or 4 Children | 80 (100.0%) | 0 (0.0%) |
| 5 or more Children | 0 (0.0%) | 0 (0.0%) |
| Total | 1,216 (97.6%) | 30 (2.4%) |
Income Below Poverty Among Single-Parent Households in Bellevue borough
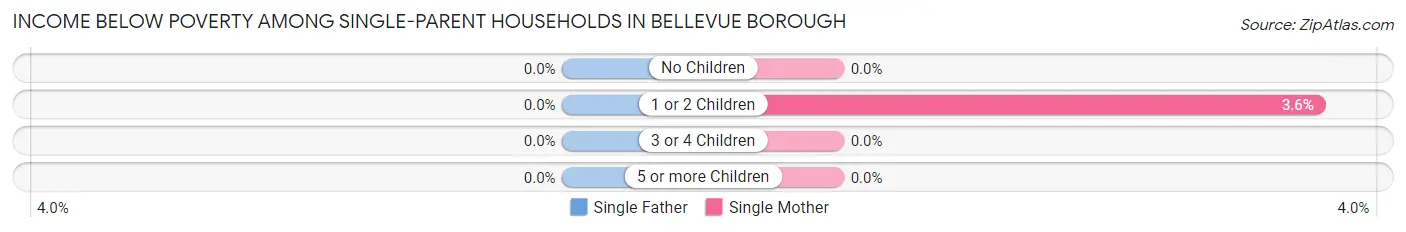
| Children | Single Father | Single Mother |
| No Children | 0 (0.0%) | 0 (0.0%) |
| 1 or 2 Children | 0 (0.0%) | 6 (3.6%) |
| 3 or 4 Children | 0 (0.0%) | 0 (0.0%) |
| 5 or more Children | 0 (0.0%) | 0 (0.0%) |
| Total | 0 (0.0%) | 6 (1.7%) |
Income Below Poverty Among Married-Couple vs Single-Parent Households in Bellevue borough
The poverty data for Bellevue borough shows that 30 of the married-couple family households (2.4%) and 6 of the single-parent households (1.2%) are living below the poverty level. Within the married-couple family households, those with no children have the highest poverty rate, with 30 households (3.6%) falling below the poverty line. Among the single-parent households, those with 1 or 2 children have the highest poverty rate, with 6 household (2.4%) living below poverty.
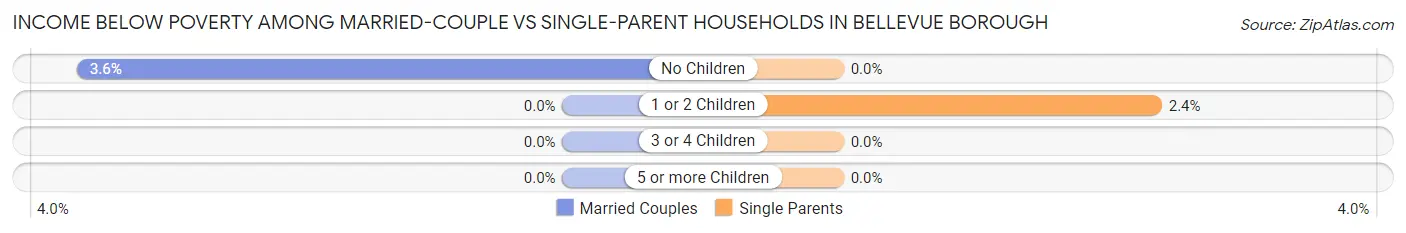
| Children | Married-Couple Families | Single-Parent Households |
| No Children | 30 (3.6%) | 0 (0.0%) |
| 1 or 2 Children | 0 (0.0%) | 6 (2.4%) |
| 3 or 4 Children | 0 (0.0%) | 0 (0.0%) |
| 5 or more Children | 0 (0.0%) | 0 (0.0%) |
| Total | 30 (2.4%) | 6 (1.2%) |
Race in Bellevue borough
The most populous races in Bellevue borough are White / Caucasian (6,805 | 82.6%), Black / African American (959 | 11.6%), and Two or more Races (367 | 4.5%).
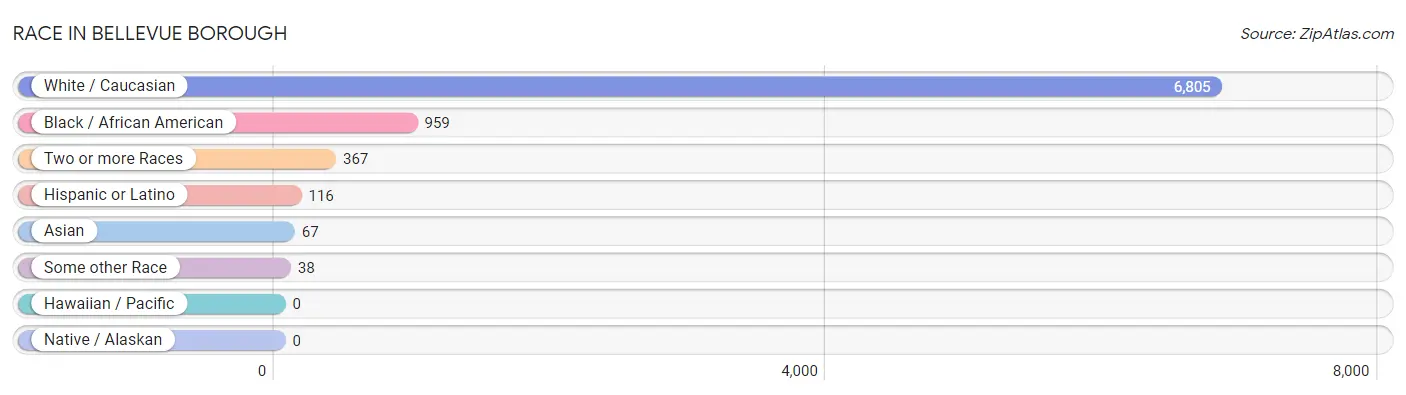
| Race | # Population | % Population |
| Asian | 67 | 0.8% |
| Black / African American | 959 | 11.6% |
| Hawaiian / Pacific | 0 | 0.0% |
| Hispanic or Latino | 116 | 1.4% |
| Native / Alaskan | 0 | 0.0% |
| White / Caucasian | 6,805 | 82.6% |
| Two or more Races | 367 | 4.5% |
| Some other Race | 38 | 0.5% |
| Total | 8,236 | 100.0% |
Ancestry in Bellevue borough
The most populous ancestries reported in Bellevue borough are German (2,461 | 29.9%), Irish (1,721 | 20.9%), English (837 | 10.2%), Italian (785 | 9.5%), and Polish (683 | 8.3%), together accounting for 78.8% of all Bellevue borough residents.
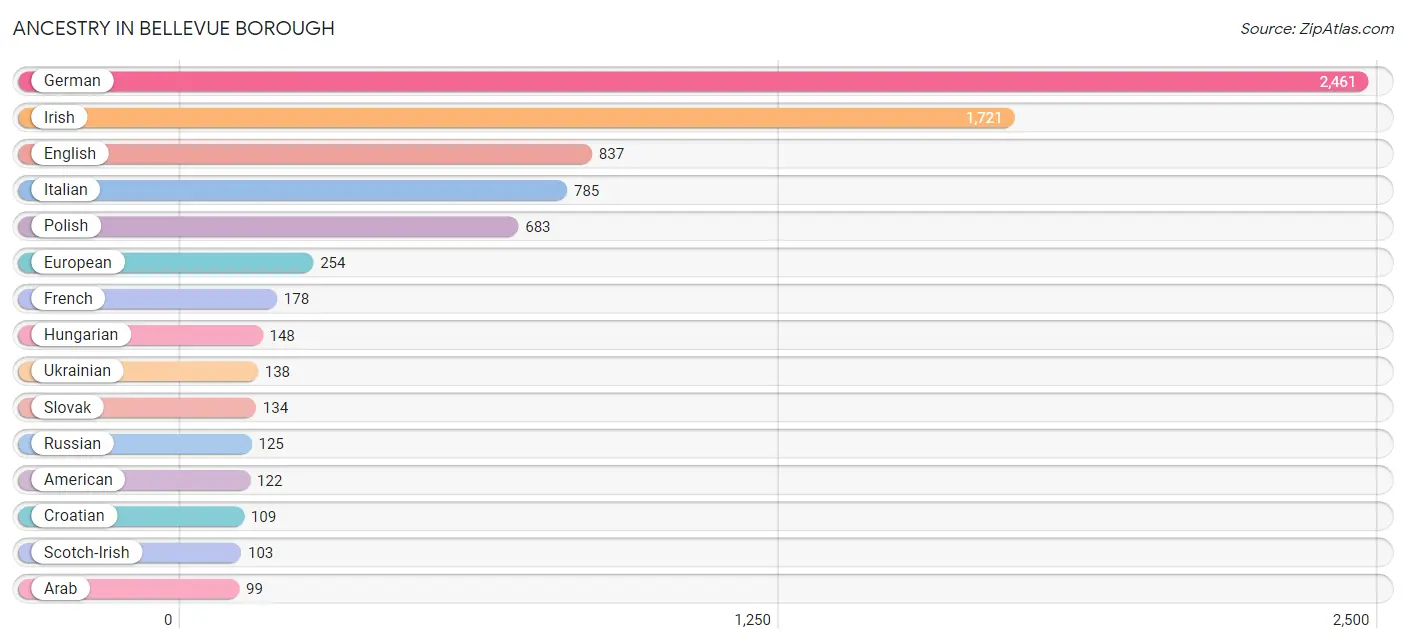
| Ancestry | # Population | % Population |
| African | 58 | 0.7% |
| Albanian | 16 | 0.2% |
| American | 122 | 1.5% |
| Arab | 99 | 1.2% |
| Armenian | 9 | 0.1% |
| Austrian | 46 | 0.6% |
| Bhutanese | 7 | 0.1% |
| Blackfeet | 4 | 0.1% |
| British | 56 | 0.7% |
| Burmese | 17 | 0.2% |
| Central American | 27 | 0.3% |
| Croatian | 109 | 1.3% |
| Czech | 36 | 0.4% |
| Czechoslovakian | 13 | 0.2% |
| Dutch | 75 | 0.9% |
| Eastern European | 50 | 0.6% |
| English | 837 | 10.2% |
| European | 254 | 3.1% |
| Finnish | 6 | 0.1% |
| French | 178 | 2.2% |
| French Canadian | 43 | 0.5% |
| German | 2,461 | 29.9% |
| Greek | 71 | 0.9% |
| Guatemalan | 11 | 0.1% |
| Honduran | 10 | 0.1% |
| Hungarian | 148 | 1.8% |
| Indian (Asian) | 51 | 0.6% |
| Irish | 1,721 | 20.9% |
| Italian | 785 | 9.5% |
| Korean | 8 | 0.1% |
| Lebanese | 31 | 0.4% |
| Lithuanian | 24 | 0.3% |
| Mexican | 77 | 0.9% |
| Northern European | 8 | 0.1% |
| Norwegian | 22 | 0.3% |
| Panamanian | 6 | 0.1% |
| Polish | 683 | 8.3% |
| Portuguese | 9 | 0.1% |
| Romanian | 9 | 0.1% |
| Russian | 125 | 1.5% |
| Scandinavian | 34 | 0.4% |
| Scotch-Irish | 103 | 1.3% |
| Scottish | 74 | 0.9% |
| Serbian | 8 | 0.1% |
| Slavic | 14 | 0.2% |
| Slovak | 134 | 1.6% |
| South American | 12 | 0.2% |
| Subsaharan African | 82 | 1.0% |
| Swedish | 80 | 1.0% |
| Swiss | 36 | 0.4% |
| Syrian | 12 | 0.2% |
| Thai | 52 | 0.6% |
| Ukrainian | 138 | 1.7% |
| Venezuelan | 12 | 0.2% |
| Welsh | 37 | 0.4% |
| Yugoslavian | 6 | 0.1% | View All 56 Rows |
Immigrants in Bellevue borough
The most numerous immigrant groups reported in Bellevue borough came from Europe (75 | 0.9%), Asia (62 | 0.7%), Latin America (50 | 0.6%), Eastern Europe (36 | 0.4%), and Iraq (24 | 0.3%), together accounting for 3.0% of all Bellevue borough residents.
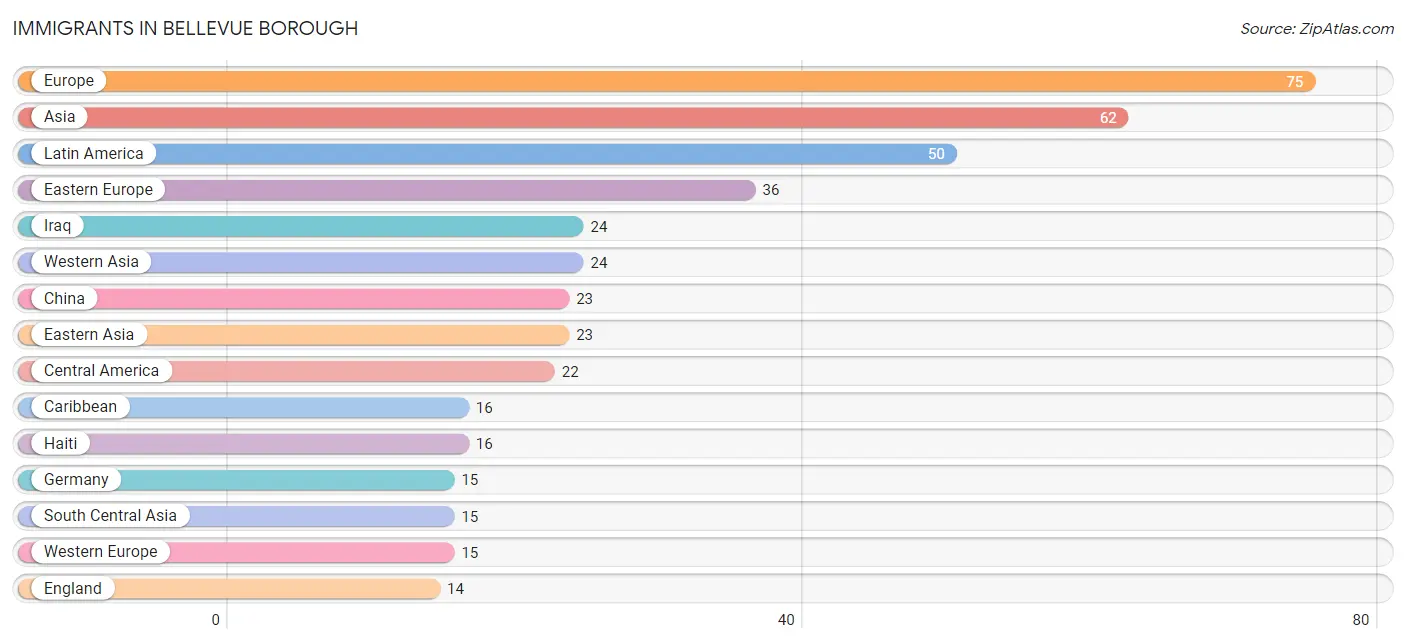
| Immigration Origin | # Population | % Population |
| Africa | 13 | 0.2% |
| Asia | 62 | 0.7% |
| Bosnia and Herzegovina | 6 | 0.1% |
| Canada | 11 | 0.1% |
| Caribbean | 16 | 0.2% |
| Central America | 22 | 0.3% |
| China | 23 | 0.3% |
| Eastern Africa | 13 | 0.2% |
| Eastern Asia | 23 | 0.3% |
| Eastern Europe | 36 | 0.4% |
| England | 14 | 0.2% |
| Europe | 75 | 0.9% |
| Germany | 15 | 0.2% |
| Haiti | 16 | 0.2% |
| Honduras | 10 | 0.1% |
| Hong Kong | 10 | 0.1% |
| Iraq | 24 | 0.3% |
| Italy | 10 | 0.1% |
| Latin America | 50 | 0.6% |
| Lithuania | 8 | 0.1% |
| Mexico | 12 | 0.2% |
| Northern Europe | 14 | 0.2% |
| Pakistan | 8 | 0.1% |
| Poland | 3 | 0.0% |
| Russia | 11 | 0.1% |
| South America | 12 | 0.2% |
| South Central Asia | 15 | 0.2% |
| Southern Europe | 10 | 0.1% |
| Sri Lanka | 7 | 0.1% |
| Venezuela | 12 | 0.2% |
| Western Asia | 24 | 0.3% |
| Western Europe | 15 | 0.2% | View All 32 Rows |
Sex and Age in Bellevue borough
Sex and Age in Bellevue borough
The most populous age groups in Bellevue borough are 25 to 29 Years (635 | 16.2%) for men and 25 to 29 Years (649 | 15.0%) for women.
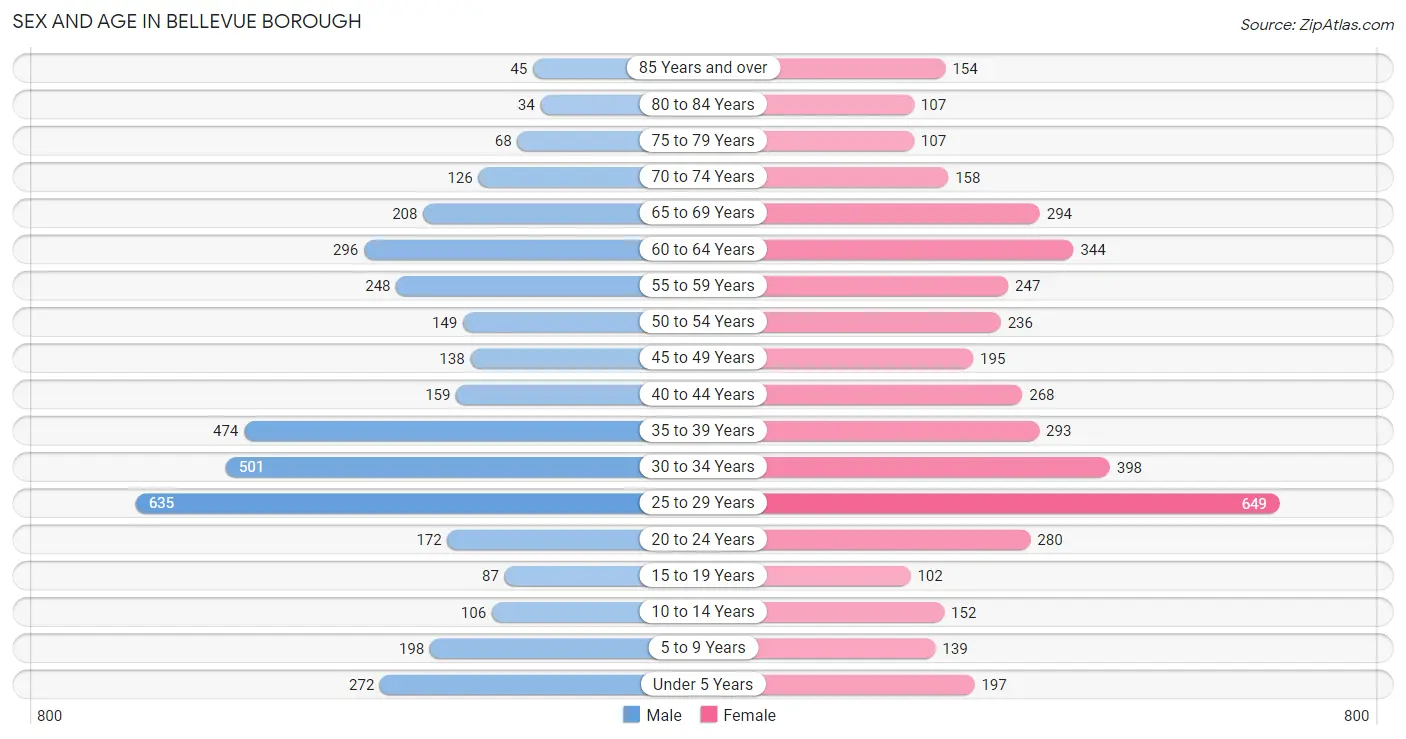
| Age Bracket | Male | Female |
| Under 5 Years | 272 (7.0%) | 197 (4.6%) |
| 5 to 9 Years | 198 (5.1%) | 139 (3.2%) |
| 10 to 14 Years | 106 (2.7%) | 152 (3.5%) |
| 15 to 19 Years | 87 (2.2%) | 102 (2.4%) |
| 20 to 24 Years | 172 (4.4%) | 280 (6.5%) |
| 25 to 29 Years | 635 (16.2%) | 649 (15.0%) |
| 30 to 34 Years | 501 (12.8%) | 398 (9.2%) |
| 35 to 39 Years | 474 (12.1%) | 293 (6.8%) |
| 40 to 44 Years | 159 (4.1%) | 268 (6.2%) |
| 45 to 49 Years | 138 (3.5%) | 195 (4.5%) |
| 50 to 54 Years | 149 (3.8%) | 236 (5.5%) |
| 55 to 59 Years | 248 (6.3%) | 247 (5.7%) |
| 60 to 64 Years | 296 (7.6%) | 344 (8.0%) |
| 65 to 69 Years | 208 (5.3%) | 294 (6.8%) |
| 70 to 74 Years | 126 (3.2%) | 158 (3.7%) |
| 75 to 79 Years | 68 (1.7%) | 107 (2.5%) |
| 80 to 84 Years | 34 (0.9%) | 107 (2.5%) |
| 85 Years and over | 45 (1.1%) | 154 (3.6%) |
| Total | 3,916 (100.0%) | 4,320 (100.0%) |
Families and Households in Bellevue borough
Median Family Size in Bellevue borough
The median family size in Bellevue borough is 2.82 persons per family, with single female/mother families (359 | 20.7%) accounting for the largest median family size of 3.14 persons per family. On the other hand, single male/father families (129 | 7.4%) represent the smallest median family size with 2.37 persons per family.
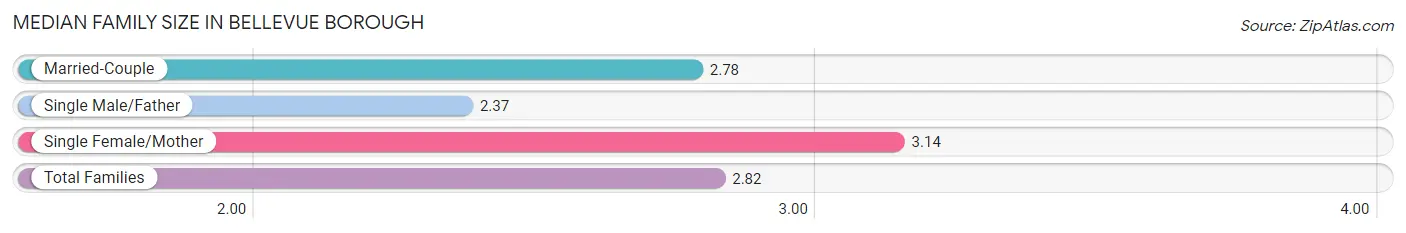
| Family Type | # Families | Family Size |
| Married-Couple | 1,246 (71.9%) | 2.78 |
| Single Male/Father | 129 (7.4%) | 2.37 |
| Single Female/Mother | 359 (20.7%) | 3.14 |
| Total Families | 1,734 (100.0%) | 2.82 |
Median Household Size in Bellevue borough
The median household size in Bellevue borough is 1.89 persons per household, with single female/mother households (359 | 8.3%) accounting for the largest median household size of 3.44 persons per household. non-family households (2,588 | 59.9%) represent the smallest median household size with 1.20 persons per household.
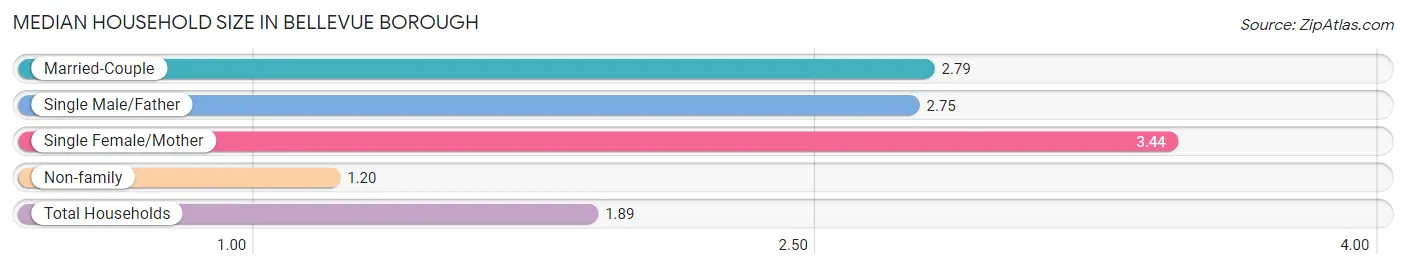
| Household Type | # Households | Household Size |
| Married-Couple | 1,246 (28.8%) | 2.79 |
| Single Male/Father | 129 (3.0%) | 2.75 |
| Single Female/Mother | 359 (8.3%) | 3.44 |
| Non-family | 2,588 (59.9%) | 1.20 |
| Total Households | 4,322 (100.0%) | 1.89 |
Household Size by Marriage Status in Bellevue borough
Out of a total of 4,322 households in Bellevue borough, 1,734 (40.1%) are family households, while 2,588 (59.9%) are nonfamily households. The most numerous type of family households are 2-person households, comprising 989, and the most common type of nonfamily households are 1-person households, comprising 2,152.
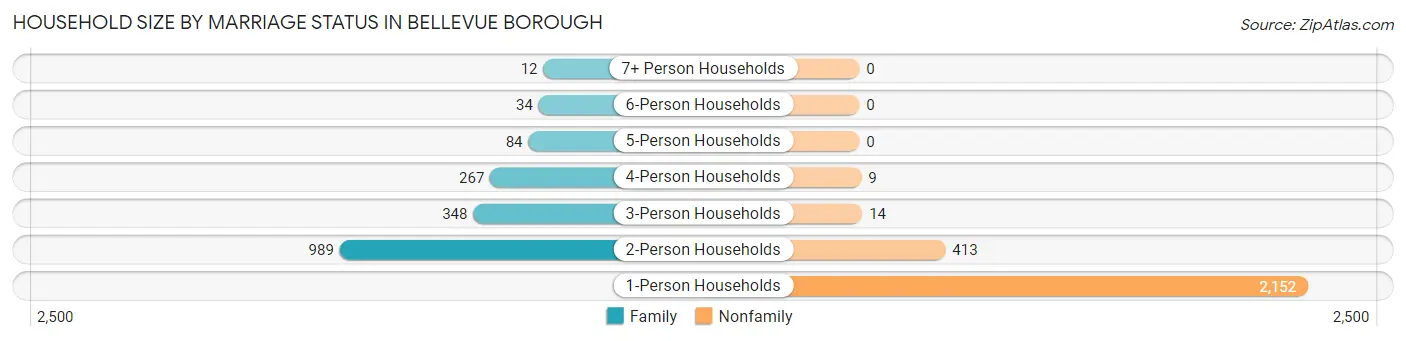
| Household Size | Family Households | Nonfamily Households |
| 1-Person Households | - | 2,152 (49.8%) |
| 2-Person Households | 989 (22.9%) | 413 (9.6%) |
| 3-Person Households | 348 (8.1%) | 14 (0.3%) |
| 4-Person Households | 267 (6.2%) | 9 (0.2%) |
| 5-Person Households | 84 (1.9%) | 0 (0.0%) |
| 6-Person Households | 34 (0.8%) | 0 (0.0%) |
| 7+ Person Households | 12 (0.3%) | 0 (0.0%) |
| Total | 1,734 (40.1%) | 2,588 (59.9%) |
Female Fertility in Bellevue borough
Fertility by Age in Bellevue borough
Average fertility rate in Bellevue borough is 76.0 births per 1,000 women. Women in the age bracket of 20 to 34 years have the highest fertility rate with 95.0 births per 1,000 women. Women in the age bracket of 20 to 34 years acount for 73.7% of all women with births.
| Age Bracket | Women with Births | Births / 1,000 Women |
| 15 to 19 years | 0 (0.0%) | 0.0 |
| 20 to 34 years | 126 (73.7%) | 95.0 |
| 35 to 50 years | 45 (26.3%) | 55.0 |
| Total | 171 (100.0%) | 76.0 |
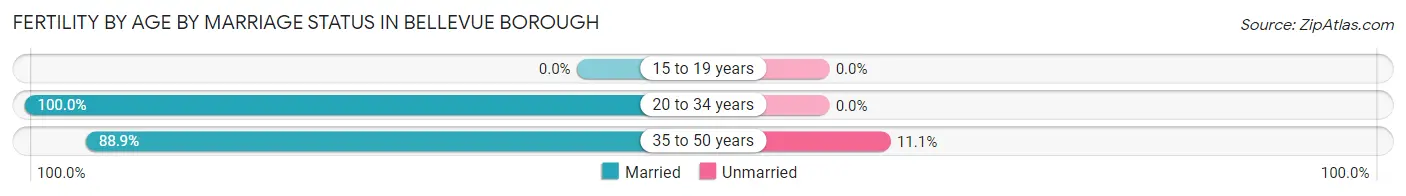
Fertility by Age by Marriage Status in Bellevue borough
97.1% of women with births (171) in Bellevue borough are married. The highest percentage of unmarried women with births falls into 35 to 50 years age bracket with 11.1% of them unmarried at the time of birth, while the lowest percentage of unmarried women with births belong to 20 to 34 years age bracket with 0.0% of them unmarried.
| Age Bracket | Married | Unmarried |
| 15 to 19 years | 0 (0.0%) | 0 (0.0%) |
| 20 to 34 years | 126 (100.0%) | 0 (0.0%) |
| 35 to 50 years | 40 (88.9%) | 5 (11.1%) |
| Total | 166 (97.1%) | 5 (2.9%) |
Fertility by Education in Bellevue borough
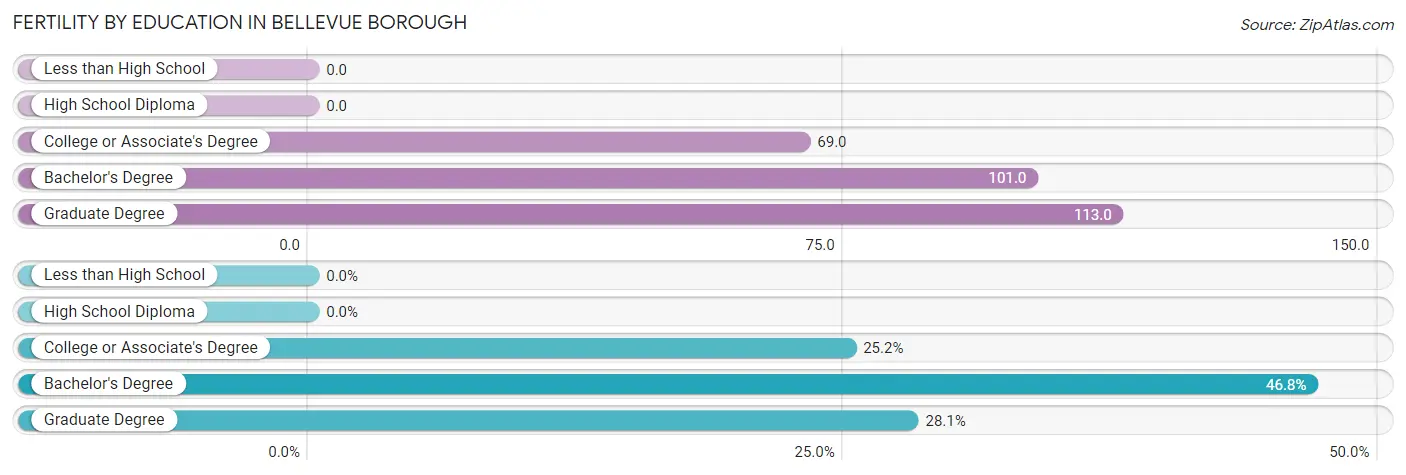
| Educational Attainment | Women with Births | Births / 1,000 Women |
| Less than High School | 0 (0.0%) | 0.0 |
| High School Diploma | 0 (0.0%) | 0.0 |
| College or Associate's Degree | 43 (25.2%) | 69.0 |
| Bachelor's Degree | 80 (46.8%) | 101.0 |
| Graduate Degree | 48 (28.1%) | 113.0 |
| Total | 171 (100.0%) | 76.0 |
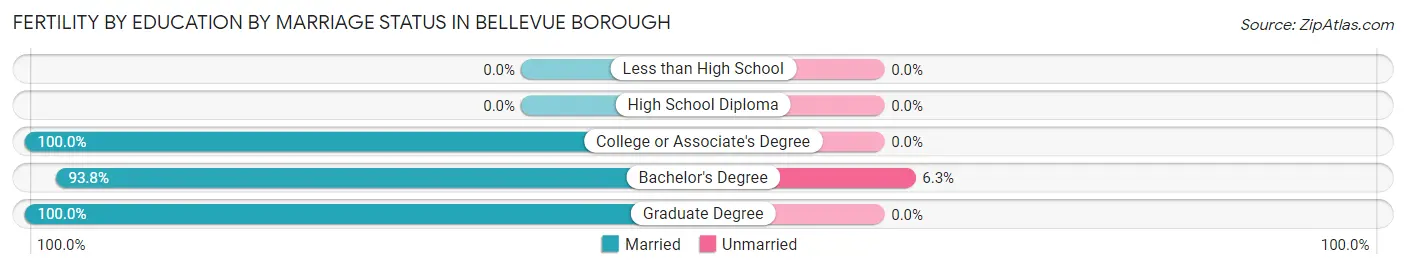
Fertility by Education by Marriage Status in Bellevue borough
2.9% of women with births in Bellevue borough are unmarried. Women with the educational attainment of college or associate's degree are most likely to be married with 100.0% of them married at childbirth, while women with the educational attainment of bachelor's degree are least likely to be married with 6.2% of them unmarried at childbirth.
| Educational Attainment | Married | Unmarried |
| Less than High School | 0 (0.0%) | 0 (0.0%) |
| High School Diploma | 0 (0.0%) | 0 (0.0%) |
| College or Associate's Degree | 43 (100.0%) | 0 (0.0%) |
| Bachelor's Degree | 75 (93.8%) | 5 (6.2%) |
| Graduate Degree | 48 (100.0%) | 0 (0.0%) |
| Total | 166 (97.1%) | 5 (2.9%) |
Employment Characteristics in Bellevue borough
Employment by Class of Employer in Bellevue borough
Among the 5,116 employed individuals in Bellevue borough, private company employees (3,431 | 67.1%), not-for-profit organizations (979 | 19.1%), and local government employees (199 | 3.9%) make up the most common classes of employment.
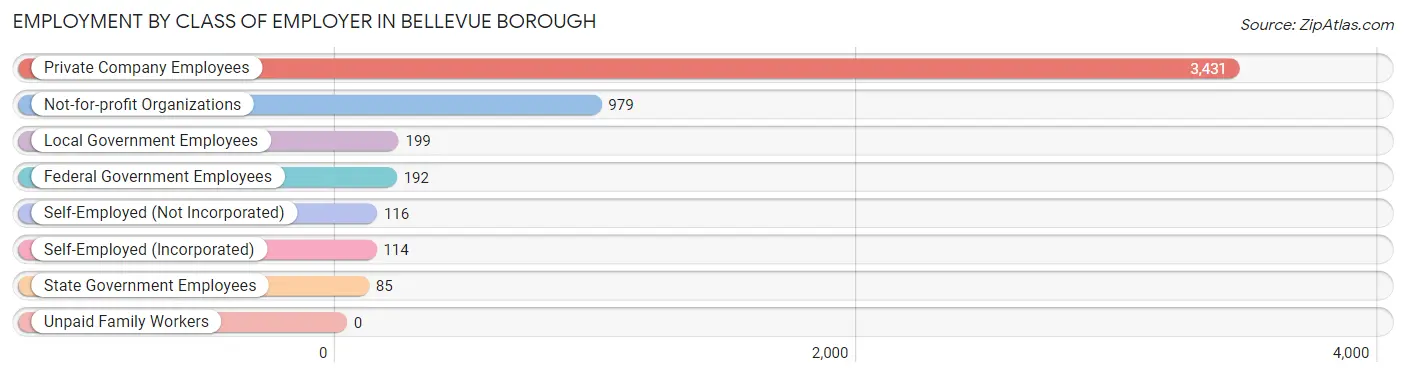
| Employer Class | # Employees | % Employees |
| Private Company Employees | 3,431 | 67.1% |
| Self-Employed (Incorporated) | 114 | 2.2% |
| Self-Employed (Not Incorporated) | 116 | 2.3% |
| Not-for-profit Organizations | 979 | 19.1% |
| Local Government Employees | 199 | 3.9% |
| State Government Employees | 85 | 1.7% |
| Federal Government Employees | 192 | 3.7% |
| Unpaid Family Workers | 0 | 0.0% |
| Total | 5,116 | 100.0% |
Employment Status by Age in Bellevue borough
According to the labor force statistics for Bellevue borough, out of the total population over 16 years of age (7,137), 75.7% or 5,403 individuals are in the labor force, with 3.7% or 200 of them unemployed. The age group with the highest labor force participation rate is 35 to 44 years, with 96.8% or 1,156 individuals in the labor force. Within the labor force, the 16 to 19 years age range has the highest percentage of unemployed individuals, with 62.0% or 31 of them being unemployed.
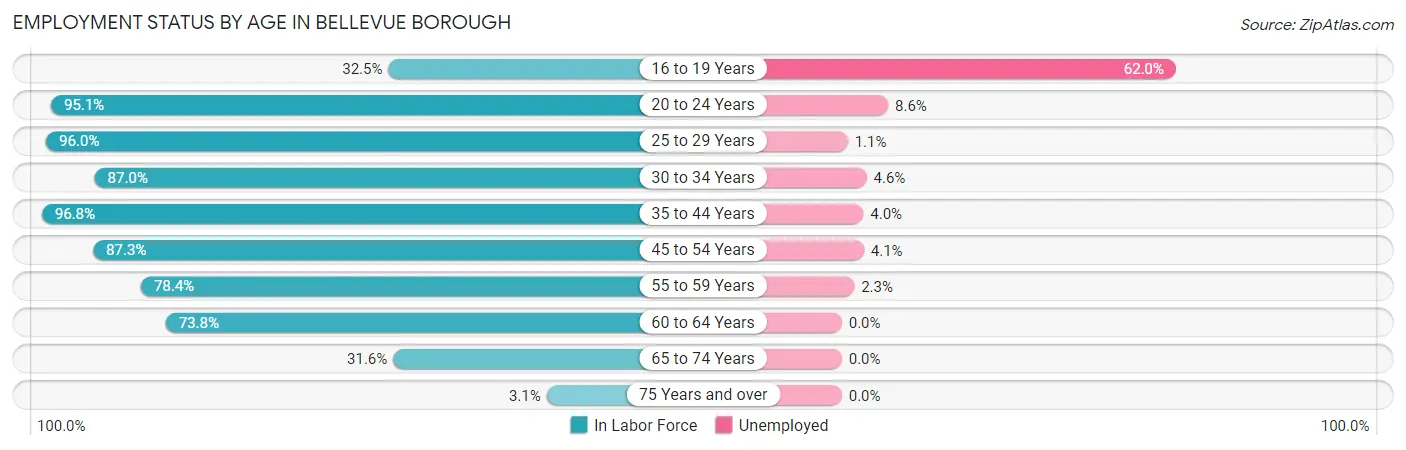
| Age Bracket | In Labor Force | Unemployed |
| 16 to 19 Years | 50 (32.5%) | 31 (62.0%) |
| 20 to 24 Years | 430 (95.1%) | 37 (8.6%) |
| 25 to 29 Years | 1,233 (96.0%) | 14 (1.1%) |
| 30 to 34 Years | 782 (87.0%) | 36 (4.6%) |
| 35 to 44 Years | 1,156 (96.8%) | 46 (4.0%) |
| 45 to 54 Years | 627 (87.3%) | 26 (4.1%) |
| 55 to 59 Years | 388 (78.4%) | 9 (2.3%) |
| 60 to 64 Years | 472 (73.8%) | 0 (0.0%) |
| 65 to 74 Years | 248 (31.6%) | 0 (0.0%) |
| 75 Years and over | 16 (3.1%) | 0 (0.0%) |
| Total | 5,403 (75.7%) | 200 (3.7%) |
Employment Status by Educational Attainment in Bellevue borough
According to labor force statistics for Bellevue borough, 89.0% of individuals (4,655) out of the total population between 25 and 64 years of age (5,230) are in the labor force, with 2.8% or 130 of them being unemployed. The group with the highest labor force participation rate are those with the educational attainment of bachelor's degree or higher, with 94.7% or 2,493 individuals in the labor force. Within the labor force, individuals with high school diploma education have the highest percentage of unemployment, with 4.4% or 39 of them being unemployed.
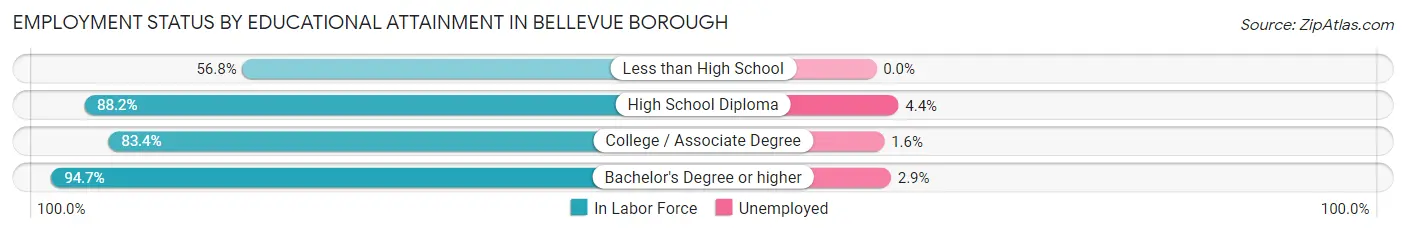
| Educational Attainment | In Labor Force | Unemployed |
| Less than High School | 108 (56.8%) | 0 (0.0%) |
| High School Diploma | 883 (88.2%) | 44 (4.4%) |
| College / Associate Degree | 1,173 (83.4%) | 22 (1.6%) |
| Bachelor's Degree or higher | 2,493 (94.7%) | 76 (2.9%) |
| Total | 4,655 (89.0%) | 146 (2.8%) |
Employment Occupations by Sex in Bellevue borough
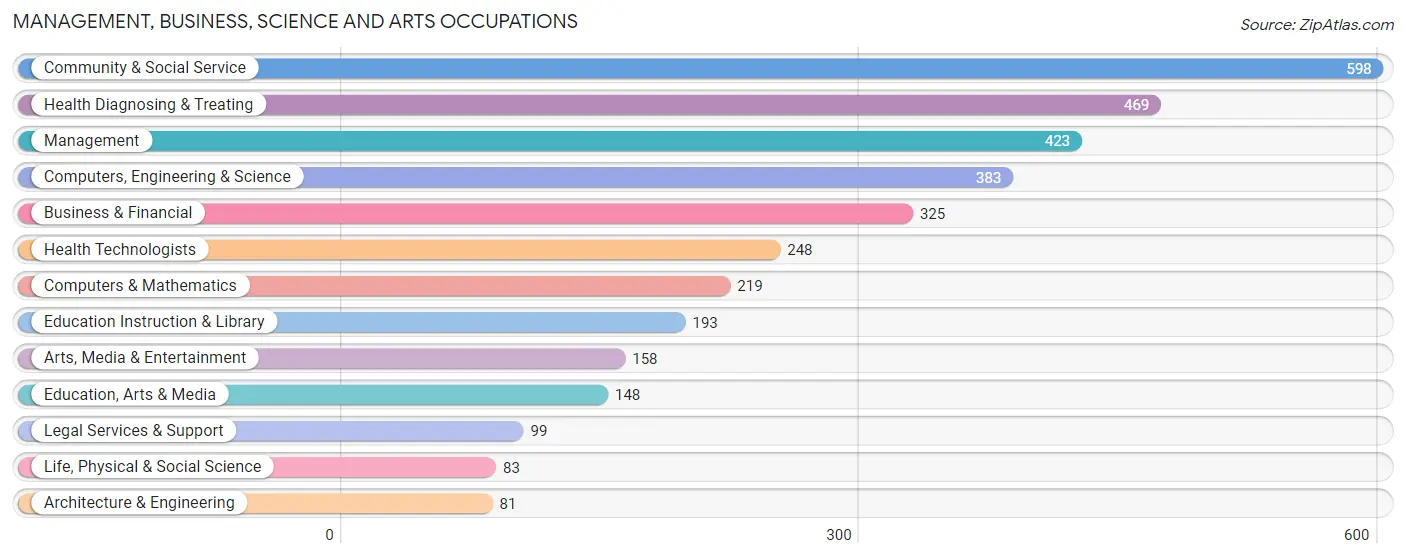
Management, Business, Science and Arts Occupations
The most common Management, Business, Science and Arts occupations in Bellevue borough are Community & Social Service (598 | 11.5%), Health Diagnosing & Treating (469 | 9.0%), Management (423 | 8.1%), Computers, Engineering & Science (383 | 7.4%), and Business & Financial (325 | 6.2%).
Management, Business, Science and Arts Occupations by Sex
Within the Management, Business, Science and Arts occupations in Bellevue borough, the most male-oriented occupations are Computers & Mathematics (70.8%), Business & Financial (69.2%), and Architecture & Engineering (65.4%), while the most female-oriented occupations are Health Diagnosing & Treating (90.2%), Health Technologists (87.9%), and Education, Arts & Media (87.2%).
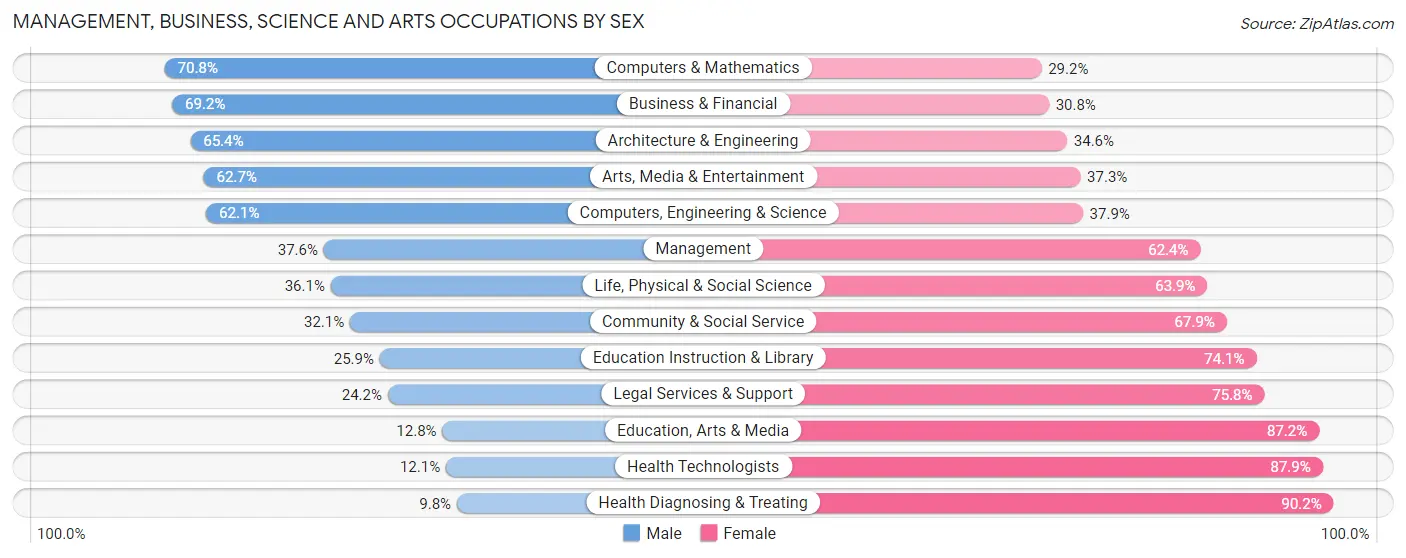
| Occupation | Male | Female |
| Management | 159 (37.6%) | 264 (62.4%) |
| Business & Financial | 225 (69.2%) | 100 (30.8%) |
| Computers, Engineering & Science | 238 (62.1%) | 145 (37.9%) |
| Computers & Mathematics | 155 (70.8%) | 64 (29.2%) |
| Architecture & Engineering | 53 (65.4%) | 28 (34.6%) |
| Life, Physical & Social Science | 30 (36.1%) | 53 (63.9%) |
| Community & Social Service | 192 (32.1%) | 406 (67.9%) |
| Education, Arts & Media | 19 (12.8%) | 129 (87.2%) |
| Legal Services & Support | 24 (24.2%) | 75 (75.8%) |
| Education Instruction & Library | 50 (25.9%) | 143 (74.1%) |
| Arts, Media & Entertainment | 99 (62.7%) | 59 (37.3%) |
| Health Diagnosing & Treating | 46 (9.8%) | 423 (90.2%) |
| Health Technologists | 30 (12.1%) | 218 (87.9%) |
| Total (Category) | 860 (39.1%) | 1,338 (60.9%) |
| Total (Overall) | 2,502 (48.1%) | 2,700 (51.9%) |
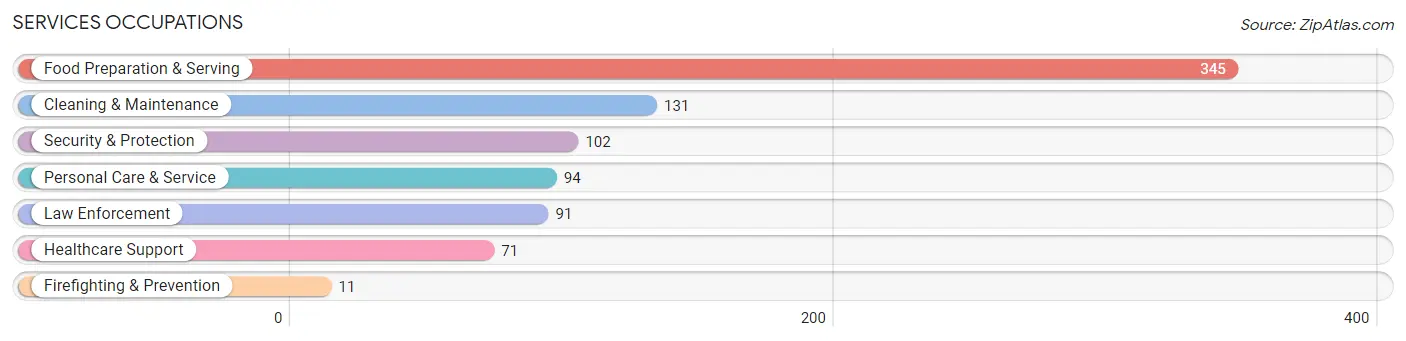
Services Occupations
The most common Services occupations in Bellevue borough are Food Preparation & Serving (345 | 6.6%), Cleaning & Maintenance (131 | 2.5%), Security & Protection (102 | 2.0%), Personal Care & Service (94 | 1.8%), and Law Enforcement (91 | 1.8%).
Services Occupations by Sex
Within the Services occupations in Bellevue borough, the most male-oriented occupations are Firefighting & Prevention (100.0%), Security & Protection (85.3%), and Law Enforcement (83.5%), while the most female-oriented occupations are Personal Care & Service (94.7%), Healthcare Support (81.7%), and Food Preparation & Serving (66.4%).
| Occupation | Male | Female |
| Healthcare Support | 13 (18.3%) | 58 (81.7%) |
| Security & Protection | 87 (85.3%) | 15 (14.7%) |
| Firefighting & Prevention | 11 (100.0%) | 0 (0.0%) |
| Law Enforcement | 76 (83.5%) | 15 (16.5%) |
| Food Preparation & Serving | 116 (33.6%) | 229 (66.4%) |
| Cleaning & Maintenance | 65 (49.6%) | 66 (50.4%) |
| Personal Care & Service | 5 (5.3%) | 89 (94.7%) |
| Total (Category) | 286 (38.5%) | 457 (61.5%) |
| Total (Overall) | 2,502 (48.1%) | 2,700 (51.9%) |
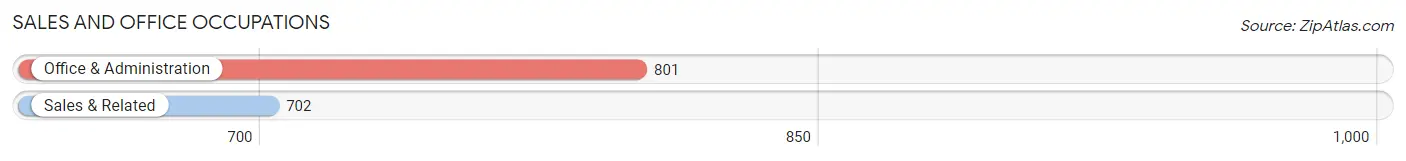
Sales and Office Occupations
The most common Sales and Office occupations in Bellevue borough are Office & Administration (801 | 15.4%), and Sales & Related (702 | 13.5%).
Sales and Office Occupations by Sex
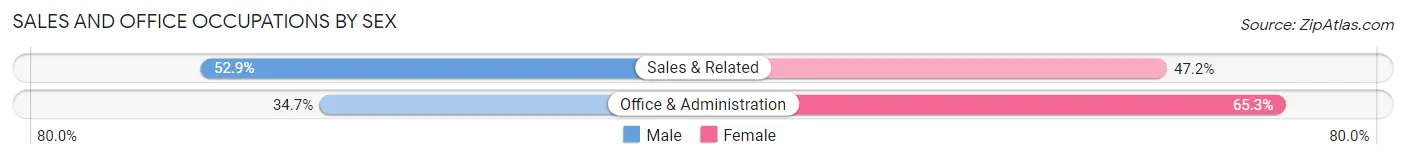
| Occupation | Male | Female |
| Sales & Related | 371 (52.8%) | 331 (47.1%) |
| Office & Administration | 278 (34.7%) | 523 (65.3%) |
| Total (Category) | 649 (43.2%) | 854 (56.8%) |
| Total (Overall) | 2,502 (48.1%) | 2,700 (51.9%) |
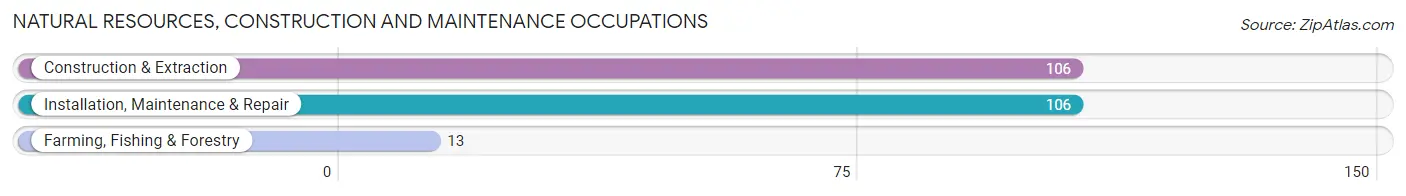
Natural Resources, Construction and Maintenance Occupations
The most common Natural Resources, Construction and Maintenance occupations in Bellevue borough are Construction & Extraction (106 | 2.0%), Installation, Maintenance & Repair (106 | 2.0%), and Farming, Fishing & Forestry (13 | 0.3%).
Natural Resources, Construction and Maintenance Occupations by Sex
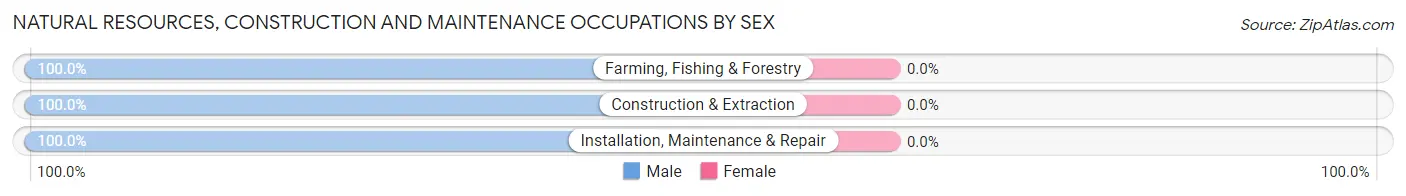
| Occupation | Male | Female |
| Farming, Fishing & Forestry | 13 (100.0%) | 0 (0.0%) |
| Construction & Extraction | 106 (100.0%) | 0 (0.0%) |
| Installation, Maintenance & Repair | 106 (100.0%) | 0 (0.0%) |
| Total (Category) | 225 (100.0%) | 0 (0.0%) |
| Total (Overall) | 2,502 (48.1%) | 2,700 (51.9%) |
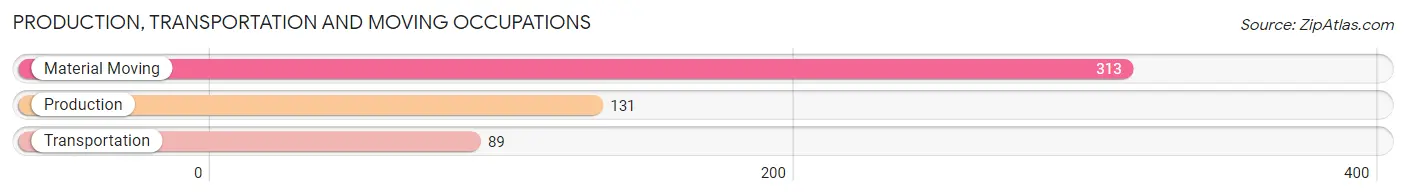
Production, Transportation and Moving Occupations
The most common Production, Transportation and Moving occupations in Bellevue borough are Material Moving (313 | 6.0%), Production (131 | 2.5%), and Transportation (89 | 1.7%).
Production, Transportation and Moving Occupations by Sex
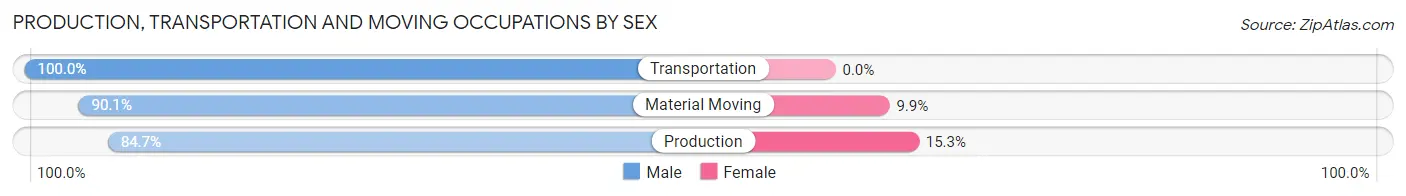
| Occupation | Male | Female |
| Production | 111 (84.7%) | 20 (15.3%) |
| Transportation | 89 (100.0%) | 0 (0.0%) |
| Material Moving | 282 (90.1%) | 31 (9.9%) |
| Total (Category) | 482 (90.4%) | 51 (9.6%) |
| Total (Overall) | 2,502 (48.1%) | 2,700 (51.9%) |
Employment Industries by Sex in Bellevue borough
Employment Industries in Bellevue borough
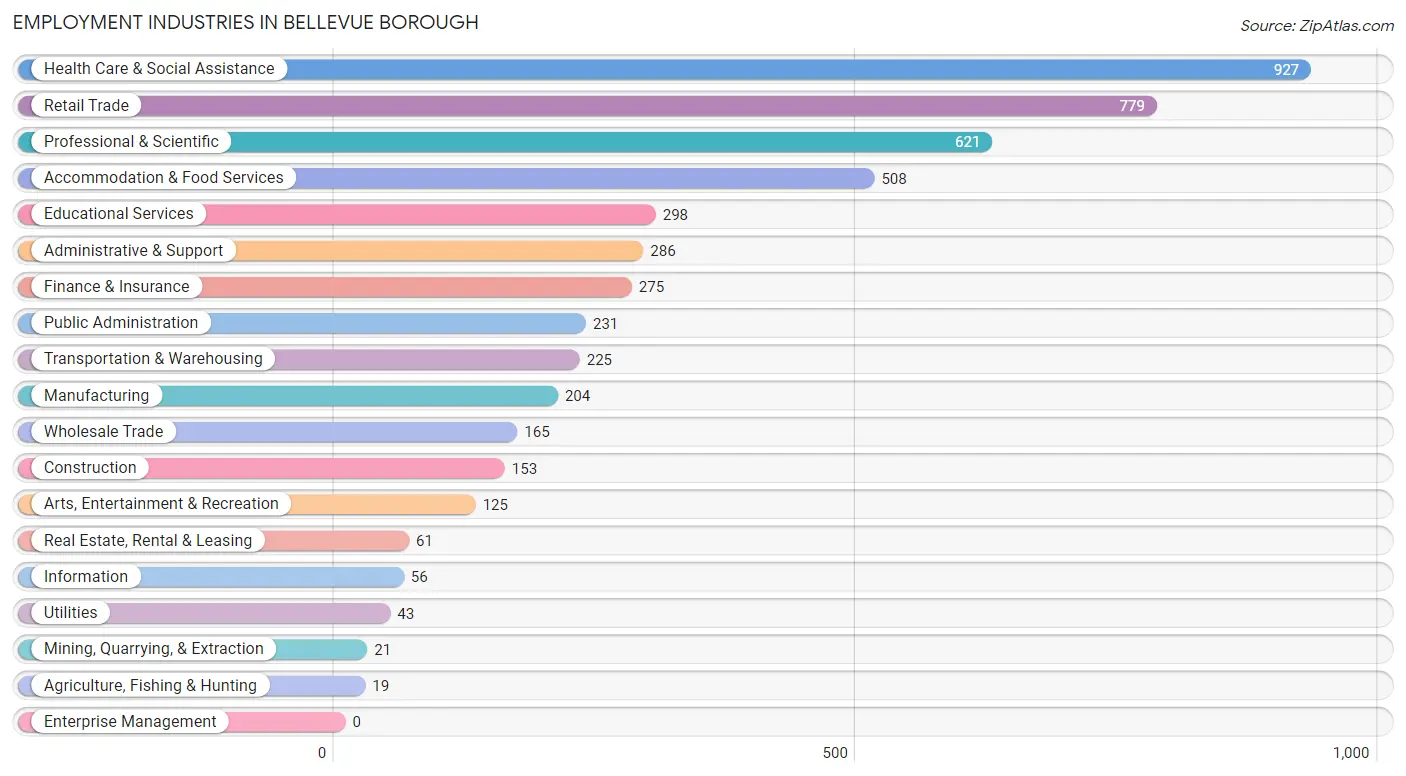
The major employment industries in Bellevue borough include Health Care & Social Assistance (927 | 17.8%), Retail Trade (779 | 15.0%), Professional & Scientific (621 | 11.9%), Accommodation & Food Services (508 | 9.8%), and Educational Services (298 | 5.7%).
Employment Industries by Sex in Bellevue borough
The Bellevue borough industries that see more men than women are Mining, Quarrying, & Extraction (100.0%), Wholesale Trade (92.7%), and Transportation & Warehousing (83.1%), whereas the industries that tend to have a higher number of women are Health Care & Social Assistance (84.3%), Educational Services (62.1%), and Retail Trade (59.6%).
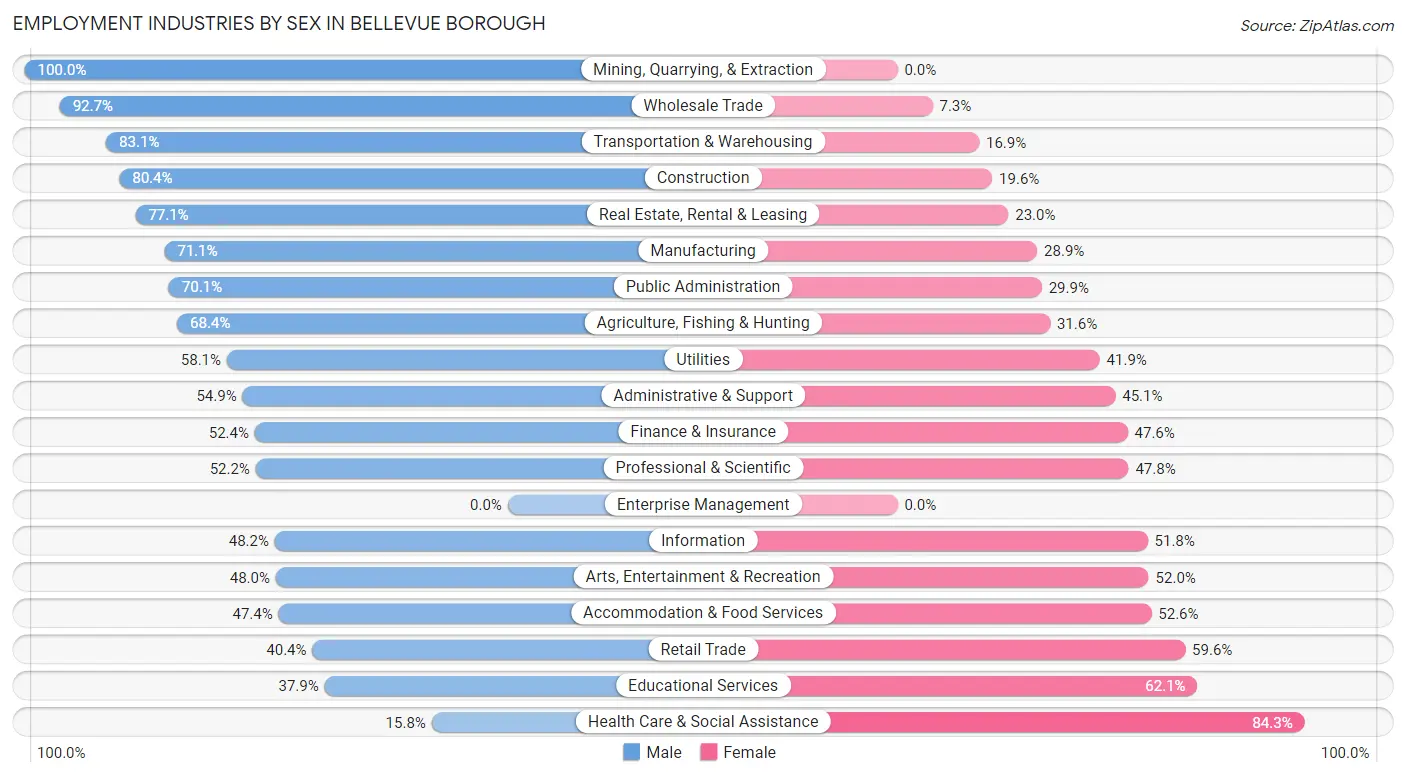
| Industry | Male | Female |
| Agriculture, Fishing & Hunting | 13 (68.4%) | 6 (31.6%) |
| Mining, Quarrying, & Extraction | 21 (100.0%) | 0 (0.0%) |
| Construction | 123 (80.4%) | 30 (19.6%) |
| Manufacturing | 145 (71.1%) | 59 (28.9%) |
| Wholesale Trade | 153 (92.7%) | 12 (7.3%) |
| Retail Trade | 315 (40.4%) | 464 (59.6%) |
| Transportation & Warehousing | 187 (83.1%) | 38 (16.9%) |
| Utilities | 25 (58.1%) | 18 (41.9%) |
| Information | 27 (48.2%) | 29 (51.8%) |
| Finance & Insurance | 144 (52.4%) | 131 (47.6%) |
| Real Estate, Rental & Leasing | 47 (77.0%) | 14 (23.0%) |
| Professional & Scientific | 324 (52.2%) | 297 (47.8%) |
| Enterprise Management | 0 (0.0%) | 0 (0.0%) |
| Administrative & Support | 157 (54.9%) | 129 (45.1%) |
| Educational Services | 113 (37.9%) | 185 (62.1%) |
| Health Care & Social Assistance | 146 (15.8%) | 781 (84.3%) |
| Arts, Entertainment & Recreation | 60 (48.0%) | 65 (52.0%) |
| Accommodation & Food Services | 241 (47.4%) | 267 (52.6%) |
| Public Administration | 162 (70.1%) | 69 (29.9%) |
| Total | 2,502 (48.1%) | 2,700 (51.9%) |
Education in Bellevue borough
School Enrollment in Bellevue borough
The most common levels of schooling among the 1,012 students in Bellevue borough are high school (239 | 23.6%), elementary school (210 | 20.7%), and middle school (173 | 17.1%).
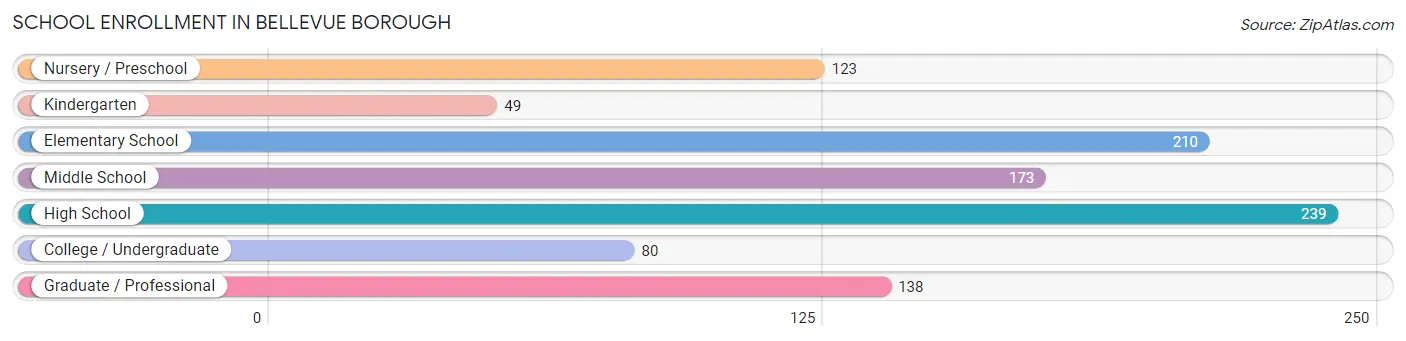
| School Level | # Students | % Students |
| Nursery / Preschool | 123 | 12.1% |
| Kindergarten | 49 | 4.8% |
| Elementary School | 210 | 20.7% |
| Middle School | 173 | 17.1% |
| High School | 239 | 23.6% |
| College / Undergraduate | 80 | 7.9% |
| Graduate / Professional | 138 | 13.6% |
| Total | 1,012 | 100.0% |
School Enrollment by Age by Funding Source in Bellevue borough
Out of a total of 1,012 students who are enrolled in schools in Bellevue borough, 292 (28.9%) attend a private institution, while the remaining 720 (71.1%) are enrolled in public schools. The age group of 15 to 17 year olds has the highest likelihood of being enrolled in private schools, with 57 (43.2% in the age bracket) enrolled. Conversely, the age group of 18 to 19 year olds has the lowest likelihood of being enrolled in a private school, with 13 (100.0% in the age bracket) attending a public institution.
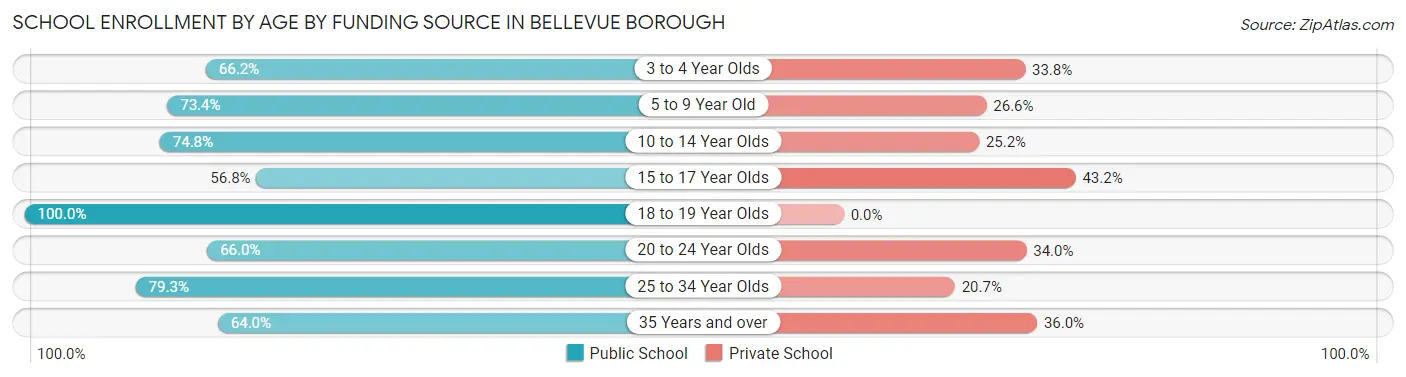
| Age Bracket | Public School | Private School |
| 3 to 4 Year Olds | 49 (66.2%) | 25 (33.8%) |
| 5 to 9 Year Old | 221 (73.4%) | 80 (26.6%) |
| 10 to 14 Year Olds | 190 (74.8%) | 64 (25.2%) |
| 15 to 17 Year Olds | 75 (56.8%) | 57 (43.2%) |
| 18 to 19 Year Olds | 13 (100.0%) | 0 (0.0%) |
| 20 to 24 Year Olds | 64 (66.0%) | 33 (34.0%) |
| 25 to 34 Year Olds | 92 (79.3%) | 24 (20.7%) |
| 35 Years and over | 16 (64.0%) | 9 (36.0%) |
| Total | 720 (71.1%) | 292 (28.9%) |
Educational Attainment by Field of Study in Bellevue borough
Business (448 | 13.5%), science & technology (349 | 10.5%), social sciences (327 | 9.8%), literature & languages (299 | 9.0%), and visual & performing arts (284 | 8.5%) are the most common fields of study among 3,326 individuals in Bellevue borough who have obtained a bachelor's degree or higher.
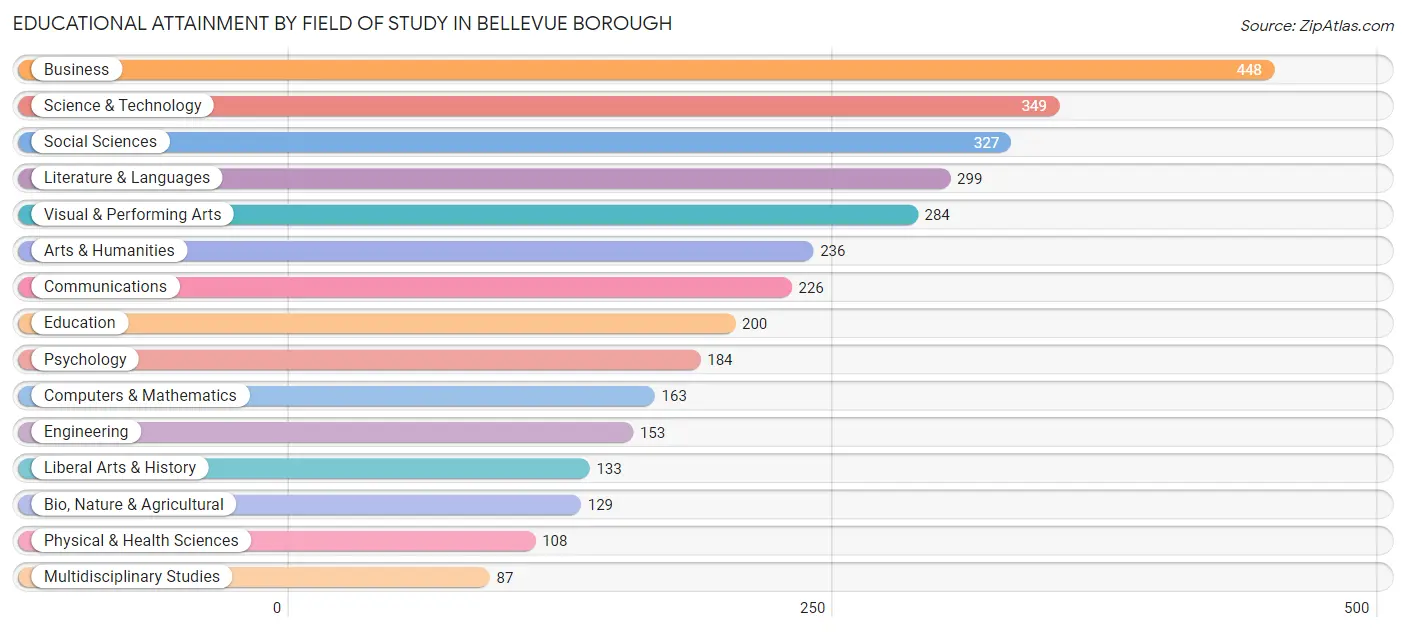
| Field of Study | # Graduates | % Graduates |
| Computers & Mathematics | 163 | 4.9% |
| Bio, Nature & Agricultural | 129 | 3.9% |
| Physical & Health Sciences | 108 | 3.3% |
| Psychology | 184 | 5.5% |
| Social Sciences | 327 | 9.8% |
| Engineering | 153 | 4.6% |
| Multidisciplinary Studies | 87 | 2.6% |
| Science & Technology | 349 | 10.5% |
| Business | 448 | 13.5% |
| Education | 200 | 6.0% |
| Literature & Languages | 299 | 9.0% |
| Liberal Arts & History | 133 | 4.0% |
| Visual & Performing Arts | 284 | 8.5% |
| Communications | 226 | 6.8% |
| Arts & Humanities | 236 | 7.1% |
| Total | 3,326 | 100.0% |
Transportation & Commute in Bellevue borough
Vehicle Availability by Sex in Bellevue borough
The most prevalent vehicle ownership categories in Bellevue borough are males with 2 vehicles (1,305, accounting for 52.5%) and females with 2 vehicles (1,207, making up 50.0%).
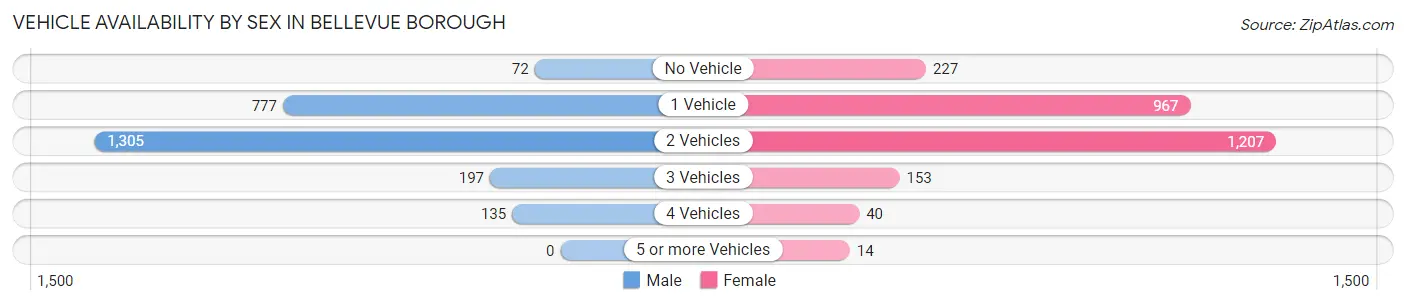
| Vehicles Available | Male | Female |
| No Vehicle | 72 (2.9%) | 227 (8.7%) |
| 1 Vehicle | 777 (31.3%) | 967 (37.1%) |
| 2 Vehicles | 1,305 (52.5%) | 1,207 (46.3%) |
| 3 Vehicles | 197 (7.9%) | 153 (5.9%) |
| 4 Vehicles | 135 (5.4%) | 40 (1.5%) |
| 5 or more Vehicles | 0 (0.0%) | 14 (0.5%) |
| Total | 2,486 (100.0%) | 2,608 (100.0%) |
Commute Time in Bellevue borough
The most frequently occuring commute durations in Bellevue borough are 20 to 24 minutes (840 commuters, 19.6%), 15 to 19 minutes (822 commuters, 19.2%), and 30 to 34 minutes (769 commuters, 18.0%).
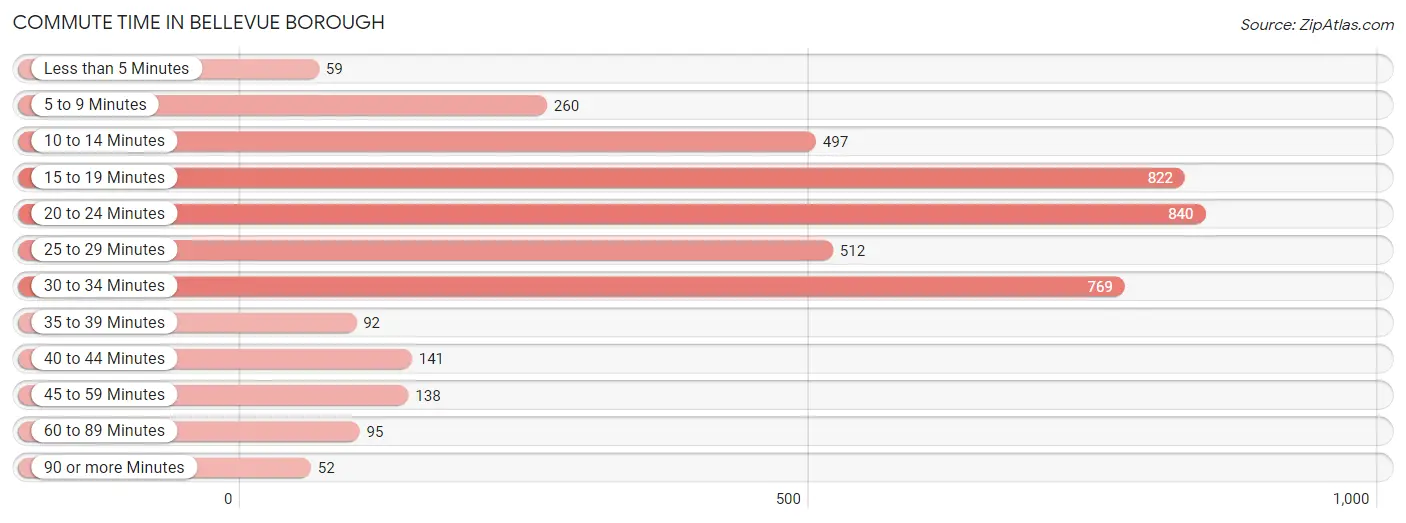
| Commute Time | # Commuters | % Commuters |
| Less than 5 Minutes | 59 | 1.4% |
| 5 to 9 Minutes | 260 | 6.1% |
| 10 to 14 Minutes | 497 | 11.6% |
| 15 to 19 Minutes | 822 | 19.2% |
| 20 to 24 Minutes | 840 | 19.6% |
| 25 to 29 Minutes | 512 | 12.0% |
| 30 to 34 Minutes | 769 | 18.0% |
| 35 to 39 Minutes | 92 | 2.1% |
| 40 to 44 Minutes | 141 | 3.3% |
| 45 to 59 Minutes | 138 | 3.2% |
| 60 to 89 Minutes | 95 | 2.2% |
| 90 or more Minutes | 52 | 1.2% |
Commute Time by Sex in Bellevue borough
The most common commute times in Bellevue borough are 20 to 24 minutes (439 commuters, 20.7%) for males and 15 to 19 minutes (540 commuters, 25.0%) for females.
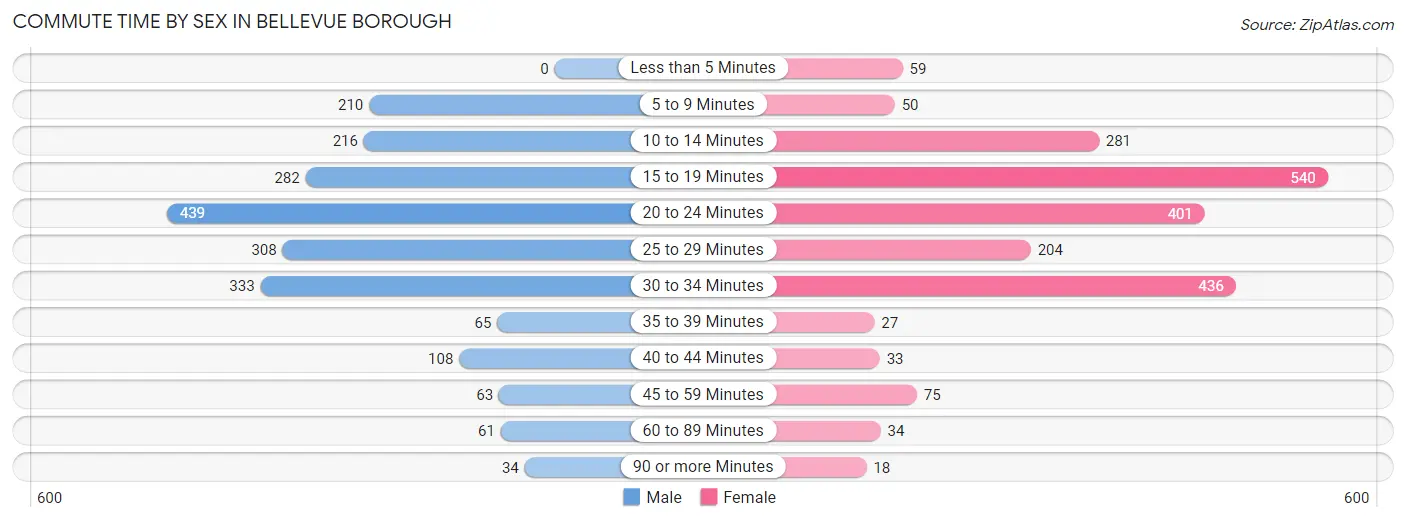
| Commute Time | Male | Female |
| Less than 5 Minutes | 0 (0.0%) | 59 (2.7%) |
| 5 to 9 Minutes | 210 (9.9%) | 50 (2.3%) |
| 10 to 14 Minutes | 216 (10.2%) | 281 (13.0%) |
| 15 to 19 Minutes | 282 (13.3%) | 540 (25.0%) |
| 20 to 24 Minutes | 439 (20.7%) | 401 (18.6%) |
| 25 to 29 Minutes | 308 (14.5%) | 204 (9.5%) |
| 30 to 34 Minutes | 333 (15.7%) | 436 (20.2%) |
| 35 to 39 Minutes | 65 (3.1%) | 27 (1.3%) |
| 40 to 44 Minutes | 108 (5.1%) | 33 (1.5%) |
| 45 to 59 Minutes | 63 (3.0%) | 75 (3.5%) |
| 60 to 89 Minutes | 61 (2.9%) | 34 (1.6%) |
| 90 or more Minutes | 34 (1.6%) | 18 (0.8%) |
Time of Departure to Work by Sex in Bellevue borough
The most frequent times of departure to work in Bellevue borough are 12:00 PM to 3:59 PM (388, 18.3%) for males and 7:00 AM to 7:29 AM (308, 14.3%) for females.
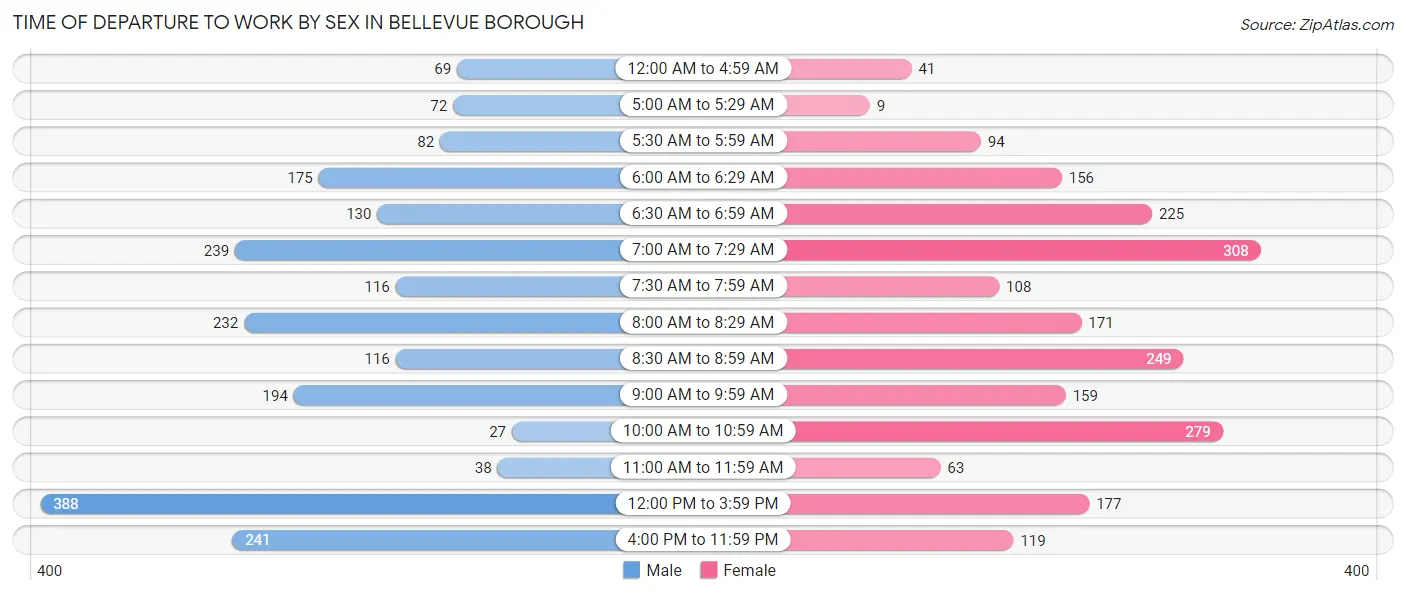
| Time of Departure | Male | Female |
| 12:00 AM to 4:59 AM | 69 (3.3%) | 41 (1.9%) |
| 5:00 AM to 5:29 AM | 72 (3.4%) | 9 (0.4%) |
| 5:30 AM to 5:59 AM | 82 (3.9%) | 94 (4.4%) |
| 6:00 AM to 6:29 AM | 175 (8.3%) | 156 (7.2%) |
| 6:30 AM to 6:59 AM | 130 (6.1%) | 225 (10.4%) |
| 7:00 AM to 7:29 AM | 239 (11.3%) | 308 (14.3%) |
| 7:30 AM to 7:59 AM | 116 (5.5%) | 108 (5.0%) |
| 8:00 AM to 8:29 AM | 232 (11.0%) | 171 (7.9%) |
| 8:30 AM to 8:59 AM | 116 (5.5%) | 249 (11.5%) |
| 9:00 AM to 9:59 AM | 194 (9.2%) | 159 (7.4%) |
| 10:00 AM to 10:59 AM | 27 (1.3%) | 279 (12.9%) |
| 11:00 AM to 11:59 AM | 38 (1.8%) | 63 (2.9%) |
| 12:00 PM to 3:59 PM | 388 (18.3%) | 177 (8.2%) |
| 4:00 PM to 11:59 PM | 241 (11.4%) | 119 (5.5%) |
| Total | 2,119 (100.0%) | 2,158 (100.0%) |
Housing Occupancy in Bellevue borough
Occupancy by Ownership in Bellevue borough
Of the total 4,322 dwellings in Bellevue borough, owner-occupied units account for 1,785 (41.3%), while renter-occupied units make up 2,537 (58.7%).
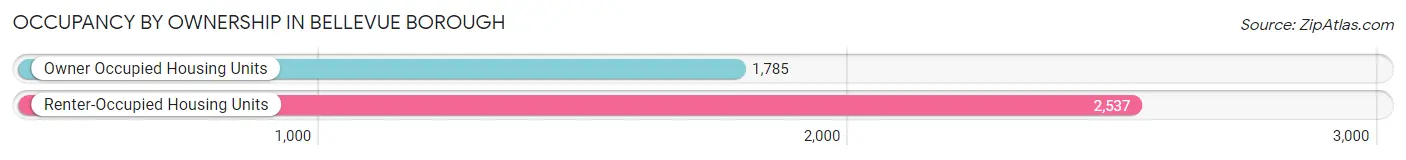
| Occupancy | # Housing Units | % Housing Units |
| Owner Occupied Housing Units | 1,785 | 41.3% |
| Renter-Occupied Housing Units | 2,537 | 58.7% |
| Total Occupied Housing Units | 4,322 | 100.0% |
Occupancy by Household Size in Bellevue borough
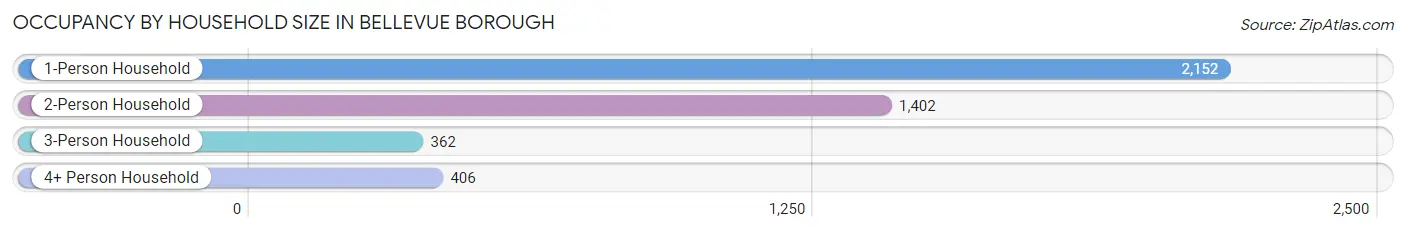
| Household Size | # Housing Units | % Housing Units |
| 1-Person Household | 2,152 | 49.8% |
| 2-Person Household | 1,402 | 32.4% |
| 3-Person Household | 362 | 8.4% |
| 4+ Person Household | 406 | 9.4% |
| Total Housing Units | 4,322 | 100.0% |
Occupancy by Ownership by Household Size in Bellevue borough
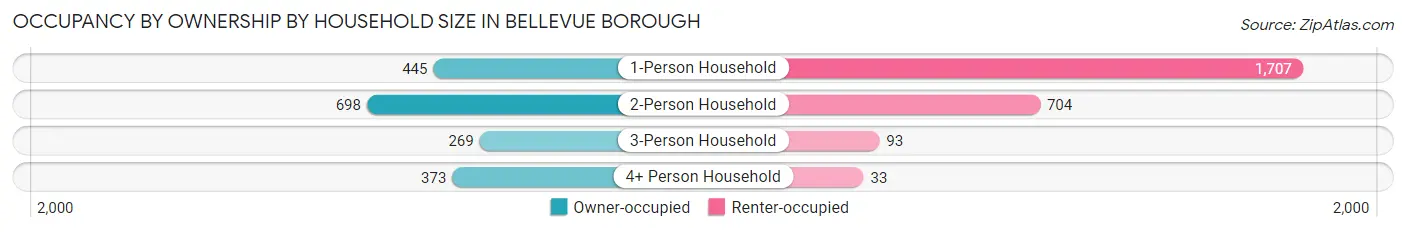
| Household Size | Owner-occupied | Renter-occupied |
| 1-Person Household | 445 (20.7%) | 1,707 (79.3%) |
| 2-Person Household | 698 (49.8%) | 704 (50.2%) |
| 3-Person Household | 269 (74.3%) | 93 (25.7%) |
| 4+ Person Household | 373 (91.9%) | 33 (8.1%) |
| Total Housing Units | 1,785 (41.3%) | 2,537 (58.7%) |
Occupancy by Educational Attainment in Bellevue borough
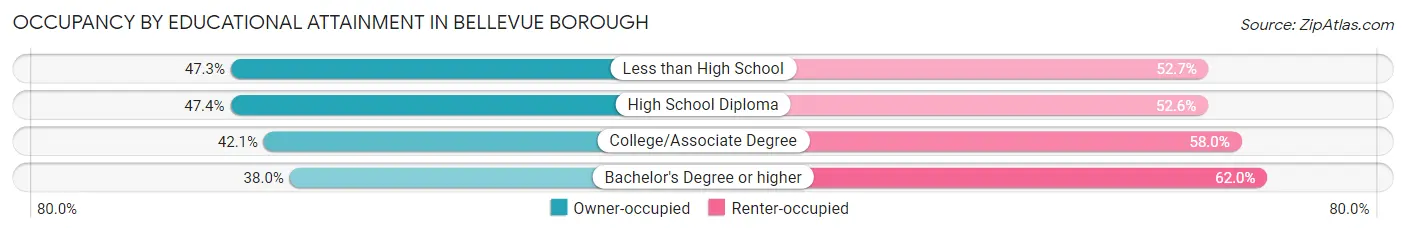
| Household Size | Owner-occupied | Renter-occupied |
| Less than High School | 61 (47.3%) | 68 (52.7%) |
| High School Diploma | 441 (47.4%) | 490 (52.6%) |
| College/Associate Degree | 460 (42.0%) | 634 (58.0%) |
| Bachelor's Degree or higher | 823 (38.0%) | 1,345 (62.0%) |
Occupancy by Age of Householder in Bellevue borough
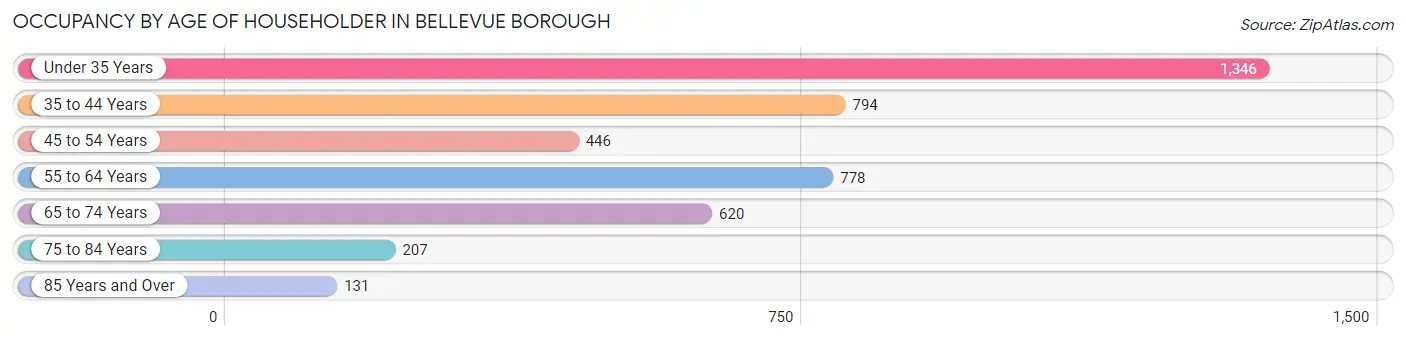
| Age Bracket | # Households | % Households |
| Under 35 Years | 1,346 | 31.1% |
| 35 to 44 Years | 794 | 18.4% |
| 45 to 54 Years | 446 | 10.3% |
| 55 to 64 Years | 778 | 18.0% |
| 65 to 74 Years | 620 | 14.3% |
| 75 to 84 Years | 207 | 4.8% |
| 85 Years and Over | 131 | 3.0% |
| Total | 4,322 | 100.0% |
Housing Finances in Bellevue borough
Median Income by Occupancy in Bellevue borough
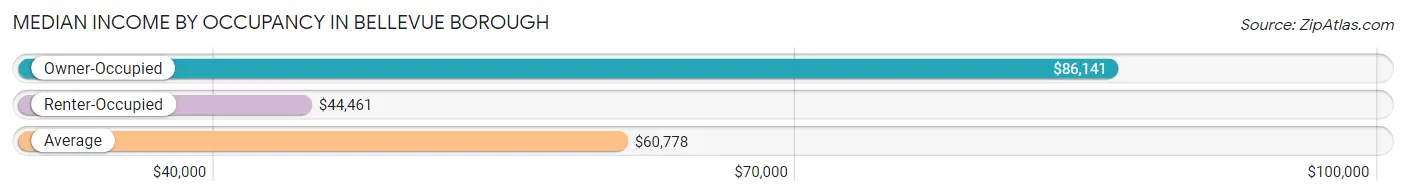
| Occupancy Type | # Households | Median Income |
| Owner-Occupied | 1,785 (41.3%) | $86,141 |
| Renter-Occupied | 2,537 (58.7%) | $44,461 |
| Average | 4,322 (100.0%) | $60,778 |
Occupancy by Householder Income Bracket in Bellevue borough
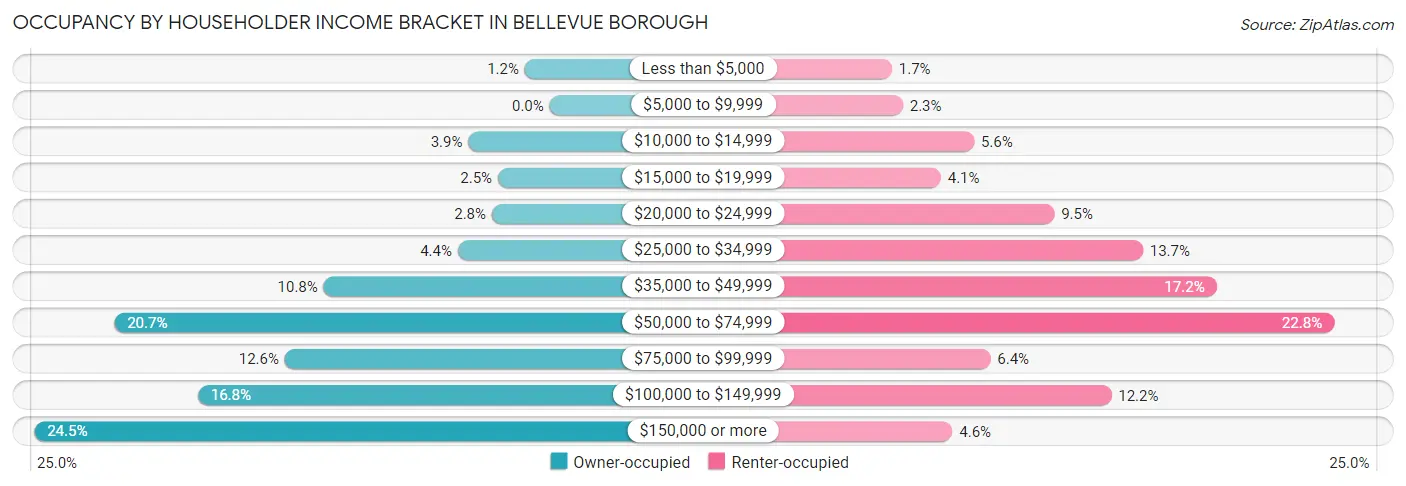
| Income Bracket | Owner-occupied | Renter-occupied |
| Less than $5,000 | 21 (1.2%) | 44 (1.7%) |
| $5,000 to $9,999 | 0 (0.0%) | 57 (2.2%) |
| $10,000 to $14,999 | 69 (3.9%) | 143 (5.6%) |
| $15,000 to $19,999 | 44 (2.5%) | 103 (4.1%) |
| $20,000 to $24,999 | 49 (2.8%) | 240 (9.5%) |
| $25,000 to $34,999 | 78 (4.4%) | 347 (13.7%) |
| $35,000 to $49,999 | 192 (10.8%) | 436 (17.2%) |
| $50,000 to $74,999 | 370 (20.7%) | 578 (22.8%) |
| $75,000 to $99,999 | 225 (12.6%) | 163 (6.4%) |
| $100,000 to $149,999 | 299 (16.8%) | 309 (12.2%) |
| $150,000 or more | 438 (24.5%) | 117 (4.6%) |
| Total | 1,785 (100.0%) | 2,537 (100.0%) |
Monthly Housing Cost Tiers in Bellevue borough
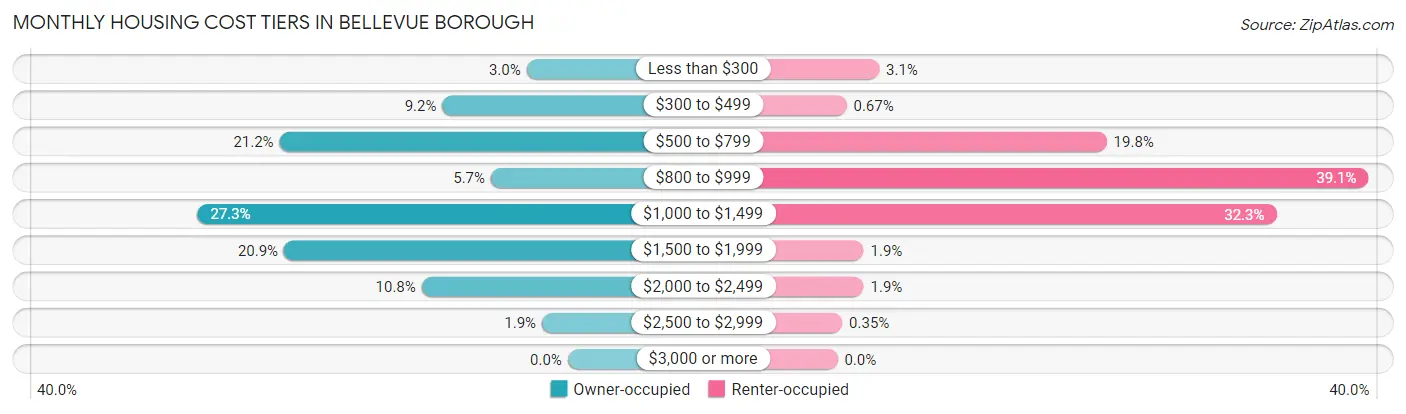
| Monthly Cost | Owner-occupied | Renter-occupied |
| Less than $300 | 54 (3.0%) | 78 (3.1%) |
| $300 to $499 | 165 (9.2%) | 17 (0.7%) |
| $500 to $799 | 379 (21.2%) | 503 (19.8%) |
| $800 to $999 | 101 (5.7%) | 992 (39.1%) |
| $1,000 to $1,499 | 487 (27.3%) | 820 (32.3%) |
| $1,500 to $1,999 | 373 (20.9%) | 49 (1.9%) |
| $2,000 to $2,499 | 192 (10.8%) | 49 (1.9%) |
| $2,500 to $2,999 | 34 (1.9%) | 9 (0.4%) |
| $3,000 or more | 0 (0.0%) | 0 (0.0%) |
| Total | 1,785 (100.0%) | 2,537 (100.0%) |
Physical Housing Characteristics in Bellevue borough
Housing Structures in Bellevue borough
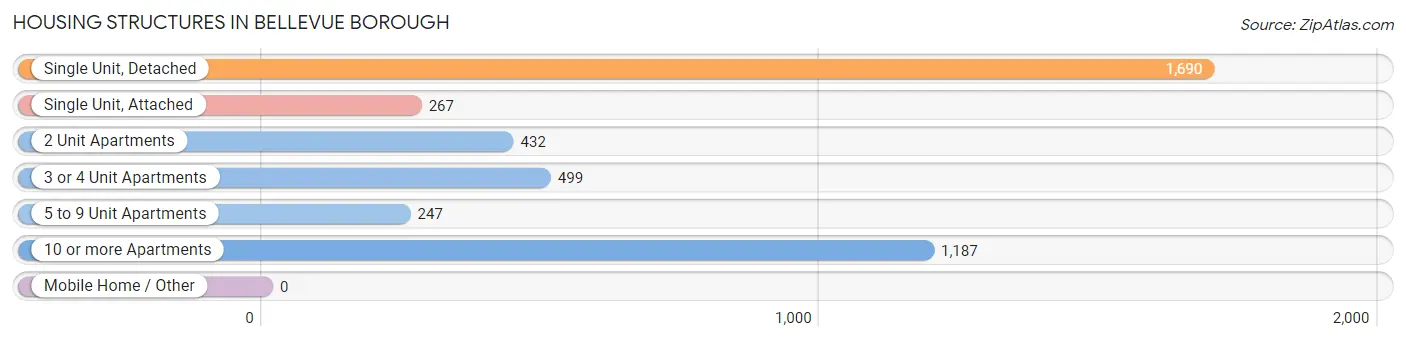
| Structure Type | # Housing Units | % Housing Units |
| Single Unit, Detached | 1,690 | 39.1% |
| Single Unit, Attached | 267 | 6.2% |
| 2 Unit Apartments | 432 | 10.0% |
| 3 or 4 Unit Apartments | 499 | 11.6% |
| 5 to 9 Unit Apartments | 247 | 5.7% |
| 10 or more Apartments | 1,187 | 27.5% |
| Mobile Home / Other | 0 | 0.0% |
| Total | 4,322 | 100.0% |
Housing Structures by Occupancy in Bellevue borough
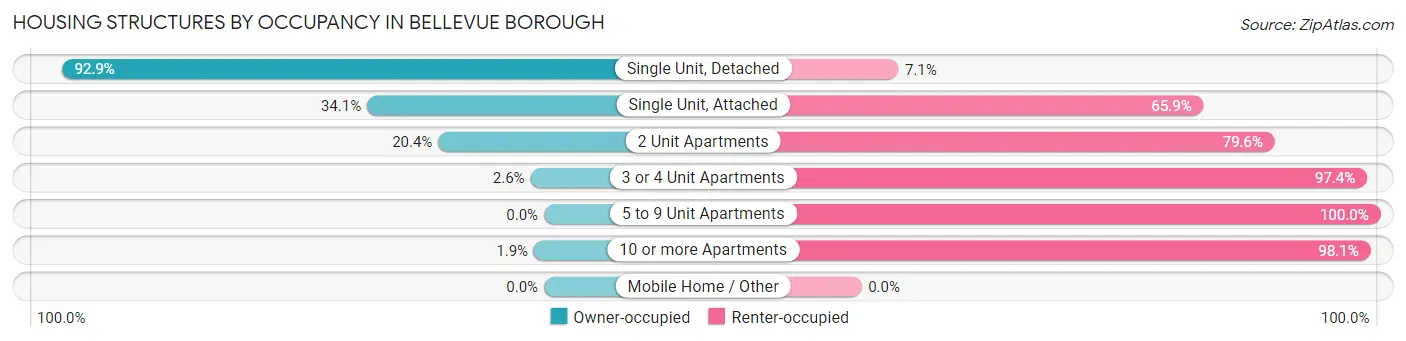
| Structure Type | Owner-occupied | Renter-occupied |
| Single Unit, Detached | 1,570 (92.9%) | 120 (7.1%) |
| Single Unit, Attached | 91 (34.1%) | 176 (65.9%) |
| 2 Unit Apartments | 88 (20.4%) | 344 (79.6%) |
| 3 or 4 Unit Apartments | 13 (2.6%) | 486 (97.4%) |
| 5 to 9 Unit Apartments | 0 (0.0%) | 247 (100.0%) |
| 10 or more Apartments | 23 (1.9%) | 1,164 (98.1%) |
| Mobile Home / Other | 0 (0.0%) | 0 (0.0%) |
| Total | 1,785 (41.3%) | 2,537 (58.7%) |
Housing Structures by Number of Rooms in Bellevue borough
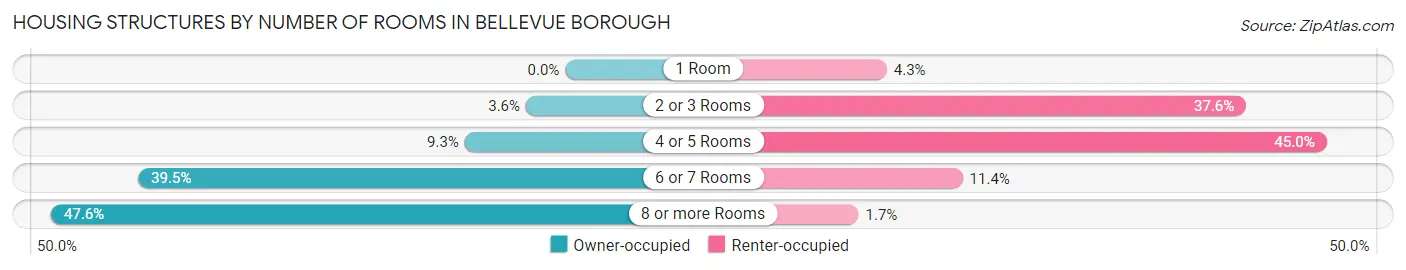
| Number of Rooms | Owner-occupied | Renter-occupied |
| 1 Room | 0 (0.0%) | 110 (4.3%) |
| 2 or 3 Rooms | 65 (3.6%) | 953 (37.6%) |
| 4 or 5 Rooms | 166 (9.3%) | 1,142 (45.0%) |
| 6 or 7 Rooms | 705 (39.5%) | 288 (11.4%) |
| 8 or more Rooms | 849 (47.6%) | 44 (1.7%) |
| Total | 1,785 (100.0%) | 2,537 (100.0%) |
Housing Structure by Heating Type in Bellevue borough
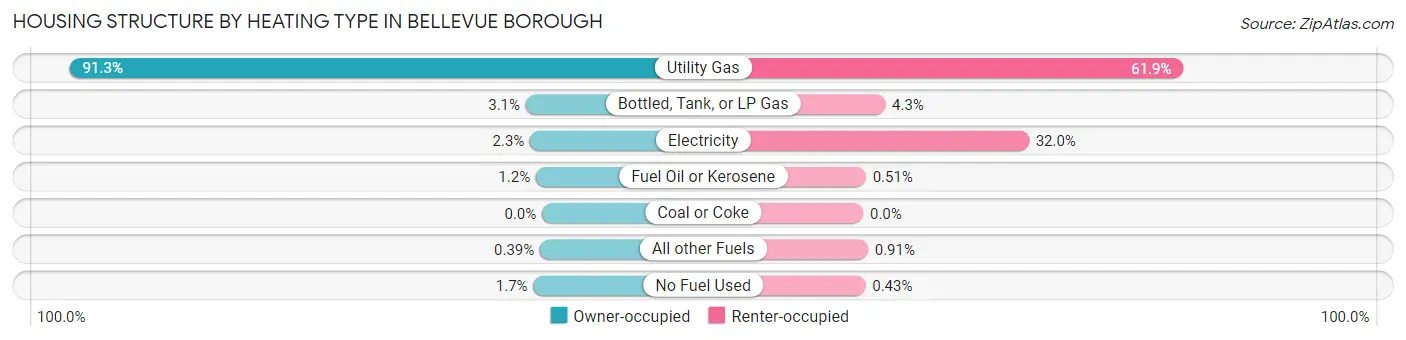
| Heating Type | Owner-occupied | Renter-occupied |
| Utility Gas | 1,630 (91.3%) | 1,570 (61.9%) |
| Bottled, Tank, or LP Gas | 56 (3.1%) | 108 (4.3%) |
| Electricity | 41 (2.3%) | 812 (32.0%) |
| Fuel Oil or Kerosene | 21 (1.2%) | 13 (0.5%) |
| Coal or Coke | 0 (0.0%) | 0 (0.0%) |
| All other Fuels | 7 (0.4%) | 23 (0.9%) |
| No Fuel Used | 30 (1.7%) | 11 (0.4%) |
| Total | 1,785 (100.0%) | 2,537 (100.0%) |
Household Vehicle Usage in Bellevue borough
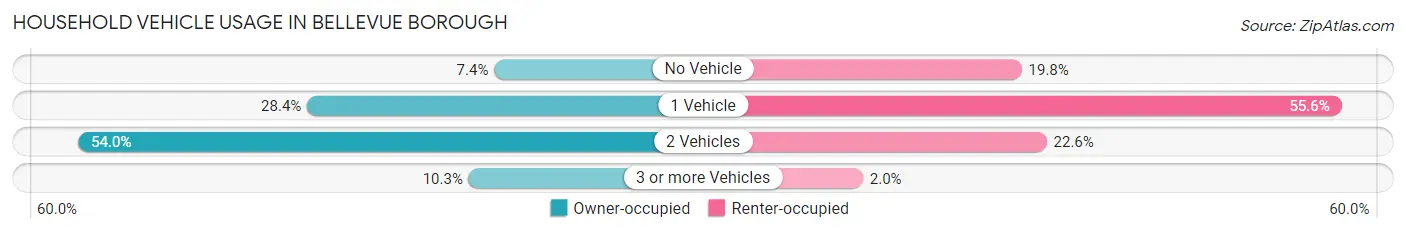
| Vehicles per Household | Owner-occupied | Renter-occupied |
| No Vehicle | 132 (7.4%) | 502 (19.8%) |
| 1 Vehicle | 506 (28.3%) | 1,411 (55.6%) |
| 2 Vehicles | 964 (54.0%) | 573 (22.6%) |
| 3 or more Vehicles | 183 (10.2%) | 51 (2.0%) |
| Total | 1,785 (100.0%) | 2,537 (100.0%) |
Real Estate & Mortgages in Bellevue borough
Real Estate and Mortgage Overview in Bellevue borough
| Characteristic | Without Mortgage | With Mortgage |
| Housing Units | 708 | 1,077 |
| Median Property Value | $122,800 | $177,400 |
| Median Household Income | $66,577 | $322 |
| Monthly Housing Costs | $644 | $0 |
| Real Estate Taxes | $2,911 | $15 |
Property Value by Mortgage Status in Bellevue borough
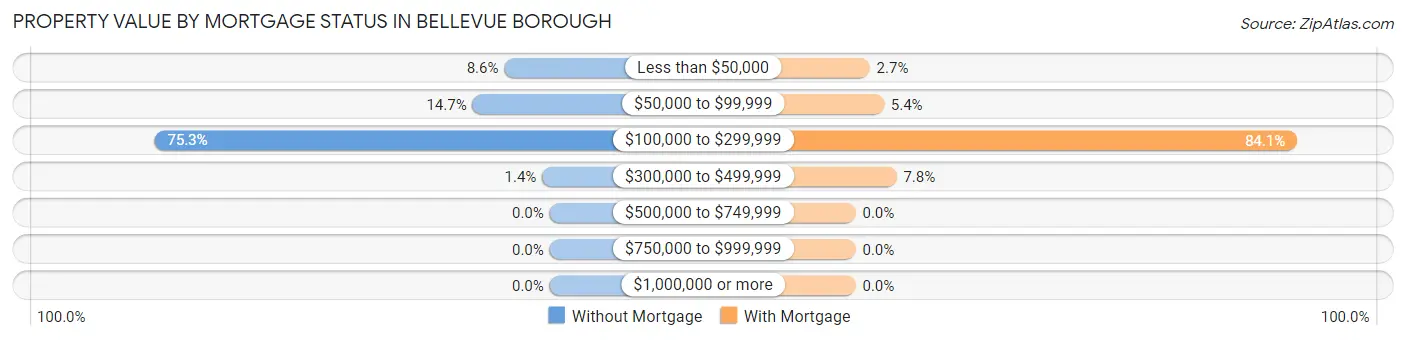
| Property Value | Without Mortgage | With Mortgage |
| Less than $50,000 | 61 (8.6%) | 29 (2.7%) |
| $50,000 to $99,999 | 104 (14.7%) | 58 (5.4%) |
| $100,000 to $299,999 | 533 (75.3%) | 906 (84.1%) |
| $300,000 to $499,999 | 10 (1.4%) | 84 (7.8%) |
| $500,000 to $749,999 | 0 (0.0%) | 0 (0.0%) |
| $750,000 to $999,999 | 0 (0.0%) | 0 (0.0%) |
| $1,000,000 or more | 0 (0.0%) | 0 (0.0%) |
| Total | 708 (100.0%) | 1,077 (100.0%) |
Household Income by Mortgage Status in Bellevue borough
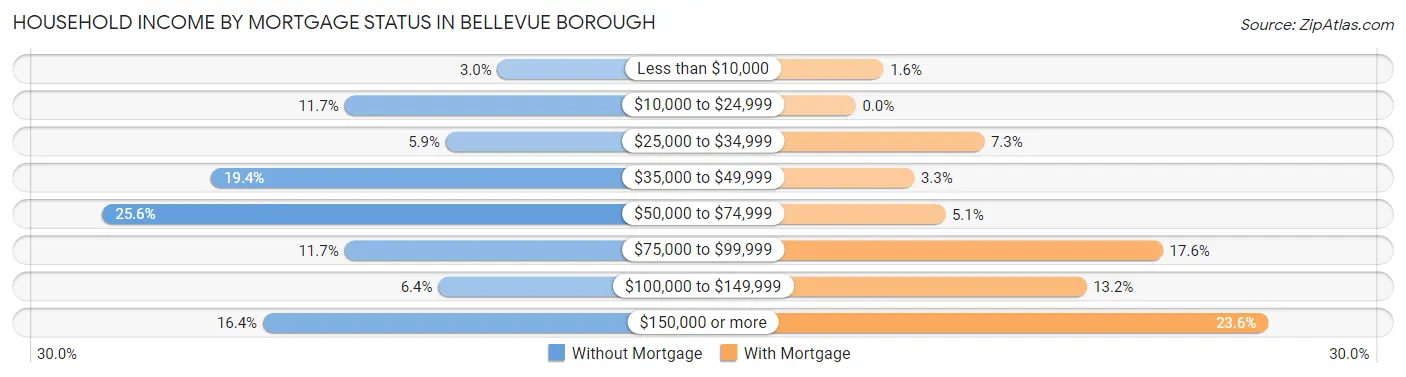
| Household Income | Without Mortgage | With Mortgage |
| Less than $10,000 | 21 (3.0%) | 17 (1.6%) |
| $10,000 to $24,999 | 83 (11.7%) | 0 (0.0%) |
| $25,000 to $34,999 | 42 (5.9%) | 79 (7.3%) |
| $35,000 to $49,999 | 137 (19.4%) | 36 (3.3%) |
| $50,000 to $74,999 | 181 (25.6%) | 55 (5.1%) |
| $75,000 to $99,999 | 83 (11.7%) | 189 (17.5%) |
| $100,000 to $149,999 | 45 (6.4%) | 142 (13.2%) |
| $150,000 or more | 116 (16.4%) | 254 (23.6%) |
| Total | 708 (100.0%) | 1,077 (100.0%) |
Property Value to Household Income Ratio in Bellevue borough
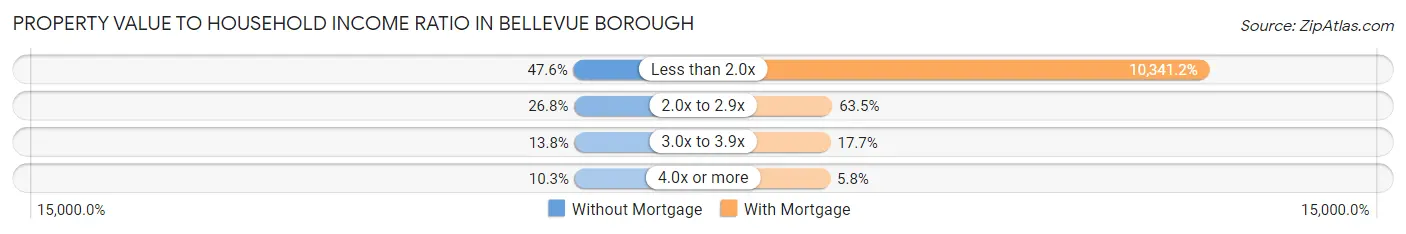
| Value-to-Income Ratio | Without Mortgage | With Mortgage |
| Less than 2.0x | 337 (47.6%) | 111,375 (10,341.2%) |
| 2.0x to 2.9x | 190 (26.8%) | 684 (63.5%) |
| 3.0x to 3.9x | 98 (13.8%) | 191 (17.7%) |
| 4.0x or more | 73 (10.3%) | 62 (5.8%) |
| Total | 708 (100.0%) | 1,077 (100.0%) |
Real Estate Taxes by Mortgage Status in Bellevue borough
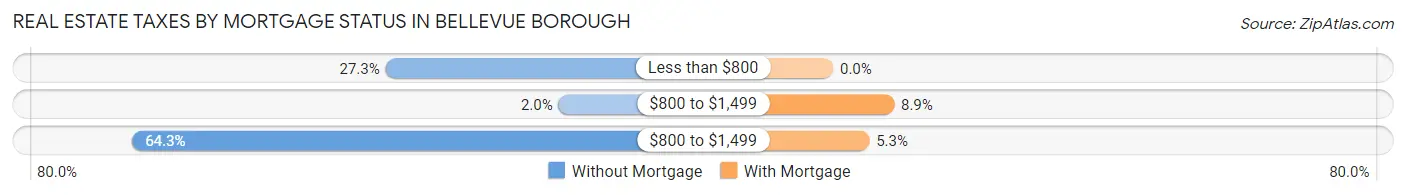
| Property Taxes | Without Mortgage | With Mortgage |
| Less than $800 | 193 (27.3%) | 0 (0.0%) |
| $800 to $1,499 | 14 (2.0%) | 96 (8.9%) |
| $800 to $1,499 | 455 (64.3%) | 57 (5.3%) |
| Total | 708 (100.0%) | 1,077 (100.0%) |
Health & Disability in Bellevue borough
Health Insurance Coverage by Age in Bellevue borough
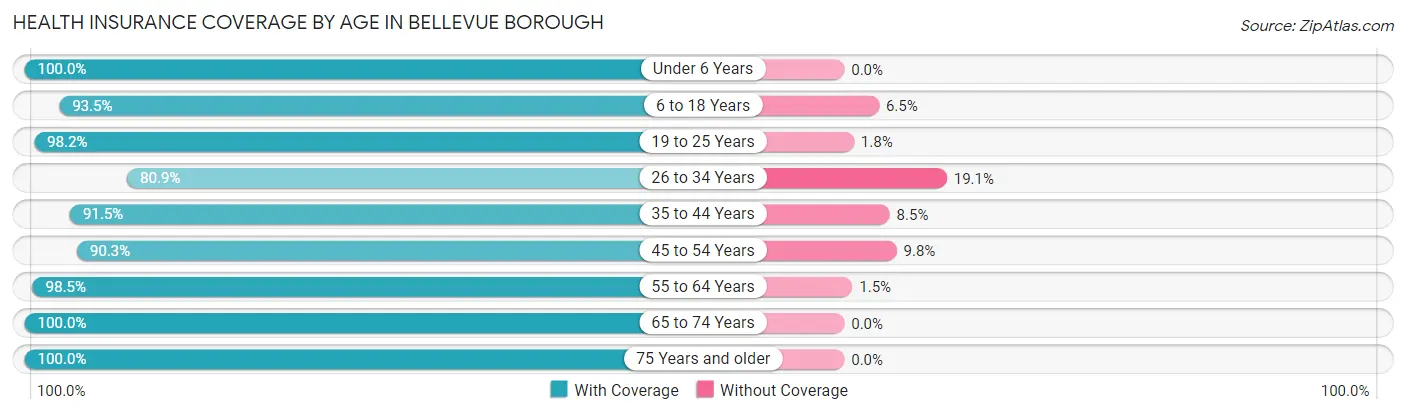
| Age Bracket | With Coverage | Without Coverage |
| Under 6 Years | 552 (100.0%) | 0 (0.0%) |
| 6 to 18 Years | 623 (93.5%) | 43 (6.5%) |
| 19 to 25 Years | 768 (98.2%) | 14 (1.8%) |
| 26 to 34 Years | 1,527 (80.9%) | 361 (19.1%) |
| 35 to 44 Years | 1,093 (91.5%) | 101 (8.5%) |
| 45 to 54 Years | 648 (90.2%) | 70 (9.8%) |
| 55 to 64 Years | 1,118 (98.5%) | 17 (1.5%) |
| 65 to 74 Years | 786 (100.0%) | 0 (0.0%) |
| 75 Years and older | 515 (100.0%) | 0 (0.0%) |
| Total | 7,630 (92.6%) | 606 (7.4%) |
Health Insurance Coverage by Citizenship Status in Bellevue borough
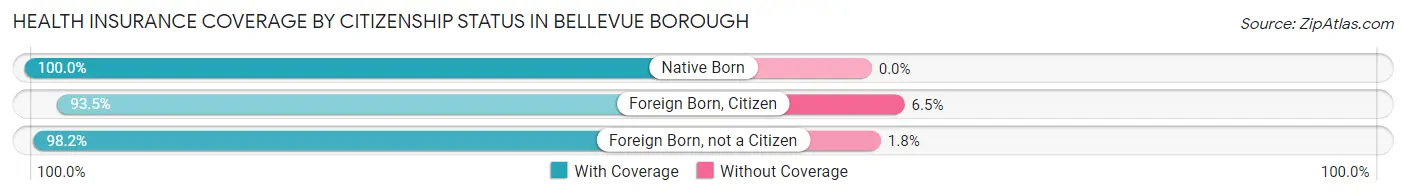
| Citizenship Status | With Coverage | Without Coverage |
| Native Born | 552 (100.0%) | 0 (0.0%) |
| Foreign Born, Citizen | 623 (93.5%) | 43 (6.5%) |
| Foreign Born, not a Citizen | 768 (98.2%) | 14 (1.8%) |
Health Insurance Coverage by Household Income in Bellevue borough
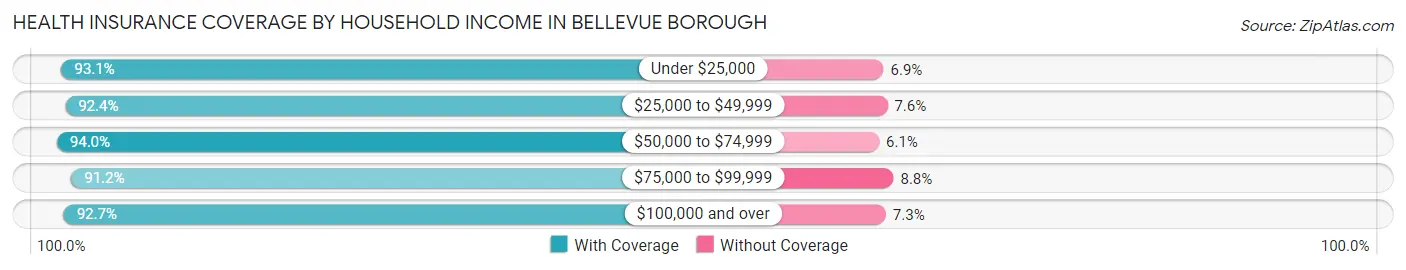
| Household Income | With Coverage | Without Coverage |
| Under $25,000 | 837 (93.1%) | 62 (6.9%) |
| $25,000 to $49,999 | 1,357 (92.4%) | 112 (7.6%) |
| $50,000 to $74,999 | 1,523 (94.0%) | 98 (6.0%) |
| $75,000 to $99,999 | 896 (91.2%) | 86 (8.8%) |
| $100,000 and over | 2,957 (92.7%) | 234 (7.3%) |
Public vs Private Health Insurance Coverage by Age in Bellevue borough
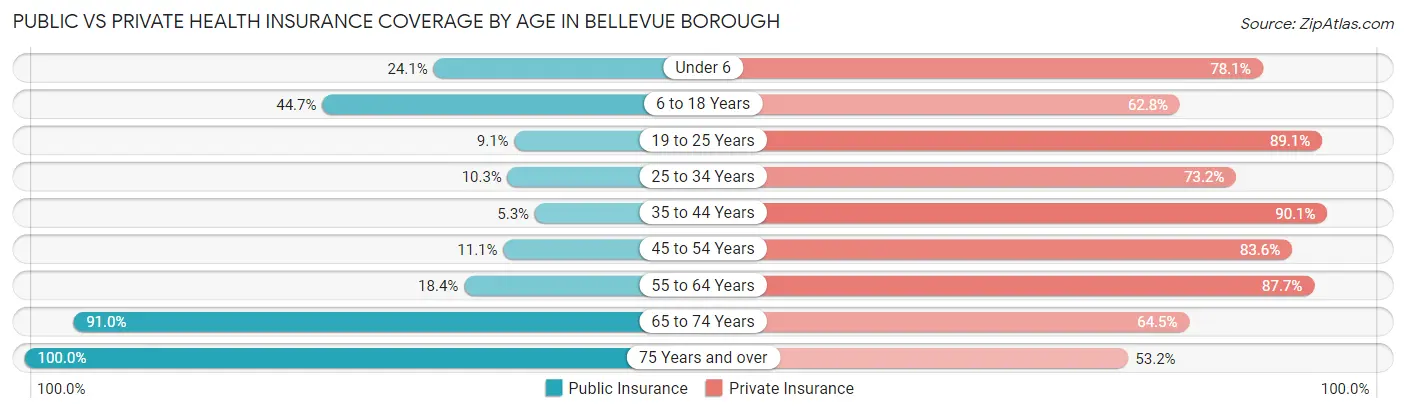
| Age Bracket | Public Insurance | Private Insurance |
| Under 6 | 133 (24.1%) | 431 (78.1%) |
| 6 to 18 Years | 298 (44.7%) | 418 (62.8%) |
| 19 to 25 Years | 71 (9.1%) | 697 (89.1%) |
| 25 to 34 Years | 195 (10.3%) | 1,382 (73.2%) |
| 35 to 44 Years | 63 (5.3%) | 1,076 (90.1%) |
| 45 to 54 Years | 80 (11.1%) | 600 (83.6%) |
| 55 to 64 Years | 209 (18.4%) | 995 (87.7%) |
| 65 to 74 Years | 715 (91.0%) | 507 (64.5%) |
| 75 Years and over | 515 (100.0%) | 274 (53.2%) |
| Total | 2,279 (27.7%) | 6,380 (77.5%) |
Disability Status by Sex by Age in Bellevue borough
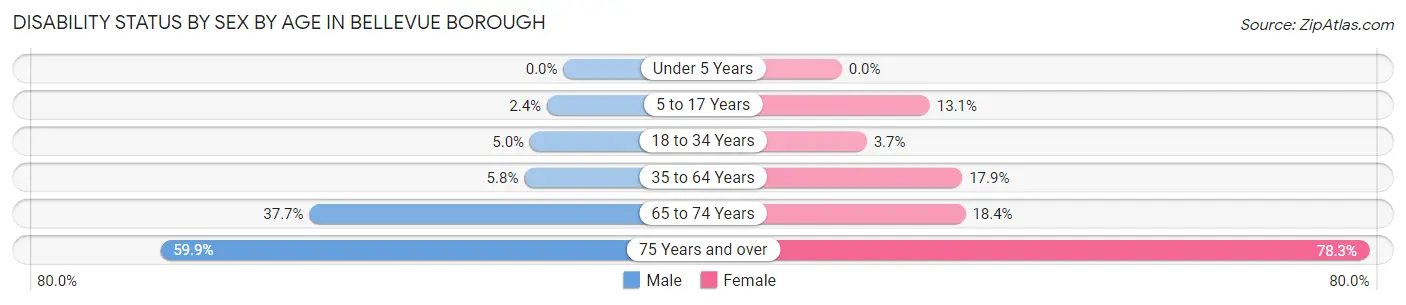
| Age Bracket | Male | Female |
| Under 5 Years | 0 (0.0%) | 0 (0.0%) |
| 5 to 17 Years | 9 (2.4%) | 48 (13.1%) |
| 18 to 34 Years | 66 (5.0%) | 50 (3.7%) |
| 35 to 64 Years | 85 (5.8%) | 283 (17.9%) |
| 65 to 74 Years | 126 (37.7%) | 83 (18.4%) |
| 75 Years and over | 88 (59.9%) | 288 (78.3%) |
Disability Class by Sex by Age in Bellevue borough
Disability Class: Hearing Difficulty
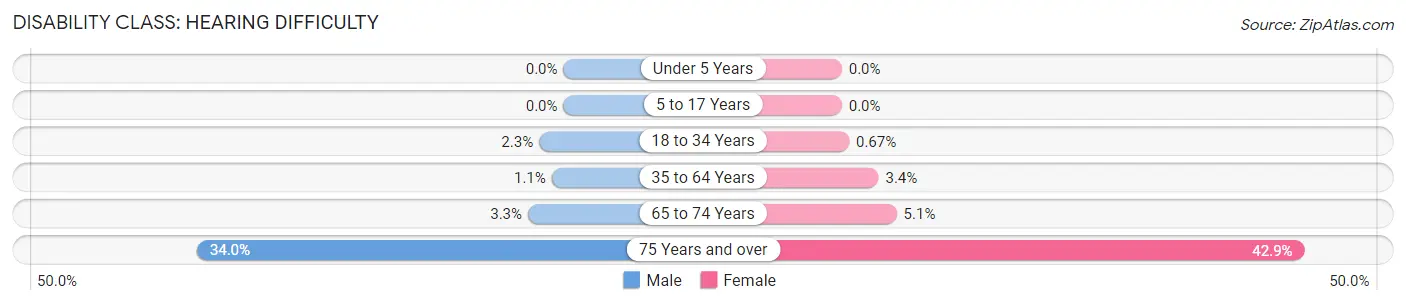
| Age Bracket | Male | Female |
| Under 5 Years | 0 (0.0%) | 0 (0.0%) |
| 5 to 17 Years | 0 (0.0%) | 0 (0.0%) |
| 18 to 34 Years | 30 (2.3%) | 9 (0.7%) |
| 35 to 64 Years | 16 (1.1%) | 54 (3.4%) |
| 65 to 74 Years | 11 (3.3%) | 23 (5.1%) |
| 75 Years and over | 50 (34.0%) | 158 (42.9%) |
Disability Class: Vision Difficulty
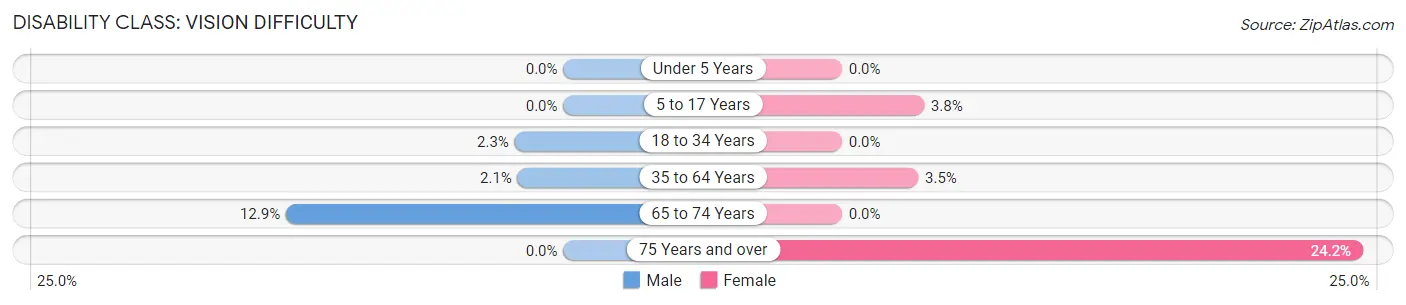
| Age Bracket | Male | Female |
| Under 5 Years | 0 (0.0%) | 0 (0.0%) |
| 5 to 17 Years | 0 (0.0%) | 14 (3.8%) |
| 18 to 34 Years | 30 (2.3%) | 0 (0.0%) |
| 35 to 64 Years | 31 (2.1%) | 56 (3.5%) |
| 65 to 74 Years | 43 (12.9%) | 0 (0.0%) |
| 75 Years and over | 0 (0.0%) | 89 (24.2%) |
Disability Class: Cognitive Difficulty
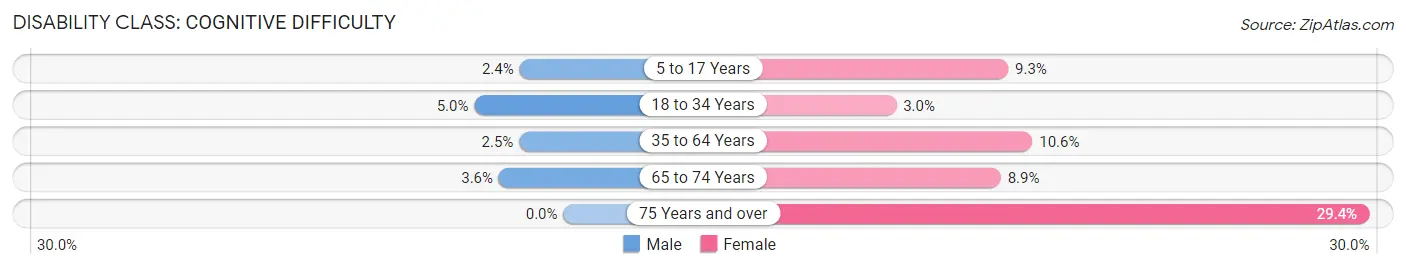
| Age Bracket | Male | Female |
| 5 to 17 Years | 9 (2.4%) | 34 (9.3%) |
| 18 to 34 Years | 66 (5.0%) | 41 (3.0%) |
| 35 to 64 Years | 36 (2.5%) | 168 (10.6%) |
| 65 to 74 Years | 12 (3.6%) | 40 (8.8%) |
| 75 Years and over | 0 (0.0%) | 108 (29.3%) |
Disability Class: Ambulatory Difficulty
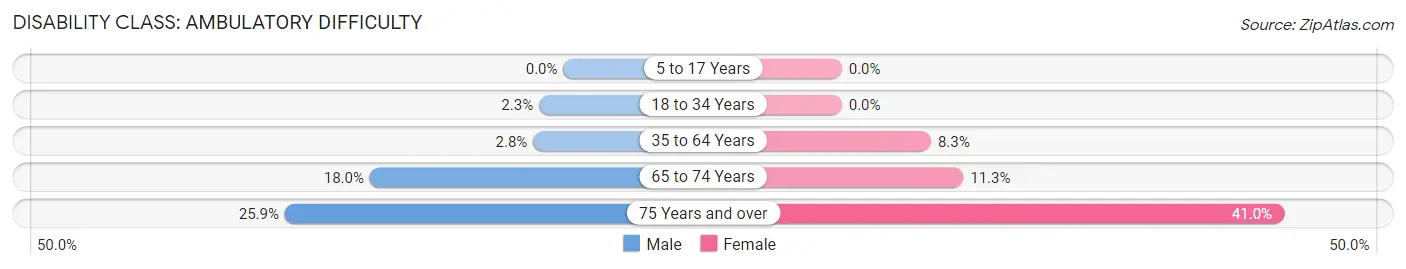
| Age Bracket | Male | Female |
| 5 to 17 Years | 0 (0.0%) | 0 (0.0%) |
| 18 to 34 Years | 30 (2.3%) | 0 (0.0%) |
| 35 to 64 Years | 41 (2.8%) | 131 (8.3%) |
| 65 to 74 Years | 60 (18.0%) | 51 (11.3%) |
| 75 Years and over | 38 (25.9%) | 151 (41.0%) |
Disability Class: Self-Care Difficulty
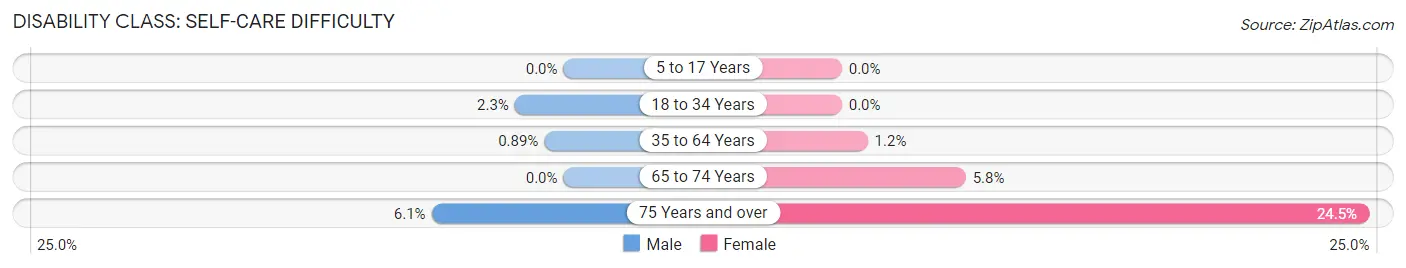
| Age Bracket | Male | Female |
| 5 to 17 Years | 0 (0.0%) | 0 (0.0%) |
| 18 to 34 Years | 30 (2.3%) | 0 (0.0%) |
| 35 to 64 Years | 13 (0.9%) | 19 (1.2%) |
| 65 to 74 Years | 0 (0.0%) | 26 (5.8%) |
| 75 Years and over | 9 (6.1%) | 90 (24.5%) |
Technology Access in Bellevue borough
Computing Device Access in Bellevue borough
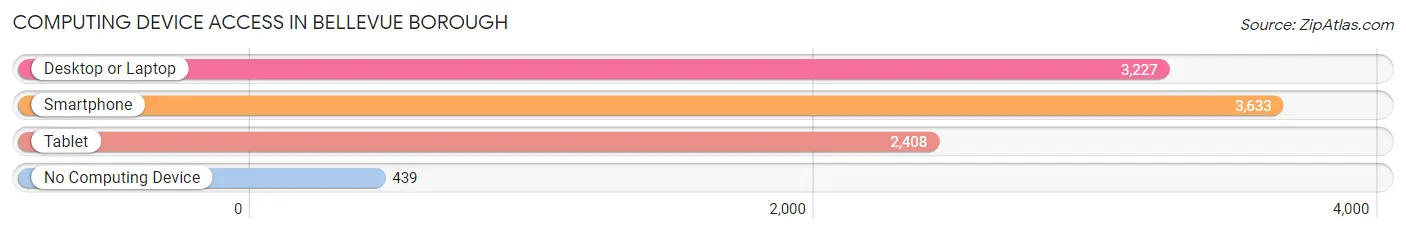
| Device Type | # Households | % Households |
| Desktop or Laptop | 3,227 | 74.7% |
| Smartphone | 3,633 | 84.1% |
| Tablet | 2,408 | 55.7% |
| No Computing Device | 439 | 10.2% |
| Total | 4,322 | 100.0% |
Internet Access in Bellevue borough
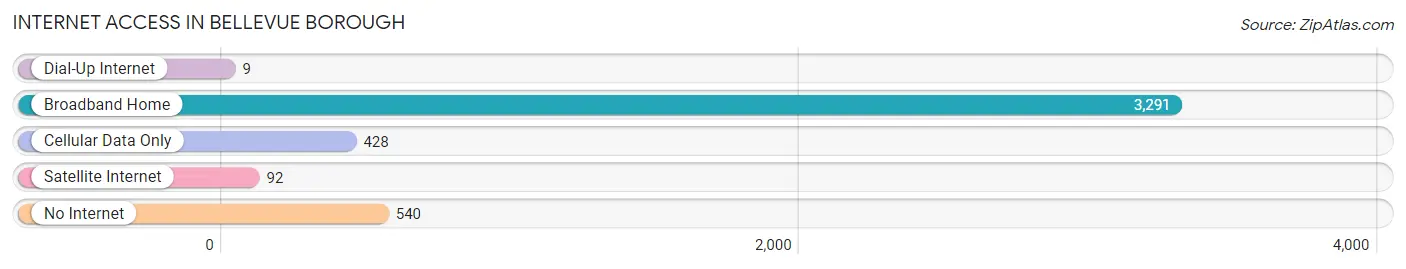
| Internet Type | # Households | % Households |
| Dial-Up Internet | 9 | 0.2% |
| Broadband Home | 3,291 | 76.1% |
| Cellular Data Only | 428 | 9.9% |
| Satellite Internet | 92 | 2.1% |
| No Internet | 540 | 12.5% |
| Total | 4,322 | 100.0% |
Bellevue borough Summary
Bellevue Borough is a small borough located in Allegheny County, Pennsylvania. It is situated along the Ohio River, just north of Pittsburgh. The borough is home to approximately 8,000 people and is part of the Pittsburgh Metropolitan Statistical Area.
History
Bellevue Borough was founded in 1867 by a group of settlers from the nearby town of Bellevue, Ohio. The settlers were attracted to the area due to its proximity to the Ohio River and the abundance of natural resources. The borough was officially incorporated in 1868 and was named after the nearby town of Bellevue, Ohio.
The borough quickly grew in population and by the early 1900s, it had become a thriving industrial center. The borough was home to several factories, including a steel mill, a glass factory, and a paper mill. The borough also had a thriving business district, with several stores, restaurants, and other businesses.
The borough experienced a period of decline in the mid-1900s, as many of the factories and businesses closed. However, the borough has since experienced a resurgence, with new businesses and development projects.
Geography
Bellevue Borough is located in Allegheny County, Pennsylvania. It is situated along the Ohio River, just north of Pittsburgh. The borough is bordered by Ross Township to the north, Avalon Borough to the east, and the Ohio River to the south and west.
The borough has a total area of 1.3 square miles, all of which is land. The borough is mostly flat, with some rolling hills in the northern part of the borough. The borough is home to several parks, including Bellevue Park, which features a playground, basketball courts, and a walking trail.
Economy
The economy of Bellevue Borough is largely based on the service industry. The borough is home to several restaurants, retail stores, and other businesses. The borough also has a thriving medical industry, with several hospitals and medical centers located in the area.
The borough is also home to several manufacturing companies, including a steel mill, a glass factory, and a paper mill. The borough also has a thriving tourism industry, with several hotels and attractions located in the area.
Demographics
As of the 2010 census, the population of Bellevue Borough was 8,073. The racial makeup of the borough was 87.3% White, 8.2% African American, 0.3% Native American, 1.2% Asian, and 2.9% from other races. Hispanic or Latino of any race were 3.3% of the population.
The median household income in the borough was $41,945, and the median family income was $50,945. The per capita income in the borough was $21,945. About 11.3% of the population was below the poverty line.
Bellevue Borough is served by the Bellevue School District, which includes two elementary schools, one middle school, and one high school. The borough is also home to several private schools, including a Catholic school and a Montessori school.
Common Questions
What is Per Capita Income in Bellevue borough?
Per Capita income in Bellevue borough is $45,551.
What is the Median Family Income in Bellevue borough?
Median Family Income in Bellevue borough is $97,622.
What is the Median Household income in Bellevue borough?
Median Household Income in Bellevue borough is $60,778.
What is Income or Wage Gap in Bellevue borough?
Income or Wage Gap in Bellevue borough is 9.4%.
Women in Bellevue borough earn 90.6 cents for every dollar earned by a man.
What is Inequality or Gini Index in Bellevue borough?
Inequality or Gini Index in Bellevue borough is 0.46.
What is the Total Population of Bellevue borough?
Total Population of Bellevue borough is 8,236.
What is the Total Male Population of Bellevue borough?
Total Male Population of Bellevue borough is 3,916.
What is the Total Female Population of Bellevue borough?
Total Female Population of Bellevue borough is 4,320.
What is the Ratio of Males per 100 Females in Bellevue borough?
There are 90.65 Males per 100 Females in Bellevue borough.
What is the Ratio of Females per 100 Males in Bellevue borough?
There are 110.32 Females per 100 Males in Bellevue borough.
What is the Median Population Age in Bellevue borough?
Median Population Age in Bellevue borough is 37.0 Years.
What is the Average Family Size in Bellevue borough
Average Family Size in Bellevue borough is 2.8 People.
What is the Average Household Size in Bellevue borough
Average Household Size in Bellevue borough is 1.9 People.
How Large is the Labor Force in Bellevue borough?
There are 5,403 People in the Labor Forcein in Bellevue borough.
What is the Percentage of People in the Labor Force in Bellevue borough?
75.7% of People are in the Labor Force in Bellevue borough.
What is the Unemployment Rate in Bellevue borough?
Unemployment Rate in Bellevue borough is 3.7%.