Zip Codes with the Highest Percentage of Population with a Degree in Communications in Utah
RELATED REPORTS & OPTIONS
Communications
Utah
Compare Zip Codes
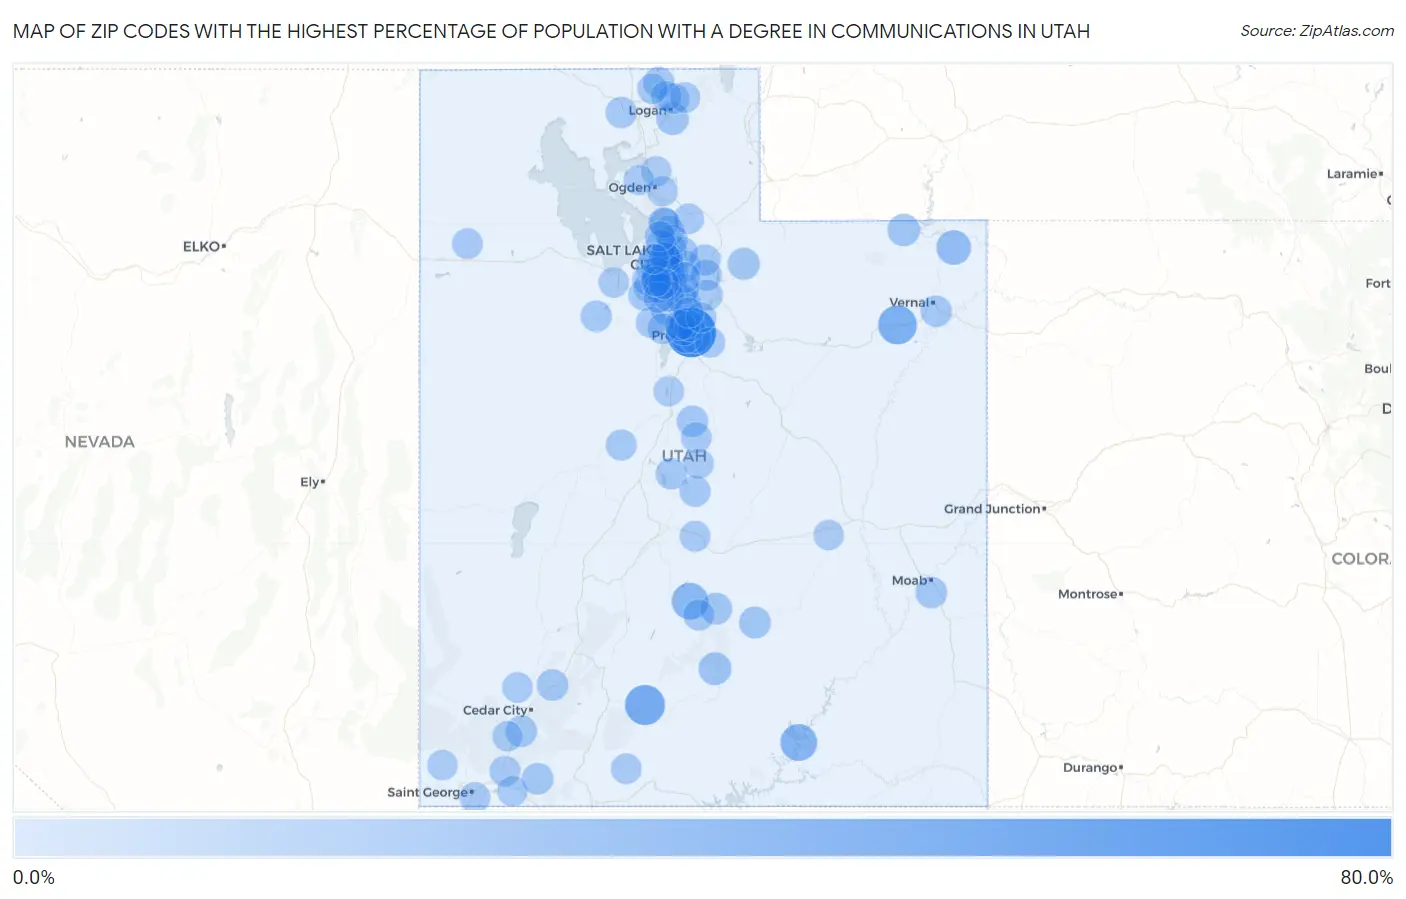
Map of Zip Codes with the Highest Percentage of Population with a Degree in Communications in Utah
0.0%
80.0%
Zip Codes with the Highest Percentage of Population with a Degree in Communications in Utah
| Zip Code | % Graduates | vs State | vs National | |
| 1. | 84602 | 68.0% | 4.4%(+63.6)#1 | 4.1%(+63.9)#28 |
| 2. | 84764 | 35.2% | 4.4%(+30.8)#2 | 4.1%(+31.1)#108 |
| 3. | 84026 | 31.0% | 4.4%(+26.6)#3 | 4.1%(+26.9)#147 |
| 4. | 84533 | 25.0% | 4.4%(+20.6)#4 | 4.1%(+20.9)#220 |
| 5. | 84747 | 24.3% | 4.4%(+19.8)#5 | 4.1%(+20.1)#228 |
| 6. | 84023 | 17.4% | 4.4%(+12.9)#6 | 4.1%(+13.3)#423 |
| 7. | 84716 | 11.4% | 4.4%(+6.93)#7 | 4.1%(+7.24)#917 |
| 8. | 84326 | 10.4% | 4.4%(+5.95)#8 | 4.1%(+6.26)#1,071 |
| 9. | 84046 | 10.3% | 4.4%(+5.85)#9 | 4.1%(+6.16)#1,088 |
| 10. | 84055 | 9.2% | 4.4%(+4.71)#10 | 4.1%(+5.03)#1,374 |
| 11. | 84115 | 8.5% | 4.4%(+4.10)#11 | 4.1%(+4.41)#1,614 |
| 12. | 84749 | 8.3% | 4.4%(+3.89)#12 | 4.1%(+4.20)#1,721 |
| 13. | 84775 | 8.2% | 4.4%(+3.79)#13 | 4.1%(+4.10)#1,753 |
| 14. | 84761 | 8.0% | 4.4%(+3.51)#14 | 4.1%(+3.82)#1,906 |
| 15. | 84532 | 7.9% | 4.4%(+3.50)#15 | 4.1%(+3.81)#1,916 |
| 16. | 84767 | 7.8% | 4.4%(+3.38)#16 | 4.1%(+3.69)#1,991 |
| 17. | 84742 | 7.7% | 4.4%(+3.25)#17 | 4.1%(+3.56)#2,065 |
| 18. | 84632 | 7.4% | 4.4%(+2.95)#18 | 4.1%(+3.26)#2,273 |
| 19. | 84630 | 7.0% | 4.4%(+2.57)#19 | 4.1%(+2.88)#2,594 |
| 20. | 84078 | 6.7% | 4.4%(+2.30)#20 | 4.1%(+2.61)#2,857 |
| 21. | 84606 | 6.7% | 4.4%(+2.27)#21 | 4.1%(+2.58)#2,888 |
| 22. | 84047 | 6.7% | 4.4%(+2.25)#22 | 4.1%(+2.56)#2,923 |
| 23. | 84069 | 6.7% | 4.4%(+2.22)#23 | 4.1%(+2.53)#2,953 |
| 24. | 84337 | 6.6% | 4.4%(+2.15)#24 | 4.1%(+2.46)#3,028 |
| 25. | 84109 | 6.6% | 4.4%(+2.14)#25 | 4.1%(+2.45)#3,035 |
| 26. | 84043 | 6.6% | 4.4%(+2.12)#26 | 4.1%(+2.43)#3,059 |
| 27. | 84642 | 6.3% | 4.4%(+1.86)#27 | 4.1%(+2.17)#3,349 |
| 28. | 84101 | 6.3% | 4.4%(+1.85)#28 | 4.1%(+2.16)#3,362 |
| 29. | 84124 | 6.3% | 4.4%(+1.85)#29 | 4.1%(+2.16)#3,372 |
| 30. | 84096 | 6.1% | 4.4%(+1.64)#30 | 4.1%(+1.96)#3,645 |
| 31. | 84338 | 6.0% | 4.4%(+1.55)#31 | 4.1%(+1.86)#3,780 |
| 32. | 84103 | 6.0% | 4.4%(+1.55)#32 | 4.1%(+1.86)#3,790 |
| 33. | 84004 | 5.9% | 4.4%(+1.50)#33 | 4.1%(+1.81)#3,861 |
| 34. | 84098 | 5.9% | 4.4%(+1.50)#34 | 4.1%(+1.81)#3,864 |
| 35. | 84715 | 5.9% | 4.4%(+1.44)#35 | 4.1%(+1.75)#3,976 |
| 36. | 84601 | 5.9% | 4.4%(+1.40)#36 | 4.1%(+1.72)#4,030 |
| 37. | 84003 | 5.8% | 4.4%(+1.40)#37 | 4.1%(+1.71)#4,040 |
| 38. | 84108 | 5.8% | 4.4%(+1.35)#38 | 4.1%(+1.66)#4,123 |
| 39. | 84106 | 5.8% | 4.4%(+1.33)#39 | 4.1%(+1.65)#4,144 |
| 40. | 84123 | 5.6% | 4.4%(+1.18)#40 | 4.1%(+1.49)#4,402 |
| 41. | 84638 | 5.6% | 4.4%(+1.17)#41 | 4.1%(+1.48)#4,416 |
| 42. | 84025 | 5.6% | 4.4%(+1.15)#42 | 4.1%(+1.46)#4,465 |
| 43. | 84120 | 5.6% | 4.4%(+1.13)#43 | 4.1%(+1.44)#4,506 |
| 44. | 84060 | 5.5% | 4.4%(+1.04)#44 | 4.1%(+1.35)#4,661 |
| 45. | 84009 | 5.5% | 4.4%(+1.01)#45 | 4.1%(+1.32)#4,722 |
| 46. | 84093 | 5.4% | 4.4%(+0.986)#46 | 4.1%(+1.30)#4,783 |
| 47. | 84107 | 5.4% | 4.4%(+0.965)#47 | 4.1%(+1.28)#4,816 |
| 48. | 84102 | 5.4% | 4.4%(+0.960)#48 | 4.1%(+1.27)#4,823 |
| 49. | 84014 | 5.3% | 4.4%(+0.903)#49 | 4.1%(+1.21)#4,943 |
| 50. | 84049 | 5.3% | 4.4%(+0.897)#50 | 4.1%(+1.21)#4,956 |
| 51. | 84105 | 5.3% | 4.4%(+0.844)#51 | 4.1%(+1.16)#5,057 |
| 52. | 84092 | 5.2% | 4.4%(+0.785)#52 | 4.1%(+1.10)#5,180 |
| 53. | 84654 | 5.2% | 4.4%(+0.726)#53 | 4.1%(+1.04)#5,308 |
| 54. | 84083 | 5.2% | 4.4%(+0.726)#54 | 4.1%(+1.04)#5,310 |
| 55. | 84058 | 5.2% | 4.4%(+0.722)#55 | 4.1%(+1.03)#5,317 |
| 56. | 84005 | 5.0% | 4.4%(+0.530)#56 | 4.1%(+0.841)#5,753 |
| 57. | 84117 | 4.9% | 4.4%(+0.482)#57 | 4.1%(+0.794)#5,857 |
| 58. | 84081 | 4.9% | 4.4%(+0.434)#58 | 4.1%(+0.746)#5,967 |
| 59. | 84318 | 4.9% | 4.4%(+0.413)#59 | 4.1%(+0.724)#6,038 |
| 60. | 84010 | 4.9% | 4.4%(+0.411)#60 | 4.1%(+0.723)#6,048 |
| 61. | 84084 | 4.9% | 4.4%(+0.405)#61 | 4.1%(+0.716)#6,066 |
| 62. | 84094 | 4.8% | 4.4%(+0.383)#62 | 4.1%(+0.694)#6,115 |
| 63. | 84774 | 4.8% | 4.4%(+0.364)#63 | 4.1%(+0.675)#6,162 |
| 64. | 84646 | 4.8% | 4.4%(+0.316)#64 | 4.1%(+0.627)#6,272 |
| 65. | 84057 | 4.7% | 4.4%(+0.250)#65 | 4.1%(+0.561)#6,417 |
| 66. | 84054 | 4.7% | 4.4%(+0.240)#66 | 4.1%(+0.551)#6,445 |
| 67. | 84121 | 4.6% | 4.4%(+0.196)#67 | 4.1%(+0.507)#6,573 |
| 68. | 84020 | 4.6% | 4.4%(+0.187)#68 | 4.1%(+0.498)#6,599 |
| 69. | 84129 | 4.6% | 4.4%(+0.183)#69 | 4.1%(+0.494)#6,608 |
| 70. | 84790 | 4.6% | 4.4%(+0.182)#70 | 4.1%(+0.494)#6,610 |
| 71. | 84045 | 4.5% | 4.4%(+0.076)#71 | 4.1%(+0.387)#6,895 |
| 72. | 84095 | 4.5% | 4.4%(+0.007)#72 | 4.1%(+0.318)#7,091 |
| 73. | 84065 | 4.4% | 4.4%(-0.062)#73 | 4.1%(+0.249)#7,295 |
| 74. | 84050 | 4.4% | 4.4%(-0.073)#74 | 4.1%(+0.238)#7,328 |
| 75. | 84111 | 4.4% | 4.4%(-0.086)#75 | 4.1%(+0.225)#7,367 |
| 76. | 84741 | 4.3% | 4.4%(-0.109)#76 | 4.1%(+0.202)#7,466 |
| 77. | 84721 | 4.2% | 4.4%(-0.251)#77 | 4.1%(+0.060)#7,912 |
| 78. | 84070 | 4.2% | 4.4%(-0.262)#78 | 4.1%(+0.049)#7,937 |
| 79. | 84037 | 4.2% | 4.4%(-0.272)#79 | 4.1%(+0.039)#7,972 |
| 80. | 84335 | 4.2% | 4.4%(-0.289)#80 | 4.1%(+0.023)#8,037 |
| 81. | 84327 | 4.1% | 4.4%(-0.308)#81 | 4.1%(+0.003)#8,103 |
| 82. | 84414 | 4.0% | 4.4%(-0.418)#82 | 4.1%(-0.107)#8,477 |
| 83. | 84737 | 4.0% | 4.4%(-0.427)#83 | 4.1%(-0.116)#8,504 |
| 84. | 84321 | 4.0% | 4.4%(-0.443)#84 | 4.1%(-0.132)#8,554 |
| 85. | 84097 | 3.9% | 4.4%(-0.506)#85 | 4.1%(-0.195)#8,775 |
| 86. | 84059 | 3.9% | 4.4%(-0.507)#86 | 4.1%(-0.196)#8,778 |
| 87. | 84074 | 3.9% | 4.4%(-0.535)#87 | 4.1%(-0.224)#8,874 |
| 88. | 84645 | 3.9% | 4.4%(-0.570)#88 | 4.1%(-0.259)#8,995 |
| 89. | 84403 | 3.9% | 4.4%(-0.575)#89 | 4.1%(-0.264)#9,009 |
| 90. | 84525 | 3.8% | 4.4%(-0.600)#90 | 4.1%(-0.289)#9,111 |
| 91. | 84765 | 3.8% | 4.4%(-0.623)#91 | 4.1%(-0.312)#9,193 |
| 92. | 84663 | 3.7% | 4.4%(-0.697)#92 | 4.1%(-0.385)#9,460 |
| 93. | 84087 | 3.7% | 4.4%(-0.700)#93 | 4.1%(-0.389)#9,470 |
| 94. | 84404 | 3.6% | 4.4%(-0.821)#94 | 4.1%(-0.510)#9,881 |
| 95. | 84604 | 3.6% | 4.4%(-0.856)#95 | 4.1%(-0.545)#9,984 |
| 96. | 84088 | 3.6% | 4.4%(-0.875)#96 | 4.1%(-0.564)#10,038 |
| 97. | 84062 | 3.6% | 4.4%(-0.894)#97 | 4.1%(-0.583)#10,130 |
| 98. | 84627 | 3.5% | 4.4%(-0.905)#98 | 4.1%(-0.594)#10,166 |
| 99. | 84104 | 3.5% | 4.4%(-0.951)#99 | 4.1%(-0.639)#10,343 |
| 100. | 84720 | 3.5% | 4.4%(-0.963)#100 | 4.1%(-0.651)#10,389 |
Common Questions
What are the Top 10 Zip Codes with the Highest Percentage of Population with a Degree in Communications in Utah?
Top 10 Zip Codes with the Highest Percentage of Population with a Degree in Communications in Utah are:
What zip code has the Highest Percentage of Population with a Degree in Communications in Utah?
84602 has the Highest Percentage of Population with a Degree in Communications in Utah with 68.0%.
What is the Percentage of Population with a Degree in Communications in the State of Utah?
Percentage of Population with a Degree in Communications in Utah is 4.4%.
What is the Percentage of Population with a Degree in Communications in the United States?
Percentage of Population with a Degree in Communications in the United States is 4.1%.