Lakeshore Gardens Hidden Acres, TX Map & Demographics
Lakeshore Gardens Hidden Acres Map
Lakeshore Gardens Hidden Acres Overview
$26,210
PER CAPITA INCOME
49.1%
WAGE / INCOME GAP [ % ]
50.9¢/ $1
WAGE / INCOME GAP [ $ ]
0.47
INEQUALITY / GINI INDEX
1,131
TOTAL POPULATION
414
MALE POPULATION
717
FEMALE POPULATION
57.74
MALES / 100 FEMALES
173.19
FEMALES / 100 MALES
40.4
MEDIAN AGE
4.4
AVG FAMILY SIZE
3.1
AVG HOUSEHOLD SIZE
358
LABOR FORCE [ PEOPLE ]
33.8%
PERCENT IN LABOR FORCE
Income in Lakeshore Gardens Hidden Acres
Income Overview in Lakeshore Gardens Hidden Acres
| Characteristic | Number | Measure |
| Per Capita Income | 1,131 | $26,210 |
| Median Family Income | 214 | $0 |
| Mean Family Income | 214 | $80,202 |
| Median Household Income | 360 | $0 |
| Mean Household Income | 360 | $80,906 |
| Income Deficit | 214 | $0 |
| Wage / Income Gap (%) | 1,131 | 49.11% |
| Wage / Income Gap ($) | 1,131 | 50.89¢ per $1 |
| Gini / Inequality Index | 1,131 | 0.47 |
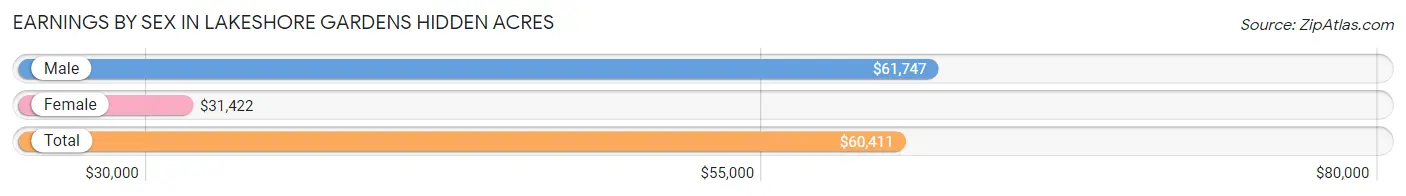
Earnings by Sex in Lakeshore Gardens Hidden Acres
Average Earnings in Lakeshore Gardens Hidden Acres are $60,411, $61,747 for men and $31,422 for women, a difference of 49.1%.
| Sex | Number | Average Earnings |
| Male | 260 (72.6%) | $61,747 |
| Female | 98 (27.4%) | $31,422 |
| Total | 358 (100.0%) | $60,411 |
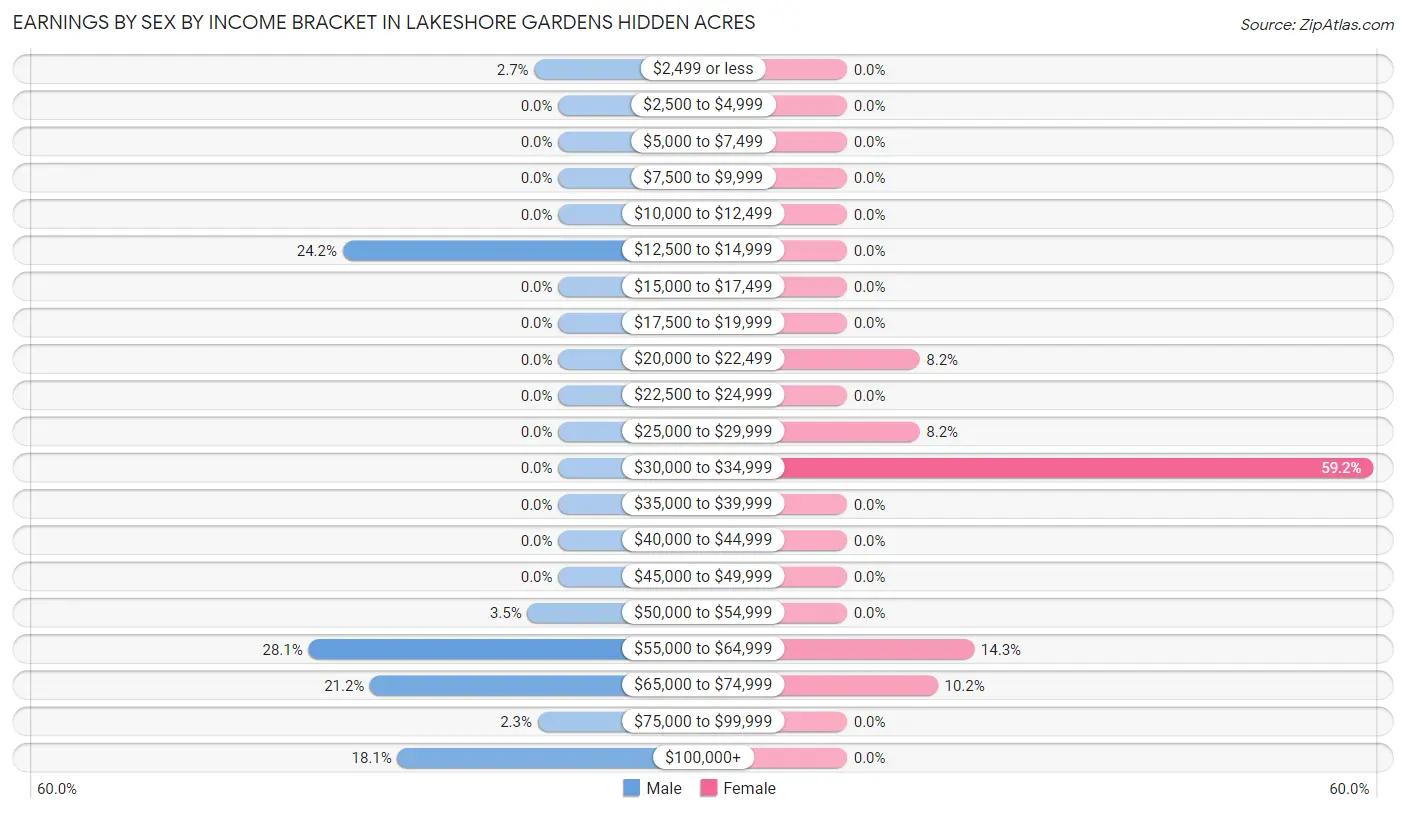
Earnings by Sex by Income Bracket in Lakeshore Gardens Hidden Acres
The most common earnings brackets in Lakeshore Gardens Hidden Acres are $55,000 to $64,999 for men (73 | 28.1%) and $30,000 to $34,999 for women (58 | 59.2%).
| Income | Male | Female |
| $2,499 or less | 7 (2.7%) | 0 (0.0%) |
| $2,500 to $4,999 | 0 (0.0%) | 0 (0.0%) |
| $5,000 to $7,499 | 0 (0.0%) | 0 (0.0%) |
| $7,500 to $9,999 | 0 (0.0%) | 0 (0.0%) |
| $10,000 to $12,499 | 0 (0.0%) | 0 (0.0%) |
| $12,500 to $14,999 | 63 (24.2%) | 0 (0.0%) |
| $15,000 to $17,499 | 0 (0.0%) | 0 (0.0%) |
| $17,500 to $19,999 | 0 (0.0%) | 0 (0.0%) |
| $20,000 to $22,499 | 0 (0.0%) | 8 (8.2%) |
| $22,500 to $24,999 | 0 (0.0%) | 0 (0.0%) |
| $25,000 to $29,999 | 0 (0.0%) | 8 (8.2%) |
| $30,000 to $34,999 | 0 (0.0%) | 58 (59.2%) |
| $35,000 to $39,999 | 0 (0.0%) | 0 (0.0%) |
| $40,000 to $44,999 | 0 (0.0%) | 0 (0.0%) |
| $45,000 to $49,999 | 0 (0.0%) | 0 (0.0%) |
| $50,000 to $54,999 | 9 (3.5%) | 0 (0.0%) |
| $55,000 to $64,999 | 73 (28.1%) | 14 (14.3%) |
| $65,000 to $74,999 | 55 (21.1%) | 10 (10.2%) |
| $75,000 to $99,999 | 6 (2.3%) | 0 (0.0%) |
| $100,000+ | 47 (18.1%) | 0 (0.0%) |
| Total | 260 (100.0%) | 98 (100.0%) |
Earnings by Sex by Educational Attainment in Lakeshore Gardens Hidden Acres
| Educational Attainment | Male Income | Female Income |
| Less than High School | - | - |
| High School Diploma | - | - |
| College or Associate's Degree | - | - |
| Bachelor's Degree | - | - |
| Graduate Degree | - | - |
| Total | - | - |
Family Income in Lakeshore Gardens Hidden Acres
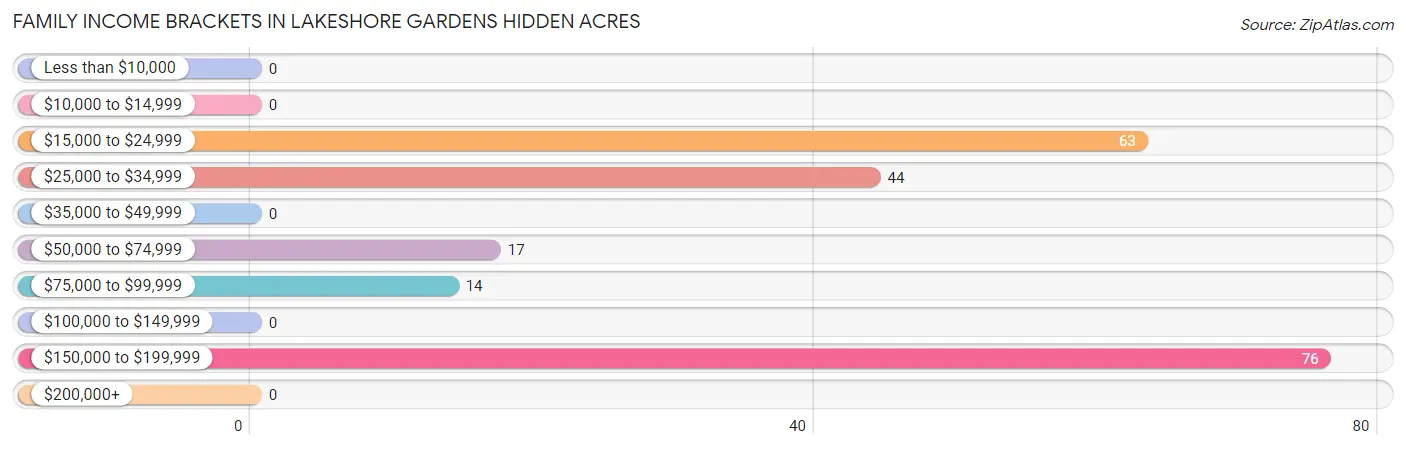
Family Income Brackets in Lakeshore Gardens Hidden Acres
According to the Lakeshore Gardens Hidden Acres family income data, there are 76 families falling into the $150,000 to $199,999 income range, which is the most common income bracket and makes up 35.5% of all families.
| Income Bracket | # Families | % Families |
| Less than $10,000 | 0 | 0.0% |
| $10,000 to $14,999 | 0 | 0.0% |
| $15,000 to $24,999 | 63 | 29.4% |
| $25,000 to $34,999 | 44 | 20.6% |
| $35,000 to $49,999 | 0 | 0.0% |
| $50,000 to $74,999 | 17 | 7.9% |
| $75,000 to $99,999 | 14 | 6.5% |
| $100,000 to $149,999 | 0 | 0.0% |
| $150,000 to $199,999 | 76 | 35.5% |
| $200,000+ | 0 | 0.0% |
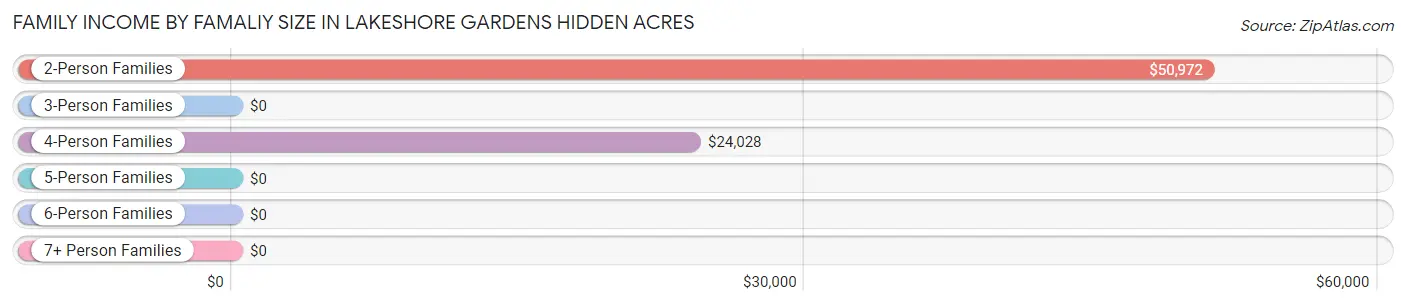
Family Income by Famaliy Size in Lakeshore Gardens Hidden Acres
2-person families (79 | 36.9%) account for the highest median family income in Lakeshore Gardens Hidden Acres with $50,972 per family, while 2-person families (79 | 36.9%) have the highest median income of $25,486 per family member.
| Income Bracket | # Families | Median Income |
| 2-Person Families | 79 (36.9%) | $50,972 |
| 3-Person Families | 0 (0.0%) | $0 |
| 4-Person Families | 77 (36.0%) | $24,028 |
| 5-Person Families | 0 (0.0%) | $0 |
| 6-Person Families | 0 (0.0%) | $0 |
| 7+ Person Families | 58 (27.1%) | $0 |
| Total | 214 (100.0%) | $0 |
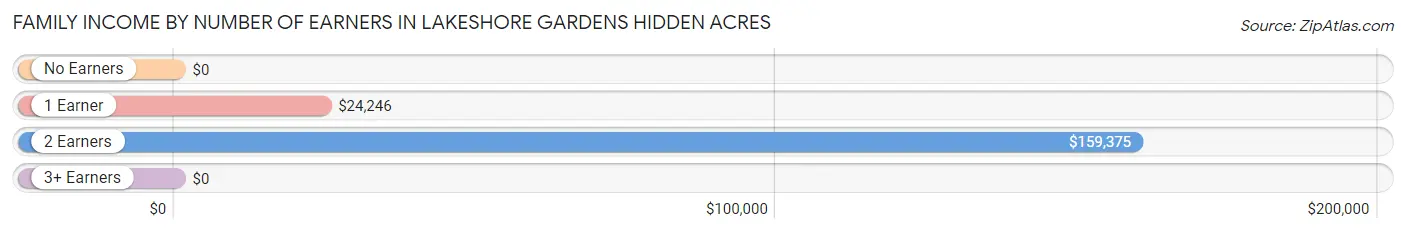
Family Income by Number of Earners in Lakeshore Gardens Hidden Acres
| Number of Earners | # Families | Median Income |
| No Earners | 44 (20.6%) | $0 |
| 1 Earner | 88 (41.1%) | $24,246 |
| 2 Earners | 24 (11.2%) | $159,375 |
| 3+ Earners | 58 (27.1%) | $0 |
| Total | 214 (100.0%) | $0 |
Household Income in Lakeshore Gardens Hidden Acres
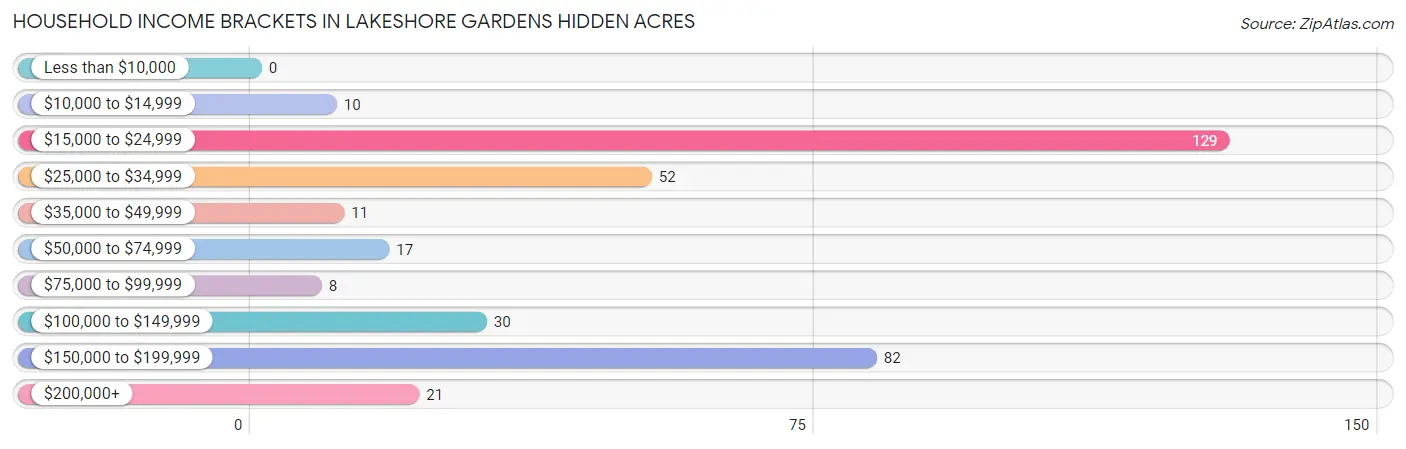
Household Income Brackets in Lakeshore Gardens Hidden Acres
With 129 households falling in the category, the $15,000 to $24,999 income range is the most frequent in Lakeshore Gardens Hidden Acres, accounting for 35.8% of all households.
| Income Bracket | # Households | % Households |
| Less than $10,000 | 0 | 0.0% |
| $10,000 to $14,999 | 10 | 2.8% |
| $15,000 to $24,999 | 129 | 35.8% |
| $25,000 to $34,999 | 52 | 14.4% |
| $35,000 to $49,999 | 11 | 3.1% |
| $50,000 to $74,999 | 17 | 4.7% |
| $75,000 to $99,999 | 8 | 2.2% |
| $100,000 to $149,999 | 30 | 8.3% |
| $150,000 to $199,999 | 82 | 22.8% |
| $200,000+ | 21 | 5.8% |
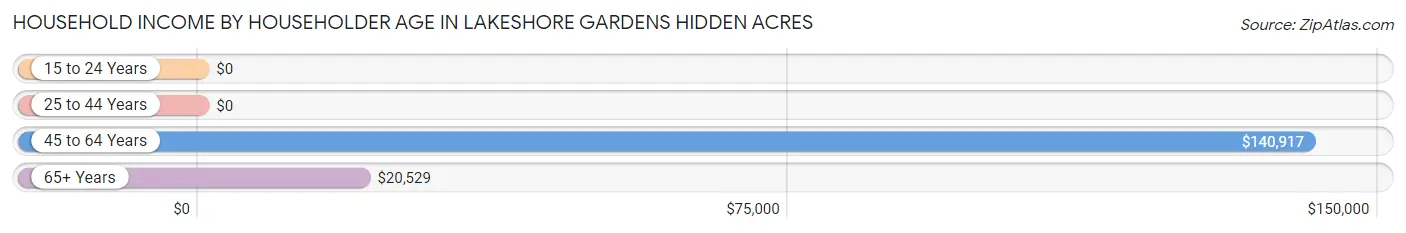
Household Income by Householder Age in Lakeshore Gardens Hidden Acres
The median household income in Lakeshore Gardens Hidden Acres is $0, with the highest median household income of $140,917 found in the 45 to 64 years age bracket for the primary householder. A total of 128 households (35.6%) fall into this category.
| Income Bracket | # Households | Median Income |
| 15 to 24 Years | 0 (0.0%) | $0 |
| 25 to 44 Years | 121 (33.6%) | $0 |
| 45 to 64 Years | 128 (35.6%) | $140,917 |
| 65+ Years | 111 (30.8%) | $20,529 |
| Total | 360 (100.0%) | $0 |
Poverty in Lakeshore Gardens Hidden Acres
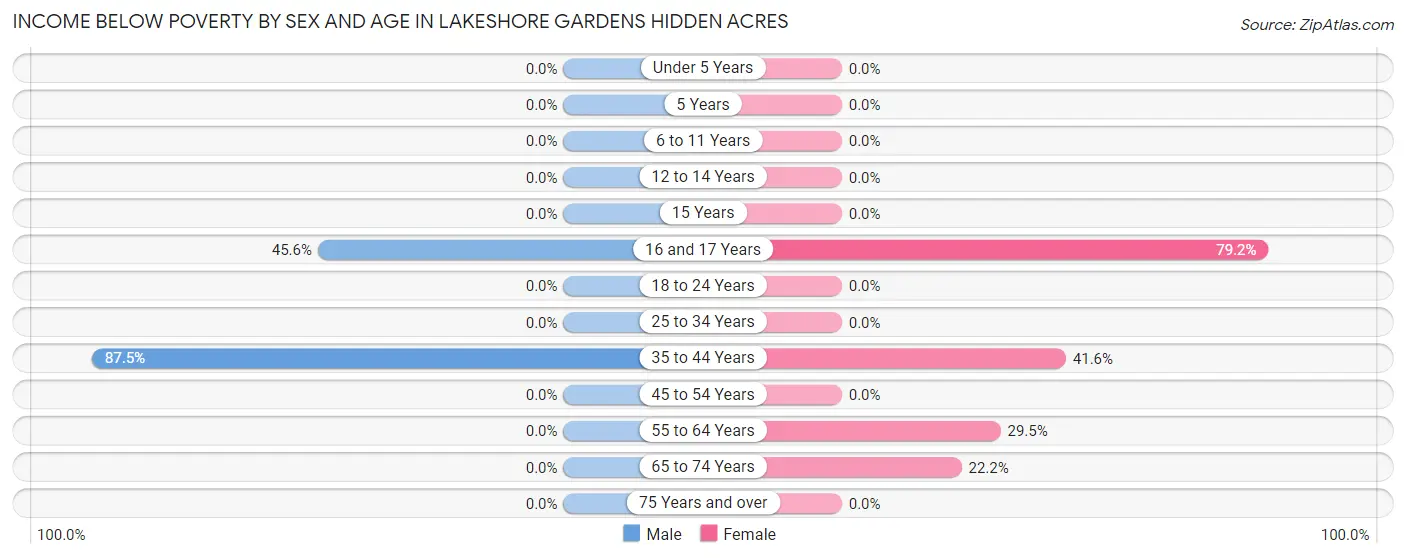
Income Below Poverty by Sex and Age in Lakeshore Gardens Hidden Acres
With 23.9% poverty level for males and 17.2% for females among the residents of Lakeshore Gardens Hidden Acres, 35 to 44 year old males and 16 and 17 year old females are the most vulnerable to poverty, with 63 males (87.5%) and 38 females (79.2%) in their respective age groups living below the poverty level.
| Age Bracket | Male | Female |
| Under 5 Years | 0 (0.0%) | 0 (0.0%) |
| 5 Years | 0 (0.0%) | 0 (0.0%) |
| 6 to 11 Years | 0 (0.0%) | 0 (0.0%) |
| 12 to 14 Years | 0 (0.0%) | 0 (0.0%) |
| 15 Years | 0 (0.0%) | 0 (0.0%) |
| 16 and 17 Years | 36 (45.6%) | 38 (79.2%) |
| 18 to 24 Years | 0 (0.0%) | 0 (0.0%) |
| 25 to 34 Years | 0 (0.0%) | 0 (0.0%) |
| 35 to 44 Years | 63 (87.5%) | 47 (41.6%) |
| 45 to 54 Years | 0 (0.0%) | 0 (0.0%) |
| 55 to 64 Years | 0 (0.0%) | 28 (29.5%) |
| 65 to 74 Years | 0 (0.0%) | 10 (22.2%) |
| 75 Years and over | 0 (0.0%) | 0 (0.0%) |
| Total | 99 (23.9%) | 123 (17.2%) |
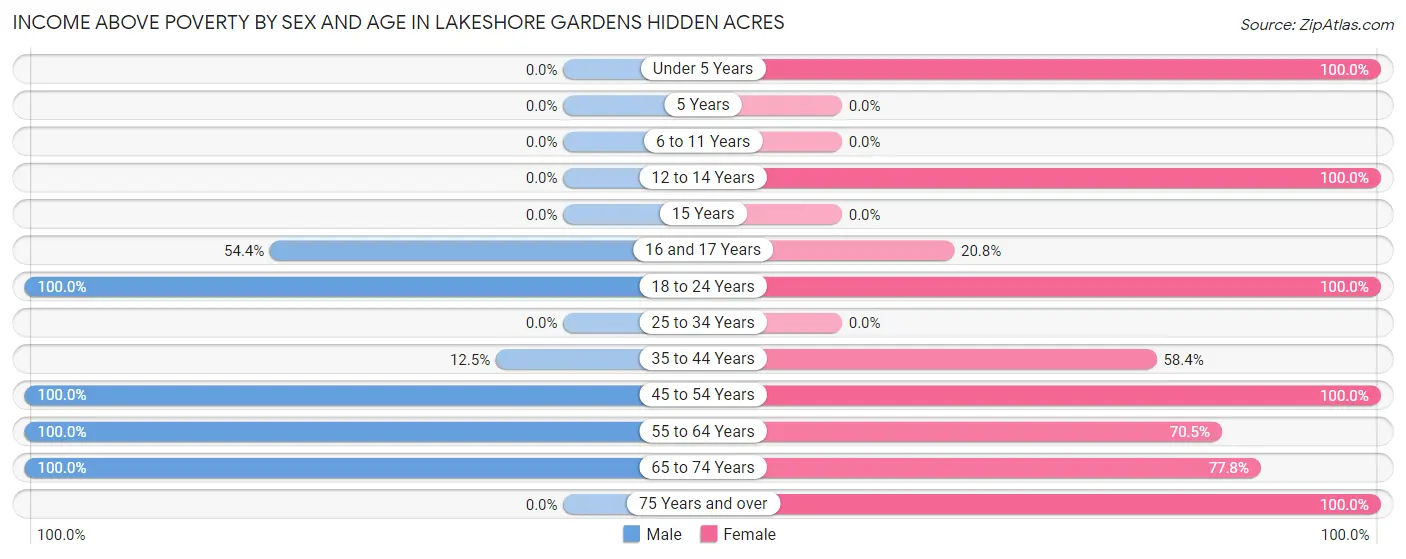
Income Above Poverty by Sex and Age in Lakeshore Gardens Hidden Acres
According to the poverty statistics in Lakeshore Gardens Hidden Acres, males aged 18 to 24 years and females aged under 5 years are the age groups that are most secure financially, with 100.0% of males and 100.0% of females in these age groups living above the poverty line.
| Age Bracket | Male | Female |
| Under 5 Years | 0 (0.0%) | 62 (100.0%) |
| 5 Years | 0 (0.0%) | 0 (0.0%) |
| 6 to 11 Years | 0 (0.0%) | 0 (0.0%) |
| 12 to 14 Years | 0 (0.0%) | 10 (100.0%) |
| 15 Years | 0 (0.0%) | 0 (0.0%) |
| 16 and 17 Years | 43 (54.4%) | 10 (20.8%) |
| 18 to 24 Years | 73 (100.0%) | 268 (100.0%) |
| 25 to 34 Years | 0 (0.0%) | 0 (0.0%) |
| 35 to 44 Years | 9 (12.5%) | 66 (58.4%) |
| 45 to 54 Years | 62 (100.0%) | 10 (100.0%) |
| 55 to 64 Years | 106 (100.0%) | 67 (70.5%) |
| 65 to 74 Years | 22 (100.0%) | 35 (77.8%) |
| 75 Years and over | 0 (0.0%) | 66 (100.0%) |
| Total | 315 (76.1%) | 594 (82.9%) |
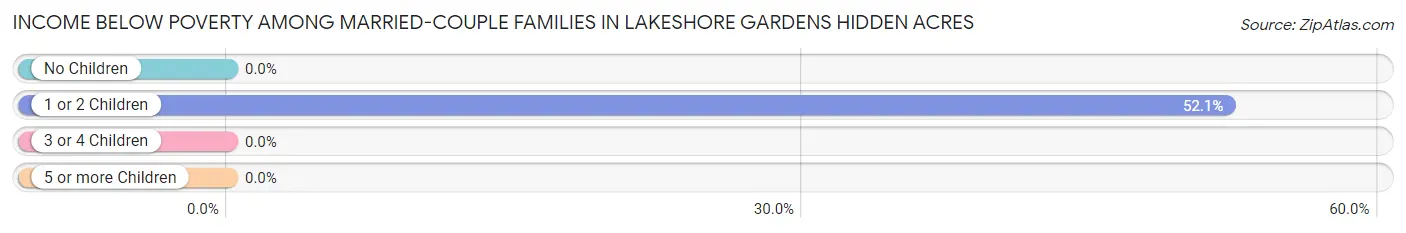
Income Below Poverty Among Married-Couple Families in Lakeshore Gardens Hidden Acres
The poverty statistics for married-couple families in Lakeshore Gardens Hidden Acres show that 31.5% or 63 of the total 200 families live below the poverty line. Families with 1 or 2 children have the highest poverty rate of 52.1%, comprising of 63 families. On the other hand, families with no children have the lowest poverty rate of 0.0%, which includes 0 families.
| Children | Above Poverty | Below Poverty |
| No Children | 79 (100.0%) | 0 (0.0%) |
| 1 or 2 Children | 58 (47.9%) | 63 (52.1%) |
| 3 or 4 Children | 0 (0.0%) | 0 (0.0%) |
| 5 or more Children | 0 (0.0%) | 0 (0.0%) |
| Total | 137 (68.5%) | 63 (31.5%) |
Income Below Poverty Among Single-Parent Households in Lakeshore Gardens Hidden Acres
| Children | Single Father | Single Mother |
| No Children | 0 (0.0%) | 0 (0.0%) |
| 1 or 2 Children | 0 (0.0%) | 0 (0.0%) |
| 3 or 4 Children | 0 (0.0%) | 0 (0.0%) |
| 5 or more Children | 0 (0.0%) | 0 (0.0%) |
| Total | 0 (0.0%) | 0 (0.0%) |
Income Below Poverty Among Married-Couple vs Single-Parent Households in Lakeshore Gardens Hidden Acres
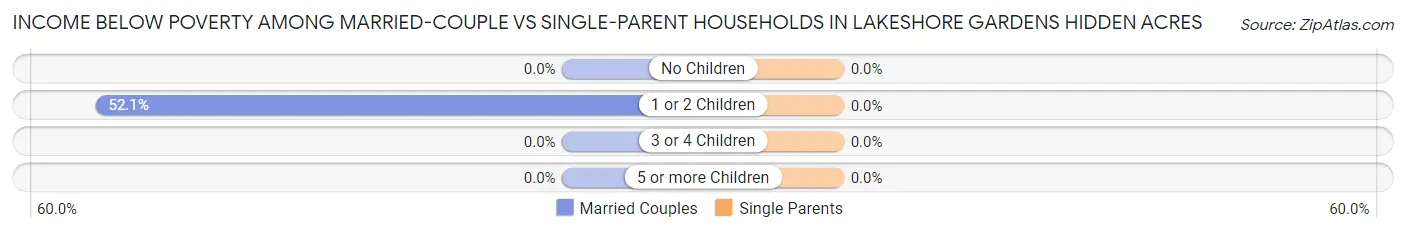
| Children | Married-Couple Families | Single-Parent Households |
| No Children | 0 (0.0%) | 0 (0.0%) |
| 1 or 2 Children | 63 (52.1%) | 0 (0.0%) |
| 3 or 4 Children | 0 (0.0%) | 0 (0.0%) |
| 5 or more Children | 0 (0.0%) | 0 (0.0%) |
| Total | 63 (31.5%) | 0 (0.0%) |
Race in Lakeshore Gardens Hidden Acres
The most populous races in Lakeshore Gardens Hidden Acres are Hispanic or Latino (829 | 73.3%), Two or more Races (658 | 58.2%), and White / Caucasian (473 | 41.8%).
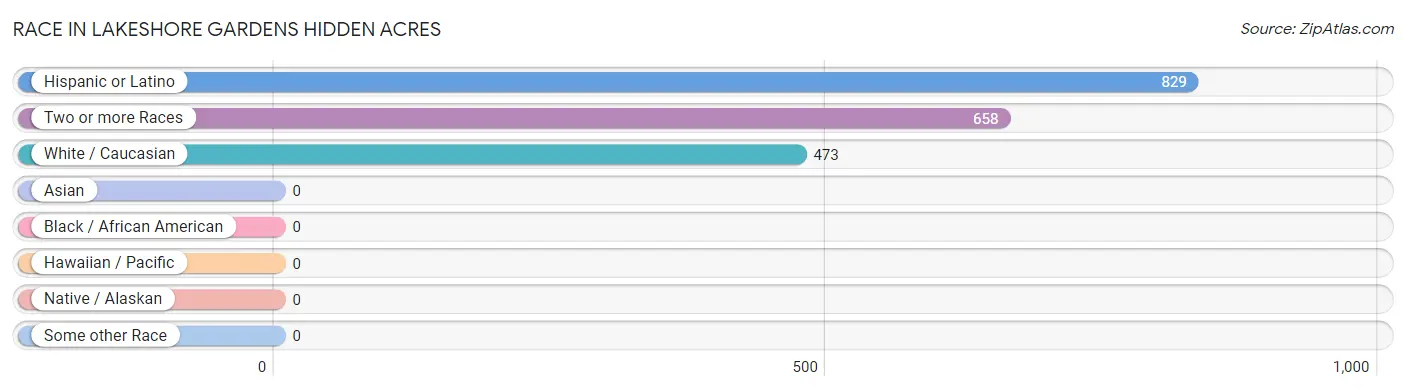
| Race | # Population | % Population |
| Asian | 0 | 0.0% |
| Black / African American | 0 | 0.0% |
| Hawaiian / Pacific | 0 | 0.0% |
| Hispanic or Latino | 829 | 73.3% |
| Native / Alaskan | 0 | 0.0% |
| White / Caucasian | 473 | 41.8% |
| Two or more Races | 658 | 58.2% |
| Some other Race | 0 | 0.0% |
| Total | 1,131 | 100.0% |
Ancestry in Lakeshore Gardens Hidden Acres
The most populous ancestries reported in Lakeshore Gardens Hidden Acres are Mexican (829 | 73.3%), English (152 | 13.4%), German (92 | 8.1%), Scotch-Irish (28 | 2.5%), and Irish (25 | 2.2%), together accounting for 99.6% of all Lakeshore Gardens Hidden Acres residents.
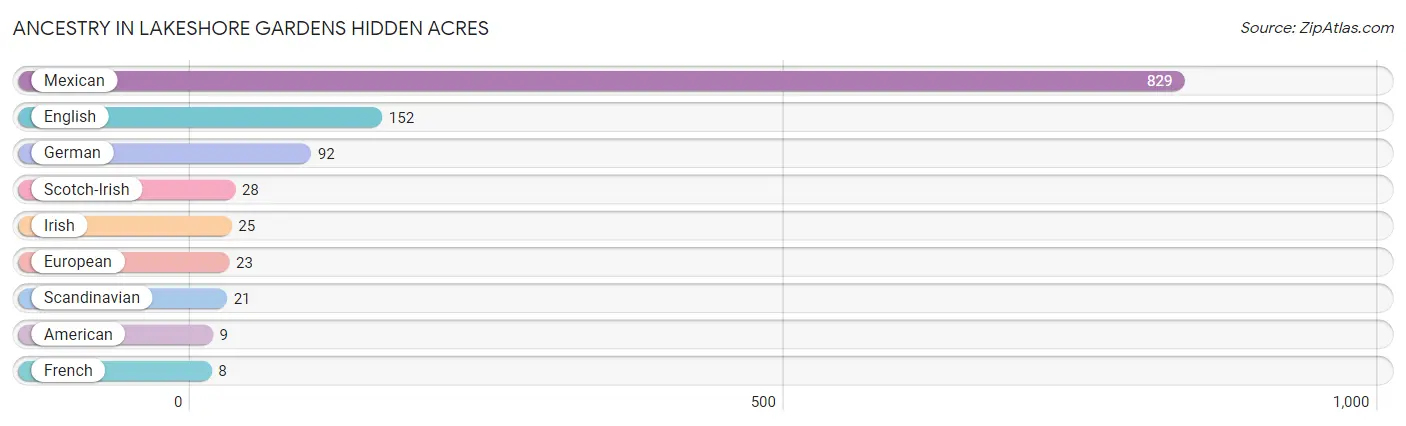
| Ancestry | # Population | % Population |
| American | 9 | 0.8% |
| English | 152 | 13.4% |
| European | 23 | 2.0% |
| French | 8 | 0.7% |
| German | 92 | 8.1% |
| Irish | 25 | 2.2% |
| Mexican | 829 | 73.3% |
| Scandinavian | 21 | 1.9% |
| Scotch-Irish | 28 | 2.5% | View All 9 Rows |
Immigrants in Lakeshore Gardens Hidden Acres
The most numerous immigrant groups reported in Lakeshore Gardens Hidden Acres came from Central America (18 | 1.6%), Latin America (18 | 1.6%), and Mexico (18 | 1.6%), together accounting for 4.8% of all Lakeshore Gardens Hidden Acres residents.
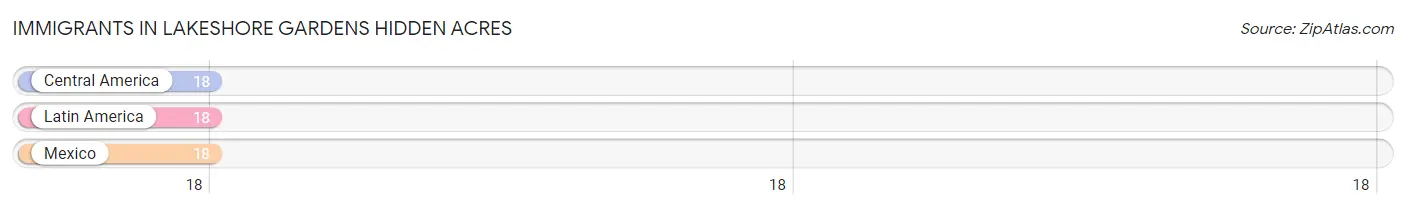
| Immigration Origin | # Population | % Population |
| Central America | 18 | 1.6% |
| Latin America | 18 | 1.6% |
| Mexico | 18 | 1.6% | View All 3 Rows |
Sex and Age in Lakeshore Gardens Hidden Acres
Sex and Age in Lakeshore Gardens Hidden Acres
The most populous age groups in Lakeshore Gardens Hidden Acres are 15 to 19 Years (79 | 19.1%) for men and 20 to 24 Years (178 | 24.8%) for women.
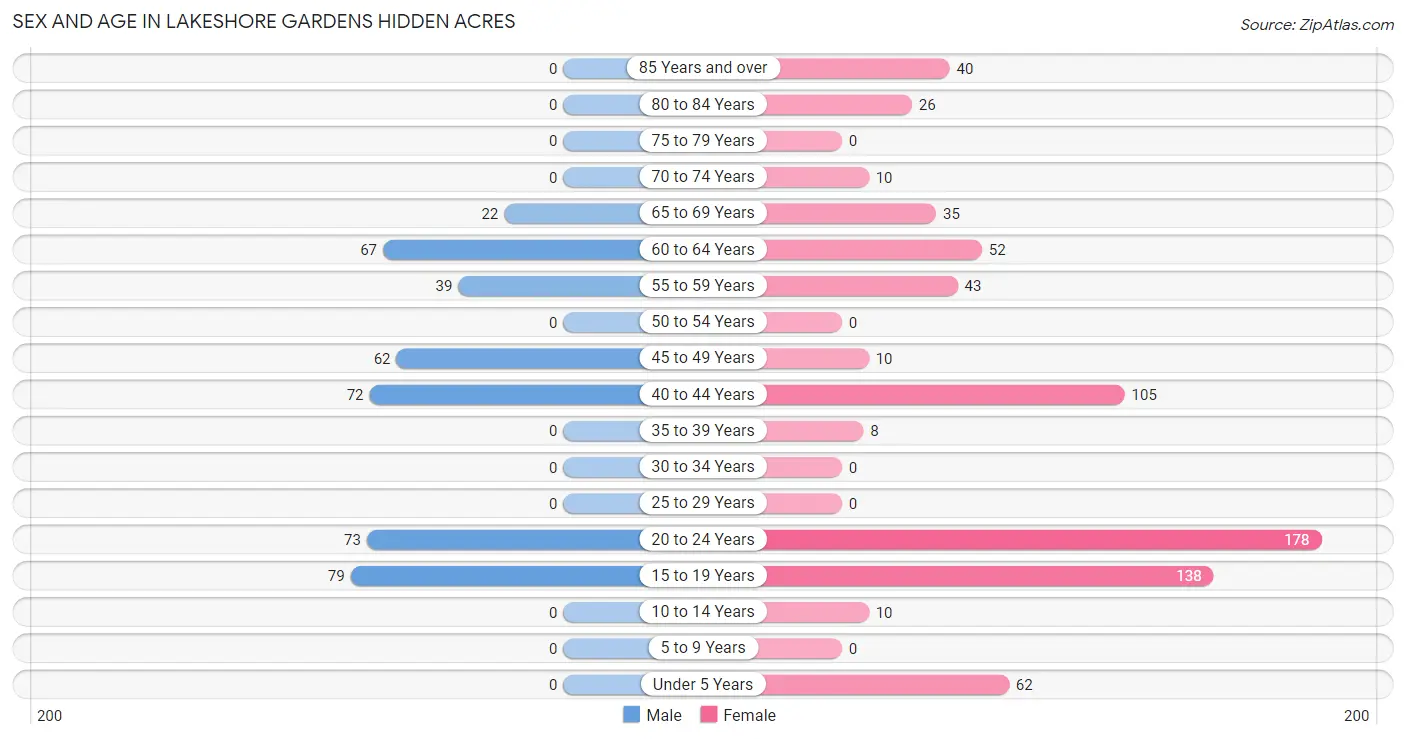
| Age Bracket | Male | Female |
| Under 5 Years | 0 (0.0%) | 62 (8.6%) |
| 5 to 9 Years | 0 (0.0%) | 0 (0.0%) |
| 10 to 14 Years | 0 (0.0%) | 10 (1.4%) |
| 15 to 19 Years | 79 (19.1%) | 138 (19.3%) |
| 20 to 24 Years | 73 (17.6%) | 178 (24.8%) |
| 25 to 29 Years | 0 (0.0%) | 0 (0.0%) |
| 30 to 34 Years | 0 (0.0%) | 0 (0.0%) |
| 35 to 39 Years | 0 (0.0%) | 8 (1.1%) |
| 40 to 44 Years | 72 (17.4%) | 105 (14.6%) |
| 45 to 49 Years | 62 (15.0%) | 10 (1.4%) |
| 50 to 54 Years | 0 (0.0%) | 0 (0.0%) |
| 55 to 59 Years | 39 (9.4%) | 43 (6.0%) |
| 60 to 64 Years | 67 (16.2%) | 52 (7.2%) |
| 65 to 69 Years | 22 (5.3%) | 35 (4.9%) |
| 70 to 74 Years | 0 (0.0%) | 10 (1.4%) |
| 75 to 79 Years | 0 (0.0%) | 0 (0.0%) |
| 80 to 84 Years | 0 (0.0%) | 26 (3.6%) |
| 85 Years and over | 0 (0.0%) | 40 (5.6%) |
| Total | 414 (100.0%) | 717 (100.0%) |
Families and Households in Lakeshore Gardens Hidden Acres
Median Family Size in Lakeshore Gardens Hidden Acres
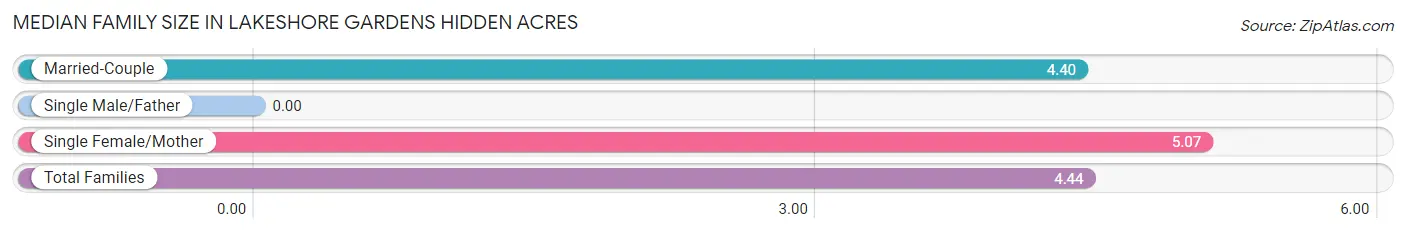
| Family Type | # Families | Family Size |
| Married-Couple | 200 (93.5%) | 4.40 |
| Single Male/Father | 0 (0.0%) | - |
| Single Female/Mother | 14 (6.5%) | 5.07 |
| Total Families | 214 (100.0%) | 4.44 |
Median Household Size in Lakeshore Gardens Hidden Acres
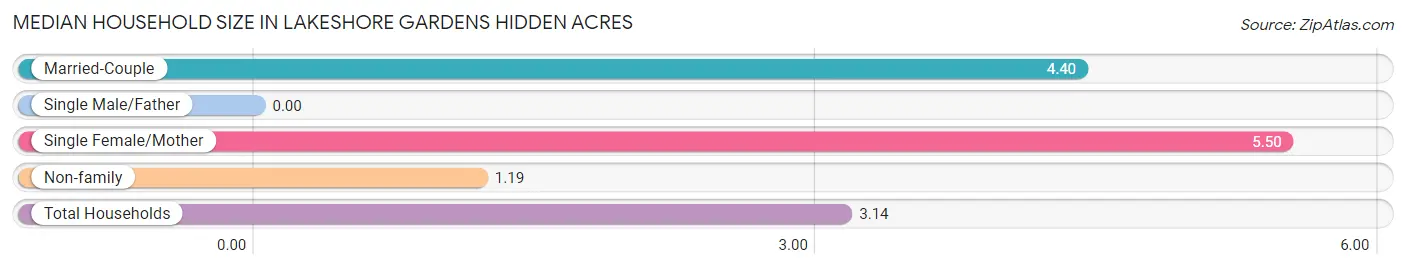
| Household Type | # Households | Household Size |
| Married-Couple | 200 (55.6%) | 4.40 |
| Single Male/Father | 0 (0.0%) | - |
| Single Female/Mother | 14 (3.9%) | 5.50 |
| Non-family | 146 (40.6%) | 1.19 |
| Total Households | 360 (100.0%) | 3.14 |
Household Size by Marriage Status in Lakeshore Gardens Hidden Acres
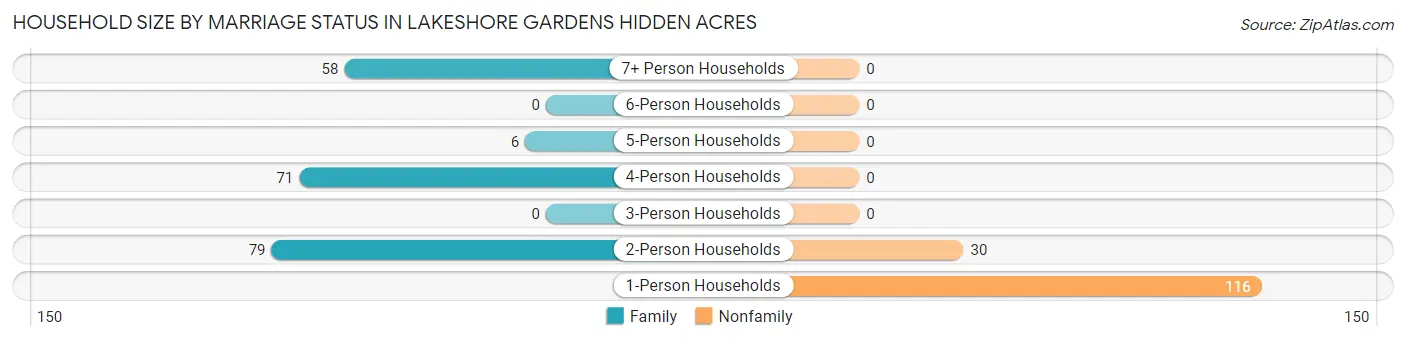
Out of a total of 360 households in Lakeshore Gardens Hidden Acres, 214 (59.4%) are family households, while 146 (40.6%) are nonfamily households. The most numerous type of family households are 2-person households, comprising 79, and the most common type of nonfamily households are 1-person households, comprising 116.
| Household Size | Family Households | Nonfamily Households |
| 1-Person Households | - | 116 (32.2%) |
| 2-Person Households | 79 (21.9%) | 30 (8.3%) |
| 3-Person Households | 0 (0.0%) | 0 (0.0%) |
| 4-Person Households | 71 (19.7%) | 0 (0.0%) |
| 5-Person Households | 6 (1.7%) | 0 (0.0%) |
| 6-Person Households | 0 (0.0%) | 0 (0.0%) |
| 7+ Person Households | 58 (16.1%) | 0 (0.0%) |
| Total | 214 (59.4%) | 146 (40.6%) |
Female Fertility in Lakeshore Gardens Hidden Acres
Fertility by Age in Lakeshore Gardens Hidden Acres
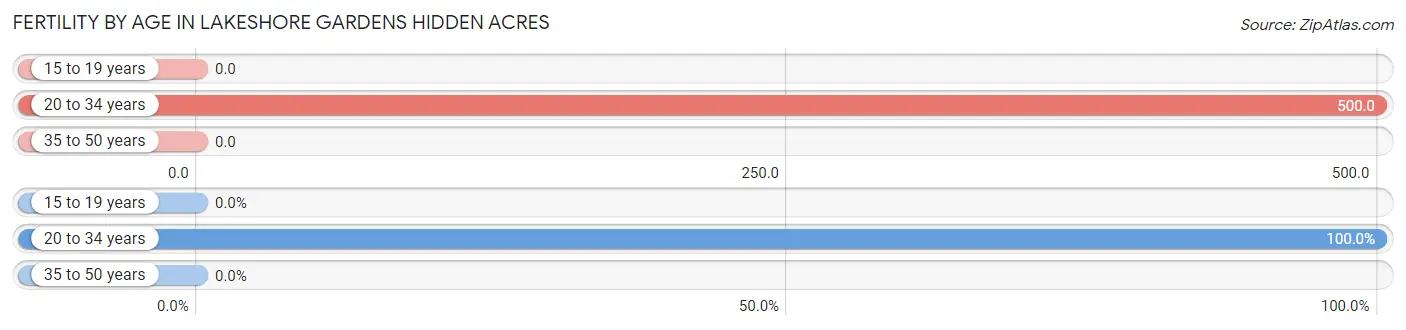
Average fertility rate in Lakeshore Gardens Hidden Acres is 203.0 births per 1,000 women. Women in the age bracket of 20 to 34 years have the highest fertility rate with 500.0 births per 1,000 women. Women in the age bracket of 20 to 34 years acount for 100.0% of all women with births.
| Age Bracket | Women with Births | Births / 1,000 Women |
| 15 to 19 years | 0 (0.0%) | 0.0 |
| 20 to 34 years | 89 (100.0%) | 500.0 |
| 35 to 50 years | 0 (0.0%) | 0.0 |
| Total | 89 (100.0%) | 203.0 |
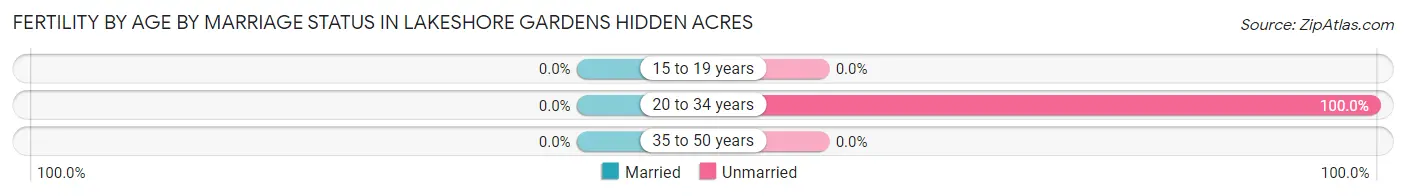
Fertility by Age by Marriage Status in Lakeshore Gardens Hidden Acres
| Age Bracket | Married | Unmarried |
| 15 to 19 years | 0 (0.0%) | 0 (0.0%) |
| 20 to 34 years | 0 (0.0%) | 89 (100.0%) |
| 35 to 50 years | 0 (0.0%) | 0 (0.0%) |
| Total | 0 (0.0%) | 89 (100.0%) |
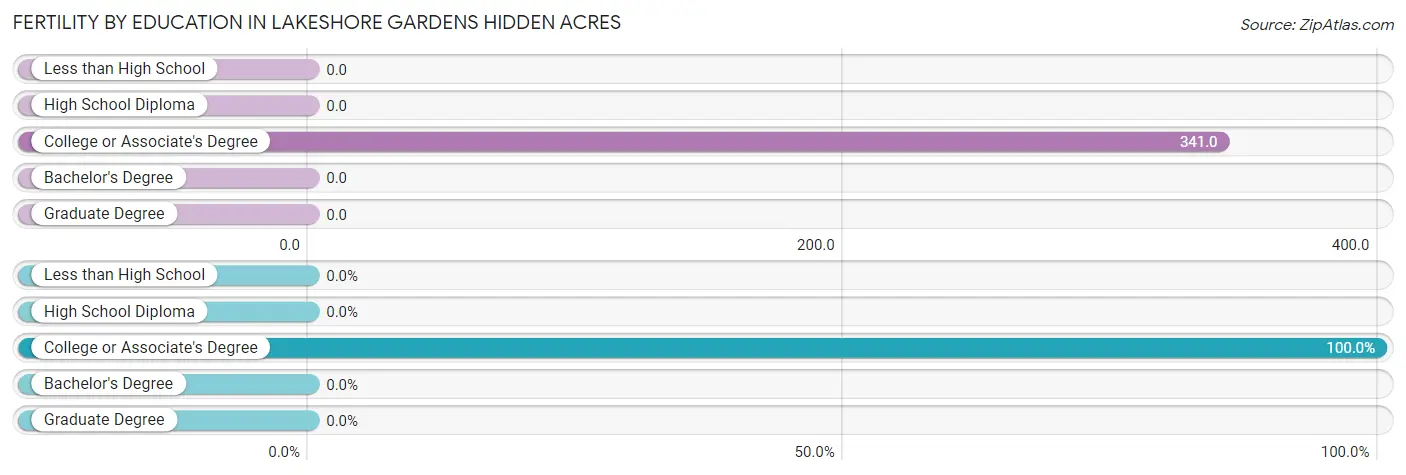
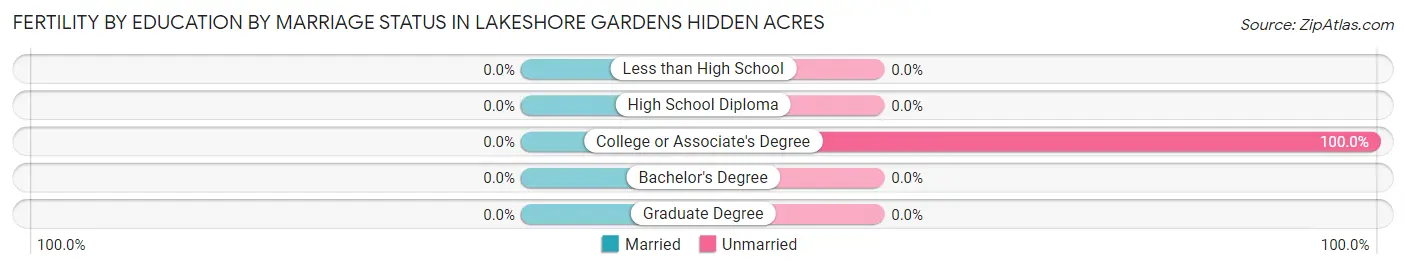
Fertility by Education in Lakeshore Gardens Hidden Acres
| Educational Attainment | Women with Births | Births / 1,000 Women |
| Less than High School | 0 (0.0%) | 0.0 |
| High School Diploma | 0 (0.0%) | 0.0 |
| College or Associate's Degree | 89 (100.0%) | 341.0 |
| Bachelor's Degree | 0 (0.0%) | 0.0 |
| Graduate Degree | 0 (0.0%) | 0.0 |
| Total | 89 (100.0%) | 203.0 |
Fertility by Education by Marriage Status in Lakeshore Gardens Hidden Acres
| Educational Attainment | Married | Unmarried |
| Less than High School | 0 (0.0%) | 0 (0.0%) |
| High School Diploma | 0 (0.0%) | 0 (0.0%) |
| College or Associate's Degree | 0 (0.0%) | 89 (100.0%) |
| Bachelor's Degree | 0 (0.0%) | 0 (0.0%) |
| Graduate Degree | 0 (0.0%) | 0 (0.0%) |
| Total | 0 (0.0%) | 89 (100.0%) |
Employment Characteristics in Lakeshore Gardens Hidden Acres
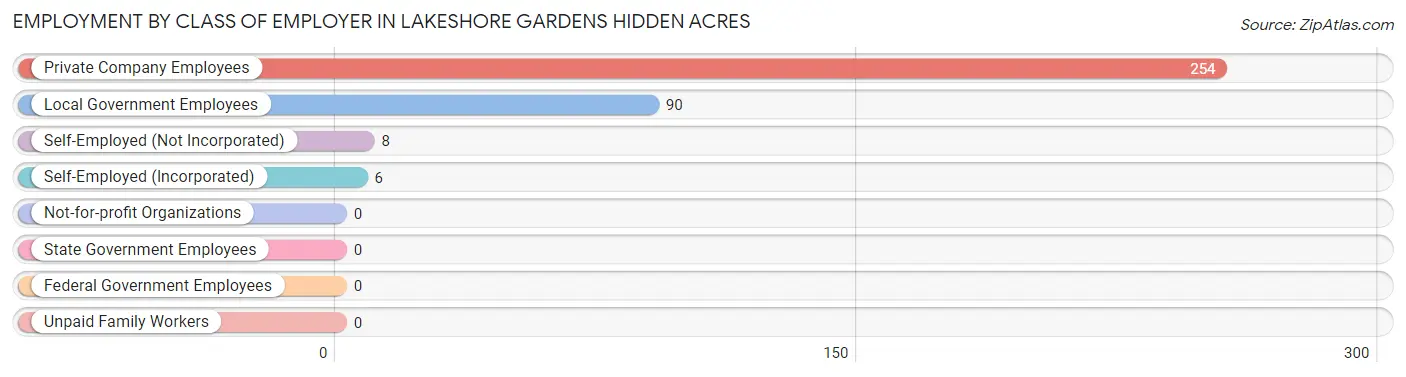
Employment by Class of Employer in Lakeshore Gardens Hidden Acres
Among the 358 employed individuals in Lakeshore Gardens Hidden Acres, private company employees (254 | 71.0%), local government employees (90 | 25.1%), and self-employed (not incorporated) (8 | 2.2%) make up the most common classes of employment.
| Employer Class | # Employees | % Employees |
| Private Company Employees | 254 | 71.0% |
| Self-Employed (Incorporated) | 6 | 1.7% |
| Self-Employed (Not Incorporated) | 8 | 2.2% |
| Not-for-profit Organizations | 0 | 0.0% |
| Local Government Employees | 90 | 25.1% |
| State Government Employees | 0 | 0.0% |
| Federal Government Employees | 0 | 0.0% |
| Unpaid Family Workers | 0 | 0.0% |
| Total | 358 | 100.0% |
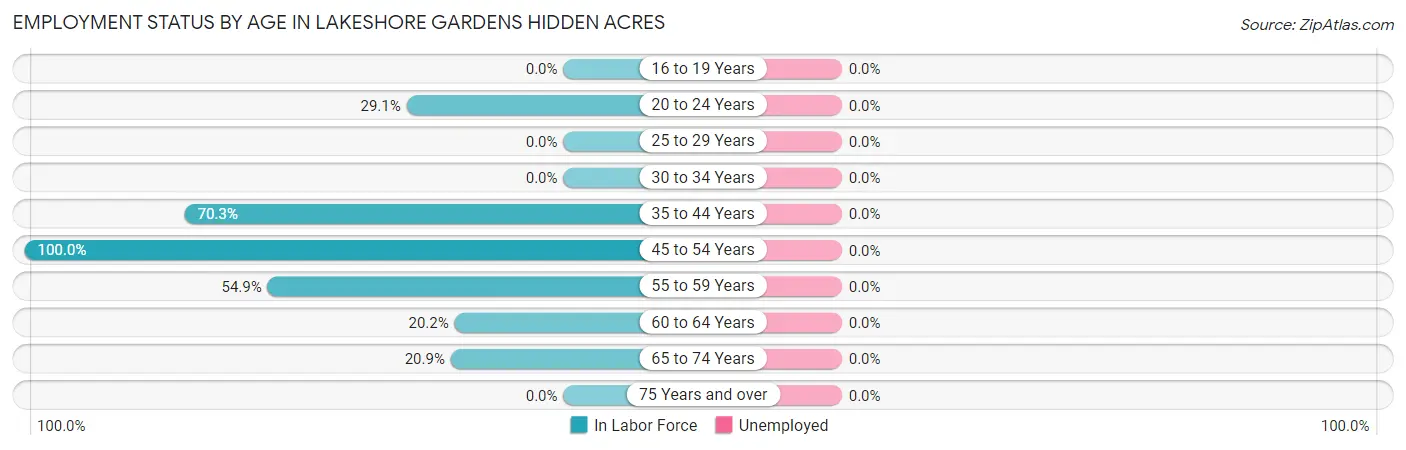
Employment Status by Age in Lakeshore Gardens Hidden Acres
| Age Bracket | In Labor Force | Unemployed |
| 16 to 19 Years | 0 (0.0%) | 0 (0.0%) |
| 20 to 24 Years | 73 (29.1%) | 0 (0.0%) |
| 25 to 29 Years | 0 (0.0%) | 0 (0.0%) |
| 30 to 34 Years | 0 (0.0%) | 0 (0.0%) |
| 35 to 44 Years | 130 (70.3%) | 0 (0.0%) |
| 45 to 54 Years | 72 (100.0%) | 0 (0.0%) |
| 55 to 59 Years | 45 (54.9%) | 0 (0.0%) |
| 60 to 64 Years | 24 (20.2%) | 0 (0.0%) |
| 65 to 74 Years | 14 (20.9%) | 0 (0.0%) |
| 75 Years and over | 0 (0.0%) | 0 (0.0%) |
| Total | 358 (33.8%) | 0 (0.0%) |
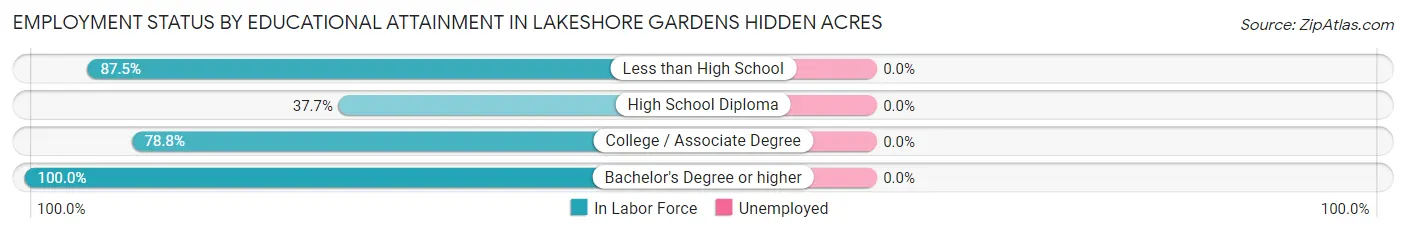
Employment Status by Educational Attainment in Lakeshore Gardens Hidden Acres
| Educational Attainment | In Labor Force | Unemployed |
| Less than High School | 63 (87.5%) | 0 (0.0%) |
| High School Diploma | 90 (37.7%) | 0 (0.0%) |
| College / Associate Degree | 108 (78.8%) | 0 (0.0%) |
| Bachelor's Degree or higher | 10 (100.0%) | 0 (0.0%) |
| Total | 271 (59.2%) | 0 (0.0%) |
Employment Occupations by Sex in Lakeshore Gardens Hidden Acres
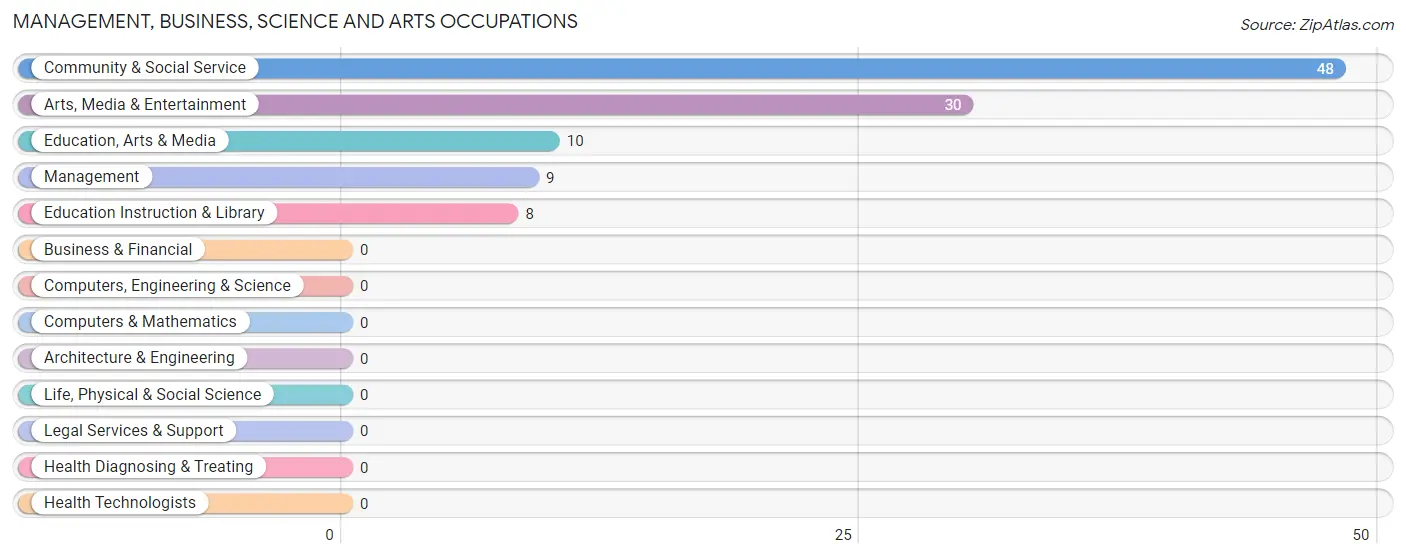
Management, Business, Science and Arts Occupations
The most common Management, Business, Science and Arts occupations in Lakeshore Gardens Hidden Acres are Community & Social Service (48 | 13.4%), Arts, Media & Entertainment (30 | 8.4%), Education, Arts & Media (10 | 2.8%), Management (9 | 2.5%), and Education Instruction & Library (8 | 2.2%).
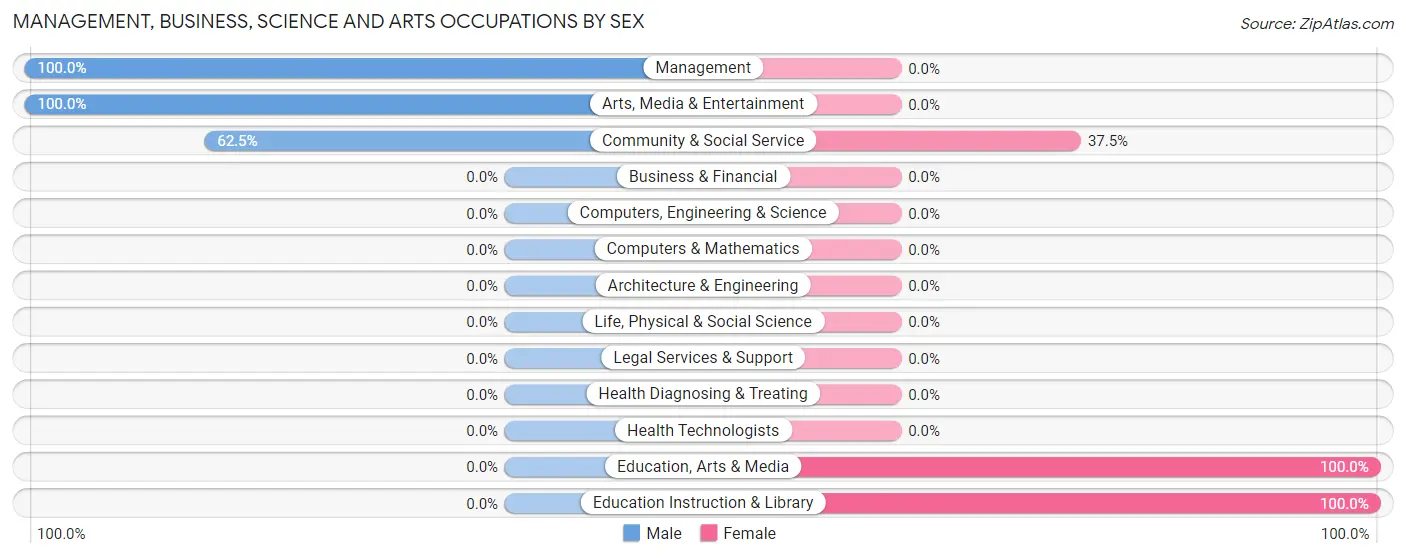
Management, Business, Science and Arts Occupations by Sex
Within the Management, Business, Science and Arts occupations in Lakeshore Gardens Hidden Acres, the most male-oriented occupations are Management (100.0%), Arts, Media & Entertainment (100.0%), and Community & Social Service (62.5%), while the most female-oriented occupations are Education, Arts & Media (100.0%), Education Instruction & Library (100.0%), and Community & Social Service (37.5%).
| Occupation | Male | Female |
| Management | 9 (100.0%) | 0 (0.0%) |
| Business & Financial | 0 (0.0%) | 0 (0.0%) |
| Computers, Engineering & Science | 0 (0.0%) | 0 (0.0%) |
| Computers & Mathematics | 0 (0.0%) | 0 (0.0%) |
| Architecture & Engineering | 0 (0.0%) | 0 (0.0%) |
| Life, Physical & Social Science | 0 (0.0%) | 0 (0.0%) |
| Community & Social Service | 30 (62.5%) | 18 (37.5%) |
| Education, Arts & Media | 0 (0.0%) | 10 (100.0%) |
| Legal Services & Support | 0 (0.0%) | 0 (0.0%) |
| Education Instruction & Library | 0 (0.0%) | 8 (100.0%) |
| Arts, Media & Entertainment | 30 (100.0%) | 0 (0.0%) |
| Health Diagnosing & Treating | 0 (0.0%) | 0 (0.0%) |
| Health Technologists | 0 (0.0%) | 0 (0.0%) |
| Total (Category) | 39 (68.4%) | 18 (31.6%) |
| Total (Overall) | 260 (72.6%) | 98 (27.4%) |
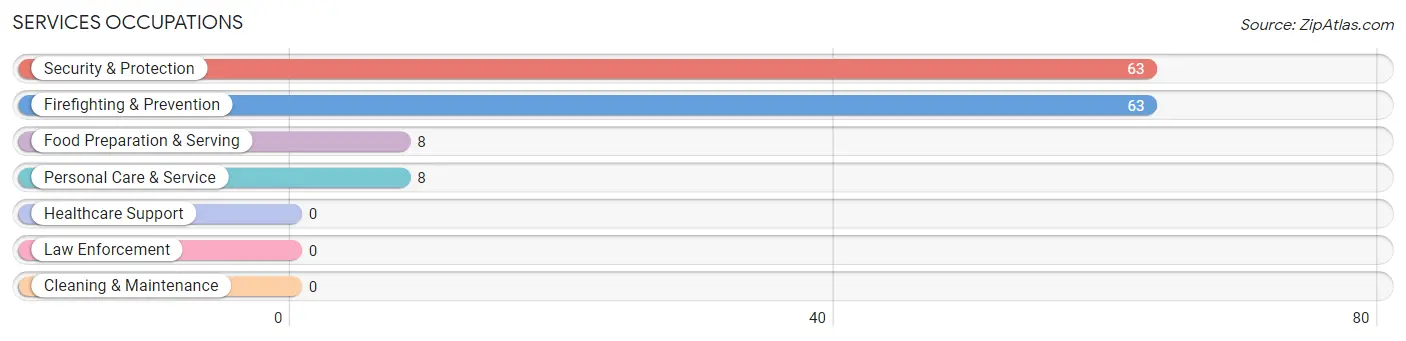
Services Occupations
The most common Services occupations in Lakeshore Gardens Hidden Acres are Security & Protection (63 | 17.6%), Firefighting & Prevention (63 | 17.6%), Food Preparation & Serving (8 | 2.2%), and Personal Care & Service (8 | 2.2%).
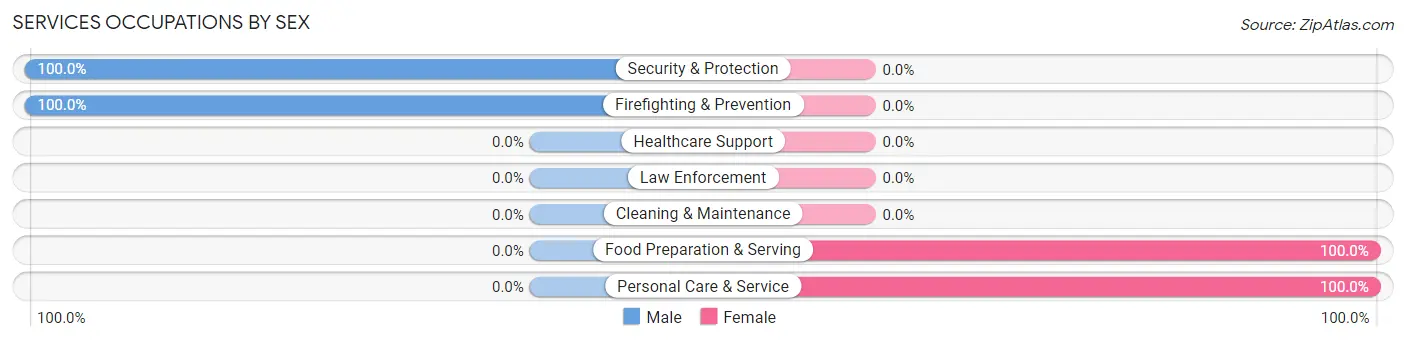
Services Occupations by Sex
Within the Services occupations in Lakeshore Gardens Hidden Acres, the most male-oriented occupations are Security & Protection (100.0%), and Firefighting & Prevention (100.0%), while the most female-oriented occupations are Food Preparation & Serving (100.0%), and Personal Care & Service (100.0%).
| Occupation | Male | Female |
| Healthcare Support | 0 (0.0%) | 0 (0.0%) |
| Security & Protection | 63 (100.0%) | 0 (0.0%) |
| Firefighting & Prevention | 63 (100.0%) | 0 (0.0%) |
| Law Enforcement | 0 (0.0%) | 0 (0.0%) |
| Food Preparation & Serving | 0 (0.0%) | 8 (100.0%) |
| Cleaning & Maintenance | 0 (0.0%) | 0 (0.0%) |
| Personal Care & Service | 0 (0.0%) | 8 (100.0%) |
| Total (Category) | 63 (79.7%) | 16 (20.3%) |
| Total (Overall) | 260 (72.6%) | 98 (27.4%) |
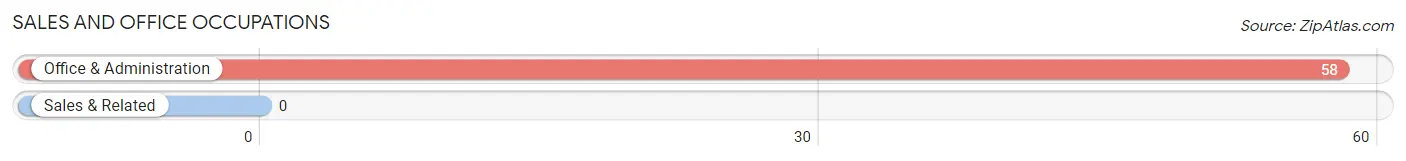
Sales and Office Occupations
The most common Sales and Office occupations in Lakeshore Gardens Hidden Acres are , and Office & Administration (58 | 16.2%).
Sales and Office Occupations by Sex
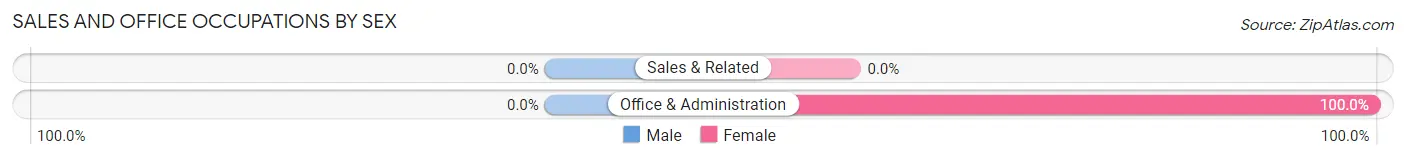
| Occupation | Male | Female |
| Sales & Related | 0 (0.0%) | 0 (0.0%) |
| Office & Administration | 0 (0.0%) | 58 (100.0%) |
| Total (Category) | 0 (0.0%) | 58 (100.0%) |
| Total (Overall) | 260 (72.6%) | 98 (27.4%) |
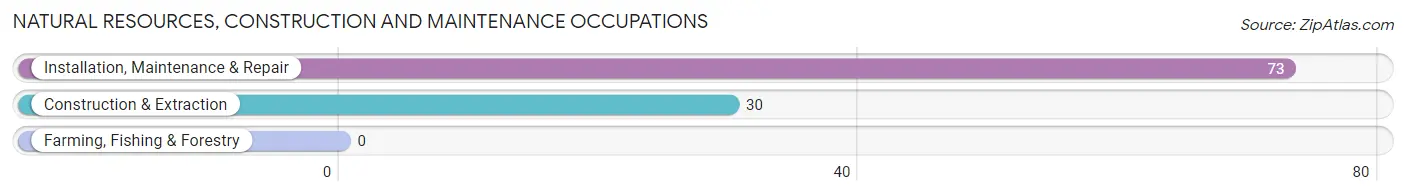
Natural Resources, Construction and Maintenance Occupations
The most common Natural Resources, Construction and Maintenance occupations in Lakeshore Gardens Hidden Acres are Installation, Maintenance & Repair (73 | 20.4%), and Construction & Extraction (30 | 8.4%).
Natural Resources, Construction and Maintenance Occupations by Sex
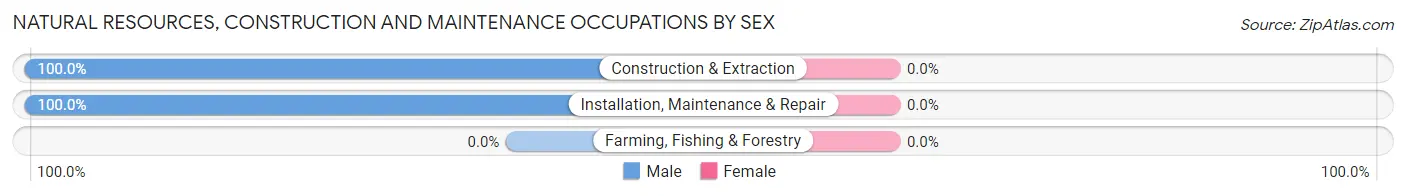
| Occupation | Male | Female |
| Farming, Fishing & Forestry | 0 (0.0%) | 0 (0.0%) |
| Construction & Extraction | 30 (100.0%) | 0 (0.0%) |
| Installation, Maintenance & Repair | 73 (100.0%) | 0 (0.0%) |
| Total (Category) | 103 (100.0%) | 0 (0.0%) |
| Total (Overall) | 260 (72.6%) | 98 (27.4%) |
Production, Transportation and Moving Occupations
The most common Production, Transportation and Moving occupations in Lakeshore Gardens Hidden Acres are , and Transportation (61 | 17.0%).
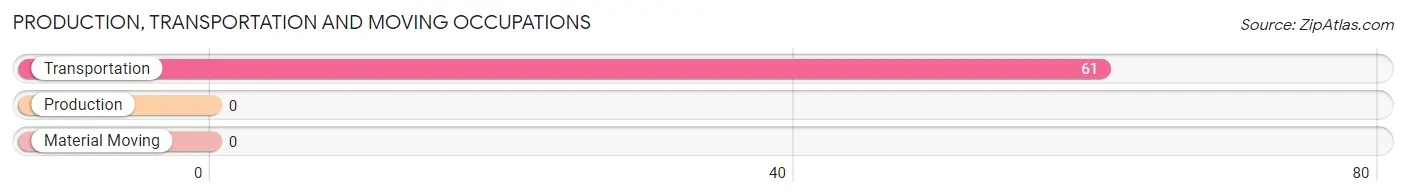
Production, Transportation and Moving Occupations by Sex
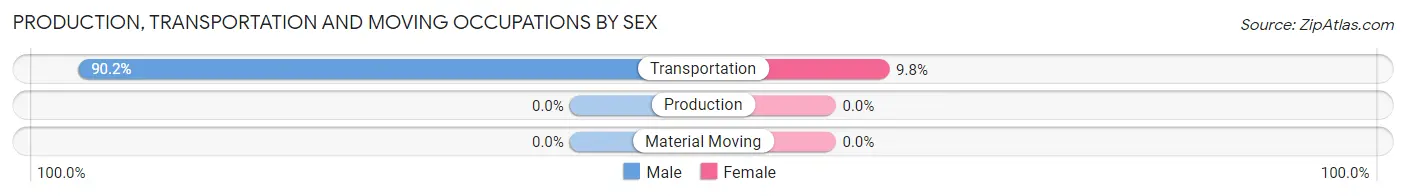
| Occupation | Male | Female |
| Production | 0 (0.0%) | 0 (0.0%) |
| Transportation | 55 (90.2%) | 6 (9.8%) |
| Material Moving | 0 (0.0%) | 0 (0.0%) |
| Total (Category) | 55 (90.2%) | 6 (9.8%) |
| Total (Overall) | 260 (72.6%) | 98 (27.4%) |
Employment Industries by Sex in Lakeshore Gardens Hidden Acres
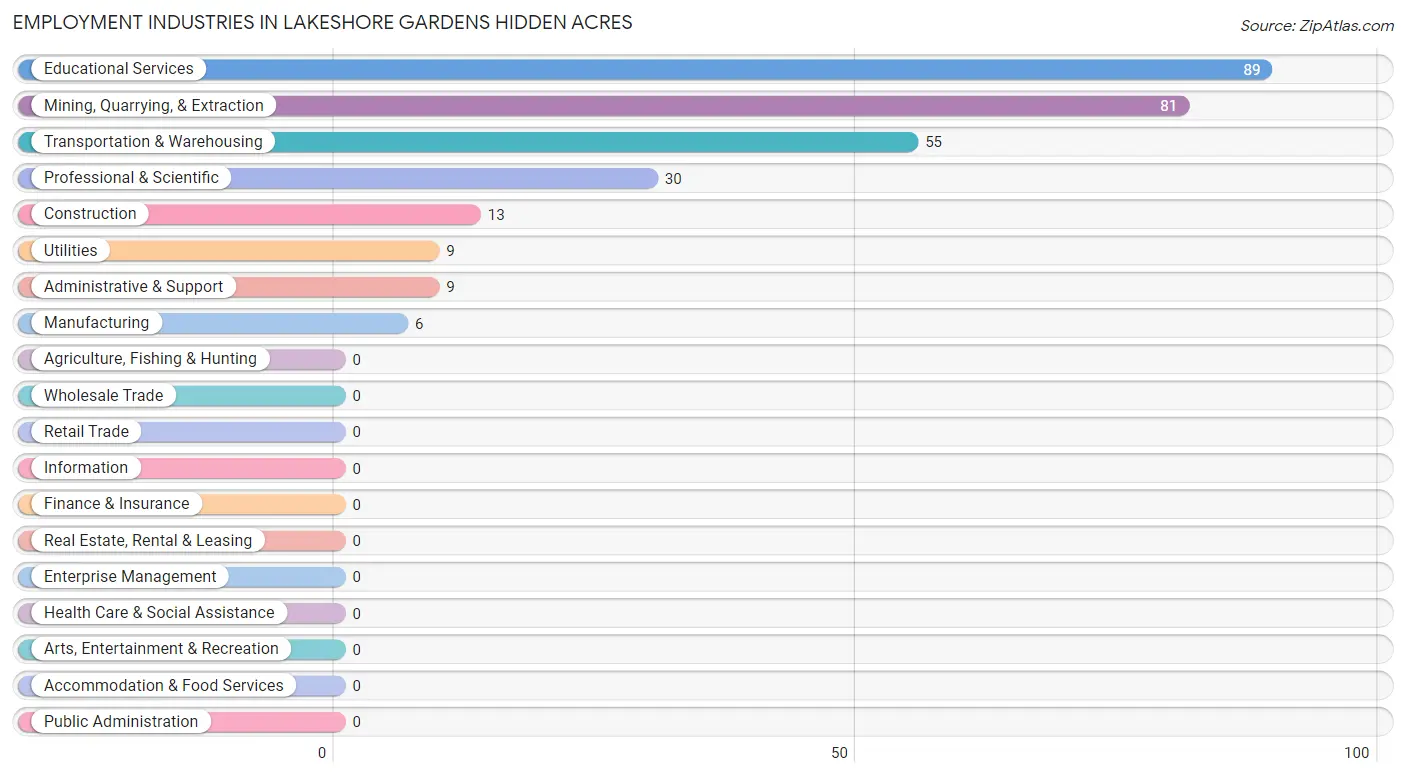
Employment Industries in Lakeshore Gardens Hidden Acres
The major employment industries in Lakeshore Gardens Hidden Acres include Educational Services (89 | 24.9%), Mining, Quarrying, & Extraction (81 | 22.6%), Transportation & Warehousing (55 | 15.4%), Professional & Scientific (30 | 8.4%), and Construction (13 | 3.6%).
Employment Industries by Sex in Lakeshore Gardens Hidden Acres
The Lakeshore Gardens Hidden Acres industries that see more men than women are Mining, Quarrying, & Extraction (100.0%), Construction (100.0%), and Transportation & Warehousing (100.0%), whereas the industries that tend to have a higher number of women are Manufacturing (100.0%), and Educational Services (29.2%).
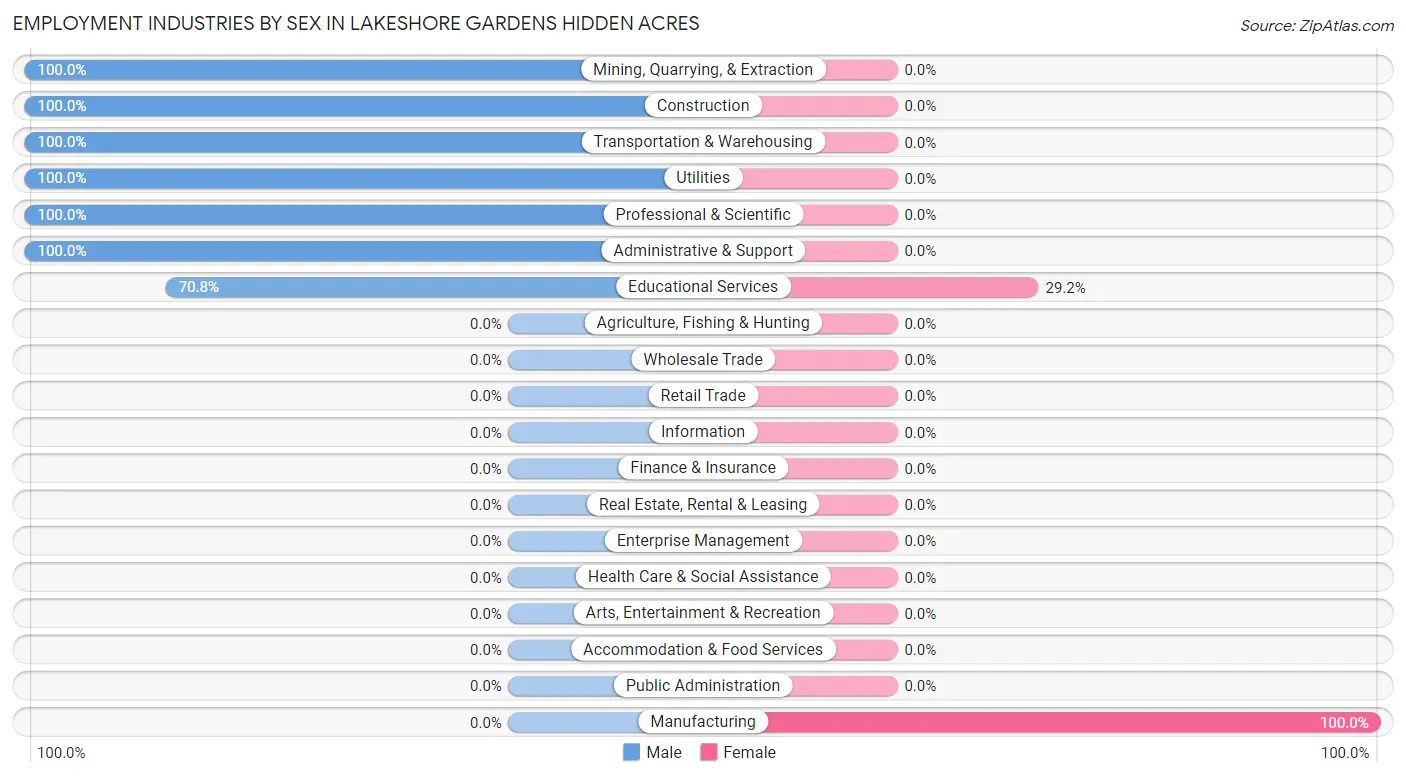
| Industry | Male | Female |
| Agriculture, Fishing & Hunting | 0 (0.0%) | 0 (0.0%) |
| Mining, Quarrying, & Extraction | 81 (100.0%) | 0 (0.0%) |
| Construction | 13 (100.0%) | 0 (0.0%) |
| Manufacturing | 0 (0.0%) | 6 (100.0%) |
| Wholesale Trade | 0 (0.0%) | 0 (0.0%) |
| Retail Trade | 0 (0.0%) | 0 (0.0%) |
| Transportation & Warehousing | 55 (100.0%) | 0 (0.0%) |
| Utilities | 9 (100.0%) | 0 (0.0%) |
| Information | 0 (0.0%) | 0 (0.0%) |
| Finance & Insurance | 0 (0.0%) | 0 (0.0%) |
| Real Estate, Rental & Leasing | 0 (0.0%) | 0 (0.0%) |
| Professional & Scientific | 30 (100.0%) | 0 (0.0%) |
| Enterprise Management | 0 (0.0%) | 0 (0.0%) |
| Administrative & Support | 9 (100.0%) | 0 (0.0%) |
| Educational Services | 63 (70.8%) | 26 (29.2%) |
| Health Care & Social Assistance | 0 (0.0%) | 0 (0.0%) |
| Arts, Entertainment & Recreation | 0 (0.0%) | 0 (0.0%) |
| Accommodation & Food Services | 0 (0.0%) | 0 (0.0%) |
| Public Administration | 0 (0.0%) | 0 (0.0%) |
| Total | 260 (72.6%) | 98 (27.4%) |
Education in Lakeshore Gardens Hidden Acres
School Enrollment in Lakeshore Gardens Hidden Acres
The most common levels of schooling among the 405 students in Lakeshore Gardens Hidden Acres are college / undergraduate (253 | 62.5%), high school (142 | 35.1%), and middle school (10 | 2.5%).
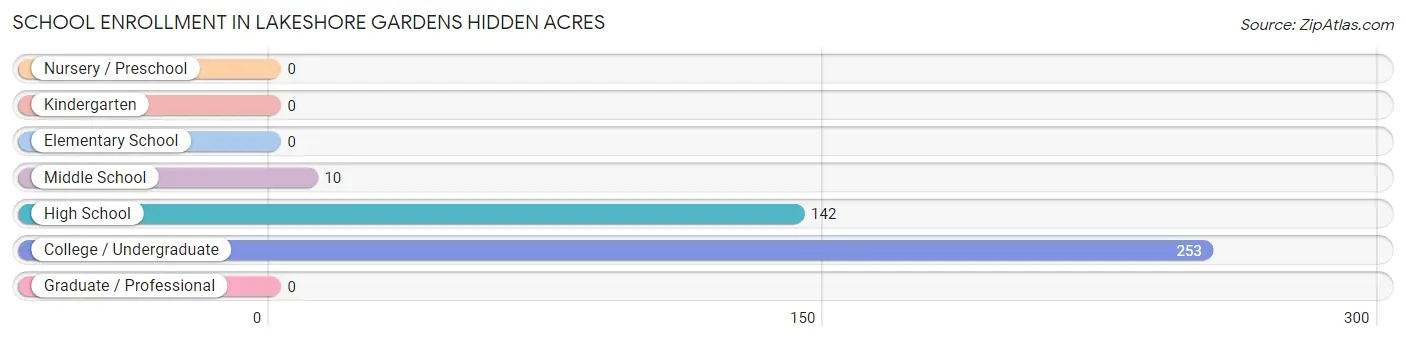
| School Level | # Students | % Students |
| Nursery / Preschool | 0 | 0.0% |
| Kindergarten | 0 | 0.0% |
| Elementary School | 0 | 0.0% |
| Middle School | 10 | 2.5% |
| High School | 142 | 35.1% |
| College / Undergraduate | 253 | 62.5% |
| Graduate / Professional | 0 | 0.0% |
| Total | 405 | 100.0% |
School Enrollment by Age by Funding Source in Lakeshore Gardens Hidden Acres
Out of a total of 405 students who are enrolled in schools in Lakeshore Gardens Hidden Acres, 10 (2.5%) attend a private institution, while the remaining 395 (97.5%) are enrolled in public schools. The age group of 10 to 14 year olds has the highest likelihood of being enrolled in private schools, with 10 (100.0% in the age bracket) enrolled. Conversely, the age group of 15 to 17 year olds has the lowest likelihood of being enrolled in a private school, with 127 (100.0% in the age bracket) attending a public institution.
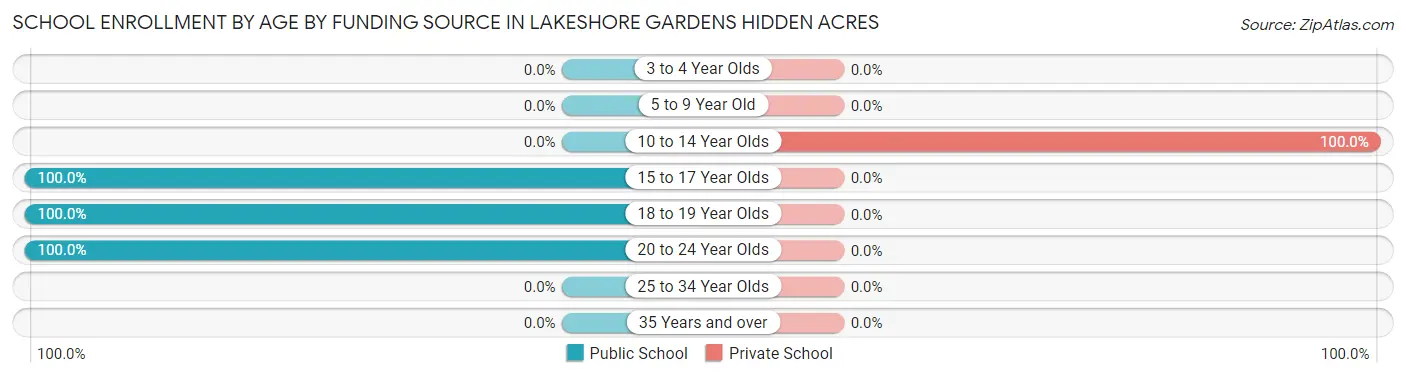
| Age Bracket | Public School | Private School |
| 3 to 4 Year Olds | 0 (0.0%) | 0 (0.0%) |
| 5 to 9 Year Old | 0 (0.0%) | 0 (0.0%) |
| 10 to 14 Year Olds | 0 (0.0%) | 10 (100.0%) |
| 15 to 17 Year Olds | 127 (100.0%) | 0 (0.0%) |
| 18 to 19 Year Olds | 90 (100.0%) | 0 (0.0%) |
| 20 to 24 Year Olds | 178 (100.0%) | 0 (0.0%) |
| 25 to 34 Year Olds | 0 (0.0%) | 0 (0.0%) |
| 35 Years and over | 0 (0.0%) | 0 (0.0%) |
| Total | 395 (97.5%) | 10 (2.5%) |
Educational Attainment by Field of Study in Lakeshore Gardens Hidden Acres
Education (19 | 65.5%), and multidisciplinary studies (10 | 34.5%) are the most common fields of study among 29 individuals in Lakeshore Gardens Hidden Acres who have obtained a bachelor's degree or higher.
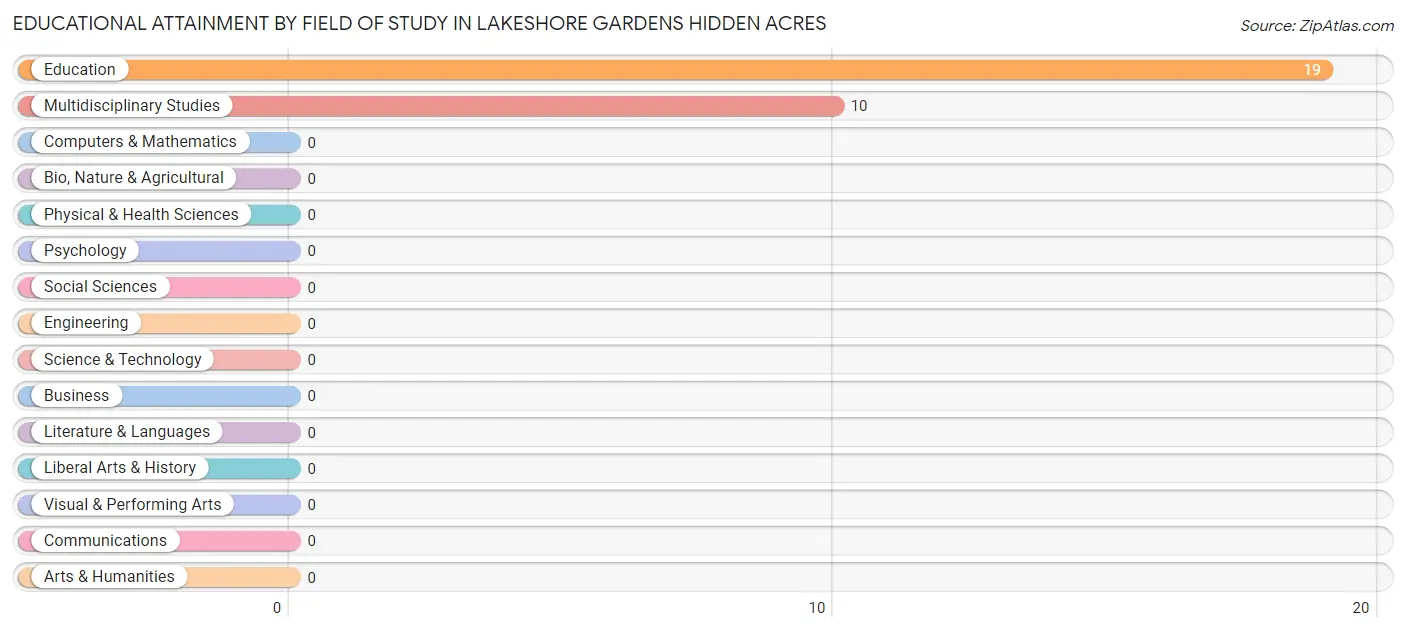
| Field of Study | # Graduates | % Graduates |
| Computers & Mathematics | 0 | 0.0% |
| Bio, Nature & Agricultural | 0 | 0.0% |
| Physical & Health Sciences | 0 | 0.0% |
| Psychology | 0 | 0.0% |
| Social Sciences | 0 | 0.0% |
| Engineering | 0 | 0.0% |
| Multidisciplinary Studies | 10 | 34.5% |
| Science & Technology | 0 | 0.0% |
| Business | 0 | 0.0% |
| Education | 19 | 65.5% |
| Literature & Languages | 0 | 0.0% |
| Liberal Arts & History | 0 | 0.0% |
| Visual & Performing Arts | 0 | 0.0% |
| Communications | 0 | 0.0% |
| Arts & Humanities | 0 | 0.0% |
| Total | 29 | 100.0% |
Transportation & Commute in Lakeshore Gardens Hidden Acres
Vehicle Availability by Sex in Lakeshore Gardens Hidden Acres
The most prevalent vehicle ownership categories in Lakeshore Gardens Hidden Acres are males with 4 vehicles (141, accounting for 54.2%) and females with 4 vehicles (64, making up 143.9%).
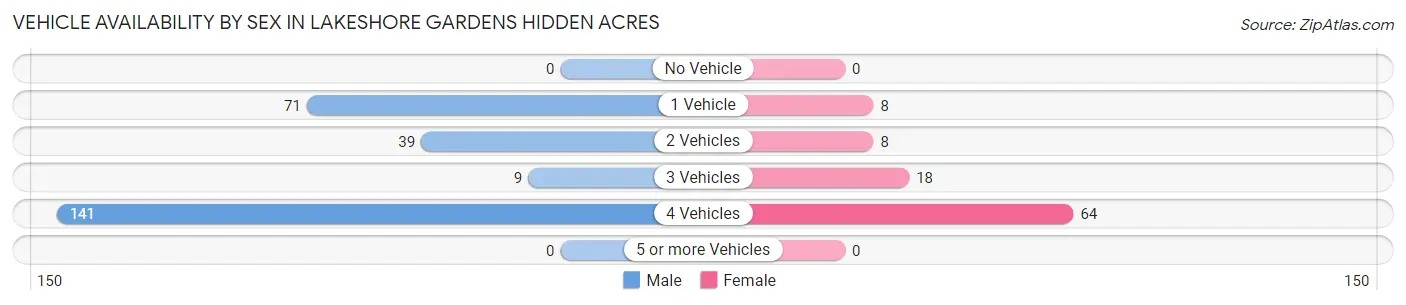
| Vehicles Available | Male | Female |
| No Vehicle | 0 (0.0%) | 0 (0.0%) |
| 1 Vehicle | 71 (27.3%) | 8 (8.2%) |
| 2 Vehicles | 39 (15.0%) | 8 (8.2%) |
| 3 Vehicles | 9 (3.5%) | 18 (18.4%) |
| 4 Vehicles | 141 (54.2%) | 64 (65.3%) |
| 5 or more Vehicles | 0 (0.0%) | 0 (0.0%) |
| Total | 260 (100.0%) | 98 (100.0%) |
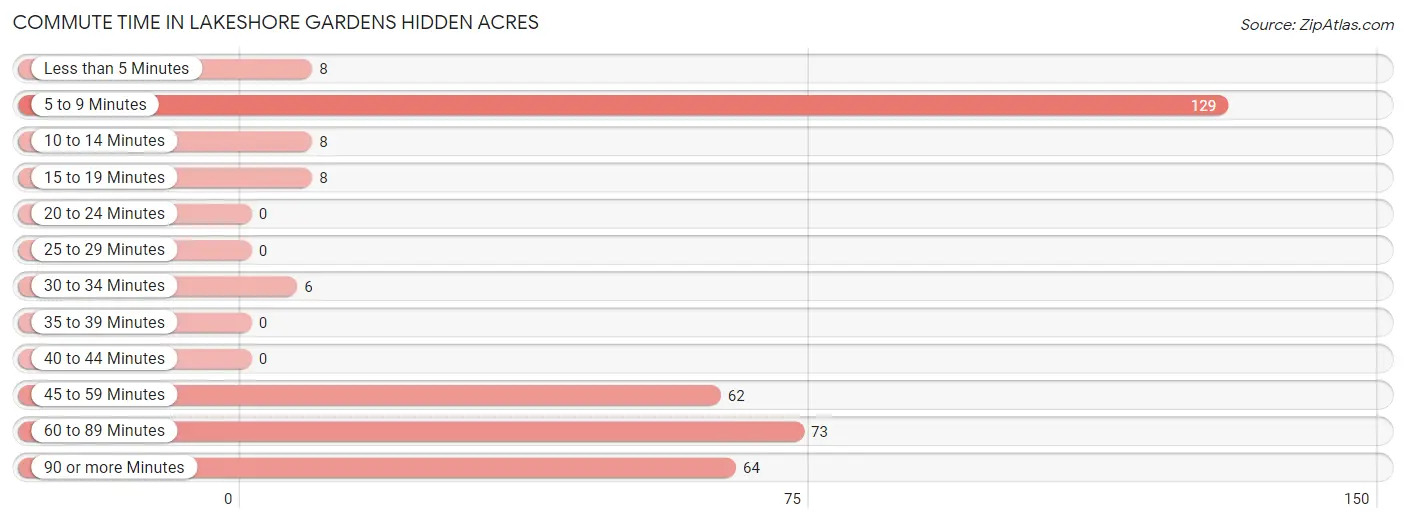
Commute Time in Lakeshore Gardens Hidden Acres
The most frequently occuring commute durations in Lakeshore Gardens Hidden Acres are 5 to 9 minutes (129 commuters, 36.0%), 60 to 89 minutes (73 commuters, 20.4%), and 90 or more minutes (64 commuters, 17.9%).
| Commute Time | # Commuters | % Commuters |
| Less than 5 Minutes | 8 | 2.2% |
| 5 to 9 Minutes | 129 | 36.0% |
| 10 to 14 Minutes | 8 | 2.2% |
| 15 to 19 Minutes | 8 | 2.2% |
| 20 to 24 Minutes | 0 | 0.0% |
| 25 to 29 Minutes | 0 | 0.0% |
| 30 to 34 Minutes | 6 | 1.7% |
| 35 to 39 Minutes | 0 | 0.0% |
| 40 to 44 Minutes | 0 | 0.0% |
| 45 to 59 Minutes | 62 | 17.3% |
| 60 to 89 Minutes | 73 | 20.4% |
| 90 or more Minutes | 64 | 17.9% |
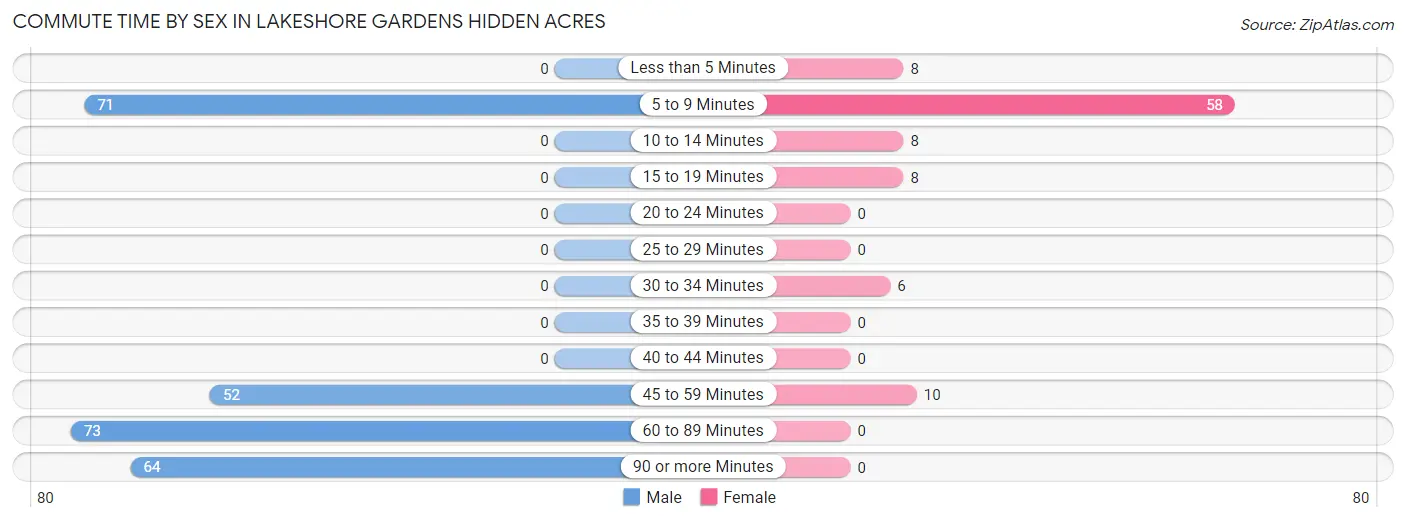
Commute Time by Sex in Lakeshore Gardens Hidden Acres
The most common commute times in Lakeshore Gardens Hidden Acres are 60 to 89 minutes (73 commuters, 28.1%) for males and 5 to 9 minutes (58 commuters, 59.2%) for females.
| Commute Time | Male | Female |
| Less than 5 Minutes | 0 (0.0%) | 8 (8.2%) |
| 5 to 9 Minutes | 71 (27.3%) | 58 (59.2%) |
| 10 to 14 Minutes | 0 (0.0%) | 8 (8.2%) |
| 15 to 19 Minutes | 0 (0.0%) | 8 (8.2%) |
| 20 to 24 Minutes | 0 (0.0%) | 0 (0.0%) |
| 25 to 29 Minutes | 0 (0.0%) | 0 (0.0%) |
| 30 to 34 Minutes | 0 (0.0%) | 6 (6.1%) |
| 35 to 39 Minutes | 0 (0.0%) | 0 (0.0%) |
| 40 to 44 Minutes | 0 (0.0%) | 0 (0.0%) |
| 45 to 59 Minutes | 52 (20.0%) | 10 (10.2%) |
| 60 to 89 Minutes | 73 (28.1%) | 0 (0.0%) |
| 90 or more Minutes | 64 (24.6%) | 0 (0.0%) |
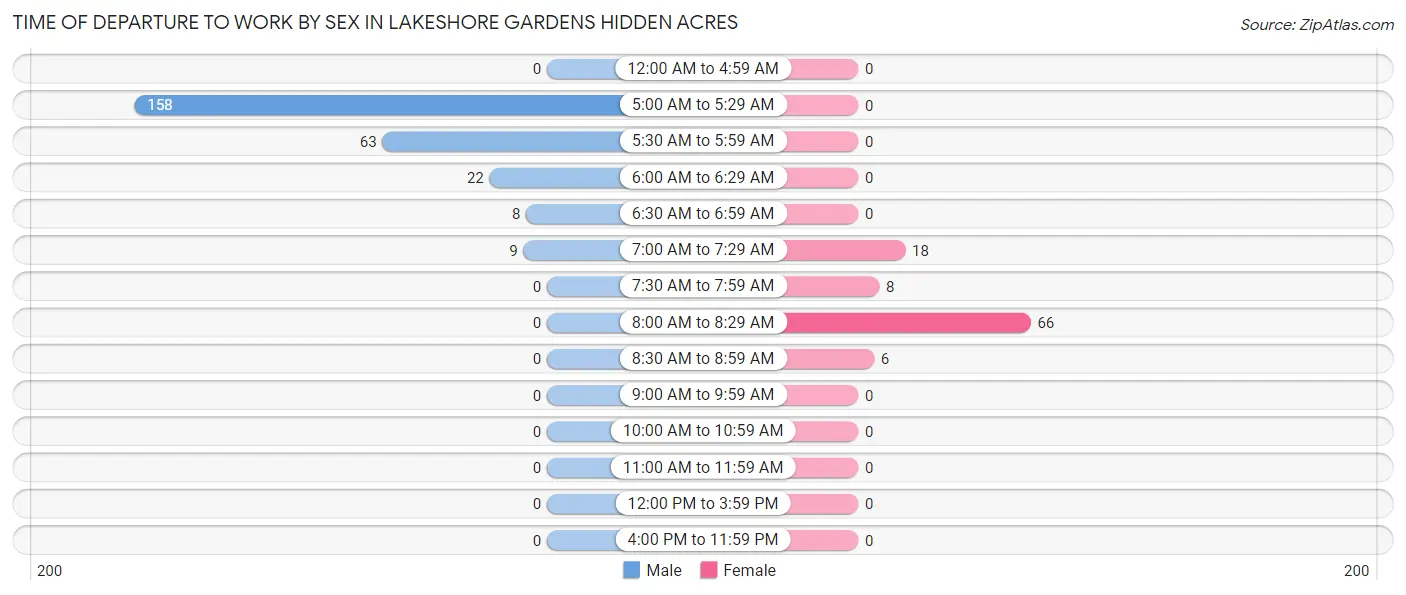
Time of Departure to Work by Sex in Lakeshore Gardens Hidden Acres
The most frequent times of departure to work in Lakeshore Gardens Hidden Acres are 5:00 AM to 5:29 AM (158, 60.8%) for males and 8:00 AM to 8:29 AM (66, 67.3%) for females.
| Time of Departure | Male | Female |
| 12:00 AM to 4:59 AM | 0 (0.0%) | 0 (0.0%) |
| 5:00 AM to 5:29 AM | 158 (60.8%) | 0 (0.0%) |
| 5:30 AM to 5:59 AM | 63 (24.2%) | 0 (0.0%) |
| 6:00 AM to 6:29 AM | 22 (8.5%) | 0 (0.0%) |
| 6:30 AM to 6:59 AM | 8 (3.1%) | 0 (0.0%) |
| 7:00 AM to 7:29 AM | 9 (3.5%) | 18 (18.4%) |
| 7:30 AM to 7:59 AM | 0 (0.0%) | 8 (8.2%) |
| 8:00 AM to 8:29 AM | 0 (0.0%) | 66 (67.3%) |
| 8:30 AM to 8:59 AM | 0 (0.0%) | 6 (6.1%) |
| 9:00 AM to 9:59 AM | 0 (0.0%) | 0 (0.0%) |
| 10:00 AM to 10:59 AM | 0 (0.0%) | 0 (0.0%) |
| 11:00 AM to 11:59 AM | 0 (0.0%) | 0 (0.0%) |
| 12:00 PM to 3:59 PM | 0 (0.0%) | 0 (0.0%) |
| 4:00 PM to 11:59 PM | 0 (0.0%) | 0 (0.0%) |
| Total | 260 (100.0%) | 98 (100.0%) |
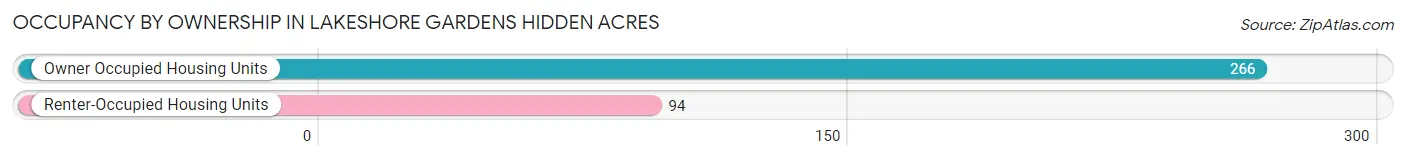
Housing Occupancy in Lakeshore Gardens Hidden Acres
Occupancy by Ownership in Lakeshore Gardens Hidden Acres
Of the total 360 dwellings in Lakeshore Gardens Hidden Acres, owner-occupied units account for 266 (73.9%), while renter-occupied units make up 94 (26.1%).
| Occupancy | # Housing Units | % Housing Units |
| Owner Occupied Housing Units | 266 | 73.9% |
| Renter-Occupied Housing Units | 94 | 26.1% |
| Total Occupied Housing Units | 360 | 100.0% |
Occupancy by Household Size in Lakeshore Gardens Hidden Acres
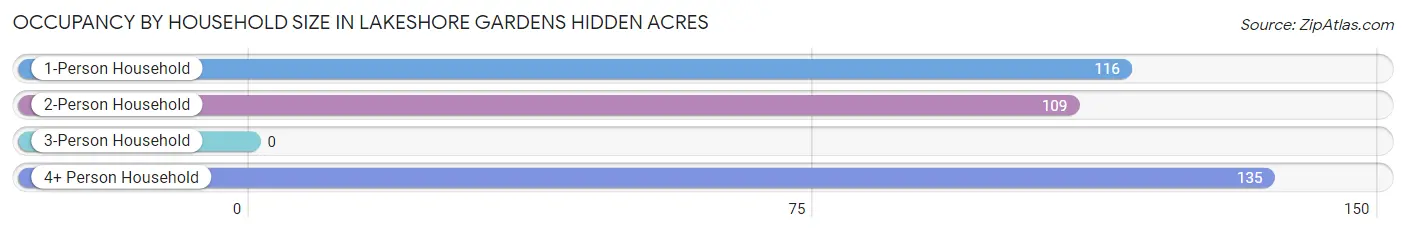
| Household Size | # Housing Units | % Housing Units |
| 1-Person Household | 116 | 32.2% |
| 2-Person Household | 109 | 30.3% |
| 3-Person Household | 0 | 0.0% |
| 4+ Person Household | 135 | 37.5% |
| Total Housing Units | 360 | 100.0% |
Occupancy by Ownership by Household Size in Lakeshore Gardens Hidden Acres
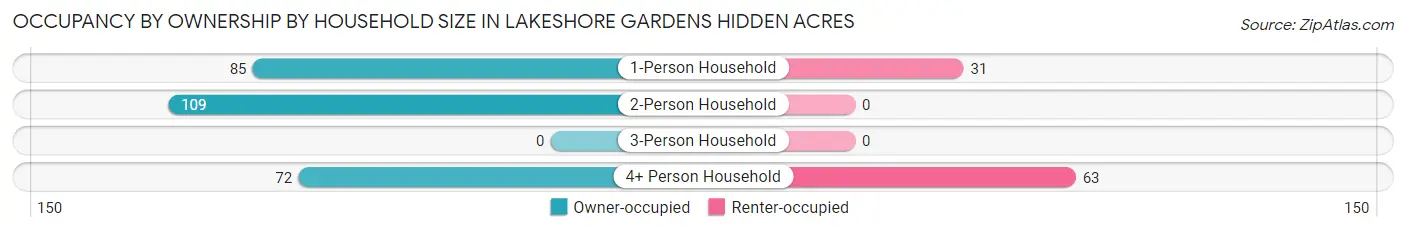
| Household Size | Owner-occupied | Renter-occupied |
| 1-Person Household | 85 (73.3%) | 31 (26.7%) |
| 2-Person Household | 109 (100.0%) | 0 (0.0%) |
| 3-Person Household | 0 (0.0%) | 0 (0.0%) |
| 4+ Person Household | 72 (53.3%) | 63 (46.7%) |
| Total Housing Units | 266 (73.9%) | 94 (26.1%) |
Occupancy by Educational Attainment in Lakeshore Gardens Hidden Acres
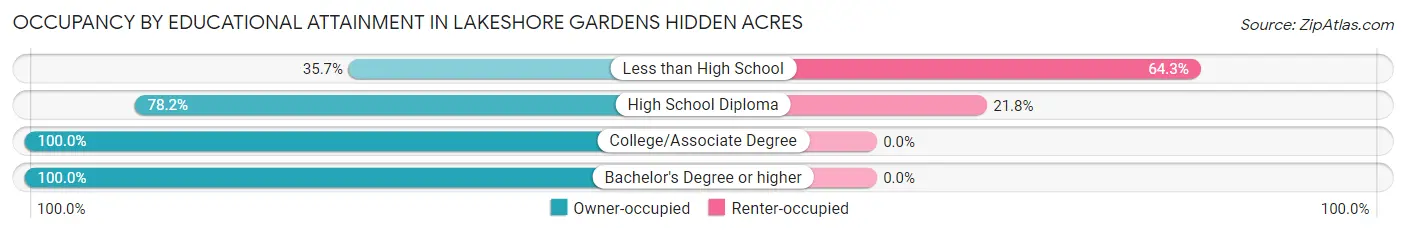
| Household Size | Owner-occupied | Renter-occupied |
| Less than High School | 35 (35.7%) | 63 (64.3%) |
| High School Diploma | 111 (78.2%) | 31 (21.8%) |
| College/Associate Degree | 91 (100.0%) | 0 (0.0%) |
| Bachelor's Degree or higher | 29 (100.0%) | 0 (0.0%) |
Occupancy by Age of Householder in Lakeshore Gardens Hidden Acres
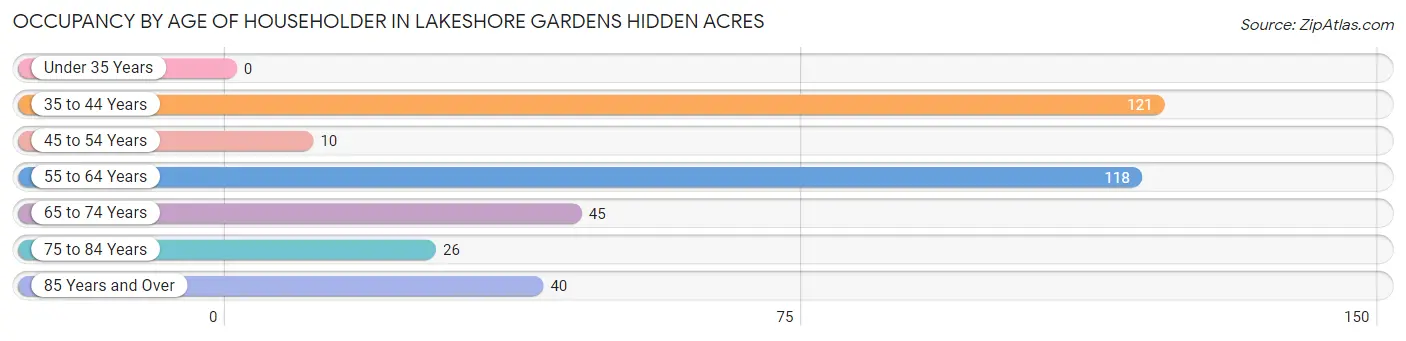
| Age Bracket | # Households | % Households |
| Under 35 Years | 0 | 0.0% |
| 35 to 44 Years | 121 | 33.6% |
| 45 to 54 Years | 10 | 2.8% |
| 55 to 64 Years | 118 | 32.8% |
| 65 to 74 Years | 45 | 12.5% |
| 75 to 84 Years | 26 | 7.2% |
| 85 Years and Over | 40 | 11.1% |
| Total | 360 | 100.0% |
Housing Finances in Lakeshore Gardens Hidden Acres
Median Income by Occupancy in Lakeshore Gardens Hidden Acres
| Occupancy Type | # Households | Median Income |
| Owner-Occupied | 266 (73.9%) | $0 |
| Renter-Occupied | 94 (26.1%) | $0 |
| Average | 360 (100.0%) | $0 |
Occupancy by Householder Income Bracket in Lakeshore Gardens Hidden Acres
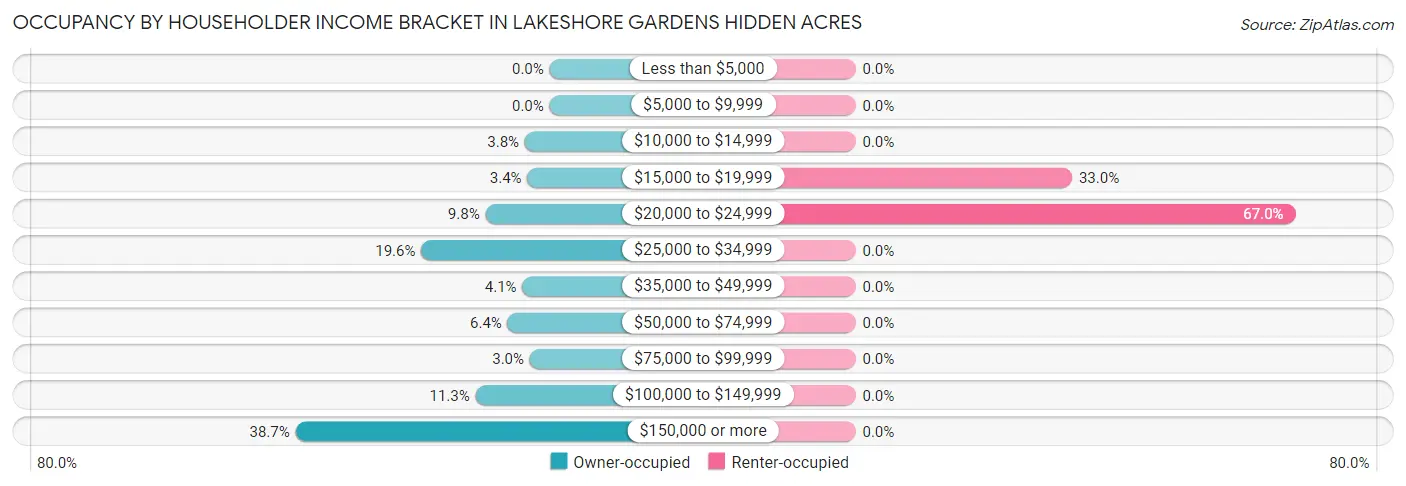
| Income Bracket | Owner-occupied | Renter-occupied |
| Less than $5,000 | 0 (0.0%) | 0 (0.0%) |
| $5,000 to $9,999 | 0 (0.0%) | 0 (0.0%) |
| $10,000 to $14,999 | 10 (3.8%) | 0 (0.0%) |
| $15,000 to $19,999 | 9 (3.4%) | 31 (33.0%) |
| $20,000 to $24,999 | 26 (9.8%) | 63 (67.0%) |
| $25,000 to $34,999 | 52 (19.6%) | 0 (0.0%) |
| $35,000 to $49,999 | 11 (4.1%) | 0 (0.0%) |
| $50,000 to $74,999 | 17 (6.4%) | 0 (0.0%) |
| $75,000 to $99,999 | 8 (3.0%) | 0 (0.0%) |
| $100,000 to $149,999 | 30 (11.3%) | 0 (0.0%) |
| $150,000 or more | 103 (38.7%) | 0 (0.0%) |
| Total | 266 (100.0%) | 94 (100.0%) |
Monthly Housing Cost Tiers in Lakeshore Gardens Hidden Acres
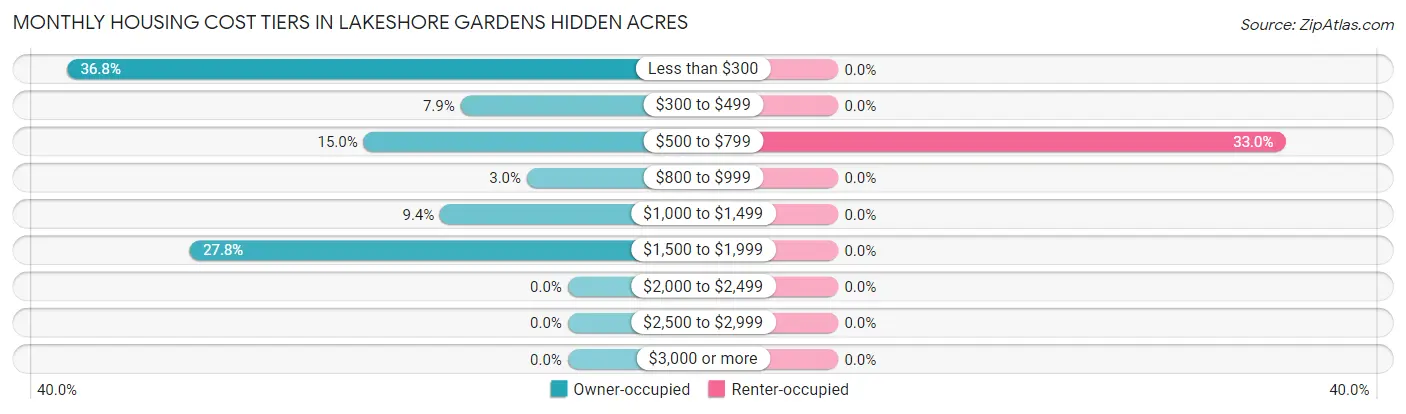
| Monthly Cost | Owner-occupied | Renter-occupied |
| Less than $300 | 98 (36.8%) | 0 (0.0%) |
| $300 to $499 | 21 (7.9%) | 0 (0.0%) |
| $500 to $799 | 40 (15.0%) | 31 (33.0%) |
| $800 to $999 | 8 (3.0%) | 0 (0.0%) |
| $1,000 to $1,499 | 25 (9.4%) | 0 (0.0%) |
| $1,500 to $1,999 | 74 (27.8%) | 0 (0.0%) |
| $2,000 to $2,499 | 0 (0.0%) | 0 (0.0%) |
| $2,500 to $2,999 | 0 (0.0%) | 0 (0.0%) |
| $3,000 or more | 0 (0.0%) | 0 (0.0%) |
| Total | 266 (100.0%) | 94 (100.0%) |
Physical Housing Characteristics in Lakeshore Gardens Hidden Acres
Housing Structures in Lakeshore Gardens Hidden Acres
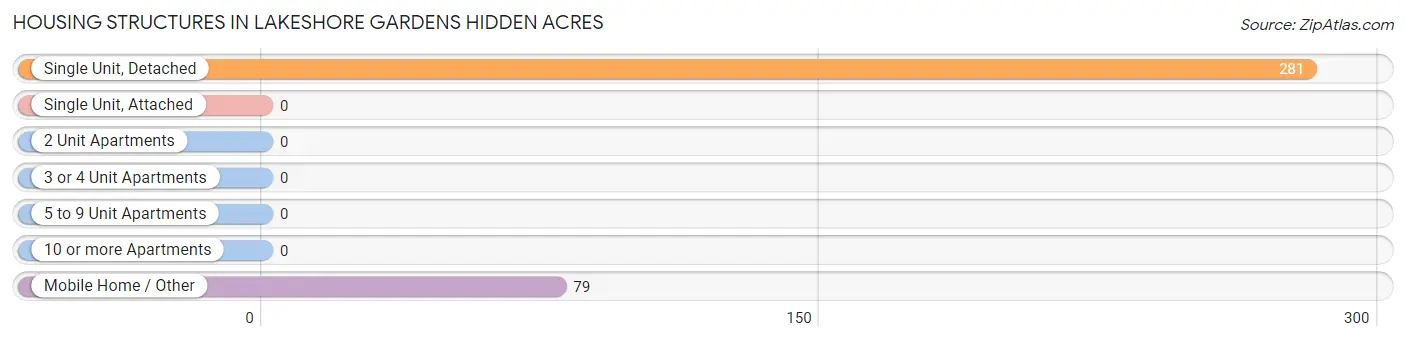
| Structure Type | # Housing Units | % Housing Units |
| Single Unit, Detached | 281 | 78.1% |
| Single Unit, Attached | 0 | 0.0% |
| 2 Unit Apartments | 0 | 0.0% |
| 3 or 4 Unit Apartments | 0 | 0.0% |
| 5 to 9 Unit Apartments | 0 | 0.0% |
| 10 or more Apartments | 0 | 0.0% |
| Mobile Home / Other | 79 | 21.9% |
| Total | 360 | 100.0% |
Housing Structures by Occupancy in Lakeshore Gardens Hidden Acres
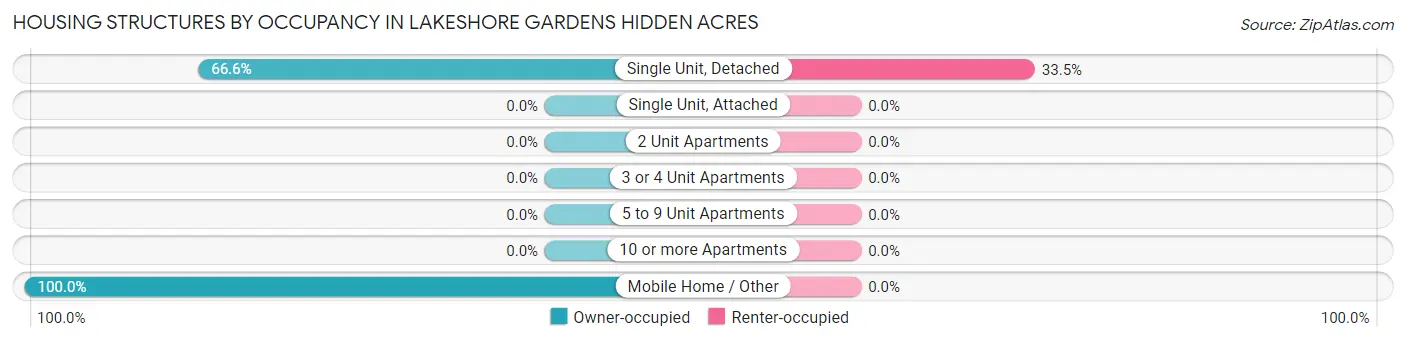
| Structure Type | Owner-occupied | Renter-occupied |
| Single Unit, Detached | 187 (66.5%) | 94 (33.5%) |
| Single Unit, Attached | 0 (0.0%) | 0 (0.0%) |
| 2 Unit Apartments | 0 (0.0%) | 0 (0.0%) |
| 3 or 4 Unit Apartments | 0 (0.0%) | 0 (0.0%) |
| 5 to 9 Unit Apartments | 0 (0.0%) | 0 (0.0%) |
| 10 or more Apartments | 0 (0.0%) | 0 (0.0%) |
| Mobile Home / Other | 79 (100.0%) | 0 (0.0%) |
| Total | 266 (73.9%) | 94 (26.1%) |
Housing Structures by Number of Rooms in Lakeshore Gardens Hidden Acres
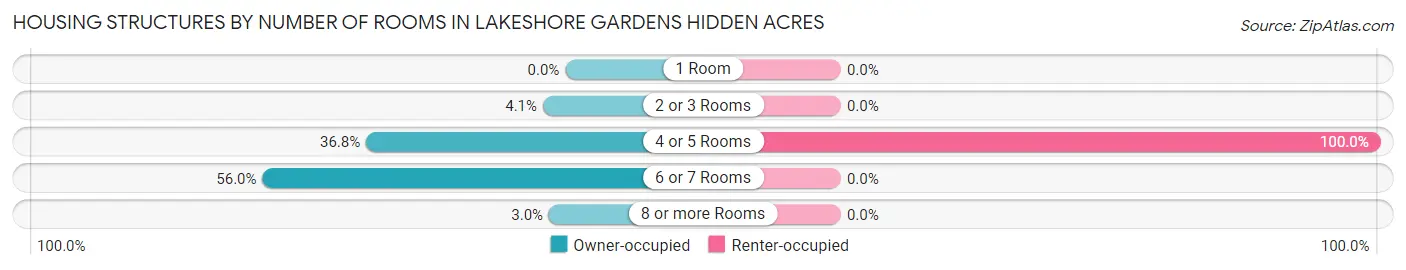
| Number of Rooms | Owner-occupied | Renter-occupied |
| 1 Room | 0 (0.0%) | 0 (0.0%) |
| 2 or 3 Rooms | 11 (4.1%) | 0 (0.0%) |
| 4 or 5 Rooms | 98 (36.8%) | 94 (100.0%) |
| 6 or 7 Rooms | 149 (56.0%) | 0 (0.0%) |
| 8 or more Rooms | 8 (3.0%) | 0 (0.0%) |
| Total | 266 (100.0%) | 94 (100.0%) |
Housing Structure by Heating Type in Lakeshore Gardens Hidden Acres
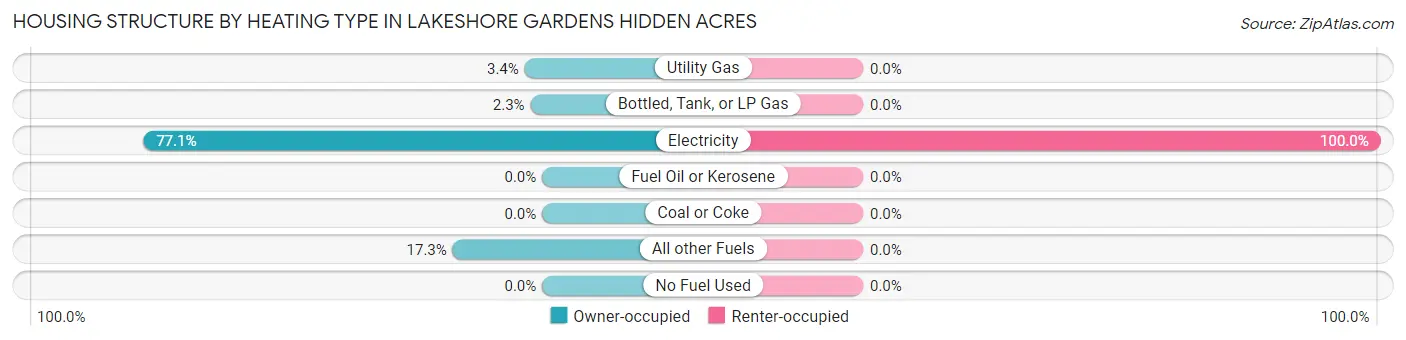
| Heating Type | Owner-occupied | Renter-occupied |
| Utility Gas | 9 (3.4%) | 0 (0.0%) |
| Bottled, Tank, or LP Gas | 6 (2.3%) | 0 (0.0%) |
| Electricity | 205 (77.1%) | 94 (100.0%) |
| Fuel Oil or Kerosene | 0 (0.0%) | 0 (0.0%) |
| Coal or Coke | 0 (0.0%) | 0 (0.0%) |
| All other Fuels | 46 (17.3%) | 0 (0.0%) |
| No Fuel Used | 0 (0.0%) | 0 (0.0%) |
| Total | 266 (100.0%) | 94 (100.0%) |
Household Vehicle Usage in Lakeshore Gardens Hidden Acres
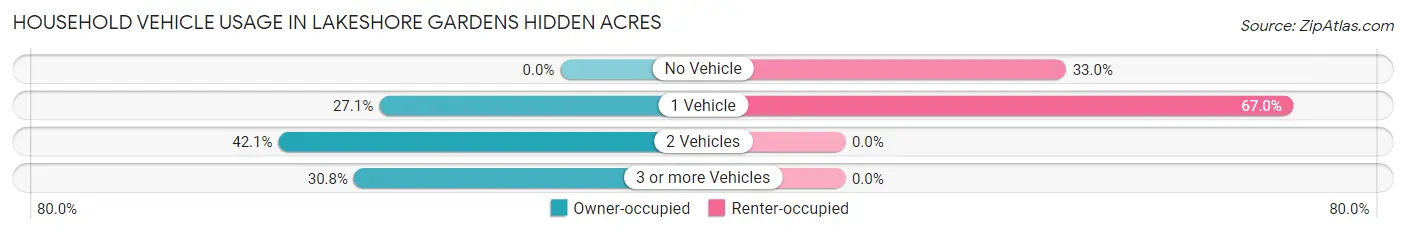
| Vehicles per Household | Owner-occupied | Renter-occupied |
| No Vehicle | 0 (0.0%) | 31 (33.0%) |
| 1 Vehicle | 72 (27.1%) | 63 (67.0%) |
| 2 Vehicles | 112 (42.1%) | 0 (0.0%) |
| 3 or more Vehicles | 82 (30.8%) | 0 (0.0%) |
| Total | 266 (100.0%) | 94 (100.0%) |
Real Estate & Mortgages in Lakeshore Gardens Hidden Acres
Real Estate and Mortgage Overview in Lakeshore Gardens Hidden Acres
| Characteristic | Without Mortgage | With Mortgage |
| Housing Units | 159 | 107 |
| Median Property Value | - | - |
| Median Household Income | - | - |
| Monthly Housing Costs | $238 | $0 |
| Real Estate Taxes | $1,724 | $0 |
Property Value by Mortgage Status in Lakeshore Gardens Hidden Acres
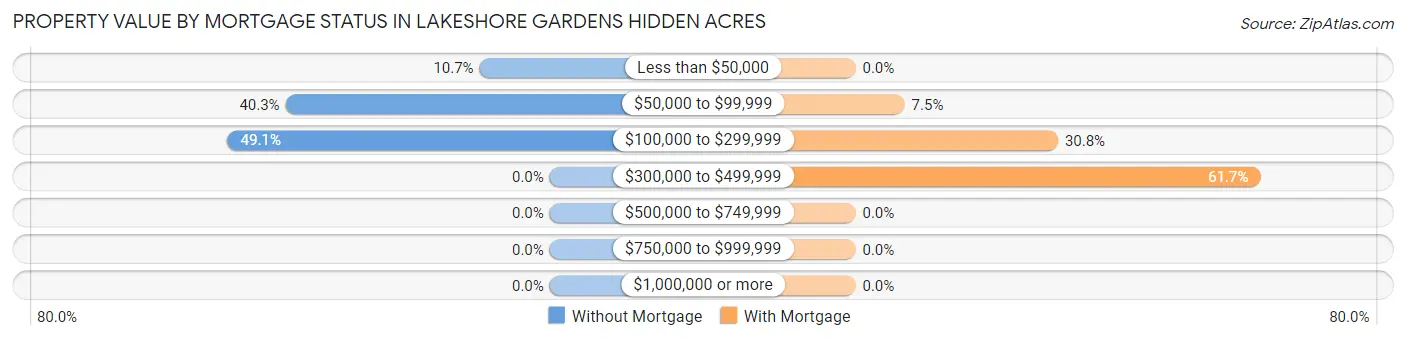
| Property Value | Without Mortgage | With Mortgage |
| Less than $50,000 | 17 (10.7%) | 0 (0.0%) |
| $50,000 to $99,999 | 64 (40.3%) | 8 (7.5%) |
| $100,000 to $299,999 | 78 (49.1%) | 33 (30.8%) |
| $300,000 to $499,999 | 0 (0.0%) | 66 (61.7%) |
| $500,000 to $749,999 | 0 (0.0%) | 0 (0.0%) |
| $750,000 to $999,999 | 0 (0.0%) | 0 (0.0%) |
| $1,000,000 or more | 0 (0.0%) | 0 (0.0%) |
| Total | 159 (100.0%) | 107 (100.0%) |
Household Income by Mortgage Status in Lakeshore Gardens Hidden Acres
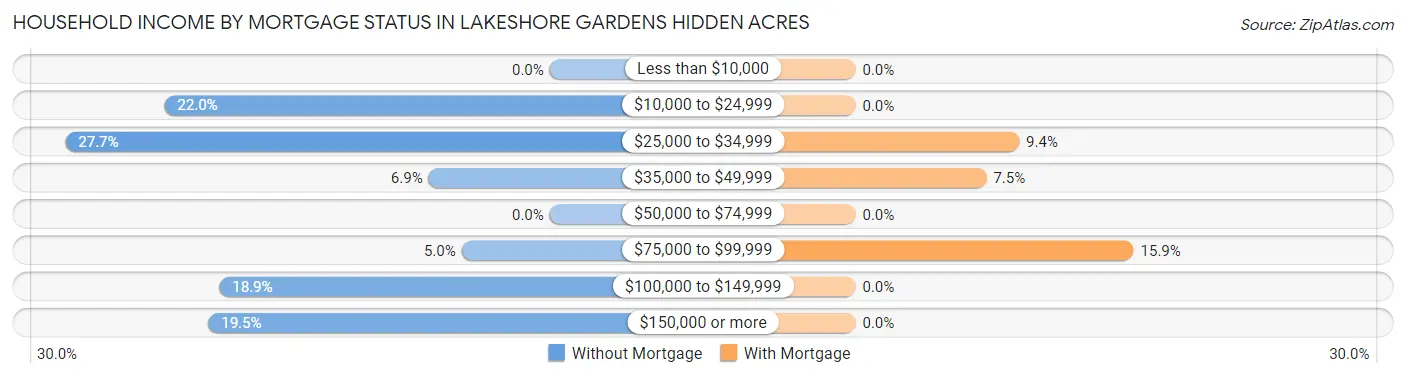
| Household Income | Without Mortgage | With Mortgage |
| Less than $10,000 | 0 (0.0%) | 0 (0.0%) |
| $10,000 to $24,999 | 35 (22.0%) | 0 (0.0%) |
| $25,000 to $34,999 | 44 (27.7%) | 10 (9.3%) |
| $35,000 to $49,999 | 11 (6.9%) | 8 (7.5%) |
| $50,000 to $74,999 | 0 (0.0%) | 0 (0.0%) |
| $75,000 to $99,999 | 8 (5.0%) | 17 (15.9%) |
| $100,000 to $149,999 | 30 (18.9%) | 0 (0.0%) |
| $150,000 or more | 31 (19.5%) | 0 (0.0%) |
| Total | 159 (100.0%) | 107 (100.0%) |
Property Value to Household Income Ratio in Lakeshore Gardens Hidden Acres
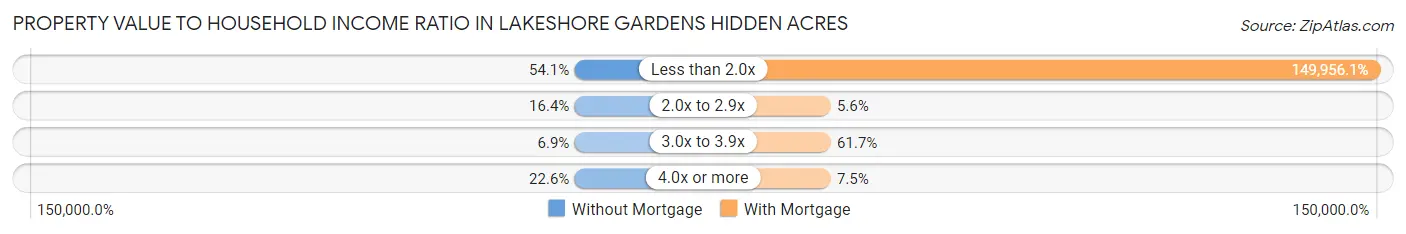
| Value-to-Income Ratio | Without Mortgage | With Mortgage |
| Less than 2.0x | 86 (54.1%) | 160,453 (149,956.1%) |
| 2.0x to 2.9x | 26 (16.4%) | 6 (5.6%) |
| 3.0x to 3.9x | 11 (6.9%) | 66 (61.7%) |
| 4.0x or more | 36 (22.6%) | 8 (7.5%) |
| Total | 159 (100.0%) | 107 (100.0%) |
Real Estate Taxes by Mortgage Status in Lakeshore Gardens Hidden Acres
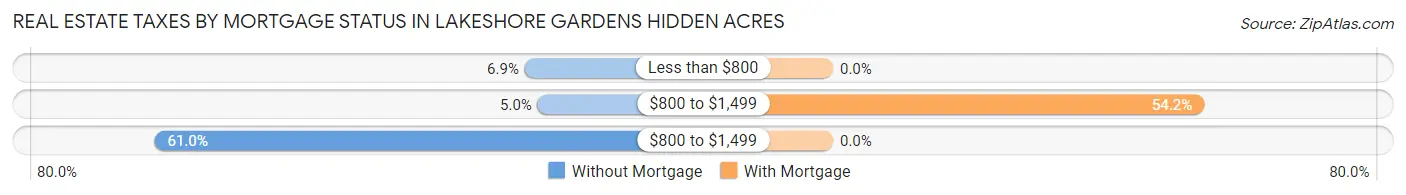
| Property Taxes | Without Mortgage | With Mortgage |
| Less than $800 | 11 (6.9%) | 0 (0.0%) |
| $800 to $1,499 | 8 (5.0%) | 58 (54.2%) |
| $800 to $1,499 | 97 (61.0%) | 0 (0.0%) |
| Total | 159 (100.0%) | 107 (100.0%) |
Health & Disability in Lakeshore Gardens Hidden Acres
Health Insurance Coverage by Age in Lakeshore Gardens Hidden Acres
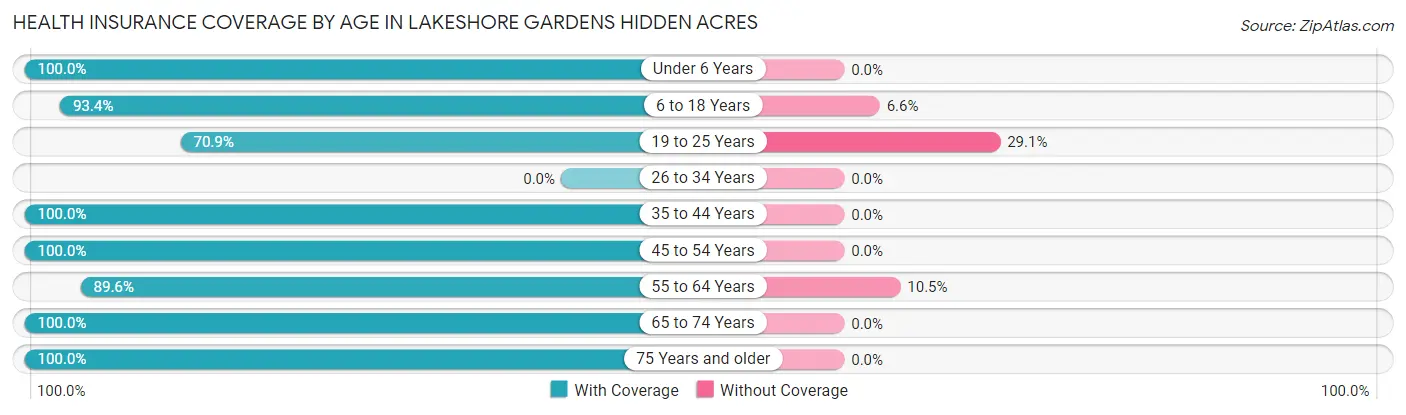
| Age Bracket | With Coverage | Without Coverage |
| Under 6 Years | 62 (100.0%) | 0 (0.0%) |
| 6 to 18 Years | 212 (93.4%) | 15 (6.6%) |
| 19 to 25 Years | 178 (70.9%) | 73 (29.1%) |
| 26 to 34 Years | 0 (0.0%) | 0 (0.0%) |
| 35 to 44 Years | 185 (100.0%) | 0 (0.0%) |
| 45 to 54 Years | 72 (100.0%) | 0 (0.0%) |
| 55 to 64 Years | 180 (89.5%) | 21 (10.4%) |
| 65 to 74 Years | 67 (100.0%) | 0 (0.0%) |
| 75 Years and older | 66 (100.0%) | 0 (0.0%) |
| Total | 1,022 (90.4%) | 109 (9.6%) |
Health Insurance Coverage by Citizenship Status in Lakeshore Gardens Hidden Acres
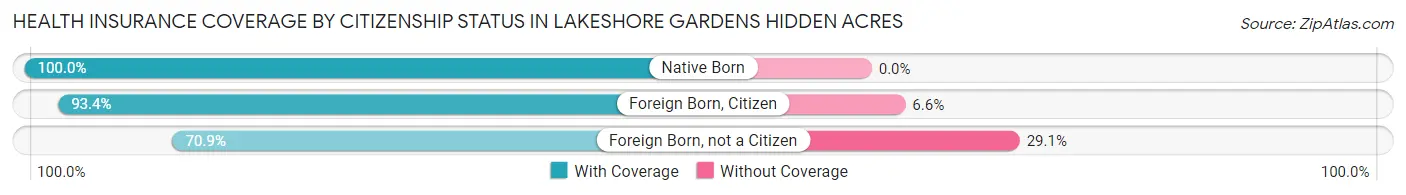
| Citizenship Status | With Coverage | Without Coverage |
| Native Born | 62 (100.0%) | 0 (0.0%) |
| Foreign Born, Citizen | 212 (93.4%) | 15 (6.6%) |
| Foreign Born, not a Citizen | 178 (70.9%) | 73 (29.1%) |
Health Insurance Coverage by Household Income in Lakeshore Gardens Hidden Acres
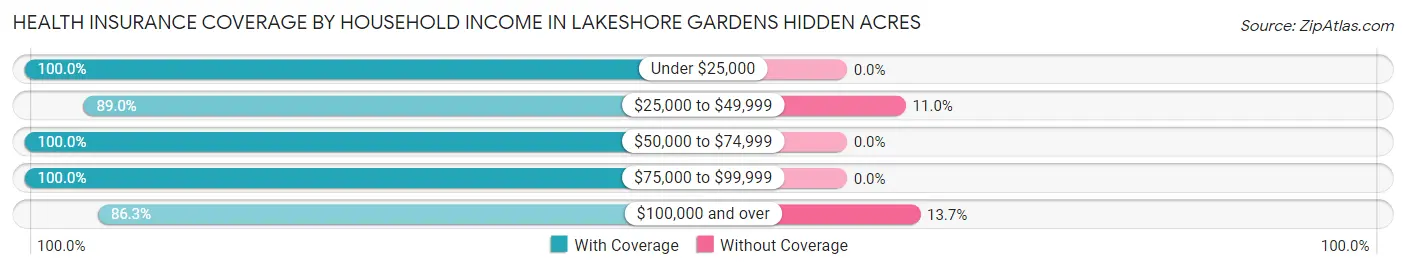
| Household Income | With Coverage | Without Coverage |
| Under $25,000 | 260 (100.0%) | 0 (0.0%) |
| $25,000 to $49,999 | 121 (89.0%) | 15 (11.0%) |
| $50,000 to $74,999 | 35 (100.0%) | 0 (0.0%) |
| $75,000 to $99,999 | 15 (100.0%) | 0 (0.0%) |
| $100,000 and over | 591 (86.3%) | 94 (13.7%) |
Public vs Private Health Insurance Coverage by Age in Lakeshore Gardens Hidden Acres
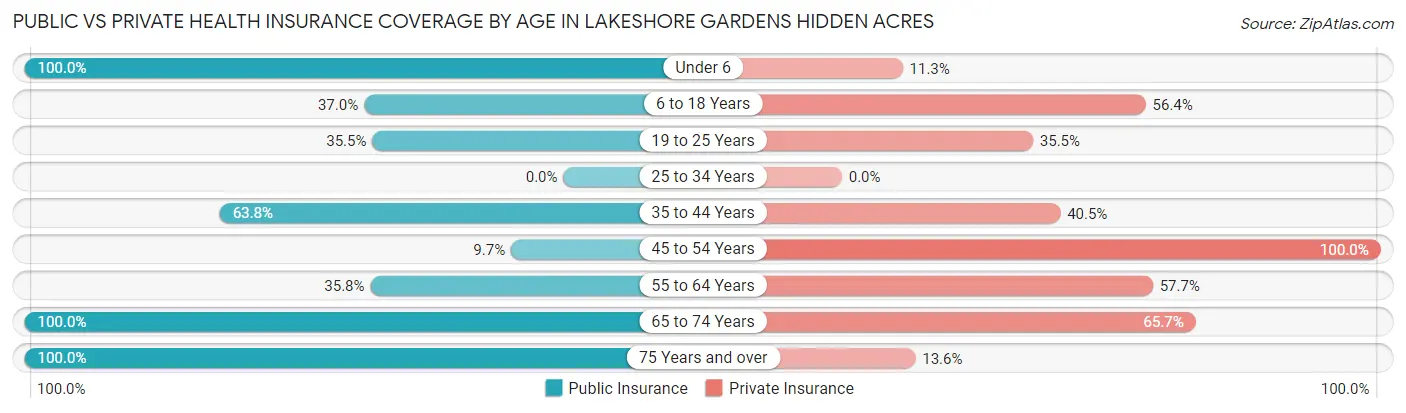
| Age Bracket | Public Insurance | Private Insurance |
| Under 6 | 62 (100.0%) | 7 (11.3%) |
| 6 to 18 Years | 84 (37.0%) | 128 (56.4%) |
| 19 to 25 Years | 89 (35.5%) | 89 (35.5%) |
| 25 to 34 Years | 0 (0.0%) | 0 (0.0%) |
| 35 to 44 Years | 118 (63.8%) | 75 (40.5%) |
| 45 to 54 Years | 7 (9.7%) | 72 (100.0%) |
| 55 to 64 Years | 72 (35.8%) | 116 (57.7%) |
| 65 to 74 Years | 67 (100.0%) | 44 (65.7%) |
| 75 Years and over | 66 (100.0%) | 9 (13.6%) |
| Total | 565 (50.0%) | 540 (47.7%) |
Disability Status by Sex by Age in Lakeshore Gardens Hidden Acres
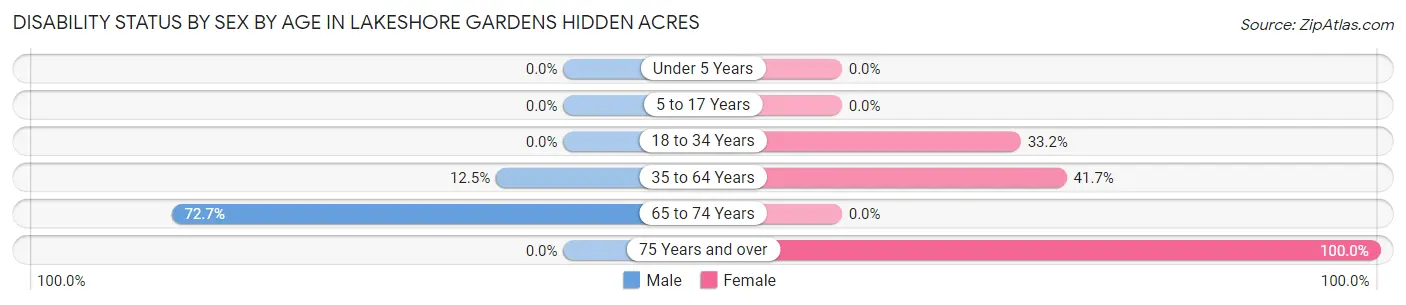
| Age Bracket | Male | Female |
| Under 5 Years | 0 (0.0%) | 0 (0.0%) |
| 5 to 17 Years | 0 (0.0%) | 0 (0.0%) |
| 18 to 34 Years | 0 (0.0%) | 89 (33.2%) |
| 35 to 64 Years | 30 (12.5%) | 91 (41.7%) |
| 65 to 74 Years | 16 (72.7%) | 0 (0.0%) |
| 75 Years and over | 0 (0.0%) | 66 (100.0%) |
Disability Class by Sex by Age in Lakeshore Gardens Hidden Acres
Disability Class: Hearing Difficulty
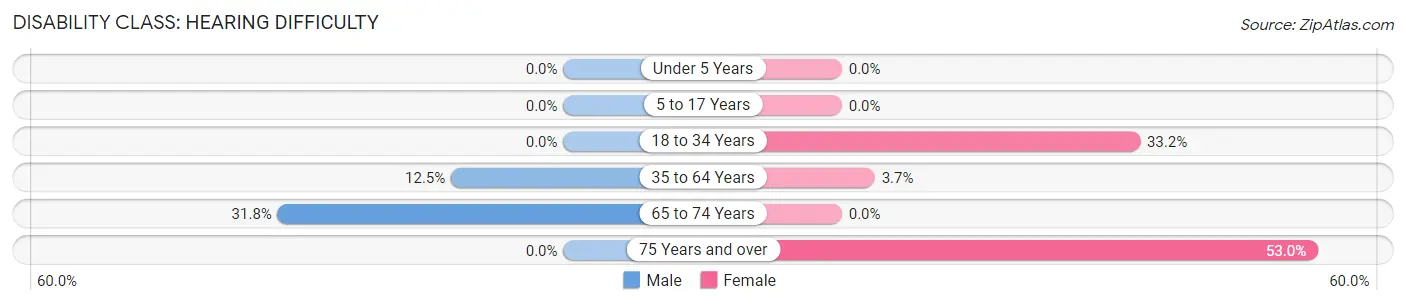
| Age Bracket | Male | Female |
| Under 5 Years | 0 (0.0%) | 0 (0.0%) |
| 5 to 17 Years | 0 (0.0%) | 0 (0.0%) |
| 18 to 34 Years | 0 (0.0%) | 89 (33.2%) |
| 35 to 64 Years | 30 (12.5%) | 8 (3.7%) |
| 65 to 74 Years | 7 (31.8%) | 0 (0.0%) |
| 75 Years and over | 0 (0.0%) | 35 (53.0%) |
Disability Class: Vision Difficulty
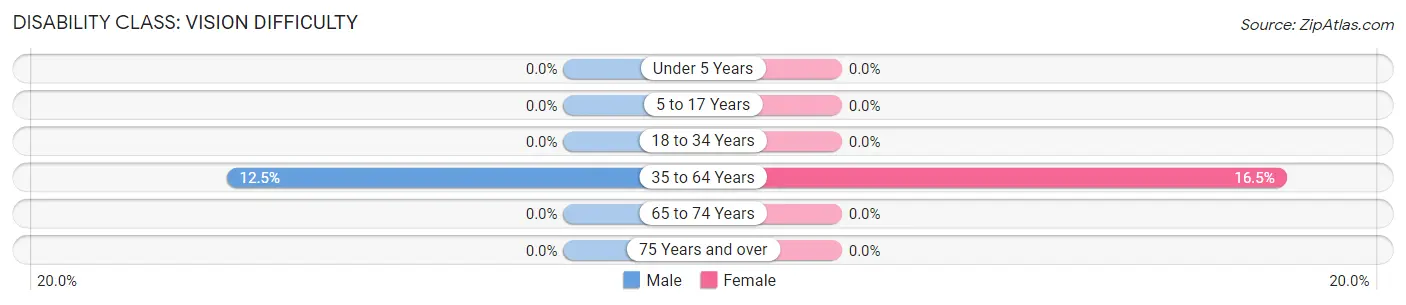
| Age Bracket | Male | Female |
| Under 5 Years | 0 (0.0%) | 0 (0.0%) |
| 5 to 17 Years | 0 (0.0%) | 0 (0.0%) |
| 18 to 34 Years | 0 (0.0%) | 0 (0.0%) |
| 35 to 64 Years | 30 (12.5%) | 36 (16.5%) |
| 65 to 74 Years | 0 (0.0%) | 0 (0.0%) |
| 75 Years and over | 0 (0.0%) | 0 (0.0%) |
Disability Class: Cognitive Difficulty
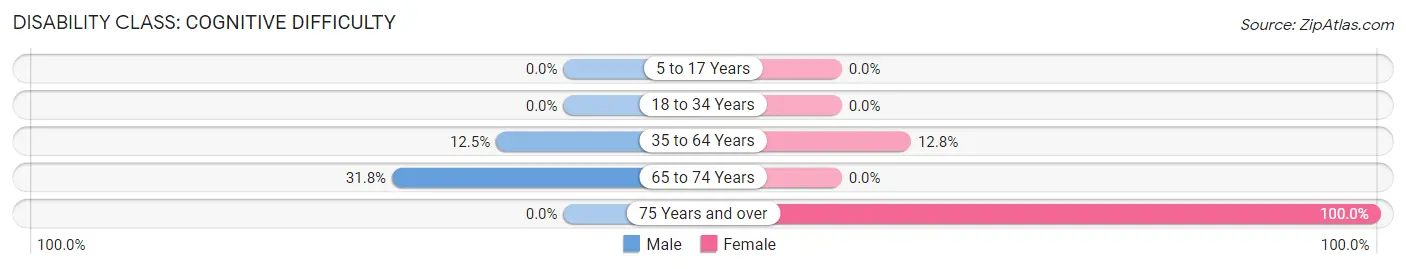
| Age Bracket | Male | Female |
| 5 to 17 Years | 0 (0.0%) | 0 (0.0%) |
| 18 to 34 Years | 0 (0.0%) | 0 (0.0%) |
| 35 to 64 Years | 30 (12.5%) | 28 (12.8%) |
| 65 to 74 Years | 7 (31.8%) | 0 (0.0%) |
| 75 Years and over | 0 (0.0%) | 66 (100.0%) |
Disability Class: Ambulatory Difficulty
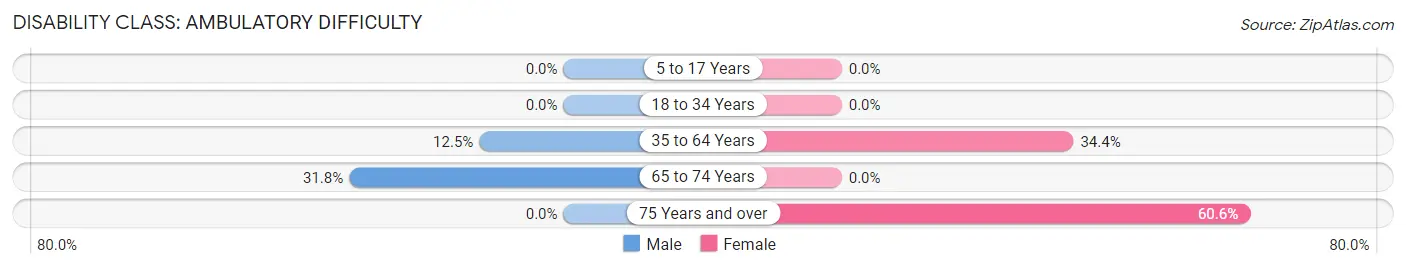
| Age Bracket | Male | Female |
| 5 to 17 Years | 0 (0.0%) | 0 (0.0%) |
| 18 to 34 Years | 0 (0.0%) | 0 (0.0%) |
| 35 to 64 Years | 30 (12.5%) | 75 (34.4%) |
| 65 to 74 Years | 7 (31.8%) | 0 (0.0%) |
| 75 Years and over | 0 (0.0%) | 40 (60.6%) |
Disability Class: Self-Care Difficulty
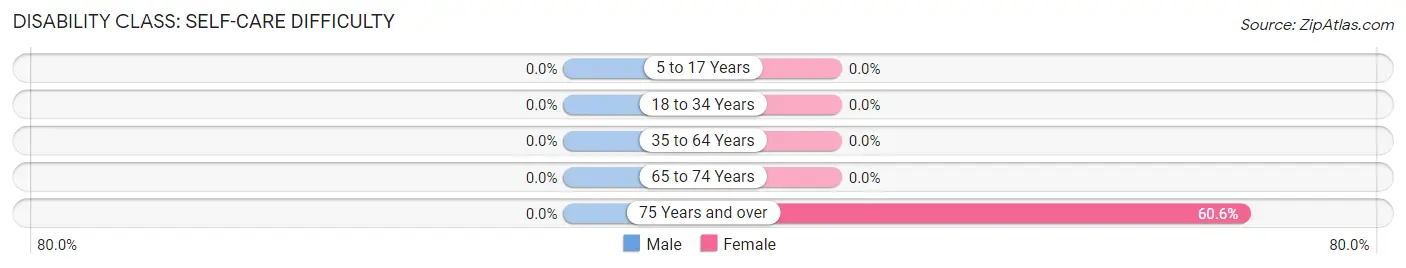
| Age Bracket | Male | Female |
| 5 to 17 Years | 0 (0.0%) | 0 (0.0%) |
| 18 to 34 Years | 0 (0.0%) | 0 (0.0%) |
| 35 to 64 Years | 0 (0.0%) | 0 (0.0%) |
| 65 to 74 Years | 0 (0.0%) | 0 (0.0%) |
| 75 Years and over | 0 (0.0%) | 40 (60.6%) |
Technology Access in Lakeshore Gardens Hidden Acres
Computing Device Access in Lakeshore Gardens Hidden Acres
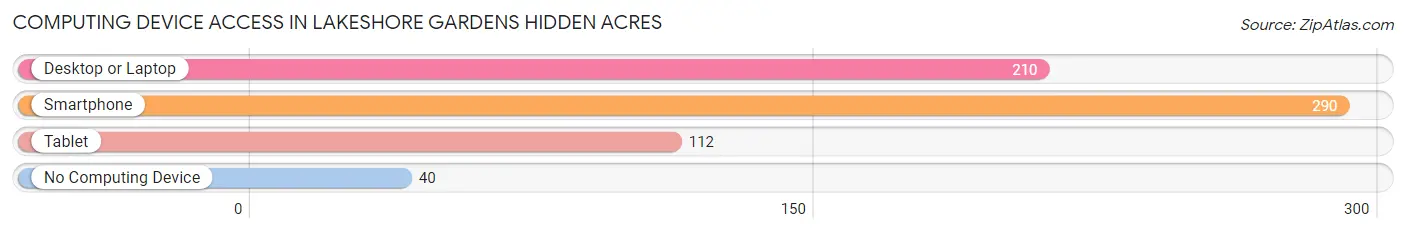
| Device Type | # Households | % Households |
| Desktop or Laptop | 210 | 58.3% |
| Smartphone | 290 | 80.6% |
| Tablet | 112 | 31.1% |
| No Computing Device | 40 | 11.1% |
| Total | 360 | 100.0% |
Internet Access in Lakeshore Gardens Hidden Acres
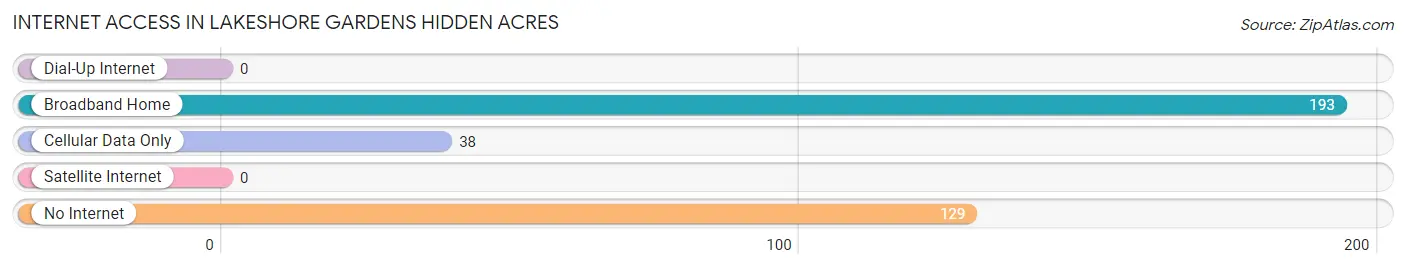
| Internet Type | # Households | % Households |
| Dial-Up Internet | 0 | 0.0% |
| Broadband Home | 193 | 53.6% |
| Cellular Data Only | 38 | 10.6% |
| Satellite Internet | 0 | 0.0% |
| No Internet | 129 | 35.8% |
| Total | 360 | 100.0% |
Lakeshore Gardens Hidden Acres Summary
Lakeshore Gardens Hidden Acres is a small, unincorporated community located in the state of Texas. It is situated in the southeastern corner of the state, near the border with Louisiana. The community is located in the county of Jefferson, and is part of the Beaumont-Port Arthur metropolitan area. The population of Lakeshore Gardens Hidden Acres was estimated to be around 1,000 people in 2000.
History
Lakeshore Gardens Hidden Acres was founded in the late 19th century by a group of settlers from Louisiana. The settlers were looking for a place to settle and start a new life, and they found the area to be ideal for their needs. The area was mostly marshland, but the settlers were able to build a small community and begin to farm the land. The community was originally known as Lakeshore Gardens, but the name was changed to Hidden Acres in the early 20th century.
The community grew slowly over the years, and by the mid-20th century, it had become a popular destination for tourists and vacationers. The area was known for its beautiful scenery and its abundance of wildlife. The community was also known for its fishing and hunting opportunities.
Geography
Lakeshore Gardens Hidden Acres is located in the southeastern corner of Texas, near the border with Louisiana. The community is situated in the county of Jefferson, and is part of the Beaumont-Port Arthur metropolitan area. The area is mostly marshland, with some areas of higher elevation. The community is located near the Sabine River, which provides a natural border between Texas and Louisiana.
The climate in the area is generally mild, with temperatures ranging from the mid-50s in the winter to the mid-80s in the summer. The area receives an average of around 50 inches of rain per year.
Economy
The economy of Lakeshore Gardens Hidden Acres is largely based on tourism and recreation. The area is known for its beautiful scenery and its abundance of wildlife, and it is a popular destination for fishing and hunting. The community also has a number of small businesses, including restaurants, convenience stores, and gas stations.
Demographics
The population of Lakeshore Gardens Hidden Acres was estimated to be around 1,000 people in 2000. The majority of the population is white, with a small percentage of African Americans and Hispanics. The median household income in the area is around $30,000, and the median home value is around $100,000. The area has a low crime rate, and the community is generally considered to be a safe place to live.
Common Questions
What is Per Capita Income in Lakeshore Gardens Hidden Acres?
Per Capita income in Lakeshore Gardens Hidden Acres is $26,210.
What is Income or Wage Gap in Lakeshore Gardens Hidden Acres?
Income or Wage Gap in Lakeshore Gardens Hidden Acres is 49.1%.
Women in Lakeshore Gardens Hidden Acres earn 50.9 cents for every dollar earned by a man.
What is Inequality or Gini Index in Lakeshore Gardens Hidden Acres?
Inequality or Gini Index in Lakeshore Gardens Hidden Acres is 0.47.
What is the Total Population of Lakeshore Gardens Hidden Acres?
Total Population of Lakeshore Gardens Hidden Acres is 1,131.
What is the Total Male Population of Lakeshore Gardens Hidden Acres?
Total Male Population of Lakeshore Gardens Hidden Acres is 414.
What is the Total Female Population of Lakeshore Gardens Hidden Acres?
Total Female Population of Lakeshore Gardens Hidden Acres is 717.
What is the Ratio of Males per 100 Females in Lakeshore Gardens Hidden Acres?
There are 57.74 Males per 100 Females in Lakeshore Gardens Hidden Acres.
What is the Ratio of Females per 100 Males in Lakeshore Gardens Hidden Acres?
There are 173.19 Females per 100 Males in Lakeshore Gardens Hidden Acres.
What is the Median Population Age in Lakeshore Gardens Hidden Acres?
Median Population Age in Lakeshore Gardens Hidden Acres is 40.4 Years.
What is the Average Family Size in Lakeshore Gardens Hidden Acres
Average Family Size in Lakeshore Gardens Hidden Acres is 4.4 People.
What is the Average Household Size in Lakeshore Gardens Hidden Acres
Average Household Size in Lakeshore Gardens Hidden Acres is 3.1 People.
How Large is the Labor Force in Lakeshore Gardens Hidden Acres?
There are 358 People in the Labor Forcein in Lakeshore Gardens Hidden Acres.
What is the Percentage of People in the Labor Force in Lakeshore Gardens Hidden Acres?
33.8% of People are in the Labor Force in Lakeshore Gardens Hidden Acres.