Zip Codes with the Highest Percentage of Population Employed in Installation, Maintenance & Repair in Mission, TX
RELATED REPORTS & OPTIONS
Installation, Maintenance & Repair
Mission
Compare Zip Codes
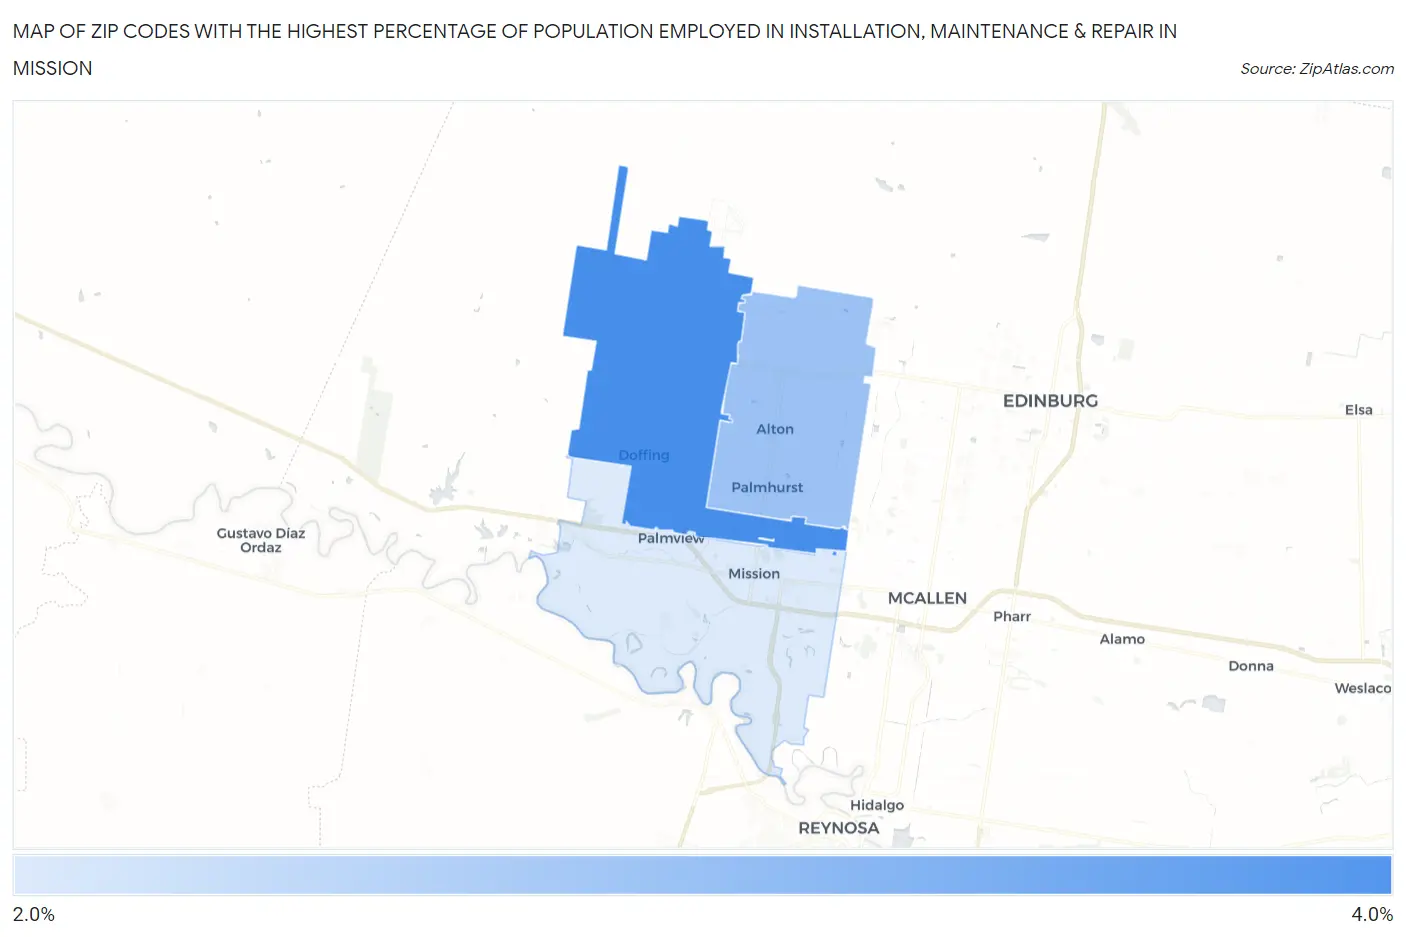
Map of Zip Codes with the Highest Percentage of Population Employed in Installation, Maintenance & Repair in Mission
2.3%
3.4%
Zip Codes with the Highest Percentage of Population Employed in Installation, Maintenance & Repair in Mission, TX
| Zip Code | % Employed | vs State | vs National | |
| 1. | 78574 | 3.4% | 3.4%(-0.035)#950 | 3.1%(+0.301)#15,242 |
| 2. | 78573 | 2.8% | 3.4%(-0.638)#1,128 | 3.1%(-0.302)#18,180 |
| 3. | 78572 | 2.3% | 3.4%(-1.08)#1,251 | 3.1%(-0.746)#20,471 |
1
Common Questions
What are the Top Zip Codes with the Highest Percentage of Population Employed in Installation, Maintenance & Repair in Mission, TX?
Top Zip Codes with the Highest Percentage of Population Employed in Installation, Maintenance & Repair in Mission, TX are:
What zip code has the Highest Percentage of Population Employed in Installation, Maintenance & Repair in Mission, TX?
78574 has the Highest Percentage of Population Employed in Installation, Maintenance & Repair in Mission, TX with 3.4%.
What is the Percentage of Population Employed in Installation, Maintenance & Repair in Mission, TX?
Percentage of Population Employed in Installation, Maintenance & Repair in Mission is 2.6%.
What is the Percentage of Population Employed in Installation, Maintenance & Repair in Texas?
Percentage of Population Employed in Installation, Maintenance & Repair in Texas is 3.4%.
What is the Percentage of Population Employed in Installation, Maintenance & Repair in the United States?
Percentage of Population Employed in Installation, Maintenance & Repair in the United States is 3.1%.