Zip Codes with the Highest Percentage of Population Employed in Installation, Maintenance & Repair in El Paso, TX
RELATED REPORTS & OPTIONS
Installation, Maintenance & Repair
El Paso
Compare Zip Codes
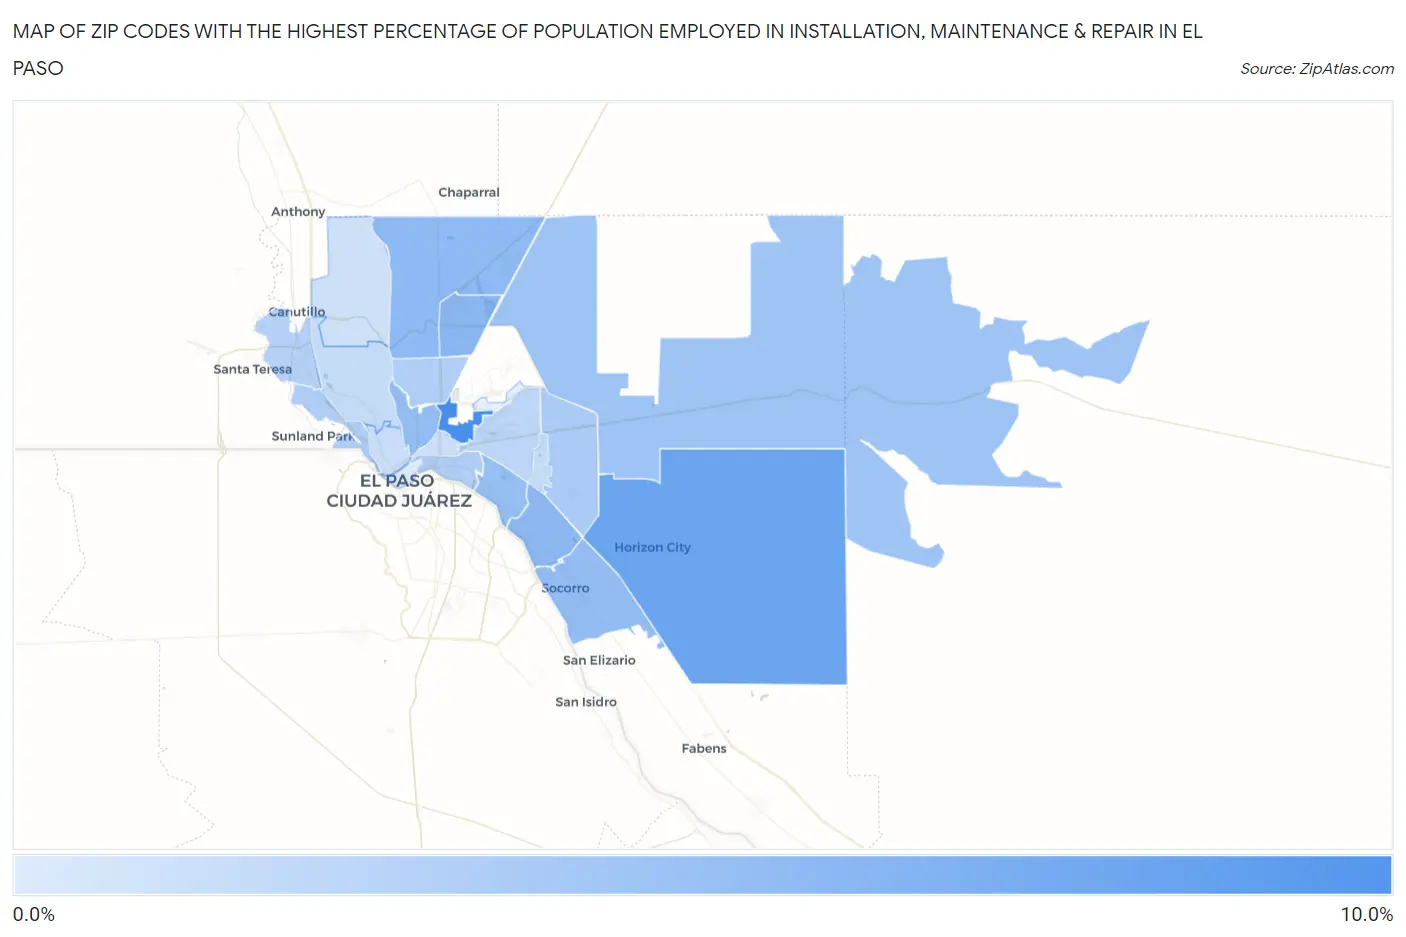
Map of Zip Codes with the Highest Percentage of Population Employed in Installation, Maintenance & Repair in El Paso
0.91%
8.3%
Zip Codes with the Highest Percentage of Population Employed in Installation, Maintenance & Repair in El Paso, TX
| Zip Code | % Employed | vs State | vs National | |
| 1. | 79906 | 8.3% | 3.4%(+4.89)#173 | 3.1%(+5.23)#3,039 |
| 2. | 79928 | 6.4% | 3.4%(+3.05)#303 | 3.1%(+3.38)#5,287 |
| 3. | 79924 | 4.9% | 3.4%(+1.49)#557 | 3.1%(+1.82)#9,073 |
| 4. | 79907 | 4.8% | 3.4%(+1.42)#571 | 3.1%(+1.76)#9,277 |
| 5. | 79934 | 4.8% | 3.4%(+1.35)#581 | 3.1%(+1.69)#9,485 |
| 6. | 79927 | 4.5% | 3.4%(+1.11)#641 | 3.1%(+1.44)#10,380 |
| 7. | 79930 | 4.5% | 3.4%(+1.08)#644 | 3.1%(+1.42)#10,484 |
| 8. | 79915 | 4.4% | 3.4%(+0.980)#664 | 3.1%(+1.32)#10,834 |
| 9. | 79938 | 4.0% | 3.4%(+0.562)#774 | 3.1%(+0.898)#12,520 |
| 10. | 79936 | 3.4% | 3.4%(-0.035)#951 | 3.1%(+0.300)#15,245 |
| 11. | 79922 | 3.2% | 3.4%(-0.249)#1,013 | 3.1%(+0.087)#16,264 |
| 12. | 79905 | 3.1% | 3.4%(-0.301)#1,024 | 3.1%(+0.034)#16,516 |
| 13. | 79904 | 3.0% | 3.4%(-0.407)#1,065 | 3.1%(-0.072)#16,997 |
| 14. | 79932 | 2.9% | 3.4%(-0.499)#1,087 | 3.1%(-0.163)#17,464 |
| 15. | 79925 | 2.5% | 3.4%(-0.903)#1,201 | 3.1%(-0.567)#19,552 |
| 16. | 79912 | 2.0% | 3.4%(-1.37)#1,339 | 3.1%(-1.03)#21,854 |
| 17. | 79935 | 2.0% | 3.4%(-1.37)#1,341 | 3.1%(-1.04)#21,875 |
| 18. | 79902 | 1.9% | 3.4%(-1.49)#1,372 | 3.1%(-1.16)#22,423 |
| 19. | 79903 | 1.8% | 3.4%(-1.64)#1,400 | 3.1%(-1.31)#23,077 |
| 20. | 79911 | 1.6% | 3.4%(-1.79)#1,431 | 3.1%(-1.46)#23,718 |
| 21. | 79901 | 0.91% | 3.4%(-2.49)#1,546 | 3.1%(-2.15)#26,160 |
1
Common Questions
What are the Top 10 Zip Codes with the Highest Percentage of Population Employed in Installation, Maintenance & Repair in El Paso, TX?
Top 10 Zip Codes with the Highest Percentage of Population Employed in Installation, Maintenance & Repair in El Paso, TX are:
What zip code has the Highest Percentage of Population Employed in Installation, Maintenance & Repair in El Paso, TX?
79906 has the Highest Percentage of Population Employed in Installation, Maintenance & Repair in El Paso, TX with 8.3%.
What is the Percentage of Population Employed in Installation, Maintenance & Repair in El Paso, TX?
Percentage of Population Employed in Installation, Maintenance & Repair in El Paso is 3.3%.
What is the Percentage of Population Employed in Installation, Maintenance & Repair in Texas?
Percentage of Population Employed in Installation, Maintenance & Repair in Texas is 3.4%.
What is the Percentage of Population Employed in Installation, Maintenance & Repair in the United States?
Percentage of Population Employed in Installation, Maintenance & Repair in the United States is 3.1%.