Fort Hancock, TX Map & Demographics
Fort Hancock Map
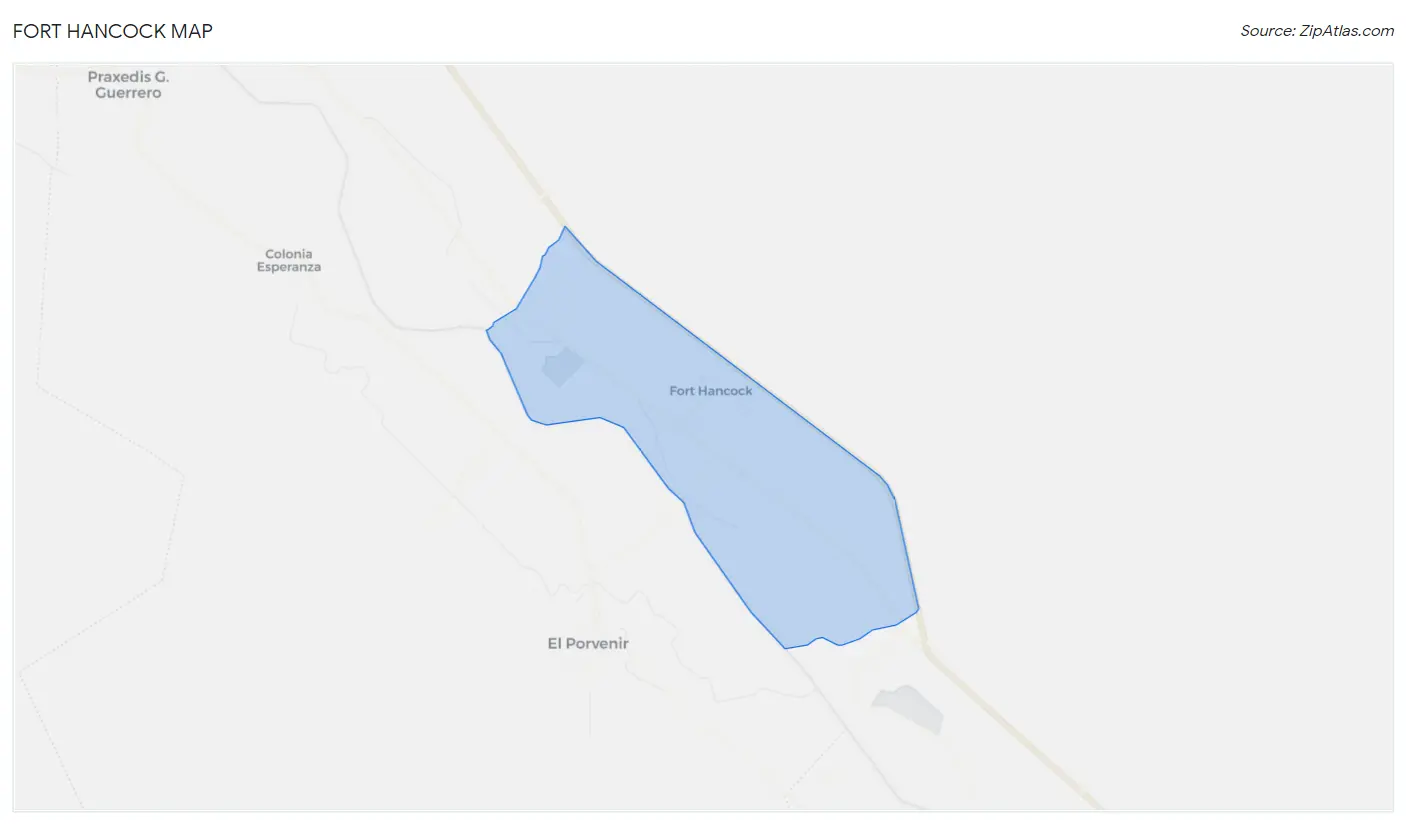
Fort Hancock Overview
$15,751
PER CAPITA INCOME
$32,576
AVG FAMILY INCOME
$31,471
AVG HOUSEHOLD INCOME
31.7%
WAGE / INCOME GAP [ % ]
68.3¢/ $1
WAGE / INCOME GAP [ $ ]
0.33
INEQUALITY / GINI INDEX
1,213
TOTAL POPULATION
672
MALE POPULATION
541
FEMALE POPULATION
124.21
MALES / 100 FEMALES
80.51
FEMALES / 100 MALES
26.9
MEDIAN AGE
3.4
AVG FAMILY SIZE
2.9
AVG HOUSEHOLD SIZE
567
LABOR FORCE [ PEOPLE ]
55.2%
PERCENT IN LABOR FORCE
Fort Hancock Zip Codes
Fort Hancock Area Codes
Income in Fort Hancock
Income Overview in Fort Hancock
Per Capita Income in Fort Hancock is $15,751, while median incomes of families and households are $32,576 and $31,471 respectively.
| Characteristic | Number | Measure |
| Per Capita Income | 1,213 | $15,751 |
| Median Family Income | 332 | $32,576 |
| Mean Family Income | 332 | $39,936 |
| Median Household Income | 424 | $31,471 |
| Mean Household Income | 424 | $35,121 |
| Income Deficit | 332 | $0 |
| Wage / Income Gap (%) | 1,213 | 31.72% |
| Wage / Income Gap ($) | 1,213 | 68.28¢ per $1 |
| Gini / Inequality Index | 1,213 | 0.33 |
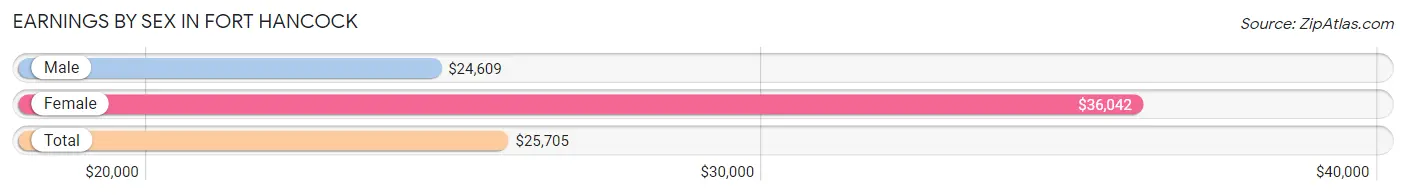
Earnings by Sex in Fort Hancock
Average Earnings in Fort Hancock are $25,705, $24,609 for men and $36,042 for women, a difference of 31.7%.
| Sex | Number | Average Earnings |
| Male | 333 (58.1%) | $24,609 |
| Female | 240 (41.9%) | $36,042 |
| Total | 573 (100.0%) | $25,705 |
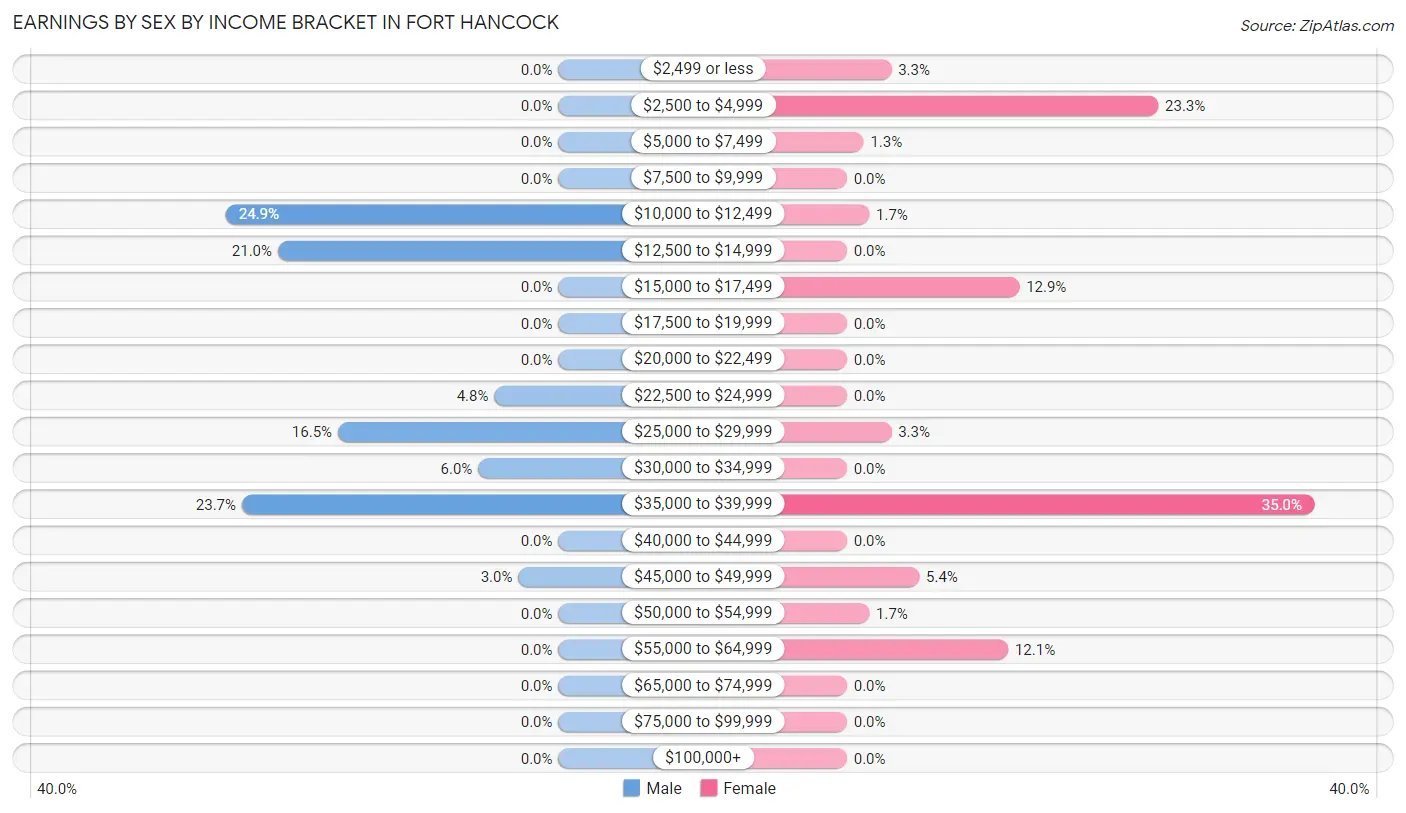
Earnings by Sex by Income Bracket in Fort Hancock
The most common earnings brackets in Fort Hancock are $10,000 to $12,499 for men (83 | 24.9%) and $35,000 to $39,999 for women (84 | 35.0%).
| Income | Male | Female |
| $2,499 or less | 0 (0.0%) | 8 (3.3%) |
| $2,500 to $4,999 | 0 (0.0%) | 56 (23.3%) |
| $5,000 to $7,499 | 0 (0.0%) | 3 (1.3%) |
| $7,500 to $9,999 | 0 (0.0%) | 0 (0.0%) |
| $10,000 to $12,499 | 83 (24.9%) | 4 (1.7%) |
| $12,500 to $14,999 | 70 (21.0%) | 0 (0.0%) |
| $15,000 to $17,499 | 0 (0.0%) | 31 (12.9%) |
| $17,500 to $19,999 | 0 (0.0%) | 0 (0.0%) |
| $20,000 to $22,499 | 0 (0.0%) | 0 (0.0%) |
| $22,500 to $24,999 | 16 (4.8%) | 0 (0.0%) |
| $25,000 to $29,999 | 55 (16.5%) | 8 (3.3%) |
| $30,000 to $34,999 | 20 (6.0%) | 0 (0.0%) |
| $35,000 to $39,999 | 79 (23.7%) | 84 (35.0%) |
| $40,000 to $44,999 | 0 (0.0%) | 0 (0.0%) |
| $45,000 to $49,999 | 10 (3.0%) | 13 (5.4%) |
| $50,000 to $54,999 | 0 (0.0%) | 4 (1.7%) |
| $55,000 to $64,999 | 0 (0.0%) | 29 (12.1%) |
| $65,000 to $74,999 | 0 (0.0%) | 0 (0.0%) |
| $75,000 to $99,999 | 0 (0.0%) | 0 (0.0%) |
| $100,000+ | 0 (0.0%) | 0 (0.0%) |
| Total | 333 (100.0%) | 240 (100.0%) |
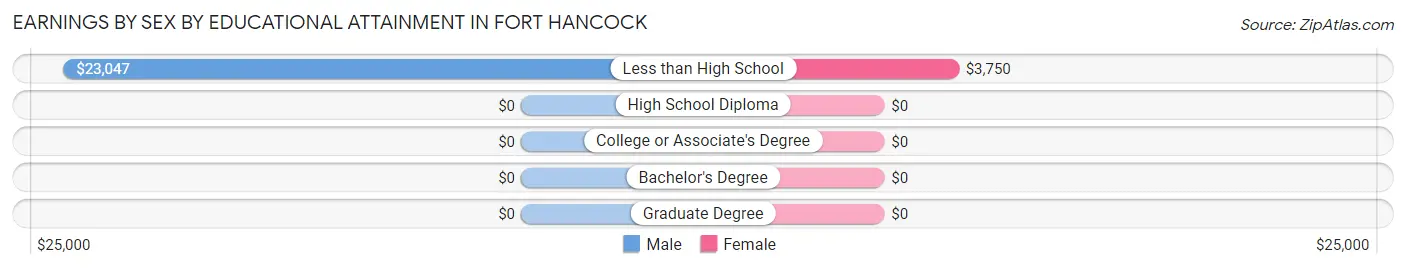
Earnings by Sex by Educational Attainment in Fort Hancock
| Educational Attainment | Male Income | Female Income |
| Less than High School | $23,047 | $3,750 |
| High School Diploma | - | - |
| College or Associate's Degree | - | - |
| Bachelor's Degree | - | - |
| Graduate Degree | - | - |
| Total | $37,627 | $0 |
Family Income in Fort Hancock
Family Income Brackets in Fort Hancock
According to the Fort Hancock family income data, there are 146 families falling into the $25,000 to $34,999 income range, which is the most common income bracket and makes up 44.0% of all families.
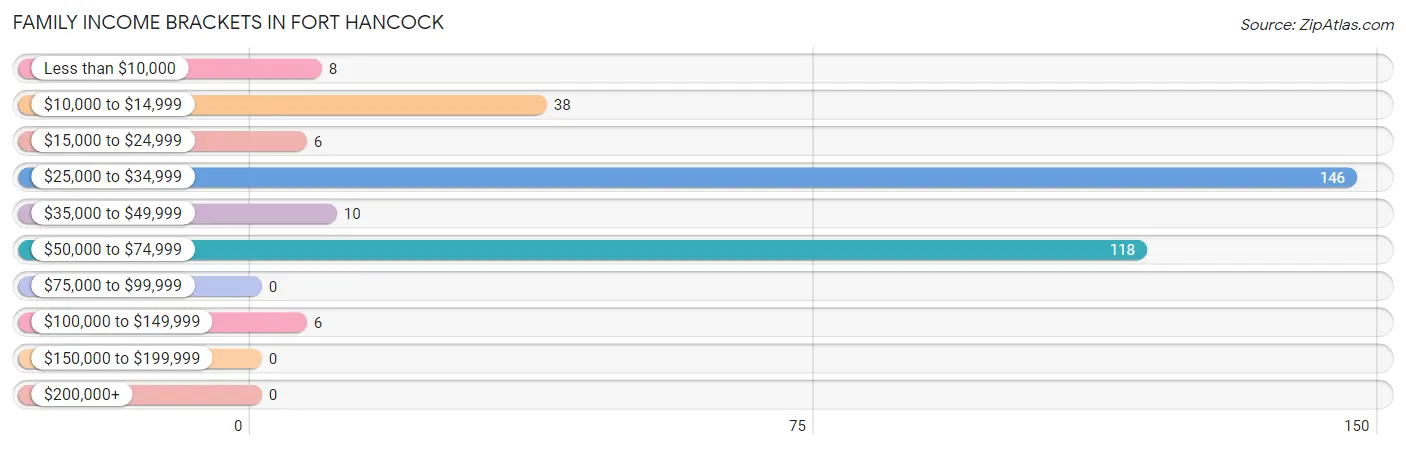
| Income Bracket | # Families | % Families |
| Less than $10,000 | 8 | 2.4% |
| $10,000 to $14,999 | 38 | 11.4% |
| $15,000 to $24,999 | 6 | 1.8% |
| $25,000 to $34,999 | 146 | 44.0% |
| $35,000 to $49,999 | 10 | 3.0% |
| $50,000 to $74,999 | 118 | 35.5% |
| $75,000 to $99,999 | 0 | 0.0% |
| $100,000 to $149,999 | 6 | 1.8% |
| $150,000 to $199,999 | 0 | 0.0% |
| $200,000+ | 0 | 0.0% |
Family Income by Famaliy Size in Fort Hancock
2-person families (96 | 28.9%) account for the highest median family income in Fort Hancock with $48,250 per family, while 2-person families (96 | 28.9%) have the highest median income of $24,125 per family member.
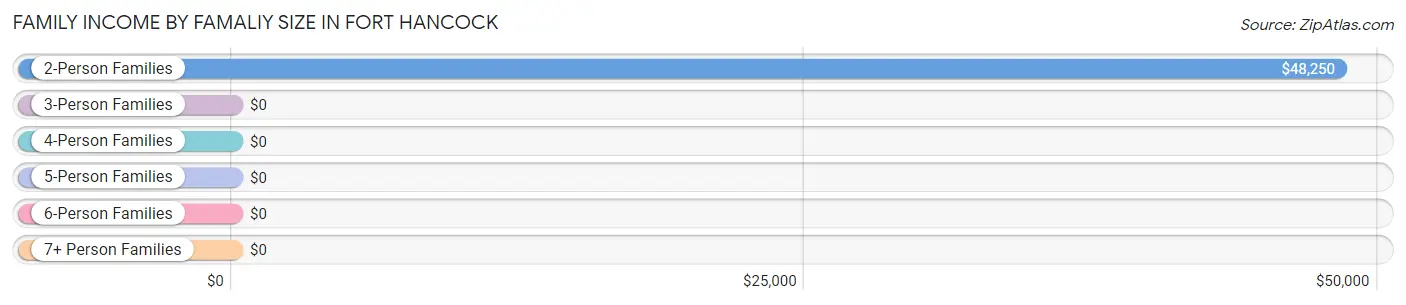
| Income Bracket | # Families | Median Income |
| 2-Person Families | 96 (28.9%) | $48,250 |
| 3-Person Families | 90 (27.1%) | $0 |
| 4-Person Families | 115 (34.6%) | $0 |
| 5-Person Families | 31 (9.3%) | $0 |
| 6-Person Families | 0 (0.0%) | $0 |
| 7+ Person Families | 0 (0.0%) | $0 |
| Total | 332 (100.0%) | $32,576 |
Family Income by Number of Earners in Fort Hancock
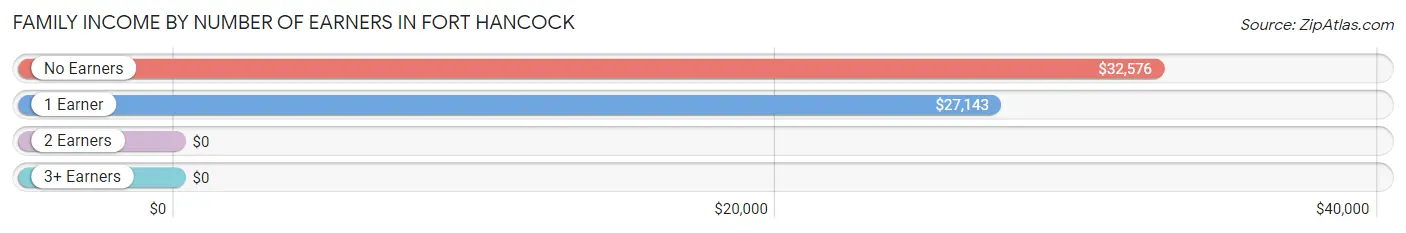
| Number of Earners | # Families | Median Income |
| No Earners | 64 (19.3%) | $32,576 |
| 1 Earner | 158 (47.6%) | $27,143 |
| 2 Earners | 61 (18.4%) | $0 |
| 3+ Earners | 49 (14.8%) | $0 |
| Total | 332 (100.0%) | $32,576 |
Household Income in Fort Hancock
Household Income Brackets in Fort Hancock
With 146 households falling in the category, the $25,000 to $34,999 income range is the most frequent in Fort Hancock, accounting for 34.4% of all households.
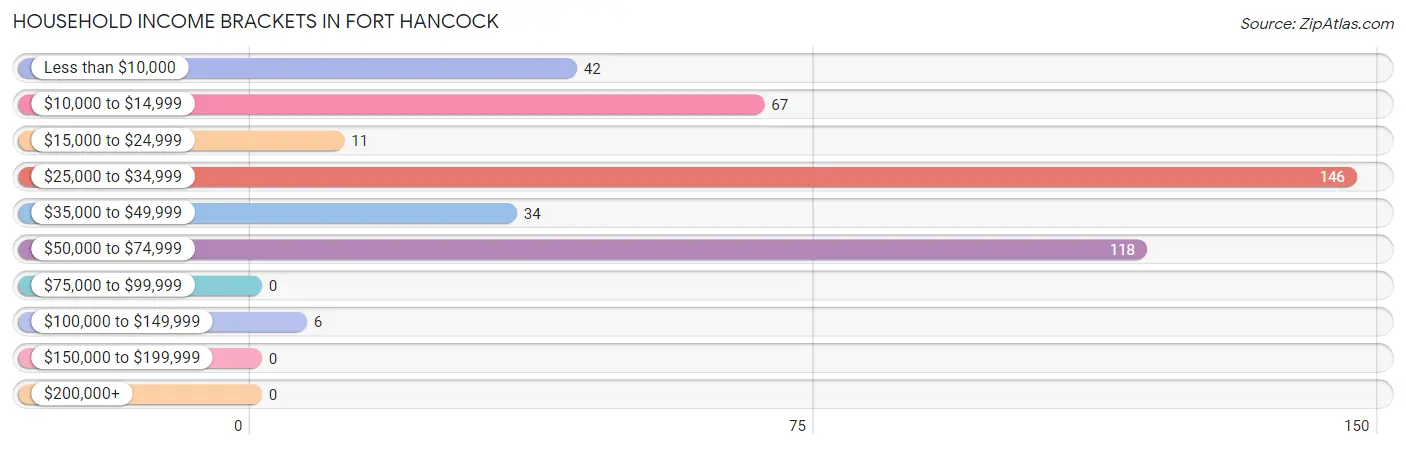
| Income Bracket | # Households | % Households |
| Less than $10,000 | 42 | 9.9% |
| $10,000 to $14,999 | 67 | 15.8% |
| $15,000 to $24,999 | 11 | 2.6% |
| $25,000 to $34,999 | 146 | 34.4% |
| $35,000 to $49,999 | 34 | 8.0% |
| $50,000 to $74,999 | 118 | 27.8% |
| $75,000 to $99,999 | 0 | 0.0% |
| $100,000 to $149,999 | 6 | 1.4% |
| $150,000 to $199,999 | 0 | 0.0% |
| $200,000+ | 0 | 0.0% |
Household Income by Householder Age in Fort Hancock
The median household income in Fort Hancock is $31,471, with the highest median household income of $48,250 found in the 45 to 64 years age bracket for the primary householder. A total of 128 households (30.2%) fall into this category. Meanwhile, the 15 to 24 years age bracket for the primary householder has the lowest median household income of $0, with 78 households (18.4%) in this group.
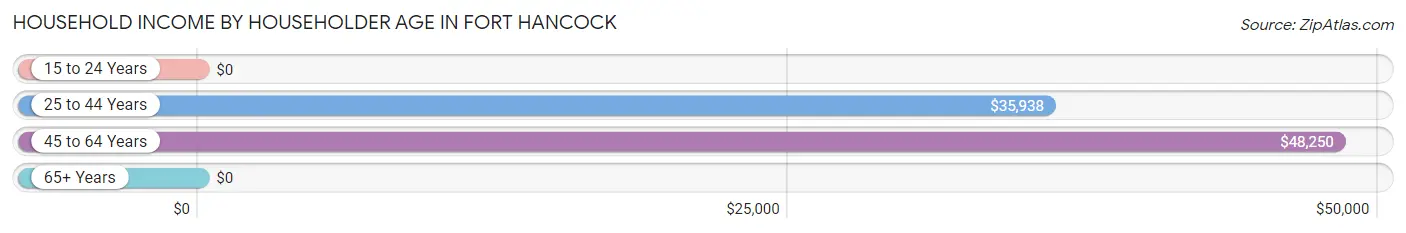
| Income Bracket | # Households | Median Income |
| 15 to 24 Years | 78 (18.4%) | $0 |
| 25 to 44 Years | 120 (28.3%) | $35,938 |
| 45 to 64 Years | 128 (30.2%) | $48,250 |
| 65+ Years | 98 (23.1%) | $0 |
| Total | 424 (100.0%) | $31,471 |
Poverty in Fort Hancock
Income Below Poverty by Sex and Age in Fort Hancock
With 33.3% poverty level for males and 37.1% for females among the residents of Fort Hancock, 12 to 14 year old males and 5 year old females are the most vulnerable to poverty, with 16 males (100.0%) and 15 females (100.0%) in their respective age groups living below the poverty level.
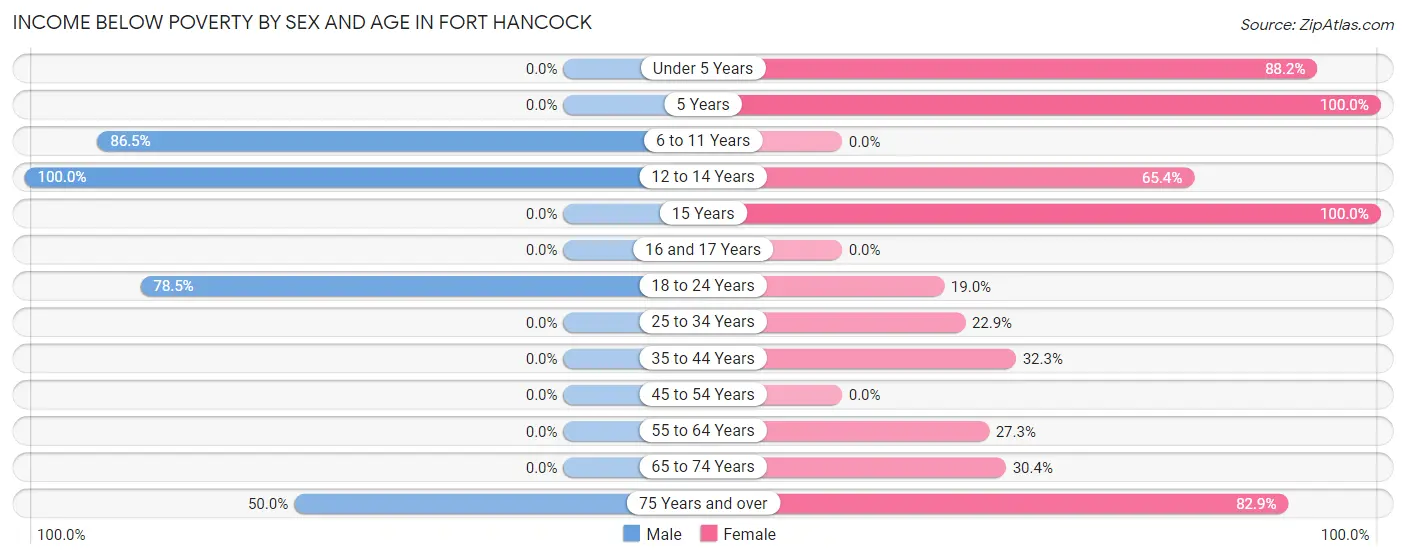
| Age Bracket | Male | Female |
| Under 5 Years | 0 (0.0%) | 30 (88.2%) |
| 5 Years | 0 (0.0%) | 15 (100.0%) |
| 6 to 11 Years | 32 (86.5%) | 0 (0.0%) |
| 12 to 14 Years | 16 (100.0%) | 17 (65.4%) |
| 15 Years | 0 (0.0%) | 21 (100.0%) |
| 16 and 17 Years | 0 (0.0%) | 0 (0.0%) |
| 18 to 24 Years | 157 (78.5%) | 18 (19.0%) |
| 25 to 34 Years | 0 (0.0%) | 8 (22.9%) |
| 35 to 44 Years | 0 (0.0%) | 31 (32.3%) |
| 45 to 54 Years | 0 (0.0%) | 0 (0.0%) |
| 55 to 64 Years | 0 (0.0%) | 18 (27.3%) |
| 65 to 74 Years | 0 (0.0%) | 14 (30.4%) |
| 75 Years and over | 19 (50.0%) | 29 (82.9%) |
| Total | 224 (33.3%) | 201 (37.1%) |
Income Above Poverty by Sex and Age in Fort Hancock
According to the poverty statistics in Fort Hancock, males aged under 5 years and females aged 45 to 54 years are the age groups that are most secure financially, with 100.0% of males and 100.0% of females in these age groups living above the poverty line.
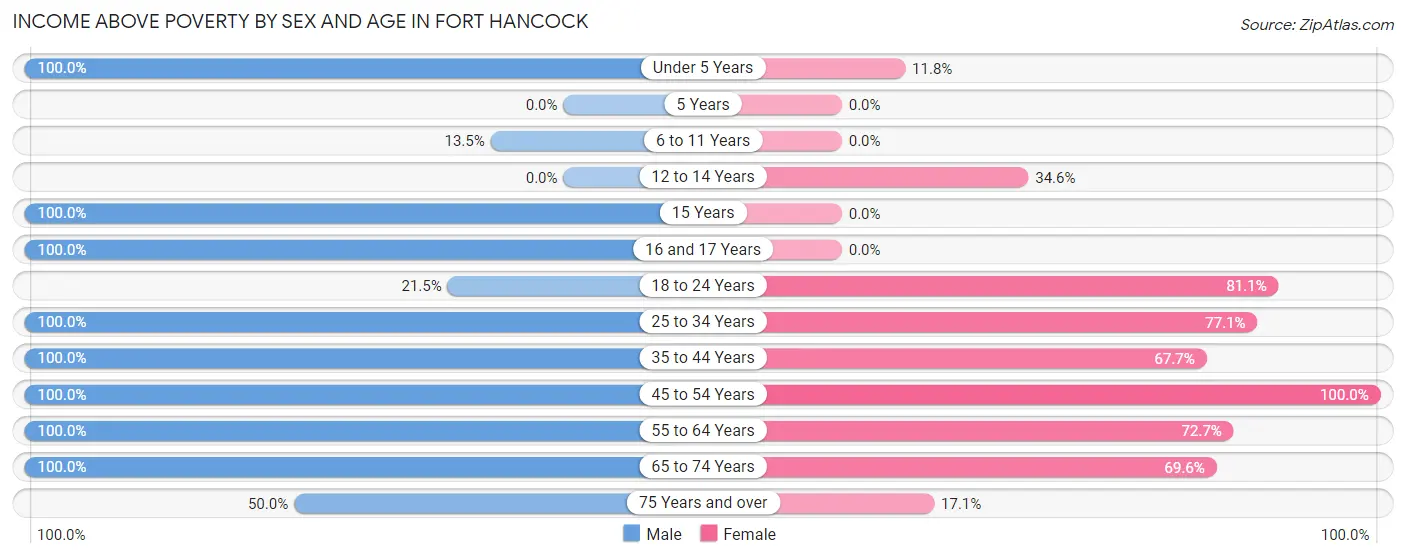
| Age Bracket | Male | Female |
| Under 5 Years | 17 (100.0%) | 4 (11.8%) |
| 5 Years | 0 (0.0%) | 0 (0.0%) |
| 6 to 11 Years | 5 (13.5%) | 0 (0.0%) |
| 12 to 14 Years | 0 (0.0%) | 9 (34.6%) |
| 15 Years | 20 (100.0%) | 0 (0.0%) |
| 16 and 17 Years | 44 (100.0%) | 0 (0.0%) |
| 18 to 24 Years | 43 (21.5%) | 77 (81.0%) |
| 25 to 34 Years | 132 (100.0%) | 27 (77.1%) |
| 35 to 44 Years | 60 (100.0%) | 65 (67.7%) |
| 45 to 54 Years | 75 (100.0%) | 72 (100.0%) |
| 55 to 64 Years | 27 (100.0%) | 48 (72.7%) |
| 65 to 74 Years | 6 (100.0%) | 32 (69.6%) |
| 75 Years and over | 19 (50.0%) | 6 (17.1%) |
| Total | 448 (66.7%) | 340 (62.8%) |
Income Below Poverty Among Married-Couple Families in Fort Hancock
The poverty statistics for married-couple families in Fort Hancock show that 19.9% or 38 of the total 191 families live below the poverty line. Families with 1 or 2 children have the highest poverty rate of 32.2%, comprising of 29 families. On the other hand, families with no children have the lowest poverty rate of 8.9%, which includes 9 families.
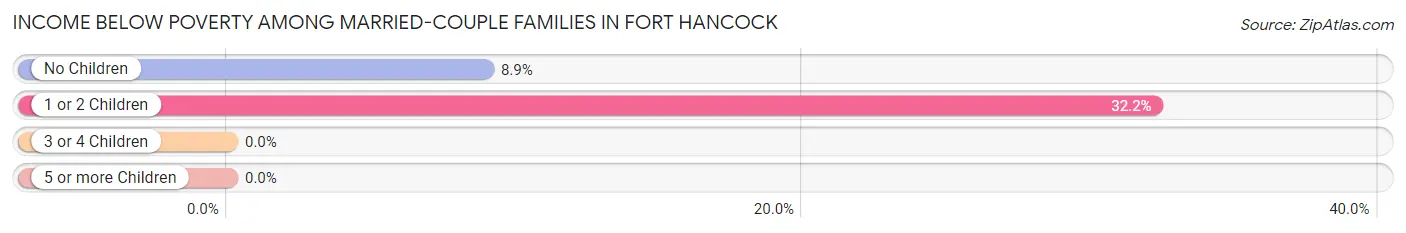
| Children | Above Poverty | Below Poverty |
| No Children | 92 (91.1%) | 9 (8.9%) |
| 1 or 2 Children | 61 (67.8%) | 29 (32.2%) |
| 3 or 4 Children | 0 (0.0%) | 0 (0.0%) |
| 5 or more Children | 0 (0.0%) | 0 (0.0%) |
| Total | 153 (80.1%) | 38 (19.9%) |
Income Below Poverty Among Single-Parent Households in Fort Hancock
According to the poverty data in Fort Hancock, 100.0% or 49 single-father households and 42.4% or 39 single-mother households are living below the poverty line. Among single-father households, those with 1 or 2 children have the highest poverty rate, with 49 households (100.0%) experiencing poverty. Likewise, among single-mother households, those with 3 or 4 children have the highest poverty rate, with 31 households (100.0%) falling below the poverty line.
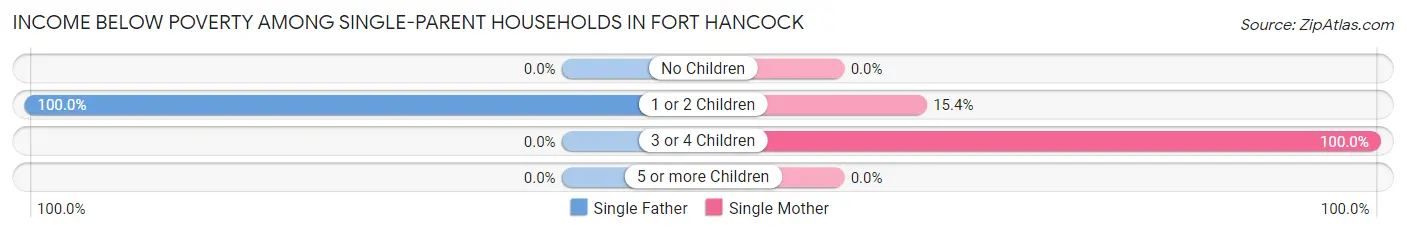
| Children | Single Father | Single Mother |
| No Children | 0 (0.0%) | 0 (0.0%) |
| 1 or 2 Children | 49 (100.0%) | 8 (15.4%) |
| 3 or 4 Children | 0 (0.0%) | 31 (100.0%) |
| 5 or more Children | 0 (0.0%) | 0 (0.0%) |
| Total | 49 (100.0%) | 39 (42.4%) |
Income Below Poverty Among Married-Couple vs Single-Parent Households in Fort Hancock
The poverty data for Fort Hancock shows that 38 of the married-couple family households (19.9%) and 88 of the single-parent households (62.4%) are living below the poverty level. Within the married-couple family households, those with 1 or 2 children have the highest poverty rate, with 29 households (32.2%) falling below the poverty line. Among the single-parent households, those with 3 or 4 children have the highest poverty rate, with 31 household (100.0%) living below poverty.
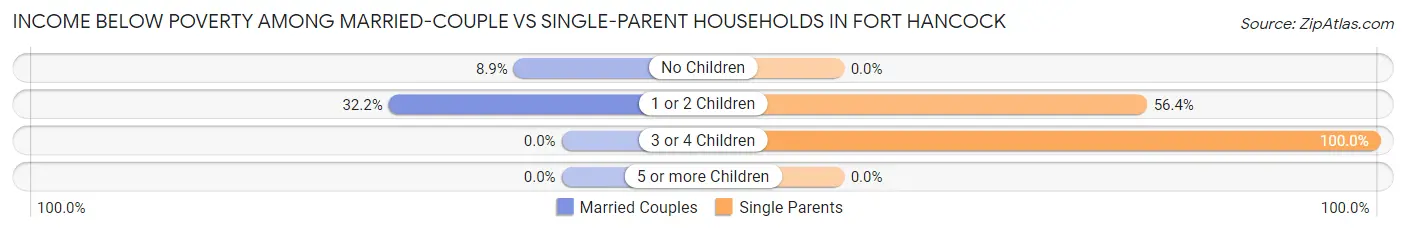
| Children | Married-Couple Families | Single-Parent Households |
| No Children | 9 (8.9%) | 0 (0.0%) |
| 1 or 2 Children | 29 (32.2%) | 57 (56.4%) |
| 3 or 4 Children | 0 (0.0%) | 31 (100.0%) |
| 5 or more Children | 0 (0.0%) | 0 (0.0%) |
| Total | 38 (19.9%) | 88 (62.4%) |
Race in Fort Hancock
The most populous races in Fort Hancock are Hispanic or Latino (1,197 | 98.7%), Two or more Races (635 | 52.3%), and White / Caucasian (499 | 41.1%).
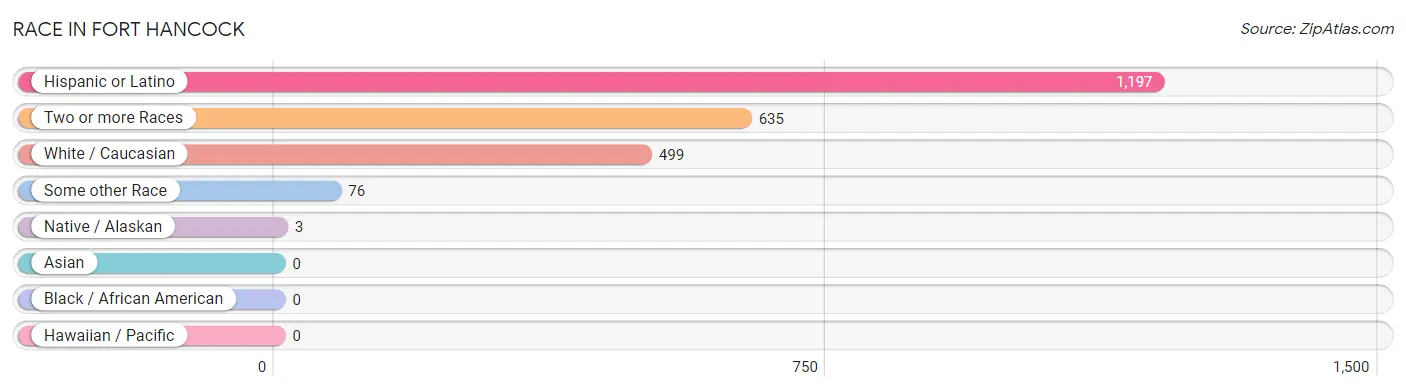
| Race | # Population | % Population |
| Asian | 0 | 0.0% |
| Black / African American | 0 | 0.0% |
| Hawaiian / Pacific | 0 | 0.0% |
| Hispanic or Latino | 1,197 | 98.7% |
| Native / Alaskan | 3 | 0.3% |
| White / Caucasian | 499 | 41.1% |
| Two or more Races | 635 | 52.3% |
| Some other Race | 76 | 6.3% |
| Total | 1,213 | 100.0% |
Ancestry in Fort Hancock
The most populous ancestries reported in Fort Hancock are Mexican (1,160 | 95.6%), French (8 | 0.7%), American (6 | 0.5%), and Central American Indian (3 | 0.3%), together accounting for 97.0% of all Fort Hancock residents.
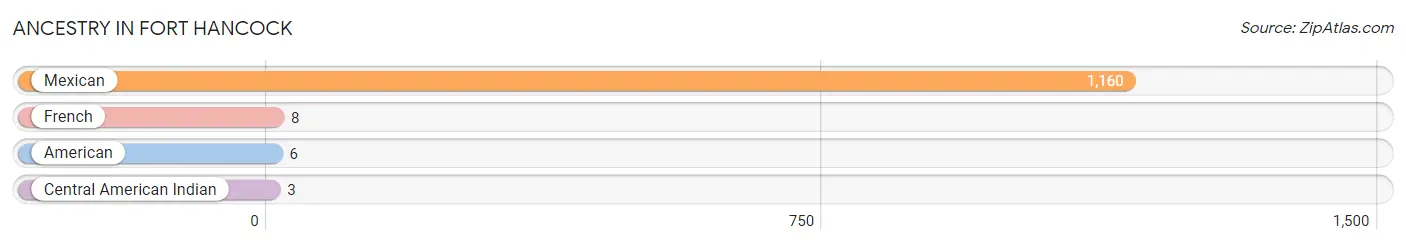
| Ancestry | # Population | % Population |
| American | 6 | 0.5% |
| Central American Indian | 3 | 0.3% |
| French | 8 | 0.7% |
| Mexican | 1,160 | 95.6% | View All 4 Rows |
Immigrants in Fort Hancock
The most numerous immigrant groups reported in Fort Hancock came from Central America (361 | 29.8%), Latin America (361 | 29.8%), Mexico (361 | 29.8%), Asia (3 | 0.3%), and South Eastern Asia (3 | 0.3%), together accounting for 89.8% of all Fort Hancock residents.
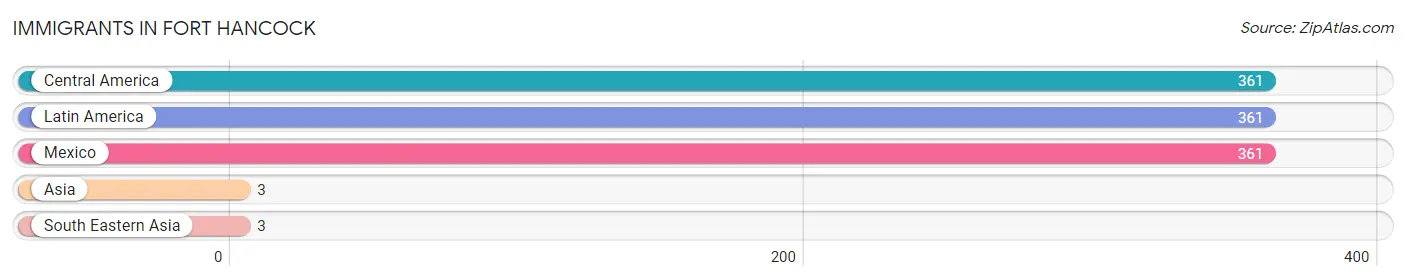
| Immigration Origin | # Population | % Population |
| Asia | 3 | 0.3% |
| Central America | 361 | 29.8% |
| Latin America | 361 | 29.8% |
| Mexico | 361 | 29.8% |
| South Eastern Asia | 3 | 0.3% | View All 5 Rows |
Sex and Age in Fort Hancock
Sex and Age in Fort Hancock
The most populous age groups in Fort Hancock are 20 to 24 Years (157 | 23.4%) for men and 40 to 44 Years (96 | 17.7%) for women.
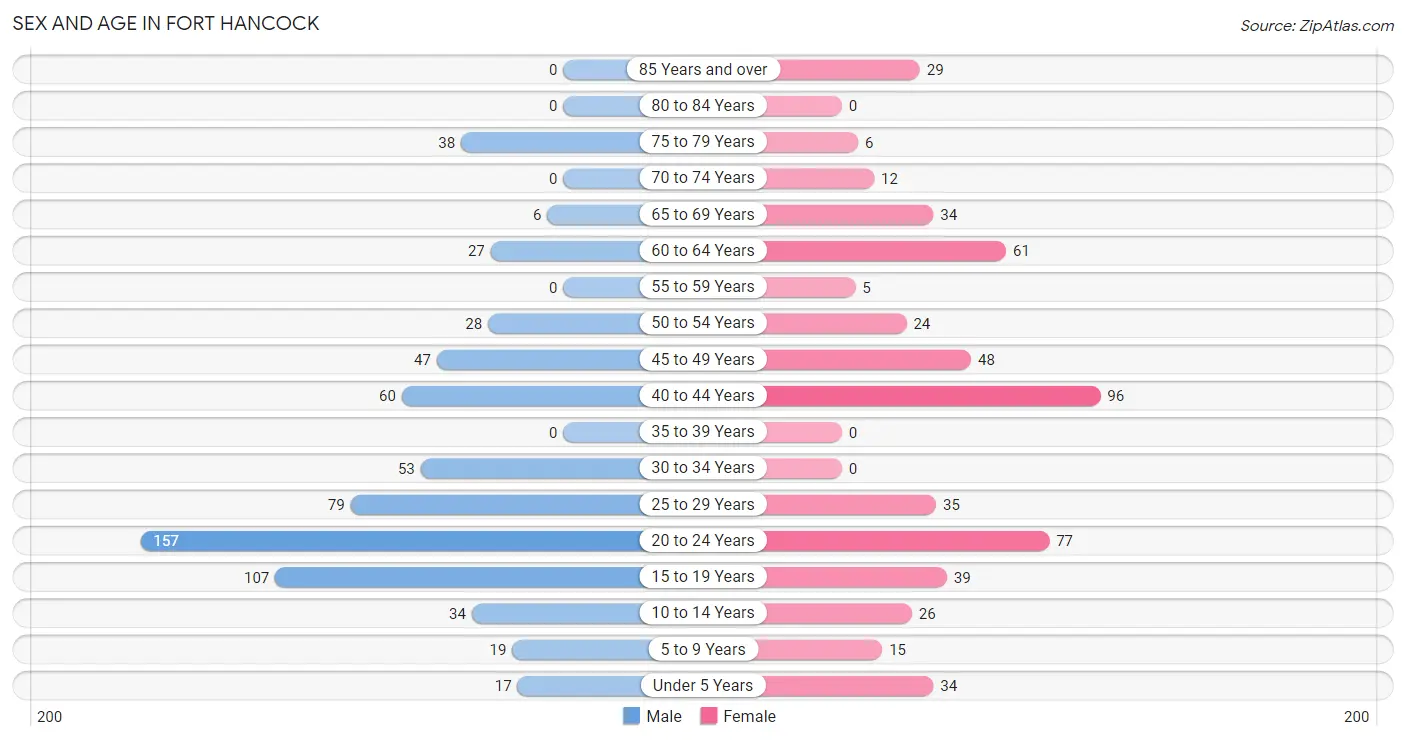
| Age Bracket | Male | Female |
| Under 5 Years | 17 (2.5%) | 34 (6.3%) |
| 5 to 9 Years | 19 (2.8%) | 15 (2.8%) |
| 10 to 14 Years | 34 (5.1%) | 26 (4.8%) |
| 15 to 19 Years | 107 (15.9%) | 39 (7.2%) |
| 20 to 24 Years | 157 (23.4%) | 77 (14.2%) |
| 25 to 29 Years | 79 (11.8%) | 35 (6.5%) |
| 30 to 34 Years | 53 (7.9%) | 0 (0.0%) |
| 35 to 39 Years | 0 (0.0%) | 0 (0.0%) |
| 40 to 44 Years | 60 (8.9%) | 96 (17.7%) |
| 45 to 49 Years | 47 (7.0%) | 48 (8.9%) |
| 50 to 54 Years | 28 (4.2%) | 24 (4.4%) |
| 55 to 59 Years | 0 (0.0%) | 5 (0.9%) |
| 60 to 64 Years | 27 (4.0%) | 61 (11.3%) |
| 65 to 69 Years | 6 (0.9%) | 34 (6.3%) |
| 70 to 74 Years | 0 (0.0%) | 12 (2.2%) |
| 75 to 79 Years | 38 (5.7%) | 6 (1.1%) |
| 80 to 84 Years | 0 (0.0%) | 0 (0.0%) |
| 85 Years and over | 0 (0.0%) | 29 (5.4%) |
| Total | 672 (100.0%) | 541 (100.0%) |
Families and Households in Fort Hancock
Median Family Size in Fort Hancock
The median family size in Fort Hancock is 3.38 persons per family, with single female/mother families (92 | 27.7%) accounting for the largest median family size of 3.93 persons per family. On the other hand, single male/father families (49 | 14.8%) represent the smallest median family size with 2.02 persons per family.
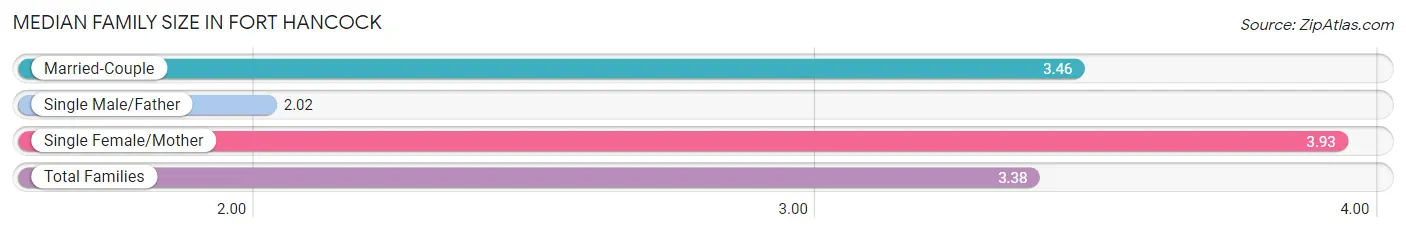
| Family Type | # Families | Family Size |
| Married-Couple | 191 (57.5%) | 3.46 |
| Single Male/Father | 49 (14.8%) | 2.02 |
| Single Female/Mother | 92 (27.7%) | 3.93 |
| Total Families | 332 (100.0%) | 3.38 |
Median Household Size in Fort Hancock
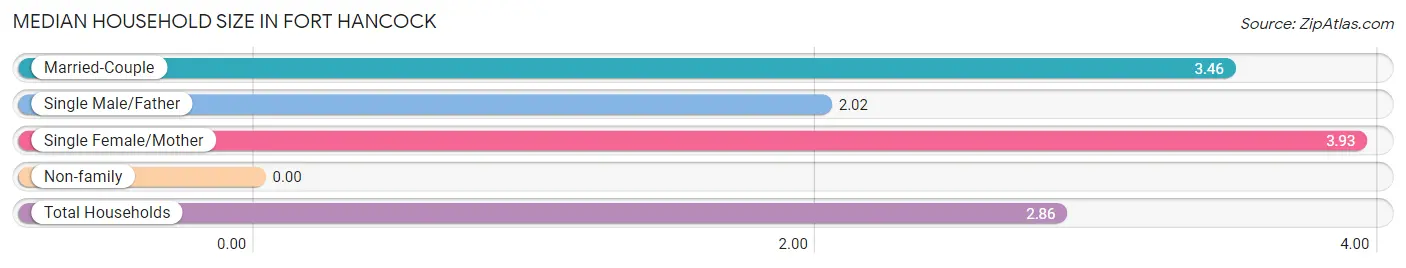
| Household Type | # Households | Household Size |
| Married-Couple | 191 (45.1%) | 3.46 |
| Single Male/Father | 49 (11.6%) | 2.02 |
| Single Female/Mother | 92 (21.7%) | 3.93 |
| Non-family | 92 (21.7%) | - |
| Total Households | 424 (100.0%) | 2.86 |
Household Size by Marriage Status in Fort Hancock
Out of a total of 424 households in Fort Hancock, 332 (78.3%) are family households, while 92 (21.7%) are nonfamily households. The most numerous type of family households are 4-person households, comprising 115, and the most common type of nonfamily households are 1-person households, comprising 92.
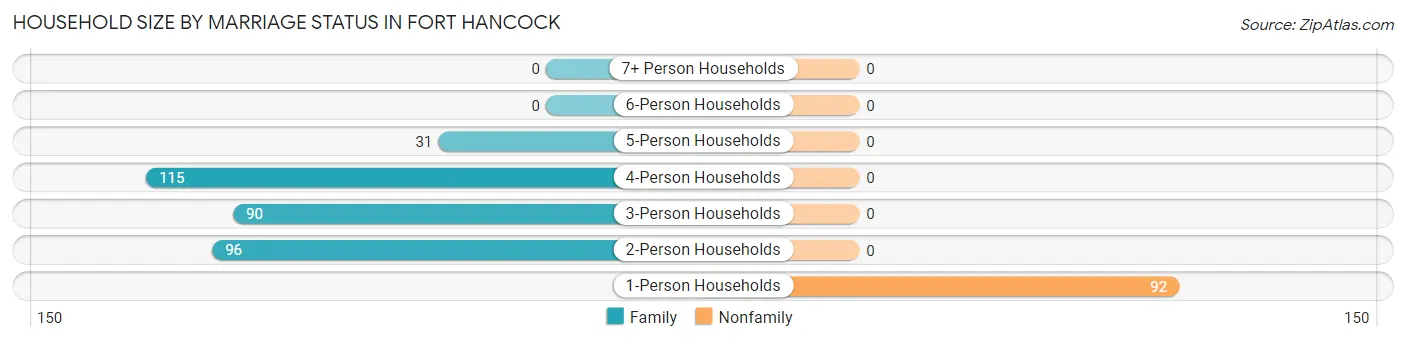
| Household Size | Family Households | Nonfamily Households |
| 1-Person Households | - | 92 (21.7%) |
| 2-Person Households | 96 (22.6%) | 0 (0.0%) |
| 3-Person Households | 90 (21.2%) | 0 (0.0%) |
| 4-Person Households | 115 (27.1%) | 0 (0.0%) |
| 5-Person Households | 31 (7.3%) | 0 (0.0%) |
| 6-Person Households | 0 (0.0%) | 0 (0.0%) |
| 7+ Person Households | 0 (0.0%) | 0 (0.0%) |
| Total | 332 (78.3%) | 92 (21.7%) |
Female Fertility in Fort Hancock
Fertility by Age in Fort Hancock
Average fertility rate in Fort Hancock is 44.0 births per 1,000 women. Women in the age bracket of 20 to 34 years have the highest fertility rate with 116.0 births per 1,000 women. Women in the age bracket of 20 to 34 years acount for 100.0% of all women with births.
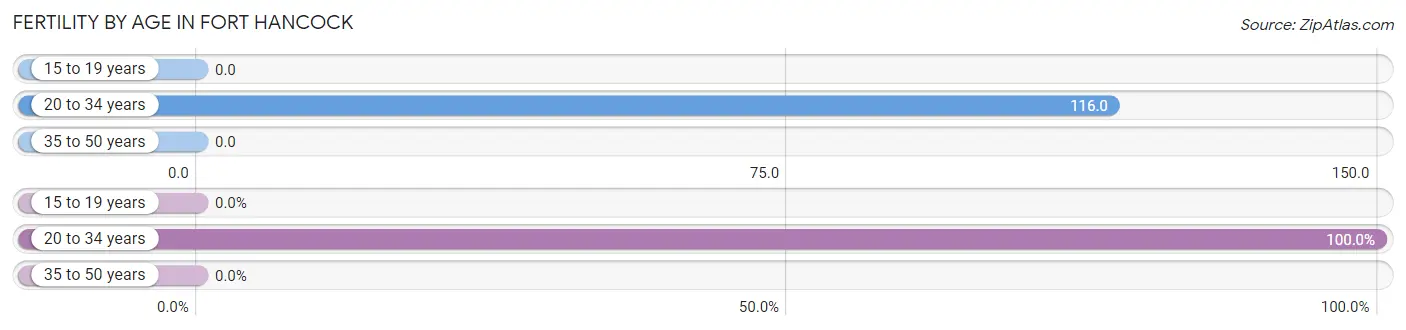
| Age Bracket | Women with Births | Births / 1,000 Women |
| 15 to 19 years | 0 (0.0%) | 0.0 |
| 20 to 34 years | 13 (100.0%) | 116.0 |
| 35 to 50 years | 0 (0.0%) | 0.0 |
| Total | 13 (100.0%) | 44.0 |
Fertility by Age by Marriage Status in Fort Hancock
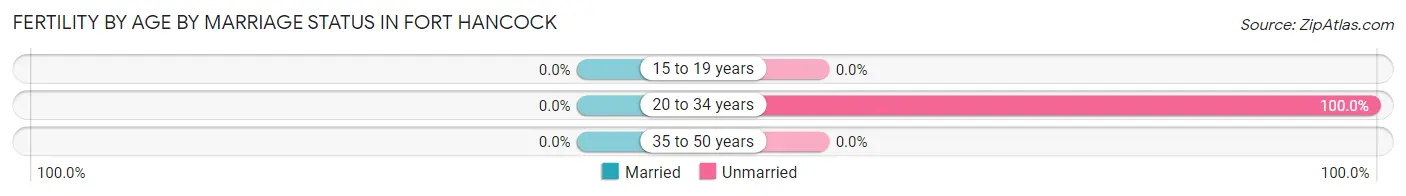
| Age Bracket | Married | Unmarried |
| 15 to 19 years | 0 (0.0%) | 0 (0.0%) |
| 20 to 34 years | 0 (0.0%) | 13 (100.0%) |
| 35 to 50 years | 0 (0.0%) | 0 (0.0%) |
| Total | 0 (0.0%) | 13 (100.0%) |
Fertility by Education in Fort Hancock
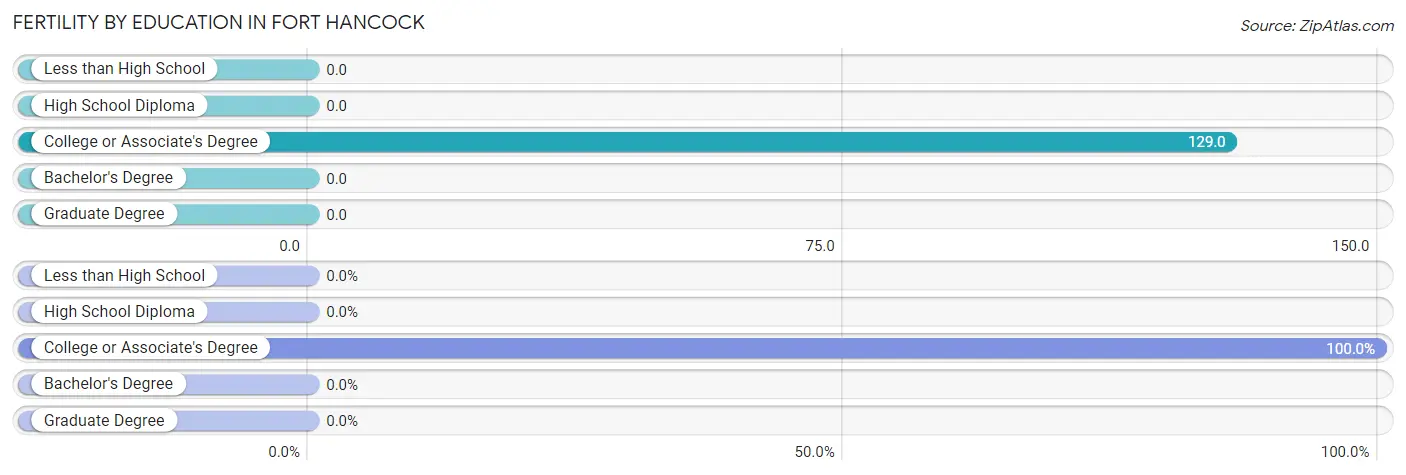
| Educational Attainment | Women with Births | Births / 1,000 Women |
| Less than High School | 0 (0.0%) | 0.0 |
| High School Diploma | 0 (0.0%) | 0.0 |
| College or Associate's Degree | 13 (100.0%) | 129.0 |
| Bachelor's Degree | 0 (0.0%) | 0.0 |
| Graduate Degree | 0 (0.0%) | 0.0 |
| Total | 13 (100.0%) | 44.0 |
Fertility by Education by Marriage Status in Fort Hancock
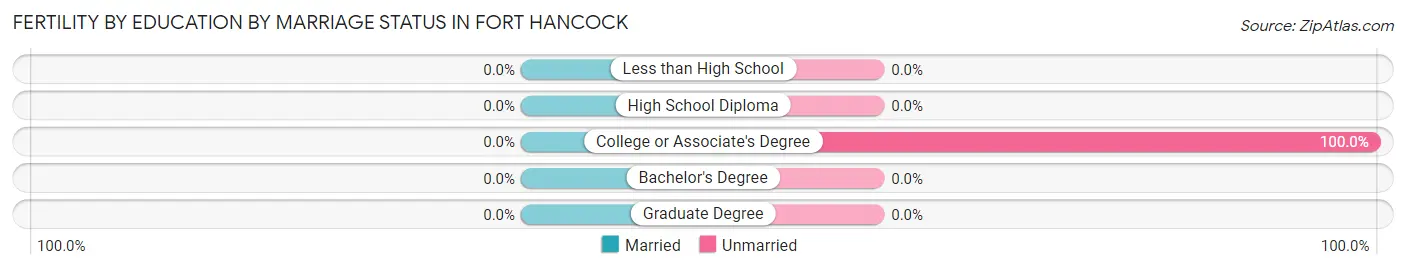
| Educational Attainment | Married | Unmarried |
| Less than High School | 0 (0.0%) | 0 (0.0%) |
| High School Diploma | 0 (0.0%) | 0 (0.0%) |
| College or Associate's Degree | 0 (0.0%) | 13 (100.0%) |
| Bachelor's Degree | 0 (0.0%) | 0 (0.0%) |
| Graduate Degree | 0 (0.0%) | 0 (0.0%) |
| Total | 0 (0.0%) | 13 (100.0%) |
Employment Characteristics in Fort Hancock
Employment by Class of Employer in Fort Hancock
Among the 567 employed individuals in Fort Hancock, private company employees (317 | 55.9%), state government employees (89 | 15.7%), and self-employed (not incorporated) (79 | 13.9%) make up the most common classes of employment.
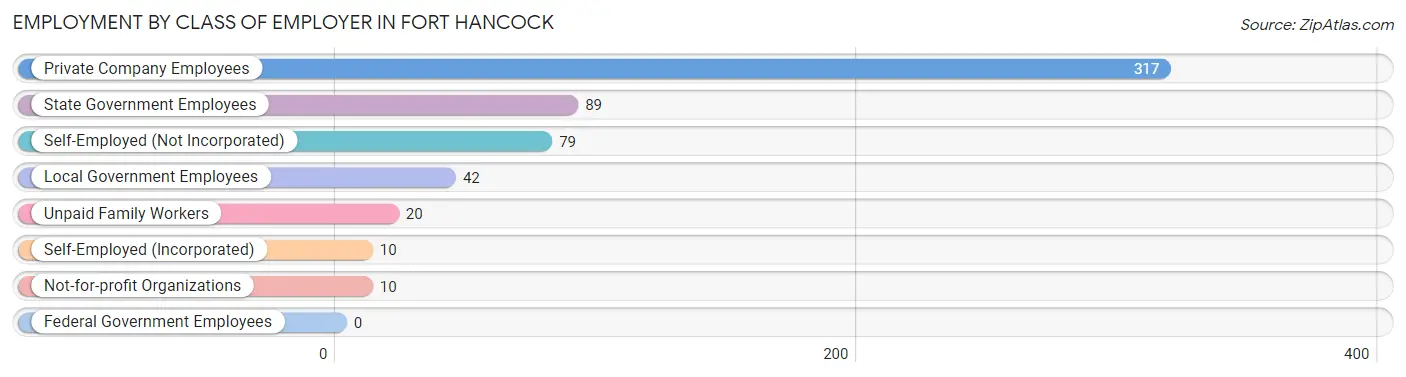
| Employer Class | # Employees | % Employees |
| Private Company Employees | 317 | 55.9% |
| Self-Employed (Incorporated) | 10 | 1.8% |
| Self-Employed (Not Incorporated) | 79 | 13.9% |
| Not-for-profit Organizations | 10 | 1.8% |
| Local Government Employees | 42 | 7.4% |
| State Government Employees | 89 | 15.7% |
| Federal Government Employees | 0 | 0.0% |
| Unpaid Family Workers | 20 | 3.5% |
| Total | 567 | 100.0% |
Employment Status by Age in Fort Hancock
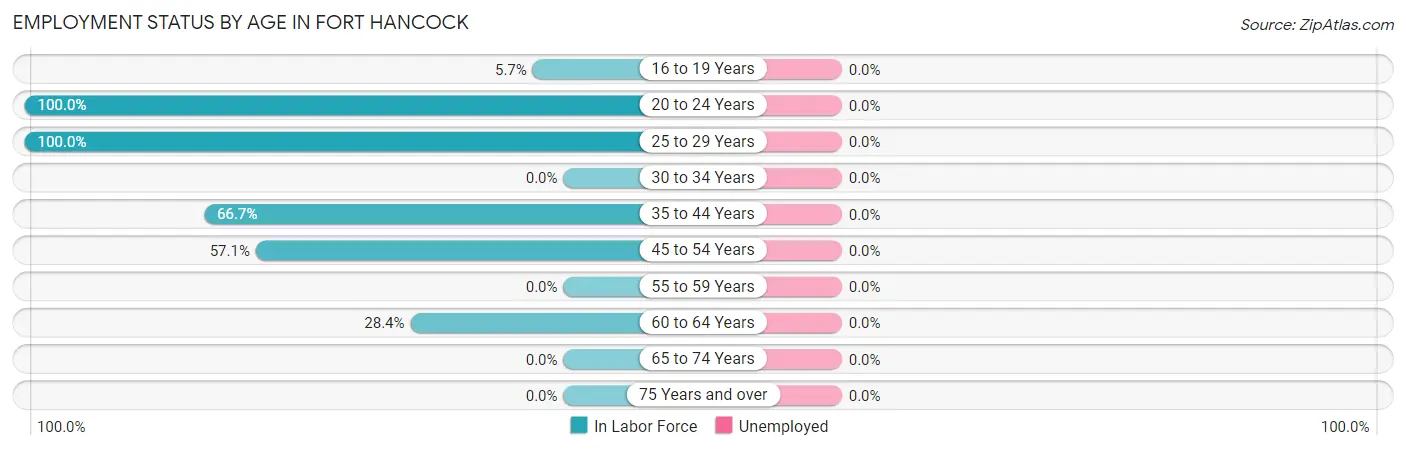
| Age Bracket | In Labor Force | Unemployed |
| 16 to 19 Years | 6 (5.7%) | 0 (0.0%) |
| 20 to 24 Years | 234 (100.0%) | 0 (0.0%) |
| 25 to 29 Years | 114 (100.0%) | 0 (0.0%) |
| 30 to 34 Years | 0 (0.0%) | 0 (0.0%) |
| 35 to 44 Years | 104 (66.7%) | 0 (0.0%) |
| 45 to 54 Years | 84 (57.1%) | 0 (0.0%) |
| 55 to 59 Years | 0 (0.0%) | 0 (0.0%) |
| 60 to 64 Years | 25 (28.4%) | 0 (0.0%) |
| 65 to 74 Years | 0 (0.0%) | 0 (0.0%) |
| 75 Years and over | 0 (0.0%) | 0 (0.0%) |
| Total | 567 (55.2%) | 0 (0.0%) |
Employment Status by Educational Attainment in Fort Hancock
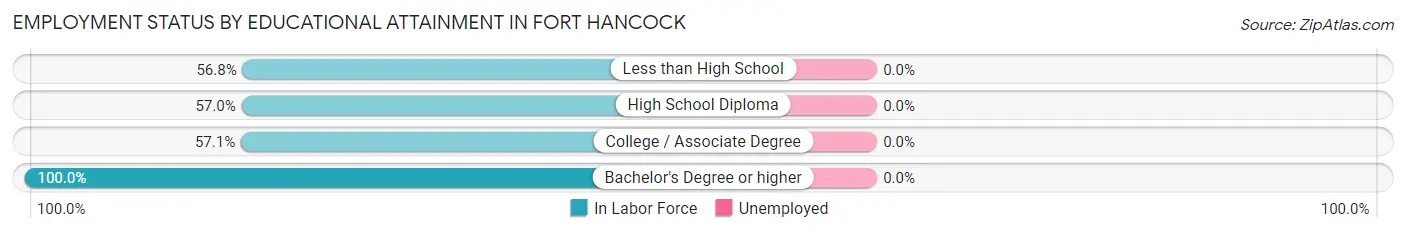
| Educational Attainment | In Labor Force | Unemployed |
| Less than High School | 146 (56.8%) | 0 (0.0%) |
| High School Diploma | 142 (57.0%) | 0 (0.0%) |
| College / Associate Degree | 24 (57.1%) | 0 (0.0%) |
| Bachelor's Degree or higher | 15 (100.0%) | 0 (0.0%) |
| Total | 327 (58.1%) | 0 (0.0%) |
Employment Occupations by Sex in Fort Hancock
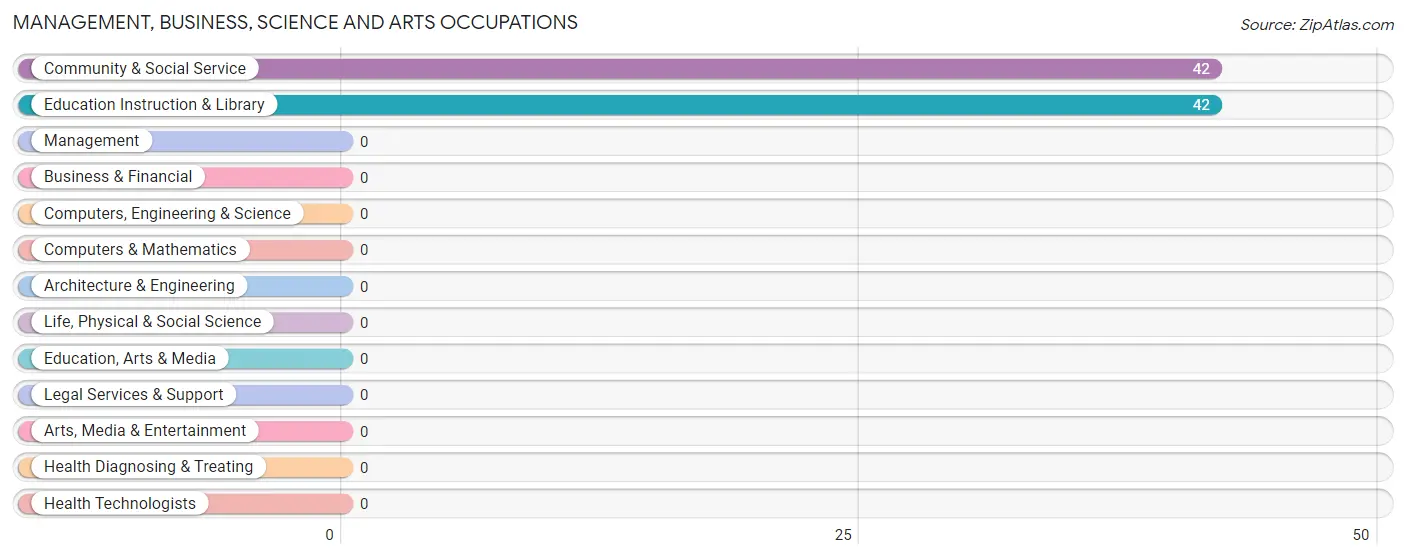
Management, Business, Science and Arts Occupations
The most common Management, Business, Science and Arts occupations in Fort Hancock are Community & Social Service (42 | 7.4%), and Education Instruction & Library (42 | 7.4%).
Management, Business, Science and Arts Occupations by Sex
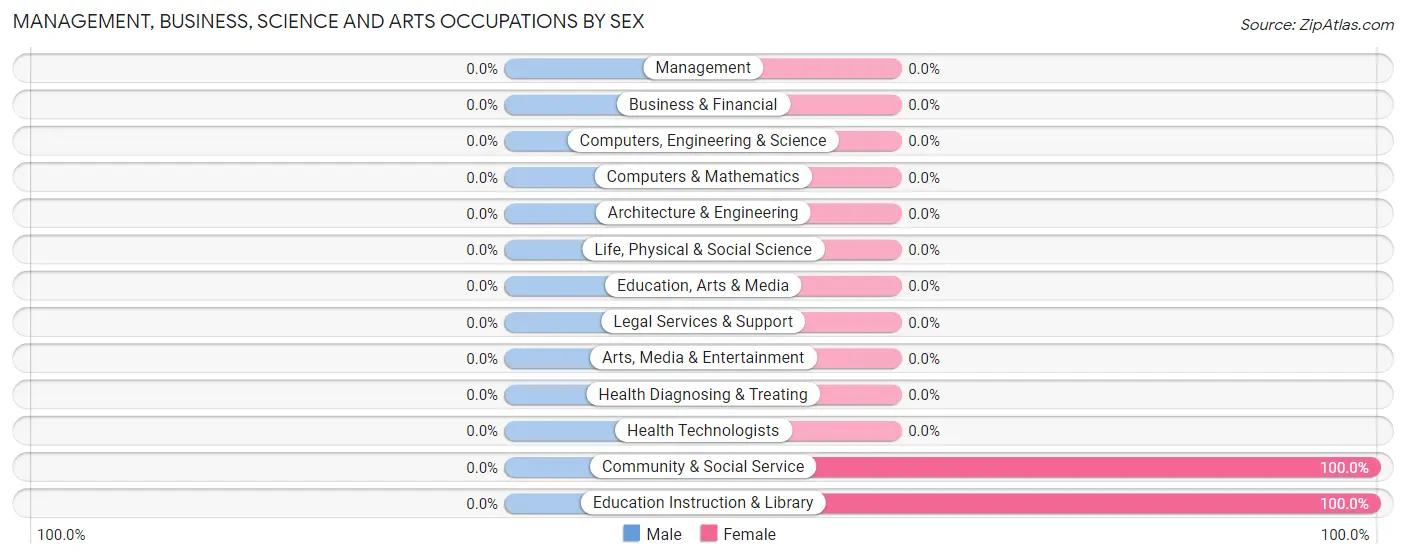
| Occupation | Male | Female |
| Management | 0 (0.0%) | 0 (0.0%) |
| Business & Financial | 0 (0.0%) | 0 (0.0%) |
| Computers, Engineering & Science | 0 (0.0%) | 0 (0.0%) |
| Computers & Mathematics | 0 (0.0%) | 0 (0.0%) |
| Architecture & Engineering | 0 (0.0%) | 0 (0.0%) |
| Life, Physical & Social Science | 0 (0.0%) | 0 (0.0%) |
| Community & Social Service | 0 (0.0%) | 42 (100.0%) |
| Education, Arts & Media | 0 (0.0%) | 0 (0.0%) |
| Legal Services & Support | 0 (0.0%) | 0 (0.0%) |
| Education Instruction & Library | 0 (0.0%) | 42 (100.0%) |
| Arts, Media & Entertainment | 0 (0.0%) | 0 (0.0%) |
| Health Diagnosing & Treating | 0 (0.0%) | 0 (0.0%) |
| Health Technologists | 0 (0.0%) | 0 (0.0%) |
| Total (Category) | 0 (0.0%) | 42 (100.0%) |
| Total (Overall) | 327 (57.7%) | 240 (42.3%) |
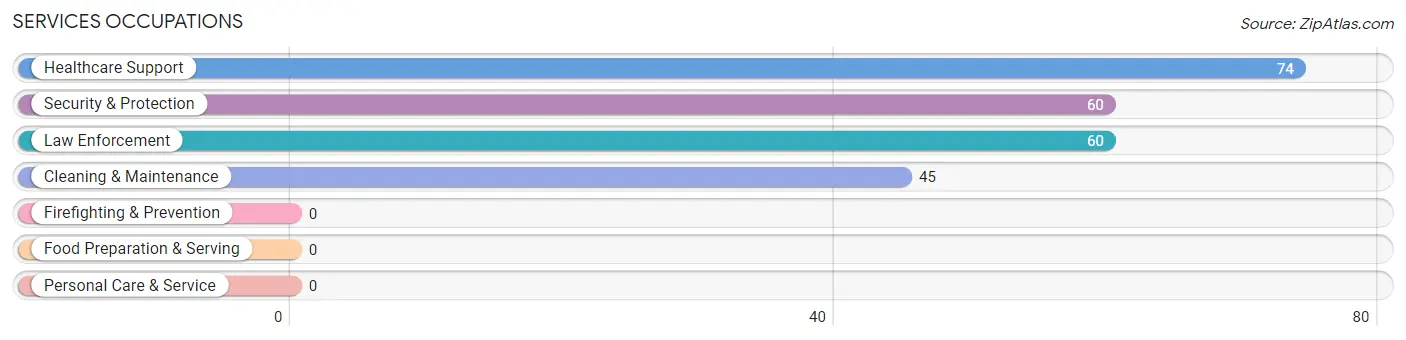
Services Occupations
The most common Services occupations in Fort Hancock are Healthcare Support (74 | 13.1%), Security & Protection (60 | 10.6%), Law Enforcement (60 | 10.6%), and Cleaning & Maintenance (45 | 7.9%).
Services Occupations by Sex
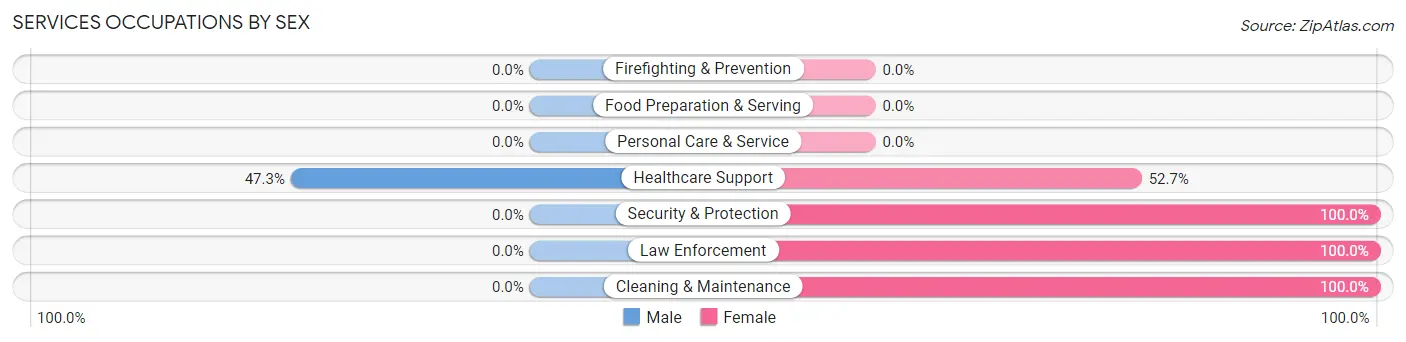
| Occupation | Male | Female |
| Healthcare Support | 35 (47.3%) | 39 (52.7%) |
| Security & Protection | 0 (0.0%) | 60 (100.0%) |
| Firefighting & Prevention | 0 (0.0%) | 0 (0.0%) |
| Law Enforcement | 0 (0.0%) | 60 (100.0%) |
| Food Preparation & Serving | 0 (0.0%) | 0 (0.0%) |
| Cleaning & Maintenance | 0 (0.0%) | 45 (100.0%) |
| Personal Care & Service | 0 (0.0%) | 0 (0.0%) |
| Total (Category) | 35 (19.6%) | 144 (80.4%) |
| Total (Overall) | 327 (57.7%) | 240 (42.3%) |
Sales and Office Occupations
The most common Sales and Office occupations in Fort Hancock are Office & Administration (29 | 5.1%), and Sales & Related (17 | 3.0%).
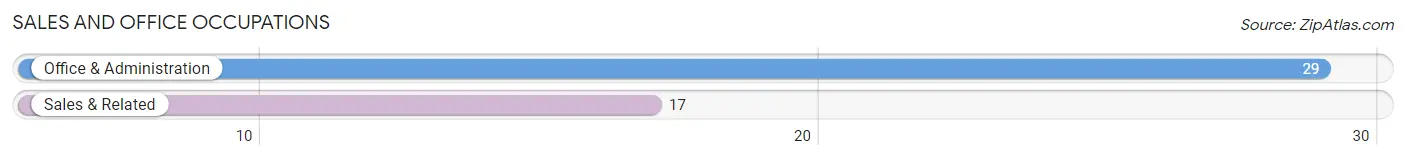
Sales and Office Occupations by Sex
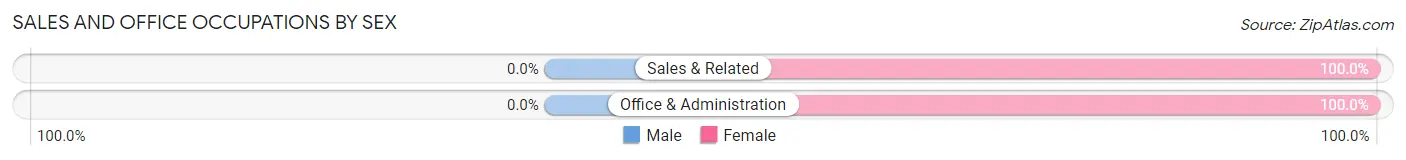
| Occupation | Male | Female |
| Sales & Related | 0 (0.0%) | 17 (100.0%) |
| Office & Administration | 0 (0.0%) | 29 (100.0%) |
| Total (Category) | 0 (0.0%) | 46 (100.0%) |
| Total (Overall) | 327 (57.7%) | 240 (42.3%) |
Natural Resources, Construction and Maintenance Occupations
The most common Natural Resources, Construction and Maintenance occupations in Fort Hancock are Installation, Maintenance & Repair (157 | 27.7%), and Farming, Fishing & Forestry (48 | 8.5%).
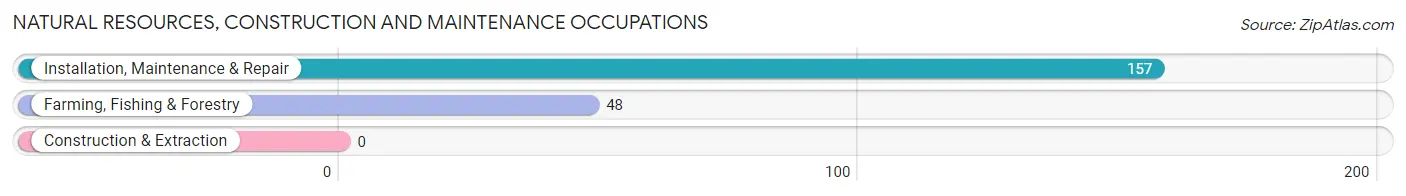
Natural Resources, Construction and Maintenance Occupations by Sex
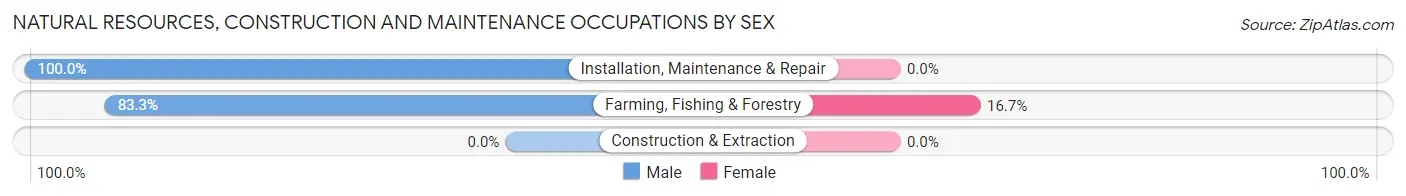
| Occupation | Male | Female |
| Farming, Fishing & Forestry | 40 (83.3%) | 8 (16.7%) |
| Construction & Extraction | 0 (0.0%) | 0 (0.0%) |
| Installation, Maintenance & Repair | 157 (100.0%) | 0 (0.0%) |
| Total (Category) | 197 (96.1%) | 8 (3.9%) |
| Total (Overall) | 327 (57.7%) | 240 (42.3%) |
Production, Transportation and Moving Occupations
The most common Production, Transportation and Moving occupations in Fort Hancock are , and Transportation (95 | 16.8%).
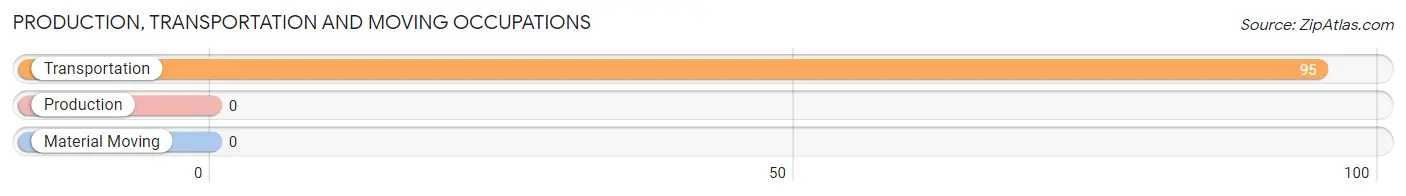
Production, Transportation and Moving Occupations by Sex
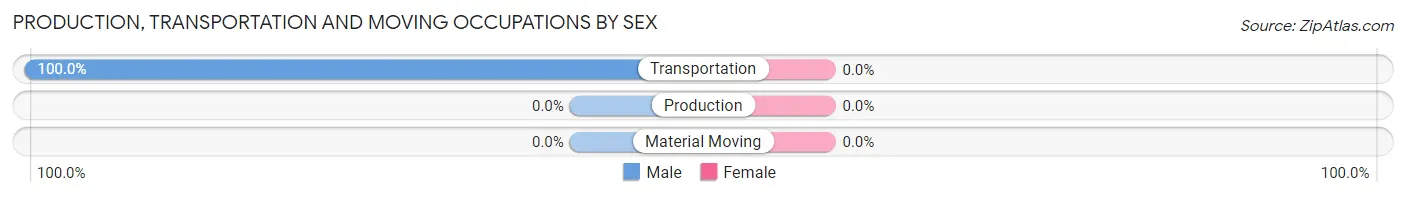
| Occupation | Male | Female |
| Production | 0 (0.0%) | 0 (0.0%) |
| Transportation | 95 (100.0%) | 0 (0.0%) |
| Material Moving | 0 (0.0%) | 0 (0.0%) |
| Total (Category) | 95 (100.0%) | 0 (0.0%) |
| Total (Overall) | 327 (57.7%) | 240 (42.3%) |
Employment Industries by Sex in Fort Hancock
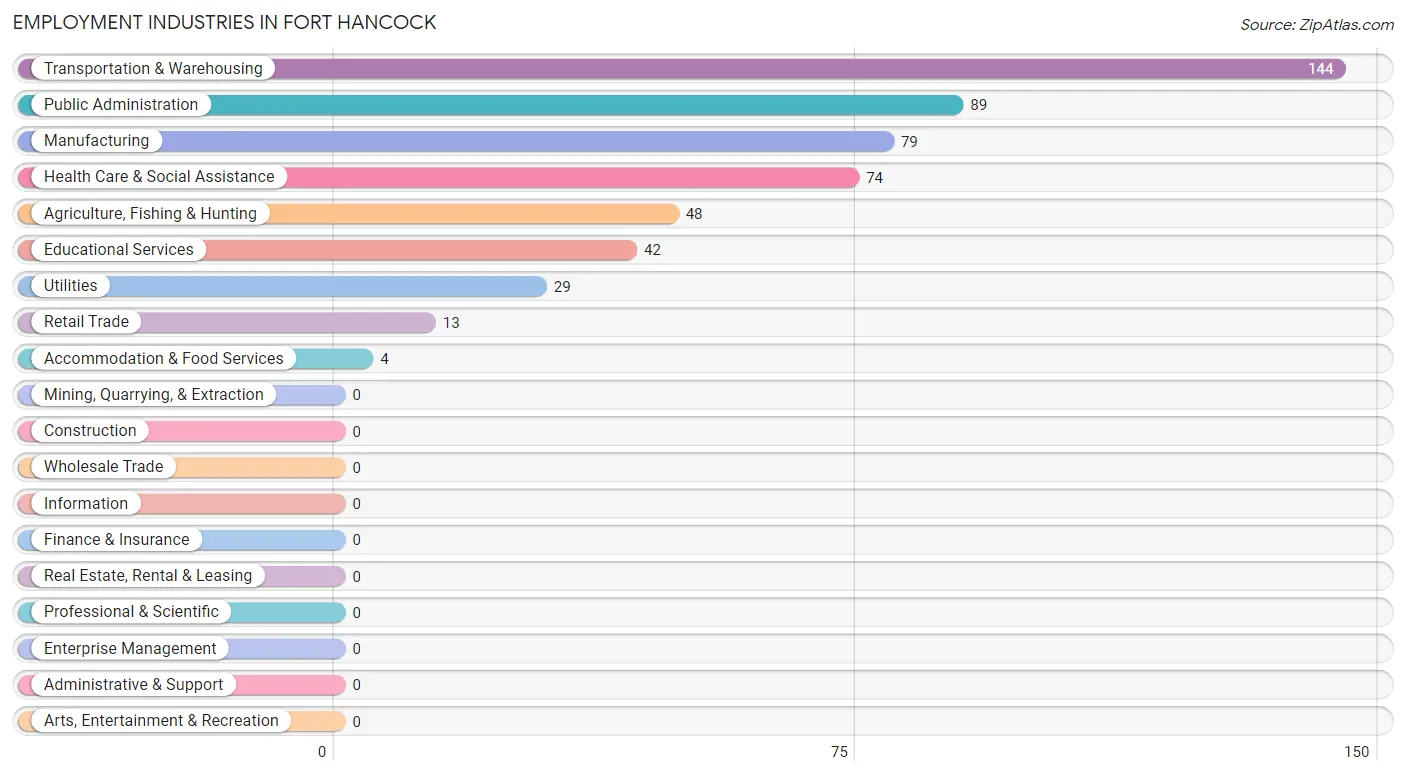
Employment Industries in Fort Hancock
The major employment industries in Fort Hancock include Transportation & Warehousing (144 | 25.4%), Public Administration (89 | 15.7%), Manufacturing (79 | 13.9%), Health Care & Social Assistance (74 | 13.1%), and Agriculture, Fishing & Hunting (48 | 8.5%).
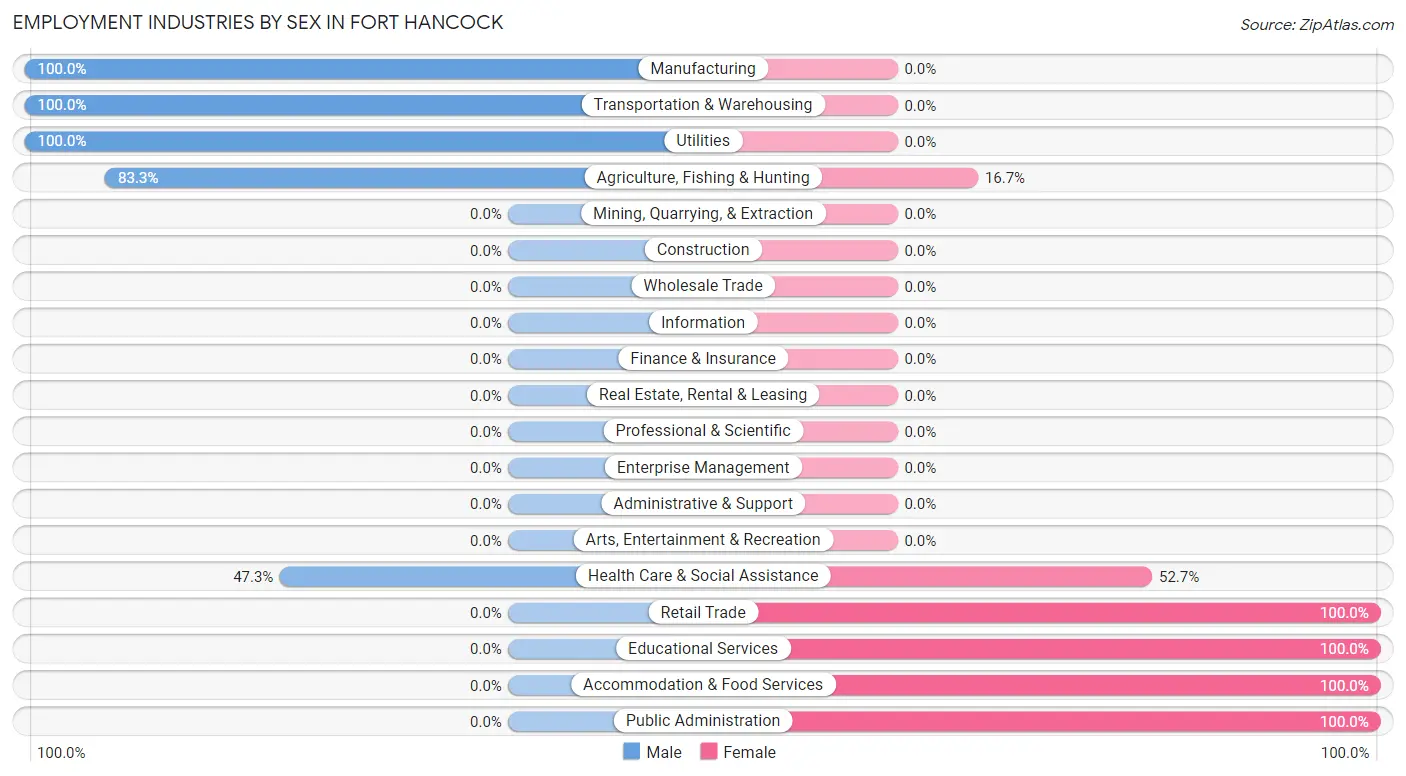
Employment Industries by Sex in Fort Hancock
The Fort Hancock industries that see more men than women are Manufacturing (100.0%), Transportation & Warehousing (100.0%), and Utilities (100.0%), whereas the industries that tend to have a higher number of women are Retail Trade (100.0%), Educational Services (100.0%), and Accommodation & Food Services (100.0%).
| Industry | Male | Female |
| Agriculture, Fishing & Hunting | 40 (83.3%) | 8 (16.7%) |
| Mining, Quarrying, & Extraction | 0 (0.0%) | 0 (0.0%) |
| Construction | 0 (0.0%) | 0 (0.0%) |
| Manufacturing | 79 (100.0%) | 0 (0.0%) |
| Wholesale Trade | 0 (0.0%) | 0 (0.0%) |
| Retail Trade | 0 (0.0%) | 13 (100.0%) |
| Transportation & Warehousing | 144 (100.0%) | 0 (0.0%) |
| Utilities | 29 (100.0%) | 0 (0.0%) |
| Information | 0 (0.0%) | 0 (0.0%) |
| Finance & Insurance | 0 (0.0%) | 0 (0.0%) |
| Real Estate, Rental & Leasing | 0 (0.0%) | 0 (0.0%) |
| Professional & Scientific | 0 (0.0%) | 0 (0.0%) |
| Enterprise Management | 0 (0.0%) | 0 (0.0%) |
| Administrative & Support | 0 (0.0%) | 0 (0.0%) |
| Educational Services | 0 (0.0%) | 42 (100.0%) |
| Health Care & Social Assistance | 35 (47.3%) | 39 (52.7%) |
| Arts, Entertainment & Recreation | 0 (0.0%) | 0 (0.0%) |
| Accommodation & Food Services | 0 (0.0%) | 4 (100.0%) |
| Public Administration | 0 (0.0%) | 89 (100.0%) |
| Total | 327 (57.7%) | 240 (42.3%) |
Education in Fort Hancock
School Enrollment in Fort Hancock
The most common levels of schooling among the 315 students in Fort Hancock are high school (168 | 53.3%), middle school (81 | 25.7%), and kindergarten (20 | 6.4%).
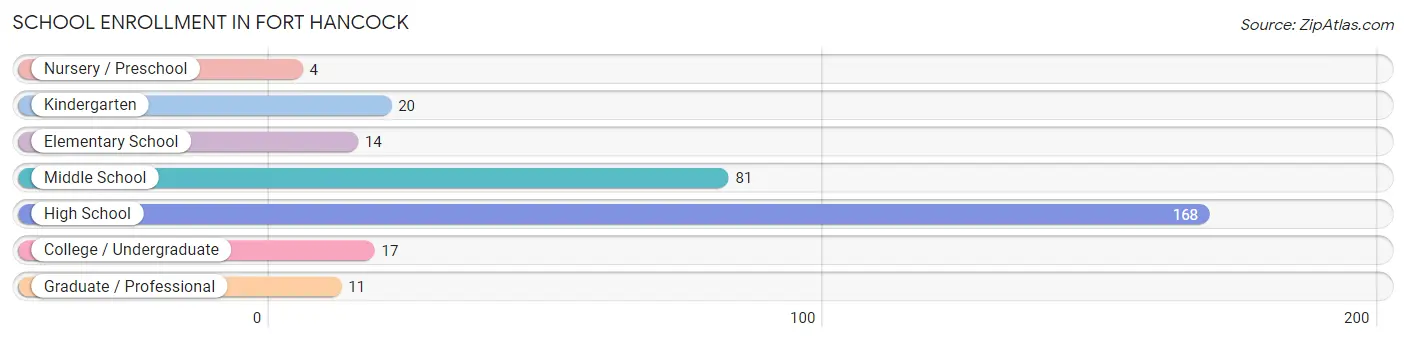
| School Level | # Students | % Students |
| Nursery / Preschool | 4 | 1.3% |
| Kindergarten | 20 | 6.4% |
| Elementary School | 14 | 4.4% |
| Middle School | 81 | 25.7% |
| High School | 168 | 53.3% |
| College / Undergraduate | 17 | 5.4% |
| Graduate / Professional | 11 | 3.5% |
| Total | 315 | 100.0% |
School Enrollment by Age by Funding Source in Fort Hancock
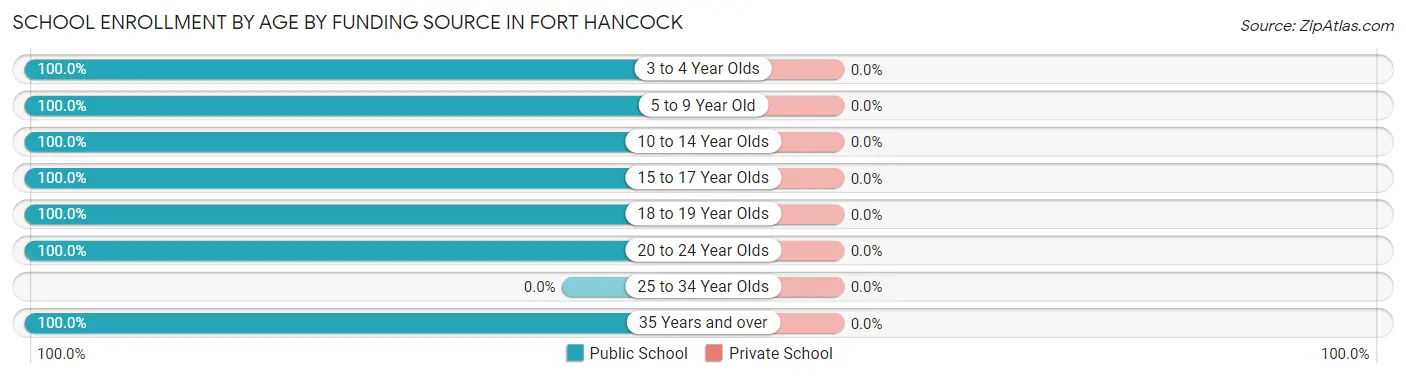
| Age Bracket | Public School | Private School |
| 3 to 4 Year Olds | 4 (100.0%) | 0 (0.0%) |
| 5 to 9 Year Old | 34 (100.0%) | 0 (0.0%) |
| 10 to 14 Year Olds | 60 (100.0%) | 0 (0.0%) |
| 15 to 17 Year Olds | 79 (100.0%) | 0 (0.0%) |
| 18 to 19 Year Olds | 61 (100.0%) | 0 (0.0%) |
| 20 to 24 Year Olds | 66 (100.0%) | 0 (0.0%) |
| 25 to 34 Year Olds | 0 (0.0%) | 0 (0.0%) |
| 35 Years and over | 11 (100.0%) | 0 (0.0%) |
| Total | 315 (100.0%) | 0 (0.0%) |
Educational Attainment by Field of Study in Fort Hancock
Education (15 | 71.4%), and physical & health sciences (6 | 28.6%) are the most common fields of study among 21 individuals in Fort Hancock who have obtained a bachelor's degree or higher.
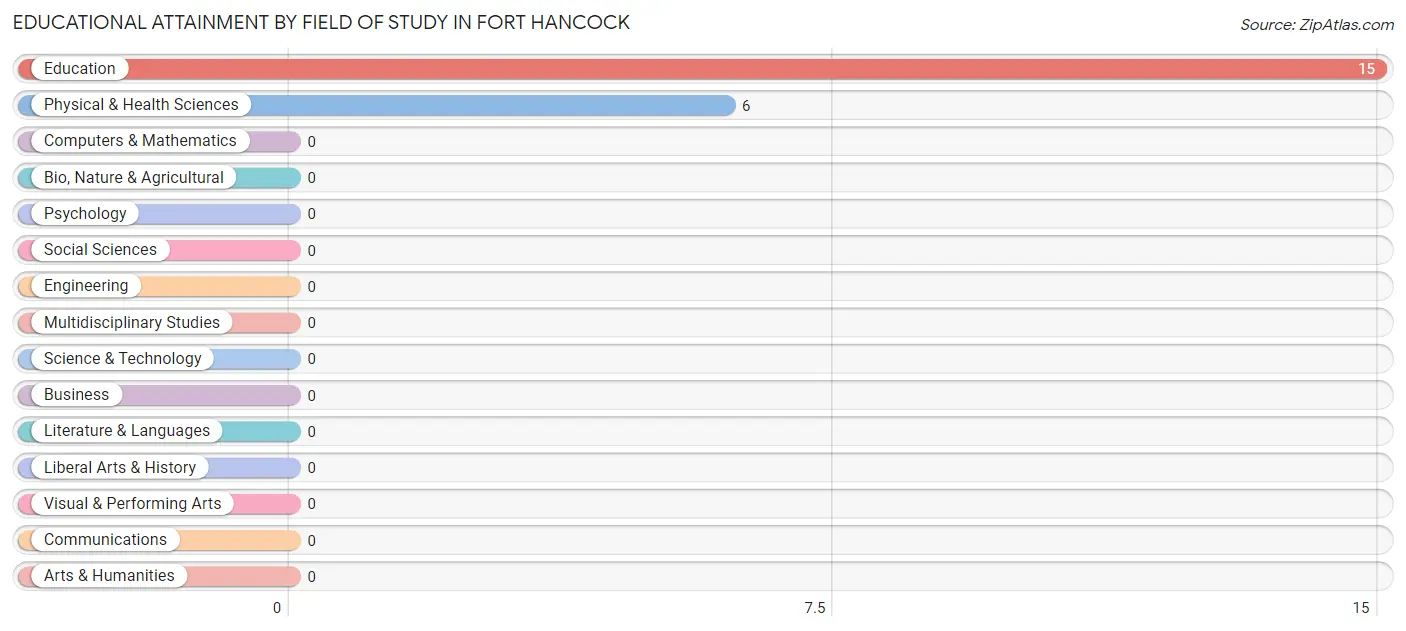
| Field of Study | # Graduates | % Graduates |
| Computers & Mathematics | 0 | 0.0% |
| Bio, Nature & Agricultural | 0 | 0.0% |
| Physical & Health Sciences | 6 | 28.6% |
| Psychology | 0 | 0.0% |
| Social Sciences | 0 | 0.0% |
| Engineering | 0 | 0.0% |
| Multidisciplinary Studies | 0 | 0.0% |
| Science & Technology | 0 | 0.0% |
| Business | 0 | 0.0% |
| Education | 15 | 71.4% |
| Literature & Languages | 0 | 0.0% |
| Liberal Arts & History | 0 | 0.0% |
| Visual & Performing Arts | 0 | 0.0% |
| Communications | 0 | 0.0% |
| Arts & Humanities | 0 | 0.0% |
| Total | 21 | 100.0% |
Transportation & Commute in Fort Hancock
Vehicle Availability by Sex in Fort Hancock
The most prevalent vehicle ownership categories in Fort Hancock are males with 1 vehicle (138, accounting for 42.2%) and females with 1 vehicle (97, making up 57.5%).
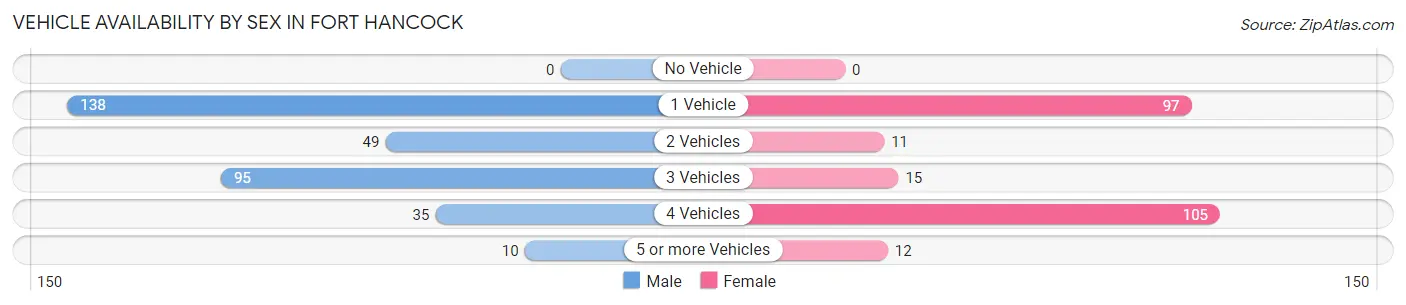
| Vehicles Available | Male | Female |
| No Vehicle | 0 (0.0%) | 0 (0.0%) |
| 1 Vehicle | 138 (42.2%) | 97 (40.4%) |
| 2 Vehicles | 49 (15.0%) | 11 (4.6%) |
| 3 Vehicles | 95 (29.0%) | 15 (6.2%) |
| 4 Vehicles | 35 (10.7%) | 105 (43.8%) |
| 5 or more Vehicles | 10 (3.1%) | 12 (5.0%) |
| Total | 327 (100.0%) | 240 (100.0%) |
Commute Time in Fort Hancock
The most frequently occuring commute durations in Fort Hancock are 5 to 9 minutes (167 commuters, 36.5%), 30 to 34 minutes (123 commuters, 26.9%), and 35 to 39 minutes (60 commuters, 13.1%).
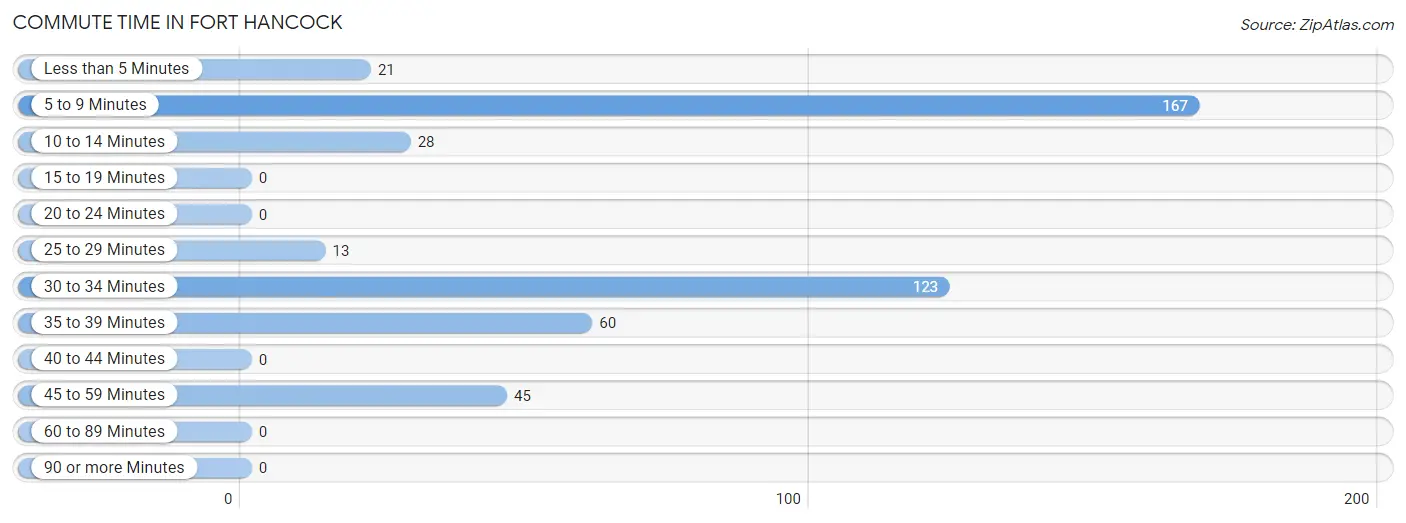
| Commute Time | # Commuters | % Commuters |
| Less than 5 Minutes | 21 | 4.6% |
| 5 to 9 Minutes | 167 | 36.5% |
| 10 to 14 Minutes | 28 | 6.1% |
| 15 to 19 Minutes | 0 | 0.0% |
| 20 to 24 Minutes | 0 | 0.0% |
| 25 to 29 Minutes | 13 | 2.8% |
| 30 to 34 Minutes | 123 | 26.9% |
| 35 to 39 Minutes | 60 | 13.1% |
| 40 to 44 Minutes | 0 | 0.0% |
| 45 to 59 Minutes | 45 | 9.9% |
| 60 to 89 Minutes | 0 | 0.0% |
| 90 or more Minutes | 0 | 0.0% |
Commute Time by Sex in Fort Hancock
The most common commute times in Fort Hancock are 5 to 9 minutes (119 commuters, 48.0%) for males and 35 to 39 minutes (60 commuters, 28.7%) for females.
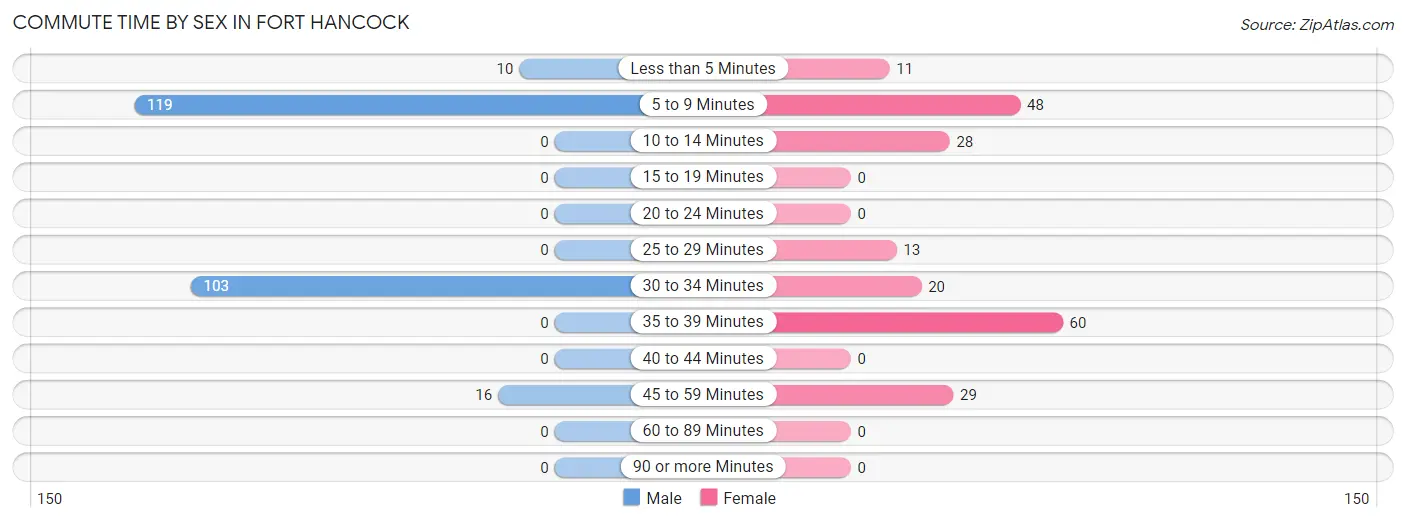
| Commute Time | Male | Female |
| Less than 5 Minutes | 10 (4.0%) | 11 (5.3%) |
| 5 to 9 Minutes | 119 (48.0%) | 48 (23.0%) |
| 10 to 14 Minutes | 0 (0.0%) | 28 (13.4%) |
| 15 to 19 Minutes | 0 (0.0%) | 0 (0.0%) |
| 20 to 24 Minutes | 0 (0.0%) | 0 (0.0%) |
| 25 to 29 Minutes | 0 (0.0%) | 13 (6.2%) |
| 30 to 34 Minutes | 103 (41.5%) | 20 (9.6%) |
| 35 to 39 Minutes | 0 (0.0%) | 60 (28.7%) |
| 40 to 44 Minutes | 0 (0.0%) | 0 (0.0%) |
| 45 to 59 Minutes | 16 (6.5%) | 29 (13.9%) |
| 60 to 89 Minutes | 0 (0.0%) | 0 (0.0%) |
| 90 or more Minutes | 0 (0.0%) | 0 (0.0%) |
Time of Departure to Work by Sex in Fort Hancock
The most frequent times of departure to work in Fort Hancock are 7:00 AM to 7:29 AM (79, 31.9%) for males and 7:00 AM to 7:29 AM (68, 32.5%) for females.
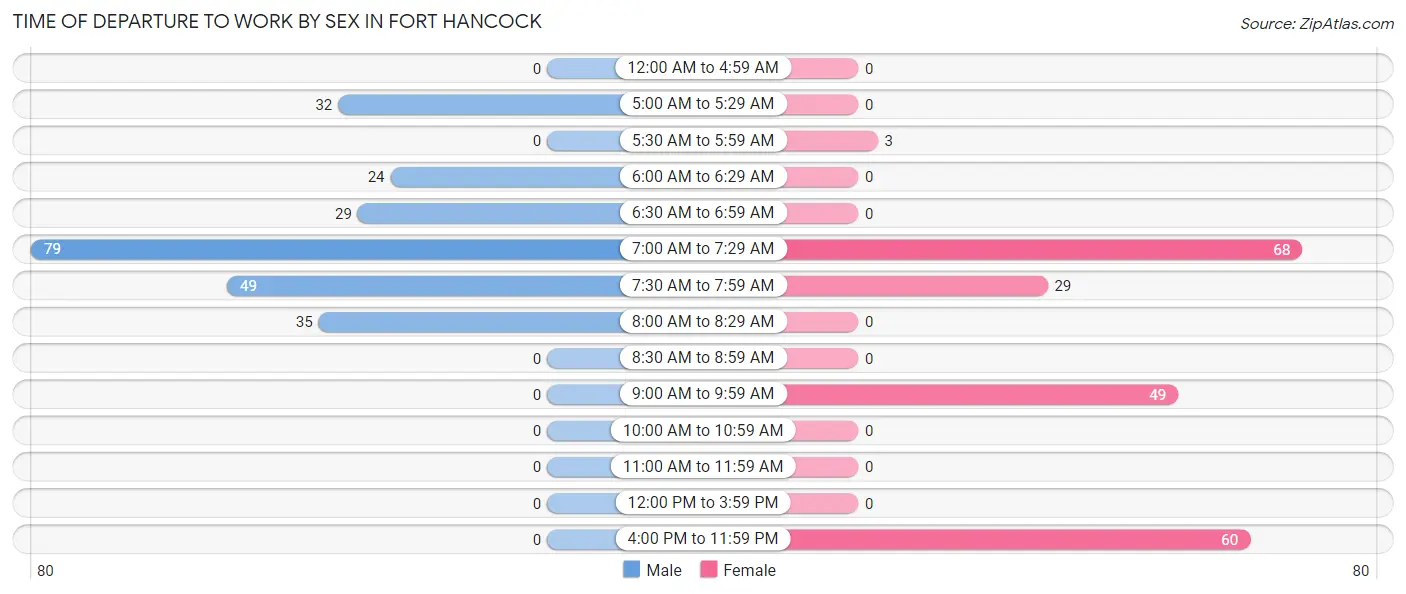
| Time of Departure | Male | Female |
| 12:00 AM to 4:59 AM | 0 (0.0%) | 0 (0.0%) |
| 5:00 AM to 5:29 AM | 32 (12.9%) | 0 (0.0%) |
| 5:30 AM to 5:59 AM | 0 (0.0%) | 3 (1.4%) |
| 6:00 AM to 6:29 AM | 24 (9.7%) | 0 (0.0%) |
| 6:30 AM to 6:59 AM | 29 (11.7%) | 0 (0.0%) |
| 7:00 AM to 7:29 AM | 79 (31.9%) | 68 (32.5%) |
| 7:30 AM to 7:59 AM | 49 (19.8%) | 29 (13.9%) |
| 8:00 AM to 8:29 AM | 35 (14.1%) | 0 (0.0%) |
| 8:30 AM to 8:59 AM | 0 (0.0%) | 0 (0.0%) |
| 9:00 AM to 9:59 AM | 0 (0.0%) | 49 (23.4%) |
| 10:00 AM to 10:59 AM | 0 (0.0%) | 0 (0.0%) |
| 11:00 AM to 11:59 AM | 0 (0.0%) | 0 (0.0%) |
| 12:00 PM to 3:59 PM | 0 (0.0%) | 0 (0.0%) |
| 4:00 PM to 11:59 PM | 0 (0.0%) | 60 (28.7%) |
| Total | 248 (100.0%) | 209 (100.0%) |
Housing Occupancy in Fort Hancock
Occupancy by Ownership in Fort Hancock
Of the total 424 dwellings in Fort Hancock, owner-occupied units account for 279 (65.8%), while renter-occupied units make up 145 (34.2%).
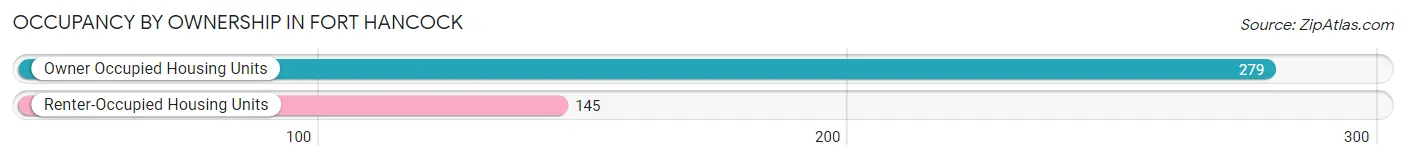
| Occupancy | # Housing Units | % Housing Units |
| Owner Occupied Housing Units | 279 | 65.8% |
| Renter-Occupied Housing Units | 145 | 34.2% |
| Total Occupied Housing Units | 424 | 100.0% |
Occupancy by Household Size in Fort Hancock
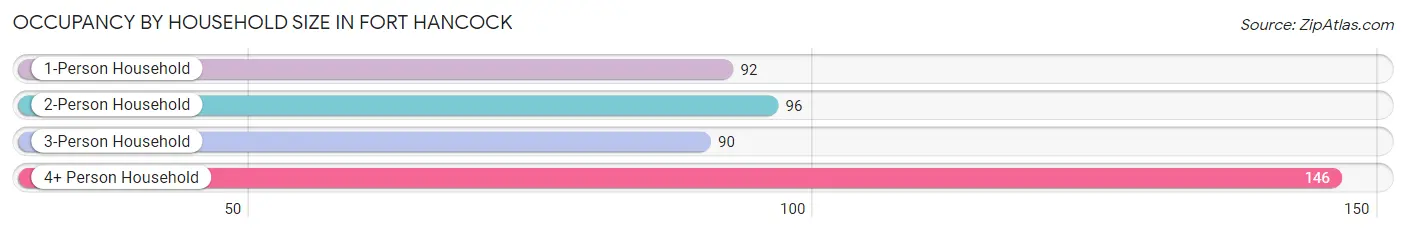
| Household Size | # Housing Units | % Housing Units |
| 1-Person Household | 92 | 21.7% |
| 2-Person Household | 96 | 22.6% |
| 3-Person Household | 90 | 21.2% |
| 4+ Person Household | 146 | 34.4% |
| Total Housing Units | 424 | 100.0% |
Occupancy by Ownership by Household Size in Fort Hancock
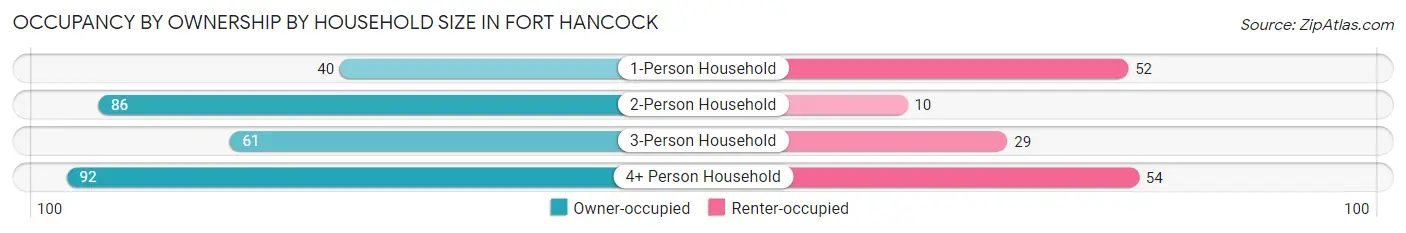
| Household Size | Owner-occupied | Renter-occupied |
| 1-Person Household | 40 (43.5%) | 52 (56.5%) |
| 2-Person Household | 86 (89.6%) | 10 (10.4%) |
| 3-Person Household | 61 (67.8%) | 29 (32.2%) |
| 4+ Person Household | 92 (63.0%) | 54 (37.0%) |
| Total Housing Units | 279 (65.8%) | 145 (34.2%) |
Occupancy by Educational Attainment in Fort Hancock
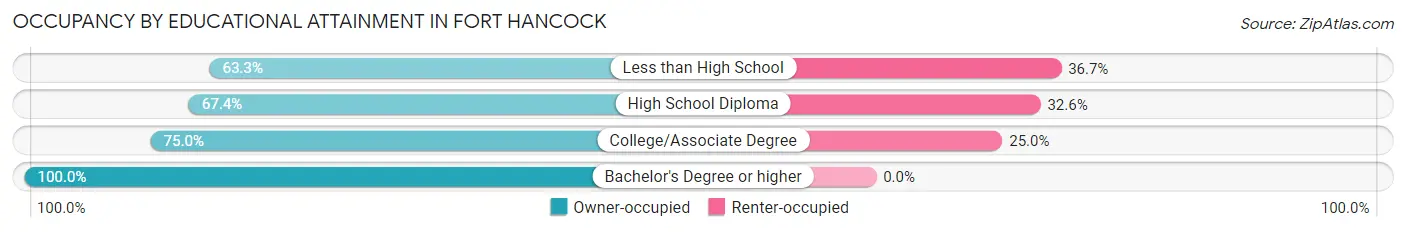
| Household Size | Owner-occupied | Renter-occupied |
| Less than High School | 183 (63.3%) | 106 (36.7%) |
| High School Diploma | 60 (67.4%) | 29 (32.6%) |
| College/Associate Degree | 30 (75.0%) | 10 (25.0%) |
| Bachelor's Degree or higher | 6 (100.0%) | 0 (0.0%) |
Occupancy by Age of Householder in Fort Hancock
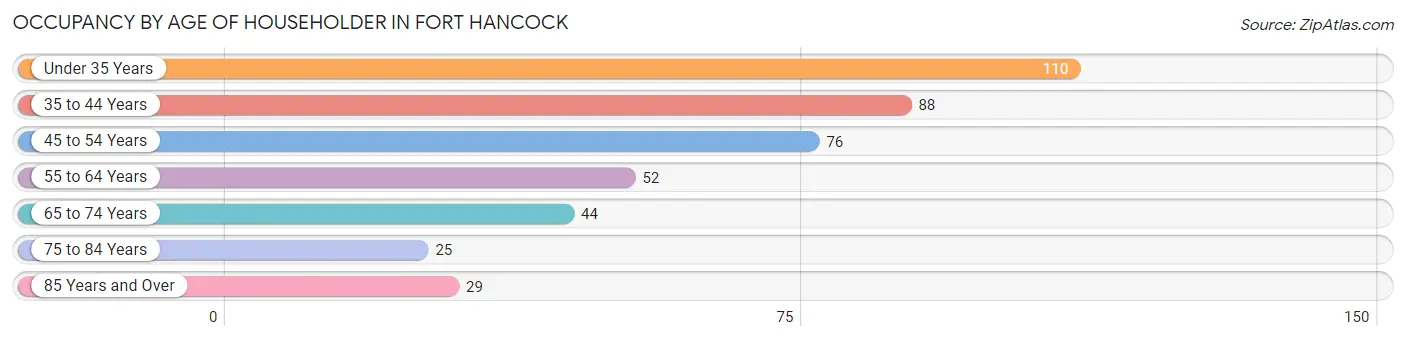
| Age Bracket | # Households | % Households |
| Under 35 Years | 110 | 25.9% |
| 35 to 44 Years | 88 | 20.7% |
| 45 to 54 Years | 76 | 17.9% |
| 55 to 64 Years | 52 | 12.3% |
| 65 to 74 Years | 44 | 10.4% |
| 75 to 84 Years | 25 | 5.9% |
| 85 Years and Over | 29 | 6.8% |
| Total | 424 | 100.0% |
Housing Finances in Fort Hancock
Median Income by Occupancy in Fort Hancock
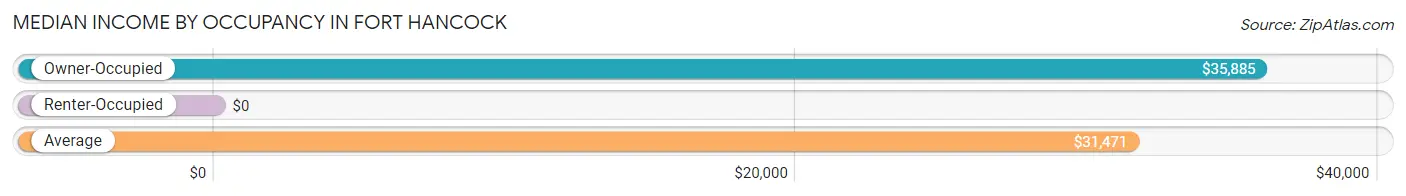
| Occupancy Type | # Households | Median Income |
| Owner-Occupied | 279 (65.8%) | $35,885 |
| Renter-Occupied | 145 (34.2%) | $0 |
| Average | 424 (100.0%) | $31,471 |
Occupancy by Householder Income Bracket in Fort Hancock
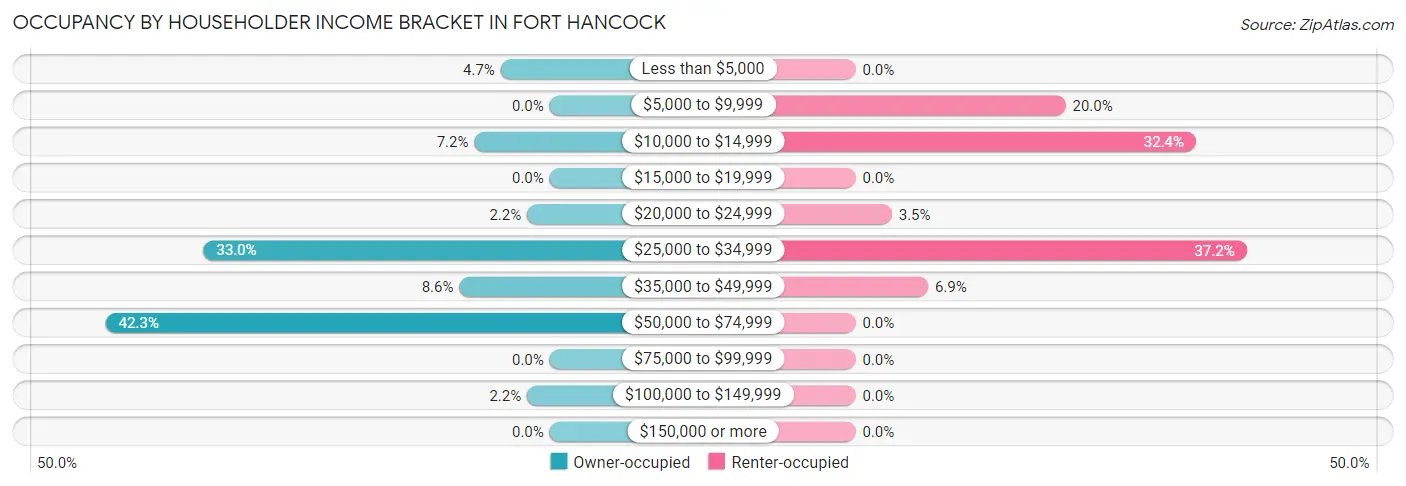
| Income Bracket | Owner-occupied | Renter-occupied |
| Less than $5,000 | 13 (4.7%) | 0 (0.0%) |
| $5,000 to $9,999 | 0 (0.0%) | 29 (20.0%) |
| $10,000 to $14,999 | 20 (7.2%) | 47 (32.4%) |
| $15,000 to $19,999 | 0 (0.0%) | 0 (0.0%) |
| $20,000 to $24,999 | 6 (2.1%) | 5 (3.5%) |
| $25,000 to $34,999 | 92 (33.0%) | 54 (37.2%) |
| $35,000 to $49,999 | 24 (8.6%) | 10 (6.9%) |
| $50,000 to $74,999 | 118 (42.3%) | 0 (0.0%) |
| $75,000 to $99,999 | 0 (0.0%) | 0 (0.0%) |
| $100,000 to $149,999 | 6 (2.1%) | 0 (0.0%) |
| $150,000 or more | 0 (0.0%) | 0 (0.0%) |
| Total | 279 (100.0%) | 145 (100.0%) |
Monthly Housing Cost Tiers in Fort Hancock
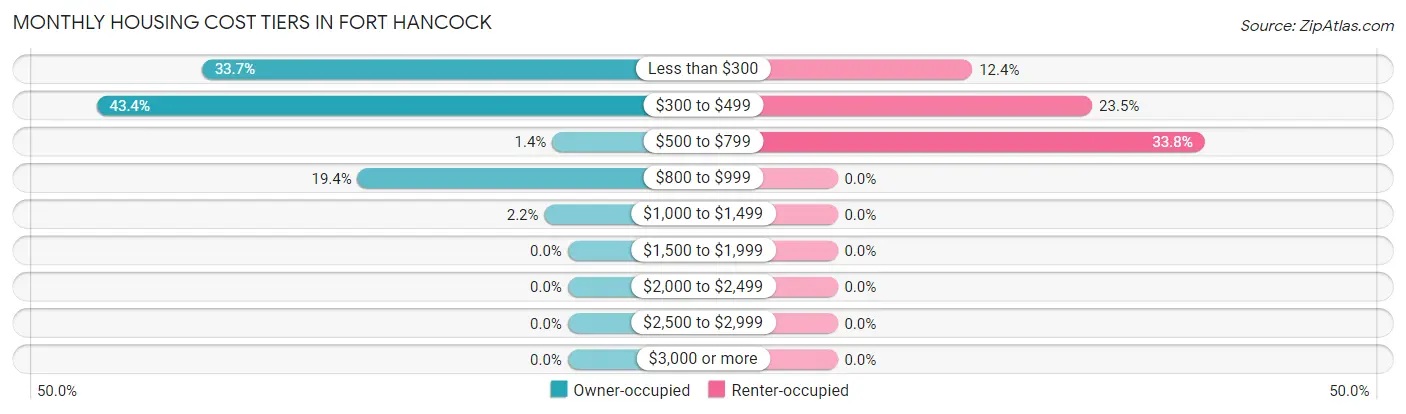
| Monthly Cost | Owner-occupied | Renter-occupied |
| Less than $300 | 94 (33.7%) | 18 (12.4%) |
| $300 to $499 | 121 (43.4%) | 34 (23.4%) |
| $500 to $799 | 4 (1.4%) | 49 (33.8%) |
| $800 to $999 | 54 (19.4%) | 0 (0.0%) |
| $1,000 to $1,499 | 6 (2.1%) | 0 (0.0%) |
| $1,500 to $1,999 | 0 (0.0%) | 0 (0.0%) |
| $2,000 to $2,499 | 0 (0.0%) | 0 (0.0%) |
| $2,500 to $2,999 | 0 (0.0%) | 0 (0.0%) |
| $3,000 or more | 0 (0.0%) | 0 (0.0%) |
| Total | 279 (100.0%) | 145 (100.0%) |
Physical Housing Characteristics in Fort Hancock
Housing Structures in Fort Hancock
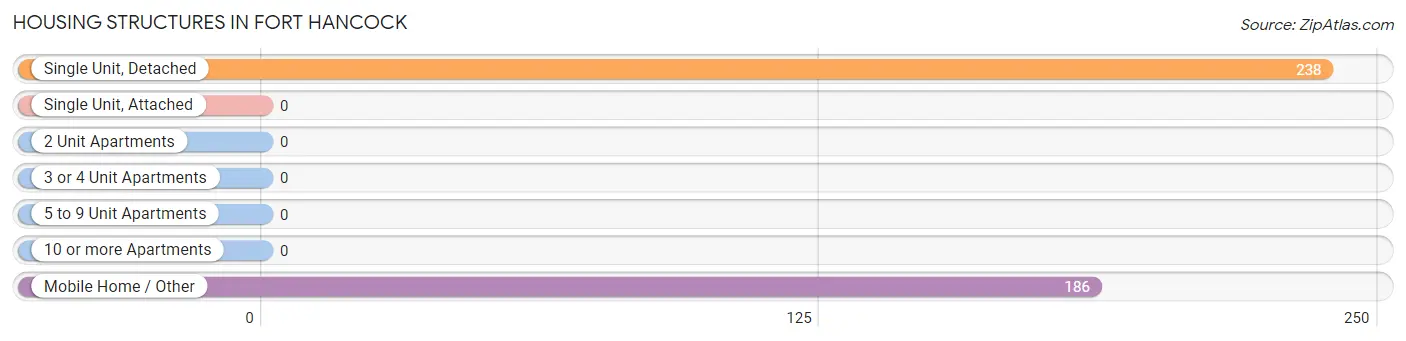
| Structure Type | # Housing Units | % Housing Units |
| Single Unit, Detached | 238 | 56.1% |
| Single Unit, Attached | 0 | 0.0% |
| 2 Unit Apartments | 0 | 0.0% |
| 3 or 4 Unit Apartments | 0 | 0.0% |
| 5 to 9 Unit Apartments | 0 | 0.0% |
| 10 or more Apartments | 0 | 0.0% |
| Mobile Home / Other | 186 | 43.9% |
| Total | 424 | 100.0% |
Housing Structures by Occupancy in Fort Hancock
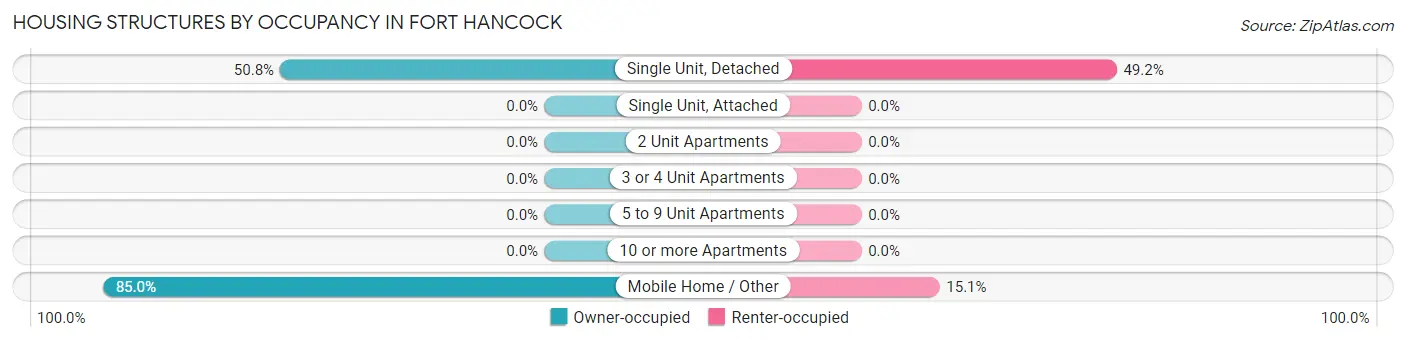
| Structure Type | Owner-occupied | Renter-occupied |
| Single Unit, Detached | 121 (50.8%) | 117 (49.2%) |
| Single Unit, Attached | 0 (0.0%) | 0 (0.0%) |
| 2 Unit Apartments | 0 (0.0%) | 0 (0.0%) |
| 3 or 4 Unit Apartments | 0 (0.0%) | 0 (0.0%) |
| 5 to 9 Unit Apartments | 0 (0.0%) | 0 (0.0%) |
| 10 or more Apartments | 0 (0.0%) | 0 (0.0%) |
| Mobile Home / Other | 158 (85.0%) | 28 (15.0%) |
| Total | 279 (65.8%) | 145 (34.2%) |
Housing Structures by Number of Rooms in Fort Hancock
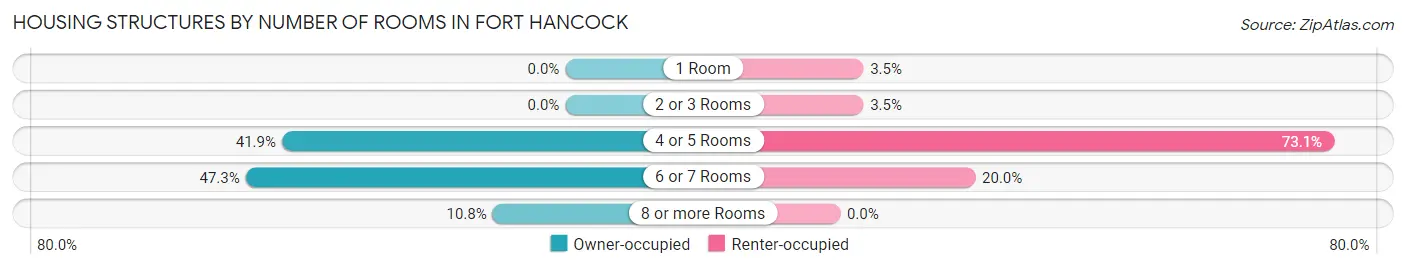
| Number of Rooms | Owner-occupied | Renter-occupied |
| 1 Room | 0 (0.0%) | 5 (3.5%) |
| 2 or 3 Rooms | 0 (0.0%) | 5 (3.5%) |
| 4 or 5 Rooms | 117 (41.9%) | 106 (73.1%) |
| 6 or 7 Rooms | 132 (47.3%) | 29 (20.0%) |
| 8 or more Rooms | 30 (10.7%) | 0 (0.0%) |
| Total | 279 (100.0%) | 145 (100.0%) |
Housing Structure by Heating Type in Fort Hancock
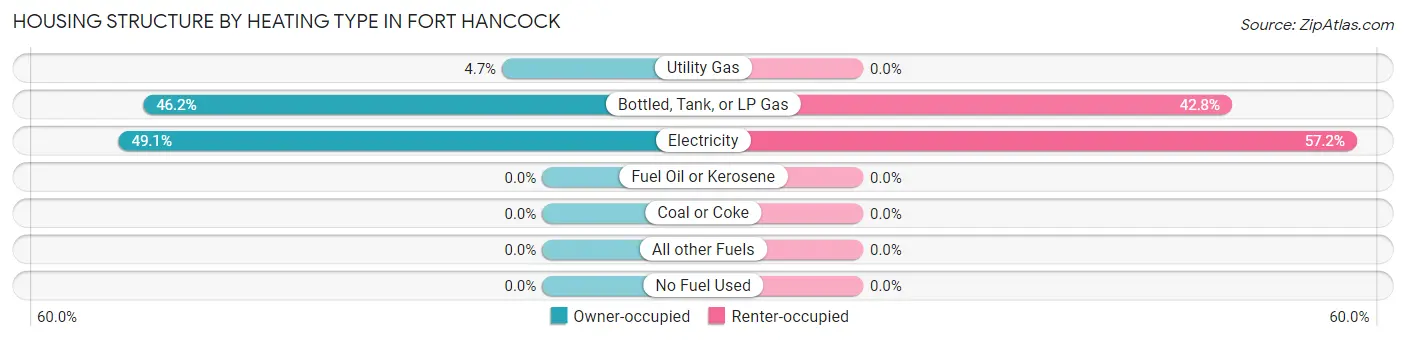
| Heating Type | Owner-occupied | Renter-occupied |
| Utility Gas | 13 (4.7%) | 0 (0.0%) |
| Bottled, Tank, or LP Gas | 129 (46.2%) | 62 (42.8%) |
| Electricity | 137 (49.1%) | 83 (57.2%) |
| Fuel Oil or Kerosene | 0 (0.0%) | 0 (0.0%) |
| Coal or Coke | 0 (0.0%) | 0 (0.0%) |
| All other Fuels | 0 (0.0%) | 0 (0.0%) |
| No Fuel Used | 0 (0.0%) | 0 (0.0%) |
| Total | 279 (100.0%) | 145 (100.0%) |
Household Vehicle Usage in Fort Hancock
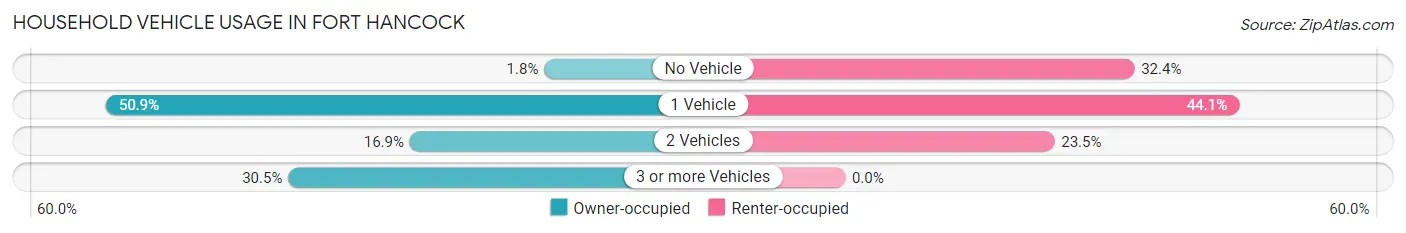
| Vehicles per Household | Owner-occupied | Renter-occupied |
| No Vehicle | 5 (1.8%) | 47 (32.4%) |
| 1 Vehicle | 142 (50.9%) | 64 (44.1%) |
| 2 Vehicles | 47 (16.9%) | 34 (23.4%) |
| 3 or more Vehicles | 85 (30.5%) | 0 (0.0%) |
| Total | 279 (100.0%) | 145 (100.0%) |
Real Estate & Mortgages in Fort Hancock
Real Estate and Mortgage Overview in Fort Hancock
| Characteristic | Without Mortgage | With Mortgage |
| Housing Units | 225 | 54 |
| Median Property Value | $54,600 | $72,800 |
| Median Household Income | $35,052 | $0 |
| Monthly Housing Costs | $315 | $0 |
| Real Estate Taxes | $536 | $0 |
Property Value by Mortgage Status in Fort Hancock
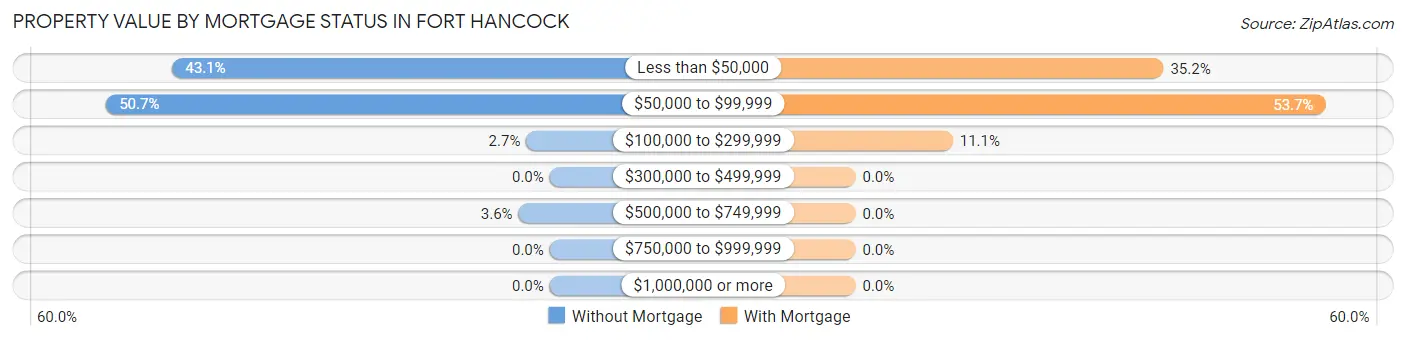
| Property Value | Without Mortgage | With Mortgage |
| Less than $50,000 | 97 (43.1%) | 19 (35.2%) |
| $50,000 to $99,999 | 114 (50.7%) | 29 (53.7%) |
| $100,000 to $299,999 | 6 (2.7%) | 6 (11.1%) |
| $300,000 to $499,999 | 0 (0.0%) | 0 (0.0%) |
| $500,000 to $749,999 | 8 (3.6%) | 0 (0.0%) |
| $750,000 to $999,999 | 0 (0.0%) | 0 (0.0%) |
| $1,000,000 or more | 0 (0.0%) | 0 (0.0%) |
| Total | 225 (100.0%) | 54 (100.0%) |
Household Income by Mortgage Status in Fort Hancock
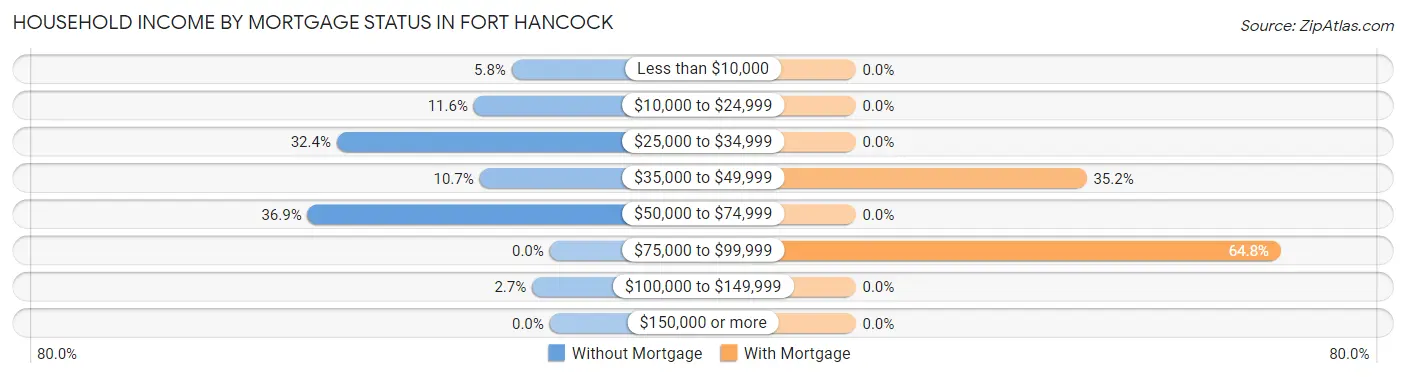
| Household Income | Without Mortgage | With Mortgage |
| Less than $10,000 | 13 (5.8%) | 0 (0.0%) |
| $10,000 to $24,999 | 26 (11.6%) | 0 (0.0%) |
| $25,000 to $34,999 | 73 (32.4%) | 0 (0.0%) |
| $35,000 to $49,999 | 24 (10.7%) | 19 (35.2%) |
| $50,000 to $74,999 | 83 (36.9%) | 0 (0.0%) |
| $75,000 to $99,999 | 0 (0.0%) | 35 (64.8%) |
| $100,000 to $149,999 | 6 (2.7%) | 0 (0.0%) |
| $150,000 or more | 0 (0.0%) | 0 (0.0%) |
| Total | 225 (100.0%) | 54 (100.0%) |
Property Value to Household Income Ratio in Fort Hancock
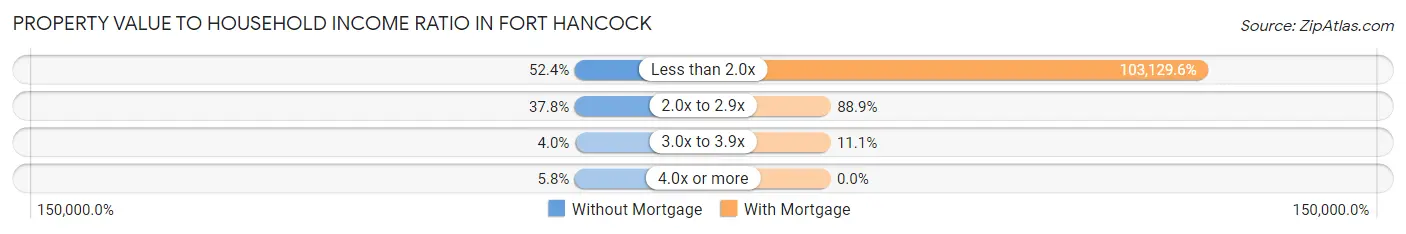
| Value-to-Income Ratio | Without Mortgage | With Mortgage |
| Less than 2.0x | 118 (52.4%) | 55,690 (103,129.6%) |
| 2.0x to 2.9x | 85 (37.8%) | 48 (88.9%) |
| 3.0x to 3.9x | 9 (4.0%) | 6 (11.1%) |
| 4.0x or more | 13 (5.8%) | 0 (0.0%) |
| Total | 225 (100.0%) | 54 (100.0%) |
Real Estate Taxes by Mortgage Status in Fort Hancock
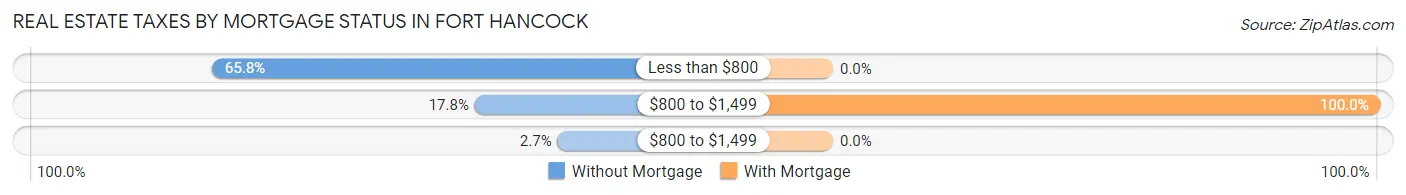
| Property Taxes | Without Mortgage | With Mortgage |
| Less than $800 | 148 (65.8%) | 0 (0.0%) |
| $800 to $1,499 | 40 (17.8%) | 54 (100.0%) |
| $800 to $1,499 | 6 (2.7%) | 0 (0.0%) |
| Total | 225 (100.0%) | 54 (100.0%) |
Health & Disability in Fort Hancock
Health Insurance Coverage by Age in Fort Hancock
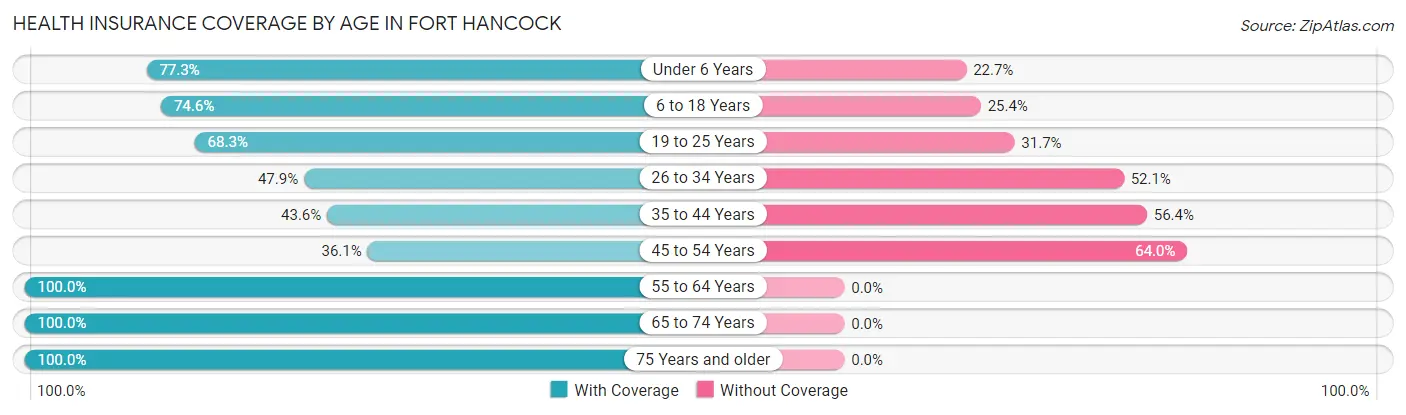
| Age Bracket | With Coverage | Without Coverage |
| Under 6 Years | 51 (77.3%) | 15 (22.7%) |
| 6 to 18 Years | 126 (74.6%) | 43 (25.4%) |
| 19 to 25 Years | 198 (68.3%) | 92 (31.7%) |
| 26 to 34 Years | 80 (47.9%) | 87 (52.1%) |
| 35 to 44 Years | 68 (43.6%) | 88 (56.4%) |
| 45 to 54 Years | 53 (36.0%) | 94 (63.9%) |
| 55 to 64 Years | 93 (100.0%) | 0 (0.0%) |
| 65 to 74 Years | 52 (100.0%) | 0 (0.0%) |
| 75 Years and older | 73 (100.0%) | 0 (0.0%) |
| Total | 794 (65.5%) | 419 (34.5%) |
Health Insurance Coverage by Citizenship Status in Fort Hancock
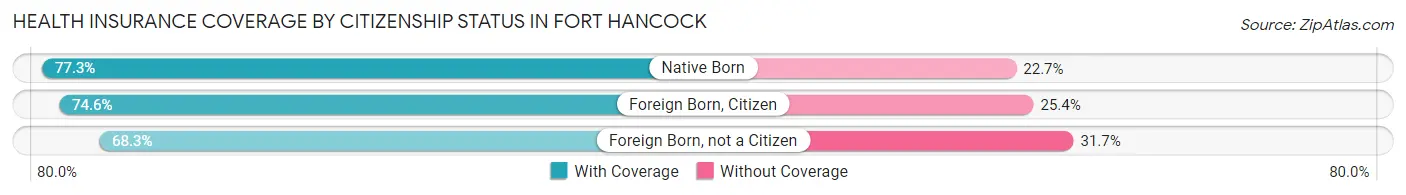
| Citizenship Status | With Coverage | Without Coverage |
| Native Born | 51 (77.3%) | 15 (22.7%) |
| Foreign Born, Citizen | 126 (74.6%) | 43 (25.4%) |
| Foreign Born, not a Citizen | 198 (68.3%) | 92 (31.7%) |
Health Insurance Coverage by Household Income in Fort Hancock
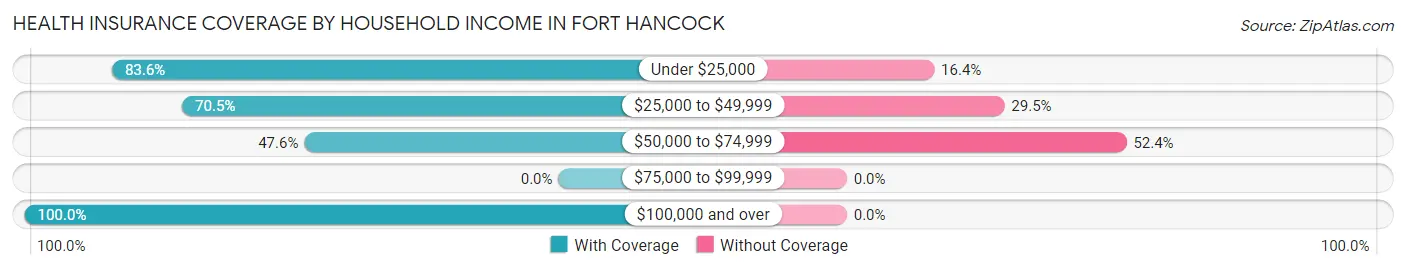
| Household Income | With Coverage | Without Coverage |
| Under $25,000 | 189 (83.6%) | 37 (16.4%) |
| $25,000 to $49,999 | 389 (70.5%) | 163 (29.5%) |
| $50,000 to $74,999 | 199 (47.6%) | 219 (52.4%) |
| $75,000 to $99,999 | 0 (0.0%) | 0 (0.0%) |
| $100,000 and over | 17 (100.0%) | 0 (0.0%) |
Public vs Private Health Insurance Coverage by Age in Fort Hancock
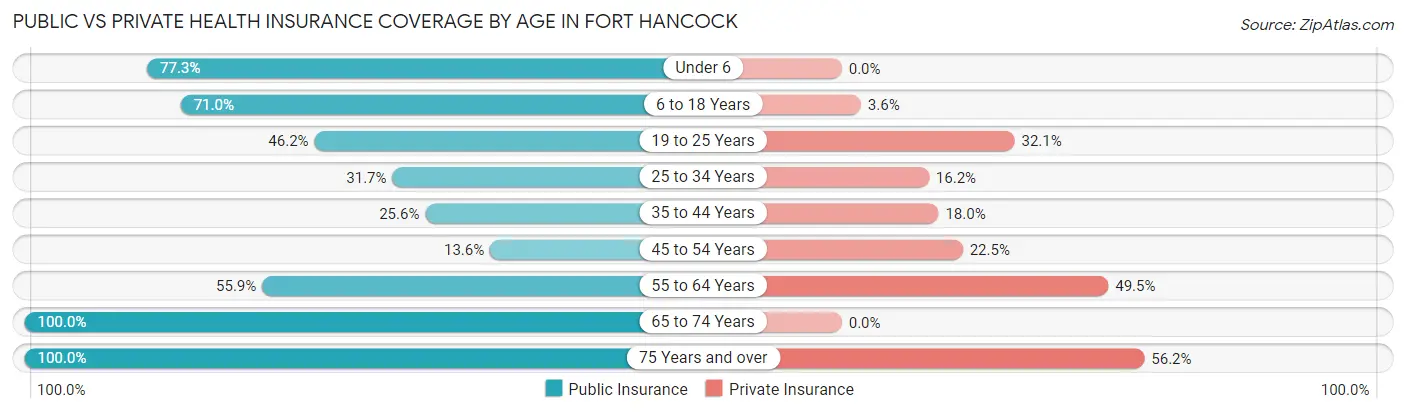
| Age Bracket | Public Insurance | Private Insurance |
| Under 6 | 51 (77.3%) | 0 (0.0%) |
| 6 to 18 Years | 120 (71.0%) | 6 (3.5%) |
| 19 to 25 Years | 134 (46.2%) | 93 (32.1%) |
| 25 to 34 Years | 53 (31.7%) | 27 (16.2%) |
| 35 to 44 Years | 40 (25.6%) | 28 (17.9%) |
| 45 to 54 Years | 20 (13.6%) | 33 (22.5%) |
| 55 to 64 Years | 52 (55.9%) | 46 (49.5%) |
| 65 to 74 Years | 52 (100.0%) | 0 (0.0%) |
| 75 Years and over | 73 (100.0%) | 41 (56.2%) |
| Total | 595 (49.0%) | 274 (22.6%) |
Disability Status by Sex by Age in Fort Hancock
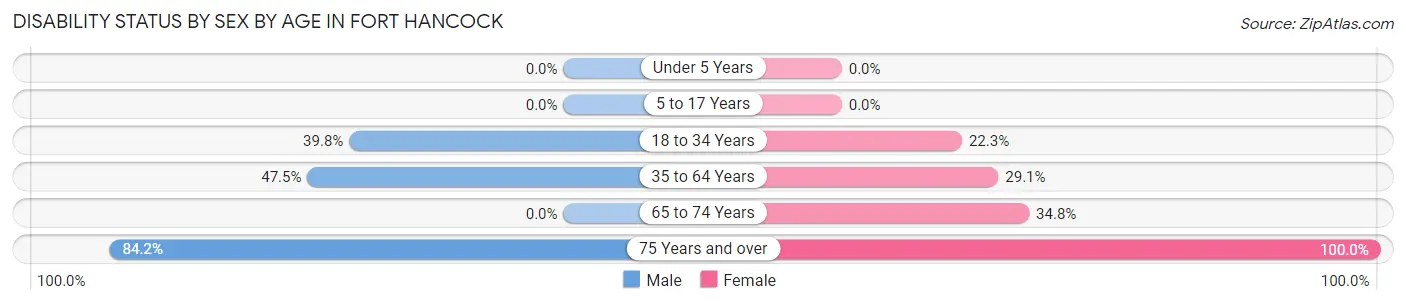
| Age Bracket | Male | Female |
| Under 5 Years | 0 (0.0%) | 0 (0.0%) |
| 5 to 17 Years | 0 (0.0%) | 0 (0.0%) |
| 18 to 34 Years | 132 (39.8%) | 29 (22.3%) |
| 35 to 64 Years | 77 (47.5%) | 68 (29.1%) |
| 65 to 74 Years | 0 (0.0%) | 16 (34.8%) |
| 75 Years and over | 32 (84.2%) | 35 (100.0%) |
Disability Class by Sex by Age in Fort Hancock
Disability Class: Hearing Difficulty
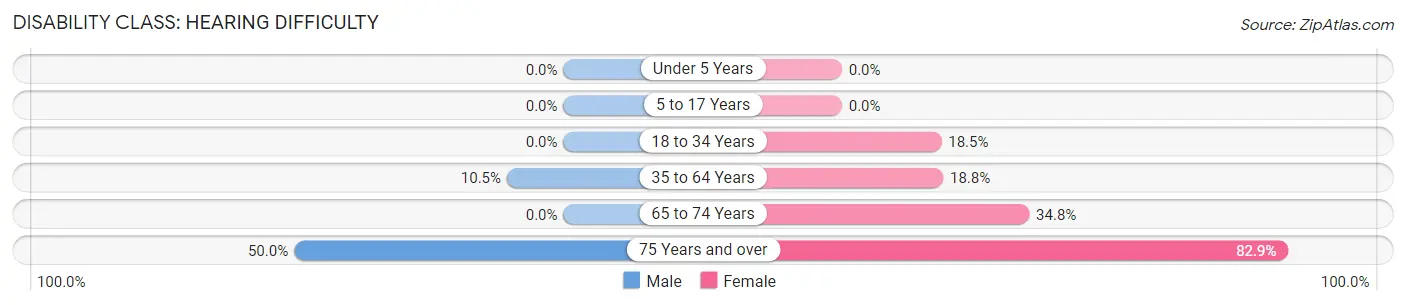
| Age Bracket | Male | Female |
| Under 5 Years | 0 (0.0%) | 0 (0.0%) |
| 5 to 17 Years | 0 (0.0%) | 0 (0.0%) |
| 18 to 34 Years | 0 (0.0%) | 24 (18.5%) |
| 35 to 64 Years | 17 (10.5%) | 44 (18.8%) |
| 65 to 74 Years | 0 (0.0%) | 16 (34.8%) |
| 75 Years and over | 19 (50.0%) | 29 (82.9%) |
Disability Class: Vision Difficulty
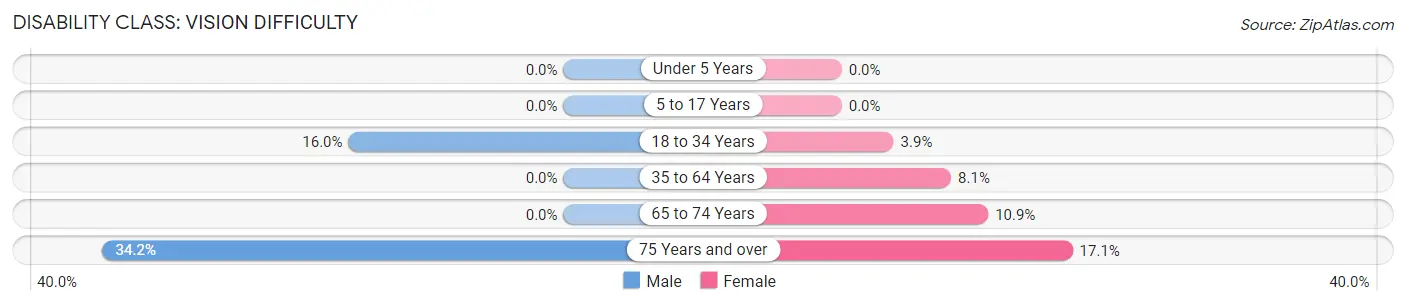
| Age Bracket | Male | Female |
| Under 5 Years | 0 (0.0%) | 0 (0.0%) |
| 5 to 17 Years | 0 (0.0%) | 0 (0.0%) |
| 18 to 34 Years | 53 (16.0%) | 5 (3.8%) |
| 35 to 64 Years | 0 (0.0%) | 19 (8.1%) |
| 65 to 74 Years | 0 (0.0%) | 5 (10.9%) |
| 75 Years and over | 13 (34.2%) | 6 (17.1%) |
Disability Class: Cognitive Difficulty
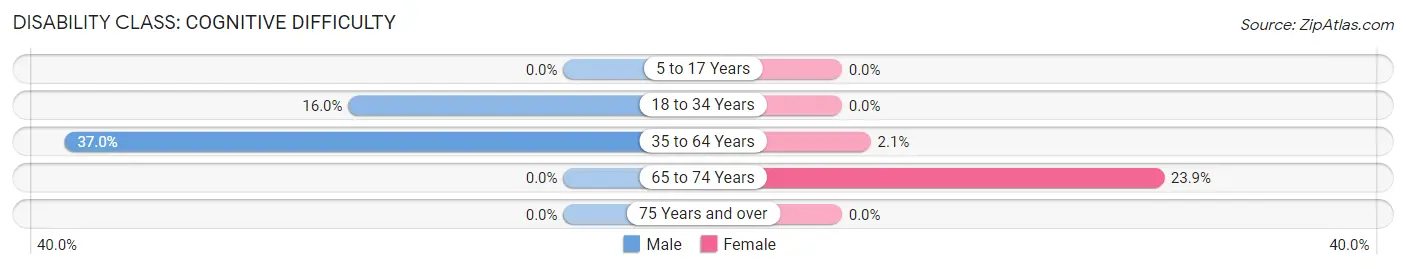
| Age Bracket | Male | Female |
| 5 to 17 Years | 0 (0.0%) | 0 (0.0%) |
| 18 to 34 Years | 53 (16.0%) | 0 (0.0%) |
| 35 to 64 Years | 60 (37.0%) | 5 (2.1%) |
| 65 to 74 Years | 0 (0.0%) | 11 (23.9%) |
| 75 Years and over | 0 (0.0%) | 0 (0.0%) |
Disability Class: Ambulatory Difficulty
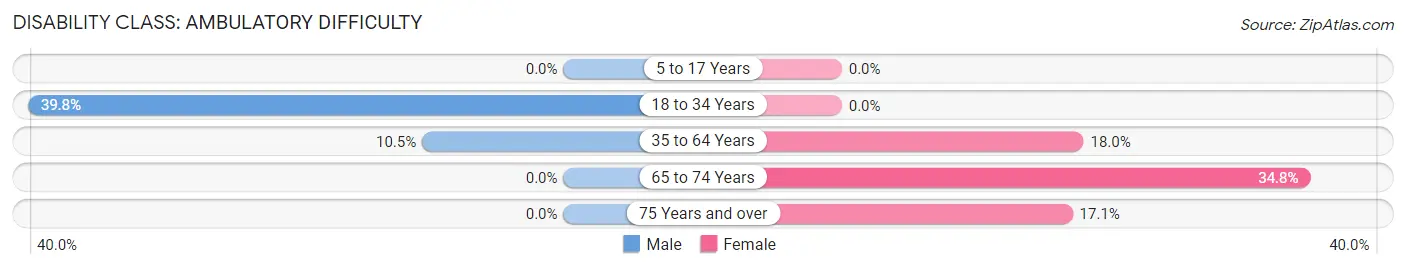
| Age Bracket | Male | Female |
| 5 to 17 Years | 0 (0.0%) | 0 (0.0%) |
| 18 to 34 Years | 132 (39.8%) | 0 (0.0%) |
| 35 to 64 Years | 17 (10.5%) | 42 (17.9%) |
| 65 to 74 Years | 0 (0.0%) | 16 (34.8%) |
| 75 Years and over | 0 (0.0%) | 6 (17.1%) |
Disability Class: Self-Care Difficulty
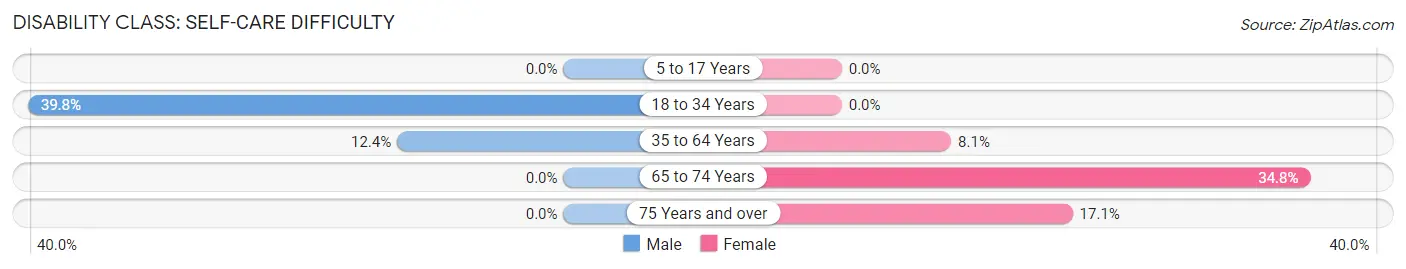
| Age Bracket | Male | Female |
| 5 to 17 Years | 0 (0.0%) | 0 (0.0%) |
| 18 to 34 Years | 132 (39.8%) | 0 (0.0%) |
| 35 to 64 Years | 20 (12.3%) | 19 (8.1%) |
| 65 to 74 Years | 0 (0.0%) | 16 (34.8%) |
| 75 Years and over | 0 (0.0%) | 6 (17.1%) |
Technology Access in Fort Hancock
Computing Device Access in Fort Hancock
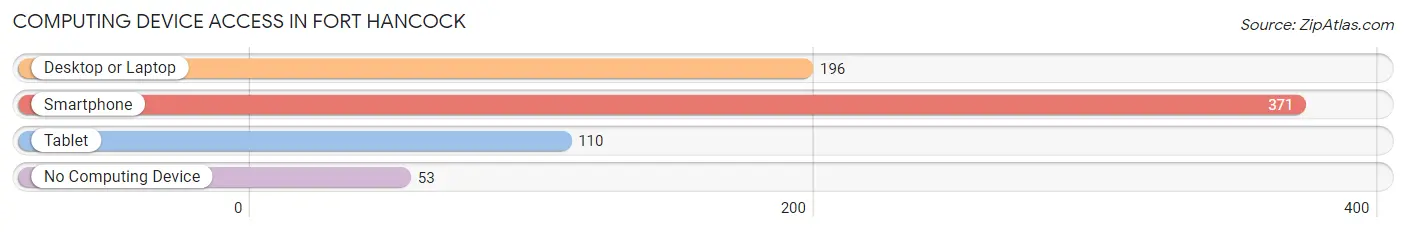
| Device Type | # Households | % Households |
| Desktop or Laptop | 196 | 46.2% |
| Smartphone | 371 | 87.5% |
| Tablet | 110 | 25.9% |
| No Computing Device | 53 | 12.5% |
| Total | 424 | 100.0% |
Internet Access in Fort Hancock
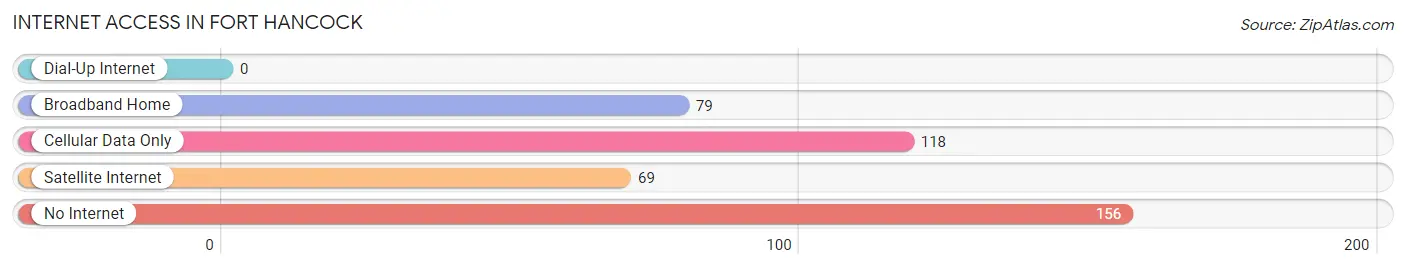
| Internet Type | # Households | % Households |
| Dial-Up Internet | 0 | 0.0% |
| Broadband Home | 79 | 18.6% |
| Cellular Data Only | 118 | 27.8% |
| Satellite Internet | 69 | 16.3% |
| No Internet | 156 | 36.8% |
| Total | 424 | 100.0% |
Fort Hancock Summary
Hancock, Texas is a small town located in the western part of the state, near the border with New Mexico. It is part of Hudspeth County, and is situated on the banks of the Rio Grande. The town was founded in 1881, and has a population of just over 1,000 people.
History
The area around Hancock was first settled by Native Americans, who lived in the area for centuries before the arrival of Europeans. The first Europeans to settle in the area were Spanish missionaries, who established a mission in the area in the late 1700s. The mission was abandoned in the early 1800s, and the area was largely uninhabited until the late 1800s.
In 1881, the town of Hancock was founded by a group of ranchers and farmers. The town was named after the nearby Fort Hancock, which had been established in 1876 to protect settlers from Native American raids. The town quickly grew, and by the early 1900s it had become a thriving community.
Geography
Hancock is located in western Texas, near the border with New Mexico. It is situated on the banks of the Rio Grande, and is surrounded by desert and mountains. The town is located in Hudspeth County, and is about 40 miles from El Paso.
The climate in Hancock is arid and semi-arid, with hot summers and mild winters. The average annual temperature is around 70 degrees Fahrenheit, and the average annual precipitation is around 10 inches.
Economy
The economy of Hancock is largely based on agriculture and ranching. The town is home to several large ranches, and the surrounding area is used for grazing cattle and growing crops. The town also has a small manufacturing sector, and is home to several small businesses.
The town is also home to a number of tourist attractions, including the Fort Hancock State Historic Site, which is a preserved fort from the late 1800s. The town also has a number of restaurants, bars, and other businesses catering to tourists.
Demographics
As of the 2010 census, the population of Hancock was 1,072. The racial makeup of the town was 94.3% White, 0.7% African American, 0.3% Native American, 0.2% Asian, 0.1% Pacific Islander, and 4.4% from other races. Hispanic or Latino of any race were 8.2% of the population.
The median household income in Hancock was $25,938, and the median family income was $31,250. The per capita income was $14,945. About 18.2% of the population was below the poverty line.
Conclusion
Hancock, Texas is a small town located in the western part of the state, near the border with New Mexico. It was founded in 1881, and has a population of just over 1,000 people. The economy of Hancock is largely based on agriculture and ranching, and the town is also home to a number of tourist attractions. The population of Hancock is mostly White, with a small percentage of African American, Native American, Asian, and Pacific Islander residents. The median household income in Hancock is lower than the national average, and about 18.2% of the population is below the poverty line.
Common Questions
What is Per Capita Income in Fort Hancock?
Per Capita income in Fort Hancock is $15,751.
What is the Median Family Income in Fort Hancock?
Median Family Income in Fort Hancock is $32,576.
What is the Median Household income in Fort Hancock?
Median Household Income in Fort Hancock is $31,471.
What is Income or Wage Gap in Fort Hancock?
Income or Wage Gap in Fort Hancock is 31.7%.
Women in Fort Hancock earn 68.3 cents for every dollar earned by a man.
What is Inequality or Gini Index in Fort Hancock?
Inequality or Gini Index in Fort Hancock is 0.33.
What is the Total Population of Fort Hancock?
Total Population of Fort Hancock is 1,213.
What is the Total Male Population of Fort Hancock?
Total Male Population of Fort Hancock is 672.
What is the Total Female Population of Fort Hancock?
Total Female Population of Fort Hancock is 541.
What is the Ratio of Males per 100 Females in Fort Hancock?
There are 124.21 Males per 100 Females in Fort Hancock.
What is the Ratio of Females per 100 Males in Fort Hancock?
There are 80.51 Females per 100 Males in Fort Hancock.
What is the Median Population Age in Fort Hancock?
Median Population Age in Fort Hancock is 26.9 Years.
What is the Average Family Size in Fort Hancock
Average Family Size in Fort Hancock is 3.4 People.
What is the Average Household Size in Fort Hancock
Average Household Size in Fort Hancock is 2.9 People.
How Large is the Labor Force in Fort Hancock?
There are 567 People in the Labor Forcein in Fort Hancock.
What is the Percentage of People in the Labor Force in Fort Hancock?
55.2% of People are in the Labor Force in Fort Hancock.